Prevalence of non-communicable diseases risk factors ... - PLOS
20
RESEARCH ARTICLE Prevalence of non-communicable diseases risk factors and their determinants: Results from STEPS survey 2019, Nepal Bihungum Bista ID 1☯ , Meghnath Dhimal ID 1☯ *, Saroj Bhattarai 1 , Tamanna Neupane 1 , Yvonne Yiru Xu 2 , Achyut Raj Pandey ID 1 , Nick Townsend 3 , Pradip Gyanwali 1 , Anjani Kumar Jha 1 1 Nepal Health Research Council, Ramshah Path, Kathmandu, Nepal, 2 WHO South East Asia Regional Office, New Delhi, India, 3 Department for Health, University of Bath, Bath, United Kingdom ☯ These authors contributed equally to this work. * [email protected] Abstract Background The World Health Organization (WHO) recommends ongoing surveillance of non-communi- cable diseases (NCDs) and their risk factors, using the WHO STEPwise approach to surveil- lance (STEPS). The aim of this study was to assess the distribution and determinants of NCD risk factors in Nepal, a low-income country, in which two-thirds (66%) of annual deaths are attributable to NCDs. Methods A nationally representative NCD risk factors STEPS survey (instrument version 3.2), was conducted between February and May 2019, among 6,475 eligible participants of age 15– 69 years sampled from all 7 provinces through multistage sampling process. Data collection involved assessment of behavioral and biochemical risk factors. Complex survey analysis was completed in STATA 15, along with Poisson regression modelling to examine associa- tions between covariates and risk factor prevalence. Results The most prevalent risk factor was consumption of less than five servings of fruit and vege- tables a day (97%; 95% CI: 94.3–98.0). Out of total participants, 17% (95% CI: 15.1–19.1) were current smoker, 6.8% (95% CI: 5.3–8.2) were consuming �60g/month alcohol per month and 7.4% (95% CI:5.7–10.1) were having low level of physical activity. Approxi- mately, 24.3% (95% CI: 21.6–27.2) were overweight or obese (BMI�25kg/m 2 ) while 24.5% (95% CI: 22.4–26.7) and 5.8% (95% CI: 4.3–7.3) had raised blood pressure (BP) and raised blood glucose respectively. Similarly, the prevalence of raised total cholesterol was 11% (95% CI: 9.6–12.6). Sex and education level of participants were statistically associated with smoking, harmful alcohol use and raised BP. Participants of age 30–44 years and 45– 69 years were found to have increased risk of overweight, raised BP, raised blood sugar PLOS ONE PLOS ONE | https://doi.org/10.1371/journal.pone.0253605 July 30, 2021 1 / 20 a1111111111 a1111111111 a1111111111 a1111111111 a1111111111 OPEN ACCESS Citation: Bista B, Dhimal M, Bhattarai S, Neupane T, Xu YY, Pandey AR, et al. (2021) Prevalence of non-communicable diseases risk factors and their determinants: Results from STEPS survey 2019, Nepal. PLoS ONE 16(7): e0253605. https://doi.org/ 10.1371/journal.pone.0253605 Editor: Brecht Devleesschauwer, Sciensano, BELGIUM Received: March 2, 2021 Accepted: June 9, 2021 Published: July 30, 2021 Peer Review History: PLOS recognizes the benefits of transparency in the peer review process; therefore, we enable the publication of all of the content of peer review and author responses alongside final, published articles. The editorial history of this article is available here: https://doi.org/10.1371/journal.pone.0253605 Copyright: © 2021 Bista et al. This is an open access article distributed under the terms of the Creative Commons Attribution License, which permits unrestricted use, distribution, and reproduction in any medium, provided the original author and source are credited. Data Availability Statement: All relevant data are within the manuscript and its Supporting information files.
-
Upload
khangminh22 -
Category
Documents
-
view
1 -
download
0
Transcript of Prevalence of non-communicable diseases risk factors ... - PLOS

RESEARCH ARTICLE
Prevalence of non-communicable diseases
risk factors and their determinants: Results
from STEPS survey 2019, Nepal
Bihungum BistaID1☯, Meghnath DhimalID
1☯*, Saroj Bhattarai1, Tamanna Neupane1,
Yvonne Yiru Xu2, Achyut Raj PandeyID1, Nick Townsend3, Pradip Gyanwali1, Anjani
Kumar Jha1
1 Nepal Health Research Council, Ramshah Path, Kathmandu, Nepal, 2 WHO South East Asia Regional
Office, New Delhi, India, 3 Department for Health, University of Bath, Bath, United Kingdom
☯ These authors contributed equally to this work.
Abstract
Background
The World Health Organization (WHO) recommends ongoing surveillance of non-communi-
cable diseases (NCDs) and their risk factors, using the WHO STEPwise approach to surveil-
lance (STEPS). The aim of this study was to assess the distribution and determinants of
NCD risk factors in Nepal, a low-income country, in which two-thirds (66%) of annual deaths
are attributable to NCDs.
Methods
A nationally representative NCD risk factors STEPS survey (instrument version 3.2), was
conducted between February and May 2019, among 6,475 eligible participants of age 15–
69 years sampled from all 7 provinces through multistage sampling process. Data collection
involved assessment of behavioral and biochemical risk factors. Complex survey analysis
was completed in STATA 15, along with Poisson regression modelling to examine associa-
tions between covariates and risk factor prevalence.
Results
The most prevalent risk factor was consumption of less than five servings of fruit and vege-
tables a day (97%; 95% CI: 94.3–98.0). Out of total participants, 17% (95% CI: 15.1–19.1)
were current smoker, 6.8% (95% CI: 5.3–8.2) were consuming�60g/month alcohol per
month and 7.4% (95% CI:5.7–10.1) were having low level of physical activity. Approxi-
mately, 24.3% (95% CI: 21.6–27.2) were overweight or obese (BMI�25kg/m2) while 24.5%
(95% CI: 22.4–26.7) and 5.8% (95% CI: 4.3–7.3) had raised blood pressure (BP) and raised
blood glucose respectively. Similarly, the prevalence of raised total cholesterol was 11%
(95% CI: 9.6–12.6). Sex and education level of participants were statistically associated
with smoking, harmful alcohol use and raised BP. Participants of age 30–44 years and 45–
69 years were found to have increased risk of overweight, raised BP, raised blood sugar
PLOS ONE
PLOS ONE | https://doi.org/10.1371/journal.pone.0253605 July 30, 2021 1 / 20
a1111111111
a1111111111
a1111111111
a1111111111
a1111111111
OPEN ACCESS
Citation: Bista B, Dhimal M, Bhattarai S, Neupane
T, Xu YY, Pandey AR, et al. (2021) Prevalence of
non-communicable diseases risk factors and their
determinants: Results from STEPS survey 2019,
Nepal. PLoS ONE 16(7): e0253605. https://doi.org/
10.1371/journal.pone.0253605
Editor: Brecht Devleesschauwer, Sciensano,
BELGIUM
Received: March 2, 2021
Accepted: June 9, 2021
Published: July 30, 2021
Peer Review History: PLOS recognizes the
benefits of transparency in the peer review
process; therefore, we enable the publication of
all of the content of peer review and author
responses alongside final, published articles. The
editorial history of this article is available here:
https://doi.org/10.1371/journal.pone.0253605
Copyright: © 2021 Bista et al. This is an open
access article distributed under the terms of the
Creative Commons Attribution License, which
permits unrestricted use, distribution, and
reproduction in any medium, provided the original
author and source are credited.
Data Availability Statement: All relevant data are
within the manuscript and its Supporting
information files.

and raised blood cholesterol. Similarly, participants in richest wealth quintile had higher
odds of insufficient physical inactivity, overweight and raised blood cholesterol. On average,
each participant had 2 NCD related risk factors (2.04, 95% CI: 2.02–2.08).
Conclusion
A large portion of the Nepalese population are living with a variety of NCD risk factors.
These surveillance data should be used to support and monitor province specific NCD pre-
vention and control interventions throughout Nepal, supported by a multi-sectoral national
coordination mechanism.
Introduction
Non-communicable diseases (NCDs) are the leading causes of disease burden worldwide [1].
According to World Health Organization (WHO) estimates, NCDs are responsible for 71% of
all deaths globally, with around 85% of premature deaths from NCDs occurring in low and
middle income countries (LMICs) [2]. Behavioral risk factors including smoking, alcohol con-
sumption, unhealthy diet and physical inactivity, along with biological risk factors such as
raised blood pressure (BP), blood glucose and cholesterol level, along with overweight and
obesity have been identified as the major underlying causes of NCDs [3]. In addition, the risk
of progression of NCDs is reported to increase with the co-existence of multiple risk factors
within the same individual, which is referred to as clustering [4–6].
Data from Nepal, a lower middle income country in South Asia, indicate an 8% increase in
deaths caused by NCDs between 2014 and 2016 [7,8] with two-thirds (66%) of the 182,751
deaths recorded in Nepal in 2017, attributed to NCDs [1]. A 2019 population based nationwide
cross-sectional study in Nepal also indicating the high burden of NCDs with a high prevalence
of COPD, diabetes, chronic kidney disease, and coronary artery disease, which could pose a
serious challenge to health systems in the near future. Apart from these diseases, diabetes mel-
litus is recognized to affect a notable proportion (8.5%) of the adult population in Nepal [9].
The 2013 STEPS Survey in Nepal also confirming the high prevalence of various risk factors
including smoking (19%), low consumption of fruits and vegetables (99%), raised BP (26%),
and abnormal lipids (23%) [10]. Likewise, a substantial proportion of the Nepalese population
was found to be hypertensive (19.9%) with more than one fifth overweight or obese (21.4%)
[11].
To combat NCDs at a population level, the Nepal government adopted a Multisectoral
Action Plan for the Prevention and Control of Non-Communicable Diseases in 2014 [12],
aligning with the NCD global monitoring framework [13]. One of the key activities identified
and included in the multisectoral action plan was to have a periodic NCD STEPS survey to
track progress on prevention and control of NCDs within the country. With recent transition
to federal structure, Nepal also needs evidence on NCD risk factors at provincial level so as to
facilitate decision making process in health sector. In this context, this study aimed to assess
the epidemiological distribution and determinants of behavioral (tobacco, alcohol, diet, salt
consumption, physical activity) and biological risk factors (overweight/obesity, raised BP,
raised blood sugar and cholesterol levels) associated with major/selected NCDs in.
PLOS ONE Noncommunicable diseases risk factors and their determinants: STEPS survey 2019, Nepal
PLOS ONE | https://doi.org/10.1371/journal.pone.0253605 July 30, 2021 2 / 20
Funding: This survey was funded by the
Government of Nepal and the World Health
Organization.
Competing interests: The authors have declared
that no competing interests exist.

Methods
Study settings
Nepal is a landlocked country situated in Southern Asia between India and China. The country
runs from a plain area in the south, known as Terai, to the mountainous area of the Himalayas
in the north, with a hilly region in between the two. Administratively, Nepal is comprised of 7
provinces, 77 districts and 753 local bodies.
Study design and sampling techniques
It was a nationally-representative cross-sectional NCD risk factors survey, following the WHO
STEPwise approach to surveillance (STEPS), an integrated surveillance tool through which
countries can collect, analyse and disseminate core standardized information on NCDs [14].
Data for the survey was collected from the eligible adult population, aged between 15 and 69
years, between February and May 2019.
Sampling for the survey took into consideration the current federal structure of Nepal,
such that findings could be generalized to the provincial levels. A multistage cluster sampling
method was used to select 6,475 eligible participants across all 7 provinces in Nepal. A total
of 259 wards were selected as the primary sampling units (PSU) at the first stage, maintaining
37 PSUs from each province. The household listing operation was carried out in 259 PSUs,
in order to develop a sampling frame for selection of individual households at the second
stage. From the prepared list of the households, 25 households per PSU were sampled using
systematic random sampling, after determining the sampling interval by dividing the num-
ber of listed households by 25. From each of the selected households, one adult member of
age 15–69 years was sampled randomly for participation in the survey using an android tab-
let. This household listing process provided greater rigor to the sampling process than for
previous STEPS surveys. Further details on the sampling process can be found elsewhere
[14].
Table 1. Variables definition.
Variables Definitions
Current smoker Participants those who had smoked in the past 30 days were considered as current
smoker for this survey.
Harmful use of alcohol Consumption of�60 gm of pure alcohol on an average day in the past 30 days was
considered harmful use.
Insufficient fruits and
vegetables intake
Participants who ate less than five servings of fruits and vegetables per day were
considered to have insufficient fruit and vegetable intake.
Insufficient Physical activity Participants who participated in less than the equivalent of 150 minutes of
moderate intensity (600 METs) physical activity per week were categorized as
having insufficient physical activity.
Overweight Participants with a BMI� 25 kg/m2, had classified them as being overweight.
Raised BP Participants were classified as having raised BP if the average 2nd and 3rd
measurement of systolic BP was�140 mmHg, or the average diastolic BP was�90
mmHg, or if they reported to be taking antihypertensive medication.
Raised blood sugar Participants with a fasting blood sugar�126 mg/dl, or those currently taking
medications to lower blood sugar, were considered to have raised blood sugar.
Raised blood cholesterol Participants whose blood cholesterol was above 190 mg/dl, or those currently taking
medications to lower blood cholesterol, were considered to have raised blood
cholesterol
https://doi.org/10.1371/journal.pone.0253605.t001
PLOS ONE Noncommunicable diseases risk factors and their determinants: STEPS survey 2019, Nepal
PLOS ONE | https://doi.org/10.1371/journal.pone.0253605 July 30, 2021 3 / 20

Variable definition
For this study, current smoking, harmful use of alcohol, insufficient fruit and vegetable intake,
insufficient physical activity are considered as a behavioral factor. Similarly, overweight and
raised BP, are categorized as a physical factor. Raised blood sugar and raised blood cholesterol
together are considered as biochemical factor. The operational definitions of the outcome vari-
ables (NCD risk factor) are presented in Table 1.
Data collection
We conducted face to face interviews using standardized questions from the STEPS Survey
(version 3.2) [15]–an update on the 2013 STEPs survey. The survey collected information
related to behavioral (tobacco use, alcohol use, physical activity, fruits and vegetables intake)
(STEP I), physical (height, weight and BP) (STEP II) and biochemical measures (Blood sugar,
sodium level measurement in urine) (STEP III). Measurement of height, weight (measured
using SECA weighing machine, Germany), BP (measured using OMRON BP monitor), blood
sugar (measured using Cardiocheck PA) and blood cholesterol (measured using Cardiocheck
PA) were made as per the WHO STEPS manual. Details of the measurement process has been
described in more detail elsewhere [14,16].
The survey also included questions related to tobacco policy, alcohol policy and programs.
Furthermore, it included questions related to violence and injury, along with musculoskeletal
pain. In addition, in this round of the STEPs survey dietary salt intake level was estimated via
spot urine collection, along with that concentrations of blood glucose and total cholesterol was
measured using CardioCheck, PA, as recommended by the WHO.
Statistical analysis
Analysis was performed with STATA version 15.1 using survey (svy) set command, defining
clusters and sampling weight information. All estimates were weighted by sample weights and
are presented with 95% confidence intervals (CI). Prevalence estimates were calculated using
Taylor series linearization. Chi-square tests were used for bivariate analysis, to test associations
between independent and dependent variables. Furthermore, Poisson regression was used to
calculate the adjusted prevalence ratio (APR) between each NCD risk factors and sociodemo-
graphic covariates (age, sex, education, marital status, province, ecological belt and place of
residence) included simultaneously [17]. For clustering analysis of NCD risk factors, the num-
bers of risk factors present within each participant were summed (from 0 to 5) and was ana-
lyzed against socio-demographic covariates through Poisson regression. The relationship
between the number of risk factors and covariates was estimated through adjusted relative risk
ratios (ARR), with the number of risk factors designated as the dependent variable.
Ethical considerations
Ethical approval to conduct this survey was granted from the Ethical Review Board (ERB) of
the Nepal Health Research Council (NHRC), Government of Nepal (Registration number
293/2018). Written informed consent was obtained from each participant before they enrolled
in the survey. In case of minors (under 18 years old) both assent from the research participants
and consent from their parents (legal guardian) was obtained, as per national ethical guidelines
for health research in Nepal. We also took administrative approval from federal, provincial
and local governments, as per the need. The confidentiality of all information gathered was
maintained. Any waste generated during the laboratory procedures was properly disinfected
PLOS ONE Noncommunicable diseases risk factors and their determinants: STEPS survey 2019, Nepal
PLOS ONE | https://doi.org/10.1371/journal.pone.0253605 July 30, 2021 4 / 20

using aseptic techniques before being safely disposed of. All blood and urine samples were dis-
carded after completing biochemical measurements.
Results
Characteristics of participants
Out of 6,475 participants approached for participation, 5,593 individuals participated in the
study, a response rate of 86%. Just over half of the participants (53%) were female. Forty five
percent (45%) of participants were aged between 15 and 29 years, with 29% aged 30 to 44 years
and 26% 45to 69. Around one fifth of participants were from Lumbini Province (21%), with
19% from province 2, with the lowest proportion coming from Karnali Province (6%) and
Gandaki Province (8%). Over half (57%) were from the Terai belt. Two-fifths (40%) of the par-
ticipants had not completed their primary level education and approximately 46% were work-
ing as a homemaker. Just under 78% of the participants were currently married (Table 2).
Smoking
Current smoking behavior was observed in 17% of the participants (95% CI: 15.2–19.2), with
the prevalence being highest amongst men (28%; 95% CI: 24.6–31.6) and in the 45 to 69 years
age group (26%; 95% CI: 22.9–28.9). The prevalence of current smoking was also higher
among uneducated/less educated participants (22%; 95% CI: 18.9–24.6). There were a higher
proportion of smokers found in Sudurpaschim Province (26%; 95% CI: 21.8–31.5) and Karnali
Province (22%; 95% CI: 17.9–25.7) than in other provinces. Similarly, the proportion of smok-
ers was higher in the mountain belt (27%; 95% CI: 22.4–33.0) and among the lowest quintile of
affluence (poorest) (23%; 95% CI: 19.8–27.1). Conversely, the prevalence of smoking was
found to be higher among employed (25%; 95% CI: 21.7–29.3) and married participants
(32.3%; 95% CI: 24.8–40.9) (Table 2).
Alcohol use
Harmful use of alcohol was observed in around 7% (95% CI: 5.5–8.4) of participants with a
higher prevalence amongst males (12%; 95% CI: 10.00–15.39). Participants from the mountain
belt (13%; 95% CI: 7.7–20.2) had higher prevalence compared to Terai residents (5%; 95% CI:
3.7–7.5). A higher prevalence was also observed among participants who had primary educa-
tion (9%; 95% CI: 6.1–12.2) and among employed people (11%; 95% CI: 8.2–14.5) (Table 2).
Insufficient fruit/Vegetable intake
An insufficient intake of fruits and vegetables was found among almost all participants (97%),
although a slightly higher prevalence was found among those with none/less than primary edu-
cation (98%; 95% CI: 95.9–99.1). Those from rural municipalities (98%; 95% CI: 97.2–99.0),
the mountain belt (99%; 95% CI: 98.4–99.7) and those with the poorest economic status (99%;
95% CI: 98.8–99.8) had the highest prevalence (Table 2).
Physical inactivity
Around 8% (95% CI: 5.7–10.1) of the participants were physically inactive with a higher preva-
lence among those 45 to 69 years of age (9%; 95% CI: 6.9–12.3). Participants with a primary
education had a higher prevalence of physical inactivity (10%; 95% CI: 6.4–14.0) compared to
participants with a secondary or higher level of education. Participants in the richest quintile
(13%; 95% CI: 9.2–18.9), those who were unemployed (13%; 95% CI: 7.1–23.4) and those that
PLOS ONE Noncommunicable diseases risk factors and their determinants: STEPS survey 2019, Nepal
PLOS ONE | https://doi.org/10.1371/journal.pone.0253605 July 30, 2021 5 / 20
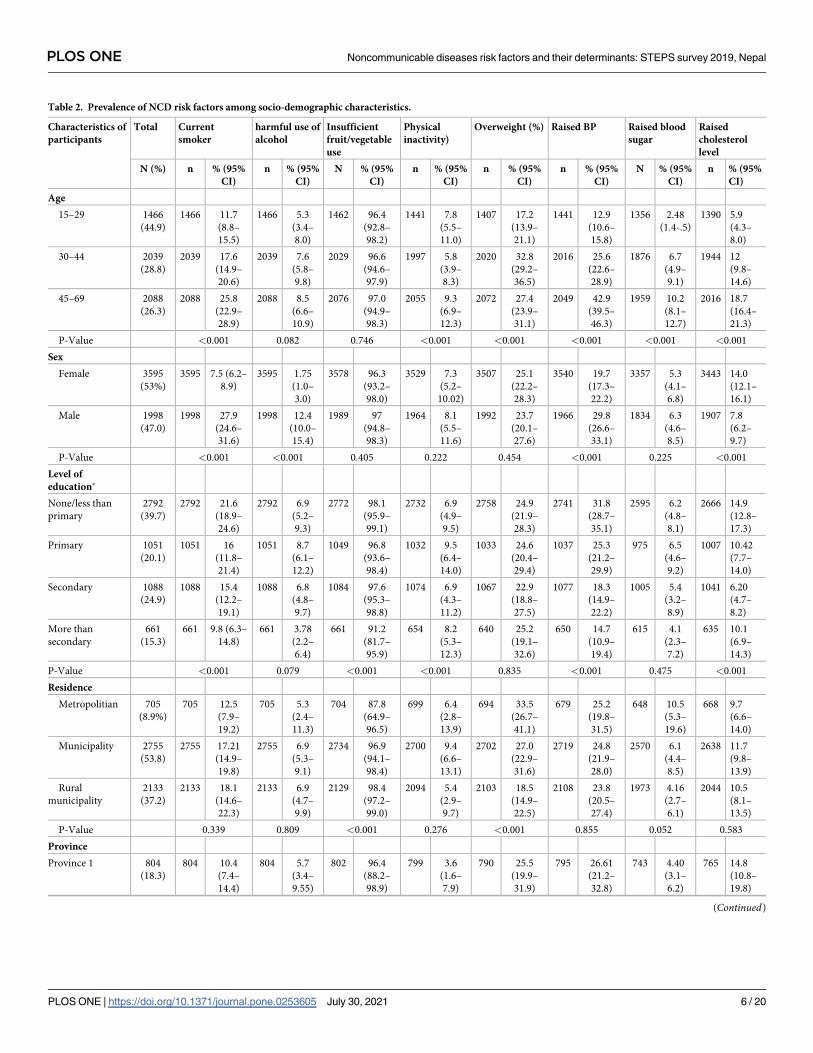
Table 2. Prevalence of NCD risk factors among socio-demographic characteristics.
Characteristics of
participants
Total Current
smoker
harmful use of
alcohol
Insufficient
fruit/vegetable
use
Physical
inactivity)
Overweight (%) Raised BP Raised blood
sugar
Raised
cholesterol
level
N (%) n % (95%
CI)
n % (95%
CI)
N % (95%
CI)
n % (95%
CI)
n % (95%
CI)
n % (95%
CI)
N % (95%
CI)
n % (95%
CI)
Age
15–29 1466
(44.9)
1466 11.7
(8.8–
15.5)
1466 5.3
(3.4–
8.0)
1462 96.4
(92.8–
98.2)
1441 7.8
(5.5–
11.0)
1407 17.2
(13.9–
21.1)
1441 12.9
(10.6–
15.8)
1356 2.48
(1.4-.5)
1390 5.9
(4.3–
8.0)
30–44 2039
(28.8)
2039 17.6
(14.9–
20.6)
2039 7.6
(5.8–
9.8)
2029 96.6
(94.6–
97.9)
1997 5.8
(3.9–
8.3)
2020 32.8
(29.2–
36.5)
2016 25.6
(22.6–
28.9)
1876 6.7
(4.9–
9.1)
1944 12
(9.8–
14.6)
45–69 2088
(26.3)
2088 25.8
(22.9–
28.9)
2088 8.5
(6.6–
10.9)
2076 97.0
(94.9–
98.3)
2055 9.3
(6.9–
12.3)
2072 27.4
(23.9–
31.1)
2049 42.9
(39.5–
46.3)
1959 10.2
(8.1–
12.7)
2016 18.7
(16.4–
21.3)
P-Value <0.001 0.082 0.746 <0.001 <0.001 <0.001 <0.001 <0.001
Sex
Female 3595
(53%)
3595 7.5 (6.2–
8.9)
3595 1.75
(1.0–
3.0)
3578 96.3
(93.2–
98.0)
3529 7.3
(5.2–
10.02)
3507 25.1
(22.2–
28.3)
3540 19.7
(17.3–
22.2)
3357 5.3
(4.1–
6.8)
3443 14.0
(12.1–
16.1)
Male 1998
(47.0)
1998 27.9
(24.6–
31.6)
1998 12.4
(10.0–
15.4)
1989 97
(94.8–
98.3)
1964 8.1
(5.5–
11.6)
1992 23.7
(20.1–
27.6)
1966 29.8
(26.6–
33.1)
1834 6.3
(4.6–
8.5)
1907 7.8
(6.2–
9.7)
P-Value <0.001 <0.001 0.405 0.222 0.454 <0.001 0.225 <0.001
Level of
education�
None/less than
primary
2792
(39.7)
2792 21.6
(18.9–
24.6)
2792 6.9
(5.2–
9.3)
2772 98.1
(95.9–
99.1)
2732 6.9
(4.9–
9.5)
2758 24.9
(21.9–
28.3)
2741 31.8
(28.7–
35.1)
2595 6.2
(4.8–
8.1)
2666 14.9
(12.8–
17.3)
Primary 1051
(20.1)
1051 16
(11.8–
21.4)
1051 8.7
(6.1–
12.2)
1049 96.8
(93.6–
98.4)
1032 9.5
(6.4–
14.0)
1033 24.6
(20.4–
29.4)
1037 25.3
(21.2–
29.9)
975 6.5
(4.6–
9.2)
1007 10.42
(7.7–
14.0)
Secondary 1088
(24.9)
1088 15.4
(12.2–
19.1)
1088 6.8
(4.8–
9.7)
1084 97.6
(95.3–
98.8)
1074 6.9
(4.3–
11.2)
1067 22.9
(18.8–
27.5)
1077 18.3
(14.9–
22.2)
1005 5.4
(3.2–
8.9)
1041 6.20
(4.7–
8.2)
More than
secondary
661
(15.3)
661 9.8 (6.3–
14.8)
661 3.78
(2.2–
6.4)
661 91.2
(81.7–
95.9)
654 8.2
(5.3–
12.3)
640 25.2
(19.1–
32.6)
650 14.7
(10.9–
19.4)
615 4.1
(2.3–
7.2)
635 10.1
(6.9–
14.3)
P-Value <0.001 0.079 <0.001 <0.001 0.835 <0.001 0.475 <0.001
Residence
Metropolitian 705
(8.9%)
705 12.5
(7.9–
19.2)
705 5.3
(2.4–
11.3)
704 87.8
(64.9–
96.5)
699 6.4
(2.8–
13.9)
694 33.5
(26.7–
41.1)
679 25.2
(19.8–
31.5)
648 10.5
(5.3–
19.6)
668 9.7
(6.6–
14.0)
Municipality 2755
(53.8)
2755 17.21
(14.9–
19.8)
2755 6.9
(5.3–
9.1)
2734 96.9
(94.1–
98.4)
2700 9.4
(6.6–
13.1)
2702 27.0
(22.9–
31.6)
2719 24.8
(21.9–
28.0)
2570 6.1
(4.4–
8.5)
2638 11.7
(9.8–
13.9)
Rural
municipality
2133
(37.2)
2133 18.1
(14.6–
22.3)
2133 6.9
(4.7–
9.9)
2129 98.4
(97.2–
99.0)
2094 5.4
(2.9–
9.7)
2103 18.5
(14.9–
22.5)
2108 23.8
(20.5–
27.4)
1973 4.16
(2.7–
6.1)
2044 10.5
(8.1–
13.5)
P-Value 0.339 0.809 <0.001 0.276 <0.001 0.855 0.052 0.583
Province
Province 1 804
(18.3)
804 10.4
(7.4–
14.4)
804 5.7
(3.4–
9.55)
802 96.4
(88.2–
98.9)
799 3.6
(1.6–
7.9)
790 25.5
(19.9–
31.9)
795 26.61
(21.2–
32.8)
743 4.40
(3.1–
6.2)
765 14.8
(10.8–
19.8)
(Continued)
PLOS ONE Noncommunicable diseases risk factors and their determinants: STEPS survey 2019, Nepal
PLOS ONE | https://doi.org/10.1371/journal.pone.0253605 July 30, 2021 6 / 20

Table 2. (Continued)
Characteristics of
participants
Total Current
smoker
harmful use of
alcohol
Insufficient
fruit/vegetable
use
Physical
inactivity)
Overweight (%) Raised BP Raised blood
sugar
Raised
cholesterol
level
N (%) n % (95%
CI)
n % (95%
CI)
N % (95%
CI)
n % (95%
CI)
n % (95%
CI)
n % (95%
CI)
N % (95%
CI)
n % (95%
CI)
Province 2 803
(19.5)
803 13.93
(10.7–
17.9)
803 3.72
(2.3–
5.92)
792 96.4
(89.5–
98.8)
796 8.55
(3.8–
17.9)
794 19.7
(14.5–
26.3)
796 18.7
(14.0–
24.4)
759 11.3
(7.4–
16.9)
770 11.5
(8.2–
15.9)
Bagmati 759
(16.2)
759 18.8
(14.3–
24.4)
759 8.72
(5.0–
14.8)
759 97.2
(94.1–
98.7)
748 10.3
(6.8–
15.3)
755 42.8
(35.4–
50.5)
732 25.2
(20.1–
31.1)
687 4.1
(2.3–
7.2)
718 8.2
(6.2–
10.7)
Gandaki province 793
(8.1)
793 18.9
(15.3–
23.2)
793 8.5
(5.2–
13.6)
791 98.9
(97.7–
99.6)
778 10.12
(4.9–
19.6)
787 35.4
(28.7–
42.7)
786 29.9
(26.6–
33.5)
757 3.2
(1.8–
5.5)
765 12.9
(9.7–
17.1)
Lumbini Province 797
(20.6)
797 17.6
(12.5–
24.1)
797 7.8
(4.6–
12.8)
792 94.4
(82.6–
98.4)
789 7.3
(3.6–
14.1)
783 19.6
(15.8–
24.2)
780 28.2
(24.1–
32.8)
748 6.4
(3.9–
10.3)
766 11.6
(8.7–
15.4)
Karnali province 808
(5.6)
808 21.6
(17.9–
25.7)
808 8.8
(5.7–
13.3)
806 96.9
(93.3–
98.6)
791 4.2
(1.9–
8.8)
788 11.4
(8.21–
15.6)
802 21.4
(17.2–
26.3)
763 0.7
(0.4–
1.4)
770 4.7
(3.2–
6.84)
Sudurpaschim
province
829
(11.8)
829 26.4
(21.8–
31.5)
829 7.0
(4.5–
10.7)
825 98.8
(97.7–
99.4)
792 9.4
(4.4–
18.9)
802 11.5
(8.7–
15.3)
815 20.9
(16.9–
25.7)
734 3.9
(1.5–
9.7)
796 9.6
(6.6–
13.8)
P-Value <0.001 0.248 0.504 0.122 <0.001 0.021 <0.001 0.023
Ecological belt
Mountain 661
(10.8)
661 27.4
(22.4–
33.0)
12.7
(7.7–
20.2)
99.3
(98.4–
99.7)
7.85
(5.1–
11.9)
23.8
(17.5–
31.5)
24.8
(18.6–
32.2)
1.01
(0.4–
2.7)
5.7
(3.8–
8.4)
Hill 2606
(31.8%)
2606 16.6
(13.8–
19.8)
7.4
(5.7–
9.61)
97.9
(96.6–
98.8)
6.3
(4.6–
8.7)
31.5
(26.1–
37.5)
27.1
(24–
30.4)
3.0
(2.0–
4.5
10.4
(8.1–
13.3)
Terai 2326
(57.5)
2326 15.5
(12.9–
18.5)
5.3
(3.7–
7.5)
95.4
(91.1–
97.7)
6.7
(4.9–
8.8)
20.6
(17.7–
23.8)
22.9
(20.1–
26.1)
8.2
(6.2–
10.5)
12.5
(10.5–
14.8)
P-Value <0.001 <0.001 0.011 0.299 0.001 0.217 <0.001 0.009
Wealth Quintile
Poorest 1653
(20.0)
1653 23.24
(19.78–
27.11)
1653 9.11
(6.59–
12.46)
1641 98.61
(96.98–
99.37)
1612 4.23
(2.55–
6.95)
1619 16.95
(13.67–
20.83)
1630 26.85
(23.27–
30.75)
1533 2.67
(1.61–
4.41)
1589 6.98
(5.30–
9.15)
Second quintile 1062
(20)
1062 17.1
(13.9–
20.9)
1062 6.4
(4.7–
8.7)
1054 99.5
(98.8–
99.8)
1049 5.9
(3.8–
9.3)
1043 21.5
(17.9–
25.5)
1042 22.4
(19.0–
26.3)
998 4.2
(2.7–
6.5)
1020 10.9
(7.7–
15.3)
Third quintile 949
(20.1)
949 15.7
(12.6–
19.3)
949 7.4
(4.8–
11.3)
947 97.9
(95.8–
99.0)
930 7.0
(4.1–
11.7)
928 22.8
(18.2–
28.2)
929 24.7
(20.1–
29.9)
890 6.5
(3.9–
10.5)
905 11.3
(8.5–
14.8)
Fourth quintile 878
(20.1)
878 15.8
(12.2–
20.2)
878 4.7
(2.9–
7.6)
876 95.9
(92.4–
97.8)
868 7.6
(5.3–
10.9)
867 23.9
(19.3–
29.1)
869 24.5
(20.2–
29.5)
803 6.8
(4.2–
11.1)
833 12.8
(9.9–
16.4)
Richest quintile 1051
(19.9)
1051 13.7
(10.6–
17.8)
1051 6.3
(4.0–
9.6)
1049 91.2
(83.1–
95.7)
1034 13.3
(9.2–
18.9)
1042 36.8
(30.5–
43.6)
1036 23.9
(19.8–
28.5)
967 8.7
(6.4–
11.8)
1003 13.5
(10.5–
17.3)
P-Value 0.002 0.177 <0.001 0.001 <0.001 <0.001 0.008 0.032
Occupation�
Employed 1707
(32.9)
1707 25.3
(21.7–
29.3)
1707 10.9
(8.2–
14.5)
1700 96.5
(93.8–
98.0)
1685 8.7
(6.0–
12.6)
1689 27.5
(23.6–
31.9)
1687 31.6
(28.1–
35.3)
1566 6.5
(5.1–
8.3)
1625 11.2
(8.5–
14.4)
(Continued)
PLOS ONE Noncommunicable diseases risk factors and their determinants: STEPS survey 2019, Nepal
PLOS ONE | https://doi.org/10.1371/journal.pone.0253605 July 30, 2021 7 / 20

were married (13%; 95% CI: 7.9–21.3) had a higher proportion of physical inactivity as com-
pared to their counterparts (Table 2).
Overweight
The prevalence of overweight was 24% (95% CI: 21.7–27.4) across all participants, a higher prev-
alence was found among participants in the 30 to 44 years age group (33%; 95% I: 29.2–36.5).
Metropolitan city residents (34%; 95% CI: 26.7–41.1) and hill residents (32%; 95% CI: 26.1–
37.5) had a higher prevalence of overweight compared to residents in rural municipality (18%;
95% CI: 14.9–22.5) and Terai belt (21%; 95% CI: 17.7–23.8]. The highest prevalence of over-
weight was found in Bagmati Province (43%; 95% CI: 35.4–50.5) followed by Gandaki Province
(35%; 95% CI: 28.7–42.7). Similarly, the prevalence was highest amongst those in the richest
quintile (37%; 95% CI: 30.5–43.6) and currently married participants (27%; 95% CI: 24.5, 30.5).
Raised BP
Around 24% (95% CI: 22.4–26.7) of the participants had raised BP with a higher prevalence
among men (30%; 95% CI: 26.6–33.1) and participants in the 45 to 69 years age group (43%;
95% CI: 39.5–46.3). Raised BP was most prevalent in Gandaki (30%; 95% CI: 26.6, 33.5) and
Table 2. (Continued)
Characteristics of
participants
Total Current
smoker
harmful use of
alcohol
Insufficient
fruit/vegetable
use
Physical
inactivity)
Overweight (%) Raised BP Raised blood
sugar
Raised
cholesterol
level
N (%) n % (95%
CI)
n % (95%
CI)
N % (95%
CI)
n % (95%
CI)
n % (95%
CI)
n % (95%
CI)
N % (95%
CI)
n % (95%
CI)
Student 402
(14.3)
402 3.6 (1.7–
7.3)
402 1.66
(0.6–
4.5)
400 95.1
(88.2–
98.1)
396 6.3
(3.6–
10.8)
393 12.3
(7.6–
19.3)
393 6.6 (3.8–
11.2)
374 1.7
(.73–
4.1)
386 3.8
(2.1–
6.9)
Homemaker 3142
(45.5)
3142 15.2
(12.9–
17.7)
3142 5.3
(3.69–
7.45)
3131 97.4
(95.7–
98.4)
3080 6.4
(4.6–
8.8)
3076 25.8
(22.6–
29.3)
3090 24.9
(21.9–
28.0)
2927 6.3
(4.5–
8.8)
3009 13.3
(11.5–
15.4)
Unemployed 273
(6.1)
273 20.9
(12.5–
32.8)
273 8.4
(4.6–
15.0)
267 95.4
(89.7–
98.0)
263 13.3
(7.1–
23.4)
272 24.0
(14.2–
37.6)
269 23.4
(17.3–
30.9)
256 5.4
(2.49–
1.4)
261 10.6
(6.41–
17.1)
Others 63 (0.9) 63 11.4
(5.1–
23.5)
63 2.3
(0.80–
6.5)
63 98.7
(92.6–
99.8)
63 12.22
(4.7–
28.2)
63 27.7
(14.3–
46.7)
61 34.3
(20.7–
51.1)
62 16.9
(8.0–
32.1)
63 16.3
(7.5–
31.9)
P-Value <0.001 <0.001 0.048 <0.001 0.002 <0.001 0.002 <0.001
Marital status�
Unmarried 538
(19.5)
538 10.0
(6.6–
15.0)
538 4.0
(1.8–
8.7)
534 96.5
(92.4–
98.4)
531 8.7
(5.4–
13.5)
531 13.79
(9.5–
19.6)
530 12.7
(9.0–
17.7)
496 1.71
(0.7–
4.1)
509 4.43
(2.6–
7.4)
Currently
married
4752
(77.8)
4752 18.4
(16.4–
20.5)
4752 7.4
(6.1–
9.1)
4735 96.6
(94.4–
97.9)
4666 7.2
(5.3–
9.6)
4668 27.4
(24.5–
30.5)
4675 26.9
(24.7–
29.2)
4412 6.7
(5.3–
8.5)
4552 12.3
(10.6–
14.2)
Separated/
Divorced/
Widowed
302
(2.7)
302 32.3
(24.8–
40.9)
302 8.20
(3.7–
17.1)
297 98.0
(93.7–
99.4)
295 13.2
(7.9–
21.3)
299 15.7
(10.7–
22.3)
300 40.6
(33.2–
48.5)
282 6.6
(3.8–
11.5)
288 22.9
(17.0–
30.1)
P-Value <0.001 0.155 0.793 <0.001 <0.001 <0.001 <0.001 <0.001
Total 5593 17.1
(15.2–
19.2)
5593 6.8
(5.5–
8.4)
5567 96.6
(94.3–
98.0)
5493 7.7
(5.7–
10.1)
5499 24.4
(21.7–
27.4)
5506 24.5
(22.4–
26.7)
5191 5.8
(4.5–
7.3)
5350 11.1
(9.7–
12.7)
� 1 case from education, 6 cases from occupation and 1 case from marital status was excluded.
https://doi.org/10.1371/journal.pone.0253605.t002
PLOS ONE Noncommunicable diseases risk factors and their determinants: STEPS survey 2019, Nepal
PLOS ONE | https://doi.org/10.1371/journal.pone.0253605 July 30, 2021 8 / 20

Lumbini Provinces (28%; 95% CI: 24.1–32.8) as compared to other provinces. Similarly, a
higher prevalence was observed among participants having none/less than primary level of
education (32%; 95% CI: 28.7–35.1) and those that were married (41%; 95% CI: 33.2–48.5).
Raised blood sugar
The prevalence of raised blood sugar was 5.8% for the total sample (95% CI: 4.5–7.3). Around
10% of participants aged 4 to 69 years (10.2%; 95% CI: 8.1–12.7) and 9% of participants in the
richest quintile (95% CI: 6.4–11.8) had raised blood sugar. The highest regional prevalence was
observed among participants of province 2 (11%; 95% CI: 7.4–16.9) with the lowest in Karnali
Province (1%; 95% CI: 0.36–1.4). Likewise, metropolitan (10%; 95% CI: 5.3–19.6) and Terai
residents (8%; 95% CI: 6.2–10.7) had higher prevalence of raised blood sugar compared to
rural municipality (4%; 95% CI: 2.7–6.1) and hilly areas (3%; 95% CI: 2.0–4.5) (Table 2).
Raised cholesterol level
Raised cholesterol level was found among 11% of the participants (95% CI: 9.7–12.7), with this
highest among participants 45 to 69 years of age (19%; 95% CI: 16.4–21.3) and among females
(14%; 95% CI: 12.11–16.17). Compared to other levels of education, participants with ‘none/
less than primary education’ (15%; 95% CI: 12.7–17.3) had the highest prevalence of raised
total cholesterol. Whilst a higher prevalence was found in Province 1 (15%; 95% CI: (10.81–
19.84), Terai residents (12%; 95% CI: 10.5, 14.8), richest quintile (14%; 95% CI: 10.5–17.3) and
married participants (23%; 95% CI: 17.0–30.1) compared to their counterparts (Table 2).
Prevalence ratios demonstrated a significantly higher prevalence of smoking among males
(APR: 4.49, 95% CI: 3.70–5.46) compared to females, once adjusting for other covariates.
Smoking was significantly lower among participants having more than a secondary level edu-
cation (APR: 0.56, 95% CI: 0.39–0.81) compared to participants with no, or less than primary
level of education. Similarly, a lower prevalence was found within Province 1 (APR: 0.42, 95%
CI: 0.29–0.60) residents and participants of hilly region (APR: 0.69, 95% CI: 0.54–0.90) as com-
pared to reference categories of Sudurpaschim Province and those from the mountain region,
respectively (Table 3).
Likewise, alcohol intake was significantly higher among men (APR: 9.09, 95% CI: 5.38–
15.35) and lower among participants having more than a secondary level of education (APR:
0.5, 95% CI: 0.28–0.9) and those residing in the Terai region (APR: 0.38, 95% CI: 0.20–0.70)
(Table 3).
Insufficient intake of fruits and vegetables was significantly less prevalent among partici-
pants having more than a secondary level education (APR: 0.94, 95% CI: 0.88–1.00) and
among participants of Karnali Province (APR: 0.97, 95% CI: 0.94–1.00) than Sudurpaschim
residents. A higher prevalence was observed among participants in the second poorest quintile
(APR: 1.02, 95% CI: 1.0–1.03) compared to those in the poorest quintile. Similarly, low physi-
cal activity was significantly lower among participants of Province 1 (APR: 0.3, 95% CI: 0.10–
0.83) and higher among richest participants (APR: 2.74, 95% CI: 1.42–5.27) (Table 3).
Being overweight was significantly higher among participants aged 30 to 44 years (APR:
1.46, 95% CI: 1.18–1.80) compared to those aged 15 to 29 years. A higher prevalence was
observed among participants of Bagmati Province (APR: 2.5, 95% CI: 1.82–3.49) and Gandaki
Province (APR: 2.36, 95% CI: 1.71–3.26) and lower among Terai residents (APR: 0.70, 95% CI:
0.53–0.94) than participants of mountain area. Similarly, raised BP (APR: 2.52, 95% CI: 2.06–
3.09) and raised blood sugar (APR: 3.9, 95% CI: 2.05–7.36) was significantly higher among par-
ticipants within the 45 to 49 years age group. A higher prevalence of raised BP was found
amongst males (APR: 1.5, 95% CI: 1.27–1.77) and participants of Gandaki Province (APR: 1.3,
PLOS ONE Noncommunicable diseases risk factors and their determinants: STEPS survey 2019, Nepal
PLOS ONE | https://doi.org/10.1371/journal.pone.0253605 July 30, 2021 9 / 20

Table 3. Adjusted prevalence ratio of sociodemographic characteristics with NCD risk factors.
Smoking
(APR with
95% CI)
Harmful use of
alcohol (APR
with 95% CI)
Insufficient fruit/
vegetable intake
(APR with 95% CI)
Physical
inactivity (APR
with 95% CI)
Overweight
(APR with 95%
CI)
Raised BP
(APR with
95% CI)
Raised Sugar
(APR with
95% CI)
Raised blood
cholesterol (APR
with 95% CI)
Age
15–29 Ref Ref Ref Ref Ref Ref Ref Ref
30–44 1.1 (0.83–
1.44)
0.94 (0.61–1.46) 0.99 (0.97–1.02) 0.72 (0.46–1.12) 1.46 (1.18–1.80)���
1.61 (1.30–
1.98)���2.33 (1.30
-.19) ��1.69 (1.15–2.48) ��
45–69 1.39 (1.03–
1.87)�0.94 (0.59–1.50) 0.99 (0.96–1.01) 1.14 (0.76–1.69) 1.26 (1.04–1.53)
�
2.52 (2.06
-.09)���3.88 (2.05
-.36)���2.58 (1.75 -.78)���
Sex
Female Ref Ref Ref Ref Ref Ref Ref Ref
Male 4.49 (3.70–
46)���9.09 (5.38
-.35)���0.98 (0.97–1.00) 0.91 (0.60–1.39) 0.95 (0.81–1.12) 1.5 (1.27
-.77)���1.04 (0.67–
1.61)
0.51 (0.38 -.67)���
Education level
None/less than
primary
Ref Ref Ref Ref Ref Ref Ref Ref
Primary 0.8 (0.63–
1.02)
1.15 (0.81–1.64) 0.98 (0.96–1.00) 1.39 (0.90–2.14) 0.99 (0.82–1.19) 0.95 (0.82–
1.10)
1.68 (1.16–
2.43)��0.89 (0.65–1.20)
Secondary 0.8 (0.63–
1.02)
0.85 (0.54–1.34) 1 (0.97–1.02) 0.91 (0.57–1.46) 0.93 (0.75–1.15) 0.79 (0.63–
1.00)�1.65 (1.03–
2.65)�0.66 (0.47–0.91)�
more than
secondary
0.56 (0.39–
0.81)��0.5 (0.28–0.90)� 0.94 (0.88–1.00)� 0.83 (0.45–1.54) 0.91 (0.71–1.19) 0.66 (0.48–
0.92)�1.29 (0.64–
2.62)
1.06 (0.67–1.69)
Residence
Rural
municipality
Ref Ref Ref Ref Ref Ref Ref Ref
(Sub)
Metropolitan
0.79 (0.53–
1.17)
0.85 (0.40–1.84) 0.93 (0.81–1.07) 0.54 (0.21–1.37) 1.22 (0.93–1.59) 1.08 (0.85–
1.36)
1.46 (0.72–
2.97)
0.73 (0.50–1.07)
Municipality 1.02 (0.82–
1.26)
0.88 (0.56–1.39) 1.01 (0.99–1.03) 0.78 (0.40–1.52) 0.78 (0.63–0.96)�
0.91 (0.77–
1.09)
0.79 (0.48–
1.31)
1 (0.75–1.32)
Province
Sudurpaschim Ref Ref Ref Ref Ref Ref Ref Ref
Province 1 0.42 (0.29–
60)���1.01 (0.55–1.87) 0.98 (0.94–1.03) 0.3 (0.10–0.83)� 1.98 (1.38–
2.84)���1.23 (0.92–
1.63)
0.68 (0.25–
1.84)
1.16 (0.74–1.82)
Province 2 0.53 (0.38
-.75)���0.75 (0.39–1.44) 1 (0.96–1.04) 0.6 (0.21–1.76) 1.51 (1.03–
2.21)�0.82 (0.59–
1.15)
1.45 (0.50–
4.25)
0.76 (0.47–1.21)
Bagmati
Province
0.67 (0.51–
0.89)��1.1 (0.56–2.16) 1 (0.97–1.03) 0.84 (0.38–1.84) 2.52 (1.82–
3.49)���0.95 (0.69–
1.31)
0.79 (0.29–
2.14)
0.63 (0.39–1.02)
Gandaki
Province
0.79 (0.60–
1.04)
1.37 (0.70–2.68) 1 (0.98–1.03) 0.89 (0.33–2.41) 2.36 (1.71–
3.26)���1.3 (1.00–
1.68)�0.67 (0.22–
2.01)
1.02 (0.66–1.60)
Lumbini
Province
0.72 (0.52–
0.98)�1.57 (0.87–2.86) 0.97 (0.92–1.03) 0.56 (0.22–1.42) 1.59 (1.13–
2.23)��1.34 (1.03–
1.74)�1 (0.34–2.94) 0.9 (0.58–1.40)
Karnali
Province
0.9 (0.67–
1.21)
1.31 (0.74–2.32) 0.97 (0.94–1.00�) 0.51 (0.17–1.49) 0.94 (0.61–1.43) 1.02 (0.76–
1.37)
0.26 (0.08
-.81)�0.53 (0.31 -.94)�
Ecological
Mountain Ref Ref Ref Ref Ref Ref Ref Ref
Hill 0.69 (0.54
-.90)��0.53 (0.30–0.95)� 1.01 (0.98–1.03) 2.32 (0.88–6.09) 1.03 (0.80–1.32) 0.94 (0.69–
1.27)
2.46 (0.81–
7.49)
1.53 (0.94–2.47)
Terai 0.7 (0.53–
0.92)��0.38 (0.20–
0.70)��0.98 (0.96–1.01) 2.76 (0.95–8.05) 0.7 (0.53–0.94)� 0.77 (0.57–
1.04)
4.25 (1.35–
13.36)�1.61 (0.94–2.77)
Wealth Quintile
Poorest quintile Ref Ref Ref Ref Ref Ref Ref Ref
Second quintile 0.88 (0.71–
1.08)
0.84 (0.53–1.34) 1.02 (1.00–1.03)� 1.27 (0.72–2.27) 1.26 (1.02–
1.56)�0.88 (0.74–
1.06)
1.2 (0.65–
2.19)
1.49 (1.08–2.07)�
(Continued)
PLOS ONE Noncommunicable diseases risk factors and their determinants: STEPS survey 2019, Nepal
PLOS ONE | https://doi.org/10.1371/journal.pone.0253605 July 30, 2021 10 / 20

95% CI: 1.0–1.7) and Lumbini Province (APR: 1.3, 95% CI: 1.03–1.74). Whilst raised blood
sugar was significantly higher among Terai residents (APR: 4.3, 95% CI: 1.35–13.36) (Table 3).
A significantly higher prevalence of raised blood cholesterol was observed among participants
within the 45 to 69 years age group (APR: 2.58, 95% CI: 1.75–3.78). This was lower among men
(APR: 0.51, 95% CI: 0.38–0.67) and participants from the Karnali Province (APR: 0.53, 95% CI:
0.31–0.94) compared to females and Sudurpaschim residents, respectively. A higher prevalence
was found among those in the most affluent quintile (APR: 2.09, 95% CI: 1.38–3.19) (Table 3).
Age, sex, education, residence, province and wealth were significantly associated with clus-
tering of risk factors. Males (ARR: 1.2, 95% CI: 1.1–1.3) and those in the fourth wealth quintile
(ARR: 1.17, 95% CI: 1.07–1.28) had a significantly higher number of risk factors compared to
females and the poorest participants. Similarly, participants who had more than a secondary
level education (ARR: 0.86, 95% CI: 0.78–0.95) and those who resided in Karnali Province
(ARR: 0.9, 95% CI: 0.8–0.9) had fewer risk factors (Table 4).
Discussion
Smoking
The prevalence of current smoking (17.1%) is relatively stable from the previous round of the
STEPS survey (19%) and this findings is similar to that of Bangladesh’s GATS 2017 survey
Table 3. (Continued)
Smoking
(APR with
95% CI)
Harmful use of
alcohol (APR
with 95% CI)
Insufficient fruit/
vegetable intake
(APR with 95% CI)
Physical
inactivity (APR
with 95% CI)
Overweight
(APR with 95%
CI)
Raised BP
(APR with
95% CI)
Raised Sugar
(APR with
95% CI)
Raised blood
cholesterol (APR
with 95% CI)
Third quintile 0.84 (0.66–
1.08)
1.16 (0.71–1.90) 1.01 (0.99–1.03) 1.31 (0.65–2.66) 1.42 (1.07–
1.88)�1.06 (0.83–
1.37)
1.4 (0.70–
2.80)
1.54 (1.01–2.37)�
Fourth quintile 0.88 (0.66–
1.17)
0.7 (0.37–1.30) 1 (0.97–1.02) 1.5 (0.82–2.74) 1.51 (1.18–
1.94)��1.06 (0.86–
1.30)
1.2 (0.58–
2.47)
1.86 (1.25–2.75)��
Richest quintile 0.87 (0.65–
1.17)
1.08 (0.59–1.97) 0.96 (0.92–1.00) 2.74 (1.42–
5.27)��1.94 (1.52–
2.50)���1.07 (0.85–
1.35)
1.5 (0.72–
3.16)
2.09 (1.38–3.19)���
Occupation
Employed Ref Ref Ref Ref Ref Ref Ref Ref
Student 0.2 (0.09
-.45)���0.24 (0.08–
0.68)��0.97 (0.92–1.02) 0.59 (0.26–1.33) 0.74 (0.43–1.25) 0.3 (0.17
-.56)���1.06 (0.25–
4.55)
0.57 (0.28–1.18)
Homemaker 1.08 (0.88–
1.32)
1.17 (0.78–1.75) 1 (0.99–1.02) 0.8 (0.59–1.10) 1.03 (0.87–1.21) 0.87 (0.72–
1.06)
1.09 (0.66–
1.79)
0.84 (0.58–1.20)
Unemployed 0.9 (0.57–
1.42)
0.91 (0.49–1.70) 0.99 (0.94–1.03) 1.65 (0.88–3.08) 0.83 (0.59–1.16) 0.71 (0.51–
0.98)�1.19 (0.55–
2.56)
0.85 (0.54–1.34)
Others 0.39 (0.19–
0.81)�0.25 (0.09–
0.70)��1.03 (0.99–1.07) 1.14 (0.44–2.94) 0.85 (0.51–1.43) 0.86 (0.58–
1.28)
2.25 (1.16
-.37)�1.2 (0.60–2.41)
Marital status
Unmarried Ref Ref Ref Ref Ref Ref Ref Ref
Currently
married
0.85 (0.58–
1.25)
1.13 (0.53–2.40) 0.98 (0.94–1.02) 0.72 (0.41–1.25) 1.28 (0.88–1.85) 0.73 (0.49–
1.09)
1.92 (0.54–
6.78)
1.13 (0.59–2.15)
Separated/
Divorced/
Widowed
1.68 (0.98–
2.90)
1.77 (0.66–4.70) 0.99 (0.94–1.03) 1.26 (0.56–2.85) 0.75 (0.45–1.24) 0.89 (0.57–
1.40)
1.55 (0.37–
6.41)
1.4 (0.68–2.91)
� p<0.05;
�� p<0.01;
��� p<0.001.
https://doi.org/10.1371/journal.pone.0253605.t003
PLOS ONE Noncommunicable diseases risk factors and their determinants: STEPS survey 2019, Nepal
PLOS ONE | https://doi.org/10.1371/journal.pone.0253605 July 30, 2021 11 / 20

Table 4. Clustering of NCD risk factors and its multivariable analysis.
Age Mean number of existing risk factors (95%
CI)
Adjusted relative risk ARR (95%
CI)
15–29 years 1.81 (1.75–1.86) Ref
30–44 years 2.00 (1.96–2.05) 1.14 (1.06–1.22)���
45–69 years 1.95 (1.91–1.98) 1.31 (1.23–1.39)���
Sex
Female 1.95 (1.91–1.98) Ref
Male 2.41 (2.36–2.46) 1.21 (1.14–1.29)���
Education level
None/less than primary 2.15 (2.11–2.20) Ref
Primary 2.11 (2.04–2.18) 0.99 (0.94–1.04)
Secondary 2.09 (2.02–2.16) 0.94 (0.92–1.01)
more than secondary level 1.95 (1.86–2.04) 0.86 (0.78–0.95)��
Residence
Rural municipality 1.99 (1.94–2.03) Ref
Sub/metropolitan 2.30 (2.21–2.39) 0.94 (0.81–1.09)
Municipality 2.16 (2.11–2.21) 0.95 (0.89–1.01)
Province
Sudurpaschim 2.09 (2.01–2.8) Ref
Province 1 2.15 (1.91–2.07) 0.91 (0.82–1.02)
Province 2 1.99 (1.91–2.08) 0.89 (0.78–1.01)
Bagmati Province 2.29 (2.20–2.37) 0.98 (0.90–1.07)
Gandaki Province 2.29 (2.21–2.38) 1.07 (0.97–1.18)
Lumbini Province 2.07 (1.99–2.15) 0.95 (0.86–1.04)
Karnali Province 1.90 (1.83–1.97) 0.88 (0.80–0.96)��
Ecological
Mountain 2.08 (1.99–2.15) Ref
Hill 2.13 (2.09–2.17) 0.99 (0.92–1.06)
Terai 2.10 (2.05–2.15) 0.93 (0.85–1.01)
Wealth Quintile
Poorest 1.95 (1.91–2.00) Ref
Second quintile 2.05 (1.99–2.12) 1.02 (0.96–1.09)
Third quintile 2.11 (2.04–2.18) 1.06 (0.98–1.14)
Fourth quintile 2.20 (2.12–2.29) 1.1 (1.02–1.18)�
Richest 2.33 (2.25–2.41) 1.17 (1.07–1.28���)
Occupation
Employed 2.28 (2.21–2.33) Ref
Student 2.22 (2.10–2.35) 0.75 (0.68–0.84)���
Homemaker 1.99 (1.96–2.04) 0.98 (0.91–1.04)
Unemployed 2.13 (1.99–2.27) 0.95 (0.86–1.05)
Others 2.5 (2.21–2.79) 0.92 (0.77–1.09)
Marital status
Unmarried 2.13 (2.03–2.23) Ref
Currently married 2.09 (2.07–2.13) 0.93 (0.84–1.03)
Separated/Divorced/
Widowed
2.29 (2.17–2.42) 0.99 (0.88–1.12)
Total 2.04 (2.02–2.08) -
� p<0.05;
�� p<0.01;
��� p<0.001.
https://doi.org/10.1371/journal.pone.0253605.t004
PLOS ONE Noncommunicable diseases risk factors and their determinants: STEPS survey 2019, Nepal
PLOS ONE | https://doi.org/10.1371/journal.pone.0253605 July 30, 2021 12 / 20

[10,18,19]. However, compared to India’s smoking prevalence (10.7%), the prevalence in
Nepal is higher [20]. This relatively stable smoking rate from 2013 onward, could be the result
of implementation and monitoring of the comprehensive tobacco control law that was intro-
duced in 2011 [21]. Furthermore, an increase in literacy rate of the population, increased
awareness about the health consequences of smoking, effective implementation and monitor-
ing of tobacco control law provisions such as pictorial health warning, tobacco industry liti-
gation, may have played a crucial role in keeping the smoking prevalence stable, or to curb the
increasing trend.
Within our study we found a significantly higher smoking prevalence amongst males (25%)
than females (7%), which aligns with the patterns of smoking observed in WHO SEARO mem-
ber countries [22]. Studies have indicated that this could due to a range of factors including
tobacco industry market strategies that portray smoking as more masculine and community
tolerance of male smoking over female smoking [23,24]. Our findings also found an increasing
prevalence in smoking with increasing age, a similar finding to that of the previous 2013
STEPS survey and other global data [10,22]. A possible explanation for increasing smoking
prevalence with age may be due to increased levels of dependence with age, or lack of effective
cessation programs which may lead to the accumulation of smokers with increasing age [25].
We found that participants residing in Province 1, Province 2, Bagmati Province, and Lum-
bini Province were less likely to smoke than those in Sudurpaschim Province, with this finding
aligning with another national level survey [26]. This may be due to the comparatively high
levels of literacy in those provinces compared to Karnali, Gandaki and Sudurpaschim. The
role of education in smoking practices is further elucidated through the relationship of educa-
tional level and prevalence of smoking found within the current study. Participants with none/
less than primary of education were more likely to smoke as compared to those with a higher
education level (primary, secondary or higher secondary above) in our study. This finding was
consistent with previous data from demographic and health surveys of nine countries, includ-
ing Nepal [27]. Similarly, people residing in mountainous region were more likely to smoke
than in any other regions of country and these findings, which aligns with previous survey
findings [10]. The differences in prevalence of smoking based on province and ecological belt
could indicate the need of contextualized targeted interventions for smoking control in Nepal.
The current federal structure of the country, where planning process is devolved to provincial
and local government to a large extent, could be an opportunity for implementation of locally
contextualized interventions for control of smoking.
Alcohol intake
Prevalence of harmful alcohol intake has increased to 6.7% in the current study from the
2.2% reported in 2013 STEPS survey [10]. Alcohol intake and harmful alcohol intake was
higher among males than females, which was also noted in the previous round of STEPS sur-
vey [10]. Regarding types of alcohol used, a significant proportion of females consumed
home-brewed alcohol whilst males consumed alcohol from other sources i.e. industrially
produced alcohol [28]. This difference in consumption of alcohol based on the sex of partici-
pants could be linked to social and cultural norms which define drinking alcohol by males as
normal behavior, while in females, drinking alcohol is still considered as an anti-social act
[24]. However, compared to previous rounds of the STEPS survey, a higher proportion of
females are consuming alcohol, which could be a result of changing lifestyles and societal
perceptions in alcohol consumption among females. In addition, findings revealed that there
is a higher prevalence of the harmful use of alcohol among employed participants (10.96%)
compared to other groups.
PLOS ONE Noncommunicable diseases risk factors and their determinants: STEPS survey 2019, Nepal
PLOS ONE | https://doi.org/10.1371/journal.pone.0253605 July 30, 2021 13 / 20

Our study revealed participants with higher education level (secondary, more than second-
ary) and Terai residents were less likely to consume harmful levels of alcohol. This finding is in
line with a previous study conducted among 9,000 females, in which those of the mountain
region and those having no education/formal education were more likely to drink alcohol
[29]. This may be due to socio-cultural differences among different ecological belts of Nepal.
In the majority of ethnic groups in the mountainous region there is a cultural acceptance of
drinking alcohol, whereas in the Terai region drinking alcohol is considered an unreligious act
[29].
Insufficient fruit and vegetable intake
The results of fruit and vegetables intake suggests that there is marginal improvement intake
in comparison to previous round of STEPS survey [10]. Multivariable analysis found no signif-
icant association with achieving recommended levels of fruit and vegetable intake. However,
this study has found participants with higher education level (more than secondary level of
education) participants were more likely to consume adequate levels of fruits and vegetables
when compared with less educated groups, similar to findings of a previous study [30]. In the
context of Nepal, factors such as limited accessibility, availability and affordability of fruits and
vegetables and social perceptions on the use of fruits and vegetables could have a role in the
high prevalence of an insufficient intake of fruit and vegetables in the population. Individuals
may also lack adequate information on the need to consume sufficient fruit and vegetables and
the health consequences of insufficient intake. This issue could be further explored through
qualitative research, which could provide more in-depth insights into the insufficient fruit and
vegetable intake among the Nepalese population. Findings from such studies could also be use-
ful in designing contextualized interventions intended to promote adequate intake of fruits
and vegetables.
Physical inactivity
The current study reports a low prevalence of physical inactivity (7.4%) a finding that is in line
with those of previous national and international surveys [31,32]. However, in comparison
with the 2013 STEPS survey, physical inactivity has doubled [10]. Those in the richest quintile
were found to have the highest prevalence of physical inactivity. This may be due to the adop-
tion of a sedentary lifestyle associated with occupations among this group of people [33] along
with better access to means of transportation, thereby reducing walking hours in a day.
Overweight
Almost of one quarter (24%) of people were overweight, a figure slightly higher than that
reported in STEPS survey in 2013 (21%) [10]. This increment may be understood in relation
to changes in physical inactivity level, which was about 3% in 2013 and has increased to 7.4%.
Apart from sedentary lifestyle, urbanization accompanied with increased consumption of pro-
cessed/junk foods may be a factor in the increased prevalence of overweight among Nepalese
adults.
There is increasing prevalence of overweight with increasing age group, a finding in line
with previous publications from the 2013 STEPS survey. Ageing may also be associated with
limited mobility and limited engagement in labor intensive works which could result in over-
weight among participants of relatively higher age group. Those in the richest quintile have
higher a prevalence of overweight compared to those in the poorest quintile which is similar to
findings from a systematic review on the South Asian context [34]. A higher prevalence of
overweight among females could be attributed to social and cultural factors which influence
PLOS ONE Noncommunicable diseases risk factors and their determinants: STEPS survey 2019, Nepal
PLOS ONE | https://doi.org/10.1371/journal.pone.0253605 July 30, 2021 14 / 20

both dietary intake and physical activity [35]. However, this finding was not supported by mul-
tivariable analysis in the present study.
Raised BP
Within the present study one quarter (24.44%) of Nepalese had raised BP, which is consistent
with previous round of STEPS survey, but slightly higher than reported in the 2016 NDHS sur-
vey (19.9%) [36]. This difference may be due to methodological variation i.e. differences in
sampling design. Findings from both surveys indicate an increasing burden of raised BP in
Nepal and demand sufficient efforts for prevention and control of this problem.
We found an increasing prevalence of raised BP with increasing age, which is similar to the
previous STEPS survey and the Nepal Demographic and Health Survey (NDHS) 2016. We also
found a sex difference in the prevalence of raised BP, which is consistent with other surveys’
findings [10,36]. Sex differences in raised BP may be due to both biological and behavioral fac-
tors [37]. Such as sex hormones, genetic makeup, and other biological sex features that are
assumed to have a protective effect against raised BP in females [37,38]. An association was
also found between education level raised BP, with a lower prevalence found amongst more
educated participants. This result is consistent with the findings of previous STEPS and
NDHS. Educated people are likely to have access to information about the raised BP and its
consequences, which might ultimately help them to adopt preventative measures [39].
Raised blood sugar
WHO global estimates has shown that 8% of South Asian people have increased level of blood
sugar level which is close to the estimates in this study (6%) [40]. The prevalence of raised
blood sugar has doubled from 3% to 6% [10] which should also be interpreted considering the
difference in techniques to measure blood sugar level. In previous rounds of the survey the wet
method was adopted to measure blood sugar level, however, for this round of survey the dry
method was used. The prevalence of raised blood sugar level increased with increasing age
group, which is comparable to other national surveys. Increasing age is associated with com-
bined effect of increasing adiposity, decreasing physical activity, medications, coexisting ill-
ness, and insulin secretary defects that effect blood sugar level [41]. Similarly, this study has
reported differences in prevalence of raised blood sugar between provinces, place of residence
(sub/metropolitan city, municipality or rural municipality), and ecological region (mountain,
hill, Terai). Furthermore, blood sugar difference among ecological region is further validated
by multivariable analysis, that has shown that residents from Terai are more likely to have
raised blood sugar compared to those from the mountainous region. These differences may be
attributed to variations in physical activity levels, dietary habits and urbanization level, with
this findings similar to that from previous studies [42,43]. Some of the studies have put for-
ward a biological explanation that increased content of the glucose transporter GLUT4 in the
plasma membrane of skeletal muscle cells incubated under anoxia conditions (35,38), and in
skeletal muscle cells exposed to prolonged hypoxia leads to the better glucose tolerance
[44,45].
Raised cholesterol level
The prevalence of raised total cholesterol as found in the current study is quite low (11%) com-
pared with previous rounds of the survey i.e 22.7%; this may be due to differences in measure-
ment techniques. As with raised BP, we found an increase in prevalence of raised cholesterol
level with increasing age group, with this finding similar to that of the 2013 survey. Reduction
in the production of growth hormone with increasing age may be a causal factor contributing
PLOS ONE Noncommunicable diseases risk factors and their determinants: STEPS survey 2019, Nepal
PLOS ONE | https://doi.org/10.1371/journal.pone.0253605 July 30, 2021 15 / 20

to the age-dependent rise in blood cholesterol [46]. Similarly, our finding that females have a
higher prevalence of raised blood cholesterol level may be linked to increasing age and fluctua-
tions in female sex hormone i.e. estrogen. Various studies have shown that estrogen helps to
maintain levels of high-density lipoproteins (HDL) in adult females. However, at menopause
many females experience a change in their cholesterol levels, with total cholesterol and low-
density lipoproteins (LDL) levels rising and HDL falling [47]. In addition, a greater prevalence
of raised total cholesterol in participants in the richest quintile, as found in the present study,
may be due to the adoption of a more sedentary lifestyle, a lack of physical activity and stress
related factors.
Clustering of risk factors
The current study reveals that Nepalese adults on average have the presence of two risk NCD
risk factors. With the average number of NCD risk factors greater in males, the richest wealth
quintile, and amongst older participants. Suggesting that increasing age is associated with
increasing clustering of risk factors, a finding supported by research from other countries
[48,49]. As Nepal has been experiencing a rapid increase in life expectancy and median age of
population, it is likely that such problems could escalate in the coming years [1]. Greater clus-
tering of risk factors in males compared to females may be due to risk-oriented behavior and
sedentary lifestyle in male such as tobacco smoking, alcohol and physical inactivity.
Our finding that the prevalence of clustering of NCDs risk factors is higher among the rich-
est, was also found in a previous study in Bhutan [50]. Similar to individual risk factors such as
overweight/obesity and hypertension, the clustering of NCDs risk factors in the richest group
can be linked with the adoption of a sedentary lifestyle.
Policy implications and way forward
The policies and programs targeted to reduce NCD risk factors within the Nepal population
should be designed as per the socio-demographic gradient of the country. Finally, the new
multi-sectoral action plan for prevention and control of NCDs in Nepal should consider the
federal context and trends of risk factors for effective prevention and control in Nepal.
Conclusion
The findings for this survey demonstrate that a large proportion of the Nepalese population is
living with two or more NCD risk factors. In comparison to the 2013 STEPS survey, prevalence
of most of the risk factors has increased, indicating a need for effective programs to counter
this. One of the primary strategies to reduce the burden of NCD risk factors would be to pre-
vent, or reduce, the burden of modifiable risk factors, which could also prove more cost effec-
tive than providing curative services to people with NCDs. However, interventions on
modifiable risk factors demand collaborative efforts from multiple sectors so as to create an
enabling environment for behavior change. The current federal structure in Nepal, in which
the municipality takes responsibility for different sectors like education, infrastructure devel-
opment, environment etc. together with health, can provide an opportunity for integrated
interventions from different sectors, which could prove effective in reducing the burden of
NCD risk factors in the country.
Supporting information
S1 File.
(PDF)
PLOS ONE Noncommunicable diseases risk factors and their determinants: STEPS survey 2019, Nepal
PLOS ONE | https://doi.org/10.1371/journal.pone.0253605 July 30, 2021 16 / 20

S1 Dataset.
(XLSX)
Acknowledgments
We would like to acknowledge the effort of all the individuals involved in this survey, express
our deep sense of appreciation to the steering committee and technical working group (TWG)
members. We are grateful to World Health Organization (WHO) for technical support to con-
duct this survey. In particular, we would like to express my sincere thanks to Dr. Manju Rani
and Naveen Agarwal (HO/SEARO); Dr. Patricia Rarau and Dr. Stefan Savin (WHO HQ); Dr.
Md. Khurshid Alam Hyder and Dr. Lonim Prasai Dixit (WHO Nepal); Ms. Yvonne Y. Xu, Ms.
Preetika D. Banerjee and Ms. Surabhi Chaturvedi (WHO SEARO) for their valuable and
remarkable contribution in the survey. We would also like to thank all NHRC staff who helped
during conduction of this study.
Author Contributions
Conceptualization: Bihungum Bista, Meghnath Dhimal, Saroj Bhattarai, Tamanna Neupane,
Achyut Raj Pandey, Anjani Kumar Jha.
Data curation: Nick Townsend.
Formal analysis: Bihungum Bista, Meghnath Dhimal, Saroj Bhattarai, Yvonne Yiru Xu,
Achyut Raj Pandey.
Funding acquisition: Anjani Kumar Jha.
Investigation: Meghnath Dhimal, Pradip Gyanwali, Anjani Kumar Jha.
Methodology: Pradip Gyanwali, Anjani Kumar Jha.
Project administration: Pradip Gyanwali, Anjani Kumar Jha.
Supervision: Pradip Gyanwali, Anjani Kumar Jha.
Validation: Nick Townsend.
Visualization: Tamanna Neupane.
Writing – original draft: Bihungum Bista, Meghnath Dhimal, Saroj Bhattarai, Tamanna Neu-
pane, Yvonne Yiru Xu.
Writing – review & editing: Bihungum Bista, Meghnath Dhimal, Saroj Bhattarai, Tamanna
Neupane, Yvonne Yiru Xu, Achyut Raj Pandey, Nick Townsend, Pradip Gyanwali, Anjani
Kumar Jha.
References1. Nepal Health Research Council (NHRC), Ministry of Health and Population(MoHP), Monitoring Evalua-
tion and Operational Research (MEOR). Nepal Burden of Disease 2017: A Country Report based on
the Global Burden of Disease 2017 Study. Kathmandu, Nepal: NHRC, MoHP and MEOR, 2019.
2. World Health Organization. Global Health Estimates 2016: Deaths by Cause, Age, Sex, by Country and
by Region, 2000–2016. Geneva: WHO, 2018.
3. WOrld Health Organization. Noncommunicable diseases: WHO; 2020 [cited 2020 2020/08/19]. http://
www.emro.who.int/noncommunicable-diseases/causes/index.html.
4. Ahmed SM, Hadi A, Razzaque A, Ashraf A, Juvekar S, Ng N, et al. Clustering of chronic non-communi-
cable disease risk factors among selected Asian populations: levels and determinants. Global Health
Action. 2009; 2(1):1986. https://doi.org/10.3402/gha.v2i0.1986 PMID: 20027260
PLOS ONE Noncommunicable diseases risk factors and their determinants: STEPS survey 2019, Nepal
PLOS ONE | https://doi.org/10.1371/journal.pone.0253605 July 30, 2021 17 / 20

5. Gupta R, Misra A, Pais P, Rastogi P, Gupta V. Correlation of regional cardiovascular disease mortality
in India with lifestyle and nutritional factors. International journal of cardiology. 2006; 108(3):291–300.
https://doi.org/10.1016/j.ijcard.2005.05.044 PMID: 15978684
6. Yusuf S, Hawken S, Ounpuu S, Dans T, Avezum A, Lanas F, et al. Effect of potentially modifiable risk
factors associated with myocardial infarction in 52 countries (the INTERHEART study): case-control
study. The lancet. 2004; 364(9438):937–52. https://doi.org/10.1016/S0140-6736(04)17018-9 PMID:
15364185
7. World Health Organization. Noncommunicable Diseases Country Profiles 2014. Geneva: WHO, 2014.
8. World Health Organization. Noncommunicable diseases country profiles 2018. Geneva: WHO, 2018.
9. Dhimal M, Karki KB, Sharma SK, Aryal KK, Shrestha N, Poudyal A, et al. Prevalence of selected chronic
non-communicable diseases in Nepal. Journal of Nepal Health Research Council. 2019; 17(3):394–
401. https://doi.org/10.33314/jnhrc.v17i3.2327 PMID: 31735938
10. Aryal KK, Mehata S, Neupane S, Vaidya A, Dhimal M, Dhakal P, et al. The Burden and Determinants of
Non Communicable Diseases Risk Factors in Nepal: Findings from a Nationwide STEPS Survey.
PLOS ONE. 2015; 10(8):e0134834. https://doi.org/10.1371/journal.pone.0134834 PMID: 26244512
11. Hasan M, Sutradhar I, Akter T, Das Gupta R. Prevalence and determinants of hypertension among
adult population in Nepal: Data from Nepal Demographic and Health Survey 2016. 2018; 13(5):
e0198028. https://doi.org/10.1371/journal.pone.0198028 PMID: 29852006.
12. Government of Nepal. Multisectoral Action Plan on the Prevention and Control of NCD in Nepal 2014–
2020. Kathmandu: Government of Nepal; 2014.
13. World Health Organization. Noncommunicable Diseases Global Monitoring Framework. 2011.
14. Dhimal M, Bista B, Bhattarai S, Dixit L, Hyder M, Agrawal N, et al. Report of Non Communicable Dis-
ease Risk Factors: STEPS Survey Nepal 2019. Kathmandu: Nepal Health Research Council, 2020.
15. World Health Organization. The STEPS Instrument and Support Materials: WHO; 2020 [cited 2020
2020/08/14]. https://www.who.int/ncds/surveillance/steps/instrument/en/.
16. World Health Organization. WHO STEPS surveillance manual. 2017. Geneva 2018.
17. Barros AJ, Hirakata VN. Alternatives for logistic regression in cross-sectional studies: an empirical com-
parison of models that directly estimate the prevalence ratio. BMC medical research methodology.
2003; 3(1):21. https://doi.org/10.1186/1471-2288-3-21 PMID: 14567763
18. Ministy of Health and family welfare, World Health Organization, Center for Disease control and preven-
tion. Global Adult Tobacco Survey 2017:Bangladesh. 2017.
19. Karki KB, Dahal BR, Regmi A, Poudel A, Y G. WHO STEPS Surveillance: Non Communicable Dis-
eases Risk Factors Survey 2008. Ministry of Health and Population, Government of Nepal, Society for
Local Integrated Development Nepal (SOLID Nepal) and World Health Organization, 2008.
20. Indian Council of Medical Research, Public Health Foundation of India, Institute of Health metrics and
Evaluation. India: Health of the Nation’s States—The India State- Level Disease Burden Initiative. 2017.
21. Pradhan PMS. Tobacco Control [Internet]. UK: BMJ. 2015. [cited 2021 29 May 2021]. https://blogs.bmj.
com/tc/2015/11/02/nepal-report-card-on-progress-in-tobacco-control/.
22. Commar A, Prasad V, d’Espaignet ET, Wolfenden L. WHO global report on trends in prevalence of
tobacco smoking 2000. World Health Organization, 2018.
23. Hanewinkel R, Sargent JD. Exposure to Smoking in Popular Contemporary Movies and Youth Smoking
in Germany. American Journal of Preventive Medicine. 2007; 32(6):466–73. https://doi.org/10.1016/j.
amepre.2007.02.025 PMID: 17533061
24. Pachankis JE, Westmaas JL, Dougherty LR. The influence of sexual orientation and masculinity on
young men’s tobacco smoking. Journal of consulting and clinical psychology. 2011; 79(2):142–52.
Epub 2011/03/30. https://doi.org/10.1037/a0022917 PMID: 21443320.
25. Karmacharya BM, Fitzpatrick AL, Koju R, Sotodehnia N, Xu DR, Pradhan PMS, et al. Quit Intentions
and Attempts among Smokers in Sub-urban Nepal: Findings from the Dhulikhel Heart Study. KATH-
MANDU UNIVERSITY MEDICAL JOURNAL. 2018; 16(61):83–8. PMID: 30631024
26. Shrestha N, Mehata S, Pradhan PMS, Joshi D, Mishra SR. A nationally representative study on socio-
demographic and geographic correlates, and trends in tobacco use in Nepal. Scientific Reports. 2019; 9
(1):1–11.
27. Sreeramareddy CT, Pradhan PMS, Mir IA, Sin S. Smoking and smokeless tobacco use in nine South
and Southeast Asian countries: prevalence estimates and social determinants from Demographic and
Health Surveys. Population health metrics. 2014; 12(1):22. https://doi.org/10.1186/s12963-014-0022-0
PMID: 25183954
28. Dhimal M, Bista B, Bhattarai S, Dixit LP, Hyder MKA, Agrawal N, et al. Report of Noncommunicable Dis-
ease Risk Factors: STEPS Survey Nepal 2019. Kathmandu: Nepal Health Research Council, 2020.
PLOS ONE Noncommunicable diseases risk factors and their determinants: STEPS survey 2019, Nepal
PLOS ONE | https://doi.org/10.1371/journal.pone.0253605 July 30, 2021 18 / 20

29. Thapa N, Aryal KK, Puri R, Shrestha S, Shrestha S, Thapa P, et al. Alcohol consumption practices
among married women of reproductive age in Nepal: a population based household survey. PLOS
ONE. 2016; 11(4):e0152535. https://doi.org/10.1371/journal.pone.0152535 PMID: 27035722
30. Nepali S, Rijal A, Olsen MH, McLachlan CS, Kallestrup P, Neupane D. Factors affecting the fruit and
vegetable intake in Nepal and its association with history of self-reported major cardiovascular events.
BMC Cardiovascular Disorders. 2020; 20(1):1–10.
31. Ministy of Health, World Health Organization. National survey for noncommunicable disease risk factors
and mental health using WHO STEPS approach in Bhutan– 2014. Ministry of Health, 2014.
32. Pedisic Z, Shrestha N, Loprinzi PD, Mehata S, Mishra SR. Prevalence, patterns, and correlates of phys-
ical activity in Nepal: findings from a nationally representative study using the Global Physical Activity
Questionnaire (GPAQ). BMC Public Health. 2019; 19(1):864. https://doi.org/10.1186/s12889-019-
7215-1 PMID: 31269984
33. Central Bureau of Statistics. Nepal living standard survey 2010/11. Kathmandu: National Planning
Commission Secretariat, Government of Nepal, 2011.
34. Jayawardena R, Byrne N.M, Soares M.J, Katulanda P, Hills A.P. Prevalence, Trends and Associated
Socio-Economic Factors of Obesity in South Asia. Obesity Facts. 2013; 6. https://doi.org/10.1159/
000355598 PMID: 24107686
35. Kanter R, Caballero B. Global Gender Disparities in Obesity: A Review. Advances in Nutrition. 2012; 3
(4):491–8. https://doi.org/10.3945/an.112.002063 PMID: 22797984
36. Ministry of Health Nepal and Population, New ERA, ICF. Nepal Demographic and Health Survey 2016.
Kathmandu,Nepal: Ministry of Health and Population, Nepal, 2017.
37. Sandberg K, Ji H. Sex differences in primary hypertension. Biology of sex differences. 2012; 3(1):7.
Epub 2012/03/16. https://doi.org/10.1186/2042-6410-3-7 PMID: 22417477 mc3331829.
38. Vitale C, Fini M, Speziale G, Chierchia S. Gender differences in the cardiovascular effects of sex hor-
mones. Fundamental & clinical pharmacology. 2010; 24(6):675–85. Epub 2010/03/05. https://doi.org/
10.1111/j.1472-8206.2010.00817.x PMID: 20199585.
39. Wang Y, Chen J, Wang K, Edwards C. Education as an important risk factor for the prevalence of hyper-
tension and elevated blood pressure in Chinese men and women. Journal of human hypertension.
2006; 20(11):898–900. https://doi.org/10.1038/sj.jhh.1002086 PMID: 16971958
40. World Health Organization. Global report on diabetes 2016. France: World Health Organization, 2016.
41. Chang AM, Halter JB. Aging and insulin secretion. American Journal of Physiology-Endocrinology and
Metabolism. 2003; 284(1):E7–E12. 10https://doi.org/10.1152/ajpendo.00366.2002 PMID: 12485807.
42. Castillo O, Woolcott OO, Gonzales E, Tello V, Tello L, Villarreal C, et al. Residents at high altitude show
a lower glucose profile than sea-level residents throughout 12-hour blood continuous monitoring. High
altitude medicine & biology. 2007; 8(4):307–11. https://doi.org/10.1089/ham.2007.8407 PMID:
18081506
43. Woolcott OO, Castillo OA, Gutierrez C, Elashoff RM, Stefanovski D, Bergman RN. Inverse association
between diabetes and altitude: a cross-sectional study in the adult population of the United States. Obe-
sity. 2014; 22(9):2080–90. https://doi.org/10.1002/oby.20800 PMID: 24890677
44. Cartee GD, Douen AG, Ramlal T, Klip A, Holloszy J. Stimulation of glucose transport in skeletal muscle
by hypoxia. Journal of Applied Physiology. 1991; 70(4):1593–600. https://doi.org/10.1152/jappl.1991.
70.4.1593 PMID: 2055841
45. Reynolds T 4th, Brozinick J Jr, Rogers M, Cushman S. Effects of exercise training on glucose transport
and cell surface GLUT-4 in isolated rat epitrochlearis muscle. American Journal of Physiology-Endocri-
nology and Metabolism. 1997; 272(2):E320–E5. https://doi.org/10.1152/ajpendo.1997.272.2.E320
PMID: 9124341
46. Uranga RM, Keller JN. Diet and Age Interactions with Regards to Cholesterol Regulation and Brain
Pathogenesis. Current Gerontology and Geriatrics Research. 2010; 2010:219683. https://doi.org/10.
1155/2010/219683 PMID: 20396385
47. Shrestha N, Mishra SR, Ghimire S, Gyawali B, Marahatta SB, Maskey S, et al. Health System Pre-
paredness in Tackling the COVID-19 in Nepal: a Qualitative Study Among Frontline Healthcare Workers
and Policymakers. 2020.
48. Khuwaja AK, Kadir MM. Gender differences and clustering pattern of behavioural risk factors for chronic
non-communicable diseases: community-based study from a developing country. Chronic Illness.
2010; 6(3):163–70. https://doi.org/10.1177/1742395309352255 PMID: 20444764.
49. Zaman MM, Bhuiyan MR, Karim MN, MoniruzZaman, Rahman MM, Akanda AW, et al. Clustering of
non-communicable diseases risk factors in Bangladeshi adults: An analysis of STEPS survey 2013.
BMC Public Health. 2015; 15(1):659. https://doi.org/10.1186/s12889-015-1938-4 PMID: 26169788
PLOS ONE Noncommunicable diseases risk factors and their determinants: STEPS survey 2019, Nepal
PLOS ONE | https://doi.org/10.1371/journal.pone.0253605 July 30, 2021 19 / 20

50. Pelzom D, Isaakidis P, Oo MM, Gurung MS, Yangchen P. Alarming prevalence and clustering of modifi-
able noncommunicable disease risk factors among adults in Bhutan: a nationwide cross-sectional com-
munity survey. BMC Public Health. 2017; 17(1):975. https://doi.org/10.1186/s12889-017-4989-x PMID:
29268747
PLOS ONE Noncommunicable diseases risk factors and their determinants: STEPS survey 2019, Nepal
PLOS ONE | https://doi.org/10.1371/journal.pone.0253605 July 30, 2021 20 / 20