Prevalence of non-communicable diseases in Brazilian children: follow-up at school age of two...
13
RESEARCH ARTICLE Open Access Prevalence of non-communicable diseases in Brazilian children: follow-up at school age of two Brazilian birth cohorts of the 1990’s Antônio A Silva 1 , Marco A Barbieri 2 , Viviane C Cardoso 2 , Rosângela F Batista 1 , Vanda M Simões 3 , Elcio O Vianna 4 , Manoel R Gutierrez 2 , Maria L Figueiredo 1 , Nathalia A Silva 1 , Thaís S Pereira 1 , Juliana D Rodriguez 1 , Sônia R Loureiro 5 , Valdinar S Ribeiro 6 and Heloisa Bettiol 2* Abstract Background: Few cohort studies have been conducted in low and middle-income countries to investigate non- communicable diseases among school-aged children. This article aims to describe the methodology of two birth cohorts, started in 1994 in Ribeirão Preto (RP), a more developed city, and in 1997/98 in São Luís (SL), a less developed town. Methods: Prevalences of some non-communicable diseases during the first follow-up of these cohorts were estimated and compared. Data on singleton live births were obtained at birth (2858 in RP and 2443 in SL). The follow-up at school age was conducted in RP in 2004/05, when the children were 9-11 years old and in SL in 2005/06, when the children were 7-9 years old. Follow-up rates were 68.7% in RP (790 included) and 72.7% in SL (673 participants). The groups of low (<2500 g) and high (≥ 4250 g) birthweight were oversampled and estimates were corrected by weighting. Results: In the more developed city there was a higher percentage of non-nutritive sucking habits (69.1% vs 47.9%), lifetime bottle use (89.6% vs 68.3%), higher prevalence of primary headache in the last 15 days (27.9% vs 13.0%), higher positive skin tests for allergens (44.3% vs 25.3%) and higher prevalence of overweight (18.2% vs 3.6%), obesity (9.5% vs 1.8%) and hypertension (10.9% vs 4.6%). In the less developed city there was a larger percentage of children with below average cognitive function (28.9% vs 12.2%), mental health problems (47.4% vs 38.4%), depression (21.6% vs 6.0%) and underweight (5.8% vs 3.6%). There was no difference in the prevalence of bruxism, recurrent abdominal pain, asthma and bronchial hyperresponsiveness between cities. Conclusions: Some non-communicable diseases were highly prevalent, especially in the more developed city. Some high rates suggest that the burden of non-communicable diseases will be high in the future, especially mental health problems. Background Cohort studies seek to verify and evaluate the health of the population and provide scientific data on the etiol- ogy of diseases, allowing the establishment of important preventive measures. These studies are increasingly used to answer many questions about health risks to the population due to their ability to generate new knowl- edge related to various outcomes [1]. Birth cohorts have the advantage of permitting the determination of health interferences suffered during the life cycle of an individual. They permit to understand the effects of exposures and experiences during intrauterine life and of childhood diseases on the future health of individuals, despite difficulty in obtaining data on expo- sure to early risk factors [2]. Classic examples are the stu- dies of Barker, started in the 20th century, which related birth weight to mortality from chronic diseases in adults, such as cardiovascular disease and hypertension [3]. In Latin America there is an increased incidence of chronic non-communicable diseases [4]. However, many * Correspondence: [email protected] 2 Departamento de Puericultura e Pediatria, Faculdade de Medicina de Ribeirão Preto, Universidade de São Paulo, Ribeirão Preto, SP, Brasil Full list of author information is available at the end of the article Silva et al. BMC Public Health 2011, 11:486 http://www.biomedcentral.com/1471-2458/11/486 © 2011 Silva et al; licensee BioMed Central Ltd. This is an Open Access article distributed under the terms of the Creative Commons Attribution License (http://creativecommons.org/licenses/by/2.0), which permits unrestricted use, distribution, and reproduction in any medium, provided the original work is properly cited.
-
Upload
independent -
Category
Documents
-
view
0 -
download
0
Transcript of Prevalence of non-communicable diseases in Brazilian children: follow-up at school age of two...

RESEARCH ARTICLE Open Access
Prevalence of non-communicable diseases inBrazilian children: follow-up at school age of twoBrazilian birth cohorts of the 1990’sAntônio A Silva1, Marco A Barbieri2, Viviane C Cardoso2, Rosângela F Batista1, Vanda M Simões3, Elcio O Vianna4,Manoel R Gutierrez2, Maria L Figueiredo1, Nathalia A Silva1, Thaís S Pereira1, Juliana D Rodriguez1,Sônia R Loureiro5, Valdinar S Ribeiro6 and Heloisa Bettiol2*
Abstract
Background: Few cohort studies have been conducted in low and middle-income countries to investigate non-communicable diseases among school-aged children. This article aims to describe the methodology of two birthcohorts, started in 1994 in Ribeirão Preto (RP), a more developed city, and in 1997/98 in São Luís (SL), a lessdeveloped town.
Methods: Prevalences of some non-communicable diseases during the first follow-up of these cohorts were estimatedand compared. Data on singleton live births were obtained at birth (2858 in RP and 2443 in SL). The follow-up at schoolage was conducted in RP in 2004/05, when the children were 9-11 years old and in SL in 2005/06, when the childrenwere 7-9 years old. Follow-up rates were 68.7% in RP (790 included) and 72.7% in SL (673 participants). The groups oflow (<2500 g) and high (≥ 4250 g) birthweight were oversampled and estimates were corrected by weighting.
Results: In the more developed city there was a higher percentage of non-nutritive sucking habits (69.1% vs47.9%), lifetime bottle use (89.6% vs 68.3%), higher prevalence of primary headache in the last 15 days (27.9% vs13.0%), higher positive skin tests for allergens (44.3% vs 25.3%) and higher prevalence of overweight (18.2% vs3.6%), obesity (9.5% vs 1.8%) and hypertension (10.9% vs 4.6%). In the less developed city there was a largerpercentage of children with below average cognitive function (28.9% vs 12.2%), mental health problems (47.4% vs38.4%), depression (21.6% vs 6.0%) and underweight (5.8% vs 3.6%). There was no difference in the prevalence ofbruxism, recurrent abdominal pain, asthma and bronchial hyperresponsiveness between cities.
Conclusions: Some non-communicable diseases were highly prevalent, especially in the more developed city.Some high rates suggest that the burden of non-communicable diseases will be high in the future, especiallymental health problems.
BackgroundCohort studies seek to verify and evaluate the health ofthe population and provide scientific data on the etiol-ogy of diseases, allowing the establishment of importantpreventive measures. These studies are increasingly usedto answer many questions about health risks to thepopulation due to their ability to generate new knowl-edge related to various outcomes [1].
Birth cohorts have the advantage of permitting thedetermination of health interferences suffered during thelife cycle of an individual. They permit to understand theeffects of exposures and experiences during intrauterinelife and of childhood diseases on the future health ofindividuals, despite difficulty in obtaining data on expo-sure to early risk factors [2]. Classic examples are the stu-dies of Barker, started in the 20th century, which relatedbirth weight to mortality from chronic diseases in adults,such as cardiovascular disease and hypertension [3].In Latin America there is an increased incidence of
chronic non-communicable diseases [4]. However, many
* Correspondence: [email protected] de Puericultura e Pediatria, Faculdade de Medicina deRibeirão Preto, Universidade de São Paulo, Ribeirão Preto, SP, BrasilFull list of author information is available at the end of the article
Silva et al. BMC Public Health 2011, 11:486http://www.biomedcentral.com/1471-2458/11/486
© 2011 Silva et al; licensee BioMed Central Ltd. This is an Open Access article distributed under the terms of the Creative CommonsAttribution License (http://creativecommons.org/licenses/by/2.0), which permits unrestricted use, distribution, and reproduction inany medium, provided the original work is properly cited.
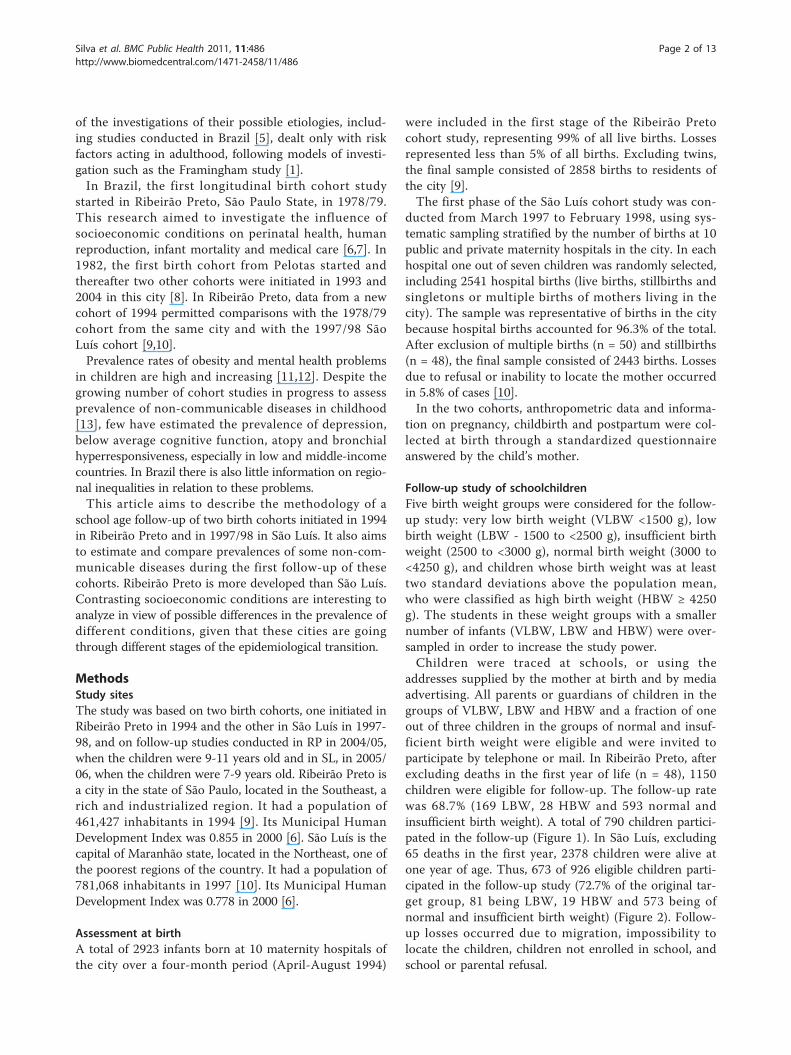
of the investigations of their possible etiologies, includ-ing studies conducted in Brazil [5], dealt only with riskfactors acting in adulthood, following models of investi-gation such as the Framingham study [1].In Brazil, the first longitudinal birth cohort study
started in Ribeirão Preto, São Paulo State, in 1978/79.This research aimed to investigate the influence ofsocioeconomic conditions on perinatal health, humanreproduction, infant mortality and medical care [6,7]. In1982, the first birth cohort from Pelotas started andthereafter two other cohorts were initiated in 1993 and2004 in this city [8]. In Ribeirão Preto, data from a newcohort of 1994 permitted comparisons with the 1978/79cohort from the same city and with the 1997/98 SãoLuís cohort [9,10].Prevalence rates of obesity and mental health problems
in children are high and increasing [11,12]. Despite thegrowing number of cohort studies in progress to assessprevalence of non-communicable diseases in childhood[13], few have estimated the prevalence of depression,below average cognitive function, atopy and bronchialhyperresponsiveness, especially in low and middle-incomecountries. In Brazil there is also little information on regio-nal inequalities in relation to these problems.This article aims to describe the methodology of a
school age follow-up of two birth cohorts initiated in 1994in Ribeirão Preto and in 1997/98 in São Luís. It also aimsto estimate and compare prevalences of some non-com-municable diseases during the first follow-up of thesecohorts. Ribeirão Preto is more developed than São Luís.Contrasting socioeconomic conditions are interesting toanalyze in view of possible differences in the prevalence ofdifferent conditions, given that these cities are goingthrough different stages of the epidemiological transition.
MethodsStudy sitesThe study was based on two birth cohorts, one initiated inRibeirão Preto in 1994 and the other in São Luís in 1997-98, and on follow-up studies conducted in RP in 2004/05,when the children were 9-11 years old and in SL, in 2005/06, when the children were 7-9 years old. Ribeirão Preto isa city in the state of São Paulo, located in the Southeast, arich and industrialized region. It had a population of461,427 inhabitants in 1994 [9]. Its Municipal HumanDevelopment Index was 0.855 in 2000 [6]. São Luís is thecapital of Maranhão state, located in the Northeast, one ofthe poorest regions of the country. It had a population of781,068 inhabitants in 1997 [10]. Its Municipal HumanDevelopment Index was 0.778 in 2000 [6].
Assessment at birthA total of 2923 infants born at 10 maternity hospitals ofthe city over a four-month period (April-August 1994)
were included in the first stage of the Ribeirão Pretocohort study, representing 99% of all live births. Lossesrepresented less than 5% of all births. Excluding twins,the final sample consisted of 2858 births to residents ofthe city [9].The first phase of the São Luís cohort study was con-
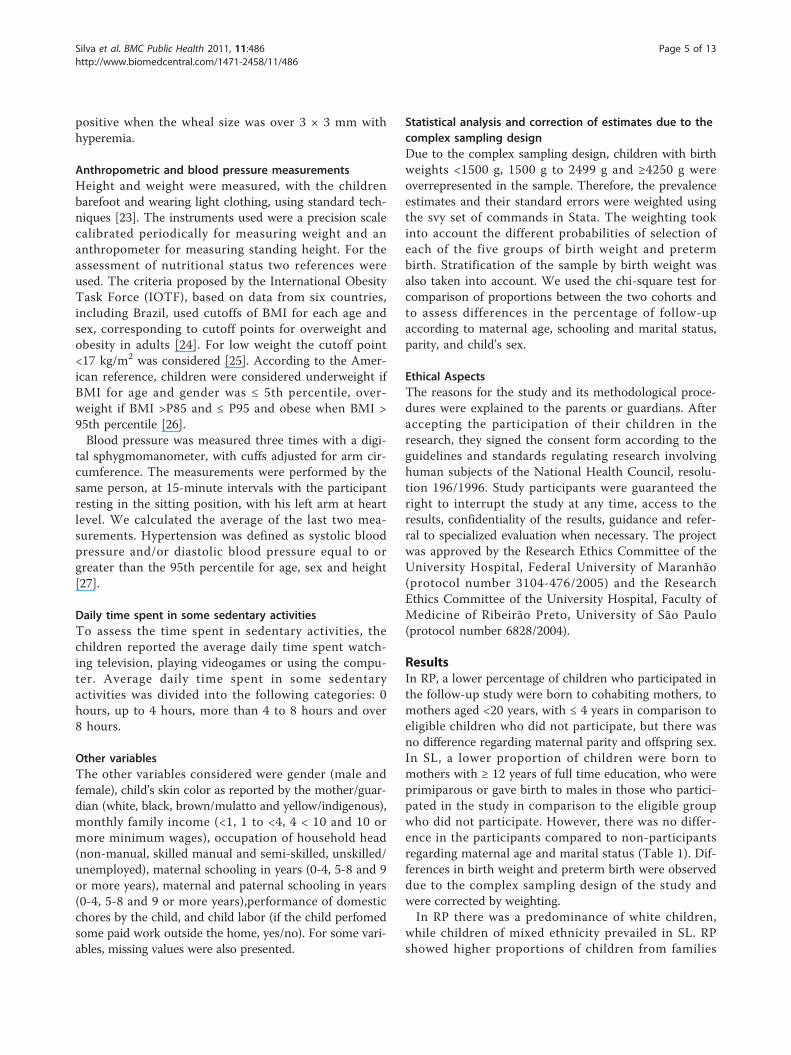
ducted from March 1997 to February 1998, using sys-tematic sampling stratified by the number of births at 10public and private maternity hospitals in the city. In eachhospital one out of seven children was randomly selected,including 2541 hospital births (live births, stillbirths andsingletons or multiple births of mothers living in thecity). The sample was representative of births in the citybecause hospital births accounted for 96.3% of the total.After exclusion of multiple births (n = 50) and stillbirths(n = 48), the final sample consisted of 2443 births. Lossesdue to refusal or inability to locate the mother occurredin 5.8% of cases [10].In the two cohorts, anthropometric data and informa-
tion on pregnancy, childbirth and postpartum were col-lected at birth through a standardized questionnaireanswered by the child’s mother.
Follow-up study of schoolchildrenFive birth weight groups were considered for the follow-up study: very low birth weight (VLBW <1500 g), lowbirth weight (LBW - 1500 to <2500 g), insufficient birthweight (2500 to <3000 g), normal birth weight (3000 to<4250 g), and children whose birth weight was at leasttwo standard deviations above the population mean,who were classified as high birth weight (HBW ≥ 4250g). The students in these weight groups with a smallernumber of infants (VLBW, LBW and HBW) were over-sampled in order to increase the study power.Children were traced at schools, or using the
addresses supplied by the mother at birth and by mediaadvertising. All parents or guardians of children in thegroups of VLBW, LBW and HBW and a fraction of oneout of three children in the groups of normal and insuf-ficient birth weight were eligible and were invited toparticipate by telephone or mail. In Ribeirão Preto, afterexcluding deaths in the first year of life (n = 48), 1150children were eligible for follow-up. The follow-up ratewas 68.7% (169 LBW, 28 HBW and 593 normal andinsufficient birth weight). A total of 790 children partici-pated in the follow-up (Figure 1). In São Luís, excluding65 deaths in the first year, 2378 children were alive atone year of age. Thus, 673 of 926 eligible children parti-cipated in the follow-up study (72.7% of the original tar-get group, 81 being LBW, 19 HBW and 573 being ofnormal and insufficient birth weight) (Figure 2). Follow-up losses occurred due to migration, impossibility tolocate the children, children not enrolled in school, andschool or parental refusal.
Silva et al. BMC Public Health 2011, 11:486http://www.biomedcentral.com/1471-2458/11/486
Page 2 of 13
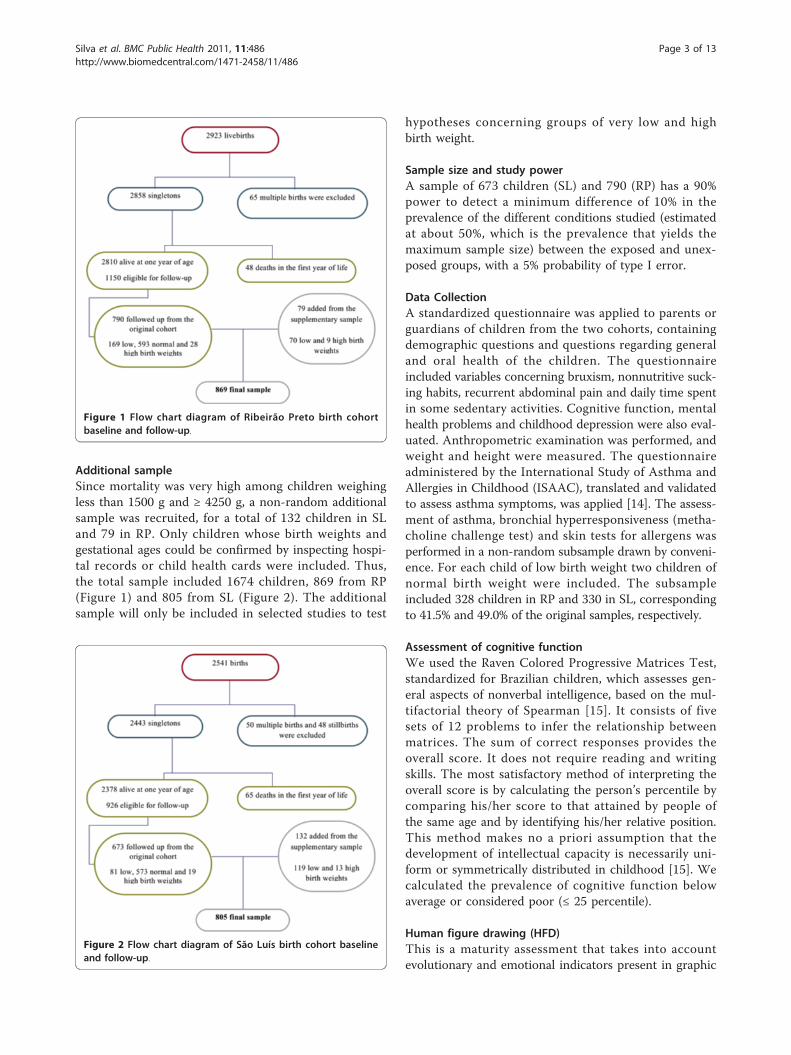
Additional sampleSince mortality was very high among children weighingless than 1500 g and ≥ 4250 g, a non-random additionalsample was recruited, for a total of 132 children in SLand 79 in RP. Only children whose birth weights andgestational ages could be confirmed by inspecting hospi-tal records or child health cards were included. Thus,the total sample included 1674 children, 869 from RP(Figure 1) and 805 from SL (Figure 2). The additionalsample will only be included in selected studies to test
hypotheses concerning groups of very low and highbirth weight.
Sample size and study powerA sample of 673 children (SL) and 790 (RP) has a 90%power to detect a minimum difference of 10% in theprevalence of the different conditions studied (estimatedat about 50%, which is the prevalence that yields themaximum sample size) between the exposed and unex-posed groups, with a 5% probability of type I error.
Data CollectionA standardized questionnaire was applied to parents orguardians of children from the two cohorts, containingdemographic questions and questions regarding generaland oral health of the children. The questionnaireincluded variables concerning bruxism, nonnutritive suck-ing habits, recurrent abdominal pain and daily time spentin some sedentary activities. Cognitive function, mentalhealth problems and childhood depression were also eval-uated. Anthropometric examination was performed, andweight and height were measured. The questionnaireadministered by the International Study of Asthma andAllergies in Childhood (ISAAC), translated and validatedto assess asthma symptoms, was applied [14]. The assess-ment of asthma, bronchial hyperresponsiveness (metha-choline challenge test) and skin tests for allergens wasperformed in a non-random subsample drawn by conveni-ence. For each child of low birth weight two children ofnormal birth weight were included. The subsampleincluded 328 children in RP and 330 in SL, correspondingto 41.5% and 49.0% of the original samples, respectively.
Assessment of cognitive functionWe used the Raven Colored Progressive Matrices Test,standardized for Brazilian children, which assesses gen-eral aspects of nonverbal intelligence, based on the mul-tifactorial theory of Spearman [15]. It consists of fivesets of 12 problems to infer the relationship betweenmatrices. The sum of correct responses provides theoverall score. It does not require reading and writingskills. The most satisfactory method of interpreting theoverall score is by calculating the person’s percentile bycomparing his/her score to that attained by people ofthe same age and by identifying his/her relative position.This method makes no a priori assumption that thedevelopment of intellectual capacity is necessarily uni-form or symmetrically distributed in childhood [15]. Wecalculated the prevalence of cognitive function belowaverage or considered poor (≤ 25 percentile).
Human figure drawing (HFD)This is a maturity assessment that takes into accountevolutionary and emotional indicators present in graphic
Figure 1 Flow chart diagram of Ribeirão Preto birth cohortbaseline and follow-up.
Figure 2 Flow chart diagram of São Luís birth cohort baselineand follow-up.
Silva et al. BMC Public Health 2011, 11:486http://www.biomedcentral.com/1471-2458/11/486
Page 3 of 13

production. It is also an indicator of cognitive develop-ment. It has been standardized by Wechsler in Brazil[16] and involves a simple activity - the drawing of aperson using pencil and eraser. The standardized scoresare converted to percentiles. We calculated the preva-lence of below average, borderline or poor (below the25th percentile) HFD.
Mental health problemsThe Strengths and Difficulties Questionnaire (SDQ) wasproposed by Goodman in 1997 [17] for screening beha-vioral problems of children and adolescents between 4and 15 years of age. It can be answered by parents/guar-dians, teachers or the adolescents themselves. In thepresent study a version of the questionnaire answeredby parents was used. The questionnaire, aimed at identi-fying mental health problems, is composed of four sub-scales: emotional symptoms, conduct problems,hyperactivity/attention deficit, and peer problems. Scoresare assigned to each of these scales (0, 1 or 2 as false,true or somewhat true). Then, a total score rangingfrom 0 to 40 is assigned at the end. According to thescore, each scale is classified as normal, borderline orabnormal [17]. The presence of mental health problemswas identified when the total score was greater than 16,which is considered abnormal [17]. The questionnairewas adapted and validated for Brazil [18].
Childhood depressionIt was measured by the Children’s Depression Inventory(CDI). It is a screening instrument based on self-reportprepared by Kovacs in 1981 which includes 27 items withthree response options to be answered from 7 years ofage onwards. The child selects the answer that bestdescribes how he/she feels. It was adapted and validatedby Gouveia et al. for Brazilian school children [19]. Toeach item 0, 1 or 2 responses are assigned, according tothe order of the answers - 1st, 2nd or 3rd, respectively.Then the items are summed to obtain the total score.The score from which the child was considered to be“depressed” was less than 17 points, according to a Brazi-lian study [19].
Bottle feeding, non-nutritive sucking habits and currentbruxismParents were asked whether the child used a bottle,pacifier or sucked its finger ever in life. Finger suckingand pacifier use were considered non-nutritive suckinghabits. Bruxism corresponded to the habit of grindingor clenching the teeth and was considered to be presentif observed during sleep or when the child was awake;current bruxism was identified when parents or guar-dians reported that the habit had persisted until the daythe interview took place.
Primary headachePrimary headache was considered to be present whenthe mother reported that her child presented ≥ 2 epi-sodes of headache in the two preceding weeks, withoutany associated organic symptoms, no matter how longor intense they were or where in the head they werelocated. This criterion was established according to theInternational Classification of Headache Disordersguidelines [20].
Recurrent abdominal painRecurrent abdominal pain was considered to be theoccurrence of pain or discomfort in the stomach in thelast three months, strong enough to disrupt the child’sdaily activities such as playing, going to school or sleep-ing [21].
Symptoms of asthma and bronchial hyperresponsivenessThe presence of symptoms of current asthma was investi-gated by adapting the questionnaire used in the asthmamodule of the ISAAC study [22]. The airway responsive-ness was measured by the methacholine challenge test(bronchoconstrictor stimulus). The child inhaled metha-choline at increasing concentrations, which started at0.03 mg/ml and were successively doubled up to 16 mg/ml. The test was terminated when there was a decrease of20% or more in forced expiratory volume in one second(FEV1) or when the last concentration of the protocol wasreached. PC20, which is the concentration of methacho-line causing a 20% fall in FEV1, was calculated. If PC 20 ≤2 mg/ml, the test was considered positive. Responsivenesswas considered borderline if PC20 >2 to 16 mg/ml andnormal if PC20 >16 mg/ml. For the examination the per-sons responsible for the children were instructed not togive the child tea, coffee, chocolate or soft drinks within6 hours before the exam. To avoid false-positive results,the test was rescheduled if the child had had airway infec-tion in the previous four weeks.Asthma was considered to be present when subjective
(symptoms of current asthma, or wheezing in the last 12months) and objective criteria (presence of bronchialhyperresponsiveness) were present simultaneously or, byother definition, when subjective symptoms were reportedalone.
Skin tests for allergensSkin tests for allergy were applied by the puncture tech-nique by trained personnel. We used the following aller-gens: 3 dust mites (Dermatophagoides pteronyssimus,Dermatophagoides farinae and Blomia tropicalis), cat,dog, two types of cockroaches (Periplaneta americanaand Blatella German), pollen and four fungi (Alternariaalternata, Cladosporium herbarum, Aspergillus fumiga-tus and Penicillium notatum). The result was considered
Silva et al. BMC Public Health 2011, 11:486http://www.biomedcentral.com/1471-2458/11/486
Page 4 of 13
positive when the wheal size was over 3 × 3 mm withhyperemia.
Anthropometric and blood pressure measurementsHeight and weight were measured, with the childrenbarefoot and wearing light clothing, using standard tech-niques [23]. The instruments used were a precision scalecalibrated periodically for measuring weight and ananthropometer for measuring standing height. For theassessment of nutritional status two references wereused. The criteria proposed by the International ObesityTask Force (IOTF), based on data from six countries,including Brazil, used cutoffs of BMI for each age andsex, corresponding to cutoff points for overweight andobesity in adults [24]. For low weight the cutoff point<17 kg/m2 was considered [25]. According to the Amer-ican reference, children were considered underweight ifBMI for age and gender was ≤ 5th percentile, over-weight if BMI >P85 and ≤ P95 and obese when BMI >95th percentile [26].Blood pressure was measured three times with a digi-
tal sphygmomanometer, with cuffs adjusted for arm cir-cumference. The measurements were performed by thesame person, at 15-minute intervals with the participantresting in the sitting position, with his left arm at heartlevel. We calculated the average of the last two mea-surements. Hypertension was defined as systolic bloodpressure and/or diastolic blood pressure equal to orgreater than the 95th percentile for age, sex and height[27].
Daily time spent in some sedentary activitiesTo assess the time spent in sedentary activities, thechildren reported the average daily time spent watch-ing television, playing videogames or using the compu-ter. Average daily time spent in some sedentaryactivities was divided into the following categories: 0hours, up to 4 hours, more than 4 to 8 hours and over8 hours.
Other variablesThe other variables considered were gender (male andfemale), child’s skin color as reported by the mother/guar-dian (white, black, brown/mulatto and yellow/indigenous),monthly family income (<1, 1 to <4, 4 < 10 and 10 ormore minimum wages), occupation of household head(non-manual, skilled manual and semi-skilled, unskilled/unemployed), maternal schooling in years (0-4, 5-8 and 9or more years), maternal and paternal schooling in years(0-4, 5-8 and 9 or more years),performance of domesticchores by the child, and child labor (if the child perfomedsome paid work outside the home, yes/no). For some vari-ables, missing values were also presented.
Statistical analysis and correction of estimates due to thecomplex sampling designDue to the complex sampling design, children with birthweights <1500 g, 1500 g to 2499 g and ≥4250 g wereoverrepresented in the sample. Therefore, the prevalenceestimates and their standard errors were weighted usingthe svy set of commands in Stata. The weighting tookinto account the different probabilities of selection ofeach of the five groups of birth weight and pretermbirth. Stratification of the sample by birth weight wasalso taken into account. We used the chi-square test forcomparison of proportions between the two cohorts andto assess differences in the percentage of follow-upaccording to maternal age, schooling and marital status,parity, and child’s sex.
Ethical AspectsThe reasons for the study and its methodological proce-dures were explained to the parents or guardians. Afteraccepting the participation of their children in theresearch, they signed the consent form according to theguidelines and standards regulating research involvinghuman subjects of the National Health Council, resolu-tion 196/1996. Study participants were guaranteed theright to interrupt the study at any time, access to theresults, confidentiality of the results, guidance and refer-ral to specialized evaluation when necessary. The projectwas approved by the Research Ethics Committee of theUniversity Hospital, Federal University of Maranhão(protocol number 3104-476/2005) and the ResearchEthics Committee of the University Hospital, Faculty ofMedicine of Ribeirão Preto, University of São Paulo(protocol number 6828/2004).
ResultsIn RP, a lower percentage of children who participated inthe follow-up study were born to cohabiting mothers, tomothers aged <20 years, with ≤ 4 years in comparison toeligible children who did not participate, but there wasno difference regarding maternal parity and offspring sex.In SL, a lower proportion of children were born tomothers with ≥ 12 years of full time education, who wereprimiparous or gave birth to males in those who partici-pated in the study in comparison to the eligible groupwho did not participate. However, there was no differ-ence in the participants compared to non-participantsregarding maternal age and marital status (Table 1). Dif-ferences in birth weight and preterm birth were observeddue to the complex sampling design of the study andwere corrected by weighting.In RP there was a predominance of white children,
while children of mixed ethnicity prevailed in SL. RPshowed higher proportions of children from families
Silva et al. BMC Public Health 2011, 11:486http://www.biomedcentral.com/1471-2458/11/486
Page 5 of 13

with higher family incomes and whose heads wereengaged in non-manual occupations. More of the chil-dren from SL (95.7%) performed household chores thanthe children from RP (87.3%). A higher proportion ofchildren whose mothers or fathers had formal education≥ 9 years were seen in SL. Child labor was infrequentand did not vary between cities (Table 2).The lifetime use of a bottle or pacifier was more fre-
quent in RP than in SL. The number of children havingthe habit of finger sucking and clenching or grindingtheir teeth did not differ between the two cities.Mothers of children in RP reported more primary head-ache (27.9%) than in SL (13.0%). The prevalence ofrecurrent abdominal pain was similar in both cities,around 22% (Table 3).
Below average or poor cognitive function, whetherassessed by the Raven test or the HFD test, was moreprevalent in SL than in RP. Indicators of mental healthproblems according to the SDQ were also more preva-lent in SL (47.4%) than in RP (38.4%). The prevalence ofchildhood depression was about three and a half timeshigher in SL (21.6%) than in RP (6%) (Table 4).The prevalence of bronchial hyperresponsiveness as
well as asthma was similar in both cities, both whenconsidering only current symptoms or symptoms asso-ciated with bronchial hyperresponsiveness. RP had ahigher percentage of children with positive skin tests toallergens (44.3%) than SL (25.3%) (Table 5).The prevalence of overweight and obesity was higher
than the prevalence of underweight among RP than SL
Table 1 Comparison of the characteristics of the participants at birth and school age
Variables Ribeirão Preto São Luís
nInitial sample(excluding 48
deaths)
nEligible tofollow-up
nfollowed
up
%followed
up
p* nInitial sample(excluding 65
deaths)
nEligible tofollow-up
nfollowed
up
%followed
up
p*
Maternal age(years)
0.005 0.350
20 to 34 2051 832 563 67.7 1,577 610 442 72.5
≥35 265 114 94 82.5 101 41 32 78.0
<20 487 202 131 64.9 698 274 199 72.6
Missing 7 2 2 85.7 2 1 0 0.0
Marital status <0.001
0.670
Married 1,664 666 489 73.5 695 266 199 74.8
Cohabiting 690 291 158 54.2 1,107 437 314 71.9
Single 338 147 106 72.1 575 223 160 71.7
Missing 118 46 37 80.4 1 0 0 0.0
Maternalschooling(years)
<0.001
<0.001
≥ 12 367 145 93 64.3 119 46 14 30.4
9 to 11 607 246 170 69.2 841 324 255 78.7
5 to 8 1,028 416 304 73.1 1007 397 301 75.8
≤ 4 618 267 158 59.1 405 157 103 65.6
Missing 190 76 65 85.2 6 2 0 0.0
Parity 0.361 0.049
1 1148 467 313 67.0 1156 457 316 69.1
2 to 4 1474 600 423 70.5 1119 424 321 75.7
≥ 5 160 73 46 63.0 103 45 36 80.0
Missing 28 10 8 80.0 0 0 0 0.0
Sex 0.714 0.001
Male 1425 581 402 69.2 1295 509 348 68.4
Female 1384 569 388 68.2 1083 417 325 77.9
Missing 1 0 0 0.0 0 0 0 0.0
Total 2810 1150 790 68.7 2378 926 673 72.7
Ribeirão Preto, 1994 and 2004/05 and São Luís, 1997/98 and 2005/06
* P value calculated by the chi-squared test.
Silva et al. BMC Public Health 2011, 11:486http://www.biomedcentral.com/1471-2458/11/486
Page 6 of 13
children according to two criteria (Table 6). SL childrenspent more hours per day in sedentary activities (TV,videogames or computer) with an average of 5.6 hoursper day, while in RP the average time spent in theseactivities was 4.6 hours per day (p < 0.001). The preva-lence of hypertension in Ribeirão Preto (10.9%) wasmore than twice that observed in São Luís (4.6%). Highsystolic blood pressure was more than three timeshigher in Ribeirão Preto (9.3%) than in SL (2.5%). There
were no differences in the prevalence of high diastolicblood pressure between the two cities (Table 6).
DiscussionThese two Brazilian cities are at different stages of theepidemiological transition. In the more developed citythere was greater lifetime use of a bottle or pacifier, agreater prevalence of primary headache and atopy and ahigher prevalence of overweight, obesity and
Table 2 Socio-demographic factors, skin color of the child, performance of domestic chores by the child and childlabor in the two birth cohorts
Variables Ribeirão Preto São Luís P value
n % weighted* n % weighted*
Sex 0.724
Female 402 50.8 348 51.7
Male 388 49.2 325 48.3
Skin color of the child <0.001
White 444 56.3 158 23.5
Black 31 4.3 50 7.1
Brown/Mulatto 304 37.9 463 69.1
Yellow/Indigenous 11 1.5 2 0.3
Monthly family income (minimum wages) <0.001
< 1 36 4.5 149 23.0
1 to <4 396 50.1 454 69.8
4 to < 10 243 32.6 33 4.8
≥ 10 103 12.8 19 2.5
Missing 12 - 18 -
Occupation of household head <0.001
Non-manual 150 19.1 85 12.3
Manual skilled/semiskilled 296 37.5 200 30.0
Unskilled manual/unemployed 340 43.4 384 57.8
Missing 4 - 4 -
Maternal schooling (years) 0.001
0 to 4 345 43.9 223 34.4
5 to 8 164 21.6 154 23.4
≥ 9 273 34.5 278 42.2
Missing 8 - 18 -
Paternal schooling (years) 0.002
0 to 4 372 48.0 248 38.9
5 to 8 148 19.5 128 20.3
≥ 9 261 32.5 256 40.8
Missing 9 - 41 -
Performance of domestic chores by the child <0.001
Yes 686 87.3 644 95.7
No 104 12.7 27 4.4
Missing 0 - 2 -
Child labor 0.269
Yes 24 2.9 13 1.9
No 766 97.2 659 98.1
Missing 0 - 1 -
Ribeirão Preto, 2004/05 and São Luís, 2005/06.
* Percentages may not add to 100% because of rounding. Missing values were excluded from percentages and P-value calculations.
Silva et al. BMC Public Health 2011, 11:486http://www.biomedcentral.com/1471-2458/11/486
Page 7 of 13
hypertension. In the less developed city there was ahigher percentage of children performing householdchores, having lower than average cognitive function,mental health problems, depression and underweight.There was no difference between cities in the prevalenceof bruxism, recurrent abdominal pain, asthma or bron-chial hyperresponsiveness.The prevalence of non-nutritive sucking habits was
almost one and half times higher in RP than in SL.These prevalence rates are higher compared to studiesconducted in rural (3%) [28] and urban areas (25.5%)[29] of India. The prevalence observed in SL was similarto that observed in Saudi Arabia (48.4%) [30] and in aBrazilian study (43.5%) [31]. The high prevalence ofnonnutritive sucking habits observed suggests that thedevelopment of malocclusions will be frequent in thesepopulations [32].
The current prevalence of bruxism was high in bothcities, with no statistically significant difference betweenthem. These prevalences were lower than those seen inBoston, 38% [33] and Canada, 45.6% [34].The prevalence of primary headache, considered as the
occurrence of two or more episodes in the last 15 days,in RP was more than twice that seen in SL. These highprevalence rates indicate that headache is an importantpublic health problem among children. Frequent andsevere headaches in the past year was reported by 17.1%of children and adolescents aged 4 to 18 years in the U.S. [35]. In Istanbul, 46.2% of the children reported head-aches in the past year [36].Prevalences of recurrent abdominal pain were high
and did not differ between cities. Prevalence rates werehigher than those reported in an international review,which ranged from 0.3% to 19% [21], indicating the
Table 3 Lifetime bottle and pacifier use, non-nutritive sucking habits, current bruxism, primary headache andrecurrent abdominal pain in the two birth cohorts
Variables Ribeirão Preto São Luís Pvalue
n %weighted*
n %weighted*
Lifetime bottle use < 0.001
Yes 709 89.6 463 68.3
No 79 10.4 206 30.7
Missing 2 - 4 -
Lifetime pacifier use < 0.001
Yes 502 63.8 263 38.7
No 286 36.2 405 61.3
Missing 2 - 5 -
Lifetime finger sucking 0.137
Yes 80 9.9 80 12.4
No 708 90.1 591 87.6
Missing 2 - 2 -
Non-nutritive sucking habits (lifetime pacifier use or finger sucking) < 0.001
Yes 543 69.1 322 47.9
No 243 30.9 346 52.1
Missing 4 - 5 -
Current bruxism (teeth clenching or grinding) 0.903
Yes 228 28.9 192 29.2
No 551 71.1 472 70.8
Missing 11 - 9 -
Primary headache (2 or more episodes in the two preceding weeks) < 0.001
Yes 206 27.9 87 13.0
No 556 72.1 568 87.0
Missing 28 - 18 -
Recurrent abdominal pain (pain in the last three months that affected the child’s dailyactivities)
0.887
Yes 172 21.9 144 21.6
No 617 78.1 529 78.4
Ribeirão Preto, 2004/05 and São Luís, 2005/06.
* Percentages may not add to 100% because of rounding. Missing values were excluded from percentages and P-value calculations.
Silva et al. BMC Public Health 2011, 11:486http://www.biomedcentral.com/1471-2458/11/486
Page 8 of 13

need for further research on this neglected public healthproblem.The higher prevalence of below average cognitive
function in the less developed city by both the Raventest and the human figure drawing, probably reflectssocioeconomic differences between the two cities, anddifferences in stardardization, since the benchmark for
both tests was established with children from the South-east. The high prevalence of mental health problems inthis study, as measured by the SDQ was surprising.These prevalences were higher than those detected instudies in Germany (14.5%) [12] and Egypt (20.6%) [37].Brazilian studies have found prevalence rates of 20.6%[38] and 24.6% [39], also lower than those detected in
Table 4 Cognitive function, mental health problems and childhood depression in the two birth cohorts
Variables Ribeirão Preto São Luís P value
n % weighted* n % weighted*
Raven’s test < 0.001
Below average or poor 103 12.2 202 28.9
Average or above average 672 87.8 468 71.1
Missing 15 - 3 -
Human Figure Drawing (HFD) < 0.001
Below average, borderline or poor 171 21.5 231 34.2
Average or above average 603 78.5 435 65.8
Missing 16 - 7 -
Strengths and Difficulties Questionnaire < 0.001
Abnormal 307 38.4 318 47.4
Borderline 126 16.3 116 17.4
Normal 351 45.2 236 35.2
Missing 6 - 3 -
Children’s Depression Inventory (CDI) < 0.001
Positive 56 6.0 141 21.6
Negative 718 94.0 529 78.4
Missing 16 - 3 -
Ribeirão Preto, 2004/05 and São Luís, 2005/06.
* Percentages may not add to 100% because of rounding. Missing values were excluded from percentages and P-value calculations.
Table 5 Asthma, bronchial hyperresponsiveness and atopy in the two birth cohorts
Variables Ribeirão Preto São Luís P value
n % weighted* n % weighted*
Wheezing in the last 12 months 0.957
Yes 60 18.0 58 17.8
No 268 82.0 270 82.2
Missing - - 2 -
Bronchial hyperresponsiveness ** 0.069
Yes 135 39.6 111 32.5
No 193 60.4 219 67.5
Asthma *** 0.209
Yes 34 10.2 25 7.3
No 294 89.8 305 92.7
Atopy **** < 0.001
Positive 142 44.3 81 25.3
Negative 185 55.7 242 74.7
Missing 1 - 7 -
Ribeirão Preto, 2004/05 and São Luís, 2005/06.
* Percentages may not add to 100% because of rounding. Missing values were excluded from percentages and P-value calculations.
** PC20 ≤2 mg/ml
*** Asthma defined by a subjective criterion (wheezing in the last 12 months) plus an objective criterion (bronchial hyperresponsiveness)
**** Atopy was defined as at least one positive skin test for some allergens
Silva et al. BMC Public Health 2011, 11:486http://www.biomedcentral.com/1471-2458/11/486
Page 9 of 13

the present study. Methodological differences in thesestudies could not possibly justify such different rates. Itis noteworthy that the SDQ tracks behavioral problemsbud does not confirm the diagnosis.The prevalence of childhood depression, as measured by
the CDI was three and a half times greater in SL than inRP. The prevalence was high in SL, more than four timesthe prevalence of depression in children and adolescentsaged 9-17 years, which has been estimated at 5% [40].Using the CDI, a study conducted in Northern Irelandshowed a prevalence of 11.6% in children aged 11 to 15years [41]. In Brazil, the prevalence was 1.5% among chil-dren aged 7 to 14 years from a private school in RibeirãoPreto [42] and 13.9% among schoolchildren aged 7 to 13years from a public school of Minas Gerais [40].
No statistically significant differences were observedbetween the two cities in asthma prevalence, which wasaround 18.0% when we considered the presence ofwheezing in the past 12 months These figures are similarto those reported in the ISAAC study, in English speak-ing countries and in Latin America, in which the highestprevalence reported was 32.2%, also using as a criterionfor the diagnosis of asthma wheezing within the past 12months [43]. When we added an objective measure (themethacholine challenge test) these prevalence rates fell toabout half (10.2% in RP and 7.3% in SL), suggesting thatonly using symptoms to diagnose asthma in epidemiolo-gical studies produces an overestimate of prevalence, dueto the possible inclusion of false-positive results. The pre-valence of bronchial hyperresponsiveness was high,
Table 6 Nutritional status, time spent in sedentary activities and arterial hypertension in the two birth cohorts
Variables Ribeirão Preto São Luís P value
n % weighted* n % weighted*
Nutritional status according to Cole et al. < 0.001
Underweight 32 3.6 39 5.8
Normal 542 68.6 595 88.8
Overweight 139 18.2 25 3.6
Obesity 75 9.5 13 1.8
Unknown 2 - 1 -
Nutritional status according to Must et al. < 0.001
Underweight 98 11.2 112 16.1
Normal 492 63.4 522 78.5
Overweight 104 13.5 24 3.5
Obesity 94 11.9 14 1.9
Unknown 2 - 1 -
Time spent in sedentary activities (hours per day) ** < 0.001
0 13 2.0 6 1.0
1 to 4 249 39.2 173 27.3
> 4 to 8 371 57.0 399 60.1
> 8 15 1.9 73 11.6
Missing 142 - 22 -
Systolic blood pressure *** < 0.001
Normal 687 90.7 647 97.5
High 69 9.3 18 2.5
Missing 34 - 8
Diastolic blood pressure *** 0.673
Normal 742 95.9 630 95.4
High 29 4.1 30 4.6
Missing 19 - 13
Arterial hypertension **** < 0.001
No 665 89.0 626 95.4
Yes 79 10.9 31 4.6
Missing 46 - 16 -
Ribeirão Preto, 2004/05 and São Luís, 2005/06.
* Percentages may not add to 100% because of rounding. Missing values were excluded from percentages and P-value calculations.
** Daily time spent watching TV, playing videogames or on the computer
*** ≥P95 for age, sex and height
**** Systolic and/or diastolic blood pressure ≥P95 for age, sex and height
Silva et al. BMC Public Health 2011, 11:486http://www.biomedcentral.com/1471-2458/11/486
Page 10 of 13
considering a cutoff point of 2, and similar when compar-ing RP (39.6%) to SL (32.5%). Among children aged 7 to10 years, the prevalence was 21.6% in the UK [44] and28% in Boston [45], but those studies considered a cutoffpoint of 4.Ribeirão Preto (44.3%) had a higher percentage of ato-
pic children than São Luís (25.3%). In a study conductedin Porto Alegre on students aged 10 to 18 years, whichused as a criterion for atopy at least one positive skintest, the prevalence was 50% [46], slightly higher thanthe values of RP and much more higher than the valuesof SL. In another study in China, also using a similarcriterion for detecting atopy, prevalences ranged from23.9% in Beijing to 41.2% in Hong Kong among school-children aged 9 to 11 years, [47].This difference in the prevalence of atopy between the
two Brazilian cities may somehow be related to differ-ences in lifestyle between developed and developing sites.It is thought that this phenomenon could also be relatedto differences in breastfeeding, smoking and infections.According to the hygiene hypothesis, in places with lowtransmission rates of pathogens, the immune systemtends to shift to atopic responses [46]. However, basedon this assumption, it would be expected that the preva-lence rates of asthma and bronchial hyperresponsivenesswould have been higher in the more developed city ofRP, which was not the case.The prevalence of obesity was higher in RP than in SL
by two criteria. According to the IOTF, the prevalence ofobesity in RP was 9.5%, lower than that observed in theUnited States in 2003-04 among children aged 6 to 11years (18.8%) [48], but higher than the percentagesobserved in England in 2006/07 among children aged 8-10 years (5.6% to 6.3% for boys and girls) [49] and Rio deJaneiro in 1999 (5.0% for boys aged 7-14 years) [50]. Theprevalence of obesity in SL (1.8%) was much lower thanthose observed in all the studies reported above. The pre-valence of overweight in RP (18.2%) showed values simi-lar to those of the United States (18.4%) [48], andEngland (19.8% to 23.9% for boys and girls) [49]. Theseresults are consistent with studies showing the occur-rence of the nutrition transition in developing countries.RP is experiencing an advanced stage of the nutritiontransition, in which prevalence rates of overweight andobesity are higher than child malnutrition, while in SLchild malnutrition rates (5.8%) are still higher than over-weight (3.6%) and obesity rates (1.8%).The average time spent in sedentary activities was
greater in SL (5.6 hours per day) than in RP (4.6 hoursper day). These results are consistent with national stu-dies that show 3 to 5 h/day, on average, spent in seden-tary activities [51,52], but a little above average hoursfound in international studies, which ranged from 2.2 to4.5 h/day [53,54]. The children from SL spent more
time watching TV and less time on videogames andcomputers, in contrast to from RP, where they spendless time watching TV and more time on electronicgames (data not shown). This difference may be asso-ciated with the socioeconomic profile of the two cities,where availability of technology such as computers andvideogames is greater for children in the more devel-oped city.The prevalence of arterial hypertension in RP was
more than twice that observed in SL. International datashow that the prevalence of hypertension ranged from2.2% to 4.5% [55,56], The prevalence of hypertension inSL was similar to those observed in those studies, whilein RP the prevalence was higher. In studies conductedin Brazil, the prevalence of hypertension ranged from2.5% to 9.4% [57,58].This study is one of the few population cohort studies
conducted in developing countries that investigatednon-communicable diseases among schoolchildren, con-trasting a more developed with a less developed city.The strategy of oversampling LBW babies was used toincrease the study power. Follow-up rates were satisfac-tory (68.7% in RP and 72.7% in SL).In SL, children born to primiparous mothers with ≥12
years of schooling, or males had lower follow-up ratesthan their counterparts. In RP, participation rates werelower for children whose mothers lived in consensualunion, had ≤ 4 years of full time education or were age <20 years. It is possible that these differences might haveled to an overestimation of some prevalence estimates inSL and to an underestimation in RP (eg, mental healthproblems), because groups of higher education wereunderrepresented in the former and overrepresented inthe latter. The small age difference of two years was alimitation in comparing prevalence rates between the twocities. Another limitation is that prevalence estimates ofasthma, bronchial hyperresponsiveness and atopy wereobtained in a subsample drawn by convenience.Differences in prevalence from other studies regarding
the various indicators may have been due to real popu-lation differences in prevalence, differences in the agegroups studied or differences regarding the methods ofmeasurement, such as when assessing the prevalence ofhypertension. In some studies used for comparison onlyone blood pressure measurement was taken, while inothers two or three measurements were taken on one ormore occasions.
ConclusionsSome non-communicable diseases were highly prevalentamong these Brazilian children, especially in the moredeveloped city. Some high rates suggest that the burdenof non-communicable diseases will be high in the future,especially mental health problems.
Silva et al. BMC Public Health 2011, 11:486http://www.biomedcentral.com/1471-2458/11/486
Page 11 of 13
AcknowledgementsThis research was supported by CNPq (Conselho Nacional deDesenvolvimento Científico e Tecnológico - Brazilian National ResearchCouncil), grants 523474/96-2 and 520664/98-1, and FAPESP (Fundação deAmparo à Pesquisa do Estado de São Paulo - São Paulo ResearchFoundation), grants 93/0525-0, 97/09517-1 and 00/0908-7. We thank theschool directors who kindly agreed to grant access to the children and theirfamilies. We also thank all children and their relatives who provided valuableinformation to foster public health.
Author details1Departamento de Saúde Pública, Universidade Federal do Maranhão, SãoLuís, MA, Brasil. 2Departamento de Puericultura e Pediatria, Faculdade deMedicina de Ribeirão Preto, Universidade de São Paulo, Ribeirão Preto, SP,Brasil. 3Departamento de Medicina I, Universidade Federal do Maranhão, SãoLuís, MA, Brasil. 4Departamento de Clínica Médica, Faculdade de Medicina deRibeirão Preto, Universidade de São Paulo, Ribeirão Preto, SP, Brasil.5Departamento de Neurociências e Ciências do Comportamento, Faculdadede Medicina de Ribeirão Preto, Universidade de São Paulo, Ribeirão Preto,SP, Brasil. 6Departamento de Medicina III, Universidade Federal do Maranhão,São Luís, MA, Brasil.
Authors’ contributionsAAS, MAB and HB conceived the study. AAS, TSP, MLF, NAS and MRGperformed the statistical analysis. VCC, RFB, EOV, MRG, AAS, TSP, MLF, NAS,MRG, JDR, SRL and VSR analyzed the data. AAS, TSP, MLF, NAS, JDR, MAB, HBand wrote the paper. All authors read and approved the final version of themanuscript.
Competing interestsThe authors declare that they have no competing interests.
Received: 26 January 2011 Accepted: 21 June 2011Published: 21 June 2011
References1. Doll R: Cohort studies: history of the method. I. Prospective cohort
studies. Soz Praventivmed 2001, 46:75-86.2. Gluckman PD, Hanson MA, Mitchell MD: Developmental origins of health
and disease: reducing the burden of chronic disease in the nextgeneration. Genome Med 2:14.
3. Barker DJ: The developmental origins of adult disease. J Am Coll Nutr2004, 23:588S-595S.
4. Perel P, Casas JP, Ortiz Z, Miranda JJ: Noncommunicable diseases andinjuries in Latin America and the Caribbean: time for action. PLoS Med2006, 3:e344.
5. Piegas LS, Avezum A, Pereira JC, Neto JM, Hoepfner C, Farran JA, Ramos RF,Timerman A, Esteves JP: Risk factors for myocardial infarction in Brazil.Am Heart J 2003, 146:331-338.
6. Cardoso VC, Simoes VM, Barbieri MA, Silva AA, Bettiol H, Alves MT,Goldani MZ: Profile of three Brazilian birth cohort studies in RibeiraoPreto, SP and Sao Luis, MA. Braz J Med Biol Res 2007, 40:1165-1176.
7. Barbieri MA, Bettiol H, Silva AA, Cardoso VC, Simoes VM, Gutierrez MR,Castro JA, Vianna ES, Foss MC, Dos Santos JE, Queiroz RG: Health in earlyadulthood: the contribution of the 1978/79 Ribeirao Preto birth cohort.Braz J Med Biol Res 2006, 39:1041-1055.
8. Barros FC, Victora CG, Barros AJ, Santos IS, Albernaz E, Matijasevich A,Domingues MR, Sclowitz IK, Hallal PC, Silveira MF, Vaughan JP: Thechallenge of reducing neonatal mortality in middle-income countries:findings from three Brazilian birth cohorts in 1982, 1993, and 2004.Lancet 2005, 365:847-854.
9. Bettiol H, Barbieri MA, Gomes UA, Andrea M, Goldani MZ, Ribeiro ER:Perinatal health: methodology and characteristics of the studiedpopulation. Rev Saude Publica 1998, 32:18-28.
10. Silva AA, Coimbra LC, da Silva RA, Alves MT, Lamy Filho F, Carvalho Lamy Z,Gomide Mochel E, Aragao VM, Ribeiro VS, Tonial SR, Barbieri MA: Perinatalhealth and mother-child health care in the municipality of Sao Luis,Maranhao State, Brazil. Cad Saude Publica 2001, 17:1413-1423.
11. Wang Y, Monteiro C, Popkin BM: Trends of obesity and underweight inolder children and adolescents in the United States, Brazil, China, andRussia. Am J Clin Nutr 2002, 75:971-977.
12. Ravens-Sieberer U, Wille N, Erhart M, Bettge S, Wittchen HU,Rothenberger A, Herpertz-Dahlmann B, Resch F, Holling H, Bullinger M,et al: Prevalence of mental health problems among children andadolescents in Germany: results of the BELLA study within the NationalHealth Interview and Examination Survey. Eur Child Adolesc Psychiatry2008, 17(Suppl 1):22-33.
13. Batty GD: Examining life-course influences on chronic disease: theRibeirao Preto and Sao Luis birth cohort studies (Brazil). Braz J Med BiolRes 2007, 40:1159-1162.
14. Asher MI, Keil U, Anderson HR, Beasley R, Crane J, Martinez F, Mitchell EA,Pearce N, Sibbald B, Stewart AW, et al: International Study of Asthma andAllergies in Childhood (ISAAC): rationale and methods. Eur Respir J 1995,8:483-491.
15. Angelini AL, Alves ICB, Custódio EM, Duarte WF: Manual MatrizesProgressivas Coloridas de Raven (Escala Especial): Padronização Brasileira SãoPaulo: Casa do Psicólogo; 1987.
16. Wechsler SM: DFH III: o Desenho da Figura Humana - Avaliação doDesenvolvimento Cognitivo de Crianças Brasileiras. 3 edition. Campinas:Editora da Pontifícia Universidade Católica de São Paulo; 2003.
17. Goodman R: The Strengths and Difficulties Questionnaire: a researchnote. J Child Psychol Psychiatry 1997, 38:581-586.
18. Fleitlich B, Goodman R: Social factors associated with child mental healthproblems in Brazil: cross sectional survey. BMJ 2001, 323:599-600.
19. Gouveia VV, Barbosa GA, Almeida HJF, Gaião AA: Children’s depressioninventory - CDI: adaptation study with students of João Pessoa. J BrasPsiq 1995, 44:345-349.
20. Headache Classification Subcommittee of the International HeadacheSociety: The International Classification of Headache Disorders: 2ndedition. Cephalalgia 2004, 24(Suppl 1):9-160.
21. Chitkara DK, Rawat DJ, Talley NJ: The epidemiology of childhoodrecurrent abdominal pain in Western countries: a systematic review. AmJ Gastroenterol 2005, 100:1868-1875.
22. Worldwide variations in the prevalence of asthma symptoms: theInternational Study of Asthma and Allergies in Childhood (ISAAC). EurRespir J 1998, 12:315-335.
23. Cameron N: The measurement of human growth London & Sidney: CroomHelm; 1984.
24. Cole TJ, Bellizzi MC, Flegal KM, Dietz WH: Establishing a standarddefinition for child overweight and obesity worldwide: internationalsurvey. Bmj 2000, 320:1240-1243.
25. Cole TJ, Flegal KM, Nicholls D, Jackson AA: Body mass index cut offs todefine thinness in children and adolescents: international survey. Bmj2007, 335:194.
26. Must A, Dallal GE, Dietz WH: Reference data for obesity: 85th and 95thpercentiles of body mass index (wt/ht2) and triceps skinfold thickness.Am J Clin Nutr 1991, 53:839-846.
27. National High Blood Pressure Education Program Working Group onHigh Blood Pressure in Children and Adolescents: The fourth report onthe diagnosis, evaluation, and treatment of high blood pressure inchildren and adolescents. Pediatrics 2004, 114:555-576.
28. Guaba K, Ashima G, Tewari A, Utreja A: Prevalence of malocclusion andabnormal oral habits in North Indian rural children. J Indian Soc PedodPrev Dent 1998, 16:26-30.
29. Kharbanda OP, Sidhu SS, Sundaram K, Shukla DK: Oral habits in schoolgoing children of Delhi: a prevalence study. J Indian Soc Pedod Prev Dent2003, 21:120-124.
30. Farsi NM, Salama FS: Sucking habits in Saudi children: prevalence,contributing factors and effects on the primary dentition. Pediatr Dent1997, 19:28-33.
31. Macena MC, Katz CR, Rosenblatt A: Prevalence of a posterior crossbiteand sucking habits in Brazilian children aged 18-59 months. Eur J Orthod2009, 31:357-361.
32. Emmerich A, Fonseca L, Elias AM, de Medeiros UV: [The relationshipbetween oral habits, oronasopharyngeal alterations, and malocclusion inpreschool children in Vitoria, Espirito Santo, Brazil]. Cad Saude Publica2004, 20:689-697.
33. Cheifetz AT, Osganian SK, Allred EN, Needleman HL: Prevalence of bruxismand associated correlates in children as reported by parents. J Dent Child(Chic) 2005, 72:67-73.
34. Petit D, Touchette E, Tremblay RE, Boivin M, Montplaisir J: Dyssomnias andparasomnias in early childhood. Pediatrics 2007, 119:e1016-1025.
Silva et al. BMC Public Health 2011, 11:486http://www.biomedcentral.com/1471-2458/11/486
Page 12 of 13
35. Lateef TM, Merikangas KR, He J, Kalaydjian A, Khoromi S, Knight E,Nelson KB: Headache in a national sample of American children:prevalence and comorbidity. J Child Neurol 2009, 24:536-543.
36. Isik U, Topuzoglu A, Ay P, Ersu RH, Arman AR, Onsuz MF, Karavus M,Dagli E: The prevalence of headache and its association withsocioeconomic status among schoolchildren in istanbul, Turkey.Headache 2009, 49:697-703.
37. Elhamid AA, Howe A, Reading R: Prevalence of emotional andbehavioural problems among 6-12 year old children in Egypt. SocPsychiatry Psychiatr Epidemiol 2009, 44:8-14.
38. Cury CR, Golfeto JH: Strengths and difficulties questionnaire (SDQ): astudy of school children in Ribeirao Preto. Rev Bras Psiquiatr 2003,25:139-145.
39. Paula CS, Duarte CS, Bordin IA: Prevalence of mental health problems inchildren and adolescents from the outskirts of Sao Paulo City: treatmentneeds and service capacity evaluation. Rev Bras Psiquiatr 2007, 29:11-17.
40. Fonseca MHG, Ferreira RA, Fonseca SG: Prevaléncia de sintomasdepressivos em escolares. Pediatr (São Paulo) 2005, 27:223-232.
41. Donnelly M: Depression among adolescents in Northern Ireland.Adolescence 1995, 30:339-350.
42. Baptista CA, Golfeto JH: Prevalência de depressão em escolares de 7 a 14anos. Rev Psiq Clin 2000, 27:253-256.
43. International Study of Asthma and Allergies in Childhood (ISAAC) SteeringComittee: Worldwide variations in the prevalence of asthma symptoms:the International Study of Asthma and Allergies in Childhood (ISAAC).Eur Respir J 1998, 12:315-335.
44. Arshad SH, Kurukulaaratchy RJ, Fenn M, Matthews S: Early life risk factorsfor current wheeze, asthma, and bronchial hyperresponsiveness at 10years of age. Chest 2005, 127:502-508.
45. Tepas EC, Litonjua AA, Celedon JC, Sredl D, Gold DR: Sensitization toaeroallergens and airway hyperresponsiveness at 7 years of age. Chest2006, 129:1500-1508.
46. Fiore RW, Comparsi AB, Reck CL, Oliveira JK, Pampanelli KB, Fritscher CC:Asthma and atopy prevalence in a group of students from Porto Alegre,Rio Grande do Sul. J Pneumol 2001, 27:237-242.
47. Wong GW, Hui DS, Chan HH, Fok TF, Leung R, Zhong NS, Chen YZ, Lai CK:Prevalence of respiratory and atopic disorders in Chinese schoolchildren.Clin Exp Allergy 2001, 31:1225-1231.
48. Ogden CL, Carroll MD, Curtin LR, McDowell MA, Tabak CJ, Flegal KM:Prevalence of overweight and obesity in the United States, 1999-2004.Jama 2006, 295:1549-1555.
49. Stamatakis E, Wardle J, Cole TJ: Childhood obesity and overweightprevalence trends in England: evidence for growing socioeconomicdisparities. Int J Obes (Lond) 2010, 34:41-47.
50. Anjos LA, Castro IR, Engstrom EM, Azevedo AM: Growth and nutritionalstatus in a probabilistic sample of schoolchildren from Rio de Janeiro,1999. Cad Saude Publica 2003, 19(Suppl 1):S171-179.
51. Ribeiro RQ, Lotufo PA, Lamounier JA, Oliveira RG, Soares JF, Botter DA:Additional cardiovascular risk factors associated with excess weight inchildren and adolescents: the Belo Horizonte heart study. Arq BrasCardiol 2006, 86:408-418.
52. da Silva RC, Malina RM: Level of physical activity in adolescents fromNiteroi, Rio de Janeiro, Brazil. Cad Saude Publica 2000, 16:1091-1097.
53. Lioret S, Maire B, Volatier JL, Charles MA: Child overweight in France andits relationship with physical activity, sedentary behaviour andsocioeconomic status. Eur J Clin Nutr 2007, 61:509-516.
54. Robinson TN: Television viewing and childhood obesity. Pediatr Clin NorthAm 2001, 48:1017-1025.
55. Chiolero A, Cachat F, Burnier M, Paccaud F, Bovet P: Prevalence ofhypertension in schoolchildren based on repeated measurements andassociation with overweight. J Hypertens 2007, 25:2209-2217.
56. Sorof JM, Lai D, Turner J, Poffenbarger T, Portman RJ: Overweight,ethnicity, and the prevalence of hypertension in school-aged children.Pediatrics 2004, 113:475-482.
57. Moura AA, Silva MA, Ferraz MR, Rivera IR: Prevalence of high bloodpressure in children and adolescents from the city of Maceio, Brazil.J Pediatr (Rio J) 2004, 80:35-40.
58. Rezende DF, Scarpelli RA, de Souza GF, da Costa JO, Scarpelli AM,Scarpelli PA, de Carvalho GB, D’Agostini HM, Pedrosa JC: Prevalence ofsystemic hypertension in students aged 7 to 14 years in the
municipality of Barbacena, in the State of Minas Gerais, in 1999. Arq BrasCardiol 2003, 81:381-386.
Pre-publication historyThe pre-publication history for this paper can be accessed here:http://www.biomedcentral.com/1471-2458/11/486/prepub
doi:10.1186/1471-2458-11-486Cite this article as: Silva et al.: Prevalence of non-communicablediseases in Brazilian children: follow-up at school age of two Brazilianbirth cohorts of the 1990’s. BMC Public Health 2011 11:486.
Submit your next manuscript to BioMed Centraland take full advantage of:
• Convenient online submission
• Thorough peer review
• No space constraints or color figure charges
• Immediate publication on acceptance
• Inclusion in PubMed, CAS, Scopus and Google Scholar
• Research which is freely available for redistribution
Submit your manuscript at www.biomedcentral.com/submit
Silva et al. BMC Public Health 2011, 11:486http://www.biomedcentral.com/1471-2458/11/486
Page 13 of 13