Prevalence of morphine use and time to initial analgesia in an Australian emergency department
8
ORIGINAL RESEARCH Prevalence of morphine use and time to initial analgesia in an Australian emergency department Roberto Forero, 1,2 Mohammed Mohsin, 3,4 Sally McCarthy, 5 Lis Young, 1,2 Sue Ieraci, 6 Ken Hillman, 1,2 Nancy Santiano, 1 Adrian Bauman 7 and Hai Phung 1,2 1 Simpson Centre for Health Services Research, Liverpool Health Service, 2 The University of New South Wales South-Western Sydney Clinical School, 3 Centre for Research, Evidence Management & Surveillance (REMS), Population Health, Sydney South-West Area Health Service, 4 School of Public Health and Community Medicine, University of New South Wales, 5 Department of Emergency Medicine, Prince of Wales Hospital, 6 Department of Emergency Medicine, Bankstown Hospital, and 7 Department of Public Health and Community Medicine, University of Sydney, Sydney, New South Wales, Australia Abstract Objective: To explore the association of morphine use with factors influencing time to initial analgesia (T-A). Methods: A retrospective cohort review was conducted. Morphine data were collected from a register for restricted drugs located in the ED. T-A was the time interval between triage and signing out of morphine’s first dose. Statistical analyses were performed to determine the association between morphine use and patient volume. Results: In total, 8% of ED attendees received at least one dose of morphine sulphate in the ED. Prevalence of morphine use significantly (P < 0.05) varied by patient’s age, Australasian Triage Scale category, time of arrival and type of illness. The median time of T-A was 79 min (95% CI 71–85) with substantially longer (median 107 min) for those who arrived during the afternoon and triaged as less urgent (median 127 min). Patients who arrived late at night (median 47 min), triaged as immediately/imminently life-threatening (median 58 min) and diagnosed as renal colic (median 27 min) or fractures/injuries (median 67 min) were more likely to receive i.v. morphine faster than other patients. The findings confirmed that large volume of patients in ED was associated with longer T-A. Patient volume in the ED showed a significant positive association with T-A (r = 0.568, 32% variation explained, P < 0.01). Correspondence: Dr Roberto Forero, Simpson Centre for Health Services Research, University of New South Wales, Locked Bag 7103, Liverpool Hospital, Liverpool BC, NSW 1871, Australia. Email: [email protected] Roberto Forero, PhD, MPH, MA, Senior Research Fellow; Mohammed Mohsin, PhD, MSc (Stats), MSc (Demography), Statistician; Sally McCarthy, MB BS, FACEM, MBA, Director of Emergency Medicine; Lis Young, FAFPHM, Clinical Coordinator; Sue Ieraci, MB BS, FACEM, Area Advisor Emergency Medicine; Ken Hillman, MB BS, FRCAnes, FFICANZCA, Professor of Intensive Care and Director Simpson Centre for Health Services Research; Nancy Santiano, RN, BSN (Phil), PGDip ED, Mclin Nsg, Project Director; Adrian E Bauman, PhD, MPH, FAFPHM, Professor of Public Health; Hai N Phung, PhD, MD, MPH, Former Principal Research fellow. doi: 10.1111/j.1742-6723.2008.01068.x Emergency Medicine Australasia (2008) 20, 136–143 © 2008 The Authors Journal compilation © 2008 Australasian College for Emergency Medicine and Australasian Society for Emergency Medicine Copyright Agency Limited (CAL) licenced copy
-
Upload
independent -
Category
Documents
-
view
0 -
download
0
Transcript of Prevalence of morphine use and time to initial analgesia in an Australian emergency department

ORIGINAL RESEARCH
Prevalence of morphine use and time to initialanalgesia in an Australian emergencydepartmentRoberto Forero,1,2 Mohammed Mohsin,3,4 Sally McCarthy,5 Lis Young,1,2 Sue Ieraci,6 Ken Hillman,1,2
Nancy Santiano,1 Adrian Bauman7 and Hai Phung1,2
1Simpson Centre for Health Services Research, Liverpool Health Service, 2The University of New SouthWales South-Western Sydney Clinical School, 3Centre for Research, Evidence Management &Surveillance (REMS), Population Health, Sydney South-West Area Health Service, 4School of PublicHealth and Community Medicine, University of New South Wales, 5Department of EmergencyMedicine, Prince of Wales Hospital, 6Department of Emergency Medicine, Bankstown Hospital, and7Department of Public Health and Community Medicine, University of Sydney, Sydney, New SouthWales, Australia
Abstract
Objective: To explore the association of morphine use with factors influencing time to initial analgesia(T-A).
Methods: A retrospective cohort review was conducted. Morphine data were collected from a registerfor restricted drugs located in the ED. T-A was the time interval between triage and signingout of morphine’s first dose. Statistical analyses were performed to determine the associationbetween morphine use and patient volume.
Results: In total, 8% of ED attendees received at least one dose of morphine sulphate in the ED.Prevalence of morphine use significantly (P < 0.05) varied by patient’s age, AustralasianTriage Scale category, time of arrival and type of illness. The median time of T-A was 79 min(95% CI 71–85) with substantially longer (median 107 min) for those who arrived during theafternoon and triaged as less urgent (median 127 min). Patients who arrived late at night(median 47 min), triaged as immediately/imminently life-threatening (median 58 min) anddiagnosed as renal colic (median 27 min) or fractures/injuries (median 67 min) were morelikely to receive i.v. morphine faster than other patients. The findings confirmed that largevolume of patients in ED was associated with longer T-A. Patient volume in the ED showeda significant positive association with T-A (r = 0.568, 32% variation explained, P < 0.01).
Correspondence: Dr Roberto Forero, Simpson Centre for Health Services Research, University of New South Wales, Locked Bag 7103,Liverpool Hospital, Liverpool BC, NSW 1871, Australia. Email: [email protected]
Roberto Forero, PhD, MPH, MA, Senior Research Fellow; Mohammed Mohsin, PhD, MSc (Stats), MSc (Demography), Statistician; Sally McCarthy,MB BS, FACEM, MBA, Director of Emergency Medicine; Lis Young, FAFPHM, Clinical Coordinator; Sue Ieraci, MB BS, FACEM, Area AdvisorEmergency Medicine; Ken Hillman, MB BS, FRCAnes, FFICANZCA, Professor of Intensive Care and Director Simpson Centre for Health ServicesResearch; Nancy Santiano, RN, BSN (Phil), PGDip ED, Mclin Nsg, Project Director; Adrian E Bauman, PhD, MPH, FAFPHM, Professor of PublicHealth; Hai N Phung, PhD, MD, MPH, Former Principal Research fellow.
doi: 10.1111/j.1742-6723.2008.01068.xEmergency Medicine Australasia (2008) 20, 136–143
© 2008 The AuthorsJournal compilation © 2008 Australasian College for Emergency Medicine and Australasian Society for Emergency Medicine
Copyright Agency Limited (CAL) licenced copy

Conclusion: T-A is an important indicator of the quality of ED services. Severity of illness and patientvolume were significant factors associated with extended T-A. Strategies for improvingpain management in the complex ED environment are discussed.
Key words: emergency medicine, pain management, time to initial analgesia.
Introduction
The management of pain is a key function for ED1–5 andan important indicator of clinical quality.5–8 To date,most authors have sought to investigate the effective-ness and timeliness of the delivery of analgesia in theED setting.3,4 Interventions have previously focused onways of encouraging ED staff to be more aware andmore effective in their delivery of analgesia.9–15 Someinvestigators have looked at patient factors that mightaffect the time to initial analgesia (T-A) delivery andconcluded that prolonged time for treating pain mightbe associated with overcrowding.1,2,8,16,17
This paper explores the association of morphine usein relation to potential factors, such as volume ofpatients in the ED, triage categories, pain categories,age, time of arrival and days of arrival in a principalreferral hospital ED in metropolitan Sydney, Australia.The present study also attempted to explore how T-Awas influenced by these factors and the patient volumein the ED.
Methods
Study design, sample size and setting
The study design was a 4 month retrospective clinicalreview of all presentations involving morphine admin-istration in the ED from 6 July to 30 September 2003conducted at Liverpool Hospital. The ED at LiverpoolHospital is a principal referral hospital ED serving thesouth-western region of Sydney with an estimated resi-dent population in 2001 of 160 000, with an estimatedgrowth of 6% per annum. Approximately 25% of thepopulation are under 15 years of age. Approximately35% of the residents were born in a non-English-speaking country, and just over a third of those speak alanguage other than English at home, where a substan-tial proportion, between 11% and 31%, speak poorEnglish. Liverpool Hospital ED has the largest numberof visits in the region with over 40 000 presentations peryear where more than 90% are local residents.
Participants
The sample comprised all eligible patients who weretreated in the ED and received morphine in the EDduring the study period. Patients who received othertypes of analgesics or sedatives were excluded from theanalysis, as well as those receiving morphine prior toarrival (e.g. ambulance patients) and those diagnosedwith acute pulmonary oedema (APO).
In the present study, T-A was defined as the timeinterval between the real-time computer entry on arrival,and the time that the drug morphine was signed out inthe restricted drug register, ready for administration.
Data collection
The institutional Human Research Ethics Committeegranted approval for the project. Irrespective ofpatients’ age, urgency of presentation (based on theAustralasian Triage Scale, ATS) and time of arrival,information on all the patients presented during the Julyand October 2003 was extracted for all patient presen-tations to the ED. During the study period, an effort wasmade to validate the information extracted from therestricted drug register in the ED by selecting a randomsample of medical notes from 50 patients. The T-A fromthe patients’ notes was reviewed against the informa-tion recorded in the register. Trained research assistantsentered information recorded in the ED drug register(which contains drug administration and patient infor-mation details. The pages are consecutively numberedand bound, so they cannot be removed or replaced).18
The register must be used at all times by all wards orsections of the hospital where restricted medications areused, including ED (sections 112–116).18 Morphine waschosen for the present study on the assumption that itsrequirement is an indication of significant pain severity,and ED policy was for use of morphine as the narcoticanalgesic of choice. The drug register database waslinked with clinical and demographic information usinga unique patient identifier number. The data werede-identified for the purposes of the analysis. A double-entry protocol was used to minimize data entry error.ED information, such as presenting problem, time of
Morphine use and time to initial analgesia
137© 2008 The AuthorsJournal compilation © 2008 Australasian College for Emergency Medicine and Australasian Society for Emergency Medicine
Copyright Agency Limited (CAL) licenced copy

presentation, triage time, time seen by doctor, andAustralian version of the International Classification ofDiseases, 9th Revision, Clinical Modification (ICD-9-CM)diagnostic codes were obtained from the EmergencyDepartment Information System (EDIS).19,20 Finally,the database was matched and linked with the drugregister data.
Analysis plan
All the data analyses were carried out by using statis-tical software SPSS (SPSS, Chicago, IL, USA)21 and Stata(Stata Corp, College Station, TX, USA).22 Bivariate(cross-tabulations) and multiple logistic regressionanalyses23 were performed to determine associationsbetween the prevalence of morphine and patient char-acteristics. Bivariate analyses were expressed as per-centage, and c2-test was used to examine groupdifferences. Logistic regression analysis determined theindependent contribution of each potential explanatoryvariable on morphine status. Adjusted odds ratios fromlogistic regression analysis expressed the likelihood ofreceiving morphine for each explanatory variable afteradjusting for the effects of other variables. Only thosefactors found significant in bivariate analyses wereincluded in the logistic regression model as predictorvariables. To assess the magnitude of the T-A variation,given the non-parametric properties of the distribution,median with 95% confidence intervals (95% CI) for themedian was used rather than mean.23 Pearson correla-tion coefficient was calculated to examine the associa-tion between the total ED presentations (patient volume)for a specific hour of the day and the correspondingmean T-A for that hour of the day. Also a linear regres-sion analysis was carried out to examine the influence ofpatient volume on T-A.
Kappa statistic was calculated with 95% CI for reli-ability analysis of the chart review.24 Prevalence andbias adjusted kappa (PABAK) was calculated usingspecial software developed by Abramson.25
Outcomes of interest
Pain categories were created from ICD-9-CM codes andreported pain, chief complaint of pain and procedures.7,8
Data variables included patients’ age, gender, dateand time of arrival, triage category (ATS), presentingproblem, time and day of arrival, admission status andICD-9-CM codes for main diagnosis. Time intervalswere determined in consultation with ED clinicians.These are standard shifts used in previous studies.26
Results
General characteristics of the study population
During the study period, a total of 13 449 ED atten-dances were registered with 35% admissions and 65%discharges after ED treatment. Of the total visits, 53%were male, 23% children (0–14 years), 41% youngadults (15–44 years), 26% mature age (45–75 years) and9% elderly (76+ years). Most patients (49%) visitedduring the daytime (08.00–17.00 hours), followed by34% between 17.00 and 23.59 hours, and the remaining17% visits were after midnight (Table 1 and Fig. 1). Outof these, 10% were triaged as immediately/imminentlylife-threatening, 55% as potentially life-threatening,36% potentially serious/less urgent. The highest-number patients arrived on Sunday (15%), followed byMonday (15%) and Friday (14%).
Morphine administration
Of the total presentations, 8% (1097 of 13 449) received atleast one dose of i.v. morphine. The results presented inTable 1 revealed that prevalence of morphine signifi-cantly (P < 0.05) varied by patients’ age, urgency of pre-sentation (triage category), time of arrival and typesof illness. Patients aged 45 years and older, arrivedlate at night, triaged as immediately/imminently life-threatening, diagnosed as renal colic were more likely toreceive morphine compared with others (Table 1). Onaverage, 28% of patients received less than 2.5 mg ofmorphine sulphate, 45% received between 2.6 and 5 mgand 26% received between 5.1 and 10 mg at the initialdose. In total, 63% received one dose in total; 24% twodoses and 13% three or more doses in total.
Factors associated with time to medication (T-A)
The mean duration between triage and analgesic admin-istration (T-A) was 131.5 min (median 79 min, standarddeviation 178.7 min). Because of the skewed distributionof T-A (mean is different to median), 95% CI for medianwere used to see the group differences of T-A. Themedian T-A with 95% CI by patients’ gender, age,severity of illness (triage category), time of arrival, daysof arrival and pain categories are presented in Table 1.
Although, the median T-A was found to be longer forthe elderly patients as compared with younger patients(75.0 vs 85.5 min), it was not found to be statisticallysignificant. As shown in Table 1, patients who arrived atlate night (47 min), triaged as immediately/imminently
R Forero et al.
138 © 2008 The AuthorsJournal compilation © 2008 Australasian College for Emergency Medicine and Australasian Society for Emergency Medicine
Copyright Agency Limited (CAL) licenced copy
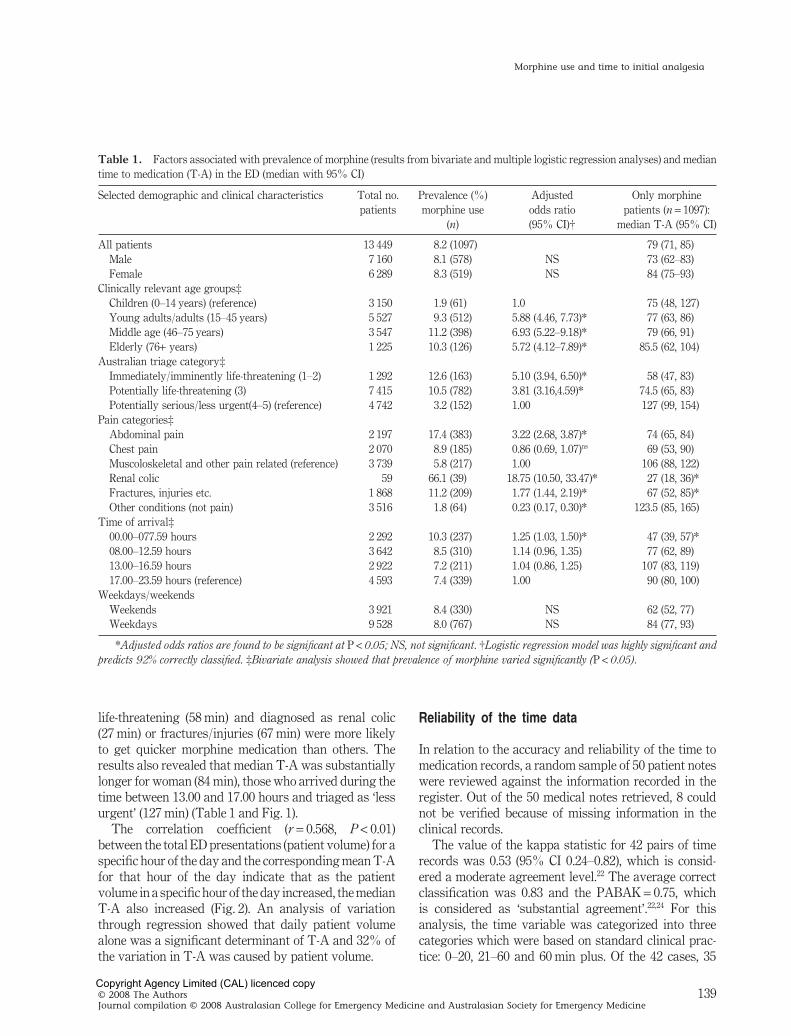
life-threatening (58 min) and diagnosed as renal colic(27 min) or fractures/injuries (67 min) were more likelyto get quicker morphine medication than others. Theresults also revealed that median T-A was substantiallylonger for woman (84 min), those who arrived during thetime between 13.00 and 17.00 hours and triaged as ‘lessurgent’ (127 min) (Table 1 and Fig. 1).
The correlation coefficient (r = 0.568, P < 0.01)between the total ED presentations (patient volume) for aspecific hour of the day and the corresponding mean T-Afor that hour of the day indicate that as the patientvolume in a specific hour of the day increased, the medianT-A also increased (Fig. 2). An analysis of variationthrough regression showed that daily patient volumealone was a significant determinant of T-A and 32% ofthe variation in T-A was caused by patient volume.
Reliability of the time data
In relation to the accuracy and reliability of the time tomedication records, a random sample of 50 patient noteswere reviewed against the information recorded in theregister. Out of the 50 medical notes retrieved, 8 couldnot be verified because of missing information in theclinical records.
The value of the kappa statistic for 42 pairs of timerecords was 0.53 (95% CI 0.24–0.82), which is consid-ered a moderate agreement level.22 The average correctclassification was 0.83 and the PABAK = 0.75, whichis considered as ‘substantial agreement’.22,24 For thisanalysis, the time variable was categorized into threecategories which were based on standard clinical prac-tice: 0–20, 21–60 and 60 min plus. Of the 42 cases, 35
Table 1. Factors associated with prevalence of morphine (results from bivariate and multiple logistic regression analyses) and mediantime to medication (T-A) in the ED (median with 95% CI)
Selected demographic and clinical characteristics Total no.patients
Prevalence (%)morphine use
(n)
Adjustedodds ratio(95% CI)†
Only morphinepatients (n = 1097):
median T-A (95% CI)
All patients 13 449 8.2 (1097) 79 (71, 85)Male 7 160 8.1 (578) NS 73 (62–83)Female 6 289 8.3 (519) NS 84 (75–93)
Clinically relevant age groups‡Children (0–14 years) (reference) 3 150 1.9 (61) 1.0 75 (48, 127)Young adults/adults (15–45 years) 5 527 9.3 (512) 5.88 (4.46, 7.73)* 77 (63, 86)Middle age (46–75 years) 3 547 11.2 (398) 6.93 (5.22–9.18)* 79 (66, 91)Elderly (76+ years) 1 225 10.3 (126) 5.72 (4.12–7.89)* 85.5 (62, 104)
Australian triage category‡Immediately/imminently life-threatening (1–2) 1 292 12.6 (163) 5.10 (3.94, 6.50)* 58 (47, 83)Potentially life-threatening (3) 7 415 10.5 (782) 3.81 (3.16,4.59)* 74.5 (65, 83)Potentially serious/less urgent(4–5) (reference) 4 742 3.2 (152) 1.00 127 (99, 154)
Pain categories‡Abdominal pain 2 197 17.4 (383) 3.22 (2.68, 3.87)* 74 (65, 84)Chest pain 2 070 8.9 (185) 0.86 (0.69, 1.07)ns 69 (53, 90)Muscoloskeletal and other pain related (reference) 3 739 5.8 (217) 1.00 106 (88, 122)Renal colic 59 66.1 (39) 18.75 (10.50, 33.47)* 27 (18, 36)*Fractures, injuries etc. 1 868 11.2 (209) 1.77 (1.44, 2.19)* 67 (52, 85)*Other conditions (not pain) 3 516 1.8 (64) 0.23 (0.17, 0.30)* 123.5 (85, 165)
Time of arrival‡00.00–077.59 hours 2 292 10.3 (237) 1.25 (1.03, 1.50)* 47 (39, 57)*08.00–12.59 hours 3 642 8.5 (310) 1.14 (0.96, 1.35) 77 (62, 89)13.00–16.59 hours 2 922 7.2 (211) 1.04 (0.86, 1.25) 107 (83, 119)17.00–23.59 hours (reference) 4 593 7.4 (339) 1.00 90 (80, 100)
Weekdays/weekendsWeekends 3 921 8.4 (330) NS 62 (52, 77)Weekdays 9 528 8.0 (767) NS 84 (77, 93)
*Adjusted odds ratios are found to be significant at P < 0.05; NS, not significant. †Logistic regression model was highly significant andpredicts 92% correctly classified. ‡Bivariate analysis showed that prevalence of morphine varied significantly (P < 0.05).
Morphine use and time to initial analgesia
139© 2008 The AuthorsJournal compilation © 2008 Australasian College for Emergency Medicine and Australasian Society for Emergency Medicine
Copyright Agency Limited (CAL) licenced copy

0
100
200
300
400
500
600
700
800
900
0 1 2 3 4 5 6 7 8 9 10 11 12 13 14 15 16 17 18 19 20 21 22 23
Time of arrival (24 h clock)
No.
pat
ient
s
Figure 1. ( ) Total number of patients arrived in each hour of the day (over the period of 118 days) and ( ) median time to initialanalgesia (in minutes) by time of arrival.
Total number of patients who arrived at each hour of the day900875850825800775750725700675650625600575550525500475450425400375350325300275250225200175
Med
ian
tim
e (m
in)
125
100
75
50
25
Figure 2. Median time to initial analgesia intervals with 95% confidence interval by the total number of patients who arrived at eachhour of the day. It is to be noted that the present study data set covered a period of 118 days (24 h a day). The total numbers of patientswho arrived at each hour over the period of 118 days were arranged in ascending order (lower to higher) and treated as x-axis, andcorresponding median time to initial analgesia intervals for respective hour was plotted on the y-axis. Same aggregate data set was usedfor correlation coefficient.
R Forero et al.
140 © 2008 The AuthorsJournal compilation © 2008 Australasian College for Emergency Medicine and Australasian Society for Emergency Medicine
Copyright Agency Limited (CAL) licenced copy

were in perfect agreement and 7 were longer in thepatient records than in the register records.
Discussion
According to several authors,3–5,7 there have been twomajor strategies for dealing with pain management inthe ED: provision and delay of analgesia. The presentstudy attempts to address the latter by exploring thedetailed use of the former. In this case, we used the i.v.administration of morphine sulphate as the outcomevariable. This was chosen as an indicator of severe pain(and therefore the patient group that would suffer mostif analgesia was delayed). Patients who were sedated ordiagnosed with APO were excluded. In the ED studied,morphine (given almost always intravenously) is thedrug of choice for the treatment of severe pain (unlesscontraindicated). Combining these two approaches, thestudy defined the T-A as the time between the real-timecomputer entry on arrival and the time that the drugmorphine was signed out for that patient. Although thistime interval is, in reality, a surrogate for the actual timefrom pain onset (or presentation) to the actual deliveryof analgesia, the method was chosen for the accuracy ofthe time indicators used.
The time of arrival is considered one of the mostaccurate data points of the EDIS system. In the studiedED, triage times were recorded as real time by one of thetwo dedicated triage nurses. If triage was at risk of beingdelayed because of the patient volume presenting, thenurse performed a rapid assessment, noting the time ona standardized form, and this information was thenentered into the computer when all patients had beentriaged. The time to delivery of an analgesic drug wasderived from the hand-written and compulsory drugregister, which is also likely to be accurate. The value ofPABAK was 0.75, which is considered ‘substantialagreement’. Although the unadjusted kappa was 0.53,the 95% CI range between 0.25 and 0.82, which could besubstantial. More research is needed to identify inaccu-racies in data reporting. We acknowledge that 83% ofcases were in perfect agreement and only 17% showedsome disagreement of just one category. This differencesuggests that it took longer to have medication in thepatient records than in the register records. This could beexplained by delays between time of signing off the drugregister and the actual time of administration of the drugto the patient. In some cases, patients might have notreceived the medication immediately as a result of mul-tiple patients receiving attention from individual nurses,
but the exact difference could not be established as wewere using categorical rather than continuous data.
The findings (Table 1) showed that the prevalence ofmorphine significantly (P < 0.05) varied by patients’ age,urgency of presentation (triage category), time of arrivaland types of illness. Renal colic cases had a significantlylower median time (27 min) whereas fractures and otherinjuries had a significantly higher median T-A of 67 min.Although not specifically studied, we hypothesize thereason for the significantly shorter T-A for renal colicmight have been that most of these patients arrive bytheir own transport, compared with those with fracturesand other injuries, and those categorized as immediately/imminently life-threatening who more frequently arriveby ambulance, and are thus more likely to have beenadministered narcotic or inhalational analgesia prior toarrival at the ED. Recent guidelines have indicated thatappropriate analgesia for severe pain should be receivedwithin 20 min of arrival or triage.3,27
The median time from arrival/triage to morphineadministration (T-A) was associated with time of arrivalon the day (Fig. 1). This evidence demonstrates that,apart from patients’ severity of illness (triage category),time of arrival and patient volume had significantimpact on performance of a clinical process. This sug-gests that the traditional strategies for improving T-A,such as staff awareness and education, will not fullyaddress the problem. It also adds to the growing body ofevidence that peak of patient volume might have a det-rimental effect on a range of clinical processes.
We acknowledge that by excluding administration ofmorphine by the ambulance service, general physiciansor other health-care providers prior to the patient’s pre-sentation to the ED, our study might underestimate thetotal number of patients who in fact had received nar-cotic analgesia associated with their emergency presen-tation. Ignoring this, first dose might have skewed ourT-A results for certain subcategories of patient. Also,we acknowledge that a number of patients will havereceived oral or inhalational analgesia prior to morphineadministration while in the ED, and it should be kept inmind that T-A in our study represents a conservativeestimate of the efficiency of analgesia provision in theED studied. Another important finding is that only 25%of patients received the full first dose and only 63%received one single dose of morphine. This is importantas a large number of patients in the present study werefound who did receive small quantities or did notreceive dosage increase.28
An interesting, and perhaps counter-intuitive, findingwas that the T-A on weekends (median 62 min) was
Morphine use and time to initial analgesia
141© 2008 The AuthorsJournal compilation © 2008 Australasian College for Emergency Medicine and Australasian Society for Emergency Medicine
Copyright Agency Limited (CAL) licenced copy
shorter than the weekdays (median 84 min). Althoughwe did not further investigate this finding, it might havebeen related to the practice of rostering additional emer-gency registrar and resident staff to the weekend ‘float’shift (midday to 22.00 hours) at that time. Anotherexplanation is that the proportion of renal colic andfractures was more common during the weekends ascompared with weekdays (data not shown), whichmight be one of the reasons for shorter median T-Aduring the weekend, as the diagnostic group of renalcolic, fractures and injuries had a lower median T-Athan other groups (Table 1).
The study is limited by observations only in one EDfor a defined period. Other potential confounders werenot considered, which might contribute to T-A variabil-ity. We did not specifically measure ED census for thetime periods studied; however, in common with othermajor ED, the presence of access block meant that therewas considerable lag time between the completion of EDcare and transfer to the wards for admitted patients.This, in addition to the volume of new patients per timeperiod, contributes to total ED patient volume. Diagnos-tic categories (such as abdominal pain or injuries) mightbe imprecisely coded at the ED level, so this analysisfocused on the total T-A time. Within these limitations,the external validity is reasonable and it is likely thatsimilar findings would be noted in other large Austra-lian hospital ED.
Conclusion
It is clear from our data that there are some factors,external to ED processes, which impact on ED clinicalperformance. The present study has shown a clear asso-ciation between longer times to analgesia and patientvolume in the ED. This suggests that ED resources ableto be directed to administering analgesia are overbur-dened at such times. In order to effectively address thesedelays, patient flow factors, including patient volume,need to be managed, and additional staff resources allo-cated to the ED. In a highly dynamic ED environmentwhere patient flow and patient volume impact onservice delivery, systems research is an important keyto understanding and improving the clinical process.
Acknowledgements
Priority Driven Research Program – Australian HealthMinisters Advisory Committee funded the study. Grant
No. AHMAC-PDR 2001/11. We thank for their supportduring the project Emily May, Kristin Magill, IsaganiSantiano, Margaret Morris, Sandra Farrugia, MonicaAburto, Steven Frost, Jenny Morris, ED Project SteeringCommittee members, Simpson Centre For Health Ser-vices Research staff and all medical, nursing and cleri-cal staff from the Liverpool Hospital ED.
Author contribution
RF contributed to the conception and design of thestudy, acquisition, statistical analysis and interpreta-tion of data; MM contributed to the substantial statisti-cal analysis and interpretation of data, drafting andgiving approval for final submission; SM contributed tooriginal conception and design of the study, revising thearticle critically for intellectual content and giving finalapproval for submission; LY contributed to the concep-tion and design of the study, coordinated and manageddata collection and contributed with the acquisition andinterpretation of data and critical revision of intellectualcontent; SI contributed to original grant submission ofthe study, critical revision for clinical and analyticalcontent, drafting and giving final approval for submis-sion; KH contributed to original grant submission, revis-ing the article critically and giving final approval forsubmission; NS coordinated data collection and contrib-uted with article writing and approved final version forsubmission; AB contributed to original grant submis-sion, critical revision for methodological and statisticalquality, drafting and giving final approval for submis-sion; HP contributed to data management, drafting andgiving approval for submission.
Competing interests
Sue Ieraci is a Section Editor for Emergency MedicineAustralasia.
Accepted 22 November 2007
References
1. Canadian Association of Emergency Physicians. Joint positionstatement on emergency department overcrowding. Can. J.Emerg. Med. 2001; 3: 82–4.
2. Kollek D. Emergency department overcrowding. Can. Med.Assoc. J. 2002; 167: 626–7.
R Forero et al.
142 © 2008 The AuthorsJournal compilation © 2008 Australasian College for Emergency Medicine and Australasian Society for Emergency Medicine
Copyright Agency Limited (CAL) licenced copy

3. Grant PS. Analgesia delivery in the ED. Am. J. Emerg. Med. 2006;24: 806–9.
4. Kelly AM. A process approach to improving pain managementin the emergency department: development and evaluation.J. Accid. Emerg. Med. 2000; 17: 185–7.
5. Fosnocht DE, Swanson ER, Barton ED. Changing attitudes aboutpain and pain control in emergency medicine. Emerg. Med. Clin.North Am. 2005; 23: 297–306.
6. Tanabe P, Buschmann M. A prospective study of ED pain man-agement practices and the patient’s perspective. J. Emerg. Nurs.1999; 25: 171–7.
7. Cordell WH, Keene KK, Giles BK, Jones JB, Jones JH, BrizendineEJ. The high prevalence of pain in emergency medical care. Am.J. Emerg. Med. 2002; 20: 165–9.
8. Rupp T, Delaney KA. Inadequate analgesia in emergency medi-cine. Ann. Emerg. Med. 2004; 43: 494–503.
9. Asplin BR. Does ambulance diversion matter? Ann. Emerg. Med.2003; 41: 477–80.
10. Silka PA, Geiderman GM, Kim JY. Diversion of ALS ambulances:characteristics, causes, and effects in a large urban system.Prehos. Emerg. Care 2001; 5: 23–8.
11. Fosnocht DE, Swanson ER, Bossart P. Patient expectations forpain medication delivery. Am. J. Emerg. Med. 2001; 19: 399–402.
12. Silka PA, Roth MM, Geiderman JM. Patterns of analgesic use intrauma patients in the ED. Am. J. Emerg. Med. 2002; 20: 298–302.
13. Vassiliadis J, Hitos K, Hill CT. Factors influencing hospital andemergency department analgesia administration to patients withfemoral neck fractures. Emerg. Med. 2002; 14: 261–6.
14. McCarthy C, Hewitt S, Choonara I. Pain in young children attend-ing an accident and emergency department. J. Accid. Emerg.Med. 2000; 17: 265–7.
15. Sandhu S, Driscoll P, Nancarrow J, McHugh D. Analgesia in theaccident and emergency department: do SHOs have the knowl-edge to provide optimal analgesia? J. Accid. Emerg. Med. 1998;15: 147–50.
16. Foster AJ, Stiell I, Wells G, Lee AJ, Walraven CV. The effect ofhospital occupancy on emergency department length of stay andpatient disposition. Acad. Emerg. Med. 2003; 10: 127–33.
17. Schneider SM, Gallery ME, Schafermeyer R, Zwemer FL. Emer-gency department crowding: a point in time. Ann. Emerg. Med.2003; 42: 167–72.
18. New South Wales Consolidated Regulations. Poisons and Thera-peutic Good Regulation 2002 – Sections 111–116. [cited 17 June2004.] Available from URL: http://www.austlii.edu.au/au/legis/nsw/consol_reg/patgr2002398/index.html
19. HAS Solutions. Emergency Department Information System V.6.[cited 21 January 2004.] Available from URL: http://www.qisu.qld.gov.au/edis.htm
20. National Coding Centre. Australian Version of The InternationalClassification of Diseases, 9th Revision, Clinical Modification(ICD-9-CM), 2nd edn. Lidcombe: The University of SydneyFaculty of Health Sciences, 1996.
21. SPSS. SPSS for Windows, Version 11. Chicago: SPSS, 2003.
22. Statacorp. Reference Manual Release 8. College Station: StataPress, 2003.
23. Conovar WJ. Practical Nonparametric Statistics, 3rd edn. NewYork: John Wiley & Sons, 1999.
24. Landis JR, Koch GG. The measurement of observer agreementfor categorical data. Biometrics 1977; 33: 159–74.
25. Abramson JH. WINPEPI (PEPI-for-Windows): computer pro-grams for epidemiologists. Epidemiol. Perspect. Innovat. 2004; 1: 6.
26. Forero R, Mohsin M, Bauman A et al. Access-block in NSWhospitals: 1999 to 2001. Does the definition matter? Med. J. Aust.2004; 180: 67–70.
27. BAEM – Clinical Effectiveness Committee. Guidelines for theManagement of Pain in Adults, 2005. [cited 25 July 2007.] Avail-able from URL: http://www.emergencymed.org.uk/BAEM/CEC/assets/cec_pain_in_adults.pdf
28. Shabbir J, Ridgway PF, Lynch K et al. Administration of analge-sia for acute abdominal pain sufferers in the accident and emer-gency setting. Eur. J. Emerg. Med. 2004; 11: 309–12.
Morphine use and time to initial analgesia
143© 2008 The AuthorsJournal compilation © 2008 Australasian College for Emergency Medicine and Australasian Society for Emergency Medicine
Copyright Agency Limited (CAL) licenced copy