Lime Pretreatment of Sugarcane Bagasse for Bioethanol Production
Upload
independentCategory
view
2download
0
ARTICLE IN PRESS
Energy 33 (2008) 1206– 1223
Contents lists available at ScienceDirect
Energy
0360-54
doi:10.1
� Corr
Coperni
Netherl
E-m1 Pr2 TO
journal homepage: www.elsevier.com/locate/energy
Pre-treatment technologies, and their effect on international bioenergysupply chain logistics. Techno-economic evaluation of torrefaction,fast pyrolysis and pelletisation
Ayla Uslu a,b,�, Andre P.C. Faaij a,b, P.C.A. Bergman a,b
a Department of Science, Technology and Society, Copernicus Institute, Utrecht University, Heidelberglaan 2, 3584 CS Utrecht, The Netherlandsb Energy Research Centre of the Netherlands (ECN) ECN Biomass, Westerduinweg 3, 1755 ZG Petten, The Netherlands
a r t i c l e i n f o
Article history:
Received 26 September 2006
Keywords:
Biomass
Bioenergy
Pre-treatment
Torrefaction
Pelletisation
Pyrolysis
TOP
42/$ - see front matter & 2008 Elsevier Ltd. A
016/j.energy.2008.03.007
esponding author at: Department of Scien
cus Institute, Utrecht University, Heidelbergl
ands. Tel.: +31 224212868; fax: +31 22429173
ail address: [email protected] (A. Uslu)
ocess efficiency includes sizing and drying o
P: torrefied and pelletised biomass.
a b s t r a c t
The pre-treatment step has a significant influence on the performance of bioenergy chains, especially on
logistics. Torrefaction, pelletisation and pyrolysis technologies can convert biomass at modest scales
into dense energy carriers that ease transportation and handling.
Torrefaction is a very promising technology due to its high process efficiency (94%) compared to
pelletisation (84%) and pyrolysis (64%).1 When torrefaction is combined with pelletisation, the product
(TOP2) energy content is as high as 20.4–22.7 GJ/ton. The primary energy requirement for TOP delivery
from Latin America to Rotterdam harbour can be as low as 0.05 GJ/GJ, in contrast to 0.12 GJ/GJ for pellets
and 0.08 GJ/GJHHV for pyrolysis oil. TOP can be delivered to Europe at over 74 h/ton (3.3 h/GJ) and
electricity could be produced as cheap as 4.4 hcent/kWhe from an existing co-firing plant. Fisher
Tropisch fuel costs 6 h/GJHHV for TOP, 7 h/GJ for conventional pellets and 9.5 h/GJHHV for pyrolysis oil.
Consequently, fuel production from TOP and conventional pellets is comparable to the current gasoline
production cost ranging from 3 to 7 h/GJHHV
and diesel from 2 to 7 h/GJHHV
, depending on the oil market.3
Thus, well designed supply chains make international trade of biomass feasible from energy efficiency
and economic perspective.
& 2008 Elsevier Ltd. All rights reserved.
1. Introduction
Sustained energy supply is an essential objective to achieveand depends on ensuring secure and reliable energy sources.However, the European Union (EU) import dependency is rising.Unless domestic energy becomes more competitive in the next20–30 years around 70% of the EU’s energy needs are expected tobe met by imported products—some from regions threatened byinsecurity [1]. On the other hand, fossil fuel consumption causessubstantial environmental harm notably, climate change. Energyproduction and consumption account for 81.5% of the total greenhouse gas (GHG) emissions in the EU-25 [2].
In addressing those threats, the EU is increasingly shiftingtowards policies favouring use of renewable energy sources.Currently biomass delivers around 4% of the EU’s primary energy(Eurostat) and in order to reach the future targets set out by the
ll rights reserved.
ce, Technology and Society,
aan 2, 3584 CS Utrecht, The
0.
.
f biomass.
EU, significant amounts of biomass will be required. The renew-able energy target in the EU’s overall mix is determined as 20% by2020, which corresponds to 230–250 MtOE bioenergy dependingon various assumptions [3].3 Furthermore as a substitute fortransportation fuels, the EU set itself a minimum binding target of10% biofuel use by 2020. Moreover, bioenergy contributes 22% ofthe primary energy supply in developing countries, and around10% of global energy demand [4].
Since some countries have larger land areas used at lowerdensities compared to others, they may become net suppliers ofrenewable bioenergy. While biomass production costs in suchcountries may be relatively low, there will be additional logisticcosts, energy uses and material losses [5]. However, severalstudies have given indications that international trade in biofuelcould be economically feasible [6–8]. These studies, concerninglong distance bio-energy transportation, analysed several cases tocalculate biomass delivery and final energy production costs.Hamelinck developed a tool with which different bioenergychains were analysed [5,6]. This work clarified that densification
3 The amount of bioenergy is dependent upon the total energy consumption
growth, the increases in the other renewable energy sources and the end-use of
the biomass.
ARTICLE IN PRESS
A. Uslu et al. / Energy 33 (2008) 1206–1223 1207
prior to international transportation of biomass is crucial, asconverting biomass into a densified intermediate can savetransport and handling costs. In addition, it can improve theefficiency of the final conversion stage. Subsequently, pre-treatment is a key step in the total supply chain. Broadly,feedstock costs contribute around 20–65% of the total deliverycost whereas pre-treatment and transport contribute 20–25% and25–40%, respectively, depending on the location of the biomassresources [5]. However, recent and potential future improvementsof pre-treatment technologies and their subsequent impacts onthe overall bioenergy chain have not been addressed in detail.
Currently, the state-of-the-art (SOTA) biomass-to-energychains are mostly based on pelletisation. However, the pre-treatment technologies such as fast pyrolysis and torrefaction mayimprove the economics of the overall production chain. However,these technologies are still under development and their econom-ic and technical performances are unclear. There are no normal-ised data sets available in literature and the available informationmainly discusses the technology and the intermediate products,rather than their influence on the performances of the wholeproduction chains. The main objective in this study is therefore toassess which pre-treatment method(s), at what point of the chain,with which conversion technology (ies) would give the optimalpower and fuel (syngas) delivery costs for international biomasssupply chains.
The study focuses on detailed techno-economic analysis of keypre-treatment technologies, namely torrefaction, pyrolysis andpelletisation and their respective impacts, in terms of costs andenergy uses in various chains for biomass production and use.
2. Methodology and evaluation criteria
A technology review was performed to collect design data ofpre-treatment technologies. Mass yields, energy yields andprocess efficiencies of each technology were evaluated, partly bybuilding simple models to determine energy and mass balances.
The economic evaluation of the technologies was based oncomponent level cost data, which were obtained from literatureand personal communication with experts. Since the capacities ofthe components affect the specific cost of a plant, economies ofscales were analysed. These were done by identifying the basescales, base costs and the maximum scales of the equipment.Next, the equipment costs for designed scales were calculatedusing the scale factors per component obtained from literature.Capital investment requirements4 and production costs werecalculated, and subsequently a sensitivity analysis was performedto identify the most important parameters that influence theproduction costs. Cost data were normalised using the OECDdeflator and exchange rates of national currencies.
Following the techno-economic assessment of each pre-treatment technology, several biomass-to-energy chains weredesigned depending on the location and scale of the technologyapplied. The chain assumptions were based on feedstockharvested in South America (Brazil) and the final conversionapplied in North-West Europe. Final conversion technologiescomprise Entrained Flow Gasification for Fischer Tropsch liquid(EF-FT) production, biomass integrated gasification combinedcycle (BIGCC), SOTA combustion and co-firing for power produc-tion. An existing model and database developed by Hamelinckwas used to design the chains [5,6]. This tool enables chains to beset up with harvesting, transport, storage, handling, pre-treatment
4 Capital costs consist of direct costs (equipment+total installation costs),
indirect costs (engineering and supervision, construction expense/contractor fee,
contingency) and working capital.
and final conversion steps considered in many ways. It alsocalculates energy and mass balances and economic performancesof the chains selected. Chain analyses were followed by sensitivityanalyses to test the robustness of the study results and assess thevariation in fuel/power costs. The performance and economicimpacts of pre-treated biomass on final conversion stage was notstudied in this research, as this requires an extensive techno-economic analysis which could however be the focus of futureresearch.
3. Techno-economic evaluation
3.1. Torrefaction
Torrefaction is a thermal pre-treatment technology performedat atmospheric pressure in the absence of oxygen. Temperaturesbetween 200 and 300 1C are used, which produces a solid uniformproduct with very low moisture content and a high calorific valuecompared to fresh biomass.
Even though torrefaction is in its infancy, several studies showthat torrefaction increases the energy density, hydrophobic natureand grindability properties of biomass [9–11]. Torrefied biomasstypically contains 70% of its initial weight and 90% of the originalenergy content [9,11]. The moisture uptake of torrefied biomass isvery limited, varying from 1% to 6%.
3.1.1. Torrefaction conditions and products
Torrefaction process composes of initial heating, pre-drying,post-drying and intermediate heating stages. Above 200 1C, thetorrefaction reaction occurs where devolatilisation takes place.Finally, the solid product is cooled to below 200 1C, whichterminates the torrefaction process [9].
During torrefaction, biomass loses relatively more oxygen andhydrogen compared to carbon. Subsequently, the calorific value of theproduct increases. The net calorific value of torrefied biomass is inthe range of 18–23 MJ/kg LHV5
(dry) or 20–24 MJ/kg HHV6(dry) [9,11].
The moisture uptake of torrefied biomass is very limited due tothe dehydration reactions during the torrefaction reaction.Destruction of OH groups in the biomass by dehydration reactionscauses the loss of capacity to form hydrogen bonds with water. Inaddition, non-polar unsaturated structures are formed whichmakes the torrefied biomass hydrophobic [9]. The torrefiedbiomass also becomes more porous with a volumetric density of180–300 kg/m3, depending on the initial biomass density andtorrefaction conditions. It is more fragile as it looses itsmechanical strength, making it easier to grind or pulverise.
3.1.2. State-of-the-art (SOTA) system description
Torrefaction technology is not yet commercially available.Pechiney has built the first demonstration unit that was inoperation since 1987 with a capacity of 12 000 ton/yr of torrefiedwood used as a reduction agent for the metallurgic industry [9]. Theprocess mainly consisted of a chopper, a drying kiln, and atorrefaction reactor (roaster) that required maximum 10% m.c.There were various problems with this reactor design when it wasconsidered for bigger scales. The heat exchange area was a limitingfactor. The feed moisture content was limited to 15% while thereactor throughput was limited to 2 ton/h. Higher moisture contentswould drop the reactor throughput. Another disadvantage was thatthe reactor required free-flowing feed particles [9].
5 LHV: lower heating value, untreated wood energy content is in the range of
17–19 MJ/kg, charcoal is 30 MJ/kg and coal is 25–30 MJ/kg (LHVdry).6 HHV: higher heating value.

ARTICLE IN PRESS
Drying Torrefaction Cooling
Heatexchange
biomassTorrefiedbiomass
Air
utillity Fuel
Fluegas
Combustion
DP
Torrefactiongases
Fluegas
Fluegas
gasrecycle
Fig. 1. General flow diagram of ECN torrefaction process [9] (DP: pressure drop recovery).
A. Uslu et al. / Energy 33 (2008) 1206–12231208
3.1.3. Energy Research Centre of The Netherlands (ECN) torrefaction
technology
At ECN, a torrefaction process based on direct heating of thebiomass by using the recycled hot gas has been designed. Thetorrefaction gas is re-pressurised and heated before it is recycledto the reactor. The moisture content of the feedstock in thisprocess is extremely important since the feedstock propertydetermines the required heat demand (Fig. 1).
In this design, the combustion of torrefaction gas is expected tocover the energy demand of the dryer (without or with a minimal)utility fuel consumption. Thus, this results in a self supporting,high efficiency system. The calorific value of the produced gasranges from 5.3 to 16.2 MJ/N m3 at the temperatures of 265 and290 1C, respectively [9].
7 Annual investment cost is calculated as Iannual ¼ a� It, a ¼ r/(1�(1+r)�L
where a: the capital recovery factor, It: total investment, r: the discount rate and L:
the life time or depreciation period of the equipment.
3.1.4. Torrefied biomass densification (torrefied and pelletised
biomass, TOP)
As described previously, torrefied biomass is a porous productwith a low density. It is fragile, which makes it relatively easy togrind. However, decreased mechanical strength and increased dustformation, in addition to low volumetric density, makes furtherdensification desirable. This is especially important when longdistance transport is considered. In the ECN Laboratories, the massdensity of torrefied biomass pellet has been measured at around22 MJ/kg, whereas the energy density reaches up to 18 GJ/m3.Although this energy density is less than that of coal (20.4 GJ/m3), itis 20% higher than commercial wood pellets [9,12]. Thus, torrefac-tion in combination with pelletisation (TOP) offers significantadvantages when the biomass logistics are considered. The pressurerequired for densification could be reduced by a factor of 2 at 225 1C,while the energy consumption of densification could be reduced bya factor of 2 compared to biomass pelletisation [9,13–15].
Torrefaction can reduce power consumption required for sizereduction by up to 70–90% compared to conventional biomasspelletisation [16]. A simpler type of size reduction, such as cuttingmills and jaw crushers, can be deployed instead of hammer millswhich are used for the conventional pelletising process [16].
3.1.5. Mass and energy balance
Experiment and process simulations conducted by ECN havebeen combined to identify the energy and mass balance, thermalprocess efficiency, auto-thermal operations and combustibility oftorrefaction gas. Torrefaction experiments are conducted in anindirectly heated screw reactor and a batch reactor. Willow andwoodcutting are used as feedstock for these experiments. For thesimulation-derived parameters, ASPEN simulations are performedon the basis of mass and energy yields of torrefaction that wereexperimentally determined. The flow sheet calculations in ASPENare done for a production rate of 150 MWth torrefied biomass. Thedefault moisture content of feedstock was 50%. Flue gas stacktemperature was around 140 1C. The heat losses in drying andtorrefaction were around 0.5% HHV of biomass feedstock. Fig. 2represents the net energy flows of one of the points of operation inLHV. In order to dry the wet biomass (50%) to 15%, 22.2 MWth
energy is used. This increases the calorific value resulting in anenergy flow increase from 135.7 to 152.8 MWth (corresponding toa thermal efficiency of 96%). The thermal efficiency of torrefactionon the other hand is 100% since the torrefaction gas is fullyutilised through combustion (neglecting heat losses to theenvironment). Moreover, the moisture content of the torrefiedproduct is as low as 1–6% which decreases the difference betweenLHV and HHV significantly. The process efficiency (96.1%) isdetermined by the efficiency of drying, lowered by the heat lossesto the environment during combustion and torrefaction. Netefficiency is around 91% when the utility consumption is included.The mass yield of the torrefaction process is around 70%.
3.1.6. Economic evaluation
The economic evaluation is based on estimations of requiredannual investment7 and total production costs. The totalcapital investment is calculated using the combination of

ARTICLE IN PRESS
Drying Torrefaction
HE
biomassTorrefiedbiomass
Combustion
Fluegas
Fluegas
051152.8135.7156.1
22.2
21.4
7.97
5.47
27.7
14.7
Cooling
4.10
Torrefactiongas
Fig. 2. Net energy flows (in MWth) corresponding with torrefaction of woodcuttings at 280 1C and 17.5 min reaction time (HE: heat exchanger) [9]. [It should be noted that
the energy flows mentioned in the figure are for woodcuttings and this would differ when a different feedstock with different hemicellulose composition is applied.]
A. Uslu et al. / Energy 33 (2008) 1206–1223 1209
capacity-factored equipment-based estimates, and vendor quotesof the main plant items. The flow rates, heat duty, powerequipment and capacity ratios are used in the capacity-factoredestimation. The equipment-based estimations are done accordingto detailed design calculations [9]. The maximum capacity of asingle torrefaction process line is estimated about 50–60 kton/aproduction capacity, corresponding to a fuel production of30–40 MWth.8 Capital investment cost of a 60 kton/a productionprocess is estimated at 5.2–7.5 Mh. Around 39% of the costcomprises the installation costs, while 31% comprises theequipment costs. When the feedstock cost is excluded, totalproduction cost of torrefied biomass is calculated in the range ofaround 40–56h/ton.
3.2. Pyrolysis
3.2.1. Process definition
Pyrolysis can be described as the direct thermal decompositionof biomass in the absence of oxygen [17]. Temperatures employedin pyrolysis are 400–800 1C [18]. The products are gas, liquid andsolid char, and their relative proportions depend on the pyrolysismethod, the characteristics of the biomass and the reactionparameters. Fast pyrolysis is one of the methods where very highheating rates (around 500 1C) at moderate temperatures and rapidproduct quenching are employed to produce pyrolysis oil (bio-oil)[19]. It generates mostly vapours and aerosols.
Generally, the yields are 40–65 wt% organic condensates,10–20% char, 10–30% gases and 5–15% water based on dryfeed [20]. The energy content of the pyrolysis oil is around15–18 MJ/kg with a moisture content around 25%. The LHV of gasis around 15 MJ/N m3 and the char is around 32 MJ/kg [20].9
The char produced in fast pyrolysis is very flammable dueto its small particle size and high volatility. Therefore, hotchar from the process should be properly handled to avoidignition.
3.2.2. SOTA technology
Fast pyrolysis of biomass is on the verge of development anddemonstration stage (in power production) [21–25]. Fluidisedand transported bed reactors have gained acceptance for beingreliable thermal reaction devices capable of producing bio-oil
8 [9].9 When the fast pyrolysis reactor operation is in favour of maximum liquid
production with a minimum of vapour cracking.
with relatively high yields. However, other reactor types such asablative, rotating cone and vacuum reactors have varying benefitsand drawbacks compared to each other. Both bubbling andcirculating fluidised bed reactors are commercially available withthe capacities of 20–400 kg/h10 for bubbling and 20–1700 kg/h forcirculating bed type,11 however, currently deployed pyrolysissystems are relatively small ranging from 20 to 3500 kg/h (in dryfeed bases).
Even though Fluidised Bed (FB) reactors are reliable (they havea long history and are commercially applied) one of the mainconstraints they have is their requirement for very small feedstocksizes (1–2 mm). Another constraint is the dependency of thereactor throughput on the amount and efficiency of the heatsupplied. Even though in some reactor types the fluidising gas canbe preheated and recycled back to the system (as in Fig. 4), thisusually results in scale up difficulty. On the other hand ablativereactors can handle feedstock sizes up to 20 mm, however, theyare subject to erosion risk due to high entering velocities. Vacuumreactors are not promising since they have relatively lower bio-oilyields (30–45%) even though the bio-oil produced is very clean[19,26–29]. A rotating cone reactor has been developed at theUniversity of Twente. This reactor is based on mixing of biomassfeedstock with hot sand near the bottom of the cone andtransportation upwards by the rotating action of cone. It is scaledup to 200 kg/h as a pilot plant. This technology does not require acarrier gas for pyrolysis and this makes bio-oil recovery easier.Moreover it is a compact technology with a good integration ofheat [29].
3.2.3. Mass and energy balance
The mass and energy yield of rotating cone pyrolysistechnology is presented in Fig. 3. The mass yield of bio-oil isaround 70%, while non-condensable gas mass yield and char yieldare around 20% and 10%, respectively. The energy yield of this fastpyrolysis process is determined to be around 66% [30].
3.2.4. Economic evaluation
Since the cost data for pyrolysis plants varies significantly,rotating cone pyrolysis plant (25 MWth) cost data from reference[30] is compared to a reference pyrolysis plant calculated in thisstudy in order to identify the possible lowest and highest costranges for the same scale. The reference plant calculation is based
10 RTI, Canada and Dynamotive.11 Ensyn Design.

ARTICLE IN PRESS
0.7 kg/hrfluegas
bio-oil4 tons/hr7.5 tons/hr 16.5 MWLHV
25 MWLHV 25 MWLHV25 MWLHV
0.75 tons/hr
Dryer 2.1MWLHV
ash0.05 tons/hr
5.5 tons/hr 5.5 tons/hr
Hammer millPyrolysis unit
gas
Fig. 3. The mass and energy balance of a 5-tondry feed/h pyrolysis plant [30].
pelletisation
biomassscreening
drying
A. Uslu et al. / Energy 33 (2008) 1206–12231210
on the cost data obtained from literature for feedstock preparationunit, dryer, hammer mill12 and the pyrolysis reactor.13 As a result,25 MWth capacity pyrolysis plant capital investment cost iscalculated as being in the range of 4.5–11.5 Mh. In addition, whenthe feedstock cost is excluded, the production cost is calculated asbeing around 75–150 h/ton (6–12 h/GJ).14
grinding
pelletstorage
cooling
Fig. 4. State-of-the-art pellet production process diagram.
3.3. Pelletisation
Pelletisation can be defined as drying and pressing of biomassunder high pressure to produce cylindrical pieces of compressedand extruded biomass. Pellets have a smaller volume and a highervolumetric energy density compared to wood chips and are hencemore efficient to store, ship and convert into energy [31].Pelletisation not only produces a uniform and stable fuel, butalso the amount of dust produced is minimised. Anotheradvantage of pelletisation is that it enables free flowing,15 whichfacilitates material handling and rate of flow control important forloading and unloading operations [32].
The production of pellets requires small feedstock particles,maximum 3–20 mm and moisture content below 10–15%[33].However, piston press pelletisation can handle up to 20% moisturecontent [34–37]. Pelletisation is performed at a temperature ofaround 150 1C. Water plays an important role in densification. Ifthe feedstock is either too dry or too wet, the pressure required fordensification increases dramatically. In fact, moisture content of10–25% is considered optimal [14]. Thus, the feedstock is heatedto 50–100 1C to soften the lignin and obtain the desired moisturecontent and at approximately 150 1C mechanical densification isapplied.
12 The base scales of 100 ton/h rotary drum dryer with 5 Mh capital cost, a
50 ton/h hammer mill with 0.37 Mh capital cost and 5000 m3 silo with 0.331 Mh
from reference [5] are applied to calculate the 25 MWth reference pyrolysis plant.
The scaled factor used is 0.7.13 The pyrolysis reactor cost data is calculated by the below equation derived
from reference [19]. TPC, kECU2000 ¼ 40.8� (Q(kg-dry/h) where TPC: total plant
cost of the pyrolysis reactor, Q: the mass flow rate of prepared wood feed into the
reactor. However, in this study five different pyrolysis plant cost data are plotted to
a graph and the equation, TCI, 2004 ¼ 94.126�Q (kg-dry/h) is derived. These
plants are from Ensyn (transported bed reactor), Egemin (entrained flow),
Interchem (NA) Industries (ablative), BTG (rotating cone) and ASR (vacuum). Since
the cost data calculated by Bridgwater’s equation is higher, it is used as the
maximum cost data.14 Assumptions are: 70% bio oil yield with 17. 5 MJ/kg LHV, 7500 h/year
biomass availability.15 Free flowing: particles having the same shape ensuring that they can flow
freely.
3.3.1. State-of-the-art (SOTA) system description
Pelletising has been commercialised. For example, a 120-ton/day plant has been operating since 1976 in Oregon [14]. Inaddition, Finland and Sweden are the two leading countries inpelletising technology in Europe. Pellet production basicallyconsists of at least four steps: drying, milling (grinding),pelletising and cooling (Fig. 4).
3.3.2. Product
The produced pellets have a net calorific heating value in therange of 16–18 MJ/kg. The actual value largely depends on themoisture content which varies between 5% and 10% (Table 1).
3.3.3. Improvements in pelletising technology
Currently there are two different processes, under develop-ment in order to improve the quality of the pellets and todecrease the energy consumption during the pelletisation process.The first of these is a steam explosion process tested in ademonstration unit [37]. The aim is to produce pellets which aremuch harder, have a higher specific weight (a bulk density of850 kg/m3) and are less sensitive to moisture and separation offines. The research is being carried out in Norway at the CambiBioenergi Vestmarka. The raw material is preconditioned in thistechnology by heating a steam-compression reactor to release thenatural lignin. After a certain exposure time, the pressure isreduced, which causes the material to explode. In the literature, itis mentioned that the pre-treatment process increases the pelletmill capacity 100%. However, the plant in Norway is a prototypeplant, it is not yet commercial and the economic data is notavailable.
The second technology has been developed by the Italiancompany EcoTre System. In this new technology, electricityconsumption ranges between 0.025 and 0.045 kWh/kg, depending

ARTICLE IN PRESS
Table 1Characteristics of wood pellets (sawdust, cutter shavings, and wood-grinding dusts
as raw materials) [38]
Variables Unit Value
Size
Diameter mm 6– 10
Length mm 10– 13
Energy content MJ/kg 16.9– 18.0
Moisture content % 7– 12
Ash content % 2
Bulk density kg/m3 650– 700
Space demand m3/ton 1.5
A. Uslu et al. / Energy 33 (2008) 1206–1223 1211
on the type of wood. The process operates at low temperatures(55–60 1C) and without any additives. The main advantageof this system is its simplicity and lower investment costs. Thepelletiser in this process can handle biomass with 30–35%moisture content, which means that a simple dryer can beemployed or a dryer might not be required [37]. Energyconsumption and investment costs are reduced significantly. Theenergy consumption of a rotary drum dryer is stated as beingaround 20 kWhe/ton [5].
3.3.4. Mass and energy balance
During pelletisation process, biomass is dried and pressurisedto produce pellets with a moisture content of 10%. Thus, the massyield is determined by the dryer efficiency. The thermal efficiencyis calculated as around 94%,16 while the net efficiency is around87% when the utility fuel is included [39].
3.3.5. Economic evaluation
A 24,000 tonpellet/yr pelletisation process cost data [39] areused as reference data.17 In addition, the cost data obtained from[5] are normalised so that a comparison can be made. The totalinvestment cost of a 24,000 tonpellet/yr plant is calculated to be inthe range of 2 Mh18–2.6 Mh.19 In another study, the investmentcost of a 80,000 tonpellet/yr plant is given as 5.9 Mh20 [16]. Thus,the normalised specific investment cost is in the range of0.15–0.25 Mh/MWth(input).
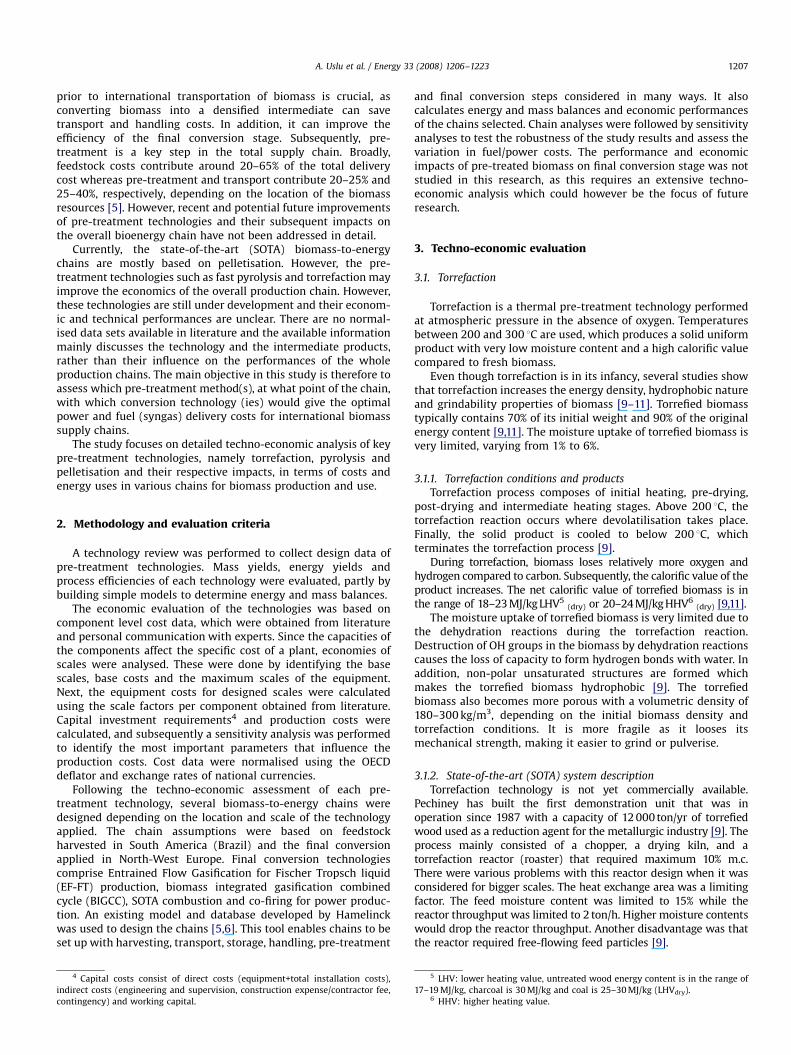
3.4. Techno-economic comparison of the processes
Technical and economic comparison of the pre-treatmenttechnologies are presented in Tables 2 and 3.
3.5. Sensitivity analyses and economy of scale for pre-treatment
technologies
The key parameters that affect the performance of torrefaction,pyrolysis and pelletisation were analysed by means of sensitivityanalysis. Table 4 shows the parameters and the ranges theseparameters may vary.
16 The moisture content of the fresh biomass is assumed to be around 35% and
the LHV(dry) as 16.5 MJ/kg. The moisture content of the pellet is around 10%.17 The assumptions are: 6 ton/h fresh biomass with 55% w.b, LHVar is 6.2 GJ/
ton. The biomass leaves the dryer has got 15% m.c.18 This is the total investment cost mentioned in reference [39].19 The cost data for dryer, hammer mill and pellet press are collected from
reference [5] and normalised for the 6 ton/h fresh biomass input data. Besides,
storage peripheral equipment and general investments which includes mainly
construction costs are calculated as the percentages of the total main equipment
costs. These percentages are obtained from reference [39].20 This value was calculated for greenwood, when sawdust is considered, the
cost data is given as 3.9 Mh [16].
The production costs of the three technologies are influencedstrongly by biomass costs, investment costs, load factor and thelife time. Torrefaction and pyrolysis production costs are moresensitive to the capital investment costs than pellet production(Figs. 5–10). Increasing the capital investment cost 40% increasesthe torrefied biomass production cost and bio-oil cost around 12%,while it increases pellet production cost 8%.
Another important factor that needs further consideration isthe scale effect. Economies of scale have a considerable influenceon the production costs. The torrefaction and pyrolysis processesare capital-intensive; hence investment costs are key to theestablishment of production costs. In Fig. 8, the economy of scaleon capital investment costs are displayed. After 40 MWth input,the specific investment cost do not decrease any longer. Incontrast, when the capacity is smaller than 40 MWth, productioncosts will increase.
For the pyrolysis process, smaller scales are more favourable.As shown in Fig. 9, capacities larger than 20–25 MWth input do notbenefit significantly from economies of scale.
3.6. Final conversion
Biomass is eventually considered for production of electricityand transportation fuels. In this study, state-of-the-art ‘SOTA’combustion, co-firing, BIGCC and FT technologies are consideredas the final conversion steps.
3.6.1. Impact of pre-treated biomass on gasification systems
Torrefied biomass has several advantages; prior to gasification,electricity consumption for milling decreases significantly. Thefibrous structure and the tenancy of biomass are reduced byhemicellulose decomposition together with the depolymerista-tion of cellulose during the torrefaction reaction. The powerconsumption in size reduction is decreased 85% when the biomassis first torrefied. The energy consumption required for millingbiomass into 100 mm decreases from 0.08 kWe/kWth(dry) to0.01–0.02 kWe/kWth when torrefaction is applied [42]. Moreoverthe capacity of the mill increases in proportion to the particle size.When the 0.2 mm particle size is considered, the chipper capacityfor torrefied willow is up to 6.5 times the capacity of untreatedwillow [42]. For both torrefied pellets and conventional pellets,drying is not needed.
In the case of bio-oil, the pre-treatment section needs to beadjusted depending on the bio-oil characteristics. Sizing is notnecessary anymore and the feeding system can be similar to theliquid fuel feeding systems for CFB gasification instead of thosethat are suitable for solid fuel feeding.
3.6.2. Impacts of pre-treated biomass on combustion
Combustion reactivity of the torrefied biomass has beenevaluated21 [9]. The carbon conversion of woodcuttings wasmeasured as 96.1%, while torrefied woodcutting was measured as96.6%, low volatile coal as 64% and high volatile coal as 81%. It wasobserved that the carbon conversion of torrefied biomass wascomparable to that of woodcuttings and significantly highercompared to low- or high volatile coal [9].
When bio-oil is combusted, the quality of the bio-oil influencesthe combustion efficiency significantly. The most important para-meters for bio-oil combustion are viscosity, water and particulatescontent, bio-oil raw material, bio-oil age and amount of methanoladdition (up to 10% wet) [43]. Methanol addition homogenises poor
21 The LCS experiments were done under typical combustion conditions in
coal fired boiler, conversion measurements were obtained after 1000 ms residence
time. Results were w.t, ash free.
ARTICLE IN PRESS
Table 2Technical comparison of torrefaction, TOP, pyrolysis and pelletisation processes
Unit Torrefaction TOP process Pyrolysis Pelletisation
Feedstock type Woodcuttings chips Green wood chips Clean wood wastea Green wood chips
Moisture content (m.c.) wt% 50% 57% – 57%
LHV a.r MJ/kg 6.2 6.2 6.2 6.2
Product type Torrefied biomass Pellets Bio-oil Pellets
Product m.c. wt% 3 1– 5 20– 30 (�22%) 7– 10
Product LHV—a.r-dry MJ/kg 19.9 (20.4) 19.9– 21.6 (20.4– 22.7) 17 15.8 (17.7)
Mass density (bulk) kg/m3 230 750– 850 1200 500– 650
Energy density (bulk) GJ/m3 4.6 14.9– 18.4 20– 30b 7.8– 10.5
Thermal efficiencyb LHVa.r 96% 92– 97% 66% 92,2%
Net efficiencyc LHVa.r 92%d 90– 95%e 64%f 84%g
a Three millimetre pine wood, sawdust residues from wood waste supplier, poplar, beech, wheat straw, rice husks, beech/oak and several organic waste materials have
been successfully converted to bio-oil.b Thermal efficiency indicates the efficiency where utility use is not included (energy cap. product/energy cap. feedstock).c Net efficiency includes the primary energy use to produce power necessary for components in the plant.d The electrical input to the system is given as 2.61 MWe for 517 kton/yr feedstock input [9].e Utility fuel consumption is measured as 4.7 MWth and electricity consumption as 1.01 MWe for 170 kton/yr feedstock input [9]. When sawdust is used as feedstock, the
efficiency is around 93.7% [9].f Pyrolysis electricity consumption is accepted as 0.0150 MWe/MWth, in reference [40], electricity is assumed to be generated with 40% efficiency.g The utility fuel consumption is measured as 11.3 MWth and electricity consumption as 1.84 MWe for a 170 kton/yr input. When sawdust is used, the net efficiency is
around 88% [16].
Table 3Economic comparison of torrefaction, TOP, pyrolysis and pelletisation processes
Unit Torrefaction TOP process Pyrolysis Pelletisation
Normalised capacitya MWth(input) 40 40 40 40
Capital investment Mh 6.5 7.8b 6.2– 15.9c 6.2d
Specific investment Mh/MWth(input) 0.16 0.20 1.16– 0.40 0.15
O&M % 5 5 4e 5
Energy—e kWh/toninput 92f 102g 75h 129
Energy—h GJ/ton
Production costsi h/ton 58 45 75–150 41
h/GJ 3.2 2.5 6–12 3.4
a All the base capacities are scaled up to 40 MWth input. This scale is the optimal scale for torrefaction and TOP. For pyrolysis, economy of scale is obtained up to about
40 MWth input [41]. See also the section on economies of scale (Section 3.5).b Greenwood (woodchips) input (37 MWth) TOP process was calculated as 7.4 Mh [16].c The cost data was calculated in the range of 4.5–11.5 Mh for the 25 MWth input capacity pyrolysis plant.d For a 37 MWth input investment cost is given as 5.9 Mh (for woodchips). This figure is scaled up to 40 MWth.e Data is obtained from reference [5].f The energy consumption of a moving bed torrefaction process is given as 92 kWh [16].g Data include drying, torrefaction, size reduction and densification; steam for drying is obtained from the torrefaction gas.h Electricity consumption is accepted as 0.0150 MWe/MWth input [40].i Assumptions for TOP and torrefaction, 8000 h load factor, 10-year depreciation [40] for pyrolysis 7500 h/yr load factor, 15-year depreciation [30] and for pelletisation
7884 h/yr load factor [16]. Feedstock cost is excluded in the production calculations to see the influence of the capital investments on production.
Table 4Main parameters used and ranges for sensitivity analysis
Parametersa Torrefied biomass Bio-oil Pellet
Value Range Value Range Value Range
Biomass costs (h/tondry) 30 0– 50 30 0– 50 30 0– 50
Capital costs (Mh) 25 12– 30 6.5 4.5– 7.8 2.03 1.6– 2.4
Discount rate (%) 12.5 5– 17.5 12.5 5– 17.5 12.5 5– 17.5
Load factor (h/yr) 7500 6750– 8000 7500 6750– 8000 7500 6750– 8000
Depreciation period (years) 10 5– 20 10 5– 20 10 5– 20
a The values and the ranges are based on literature studies mentioned in technology section.
A. Uslu et al. / Energy 33 (2008) 1206–12231212
quality oil and decreases particulate emissions. The high viscosity ofthe bio-oil can cause blockages of the burner pipe and the highwater content of bio-oil makes it difficult to ignite [30]. Therefore,the bio-oil needs to be pre-treated before it is combusted. Different
than a regular biomass pre-treatment section, which is mainlybiomass sizing; the bio-oil pre-treatment step consists of filteringthe oil to a maximum particle size of 40mm and pre-heating the bio-oil to roughly 60 1C, depending on the bio-oil quality [30]. Another

ARTICLE IN PRESS
Sensitivity analysis of torref. biomass production
45
55
65
75
85
1
Variables
Prod
uctio
n co
st (
Eur
o/to
n)
Biomass costCapital costInterest rateLoad factorDepr. period
2 3 4 5 6
Fig. 5. Torrefied biomass production sensitivity.
Sensitivity analysis of bio-oil production costs
4
6
8
10
12
14
1Variables
Bio
-oil
prod
uctio
n co
st (
Eur
o/G
J)
Biomass costCapital costInterest rateLoad factorDepreciation
2 3 4 5 6
Fig. 6. Bio-oil production costs sensitivity.
Sensitivity analysis of pelletisation
40
60
80
100
120
1
Variables
Pelle
t pro
duct
ion
cost
(E
uro/
ton)
2 3 4 5 6
Biomass costCap. invest. costInterest rateLoad factorDepcreciation period
Fig. 7. Pellet production sensitivity analysis.
Torrefaction economy of scale
0
10
20
30
40
50
60
0
MWth
Spec
ific
Inv
estm
ent C
osts
(E
uro/
ton)
50 100 150 200
Fig. 8. Scale effect on torrefied investment costs.
Pyrolysis economy of scale
0
50
100
150
200
250
300
0
MWth
Spe
cifi
c pr
oduc
tion
cos
t (E
uro/
ton)
20 40 60 80
Fig. 9. Scale effect on bio-oil production costs.
40
50
60
70
80
0
MWth
Spec
ific
pro
duct
ion
cost
(E
uro/
ton)
Pelletisation economy of scale
10 20 30 40 50 60
Fig. 10. Scale effect on pellet production costs (local transportation is not included
in the production cost calculations. Biomass feedstock is assumed to be 30 h/ton
and a 0, 7 scale factor is used).
A. Uslu et al. / Energy 33 (2008) 1206–1223 1213
experimental study has shown that some important modificationsin the injection system of the gas turbine need to be done due to thehigh viscosity of bio-oil [44]. Since the related cost data for filteringand pre-heating bio-oil could not be obtained, the influence oncombustion cost data cannot be determined.
The cost data used in this study is presented in Table 5.
4. Chain analysis
4.1. Approach and methodology
There are several factors influencing the overall production costswhen international bio-energy trade is considered. The location of

ARTICLE IN PRESS
Table 5Final conversion cost figures to be used for TOP, pellet and pyrolysis oila
Unit BIGCCb FB-combustionc Co-firingd EF gasificatione
Base scale MWth 105 200 100 1000
Maximum scale MWth 408 200 100 –
R factor 0.61 0.77 0.7 0.7
Efficiency % 57 35 40 71%
Life time Year 25 25 10 25
Total capital req. Mh 90 124 16.7 83–134
Spec. capital req. Mh/MWth(input) 0.86 0.62 0.16 0.083–0.134
O&M % 4 4 0 6–8
a Data mentioned do not include the possible impacts of pre-treated biomass on those technologies.b [45].c [46].d Extra (non-fuel) costs for coal load are mentioned as 13.7 h/MWhLHV for pellets and 6.3 h/MWhLHV for pyrolysis oil. This cost is accepted as capital cost and O&M
accepted as 0. The depreciation is done for 10 years [5].e EF gasifier investment (including fuel feeding and syngas cooler) is estimated to be from about 41 to 75h/kWth with pyrolysis oil as feed, the lower end of the range
being for large-scale plants (1000 MWth) while the higher cost corresponds to capacities around 300 MWth. In this study, 41 h/kWth is applied for pyrolysis oil and 45 h/kWh
for pellets. Figures include syngas conditioning (syngas cleaning, water gas shifting and CO2 removal) [40].
A. Uslu et al. / Energy 33 (2008) 1206–12231214
the pre-treatment process is one important factor since it influencesthe scale of the subsequent processes which are capital-intensive.Moreover it influences the further transportation and storageoptions. In this study, five transfer points were considered, namely:local biomass production site, central gathering point, export andimport terminals and a final conversion unit. As mentionedpreviously various chains have been designed using a tooldeveloped by Hamelinck et al. [5]. This tool enables to calculateenergy and mass balance, and economic performance of the chains(Table 6).
4.2. Logistic operations
Latin American22 energy crops are chosen as the biomasssource since Latin America offers high yield of biomass with lowproduction costs [5]. The crop characteristics applied in the chainanalysis are presented in Table 7.
Harvesting is assumed to be done by harvest bundlers. Furtherin the chain, biomass is cut to the desired feedstock particle sizedepending on the pre-treatment process type. From bundles(3000 mm) to chips (30 mm), roll crushers are employed and forsmaller sizes (2 mm for pyrolysis and 3–10 mm for pellets)hammer mills are considered. Biomass is dried up to 15% moisturecontent for torrefaction and pelletisation and to 7% for pyrolysisprocess. Following the pre-treatment, product is stored either insilos or special lined carbon steel tanks depending on its form.
4.3. Biomass transportation
Transport distance is determined depending on the pre-treatment process capacity, the percentage of the land occupiedwith crops and the biomass yield. Pre-treatment plants areassumed to be located at the centre of the farming areas. In thisstudy, 20% of land under energy cropping and 22.4 tondry/ha yryield is accepted.23 The first truck transport distance24 is
22 Latin American electricity price is considered as 35h/MWhe and labour
price as 6 h/man-h [47], while for Western Europe electricity price is considered as
60 h/MWhe [5] and labour price as 25h/man-h (average salary in Western Europe
is in the range of 14–40 h/man-h [5,19]).23 Yield for Latin American energy crops are in the range of 22.4–28 tondry/
ha yr (short–long term) at a harvest rotation of 6 year and 60% m.c. m.c. decrease to
20% after 4 weeks drying in the field [5]. Bulk density of stacked eucalyptus stems
is 0.28 ton dry/m3 bulk (0.47 m3 solid/m3 bulk and 0.59 ton dry/m3 solid) [48].24 The transport distance is calculated as: R ¼ O(P/(2�p�Y�C)) where P is
plant capacity (tons/year), Y is crop yield (tons/km2) and C is % of total area covered
by energy crops.
calculated as the radius of the circle (Fig. 11) [45,46]. A genericdistance (100 km) to the harbour is assumed in this study, sincethe biomass production stage including the possible locations isnot considered within the scope of this work. However, this issueis considered in the sensitivity analysis.
Table 8 illustrates the average transportation distances fromharvested area to the transfer point in relation to the capacity ofpre-treatment unit. Following the pre-treatment step intermedi-ate biomass is transported by trucks to the harbour. Shipmentdistance from Latin America to West Europe is assumed as11.500 km. Suezmax tanker (125,000 ton) is considered for bio-oilshipment and Suezmax bulk carrier or tank is employed forpellets. Cost figures and energy use data for truck transport andshipment are derived from references [5].
4.4. Designed chains
Fig. 12 outlines the chains that are modelled in this study. Inthe local processing steps, smaller pre-treatment units areassumed whereas in the central gathering points relatively largerpre-treatment options (150 MWth) are considered. The mentionedpre-treatment processes include sizing and drying. Therefore,these options are not renamed in the designed chains. The firstand the second chain show the transport cost differences betweentorrefied biomass and torrefied+pelletised (TOP) biomass. The lastchain is considered as the reference scenario.
4.5. Results
4.5.1. Energy use of chains delivering solid energy carrier
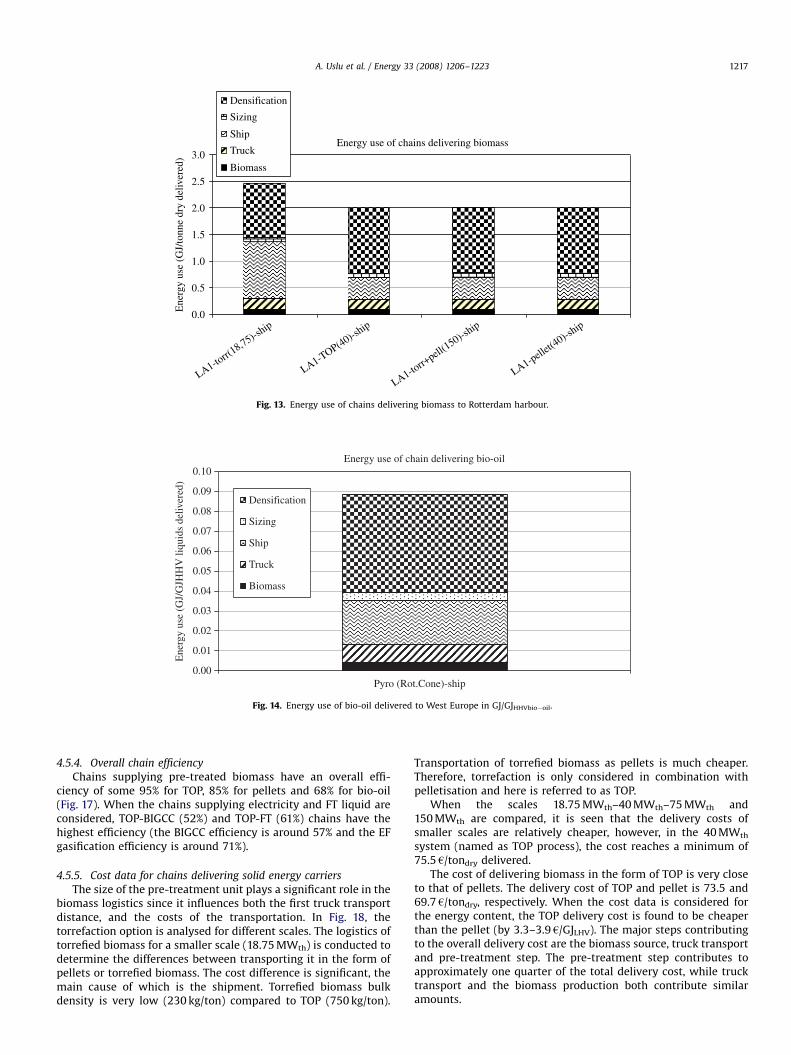
Fig. 13 shows the primary energy use of the chains deliveringbiomass. Energy use ranges from 1.98 GJ/tondm (for TOP processhaving a relatively small scale) to 2.46 GJ/tondm (for torrefiedbiomass without pelletisation). This difference occurs due to theenergy used during shipment. Total energy use of the ship isassumed to be 4516 MJ/km [5]. Since the ship is filled volume-trically before it is filled down to its load mark by weight, due tothe low density of torrefied wood high energy use occurs. Theprimary energy use for TOP delivery is approximately 8.5% of thedelivered LHV. Only torrefied and delivered biomass requires 12%of the delivered LHV. Reference case primary energy requirementfor energy is 11% of delivered.
4.5.2. Energy use of chain delivering liquid
The energy use of bio-oil delivery to West Europeis approximately 0.09 GJprimary/GJHHV (Fig. 14). The energy

ARTICLE IN PRESS
Table 6Bio-energy chain operation steps, options and variables included in the chains model [5]
aOperation window (OW) is defined by the annual period that the equipment is available/used for processing.bLoad factor is defined as the percentage of the time the equipment can be used within the operation window [6].
Table 7Crop characteristics (ranges indicate short and long term) [5,6]
Type Logs
Position Roadside
Biomass cost
(h/tonw.b) 10.2– 16.8
(h/GJ) 1– 1.8
Energy fuel (MJHHV/ton) 49– 60
Yield (tondry/ha yr) 22.4– 28
Density (kg/m3bulk) 324
HV (GJHHV/tondry) 19.4
Dm loss/month 0.5%
Supply Whole year
w.b: wet bases; Dm: dry matter; Avg ps: average particle size; HV: heating value.
Transfer point (Pre-treatment)
Biomass collectionarea
Harbour
Truck Ship
Fig. 11. Schematic presentation of transportation distances.
A. Uslu et al. / Energy 33 (2008) 1206–1223 1215

ARTICLE IN PRESS
Table 8Logistics of biomass from harvesting to the pre-treatment process point
Pre-treatment capacity MWth input 19 41 77 41 41 41
Biomass LHVdry (MJ/kg) 17.7 17.7 17.7 17.7 17.7 17.7
Fuel input plant (ktonwet/yr) 47.9 102.2 191.6 102.2 102.2 102.2
Moister content (%) 35 35 35 35 35 35
Fuel input plant (ktondry/yr) 31.1 66.4 124.5 66.4 66.4 66.4
Yield (tondry/ha yr) 22.4 22.4 22.4 22.4 22.4 22.4
Number of ha energy crops 1390 2965 5559 2965 2965 2965
Land available for energy farming 0.2 0.2 0.2 0.1 0.3 0.5
Number of square km energy crops 69.5 148.2 277.9 296.5 98.8 59.3
Average distance to transfer point (km, one way) 3 5 7 7 4 3
Storage Storage Storage Storage
Open air pile (bales) Open air pile (bales) Open air pile (bales) Open air pile (bales)
Chipper
Chipper
Chipper
HammermillHammermillTorrefaction
Pelletisation
Pelletisation
Storage (Silo) Storage (Tank) Hammermill
Pyrolysis
Storage (Silo) Storage (Tank)
Combustion
truck transp.
truck transp. truck transp. truck transp. truck transp. truck transp. truck transp.
truck transp. truck transp. truck transp. truck transp. truck transp.
ship transport
Import Harbour
truck transp.
Storage
cent
ral
Harvesting (felling)
Chipper
Chipper
Base Case Scenario
Storage
Open air pile (bales)
Final conversion
BIGCC
Co-firing
StorageOpen air pile(bales)
Export Harbour
EF-Fischer Tropsch
loca
l
loca
l
Chipper
Torrefaction
Storage (Silo)
cent
ral
Storage (silo/tank)
Preparation
PelletisationPyrolysis
Torrefaction
Fig. 12. Modelled bio-energy chains from Latin America to West Europe.
A. Uslu et al. / Energy 33 (2008) 1206–12231216
is mainly required in the pre-treatment and transportationstep.
On the other hand, FT fuel chains consume on average0.26 GJprimary/GJHHV for TOP, whereas it consumes around0.16 GJprimary/GJHHV for bio-oil chains and 0.17 GJprimary/GJHHV forpellet chains (Fig. 15).
4.5.3. Energy use of chains delivering electricity
The energy requirement for the chains that produce electricity isin the range of 0.15–0.25 GJprimary/GJHHV (Fig. 16). The main stepsthat use primary energy are the energy requirement for densifica-tion and fuel consumption stages. Approximately 40% of the energyuse is due to the pre-treatment (mentioned as densification) step.
ARTICLE IN PRESS
Energy use of chains delivering biomass
0.0
0.5
1.0
1.5
2.0
2.5
3.0
LA1-torr(
18,75)-ship
Ene
rgy
use
(GJ/
tonn
e dr
y de
liver
ed)
Densification
Sizing
Ship
Truck
Biomass
LA1-TOP(40)-ship
LA1-torr+
pell(150)-s
hip
LA1-pellet(
40)-ship
Fig. 13. Energy use of chains delivering biomass to Rotterdam harbour.
Energy use of chain delivering bio-oil
0.00
0.01
0.02
0.03
0.04
0.05
0.06
0.07
0.08
0.09
0.10
Pyro (Rot.Cone)-ship
Ene
rgy
use
(GJ/
GJH
HV
liqu
ids
deliv
ered
)
Densification
Sizing
Ship
Truck
Biomass
Fig. 14. Energy use of bio-oil delivered to West Europe in GJ/GJHHVbio�oil.
A. Uslu et al. / Energy 33 (2008) 1206–1223 1217
4.5.4. Overall chain efficiency
Chains supplying pre-treated biomass have an overall effi-ciency of some 95% for TOP, 85% for pellets and 68% for bio-oil(Fig. 17). When the chains supplying electricity and FT liquid areconsidered, TOP-BIGCC (52%) and TOP-FT (61%) chains have thehighest efficiency (the BIGCC efficiency is around 57% and the EFgasification efficiency is around 71%).
4.5.5. Cost data for chains delivering solid energy carriers
The size of the pre-treatment unit plays a significant role in thebiomass logistics since it influences both the first truck transportdistance, and the costs of the transportation. In Fig. 18, thetorrefaction option is analysed for different scales. The logistics oftorrefied biomass for a smaller scale (18.75 MWth) is conducted todetermine the differences between transporting it in the form ofpellets or torrefied biomass. The cost difference is significant, themain cause of which is the shipment. Torrefied biomass bulkdensity is very low (230 kg/ton) compared to TOP (750 kg/ton).
Transportation of torrefied biomass as pellets is much cheaper.Therefore, torrefaction is only considered in combination withpelletisation and here is referred to as TOP.
When the scales 18.75 MWth–40 MWth–75 MWth and150 MWth are compared, it is seen that the delivery costs ofsmaller scales are relatively cheaper, however, in the 40 MWth
system (named as TOP process), the cost reaches a minimum of75.5 h/tondry delivered.
The cost of delivering biomass in the form of TOP is very closeto that of pellets. The delivery cost of TOP and pellet is 73.5 and69.7 h/tondry, respectively. When the cost data is considered forthe energy content, the TOP delivery cost is found to be cheaperthan the pellet (by 3.3–3.9 h/GJLHV). The major steps contributingto the overall delivery cost are the biomass source, truck transportand pre-treatment step. The pre-treatment step contributes toapproximately one quarter of the total delivery cost, while trucktransport and the biomass production both contribute similaramounts.

ARTICLE IN PRESS
Energy use of chains delivering FT-liquids
0.00
0.05
0.10
0.15
0.20
0.25
0.30
LA1-TOP-ship-FT(EF)
Ene
rgy
use
(GJ/
GJH
HV
liqu
ids
deliv
ered
Conversion
Sizing
Ship
Truck
Biomass
*Conversion includes pre-treatment + EF-FT
LA1-Pellet-ship-FT(EF) LA1-pyro-ship-FT(EF)
Fig. 15. Energy use of the chains delivering FT liquid.
Energy use of chains delivering electricity
0
0.05
0.1
0.15
0.2
0.25
0.3
LA1-TOP-BIGCC
LA1-pellet-BIGCC
LA1-TOP-co-firing
LA1-pellet-co-firing
LA1-pyro-co-firing
LA1-TOP-com.
LA1-pellet-comb
Ene
rgy
use
(GJ/
GJ
pow
er d
eliv
ered
)
De
SizingDesnificationShipTruckBiomass
Fig. 16. Primary energy uses for chains delivering electricity.
A. Uslu et al. / Energy 33 (2008) 1206–12231218
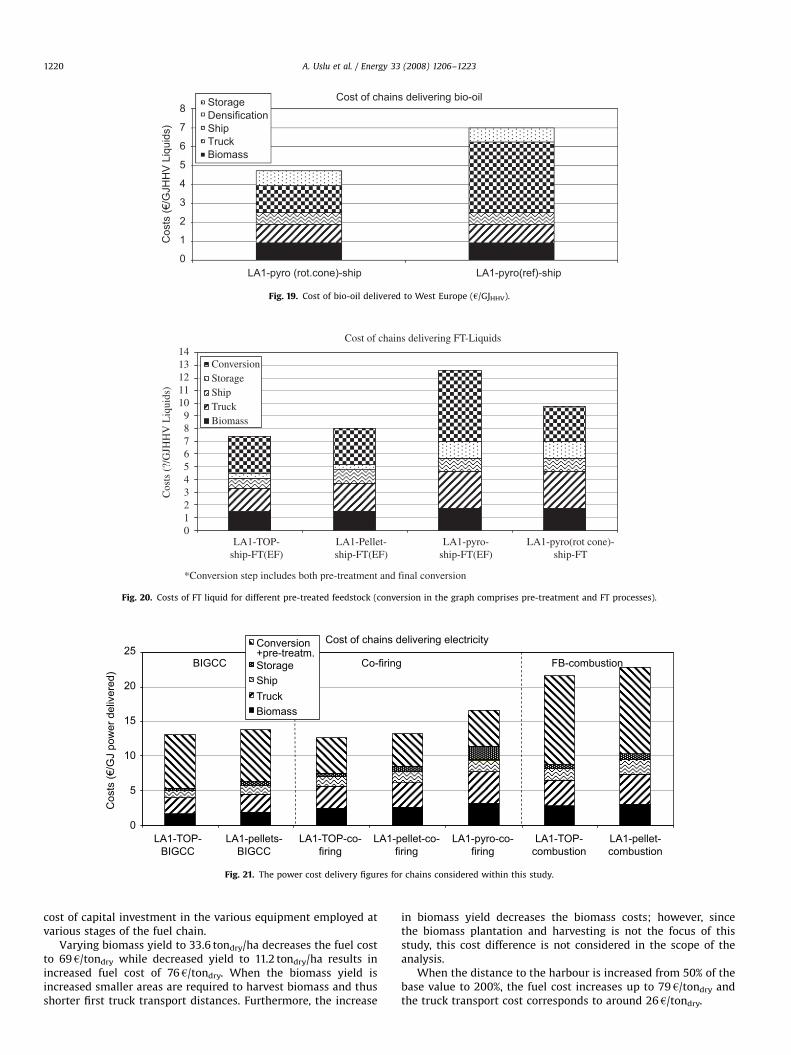
4.5.6. Cost data for chains delivering liquid energy carriers
A capacity rotating cone technology (25 MWth) and a referencetechnology with the same scale are analysed. Cost figures forreference technology are based on literature data whereas costfigure for rotating cone technology is based on reference [29].Fig. 19 illustrates that significant cost differences occur even forsame scale of pyrolysis processes. This is one of the drawbacks ofthis technology.
The delivery cost of bio-oil ranges between 4.7 and 7 h/GJHHV
when the investment costs are calculated based on rotating conetechnology and the reference technology described in thepyrolysis sub-section. Pre-treatment accounts for approximately30–50% of the total cost of bio-oil delivery.
In contrast, when FT liquid production is considered, theconversion to FT liquid stage is assumed to be applied in WestEurope with a large scale (1000 MWth) since FT liquid productionis more cost effective at larger scales [5,40,49]. The FT liquid costsaround 7.4 h/GJHHV for TOP whereas it costs in the range of9.8–12.6 h/GJHHV for bio-oil (see Fig. 20). The cost of liquidproduction in the reference case (pelletisation) is 7.9 h/GJHHV.
4.5.7. Cost data for chains producing electricity
Electricity is assumed to be produced either by BIGCC, FBcombustor-steam turbine or by co-firing in a PC boiler. The electricitycosts for TOP and pellet chain are 13.05h/GJ (4.6hcent/kWhe) and15.24h/GJ (5.5hcent/KWhe), respectively, when the BIGCC option isconsidered. The conversion step contributes to approximately 50% ofthe total power cost while the second major contributor istransportation (�25%). The storage costs following the TOP processhave not been considered. As torrefied biomass is hydrophobic innature, it may be stored in the open air and not in silos.
When FB-combustion is used, cost of chains delivering electricityare: 21.64h/GJ (7.7hcent/kWhe) for the TOP chain, and 22.84h/GJ(8.2hcent/kWhe) for the reference chain. Similarly as for theelectricity production by BIGCC, the costs are mainly influencedby the conversion steps followed by transportation and biomassharvesting steps. It accounts for approximately 60% of the total cost.On the other hand, electricity costs are 12.2h/GJ (4.4hcent/kWhe)and 16.2h/GJ (5.8hcent/kWhe) for the TOP chain and pyrolysischain, respectively, when co-firing is applied. Approximately 10–15%of wood pellets can be co-fired by mass [5] and the costs associated

ARTICLE IN PRESS
Cost of chains delivering pellets
0
20
40
60
80
100
120
LA1-torr(1
8,75)-ship
LA1-TOP(40)-ship
Cos
ts (€
/tonn
e dr
y de
liver
ed)
PelletisationTorrefaction+pelletisationTorrefaction
LA1-torr+
pellet(18,75)-
ship
LA1-torr+
pell(75)-s
hip
LA1-torr+
pell(150)-s
hip
LA1-pellet(40)-s
hip
StorageDensification
SizingShipTruckBiomass
(pre-treatment)
Fig. 18. Cost data of chains delivering pellets in h/tondry delivered.
Energy efficiencies
0
10
20
30
40
50
60
70
80
90
100
TOP-ship
Pellet-
ship
Pyro-
ship
TOP
Pellets TOP
Pellet
Pyro
TOPPell
etTOP
Pellet
Pyro
(%)
Co-firingBIGCC Comb. FT-liq.(EF)
Fig. 17. Overall energy efficiencies.
A. Uslu et al. / Energy 33 (2008) 1206–1223 1219
with feedstock handling account for 6.3h/MWhLHV for bio-oil and13.7h/MWhLHV for pellets [5] (Fig. 21).
As seen, the chains including TOP process with BIGCC andEF-FT liquid production are identified as the optimal chains.BIGCC efficiency is much higher (56%) compared to combustion(35%) and co-firing (40%) and it gains from bigger scales(105–408 MWth), whereas EF gasification efficiency is 71% at a1000 MWth capacity.
4.6. Sensitivity analysis
The biomass supply chains analysed in this work are highlydependent on the plantation yield, interest rate, load factor and
the plantation distance to the harbour. Therefore, they requirefurther evaluation. The base values presented in Table 9 areanalysed within the range of 50–250% and the results areillustrated in Fig. 22.
The most significant factor in terms of fuel cost is the operationwindow. Reducing OW from 12 months to 6 months increases theTOP production cost from 60 to 80h/ton. The cost changes mainlydepend on the storage and operational costs. In fact, the number ofstorage units increases significantly when the biomass is harvestedfor a shorter period of time. The operation cost increases becausethe equipment is not fully utilised throughout the year. The storagecontributes about 6.75h/tondry for a 6 months OW.
When the interest rate is increased from 5% to 20%, the fuelcost increased from 64 to 86 h/ton. This is directly related to the
ARTICLE IN PRESS
Cost of chains delivering bio-oil
0
1
2
3
4
5
6
7
8
LA1-pyro(ref)-shipLA1-pyro (rot.cone)-ship
Cos
ts (€
/GJH
HV
Liq
uids
)
StorageDensificationShipTruckBiomass
Fig. 19. Cost of bio-oil delivered to West Europe (h/GJHHV).
Cost of chains delivering FT-Liquids
0123456789
1011121314
LA1-TOP-ship-FT(EF)
Cos
ts (
?/G
JHH
V L
iqui
ds)
*Conversion step includes both pre-treatment and final conversion
LA1-Pellet-ship-FT(EF)
LA1-pyro-ship-FT(EF)
LA1-pyro(rot cone)-ship-FT
ConversionStorageShipTruckBiomass
Fig. 20. Costs of FT liquid for different pre-treated feedstock (conversion in the graph comprises pre-treatment and FT processes).
Cost of chains delivering electricity
0
5
10
15
20
25
LA1-TOP-BIGCC
LA1-TOP-co-firing
LA1-pellet-co-firing
LA1-pyro-co-firing
LA1-TOP-combustion
LA1-pellet-combustion
Cos
ts (€
/GJ
pow
er d
eliv
ered
)
BIGCC Co-firing FB-combustion.
LA1-pellets-BIGCC
Conversion
StorageShipTruckBiomass
+pre-treatm.
Fig. 21. The power cost delivery figures for chains considered within this study.
A. Uslu et al. / Energy 33 (2008) 1206–12231220
cost of capital investment in the various equipment employed atvarious stages of the fuel chain.
Varying biomass yield to 33.6 tondry/ha decreases the fuel costto 69h/tondry while decreased yield to 11.2 tondry/ha results inincreased fuel cost of 76 h/tondry. When the biomass yield isincreased smaller areas are required to harvest biomass and thusshorter first truck transport distances. Furthermore, the increase
in biomass yield decreases the biomass costs; however, sincethe biomass plantation and harvesting is not the focus of thisstudy, this cost difference is not considered in the scope of theanalysis.
When the distance to the harbour is increased from 50% of thebase value to 200%, the fuel cost increases up to 79 h/tondry andthe truck transport cost corresponds to around 26h/tondry.

ARTICLE IN PRESS
A. Uslu et al. / Energy 33 (2008) 1206–1223 1221
In conclusion, changing the operation period from 6 months to12 months decreases the TOP delivery cost 25%, while variation ofinterest rates from 5% to 20% results in fuel cost changes of about33%. Similarly, changing the biomass yield from 50% to 150% of thebase value results in a fuel cost change of about 11%. When thetransportation distance is considered, increasing the truckdistance from 50% to 200% of base values increases the fuel costsby around 20%.
5. Discussion and conclusion
The main objective of this study was to identify the optimumbiomass-to-energy chains by analysing the pre-treatment tech-nologies (torrefaction, pyrolysis and pelletisation) each of whichdiffer significantly in terms of their impacts on transportation,storage and conversion. The potential and future technical andeconomic performance of these technologies was analysed. Theinfluences of intermediate products (pre-treated biomass) ontransportation cost and energy use were evaluated. The impacts of
Table 10Techno-economic comparison of torrefaction, TOP, pelletisation and pyrolysis
Unit Torrefaction
Process efficiencya % 92
Energy content (LHVdry) MJ/kg 20.4
Mass density kg/m3 230
Energy density GJ/m3 4.6
Specific capital investments Mh/MWth 0.17
Production costs h/ton 58
a This is the overall efficiency of the technology which includes utility fuels
Sensitivity analysis-TOP delivery
50
60
70
80
90
50%
Parameter variation
TO
P de
liver
y co
st (
€/to
n-dr
y
OW
Ir
Yield
Tran.
100% 150% 200%
Fig. 22. Sensitivity analysis for TOP process (OW: harvest operation period).
Table 9Parameter used for sensitivity analysis
Parameters Base value
Interest rate (%) 10
Yield (tondry/ha yr) 22.4
Harvest operation period (OW) (months) 8
Distance (km) 100
intermediate products on the performance of power and syngasconversion technologies require an extensive analysis, which wasnot the scope of this research. However, those impacts can havesignificant impacts not only on costs but also performances of thefinal conversion technologies.
5.1. Pre-treatment technologies
Torrefaction, pyrolysis and pelletisation were evaluated interms of their technical and economic performances. Results aresummarised in Table 11.
Table 10 illustrates that torrefaction, TOP and pelletisationprocess efficiencies were found to be high compared to pyrolysistechnology. The energy density of TOP pellets is approximately1.75 times higher than conventional pellets and 3 times higherthan torrefied biomass.
When the specific capital investment of pyrolysis technology isconsidered, there is a significant variation between the costfigures found in scientific literature. This variation could due tothe range of technologies reported. However, cost data for specificprocess designs in literature varies widely. Therefore, in this study,two scenarios were considered, one assuming low and oneassuming relatively high capital costs. The resulting bio-oilproduction cost estimates are in the range of 6–12 h/GJHHV
(feedstock cost is accepted as 0) in the Western Europe conditions.Economy of scale plays a significant role in the pre-treatment
costs. This study shows that torrefaction plant capacity exceeding40 MWth does not gain from an economy of scale. A similarconclusion can be drawn for the pelletisation process,35–40 MWth does not result in further gains from the economiesof scale.
Consequently, this study indicates that torrefaction in combi-nation with a pelletisation process is more advantageous thanpelletisation. Pyrolysis, as an alternative, has drawbacks in termsof process efficiency and economy when compared to the othertechnologies. However, this performance should be evaluated aspart of the overall bioenergy supply and conversion chainsconsidered.
5.2. Chain analysis
Energy crops (eucalyptus) produced in Latin America areconsidered to be imported to the Netherlands. In order toinvestigate the optimal location for the pre-treatment processes,different scales were applied in the chains. These chains werethen compared. Biomass supply chain elements for TOP biomass,pellets and bio-oil included harvesting, storage, pre-treatment,transportation and final conversion stages. The final energyconversions considered were FT fuels, and power production bymeans of BIGCC, combustion and co-firing. The pre-treatmenttechnologies were assumed to operate with a high load factor,which however sets high organisational requirements for the
TOP Pelletisation Pyrolysis
90.8 84– 87 66– 70
20.4– 22.7 17.7 17
750– 850 1200 500– 650
14.9– 18.4 7.8– 10.5 20– 30
0.19 0.15 0.19– 0.42
50 54 75– 104

ARTICLE IN PRESS
Table 11Costs of chains delivering fuel and power
Intermediate delivered to
harbour (h/GJHHV)
FT-liquid fuel
(h/GJHHV)
Power (BIGCC)
(h/kWh)
Power (combustion)
(h/kWh)
Power (co-firing)
(h/kWh)
TOP 3.3 7.4 4.6 7.7 4.6
Pellet 3.9 7.9 5.5 8.2 4.8
F. pyrolysis 4.7– 7.0 9.8– 12.6 5.9
A. Uslu et al. / Energy 33 (2008) 1206–12231222
biomass supplies. In addition, the bioenergy supply chain costsare very sensitive to the harvest operation period. In this study, 8months harvesting is considered. Shorter harvesting periods resultin increased biomass production costs.
The calculation results are summarised in Table 11.TOP pellets can be delivered at costs as low as 73.5 h/ton
(3.3 h/GJ) with a biomass cost of 10 h/ton. One of the reasons forthe relatively low delivery cost is the approximately 15% higherbulk density compared to conventional pellets, which lowers boththe road and sea transport costs. Another reason is the plant scaleapplied. As mentioned previously, with a 40 MWth plant scale itwas possible to obtain lower production costs. When TOP isconsidered for smaller scales such as 18.75 MWth, the deliverycost increased by 16%. On the other hand, when the base scale isincreased around 80%, the delivery cost increases by 10% becauseof longer first truck transport distances.
Pyrolysis oil delivery costs were found to be in the range of4.7–7 h/GJ, depending on the scenarios mentioned above. Thisstudy shows that it is possible to deliver 80% of the initial amountof biomass to Rotterdam harbour by means of TOP pellets,whereas it is 70% for pellets and 50% for pyrolysis oil. The chainefficiency in this study is defined as the ratio of the biomassdelivered to the total of biomass and primary energy input inevery step of the chain. These efficiencies are highly influenced bythe pre-treatment process efficiencies and the dry matter lossesduring transport.
FT fuel production cost can be as low as 7.4 h/GJHHV, when thefinal conversion takes place at large centralised facility. The EFgasifier assumed here had a 1000 MWth capacity. When pyrolysisoil is converted into FT liquids, the production cost is in the rangeof 9.8–12.6 h/GJHHV. The truck transport, the storage and the pre-treatment costs are the major cost factors.
Table 11 indicates that power production costs can be as low as4.6 h/kWh either with a large scale BIGCC facility or with anexisting co-firing plant. BIG/CC benefits from its high efficiency(which is assumed to be 57%), whereas it is 35% for combustionand 40% for co-firing. As described earlier, cost data for co-firingdoes not include the facility capital investment cost but it doesinclude extra costs for pellets and pyrolysis oil handling. Theimplication of this is that when a new facility is considered, thecost of electricity will be higher.
The primary energy required to deliver the fuel to theRotterdam harbour is 8% (of their initial energy content) fordelivered TOP, 10% for pellet and 8–9% for pyrolysis oil (HHV). Thechain efficiency of TOP for electricity generation by BIGCC isaround 55% where as it is around 61% for FT.
Consequently, according to the parameters used in this study:
�
Torrefaction in combination with pelletisation (TOP), in plantswith a scale of 40 MWth, is the optimum supply chain from theeconomic and energy efficiency perspective, � TOP supply converted to the FT-liquid is the optimal synfuelproduction chain and
� TOP supply converted to power either by BIGCC or existing co-firing facility are the optimal chains.
Further conclusion of this study is that pyrolysis, even assumingoptimistic performance and cost cannot compete in energyefficiency terms with the TOP and pelletisation pre-treatmenttechnologies (and also when the total chain from biomassproduction to final conversion is considered).
Since torrefaction has not been demonstrated yet, its perfor-mance is still uncertain and verification is needed. Pelletisationhas already been commercialised and there is further room toimprove the technology. This indicates that pelletisation shouldstill be considered as an important option for the near future.Pyrolysis technology, in contrast needs further improvements thatit can be cheaper.
In conclusion, this study has indicated that intercontinentalbioenergy transport is economically and energetically feasible,when associated pre-treatment stages are considered in the chain.Furthermore, torrefaction in combination with pelletisationappears a very promising technology that of course requiresfurther development and commercialisation. Thus, well-designedsupply chains make international trade of biomass feasible fromthe energy efficiency and economic perspectives. Torrefactionhence seems a very promising option for minimising logistic costsand improving energy use.
References
[1] European Commission. Green Paper, a European strategy for sustainable,competitive and secure energy. COM (2006) 105 final.
[2] Wiesenthal T, Fernandez R, Taylor P, Greenleaf J. Energy and environment inthe European Union. EEA report. Copenhagen, Denmark, 2006. p. 1–56.
[3] Mario R, Toro F, Resch G, Faber T, Haas R, Hoogwijk M, et al. Economic analysisof reaching a 20% share of renewable energy sources in 2020. Final report forthe European Commission, DG Environment (contract no. ENV.C.2/SER/2005/0080r). Fraunhofer ISI, Energy Economics Group/TU Wien, Ecofys, August2006.
[4] IEA, World Energy Outlook 2006. IEA 2006. See also: /http://www.worldenergyoutlook.org/2006.aspS.
[5] Hamelinck CN, Suurs RAA, Faaij APC. Techno-economic analysis of interna-tional bio-energy trade chains. Biomass Bioenergy 2005;29(2):114–34.
[6] Hamelinck CN, Faaij APC. Production of advanced biofuels. Int. Sugar J.2006;108(1287):168–75.
[7] Wasser R, Brown A. Foreign wood fuel supply for power generation in theNetherlands, Netherlands agency for energy and the environment (Novem)/UN FAO, Utrecht, The Netherlands, 1995. 48p.+annexes.
[8] Agterberg AE, Faaij APC. Bio-energy trade: possibilities and constraints onshort and longer term. Report EWAB 9841, Novem, Utrecht, The Netherlands,1998.
[9] Bergman PCA, Boersma AR, Kiel JHA, Zwart RWH. Development of torrefactionfor biomass co-firing in existing coal-fired power stations. BIOCOAL conceptversion, ECN report, 2005.
[10] Bioenergy. A new process for torrefied wood manufacturing. Gen Bioenergy2000;2(4).
[11] Prins MJ. Thermodynamic analysis of biomass gasification and torrefaction.Ph.D. thesis, Eindhoven Technical University, The Netherlands, 2005.
[12] Girard P, Shah N. Developments on torrefied wood—an alternative to charcoalfor reducing deforestation. FAO paper, Centre Technique Forestier Troical,France. See also: /http://www.techtp.com/tw%20papers/fao_paper.htmS;2005.
[13] Lipinsky ES, Arcate JR, Reed TB. Enhanced wood fuels via torrefaction. Fuelchemistry division preprints, 2002.
[14] Reed T, Bryant B. Densified biomass a new form of solid fuel. Solar EnergyResearch Institute, US Department of Energy Division of Solar Technology,1978.
[15] Koukios EG. Progress in thermochemical, solid-state refining of biofuels—
from research to commercialization. Adv Thermochem Biomass Convers2003;2.

ARTICLE IN PRESS
A. Uslu et al. / Energy 33 (2008) 1206–1223 1223
[16] Bergman PCA. Combined torrefaction and pelletisation—the TOP process.ECN report, The Netherlands, July 2005.
[17] Yaman S. Pyrolysis of biomass to produce fuels and chemical feedstock.Turkey: Chemical Engineering Department, Istanbul Technical University;2003.
[18] Bridgwater AV, Evans GD. An assessment of thermochemical conversionsystems for processing biomass and refuse. Aston University & DK Teknik(Denmark), ETSU B/T1/REP, 1993.
[19] Bridgwater AV, Toft AJ, Brammer JG. A techno-economic comparison of powerproduction by biomass fast pyrolysis with gasification and combustion.Renew Sust Energy Rev 2002, Birmingham, UK.
[20] Diebold JP, Bridgwater AV. Overview of fast pyrolysis of biomass for theproduction of liquid fuels, fast pyrolysis of biomass: a handbook. PyNe, UK,1999.
[21] Kaminsky W. Thermal recycling of polymers. J Anal Appl Pyrolysis 1985;8:439–48.
[22] DynaMotive Energy Systems Corporation. BioTherm TM a system forcontinuous quality, fast pyrolysis biooil. In: 4th biomass conference of theAmericans, Oakland, CA, 1999.
[23] Bridgwater AV, Peacocke GVC. Fast pyrolysis processes for biomass. Bio-energy research Group, Aston University, Birmingham, UK. Renew SustEnergy Rev 2000;4:1–73.
[24] Ensyn. See also: /http://www.ensyn.com/info/23102000.htmS; 2005.[25] Bridgwater AV, Bridge S, Grassi G. Review of biomass pyrolysis technologies in
biomass pyrolysis liquids upgrading and utilisation. Commission of theEuropean Communities, Elsevier, 1991. p. 11–92.
[26] Bridgwater AV. An introduction to fast pyrolysis of biomass for fuels andchemicals. Fast pyrolysis of biomass: a handbook. Cpl press, 1999.
[27] Scott DS, Majerski P, Piskorz J, Radlein D. A second look at fast pyrolysis ofbiomass-the RTI process. J Anal Appl Pyrolysis 1999;51:23–37. Waterloo,Canada.
[28] Lappas AA, Samolada MC, Iatridis DK, Voutetakis SS, Vasalos IA. Biomasspyrolysis in a circulating fluid bed reactor for the production of fuels andchemicals. Chemical Process Engineering Research Institute (CPERI) andDepartment of Chemical Engineering, Aristotelian University of Thessaloniki,Greece, 2002.
[29] Wagenaar BM, Prins W, Van Swaay WPM. Pyrolysis of biomass in the rotatingcone reactor: modelling and experimental justification. Chem Eng Sci1994;49:5109–26. The Netherlands.
[30] Gansekoele E, Wagenaar B, Pascual LSE, Van der Aa BJ, Strenziok R.Scaling—up and operation of a flash pyrolysis system for bio-oil productionand application on the basis of rotating cone technology. BTG BiomassTechnology Group BV, The Netherlands, KARA Energy Systems BV, TheNetherlands, Centro de Investigaciones Energeticas, Medioambientas yTecnologicas, Spain, Rostock University, Germany. Contract FAIR-CT97-3203,2000.
[31] AET. Wood pellet manufacture in Scotland—a report produced for ScottishEnterprise Forest Industries Cluster. Issue 1, 2003.
[32] Koppejan J, Meulman PDM. The market for fuel pellet produced from biomassand waste in the Netherlands. EWAB report, The Netherlands, 2001.
[33] Pierik JTG, Curvers APWM. Logistics and pre-treatment of biomass fuels forgasification and combustion. ECN, The Netherlands, 1995.
[34] Stahl M, Granstrom K, Berghel J, Renstrom R. Industrial processes for biomassdrying and their effects on the quality properties of wood pellets. J BiomassBioenergy 2004.
[35] Malisius U, Jauschnegg H, Schmidl H, Nilson B, Rapp S, Strehler A, et al. Woodpellets in Europe-state of the art technologies, activities, market. Industrialnetwork on wood pellets, Thermie B DIS/2043/98-AT, 2000.
[36] Hirsmark J. Densified biomass fuels in Sweden: Country report for the EU/IBDEBIF project. M.Sc. thesis, Swedish University of Agriculture SciencesDepartment of Forest Management and Products, Upsala, Sweden, 2002.
[37] Malisius U, Jauschnegg H, Scmidl H, Nilsson B, Rapp S, Strehler A, et al.Woodpellets in Europe, state of the art technologies, activities, markets.Thermie B DIS/2043/98-AT industrial network on wood pellets, January 2000.
[38] Alakangas E, Paju P. Wood pellets in Finland—technology, economy andmarket. OPET report 5, Jyvaskyla. VTT processes, 2002. 64p.+app.21p.
[39] Thek G, Obernberger I. Wood pellet production costs under Australian and incomparison to Swedish framework conditions. Biomass Bioenergy, V.27, Graz,Austria, 2004. p. 671–93.
[40] Calis HPA, Haan JP, Peppink G, Boerrigter H, Van Der Drift B, Venderbosch RJ,et al. Technical and economic feasibility of large scale synthesis gasproduction in the Netherlands from imported biomass feedstock—a strategicdecision analysis study. Agency for Research in Sustainable Energy, TheNetherlands, 2002.
[41] Solantausta Y. Techno-economic assessment, the Finish case study. COM-BIO—a new competitive liquid biofuel for heating, work package 5, projectno: NNE5-CT-2001-00604, 2001.
[42] Van der Drift A, Boerrigter H, Coda B, Cieplik MK, Hemmes K. Entrained flowgasification of biomass, ash behaviour, feeding issues, system analyses.Energy Research Centre of the Netherlands (ECN), Petten, The Netherlands,April 2004. Report C–04-039. 58p.
[43] Pyne. Bio-oil pyrolysis liquid. See also: /www.pyne.co.uk/?_id=73S; 2006.[44] Juste GL, Monfort JJS. Preliminary test on combustion of wood derived
fast pyrolysis oils in a gas turbine combustor. Biomass Bioenergy2000;19:119–28.
[45] Faaij A, Meuleman B, Van Ree R. Long term perspectives of biomass integratedgasification/combined cycle (BIG/CC) technology; costs and electricityefficiency. The Netherlands: Department of science, technology and society,Utrecht University; 1998.
[46] Dornburg V, Faaij A. Efficiency and economy of wood-fired biomass energysystems in relation to scale regarding heat and power generation usingcombustion and gasification technologies. Biomass Bioenergy 2001;21(2):91–108.
[47] Tokman VE, Martinez D. Labour costs and competitiveness in the Latin Americanmanufacturing sector, 1990–1998. Cepal Rev 1999;69. See also: /http://www.eclac.cl/publicaciones/SecretariaEjecutiva/7/lcg2067I/tokman.pdfS.
[48] Van den Broek R. Sustainability of biomass electricity systems—an assess-ment of costs, macro-economic and environmental impacts in Nicaragua,Ireland and the Netherlands. Ph.D. thesis, Utrecht University, ScienceTechnology and Society, Utrecht, The Netherlands, 2000. 216p.
[49] Batidzirai B, Faaij A, Smeets E. Biomass and bioenergy supply fromMozambique. Energy for Sustainable Development (Special Issue on Emer-ging International Bio-energy markets and opportunities for socio-economicdevelopment) 2006;X(1):54–81.
Copyright © 2022 FDOKUMEN