Impact of torrefaction on the grindability and fuel characteristics of forest biomass
8
Impact of torrefaction on the grindability and fuel characteristics of forest biomass Manunya Phanphanich, Sudhagar Mani ⇑ Biochemical Engineering Program, Faculty of Engineering, Driftmier Engineering Center, University of Georgia, Athens, GA 30602, USA article info Article history: Received 24 May 2010 Received in revised form 6 August 2010 Accepted 9 August 2010 Available online 11 August 2010 Keywords: Torrefaction Wood chips Logging residues Grinding energy consumption Coal abstract Thermal pretreatment or torrefaction of biomass under anoxic condition can produce an energy dense and consistent quality solid biomass fuel for combustion and co-firing applications. This paper investi- gates the fuel characteristics and grindability of pine chips and logging residues torrefied at temperatures ranging from 225 °C to 300 °C and 30 min residence time. Grinding performance of torrefied biomass evaluated by determining energy required for grinding, particle size distribution and average particle size were compared with raw biomass and coal. Specific energy required for grinding of torrefied biomass decreased significantly with increase in torrefaction temperatures. The grinding energy of torrefied bio- mass was reduced to as low as 24 kW h/t at 300 °C torrefaction temperature. The gross calorific value of torrefied chips increased with increase in torrefaction temperature. Torrefaction of biomass clearly showed the improved fuel characteristics and grinding properties closer to coal. Ó 2010 Elsevier Ltd. All rights reserved. 1. Introduction Efficient and economical conversion of renewable biomass into high value fuels and chemicals is a top research and development priority for researchers, scientists and policy makers to enhance the nation’s energy security, to mitigate the impact of global warming and to boost local agriculture and rural economic devel- opment. A recent biomass availability study conducted by The Uni- ted States Department of Agriculture (USDA) and Department of Energy (DOE) has reported that nearly 1.2 10 9 dry Mg of biomass can be produced annually from agricultural and forestry lands for generation of biofuels and power (Perlack, 2005). The Southeast US contributes significantly on the sustainable production of forest biomass and energy crops. Structural heterogeneity, non-uniform physical properties and low energy density of biomass have become major problems in its efficient and economic transport, handling, storage and conver- sion into bioenergy products. Biomass in its original form has wide range of moisture content (60–25%), uneven particle sizes (100– 10 mm) and low energy density (8–14 MJ kg 1 ) and is difficult to store, transport and feed it in the existing combustion and gasifica- tion systems. Low bulk density (60–100 kg m 3 ) of lignocellulosic biomass further increases the transport and storage cost of the feedstock (Mani, 2005; Mani et al., 2006; Sokhansanj et al., 2009). Energy required for grinding of biomass is very high to pro- duce powdered biomass supply that is often required at the throat of the conversion chamber (Mani et al., 2004). Combustion and cofiring of biomass with coal is difficult due to imbalance in the energy density differences of coal and biomass, low burning rate and low flame temperature. It also creates addi- tional problem due to poor flowability, poor blending and reduces the thermal efficiency and capacity of existing boiler units (Hughes and Tillman, 1998; Tillman, 2000). Gasification of low quality bio- mass results in poor synthetic gas quality and high tar concentra- tion. Tar is a highly viscous and higher molecular weight volatile organic compound generated during biomass gasification process. A recent study reported that feedstock composition has some effect on tar formation during gasification (Kiel et al., 2004). They re- ported that presence of high moisture and a high concentration of hemi-cellulose and lignin in the feedstock produce more tar in the syngas than that of cellulose. The hydrophillic nature of bio- mass compounds additional problem for safe storage. In order to address the above problems, biomass needs to be pretreated to improve its quality for efficient energy conversion. Thermal pretreatment or torrefaction of biomass is a promising method to preprocess low quality biomass into high energy density feedstock with consistent and uniform physical and chemical char- acteristics. Torrefaction can therefore be suitable for long distance transportation, long term storage and improved conversion of bio- mass because of reduction in downstream cleaning and processing costs. During torrefaction of biomass, some of the highly reactive volatile compounds are removed from the biomass as vapors and resulting in clean, dark brown colored solid biomass with higher energy density. The energy density of biomass could be increased closer to the energy density of coal (22–23 MJ kg 1 ) used for heat 0960-8524/$ - see front matter Ó 2010 Elsevier Ltd. All rights reserved. doi:10.1016/j.biortech.2010.08.028 ⇑ Corresponding author. Tel.: +1 706 542 2358; fax: +1 706 542 8806. E-mail address: [email protected] (S. Mani). Bioresource Technology 102 (2011) 1246–1253 Contents lists available at ScienceDirect Bioresource Technology journal homepage: www.elsevier.com/locate/biortech
-
Upload
independent -
Category
Documents
-
view
2 -
download
0
Transcript of Impact of torrefaction on the grindability and fuel characteristics of forest biomass

Bioresource Technology 102 (2011) 1246–1253
Contents lists available at ScienceDirect
Bioresource Technology
journal homepage: www.elsevier .com/locate /bior tech
Impact of torrefaction on the grindability and fuel characteristics of forest biomass
Manunya Phanphanich, Sudhagar Mani ⇑Biochemical Engineering Program, Faculty of Engineering, Driftmier Engineering Center, University of Georgia, Athens, GA 30602, USA
a r t i c l e i n f o
Article history:Received 24 May 2010Received in revised form 6 August 2010Accepted 9 August 2010Available online 11 August 2010
Keywords:TorrefactionWood chipsLogging residuesGrinding energy consumptionCoal
0960-8524/$ - see front matter � 2010 Elsevier Ltd. Adoi:10.1016/j.biortech.2010.08.028
⇑ Corresponding author. Tel.: +1 706 542 2358; faxE-mail address: [email protected] (S. Mani).
a b s t r a c t
Thermal pretreatment or torrefaction of biomass under anoxic condition can produce an energy denseand consistent quality solid biomass fuel for combustion and co-firing applications. This paper investi-gates the fuel characteristics and grindability of pine chips and logging residues torrefied at temperaturesranging from 225 �C to 300 �C and 30 min residence time. Grinding performance of torrefied biomassevaluated by determining energy required for grinding, particle size distribution and average particle sizewere compared with raw biomass and coal. Specific energy required for grinding of torrefied biomassdecreased significantly with increase in torrefaction temperatures. The grinding energy of torrefied bio-mass was reduced to as low as 24 kW h/t at 300 �C torrefaction temperature. The gross calorific value oftorrefied chips increased with increase in torrefaction temperature. Torrefaction of biomass clearlyshowed the improved fuel characteristics and grinding properties closer to coal.
� 2010 Elsevier Ltd. All rights reserved.
1. Introduction
Efficient and economical conversion of renewable biomass intohigh value fuels and chemicals is a top research and developmentpriority for researchers, scientists and policy makers to enhancethe nation’s energy security, to mitigate the impact of globalwarming and to boost local agriculture and rural economic devel-opment. A recent biomass availability study conducted by The Uni-ted States Department of Agriculture (USDA) and Department ofEnergy (DOE) has reported that nearly 1.2 � 109 dry Mg of biomasscan be produced annually from agricultural and forestry lands forgeneration of biofuels and power (Perlack, 2005). The SoutheastUS contributes significantly on the sustainable production of forestbiomass and energy crops.
Structural heterogeneity, non-uniform physical properties andlow energy density of biomass have become major problems inits efficient and economic transport, handling, storage and conver-sion into bioenergy products. Biomass in its original form has widerange of moisture content (60–25%), uneven particle sizes (100–10 mm) and low energy density (8–14 MJ kg�1) and is difficult tostore, transport and feed it in the existing combustion and gasifica-tion systems. Low bulk density (60–100 kg m�3) of lignocellulosicbiomass further increases the transport and storage cost of thefeedstock (Mani, 2005; Mani et al., 2006; Sokhansanj et al.,2009). Energy required for grinding of biomass is very high to pro-
ll rights reserved.
: +1 706 542 8806.
duce powdered biomass supply that is often required at the throatof the conversion chamber (Mani et al., 2004).
Combustion and cofiring of biomass with coal is difficult due toimbalance in the energy density differences of coal and biomass,low burning rate and low flame temperature. It also creates addi-tional problem due to poor flowability, poor blending and reducesthe thermal efficiency and capacity of existing boiler units (Hughesand Tillman, 1998; Tillman, 2000). Gasification of low quality bio-mass results in poor synthetic gas quality and high tar concentra-tion. Tar is a highly viscous and higher molecular weight volatileorganic compound generated during biomass gasification process.A recent study reported that feedstock composition has some effecton tar formation during gasification (Kiel et al., 2004). They re-ported that presence of high moisture and a high concentrationof hemi-cellulose and lignin in the feedstock produce more tar inthe syngas than that of cellulose. The hydrophillic nature of bio-mass compounds additional problem for safe storage.
In order to address the above problems, biomass needs to bepretreated to improve its quality for efficient energy conversion.Thermal pretreatment or torrefaction of biomass is a promisingmethod to preprocess low quality biomass into high energy densityfeedstock with consistent and uniform physical and chemical char-acteristics. Torrefaction can therefore be suitable for long distancetransportation, long term storage and improved conversion of bio-mass because of reduction in downstream cleaning and processingcosts. During torrefaction of biomass, some of the highly reactivevolatile compounds are removed from the biomass as vapors andresulting in clean, dark brown colored solid biomass with higherenergy density. The energy density of biomass could be increasedcloser to the energy density of coal (22–23 MJ kg�1) used for heat

Nomenclature
a Measured area covered by a particle projectionA Surface of all particles (mm2)C Carbond16 The particle diameters obtained from the cumulative
distribution data at 16%.d84 The particle diameters obtained from the cumulative
distribution data at 84%.dgw d50 and The geometric mean diameter (mm).Eg Specific energy consumption for grinding (kW h/t).H HydrogenHHV Higher heating value (MJ kg�1).N Nitrogen.O Oxygen.P Measured circumference of a particle projection.
P1 The pressure reading after pressurizing the referencevolume (Pa).
P2 The pressure after including Vc (Pa).Sgw The geometric mean diameter standard deviation (mm).Sv The specific surface area (mm�1)SHPT Sphericity (dimensionless).T Torrefaction temperature (�C).V Volume of all particle (mm3).Vc The volume of sample cell (m3).VM Volatile matter.Vp The volume of solid biomass.VR The reference volume (m3).Xc min The shortest chord or width (mm).
M. Phanphanich, S. Mani / Bioresource Technology 102 (2011) 1246–1253 1247
and power generation (Lipinsky et al., 2002; Prins, 2005; Zwartet al., 2006). The higher energy density of torrefied biomass ascompared to sawdust, wood chips and conventional wood pelletswould reduce transport costs and facilitate higher rates of co-firingwith coal at power plants. The cement industry represents anotherpotential large application where torrefied biomass can be co-firedwith coal. Torrefied wood could also be blended with biomassfeedstock used for production of pellets and briquettes (Arcate,2002). During the torrefaction process, biomass losses about 10–20% of its mass through conversion into volatile gases and otherchemicals which can be captured and utilized to produce valueadded chemicals. Preliminary research work carried out on the tor-refaction of wood in the batch reactor showed some evidence thattorrefaction improves feedstock quality (Pach, 2002; Ferro et al.,2004; Prins, 2005; Bergman et al., 2005). A recent study by Felfliet al. (2005) reported that torrefaction of wood briquettes in-creased the energy density of briquettes and decreased moistureadsorption during storage.
The main objectives of this study were to investigate the impactof torrefaction treatment on the grinding energy consumption andfuel characteristics of logging residues and clean wood chips.
2. Methods
2.1. Materials
Clean pine chips were received from a local saw mill operationin Oglethorpe, Georgia. The moisture content of chips as receivedwas 41.7% on the wet basis (wb). The pine chips dimensions werein the ranges of 20.94–70.59 mm in length, 1.88–4.94 mm in thick-ness and 15.08–39.70 mm in width. Southern yellow pine loggingresidue chips were also received from local logging operation inMacon, GA and they consists of clean chips (sap and heart wood),branches, barks, leaves and small particles. The anatomical compo-sitions and the particle sizes of logging residues can be obtainedfrom Phanphanich and Mani (2010). The initial moisture contentof the residues was 49.60% (wb). Chip samples were dried to 10%moisture content (wb) for safe outside storage and were used fortorrefaction study. Bituminous coal sample was collected fromthe Central Steam Plant at the University of Georgia, Athens, Geor-gia for comparative analysis.
2.2. Torrefaction experiment
Torrefaction of wood chips and forest residues was conductedin a batch torrefaction reactor placed inside an externally heatedelectric furnace (Fig. 1). A thermocouple was inserted in the sample
bed for temperature control and was data logged to monitor andcontrol the torrefaction experiment. A nitrogen flow of 2 L min�1
was used as a carrier gas throughout the experiment to eliminatethe presence of oxygen, thereby avoiding oxidation and ignition.The exhaust from the batch reactor was passed through series ofmetal condensers immersed in an ice bath before exhausted tothe atmosphere. The purpose of condensers was to collect all thepotential condensable generated from the torrefaction reaction. Aknown amount of samples (1–1.5 kg) was charged into the reactorat room temperature, and the reactor was heated at 10 �C min�1
under atmospheric pressure. Both clean wood chips and forest res-idue chips were torrefied at four different temperatures (225, 250,275, and 300 �C) and at 30 min residence time. The torrefactionresidence time of 30 min was chosen to be optimal for torrefactionreaction from preliminary studies. After the treatment, sampleswere cooled and weighed to determine the solid yield. The sampleswere placed in the air tight plastic bags and stored in a desiccatorfor further analysis. The moisture content of torrefied sample wasdetermined as per ASABE S358.2 (ASABE, 2006) standard protocol(see Section 2.4.1). The scope of this study was primarily focusedon the analysis of torrefied clean wood chips and logging residues.
2.3. Grinding experiment
A laboratory heavy-duty knife mill (Retsch SM 2000, Germany)was used in the grinding experiments. The knife mill used in thisstudy consisted of a cutting blade rotor (1690 rpm, 60 Hz) whichis powered by a 1.5 kW electric motor. A computer with a data log-ger assembled with a multi function transducer (CR Manetics Inc.,MO) was connected to the mill to measure the power consumptionduring the grinding experiment. Instantaneous power consump-tion data was recorded every two seconds by the computer. Thebottom sieve opening of 1.5 mm was used in this study as this sizehas been found to produce good quality pellets for combustionapplications (Mani, 2005; Mani et al., 2006; Kaliyan and Morey,2009). Untreated wood and coal were also tested for grindingexperiments under the same grinding conditions for comparisons.A known quantity of biomass samples was taken and was groundusing a knife mill. The sample was manually fed without exceedingthe maximum current drawn by the mill. A circuit breaker was in-stalled in the grinder motor to avoid motor overloading. The timerequired for complete grinding of the samples was recorded. Dur-ing grinding, the instantaneous power consumption data with re-spect to time was recorded and used for energy consumptioncalculation. The specific energy consumption for grinding wasdetermined by integrating the area under the instantaneous powerconsumption curve (P–t) over the total time required to grind the

Biomass
Cold water
N2
H2O
Thermocouple
Volatiles
Non-condensable phase
Condensable phase
Torrefied Biomass
Reactor
Temperature profile
Fig. 1. Laboratory torrefaction unit using a batch pyrolysis reactor.
1248 M. Phanphanich, S. Mani / Bioresource Technology 102 (2011) 1246–1253
given sample (Mani et al., 2004). Each test was repeated threetimes.
2.4. Analyzes of physical and fuel properties
2.4.1. Moisture contentThe untreated and torrefied samples were analyzed for mois-
ture content according to ASABE S358.2 (ASABE, 2006) standardprotocol. About 10 g sample was placed in a convective oven at103 + 2 �C. The mass loss was recorded after 24 h and used to cal-culate sample moisture content. ASTM Standard D 3173–87 (ASTM,1998) was used to determine moisture content of coal sample. Themoisture content data were reported in wet basis. Each test was re-peated three times.
2.4.2. Particle size and particle size distributionAn image analyzer (HORIBA CAMSIZER, Instruments, Inc. CA,
USA) equipped with two digital cameras was used to measureaverage particle size and size distribution using a standard proce-dure (ASABE, 2008). Since the samples were electro-staticallycharged, an ultrasonic probe disperser was used for all measure-ments to better characterize needle shaped particles. To conductthe test, a sample of 20–40 g biomass after the grinding experi-ment was loaded onto the hopper of the instrument. The samplewas conveyed and dropped via a vibratory feeder onto the mea-surement field of the cameras. The size and shape of powders wererecorded and analyzed by the software provided by the equipmentmanufacturer. The series of sieve size were set on the software inthe series ranges from 30 to 0.02 mm. The series of sieves andthe following particle size analysis equations are followed theStandard ANSI/ASAE S319.4 (ASABE, 2008). Four parameters wereanalyzed, including: (a) geometric mean diameter (dgw) – the sizeat 50% cumulative distribution; (b) the geometric mean diameterstandard deviation (Sgw) – the measurement of the variation inthe particle sizes of the wood powders; (c) the sphericity (SHPT)(Eq. (3)) -roundness value ranges from 0 to 1 (a perfect spherehas a value of 1); and d) the specific surface area (Sv) (Eq. (4)) –the value directly shows the results of size reduction and indicatescombustion properties of fuel.
Sgw ¼12½d84 � d16� ð1Þ
VEllipsoid ¼p6
Xc min2 � Length ð2Þ
SHPT ¼ 4pap2 ð3Þ
Sv ¼Am
ð4Þ
Where d84 and d16 are particle diameters obtained from the cumu-lative distribution data at 84% and 16% respectively. The Particlesize distribution and cumulative passing percentage were con-structed against the shortest chord or width (Xc min), which is thedimension that fits to sieve results because with sieving, the parti-cle passes the mesh with its smallest dimension. Each run was re-peated three times.
2.4.3. Bulk densityThe bulk density of grinds was performed by employing ASTM E
873–82 for densified particulate biomass fuels (ASTM, 2006). Thesamples were poured from a height of 0.6 m above the top edgeof the container and then dropped five times from a height of0.15 m onto a hard surface to allow settling. The density was calcu-lated by the ratio of mass of the sample to volume correspondingto the height of the sample in the container.
2.4.4. Particle densityA gas multi-pycnometer (MPV-D160-E, Quantachrome Corpora-
tion, FL) was used to measure the particle density of grinds bymeasuring the pressure difference when a known quantity of he-lium (He) under pressure was allowed to flow from a preciselyknown reference volume (VR) into a sample cell (Vc) containingthe solid material. The true volume of the sample (Vp) was calcu-lated from Eq. (1). The particle density of the sample was its massdivided by Vp and was expressed in Mg/m3. Both bulk and particledensity measurements were repeated three times.

M. Phanphanich, S. Mani / Bioresource Technology 102 (2011) 1246–1253 1249
Vp ¼ V c � VRp1
p2� 1
� �ð5Þ
where Vp is the volume of solid biomass (m3), Vc is the volume ofsample cell (m3), VR is the reference volume (m3), P1 is the pressurereading after pressurizing the reference volume (Pa), and P2 is thepressure after including Vc (Pa). The tests were repeated three timeson each sample.
2.4.5. Heat contentThe adiabatic oxygen bomb calorimeter (IKA C 2000, IKA Works,
Inc., NC) was used for determination of gross calorific value ofgrinds based on the ASTM D 5865–03, standard test method forcoal and coke (ASTM, 2003). Initially, a known amount of grinds(�0.5 g) was placed in a nickel crucible and burned inside thebomb calorimeter surrounded by a water jacket. The sample wasignited by a pure cotton thread in the presence of oxygen. Uponthe ignition, the released heat is transferred to the water jacketcausing temperature to rise. The increase in temperature was usedto calculate the heating value of the sample. The calorific value wasexpressed in MJ/kg.
2.4.6. Proximate analysisProximate analysis (Ash, volatiles, fixed carbon and moisture
content) was carried out with a micro thermo-gravimetric analyzer(Model TGA701, LECO Corporation, St. Joseph, MI) as similar to theprocedure of ASTM D 5142–04 for coal and coke (ASTM, 2002a).Approximately, one to 2 g of grinds was placed in an aluminumcrucible which was placed and heated in a muffle furnace. Ash con-tent and volatile matter were expressed in dry basis. The fixed car-bon, in dry basis was calculated from subtracting a hundredpercentages with ash and volatile matter.
2.4.7. Ultimate analysisElemental analysis of the samples was performed according to
the ASTM D3176–89 standard test method for coal and coke(ASTM, 2002b). The C, H, N, S contents were measured using an ele-mental analyzer (LECO CHNS 932, LECO Corporation, MI). Oxygenwas estimated by the difference. All thermal and chemical mea-surements were conducted in triplicates.
Table 1Effect of torrefied temperature on mass and energy yields of torrefied wood chips.
Biomass Torrefactiontemperature (�C)
Mass yield(%)
Energy yield(%)
Pine wood chips 225 89 94250 82 90275 73 87300 52 71
Logging residue chips 225 88 92250 81 92275 70 82300 52 72
Fig. 2. Physical changes occurred during torrefaction of pine wood chips at various t
2.4.8. Chemical compositionsThe sample was dried and treated in a neutral detergent solu-
tion (30.0 g Sodium dodecyl sulfate, USP; 18.61 g Ethylenedi-aminetetraacetic disodium salt, dihydrate; 6.81 g Sodium borate;4.56 g Sodium phosphate dibasic, anhydrous; and 10.0 ml Triethyl-ene glycol, in 1 L distilled H2O). The insoluble residues were hemi-cellulose, cellulose, and lignin. Then, the separation of cellulose andlignin: sample was digested with acid-solution (20 g of cetyl trime-thylammonium bromide (CTAB) to 1 L of H2SO4). After digestion,the hemicelluloses dissolved and were filtered away. Secondly,the separation of lignin: acid detergent lignin (ADL) was measuredby further treating ADF (the insoluble fiber residues remained afterdigesting which consisted mainly of cellulose and lignin) with 72%H2SO4, which dissolved cellulose. The cellulose content was de-rived by subtracting ADF values from ADL values. Calculations ofcellulose and hemicellulose percentages were given by.
%Hemicellulose ¼ %NDF�%ADF ð6Þ
%Cellulose ¼ %ADF�%ADL ð7Þ
2.5. Statistical analysis
Specific energy consumption for grinding, average particle sizeand higher heating values data for torrefied pine chips and forestresidues were compared at various torrefaction temperaturesusing one-way ANOVA and Duncan multiple comparison test.SAS Non-linear Regression (NLIN) (SAS, 2006) was used for regres-sion fits and analyses. The level of significant difference was kept atP < 0.05.
3. Results and discussion
3.1. Torrefied biomass mass and energy yields
Table 1 shows the mass and energy yields of pine chips and log-ging residues at various torrefaction temperature conditions. En-ergy yield data represents the ratio of actual energy retainedafter the torrefaction process to initial energy content of biomass.Table 1 shows that the mass yield of torrefied biomass (both pinechips and logging residues) decreased with increase in torrefactiontemperature. The mass yield started to decline dramatically fromtemperature of 275 �C and became to only about one-half of theoriginal weight when torrefied temperature reaching 300 �C. Themass loss was primary due to thermal decomposition of hemi-cel-lulose and some short chain lignin compounds (Bergman et al.,2005). The decomposed volatiles can be captured and used for var-ious applications. Detailed compositions of condensable volatileproducts and non-condensable gases can be obtained from Mani(2009). Fig. 2 shows the physical changes occurred during torrefac-tion of wood chips at various temperatures. The energy yields ran-ged from 71% to 94% depending on the torrefaction temperatures.
reatment temperatures: (a) control, (b) 225 �C, (c) 250 �C, (d) 275 �C, (e) 300 �C.

Table 2Fuel properties of torrefied wood chips and logging residuesb.
Biomass MC (%, wb) VM (%, db) Ash (%, db) FC (%, db) C (%, db) H (%, db) N (%, db) O (%, db) HHV (MJ kg�1)c
Pine chips (PC) 6.69 (0.11) 85.98 (0.01) 0.27 (0.02) 13.76 (0.02) 47.21 (0.28) 6.64 (0.01) 0.17 (0.05) 45.76 (0.53) 18.46 (0.13)aTPC-225 �C 3.30 (0.06) 84.78 (0.06) 0.27 (0.01) 14.95 (0.06) 49.47 (0.02) 6.07 (0.02) 0.15 (0.01) 44.03 (0.03) 19.48 (0.02)bTPC-250 �C 2.88 (0.05) 82.52 (0.41) 0.25 (0.01) 17.24 (0.40) 51.46 (0.01) 5.86 (0.37) 0.14 (0.01) 42.02 (0.34) 20.08 (0.01)cTPC-275 �C 2.46 (0.10) 76.40 (0.27) 0.35 (0.03) 23.26 (0.23) 54.91 (0.27) 6.20 (0.1) 0.20 (0.0) 38.17 (0.13) 21.82 (0.08)dTPC-300 �C 2.57 (0.02) 58.72 (0.16) 0.43 (0.06) 40.85 (0.22) 63.67 (0.01) 5.58 (0.14) 0.20 (0.01) 29.99 (0.16) 25.38 (0.07)e
Logging residue chips (LR) 7.94 (0.18) 82.17 (0.06) 1.77 (0.11) 16.07 (0.05) 47.29 (0.37) 6.20 (0.12) 0.42 (0.01) 45.19 (1.76) 18.79 (0.01)aTLR-225 �C 3.11 (0.16) 80.75 (0.05) 1.37 (0.02) 17.90 (0.04) 50.15 (0.02) 6.10 (0.05) 0.30 (0.03) 42.74 (1.03) 19.79 (0.01)bTLR -250 �C 2.66 (0.09) 78.16 (0.09) 1.49 (0.04) 20.37 (0.06) 54.91 (0.04) 5.87 (0.20) 0.31 (0.03) 40.96 (1.18) 21.21 (0.03)cTLR -275 �C 2.64 (0.08) 71.44 (0.89) 1.88 (0.05) 26.69 (0.84) 53.24 (0.95) 5.39 (0.5) 0.30 (0.04) 40.12 (2.82) 22.03 (0.19)dTLR -300 �C 2.36 (0.10) 52.92 (0.06) 2.32 (0.08) 44.76 (0.08) 66.07 (0.13) 4.92 (0.16) 0.48 (0.04) 27.34 (1.88) 26.41 (0.02)eBituminous Coala 1.57 (0.05) 36.58 (0.02) 6.52 (0.05) 56.91 (0.20) 77.63 6.30 2.00 9.16 27.72 (0.02)f
a Sulfur content in bituminous coal was 1.66 (0.20)%, db.b Number enclosed in the parenthesis were standard deviations with n = 3.c Number with the same letters were not significantly different.
1250 M. Phanphanich, S. Mani / Bioresource Technology 102 (2011) 1246–1253
3.2. Fuel characteristics of torrefied biomass
Data from proximate, ultimate and heating value analyses oftorrefied pine chips (TPC) and torrefied logging residues (TLR) aregiven in Table 2. It was observed that moisture content of torrefiedbiomass was decreased as the torrefaction temperature increaseswhen stored at room temperature. It indicates that torrefied bio-mass can’t absorb moisture compared to untreated wood. Thisbehavior may be due to loss of hydroxyl (�OH) groups from bio-mass during torrefaction reaction. The volatile matter present inboth samples was changed less at temperature of 225 and250 �C, while noticeable reduction was observed at torrefied tem-peratures of 275 and 300 �C. Similar observation was also found inthe study of torrefied wood briquette and other biomass species(Felfli et al., 2005; Pimchuai et al., 2010). An observed increase inash content of torrefied biomass was mainly due to mass loss (con-centration effect) during torrefaction reaction. Logging residueshad slightly higher ash content than that of pine chips due to highpercentage of bark and needles contents.
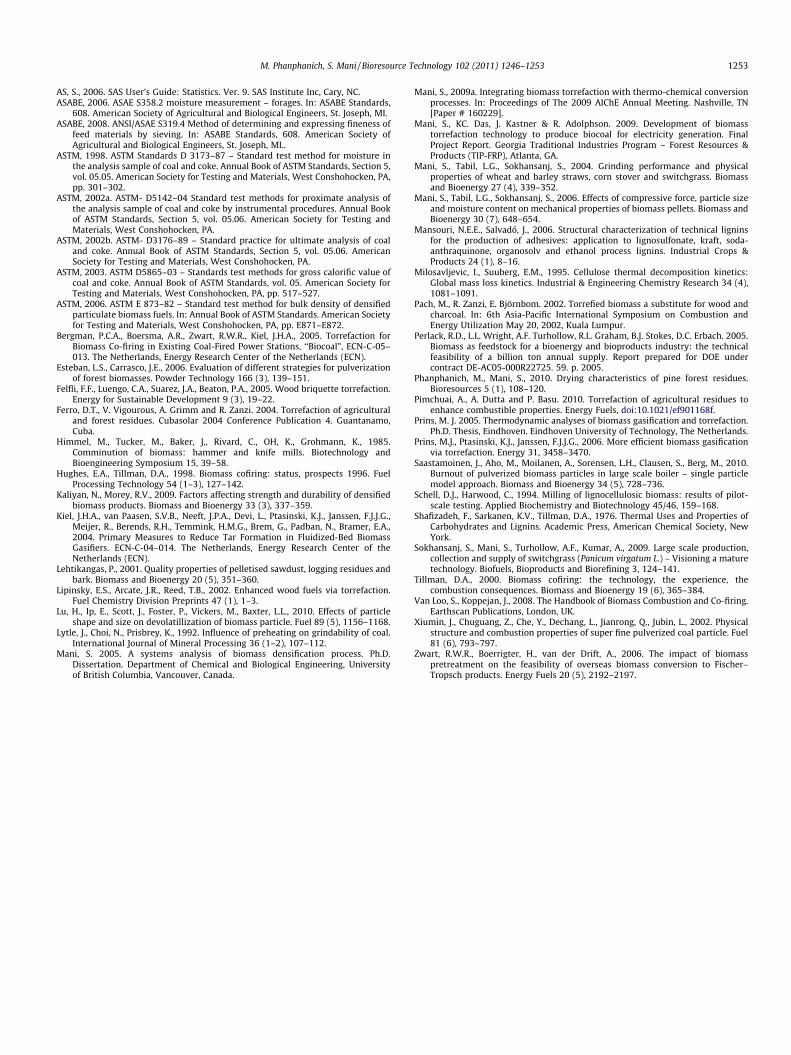
As the torrefaction temperature increased, the elemental carboncontent of torrefied biomass was increased. At the same time,hydrogen and oxygen contents of torrefied biomass decreased,resulting in decreased H/C and O/C ratios. Lower hydrogen andoxygen contents of torrefied biomass also support the fact ofreduction in hydroxyl (�OH) groups during torrefaction. Fig. 3
0.0
0.2
0.4
0.6
0.8
1.0
1.2
1.4
1.6
1.8
2.0
0.0 0.2 0.4 0.6 0.8
Fuel
H/C
rat
io
Fuel O/C ratio
Untreated-PC Untreated-LRTPC-225 TLR-225TPC-250 TLR-250TPC-275 TLR-275TPC-300 TLR-300COAL*
Bituminous Coal
Anthracite
Lignite
Peat
Fig. 3. Chemical composition for pine chips and forest residues at varioustorrefaction temperatures. The comparison data of various solid fuels was obtainedfrom (van Loo and Koppejan, 2008).
illustrated that torrefied logging residues had lower levels of H/Cand O/C ratios than those of torrefied pine chips. The chemicalcompositions of torrefied biomass were very similar to that of lig-nite coal or sub-bituminous coal for potential co-firing application.Higher heating value (HHV) of torrefied biomass was significantlyincreased with increase in torrefaction temperature. Increase inenergy density of biomass during torrefaction was comparablewith other similar studies for agricultural residues (Pimchuaiet al., 2010) and wood chips (Prins et al., 2006). In overall, energydensity or HHV of torrefied logging residues was slightly higherthan that of torrefied chips. The higher energy density was primar-ily due to higher percentages of lignin and extractives present inlogging residues (Shafizadeh et al., 1976; Lehtikangas, 2001). Lig-nin are linked by multitude of inter-unit bonds including etherand carbon–carbon linkages (Mansouri and Salvadó, 2006; vanLoo and Koppejan, 2008). In an energy density prospective, energycontained in C–C bond is higher than C–O or C–H bonds. The rela-tive increase of C better indicates combustion characteristics as itdirectly results in higher calorific value, as lower of O/C and H/C ra-tios reduces thermodynamic losses (over-oxidation) smoke andwater vapor (Bergman et al., 2005; Prins et al., 2006).
Table 3 shows the change in chemical composition of torrefiedbiomass at various temperatures. This table supports the fact thathemicelluloses present in the biomass samples used in this studywere thermally decomposed. Although it is a known fact that cel-lulose does not decompose (Milosavljevic and Suuberg, 1995). Theacid insoluble portion of cellulose was accounted with lignin fiberspresent in torrefied biomass. As a result, the acid insoluble fibercontent of torrefied biomass increased with increase in torrefactiontemperature. Therefore, it may be concluded that torrefied biomasswill not be suitable for extracting simple sugars and further con-verting into ethanol.
3.3. Grinding of torrefied biomass
3.3.1. Specific energy consumption for grindingFig. 4 shows the effect of torrefaction temperature on the spe-
cific energy required to grind torrefied pine chips and logging res-idues. Specific grinding energy consumption of untreated woodchips and logging residues was very high (237 kW h/t) and wascomparable to other similar studies (Esteban and Carrasco, 2006).Specific energy consumption for grinding was significantly reducedwith increase in torrefaction temperature for both torrefied pinechips and logging residues. Specific grinding energy consumptionof torrefied biomass was linearly correlated with torrefaction tem-perature (R2 > 0.9). Grindability of torrefied wood was improveddramatically at 275 and 300 �C as the specific energy required forgrinding (23–78 kW h/t) were as low as that needed to grind

Table 3Chemical compositionsa of torrefied biomass.
Biomass Hemi-cellulose(wt.%)
Acid solublecellulose (wt.%)
Acid insoluble fibers(mostly lignin), (wt.%)
Untreated-PC 15.19 48.57 26.16TPC 225 �C 12.87 41.23 38.42TPC 250 �C 6.93 41.90 45.70TPC 275 �C 0.99 39.54 53.30TPC 300 �C 0.56 12.84 79.99
Untreated-LR 13.26 37.49 26.15TLR 225 �C 14.77 41.04 33.20TLR 250 �C 5.87 38.57 42.49TLR 275 �C 5.23 34.08 52.80TLR 300 �C 1.04 6.10 85.06
a The reported values were presented in dry ash free percentage with a standarddeviation of 0.02.
dgw = -1E-05T2 + 0.001T + 0.669R² = 0.99
dgw = -7E-06T2 + 0.001T + 0.717R² = 0.99
0.0
0.1
0.2
0.3
0.4
0.5
0.6
0.7
0.8
0 50 100 150 200 250 300Geo
met
ric m
ean
parti
cle
diam
eter
, dgw
(mm
)
Torrefaction temperature, T (oC)
Pine Chips
Logging Residues
Fig. 5. Effect of torrefaction temperature on the geometric mean particle diameterof torrefied biomass.
M. Phanphanich, S. Mani / Bioresource Technology 102 (2011) 1246–1253 1251
grasses: wheat straw, barley straw, corn, and switchgrass (43.6,27.1, 19.8, and 58.5 kW h/t, respectively) using a similar sieve sizeof 1.6 mm (Schell and Harwood, 1994; Mani et al., 2004) and sim-ilar to energy needed to grind coal (7–36 kW h/t). The specific en-ergy needed to grind the bituminous coal used as a benchmark was8.86 kW h/t. This value is comparable with other published data ongrinding of coal for power generation (Lytle et al., 1992). Comparedto untreated biomass samples, torrefaction at 300 �C reduce grind-ing energy consumption by 10 times for pine chips and by six timesfor logging residues. Improved grindability of torrefied biomassmay primarily be due to relative increase in biomass brittlenessand breakdown of fibrous compounds during torrefaction (Ariaset al., 2008; Mani, 2009).
3.3.2. Particle size and particle size distribution (PSD)Fig. 5 shows the effect of torrefaction temperature with geomet-
ric mean particle size of torrefied biomass ground through a screensize of 1.5 mm. The mean particle size of ground torrefied biomasswas decreased with increase in torrefaction temperature. The aver-age particle sizes of logging residues at all torrefaction tempera-tures were slightly higher than that of torrefied pine chips. Inoverall, torrefaction of biomass not only decreased the specific en-ergy required for grinding but also decreased the average particlesize of ground biomass. A second order polynomial model wasdeveloped to correlate mean particle diameter of torrefied biomassand the torrefaction temperature (Fig. 5).
Fig. 6 shows that percent particle size distribution and cumula-tive percent passing of ground torrefied pine chips and logging res-idues. The particle size distribution curves for pine chips andlogging residues showed that torrefied biomass produces smaller
Pine ChipsEg = -0.756T + 260.0
R² = 0.98
Logging ResiduesEg = -0.665T + 258.3
R² = 0.94
0
50
100
150
200
250
300
0 100 200 300
Spec
ific
ene
rgy
cons
umpt
ion
for
grin
ding
, Eg
(kW
h/t)
Torrefaction temperature, T (oC)
Fig. 4. Effect of torrefaction temperature on the specific energy consumption forgrinding of torrefied biomass.
particles than that of untreated biomass. The particle size distribu-tion curve was skewed towards smaller particle sizes as the torre-faction temperature increases. The similar skewed distribution ofground biomass was also observed from other studies (Himmelet al., 1985; Mani et al., 2004). Cumulative percent passing curvealso showed the similar behavior for torrefied biomass. In overall,torrefied biomass produced relatively narrower or uniform particlesize ranges compared to untreated biomass due to intense brittle-ness of torrefied biomass similar to coal. This behavior was directlysupported by the least grinding energy consumption of torrefiedbiomass.
3.3.3. Sphericity and particle surface areaTable 4 summarizes the physical properties of ground torrefied
pine chips and logging residues at various torrefaction tempera-tures. Sphericity of pine chips was improved as the torrefactiontemperature was increased from 0.48 to 0.62. Higher sphericity va-lue of torrefied pine chips indicated that the shape of ground torr-efied pine chip was changed. However, no significant difference insphericity of ground torrefied logging residue was observed com-pared to untreated logging residues thus indicating that the shapeof torrefied logging residue did not change compared to untreatedlogging residue. Particle surface area of torrefied biomass washigher compared to that of untreated biomass. In overall, an in-crease in particle surface area or a decrease in particle size of torr-efied biomass can be the desired properties of torrefied biomass forefficient combustion and co-firing applications (Xiumin et al.,2002). Additionally, particle size, shape and surface area had signif-icant impact on combustion characteristics of biomass and coal (Luet al., 2010; Saastamoinen et al., 2010).
3.3.4. Bulk density and particle densityGenerally, decrease in particle size of biomass would increase
the bulk density and particle density. This is due to the reductionin both inter- and intra-particle voids generated after milling(Mani et al., 2004; Esteban and Carrasco, 2006). However, bulkdensity and particle density of torrefied biomass behaved differ-ently. Table 4 shows that particle density of torrefied pine chipsand logging residue particles did not change compared to that ofuntreated biomass. Bulk density of torrefied pine chip particles de-creased until the torrefaction temperature of 250 �C. Then, it wasincreased up to the torrefaction temperature of 300 �C. On theother hand, bulk density of torrefied logging residue particles didnot change compared to that of untreated logging residue particles.This result was contrary to the behavior observed for untreatedagricultural residues and energy crops (Mani et al., 2004).

(a1) (b1)
(a2) (b2)
0
2
4
6
8
10
12
14
0 1 2
Part
icle
siz
e di
stri
butio
n [%
]
Particle size (mm)
Untreated-PCTPC-225
TPC-250
TPC-275
TPC-300
0
10
20
30
40
50
60
70
80
90
100
0 1 2
Cum
mul
ativ
e pa
ssin
g[%
]
Particle size (mm)
Untreated-PC
TPC-225
TPC-250
TPC-275
TPC-300
0
2
4
6
8
10
12
14
0 1 2
Part
icle
siz
e di
stri
butio
n [%
]
Particle size (mm)
Untreated-LRTLR-225
TLR-250
TLR-275
TLR-300
0102030405060708090
100
0 1 2
Cum
mul
ativ
e pa
ssin
g [%
]
Particle size (mm)
Untreated-LR
TLR-225
TLR-250
TLR-275
TLR-300
Fig. 6. Particle size distributions of various torrefaction -temperature of (a1) ground pine chips and (a2) logging residues, cumulative passing graphs of various torrefactiontemperature of (b1) for ground pine chips and (b2) for logging residues.
Table 4Physical properties and specific energy consumption for grinding of torrefied biomassa.
Biomass grinds dgw (mm)b,d Sgw (mm)b SPHTc
(Dimensionless)Sv (mm�1)b Bulk density
(kg m�3)bParticle density(Mg m�3)b
Specific grinding energyconsumption (kW h/t)b,d
Untreated-PC 0.71 (0.01)a 0.41 (0.01) 0.48 (99.2) 13.5 (0.3) 381.0 (1.3)) 1.40 (0.02) 237.7 (6.6)aTPC-225 �C 0.45 (0.01)c 0.40 (0.01) 0.52 (98.2) 30.4 (1.8) 342.4 (4.1) 1.41 (0.02) 102.6 (13.4)bTPC-250 �C 0.42 (0.0)d 0.38 (0.01) 0.51 (98.3) 32.6 (0.2) 331.8 (4.5) 1.40 (0.01) 71.4 (3.6)cTPC-275 �C 0.27 (0.03)f 0.36 (0.03) 0.60 (95.3) 48.6 (3.3) 376.1 (1.6) 1.37 (0.01) 52.0 (7.3)dTPC-300 �C 0.13 (0.02)g 0.31 (0.02) 0.62 (92.4) 64.2 (0.2) 400.2 (4.0) 1.34 (0.01) 23.9 (3.0)eUntreated-LR 0.74 (0.03)a 0.43 (0.03) 0.54 (97.1) 17.2 (0.2) 351.3 (1.6) 1.35 (0.01) 236.7 (16.0)aTLR-225 �C 0.57 (0.0)b 0.42 (0.0) 0.57 (96.4) 21.4 (0.2) 351.7 (1.0) 1.39 (0.02) 113.8 (9.0)bTLR-250 �C 0.53 (0.01)b 0.41 (0.01) 0.53 (96.9) 21.8 (0.2) 336.6 (2.6) 1.37 (0.02) 110.4 (4.3)bTLR-275 �C 0.46 (0.01)c 0.37 (0.01) 0.53 (96.2) 24.0 (1.2) 331.5 (0.9) 1.34 (0.01) 78.0 (10.2)cTLR-300 �C 0.36 (0.02)f 0.33 (0.02) 0.53 (95.6) 29.2 (2.8) 330.5 (2.6) 1.33 (0.01) 37.6 (7.0)f
a All grinds were received from knife mill with a screen size of 1.5 mm.b Number enclosed in the parenthesis were standard deviations with n = 3.c Number enclosed in the parenthesis represented fraction of sample that is less than 0.9 sphericity.d Number with the same letters were not significantly different at p = 0.05.
1252 M. Phanphanich, S. Mani / Bioresource Technology 102 (2011) 1246–1253
4. Conclusions
Torrefaction of clean wood chips and logging residues signifi-cantly improved the heating value compared to that of untreatedbiomass. Proximate and elemental compositions of torrefied bio-mass were also improved and were comparable to coal. Specific en-ergy consumption for grinding of torrefied biomass was decreasedup to 10 times for torrefied wood chips and up to six times for torr-efied logging residues compared to that of untreated biomass. Tor-refaction temperature was linearly correlated with specificgrinding energy consumption and average particle diameter ofground torrefied biomass. Physical and fuel characteristics of torr-efied biomass was superior compared to that of untreated biomass.
Acknowledgement
Authors acknowledge Traditional Industries Program (TIP3) forforest resources and products, State of Georgia (GA), USA and Officeof Vice President for Research (OVPR), University of Georgia, Ath-ens (UGA) for financially supporting this project.
References
Arcate, J., 2002. Global markets and technologies for torrefied wood in 2002. WoodEnergy 6, 26–28.
Arias, B., Pevida, C., Fermoso, J., Plaza, M.G., Rubiera, F., Pis, J.J., 2008. Influence oftorrefaction on the grindability and reactivity of woody biomass. FuelProcessing Technology 89 (2), 169–175.
M. Phanphanich, S. Mani / Bioresource Technology 102 (2011) 1246–1253 1253
AS, S., 2006. SAS User’s Guide: Statistics. Ver. 9. SAS Institute Inc, Cary, NC.ASABE, 2006. ASAE S358.2 moisture measurement – forages. In: ASABE Standards,
608. American Society of Agricultural and Biological Engineers, St. Joseph, MI.ASABE, 2008. ANSI/ASAE S319.4 Method of determining and expressing fineness of
feed materials by sieving. In: ASABE Standards, 608. American Society ofAgricultural and Biological Engineers, St. Joseph, MI..
ASTM, 1998. ASTM Standards D 3173–87 – Standard test method for moisture inthe analysis sample of coal and coke. Annual Book of ASTM Standards, Section 5,vol. 05.05. American Society for Testing and Materials, West Conshohocken, PA,pp. 301–302.
ASTM, 2002a. ASTM- D5142–04 Standard test methods for proximate analysis ofthe analysis sample of coal and coke by instrumental procedures. Annual Bookof ASTM Standards, Section 5, vol. 05.06. American Society for Testing andMaterials, West Conshohocken, PA.
ASTM, 2002b. ASTM- D3176–89 – Standard practice for ultimate analysis of coaland coke. Annual Book of ASTM Standards, Section 5, vol. 05.06. AmericanSociety for Testing and Materials, West Conshohocken, PA.
ASTM, 2003. ASTM D5865–03 – Standards test methods for gross calorific value ofcoal and coke. Annual Book of ASTM Standards, vol. 05. American Society forTesting and Materials, West Conshohocken, PA, pp. 517–527.
ASTM, 2006. ASTM E 873–82 – Standard test method for bulk density of densifiedparticulate biomass fuels. In: Annual Book of ASTM Standards. American Societyfor Testing and Materials, West Conshohocken, PA, pp. E871–E872.
Bergman, P.C.A., Boersma, A.R., Zwart, R.W.R., Kiel, J.H.A., 2005. Torrefaction forBiomass Co-firing in Existing Coal-Fired Power Stations, ‘‘Biocoal”, ECN-C-05–013. The Netherlands, Energy Research Center of the Netherlands (ECN).
Esteban, L.S., Carrasco, J.E., 2006. Evaluation of different strategies for pulverizationof forest biomasses. Powder Technology 166 (3), 139–151.
Felfli, F.F., Luengo, C.A., Suarez, J.A., Beaton, P.A., 2005. Wood briquette torrefaction.Energy for Sustainable Development 9 (3), 19–22.
Ferro, D.T., V. Vigourous, A. Grimm and R. Zanzi. 2004. Torrefaction of agriculturaland forest residues. Cubasolar 2004 Conference Publication 4. Guantanamo,Cuba.
Himmel, M., Tucker, M., Baker, J., Rivard, C., OH, K., Grohmann, K., 1985.Comminution of biomass: hammer and knife mills. Biotechnology andBioengineering Symposium 15, 39–58.
Hughes, E.A., Tillman, D.A., 1998. Biomass cofiring: status, prospects 1996. FuelProcessing Technology 54 (1–3), 127–142.
Kaliyan, N., Morey, R.V., 2009. Factors affecting strength and durability of densifiedbiomass products. Biomass and Bioenergy 33 (3), 337–359.
Kiel, J.H.A., van Paasen, S.V.B., Neeft, J.P.A., Devi, L., Ptasinski, K.J., Janssen, F.J.J.G.,Meijer, R., Berends, R.H., Temmink, H.M.G., Brem, G., Padban, N., Bramer, E.A.,2004. Primary Measures to Reduce Tar Formation in Fluidized-Bed BiomassGasifiers. ECN-C-04–014. The Netherlands, Energy Research Center of theNetherlands (ECN).
Lehtikangas, P., 2001. Quality properties of pelletised sawdust, logging residues andbark. Biomass and Bioenergy 20 (5), 351–360.
Lipinsky, E.S., Arcate, J.R., Reed, T.B., 2002. Enhanced wood fuels via torrefaction.Fuel Chemistry Division Preprints 47 (1), 1–3.
Lu, H., Ip, E., Scott, J., Foster, P., Vickers, M., Baxter, L.L., 2010. Effects of particleshape and size on devolatillization of biomass particle. Fuel 89 (5), 1156–1168.
Lytle, J., Choi, N., Prisbrey, K., 1992. Influence of preheating on grindability of coal.International Journal of Mineral Processing 36 (1–2), 107–112.
Mani, S. 2005. A systems analysis of biomass densification process. Ph.D.Dissertation. Department of Chemical and Biological Engineering, Universityof British Columbia, Vancouver, Canada.
Mani, S., 2009a. Integrating biomass torrefaction with thermo-chemical conversionprocesses. In: Proceedings of The 2009 AIChE Annual Meeting. Nashville, TN[Paper # 160229].
Mani, S., KC. Das, J. Kastner & R. Adolphson. 2009. Development of biomasstorrefaction technology to produce biocoal for electricity generation. FinalProject Report. Georgia Traditional Industries Program – Forest Resources &Products (TIP-FRP), Atlanta, GA.
Mani, S., Tabil, L.G., Sokhansanj, S., 2004. Grinding performance and physicalproperties of wheat and barley straws, corn stover and switchgrass. Biomassand Bioenergy 27 (4), 339–352.
Mani, S., Tabil, L.G., Sokhansanj, S., 2006. Effects of compressive force, particle sizeand moisture content on mechanical properties of biomass pellets. Biomass andBioenergy 30 (7), 648–654.
Mansouri, N.E.E., Salvadó, J., 2006. Structural characterization of technical ligninsfor the production of adhesives: application to lignosulfonate, kraft, soda-anthraquinone, organosolv and ethanol process lignins. Industrial Crops &Products 24 (1), 8–16.
Milosavljevic, I., Suuberg, E.M., 1995. Cellulose thermal decomposition kinetics:Global mass loss kinetics. Industrial & Engineering Chemistry Research 34 (4),1081–1091.
Pach, M., R. Zanzi, E. Björnbom. 2002. Torrefied biomass a substitute for wood andcharcoal. In: 6th Asia-Pacific International Symposium on Combustion andEnergy Utilization May 20, 2002, Kuala Lumpur.
Perlack, R.D., L.L. Wright, A.F. Turhollow, R.L. Graham, B.J. Stokes, D.C. Erbach. 2005.Biomass as feedstock for a bioenergy and bioproducts industry: the technicalfeasibility of a billion ton annual supply. Report prepared for DOE undercontract DE-AC05-000R22725. 59. p. 2005.
Phanphanich, M., Mani, S., 2010. Drying characteristics of pine forest residues.Bioresources 5 (1), 108–120.
Pimchuai, A., A. Dutta and P. Basu. 2010. Torrefaction of agricultural residues toenhance combustible properties. Energy Fuels, doi:10.1021/ef901168f.
Prins, M. J. 2005. Thermodynamic analyses of biomass gasification and torrefaction.Ph.D. Thesis, Eindhoven. Eindhoven University of Technology, The Netherlands.
Prins, M.J., Ptasinski, K.J., Janssen, F.J.J.G., 2006. More efficient biomass gasificationvia torrefaction. Energy 31, 3458–3470.
Saastamoinen, J., Aho, M., Moilanen, A., Sorensen, L.H., Clausen, S., Berg, M., 2010.Burnout of pulverized biomass particles in large scale boiler – single particlemodel approach. Biomass and Bioenergy 34 (5), 728–736.
Schell, D.J., Harwood, C., 1994. Milling of lignocellulosic biomass: results of pilot-scale testing. Applied Biochemistry and Biotechnology 45/46, 159–168.
Shafizadeh, F., Sarkanen, K.V., Tillman, D.A., 1976. Thermal Uses and Properties ofCarbohydrates and Lignins. Academic Press, American Chemical Society, NewYork.
Sokhansanj, S., Mani, S., Turhollow, A.F., Kumar, A., 2009. Large scale production,collection and supply of switchgrass (Panicum virgatum L.) – Visioning a maturetechnology. Biofuels, Bioproducts and Biorefining 3, 124–141.
Tillman, D.A., 2000. Biomass cofiring: the technology, the experience, thecombustion consequences. Biomass and Bioenergy 19 (6), 365–384.
Van Loo, S., Koppejan, J., 2008. The Handbook of Biomass Combustion and Co-firing.Earthscan Publications, London, UK.
Xiumin, J., Chuguang, Z., Che, Y., Dechang, L., Jianrong, Q., Jubin, L., 2002. Physicalstructure and combustion properties of super fine pulverized coal particle. Fuel81 (6), 793–797.
Zwart, R.W.R., Boerrigter, H., van der Drift, A., 2006. The impact of biomasspretreatment on the feasibility of overseas biomass conversion to Fischer–Tropsch products. Energy Fuels 20 (5), 2192–2197.