Rapid Appraisal of the Bioenergy-Food Security Nexus in ...
124
FAO SUB-REGIONAL OFFICE FOR THE PACIFIC ISLANDS Final Report Rapid Appraisal of the Bioenergy-Food Security Nexus in Pacific Island Countries June 2009 Prepared by: K.R. Chapman FAO Consultant FOOD AND AGRICULTURE ORGANIZATION OF THE UNITED NATIONS
-
Upload
khangminh22 -
Category
Documents
-
view
6 -
download
0
Transcript of Rapid Appraisal of the Bioenergy-Food Security Nexus in ...

FAO SUB-REGIONAL OFFICE FOR THE PACIFIC ISLANDS
Final Report
Rapid Appraisal of the Bioenergy-Food Security Nexus in
Pacific Island Countries June 2009
Prepared by:
K.R. Chapman FAO Consultant
FOOD AND AGRICULTURE ORGANIZATION OF THE
UNITED NATIONS

2
Acronyms and abbreviations ACIAR Australian Centre for International Agricultural Research ADB Asian Development Bank ADMIRE Action for Development of Marshall Islands Renewable Energies – UNDP APEC Asia–Pacific Economic Cooperation AusAID Australian Agency for International Development BEFS Bioenergy Food Security Project – FAO CI Cook Islands CoCoGEN Coconut Oil for Power Generation by EPC in Samoa CPO Crude palm oil CROP Council of Regional Organizations in the Pacific EEZ Exclusive Economic Zone EU European Union EWG Energy Working Group EPC Electric Power Company (Samoa) EPU Energy Planning Unit (Tonga) FAO Food and Agriculture Organization of the United Nations FAOSTAT FAO Statistical Database on Food Crops and Commodities FSM Federated States of Micronesia FSSLP Food Security and Sustainable Livelihoods Programme GDP Gross Domestic Product GEF Global Environmental Facility GHG Greenhouse gases GIS Geographic Information System GTZ Deutsche Gesellschaft für Technische Zusammenarbeit GmbH HIES Household Income and Expenditure Survey IEA International Energy Agency IFPRI International Food Policy Research Institute IFAD International Fund for Agricultural Development JICA Japan International Cooperation Agency MAPI Ministry of Agriculture and Primary Industries (Fiji) MDG Millennium Development Goal MLSNR Ministry of Lands, Survey and Natural Resources (Tonga) MNRE Ministry of Natural Resources and Energy (Samoa) MOU Memorandum of Understanding NFSA National Food Security Assessment NGO Non-governmental Organization NISP Niue Integrated Strategic Plan NMTPF National Medium Term Priority Framework – FAO NPC Nauru Power Company NPC National Programme on Food Security Coordinators NZ New Zealand NZAID New Zealand Agency for International Development OECD Organisation for Economic Co-operation and Development OTEC Ocean Thermal Energy Conversion PEMM Pacific Energy Ministers Meeting PICs Pacific Island Countries PIFS Pacific Island Forum Secretariat PIEPSAP Pacific Islands Policy and Strategic Planning Project PIGGAREP Pacific Islands Greenhouse Gas Abatement through Renewable Energy Project PIDMC Pacific Island Developing Member Countries PIREP Pacific Islands Renewable Energy Project PKO Palm kernel oil

3
PNG Papua New Guinea PNGRIS Papua New Guinea Resource Information System PV Photo voltaic REDD Reducing Emissions from Deforestation and Forest Degradation in Developing
Countries RET Renewable Energy Technology R&D Research and Development RIF Regional Institutional Framework ROK Republic of Korea RMI Republic of Marshall Islands RPFS Regional Programme of Food Security SAMRIS Samoa Regional Information System SAP FAO Subregional Office for the Pacific SI Solomon Islands SIEA Solomon Islands Electricity Authority SIRIS Solomon Islands Regional Information System SOPAC South Pacific Applied Geoscience Commission SPC Secretariat of the Pacific Community SPREP Secretariat of the Pacific Regional Environment Program TA Technical Assistance TEC Tuvalu Electric Corporation TFS Training and Facilitation Support UNDP United Nations Development Programme UNFPA United Nations Population Fund UNIDO United Nations Industrial Development Organization UPNG University of Papua New Guinea USAID United States Agency for International Development VANRIS Vanuatu Regional Information System WFP World Food Programme

4
Contents Acronyms and abbreviations ............................................................................................... 2 Executive summary ............................................................................................................. 5 I. Introduction and background ......................................................................................... 10
Definitions: ................................................................................................................... 11 Food security policy and planning involving bioenergy, natural resources and climate change – why? ............................................................................................................... 12
II. Approach methodology ................................................................................................ 15 III. Preliminary findings .................................................................................................... 17
Notes on data ................................................................................................................. 17 Energy policy data .................................................................................................... 17 Food security policy data .......................................................................................... 19 Agriculture and economy data .................................................................................. 22 Natural resource GIS remote sensing capabilities .................................................... 22
Country summaries ....................................................................................................... 23 Vanuatu ..................................................................................................................... 24 Fiji ............................................................................................................................. 27 Samoa ........................................................................................................................ 30 Tonga ........................................................................................................................ 32 Papua New Guinea .................................................................................................... 35 Solomon Islands ........................................................................................................ 39 Niue ........................................................................................................................... 43 Marshall Islands ........................................................................................................ 45 Nauru ......................................................................................................................... 47 Palau .......................................................................................................................... 49 Tuvalu ....................................................................................................................... 51 Kiribati ...................................................................................................................... 53 Cook Islands .............................................................................................................. 56 Federated States of Micronesia ................................................................................. 59
IV. Conclusions and recommendations ............................................................................ 61 Acknowledgements ........................................................................................................... 66 References ......................................................................................................................... 67 Appendix 1: Terms of reference ....................................................................................... 69 Appendix 2: Survey of PICs ............................................................................................. 71 Appendix 3: Food production and import data for PICs ................................................... 75 Appendix 4: List of participants, PEMM 2009 and REM 2009 ....................................... 91 Appendix 5: List of persons met ..................................................................................... 101 Appendix 6: Programme of visit ..................................................................................... 108 Appendix 7: Completed survey forms ............................................................................ 111

5
Executive summary This report presents findings from a rapid appraisal of the bioenergy–food security nexus at the regional level, including selected Micronesian, Melanesian and Polynesian Pacific Island Countries (PICs). The aim of the appraisal was to provide policy-makers with a decision-making basis for the prioritization of in-depth country assessments and further analysis to be conducted in the second half of 2009 under FAO’s Bioenergy and Food Security (BEFS) analytical framework. The approach was to assess the data available in each country on energy/bioenergy, agriculture and the economy and natural resources and assess the ability of each country to provide or collect the required data with or without additional assistance. Of the 14 PICs, Samoa, Tonga, Fiji, Vanuatu, Papua New Guinea (PNG) and Solomon Islands (SI) were visited to interview governmental institutions, donors and key aid projects as well as private sector personnel. The aim was to verify available data and the ability to collect defined data for assembling a multisector food security, energy/bioenergy and natural resources policy at individual PIC government levels. For all countries an extensive database of information provided by the Council of Regional Organizations in the Pacific (CROP) agencies, donors, individuals and was compiled and reviewed, for each country, and a survey was sent to each PIC for completion. The outcome of the rapid appraisal is summarized hereunder along with recommendations. PICs have neither an integrated energy/bioenergy/food security and natural resource policy nor a policy framework or strategies as guidelines for energy and food security development in relation to the existing resource bases. Most PICs have no energy or food security policies. SI has the recent National Policy Framework involving policies and guidelines while PNG has a food security policy.
All PICs, with the exception of PNG and SI, have no updated GIS imagery – the last aerial photography was conducted around 1996. SI’s Forestry Division has recently updated data on forest cover and PNG has an updated PNGRIS database. SI, with help from the Australian Agency for International Development (AusAID), is preparing to carry out a strategic environmental assessment involving a broad inventory of forestry types and land use. Most PICs have minimal land area for large-scale planting of biofuel crops with the exceptions of PNG, Fiji and to a much less extent, SI. Most PICs, with the exception of PNG and SI, do not have the data available or the ability to collect data needed to develop integrated policy involving bioenergy, food security and the natural resource base. However Vanuatu is a good example of where technologies are being applied to make practical use of coconut oil as a vital energy source. With regard to bioenergy crops, no PIC country has a clear policy. A policy similar to that of the People’s Republic of China in which no basic food crop is to be used for

6
biofuel and no food cropland is to be used for biofuel crops is recommended for consideration as a starting point for all PICs. Apropos food security, the most critical cases would appear to be the Marshall Islands and Tuvalu. The economic collapse of the Marshalls and the inundation of Tuvalu as well as the existing extent of aid support contribute strongly to this urgent need. While most institutions and agencies consulted have a clear interest in seeing policies linking food security with energy/bioenergy and natural resources, the political will is often hard to judge because of lack of transparency in decision-making, particularly in terms of land use and concessions to logging, mining, agriculture development and real estate development in many PICs. Which countries are to be chosen for further in-depth study depends on the selection criteria that are adopted, inter alia food security urgency, energy deficiency, bioenergy opportunities, data availability, threats to the natural resource base, vulnerability to natural disasters, complementary support from the Food Security and Sustainable Livelihoods Programme (FSSLP) and other key donor support. The data provided in this report will allow choices based on the selection criteria chosen. There are clear options for more detailed case studies, such as: (i) coconut whole nut use including oil for diesel replacement and sustainable oil-palm planting in PNG and SI and the potential for palm oil biofuel development; (ii) integrated cassava production and processing including ethanol generation in PNG and Fiji; (iii) sugar cane linked to sweet sorghum off-season production for feedstock for ethanol, throughout the year, again in PNG and Fiji. The response from the PICs to the survey was disappointing with only three countries responding in some detail and most, except for the Marshall Islands, in an incomplete fashion. For better information it was essential to visit the countries and meet with key agencies as well as donors and CROP agencies. Surveys for the Marshall Islands and the six countries visited are now complete and contained in Appendix 7. Apart from the use of wood energy for cooking, drying of copra, cocoa and coffee and in some cases gasification, the main opportunity for most PICs is to use coconut oil as a diesel substitute, as practiced successfully in Vanuatu, especially for power generation. The exceptions are Nauru, Cook Islands, Niue, Tonga and Palau, which have low coconut production and where most coconut is used for human or animal food. The use of coconut oil as a diesel substitute in Vanuatu is a mature technology and the model for rural electrification where farmers bring copra to the oil plant and generator site to prepay for metered electricity is very successful. The programme is implemented by UNELCO and supported by the European Union (EU); it is operating in three sites and will extend to nine sites. It makes good sense to use the coconut resource to produce coconut oil for diesel substitution because copra and coconut oil prices on the world market are low and it is uneconomic to export. Use of the coconut for oil will give farmers further income and at the same time reduce diesel imports and fuel costs and save on foreign exchange.

7
There are options for the use of gasifiers but they have failed in most countries in the past with the possible exception of PNG for crop drying. Most PICs have scant opportunity for biogas production and success has been very mixed. Fiji and PNG have opportunities to produce ethanol from sugar cane and cassava and projects are planned with integrated cassava factories for Fiji and PNG. It was recommended that both PNG and Fiji consider including sweet sorghum as a crop with sugar cane to provide a summer feedstock to sustain a sugar factory for producing ethanol year-round. Use of breadfruit to make ethanol in Samoa would be very questionable with respect to economic viability and desirability because breadfruit is an important food crop. Fiji, PNG, SI and Vanuatu have been lobbied by investors with Jatropha curcas plantation proposals. To their credit, all applications have been refused to date. Jatropha plantations have been commercially unsuccessful worldwide and interplanting of coconut with Jatropha will disrupt food and cash crop production as well as livestock rearing options. The oil and oil cake are toxic, the oil needs reprocessing in three months and the plant has been declared a perennial noxious weed and invasive species in many countries (Chapman and Yishi 2008). Jatropha has no place in coconut areas because coconut is infinitely more useful in many different ways for food, fuel, feed and fibre; it is the main basis for very sustainable coconut farming systems in PICs. One investor group is proposing to promote Pongamia pinnata as an oil crop for smallholder farmers in Fiji. Pongamia trees are large and their thick canopies exclude sunlight, unlike coconuts, and take a number of years to be productive (ten to fifteen years to attain high yields). Once planted the trees will largely occupy all the land and exclude other cropping as trees mature. Single seed pods have to be hand-harvested and the economics involved have yet to be demonstrated. If Pongamia can be effectively harvested mechanically, it is possible that plantations may be successful, but the crop should not be promoted to smallholders to replace food crop or livestock areas. The seeds and oil as well as the oil cake are toxic and cannot be used for animal feed. PICs visited were generally unaware of the advantages or disadvantages of biofuel crops; a concerted effort is needed to inform energy and agriculture ministries about biofuels in more detail so they can address extravagant investor proposals that try to gain major plantation concessions. Oil-palm is a very successful crop in PNG and SI and is produced in a certified sustainable way; it provides secure incomes for smallholder diversified farming. Crude palm oil (CPO) is not used for biodiesel in either PNG or SI. PNG has 13 plantations and a refinery but SI only has a CPO and a palm kernel oil (PKO) plant. All the SI exports of CPO and PKO go to Europe and are used solely for food products. Third generation biofuels, as described briefly hereunder, could well become a reality in PICs, with the support of aid and public/private sector investments and cooperation. Such support for the future is recommended to aid agencies and investors. Third generation biofuel technology R&D and testing should be fast-tracked in PICs and both donor and

8
investor support for this work is very strongly recommended. Limited land area and a dwindling resource base is a reality for many PICs and economic, more efficient non-conventional solutions must be viewed as a very high priority for both energy and food security, while maintaining a sustainable resource base as far as is practicable. Third generation fuel from cellulosic ethanol production from fibre celluloses and lignocelluloses in waste materials such as sugar-cane bagasse, crop residues and by-products from crop processing such as cassava stalks, oil-palm empty bunches or fast growing tropical C4 grasses such as elephant grass or from legume fuelwood trees such as Gliricidia and Leucaena are clear options for the future for energy production. Use of sugar-cane bagasse can increase the yield of ethanol per hectare from around 3 500 litres to around 30 000 litres using cellulosic transformation to hexose sugars and their fermentation and distillation. The technology is being commercialized in the People’s Republic of China, Republic of Korea and Europe and is now a reality. Third generation oil production from algae is a new and very promising technology that when perfected may prove to be ideal for PICs as the productivity of oil per hectare is very high at levels up to 300 000 L/ha, but potentially is as high as 1.25 million L/ha (http://en.wikipedia.org/wiki/Algae_fuel). Research in the USA and Australia as well as other countries is well advanced on these technologies and their commercialization. The German Alpha Kat KDV technologies are used to convert waste from a whole range of sources, such as dump sites, animal wastes, plastics, paper, manure, sawdust and wood and sewage to diesel in a high temperature reactor process using catalytic depolymerization (SOPAC 2009). Butanol produced from anaerobic fermentation of starch, sugar, lignin, cellulosic fibre, lignin and other biomass with Clostridium acetobutylicium is another useful third generation biofuel that has a number of advantages over ethanol as a gasoline replacement (SOPAC 2009). The ethanolix continuous fermentation technology developed by St1 Biofuels of Finland produces ethanol from organic wastes. Production costs in much smaller plants compare very favourably with large first generation or second generation bioethanol plants. Household and municipal waste, paper, starch and sugar may act as feedstock and by-products/residues of the process, depending on feedstock, may be used for animal feed fertilizer or fed to anaerobic fermentation systems (www.st1.eu). The St1 company founded in 1997 acquired the Exxon Mobil subsidiary in Finland and operates over 400 service stations in Finland and 40 in Sweden. Synthetic diesel from the Fischer/Tropsch process using gasification of biomass is another third generation technology that in the near future may be feasible for a number of PICs with biomass resources. Clearly, when third generation technologies such as cellulosic ethanol and algae oil and the Alpha Kat KDV 500 waste treatment methods are introduced and found to be feasible in PICs then the pressure on food crops or food croplands and forests would be greatly reduced by these sustainable technologies. PICs could also dispense with the unacceptable options of Jatropha and other marginal biofuel crops and the concomitant

9
disruption with long-term sustainable coconut farm systems, which Pacific islanders know well and are able to manage sustainably. One very clear and urgent intervention in all PICs would be the regeneration of coconut industries and farming systems (including intercropping with food crops, fruits, vegetables, coffee, cocoa, vanilla, pepper and livestock rearing) and the rehabilitation and replanting of coconuts to replace the ageing coconuts present in all PICs. In addition such a programme should consider all the value-adding options of using the whole coconut for food, fuel, fibre, feed, oil, virgin coconut oil, handicrafts etc. It is recommended that donor agencies be alerted to these excellent intervention options to make a real impact on Pacific islanders’ livelihood improvements via income-generating opportunities. Donor support is urgently needed for coconut regeneration and rehabilitation in this context. Finally the resolution of energy needs in any individual PIC will often be a combination of bioenergy, solar, wind or other wave energy technologies depending on the resource options and capabilities of each country and likely impacts on food security. Again strong donor support for third generation biofuel technologies is recommended. Urgent and innovative third generation bioenergy technologies must be developed, juxtaposing economic renewable options.

10
I. Introduction and background
This report responds to a request by the FAO Subregional Office for the Pacific in Apia, Samoa and the Bioenergy Group of the FAO Natural Resources Management and Environmental Department in Rome, for a rapid appraisal of the bioenergy–food security nexus at the regional level in selected Micronesian, Melanesian and Polynesian island countries. The aim is to provide policy-makers with a decision-making basis for the prioritization of in-depth country assessments and further analysis to be conducted in the second half of 2009 under the Bioenergy and Food Security (BEFS) analytical framework. More specific data requirements for the BEFS framework will be noted, to the extent possible, during the appraisal. The Terms of Reference (Appendix 1) outline the background and tasks of the appraisal. The primary objective of FAO’s three-year BEFS project is to mainstream food security concerns into national assessments of bioenergy and establish an analytical framework for the analysis of the food security–bioenergy nexus. Currently, Peru, Tanzania and Thailand have been chosen for BEFS studies with the activities in Thailand planned to be closely linked to analysis in Cambodia. Some PIC countries will be added. The BEFS strategy is based on three central components:
(i) Development of an overall bioenergy–food security analytical framework and methodological guidance including data and information support.
(ii) Estimation of bioenergy potential and food security implications within specific national and subnational contexts.
(iii) Development of replicable and sustainable field activities that will strengthen institutional and key national stakeholder capacities.
Overall, the BEFS assessment includes five analytical steps, namely Module 1: Biomass Potential, Module 2: Biomass Supply Chain Production Costs, Module 3: Agriculture Markets Outlook, Module 4: Economy-wide Effects and Module 5: Household-level Food Security. More specific data requirements for the BEFS framework will be, to the extent possible, noted during the completion of the rapid appraisal, as they may additionally influence the selection of countries for more in-depth studies and analysis. In summary the data needs for in-depth studies will include:
Agriculture and economy • Identify the main food crops and crops considered for bioenergy in each country. • Collect food insecurity and vulnerability data at national and, if possible,
subnational levels. Special emphasis should be placed on the specific vulnerability of remote islands.

11
• Obtain data on each country’s agricultural trade balance to assess national self-sufficiency per crop.
• Assess national domestic demand for agricultural commodities and, to the extent possible, projected future demand.
• Gauge the scope and degree of policy commitment and action with regard to bioenergy programmes, regulation and political sensitivity for food security.
Energy • The share of different energy sources in the national energy mix. • The share of imported energy. • Assess current and projected future volumes and costs for import of fossil fuels
(crude oil, gas, gasoline, diesel). • Collect main fuel prices for consumers (gasoline/litre, diesel/litre, Kw/h). • Assess decentralized electrification (e.g. for on-farm use, telecommunication
towers, use in urban/rural transport etc.).
Natural resources • Identify, where possible geospatially, current land cover, land use and
(qualitatively) land-use change trends in recent years. Where available, collect information on crop-specific land use and on existing or planned crop suitability assessments.
• Assess water availability and constraints and irrigated area. • Assess scope of wood energy and most important challenges faced. • Highlight major environmental challenges in each country potentially linked to
bioenergy development (deforestation, biodiversity and habitat loss, water stress and pollution).
The purpose of the rapid appraisal is to determine data sources available in PICs and whether they need help in collection and synthesis of data to assess at least two likely countries for further in-depth studies under the BEFS Project later in 2009.
Definitions Bioenergy is defined as energy derived either directly or indirectly from derivatives of biological materials or biomass resources including agricultural crops and residues, forestry, livestock, waste, energy crops, algae and natural vegetation. Bioenergy is renewable energy from materials derived from biological sources as opposed to petroleum, coal, nuclear materials etc. In essence bioenergy is derived from biomass that either directly or indirectly derives from solar energy capture in biological materials.
Food security exists when all people, at all times, have physical, social and economic access to sufficient, safe and nutritious food that meets their dietary needs and food preferences for an active and healthy life. Household food security is the application of this concept to the family level, with individuals within households as the focus of concern (FAO 2002).

12
Food insecurity exists when people do not have adequate physical, social or economic access to food as defined earlier.
In the FAO National Medium Term Priority Framework (NMTPF) for 13 PICs 2009–2012, the focus areas for interventions such as food safety, quality and nutrition as well as production, sustainability, agribusiness and trade, policy and planning, fisheries etc., all target improved food security and income-earning opportunities in PIC countries; this is the central aim of FAO–government partnerships in the Pacific (Pacific Multi-Country NMTPF 2009–2012, FAO April 2009). Papua New Guinea, the fourteenth PIC, is now being addressed to prepare an NMTPF paper (Stephen Rogers, personal communication)
Food security policy and planning involving bioener gy, natural resources and climate change – why? The following extract from the State of food and agriculture (FAO 2008) essentially summarizes the likely impacts of biofuels, a possible major component of bioenergy in many countries, on the food security of especially poor households and reinforces the need for all countries to have firm well-guided policies on bioenergy in relation to food security. “The impact of bio-fuels on food prices remains the subject of considerable debate, as does their potential to contribute to energy security, climate-change mitigation and agricultural development. Even while this debate continues, countries around the world confront important choices about policies and investments regarding bio-fuels. These were among the topics discussed at FAO in June 2008 by delegations from 181 countries attending the High-Level Conference on World Food Security: the Challenges of Climate Change and Bioenergy. Given the urgency of these choices and the magnitude of their potential consequences, participants at the Conference agreed that careful assessment of the prospects, risks and opportunities posed by bio-fuels is essential. This is the focus of FAO’s 2008 report on the State of food and agriculture. The report finds that while bio-fuels will offset only a modest share of fossil energy use over the next decade, they will have much bigger impacts on agriculture and food security. The emergence of bio-fuels as a new and significant source of demand for some agricultural commodities– including maize, sugar, oilseeds and palm oil – contributes to higher prices for agricultural commodities in general, and for the resources used to produce them. For the majority of poor households who consume more food than they produce, higher prices can pose a serious threat to food security – especially in the short term” (FAO 2008). This position on food in relation to biofuel development was flagged by various key world agencies including the CGIAR1 Science Council in April 2008, International Food Policy Research Institute (IFPRI) policy briefs in May 2008 and an Organisation for Economic Co-operation and Development (OECD) policy brief in November 2007 (among many others); these were forerunners to the June 2008 FAO Rome meeting that comprehensively and in detail set forth the position and policy challenges for world food security in relation to the challenges of climate change and bioenergy.
1 Consultative Group on International Agricultural Research.

13
The current challenges are to help PICs develop policies on food security in relation to both bioenergy, especially biofuel crops, and climate change. For example, in the People’s Republic of China from March 2007, the official government policy directive was not to use food crops for making biofuel and not to use food croplands for growing biofuel crops. By-products of food crops such as stover/crop residues, molasses etc., are considered second generation biofuel feedstock and may be used for biofuel manufacture. Similar positions to those of the People’s Republic of China may or may not apply or be appropriate for PIC countries, thus the need for research on food security in relation to both bioenergy and the natural resource base, which are both critical issues for these countries. Bioenergy from biofuels will be an unlikely substitute for a significant proportion of the energy needs of most countries, because of limited land areas. IEA (2006) estimated that only 4 to 7 percent of road transport fuels would be provided by energy crops by 2030. Biofuel effects on climate change are not all positive. The complete life cycle of a biofuel crop or biomass energy source must be undertaken to reveal the real benefits of reduction in greenhouse gases (GHG) and reduced carbon footprints, likely carbon credits, etc. In many instances, due to the effects of clearing forests and new land areas, the benefits of biofuels are negated for very long periods by the release of CO2 and methane from the initial land clearing (FAO 2008). Lloyd (2009) reported that the present emerging experience indicates current energy crops contribute little to GHG abatement, but that if and when lignin/cellulose digestion and fermentation and biodiesel conversion technologies are perfected and are cost-competitive for perennial plants, the position may improve and in particular reduce land competition with food crops and reduce distortion of food commodity prices. The Environment and Agriculture paper (FAO COAG 2007) emphasized the urgent need to address the nexus between bioenergy, biosecurity and climate change in agricultural policy. Further, the report by FAO/SPREP (2008) emphasized that climate change will exacerbate threats to food security already present. The report proposed a list of urgent short- and long-term measures for regional action and the need to build resilience into food production systems particularly via diversification options for growing and using crops, among other key issues and proposals. The SPC/SOPAC Pacific Regional Biofuel Workshop in Fiji 2008 estimated that for many PICs, 20 to 30 percent of current fossil fuel demand for power generation and transport could be replaced with biofuels, using readily available technologies to convert existing biomass resources. The comprehensive workshop addressed a wide range of strategy issues aimed at striking a balance between increased resilience for food and

14
energy while reducing poverty; the paper gives “A framework for national biofuel policies to reshape the energy and agricultural sectors of Pacific island countries, recognising the Pacific region’s vulnerability to the effects of climate change” (SPC/SOPAC 2008). Pacific Island Developing Member Countries (PIDMCs) remain highly exposed to oil price shocks that can weaken sound macroeconomic policy management and negatively impact business and household welfare. The Asian Development Bank (ADB} continues to advocate use of economic analyses to strengthen energy policy and planning and overcome PIDMC weaknesses to shift towards more diversified energy options and bulk fuel procurement and modify fuel supply arrangements (Woodruff 2009). These points clearly indicate that PICs are well informed about the interactions and competing issues among food security, biofuel/biomass energy, natural resources and climate change and the need for a multisectorial approach in each country. The challenge is how to achieve sustainable policies and practical implementation. However, recent missions to selected PICs during the rapid appraisal have revealed that many government institutions, power-generating utilities and private sector groups are unaware of the advantages or disadvantages of biofuel crops that internal and external investors are trying to promote.

15
II. Approach methodology This rapid appraisal involved collecting data from the 14 PICs, CROP agencies, key donor agencies, the Energy Working Group (EWG) and approaching individual scientists and consultants; Samoa, Tonga, Fiji, PNG, Vanuatu and SI were visited to determine what key data are available at the country level and the extent of work done on food security and bioenergy and likely future needs to fill the gaps. In addition a survey was conducted to assess what data individual PICs have and can access readily or if more help is required to assemble and synthesize time series data for five years or more on agriculture and economy, energy and natural resources. The survey also asked if each country has a recent policy on food security, and if so, whether the policy includes bioenergy crops and whether each country has a national agricultural development plan (see Appendix 2). The first visits to Samoa, Tonga and Fiji, coincided with the Pacific Energy Ministers Meeting and the Regional Energy Officials Meeting in Tonga in 2009; this provided an opportunity to meet country ministry officials, and representatives of CROP energy agencies, the EWG, donors, the United Nations Industrial Development Organization (UNIDO) and private sector and institute participants. Discussions with key persons provided considerable background information on energy, including bioenergy, for this report. Detailed collection of time series data on agriculture and economy, energy and natural resources by an individual in the narrow window of the consultancy work was considered impossible by both the consultant and FAO–SAP; this message was conveyed to the bioenergy group of the FAO Natural Resources Management and Environmental Department in Rome, prior to the contract being finalized. It was agreed that the rapid appraisal would try to determine if such data might be available, and in which areas and countries, and at the same time identify countries that would need significant help in collecting information on agriculture and economy, energy and natural resources. It was felt that the study would try to:
• Assess which countries already have a policy on food security and energy, in particular bioenergy, and have recent natural resource base data that are worthwhile.
• Assess interest, willingness, opportunity and commitment by individual countries
to proceed with bioenergy initiatives.
• Prepare country summaries of the positions on energy/bioenergy, food security and natural resource policy and data. Also to identify PICs with larger tracts of land and natural resources that could be diverted into growing additional bioenergy crops and countries where there are surplus resources; for example, coconut or other products such as wood, animal wastes etc., that could be utilized in a sustainable and economic way for bioenergy production.

16
As a short additional task a briefing report was prepared for the Eighth Meeting of the FAO South West Pacific Ministers for Agriculture, Alofi, Niue, from 20 to 22 May, 2009. Dozens of electronic documents and reports comprising over 2 500 pages of information from individuals in ministries, institutes, CROP agencies, donors and FAO backstopped the appraisal.

17
III. Preliminary findings
Notes on data
Energy policy data There appears to be a wealth of accumulated knowledge and studies on energy including renewable energy and bioenergy in PICs. The Pacific Islands Policy and Strategic Action Planning Project (PIEPSAP) of SOPAC/UNDP/Government of Denmark (2004–2008) had as its overall objective the development of national energy policies, plans and mechanisms within PICs, which influence national efforts towards achieving the PIEPSAP vision of available, reliable, affordable and environmentally sound energy for sustainable development among all Pacific islanders. However, energy R&D and provision of energy, particularly rural energy, varies considerably from country to country and the Pacific Islands Renewable Energy Project’s (PIREP) renewable energy studies for SPREP/UNDP/GEF (2003–2004) have been recently flagged for updating to address these issues. The information collected in these studies and those of SOPAC/ICCEPT (2003), are another repository of individual PIC country biomass and renewable energy data, but with far less detail than the SPREP/PIREP individual country reports. Resolutions from the recent Pacific Energy Ministers Meeting (PEMM 2009) and the Regional Energy Officials Meeting (REM 2009) clearly indicate that the time series energy data on energy available over a number of years for each country are highly deficient for many PICs and are a priority for the future. Even obtaining reliable time series petroleum data on country use and demand is very difficult because oil companies are often unwilling to cooperate and even the split between bunkering/refueling of ships/boats and domestic use is often not available (SPREP 2004a). SPREP (2004a) summarizes the status of national energy policies and energy plans or components of national development plans for PICs. Most countries, except Nauru and Palau, had made some attempt at development of national energy policies that are clearly very variable regarding cabinet approval and effectiveness. All policies or drafts are likely to require updating and in addition adjustment to incorporate food security policy as well as natural resource base and climate change cross-cutting issues. The PIEPSAP recommendations given hereunder to the REM meeting in Cook Islands in 2007 re-enforce the need for better energy policy planning and development. It was recommended that ministers: 1. Consider the need for a permanent planning and policy development facility in the
region and emphasize the need to coordinate energy sector development among all regional and national stakeholders and relevant donors.
2. Call for more tangible regional collaboration in the energy sector in order to harness joint benefits through:

18
(a) free exchange of data and information amongst energy sector stakeholders in the region;
(b) harmonization of energy sector regulations to create a conducive climate for private sector-led energy sector investments;
(c) regional benchmarking of energy service providers; and (d) joint procurement of fuels, goods and services.
3. Agree on the need for the establishment of a regional energy financing facility that firmly links energy sector planning with sustainable energy sector investments.
At the 2009 Regional Energy Meeting in Tonga the official 2009 Pacific Energy Ministers Communiqué underscored the following key priority areas: 1 “Ministers in noting the progress in the implementation of the Regional
Institutional Framework (RIF) and the implications on energy recommended and agreed to the following:
a) That regional and donor coordination delivery of energy services to Pacific island countries be strengthened and delivered through one energy agency and through one programme contributing to the development of a stronger energy sector and improved service to member countries; and
b) In this context it was noted that there was a need to ensure that energy policy and climate change policy remained separate where environmental aspects are managed by SPREP and energy sector activities by SPC so as to ensure that the socio-economic aspects of energy were adequately addressed.
2 Ministers underlined the need to strengthen human capacity development initiatives to support national and regional energy programmes including gender mainstreaming; and further noted on-going need to focus on development of apprentice schemes for power utilities and alternative energy technologies.
3 Ministers expressed the need to review and as appropriate strengthen national
capacity in energy data and information gathering and collation, management, dissemination and, analysis on economics, social and environment to better inform national and regional energy planning and policy choices where this should be incorporated into the one energy agency.
4 Ministers acknowledged progress in the implementation of the regional bulk fuel
procurement initiative and called upon CROP agencies to continue to support PICs to move the initiative to implementation.
5 Ministers encouraged the necessary actions that would facilitate investment in
sustainable renewable energy technologies and in energy efficiency and energy conservation initiatives.
Ministers in highlighting these five key priority areas acknowledged that all Pacific island countries are individual and unique in their own respect and accepted that the other

19
outcome areas as recommended to the Ministers be individually assessed on a case by case basis as countries deemed necessary and on the availability of human and financial resources. Clearly there is now united will among all energy ministers to push forward on policies and initiatives on all fronts to improve and strengthen energy supply and security in PICs.
Food security policy data To date investigations indicate, in contrast to energy, a dearth of recent R&D on food security policy; there are various policy-related studies completed, ongoing or proposed on agricultural policy and national agricultural development plans that can/will support food security policy development and strategies or plans. FAO’s FSSLP in PICs has been revised down to US$41.8 million from US$71 million. To date the FSSLP has not been funded for implementation. An extract from recent communications with Fintan Scanlan, FAO Rome is given hereunder: Component 3 of the FSSLP will provide support to countries’ food security initiatives, through strategic planning and implementation support, and key initiatives involving more than one country or even at the regional level. Its objectives are to bolster national initiatives through enhanced capacities, strategies and policies; address food security issues of cross-cutting and regional/sub-regional nature (e.g. climate change); and help fill gaps not readily covered by individual country projects (such as food safety standards and international trade issues). Taking into consideration the findings of the Independent Evaluation of the Regional Programme of Food Security (RPFS), multi-country initiatives will be designed keeping in mind the diversity in circumstances between countries and sub-regions. The Programme will ensure design of such activities is cognisant of, and have clear linkages to, strategies and priorities of individual countries. This component has two sub-components.
Sub-component 3.1. Training, Facilitation and Assessment Support to Countries. This sub-component will provide training and facilitation support to the countries to help build capacities in food security vulnerability assessment and strategy processes, project planning/design, and in monitoring and evaluation. Training and Facilitation Support (TFS) specialists will be deployed on a needs basis, to cover countries by cluster, or sub-regional basis, for at least the first three years of the Programme. A core pool of experienced specialists will be used, to ensure consistency and cross-country learning. They will, with guidance of RPMU and in collaboration with other specialist personnel, help organise training for the NPCs/country project teams. They will use a training of trainers approach, along with hands-on technical assistance and mentoring, to provide learning on the job.
The Programme will support the NPSCs in each country to do a national food security assessment (NFSA), at the time of programme start-up (or prior to, where possible). Guided by the NPSCs, the NPCs, with RPMU and the TFS support, will initiate

20
development or refinement of a national strategic framework for food security, based on the national food security assessment. This will be done iteratively, drawing on experience gained during programme implementation. The strategy will define priority (sub-) sectors, the programme area and the target groups. It will undertake more detailed participatory assessments as necessary, especially in the early years.
Sub-component 3.2 Support to Multi-country Food Security Initiatives. This sub-component will support multi-country food security initiatives in the following Programmatic Areas: 1) Planning, policy and programme development support; 2) Climate change preparedness, adaptation and mitigation; 3) Food quality and safety improvement; and 4) Facilitation of trade and marketing. These Programmatic Areas will make an important contribution to programme objectives through capacity strengthening and supporting strategic actions to address immediate as well as longer term food security challenges at country and regional levels. Initiatives in other areas are not ruled out, however, and there will be sufficient flexibility for inclusion of others, if found to be justified during programme implementation (FAO 2008). Clearly the above programme if/when funded and implemented would give the desired opportunity to link food security policy development with energy and bioenergy policies as well as natural resource and climate change policies in all PICs. Pacific island food security: situation, challenges and opportunities by McGregor et al. (2008) highlights urgent food security issues and the need for action. Similarly, Sharma (2006) reported on Food security in the South Pacific island countries with special reference to the Fiji Islands. At the SPC/Committee of Representatives of Governments and Administrations (SPC/CRGA) meeting in Noumea in 2008 a paper was presented by the secretariat on food security in the Pacific. It emphasized the precarious positions of many PICs with regard to food production, food imports and food prices and that threats to food security require a multisectoral approach involving society and government in toto A worrying feature of agriculture in PICs is, as Reddy (2007) clearly points out, that agriculture – particularly the crop sector (not livestock) – has leveled off since the 1980s and expansion of land under cropping, changes in farming systems and adoption of new technologies are urgently needed to improve food security. The World Bank (2008a) hosted a very useful meeting in Sydney in July 2008 on the impact of global oil and ‘Food price increases on the Pacific region and possible mitigation measures.’ This meeting, among other very useful outcomes, produced a Pacific food and fuel related activities matrix by agency document that listed for each PIC the activity names and descriptions for each agency including the World Bank, SPC, WFP, UNDP, NZAID, PIFS, FAO, IFAD, AusAID and ADB. The matrix reveals that in matters related to food security:
• The World Food Programme (WFP) has concentrated in recent times on food vulnerability and vulnerability mapping in partnership with the International Fund for Agricultural Development (IFAD).

21
• In July 2008 IFAD had a pipeline proposal on a Regional Food Security and
Sustainable Livelihoods Programme for PICs.
• Recently, the United Nations Development Programme (UNDP) has been concentrating on poverty analysis and energy and poverty in PICs (UNDP 2007); also, policy and technical advice on poverty reduction, MDG achievement, sustainable livelihoods and energy as well as support to household income expenditure surveys.
• AusAID supports the Department of Food Security in Timor-Leste and has
recently funded an FAO/AusAID food security study.
• UNDP is supporting the Integrated Climate Change Adaption Project 2008–2012 in Samoa, which will cover climate change, agriculture and food security.
• UNDP is also supporting MDG Achievement and Poverty Reduction 2008–2012
for 11 PICs; the focus is on sustainable and affordable energy services for the poor with inputs on pro-poor interventions, policy and institutional arrangements for mainstreaming poverty–energy issues, especially with renewable energy.
• UNDP is continuing to support renewable energy, energy efficiency and carbon
financing initiatives in selected PIC countries.
• FAO has been involved recently in the following food security policy-related areas:
• Cook Islands: Agricultural Policy Review 2008. • Nauru: Strategic Plan for Sustainable Development in Nauru 2004–2008. • Papua New Guinea: Formulation of a National Agriculture Development
Plan 2005–2007. • SI: Formulation of a National Agriculture Development Policy 2008–2012.
Rejected by the government. • Vanuatu: Formulation of the Agricultural Policy for Vanuatu 2007–2008. • All Forum Island Countries: Regional Food Security Project in PICs –
Component 2. Strengthening Agricultural Trade and Policy. • Vanuatu Agriculture Sector Study 2007–2012. FAO–SAP document. • All PICs: The FSSLP, which has some policy elements. Pipeline status, as
discussed earlier. • FAO Assessment of the Impact of Climate Change on Agriculture and Food
Security in the Pacific (case studies on the Cook Islands, the Marshall Islands and Vanuatu) 2007–2008.
• The Pacific Economic Survey 2009 is under preparation with AusAID support; it will be helpful in preparation of food security policies and strategies.
• Formulation of the NMTPF for 13 PICs, 2009–2012, which has a clear food security target. A separate NMTPF study is now being conducted for PNG.

22
This report provides the most recent information on food security policy and constraints to development.
Agriculture and economy data Data on food production (tonnes per year) and areas harvested in hectares are available from FAOSTAT for all 14 PICs (Appendix 3); the data encompass major food crops (coconut, cassava, sweet potato, taro and rice) for countries that grow them. Also, food imports for nine countries – wheat, rice, flour, chicken, processed fish, canned beef and canned tuna (Tim Martyn [SPC] 2009, personal communication). However, for some countries there are many gaps in the data from year to year and all data depend on local collection capabilities and often no account is taken of subsistence production on home plots and very small landholdings. Without Household Income and Expenditure Surveys (HIES) and food security surveys, the overall picture of individual countries on food security may be far from clear because pockets of poverty in isolated areas and islands are often found. The PIREP/SPREP (2004) national reports for each of the 14 PICs give a snapshot of each country, with respect to aspects such as land area, economy, population income and MDGs. Similar data in more detail are available in the NMTPF (2009) and FAO National Agricultural Policy and National Agricultural Development Plan Reports for individual countries.
Natural resource GIS remote sensing capabilities For most countries, the land and survey departments have a GIS-based mapping system that would allow the matching of plants to land. However, the status of the systems and updates are variable (Aru Mathias, FAO–SAP, personal communication):
• In PNG, the Agriculture Department and the National Forest Authority have an upgraded/advanced version of the AusAID-developed PNGRIS similar to SI’s SIRIS and Vanuatu’s VANRIS. Recently, the University of PNG has been releasing some data and information based on satellite image analysis.
• UNDP is supporting Capacity Building for Sustainable Land Management
Medium Size Projects which will involve integrated land-use planning with an improved GIS.
• In Samoa, SAMRIS is housed in the Forestry Division of the Ministry of Natural
Resources and Energy (MNRE).
• In Palau, the Ministry of Lands and Survey has a GIS unit while in Niue GIS is with the Lands Department and Planning Unit.
• Kiribati, Tuvalu and the Marshall Islands all have GIS units in the Ministry and
Department of Lands.

23
• Member countries of the South Pacific Applied Geoscience Commission (SOPAC) are provided with technical training and are given hardware and software, and some data. For most countries the capacity to keep updating, upgrading and expanding the GIS systems is a problem.
• In Tonga, the Lands Department has a GIS system, and mapping of the whole
country is being updated.
• Most countries have the soil attributes (or soil types) in their systems. Except for PNG, all countries visited need upgrading with respect to recent satellite imagery for land cover and land-use databases.
Country summaries In this section, a summary of energy/bioenergy, food security, natural resource base data and policies is given for each country based on reports, available data, surveys and country missions The PIREP/SPREP assessments of 2003–2004 considered bioenergy to be derived from multiple biomass resources and these were investigated and presented in detail in each of the 14 country reports (SPREP 2004a). Prior to the PIREP assessments, in 2003 SOPAC proposed a Master plan for biomass resources of Fiji, Kiribati, Samoa, Tonga, Tuvalu and Vanuatu (SOPAC 2003a) and produced the synthesis report, The biomass resources of Fiji, Kiribati, Samoa, Tonga, Tuvalu and Vanuatu (SOPAC 2003b). These reports were much less detailed than the PIREP/SPREP reports but the Technical Assistance (TA) by the Imperial College, London in a consultancy for SOPAC provided valuable training for the countries involved in biomass and biomass assessments. The energy and biomass positions for each country have been summarized from existing SPREP country reports, missions to some countries, other SOPAC and CROP agencies’ reports and survey results. Eleven PIC countries are included in the UNDP/GEF Pacific Islands Greenhouse Gas Abatement through Renewable Energy Project (PIGGAREP). The PIGGAREP/SPREP/UNDP/GEF Project 2008–2012 seeks to reduce GHG emissions by cost-effective use of commercially viable renewable energy technologies. The TA will be particularly beneficial to those countries with limited experience and capacity in renewable energy.

24
Vanuatu (Information sources: PIREP/SPREP reports 2004; SOPAC reports; World Bank [2008a,b,c] and reports mentioned earlier along with visits to key agencies, country visit and survey results.) Land area (km2): 12 189
Sea area/EEZ (km2): 680 000
Population: 217 000 (2005)
Annual growth (%): 2.6
Density (inhabitants/km2): 16 (2005 estimate)
Rural population (% of total population): 76%
GDP (US$ million): 368.9 (2005)
GDP per capita: US$1 700 (2005)
GDP real growth (ave.1996–2006): 2.5% per annum
Primary sector GDP (% of total GDP): 14.7% (2006)
Trade balance: US$75 million (exports as % of imports): 14.8% (2007)
Food and live animals as % of total imports: 17.2% (2006)
Budget allocation for agriculture (2007): VUV405 million (US$4 million) % of total budget: 3.4%
Human Development Index: 0.674 (2008) Position,120 out of 177 countries
Source: NMTPF (2009).
• Vanuatu has more than 80 islands of which 65 are populated. Most islands are mountainous and of volcanic origin; there are narrow coastal plains exposed to tropical cyclones. Vanuatu has a high occurrence of natural disasters including cyclones, floods and drought; volcanic activity, including eruptions, can cause earthquakes and tsunamis.
• “A productive agriculture sector is important for the national economy, vital for food security and rural poverty alleviation, and also provides links to downstream industries such as agricultural processing. Agriculture (including forestry and fisheries) accounted for approximately 15% of GDP and almost all merchandise exports in 2006. Agriculture consists of two sub-sectors: subsistence smallholder farming, and large commercial farms and plantations. Coconut oil, copra, kava and beef contribute about 20% to total exports. Outputs from cash enterprises and export commodities are more dominant than the purely commercial plantation agricultural sector; smallholders produce 80% of copra, 70% of cocoa, 20% of beef, and all kava” (NMTPF 2009).
• Vanuatu has no mineral resources, oil or gas and its forest resources are limited and not easily accessed.
• Energy policies are formulated in the Energy Unit within the Ministry of Lands, Geology, Mines, Energy, Environment and Water Resources.
• Vanuatu is predominantly dependent on imported fossil fuel for commercial energy. The Energy Unit cannot access fuel import data from oil companies.
• Biomass provides about 50 percent of the gross national energy production. • Fossil fuel use: Transport 64 percent, electricity generation approximately 30
percent, direct household use 4 percent. Recent fuel import data are very difficult to obtain since fuel companies are uncooperative.

25
• Ninety-five percent of households cook with fuelwood. • Annual petroleum fuel use is expected to grow by 3.5 percent per annum. GHG
emissions could be reduced by about 15 percent over the period 2003–2013 mainly by using biofuels.
• Vanuatu has good forest cover but in some areas it has been declining rapidly in recent years. Waste wood is already used as an energy source but is widely dispersed and wood-based power generation is not promising. There is good scope for introducing fuel-efficient cooking stoves for fuelwood, charcoal and other wastes so communities can burn biomass more efficiently and hygienically.
• There is only limited potential for biogas from animal waste or landfills. • A 25 KW gasifier at the Onesua Presbyterian College has not been used in recent
years. • Vanuatu, like PNG, Fiji and SI has been receiving proposals for large-scale
Jatropha plantations; it is pleasing to note that they have been firmly rejected. Replanting of coconut is a far better proposition because the sustainable coconut-based farming systems will be retained.
• Vanuatu has considerable experience and mature technologies for replacing diesel with coconut oil for transport and power generation. In recent years, copra output has been around 40 000 tonnes, which could produce 27 000 tonnes of coconut oil equivalent in energy content to 28 million litres of diesel or enough to replace all diesel fuel imports. However, the economics of the production of coconut oil for diesel replacement have to be considered carefully in relation to rural demand by widely dispersed communities for electric power. Shipping coconut oil even from Santos to Efate may not be economic depending on diesel and coconut oil prices. However, in spite of these constraints UNELCO and others such as the Teouma Prawns group are expanding coconut oil production in Efate, Malekula and Epi islands to replace diesel. The technologies for making and using 100 percent coconut oil to substitute for diesel in Vanuatu are impressive, well advanced (compared to other PICs) and well validated. Vanuatu uses copra as prepayment for electricity in small local grids in rural areas and runs generators on coconut oil processed at the generation facility. The model supported by EU funding and implemented by UNELCO works very well and is operating efficiently in three rural locations; each location serves 100–600 households. The aim is to extend the model to nine rural locations.
• The PRIREP/SPREP report of 2004 recommended a coconut oil/biofuel study for replacing fossil fuel use in power generation and transport at a scale of 5–30 million litres per year and to enhance government revenue, rural incomes and employment. The same report recommended that advisers should help Vanuatu review and draft energy policies and prepare practical policy documents for cabinet consideration.
• The PIGGAREP/SPREP/UNDP/GEF Project, which seeks to reduce GHG emissions by cost-effective use of commercially viable renewable energy technologies, includes Vanuatu.
• Vanuatu has very good scope for use of biofuel energy from existing coconut oil and copra (Chaniel 2009). Use of this coconut resource, if economic under Vanuatu’s existing tax laws and fuel regulation, will be unlikely to impact negatively on food security provided generation of power and fuel production are close to the resource and the community served.

26
• UNELCO has also recently successfully developed a wind farm for electricity generation on Efate.
• In summary, lack of energy legislation and national energy policies are significant problems for energy development, including bioenergy. An Energy Unit Business Plan 2000–2004 provides some guidance at present. Vanuatu would need assistance in the collection of energy data. No final energy policy has been approved by the government.
• There is no recent food security policy but FAO recently completed the Study on the Assessment of the Impact of Climate Change on Agriculture and Food Security in the Pacific in 2007–2008 and this will assist with policy formulation as will the Agricultural Census 2006. The Vanuatu Agriculture Sector Study 2007–2012 document will assist with food security policy and planning. Data are comprehensive but more HIES are needed in Vanuatu because food is expensive and due to vulnerability to natural disasters, the country is quite susceptible to food security problems, especially in urban areas. However, further assistance would be needed in formulating and integrating food security and energy policies. This would have to take into account biomass/biofuel opportunities and the natural resource base, because there is limited financial and human resource capacity for sectoral development in the Ministry of Agriculture, especially in research, extension and information acquisition/dissemination (NMTPF 2009). Overlogging, excessive land clearing and concomitant impacts on biodiversity and natural resources – complicated by climate change and natural disasters – point to an urgent need to update the natural resource inventory. Vanuatu has the VANRIS database for natural resources but the data on satellite imagery and aerial photography have not been updated since 1997; help will be needed to update the natural resource base for policy and planning. Vanuatu is not a resource-rich country and being mountainous and highly prone to natural disasters, food security is a very high priority.

27
Fiji (Information sources: PIREP/SPREP reports of 2004; SOPAC reports; World Bank [2008a,b,c] and reports mentioned earlier along with visits to key agencies, country visit and survey results.) Land area (km2):18 272
Sea area/EEZ (million km2): 1.26
Population: 827 900 (2007)
Annual growth (%): 0.5
Density (inhabitants/km2): 45 (2007)
Rural population (% of total population): 49 (2007)
GDP (F$ million): 4 647.7 (2006) US$2 695.7 million
GDP per capita: F$6 610 (2006) US$3 175
GDP real growth (ave.2001–2006): 3.13% per annum
Agriculture sector GDP (% of total GDP): 11% (2006)
Trade balance: US$1 058 563 000 (exports as % of imports): 42% (2007)
Food and live animals as % of total imports: 15% (2007)
Budget allocation for agriculture/forestry/fisheries (2007): F$28.3 million % of total budget: 3.7%
Human Development Index (2005): 0.762 Position, 92 out of 177 countries
Source: NMTPF (2009).
• Fiji consists of 320 islands of which about one-third are inhabited. Most of the land area is volcanic islands that rise to over 1 000 metres. The climate is tropical with 1 800 to 2 600mm of rain per year. Viti Levu and Vanua Levu occupy about 87 percent of the land area. The country is susceptible to natural disasters including cyclones, earthquakes and floods. Fiji has good natural resources with rich timber stocks, fertile soils, considerable mineral deposits and ample fishing grounds. It is much richer in natural resources than many Polynesian and Micronesian PICs (PIREP/SPREP 2004).
• “Subsistence farming and sugar cane production dominate the agricultural sector. In 2004 the structure of the agriculture sector was as follows: crops and livestock, 73%; forestry 10%; and fisheries 17%. Subsistence production provides 38% of the total agricultural GDP, sugar cane 27%, other crops 16% and other sub-sectors 19%. Agriculture is a key part of the Fijian economy in terms of its role in providing subsistence in the rural areas and helping in ensuring food security for the society as a whole, as well as contributing to export earnings and foreign exchange. A combination of declining sugar export earnings and increasing external debt servicing are combining to reduce foreign exchange purchasing power for imported food-stuffs thus increasing food security vulnerability in Fiji” (NMTPF 2009.

28
The December 2006 military coup has crippled Fiji's democratic institutions and this has further complicated food security issues, policies and planning; it has also led to loss of EU sugar concessions.
• The Department of Energy is responsible for energy policy and off-grid rural electrification. The Fiji Electricity Authority is responsible for electricity.
• Fiji has three suppliers of petroleum, namely BP, Shell and Mobil. • Fiji has good data on energy and has the highest renewable energy mix of any of
the PICs. Currently about 40 percent of the total energy cost is transport fuel. Fiji is the last port for delivery of petroleum fuels in the Pacific.
• Fiji has specific objectives on the formulation of a national energy policy. However, there is no consistent national policy that provides continuity of programmes through changes of government. The Department of Energy has sought assistance from SOPAC’s PIEPSAP project to develop a new national energy policy. The Fiji Electricity Authority has received support from PIEPSAP on regulation and other aspects of pricing.
• Fiji could reduce GHG emissions by 90 percent and in principle use all renewable energy to produce electricity for the grid system.
• Biomass provides about 50 percent of the total gross energy use in Fiji. This comprises biomass bagasse from sugar cane burned for heat and electricity (65–70 percent), 25 percent for household cooking and 5–10 percent for copra drying. Wood waste and coal are used in the sugar-cane industry off-season to substitute for bagasse for electricity generation (PIREP/SPREP 2004).
• About 10 000 tonnes of coconut oil are produced each year, which could be used for diesel replacement. Coconut oil has been used successfully to operate diesel generators in two rural locations in the past but the local coconut oil supply system broke down and import of coconut oil from other locations proved uneconomic. With current low copra export prices there may be more opportunity to expand use of coconut oil as a diesel replacement. Current assumptions are that around 20 percent of coconut oil produced may be used for fuel in due course. Fuel standards are a key issue for B5 cocodiesel (World Bank 2008b). Initial conclusions from a feasibility study for biodiesel in Fiji were somewhat negative for coconut oil production for biodiesel. This was because the prices then for coconut oil were high, coconut trees were ageing and volumes of oil were low compared to industry standards at present. It was estimated that approximately 5 percent of a biodiesel blend would use up current copra/oil exports.
• Discussions indicated that Fiji is very interested in the Vanuatu technologies of UNELCO for using coconut oil to replace diesel for power generation and rural electrification.
• The FAO Coconut Multi-purpose Processing Project TA recently assessed the feasibility of setting up whole-nut processing centres in strategic locations as a way to assess rural coconut farmers for production of a range of products (Bawalan 2008).
• Fiji produces ethanol from sugar molasses and it is estimated that enough could be produced to replace 10 percent of petrol used from sugar cane and other crops. To date ethanol production has been marginal cost-wise for liquid fuel production. Good opportunities exist for ethanol production from sugar, molasses and sweet sorghum and the government is keen to revisit these options.

29
• Cassava for ethanol production and Pongamia trees for fuel oil are being examined as possible future biofuels. Sweet sorghum would fit well into the sugar-cane growing and harvesting cycle and would provide a source of feedstock for sugar-cane factories for ethanol production in the off-season. The World Bank 2008c Feasibility Study for Ethanol in Fiji concluded that the most attractive feedstock for ethanol production was molasses and that there is potential to produce ethanol to meet the needs of the domestic market but not for exports. Cassava was not seen as a viable feedstock. Sweet sorghum, which has very good potential for supplementing molasses alcohol, is an ideal off-season crop to give year-round production of ethanol. However, sweet sorghum was not considered by the World Bank study. With the loss of Fiji’s EU support for sugar or alcohol imports it may be more profitable in future to turn most of the sugar-cane crop into alcohol to save foreign exchange on imports of gasoline. An overseas investor is promoting Pongamia pinnata as an oil tree resource. Extravagant claims are made on its productivity and oil production, but to date the economics of production have yet to be validated given the high cost of harvesting if hand harvesting is practised. Pongamia plantings by smallholders could prove a major problem as the large trees, unlike coconut, cannot be intercropped because tree canopies completely exclude direct sunlight. Pongamia plantations might work if the costs of production are competitive and this will largely depend on the ability to cheaply harvest the crop mechanically.
• Fiji like PNG, Vanuatu and the Solomons has been receiving proposals for large-scale Jatropha plantations, which it is pleasing to note have been firmly rejected.
• SOPAC (2009) has produced a very useful guideline (Miscellaneous Report 677) on the potential of liquid biofuels in Fiji.
• Suva has an opportunity to produce energy from biomass waste of over 100 000 tonnes/year, increasing to 135 000 tonnes by 2013.
• Biogas opportunities exist in dairy farms, piggeries and poultry farms; new designs focusing on improved waste disposal control, with biogas used for domestic cooking and digested materials for fertilizer are proving more successful than earlier attempts.
• A number of Renewable Energy Technology (RET) initiatives are planned for Fiji and include biomass wood energy and bagasse burning for electricity.
• Fiji has very good scope for further developing ethanol and coconut oil for fuel in both transportation and power generation. It is unlikely that there will be conflicts in food production because Fiji has relatively larger tracts of land, help from both the government and private sector as well as customary lands. The government and the Fiji Electricity Authority have an interest in expanding ethanol production from cassava or possibly sweet sorghum. The latter would be preferred because it is more efficient for producing ethanol and can be readily mechanized and integrated into the sugar-cane factories and the crop harvesting cycle of sugar cane; also, cassava is an important food crop and use for biofuel may drive up food prices.
• The PIGGAREP/SPREP/UNDP/GEF Project which seeks to reduce GHG emissions by cost-effective use of commercially viable renewable energy technologies includes Fiji.
• In summary, Fiji has good data on energy but would need help with energy policy development. However, no agriculture sector plan; weak policy capacity; poor

30
agricultural data, statistics collection and management systems; and inadequate domestic food production and productivity to meet food security and market demands have been identified by NMTPF (2009). Thus Fiji will need strong support on food security issues, policy development, strategies and plans.
Samoa (Information sources: PIREP/SPREP reports 2004; SOPAC reports; World Bank [2008a,b,c] and reports mentioned earlier along with visits to key agencies, country visit and survey results.) Land area (km2): 2 820
Sea area/EEZ (km2): 98 500 (smallest in the Pacific)
Population: 180 741 (2006) 21% in Apia urban area
Annual growth (%): 0.6
Density (inhabitants/km2): 65 (2004 estimate)
Rural population (% of total population): 78
GDP (US$ million): 532.0 (2006)
GDP per capita: US$2 872 (2007)
GDP real growth (ave.1994–2006): 4.2% per annum
Primary sector GDP (% of total GDP): 11.4% (2006) Agriculture 6.7% and fishing 4.7%
Trade balance: US$167 356 000 (exports as % of imports): 6% (2007)
Food and live animals as % of total imports: 19% (2006)
Budget allocation for agriculture (2008/09): ST12.37 million (US$4.95 million) % of total budget: 1.8%
Human Development Index: 0.778 (2004) Position, 75 out of 177 countries
Source: NMTPF (2009).
• Samoa’s land area is mostly in Savai’i and Upolu, which have a tropical humid climate with distinct wet and dry seasons. Samoa is affected by tropical cyclones.
• The agriculture sector (encompassing crops, livestock, forestry and fisheries) offers some of the best opportunities for Samoa’s development. Given the high proportion of people who are engaged primarily in the agriculture sector, and Samoa’s relatively limited resource base, the agriculture sector must be developed if the majority of Samoans are not only going to satisfy their subsistence needs in future years, but meet their increasing needs for cash income. With soaring global oil and food prices fueling inflation, it is imperative that national food security is maintained by strengthening the resilience provided through the traditional farming system (NMTPF 2009).
• The Energy Unit of the Ministry of Finance is responsible for energy planning. The unit is very active in energy issues.
• Samoa has had recent help with a Samoa National Energy Plan-Strategic Action Plan from the SOPAC/PIEPSAP Project. However, no formal energy policy has been endorsed by the minister or cabinet although numerous drafts have been prepared. The priority is to operationalize policy after formal approval so it can be

31
effective. ADB provided support for implementation of the Samoa National Energy Policy (Component 3) in 2007 to 2008.
• Samoa is at present the only country with one petroleum supplier status and is benefiting from this policy. Petroleum supply is under the Ministry of Finance.
• The state-owned Electric Power Company (EPC) is responsible for power generation and distribution. It works closely with the Coconut Oil for Power Generation by EPC in Samoa (CoCoGEN) Project of SOPAC on use of coconut oil for power generation in Savai’i. The outcome of a feasibility study (CoCoGEN 2005 and 2005a) was to precede with implementation (CoCoGEN II 2006) by looking at the practical aspect of using coconut oil diesel mixes for power generation, using a 1.5 MW gasifier for coconut waste husks and shells and supply chain analysis among other activities (such as financial and environmental analyses). The EPC has already run successful cocodiesel blending trials for power generation at Salelonga power station with 10 percent coconut oil blends. Ten percent mixes according to the EPC would not overstretch available supplies of coconut oil. Currently, about 56 percent of Upolu and 44 percent of Savai’i are under coconut. CoCoGEN II in 2009 is proceeding as planned.
• FAO (2008b) sponsored a Biofuel Feasibility Study to identify selected agricultural crops for producing biofuel and suitable land areas, including methodologies for fuel production. Fifteen thousand hectares of disaggregated land would be suited to production of biofuel crops if production is economically feasible and socially and technically acceptable. Jatropha, which was recommended, should be firmly rejected because large-scale planting will affect food croplands. A much better strategy would be to replant and regenerate coconut planting if the use of coconut oil as diesel substitution for power generation proves to be viable.
• In the past, Samoa has exported up to 25 000 tonnes of copra but more recently because of price drops this has declined to 4 800 tonnes of copra and 3 900 tonnes of coconut oil. These resources could produce the equivalent of 9 million litres of diesel, provided this is economically justifiable. The CoCoGEN I report gives very good detail on coconut varieties, age and a GIS study to estimate the extent of the resource. CoCoGEN II is now implementing coconut oil production and testing on Savai’i.
• Samoa receives considerable income from expatriate Samoans; this contributes to high food prices and a labour shortage. Lack of interest in harvesting of coconut, coffee and cocoa may be a major issue for sourcing sufficient coconut for coconut oil for fuel. Many fruits and vegetables are imported when they could be easily produced in Samoa.
• Commercial logging will likely cease soon. The use of logging wastes for power generation has been limited and is no longer done. Fast growing legume fuelwood trees like Gliricidia and Leucaena are a possible option for ensuring future biomass supply for cooking and possibly for power generation when intercropped in older coconut plantings near power stations or a gasifier.
• Cooking with biomass is estimated to account for about half of the gross energy demand, but reliable recent data are not available to confirm this figure. The rest of the demand is met by electricity and petroleum. About half of Upolu’s electricity comes from hydropower at present.

32
• Samoa has very limited options for economically and efficiently producing commercial quantities of ethanol from cassava or breadfruit. It is doubtful if this would prove to be economically sustainable and in addition breadfruit is a staple food. Samoa terrain does not lend itself to the mechanization needed to efficiently and economically produce ethanol.
• Biogas opportunities are limited; many were installed in the 1970s and 1980s for piggery waste and energy but most no longer function. Biogas from municipal wastes is under trial, but the scale of production is small.
• UNDP has recently supported a Household Energy Survey to look at the impacts of petroleum prices on households as part of a preparatory phase for the Samoa Solar PV Electrification Programme.
• The PIGGAREP/SPREP/UNDP/GEF Project which seeks to reduce GHG emissions by cost-effective use of commercially viable renewable energy technologies includes Samoa.
• In summary, the planned use by the EPC of a 10 percent blend of coconut oil/diesel mix will not place undue stress on the coconut resource supply or impact negatively on food production of coconut and intercrops or inter-row activities such as livestock rearing. However, Samoa needs assistance with energy data collection and especially with food security. Lack of an overarching agriculture sector plan that provides a coherent policy framework for promoting agricultural development is a constraint to the preparation of a food security policy. Low productivity and returns in subsistence and commercial agriculture and fisheries and a limited commodity base are constraints to diversification and increases in agricultural production and products. High food prices and susceptibility to high fuel prices are of major concern for food security in Samoa (NMTPF 2009).
Tonga (Information sources: PIREP/SPREP reports 2004; SOPAC reports; World Bank [2008a,b,c] and reports mentioned earlier along with visits to key agencies, country visit and survey results.) Land area (km2): 747
Sea area/EEZ (km2): 700 000
Population: 101 134 (2006)
Annual growth (%): 0.4
Density (inhabitants/km2): 135
Rural population (% of total population): 57% (2006)
GDP (US$ million): 178.504 (2004)
GDP per capita: US$1 781 (2004)
GDP real growth (ave. 1996–2006): 2.5% per annum
Primary sector GDP (% of total GDP): 23.2% (2004)
Trade balance: US$106 149 650 (exports as % of imports): 5.6% (2007)
Food as % of total imports: 14%
Budget allocation for agriculture/forest/fisheries (2007): less than 2%
Human Development Index (2004): 0.815 Position, 55 out of 177 countries
Source: NMTPF (2009).

33
• Tonga consists of 176 islands; 36 are inhabited. Most islands have a limestone
base formed from uplifted coral overlying a volcanic base. Volcanic activity is present. The largest island is the capital island of Tongatapu. The climate is tropical with cyclones (PIREP 2004).
• Agricultural production is still the predominant economic activity, accounting for 23 percent of GDP, 70 percent of total merchandise export and 40 percent of employment. Over 64 percent of Tongan households (10 102) are involved in agriculture, of which 59 percent are subsistence farmers, 38 percent are involved in subsistence agriculture with cash crops and only about 2 percent are fully commercial crop producers (Agriculture Census 2001). The agriculture sector therefore is important for employment, as a source of domestic food supply, for cash income, foreign exchange earnings and for raw materials in processing and handicrafts. However the sector is underperforming and the output has been in decline for a number of years. Considerable potential exists for improved performance. Tonga has a good growing climate and fertile soils, and is well placed to serve markets in both southern and northern hemispheres (NMTPF 2009).
• The Ministry of Lands, Survey and Natural Resources (MLSNR) includes an Energy Planning Unit (EPU). Tasks involve policy development, energy planning and project coordination. There is a draft Tonga Energy Policy and a Pacific Islands Energy Plan prepared by the Energy Working Group (EWG) of CROP. However, it seems that considerable work still has to be done before it can be of real use to Tonga. Much of the legislation on energy in Tonga has not been passed into law. There is no energy policy defining the role of the EPU or the place for renewable energy in Tonga.
• Petroleum products are supplied by and distributed by Shell and BP. Over half the energy needs are met by imported petroleum products. Tonga is energy supply-vulnerable. There are only limited data available on the end use of petroleum.
• The Tonga Electric Power Board is the regulatory agency for electricity. Power is generated and distributed by a private company for urban areas. There are community-operated diesel grids in rural areas. Small outer islands have solar power.
• About 65 percent of Tonga is under some form of tree crop, but mainly coconuts. Biomass use is mostly for cooking and crop drying/copra, and there is little opportunity for biomass from forests to be a significant resource because most logging occurs on uninhabited islands. However, many households use wood, LPG and kerosene for cooking. Tonga has been planting wood and fuelwood species and is promoting coconut rehabilitation and replanting as well as fast growing nitrogen-fixing trees for fuelwood. However, uptake and follow through have been limited. Biomass estimates are not based on recent surveys or measurements, but may supply about 44 percent of gross national energy production. Reforested areas are mostly considered to be unsuited to other cropping.
• There are limited opportunities for biogas as pigs are mostly free ranging. • According to SPREP, Tonga could offset up to 50 percent of diesel requirements.
However, to do this would require rehabilitation of coconut resources and efficient gathering and processing of coconuts to produce about 10 million litres

34
of coconut oil for biofuel use. However, marginal biofuel work has been carried out in Tonga; in 2007 the MLSNR expressed interest in using coconut biodiesel to replace diesel after demonstrations by a chemical engineering youth group from the USA. However, use of coconut oil instead of diesel is much more economical than methyl esterified coconut biodiesel.
• Community-based diesel systems for generation have proved expensive to operate and biofuel replacement of some diesel may be an attractive alternative as would wind or solar power with the latter proving successful in Ha’apai. However, rising labour costs mean that collection and processing of coconut for coconut oil biofuels must be efficient and cost effective to compete with diesel.
• Large-scale development of coconut biofuel would not disturb the agricultural use of land because agricultural land use takes place between the coconut rows. However, development of this fuel must be economically viable and competitive with diesel and coconut supplies must be sufficient to offset variability with droughts and seasonal weather changes. Also, much of the coconut resource at present is used for animal feed as well as household consumption and the prices for coconut for biofuel would need to be attractive enough to interest farmers in producing coconut for this purpose.
• The PIGGAREP/SPREP/UNDP/GEF Project which seeks to reduce GHG emissions by cost-effective use of commercially viable renewable energy technologies includes Tonga.
• There is no conflict between biomass trees and biofuel based on coconuts and food crops in Tonga; there is thus virtually no threat to food security by biomass or biofuel crops. Tonga needs help in assessing the benefits, economics and social impacts of diesel replacement with coconut oil to help reduce GHG emissions, offset foreign exchange loss from diesel procurement and help to ensure liquid fuel security into the future.
• In summary, Tonga needs assistance with getting legislation passed and accepted on national energy policy and conducting a biomass energy inventory and projections. There is no food security policy in place and the lack of an agriculture sector strategy and plan makes preparation of policy, policy analysis and integration with bioenergy and climate change policies very difficult. According to the NMTPF (2009) and from discussions, a weak agricultural data and statistics collection and management system exacerbates the problem of policy development. All of these factors signal that Tonga needs strong support in policy development in both the energy and food security sectors and probably to a significant extent in natural resource assessment.

35
Papua New Guinea (Information sources: PIREP/SPREP reports 2004; SOPAC reports; World Bank [2008a,b,c] and reports mentioned earlier along with visits to key agencies, country visit and survey results). Land area (km2): 452 860
Sea area/EEZ (million km2): 3 120 000
Population: 6 057 263 (July 2009 est.) Annual growth (%): 2.7 (2009) Density (inhabitants/km2): 12
Rural population (% of total population): 87
GDP (US$ billion): 6.363 (2008 est.) (estimated US$ million: 373 in 2006)
GDP per capita: US$2 200
GDP real growth (ave. 2007–2008): 6.3% Agriculture sector GDP (% of total GDP): 38.6% (2008)
Trade balance: US$228 million (2004). Exports US$1 345 imports US$1 573
Food and live animal imports: US$192.428 million (2003), as % of total imports: approx. 12%
Budget allocation for agriculture: % of total budget N.A.
Human Development Index: 0.530 Position, 145 out of 177 countries
Source: CIA (2009); SPC (2004) and HDI Web site.
• PNG, like SI, Vanuatu and Fiji has larger tracts of land than the small island states and atolls. PNG has the largest land area of all PICs, with more than 600 islands and very diverse topography and climates. It is subject to all forms of natural disasters, including droughts, floods, volcanic eruptions, earthquakes, damaging forest fires and tsunamis.
• Within the Department of Petroleum and Energy, the Energy Division is responsible for energy policies, plans and data collection and analysis to provide advice to the government.
• For data collection on energy and renewable energy, the Energy Division has very limited capabilities; biomass and other renewable energy data collection has not been conducted for over two decades.
• SPREP reported in the PIREP Project that in 2004, PNG had no formal energy policy. AusAID supported a review of national energy policy in 2004 and there is a draft Five Year Strategic Plan for the Department of Petroleum and Energy 2004–2008. The National Energy Policy Statement and National Energy Guidelines of 2001 have been revised following the AusAID review. Still there seems to be lack of appropriate legislation with essential guidelines and regulations on energy, renewable energy and rural electrification.
• Unlike most PICs, PNG is a major exporter of light crude oil and exports about 100 000 barrels/day from known recoverable reserves of around 550 million barrels. In addition the natural gas resource is estimated to be equal to 2 700 million barrels of oil. PNG has a 36 000 barrel/day refinery, but still imports

36
refined petroleum from Shell, BP and Mobil to satisfy about 40 percent of the market.
• In 2000 the Asia–Pacific Economic Cooperation (APEC) prepared an energy balance for PNG which showed net primary energy supply at 573 kilotonnes of oil equivalent (ktoe). Data are available from the National Bank, PNG and the Internal Revenue Commission on energy imports and exports.
• PIREP/SPREP (2004) estimated that 1 000 ktoe from wood was used for cooking in PNG with 90 percent of households using wood for cooking in rural areas but this figure is much lower in urban areas.
• Industry uses around 60 percent, transport 17 percent and agriculture/residential/commercial activities use 24 percent of the energy (PIREP 2004).
• PNG has forest cover of around 66 percent but much of the forest is inaccessible and cannot be used to source energy. Also, about 58 percent of the land is steep and highly prone to erosion with about 18 percent being inundated or flooded. Thus the main biomass energy potential is in logging areas or those under agricultural production. Log exports are significant but most are exported whole so there is very little residue for energy use; for the smaller processors, no data are available on wastes. It is estimated that about 200 000 ha of land are cleared annually for traditional agriculture. Applications for mining, logging and large agricultural development projects are numerous and often not well assessed before approval. Procedures for vetting applications are cumbersome and slow.
• Traditional biomass was estimated to be about 53 percent of PNG energy consumption in 2000, mostly for cooking and some for industrial and agricultural use like copra drying.
• Palm oil biomass wastes are used for fuel in palm oil factories and for limited electricity generation.
• Heat gasifiers have been used successfully since around 1990 for using biomass wastes in the copra, coffee, cocoa and tea industries – mostly for drying.
• About 330 million litres of palm oil and 33 million litres of coconut oil are produced annually with most being exported in the past. PNG has around 2 percent of the world’s oil-palm but 28 percent of certified sustainable oil-palm with one-third of the production coming from smallholders in integrated farming systems. The total area under oil-palm in 2009 is 138 000–140 000 ha with 13 CPO mills and a new one in the pipeline. There is one refinery for palm oil. CPO is not used for diesel substitution and no esterified biodiesel is made commercially from palm oil in PNG.
• Palm oil is a good source of oil with high productivity of up to 4 000 litres/ha of oil for diesel substitution or methyl esterified biodiesel; the net fossil energy gain is from 4-6:1 or more.
• Copra production in 2007 was 677 000 tonnes. However, with low world prices there has been more interest in biofuels to replace diesel recently. The University of Technology in Lae is undertaking R&D on biofuels (Gaaraio Gafiye, personal communication). Unitech, the Forest Research Institute and the Agriculture Department are expanding R&D for bioenergy by looking at biodiesel and use of agricultural residues. In the past PNG was a leader in bioenergy technologies among PICs. The World Bank is providing financing and TA to all New Ireland

37
schools to produce coconut oil to fuel school generators. PNG is very interested in the Vanuatu technologies of using coconut oil to replace diesel.
• Biogas generation is reported to be non-existent at present. • Ethanol can be produced from sugar cane, molasses, sago palm and nipa palm.
Around 200–1 100 million litres of ethanol/year could be produced by sago palm in Gulf Province, but the economics and the destructive nature of the process (logging the trees for starch removal from trunks) make this practice highly questionable economically and environmentally. In addition sago is viewed as a starvation back-up food when other crops like sweet potato fail; diversion of sago to ethanol may well affect food security in some locations. Tapping of nipa palm for sugary sap for making ethanol is a far more sustainable process. The economics of ethanol clearly depend on the costs of sap collection, which is laborious.
• Ethanol production from sugar cane or molasses is a highly efficient way of capturing energy in a biofuel product with a net energy fossil energy gain ratio of 10:1 or better. Sugar cane or sweet sorghum with ratios of 10:1 to as high as 14:1 are much more attractive propositions for ethanol production and the harvesting and processing of both can be mechanized. Ramu Sugar Mills are reported to produce around 4 million litres of ethanol/year for fuel use. They have planted fuelwood trees to supplement bagasse for producing electricity in the off-harvest season.
• The Republic of Korea (ROK) Changae Cassava Project is establishing a 20 000 ha plantation for integrated production of cassava pellets, powder, starch and ethanol for export to ROK. The site is 95 km from Port Moresby on flat lands and will have a 6 000 ha nucleus plantation with mechanization for planting and harvesting and involvement of outgrowers. The area of land does not conflict with existing food crop production; it comprises government land and customary land agreements.
• PNG does not have the capability to assess renewable energy resources including biomass/bioenergy data and capacity in the Energy Division for analysis and R&D is low.
• If approximately 10 percent of the vegetable oils (palm and coconut) are diverted to biofuels then the impact on agriculture and food will be negligible. Coconut oil-based biofuels, if economic, may be used for power and transport, especially in remote communities and the impact of such diversion of the resource needs to be assessed if large-scale 200 million litre/year levels are planned.
• PNG has good opportunities for biofuel development. But if large tracts of forested lands are cleared for expansion of biofuels from palm oil or sugar cane, the full life cycle impact of GHG releases from clearing have to be factored in to the assessment of benefits, if any, of conversion to biofuels. Conversion of copra or existing sugar cane or palm oil for biofuels is much less damaging apropos GHG production, but there may be other considerations relating to food security if diversions are large. PNG, like Vanuatu, SI and Fiji, has been receiving proposals for large-scale Jatropha plantations, which it is pleasing to note have been firmly rejected.
• While PNGRIS GIS databases exist in the Department of Lands, Environment and Conservation, Department of Agriculture and Livestock and Department of Forestry it is only the University of PNG’s (UPNG) Remote Sensing Unit that has

38
the required updated imagery to undertake land cover and land-use studies and work with crop potential options for given locations. Currently there is no existing natural resources and environment policy; help would be needed to procure the data required and in policy formulation. The PNG resource information system handbook (3rd edition) was prepared for the Land Use Section of the Department of Agriculture and Livestock in 2008 by UPNG with EU support; it is a very important document on data collection, data use and analysis of topography, climate and soils. It is an excellent basis for future natural resource studies. The state of the forests of Papua New Guinea has been mapped and changes assessed over the period 1972–2002 by the UPNG Remote Sensing Unit with EU, GTZ and UNDP assistance.
• The Office of Climate Change and Environmental Sustainability is a new somewhat isolated institute that has no legislative basis, no policy framework, no REDD2 credibility and no ownership over carbon credits for sale. It is unclear what basis this office has for its existence and its credibility is strongly under question at present.
• The PIGGAREP/SPREP/UNDP/GEF Project which seeks to reduce GHG emissions by cost-effective use of commercially viable renewable energy technologies includes PNG.
• PNG has the National Food Security Policy 2000–2010 and is preparing for a mid-term review with FAO assistance on the policy for 2009–2018. However, the policy at present does not take into account bioenergy issues or natural resource base policy issues. A National Development Plan 2007–2016 has been prepared and funds set aside, but no implementation has taken place and funds have been diverted to non-transparent activities. Hanson et al. (2001) prepared the Papua New Guinea rural development handbook, which covers poverty districts as well as population densities and agricultural intensity and is very useful when linked with other food security and HIES studies.
• In summary, PNG is in need of further help to draft an energy/bioenergy/renewable energy policy and would benefit from assistance in preparing appropriate legislation with the essential guidelines and regulations for cabinet approval and linking energy policy with food security. PNG has the ability, if funded, to provide required data on natural resources and food security for policy planning. At the departmental levels, there is a willingness to prepare essential integrated policies, but it is less clear if political will is as strong.
2 Reducing Emissions from Deforestation and Forest Degradation in Developing Countries

39
Solomon Islands (Information sources: PIREP/SPREP reports 2004; SOPAC reports; World Bank [2008a,b,c] and reports mentioned earlier along with visits to key agencies, country visit and survey results.) Land area (km2): 28 370
Sea area/EEZ (million km2): 1.3
Population: 533 672 (2006)
Annual growth (%): 2.8
Density (inhabitants/km2): 19
Rural population (% of total population): 84
GDP (SB$ million): 2 907.6 (2004) (estimated US$ million: 373 in 2006)
GDP per capita: SI$5 695 (2004) (estimated US$753 – 2006)
GDP real growth (ave.2004–2007): 8.8% per annum
Primary sector GDP (% of total GDP): 37% (2004)
Trade balance: US$75 992 509 (exports as % of imports): 53% (2006)
Food and live animals as % of total imports: 17%
Budget allocation for agriculture % of total budget <2 %
Human Development Index: 0.602 (2007) Position, 129 out of 177 countries
Source: NMTPF (2009).
• SI covers around 28 000 km2 of land spread across 1 000 islands of which 350 are inhabited. There are six major islands.
• The islands are mountainous with good forest resources fed by a tropical monsoonal climate. It is subject to cyclones, volcanic activity, earthquakes, floods and droughts.
• The Energy Division of the Department of Energy and Mines is responsible for energy policy, renewable energy development and project implementation. The division was understaffed and underfunded for the work it has to do until recently; now SI has started implementing its energy policy and the government has allocated good funding resources to support implementation. Most positions for staff are now filled and a future watching brief by SOPAC hopefully will keep the process on track with assistance as needed. SI was a beneficiary of SOPAC PIEPSAP Project assistance with TA for policy development.
• SI is highly dependent on imported petroleum for commercial energy; biomass still constitutes about 61 percent of gross national energy production, petroleum 38 percent and hydro- and solar power 1 percent. There are no reliable data on sectoral energy demand for petroleum, but estimates from 2001 to 2002 suggest 56 percent by transport, 28 percent by commerce and industry and 15 percent by households (PIREP/SPREP 2004). Biomass for cooking was estimated at 89 percent of all households. Hydropower development could probably supply about 75–80 percent of Honiara’s power needs of around 13.5 MGW. A feasibility study is about to be conducted for World Bank funding.

40
• While biomass from sawmill and agro-industrial wastes has been used in the past for power generation this has not endured. Likewise a gasifier and biogas initiatives have failed. Logging is petering out and will end in the next two to six years.
• Good potential exists for reducing energy imports and GHG reductions by switching to more hydropower and biofuels, if acceptable socially, financially, economically and environmentally. However, land disputes, logging disputes and land alienation by palm oil and replanting of timber are serious complicating issues in certain parts of SI. Guandalcanal Plains Palm Oil Limited with approximately 8 000 ha of palms is planning expansion with government and landowners’ cooperation to around 1 000 ha per year up to 15 000 ha. Smallholders are increasing and they now grow 600 ha of oil-palm; 3–4 ha per family is the smallholder allocation – this can be readily managed by a family without outside labour and generates good incomes, beginning in year 2 after planting. All technology and inputs are provided by the company and paid off with palm bunches. The expansions of palm oil are on grassland areas or those with light bush cover and are not environmentally damaging. The entire development will receive full certification as sustainable oil-palm during 2009. All CPO and PKO are exported to Europe and are not used for biofuel. The company plans to expand into livestock integrated with oil-palm for the estate and smallholders. Oil-palm residue meal is exported for stock feed at present but could be used locally when the cattle industry is revived.
• Copra exports were as high as 40 000 tonnes in the 1980s while recent production showed levels of 37 000 tonnes in 2007 (Appendix 3). Thirty-seven thousand tonnes of copra would produce around 28 million litres of coconut oil or about 26 million litres of diesel equivalent or about half of the diesel imports at 45–55 million litres/year. With low copra prices, options for using coconut oil to replace diesel, especially in isolated remote areas for power generation and transport, are now being employed and tested on a small scale. This initiative may be expanded in the future. Interisland transport of diesel is expensive and in the future more coconut oil may find a regular place in power generation and transport. More work with coconut oil as a replacement for diesel is required and with palm oil if production resumes to the pre-unrest period. Palm and coconut oil residues can also be used for heating and electricity generation. The Solomon Islands Electricity Authority (SIEA) is still interested in using coconut oil to replace diesel for power generation and more testing of this technology.
• The impacts of large-scale use of coconut oil as biofuel have to evaluated against a wide range of financial/economic/government revenue impacts, import duties as well as logistics and the extent and size of the resource base. ADB has recently assisted with coconut oil retrofitting of a diesel generator at a regional provincial centre to run on coconut oil. Institutional weakness after the period of unrest translates into the need for more aid and training in undertaking such studies and R&D. Vanuatu’s coconut oil diesel replacement technology from UNELCO is the clear direction for SI to follow.
• PIREP estimated that large-scale use of coconut oil for biofuel could potentially eliminate 70 percent of the 2001/2003 national CO2 emissions.
• A 10 percent coconut/diesel oil blend was launched by Solomon Tropical Products in Honiara at the 2006 National Trade Show after testing the product in

41
local vehicles (Biopact Web site). The small company is now producing esterified biodiesel B100 for vehicle use and is beginning to generate electricity to feed back to the SIEA. The plan is to produce 300 tonnes/month of coconut oil.
• AusAID and the World Bank recently financed a study to identify all energy resources for electricity production (World Bank 2008).
• The joint World Bank/AusAID Outer Islands Electrification pipeline project will convert current diesel power generation to operate with locally produced coconut oil. The Energy Division is very interested in Vanuatu’s rural electrification model, described earlier.
• If coconut oil is the main source of biofuel, it is unlikely that there will be a significant impact on food security. Low copra prices have already impacted on farmers’ incomes and in many instances it will not be viable for farmers to send oil or copra to export collection points. Optional use of this resource for biofuels will at least ensure some income for farmers.
• However, the coconuts are ageing and a major initiative is needed to replant and in the case of the old abandoned Lever’s plantations both rehabilitate and replant on the Guadalcanal Plain. AusAID may be considering support for coconut industry regeneration along similar lines to the Cocoa Rehabilitation Program just begun under the AusAID Community Sector Program.
• The PIGGAREP/SPREP/UNDP/GEF Project which seeks to reduce GHG emissions by cost-effective use of commercially viable renewable energy technologies includes SI. The project has specifically targeted development of biofuel in SI.
• In summary, SI is now implementing energy policy but will need some help in integrating energy policy with food security policy and with coconut biofuel initiatives for rural electrification. SI, like PNG, Fiji and Vanuatu has been receiving proposals for large-scale Jatropha plantations, which it is pleasing to note have been firmly rejected.
• FAO has assisted SI with the formulation of a National Agriculture Development Policy 2008–2012. However, this policy has been rejected by the government. The last Agricultural Census was conducted in 1986. A National Census is due this year and is now fully funded with United Nations Population Fund (UNFPA) and EU support. Recently, the agriculture sector has been neglected by the government. The Community Sector Program supported by AusAID is funding income-generating initiatives with crops and coconut and is now implementing the revival and renewal of cocoa with A$9 million support. The government is assisting with smallholder oil-palm development. AusAID is now considering assistance to the coconut industry and in initiating a Rural Livelihoods Program on Forestry and Agriculture. Fisheries exports have collapsed with the closing of the Japan-funded fish processing facility due to ethnic tensions. Mining is almost non-existent and with logging due to finish in the next two to six years and collapse of copra and coconut oil prices, foreign exchange earnings are in danger of a very serious drop. Already fuel for power generation is purchased on credit. Palm oil is one of a few foreign exchange earners. Cocoa, if regenerated, would provide some much needed income. Similarly coconut oil to replace diesel would be a significant saving.

42
Some HIES have been done and village resource surveys are being conducted prior to the coming census. The Community Sector Program has undertaken supply chain and marketing studies recently on fruits and vegetables and the Smallholder Agriculture Study Outcomes are being addressed by the Community Sector Program. The NMTPF (2009) points out the following key issues and they will need to be appreciated and addressed to finalize food security policy: “Lack of agriculture statistics and baseline data for the sector: Limited Livelihood options for people in remote areas and outer islands: Shortage of experienced and qualified staff at all levels of Government and private sector: Increasing dependence on nutritionally poor imported foods. Also, assistance with data collection is needed to strengthen land-use planning and environmental management generally to avoid threats to food security due to over-logging practices”. AusAID has just finished support for the Forest Management Program II that has updated forest cover in GIS format and will fund a Strategic Environmental Assessment, which will be a broad inventory of forests and land use and assist with future policy and strategy planning. A national GIS unit in the Lands Department is supposed to house the future database for all land-use and natural resource data. Central Bank Reports with agricultural statistical data are available at www.cbsi.com.sb. Potential agricultural area maps from 1974 are still useful in planning agricultural development but an update based on areas cleared by logging or otherwise, would be useful to more accurately reflect new opportunity areas for agricultural and livestock production. Finally, it may be concluded that considerable support will be needed to gather the agricultural and natural resource data needed to support multisector policy development integrating energy, agriculture and natural resources.

43
Niue (Information sources: PIREP/SPREP reports 2004; SOPAC reports; World Bank [2008a,b,c] and reports mentioned earlier along with visits to key agencies and survey results.) Land area (km2): 260
Sea area/EEZ (km2): 293 988
Population: 1 625 (2006)
Annual growth (%): Population has declined steadily due to migration since it peaked at 5 296 in 1969 and was estimated at 1 444 in 2008
Density (inhabitants/km2): 6
Rural population (% of total population): 68
GDP (NZ$ million): 17.3 (2003)
GDP per capita: NZ$10 048 (2003)
GDP real growth (ave.1994–2006): N/A
Primary sector GDP (% of total GDP): 25.5% (2003 estimate)
Trade balance: NZ$3 800 000 (exports as % of imports): 5% (2002)
Food and live animals as % of total imports: 52.3% (2000)
Budget allocation for agriculture (2006/07): % of total budget 3.7%
Human Development Index: N/A
Source: NMTPF (2009). • Niue is one of the largest raised coral islands in the world with an area of 260 km2
and steep limestone cliffs 20–25 metres above sea level. Niue is subject to damaging cyclones and droughts.
• Population is very low, around 1 600 persons; 20 000 expatriates live in New Zealand.
• There is no energy officer in the government and only the Public Works Department has any experience with renewable energy, but lacks capacity to develop and operate/maintain renewable energy systems. There is no energy policy to help with energy problems, coordination and development. The Niue Integrated Strategic Plan 2003–2008 has some energy components; the more important component is improving energy efficiency, which has been assisted by the EU.
• Twenty percent of the land is considered to be arable but only a small percentage is cultivated. Forest covers 60 percent of the land. About 40 percent of the land cleared for agriculture is for commercial crops of banana, coconut, taro and vanilla and subsistence gardens.
• The Bulk Fuel Corporation has exclusive authority to import petroleum and for many years Shell has held the contract.
• Niue Power Corporation generates and distributes electricity. Diesel is mostly used to generate electricity and 90 percent of petroleum is used for transportation. All houses have power connections. About 50 percent of houses use LPG for cooking.

44
• Biomass is very limited as forests are protected and there are no large plantations of tree crops. Thus there are no options for expanding biomass production for wood or biofuels apart from perhaps household Gliricidia or Leucaena or similar fast growing species for living fences to provide firewood. High labour costs and high income levels from repatriated family funds from overseas are likely to make coconut oil biofuel uneconomic and there is no room for expansion of plantations. No copra is made or exported and most coconuts are for drinking or household use.
• Biogas is impractical as animals are pasture-fed or free range. • There is virtually no distinction between urban and rural populations in Niue so
there are no rural development flow-on advantages to biomass or biofuel developments.
• GHG reductions would need to come from solar or wind power savings; it is estimated that only 15–20 percent of diesel use could be offset by solar and wind energy adoption. More than 15–20 percent of energy from these sources leads to grid instability and problems with supply continuity. Direct solar power connections to the grid are essential to avoid problems related to battery use and pollution from battery disposal. Any renewable energy development must come from aid as there is little opportunity to generate funds locally for such development. However, past experience with solar power has been almost a complete failure due to lack of maintenance. Solar hot water heaters have survived longer.
• PIREP/SPREP (2004) concluded that the best option for reducing diesel imports for power generation will be energy efficiency improvement.
• The PIGGAREP/SPREP/UNDP/GEF Project which seeks to reduce GHG emissions by cost-effective use of commercially viable renewable energy technologies includes Niue.
• There are opportunities for Niue to produce more home-grown food products and reduce dependence on food imports, but they are slight because of the small population with strong income purchasing power. Prospects for exports must be in the form of high value products because air transport is the only regular service for many products. Honey and vanilla are two such products.
• In summary, there is no conflict between biomass energy and food security as the scope for biomass energy use is minimal. Food security can be a problem especially due to droughts and cyclones. At present there is no food security policy and it would be difficult to prepare without help. Insufficient staff and a large reduction in the capacity of the ministry to support development programmes are constraints. Also, interest in farming has declined and has narrowed into the older group; school leavers who remain in Niue have not shown appreciable interest in farming as an occupation. Finally lack of data collection systems that provide baseline information and indicators of progress such as agriculture census and food balance sheets and no integrated agriculture sector plan/policy and natural resource policy make it very difficult to prepare an integrated food security/energy/natural resource policy without external TA.

45
Marshall Islands (Information sources: PIREP/SPREP reports 2004; SOPAC reports; World Bank [2008a,b,c] and reports mentioned earlier along with visits to key agencies and survey results.) Land area (km2): 181
Sea area/EEZ (million km2): 2.1
Population: 50 840 (1999 census), 52 700 (2007 SPC estimate)
Annual growth (%): 3.9 (2004–2006)
Average density (inhabitants/mile2) 727 but varies up to 82 000 for some islets Rita = 38 000 and Delap = 16 000
Rural population (% of total population): 33
GDP (US$ million): 131.7 (2007)
GDP per capita: US$2 851 (2007)
GDP real growth (ave.1994–2006): 1.3% per annum
Primary sector GDP (% of total GDP): 2.5% Fisheries 1%, agriculture 1.5%
Trade balance: US$45 600 000 (exports as % of imports) 16.67% (2000)
Food and live animals as % of total imports: 9% (2000)
Budget expenditure for resources and Development Ministry (2004/05): US$2.41 million % of total budget expenditure: 2.2%
Human Development Index: N/A
Source: NMTPF (2009). • The Republic of the Marshall Islands (RMI) constitutes two groups of atolls and
islands, Ratak in the east and Ralik to the west. Four of the small raised coral islands and 22 of the atolls are inhabited. Most islands are a few kilometres long and around 20 metres wide.
• The land area is 181.3 km2 with 11 673 km2 of lagoons; the climate is tropical monsoonal. The islands are low coral or sand outcrops with a maximum elevation of 10 metres above sea level.
• Most people, about 50 percent, reside in the capital of Majuro. • The arable land area is approximately 11 percent; 44 percent is under permanent
crops and the balance comprises other uses. • The RMI is heavily dependent on aid grants and assistance for about 60 percent of
the GDP. • There have been numerous energy policy drafts but only two have been endorsed;
the most recent (2003) is the RMI National Energy Policy. An ADB study in 1995 provided the guidance for rural electrification. Generally agreed policies emphasize use of commercially proven technologies, use of local energy sources and recovery of operating costs from consumers. SOPAC has helped with a Strategic Development Plan Framework 2003–2118 (Vision 2018) on energy aspects. What is needed now is for the cabinet to ratify the work and support implementation with resources and funding.
• Rural electrification over the past decade with solar PV technologies has been successful and this augers well for use of other renewable energy sources.

46
• RMI is extremely dependent on imports of petroleum, which constitute 90 percent of gross energy supply with the balance of 10 percent coming from biomass (declining in 2003). PIREP/SPREP (2004) estimates that about 68 percent of petroleum imports are used for transport, about 30 percent for power generation and 2 percent for direct household or commercial use. RMI is in a state of economic emergency, as declared in July 2008, because of rising fuel imports and prices and dependence on imported petroleum.
• Time series data on petroleum imports and sales are very difficult to source although the rapid appraisal survey indicated the data can be found. Estimates of fuel growth needs suggest a 5 percent increase/year.
• Coconuts, marine products and deep-sea minerals are the main industries. • Biomass for cooking and copra drying are important but there is no opportunity
for commercial use of biomass energy like wood and coconut wastes. • Large-scale biomass production for energy is not feasible with the poor sandy
atoll soils; an exception is the existing coconut resource to make coconut oil to replace diesel. Production in 2007 was recorded as 20 400 tonnes of copra; if this was converted to coconut oil it would equate to about 14 million litres of diesel or about half of the diesel imports. The use of coconut oil for biofuel is perhaps the most promising option for renewable energy in RMI provided it is viable.
• PIREP proposed a feasibility study on coconuts and coconut oil for power generation and UNDP is supporting the Action for Development of Marshall Islands Renewable Energies (ADMIRE) Project to encourage development of diverse renewable energy technologies in 2008–2012.
• The Tobolar copra mill is retailing a 50/50 filtered coconut oil and diesel blend below the price of regular diesel.
• Biogas potential is very small. • Cost-effective electrification with solar PV is a very useful energy option for rural
communities, but models for installation, maintenance, use and payments must be carefully crafted to avoid the past failures in RMI with this technology.
• Unfortunately, the PIGGAREP/SPREP/UNDP/GEF Project which seeks to reduce GHG emissions by cost-effective use of commercially viable renewable energy technologies does not include RMI.
• In summary, RMI is beginning to receive better support on renewable energy, including bioenergy policy. Recently UNDP supported a recent household energy survey to study the impacts of petroleum price hikes. Implementation of renewable energy initiatives is a key issue. RMI has indicated that assistance is needed with agriculture/economy and food security data assembly and analysis, as well as assistance with GIS and natural resource assessment. There is no food security policy and RMI needs help with preparation and especially integration of bioenergy and climate change policy. However, FAO recently completed a Study on the Assessment the Impact of Climate Change on Agriculture and Food Security in the Pacific in 2007–2008 and this will assist with policy development. Food security is important for RMI because of high and volatile food and oil prices and a deep trade balance deficit; there is also limited capacity for food crop production, limited water supplies, limited livelihood options particularly for outer islands and the need to sustainably develop value-added coconut farming systems. Vulnerability to the adverse impacts of climate change and sea-level rise

47
are major issues for food security (NMTPF 2009). RMI desperately needs assistance with both food security and renewable energy including bioenergy.
Nauru (Information sources: PIREP/SPREP reports 2004; SOPAC reports; World Bank [2008a,b,c] and reports mentioned earlier along with visits to key agencies and survey results.) Land area (km2): 21
Sea area/EEZ (km2): 320 000
Population: 8 800 (2007 estimate)
Annual growth (%): -10 (2007) (due to increased migration and repatriation)
Density (inhabitants/km2): 495
Rural population (% of total population): 0
GDP (US$ million): 26.32 (2006)
GDP per capita (US$): 2 671 (2006)
GDP real growth: N/A Primary sector: 10.6 % (2006) Trade balance: A$28 720 000 (exports as % of imports: 14.7% [2005)])
Food and live animals as % of total imports: 13.5% (2005)
Budget allocation for agriculture (2008/09): % of total budget: 0.09%
Human Development Index: N/A
Source: NMTPF (2009). • Nauru is a single raised coral island in the equatorial tropics that is only 21 km2 in
area. It is subject to severe droughts. • The island has been a supply of rock phosphate and about 85 percent of the island
has been devastated by mining. As mining has declined the island has become essentially bankrupt and is supported by aid and support from the Phosphate Trust funds, which are rapidly decreasing. Australia used Nauru as a base for hosting refugees up until 2008 for screening for entry into Australia, but now these funds are no longer available and phosphate reserves will be used up by 2010.
• Rehabilitation of the mined areas is virtually impossible without imports of replacement soil. Rehabilitation is supposed to proceed based on an Australian agreement with Nauru, but there is no visible progress to date. Thus there is virtually no potential for bioenergy other than from existing coconuts and there is little use of biomass for cooking. Nauru was reputed to produce 1 800 tonnes of copra in 2007 (FAOSTAT) which if converted to coconut oil would amount to about 1.2 million litres of diesel or about 12.5 percent of the diesel use in 2004. The use of coconut oil as a diesel substitute would have to be assessed for impact on food supply and if financially and economically feasible in practice. The area of land potentially available for agricultural purposes is small (there are only 4 km2 of fertile land, but development is constrained by land rights, plot sizes and fresh water for irrigation. Currently there is no formal commercial agriculture in Nauru.
• Energy comes from diesel generators and in the past, with subsidy being so cheap, unpaid bills were often not enforced and gross wastage of energy was common.

48
• There is no government energy office and the Nauru Power Company (NPC) has one generating station that supplies the main grid. Development of the Nauru National Energy Policy with PIEPSAP/SOPAC help in 2008 and good stakeholder interest produced a final draft and now awaits cabinet approval. A key aspect of the policy is establishment of an appropriate fuel supply arrangement to ensure Nauru can obtain a reliable and affordable fuel supply; ongoing SOPAC support and monitoring will be needed because of weak government institutional capacity. The EU continues to assist by promoting energy saving via improved efficiency of energy use and energy audits.
• Recently Nauru signed an MOU with the Pacific Island Forum Secretariat to be involved in the Bulk Procurement of Fuel Initiative as a first step to securing supplies and reducing imported fuel costs.
• Ocean Thermal Energy Conversion (OTEC) and wind renewable energy with a smaller contribution from solar PV and solar heating are the other possible options at present for Nauru. In the past Nauru had an OTEC generation system but it has fallen into disrepair.
• A Strategic Plan for Sustainable Development in Nauru 2004–2008 was supported by FAO and provided a framework to develop agriculture.
• The PIGGAREP/SPREP/UNDP/GEF Project which seeks to reduce GHG emissions by cost-effective use of commercially viable renewable energy technologies includes Nauru.
• Development of fisheries is vital to food security in Nauru. Fisheries play an important role in the economy from license fees for foreign fishing boats fishing in the substantial EEZ.
• In summary, Nauru at present has no food security policy but it does have the basis for same with the FAO Strategic Plan for Sustainable Development in Nauru 2004–2008. Limited livelihood options, high and volatile food prices and a deep trade balance deficit as well as total reliance on food imports because agricultural and livestock production levels are very low have major implications for food security. Assistance with preparing a food security policy and integrating it with energy policy would need external TA as there is very limited institutional capacity to do such work in Nauru.

49
Palau (Information sources: PIREP/SPREP reports 2004; SOPAC reports; World Bank [2008a,b,c] and reports mentioned earlier along with visits to key agencies and survey results.) Land area (km2): 487
Sea area/EEZ (km2): 600 900
Population: 19 900 (2005)
Annual growth (%): 0.8
Average density (inhabitants/mile2): 45 Rural population (% of total population): 23
GDP (US$ million):156 614 (2006)
GDP per capita (US$): 7 284 (2006)
GDP real growth (ave.1994–2006): 3.3% per annum
Agriculture sector GDP (% of total GDP): 3.4% (2006)
Trade balance (2005): US$91 765 000 (exports as % of imports): 12.75%
Food and live animals as % of total imports: 9.3% (2005)
Budget expenditure for agriculture and fisheries: US$925 072 (2008) 0.7% of 2008 budget appropriations went to the Bureau of Agriculture and 0.9% went to the Bureau of Marine Resources
Human Development Index: N/A
Source: NMTPF (2009).
• Palau consists of over 200 islands and has a land area of 487 km2 with most of the population residing in three islands. The islands are a mix of coral and volcanic outcrops and atolls with most of the area being in one reef structure.
• The Energy Department is in the Public Works Department and the director reports directly to the minister. The department’s duties are not well defined and there was no energy policy in the past (PIREP/SPREP 2004). Energy demand in 2002 was 51 million litres of diesel and 56 million litres of petrol. Diesel is used for power generation and marine use while petrol is used for land transport and marine purposes; both are evenly split between different uses.
• Palau is the highest GHG producer of all PICs. • The opportunities to reduce imports of fuel and GHG reduction would seem to lie
with solar PV grid connections, house PV units and solar hot water as well as energy efficiency improvements. Wind power installations have failed in the past.
• There is good forest cover of 75 percent of which about 60 percent is dense forest. Harvest of this biomass for energy or planting of plantations is not likely to occur because of economic, environmental and land tenure issues.
• Opportunities for biofuel are slim as there are no large coconut plantings and copra is not produced commercially; thus biofuels are not an option for bioenergy. Commercial pig and chicken producers might usefully use biogas digesters for waste handling and methane gas production for use in the processing areas.
• Biogas options for generating methane from human sewage waste are possible and as landfills develop they provide some small options for energy generation.

50
• OTEC energy generation is possible, based on ocean depths nearby, but is not likely in the next decade or so and hydropower potential is very limited.
• Because energy use/head is high, changes from conventional diesel-powered systems to renewable energy will be costly. Also, Palau has had limited experience with renewable energy projects in the past thus giving a range of constraints to their design, evaluation and use.
• Unfortunately the PIGGAREP/SPREP/UNDP/GEF Project which seeks to reduce GHG emissions by cost-effective use of commercially viable renewable energy technologies does not include Palau.
• In summary, there is likely to be no conflict between bioenergy and food security issues arising in Palau. Palau was supported with poverty analysis by UNDP, ADB and SPC until the end of 2008. Currently only a small commercial sub-sector is producing vegetable crops for the local market. Commercial farms mostly specialize in high value crops such as cucumber, green onion, Chinese cabbage, green peppers, beans, kankum and egg plant. The commercial sub-sector is largely driven by foreigners, either as laborers from the Philippines, or entrepreneurs from China. Traditional farming systems are semi-subsistence systems producing root crops, cassava, betel nut and pepper leaf, or more conventional systems that rotate vegetable crops on annual basis, using a mix of organic and inorganic inputs to ameliorate the relatively infertile acid soils. Traditional subsistence systems predominantly involve production by women. Aspects of the 2020 National Master Development Plan (NMDP), and other plans, have been implemented, but on a somewhat ad hoc basis. There is a need to streamline and more effectively coordinate the implementation of the various development plans and the assistance provided by Palau’s development partners. High and volatile food and oil prices and a significant trade balance deficit are serious issues. Unexploited potential for increased local agricultural production., unexploited potential for sustainable timber production in agroforestry systems, lack of appropriate forest policy and legislative framework, lack of local produce market and weak market chain linkages (NMTPF 2009.) These among many other issues all point to the need for a food security policy for Palau and to integrate it with energy and other policies. External TA will be needed for the policy work because Palau has weak institutional capacity. An updated natural resource inventory and databases could not be found.
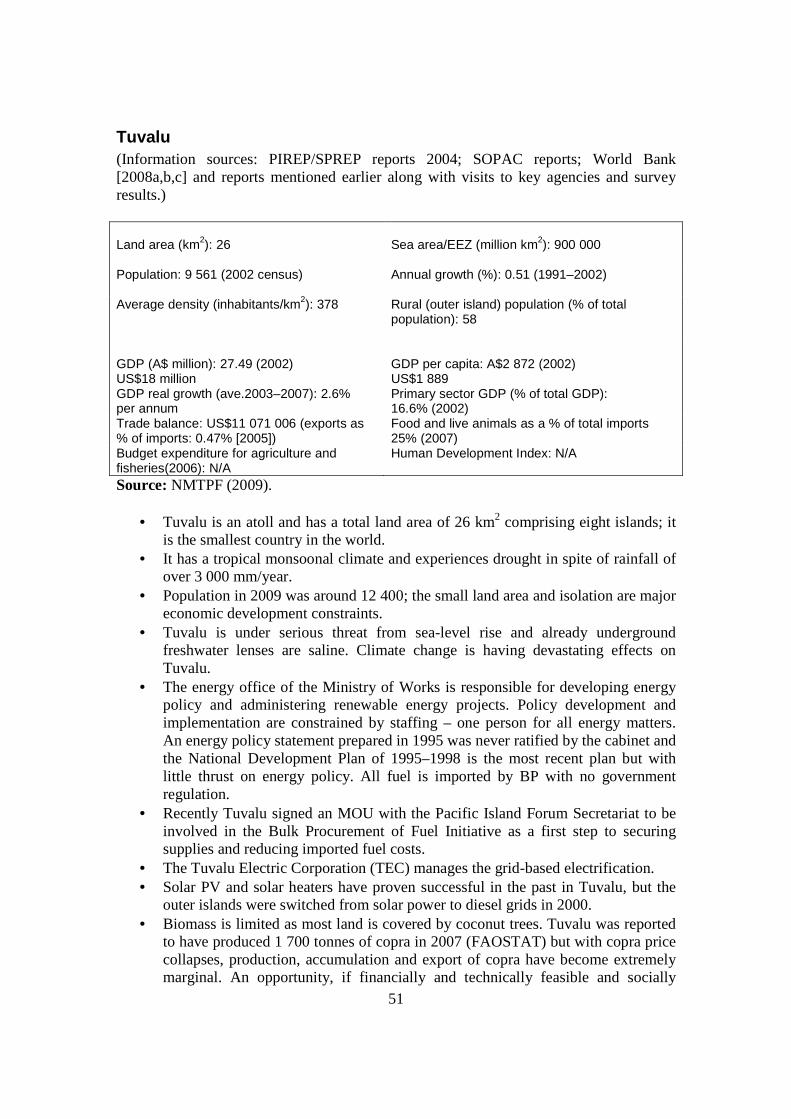
51
Tuvalu (Information sources: PIREP/SPREP reports 2004; SOPAC reports; World Bank [2008a,b,c] and reports mentioned earlier along with visits to key agencies and survey results.) Land area (km2): 26
Sea area/EEZ (million km2): 900 000
Population: 9 561 (2002 census)
Annual growth (%): 0.51 (1991–2002)
Average density (inhabitants/km2): 378 Rural (outer island) population (% of total population): 58
GDP (A$ million): 27.49 (2002) US$18 million
GDP per capita: A$2 872 (2002) US$1 889
GDP real growth (ave.2003–2007): 2.6% per annum
Primary sector GDP (% of total GDP): 16.6% (2002)
Trade balance: US$11 071 006 (exports as % of imports: 0.47% [2005])
Food and live animals as a % of total imports 25% (2007)
Budget expenditure for agriculture and fisheries(2006): N/A
Human Development Index: N/A
Source: NMTPF (2009).
• Tuvalu is an atoll and has a total land area of 26 km2 comprising eight islands; it is the smallest country in the world.
• It has a tropical monsoonal climate and experiences drought in spite of rainfall of over 3 000 mm/year.
• Population in 2009 was around 12 400; the small land area and isolation are major economic development constraints.
• Tuvalu is under serious threat from sea-level rise and already underground freshwater lenses are saline. Climate change is having devastating effects on Tuvalu.
• The energy office of the Ministry of Works is responsible for developing energy policy and administering renewable energy projects. Policy development and implementation are constrained by staffing – one person for all energy matters. An energy policy statement prepared in 1995 was never ratified by the cabinet and the National Development Plan of 1995–1998 is the most recent plan but with little thrust on energy policy. All fuel is imported by BP with no government regulation.
• Recently Tuvalu signed an MOU with the Pacific Island Forum Secretariat to be involved in the Bulk Procurement of Fuel Initiative as a first step to securing supplies and reducing imported fuel costs.
• The Tuvalu Electric Corporation (TEC) manages the grid-based electrification. • Solar PV and solar heaters have proven successful in the past in Tuvalu, but the
outer islands were switched from solar power to diesel grids in 2000. • Biomass is limited as most land is covered by coconut trees. Tuvalu was reported
to have produced 1 700 tonnes of copra in 2007 (FAOSTAT) but with copra price collapses, production, accumulation and export of copra have become extremely marginal. An opportunity, if financially and technically feasible and socially

52
acceptable, would be to replace about 1.5 million litres of diesel used to power electricity generators with coconut oil; 1 700 tonnes of copra would produce around 1.1 million litres of diesel equivalent. Coconut oil biofuel seems to be the best potential renewable energy resource for Tuvalu along with solar power. About half the land area of Tuvalu is covered by coconut. High labour costs may be a major constraint for coconut oil production and feasibility studies are essential for the outer islands along with small-scale trials.
• UNDP (2008–2011) is assisting with a Capacity Building for Sustainable Land Management Medium Size Project; it strengthens land-use capacities and land information management systems as well as sustainable management of land systems in traditional and modern agriculture and land rehabilitation.
• On 26 April 2008 the first production of coconut biodiesel was demonstrated in Tuvalu.
• Poor atoll soils are not conducive to rapid biomass growth. Some wood biomass would be available from replacement of old coconut trees with new plantings, but the amount would be limited.
• OTEC, wave and wind power and biogas do not appear to be viable technologies for Tuvalu, except possibly for wind in specific locations.
• With solar PV and coconut oil biofuel, GHG production could be reduced by about 17 percent over a ten-year period.
• The PIGGAREP/SPREP/UNDP/GEF Project which seeks to reduce GHG emissions by cost-effective use of commercially viable renewable energy technologies includes Tuvalu.
• In summary, Tuvalu will need help in assessment of coconut resources available for biofuel coconut oil and feasibility studies on coconut oil production for diesel substitution. While it is unlikely that use of coconut for oil would impact greatly on food security, food security studies need to be undertaken in light of the inundation and land loss occurring already from climate change. It is unlikely that Tuvalu would be able to develop a food security policy without considerable assistance as technical capacity is very limited. Tuvalu has no energy policy and again would need assistance to develop one and integrate it with food security policy.

53
Kiribati (Information sources: PIREP/SPREP reports 2004; SOPAC reports; World Bank [2008a,b,c] and reports mentioned earlier along with visits to key agencies and survey results.) Land area (km2): 810
Sea area/EEZ (million km2): 3.6
Population: 92 533 (2005 census)
Annual growth (%): 2.5
Average density (inhabitants/km2):127 Rural population (% of total population): 54
GDP (A$ million): 81.91 (2006) US$61.43 million
GDP per capita: A$870 (2006) US$653
GDP real growth (ave. 2000–2006): 0.04% per annum
Primary sector GDP (% of total GDP): 3.2% (2006)
Trade balance: US$56 887 000 (exports as % of imports: 9.9% [2006])
Food and live animals as % of total imports: 30.1% (2005)
Budget expenditure for agriculture and fisheries (2006): A$1.83 million % of total budget expenditure: 2.3%
Human Development Index: N/A
Source: NMTPF (2009).
• Kiribati includes 32 atolls in three island groups (Phoenix, Line and Gilbert) and one raised coral island spread over an ocean extent of 4 200 by 2 000 km. The total land area is 811 km2. The climate is marine equatorial with islands in the south being very dry while northern islands receive around 3 000 mm/year of rainfall. However, all of Kiribati experiences cyclic droughts and rainwater for drinking can be a problem with many water lenses now experiencing salt inundation.
• Twenty-one of the 33 islands are inhabited; Banaba (Ocean Island) in Kiribati is one of the three great phosphate rock islands in the Pacific Ocean – the others are Makatea in French Polynesia and Nauru.
• There has been rapid growth of the urban population in Tarawa and Kiritimati as well as rapid growth in energy demand.
• Commercially viable phosphate deposits were exhausted at the time of independence from the United Kingdom in 1979. Copra and fish now represent the bulk of production and exports. The economy has fluctuated widely in recent years. Economic development is constrained by a shortage of skilled workers, weak infrastructure and remoteness from international markets. Tourism provides more than one-fifth of the GDP. Private sector initiatives and a financial sector are in the early stages of development. Foreign financial aid from the EU, United Kingdom, USA, Japan, Australia, New Zealand, Canada, UN agencies and Taiwan, Province of China accounts for 20 to 25 percent of the GDP. Remittances from mariners on merchant ships abroad account for more than US$5 million each year. Kiribati receives around US$15 million annually for the government budget from an Australian trust fund (CIA 2009). Recently Australia has provided A$50

54
million over ten years for rehabilitation of the island devastated by phosphate mining.
• The Ministry of Works and Utilities is responsible for energy needs. It promotes development of renewable energy and encourages energy efficiency. The Energy Planning Unit (EPU) is responsible for policy development and coordination as well as providing assistance for all energy activities. There is an urgent need for development of a national energy policy. The SOPAC PIEPSAP Project assisted with the development of a National Energy Policy Framework. At the PEMM 2009 meeting in Tonga, Kiribati announced that it was working on an implementation plan for the policy and other energy-related activities.
• Kiribati is highly dependent on imported petroleum and energy costs have risen sharply in recent years with a serious flow-on effect on food prices. Kiribati depends almost solely on petroleum imports for electricity generation except for about 1 percent of electricity that comes from home solar PV on the outer islands and from government offices and housing where generators are used. Thus, generally the outer islands depend on solar PV for electricity for lighting and largely on biomass for cooking and copra drying. Solar energy levels for all of Kiribati are very good and Kiribati was one of the first countries in the world to promote solar energy for electrification.
• In 2005, of the total land area, arable land comprised 2.74 percent (permanent crops 47.95 percent and other uses 49.31 percent).
• Biomass for cooking largely comes from coconut husks, dead leaves and shells or from mangrove wood. Biomass is apparently sufficient on outer islands but in short supply in the urban areas of Tarawa and Kiritimati.
• Kiribati is a moderate producer of copra, producing 110 000 tonnes in 2007 (FAOSTAT). Production is falling because of low copra prices in recent times and the costs of producing copra on outer islands have risen. There is now a good opportunity to use coconut oil for diesel substitution to reduce dependence on imported diesel. PIREP/SPREP (2004) concluded that potentially up to 85 percent of diesel could be offset by biofuel based on coconut oil and a further 15 percent by solar and wind power. However, before wind is proposed for energy, a much better assessment of the resource must be undertaken. Most GHG emissions are from urban areas and most emissions will need to be offset by improved energy efficiency.
• Biogas is not an alternative for saving fuel. OTEC, wave and tidal energy do not appear feasible for Kiribati.
• Use of coconut oil for export or use as biofuel is unlikely to impact on food security because the resource is simply diverted to an alternate use. Low prices for copra/oil exports affect food security because incomes fall. FAO supported a Coconut Study 2004–2008 to review the existing structure of the copra industry, particularly processing and marketing, to recommend operations to assess the long-term sustainability of the industry. In spite of repeated requests this report was not provided by FAO.
• The PIGGAREP/SPREP/UNDP/GEF Project which seeks to reduce GHG emissions by cost-effective use of commercially viable renewable energy technologies includes Kiribati.
• Kiribati will need considerable help with the feasibility, technologies and restructuring of the copra industry to produce coconut oil for fuel as diesel

55
replacement in power generation and land and marine transport. UNDP, ADB and SPC provided support on poverty analysis until the end of 2008. The following comments are especially pertinent to food security policy development: “High and volatile food and oil prices and a deep trade balance deficit. High dependency on imported foods and rapidly increasing levels of food and nutrition related non communicable diseases, which impact negatively on health system, families and national economy. Limited livelihood options particularly for outer islands. High level of youth unemployment particularly in urban areas. Lack of a sector plan that provides a coherent policy and financing framework for promoting agriculture development and food security. Limited human resource capacity for sector development. Limited capacity for staple food crop and livestock production. Limited water supply for competing demands between domestic and agricultural uses. Need to sustainably develop and diversify fisheries and aquaculture commodities for domestic and international markets. Need to sustainably develop coconut value added industries. Vulnerability to adverse impacts of Climate Change and Sea level Rise” (NMTPF 2009).
• In summary, Kiribati will need help in assessing the coconut/bioenergy resource
in future. Additional assistance is needed for food security data. Kiribati does not have a food security policy or a cabinet-ratified energy policy and needs help with preparation and integration. Lack of a sectoral plan that provides a coherent policy and financing framework for promoting agricultural development and food security and limited human resource capacity for sectoral development are major constraints. There is no energy policy but there is a framework prepared by SOPAC and clear intent to proceed as flagged at the recent PEMM 2009 meeting in Tonga in April. Natural resource data collection is required.

56
Cook Islands
(Information sources: PIREP/SPREP reports 2004; SOPAC reports; World Bank [2008a,b,c] and reports mentioned earlier along with visits to key agencies and survey results.) Land area (km2): 237; 58% arable
Sea area/EEZ (km2): 1.8 million
Population: 19 569 (2006)
Annual growth (%): -1.1 (due to emigration)
Density (inhabitants/km2): 83
Rural population (% of total population): 30
GDP: NZ$286 711 million (2007) (US$168 844 million)
GDP per capita: NZ$13 588 (2007) (US$8 001)
GDP real growth (ave.1995–2007): 6.1% per annum
Primary sector (agriculture and fisheries) GDP (% of total GDP): 12.2% (2007)
Trade balance: US$135 489 000 (exports as % of imports): 3% (2007)
Food and live animals as % of total imports: 19% (2007)
Budget allocation for agriculture, forestry and fisheries (2006/07): % of total budget 3.7%
Human Development Index (2004): N/A
Source: NMTPF (2009).
• The Cook Islands consist of 15 islands with a total land area of 240 km2. The northern Cook Islands are seven low-lying, sparsely populated, coral atolls; the southern Cook Islands, where most of the population lives, consist of eight elevated, fertile, volcanic isles, including the largest, Rarotonga, at 67 km2 (CIA 2009). Ninety percent of the land area and population live in the southern group of eight elevated volcanic islands with fertile soils. The Cook Islands are environmentally fragile with often steep lands that, if disturbed, erode quickly and contaminate coral reefs. The islands are subject to cyclones. Migration away from outer islands is a problem for agriculture and fishing as well as energy provision.
• The climate is tropical oceanic, moderated by trade winds. The dry season lasts from April to November and a more humid season is experienced from December to March.
• Like many other PICs, the Cook Islands' economic development is hindered by the isolation of the country from foreign markets, the limited size of domestic markets, lack of natural resources, periodic devastation by natural disasters and inadequate infrastructure. Agriculture, employing about one-third of the working population, provides the economic base with major exports comprising copra and citrus fruit. Black pearls are the Cook Islands' leading export. Manufacturing activities are limited to fruit processing, clothing and handicrafts. Trade deficits are offset by remittances from emigrants and by foreign aid, predominantly from New Zealand. The encouragement of tourism and a debt-restructuring agreement has helped investment and growth in recent years (CIA 2009).

57
• The Ministry of Works has a small Energy Division, but focus is mostly on electrical work and not on policy. Responsibilities in energy are spread over a number of ministries. A National Energy Policy was endorsed by the cabinet in 2003. There are several acts of parliament dealing with energy-related issues. The National Strategic Plan covers some of them. There is no development plan for use of renewable energy to help foster renewable energy investment and development. PIREP/SPREP (2004) give details of constraints and needs.
• There is limited information to determine energy use by commercial, industrial, household, government and transport sectors. Ninety percent of the Cook Islands’ energy comes from petroleum imports. Only 10 percent of energy comes from biomass/wood, mostly for cooking. Ninety-nine percent of households have electricity, with around 8 percent having solar connections. Some have diesel generators as well.
• Recently the Cook Islands signed an MOU with the Pacific Island Forum Secretariat to be involved in the Bulk Procurement of Fuel Initiative as a first step to securing supplies and reducing imported fuel costs.
• There have been no biomass surveys since the 1980s. While about 65 percent of the land has light to dense tree cover, it is unlikely that this will be used for biomass energy other than for cooking. Logging and commercial timber production with waste for biomass is very unlikely to develop because of environment laws, land tenure and transport costs. The Cook Islands have only a small reserve of coconuts with the 2000 Agricultural Census indicating only 43 000 trees. Ninety-seven percent of coconuts is used for household use including animal feed; copra production for sale is negligible as generally production costs are too high and thus also likely to be too high for fuel production. While 58 percent of the land is considered arable only about 18 percent has been cleared for agriculture and about 17 percent for property development.
• Biogas has limited potential with only three piggeries using digester units. • Solar power is used successfully on outer islands and is probably the best
renewable energy option because the resource is good. While there may be potential for wind, wave and OTEC power none seem likely to be developed at present, except for wind perhaps, in a small way. Solar heating of water is used by about 50 percent of households. Hydropower systems are not being considered as they would be too expensive. Emphasis on energy efficiency is one way to reduce dependence on fossil fuels. The spread of population and thus energy demand make expensive OTEC and wave technologies largely uneconomic.
• The PIGGAREP/SPREP/UNDP/GEF Project which seeks to reduce GHG emissions by cost-effective use of commercially viable renewable energy technologies includes the Cook Islands. The project has helped with a survey for wind farms and other associated wind-monitoring activities.
• The Cook Islands in 2007–2008 were supported by an FAO study on Assessment of the Impact of Climate Change on Food Security. Agricultural policy was recently reviewed in 2008 by FAO and a policy guideline has been drawn up for ten years. Both of these studies will help with food security policy formulation. UNDP, ADB and SPC provided support on poverty analysis until the end of 2008.
• NMTPF (2009) gives a long list of constraints and issues affecting agricultural development including: “Limited livelihood options for people on outer islands (particularly Northern atoll group), poor agricultural production potential on atoll

58
soils, isolation of Northern Group and very expensive transport costs, labour constraints for growth in the agriculture sector, including limited skilled workers in technical and specialised fields, lack of agricultural (and fisheries) infrastructure in the outer islands to improve production levels, limited land available for agriculture production on Rarotonga, limited water supply for competing demands between domestic and agricultural uses, plus natural disasters from cyclones and climate change. Outdated agricultural statistical data since the last agricultural census was in 2000, and the need to have this updated to assist decision-making processes and food security policy formulation andplans” All of these points flag potentially serious food security issues.
• In summary, the Cook Islands will need help with data collection on food crops and natural resources and in formulation of a food security policy and its integration with future policy on energy/bioenergy. However, it is unlikely that there will be conflict with bioenergy/biofuels and food because the costs and opportunities to produce conventional biomass and biofuels will not be financially, economically or technically feasible at present with existing commercially available technologies.
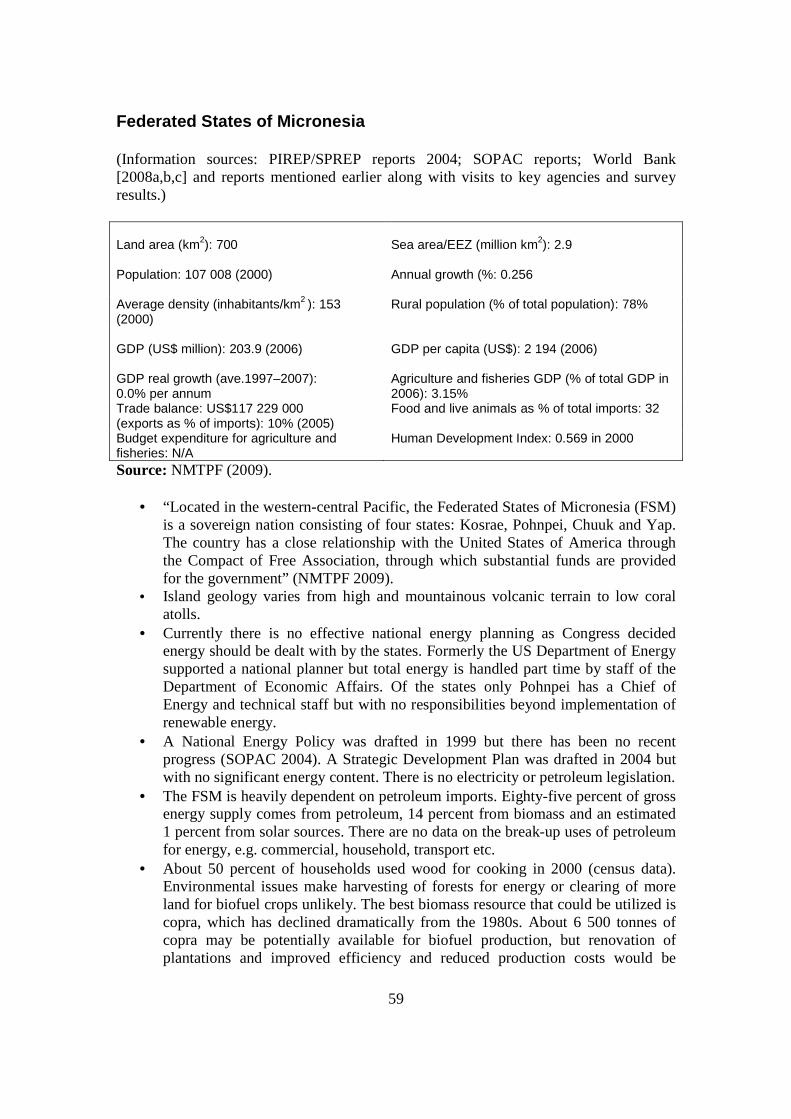
59
Federated States of Micronesia
(Information sources: PIREP/SPREP reports 2004; SOPAC reports; World Bank [2008a,b,c] and reports mentioned earlier along with visits to key agencies and survey results.) Land area (km2): 700
Sea area/EEZ (million km2): 2.9
Population: 107 008 (2000)
Annual growth (%: 0.256
Average density (inhabitants/km2 ): 153 (2000)
Rural population (% of total population): 78%
GDP (US$ million): 203.9 (2006)
GDP per capita (US$): 2 194 (2006)
GDP real growth (ave.1997–2007): 0.0% per annum
Agriculture and fisheries GDP (% of total GDP in 2006): 3.15%
Trade balance: US$117 229 000 (exports as % of imports): 10% (2005)
Food and live animals as % of total imports: 32
Budget expenditure for agriculture and fisheries: N/A
Human Development Index: 0.569 in 2000
Source: NMTPF (2009). • “Located in the western-central Pacific, the Federated States of Micronesia (FSM)
is a sovereign nation consisting of four states: Kosrae, Pohnpei, Chuuk and Yap. The country has a close relationship with the United States of America through the Compact of Free Association, through which substantial funds are provided for the government” (NMTPF 2009).
• Island geology varies from high and mountainous volcanic terrain to low coral atolls.
• Currently there is no effective national energy planning as Congress decided energy should be dealt with by the states. Formerly the US Department of Energy supported a national planner but total energy is handled part time by staff of the Department of Economic Affairs. Of the states only Pohnpei has a Chief of Energy and technical staff but with no responsibilities beyond implementation of renewable energy.
• A National Energy Policy was drafted in 1999 but there has been no recent progress (SOPAC 2004). A Strategic Development Plan was drafted in 2004 but with no significant energy content. There is no electricity or petroleum legislation.
• The FSM is heavily dependent on petroleum imports. Eighty-five percent of gross energy supply comes from petroleum, 14 percent from biomass and an estimated 1 percent from solar sources. There are no data on the break-up uses of petroleum for energy, e.g. commercial, household, transport etc.
• About 50 percent of households used wood for cooking in 2000 (census data). Environmental issues make harvesting of forests for energy or clearing of more land for biofuel crops unlikely. The best biomass resource that could be utilized is copra, which has declined dramatically from the 1980s. About 6 500 tonnes of copra may be potentially available for biofuel production, but renovation of plantations and improved efficiency and reduced production costs would be

60
needed for the biofuel to be economically competitive, as noted in the PIREP 2004 report.
• Regarding biogas, no resource assessment was available. • Hydropower operated in a small way in the past but is now defunct. • There is a good solar resource for development. • There are limited prospects for wave and OTEC but development is not possible
with current technologies. • The PIGGAREP/SPREP/UNDP/GEF Project which seeks to reduce GHG
emissions by cost-effective use of commercially viable renewable energy technologies does not include the FSM. Thus the FSM will have to seek biofuel and other renewable technologies from other aid supporters. UNDP’s MDG Achievement and Poverty Reduction 2008–2012 for 11 PICs focuses on sustainable and affordable energy services for the poor with inputs on pro-poor interventions, policy and institutional arrangements for mainstreaming poverty-energy issues, especially with renewable energy; this may be of some assistance.
• ADB (2003) estimated poverty incidence to be as high as 40 percent. UNDP, ADB and SPC provided support on poverty analysis until the end of 2008. NMTPF (2009) states: “Data on the primary economic sectors of FSM are weak; there are no indicators on agricultural production, limited information on agricultural exports, and fisheries information is also generally poor. Agricultural subsistence activities are estimated to make a substantial contribution to GDP, but production is locally-based and small scale. Food is grown for local consumption and to support relatively small export sales in regional markets, primarily Guam and the Marshall Islands. Main export products include fish, betel nut, kava, banana and root crops; small amounts of pepper leaves and citrus are also exported. The small land area generally limits large-scale commercial farming for export. Farmstead livestock production is important throughout the FSM, particularly for subsistence and cultural use”
• In summary, the FSM will need assistance with natural resource data collection on
biomass energy and formulation of energy and food security policies and their integration.

61
IV. Conclusions and recommendations
• None of the PICs has an integrated energy/bioenergy/food security and natural resource policy, policy framework or strategies as a basis for guidelines for energy and food security development in relation to the existing resource bases. Most PICs have no energy or food security policies. SI has the recent National Policy Framework involving policies and guidelines while PNG has a food security policy.
• All PICs with the exception of PNG and SI has no updated GIS imagery, with the
last aerial photography being conducted in 1996. PNG has new imagery at UNPG and an updated PNGRIS database. The Forestry Division in SI has recently updated forest cover and with AusAID help is preparing to prepare a Strategic Environmental Assessment involving a broad inventory of forestry types and land use.
• Most PICs have virtually no lands of any consequence for large-scale plantings of
biofuel crops except for PNG, Fiji and to a much less extent SI.
• Most PICs, with the exception of PNG and SI, do not have data available or the ability to collect data needed to develop integrated policy involving bioenergy, food security and the natural resource base. However Vanuatu is a good example of the application of technologies to make practical use of coconut oil as a vital energy source.
• No PIC has a clear policy on bioenergy crops. A policy similar to the People’s
Republic of China in that no basic food crop, unless in surplus is to be used for biofuel and no food cropland is to be used for biofuel crops is recommended for consideration as a starting point for all PICs.
• The most acute need for food security would appear to be in the Marshall Islands
and Tuvalu. The economic collapse of the Marshalls and the inundation of Tuvalu and the existing extent of aid support contribute strongly to this urgent situation.
• While most institutions and agencies consulted have a clear interest in seeing
policies linking food security with energy/bioenergy and natural resources the political will is often hard to judge because of lack of transparency in decision-making, particularly in terms of land use and concessions to logging, mining, agricultural development and real estate development in many PICs.
• Which countries are chosen for further in-depth study depends on the selection
criteria that are chosen, e.g. food security urgency, energy deficiency, bioenergy opportunities, data availability, threats to the natural resource base, vulnerability to natural disasters, complementary support from the FSSLP and other key donor support. The data provided in this report will allow choices based on the selection criteria adopted. Another option would be to choose a country with good available data, such as PNG, and demonstrate how a food security/energy–

62
bioenergy/natural resources integrated policy can be developed as a model for other countries. This exercise may be linked to case studies such as whole nut use of the coconut, including economic aspects of use for diesel replacement in selected countries. Case studies could examine the sustainable oil-palm models of PNG and SI and the potential integrated use of sugar cane and off-season sweet sorghum for ethanol generation in Fiji and PNG; also the integrated model of cassava production and utilization for ethanol and other value-added products in PNG.
• The response from PICs to the survey was disappointing with only three countries
responding in an incomplete way. For better information it was essential to visit the countries and meet with key agencies as well as donors and CROP agencies. Surveys for the Marshall Islands and the six countries visited are found in Appendix 7.
• Apart from the use of wood energy for cooking, drying of copra, cocoa and coffee
and in some cases gasification, the main opportunity for most PICs, is to use coconut oil as a diesel substitute, as so successfully practised in Vanuatu, especially for power generation. The exceptions are Nauru, Cook Islands, Niue, Tonga and Palau, which have low coconut production and where most coconut is used for human or animal food.
• The use of coconut oil as a diesel substitute is a mature technology, as
demonstrated in Vanuatu; the model for rural electrification where farmers bring copra to the oil plant and generator site to prepay for metered electricity is very successful. The programme is implemented by UNELCO and supported by the EU; it is operating in three sites and will extend to nine sites. It makes good sense to use the coconut resource to produce coconut oil for diesel substitution because copra and coconut oil prices on the world market are low and it is uneconomic to export. Use of the coconut for oil will give farmers further income and at the same time reduce diesel imports and fuel costs and save foreign exchange.
• There are options for the use of gasifiers but these have failed in most countries in
the past with the possible exception of PNG for crop drying.
• Most PICs have little opportunity for biogas production and success has been very mixed.
• Fiji and PNG have opportunities to produce ethanol from sugar cane and cassava
and projects are planned with integrated cassava factories for Fiji and PNG. It was recommended that both PNG and Fiji include sweet sorghum as a crop with sugar cane to provide a summer feedstock to sustain a sugar factory producing ethanol year-round. Use of breadfruit to make ethanol in Samoa would be highly questionable with respect to economic viability and desirability because breadfruit is an important food crop.
• Fiji, PNG, SI and Vanuatu have been lobbied by Jatropha curcas plantation
proposals from investors. To their credit all applications have been refused to

63
date. Jatropha plantations have not been commercially successful anywhere in the world, and interplanting of coconut with Jatropha will disrupt food and cash crop production and livestock rearing options. The oil and oil cake are toxic, the oil needs reprocessing in three months and the plant has been declared a perennial noxious weed and invasive species in many countries (Chapman and Yishi 2008; http://www.guardian.co.uk/environment/2009/may/05/jatropha-biofuels-food-crops). Jatropha has no place in coconut areas because coconut is infinitely more useful in many different ways as a food or fuel and is the main basis for very sustainable coconut farming systems in PICs.
• One investor group is proposing to promote Pongamia pinnata as an oil crop for
smallholder farmers in Fiji. Pongamia trees are large, and thick canopies exclude sunlight unlike coconuts and take a number of years to be productive (10–15 years to attain high yields). Once planted the trees will largely occupy all the land and exclude other cropping as trees mature. Single seed pods have to be hand harvested and the economics of doing so has yet to be demonstrated. If Pongamia can be effectively harvested mechanically, it is possible that plantations may be successful, but the crop should not be promoted to smallholders to replace food crop or livestock areas. The seeds, oil and oil cake are toxic and cannot be used for animal feed.
• No awareness of the advantages or disadvantages of biofuel crops generally
prevailed in the PICs visited and a concerted effort is needed to inform energy and agriculture ministries in more detail about biofuels so they can deal with the extravagant claims of investor proposals to try to gain major plantation concessions.
• Oil-palm is a very successful crop in PNG and SI and is produced in a certified
sustainable way to provide secure incomes for smallholder diversified farming. CPO is not used for biodiesel in either PNG or SI. PNG has 13 plantations and a refinery but SI has only a CPO and PKO plant. All SI exports of CPO and PKO go to Europe and are used solely for food products. Palm oil planted in grassland waste areas such as in SI is not nearly as damaging to carbon sequestration compared to cutting of tropical forests in Malaysia and Indonesia, for example, and is a very sustainable option.
• Third generation biofuels could well become a reality in PICs, with the support of
foreign aid and public/private sector investments and cooperation. Such support for the future is recommended to aid agencies and investors. Third generation biofuel technology R&D and testing should be fast-tracked in PICs and both donor and investor support for this work is very strongly recommended. Limited land area and the dwindling resource base is a reality for many PICs and economic, more efficient non-conventional solutions must be viewed as a very high priority for both energy and food security and attaining a sustainable resource base.
• Third generation fuel from cellulosic ethanol production from fibre celluloses and
lignocelluloses in waste materials such as sugar-cane bagasse, crop residues and

64
by-products from crop processing such as cassava stalks, oil-palm empty bunches or fast growing tropical C4 grasses such as elephant grass or from legume fuelwood trees such as Gliricidia, Leucaena are clear options for future energy production. Use of sugar-cane bagasse can increase the yield of ethanol per hectare from around 3 500 litres to around 30 000 litres using cellulosic transformation to hexose sugars and their fermentation and distillation. The technology is now being commercialized in the People’s Republic of China and Republic of Korea.
• Third generation oil production from algae is a new and very promising
technology that when perfected may prove to be ideal for PICs as the productivity of oil per hectare is very high at levels up to 300 000 litres/ha, but potentially as high as 1.25 million litres/ha (http://en.wikipedia.org/wiki/Algae_fuel). Research in the USA and in Australia as well as other countries is well advanced on these technologies and their commercialization.
• The German Alpha Kat KDV technologies are used to convert wastes from a
whole range of sources such as dump sites, animal wastes, plastics, paper, manure, sawdust and wood and sewage to diesel in a high temperature reactor process using catalytic depolymerization (SOPAC 2009).
• Butanol produced from anaerobic fermentation of starch, sugar, lignin, cellulosic
fibre, lignin and other biomass with Clostridium acetobutylicium is another useful third generation biofuel that has a number of advantages over ethanol as a gasoline replacement (SOPAC 2009).
• Ethanolix continuous fermentation technology developed by St1 Biofuels of
Finland produces ethanol from organic wastes. Production costs in much smaller plants compare very favourably with large first generation or second generation bioethanol plants. Household and municipal wastes, paper, starch and sugar may act as feedstocks and by-products/residues of the process, depending on feedstocks, may be used for animal feed fertilizer or fed to anaerobic fermentation systems (www.st1.eu). The St1 company, founded in 1997, acquired the Exxon Mobil subsidiary in Finland and operates over 400 service stations in Finland and 40 in Sweden.
• Synthetic diesel from the Fischer/Tropsch process using gasification of biomass is
another third generation technology that in the near future may be feasible for a number of PICs with biomass resources.
• Clearly, when third generation technologies such as cellulosic ethanol, algae oil
and the Alpha Kat KDV 500 waste treatment method are introduced and found to be feasible in PICs then the pressure on food crops or food croplands and forests would be greatly reduced by these sustainable technologies. PICs could also dispense with the unacceptable options of Jatropha and other marginal biofuel crops and the disruption to long-term sustainable coconut farming systems, which Pacific islanders know well and are able to manage sustainably. Again strong donor support for third generation biofuel technologies is recommended.

65
• One very clear and urgent intervention in all PICs would be the regeneration of
the coconut industries and farming systems (including intercropping with food crops, fruits, vegetables, coffee, cocoa, vanilla, pepper and livestock rearing) and the rehabilitation and replanting of coconuts to replace the ageing coconuts present in all PICs. In addition such a programme should consider all the value-adding options of using the whole coconut for food, fuel, fibre, feed, oil, virgin coconut oil, handicrafts etc. It is recommended that donor agencies be alerted to these excellent intervention options to make a real impact for Pacific islanders’ livelihood improvements via income-generating opportunities. Urgent donor support is needed for coconut regeneration and rehabilitation along the lines described.
• Finally the resolution of energy needs in any individual PIC will often be a
combination of bioenergy, solar, wind and OTEC or other wave energy technologies depending on the resource options and capabilities of each country and likely impacts on food security.

66
Acknowledgements I wish to sincerely acknowledge the assistance of Nadia Scialabba, Senior Advisor of the Assistant Director-General of the Natural Resources Management and Environment Department, FAO, Rome and Vili Fuavao Subregional FAO Representative for the Pacific Islands, Apia, Samoa and his staff for their considerable support in organizing the appraisal mission and visits to Samoa, Fiji, Tonga, Vanuatu, PNG and SI as well as very useful background discussions. I also sincerely thank the FAO focal point officers and their staff in each of the countries visited for making all appointments and for very helpful discussions and guidance during my visits. I thank the various governmental agencies, donors and aid projects as well as private sector personnel in Samoa, Tonga, Fiji, Vanuatu, PNG and SI and the UNPNG for their helpful contributions to our discussions on food security, energy/bioenergy and natural resources and the sharing of information in hard copy and electronic format. I especially thank the CROP agencies, particularly SPREP, SOPAC and SPC for their very useful contributions and discussions, along with Peter Johnston, consultant and contributing author/consultant to the many SPREP/PIREP missions and reports and his overview of the renewable energy sectors of the PICs. Also, my special thanks to Tim Martyn (SPC), Solomone Fifita (SPREP), Rupeni Mario (SOPAC), Anthony Maxwell (ADB), Thomas Jensen (UNDP), Stephen Rogers (FAO consultant) and Fintan Scanlan (FAO, Rome) for very useful discussions and many electronic reports and data updates. Finally I thank SOPAC for kindly allowing me to attend the Pacific Energy Ministers Meeting in Tonga in April 2009, which provided an excellent opportunity to meet with so many PIC participants, donors, CROP agencies and private sector players in renewable energy technologies.

67
References Bawalan, Divina. 2008. Feasibility study on the whole nut coconut multipurpose
processing center concept in Fiji. Report for FAO-SAP. pp. 184. Chapman, K.R. & Yishi, Tian. 2008. ADB TA PRC-4987 national strategy for
sustainable energy crops development in China component B. Preparing a national strategy for sustainable energy crops development. Interim Report. pp. 93.
Central Intelligence Agency (CIA). 2009. The world fact book (available at http://www.google.com/search?sourceid=gmail&rls=gm&q=CIA%20The%20world%20Fact%20book)
Chaniel, J. 2009. Energy of the future. Paper and PowerPoint presentation for Regional Energy Ministers Meeting 2009, Tonga, April 2009. Vanuatu, UNELCO.
CoCoGEN. 2005. SOPAC feasibility study into the use of coconut oil fuel in EPC power generation-Samoa. SOPAC/UNDP Project Report. pp. 56.
CoCoGEN. 2005a. SOPAC CoCoGEN debriefing report. SOPAC/UNDP Project Report. pp. 54.
CoCoGEN-II. 2006. SOPAC mission report. CoCoGEN II Inception Visit. pp. 22. Food and Agriculture Organization of the United Nations (FAO). 2002. The state of
food insecurity in the world 2001. Rome, FAO (available at http://www.fao.org/docrep/005/y4671e/y4671e06.htm)
FAO COAG. 2007. Environment and agriculture. Item 6 of COAG 2007. FAO. 2008. State of food and agriculture-biofuels: prospects, risks and opportunities.
Rome, FAO. FAO. 2008a. Food Security and Sustainable Livelihoods Programme in Pacific Island
Countries. Programme Brief for Donor Meeting with ADB in Madrid, 5 May 2008. FAO. 2008b. FAO biofuel feasibility study Samoa. FAO-SAP Report. FAO. 2008c. National agriculture sector policy 2008-2012. Prepared with Ministry of
Agriculture and Livestock, Government of Solomon Islands and FAO. FAO-SAP Report. pp. 33.
FAO/SPREP. 2008. Report of the expert group on food security and climate change, Rome, June 2008. Prepared by SPREP.
Hanson, L.W., Allen, B.J., Bourke, R.M. & McCarthy, T.J. 2001. Papua New Guinea rural development handbook. ANU, Australia, Brown Prior and Anderson Melbourne.
International Energy Agency (IEA). 2006. World energy outlook 2006. IEA/OCD. pp. 600.
Johnston, Peter. 2009. Strengthening the fragile Pacific islands energy sector: addressing energy, economy and environment in a period of rapid change. Paper and PowerPoint presentation for Regional Energy Ministers Meeting 2009, Tonga, April 2009.
Lloyd, D. 2009. Challenges and opportunities for agriculture in a changing carbon economy. Queensland Report on AIAST Symposium 2008. J. Aust. Institute of Agr. Sc. and Technology, 21(1): 7–9.
McGregor, A., Bourke, R.M, Manley, M., Tubna, S. & Dea, R. 2008. Pacific island food security: situation, challenges and opportunities. Paper presented to the Third Conference of Ministers of Agriculture and Forestry (MOAF) in Apia, 8–9 September 2008. Secretariat of the Pacific Community.

68
National Medium Term Plan Framework (NMTPF). 2009. National Medium Term Plan Framework 2009-2012 for Cooperation and Partnership between FAO and 13 Pacific Island Countries. Samoa, FAO SAP, April 2009.
Pacific Islands Policy and Strategic Planning Project (PIEPSAP). 2008. Back to office project reports for Nauru (No. 77), Solomon Islands (No. 78) and Kiribati (No. 76) of PIEPSAP missions to assist with energy policy development and for the Samoa National Energy Plan – Strategic Action Plan Project Report No.80.
Pacific Islands Renewable Energy Project (PIREP)/SPREP. 2004. Pacific Regional Energy Assessment – 13 country reports of PIREP compiled by SPREP.
Reddy, M. 2007. Enhancing the agriculture sector in Pacific island economies. Pacific Economic Bulletin, Vol. 22(3): 48–60.
Sharma, K.L. 2006. Food security in the South Pacific island countries with special reference to the Fiji Islands. UNU-WIDER Research Paper No. 2006/68, United Nations University.
Secretariat of the Pacific Community (SPC)/South Pacific Applied Geoscience Commission (SOPAC). 2008. Pacific strategy for sustainable biofuels. Report for the SPC/SOPAC Pacific Regional Biofuel Workshop, 17–20 November 2008, Nadi, Fiji.
Secretariat of the Pacific Regional Environment Program (SPREP). 2004a. Pacific regional energy assessment 2004. Regional Overview Report Vol 1 of PIREP.
SOPAC. 2003a. A master plan for biomass resources of Fiji, Kiribati, Samoa, Tonga Tuvalu and Vanuatu. ICEPT/EPMG Consultancy Report for SOPAC.
SOPAC. 2003b. Synthesis report the biomass resources of Fiji, Kiribati, Samoa, Tonga Tuvalu and Vanuatu. ICEPT/EPMG Consultancy Report for SOPAC. pp. 33.
SOPAC. 2009. Potential for liquid biofuels in Fiji. SOPAC Miscellaneous Report 677. pp. 42.
SPC/Committee of Representatives of Governments and Administration (CRGA). 2008. Food security in the Pacific. Secretariat paper presented at SPC/CRGA 38th Meeting of the CRGA.
United Nations Development Programme (UNDP). 2007. Energy and poverty in the Pacific island countries. Bangkok, UNDP. pp. 52.
Woodruff, Allison. 2009. Taking control of oil in the Pacific: using analysis to strengthen energy policy and planning. Paper for Regional Energy Ministers Meeting 2009, Tonga, April 2009.
World Bank (WB). 2008a. The impact of global oil food price increases on the Pacific region and possible mitigation measures including Pacific food and fuel related activities matrix by agency. Report from July 2008 meeting of PICs in Sydney.
WB. 2008b Initial feasibility study for biodiesel in Fiji. Report prepared by LMC International for World Bank. pp. 32.
WB. 2008c. Feasibility study for ethanol in Fiji. Report prepared by LMC International for World Bank. pp. 55.

69
Appendix 1. Terms of reference for rapid appraisal of the bioenergy–food security nexus in the Pacific
Under the overall guidance of the Subregional Representative for the Pacific Islands and technical guidance of the Bioenergy Group of the Natural Resources Management and Environment Department, the consultant is expected to conduct a rapid appraisal on the bioenergy–food security nexus at the regional level, including selected Micronesian, Melanesian and Polynesian island countries. The aim is to provide policy-makers with a decision-making basis for the prioritization of in-depth country assessments and further analysis to be conducted in the second half of 2009 under the Bioenergy and Food Security (BEFS) analytical framework. More specific data requirements for the BEFS framework should, to the extent possible, already be noted during the completion of the rapid appraisal, as they may additionally influence the selection of in-depth countries. Agriculture and economy • Identify what are the main food crops and crops considered for bioenergy in each
country. • Collect food insecurity and vulnerability data for national and, if possible,
subnational level. Special emphasis should be placed on specific vulnerability of remote islands.
• Obtain data on each country’s agricultural trade balance to assess self-sufficiency of country per crop
• Assess the country’s domestic demand for agricultural commodities and, to the extent possible, projected future demand.
• Gauge the scope and degree of policy commitment and action with regard to bioenergy programmes, regulation and the political sensitivity for food security.
Energy • Share of different energy sources in the national energy mix. • Share of imported energy. • Assess current and projected future volumes and costs of import of fossil fuels
(crude oil, gas, gasoline and diesel). • Collect main fuel prices for consumers (gasoline/litre, diesel/litre, Kw/h). • Assess decentralized electrification (e.g. for on-farm use, telecommunication
towers, use in urban/rural transport etc.).
Natural resources • Identify, where possible geospatially, current land cover, land-use and
(qualitatively) land-use change trends in recent years. Where available, collect information on crop-specific land use and on existing or planned crop suitability assessments.
• Assess water availability and constraints and irrigated area. • Assess scope of wood energy and most important challenges faced.

70
• Highlight the major environmental challenges in each country potentially linked to bioenergy development (deforestation, biodiversity and habitat loss, water stress and pollution).
Possible references: IEA country profiles

71
Appendix 2. Survey of PICs to assist with a rapid a ppraisal of the bioenergy–food security nexus in the Pacific Background briefing information The FAO Subregional Office for the Pacific in collaboration with the Bioenergy Group of the Natural Resources Management and Environment Department, FAO, Rome, is conducting a rapid appraisal of the bioenergy–food security nexus at the regional level. The appraisal intends to include selected Micronesian, Melanesian and Polynesian PICs. In recent years conflicts have arisen between food and bioenergy crops as a consequence of rising global oil prices and they will likely continue in the future. Firm governmental policies on food security and bioenergy and implications for climate change are required to ensure continued sustainable development of island economies, with both access to adequate food and energy at affordable prices for all.
The aim of the work is to provide policy-makers at decision-making levels with a basis for the prioritization of in-depth country assessments and further analysis to be conducted in the second half of 2009 under the Bioenergy and Food Security (BEFS) analytical framework.
The primary objective of FAO’s three-year Bioenergy and Food Security (BEFS) Project is to mainstream food security concerns into national assessments of bioenergy and establish an analytical framework for the analysis of the food security and bioenergy nexus. Currently, Peru, Tanzania and Thailand have been chosen for BEFS studies with the activities in Thailand planned to be closely linked to analysis in Cambodia. Some PIC countries will be added. The BEFS strategy is based on three central components:
(iv) Development of an overall bioenergy and food security analytical framework and methodological guidance including data and information support.
(v) Estimation of bioenergy potential and food security implications within specific national and subnational contexts.
(vi) Development of field activities that are replicable, sustainable and that will strengthen both institutional capacities, as well as those of key national stakeholders.
The BEFS assessment overall includes five analytical steps, namely Module 1: Biomass Potential, Module 2: Biomass Supply Chain Production Costs, Module 3: Agriculture Markets Outlook, Module 4: Economy-wide Effects and Module 5: Household-level Food Security.

72
More specific data requirements for the BEFS framework are needed for completion of the rapid appraisal, as they may additionally influence the selection of countries for more in-depth studies and analysis. The purpose of the rapid appraisal is to determine data sources available in the PICs and whether they need help in collection and synthesis of data to assess initially at least two likely countries for further in-depth studies under the BEFS Project later in 2009 and on-going future assistance for food security/energy/climate change policy development. The survey form is included below. Please kindly complete the survey form electronically then save it as described on the form and kindly return the form by 27 May 2009 to: Keith Chapman – FAO Consultant E-mail: [email protected] With copy to: "Fuavao, Vili (FAOSAP)" [email protected] Subregional FAO Representative for the Pacific Islands Please note that all information will remain confidential and will only be referred to in general synthesis statements not be attributable to any individuals. Many thanks for your cooperation. Vili Fuavao Subregional FAO Representative for the Pacific Islands Apia, Samoa.

73
Survey form: rapid appraisal of bioenergy and food security The data needs for in-depth studies under the FAO BEFS Project include the following questions below. Data should be available for the most recent five-year period, where possible.
Please place a Y =Yes or N=No or H=Need Help, at the end of each line and please kindly complete the information on the bottom of the sheet. Many thanks for your greatly appreciated participation. After completion please save the completed form under a new file name e.g. Survey Rapid Appraisal Samoa Dept Energy .doc or similar for your country.
Agriculture and economy
Are you able, within the country, to: • Identify what are the main food crops and crops considered for bioenergy in each
country?.......... • Collect food insecurity and vulnerability data for national and, if possible, subnational
levels? (Special emphasis should be placed on specific vulnerability of remote islands)………..
• Obtain data on your country’s agricultural trade balance to assess self-sufficiency of country per crop?..........
• Assess your country’s domestic demand for agricultural commodities and, to the extent possible, project future demands?..........
• Gauge the scope and degree of policy commitment and action with regard to bioenergy programmes, regulation and the political sensitivity for food security?..........
Energy Can you determine from your own data or actions the following:
• The share of different energy sources (biomass, hydro, oil, gas, solar wind, ocean) in the national energy mix?..........
• The share of imported energy out of the total?.......... • Current and projected future volumes and costs of import of fossil fuels (crude oil, gas,
gasoline, diesel)?.......... • Collect main fuel prices for consumers (gasoline/litre, diesel/litre, Kw/h)?.......... • Assess the extent and amount of decentralized electrification? (e.g. for on-farm use,
telecommunication towers, use in urban/rural transport etc.)……….
Natural resources
Do you within the country have the ability to: • Identify, where possible geospatially, current land cover, land use and (qualitatively)
land-use change trends in recent years?.......... • Collect information on crop-specific land use and on existing or planned crop suitability
assessments?.......... • Assess water availability and constraints and irrigated area?..........

74
• Assess scope of wood energy and the most important challenges faced?.......... • Highlight major environmental challenges in each country potentially linked to bioenergy
development? (e.g. deforestation, biodiversity and habitat loss, water stress and pollution)……….
Additional policy planning questions Please answer with Y=Yes or N=No and dates where known
1. Is there an existing recent Food Security Policy for your country?..........
If so what was the date of its introduction/last revision, if known?.......... 2. Does the existing Food Security Policy include considerations on biomass and bioenergy crops and implications of likely conflicts with food crops?.......... 3. Does your country have a National Agricultural Development Plan?..........
If so what was the date of its introduction/last revision, if known?.......... Please kindly complete the information below. Name: E-mail: Department/institute: Country: Again many thanks for your kind cooperation.

75
Appendix 3. Food production and import data for PIC s (source: Tim Martyn SPC, Suva, Fiji derived from FAOSTAT and country statistical data) Cassava
Production (tonnes)
1998 1999 2000 2001 2002 2003 2004 2005 2006 2007
PNG 112 000 120 000 120 000 125 000 125 000 125 000 120 000 125 000 125 000 125 000
Samoa 250 300 300 300 300 300 300 300 310 370
Solomon Islands 2 000 2 100 2 300 2 300 2 500 2 500 2 500 2 500 2 500 2 500
Fiji 27 136 26 164 29 840 29 954 41 432 40 339 60 303 59 648 33 500 34 500
Cook Islands 3 000 3 000 3 000 2 000 1 600 1 250 1 250 1 250 1 250 1 500
Tonga 20 000 16 000 9 070 9 000 9 000 9 000 9 000 9 000 9 500 9 700
Tuvalu n/a n/a n/a n/a n/a n/a n/a n/a n/a n/a
FSM 11 800 11 800 11 800 11 800 11 800 11 800 11 800 11 800 11 800 12 000
RMI n/a n/a n/a n/a n/a n/a n/a n/a n/a n/a
Nauru n/a n/a n/a n/a n/a n/a n/a n/a n/a n/a
Palau n/a n/a n/a n/a n/a n/a n/a n/a n/a n/a
Timor-Leste 32 092 66 500 50 000 48 056 50 000 41 525 43 500 48 000 47 500 49 720
Kiribati n/a n/a n/a n/a n/a n/a n/a n/a n/a n/a
Vanuatu n/a n/a n/a n/a n/a n/a n/a n/a n/a n/a
Cassava
area harvested (ha)
1998 1999 2000 2001 2002 2003 2004 2005 2006 2007
PNG 10 500 11 000 11 000 12 000 12 000 12 000 12 000 12 500 12 500 12 500
Samoa 20 24 24 24 24 24 24 24 25 30
Solomon Islands 125 130 140 140 150 150 150 150 150 150
Fiji 1 983 2 000 2 400 2 400 3 000 3 300 3 600 3 600 2 400 2 500
Cook Islands 170 170 170 60 50 50 50 50 50 60
Tonga 1 500 1 215 700 700 700 700 700 700 750 770

76
Coconut
Production (tonnes)
1998 1999 2000 2001 2002 2003 2004 2005 2006 2007
PNG 858 000 1 020 000 1 032 000 553 000 680 000 631 000 651 000 651 000 660 000 677 000
Samoa 154 000 130 000 140 000 140 000 140 000 140 000 140 000 140 000 145 000 146 000
Solomon Islands 307 000 269 000 246 000 208 000 200 000 192 000 240 000 276 000 276 000 276 000
Fiji 209 340 170 600 170 600 170 000 170 000 130 000 140 000 187 500 140 000 140 000
Cook Islands 5 000 5 000 5 000 5 000 5 000 2 200 1 800 1 850 1 850 2 000
Tonga 56 000 57 683 57 685 58 000 58 000 58 000 58 000 58 000 58 300 58 500
Tuvalu 1 500 1 500 1 500 1 500 1 500 1 500 1 600 1 600 1 600 1 700
FSM 40 000 40 000 40 000 40 000 40 000 40 000 40 000 40 000 40 000 41 000
RMI 23 500 18 500 4 640 4 080 14 240 32 960 20 400 20 400 20 400 20 400
Nauru 1 600 1 600 1 600 1 600 1 600 1 600 1 600 1 600 1 600 1 800
Palau n/a n/a n/a n/a n/a n/a n/a n/a n/a n/a
Timor-Leste 10 000 12 000 13 000 14 000 14 000 14 000 14 000 14 000 14 000 14 000
Kiribati 106 250 106 250 96 000 96 000 96 000 96 000 129 000 129 000 105 000 110 000
Vanuatu 389 000 280 000 248 000 273 000 229 700 231 100 313 000 315 000 320 000 322 000
Tuvalu n/a n/a n/a n/a n/a n/a n/a n/a n/a n/a
FSM 1 100 1 100 1 100 1 100 1 100 1 100 1 100 1 100 1 100 1 200
RMI n/a n/a n/a n/a n/a n/a n/a n/a n/a n/a
Nauru n/a n/a n/a n/a n/a n/a n/a n/a n/a n/a
Palau n/a n/a n/a n/a n/a n/a n/a n/a n/a n/a
Timor-Leste 7 996 10 319 10 500 12 000 14 000 10 000 15 000 16 000 11 500 12 000
Kiribati n/a n/a n/a n/a n/a n/a n/a n/a n/a n/a
Vanuatu n/a n/a n/a n/a n/a n/a n/a n/a n/a n/a

77
Coconut
area harvested (ha)
1998 1999 2000 2001 2002 2003 2004 2005 2006 2007
PNG 260 000 260 000 260 000 195 000 197 000 198 000 180 000 195 000 198 000 203 000
Samoa 25 000 21 500 21 500 21 500 21 500 21 500 21 500 21 500 21 600 21 700
Solomon Islands 37 000 37 000 37 000 37 000 37 000 37 000 37 000 37 000 37 000 37 000
Fiji 64 953 53 720 53 720 65 114 65 114 60 000 61 200 60 000 50 000 50 000
Cook Islands 2 200 2 200 2 200 2 200 1 500 750 700 720 720 730
Tonga 7 000 8 100 8 100 8 100 8 100 8 100 8 100 8 100 8 200 8 300
Tuvalu 1 800 1 500 1 800 1 500 1 500 1 500 1 600 1 600 1 600 1 700
FSM 16 500 16 500 16 500 16 500 16 500 16 500 16 500 16 500 16 500 16 600
RMI 10 000 8 000 8 000 8 000 8 000 8 000 8 000 8 000 8 000 8 000
Nauru 320 320 320 320 320 320 320 320 320 350
Palau n/a n/a n/a n/a n/a n/a n/a n/a n/a n/a
Timor-Leste n/a n/a n/a n/a n/a n/a n/a n/a n/a n/a
Kiribati 26 000 26 000 25 000 25 000 25 000 25 000 27 000 27 000 28 000 29 000
Vanuatu 73 000 73 000 73 000 74 000 74 000 74 000 74 000 74 000 75 000 76 000
Taro
Production (tonnes)
1998 1999 2000 2001 2002 2003 2004 2005 2006 2007
PNG 200 000 220 000 220 000 230 000 250 000 255 000 256 000 260 000 260 000 260 000
Samoa 12 000 15 000 15 000 15 000 17 000 17 000 17 000 17 000 17 500 17 600
Solomon Islands 31 000 30 000 34 000 36 000 38 000 40 000 40 000 44 000 40 000 40 000

78
Fiji 25 625 20 189 35 828 30 558 36 796 39 083 65 545 83 751 38 000 38 000
Cook Islands n/a n/a n/a n/a n/a n/a n/a n/a n/a n/a
Tonga 5 000 3 240 3 720 3 700 3 700 3 700 3 700 3 700 3 750 3 800
Tuvalu n/a n/a n/a n/a n/a n/a n/a n/a n/a n/a
FSM n/a n/a n/a n/a n/a n/a n/a n/a n/a n/a
RMI n/a n/a n/a n/a n/a n/a n/a n/a n/a n/a
Nauru n/a n/a n/a n/a n/a n/a n/a n/a n/a n/a
Palau n/a n/a n/a n/a n/a n/a n/a n/a n/a n/a
Timor-Leste n/a n/a n/a n/a n/a n/a n/a n/a n/a n/a
Kiribati 1 600 1 600 1 600 1 700 1 800 1 900 2 000 2 000 2 150 2 200
Vanuatu n/a n/a n/a n/a n/a n/a n/a n/a n/a n/a
Taro
area harvested (ha)
1998 1999 2000 2001 2002 2003 2004 2005 2006 2007
PNG 32 000 34 000 35 000 36 000 38 000 39 000 39 000 40 000 40 000 40 000
Samoa 3 500 4 253 3 000 3 000 3 500 3 500 3 500 3 500 3 550 3 600
Solomon Islands 1 600 1 500 1 700 1 800 1 900 2 000 2 000 2 200 2 000 2 000
Fiji 3 066 1 359 3 192 3 100 3 200 3 200 3 200 3 200 3 200 3 200
Cook Islands n/a n/a n/a n/a n/a n/a n/a n/a n/a n/a
Tonga 550 472 500 400 400 400 400 400 420 450
Tuvalu n/a n/a n/a n/a n/a n/a n/a n/a n/a n/a
FSM n/a n/a n/a n/a n/a n/a n/a n/a n/a n/a
RMI n/a n/a n/a n/a n/a n/a n/a n/a n/a n/a
Nauru n/a n/a n/a n/a n/a n/a n/a n/a n/a n/a
Palau n/a n/a n/a n/a n/a n/a n/a n/a n/a n/a

79
Timor-Leste n/a n/a n/a n/a n/a n/a n/a n/a n/a n/a
Kiribati 380 380 380 400 400 420 430 430 440 450
Vanuatu n/a n/a n/a n/a n/a n/a n/a n/a n/a n/a
Sweet potato
Production (tonnes)
1998 1999 2000 2001 2002 2003 2004 2005 2006 2007
PNG 460 000 480 000 480 000 490 000 490 000 500 000 520 000 520 000 520 000 520 000
Samoa
Solomon Islands 73 000 74 000 76 000 80 000 82 000 86 000 86 000 88 000 86 000 86 000
Fiji 7 370 5 224 6 495 5 413 7 221 7 292 3 032 4 555 6 000 6 000
Cook Islands 1 400 1 400 1 400 850 850 550 550 550 550 700
Tonga 6 000 3 080 8 000 5 500 6 000 6 000 6 000 6 000 6 750 6 800
Tuvalu n/a n/a n/a n/a n/a n/a n/a n/a n/a n/a
FSM 3 000 3 000 3 000 3 000 3 000 3 000 3 000 3 000 3 000 3 200
RMI n/a n/a n/a n/a n/a n/a n/a n/a n/a n/a
Nauru n/a n/a n/a n/a n/a n/a n/a n/a n/a n/a
Palau n/a n/a n/a n/a n/a n/a n/a n/a n/a n/a
Timor-Leste 11 989 14 000 20 000 24 705 26 000 26 000 26 000 26 000 26 000 26 000
Kiribati n/a n/a n/a n/a n/a n/a n/a n/a n/a n/a
Vanuatu n/a n/a n/a n/a n/a n/a n/a n/a n/a n/a
Sweet potato
area harvested (ha)
1998 1999 2000 2001 2002 2003 2004 2005 2006 2007

80
PNG 100 000 102 000 102 000 102 000 103 000 103 000 104 000 104 000 104 000 104 000
Samoa
Solomon Islands 5 000 5 200 5 300 5 500 5 700 6 000 6 000 6 200 6 000 6 000
Fiji 727 477 736 700 760 800 700 700 750 750
Cook Islands 50 50 50 30 30 20 20 20 20 25
Tonga 500 249 648 450 500 500 500 500 550 600
Tuvalu n/a n/a n/a n/a n/a n/a n/a n/a n/a n/a
FSM 510 510 510 510 510 510 510 510 510 550
RMI n/a n/a n/a n/a n/a n/a n/a n/a n/a n/a
Nauru n/a n/a n/a n/a n/a n/a n/a n/a n/a n/a
Palau n/a n/a n/a n/a n/a n/a n/a n/a n/a n/a
Timor-Leste 3 052 3 500 5 000 6 000 7 000 7 000 7 000 7 000 7 000 7 000
Kiribati n/a n/a n/a n/a n/a n/a n/a n/a n/a n/a
Vanuatu n/a n/a n/a n/a n/a n/a n/a n/a n/a n/a
Rice
Production (tonnes)
1998 1999 2000 2001 2002 2003 2004 2005 2006 2007
PNG 600 650 700 800 800 800 800 800 800 800
Samoa n/a n/a n/a n/a n/a n/a n/a n/a n/a n/a
Solomon Islands 1 300 4 500 4 800 5 200 5 000 5 000 5 500 5 500 5 500 5 700
Fiji 5 092 17 301 13 170 14 612 12 852 15 504 14 358 15 189 12 732 15 000
Cook Islands n/a n/a n/a n/a n/a n/a n/a n/a n/a n/a
Tonga n/a n/a n/a n/a n/a n/a n/a n/a n/a n/a
Tuvalu n/a n/a n/a n/a n/a n/a n/a n/a n/a n/a

81
FSM 90 90 90 90 90 90 90 90 90 100
RMI n/a n/a n/a n/a n/a n/a n/a n/a n/a n/a
Nauru n/a n/a n/a n/a n/a n/a n/a n/a n/a n/a
Palau n/a n/a n/a n/a n/a n/a n/a n/a n/a n/a
Timor-Leste 36 848 33 585 51 000 53 845 53 656 65 433 61 500 60 000 65 000 41 386
Kiribati n/a n/a n/a n/a n/a n/a n/a n/a n/a n/a
Vanuatu n/a n/a n/a n/a n/a n/a n/a n/a n/a n/a
Rice
area harvested (ha)
1998 1999 2000 2001 2002 2003 2004 2005 2006 2007
PNG 350 350 350 400 400 400 400 400 400 400
Samoa n/a n/a n/a n/a n/a n/a n/a n/a n/a n/a
Solomon Islands 330 1 126 1 200 1 300 1 300 1 300 1 400 1 400 1 400 1 450

82
Fiji 8 000 6 261 5 273 6 000 6 000 6 500 6 500 6 500 5 500 5 600
Cook Islands n/a n/a n/a n/a n/a n/a n/a n/a n/a n/a
Tonga n/a n/a n/a n/a n/a n/a n/a n/a n/a n/a
Tuvalu n/a n/a n/a n/a n/a n/a n/a n/a n/a n/a
FSM 80 80 80 80 80 80 80 80 80 90
RMI n/a n/a n/a n/a n/a n/a n/a n/a n/a n/a
Nauru n/a n/a n/a n/a n/a n/a n/a n/a n/a n/a
Palau n/a n/a n/a n/a n/a n/a n/a n/a n/a n/a
Timor-Leste 13 826 12 679 17 000 35 000 35 000 43 550 43 000 43 000 45 000 31 650
Kiribati n/a n/a n/a n/a n/a n/a n/a n/a n/a n/a
Vanuatu n/a n/a n/a n/a n/a n/a n/a n/a n/a n/a
FOOD IMPORTS BY VOLUME KG
FIJI 2000 2001 2002 2003 2004 2005 2006 2007
Chicken and fowls 1 995 043 2 497 361 686 619 642 338 1 950 078 3 058 539 1 948 123 1 081 797
Wheat 103 891 680 210 358 448 106 795 050 57 623 830 87 479 754 114 115 044 37 409 921 78 588 800
Rice 38 619 952 28 522 136 27 495 913 33 955 943 36 106 386 101 405 055 25 739 578 32 757 624
Flour 6 206 757 4 428 776 4 464 363 5 099 283 3 758 719 3 323 841 912 410 896 494
Canned beef 33 613 26 834 12 755 45 291 11 940 30 838 48 434 51 292
Processed fish 807 645 1 042 020 2 101 235 5 986 184 5 798 879 6 464 266 4 295 233 5 759 068
SAMOA KG
2000 2001 2002 2003 2004 2005 2006 2007
Chicken and fowls N/A N/A 1 943 825 6 201 894 3 632 338 5 462 583 5 221 849 4 899 266

83
Wheat N/A N/A 10 1 488 2 485 N/A 714 N/A
Rice N/A N/A 1 132 180 1 689 550 910 192 1 465 840 1 454 130 3 369 838
Flour N/A N/A # # # # # #
Canned beef N/A N/A 185 605 184 961 194 345 190 505 338 651 490 289
Processed fish N/A N/A 3 433 786 4 544 254 2 628 141 1 916 970 1 996 905 2 166 335
TONGA KG
2000 2001 2002 2003 2004 2005 2006 2007
Chicken and fowls N/A 184 497 449 776 597 016 478 832 151 130 342 264 653 142
Wheat N/A 210 635 1 792 107 - 33 589
Rice N/A 340 868 297 105 394 259 378 184 504 803 399 818 446 862
Flour N/A 5 086 780 5 253 191 5 713 043 5 751 427 4 858 001 4 946 279 4 877 478
Canned beef N/A 574 002 657 586 484 284 776 666 574 900 426 196 844 273
Processed fish N/A 446 661 573 317 609 862 789 332 703 398 428 809 1 047 322
SOLOMON IS. KG
2000 2001 2002 2003 2004 2005 2006 2007
Chicken and fowls N/A N/A 31 503 33 424 69 626 32 905 296 939 109 657
Wheat N/A N/A 5 246 351 5 166 340 4 979 410 6 808 062 10 134 286 13 989 257
Rice N/A N/A 16 017 566 29 733 367 22 442 420 31 692 376 27 246 937 35 746 112
Flour N/A N/A 133 999 628 113 2 373 166 1 140 128 1 146 396 445 023
Canned beef N/A N/A 377 569 193 716 280 962 418 947 541 640 727 991
Processed fish N/A N/A 693 002 270 344 591 527 858 675 1 727 184 2 255 141
PNG KG
2000 2001 2002 2003 2004 2005 2006 2007
Chicken and fowls 8 076 826 34 41 206 3 970 1 128 99 647

84
Wheat 814 000 59 742 95 398 15 551 9 153 008 23 034 967
Rice 49 463 339 67 100 901 14 939 980 40 388 100 39 631 300 25 438 570 11 545 625
Flour 290 258 382 883 626 782 493 751 430 249 ? ?
Canned beef 1 397 2 073 158 2 936 1 2 564 943 44 872
Processed fish 323 110 1 047 036 1 191 854 2 508 367 2 824 241 5 060 871 2 235 318
TUVALU KG
2000 2001 2002 2003 2004 2005 2006 *2007
Chicken and fowls 25 7 102 342 1 273
Wheat 1
Rice 173 745 559 119 217 380 611 242 581 792 1 917 606 162 446
Flour 89 935 210 710 170 155 272 430 298 630 198 181 120 102
Canned beef 20 478 80 853 46 810 57 080 80 036 19 701 7 356
Processed fish 50 325 19 027 12 588 35 737 35 590 5 216 3 921
* Imports for period of Jan–May 2007
VANUATU KG
2000 2001 2002 2003 2004 2005 2006 2007
Chicken and fowls 773 044 879 136 1 665 718 830 795 748 239 1 036 621 872 319
Wheat 20 10 2 40 22 5 3 667
Rice 11 077,703 10 738 874 21 643 332 11 813 952 11 358 948 11 746 004 10 951 411
Flour 3 773 018 3 923 714 6 994 363 4 745 016 4 607 626 5 103 407 4 799 161
Canned beef 144 487 164 764 111 419 151 366 160 137 221 558 202 534
Processed fish 923 362 979 073 2 671 056 1 218 308 1 260 920 1 363 396 1 451 160
COOK ISLANDS KG

85
2000 2001 2002 2003 2004 2005 2006 2007
Chicken and fowls 1 545 024 345 932 503 964 235 504 564 373 592,348 1,445,925
Wheat 34 17 641 125 - 3,029 287
Rice 132 896 77 718 41 021 127 153 137,725 208,306
Flour 68 804 960 240 631 38 675 3 832 592 127 287 210,594 552,972
Canned beef 196 388 68 395 87 246 56 597 235 287 132,378 83,174
Processed fish 42 129 17 769 21 223 33 386 59 824 66 975 82 686
KIRIBATI KG
2000 2001 2002 2003 2004 2005 2006 2007
Chicken and fowls 1 346 773
Wheat
Rice 9 091 255
Flour 4 147 700
Canned beef
Processed fish 592 915

86
ANNUAL KG PER CAPITA RICE IMPORTS
2002 2007
Fiji 34.26 39.39
Samoa 6.41 18.78
Tonga 2.90 4.04
Solomon Is. 34.36 70.94
PNG 12.10 1.82
Tuvalu 18.17 39.99
Vanuatu 53.20 48.21
Cook Is. 5.27 15.40
RICE IMPORTS IN KG
2000 2001 2002 2003 2004 2005 2006 2007
Fiji 38 619 952 28 522 136 27 495 913 33 955 943 36 106 386 32 540 076 25 739 578 32 757 624
Samoa 1 132 180 1 689 550 910 192 1 465 840 1 454 130 3 369 838
Tonga 340 868 297 105 394 259 378 184 504 803 399 818 446 862
Solomon Is. 16 017 566 29 733 367 22 442 420 31 692 376 27 246 937 35 746 112
PNG 49 463 339 67 100 901 14 939 980 40 388 100 39 631 300 25 438 570 11 545 625
Tuvalu 173 745 559 119 217 380 611 242 581 792 1 917 606 387 980
Vanuatu 11 077 703 10 738 874 21 643 332 11 813 952 11 358 948 11 746 004 10 951 411
Cook Is. 132 896 77 718 - 41 021 127 153 137 725 208 306
PROCESSED FISH IMPORTS IN KG
2000 2001 2002 2003 2004 2005 2006 2007
Fiji 807 645 1 042 020 2 101 235 5 986 184 5 798 879 6 464 266 4 295 233 5 759 068
Samoa 3 433 786 4 544 254 2 628 141 1 916 970 1 996 905 2 166 335
Tonga 446 661 573 317 609 862 789 332 703 398 428 809 1 047 322
Solomon Is. 693 002 270 344 591 527 858 675 1 727 184 2 255 141

87
PNG 323 110 1 047 036 1 191 854 2 508 367 2 824 241 5 060 871 2 235 318
Tuvalu 50 325 19 027 12 588 35 737 35 590 5 216 9 410
Vanuatu 923 362 979 073 2 671 056 1 218 308 1 260 920 1 363 396 1 451 160
Cook Is. 42 129 17 769 21 223 33 836 59 824 66 975 82 686
FOOD IMPORTS BY VALUE
FIJI FJ$ US$ FJ$ US$ FJ$ US$ FJ$ US$ FJ$ US$ FJ$ US$ FJ$ US$ FJ$ US$
2000 2001 2002 2003 2004 2005 2006 2007
Chicken
& fowls 359
544
170
154
6 342
856
2 800
561
2 267
481
1 036
692 1 574 812 835 926 536 398 309 625 7 379 623 4 377 961 4 499 292 2 615 123 3 096 072 1 935 695
Wheat
38
855
839
18
388
526
36
433
651
16
086
550
46
072
579
21
064
383 45 681 553 24 248 225
46 440
077
26 806
606 46 978 939 57 595 017 33 475 952 68 225 152 42 655 047
Rice
16
174
602
7
654
630
19
231
446
8 491
260
18
669
225
8 535
570 18 986 435 10 078 190
22 338
420
12 894
406 21 943 563 13 023 944 24 210 908 14 072 106 24 553 296 15 350 966
Flour 3 423
453
1
620
149
2 677
463
1 182
180
2 778
482
1 270
322 2 477 072 1 314 855
2 319
213
1 338
719 2 312 611 1 015 965 590 509 1 057 039 660 871
Canned beef 206
482
97
718
133
570
58
975
110
411
50
480 178 719 94 866 66 774 38 544 210 449 313 422 182 170 310 629 194,208
Processed fish 2 490
735
1
178
740
2 794
874
1 234
021
5 210
062
2 382
040 11 092 288 5 887 897
13 589
387
7 844
202 15 427 824 9 156 722 20 303 164 11 800 808 16 768 488 10 483 826
SAMOA ST US$ ST US$ ST US$ ST US$ ST US$ ST US$ ST US$ ST US$
2000 2001 2002 2003 2004 2005 2006 2007
Chicken
& fowls N/A N/A
5 473
923
1 606
815 14 570 255 4 832 516
13 339
587
4 785
844 18 226 996 6 953 964 13 102 493 4 998 863 19 914 023 7 536 263
Wheat N/A N/A 117 34 1 820 604 610 219 0 0 3 062 1 168 0 0
Rice N/A
US$1
287
000
6 380
144
1 872
827 6 632 205 2 199 703
8 750
991
3 139
593 8 097 321 3 089 290 8 806 489 3 359 852 9 072 132 3 433 258
Flour N/A N/A
5 589
576
1 640
764 7 448 240 2 470 358
2 076
356 744 934 6 625 805 2 527 877 6 978 471 2 662 426 9 695 564 3 669 189
Canned beef N/A N/A
1 569
106
460
595 1 664 001 551 899
1 604
390 575 607 1 802 665 687 753 4 019 819 1 533 641 4 158 801 1 573 857
Processed fish N/A N/A
10
544
898
3 095
349 12 047 229 3 995 704
10 540
434
3 781
592 10 603 655 4 045 506 14 582 299 5 563 439 13 896 064 5 258 826
TONGA TP US$ TP US$ TP US$ TP US$ TP US$ TP US$ TP US$ TP US$
2000 2001 2002 2003 2004 2005 2006 2007

88
451 844
259
625
1 305
833
616
066
1 404
968
645
119
1 479
371 692 124
1 094
319 552 544 415 391 214 525 801 132 392 691 1 591 750 779 958
325 187 888 419 620 285 4 314 2 018 81 41 0 0 120 59 1 179 578
328 003
188
467
384
652
181
471
622
276
285
730
671
183 314 013 474 925 239 799 640 012 330 528 439 076 215 222 572 075 280 317
2 785
982
1,600
797
3 056
941
1 442
204
3 961
611
1 819
053
4 622
185 2 162 489
4 335
716
2 189
190 3 488 685 1 801 696 4 006 483 1 963 858 4 622 735 2 265 140
2 428
522
1 395
404
3 522
020
1 661
619
3 248
635
1 491
676
2 367
326 1 107 553
2 752
084
1 389
582 3 908 791 2 018 656 2 506 181 1 228 455 4 898 981 2 400 501
1 011
209
581
031
1 244
603
587
179
1 757
045
806
782
1 880
667 879 870
1 864
286 941 315 2 324 687 1 200 561 1 345 676 659 610 3 078 621 1 508 524
SB$ US$ SB US$ SB US$ SB US$ SB US$ SB US$ SB US$ SB US$
2000 2001 2002 2003 2004 2005 2006 2007
N/A N/A
263
070
52
283
581
899 79 109 719 605 105 249 914 912 125 325 2 855 825 408 554 2 055 952 295 029
N/A N/A
10
850
732
2 156
474
8 784
527 1 194 256
8 720
864
1 275
514 16 299 410 2 232 693 23 922 399 3 422 338 29 109 678 4 177 239
N/A N/A
50
953
854
10
126
569
73
594
187 10 005 130
78 710
641
11 512
218 133 701 604 18 314 446
150 831
675 21 577 979 167 962 480 24 102 616
N/A N/A
255
576
50
793
1 524
803 207 297
6 989
395
1 022
269 4 065 909 556 948 3 738 551 534 837 1 195 135 171 502
N/A N/A
6 710
850
1 333
714
5 429
516 738 143
7 071
092
1 034
218 7 665 127 1 049 969 10 470 563 1 497 919 13 911 826 1 996 347
N/A N/A
6 652
075
1 322
033
2 708
241 368 185
4 788
573 700 377 10 072 053 1 379 670 18 967 474 2 713 487 29 592 634 4 246 543
PGK US$ PGK US$ PGK US$ PGK US$ PGK US$ PGK US$ PGK US$ PGK US$
2000 2001 2002 2003 2004 2005 2006 2007
74
819
22
684 4 254 1 115 665 192 128 097 39 902 41 204 13 601 148 758 51 975 2 373 019 843 181
37
050
050
11
232
834
45
035
613
11
802
033
42
885
352 12 368 564
39 805
815
12 399
511 12 328 296 4 069 324 33 854 347 11 828 370 81 930 806 29 111 654
130 023
685
47
748
598
174
722
761
52
972
447
219
454
463
57
510
237
244
846
259 70 616 110
322 989
660
100 611
279 1 607 814 530 707
104 440
591 36 490 498 437 208 861 155 349 053
522
982
158
558
540
212
141
568
1 109
292 319 931
1 106
390 344 640 925 283 305 417 0 0
16
520 5 009
21
915 5 743 1 707 492 187 682 58 463 80 26 524 541 183 269 351 527 124 905
1 800
240
545
797
5 708
257
1 495
905
6 683
140 1 927 484
15 474
502
4 820
307 3 899 120 1 287 022 19 326 915 6 752 631 30 631 409 10 883 952
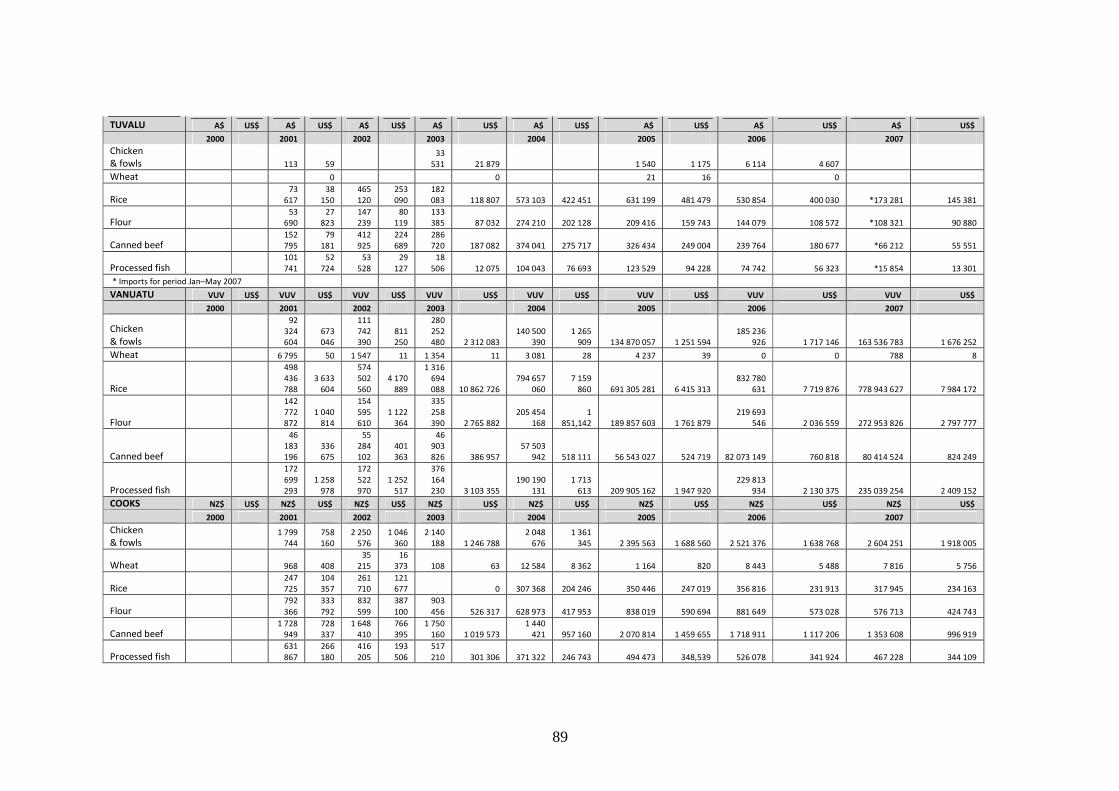
89
TUVALU A$ US$ A$ US$ A$ US$ A$ US$ A$ US$ A$ US$ A$ US$ A$ US$
2000 2001 2002 2003 2004 2005 2006 2007
Chicken
& fowls 113 59
33
531 21 879 1 540 1 175 6 114 4 607
Wheat 0 0 21 16 0
Rice
73
617
38
150
465
120
253
090
182
083 118 807 573 103 422 451 631 199 481 479 530 854 400 030 *173 281 145 381
Flour
53
690
27
823
147
239
80
119
133
385 87 032 274 210 202 128 209 416 159 743 144 079 108 572 *108 321 90 880
Canned beef
152
795
79
181
412
925
224
689
286
720 187 082 374 041 275 717 326 434 249 004 239 764 180 677 *66 212 55 551
Processed fish
101
741
52
724
53
528
29
127
18
506 12 075 104 043 76 693 123 529 94 228 74 742 56 323 *15 854 13 301
* Imports for period Jan–May 2007
VANUATU VUV US$ VUV US$ VUV US$ VUV US$ VUV US$ VUV US$ VUV US$ VUV US$
2000 2001 2002 2003 2004 2005 2006 2007
Chicken
& fowls
92
324
604
673
046
111
742
390
811
250
280
252
480 2 312 083
140 500
390
1 265
909 134 870 057 1 251 594
185 236
926 1 717 146 163 536 783 1 676 252
Wheat 6 795 50 1 547 11 1 354 11 3 081 28 4 237 39 0 0 788 8
Rice
498
436
788
3 633
604
574
502
560
4 170
889
1 316
694
088 10 862 726
794 657
060
7 159
860 691 305 281 6 415 313
832 780
631 7 719 876 778 943 627 7 984 172
Flour
142
772
872
1 040
814
154
595
610
1 122
364
335
258
390 2 765 882
205 454
168
1
851,142 189 857 603 1 761 879
219 693
546 2 036 559 272 953 826 2 797 777
Canned beef
46
183
196
336
675
55
284
102
401
363
46
903
826 386 957
57 503
942 518 111 56 543 027 524 719 82 073 149 760 818 80 414 524 824 249
Processed fish
172
699
293
1 258
978
172
522
970
1 252
517
376
164
230 3 103 355
190 190
131
1 713
613 209 905 162 1 947 920
229 813
934 2 130 375 235 039 254 2 409 152
COOKS NZ$ US$ NZ$ US$ NZ$ US$ NZ$ US$ NZ$ US$ NZ$ US$ NZ$ US$ NZ$ US$
2000 2001 2002 2003 2004 2005 2006 2007
Chicken
& fowls
1 799
744
758
160
2 250
576
1 046
360
2 140
188 1 246 788
2 048
676
1 361
345 2 395 563 1 688 560 2 521 376 1 638 768 2 604 251 1 918 005
Wheat 968 408
35
215
16
373 108 63 12 584 8 362 1 164 820 8 443 5 488 7 816 5 756
Rice
247
725
104
357
261
710
121
677 0 307 368 204 246 350 446 247 019 356 816 231 913 317 945 234 163
Flour
792
366
333
792
832
599
387
100
903
456 526 317 628 973 417 953 838 019 590 694 881 649 573 028 576 713 424 743
Canned beef
1 728
949
728
337
1 648
410
766
395
1 750
160 1 019 573
1 440
421 957 160 2 070 814 1 459 655 1 718 911 1 117 206 1 353 608 996 919
Processed fish
631
867
266
180
416
205
193
506
517
210 301 306 371 322 246 743 494 473 348,539 526 078 341 924 467 228 344 109

90
KIRIBATI A$ US$
2000 2001 2002 2003 2004 2005 2006 2007
Chicken
& fowls 1 874 077 1 429 546
Wheat 0
Rice 10 319 716 7 871 879
Flour 1 806 358 1 377 890
Canned beef 3 040 032 2 318 936
Processed fish 824 717 629 094

91
Appendix 4. List of participants Pacific Energy Ministers Meeting (PEMM 2009) and the Regional Energy
Officials Meeting (REM 2009) in Nuku’alofa Tonga
20 to 24 April 2009
Member Countries
AUSTRALIA (**Representing the Minister) Mr Brendan Morling Head of Energy and Environment Division, Department of Resource, Energy and Tourism GPO Box 1564 Canberra ACT 2601 AUSTRALIA Tel: (612) 6213 7300 Fax: (612) 6090 8833 E-mail: [email protected] Mr John Russell Assistant Director Renewable Energy Policy & Partnerships Section Department of the Environment, Water, Heritage and the Arts GPO Box 787 Canberra ACT 2601 AUSTRALIA Tel: (612) 6274 1139 Fax: (612) 6274 1390 E-mail: [email protected] COOK ISLANDS Honourable Tangata Vavia Minister of Energy PO Box 3030 Rarotonga COOK ISLANDS Tel: (682) 29419 Fax: E-mail: [email protected] FEDERATED STATES OF MICRONESIA Secretary Peter Christian Secretary for Department of Resources & Development PO Box Ps - 12 Palikir Pohnpei FM 96941 Tel: (691) 320 2646 Fax: (691) 320 5848/2079 E-mail: [email protected] KIRIBATI Mr Kireua B Kaiea
Mr Mata Nooroa Director of Energy Energy Division PO Box 129 Rarotonga COOK ISLANDS Tel: (682) 24484 Fax: (682) 24483 E-mail: [email protected] [email protected] FIJI Honourable Timoci Natuva Minister for Works, Transport and Public Utilities Ministry for Works, Transport and Public Utilities PMB Samabula FIJI ISLANDS Tel: (679) 338 9613 Fax: (679) 338 6301 E-mail: [email protected] Mr Peceli Nakavulevu Principal Energy Analyst Department of Energy G.P.O. Box 2493 Government Buildings Suva FIJI ISLANDS Tel: (679) 3386006 Fax: (679) 3386301 E-mail: [email protected] Nauru Ms Apisake Soakai CEO – Nauru Utilities C/- Nauru Utilities Aiwo District REPUBLIC OF NAURU Tel: (674) 444 3247 Fax: (674) 444 3521 E-mail: [email protected] NEW ZEALAND Honourable Gerry Brownlee Minister of Energy and Natural Resources Parliament Buildings Wellington New Zealand Tel: (644) 471 9999

92
Energy Planner Ministry of Works & Energy P O Box 498 Betio Tarawa REPUBLIC OF KIRIBATI Tel: (686) 25 046 Fax: (686) 20 172 E-mail: [email protected] [email protected] NAURU Honourable Frederick Pitcher Minister of Commerce, Industry & Environment Ministry for Commerce, Industry & Environment Government Ministries Yaren District REPUBLIC OF NAURU Tel: (674) 444 3133 ext. 212 Fax: (674) 444 3199 E-mail: [email protected] Mr Russ J Kun Secretary for Ministry Commerce, Industry & Environment Government Ministries Yaren District REPUBLIC OF NAURU Tel: (674) 444 3133 xtn 212 Fax: (674) 444 3199 E-mail: [email protected] NIUE Honourable Togia Sioneholo Minister for Bulk Fuels Fale Fono Government of Niue Alofi NIUE Tel: (683) 4200 Fax: (683) 4206 E-mail: [email protected] Ms Josie Tamate Policy Advisor Premiers Department Ministry for Bulk Fuels Government of Niue Alofi NIUE Tel: (683) 4364 Fax: (683) 4206 E-mail: [email protected]
Fax: (644) 471 2551 Email: [email protected] Dr Peter Crabtree Director Energy and Communications Branch Ministry of Economic Development PO Box 1473 Wellington NEW ZEALAND Tel: (644) 76 2618 Fax: (644) 499 0969 E-mail: [email protected] Mr Mark Ramsden Deputy Director Pacific Group NZAID Private Bag 18901 Wellington New Zealand Tel: (644) 439 8000 Fax: (644) 439 8813 E-mail: [email protected] PAPUA NEW GUINEA Mr Vore Veve Acting Deputy Secretary Department of Petroleum and Energy PO Box 494 Waigani, NCD PAPUA NEW GUINEA Tel: (675) 325 3233 Fax: (675) 325 1678 E-mail: [email protected] Mr Idau Kopi A/Assistant Director Energy Division PO Box 494 Waigani, NCD PAPUA NEW GUINEA Tel: (675) 325 3233 Fax: (675) 325 1678 E-mail: [email protected] REPUBLIC OF MARSHALL ISLANDS (**Representing the Minister) Ms Angeline Abraham National Energy Planner Ministry of Resources & Development P O Box 1727 Majuro MARSHALL ISLANDS 96900 Tel: (692) 625 3206 Fax: (692) 625 7471 E-mail: [email protected]

93
PALAU Honourable Jackson R. Ngiraingas Minister of Public Infrastructure, Industry and Commerce Ministry for Public Infrastructure, Industry & Commerce PO Box 1471 Koror PALAU 96940 Tel: (680) 767 2111/ 4343 Fax: (680) 767 3207 E-mail: [email protected] Mr Charles Uong Special Assistant to the Minister Ministry for Public Infrastructure, Industry and Commerce PO Box 1471 Koror Palau 96940 Tel: (680) 767 2111 / 4343 Fax: (680) 767 3207 E-mail: [email protected] [email protected] Mr Nick Wardrop Energy Adviser Ministry of Resources & Development P O Box 1727 Majuro MARSHALL ISLANDS 96900 Tel: (692) 625 3206 61 7 418254275 Fax: (692) 625 7471 E-mail: [email protected] Ms Yuen Kayo Yamaguchi – Kotton Ministry of Finance Senior EU Desk Officer PO Box D Majuro MARSHALL ISLANDS 96900 Tel: (692) 625 8835 Fax: (692) 625 3607 E-mail: [email protected] SAMOA Honourable Niko Lee Hang Minister of Finance Ministry of Finance Private Mail Bag Government of Samoa Apia SAMOA (WESTERN) Tel: (685) 25210 Fax: (685) 25357 E-mail: [email protected] Ms Hinauri Petana CEO Ministry for Finance Private Mail Bag Government of Samoa
Mr Thomas Kijiner Jnr Permanent Secretary Ministry of Resources and Development P O Box 1727 MAJURO MARSHALL ISLANDS 96900 Tel: (692) 625 3206 Fax: (692) 625 7471 E-mail: [email protected] SOLOMON ISLANDS Honourable Edward Huniehu Minister of Mines, Energy and Rural Electrification Ministry of Mines, Energy and Rural Electrification PO Box G37 Honiara SOLOMON ISLANDS Tel: (677) 21521 Fax: (677) 25811 E-mail: [email protected] Mr John Korinihona Director of Energy Ministry of Mines, Energy and Rural Electrification P O Box G37 Honiara SOLOMON ISLANDS Tel: (677) 21 522 Fax: (677) 25 811 E-mail: [email protected] Mr Tione Bugotu Permanent Secretary Ministry of Mines, Energy and Rural Electrification PO Box G37 Honiara SOLOMON ISLANDS Tel: (677) 21 522 Fax: (677) 25 811 E-mail: [email protected] Mr Toswell Kaua Ministry of Mines, Energy and Rural Electrification PO Box G37Honiara SOLOMON ISLANDS Tel: (677) 21 522 / 21 525 Fax: (677) 25 811 E-mail: [email protected] Ms Emeline Veikoso Energy Planner, EPU Ministry of Lands, Surveys & Natural Resources P O Box 5 Nuku’alofa KINGDOM of TONGA Tel: (676) 23 611 Fax: (676) 23 216 E-mail: [email protected] [email protected] TUVALU Honourable Kausea Natano Minister of Public Utilities and Industries Ministry for Public Utilities and Industries

94
Apia SAMOA (WESTERN) Tel: (685) 34332 Fax: (685) 21312 E-mail: [email protected] TONGA Lord Tuita Ministry of Lands, Surveys & Natural Resources P O Box 5 Nuku’alofa KINGDOM of TONGA Tel: (676) 20615 Fax: (676) 23 216 E-mail: Hon Lisiate Akolo Ministry for Labour, Commerce & Industries P O Box 5 Nuku’alofa KINGDOM of TONGA Tel: (676) 20615 Fax: (676) 23 216 E-mail: Mr Sean Torbit Deputy Head of Mission NZ High Commission to Tonga Nuku'alofa Tonga (NZ) Tel: (676) 23 122 Fax: E-mail: [email protected] Dr Sione Nailasikau Halatuituia Secretary for Lands, Surveys & Natural Resources Ministry of Lands, Surveys & Natural Resources P O Box 5 Nuku’alofa KINGDOM of TONGA Tel: (676) 23 611 Fax: (676) 23 216 E-mail: [email protected] Mr Asipeli Palaki Deputy CEO Ministry of Lands, Surveys & Natural Resources P O Box 5 Nuku’alofa KINGDOM of TONGA Tel: (676) 23 611 Fax: (676) 23 216 E-mail: [email protected] VANUATU Honourable Raphael Worwor Minister for Lands, Geology, Mines, Water Resources, Energy & Environment PMB 9007 Port Vila
Private Mail Bag Vaiaku Funafuti Tel: (688) 20615 Fax: (688) 20207 E-mail: [email protected] Mr Paulson Panapa Secretary - Public Utilities and Industries Ministry for Public Utilities and Industries Private Mail Bag Funafuti TUVALU Tel: (688) 20 060 Fax: (688) 20 207 E-mail: [email protected] Mr Nielu Meisake Assistant Energy Planner Ministry for Public Utilities and Industries Private Mail Bag Funafuti TUVALU Tel: (688) 20 056 Fax: (688) 20 207 E-mail: [email protected] [email protected] AusAID Mr Brian Dawson Climate Change and Energy Advisor AusAID GPO Box 887 Canberra ACT 2601 AUSTRALIA Tel: (612) 6206 4819 Fax: (612) 6206 4720 E-mail: [email protected] Mr Paul Wright Program Manager Infrastructure Pacific Branch AusAID GPO Box 887 Canberra ACT 2601 AUSTRALIA Tel: (612) 6206 4346 Fax: (612) 6206 4720 E-mail: [email protected] Asian Development Bank Mr Anthony Maxwell Energy Speclialist Asian Development Bank 6 ADB Avenue Mandaluyong City 1550 Metro Manila PHILIPPINES Tel: (632) 632-6391 Fax: (632) 636 2446 E-mail: [email protected]

95
VANUATU Tel: (678) 23105 Fax: Mr Moli Janjea Senior Energy Officer Energy Unit Private Mail Bag 9067 Rue Winston Churchill Port Vila VANUATU Tel: [678] 25201 Fax: [678] 23586 E-mail: [email protected] DEVELOPING PARTNERS ARGO ENVIRONNMENT LTD Mr Luke Gowing Director Argo Environment Ltd PO Box 105774 Auckland 1143 NEW ZEALAND Tel: 64 9 376 0631 Fax: 64 21 323310 E-mail: [email protected] Mr Garry Venus Director Argo Environment Ltd PO Box 105774 Auckland 1143 NEW ZEALAND Tel: 64 9 376 0631 Fax: 64 21 741410 E-mail: [email protected] Ms Allison Woodruff Young Professional (Economics) Asian Developmet Bank 6 ADB Avenue Mandaluyong City 1550 Metro Manila PHILIPPINES Tel: (632) 632-6207 Fax: (632) 636 2444 E-mail: [email protected] Technical Centre for Agricultural and Rural Cooperation (CTA) Dr Hansjoerg Neun Director Technical Centre for Agricultural and Rural Cooperation (CTA) Postbus 380 6700 AJ Wageningen THE NETHERLANDS Tel: 31 (0) 317467131 Fax: 31 (0) 317 460067 E-mail: [email protected]
Mr Jiwan Acharya Climate Change Specialist Energy, Transport, and Water Division Regional and Sustainable Development Department Asian Development Bank 6 ADB Avenue Mandaluyong City 1550 Metro Manila PHILIPPINES Tel: (632) 632-6207 Fax: (632) 636 2444 E-mail: [email protected] Tel: (612) 6295 1533 Fax: (612) 6239 6751 Email: [email protected] European Investment Bank Mr Nigel Hall European Investment Bank Technical Adviser Aurora Place 88 Philip Street Sydney NSW 2000 AUSTRALIA Tel: 61 282 110530 Fax: 61 282 110538 E-mail: [email protected] The Foundation for Development Mr Craig Wilson Executive Director The Foundation for Development Cooperation 137 Melbourne St South Brisbane Queensland 4101 AUSTRALIA Tel: (61 7) 3217 2924 Fax: (61 7) 3846 0342 E-mail: [email protected] International Union for the Conservation of Nature (IUCN) Ms Andrea Athanas Senior Programme Officer Energy, Ecosystems and Livelihoods Business and Biodiversity The World Conservation Union (IUCN) 28 Rue de Mauverney Gland 1196 Switzerland Tel: (41) 22 999 0213 Fax: (41) 22 999 0002 E-mail: [email protected] REEEP Mr Mark Fogarty Chair of REEEP South East Asia Pacific Suite 201, Level 2 18 Kavanagh Street Southbank VIC 3006

96
Delegation of the European Commission for the Pacific Mr Lenaic Georgelin Head of Infrastructure Delegation of the European Commission for the Pacific 4th Floor, Development Bank Centre Private Mail Bag GPO SUVA FIJI ISLANDS Tel: (679) 331 3633 Fax: (679) 330 0370 E-mail: [email protected] Embassy of Austria Mr Lukas Wolfgang Strohmayer Government of Austria Minister – Counsellor Embassy of Austria P O Box 3375 Manuka Canberra ACT 2603 AUSTRALIA Mr Taholo Kami Director IUCN Regional Office for Oceania PMB 5 Ma'afu Street Suva FIJI ISLANDS Tel: (679) 331 9084 Fax: (679) 3100 128 E-mail: [email protected] Mr Anare Matakiviti Project Manager IUCN Regional Office for Oceania PMB Suva FIJI ISLANDS Tel: (679) 331 9084 Fax: (679) 3100 128 E-mail: [email protected] Ms Salote Sauturaga IUCN PMB 5 Ma'afu Street Suva FIJI ISLANDS Tel: (679) 331 9084 Fax: (679) 3100 128 E-mail: [email protected] IT Power Mr Anthony Derrick Managing Director IT POWER LTD
AUSTRALIA Tel: (613) 9929 4100 Fax: (613) 9929 4101 Ms Eva Oberender Regional Manager – South East Asia Pacific REEEP Suite 201, Level 2 18 Kavanagh Street Southbank VIC 3006 AUSTRALIA Tel: (613) 9929 4100 Fax: (613) 9929 4101 E-mail: [email protected] [email protected] Ms Maaike Göbel Manager – South East Asia Pacific REEEP Suite 201, Level 2 18 Kavanagh Street Southbank VIC 3006 AUSTRALIA Tel: (613) 9929 4100 Fax: (613) 9929 4101 E-mail: [email protected] Ms Amy Kean Advisor REEEP Suite 201, Level 2 18 Kavanagh Street Southbank VIC 3006 AUSTRALIA Tel: (613) 9929 4100 Fax: (613) 9929 4101 E-mail: [email protected] Mr Frederic Asseline Senior Energy Specialist World Bank 1618 St, NW Washington DC 20433 Tel: 61(0) 2 9223 7777 Fax: 61 (0) 2 9223 9903 E-mail: [email protected] Mr Tendai Gregan Energy Specialist Sustainable Development Department East Asia and the Pacific Region (EASNS) World Bank Level 19, 14 Martin Place Sydney NSW 2000 AUSTRALIA Tel: 61(0) 2 9223 7777 Fax: 61 (0) 2 9223 9903 E-mail: [email protected] Mr Charles Feinstein SD Leader for Timor- Leste Papua New Guinea and the Pacific Isl. Sustainable Development Department East Asia and the Pacific Region (EASNS)

97
The Warren, Bramshill Road Rg27 0pr Hook Eversley, Hants United Kingdom Tel: 44 12 56392700 Fax: 44 12 56392700 E-mail: [email protected] Mr Mike Allen Advisor REEEP Suite 201, Level 2 18 Kavanagh Street Southbank VIC 3006 AUSTRALIA Tel: (613) 9929 4100 Fax: (613) 9929 4101 E-mail: [email protected] UNDP Mr Thomas Lynge Jensen Environment & Energy Policy Specialist UNDP Pacific Centre Private Mail Bag Suva FIJI ISLANDS Tel: (679) 330 0399 Fax: (679) 330 1976 E-mail: [email protected] UNIDO Mr Sebastian Hermann Associate Expert Renewable EnergyRenewable and Rural Energy Unit Energy and Climate Change Branch Programme Development and Technical Cooperation Division UNIDO Vienna International Centre P O Box 300 1400 Vienna AUSTRIA Tel: 43 1 26026 4817 Fax: 43 1 26026 6803 E-mail: [email protected] World Bank Ms Wendy Hughes Senior Energy Specialist Sustainable Development Department East Asia and the Pacific Region (EASNS) World Bank Level 19, 14 Martin Place Sydney NSW 2000 AUSTRALIA Tel: 61(0) 2 9223 7777 Fax: 61 (0) 2 9223 9903 E-mail: [email protected] TECHNICAL PRESENTERS FIJI
World Bank Level 19, 14 Martin Place Sydney NSW 2000 AUSTRALIA Tel: 61(0) 2 9235 6531 Fax: 61 (0) 2 9223 9903 E-mail: [email protected] Mr Marin Swales Consultant - Power Engineer Sustainable Development Department East Asia and the Pacific Region (EASNS) World Bank Level 19, 14 Martin Place Sydney NSW 2000 AUSTRALIA Tel: 61(0) 2 9223 7777 Fax: 61 (0) 2 9223 9903 E-mail: [email protected] TECHNICAL PRESENTERS FIJI Mr Peter Johnston Consultant PO Box 4206 Samabula Suva FIJI ISLANDS Tel: (679) 337 0861 Fax: E-mail: [email protected] THE FOUNDATION FOR DEVELOPMENT COOPERATION Mr Jack Whelan The Foundation for Development Cooperation 137 Melbourne Street South Brisbane Queensland 4101 AUSTRALIA Tel: (617) 3217 2924 Fax: (617) 3846 0342 E-mail: [email protected] FIJI ELECTRICITY AUTHORITY Mr Hasmukh Patel CEO Fiji Electricity Authority PMB Suva FIJI ISLANDS Tel: (679) 3224310 Fax: (679) 3311074 E-mail: [email protected] KIRIBATI SOLAR ENERGY COMPANY LIMITED Mr Terubentau Akura CEO Kiribati Solar Energy Company Limited PO Box 493

98
Mr Peter Johnston Consultant PO Box 4206 Samabula Suva FIJI ISLANDS Tel: (679) 337 0861 Fax: E-mail: [email protected] THE FOUNDATION FOR DEVELOPMENT COOPERATION Mr Jack Whelan The Foundation for Development Cooperation 137 Melbourne Street South Brisbane Queensland 4101 AUSTRALIA Tel: (617) 3217 2924 Fax: (617) 3846 0342 E-mail: [email protected] KIRIBATI SOLAR ENERGY COMPANY LIMITED Mr Terubentau Akura CEO Kiribati Solar Energy Company Limited PO Box 493 Betio Tarawa KIRIBATI Tel: (686) 2605 E-mail: [email protected] UNELCO Mr John Chaniel Board Member UNELCO PO Box 25 Port Vila VANUATU Tel: (678) 23883 Fax: (678) 25011 E-mail: [email protected] OBSERVERS Mr Lester Bemand Project Manager / Engineer Bemand Consultanting PTY LTD 28 Renown Ave Oatley NSW 2223 AUSTRALIA Tel: 61 2 95807948 Fax: 61 2 95807948 E-mail: [email protected] Mr Keith R Chapman Bioenergy Food Security Consultant to FAO - SAP 8 Fort Street Buderim 4556 Queensland
Betio Tarawa KIRIBATI Tel: (686) 2605 E-mail: [email protected] NAURU UTILITIES AUTHORITY Ms Silvie Dageago Nauru Utilities Authority AIWO District NAURU ISLAND Tel: (674) 444 3794 Fax: (674) E-mail: [email protected] SAMOA – MINISTRY OF FINANCE Mrs Silia Kilepoa-Ualesi Energy Coordinator Ministry Finance Central Bank Building Beach Road Apia SAMOA Tel: (685) 34 341 / 34333 Fax: (685) 21 312 E-mail: [email protected] SOLOMON ISLANDS – WILLIES ELECTRICAL Mr David Iro Manager - Willies Electrical PO Box R169 Honiara SOLOMIN ISLANDS Tel: (677) 30508 Fax: (677) 30477 E-mail: [email protected] SOCIÉTÉ DE RECHERCHE DU PACIFIQUE Ms Barbara Vlaeminck SRP Director Société de Recherche du Pacifique Immeuble Le Surcouf 1 Rue Frédéric Surleau BP5363 - 98853 Nouméa Cedex NOUVELLE-CALÉDONIE Tel: (687) 28 2195 Fax: (687) 28 9896 E-mail: [email protected] Mr. Tau'aika 'Uta'atu (Heiss Fonohema) for Commander Tonga Defence Services Mr. Laki Pifeleti Chief Education Officer Ministry of Education, Women Affair's & Culture Mr. David Robert Wright Acting CEO & Chairman of the Board Tonga Power Ltd

99
AUSTRALIA Tel: 61 7 54456430 Fax: 61 7 54456430 E-mail: [email protected] Ms. 'Akanesi Paunga Deputy Director & Head of Women Affair's Division Ministry of Education, Women Affair's & Culture Mr Sione Taumoepeau Director of Works Ministry of Works Mr. Paula Taufa Sales & Marketing Manager BP Southwet Pacific Ltd Ms. Sepiuta Moala Auditor Audit Department RIF CONSULTANTS Ms Catherine Bennet Mr Russell Howarth Mr Rewi Edwin (Ed) Pittman CROP PACIFIC ISLANDS FORUM SECRETARIAT Mr Tuiloma Neroni Slade Secretary General Pacific Islands Forum Secretariat PMB Suva FIJI ISLANDS Tel: (679) 331 2600 Fax: E-mail: [email protected] Mr Edward (Ed) Vrkic Executive Officer – Pacific Plan Pacific Islands Forum Secretariat PMB Suva FIJI ISLANDS Tel: (679) Fax: (679) E-mail: PACIFIC POWER ASSOCIATION Mr Tony Neil Executive Director Pacific Power Association PMB Suva FIJI ISLANDS Tel: (679) 330 6022 Fax: (679) 330 2038 E-mail: [email protected]
Mr Roland Leong Refining & Marketing Manager – Marketing & Operations PO Box 140 Nuku’alofa KINGDOM OF TONGA Tel: (676) 23377/23797 Fax: (676) 23899 E-mail: [email protected] Honourable 'Akau'ola Renewable Energy Advisor PMO Advisory Unit Ms Meleane Taueli Tonga Police Mr Vailala Matoto Secretary for Fisheries Fisheries Department Nuku'alofa Phone: 23 730 E-mail: [email protected] Mr Garaio D Gafiye Manager - Energy Programme ATCDI Unitech PMB Lae Mr Albert (Al) Binger Advisor to Executive Director Caribbean Community Climate Change Centre Belmopan Belize Central America Tel: (501) 522 1104/
1094 Fax: (501) 822 1365 E-mail: [email protected] Secretariat of the Pacific Community (SPC) BP D5, 98848 Noumea Cedex 95 Promenade Roger Laroque, Anse Vata NEW-CALEDONIA Tel: (687) 262000 Fax: (687) 263818 E-mail: [email protected] Mr Tim Martyn Economist Secretariat of the Pacific Community (SPC) Private Mail Bag Suva FIJI ISLANDS Tel: (679) 337 0733 Fax: (679) 337 0021 E-mail: [email protected] SPREP Mr Kosi Latu Acting Director SPREP PO Box 240 Apia

100
Secretariat for the Pacific Community Mr Jimmy Rodgers Director General Tel: (679) 323 2845 Fax: (679) 323 1511 E-mail: [email protected] Dr Ajal Kumar Lecturer Faculty of Science, Technology and Environment University of the South Pacific Laucala Campus Suva FIJI ISALNDS Tel: (679) 32 32147 Fax: (679) 323 1511 E-mail: [email protected] SOPAC SECRETARIAT Secretariat of the Pacific Applied Geoscience Commission Private Mail Bag GPO Suva FIJI ISLANDS Tel: (679) 3381 377 Fax: (679) 3370 040 E-mail: [email protected] Website: www.sopac.org Ms Cristelle Pratt Director E-mail: [email protected] Mr Paul Fairbairn Manager Community Lifelines Programme E-mail: [email protected] Mr Rupeni Mario Senior Energy Advisor E-mail: [email protected] Ms Arieta Gonelevu Senior Project Officer E-mail: [email protected] Ms Lala Bukarau Senior Advisor – Technial Editor E-mail: [email protected] Mr Sakaio Manoa Adviser ICT E-mail: [email protected]
SAMOA Tel: (685) 21929 Fax: (685) 20231 E-mail: [email protected] Mr Solomone Fifita Manager – PIGGAREP SPREP PO Box 240 Apia SAMOA Tel: (685) 21929 Fax: (685) 20231 E-mail: [email protected] University of the South Pacific Dr Kifle Kahsai Associate Dean Faculty of Science, Technology and Environment University of the South Pacific Laucala Campus Suva FIJI ISALNDS Mrs Koin Etuati Energy Project Officer E-mail: [email protected] Ms Pooja Pal PA – Community Lifelines Programme E-mail: [email protected] Ms Atishma Lal Energy Support Officer E-mail: [email protected]

101
Appendix 5. List of persons met SOPAC Secretariat Secretariat of the Pacific Applied Geoscience Commission (SOPAC) Private Mail Bag GPO Suva FIJI ISLANDS Tel: (679) 3381 377 Fax: (679) 3370 040 E-mail: [email protected] Website: www.sopac.org Ms Cristelle Pratt Director E-mail: [email protected] Mr Paul Fairbairn Manager Community Lifelines Programme E-mail: [email protected] Mr Rupeni Mario Senior Energy Advisor E-mail: [email protected] Ms Arieta Gonelevu Senior Project Officer E-mail: [email protected] Ms Pooja Pal PA – Community Lifelines Programme E-mail: [email protected] Mr Ivan Krishna Project Officer-Energy Community Lifelines Programme E-mail: [email protected] University of the South Pacific Dr Kifle Kahsai Associate Dean Faculty of Science, Technology and Environment University of the South Pacific Laucala Campus Suva FIJI ISALNDS Dr Ajal Kumar Lecturer Faculty of Science, Technology and Environment University of the South Pacific Laucala Campus Suva FIJI ISALNDS Tel: (679) 32 32147 Fax: (679) 323 1511 E-mail: [email protected] UNELCO
SPREP Mr Kosi Latu Acting Director SPREP PO Box 240 Apia SAMOA Tel: (685) 21929 Fax: (685) 20231 E-mail: [email protected] Mr Solomone Fifita Manager – PIGGAREP SPREP PO Box 240 Apia SAMOA Tel: (685) 21929 Fax: (685) 20231 E-mail: [email protected] Mr Taito Nakalevu Regional Project Manager UNDP/SPREP PO Box 240 Apia SAMOA Tel: (685) 21929 Fax: (685) 20231 E-mail: [email protected] Mr Albert (Al) Binger Advisor to Executive Director Caribbean Community Climate Change Centre Belmopan Belize Central America Tel: (501) 522 1104/
1094 Fax: (501) 822 1365 E-mail: [email protected] Secretariat of the Pacific Community (SPC) BP D5, 98848 Noumea Cedex 95 Promenade Roger Laroque, Anse Vata NEW-CALEDONIA Tel: (687) 262000 Fax: (687) 263818 E-mail: [email protected] Mr Tim Martyn Economist Secretariat of the Pacific Community (SPC) Private Mail Bag Suva FIJI ISLANDS Tel: (679) 337 0733 Fax: (679) 337 0021 E-mail: [email protected]

102
Mr John Chaniel Board Member UNELCO PO Box 25 Port Vila VANUATU Tel: (678) 23883 Fax: (678) 25011 E-mail: [email protected] Mr Peter Johnston Consultant PO Box 4206 Samabula Suva FIJI ISLANDS Tel: (679) 337 0861 Fax: E-mail: [email protected] THE FOUNDATION FOR DEVELOPMENT COOPERATION Mr Jack Whelan The Foundation for Development Cooperation 137 Melbourne Street South Brisbane Queensland 4101 AUSTRALIA Tel: (617) 3217 2924 Fax: (617) 3846 0342 E-mail: [email protected] FIJI Mr. Peceli Nakavulevu Dept of Energy Ministry of Works and Energy PO Box 2493 Govt. Buildings Suva FIJI ISLANDS Tel: (679) 3386006 Fax: (679) 3386677 E-mail: [email protected] Mr Tony Neil Executive Director Pacific Power Association PMB Suva FIJI ISLANDS Tel: (679) 330 6022 Fax: (679) 330 2038 E-mail: [email protected] Mr Taholo Kami Director IUCN Regional Office for Oceania PMB 5 Ma'afu Street Suva FIJI ISLANDS Tel: (679) 331 9084 Fax: (679) 3100 128 E-mail: [email protected]
SAMOA – MINISTRY OF FINANCE Mrs Silia Kilepoa-Ualesi Energy Coordinator Ministry Finance Central Bank Building Beach Road Apia SAMOA Tel: (685) 34 341 / 34333 Fax: (685) 21 312 E-mail: [email protected] IT Power Mr Anthony Derrick Managing Director IT POWER LTD The Warren, Bramshill Road Rg27 0pr Hook Eversley, Hants United Kingdom Tel: 44 12 56392700 Fax: 44 12 56392700 E-mail: [email protected] REEEP Mr Mike Allen Advisor REEEP Suite 201, Level 2 18 Kavanagh Street Southbank VIC 3006 AUSTRALIA Tel: (613) 9929 4100 Fax: (613) 9929 4101 E-mail: [email protected] UNDP Mr Thomas Lynge Jensen Environment & Energy Policy Specialist UNDP Pacific Centre Private Mail Bag Suva FIJI ISLANDS Tel: (679) 330 0399 Fax: (679) 330 1976 E-mail: [email protected] UNIDO Mr Sebastian Hermann Associate Expert Renewable Energy Renewable and Rural Energy Unit Energy and Climate Change Branch Programme Development and Technical Cooperation Division UNIDO Vienna International Centre P O Box 300 1400 Vienna AUSTRIA Tel: 43 1 26026 4817 Fax: 43 1 26026 6803

103
Mr Anare Matakiviti Project Manager IUCN Regional Office for Oceania PMB 5 Ma'afu Street Suva FIJI ISLANDS Tel: (679) 331 9084 Fax: (679) 3100 128 E-mail: [email protected] Ms Salote Sauturaga IUCN PMB 5 Ma'afu Street Suva FIJI ISLANDS Tel: (679) 331 9084 Fax: (679) 3100 128 E-mail: [email protected] Dr Richard Beyer Perm. Secretary Ministry of Primary Industries Takayawa Tower PMB Raiwaga Suva Fiji Tel: 679-3301611 Fax:679- 3310679 E-mail: [email protected] The Foundation for Development Mr Craig Wilson Executive Director The Foundation for Development Cooperation 137 Melbourne St South Brisbane Queensland 4101 AUSTRALIA Tel: (61 7) 3217 2924 Fax: (61 7) 3846 0342 E-mail: [email protected] VANUATU Mr Moli Janjea Senior Energy Officer Energy Unit Private Mail Bag 9067 Rue Winston Churchill Port Vila VANUATU Tel: [678] 25201 Fax: [678] 23586 E-mail: [email protected] Solomon Islands Mr Toswell Kaua Ministry of Mines, Energy and Rural Electrification PO Box G37 Honiara SOLOMON ISLANDS Tel: (677) 21 522 / 21 525 Fax: (677) 25 811
E-mail: [email protected] World Bank Ms Wendy Hughes Senior Energy Specialist Sustainable Development Department East Asia and the Pacific Region (EASNS) World Bank Level 19, 14 Martin Place Sydney NSW 2000 AUSTRALIA Tel: 61(0) 2 9223 7777 Fax: 61 (0) 2 9223 9903 E-mail: [email protected] Kingdom of Tonga Mr Asipeli Palaki Deputy CEO Ministry of Lands, Surveys & Natural Resources P O Box 5 Nuku’alofa Tel: (676) 23 611 Fax: (676) 23 216 E-mail: [email protected] Ms Emeline Veikoso Energy Planner, EPU Ministry of Lands, Surveys & Natural Resources P O Box 5 Nuku’alofa KINGDOM of TONGA Tel: (676) 23 611 Fax: (676) 23 216 E-mail: [email protected] [email protected] Asian Development Bank Mr Anthony Maxwell Energy Speclialist Asian Development Bank 6 ADB Avenue Mandaluyong City 1550 Metro Manila PHILIPPINES Tel: (632) 632-6391 Fax: (632) 636 2446 E-mail: [email protected] AusAID and Australia Mr Brian Dawson Climate Change and Energy Advisor AusAID GPO Box 887 Canberra ACT 2601 AUSTRALIA Tel: (612) 6206 4819 Fax: (612) 6206 4720 E-mail: [email protected] Mr Paul Wright Program Manager Infrastructure Pacific Branch AusAID

104
E-mail: [email protected] Marshall Islands Mr Nick Wardrop Energy Adviser Ministry of Resources & Development P O Box 1727 Majuro MARSHALL ISLANDS 96900 Tel: (692) 625 3206 61 7 418254275 Fax: (692) 625 7471 E-mail: [email protected] Ms Yuen Kayo Yamaguchi – Kotton Ministry of Finance Senior EU Desk Officer PO Box Majuro MARSHALL ISLANDS 96900 Tel: (692) 625 8835 Fax: (692) 625 3607 E-mail: [email protected] Republic Of Marshall Islands (**Representing the Minister) Ms Angeline Abraham National Energy Planner Ministry of Resources & Development P O Box 1727 Majuro MARSHALL ISLANDS 96900 Tel: (692) 625 3206 Fax: (692) 625 7471 E-mail: [email protected] Mr Thomas Kijiner Jnr Permanent Secretary Ministry of Resources and Development P O Box 1727 MAJURO MARSHALL ISLANDS 96900 Tel: (692) 625 3206 Fax: (692) 625 7471 E-mail: [email protected] Ms. Yuen Kayo Yamaguchii Kotton TA to NAO-EU Officer Ministry of Finance Majuro Marshall Islands. 96960. Tel: 692-6258835/5413 Fax: 692-6253607 E-mail: [email protected] Samoa Mr Mua’Ausa Joseph Siegfried Walter General Manager Electric Power Corporation Level 3 John Williams Bldg.Tamaligi Apia Samoa Tel: 685-26286 Fax: 685 23748 E-mail: [email protected] [email protected]
GPO Box 887 Canberra ACT 2601 AUSTRALIA Tel: (612) 6206 4346 Fax: (612) 6206 4720 E-mail: [email protected] Mr John Russell Assistant Director Renewable Energy Policy & Partnerships Section Department of the Environment, Water, Heritage and the Arts GPO Box 787 Canberra ACT 2601 AUSTRALIA Tel: (612) 6274 1139 Fax: (612) 6274 1390 E-mail: [email protected] South Pacific Commission Mr Tim Martyn Economist Secretariat of the Pacific Community (SPC) Private Mail Bag Suva FIJI ISLANDS Tel: (679) 337 0733 Fax: (679) 337 0021 E-mail: [email protected] Dr Lex Thomson FACT Team Leader Agri-Forestry Export Production Specialist Secretariat of the Pacific Community (SPC) Private Mail Bag Suva FIJI ISLANDS Tel: 679-337 0733 Fax: 679-3370021 E-mail: [email protected] Papua New Guinea Mr Garaio Gafiye Res. Engineer PNG Univ of Technology PMB, Lae. Morobe Province Papua New guinea Tel: 675-473 4778 Fax: 675-473 4303 Email: [email protected] Apia Samoa Tel: 685-65408 Fax: 685-685 2378 E-mail: [email protected] Vanuatu Ministry of Agriculture Quarantine Forestry and Fisheries Port Vila: Ruben Markward Director of Agriculture James Wasi Dept of Ag Extension

105
Mr Wairarapa Young Renewable Energy Officer Electric Power Corporation Level 3 John Williams Bldg.Tamaligi. Mr Taito Ulaitino Dr Faale Tumaalii Chief Executive Officer Scientific Research Organisation of Samoa PO box 6597 Apia Post Office, Apia. Samoa. Tel: 685-20664 Fax:685 20352 E-mail: [email protected] FAO –SAP Samoa Private Mail Bag Apia Samoa. Tel: +685 22127 Fax+ 685 21126 Vili Favao Subregional FAO Representative for the Pacific E-mail: [email protected] Dirk Schulz E-mail: [email protected] Aru Matias E-mail: [email protected] Mat Purea E-mail: [email protected] Stephen Rogers: Consultant to FAO E-mail: [email protected] Daneswar Poonyth E-mail: [email protected] Mere Salesa E-mail: [email protected] PAPUA NEW GUINEA Dept of Agriculture and Livestock Port Moresby. Mr Brown Konabe Director of Food Security Programme and Food Security Branch Konedobu Port Moresby E-mail: [email protected] Mr Ian Onaga Director of Science and Technology Branch Konedobu Port Moresby Dr Ruth Turia Director Forest Policy Planning National Forest Service
E-mail: [email protected] Ms.Annick Stevens Food Security Officer Julie Beierlein Tech Assistant –Food Security Vincent Lebot Agric Research (Root Crops) E-mail: [email protected] Rexon Vira Sen. Forestry Officer Planning Ms Sapai-Moana Matariki Sen. Trade and Marketing Officer Dept of Trade and Industry Port Vila E-mail: [email protected] Ministry of Lands, Geology, Mines, Energy and Rural Water Supply Port Vila: George Shem Dept of Lands-Land Use Planning Ms Josiana Jackson GIS Section Chief/ITC Unit Lands and SurveyDept. E-mail: [email protected] Moli Janjea Energy Officer Jesse Benjamin Rural Electrification Unit Trinison Tari Head of Environmental Unit Erickson Sammy Rural Water Supply Officer Willie Karie Resources Department Socometra Vanuatu Ltd. UNELCO Port Vila. E-mail: [email protected] Francois Py Technical Department Socometra Vanuatu Ltd. UNELCO Port Vila. E-mail: [email protected] John Chaniel Board Member UNELCO Port Vila E-mail: [email protected] Nicholas Monvoisin Management Team

106
National Capital District Port Moresby E-mail: [email protected] Mr Goodwill Amos Manager Forest Planning and Coordinator Forest and Climate Change National Forest Service National Capital District Port Moresby E-mail: [email protected] Mr Alan Lari Assistant Director Engineering Services Branch Energy Division Dept of Petroleum and Energy National Capital District Port Moresby Ph: 675-3253233 Mr Vove Veve Acting Secretary Dept of Petroleum and Energy National Capital District Port Moresby Mr Brenden Trawen Dept of Environment and Conservation Somare Foundation Building Port Moresby Mt Gerard Natera Manager Spatial Systems and Data Dept of Environment and Conservation Somare Foundation Building Port Moresby E-mail: [email protected] Professor Pal Mrs Rosa Kambou NARI PNG. Mr Pepi Kimas Sec. Dept of Lands and The Director Waigami. Port Moresby. Mr Nick Suvulo Acting National Statistician Waigami. Port Moresby. E-mail: [email protected] Mr Alan Aku Sen. Projects Officer Kokonas Indastri Koporesen Nat Capital District Port Moresby. E-mail: [email protected] Mr Ian Orrell Managing Director OilPalm Research Association Inc. Dami Research Station Kimbe West New Britain Province PNG. E-mail: [email protected] Mr Jeong Lim CEO Changae Cassava Biofuel Project Port Moresby
Teouma Prawns/Coconut Oil Port Vila E-mail: [email protected] Solomon Islands Mr Harry Brock Project Manager Guadalcanal Plains Palm Oil Ltd., E-mail: [email protected] Mr Grant Vinning Aus AID Community Sector Program Marketing Specialist Tom Yu Bldg Honiara. E-mail: [email protected] Mr Owen Hughes Agriculture Livelihoods Program Manager AusAID Community Sector Program Tom Yu Bldg Honiara Ph: +677-96565 E-mail: [email protected] Mr Trevor Clark Cocoa Rehabilitation Program Coordinator AusAID Community Sector Program Tom Yu Bldg Honiara Ph: +677-96565 Ross Andrewartha Team Leader AusAID Forestry Management Project II Honiara E-mail: [email protected] John Vollrath Director Manager Solomon Tropical Products Honiara E-mail: [email protected] Ph: +677-38553 Aileen Croghan First Secretary Dept Cooperation AusAID Australian High Commission Honiara E-mail: [email protected] Ph: + 677-21561 Mr Paul Greener Rural Development Adviser Dept Cooperation AusAID Australian High Commission Honiara Mr Martin Sam Manager Distribution/Chief Engineer Ranadi Head Office Honiara

107
Mr Matthew Kanua Program Manager-Agriculture PNG Sustainable Development Project NCD Port Moresby E-mail: [email protected] Mr Ted Sitapai PNG Sustainable Development Project NCD Port Moresby Mr Sev Maso Advisor –Power Engineering Program Manager-Agriculture PNG Sustainable Development Project NCD Port Moresby. E-mail: [email protected] Mr Raymond Yauiab Mr Daniel Paita and Team Office of Climate Change and Environmental Sustainability Port Moresby E-mail: [email protected] Mr Phil Sherman Remote Sensing Unit Science 2 Building UPNG Port Moresby Mr Tony Nakuk and Ms Myamya Kyi Policy and Statistics Section Commerce and Industry Dept of Foreign Affairs and Trade. Port Moresby.
E-mail: [email protected] Ph: + 677-30533 Mr Alfred Maesulia Under Secretary Ministry of Agriculture and Livestock Honiara E-mail: [email protected] Ph: + 677-24570 Mr Kennet Bulehite Energy Division Ministry of Mines, Energy and Rural Electrification Honiara. E-mail: [email protected] Mr David Ramu Commodity Export Marketing Authority Honiara Mr Jimmy Ikina Head National GIS Unit National Land Centre Ministry of Lands Honiara Mr John Harunari Director of Extension and Training Ministry of Agriculture and Livestock Honiara E-mail: [email protected] Mr Jimi Saelea Director of Research Ministry of Agriculture and Livestock Honiara

108
Appendix 6. Programme of visit
Date Itinerary Friday 10 April 2009 Sat 11 April Friday 10 April Sat 11 April, Sunday 12 April Monday 13 April Tues 14 April Wed 15 April Thurs 16 April Friday 17 April Sat 18 April Sunday 19 April Monday 20 April Tuesday 21, Wed 22 and Thursday 23 April Friday 24 April Sat 25 and Sunday 26 April Monday 27 April Tues 28 April Wed 29 April Thurs 30 April
Dep. Buderim. Q. Australia.1400 hrs bus Arr. Brisbane 1520 hrs Dep Brisbane 1815 hrs NZ 738 Arr. Auckland 2235 hrs Dep Auckland 0035 hrs NZ 62 Arr. Apia Samoa. 0525 hrs. Free day own expense. Free days own expense. Mission commences FAO–SAP Samoa. Meetings with FAO staff and arranging appointments. Meetings at Ministry of Agriculture and Fisheries, Foreign Affairs and Ministry of Finance and FAO–SAP. Meetings at Ministry of Natural Resources and Environment and SPREP. Arrange ticketing to Tonga and Fiji for following 2 weeks of mission. Meetings at Electric Power Corporation, and Research and Development Institute of Samoa. And FAO–SAP Dep. Samoa 0535 hrs FJ 0252 Arr. Nadi Fiji. Nadi Fiji. Report writing and reviewing documents. Dep. Nadi 0700hrs FJ0007 Arr. Suva. Dep Suva 0915 hrs FJ0271 Arr. Nuku’Alofa Tonga. 1150 hrs. Attend Regional Energy Ministers Meeting in Tonga. Attend Regional Energy Ministers Meeting in Tonga and meet with key persons from CROP agencies, donors and country officials from all 14 PICs as well as from Tonga Ministry of Lands, Survey and Natural Resources and Department of Agriculture and Food, Forests and Fisheries. Dep. Tonga 135 hrs FJ0270 Arr. Suva 1330 hrs. Document review and report outlining. Meetings with ACIAR and SPC and SOPAC and Ecoconsult. Further meetings at SPC and with Ministry of Primary Industries. Further meetings with SOPAC staff and meetings with Department of Energy at Ministry of Works and Energy and discussions with USP and Ecoconsult. Dep. Suva 0605 hrs FJ0004 Arr. Nadi 0635 hrs Dep. Nadi 0845 hrs FJ0411 Arr. Auckland 1145 hrs Dep Auckland 1300hrs

109
Wed 29 April Thurs 30 April Friday 01 May Saturday 02 May Friday15 May – Friday 29 May Sat 30 May Sun 31 May Mon. 01 June Tues 02 June Wed 03 June Thurs 04 June Friday 05 June Sat 06 June Sun 07 June Mon 08 June Tues 09 June Wed 10 June Thurs 11 June Friday 12 June Sat 13 June
Arr. Apia 1750 hrs Debriefing at FAO–SAP and further discussions with key staff. Dep Apia. 0640 hrs NZ61 Arr. Auckland 0950 hrs Dep. Auckland 1530 hrs NZ 739 Arr. Brisbane 1720 hrs Dep. Brisbane 1800 hrs Sunair Bus. Arr. Buderim. 2000 hrs. Document printing and reviewing and report compilation. Dep. Buderim 0600 hrs car. Arr. Brisbane 0715 hrs Dep. Brisbane 1000 hrs DJ181 Arr. Vila 1335 hrs. Preparing programme of visit Meetings with Ministry of Agriculture Quarantine Forestry and Fisheries and Department of Trade, Vila. Meetings with Ministry of Lands, Geology, Mines, Energy and Rural Water Supply Port Vila: Meetings with Department of Lands and GIS Unit and private sector manufacturers and users of bioenergy and renewable energy. Visit to Dept of Statistics Govt of Vanuatu and more discussions on coconut oil production and use by private sector for power generation and fuel. Visit to UNELCO power generation station and report compilation. Dep Vila 1355 hrs DJ180 Arr. Brisbane 1635 hrs Overnight Brisbane. Dep Brisbane 1000hrs DJ 169 Arr. Port Moresby 1400 hrs Briefing with Brown Konabe, Dept of Ag and Livestock (DAL) Queens Birthday holiday- Report writing. Meetings with Brown Konabe of DAL and Dept of Environment and Conservation and Dept of Petroleum, Mines and Energy Meetings with Brown Konabe of DAL and Department of Lands, PNG National Forest Authority, National Statistical Office and Ian Orrell, Managing Director Oil Palm Research Association Inc. Meetings with Brown Konabe of DAL and National Agricultural Research Institute and Office of Climate Change and Environmental Sustainability and Kokonas Indastri Koporesen and PNG Sustainable Development Program Ltd. Meetings with Brown Konabe of DAL and Changae Cassava Project and Phil Sherman of UPNG Remote Sensing Unit and DAL wrap-up meeting and Commerce and Industry Policy and Statistics Unit. Report writing.

110
Sun 14 June Tues 16 June Wed 17 June Thurs 18 June Friday 19 June Sat. 20 June Sun 21 June Monday 22 June Tues 23 June Wed 24 June
Dep. Port Moresby 1355hrs DJ190 Arr. Brisbane 1655 hrs Dep Brisbane 1800 hrs Sunair bus Arr. Buderim 2000hrs Dep. Buderim 0530 hrs Sunair bus Arr. Brisbane 0730 hrs Dep. Brisbane 100hrs DJ 169 Arr. Honiara 1400hrs Discussions with Undersecretary Dept. Agriculture and Livestock and arranging programme of visit. Meetings at Energy Division Ministry of Mines, Energy and Rural Electrification and Forest Management Project II Meeting with Community Sector Program team. Meeting with Commodity Export Marketing Authority and visit to Central Bank to check data. Meeting at Solomon Tropical Products and at Ministry of Lands and Ministry of Agriculture and Livestock Meeting with AusAID First Secretary and Rural Development Adviser. Meeting with National GIS Unit. Lands Department. Meeting with Solomon Islands Electricity Authority. Report compilation, updating. Discussions with Grant Vinning of Community Sector Program Report writing. Meetings at Ministry of Agriculture and Livestock Dep Honiara 1450 hrs DJ168 Arr. Brisbane 1705 hrs Dep Brisbane 1800 hrs Sunair bus Arr. Buderim 2000hrs Final editing of report

111
Appendix 7. Completed survey forms Marshall Islands Survey form – rapid appraisal of bioenergy and food security
The data needs for in-depth studies under the FAO BEFS Project include the following in the questions below. Data should be available for the most recent five-year period, where possible.
Please place a Y =Yes or N=No or H=Need Help, at the end of each line and please kindly complete the information on the bottom of the sheet. Many thanks for your greatly appreciated participation. After completion please save the completed form under a new file name e.g. Survey Rapid Appraisal Samoa Dept Energy .doc or similar for your country.
Agriculture and economy
Are you able, within the country, to: • Identify what are the main food crops and crops considered for bioenergy in each
country? Y • Collect food insecurity and vulnerability data for national and, if possible, subnational
levels? (special emphasis should be placed on specific vulnerability of remote islands). H • Obtain data on your country’s agricultural trade balance to assess self-sufficiency of
country per crop? H • Assess your country’s domestic demand for agricultural commodities and, to the extent
possible, project future demands? H • Gauge the scope and degree of policy commitment and action with regard to bioenergy
programmes, regulation and the political sensitivity for food security? H
Energy Can you determine from your own data or actions the following:
• The share of different energy sources (biomass, hydro, oil, gas, solar wind, ocean) in the national energy mix? Y
• The share of imported energy out of the total? Y • Current and projected future volumes and costs of import of fossil fuels (crude oil, gas,
gasoline, diesel)? Y • Collect main fuel prices for consumers (gasoline/litre, diesel/litre, Kw/h)? Y • Assess the extent and amount of decentralized electrification? (e.g. for on-farm use,
telecommunication towers, use in urban/rural transport etc.) Y Natural resources
Do you within the country have the ability to: • Identify, where possible geospatially, current land cover, land use and (qualitatively)
land-use change trends in recent years? N • Collect information on crop-specific land use and on existing or planned crop suitability
assessments? N • Assess water availability and constraints and irrigated area? N

112
• Assess scope of wood energy and most important challenges faced? N • Highlight major environmental challenges in each country potentially linked to bioenergy
development? (e.g. deforestation, biodiversity and habitat loss, water stress and pollution) N
Additional policy planning questions:
Please answer with Y=Yes or N=No and dates where known
1. Is there an existing recent Food Security Policy for your country? N
If so what was the date of its introduction/last revision, if known? ... 2. Does the existing Food Security Policy include considerations on biomass and bioenergy crops and implications of likely conflicts with food crops? N 3. Does your country have a National Agricultural Development Plan? Y
If so what was the date of its introduction/last revision, if known? 2005 Please kindly complete the information below. Name: Thomas Kijiner, Jr . E-mail: [email protected] Department/Institute: Ministry of Resources & Development Country: Republic of the Marshall Islands Kiribati Survey form – rapid appraisal of bioenergy and food security
The data needs for in-depth studies under the FAO BEFS Project include the following in the questions below. Data should be available for the most recent five-year period, where possible.
Please place a Y =Yes or N=No or H=Need Help, at the end of each line and please kindly complete the information on the bottom of the sheet. Many thanks for your greatly appreciated participation. After completion please save the completed form under a new file name e.g. Survey Rapid Appraisal Samoa Dept Energy .doc or similar for your country.
Agriculture and economy
Are you able, within the country, to: • Identify what are the main food crops and crops considered for bioenergy in each
country? Y Coconut. • Collect food insecurity and vulnerability data for national and, if possible, subnational
levels? (special emphasis should be placed on specific vulnerability of remote islands).

113
(MELAD to answer this) • Obtain data on your country’s agricultural trade balance to assess self-sufficiency of
country per crop? (MELAD and MFED to answer this) • Assess your country’s domestic demand for agricultural commodities and, to the extent
possible, project future demands? (MFED to answer this) • Gauge the scope and degree of policy commitment and action with regard to bioenergy
programmes, regulation and the political sensitivity for food security? (MWPU to answer this)
Energy Can you determine from your own data or actions the following:
• The share of different energy sources (biomass, hydro, oil, gas, solar, wind, ocean) in the national energy mix for 2006. Y Year Unit Biomass
(t) Solar (W)
Kerosene (ltr)
Diesel (ltr)
Benzene (ltr)
Gas (ltr)
2004 Original 36 977.48 201 200 2 462 938 12 531 796 5 679 361 451 000
Gigajoules 632 315 73.438 90 636.12 483 727.33 194 234.15 12 492.7
2005 Original 37 538.88 213 100 2 270 659 12 579 836 5 380 706 416 000
Gigajoules 641 915 77.782 83 560.25 485 581.67 184 020.15 11 523.2
2006 Original 37 647.61 211 700 2 464 623 12 852 068 5 570 454 389 000
Gigajoules 643 774 77.271 90 698.13 496 089.82 190 509.53 10 775.3
NB: Hydro, wind and ocean energy cannot be measured at the moment as they have not yet been applied in Kiribati.
• The share of imported energy out of the total for 2004, 2005, 2006 Y Using the above table, the imported energy is taken as the total of kerosene, diesel, benzene and gas (LPG) therefore the share of imported energy out of the total for:
2004: 781 090.302/1 413 478.74 = 55 percent 2005: 764 685.27/1 406 678.052 = 54 percent 2006: 788 072.78/1 431 924.051 = 55 percent
• Current and projected future volumes and costs of import of fossil fuels (crude oil, gas,
gasoline, diesel)? Y Year LPG Gasoline Diesel Volume
(ltr) Costs (A$) Volume
(ltr) Costs (A$) Volume (ltr) Costs (A$)
Jan 2009 20 206 1 899 732 476 545 371 276.21 11 901 69 10 210 45.99
Feb 2009 - - 410 084 381 870.22 8 126 33 6 995 95.75
March 2009 - - 439 726 383 353.13 11 830 61 10 203 90.11
Jan 2010 (projected)
42 994 2 600 000 417 273
388 564.62 10 907 37 9 407 60.70
NB: Kiribati Oil Importing Limited does not import crude oil. The projected figures are estimated based on 2008 data best-fit line THE HIGHLIGHT CORRECTED FROM 26 000 000
• Collect main fuel prices for consumers (gasoline/litre, diesel/litre, Kw/h)? Y Current retail price for: Gasoline/litre: $1.19 (under MCIC control price) Diesel/litre: $1.47 (quoted from Betio Gas Station) kWh: Domestic – $0.40

114
Government – $0.70 Commercial – $0.55
• Assess the extent and amount of decentralized electrification? (e.g. for on-farm use, telecommunication towers, use in urban/rural transport etc.) Y Electricity in Kiribati is primarily generated from fossil fuels by the Public Utilities Board (PUB) in South Tarawa, Ministry of Lines and Phoenix on Kiritimati Island, and Kiribati Solar Energy Company (KSEC) on the other hand is responsible for the electrification of the outer islands using solar PV systems. The amount of electricity sent out in 2007 was 22 440 MWh for South Tarawa and 830 MWh for the outer island. For Kiritimati Island, the required data are not yet available in this Ministry.
Natural resources Do you within the country have the ability to:
• Identify, where possible geospatially, current land cover, land use and (qualitatively)
land-use change trends in recent years? (MWPU and MELAD to answer this) • Collect information on crop-specific land use and on existing or planned crop suitability
assessments? (MELAD to answer this) • Assess water availability and constraints and irrigated area? (MWPU to answer this). • Assess scope of wood energy and most important challenges faced? (No data available
on this) • Highlight major environmental challenges in each country potentially linked to bioenergy
development? (e.g. deforestation, biodiversity and habitat loss, water stress and pollution) Y. In Kiribati only south Tarawa, the island capital, is seriously affected by fuel pollution, especially in the Betio Town area. In areas close to Power House, diesel fuel leakage has penetrated to the underground water lens.
Additional policy planning questions
Please answer with Y=Yes or N=No and dates where known
1, Is there an existing recent Food Security Policy for your country? Y
If so what was the date of its introduction/last revision, if known? 2008 2. Does the existing Food Security Policy include considerations on biomass and bioenergy crops and implications of likely conflicts with food crops? ?(MELAD and MWPU) 3. Does your country have a National Agricultural Development Plan? ........
If so what was the date of its introduction/last revision, if known? (MELAD)
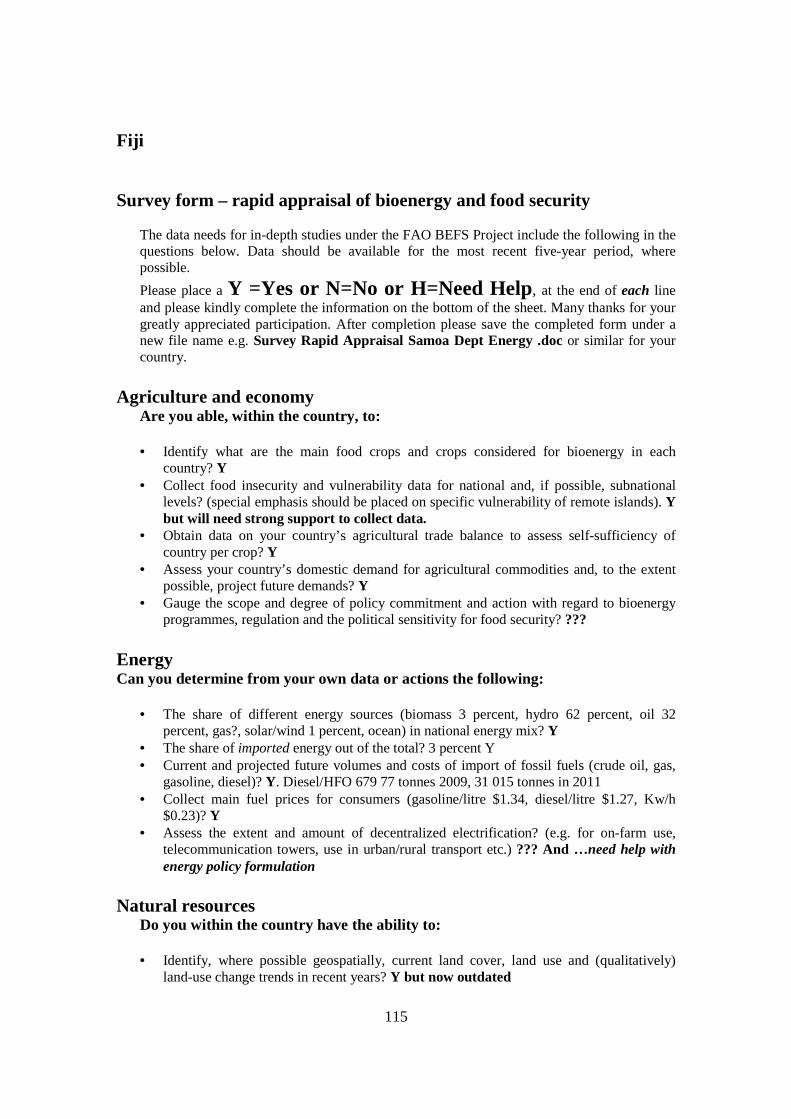
115
Fiji
Survey form – rapid appraisal of bioenergy and food security
The data needs for in-depth studies under the FAO BEFS Project include the following in the questions below. Data should be available for the most recent five-year period, where possible.
Please place a Y =Yes or N=No or H=Need Help, at the end of each line and please kindly complete the information on the bottom of the sheet. Many thanks for your greatly appreciated participation. After completion please save the completed form under a new file name e.g. Survey Rapid Appraisal Samoa Dept Energy .doc or similar for your country.
Agriculture and economy
Are you able, within the country, to: • Identify what are the main food crops and crops considered for bioenergy in each
country? Y • Collect food insecurity and vulnerability data for national and, if possible, subnational
levels? (special emphasis should be placed on specific vulnerability of remote islands). Y but will need strong support to collect data.
• Obtain data on your country’s agricultural trade balance to assess self-sufficiency of country per crop? Y
• Assess your country’s domestic demand for agricultural commodities and, to the extent possible, project future demands? Y
• Gauge the scope and degree of policy commitment and action with regard to bioenergy programmes, regulation and the political sensitivity for food security? ???
Energy Can you determine from your own data or actions the following:
• The share of different energy sources (biomass 3 percent, hydro 62 percent, oil 32 percent, gas?, solar/wind 1 percent, ocean) in national energy mix? Y
• The share of imported energy out of the total? 3 percent Y • Current and projected future volumes and costs of import of fossil fuels (crude oil, gas,
gasoline, diesel)? Y. Diesel/HFO 679 77 tonnes 2009, 31 015 tonnes in 2011 • Collect main fuel prices for consumers (gasoline/litre $1.34, diesel/litre $1.27, Kw/h
$0.23)? Y • Assess the extent and amount of decentralized electrification? (e.g. for on-farm use,
telecommunication towers, use in urban/rural transport etc.) ??? And …need help with energy policy formulation
Natural resources
Do you within the country have the ability to: • Identify, where possible geospatially, current land cover, land use and (qualitatively)
land-use change trends in recent years? Y but now outdated

116
• Collect information on crop-specific land use and on existing or planned crop suitability assessments? Y if funds and help provided
• Assess water availability and constraints and irrigated area? Y • Assess scope of wood energy and most important challenges faced? Y if funds provided • Highlight major environmental challenges in each country potentially linked to bioenergy
development? (e.g. deforestation, biodiversity and habitat loss, water stress and pollution) Y
Additional policy planning questions:
Please answer with Y=Yes or N=No and dates where known
1. Is there an existing recent Food Security Policy for your country? N and will
need help on FS policy
If so what was the date of its introduction/last revision, if known?...... 2. Does the existing Food Security Policy include considerations on biomass and bioenergy crops and implications of likely conflicts with food crops? N.A.. 3. Does your country have a National Agricultural Development Plan? N
If so what was the date of its introduction/last revision, if known?...... N.B. Energy section was completed by Fiji survey response. Vanuatu
Survey form – rapid appraisal of bioenergy and food security
The data needs for in-depth studies under the FAO BEFS Project include the following in the questions below. Data should be available for the most recent five-year period, where possible.
Please place a Y =Yes or N=No or H=Need Help, at the end of each line and please kindly complete the information on the bottom of the sheet. Many thanks for your greatly appreciated participation. After completion please save the completed form under a new file name e.g. Survey Rapid Appraisal Samoa Dept Energy .doc or similar for your country.
Agriculture and economy
Are you able, within the country, to: • Identify what are the main food crops and crops considered for bioenergy in each
country? Y • Collect food insecurity and vulnerability data for national and, if possible, subnational
levels? (special emphasis should be placed on specific vulnerability of remote islands). Y. Recent agricultural census done, but help needed for more detailed surveys.

117
• Obtain data on your country’s agricultural trade balance to assess self-sufficiency of country per crop? Y
• Assess your country’s domestic demand for agricultural commodities and, to the extent possible, project future demands? Y
• Gauge the scope and degree of policy commitment and action with regard to bioenergy programmes, regulation and the political sensitivity for food security? Y
Energy Can you determine from your own data or actions the following:
• The share of different energy sources (biomass, hydro, oil, gas, solar wind, ocean) in national energy mix? Y
• The share of imported energy out of the total? Y • Current and projected future volumes and costs of import of fossil fuels (crude oil, gas,
gasoline, diesel)? Y • Collect main fuel prices for consumers (gasoline/litre, diesel/litre, Kw/h)? Y • Assess the extent and amount of decentralized electrification? (e.g. for on-farm use,
telecommunication towers, use in urban/rural transport etc.) Y
Natural resources
Do you within the country have the ability to: • Identify, where possible geospatially, current land cover, land use and (qualitatively)
land-use change trends in recent years? Y but outdated VANRIS. • Collect information on crop-specific land use and on existing or planned crop suitability
assessments? Y but need assistance to do. • Assess water availability and constraints and irrigated area? Y but need assistance. • Assess scope of wood energy and most important challenges faced? Y • Highlight major environmental challenges in each country potentially linked to bioenergy
development? (e.g. deforestation, biodiversity and habitat loss, water stress and pollution) Y
Additional policy planning questions:
Please answer with Y=Yes or N=No and dates where known
1. Is there an existing recent Food Security Policy for your country? N. But FS is
high priority.
If so what was the date of its introduction/last revision, if known? ...2000–2005 Training only given. Agricultural Census 2006 and Agricultural Development Plan 2007 and Assessment of the Impact of Climate Change on Agriculture and Food Security in the Pacific in 2007–2008 will help develop FS policy. 2. Does the existing Food Security Policy include considerations on biomass and bioenergy crops and implications of likely conflicts with food crops? N

118
3. Does your country have a National Agricultural Development Plan? Y. The Vanuatu Agriculture Sector Study 2007–2012
If so what was the date of its introduction/last revision, if known? 2007 Papua New Guinea
Survey form – rapid appraisal of bioenergy and food security
The data needs for in-depth studies under the FAO BEFS Project include the following in the questions below. Data should be available for the most recent five-year period, where possible.
Please place a Y =Yes or N=No or H=Need Help, at the end of each line and please kindly complete the information on the bottom of the sheet. Many thanks for your greatly appreciated participation. After completion please save the completed form under a new file name e.g. Survey Rapid Appraisal Samoa Dept Energy .doc or similar for your country.
Agriculture and economy
Are you able, within the country, to: • Identify what are the main food crops and crops considered for bioenergy in each
country? Y • Collect food insecurity and vulnerability data for national and, if possible, subnational
level? (Special emphasis should be placed on specific vulnerability of remote islands). Y • Obtain data on your country’s agricultural trade balance to assess self-sufficiency of
country per crop? Y • Assess your country’s domestic demand for agricultural commodities and, to the extent
possible, project future demands? Y • Gauge the scope and degree of policy commitment and action with regard to bioenergy
programmes, regulation and the political sensitivity for food security? Y
Energy Can you determine from your own data or actions the following:
• The share of different energy sources (biomass, hydro, oil, gas, solar wind, ocean) in national energy mix? Y
• The share of imported energy out of the total? N • Current and projected future volumes and costs of import of fossil fuels (crude oil, gas,
gasoline, diesel)? ??? • Collect main fuel prices for consumers (gasoline/litre, diesel/litre, Kw/h)? Y • Assess the extent and amount of decentralized electrification? (e.g. for on-farm use,
telecommunication towers, use in urban/rural transport etc.) N

119
Natural resources Do you within the country have the ability to: • Identify, where possible geospatially, current land cover, land use and (qualitatively)
land-use change trends in recent years? Y • Collect information on crop-specific land use and on existing or planned crop suitability
assessments? N. Help required • Assess water availability and constraints and irrigated area? N • Assess scope of wood energy and most important challenges faced? Y • Highlight major environmental challenges in each country potentially linked to bioenergy
development? (e.g. deforestation, biodiversity and habitat loss, water stress and pollution) Y
Additional policy planning questions:
Please answer with Y=Yes or N=No and dates where known
1. Is there an existing recent Food Security Policy for your country? Y
If so what was the date of its introduction/last revision, if known? 2000–2010. Update now planned. 2. Does the existing Food Security Policy include considerations on biomass and bioenergy crops and implications of likely conflicts with food crops? N 3. Does your country have a National Agricultural Development Plan? Y
If so what was the date of its introduction/last revision, if known? 2007–2016. Solomon Islands
Survey form – rapid appraisal of bioenergy and food security
The data needs for in-depth studies under the FAO BEFS Project include the following in the questions below. Data should be available for the most recent five-year period, where possible.
Please place a Y =Yes or N=No or H=Need Help, at the end of each line and please kindly complete the information on the bottom of the sheet. Many thanks for your greatly appreciated participation. After completion please save the completed form under a new file name e.g. Survey Rapid Appraisal Samoa Dept Energy .doc or similar for your country.

120
Agriculture and economy Are you able, within the country, to: • Identify what are the main food crops and crops considered for bioenergy in each
country? Y • Collect food insecurity and vulnerability data for national and, if possible, subnational
levels? (special emphasis should be placed on specific vulnerability of remote islands). N. Help needed
• Obtain data on your country’s agricultural trade balance to assess self-sufficiency of country per crop? Y
• Assess your country’s domestic demand for agricultural commodities and, to the extent possible, project future demands? N. Need an agricultural census to update.
• Gauge the scope and degree of policy commitment and action with regard to bioenergy programmes, regulation and the political sensitivity for food security? Y
Energy Can you determine from your own data or actions the following:
• The share of different energy sources (biomass, hydro, oil, gas, solar wind, ocean) in national energy mix? Y
• The share of imported energy out of the total? Y • Current and projected future volumes and costs of import of fossil fuels (crude oil, gas,
gasoline, diesel)? Y • Collect main fuel prices for consumers (gasoline/litre, diesel/litre, Kw/h)? Y • Assess the extent and amount of decentralized electrification? (e.g. for on-farm use,
telecommunication towers, use in urban/rural transport etc.) Y
Natural resources
Do you within the country have the ability to: • Identify, where possible geospatially, current land cover, land use and (qualitatively)
land-use change trends in recent years? Y. National Forest Assessment done in 2005. • Collect information on crop-specific land use and on existing or planned crop suitability
assessments? N. National Land Use Inventory to come with EU help expected shortly.
• Assess water availability and constraints and irrigated area? N • Assess scope of wood energy and most important challenges faced? Y • Highlight major environmental challenges in each country potentially linked to bioenergy
development? (e.g. deforestation, biodiversity and habitat loss, water stress and pollution) Y

121
Additional policy planning questions:
Please answer with Y=Yes or N=No and dates where known
1. Is there an existing recent Food Security Policy for your country? N
If so what was the date of its introduction/last revision, if known? N.A. 2. Does the existing Food Security Policy include considerations on biomass and bioenergy crops and implications of likely conflicts with food crops? N 3. Does your country have a National Agricultural Development Plan? N. Formulation of a National Agriculture Development Policy 2008–2012 by FAO rejected by the government.
If so what was the date of its introduction/last revision, if known? ...... Samoa
Survey form – rapid appraisal of bioenergy and food security
The data needs for in-depth studies under the FAO BEFS Project include the following in the questions below. Data should be available for the most recent five-year period, where possible.
Please place a Y =Yes or N=No or H=Need Help, at the end of each line and please kindly complete the information on the bottom of the sheet. Many thanks for your greatly appreciated participation. After completion please save the completed form under a new file name e.g. Survey Rapid Appraisal Samoa Dept Energy .doc or similar for your country.
Agriculture and economy
Are you able, within the country, to: • Identify what are the main food crops and crops considered for bioenergy in each
country? Y • Collect food insecurity and vulnerability data for national and, if possible, subnational
levels? (special emphasis should be placed on specific vulnerability of remote islands). NH
• Obtain data on your country’s agricultural trade balance to assess self-sufficiency of country per crop? Y
• Assess your country’s domestic demand for agricultural commodities and, to the extent possible, project future demands? NH
• Gauge the scope and degree of policy commitment and action with regard to bioenergy programmes, regulation and the political sensitivity for food security? ???

122
Energy Can you determine from your own data or actions the following:
• The share of different energy sources (biomass, hydro, oil, gas, solar wind, ocean) in national energy mix? Y. No energy policy but good commitment to energy policy development.
• The share of imported energy out of the total? Y • Current and projected future volumes and costs of import of fossil fuels (crude oil, gas,
gasoline, diesel)? Y • Collect main fuel prices for consumers (gasoline/litre, diesel/litre, Kw/h)? Y • Assess the extent and amount of decentralized electrification? (e.g. for on-farm use,
telecommunication towers, use in urban/rural transport etc.) Y
Natural resources
Do you within the country have the ability to: • Identify, where possible geospatially, current land cover, land use and (qualitatively)
land-use change trends in recent years? Y • Collect information on crop-specific land use and on existing or planned crop suitability
assessments? NH • Assess water availability and constraints and irrigated area? NH • Assess scope of wood energy and most important challenges faced? Y • Highlight major environmental challenges in each country potentially linked to bioenergy
development? (e.g. deforestation, biodiversity and habitat loss, water stress and pollution) Y
Additional policy planning questions:
Please answer with Y=Yes or N=No and dates where known
1. Is there an existing recent Food Security Policy for your country? N If so what was the date of its introduction/last revision, if known? N.A. 2. Does the existing Food Security Policy include considerations on biomass and bioenergy crops and implications of likely conflicts with food crops? N
3. Does your country have a National Agricultural Development Plan? The Agriculture Sector plan is currently under development…in conjunction with the Strategy for the Development of Samoa (National Plan)…so in the absence of the agriculture plan, the SDS2008–2012 and the Ministry of Agriculture Corporate Plan are used as guides in the development of this sector and food security is reflected as a priority for the agriculture sector in both the SDS and the sector plan under process.
If so what was the date of its introduction/last revision, if known? N.A.
N.B. The Energy Section was completed by response to the survey.

123
Tonga
Survey form – rapid appraisal of bioenergy and food security
The data needs for in-depth studies under the FAO BEFS Project include the following in the questions below. Data should be available for the most recent five-year period, where possible.
Please place a Y =Yes or N=No or H=Need Help, at the end of each line and please kindly complete the information on the bottom of the sheet. Many thanks for your greatly appreciated participation. After completion please save the completed form under a new file name e.g. Survey Rapid Appraisal Samoa Dept Energy .doc or similar for your country.
Agriculture and economy
Are you able, within the country, to: • Identify what are the main food crops and crops considered for bioenergy in each
country? Y • Collect food insecurity and vulnerability data for national and, if possible, subnational
levels? (special emphasis should be placed on specific vulnerability of remote islands). H • Obtain data on your country’s agricultural trade balance to assess self-sufficiency of
country per crop? Y • Assess your country’s domestic demand for agricultural commodities and, to the extent
possible, project future demands?NH • Gauge the scope and degree of policy commitment and action with regard to bioenergy
programmes, regulation and the political sensitivity for food security? ??? Energy Can you determine from your own data or actions the following:
• The share of different energy sources (biomass, hydro, oil, gas, solar wind, ocean) in national energy mix? N. No energy policy. Help needed.
• The share of imported energy out of the total? N • Current and projected future volumes and costs of import of fossil fuels (crude oil, gas,
gasoline, diesel)? NH • Collect main fuel prices for consumers (gasoline/litre, diesel/litre, Kw/h)? Y • Assess the extent and amount of decentralized electrification? (e.g. for on-farm use,
telecommunication towers, use in urban/rural transport etc.)…Y but need help Natural resources
Do you within the country have the ability to: • Identify, where possible geospatially, current land cover, land use and (qualitatively)
land-use change trends in recent years? Y but data outdated. • Collect information on crop-specific land use and on existing or planned crop suitability
assessments? Y help required... • Assess water availability and constraints and irrigated area? Y • Assess scope of wood energy and most important challenges faced? Y

124
• Highlight major environmental challenges in each country potentially linked to bioenergy development? (e.g. deforestation, biodiversity and habitat loss, water stress and pollution) ???
Additional policy planning questions:
Please answer with Y=Yes or N=No and dates where known
1. Is there an existing recent Food Security Policy for your country? N
If so what was the date of its introduction/last revision, if known? N.A. 2. Does the existing Food Security Policy include considerations on biomass and bioenergy crops and implications of likely conflicts with food crops? N 3. Does your country have a National Agricultural Development Plan? N
If so what was the date of its introduction/last revision, if known? N.A.