Presumed Inhibitory Neurons in the Macaque Inferior Temporal Cortex: Visual Response Properties and...
15
Presumed Inhibitory Neurons in the Macaque Inferior Temporal Cortex: Visual Response Properties and Functional Interactions With Adjacent Neurons Hiroshi Tamura, 1,2 Hidekazu Kaneko, 2 Keisuke Kawasaki, 1,3 and Ichiro Fujita 1,3 1 Graduate School of Frontier Biosciences, Osaka University, Toyonaka, Osaka, 560 – 8531; 2 National Institute of Advanced Industrial Science and Technology, Tsukuba, Ibaraki, 305– 8566; and 3 Core Research for Evolutional Science and Technology, Japan Science and Technology Corporation, Toyonaka, Osaka, 560 – 8531, Japan Submitted 29 December 2003; accepted in final form 2 January 2004 Tamura, Hiroshi, Hidekazu Kaneko, Keisuke Kawasaki, and Ichiro Fujita. Presumed inhibitory neurons in the macaque inferior temporal cortex: visual response properties and functional interactions with adjacent neurons. J Neurophysiol 91: 2782–2796, 2004. First published January 7, 2004; 10.1152/jn.01267.2003. Neurons in area TE of the monkey inferior temporal cortex respond selectively to images of particular objects or their characteristic visual features. The mechanism of generation of the stimulus selectivity, however, is largely unknown. This study addresses the role of inhibitory TE neurons in this process by examining their visual response properties and interactions with adjacent target neurons. We applied cross- correlation analysis to spike trains simultaneously recorded from pairs of adjacent neurons in anesthetized macaques. Neurons whose activity preceded a decrease in activity from their partner were presumed to be inhibitory neurons. Excitatory neurons were also identified as the source neuron of excitatory linkage as evidenced by a sharp peak displaced from the 0-ms bin in cross-correlograms. Most inhibitory neurons responded to a variety of visual stimuli in our stimulus set, which consisted of several dozen geometrical figures and photographs of objects, with a clear stimulus preference. On average, 10% of the stimuli increased firing rates of the inhibitory neurons. Both excitatory and inhibitory neurons exhibited a similar degree of stimulus selec- tivity. Although inhibitory neurons occasionally shared the most pre- ferred stimuli with their target neurons, overall stimulus preferences were less similar between adjacent neurons with inhibitory linkages than adjacent neurons with common inputs and/or excitatory linkages. These results suggest that inhibitory neurons in area TE are activated selectively and exert stimulus-specific inhibition on adjacent neurons, contributing to shaping of stimulus selectivity of TE neurons. INTRODUCTION Visual information regarding the shape and surface charac- teristics of objects is processed along the cortical pathway projecting to the inferior temporal cortex in the primate brain. Neurons in area TE of the inferior temporal cortex exhibit selectivity to shapes, and some respond preferentially to com- plex object images such as faces (Desimone et al. 1984; Gross et al. 1972; Perrett et al. 1982; Tanaka et al. 1991). TE neurons are also selective for color, texture, and binocular disparity (Fujita 2002; Janssen et al. 2000; Komatsu et al. 1992; Sa ´ry et al. 1995; Uka et al. 2000; Wang et al. 2003). A proportion of neurons require that these visual attributes are combined with specific shapes to achieve maximal activation. The prestriate areas V2 and V4 and area TEO of the inferior temporal cortex also contain a substantial population of neurons that respond more strongly to higher-order shapes, such as crosses and hyperbolic or polar gratings than to bars, edges, or linear gratings (Gallant et al. 1993; Hegde ´ and Van Essen 2000; Kobatake and Tanaka 1994; Pasupathy and Connor 1999). The stimuli necessary for maximal activation of neurons in these areas, however, are generally less complex than those that excite TE neurons. The mechanism of generation of stimulus selectivity dis- played by TE neurons remains largely unknown. We have recently shown that inhibitory neuronal interactions mediated by the type-A receptor for -aminobutyric acid (GABA) shape multiple characteristics of the visual response (Wang et al. 2000, 2002, 2003). Removal of this inhibition by local appli- cation of a GABA A receptor antagonist, bicuculline methio- dide, to TE neurons modulates their stimulus-selective re- sponses. Bicuculline application augments responses to a sub- set of stimuli, even unmasking responses to stimuli that do not elicit responses under normal conditions. Responses to other stimuli, including some of the originally effective stimuli, remain unaffected. Several types of local inhibitory circuitry can explain stim- ulus-specific effect of bicuculline. A straightforward interpre- tation is that inhibitory neurons are stimulus selective. How- ever, stimulus-specific inhibition may not entail inhibitory neu- rons with stimulus-specific responses; such inhibition can occur if inhibitory neurons with poor stimulus tuning shunt stimulus-specific excitatory inputs. Broadband inhibition can be mediated by stimulus-selective inhibitory neurons selective for different stimuli that converge onto a same target neuron. To separate these possibilities, we need to investigate the response properties of individual inhibitory neurons. Such a study directly addresses if the responses of inhibitory neurons are stimulus selective and how this stimulus selectivity is related to that of their target neurons. In the present study, we identified inhibitory neurons by applying cross-correlation analysis to extracellular spikes re- corded simultaneously from adjacent neurons. A paired neuron the activity of which was followed by a decrease in activity of its partner was presumed to be inhibitory. Most of the inhibi- Address for reprint requests and other correspondence: H. Tamura, Labo- ratory for Cognitive Neuroscience, Graduate School of Frontier Biosciences, Osaka University, Toyonaka, Osaka, 560 – 8531, Japan (E-mail: [email protected]). The costs of publication of this article were defrayed in part by the payment of page charges. The article must therefore be hereby marked ‘‘advertisement ’’ in accordance with 18 U.S.C. Section 1734 solely to indicate this fact. J Neurophysiol 91: 2782–2796, 2004. First published January 7, 2004; 10.1152/jn.01267.2003. 2782 0022-3077/04 $5.00 Copyright © 2004 The American Physiological Society www.jn.org
Transcript of Presumed Inhibitory Neurons in the Macaque Inferior Temporal Cortex: Visual Response Properties and...

Presumed Inhibitory Neurons in the Macaque Inferior Temporal Cortex:Visual Response Properties and Functional InteractionsWith Adjacent Neurons
Hiroshi Tamura,1,2 Hidekazu Kaneko,2 Keisuke Kawasaki,1,3 and Ichiro Fujita1,3
1Graduate School of Frontier Biosciences, Osaka University, Toyonaka, Osaka, 560–8531; 2National Institute of Advanced IndustrialScience and Technology, Tsukuba, Ibaraki, 305–8566; and 3Core Research for Evolutional Science and Technology, Japan Science andTechnology Corporation, Toyonaka, Osaka, 560–8531, Japan
Submitted 29 December 2003; accepted in final form 2 January 2004
Tamura, Hiroshi, Hidekazu Kaneko, Keisuke Kawasaki, andIchiro Fujita. Presumed inhibitory neurons in the macaque inferiortemporal cortex: visual response properties and functional interactionswith adjacent neurons. J Neurophysiol 91: 2782–2796, 2004. Firstpublished January 7, 2004; 10.1152/jn.01267.2003. Neurons in areaTE of the monkey inferior temporal cortex respond selectively toimages of particular objects or their characteristic visual features. Themechanism of generation of the stimulus selectivity, however, islargely unknown. This study addresses the role of inhibitory TEneurons in this process by examining their visual response propertiesand interactions with adjacent target neurons. We applied cross-correlation analysis to spike trains simultaneously recorded from pairsof adjacent neurons in anesthetized macaques. Neurons whose activitypreceded a decrease in activity from their partner were presumed to beinhibitory neurons. Excitatory neurons were also identified as thesource neuron of excitatory linkage as evidenced by a sharp peakdisplaced from the 0-ms bin in cross-correlograms. Most inhibitoryneurons responded to a variety of visual stimuli in our stimulus set,which consisted of several dozen geometrical figures and photographsof objects, with a clear stimulus preference. On average, 10% of thestimuli increased firing rates of the inhibitory neurons. Both excitatoryand inhibitory neurons exhibited a similar degree of stimulus selec-tivity. Although inhibitory neurons occasionally shared the most pre-ferred stimuli with their target neurons, overall stimulus preferenceswere less similar between adjacent neurons with inhibitory linkagesthan adjacent neurons with common inputs and/or excitatory linkages.These results suggest that inhibitory neurons in area TE are activatedselectively and exert stimulus-specific inhibition on adjacent neurons,contributing to shaping of stimulus selectivity of TE neurons.
I N T R O D U C T I O N
Visual information regarding the shape and surface charac-teristics of objects is processed along the cortical pathwayprojecting to the inferior temporal cortex in the primate brain.Neurons in area TE of the inferior temporal cortex exhibitselectivity to shapes, and some respond preferentially to com-plex object images such as faces (Desimone et al. 1984; Grosset al. 1972; Perrett et al. 1982; Tanaka et al. 1991). TE neuronsare also selective for color, texture, and binocular disparity(Fujita 2002; Janssen et al. 2000; Komatsu et al. 1992; Sary etal. 1995; Uka et al. 2000; Wang et al. 2003). A proportion ofneurons require that these visual attributes are combined with
specific shapes to achieve maximal activation. The prestriateareas V2 and V4 and area TEO of the inferior temporal cortexalso contain a substantial population of neurons that respondmore strongly to higher-order shapes, such as crosses andhyperbolic or polar gratings than to bars, edges, or lineargratings (Gallant et al. 1993; Hegde and Van Essen 2000;Kobatake and Tanaka 1994; Pasupathy and Connor 1999). Thestimuli necessary for maximal activation of neurons in theseareas, however, are generally less complex than those thatexcite TE neurons.
The mechanism of generation of stimulus selectivity dis-played by TE neurons remains largely unknown. We haverecently shown that inhibitory neuronal interactions mediatedby the type-A receptor for �-aminobutyric acid (GABA) shapemultiple characteristics of the visual response (Wang et al.2000, 2002, 2003). Removal of this inhibition by local appli-cation of a GABAA receptor antagonist, bicuculline methio-dide, to TE neurons modulates their stimulus-selective re-sponses. Bicuculline application augments responses to a sub-set of stimuli, even unmasking responses to stimuli that do notelicit responses under normal conditions. Responses to otherstimuli, including some of the originally effective stimuli,remain unaffected.
Several types of local inhibitory circuitry can explain stim-ulus-specific effect of bicuculline. A straightforward interpre-tation is that inhibitory neurons are stimulus selective. How-ever, stimulus-specific inhibition may not entail inhibitory neu-rons with stimulus-specific responses; such inhibition canoccur if inhibitory neurons with poor stimulus tuning shuntstimulus-specific excitatory inputs. Broadband inhibition canbe mediated by stimulus-selective inhibitory neurons selectivefor different stimuli that converge onto a same target neuron.To separate these possibilities, we need to investigate theresponse properties of individual inhibitory neurons. Such astudy directly addresses if the responses of inhibitory neuronsare stimulus selective and how this stimulus selectivity isrelated to that of their target neurons.
In the present study, we identified inhibitory neurons byapplying cross-correlation analysis to extracellular spikes re-corded simultaneously from adjacent neurons. A paired neuronthe activity of which was followed by a decrease in activity ofits partner was presumed to be inhibitory. Most of the inhibi-
Address for reprint requests and other correspondence: H. Tamura, Labo-ratory for Cognitive Neuroscience, Graduate School of Frontier Biosciences,Osaka University, Toyonaka, Osaka, 560–8531, Japan (E-mail:[email protected]).
The costs of publication of this article were defrayed in part by the paymentof page charges. The article must therefore be hereby marked ‘‘advertisement’’in accordance with 18 U.S.C. Section 1734 solely to indicate this fact.
J Neurophysiol 91: 2782–2796, 2004.First published January 7, 2004; 10.1152/jn.01267.2003.
2782 0022-3077/04 $5.00 Copyright © 2004 The American Physiological Society www.jn.org

tory neurons had clear stimulus preferences. Overall the stim-ulus preferences of inhibitory neurons differed from that oftheir target neurons. The results suggest that inhibitory TEneurons are involved in shaping stimulus preferences by pro-viding stimulus-specific inhibition. Part of the present resultshas appeared in abstract form (Tamura et al. 2002).
M E T H O D S
Neuronal responses were recorded from area TE of the inferiortemporal cortex in four anesthetized monkeys (Macaca fuscata; bodyweight, 5.2–7.5 kg). All the experimental procedures were in accor-dance with the guidelines of the National Institutes of Health (1996)and the Japan Neuroscience Society. The Osaka University AnimalExperiment Committee, with a veterinarian as a committee member,approved the procedures as appropriate and conforming to the currentstandard of the animal experiment protocols.
Preparation
General experimental procedures were similar to those describedpreviously (Wang et al. 2002). Monkeys were prepared for recordingsthrough an initial aseptic surgery, which began with an injection ofatropine sulfate (0.1 mg/kg im) and ketamine hydrochloride (12mg/kg im). For 12 h before introducing anesthesia, monkeys weredeprived of food. Water was freely available. Electrocardiogram(ECG) and arterial oxygen saturation levels were continuously mon-itored throughout the surgery. The heart rate is continuously audio-monitored. Body temperature was maintained at 37–38°C. A vasotro-pic drug (Adona, Tanabe; 1.0 mg/kg im) and an anti-plasmin agent(Transamine, Dai-ichi; 17 mg/kg im) were given to minimize bleedingduring the surgery. We inserted an intravenous tube into a vein andinfused 5% glucose-saline at a speed of 25 ml/h. The infusion fluidcontained 131 Na�, 4 K�, 3 Ca2�, 110 Cl�, and 28 lactate� (mEq/l).Anesthesia was induced and maintained by pentobarbital sodium (15mg/kg iv) through the intravenous tube. Spontaneous change in theheart rate, cardiac responses, and body movements were carefullymonitored. Anesthesia was supplemented by additional injections ofpentobarbital sodium (5 mg/kg iv each) when necessary. After topicalapplication of local anesthetic (2% lidocaine), a head restraint wasattached with acrylic resin onto the top of the skull. In each monkey,only the right side of the lateral surface of the skull was exposed andcovered with resin. The right zygomatic arc was partially (�5 mm)removed to access the anterior part of area TE. An antibiotic (Pent-cilin, Sankyo; 40 mg/kg im) and an antiinflammatory/analgesic agent(Voltaren, Novartis; or Ketoprofen, Chugai Pharmaceutical) weregiven after the surgery and also during the first postoperative week.
After 1–2 wk of recovery, the eye optics were assessed to selectappropriate contact lenses allowing images to be focused on the retinaat a distance of 57 cm from the cornea. Photographs of the retinalfundus were taken to determine the position of the fovea.
Recordings
The monkeys were first injected with atropine sulfate (0.1 mg/kgim) and then ketamine hydrochloride (12 mg/kg im). After we appliedlocal anesthetic (1–5 sprays of lidocaine; 8 mg/spray) to pharynx andlarynx, an endotracheal cannula, lubricated with a coating of localanesthetic (2% lidocaine) and anti-infective/antiinflammatory(Chlomy-P ointment, Sankyo), was inserted into trachea. The animalswere held through the head restraint. No painful procedures such asusing a stereotaxic apparatus were applied for the purpose of holdingthem. The animals were then anesthetized by inhalation of 2–3%isoflurane in 70% N2O-30% O2 through the endotracheal cannula(Popilskis and Kohn 1999). ECG and arterial oxygen saturation levelswere continuously monitored throughout the experiment. The heart
rate was continuously audiomonitored. Body temperature was main-tained at 37–38°C. We infused 5% glucose-saline at a speed of 25ml/h through an intravenous tube. Atropine sulfate (0.005 mg � kg�1 �h�1, intravenous) was administered to reduce salivation. We drilled asmall hole in the skull (�5 mm), made a small slit (0.5–1 mm) in thedura, and penetrated an electrode (100 �m in the shaft diameter; seeFig. 1A) into the brain through the slit.
After the completion of surgical procedures, we carefully decreasedthe concentration of isoflurane to 0.5–1% in 70% N2O-30% O2, theminimal level at which the animals did not respond to external stimulisuch as a sudden touch to the facial skin. We also consulted previousliteratures about the dose of isoflurane for visual physiology experi-ments (Pack et al. 2001; Sato et al. 1996; Tigwell and Sauter 1992;Tsunoda et al. 2001). To immobilize eye movements for visualphysiology experiments, the animals were paralyzed with pancuro-nium bromide (0.02 mg � kg�1 � h�1, intravenous) diluted in the 5%glucose-saline. The monkeys were artificially ventilated through theendotracheal cannula at the rate of 25 strokes/min. The volume of asingle stroke of ventilation was adjusted to keep end-tidal CO2 levelbeing at 4.0–4.5% and was usually �80 ml. During the experiments,we continuously paid attention to spontaneous changes in the heartrate and cardiac responses to touches to the skin with a cotton tip byan experimenter. We increased the concentration of isoflurane if theheart rate increased �10% on touching the skin (Sato et al. 1996).Under this anesthetic condition, the heart rate was maintained at142 � 20 (SD) beats/min. Arterial oxygen saturation level was always�95% and was 99% on average. These physiological parameters, i.e.,heart rate, body-temperature, end-tidal CO2, and arterial oxygen sat-uration level were comparable to the ones reported in functionalbrain-imaging studies using anesthetized monkeys (Logothetis et al.1999). We did not observe any signs of arrhythmia or edema, whichmay be induced by an imbalance of electrolyte or blood volume. Wealso watched urination.
The anesthetic protocol described in the preceding text decreasedthe firing rates of neurons in area TE; the maximum firing rate of ourneurons recorded from anesthetized animals [11.5 � 12.3 (SD)spikes/s] was substantially lower than that of neurons recorded fromalert animals (35.0 � 27.9 spikes/s, mean) (awake animals of Tamuraand Tanaka 2001). However, other properties such as stimulus selec-tivity have been shown to be largely preserved in anesthetized animals(Rodman et al. 1991; Kato et al. 1999; Tamura and Tanaka 2001).
The pupils were dilated and the lenses were relaxed by the localapplication of 0.5% tropicamide-0.5% phenylephrine. Corneas werecovered with preselected contact lenses, which had artificial pupils of3 mm diam. They prevented eyes from drying. Further, we irrigatedeyes every 20–60 min with saline.
Multiple single-unit recordings were made from area TE using asingle-shaft electrode with seven recording probes (Fig. 1A; Heptode;Thomas, Germany). Due to the technical details of our custom-madesoftware, we used six of the seven probes, including the tip probe, forrecording. The impedance of each probe was 1–2 M� at 1 kHz. Theelectrode was advanced with a manipulator (Narishige, Tokyo) fromthe side to the cortical surface. Recorded potentials were amplified10,000 times, band-pass filtered (500 Hz to 3 kHz), and digitized at a50-�s resolution, then stored on a computer for later analysis. Usingthe electrode, the action potentials (“spikes”) generated by a singleneuron were recorded by some or all of the six recording probessimultaneously with different amplitudes and waveforms. Each indi-vidual probe could record spikes from multiple neurons. The isolationand classification of single neuronal activity are described in thefollowing text. Recordings were made at intervals of �300 �m alonga penetration axis so as not to sample the same neurons at successivesites. The sampling diameter of each probe was estimated at 150 �m(Kaneko et al. 1998). All neurons encountered were recorded andanalyzed. At the end of a recording session in each penetration, two orthree small electrolytic lesions were made by passing a cathodal
2783INHIBITORY NEURONS IN MACAQUE IT
J Neurophysiol • VOL 91 • JUNE 2004 • www.jn.org

current of 10 �A through the electrode tip for 10 s to allow laterhistological verification of the recording sites.
Each recording session lasted for 10–15 h after which the hole inthe skull was cleaned and filled with resin. We washed eyes withsaline and administrated a drop of antibiotics (Tarivid ophthalmicsolution, Santen, 3 mg/ml) and a drop of vitamin B2 (Flavitan eyedrops, Yamanouchi, 0.5 mg/ml). Within 20–30 min after the termi-nation of muscle relaxant infusion, spontaneous respiration resumedand returned to normal, aided by an injection of neostigmine meth-ylsulfate (Vagostigmine, Shionogi; 0.1 mg/kg im). Monkeys werereturned to their home cages after antibiotic injection (Pentcilin,Sankyo; 40 mg/kg im).
Visual stimuli
The stimulus set used routinely consisted of 64 visual stimuli (Fig.1B, stimulus set), 53 two-dimensional geometrical shapes (circles,squares, triangles, bars, stars, gradation patterns, gratings, etc.) and 11photographs of natural or man-made objects (banana, apple, monkeyface, human face, cage, hand, syringe, etc.). Images were �4° invisual angle and were encoded in 256 gray levels. The luminances ofwhite and black were 99.2 and 0.7 cd/m2, respectively. If none of the64 stimuli activated multiple-unit activities recorded from the tipprobe during the initial survey, we searched for effective visualstimuli by presenting a collection of objects, including laboratoryitems and plastic or stuffed toys of animals and plants. We then addedthese effective images to the routine set (Fig. 1B, supplementarystimuli). These stimuli were encoded in 24-bit color depth. On aver-age, 68 stimuli (64 routine and 4 supplementary stimuli) were pre-sented to the animals for each recording site. The maximum responsemagnitude and “signal” correlation (see following text for definition)did not differ among neurons presented with a different number ofstimuli (P � 0.05, Mann-Whitney’s U test).
Visual stimuli were presented individually for 1 s against a homo-geneous gray background (15.7 cd/m2) at the center of the receptivefield hand-plotted for each recording site by referring to audiomoni-tored multiple-unit activities recorded from the tip probe. The samehomogeneous gray field was presented during the 1-s intervals be-tween presentations of stimuli. The stimuli were presented in a pseu-dorandom order within a stimulus presentation block. Ten blocks werepresented for each recording site.
Isolation and classification of spikes
Isolation and classification of spikes from recorded signals werecarried out by an automatic method described previously (Kaneko etal. 1999). Spikes in the recorded signal were detected by matchingwith a template spike. The covariance value between the templatespike and a detected spike was then calculated for each of the sixrecording probes. The six-covariance values were vectorized andanalyzed by hierarchical clustering using a multidimensional statisti-cal test (Lance and Williams 1967). A cluster of covariance values insix-dimensional space corresponds to spikes from a single neuron;different neurons yielded different clusters. The following procedureswere taken to minimize possible errors in single-unit isolation(Kaneko et al. 1999). Errors due to partially overlapping spikes wereminimized by successively subtracting the preceding spikes from rawsignal to recover the shape of subsequent spikes. Clustering errors dueto bursts of progressively smaller spikes were avoided by detectingsuch bursts, then using only the first spike in each burst for clustering.After assigning the first spike to a particular neuron, the remainingspikes in the burst were assigned to the same neuron.
For the purposes of this study, the multiprobe recording techniquehas several advantages over conventional single-probe recording tech-niques. First, it allows us to reliably isolate and analyze low-amplitudespikes from inhibitory neurons, which generally have small dendritic
FIG. 1. Electrode, stimulus images, and recording site. A: the electrode (Heptode; Thomas, Germany) has 7 recording probes.One probe is at the tip; the other 6 surround the electrode at a distance of 60 �m from the tip. B: the top 64 images constitute thepredetermined stimulus set routinely used for every neuron, whereas the lower 10 images are examples of supplementary stimuliused for neurons unresponsive to the routine set. C: the shaded area on the lateral view of the right cerebral hemisphere indicatesthe overall recording site in all animals. The area corresponds to the dorsal part of area TE. amts, anterior middle temporal sulcus;ios, inferior occipital sulcus; pmts, posterior middle temporal sulcus; sts, superior temporal sulcus. A5 and A20 indicate levels 5and 20 mm anterior to the ear canal.
2784 H. TAMURA, H. KANEKO, K. KAWASAKI, AND I. FUJITA
J Neurophysiol • VOL 91 • JUNE 2004 • www.jn.org
arbors. Second, the technique also enables recording from a singleneuron for long durations, thereby increasing the number of recordedspikes and allowing sensitive detection of inhibitory connectionsbetween pairs of neurons by cross-correlation analysis (see followingtext; Aertsen and Gerstein 1985). These two advantages increase thelikelihood that inhibitory neurons are reliably recorded.
Analysis of visual responses
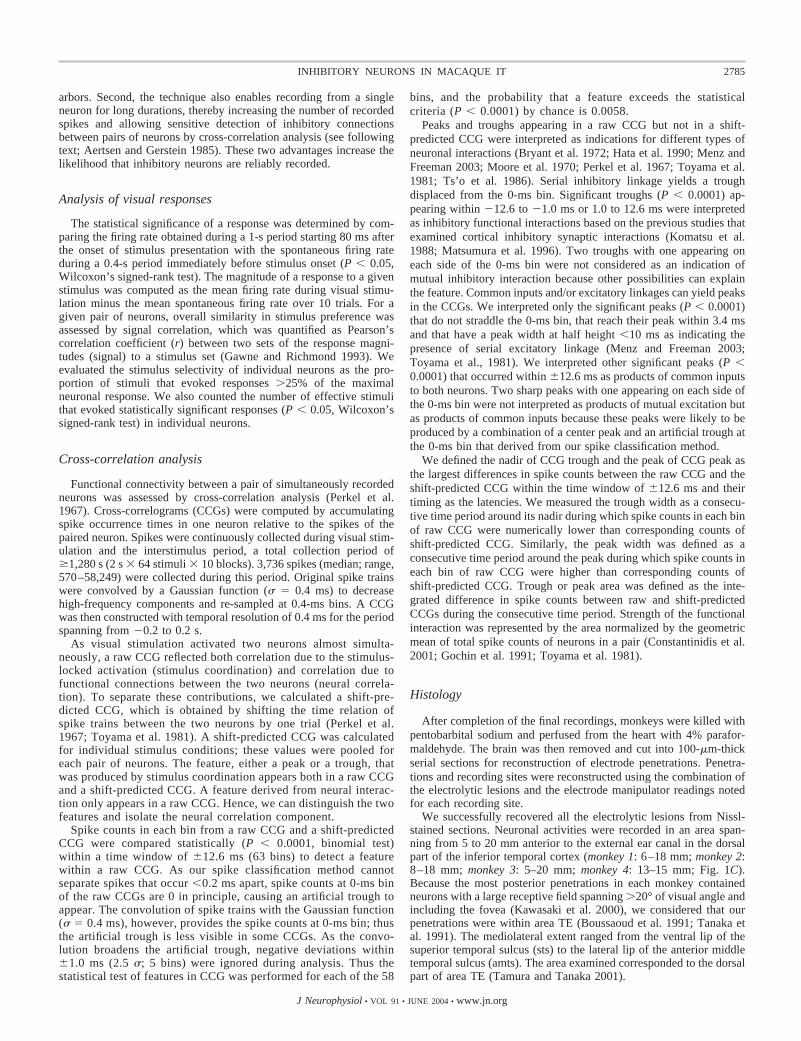
The statistical significance of a response was determined by com-paring the firing rate obtained during a 1-s period starting 80 ms afterthe onset of stimulus presentation with the spontaneous firing rateduring a 0.4-s period immediately before stimulus onset (P � 0.05,Wilcoxon’s signed-rank test). The magnitude of a response to a givenstimulus was computed as the mean firing rate during visual stimu-lation minus the mean spontaneous firing rate over 10 trials. For agiven pair of neurons, overall similarity in stimulus preference wasassessed by signal correlation, which was quantified as Pearson’scorrelation coefficient (r) between two sets of the response magni-tudes (signal) to a stimulus set (Gawne and Richmond 1993). Weevaluated the stimulus selectivity of individual neurons as the pro-portion of stimuli that evoked responses �25% of the maximalneuronal response. We also counted the number of effective stimulithat evoked statistically significant responses (P � 0.05, Wilcoxon’ssigned-rank test) in individual neurons.
Cross-correlation analysis
Functional connectivity between a pair of simultaneously recordedneurons was assessed by cross-correlation analysis (Perkel et al.1967). Cross-correlograms (CCGs) were computed by accumulatingspike occurrence times in one neuron relative to the spikes of thepaired neuron. Spikes were continuously collected during visual stim-ulation and the interstimulus period, a total collection period of�1,280 s (2 s � 64 stimuli � 10 blocks). 3,736 spikes (median; range,570–58,249) were collected during this period. Original spike trainswere convolved by a Gaussian function (� 0.4 ms) to decreasehigh-frequency components and re-sampled at 0.4-ms bins. A CCGwas then constructed with temporal resolution of 0.4 ms for the periodspanning from �0.2 to 0.2 s.
As visual stimulation activated two neurons almost simulta-neously, a raw CCG reflected both correlation due to the stimulus-locked activation (stimulus coordination) and correlation due tofunctional connections between the two neurons (neural correla-tion). To separate these contributions, we calculated a shift-pre-dicted CCG, which is obtained by shifting the time relation ofspike trains between the two neurons by one trial (Perkel et al.1967; Toyama et al. 1981). A shift-predicted CCG was calculatedfor individual stimulus conditions; these values were pooled foreach pair of neurons. The feature, either a peak or a trough, thatwas produced by stimulus coordination appears both in a raw CCGand a shift-predicted CCG. A feature derived from neural interac-tion only appears in a raw CCG. Hence, we can distinguish the twofeatures and isolate the neural correlation component.
Spike counts in each bin from a raw CCG and a shift-predictedCCG were compared statistically (P � 0.0001, binomial test)within a time window of �12.6 ms (63 bins) to detect a featurewithin a raw CCG. As our spike classification method cannotseparate spikes that occur �0.2 ms apart, spike counts at 0-ms binof the raw CCGs are 0 in principle, causing an artificial trough toappear. The convolution of spike trains with the Gaussian function(� 0.4 ms), however, provides the spike counts at 0-ms bin; thusthe artificial trough is less visible in some CCGs. As the convo-lution broadens the artificial trough, negative deviations within�1.0 ms (2.5 �; 5 bins) were ignored during analysis. Thus thestatistical test of features in CCG was performed for each of the 58
bins, and the probability that a feature exceeds the statisticalcriteria (P � 0.0001) by chance is 0.0058.
Peaks and troughs appearing in a raw CCG but not in a shift-predicted CCG were interpreted as indications for different types ofneuronal interactions (Bryant et al. 1972; Hata et al. 1990; Menz andFreeman 2003; Moore et al. 1970; Perkel et al. 1967; Toyama et al.1981; Ts’o et al. 1986). Serial inhibitory linkage yields a troughdisplaced from the 0-ms bin. Significant troughs (P � 0.0001) ap-pearing within �12.6 to �1.0 ms or 1.0 to 12.6 ms were interpretedas inhibitory functional interactions based on the previous studies thatexamined cortical inhibitory synaptic interactions (Komatsu et al.1988; Matsumura et al. 1996). Two troughs with one appearing oneach side of the 0-ms bin were not considered as an indication ofmutual inhibitory interaction because other possibilities can explainthe feature. Common inputs and/or excitatory linkages can yield peaksin the CCGs. We interpreted only the significant peaks (P � 0.0001)that do not straddle the 0-ms bin, that reach their peak within 3.4 msand that have a peak width at half height �10 ms as indicating thepresence of serial excitatory linkage (Menz and Freeman 2003;Toyama et al., 1981). We interpreted other significant peaks (P �0.0001) that occurred within �12.6 ms as products of common inputsto both neurons. Two sharp peaks with one appearing on each side ofthe 0-ms bin were not interpreted as products of mutual excitation butas products of common inputs because these peaks were likely to beproduced by a combination of a center peak and an artificial trough atthe 0-ms bin that derived from our spike classification method.
We defined the nadir of CCG trough and the peak of CCG peak asthe largest differences in spike counts between the raw CCG and theshift-predicted CCG within the time window of �12.6 ms and theirtiming as the latencies. We measured the trough width as a consecu-tive time period around its nadir during which spike counts in each binof raw CCG were numerically lower than corresponding counts ofshift-predicted CCG. Similarly, the peak width was defined as aconsecutive time period around the peak during which spike counts ineach bin of raw CCG were higher than corresponding counts ofshift-predicted CCG. Trough or peak area was defined as the inte-grated difference in spike counts between raw and shift-predictedCCGs during the consecutive time period. Strength of the functionalinteraction was represented by the area normalized by the geometricmean of total spike counts of neurons in a pair (Constantinidis et al.2001; Gochin et al. 1991; Toyama et al. 1981).
Histology
After completion of the final recordings, monkeys were killed withpentobarbital sodium and perfused from the heart with 4% parafor-maldehyde. The brain was then removed and cut into 100-�m-thickserial sections for reconstruction of electrode penetrations. Penetra-tions and recording sites were reconstructed using the combination ofthe electrolytic lesions and the electrode manipulator readings notedfor each recording site.
We successfully recovered all the electrolytic lesions from Nissl-stained sections. Neuronal activities were recorded in an area span-ning from 5 to 20 mm anterior to the external ear canal in the dorsalpart of the inferior temporal cortex (monkey 1: 6–18 mm; monkey 2:8–18 mm; monkey 3: 5–20 mm; monkey 4: 13–15 mm; Fig. 1C).Because the most posterior penetrations in each monkey containedneurons with a large receptive field spanning �20° of visual angle andincluding the fovea (Kawasaki et al. 2000), we considered that ourpenetrations were within area TE (Boussaoud et al. 1991; Tanaka etal. 1991). The mediolateral extent ranged from the ventral lip of thesuperior temporal sulcus (sts) to the lateral lip of the anterior middletemporal sulcus (amts). The area examined corresponded to the dorsalpart of area TE (Tamura and Tanaka 2001).
2785INHIBITORY NEURONS IN MACAQUE IT
J Neurophysiol • VOL 91 • JUNE 2004 • www.jn.org
R E S U L T S
We analyzed 1,028 neuron pairs obtained from 455 neuronsat 103 sites in area TE of four monkeys. Two to 12 neurons(median 4) were isolated at a single recording site. If threeor more neurons were isolated from a single recording site,neurons were analyzed as multiple neuron pairs.
Functional properties of presumed inhibitory neurons
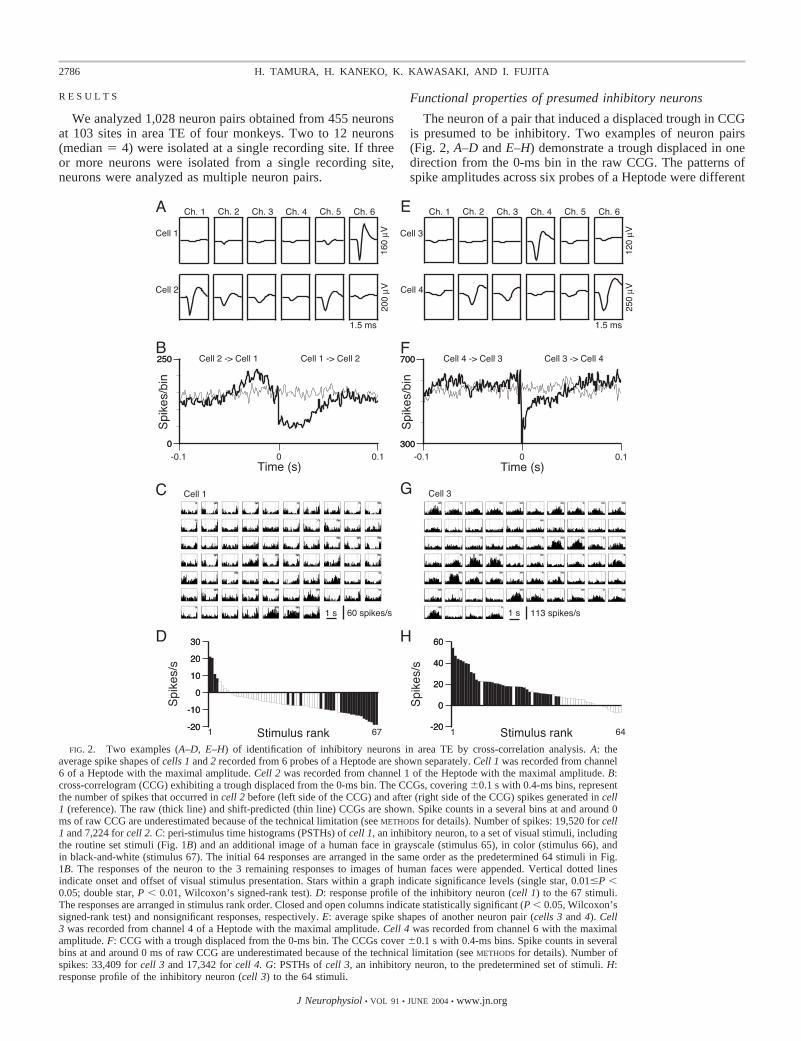
The neuron of a pair that induced a displaced trough in CCGis presumed to be inhibitory. Two examples of neuron pairs(Fig. 2, A–D and E–H) demonstrate a trough displaced in onedirection from the 0-ms bin in the raw CCG. The patterns ofspike amplitudes across six probes of a Heptode were different
FIG. 2. Two examples (A–D, E–H) of identification of inhibitory neurons in area TE by cross-correlation analysis. A: theaverage spike shapes of cells 1 and 2 recorded from 6 probes of a Heptode are shown separately. Cell 1 was recorded from channel6 of a Heptode with the maximal amplitude. Cell 2 was recorded from channel 1 of the Heptode with the maximal amplitude. B:cross-correlogram (CCG) exhibiting a trough displaced from the 0-ms bin. The CCGs, covering �0.1 s with 0.4-ms bins, representthe number of spikes that occurred in cell 2 before (left side of the CCG) and after (right side of the CCG) spikes generated in cell1 (reference). The raw (thick line) and shift-predicted (thin line) CCGs are shown. Spike counts in a several bins at and around 0ms of raw CCG are underestimated because of the technical limitation (see METHODS for details). Number of spikes: 19,520 for cell1 and 7,224 for cell 2. C: peri-stimulus time histograms (PSTHs) of cell 1, an inhibitory neuron, to a set of visual stimuli, includingthe routine set stimuli (Fig. 1B) and an additional image of a human face in grayscale (stimulus 65), in color (stimulus 66), andin black-and-white (stimulus 67). The initial 64 responses are arranged in the same order as the predetermined 64 stimuli in Fig.1B. The responses of the neuron to the 3 remaining responses to images of human faces were appended. Vertical dotted linesindicate onset and offset of visual stimulus presentation. Stars within a graph indicate significance levels (single star, 0.01�P �0.05; double star, P � 0.01, Wilcoxon’s signed-rank test). D: response profile of the inhibitory neuron (cell 1) to the 67 stimuli.The responses are arranged in stimulus rank order. Closed and open columns indicate statistically significant (P � 0.05, Wilcoxon’ssigned-rank test) and nonsignificant responses, respectively. E: average spike shapes of another neuron pair (cells 3 and 4). Cell3 was recorded from channel 4 of a Heptode with the maximal amplitude. Cell 4 was recorded from channel 6 with the maximalamplitude. F: CCG with a trough displaced from the 0-ms bin. The CCGs cover �0.1 s with 0.4-ms bins. Spike counts in severalbins at and around 0 ms of raw CCG are underestimated because of the technical limitation (see METHODS for details). Number ofspikes: 33,409 for cell 3 and 17,342 for cell 4. G: PSTHs of cell 3, an inhibitory neuron, to the predetermined set of stimuli. H:response profile of the inhibitory neuron (cell 3) to the 64 stimuli.
2786 H. TAMURA, H. KANEKO, K. KAWASAKI, AND I. FUJITA
J Neurophysiol • VOL 91 • JUNE 2004 • www.jn.org
between the two neurons in a pair, thus discriminating each ofthe neurons (Fig. 2, A and E). In the neuronal pair displayed inFig. 2, A–D, the trough in the raw CCG (thick line) displacedtoward the positive direction from the 0-ms bin (Fig. 2B). Thistrough was not observed in the shift-predicted CCG (thin line),indicating an inhibitory influence of the reference cell (cell 1)on the other cell (cell 2). The trough persisted for 60 ms. Thepeak appearing on the left side of the raw CCG may be causedby either a primary synaptic effect, such as an excitatorylinkage from cell 2 to cell 1 and/or common inputs to bothneurons or a secondary effect. Possible secondary effects couldinclude presynaptic dead time (Bryant et al. 1972) in which,just before the firing of an inhibitory neuron, the inhibitoryneuron cannot fire due to the refractory period, leading toincreased excitability of the target neuron. From this CCG,therefore we identified cell 1 as an inhibitory neuron, but thenature of cell 2 was unclear.
The spike amplitude, measured from the base line to the initialnegative nadir, was 91.4 �V (Fig. 2A, cell 1). The spike width,measured from the initial negative nadir to the subsequent positivepeak, was 252 �s for the inhibitory neuron (Fig. 2A, cell 1). Thespontaneous firing rate of the inhibitory neuron was 16.7 spikes/sduring the 0.4-s period immediately prior to stimulus onset. Themaximum response amplitude, defined as the largest change infiring rate from the spontaneous activity, was 21.3 spikes/s. Fourof the 67 stimuli tested increased the firing rate of the inhibitoryneuron, whereas 23 stimuli decreased it (P � 0.05, Wilcoxon’ssigned-rank test; Fig. 2, C and D). The proportion of stimuli thatevoked responses �25% of the maximal response of the inhibi-tory neuron was 0.07 (5 of 67 stimuli, Fig. 2D). Cell 2 had spikeamplitude of 72.1 �V and spike width of 482 �s (Fig. 2A, cell 2).Visual responses of the target neuron (cell 2) will be described inthe following text.
Another inhibitory neuron (cell 3, Fig. 2, right) exhibitedbroader stimulus selectivity than cell 1. The trough displacedtoward the positive direction from the 0-ms bin (Fig. 2F)indicates an inhibitory influence of the reference cell (cell 3) onthe other cell (cell 4); the reference cell was presumed to be aninhibitory neuron. The spike amplitude and spike width of theinhibitory neuron were 52.5 �V and 380 �s, respectively (Fig.2E), and the spontaneous firing rate was 18.9 spikes/s. Themaximum response amplitude of the inhibitory neuron was54.2 spikes/s. Thirty-seven of the 64 stimuli increased thefiring rate of this neuron, whereas none of the stimuli decreasedit (P � 0.05, Wilcoxon’s signed-rank test; Fig. 2G). Theproportion of stimuli that evoked responses �25% of themaximal response of the neuron was 0.45 (29 of 64 stimuli,Fig. 2H). Cell 4 had spike amplitude of 103.0 �V and spikewidth of 621 �s (Fig. 2A, cell 2).
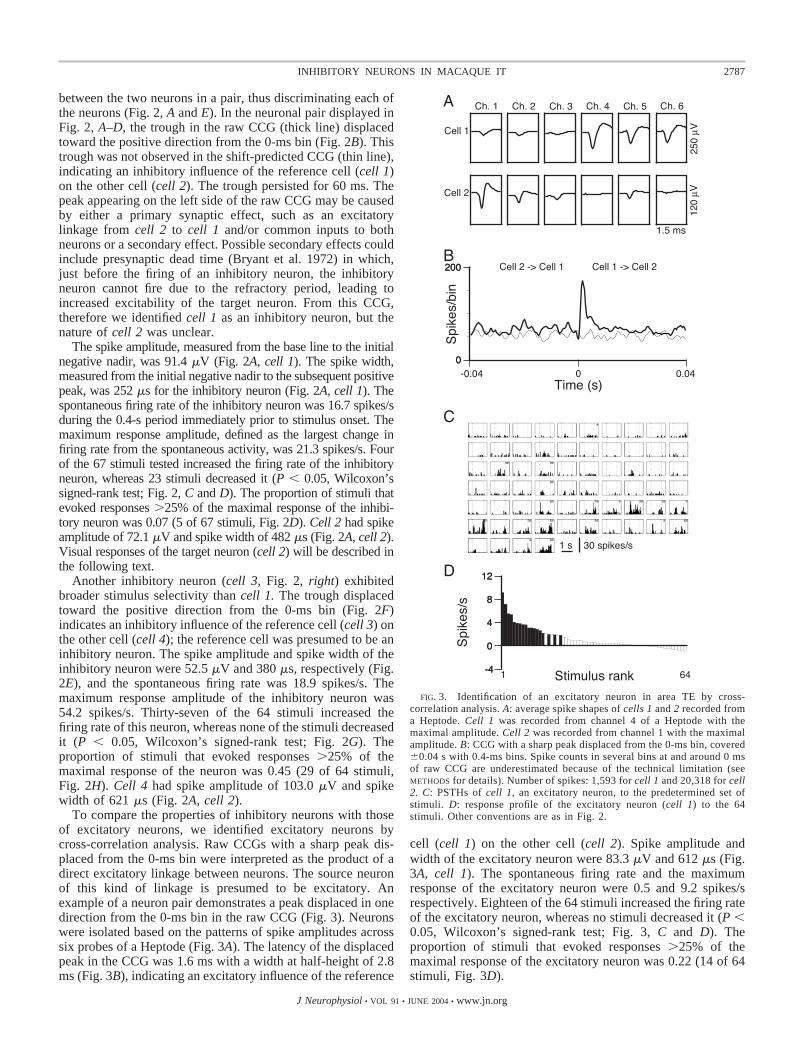
To compare the properties of inhibitory neurons with thoseof excitatory neurons, we identified excitatory neurons bycross-correlation analysis. Raw CCGs with a sharp peak dis-placed from the 0-ms bin were interpreted as the product of adirect excitatory linkage between neurons. The source neuronof this kind of linkage is presumed to be excitatory. Anexample of a neuron pair demonstrates a peak displaced in onedirection from the 0-ms bin in the raw CCG (Fig. 3). Neuronswere isolated based on the patterns of spike amplitudes acrosssix probes of a Heptode (Fig. 3A). The latency of the displacedpeak in the CCG was 1.6 ms with a width at half-height of 2.8ms (Fig. 3B), indicating an excitatory influence of the reference
cell (cell 1) on the other cell (cell 2). Spike amplitude andwidth of the excitatory neuron were 83.3 �V and 612 �s (Fig.3A, cell 1). The spontaneous firing rate and the maximumresponse of the excitatory neuron were 0.5 and 9.2 spikes/srespectively. Eighteen of the 64 stimuli increased the firing rateof the excitatory neuron, whereas no stimuli decreased it (P �0.05, Wilcoxon’s signed-rank test; Fig. 3, C and D). Theproportion of stimuli that evoked responses �25% of themaximal response of the excitatory neuron was 0.22 (14 of 64stimuli, Fig. 3D).
FIG. 3. Identification of an excitatory neuron in area TE by cross-correlation analysis. A: average spike shapes of cells 1 and 2 recorded froma Heptode. Cell 1 was recorded from channel 4 of a Heptode with themaximal amplitude. Cell 2 was recorded from channel 1 with the maximalamplitude. B: CCG with a sharp peak displaced from the 0-ms bin, covered�0.04 s with 0.4-ms bins. Spike counts in several bins at and around 0 msof raw CCG are underestimated because of the technical limitation (seeMETHODS for details). Number of spikes: 1,593 for cell 1 and 20,318 for cell2. C: PSTHs of cell 1, an excitatory neuron, to the predetermined set ofstimuli. D: response profile of the excitatory neuron (cell 1) to the 64stimuli. Other conventions are as in Fig. 2.
2787INHIBITORY NEURONS IN MACAQUE IT
J Neurophysiol • VOL 91 • JUNE 2004 • www.jn.org

Among the 1,028 neuron pairs examined by cross-correla-tion analysis, a large number of pairs (397) exhibited a peakstraddling the 0-ms bin. These common-input pairs may alsoinvolve direct excitatory and/or inhibitory linkages between theneurons, although the presence of common-input peaks ob-scured the features derived from these direct interactions. Wemainly focused our analysis on 56 pairs with a displacedtrough, and 20 pairs with a sharp displaced peak withoutstraddling the 0-ms bin in the raw CCGs (see METHODS for thecriteria). A low incidence of purely serial excitatory linkages iscommon in previous cross-correlation studies (Constantinidiset al. 2001; Hata et al. 1990; Toyama et al. 1981; Ts’o et al.1986; see DISCUSSION). From the present analysis, 49 of the 455neurons were presumed to be inhibitory, 19 were presumed tobe excitatory; the remaining 387 neurons were not classified.The total number of identified neurons (68) was smaller thanthe number of serial linkage pairs (76) because some neuronswere involved in multiple pairings. We never observed a casewhere a single neuron provided excitation for a target neuronand inhibition for another. The incidences of inhibitory andexcitatory neurons were not different along the anterior-poste-rior axis in the inferior temporal cortex (P 0.120, �2 test).
The incidence of inhibitory neurons responding by increas-ing their firing rate to at least one of the stimuli (46/49) did notdiffer from that of excitatory neurons (16/19; P 0.210, �2
test). Likewise the incidence of inhibitory neurons decreasingtheir firing rate in response to at least one of the stimuli (24/49)did not differ from that of excitatory neurons (9/19; P 0.560,�2 test).
Analysis of population data indicates that inhibitory neuronswere as stimulus selective as excitatory neurons (Fig. 4). Thestimulus selectivity of individual neurons was evaluated bythree measures: the proportion of stimuli that evoked responses�25% of the maximal neuronal response, the proportion ofstimuli that increased the firing above the spontaneous firingrate (P � 0.05, Wilcoxon’s signed-rank test), and the propor-tion of stimuli that decreased firing below the spontaneousfiring rate (P � 0.05, Wilcoxon’s signed-rank test). The me-dian of the proportion of stimuli that evoked responses �25%of the maximal response was 0.21 for inhibitory neurons and0.23 for excitatory neurons. The medians of the proportions ofstimuli increasing the firing rates of inhibitory and excitatoryneurons were 0.10 and 0.21, respectively. The medians of the
proportion of stimuli that decreased firing rates in inhibitoryand excitatory neurons were both 0.04. By these three mea-sures, there were no differences between inhibitory and exci-tatory neurons (P � 0.05, Mann-Whitney’s U test) except forthe proportion of stimuli increasing the firing rate (P 0.033,U test). Thus we concluded that the difference in the degree ofstimulus selectivity between inhibitory and excitatory neuronswas small, if any.
Although many of the properties of these cells were similar,some physiological properties differed between the 49 inhibi-tory and 19 excitatory neurons (Table 1). No difference wasfound in the spike amplitude between inhibitory neurons(102.4 � 46.8 �V) and excitatory neurons (98.3 � 55.3 �V;P 0.408, U test). On average, inhibitory neurons exhibited ashorter spike width [492.6 � 92.1 (SD) �s] than excitatoryneurons (539.4 � 89.4 �s; P 0.040, U test), although therewas a large overlap. The spontaneous firing rate of inhibitoryneurons [7.4 � 7.2 (SD) spikes/s] was higher than that ofexcitatory neurons (4.5 � 5.3 spikes/s; P 0.027, U test).Spontaneous firing rates of the identified and the other neuronswere plotted against spike widths to see the distributions ofidentified neurons among the entire sample (Fig. 5) (Constan-tinidis and Goldman-Rakic 2002). The frequency distributionof spike width of all the 455 neurons was bimodal with a diplocated �400 �s. Sixteen percent of the 455 neurons had spikewidth �400 �s and might correspond to fast-spiking neurons.Of the 49 inhibitory neurons, 8 had spike width �400 �s, andthey had spontaneous firing rates �4 spikes/s (14.0 � 11.3spikes/s). Only one of the identified excitatory neurons had aspike width �400 �s (349.5 �s), but its spontaneous firing ratewas low (2 spikes/s; Fig. 5). The maximal visual response ofinhibitory neurons (12.1 � 11.6 spikes/s), however, did notdiffer from that of excitatory neurons (Table 1; 10.6 � 7.7spikes/s; P 0.897, U test). Also, the occurrence in inhibitoryneurons of the burst discharge, defined as the occurrence ofmore than one spikes within 1.5- to 10-ms intervals, was notdifferent from that of excitatory neurons (P 0.822, U test).
The spike width and each of the three measures of stimulusselectivity did not correlate in inhibitory neurons (r �0.17 to0.03, P � 0.05). The spike width, however, correlated in-versely with the spontaneous firing rate (r �0.35, P 0.014; see Fig. 5) and the maximal response (r �0.47, P 0.001). Inhibitory neurons with shorter spike widths tended to
FIG. 4. Comparison of stimulusselectivity between inhibitory andexcitatory neurons. The proportionof stimuli that evoked responses�25% of the maximal neuronal re-sponse (left), the proportion of stim-uli that increased firing rates fromspontaneous firing rates in individ-ual neurons (middle), and the pro-portion of stimuli that decreased fir-ing rates from spontaneous firingrates in individual neurons (right)were compared between inhibitory(top) and excitatory (bottom) neu-rons. Histograms demonstrated thefrequency distributions of thesepopulations of neurons.
2788 H. TAMURA, H. KANEKO, K. KAWASAKI, AND I. FUJITA
J Neurophysiol • VOL 91 • JUNE 2004 • www.jn.org
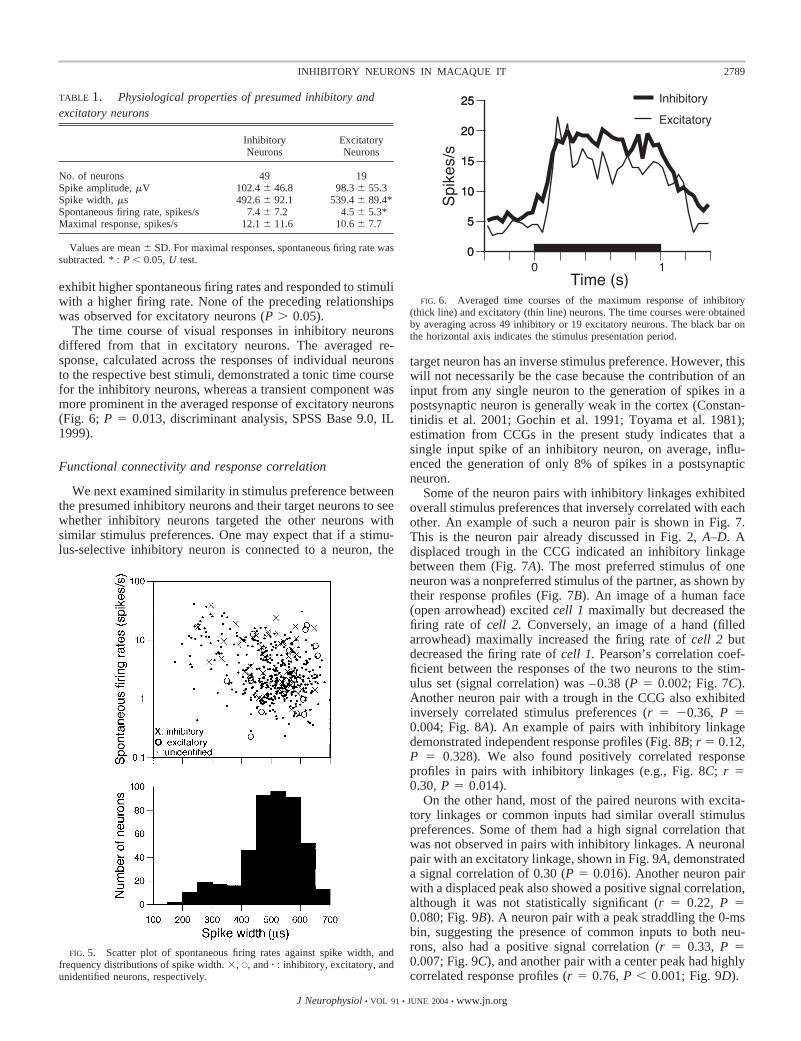
exhibit higher spontaneous firing rates and responded to stimuliwith a higher firing rate. None of the preceding relationshipswas observed for excitatory neurons (P � 0.05).
The time course of visual responses in inhibitory neuronsdiffered from that in excitatory neurons. The averaged re-sponse, calculated across the responses of individual neuronsto the respective best stimuli, demonstrated a tonic time coursefor the inhibitory neurons, whereas a transient component wasmore prominent in the averaged response of excitatory neurons(Fig. 6; P 0.013, discriminant analysis, SPSS Base 9.0, IL1999).
Functional connectivity and response correlation
We next examined similarity in stimulus preference betweenthe presumed inhibitory neurons and their target neurons to seewhether inhibitory neurons targeted the other neurons withsimilar stimulus preferences. One may expect that if a stimu-lus-selective inhibitory neuron is connected to a neuron, the
target neuron has an inverse stimulus preference. However, thiswill not necessarily be the case because the contribution of aninput from any single neuron to the generation of spikes in apostsynaptic neuron is generally weak in the cortex (Constan-tinidis et al. 2001; Gochin et al. 1991; Toyama et al. 1981);estimation from CCGs in the present study indicates that asingle input spike of an inhibitory neuron, on average, influ-enced the generation of only 8% of spikes in a postsynapticneuron.
Some of the neuron pairs with inhibitory linkages exhibitedoverall stimulus preferences that inversely correlated with eachother. An example of such a neuron pair is shown in Fig. 7.This is the neuron pair already discussed in Fig. 2, A–D. Adisplaced trough in the CCG indicated an inhibitory linkagebetween them (Fig. 7A). The most preferred stimulus of oneneuron was a nonpreferred stimulus of the partner, as shown bytheir response profiles (Fig. 7B). An image of a human face(open arrowhead) excited cell 1 maximally but decreased thefiring rate of cell 2. Conversely, an image of a hand (filledarrowhead) maximally increased the firing rate of cell 2 butdecreased the firing rate of cell 1. Pearson’s correlation coef-ficient between the responses of the two neurons to the stim-ulus set (signal correlation) was –0.38 (P 0.002; Fig. 7C).Another neuron pair with a trough in the CCG also exhibitedinversely correlated stimulus preferences (r �0.36, P 0.004; Fig. 8A). An example of pairs with inhibitory linkagedemonstrated independent response profiles (Fig. 8B; r 0.12,P 0.328). We also found positively correlated responseprofiles in pairs with inhibitory linkages (e.g., Fig. 8C; r 0.30, P 0.014).
On the other hand, most of the paired neurons with excita-tory linkages or common inputs had similar overall stimuluspreferences. Some of them had a high signal correlation thatwas not observed in pairs with inhibitory linkages. A neuronalpair with an excitatory linkage, shown in Fig. 9A, demonstrateda signal correlation of 0.30 (P 0.016). Another neuron pairwith a displaced peak also showed a positive signal correlation,although it was not statistically significant (r 0.22, P 0.080; Fig. 9B). A neuron pair with a peak straddling the 0-msbin, suggesting the presence of common inputs to both neu-rons, also had a positive signal correlation (r 0.33, P 0.007; Fig. 9C), and another pair with a center peak had highlycorrelated response profiles (r 0.76, P � 0.001; Fig. 9D).
TABLE 1. Physiological properties of presumed inhibitory andexcitatory neurons
InhibitoryNeurons
ExcitatoryNeurons
No. of neurons 49 19Spike amplitude, �V 102.4 � 46.8 98.3 � 55.3Spike width, �s 492.6 � 92.1 539.4 � 89.4*Spontaneous firing rate, spikes/s 7.4 � 7.2 4.5 � 5.3*Maximal response, spikes/s 12.1 � 11.6 10.6 � 7.7
Values are mean � SD. For maximal responses, spontaneous firing rate wassubtracted. * : P � 0.05, U test.
FIG. 5. Scatter plot of spontaneous firing rates against spike width, andfrequency distributions of spike width. �, E, and � : inhibitory, excitatory, andunidentified neurons, respectively.
FIG. 6. Averaged time courses of the maximum response of inhibitory(thick line) and excitatory (thin line) neurons. The time courses were obtainedby averaging across 49 inhibitory or 19 excitatory neurons. The black bar onthe horizontal axis indicates the stimulus presentation period.
2789INHIBITORY NEURONS IN MACAQUE IT
J Neurophysiol • VOL 91 • JUNE 2004 • www.jn.org

Analysis of all of the samples indicated that neuron pairswith different functional interactions had different degrees ofstimulus preference similarities between neurons in a pair. Weclassified these pairs into three types according to the featuresof the raw CCGs; neuron pairs with a trough displaced from the0-ms bin with or without an accompanying peak (inhibitory-linkage pairs, n 56), neuron pairs with a sharp peak dis-placed from the 0-ms bin without a trough (excitatory-linkagepairs, n 20), and neuron pairs with a peak straddling the0-ms bin without a trough (common-input pairs, n 397). Theaverage coefficients of signal correlation for pairs with inhib-itory linkages, excitatory linkages, and common inputs were�0.04 � 0.22, 0.24 � 0.25, and 0.18 � 0.22 (means � SD),respectively. The frequency distributions of the signal correla-tion differed among the three types of neuron pairs (P � 0.001,Kruskal Wallis test; Fig. 10). Sixteen percent of the pairs with
inhibitory linkages had a significantly (P � 0.05) negativesignal correlation, and none of the pairs with excitatory link-ages and only a small fraction of pairs with common inputs(2%) had significantly negative signal correlation. On the otherhand, significant (P � 0.05) positive signal correlation wasobserved in 11, 40, and 37% of inhibitory-linkage pairs, exci-tatory-linkage pairs, and common-input pairs, respectively.Thus the incidence of negatively correlated or independentoverall stimulus preferences was higher for pairs with theinhibitory linkages than those with excitatory linkages or com-mon inputs.
Although the overall distribution of signal correlations dif-fered among pairs with differing CCG types, each type had avariety of degrees in their signal correlation. We then investi-gated possible relationship between the strength of the func-tional interaction and the degree of signal correlation in eachCCG type. To examine the strength of the functional interac-tion between neurons, we quantitated the peak or trough area(Constantinidis et al. 2001; Gochin et al. 1991; Toyama et al.1981). This was measured in a CCG obtained by subtractingthe shift-predicted CCG from the raw CCG. The area thusobtained was then divided by the geometric mean of the spikecounts of constituent neurons. This analysis showed that thestrength of the functional interaction between a pair of neuronswas related to the degree of signal correlation. In neuron pairswith inhibitory linkages, the trough area was negatively corre-lated with the degree of signal correlation (r �0.29, P 0.032). Inhibitory-linkage pairs with inverse stimulus prefer-ence exhibited stronger inhibitory interactions than those withsimilar stimulus preferences. In neuron pairs with excitatorylinkages or common inputs, the peak area was positively cor-related with the degree of signal correlation (r 0.51, P 0.023 for excitatory-linkage pairs; r 0.27, P � 0.001 forcommon-input pairs). Thus excitatory-linkage or common-in-put pairs with more similar overall stimulus preferences tendedto exhibit stronger excitatory interactions or a higher degree ofcoordinated firing than those with lower similarity of stimuluspreferences.
We next examined the congruity of the most preferredstimulus between a pair of neurons. We determined the rank ofthe most preferred stimulus of a neuron in the partner neuron’sstimulus preference. For example, the most preferred stimulusfor cell 1 of Fig. 7 (stimulus 65, ƒ in Fig. 7B) was the 49thranked stimulus for cell 2 of Fig. 7, and the most preferredstimulus for cell 2 (stimulus 61, � in Fig. 7B) was the 58thranked stimulus for cell 1. Thus we obtained two rank-ordervalues for each pairs. If the most preferred stimulus is sharedby two neurons, the rank-order values will be 1 for bothneurons. If the most preferred stimulus of a neuron is indepen-dent from that of the other as a population, the frequencydistribution of rank orders will be uniform. The distribution of2,056 rank orders from the entire 1,028 pairs was not uniform(P � 0.001, �2 test; Fig. 11A); 34% (690/2,056) had 1–15thrank orders, indicating that the most preferred stimulus of aneuron often activates adjacent neurons well.
Neuron pairs with different types of CCGs exhibited differ-ent patterns of rank-order frequency distributions (P 0.003,�2 test; Fig. 11, B–D). The frequency distribution for theinhibitory-linkage pairs exhibited a uniform distribution (P 0.177, �2 test; Fig. 11B); inhibitory linkages were observedbetween neurons regardless of whether or not they shared the
FIG. 7. An example of neuronal pair with an inhibitory linkage. A: the CCGfrom Fig. 2B was replicated. B: response profiles of cells 1 and 2 to a set ofvisual stimuli, including the predetermined 64 stimuli and an additional imageof a human face in grayscale (stimulus 65), color (stimulus 66), and black-and-white (stimulus 67). ƒ, stimulus 65 (inset), which evoked the strongestresponse in cell 1. �, stimulus 61 (a photographs of human hand in grayscale,inset), which was the best stimulus for cell 2. C: signal correlation between theneurons. F, stimuli, which evoked significant responses in �1 of the neurons.E, ineffective stimuli.
2790 H. TAMURA, H. KANEKO, K. KAWASAKI, AND I. FUJITA
J Neurophysiol • VOL 91 • JUNE 2004 • www.jn.org

most preferred stimuli. In contrast, the frequency distributionof the excitatory-linkage pairs was not uniform and skewedtoward the 1–15th rank (P � 0.001, �2 test; Fig. 11C); the mostpreferred stimulus of a neuron that constitutes an excitatory-linkage pair was ranked in a higher order, mostly the 1–15thrank group, of a partner neuron. A similar but less conspicuoustendency was observed in common-input pairs (P � 0.001, �2
test; Fig. 11D).We compared the area of troughs or peaks in CCGs among
the four different rank-order groups. In the inhibitory-linkagegroups, the trough area did not differ among them (P 0.917,Kruskal Wallis test). Thus the strength of inhibitory interac-tions was not reflected in the degree of sharing of the mostpreferred stimuli but more related to the similarity in overallstimulus preferences (see preceding text). The peak area didnot differ among the four rank groups in excitatory-linkagepairs (P 0.543). On the other hand, it differed among thefour groups in common-input pairs (P � 0.001). Common-input pairs with the shared best stimulus tended to exhibit ahigher degree of coordinated firing than those without.
D I S C U S S I O N
Inhibitory neurons identified on the basis of cross-correla-tion analysis exhibited stimulus-selective visual responses. Theincidence of visually responsive neurons and the degree ofstimulus selectivity were comparable between inhibitory andexcitatory neurons. Inhibitory neurons tended to connect withneurons with dissimilar overall stimulus preferences, whereas
excitatory neurons exhibited more frequent connections toneurons with shared overall stimulus selectivity.
Identification of inhibitory and excitatory neurons
A straightforward and decisive method to identify inhibitoryneurons in vitro is to perform intracellular recording and stain-ing combined with immunohistochemical staining for glutamicacid decarboxylase (McCormick et al. 1985). This method isnot readily applicable to in vivo experiments, although it is notimpossible (Azouz et al. 1997). Previous studies have tried toidentify inhibitory neurons from information obtained withextracellular recording techniques. For example, narrow extra-cellular spikes are associated with fast-spiking inhibitory neu-rons (e.g., Mountcastle et al. 1969; Simons 1978; Wilson et al.1994). Constantinidis and Gldman-Rakic (2002) classifiedcells with higher spontaneous firing rates and narrower spikewidth as fast-spiking neurons and those with lower spontane-ous firing rates and broader spike width as regular-spikingneurons. They assumed those fast-spiking neurons were inhib-itory. Our finding that neurons with narrower spike width(�400 �s) and a higher spontaneous firing rate (�4 spikes/s)were never classified into excitatory neurons on the basis ofCCGs was consistent with their classification method. Rao etal. (1999) reported that some regular-spiking neurons wererecorded with an electrode over a few hundred micrometers,whereas fast-spiking neurons were rarely tracked for �20 �m.Consistent with this, we observed that spikes from excitatoryneurons tended to be recorded at many probes with large
FIG. 8. Three examples of trough-containing CCGs (left)and scatter diagrams of their response magnitudes to thestimulus set (right). CCGs covered �0.1 s with 0.4-ms bins.Signal correlation (r) is indicated at the top of the scatterdiagrams. F and E, effective and ineffective stimuli, respec-tively. A: the CCG from Fig. 2F is replicated. B and C: thetrough was displaced in a negative direction, indicating thepresence of inhibitory linkage from cell 4 to cell 3 (B) and cell6 to cell 5 (C). Cell 6 is cell 1 in Fig. 2; a single inhibitoryneuron was connected to 2 other neurons. Spike counts inseveral bins at and �0 ms of raw CCGs are underestimatedbecause of the technical limitation (see METHODS for details).Number of spikes: 12,236 for cell 3, 16,226 for cell 4, 7,901for cell 5, 19,520 for cell 6.
2791INHIBITORY NEURONS IN MACAQUE IT
J Neurophysiol • VOL 91 • JUNE 2004 • www.jn.org

amplitudes, whereas spikes from inhibitory neurons tended tobe recorded only at a single probe (see Figs. 2 and 3). Corticalinhibitory neurons, however, are highly diverse in their phys-iology, morphology, and chemistry; other classes of inhibitory
neurons have broader spikes (Foehring et al. 1991; Kawaguchi1995; Thomson et al. 1996). Indeed, some of the identifiedinhibitory neurons had a broader spike width (�400 �s; seeFig. 5). A method used to classify hippocampal neuronal typesmeasures the occurrence of burst spikes (Csicsvari et al. 1999).The occurrence of bursting discharges in the neocortex, how-ever, is not associated with a single neuron type (McCormicket al. 1985). These considerations motivated us to employcross-correlation analysis to identify inhibitory neurons: iden-tification based solely on spike width would miss a largepopulation of nonfast spiking inhibitory neurons.
We followed protocols outlined in previous reports to inter-pret CCGs (Bryant et al. 1972; Hata et al. 1990; Menz andFreeman 2003; Moore et al. 1970; Perkel et al. 1967: Toyamaet al. 1981; Ts’o et al. 1986). Raw CCGs containing a dis-placed trough were interpreted as neurons connected throughinhibitory linkages; in the pair, the source neuron of thislinkage is presumed to be inhibitory. The troughs in raw CCGs
FIG. 9. Four examples of peak-containing CCGs (left) andscatter diagrams of their response magnitudes to the stimulusset (right). CCGs covered �0.04 s (A), �0.02 s (B), or �0.2s (C and D) with 0.4-ms bins. F and E, effective and ineffec-tive stimuli, respectively. A and B: pairs with displaced peak.A: the CCG from Fig. 3B is replicated. B: the peak wasdisplaced in the negative direction, indicating the presence ofan excitatory linkage from cell 4 to cell 3. C and D: pairs witha center peak. Spike counts in several bins at and �0 ms ofraw CCGs are underestimated because of the technical limi-tation (see METHODS for details). Number of spikes: 9,871 forcell 3, 2,529 for cell 4, 34,249 for cell 5, 13,013 for cell 6,24,909 for cell 7, and 7,638 for cell 8.
FIG. 10. A: cumulative sums of signal correlations for neurons with inhib-itory linkages (dotted line), excitatory linkages (thin line), and common inputs(thick line).
2792 H. TAMURA, H. KANEKO, K. KAWASAKI, AND I. FUJITA
J Neurophysiol • VOL 91 • JUNE 2004 • www.jn.org

of our inhibitory-linkage pairs had width of 15.0 � 11.4 (SD)ms, similar to values recorded for monosynaptic inhibitorypostsynaptic potentials (IPSPs) in cortical neurons (Komatsu etal. 1988; Matsumura et al. 1996). If cross-correlation analysiswas to detect polysynaptic connections involving inhibitoryneurons, some of our presumed inhibitory neurons may beexcitatory neurons. One possibility is that such an excitatoryneuron in the recorded pair drives an unobserved inhibitoryneuron, which in turn inhibits the other neuron of the pair.Another possibility is that a common excitatory input drivesone neuron of the pair directly and inhibits the other neuron viaan intervening but unobserved inhibitory neuron. These cir-cuits or variations thereof could in principle cause a trough inthe CCG. Although these possibilities cannot be excluded, it ishighly unlikely because a polysynaptic CCG is the convolutionof successive monosynaptic CCGs (Fetz et al. 1991), and atrough caused by polysynaptic inhibition is significantly dimin-ished. Even monosynaptic inhibitory connections are difficultto detect (Aertsen and Gerstein 1985); previous studies haveoften failed to detect them (e.g., Gawne and Richmond 1993;Gochin et al. 1991; Rao et al. 1999; but see Constantinidis etal. 2001, 2002; Hata et al. 1988, 1990; Toyama et al. 1981).Further, if cross-correlation analysis detects polysynaptic con-nections, we would expect to have cases where a single neuronprovides excitatory effects on a target neuron and inhibitoryeffects, via unobserved inhibitory neurons, on another neuron.However, we never observed this. A problem associated withcross-correlation analysis is its inability to detect weak func-tional interactions (Aertsen and Gerstein 1985; Melssen andEpping 1987). Thus our interpretation of the present resultsmay be restricted to the pairs with strong functional interac-tions. Although such weak interactions may not be functionallyrelevant, these limitations must be taken into consideration.
We detected 20 excitatory linkages. Although excitatory
connections prevail in the cortex, such a low incidence ofpurely direct excitatory linkages is usually the case for cross-correlation analysis (Constantinidis et al. 2001; Hata et al.1990; Toyama et al. 1981; Ts’o et al. 1986). Cortical neuronsconstitute a highly interconnected network; each neuron re-ceives inputs from many others, while it provides inputs tomany others. In this situation, we can expect that most of theneurons connected with an excitatory linkage also shares syn-aptic inputs, and a displaced peak of a CCG, which derivedfrom excitatory linkage between them, will be buried in acenter common-input peak. In this situation, a broad displacedpeak straddling the 0-ms bin or an asymmetric peak can befound in CCG. Such a peak can be interpreted as an indicationof a serial linkage. However, it can also be explained bycommon inputs without direct excitatory linkage. Thus if thereis a broad peak straddling the 0-ms bin in a CCG, we cannot besure about the presence of direct excitatory linkage between thetwo neurons.
Operation mode of inhibition
Local application of bicuculline to TE neurons alters theirstimulus selectivity, enhancing their responses to some stimulibut not to others (Wang et al. 2000, 2003). Bicuculline admin-istration often unmasks responses to originally ineffectivestimuli, while preserving responses to some of the originallyeffective stimuli. These results suggest that GABAergic inhi-bition functions in a stimulus-specific manner. Stimulus-spe-cific inhibition could originate from stimulus-insensitive inhib-itory neurons that exert shunting inhibition on target dendritesreceiving stimulus-selective excitatory inputs. The presentstudy, however, demonstrated that inhibitory neurons are stim-ulus selective. Non-stimulus-driven inhibition may also be atwork as the spontaneous firing of inhibitory neurons is high(the present study) and the administration of bicuculline mildlyincreases the spontaneous firing rates (Wang et al. 2000).
Inhibition in a neuron frequently derives from other neuronsthat, although they may share some of the preferred stimuli (asin Fig. 11B, far left), show a low overall signal correlation.Additional groups of neuron pairs (Fig. 11B, far right) pre-ferred different stimuli. Thus a neuron receives inhibitoryinputs both from neurons sharing some of the preferred stim-ulus, but with low overall selectivity similarity, and fromneurons that do not share preferred stimulus. This is consistentwith the results of previous experiments; disinhibition of re-sponses by administration of bicuculline occurs for particulargroups of stimuli that are related to the originally effectivestimuli and for the stimuli that do not originally excite theneurons themselves but instead activate adjacent neurons(Wang et al. 2000). The present results indicate that some ofthe source neurons for this inhibition reside in close vicinity ofthe target neurons, presumably within the same functionalcolumn (see following text).
Columnar organization in area TE
Stimulus preferences are correlated to a greater extent be-tween adjacent TE neurons than between distant ones (Gochinet al. 1991; Wang et al. 2000). TE neurons responding tosimilar object images are clustered in columns (Fujita et al.1992; Tsunoda et al. 2001; Wang et al. 1996). Afferents to a
FIG. 11. Frequency distributions of 2,056 stimulus rank orders from all1,028 pairs (A), 56 inhibitory-linkage pairs (B, n 112), 20 excitatory-linkagepairs (C, n 40), and 397 common-input pairs (D, n 794). We determinedthe ranking of the most preferred stimulus of a paired neuron in the partnerneuron’s stimulus preference. The graphs in B–D display the proportions oftotal pairs falling in each of the 4 rank-order groups so as to eliminate asampling bias. Bin width was 16. Far left: rank orders of 1–15; middle left:16–31; middle right: 32–47; far right: rank orders of �48.
2793INHIBITORY NEURONS IN MACAQUE IT
J Neurophysiol • VOL 91 • JUNE 2004 • www.jn.org
local region in area TE form columnar clusters (Fujita andFujita 1996; Miyata et al. 2000; Saleem et al. 1993); adjacentneurons in the local region are likely to share a high proportionof inputs. The present study demonstrates that approximatelyhalf of adjacent neuron pairs share common inputs. These pairshave greater stimulus preference similarity than those withoutcommon inputs or excitatory linkages.
TE neurons within a column do not necessarily have iden-tical, although similar or correlated, stimulus selectivity withtheir neighbors. There is heterogeneity in stimulus preferencewithin a column or even between adjacent neurons (Fujita et al.1992; Gawne and Richmond 1993; Wang et al. 2000). As halfof the examined pairs did not share inputs, varied degrees ofafferent-input sharing may produce the heterogeneity. Inhibi-tory interactions between adjacent neurons also contribute tothe generation of the heterogeneity.
In area TE, inhibitory neurons can suppress the responses ofadjacent target neurons to irrelevant inputs. This kind of localinhibitory interaction may not be specific to area TE. Modelsfor orientation selectivity of primary visual cortex neuronsoften assume that all neurons in a columnar region respond tothe same orientation and that cross-orientation inhibition orig-inates from neurons in different columns with different orien-tation preferences (Somers et al. 1995; Worgotter and Koch1991). Although most adjacent neurons in the primary visualcortex share a preferred orientation, there exist neurons with awide variety of preferred orientations within a local region(Maldonado and Gray 1996). The question remains if the latterneurons are inhibitory, providing cross-orientation inhibitionfrom within a same columnar region in a similar way as seenin area TE.
Inhibitory neurons in other systems
Inhibitory neurons in the primary visual cortex are selectivefor the orientation of stimulus bars or gratings in a similar wayas excitatory neurons (Azouz et al. 1997; Gilbert and Wiesel1979; Kelly and Van Essen 1974; Martin et al. 1983; but seeSwadlow 1988). Experimental evidence and theoretical mod-eling suggest that both cross-orientation and iso-orientationinhibition contribute to shaping orientation selectivity (Blake-more and Tobin 1972; Douglas et al. 1991; Eysel et al. 1990;Ferster 1986; Hata et al. 1988; Kisvarday et al. 1994; Monieret al. 2003; Sato et al. 1996; Shapley et al. 2003; Sillito 1975;Somers et al. 1995; Worgotter and Koch 1991).
Stimulus-selective responses of inhibitory neurons have alsobeen demonstrated in the prefrontal cortex. Fast-spiking neu-rons, which are putative inhibitory neurons, in the primateprefrontal cortex are directionally tuned to a memory targetduring an oculomotor delayed response task (Rao et al. 1999;Wilson et al. 1994). Fast-spiking neurons in the prefrontalcortex respond to a different direction than regular-spikingneurons located �400 �m away (Wilson et al. 1994). Whencomparisons are confined to more closely adjacent neuronsrecorded at a single site, fast- and regular-spiking neurons havesimilar directional preferences (Rao et al. 1999). Cross-direc-tional inhibition predominates between functional columnswith different directional tuning, while iso-directional inhibi-tion operates within a column.
In summary, evidence from different areas indicates thatinhibitory neurons exhibit responses selective for particular
stimulus features or remembered spatial fields in a mannersimilar to excitatory neurons. They contribute to the formationof response properties of target neurons in a stimulus-specificmanner rather than simply controlling the activity levels of theneuronal network.
A C K N O W L E D G M E N T S
We thank T. Doi, H. Sato, S. Tanabe, and Y. Wang for comments on themanuscript and M. Murayama and K. Miyata for technical assistance.
G R A N T S
This work was supported by a CREST grant from the Japan Science andTechnology Corporation to I. Fujita, grants from the Japanese Ministry ofEducation, Culture, Sports, Science and Technology to I. Fujita and H.Tamura, and grants from National Institute of Advanced Industrial Science andTechnology to H. Tamura and H. Kaneko. Two of the animals used wereobtained through the Cooperation Research Program of Primate ResearchInstitute, Kyoto University.
R E F E R E N C E S
Aertsen A and Gerstein GL. Evaluation of neuronal connectivity: sensitivityof cross correlation. Brain Res 340: 341–354, 1985.
Azouz R, Gray CM, Nowak LG, and McCormick DA. Physiological prop-erties of inhibitory interneurons in cat striate cortex. Cereb Cortex 7:534–545, 1997.
Blakemore C and Tobin EA. Lateral inhibition between orientation detectorsin the cat’s visual cortex. Exp Brain Res 15: 439–440, 1972.
Boussaoud D, Desimone R, and Ungerleider LG. Visual topography of areaTEO in the macaque. J Comp Neurol. 306: 554–575, 1991.
Bryant HL, Marcos AR, and Segundo JP. Correlations of neuronal spikedischarges produced by monosynaptic connections and by common inputs.J Neurophysiol 36: 205–225, 1972.
Constantinidis C, Franowicz MN, and Goldman-Rakic PS. Coding speci-ficity in cortical microcircuits: a multiple-electrode analysis of primateprefrontal cortex. J Neurosci 21: 3646–3655, 2001.
Constantinidis C and Goldman-Rakic PS. Correlated discharges amongputative pyramidal neurons and interneurons in the primate prefrontal cor-tex. J Neurophysiol 88: 3487–3497, 2002.
Constantinidis C, Williams GV, and Goldman-Rakic PS. A role for inhi-bition in shaping the temporal flow of information in prefrontal cortex. NatNeurosci 5: 175–180, 2002.
Csicsvari J, Hirase H, Czurko A, Mamiya A, and Buzsaki G. Oscillatorycoupling of hippocampal pyramidal cells and interneurons in the behavingrat. J Neurosci 19: 274–287, 1999.
Desimone R, Albright TD, Gross CG, and Bruce C. Stimulus-selectiveproperties of inferior temporal neurons in the macaque. J Neurosci 4:2051–2062, 1984.
Douglas RJ, Martin KAC, and Whitteridge D. An intracellular analysis ofthe visual responses of neurons in cat visual cortex. J Physiol 440: 659–696,1991.
Eysel UT, Crook JM, and Machemer HF. GABA-induced remote inactiva-tion reveals cross-orientation inhibition in the cat striate cortex. Exp BrainRes 80: 626–630, 1990.
Ferster D. Orientation selectivity of synaptic potentials in neurons of catprimary visual cortex. J Neurosci 6: 1284–1301, 1986.
Fetz E, Toyama K, and Smith W. Synaptic interactions between corticalneurons. In: Cerebral Cortex, edited by Peters A and Jones EG, New York:Plenum, 1991, vol. 9, p. 1–49.
Foehring RC, Lorenzon NM, Herron P, and Wilson CJ. Correlation ofphysiologically and morphologically identified neuronal types in humanassociation cortex in vitro. J Neurophysiol 66: 1825–1837, 1991.
Fujita I. The inferior temporal cortex: architecture, computation, and repre-sentation. J Neurocytol 31: 359–371, 2002.
Fujita I and Fujita T. Intrinsic connections in the macaque inferior temporalcortex. J Comp Neurol 368: 467–486, 1996.
Fujita I, Tanaka K, Ito M, and Cheng K. Columns for visual features ofobjects in monkey inferotemporal cortex. Nature 360: 343–346, 1992.
Gallant JL, Braun J, and Van Essen DC. Selectivity for polar, hyperbolicand cartesian gratings in macaque visual cortex. Science 259: 100–103,1993.
2794 H. TAMURA, H. KANEKO, K. KAWASAKI, AND I. FUJITA
J Neurophysiol • VOL 91 • JUNE 2004 • www.jn.org

Gawne TJ and Richmond BJ. How independent are the messages carried byadjacent inferior temporal cortical neurons? J Neurosci 13: 2758–2771,1993.
Gilbert CD and Wiesel TN. Morphology and intracortical projections offunctionally characterized neurons in the cat visual cortex. Nature 280:120–125, 1979.
Gochin PM, Miller EK, Gross CG, and Gerstein G. Functional interactionsamong neurons in inferior temporal cortex of the awake macaque. Exp BrainRes 84: 505–516, 1991.
Gross CG, Rocha-Miranda CE, and Bender DB. Visual properties ofneurons in inferotemporal cortex of the macaque. J Neurophysiol 35: 96–111, 1972.
Hata Y, Tsumoto T, Sato H, Hagihara K, and Tamura H. Inhibitioncontributes to orientation selectivity in visual cortex of cat. Nature 335:815–817, 1988.
Hata Y, Tsumoto T, Sato H, Hagihara K, and Tamura H. Horizontalinteractions between visual cortical neurons studied by cross-correlationanalysis in the cat. J Physiol 441: 593–614, 1990.
Hegde J and Van Essen DC. Selectivity for complex shapes in primate visualarea V2. J Neurosci 20: RC1–6, 2000.
Janssen P, Vogels R, and Orban GA. Three-dimensional shape coding ininferior temporal cortex. Neuron 27: 385–397, 2000.
Kaneko H, Suzuki SS, Okada J, and Akamatsu M. Multineuronal spikeclassification based on multisite electrode recording, whole-waveform anal-ysis, and hierarchical clustering. IEEE Trans Biomed Eng 46: 280–290,1999.
Kaneko H, Suzuki SS, Tamura H, Takita M, and Akamatsu M. A micro-electrode positioning system for semiautomatically tracking neuronalspikes. Proc 20th Conference of IEEE Med Biol 20: 2236–2238, 1998.
Kato M, Uka T, and Fujita I. How selective and reliable are visual responsesof inferior temporal cortex neurons? Comparison between anesthetized andawake conditions. Soc Neurosci Abstr 25: 918, 1999.
Kawaguchi Y. Physiological subgroups of nonpyramidal cells with specificmorphological characteristics in layer II/III of rat frontal cortex. J Neurosci15: 2638–2655, 1995.
Kawasaki K, Tamura H, Miyata K, and Fujita I. Quantitative comparisonof intrahemispheric and interhemispheric responses of area TE neurons inmacaques. Soc Neurosci Abstr 448.7, 2000.
Kelly JP and Van Essen DC. Cell structure and function in the visual cortexof the cat. J Physiol 238: 515–547, 1974.
Kisvarday ZF, Kim D-S, Eysel UT, and Bonhoeffer T. Relationship be-tween lateral inhibitory connections and the topography of the orientationmap in cat visual cortex. Eur J Neurosci 6: 1619–1632, 1994.
Kobatake E and Tanaka K. Neuronal selectivities to complex object featuresin the ventral visual pathway of the macaque cerebral cortex. J Neurophysiol71: 856–867, 1994.
Komatsu H, Ideura Y, Kaji S, and Yamane S. Color selectivity of neuronsin the inferior temporal cortex of the awake macaque monkey. J Neurosci12: 408–424, 1992.
Komatsu Y, Nakajima S, Toyama K, and Fetz EE. Intracortical connectivityrevealed by spike-triggered averaging in slice preparations of cat visualcortex. Brain Res 442: 359–362, 1988.
Lance GN and Williams WT. A general theory of classificatory sortingstrategies. I. Hierarchical systems. Comput J 9: 373–380, 1967.
Logothetis NK, Guggenberger H, Peled S, and Pauls J. Functional imagingof the monkey brain. Nat Neurosci 2: 555–562, 1999.
Maldonado PE and Gray CM. Heterogenity in local distributions of orien-tation-selective neurons in the cat primary visual cortex. Vis Neurosci 13:509–516, 1996.
Martin KAC, Somogyi P, and Whitteridge D. Physiological and morpho-logical properties of identified basket cells in the cat’s visual cortex. ExpBrain Res 50: 193–200, 1983.
Matsumura M, Chen D-F, Sawaguchi T, Kubota K, and Fetz EE. Synapticinteractions between primate precentral cortex neurons revealed by spike-triggered averaging of intracellular membrane potentials in vivo. J Neurosci16: 7757–7767, 1996.
McCormick DA, Connors BW, Lighthall JW, and Prince DA. Comparativeelectrophysiology of pyramidal and sparsely spiny stellate neurons of theneocortex. J Neurophysiol 54: 782–806, 1985.
Melssen WJ and Epping WJM. Detection and estimation of neuronal con-nectivity based on cross-correlation analysis. Biol Cybern 57: 403–414,1987.
Menz DM and Freeman RD. Stereoscopic depth processing in the visualcortex: a coarse-to-fine mechanisms. Nat Neurosci 6: 59–65, 2003.
Miyata K, Kawasaki K, Wang QX, Tamura H, and Fujita I. Columnarinterhemispheric connections between area TEs in macaque. Soc NeurosciAbstr 448.6, 2000.
Monier C, Chavane F, Baudot P, Graham LJ, and Fregnac Y. Orientationand direction selectivity of synaptic inputs in visaul cortical neurons: adiversity of combinations produces spike tuning. Neuron 37: 663–680, 2003.
Moore GP, Segundo JP, Perkel DH, and Levitan H. Statistical signs ofsynaptic interaction in neurons. Biophys J 10: 876–900, 1970.
Mountcastle VB, Talbot WH, Sakata H, and Hyvarinen J. Cortical neuro-nal mechanisms in flutter-vibration studied in unanesthetized monkeys.Neuronal periodicity and frequency discrimination. J Neurophysiol 32:452–484, 1969.
Pack CC, Berezovskii VK, and Born RT. Dynamic properties of neurons incortical area MT in alert and anesthetized macaque monkey. Nature 414:905–908, 2001.
Pasupathy A and Connor CE. Responses to contour features in macaque areaV4. J Neurophysiol 82: 2490–2502, 1999.
Perkel DH, Gerstein GL, and Moore GL. Neuronal spike trains and sto-chastic point processes. II. Simultaneous spike trains. Biophys J 7: 419–440,1967.
Perrett DI, Rolls ET, and Caan W. Visual neurons responsive to faces in themonkey temporal cortex. Exp Brain Res 47: 329–342, 1982.
Popilskis SJ and Kohn DF. Anesthesia and analgesia in nonhuman primates.In: Anesthesia and Analgesia in Laboratory Animals, edited by Kohn DF,Wixon SK, White WJ, and Benson GJ. New York: Academic, 1999, p.233–255.
Rao SG, Williams GV, and Goldman-Rakic PS. Isodirectional tuning ofadjacent interneurons and pyramidal cells during working memory: evi-dence for microcolumnar organization in PFC. J Neurophysiol 81: 1903–1916, 1999.
Rodman HR, Skelly JP, and Gross CG. Stimulus selectivity and statedependence of activity in inferior temporal cortex of infant monkeys. ProcNatl Acad Sci USA 88: 7572–7575, 1991.
Saleem KS, Tanaka K, and Rockland KS. Specific and columnar projectionfrom area TEO to TE in the macaque inferotemporal cortex. Cereb Cortex3: 454–464, 1993.
Sary G, Vogels R, Kovacs G, and Orban GA. Reponses of monkey inferiortemporal neurons to luminance-, motion-, and texture-defined gratings.J Neurophysiol 73: 1341–1354, 1995.
Sato H, Katsuyama N, Tamura H, Hata Y, and Tsumoto T. Mechanismsunderlying orientation selectivity of neurons in the primary visual cortex ofthe macaque. J Physiol 494: 757–771, 1996.
Shapley R, Hawken M, and Ringach DL. Dynamics of orientation selectivityin the primary visual cortex and the importance of cortical inhibition.Neuron 38: 689–699, 2003.
Sillito AM. The contribution of inhibitory mechanisms to the receptive fieldproperties of neurons in the striate cortex of the cat. J Physiol 250: 305–329,1975.
Simons DJ. Response properties of vibrissa units in rat SI somatosensoryneocortex. J Neurophysiol 41: 798–820, 1978.
Somers DC, Nelson SB, and Sur M. An emergent model of orientationselectivity in cat visual cortical simple cells. J Neurosci 15: 5448–5465, 1995.
Swadlow HA. Efferent neurons and suspected interneurons in binocular visualcortex of the awake rabbit: receptive fields and binocular properties. J Neu-rophysiol 59: 1162–1187, 1988.
Tamura H, Kaneko H, Kawasaki K, and Fujita I. Visual response proper-ties of presumed inhibitory neurons in the inferior temporal cortex ofmacaque monkey. Soc Neurosci Abstr 160.7, 2002.
Tamura H and Tanaka K. Visual response properties of cells in the ventraland dorsal parts of the macaque inferotemporal cortex. Cereb Cortex 11:384–399, 2001.
Tanaka K, Saito H-A, Fukada Y, and Moriya M. Coding visual images ofobjects in the inferotemporal cortex of the macaque monkey. J Neurophysiol66: 170–189, 1991.
Thomson AM, West DC, Hahn J, and Deuchars J. Single axon IPSPselicited in pyramidal cells by three classes of interneurons in slices of ratneocortex. J Physiol 496: 81–102, 1996.
Tigwell DA and Sauter J. On the use of isofluorane as an anesthetic for visualneurophysiology. Exp Brain Res 88: 224–228, 1992.
Toyama K, Kimura M, and Tanaka K. Cross-correlation analysis of inter-neuronal connectivity in cat visual cortex. J Neurophysiol 46: 191–201,1981.
2795INHIBITORY NEURONS IN MACAQUE IT
J Neurophysiol • VOL 91 • JUNE 2004 • www.jn.org

Ts’o DY, Gilbert CD, and Wiesel TN. Relationships between horizontalinteractions and functional architecture in cat striate cortex as revealed bycross-correlation analysis. J Neurosci 6: 1160–1170, 1986.
Tsunoda K, Yamane Y, Nishizaki M, and Tanifuji M. Complex objects arerepresented in macaque inferotemporal cortex by the combination of featurecolumns. Nat Neurosci 4: 832–838, 2001.
Uka T, Tanaka H, Yoshiyama K, Kato M, and Fujita I. Disparity selectivityof neurons in monkey inferior temporal cortex. J Neurophysiol 84: 120–132, 2000.
Wang G, Tanaka K, and Tanifuji M. Optical imaging of functional organi-zation in the monkey inferotemporal cortex. Science 272: 1665–1668, 1996.
Wang Y, Fujita I, and Murayama Y. Neuronal mechanisms of selectivity forobject features revealed by blocking inhibition in inferotemporal cortex. NatNeurosci 3: 807–813, 2000.
Wang Y, Fujita I, and Murayama Y. Coding of visual patterns and texturesin monkey inferior temporal cortex. NeuroRep 14: 453–458, 2003.
Wang Y, Fujita I, Tamura H, and Murayama Y. Contributions of GABAer-gic inhibition to receptive field structures of monkey inferior temporalneurons. Cereb Cortex 12: 62–74, 2002.
Wilson FAW, O’Scalaidhe SP, and Goldman-Rakic PS. Functional syner-gism between putative �-aminobutyrate-containing neurons and pyrami-dal neurons in prefrontal cortex. Proc Natl Acad Sci USA 91: 4009 –4013, 1994.
Worgotter F and Koch C. A detailed model of the primary visual pathway inthe cat: comparison of afferent excitatory and intracortical inhibitory con-nection schemes for orientation selectivity. J Neurosci 11: 1959–1979,1991.
2796 H. TAMURA, H. KANEKO, K. KAWASAKI, AND I. FUJITA
J Neurophysiol • VOL 91 • JUNE 2004 • www.jn.org