Presentation - Investor Relations | Booz Allen Hamilton
49
-
Upload
khangminh22 -
Category
Documents
-
view
0 -
download
0
Transcript of Presentation - Investor Relations | Booz Allen Hamilton


R U B U N D E Y

A G E N D A

H O R A C I O R O Z A N S K I


•
•
•
•
•
•
•

K A R E N D A H U T

•
•
•
•
•


J U D I D O T S O N

•
•
•
• Digital Modernization
•


K R I S T I N E M A R T I N A N D E R S O N

•
•
•
•
•


K A R E N D A H U T

•
•
•
•
•

S U S A N P E N F I E L D


B E T T Y T H O M P S O N


L L O Y D H O W E L L


•
•
•
•
•
•
•
•
•
-
-
-

•
•
•
•
•
•


N O N - G A A P F I N A N C I A L I N F O R M A T I O N
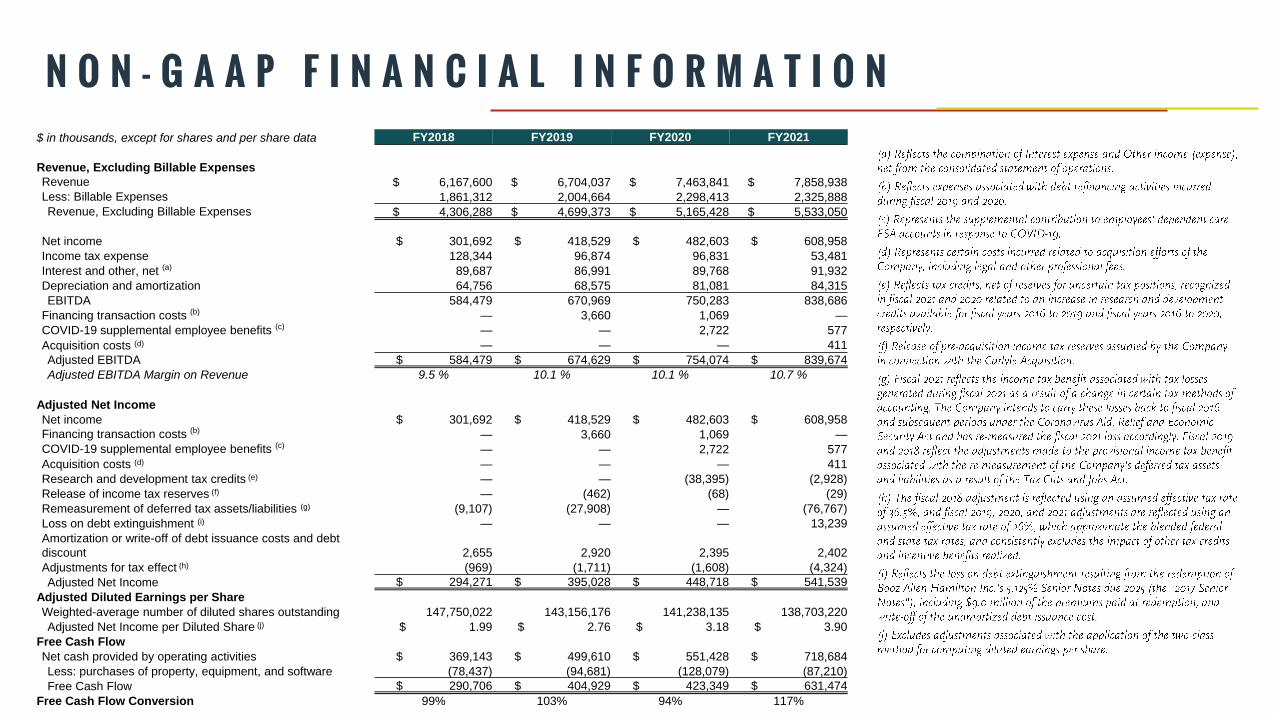
N O N - G A A P F I N A N C I A L I N F O R M A T I O N$ in thousands, except for shares and per share data FY2018 FY2019 FY2020 FY2021
Revenue, Excluding Billable Expenses
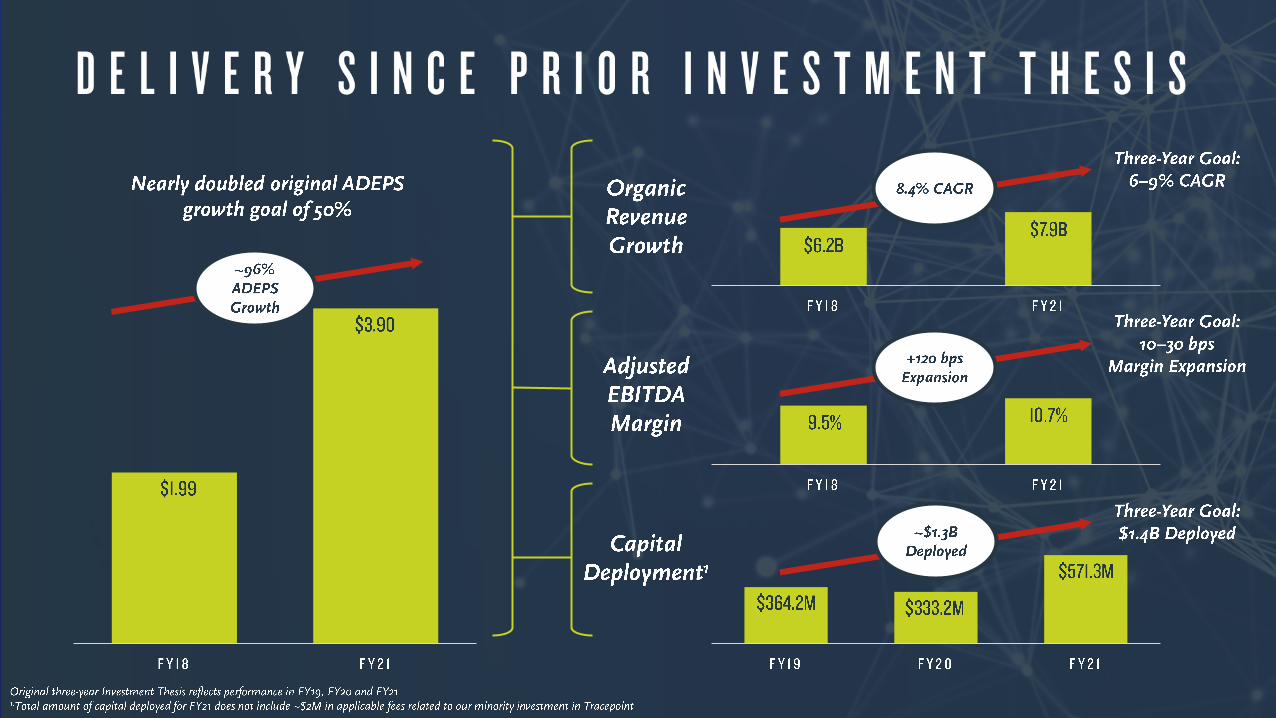
Revenue $ 6,167,600 $ 6,704,037 $ 7,463,841 $ 7,858,938
Less: Billable Expenses 1,861,312 2,004,664 2,298,413 2,325,888
Revenue, Excluding Billable Expenses $ 4,306,288 $ 4,699,373 $ 5,165,428 $ 5,533,050
Net income $ 301,692 $ 418,529 $ 482,603 $ 608,958
Income tax expense 128,344 96,874 96,831 53,481
Interest and other, net (a) 89,687 86,991 89,768 91,932
Depreciation and amortization 64,756 68,575 81,081 84,315
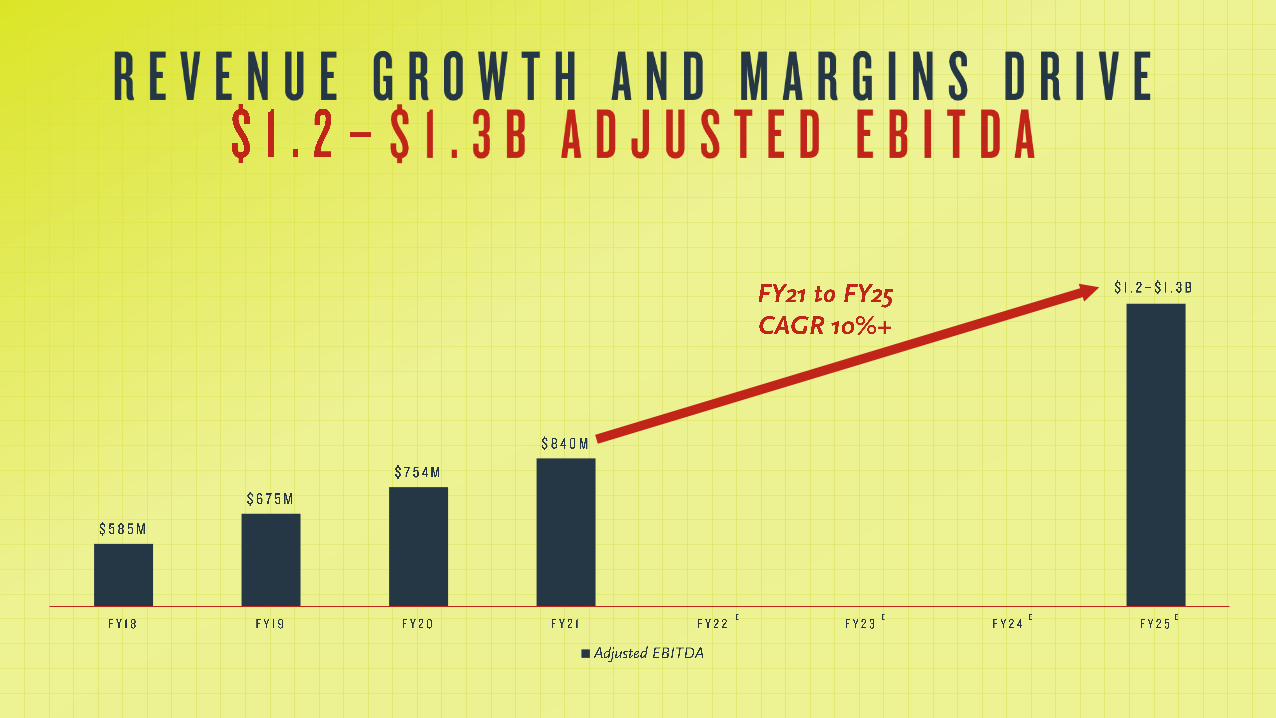
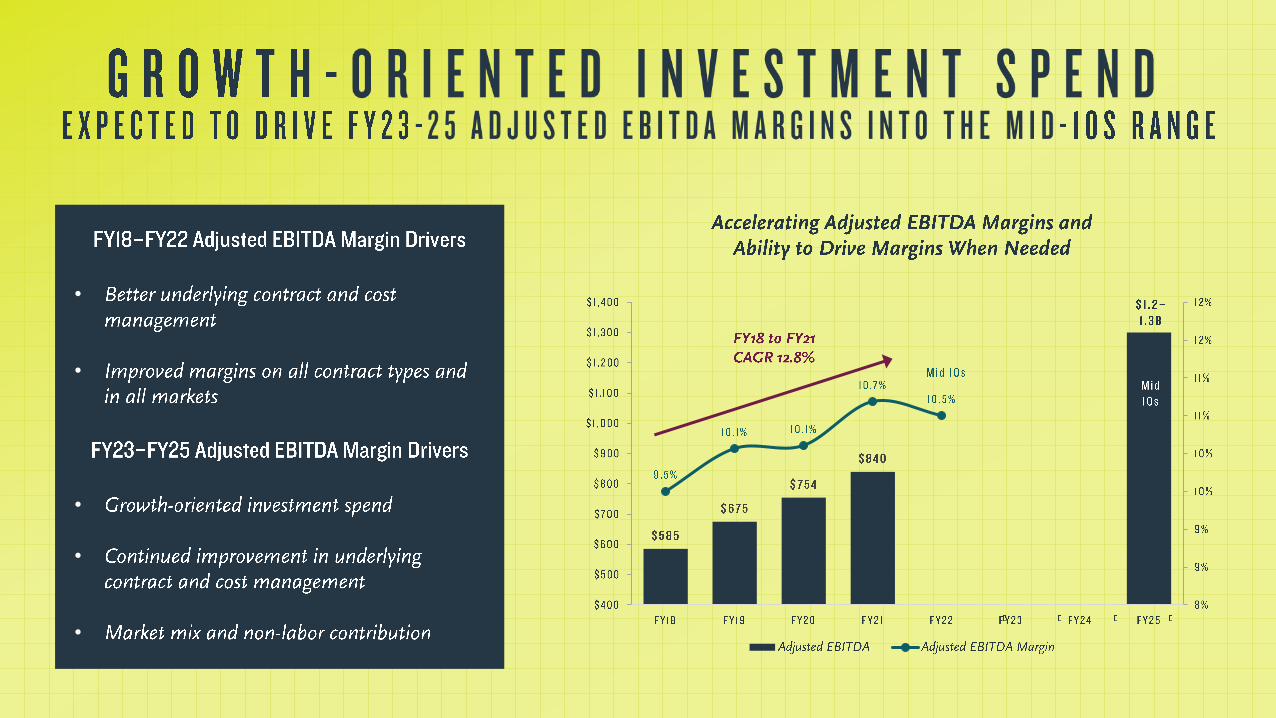
EBITDA 584,479 670,969 750,283 838,686
Financing transaction costs (b) — 3,660 1,069 —
COVID-19 supplemental employee benefits (c) — — 2,722 577
Acquisition costs (d) — — — 411
Adjusted EBITDA $ 584,479 $ 674,629 $ 754,074 $ 839,674
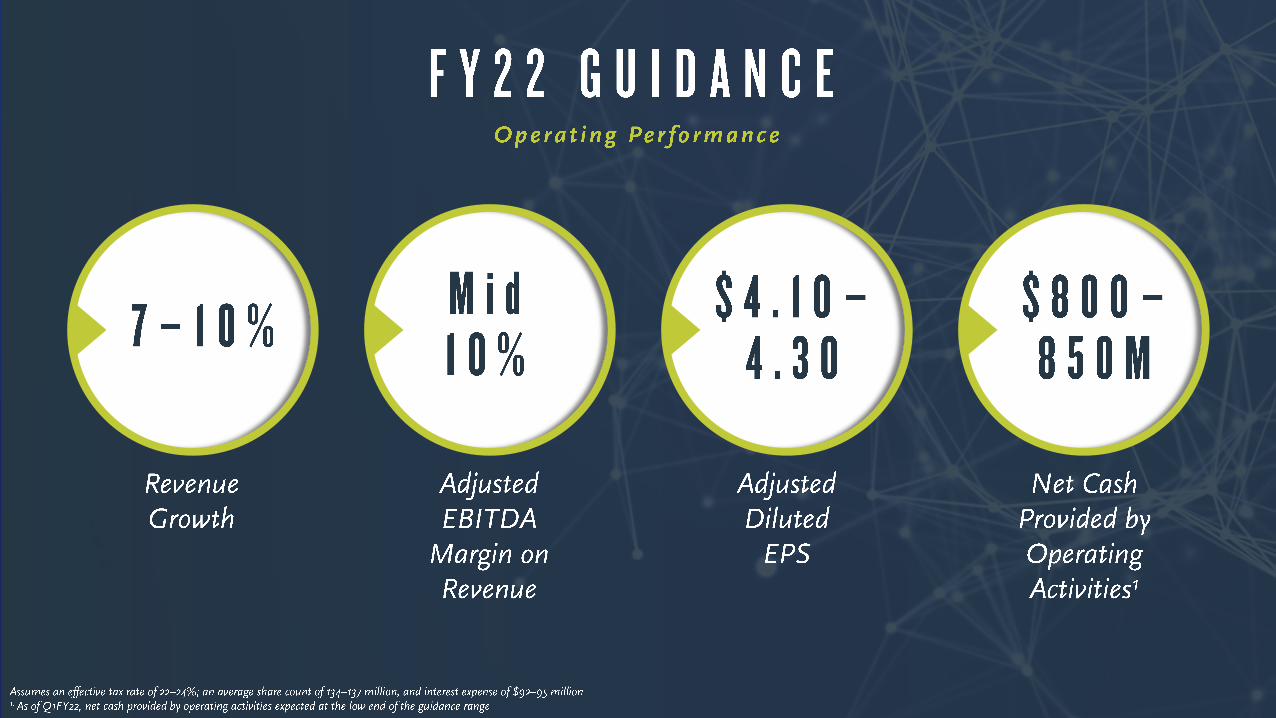
Adjusted EBITDA Margin on Revenue 9.5 % 10.1 % 10.1 % 10.7 %
Adjusted Net Income
Net income $ 301,692 $ 418,529 $ 482,603 $ 608,958
Financing transaction costs (b) — 3,660 1,069 —
COVID-19 supplemental employee benefits (c) — — 2,722 577
Acquisition costs (d) — — — 411
Research and development tax credits (e) — — (38,395) (2,928)
Release of income tax reserves (f) — (462) (68) (29)
Remeasurement of deferred tax assets/liabilities (g) (9,107) (27,908) — (76,767)
Loss on debt extinguishment (i) — — — 13,239
Amortization or write-off of debt issuance costs and debt
discount 2,655 2,920 2,395 2,402
Adjustments for tax effect (h) (969) (1,711) (1,608) (4,324)
Adjusted Net Income $ 294,271 $ 395,028 $ 448,718 $ 541,539
Adjusted Diluted Earnings per Share
Weighted-average number of diluted shares outstanding 147,750,022 143,156,176 141,238,135 138,703,220
Adjusted Net Income per Diluted Share (j) $ 1.99 $ 2.76 $ 3.18 $ 3.90
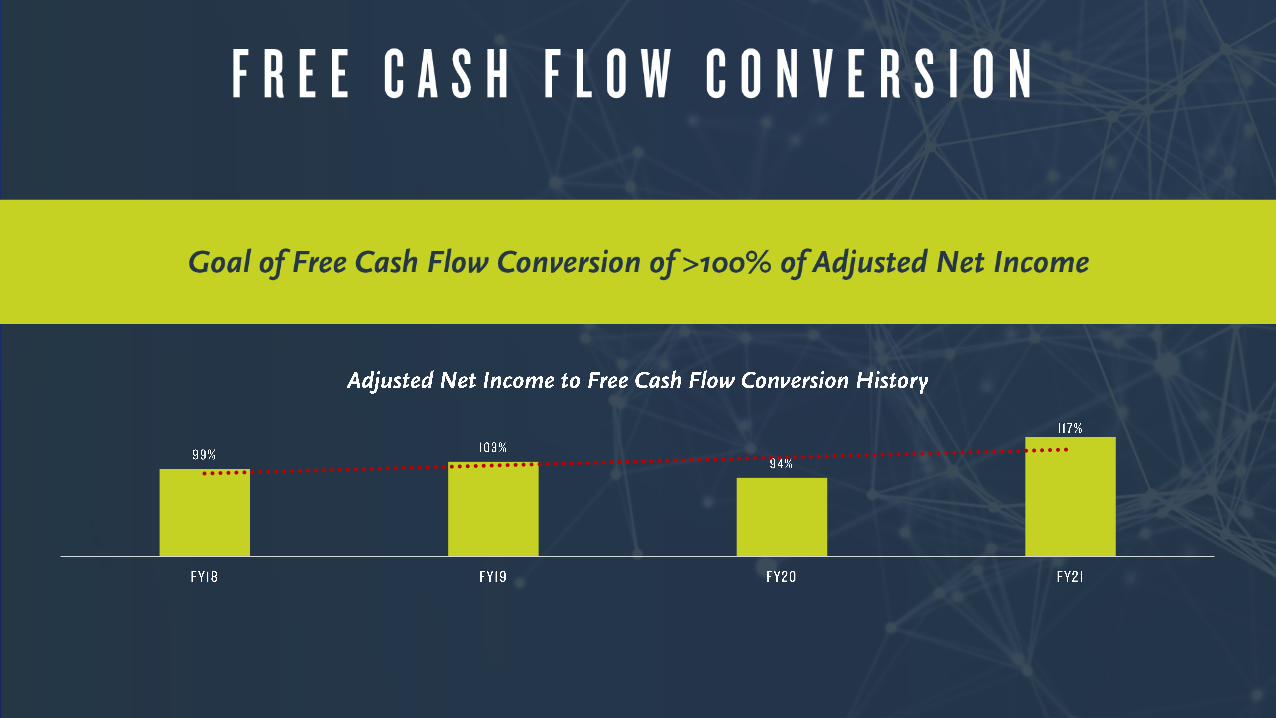
Free Cash Flow
Net cash provided by operating activities $ 369,143 $ 499,610 $ 551,428 $ 718,684
Less: purchases of property, equipment, and software (78,437) (94,681) (128,079) (87,210)
Free Cash Flow $ 290,706 $ 404,929 $ 423,349 $ 631,474
Free Cash Flow Conversion 99% 103% 94% 117%