Preparation of novel heterogeneous catalysts by adsorption of a cationic tetrapyrrole on to...
16
ORIGINAL PAPER Preparation of novel heterogeneous catalysts by adsorption of a cationic tetrapyrrole on to bentonite: equilibrium, kinetics, and thermodynamics Altug ˘ Mert Sevim • Rustam Hojiyev • Ahmet Gu ¨l • Mehmet Sabri C ¸ elik Received: 13 May 2010 / Accepted: 15 July 2011 / Published online: 19 August 2011 Ó Springer-Verlag 2011 Abstract Adsorption of an octacationic tetrapyrrole, octakis(2-trimethylammoniumethylsulfanyl)porphyrazina- tocobalt octaiodide (QCoPz), from aqueous solutions on to negatively charged bentonite was investigated. Effects of temperature, dye concentration, solid concentration, and contact time on adsorption were determined. Zeta potential and ion-release measurements were also used as supporting experiments. Experimental data were analyzed using four adsorption kinetic models; a pseudo second-order kinetic model resulted in better correlation with experimental results than the others. Experimental equilibrium data were analyzed by non-linear regression using five adsorption isotherm models with two, three, or four terms. Free energies, enthalpies, and entropies for the adsorption pro- cess were determined. The results indicated that adsorption of QCoPz on bentonite was exothermic and spontaneous in nature. FT-IR spectroscopy of the composite and its desorptive behavior were also investigated to identify the mechanism of adsorption. The novel QCoPz–bentonite composites obtained are likely to be used in ‘‘green chemistry’’ and in a wide range of optical and/or catalytic applications, especially those crucially important in the petroleum and pulp/paper industries for waste water cleaning (destruction of mercaptans, sulfides, phenol, and halogenated aromatics, etc.) and removal of bad odor. Keywords Clays Dyes Intercalation compounds IR spectroscopy Porphyrazine Introduction Porphyrazines can be regarded as porphyrin analogues with meso nitrogen atoms replacing the meso carbons. This alteration results in significant structural and electronic changes within the macrocycle [1]. Porphyrazines, how- ever, have received much less synthetic interest than the related porphyrins and phthalocyanines [2]. They have a wide variety of redox properties [3]. Furthermore, because it is possible to control their photochemical and electro- chemical properties by modification of the substituents and selection of the central metal, the importance of porphyr- azines in biological, chemical, and physical research is likely to increase. Intensive research interest in peripher- ally functionalized porphyrazines during the last decade has shown that these tetrapyrrole derivatives should be regarded as alternatives to the phthalocyanines that have found extensive applications in many fields, including materials science, photodynamic therapy of tumors, and as pigments and dyes [4]. Inorganic–organic hybrids are popular and new func- tional materials and their importance from a nanostructural perspective is increasing [5]. Not only is simple hybrid- ization of inorganic materials and organic compounds expected but also control of orientation at the molecular level. Clay minerals are known to be multilayered mate- rials that yield wide two-dimensional spaces with highly ordered nanostructured environments for chemical reac- tions. Synthetic clay minerals can be used as well- characterized inorganic hosts and have attracted increasing interest, especially for their applications in photochemical A. M. Sevim A. Gu ¨l (&) Department of Chemistry, Istanbul Technical University, 34469 Maslak, Istanbul, Turkey e-mail: [email protected] R. Hojiyev M. S. C ¸ elik Faculty of Mines, Department of Mineral and Coal Processing, Istanbul Technical University, 34469 Maslak, Istanbul, Turkey 123 Monatsh Chem (2012) 143:385–400 DOI 10.1007/s00706-011-0599-y
-
Upload
independent -
Category
Documents
-
view
1 -
download
0
Transcript of Preparation of novel heterogeneous catalysts by adsorption of a cationic tetrapyrrole on to...
ORIGINAL PAPER
Preparation of novel heterogeneous catalysts by adsorptionof a cationic tetrapyrrole on to bentonite: equilibrium, kinetics,and thermodynamics
Altug Mert Sevim • Rustam Hojiyev •
Ahmet Gul • Mehmet Sabri Celik
Received: 13 May 2010 / Accepted: 15 July 2011 / Published online: 19 August 2011
� Springer-Verlag 2011
Abstract Adsorption of an octacationic tetrapyrrole,
octakis(2-trimethylammoniumethylsulfanyl)porphyrazina-
tocobalt octaiodide (QCoPz), from aqueous solutions on to
negatively charged bentonite was investigated. Effects of
temperature, dye concentration, solid concentration, and
contact time on adsorption were determined. Zeta potential
and ion-release measurements were also used as supporting
experiments. Experimental data were analyzed using four
adsorption kinetic models; a pseudo second-order kinetic
model resulted in better correlation with experimental
results than the others. Experimental equilibrium data were
analyzed by non-linear regression using five adsorption
isotherm models with two, three, or four terms. Free
energies, enthalpies, and entropies for the adsorption pro-
cess were determined. The results indicated that adsorption
of QCoPz on bentonite was exothermic and spontaneous in
nature. FT-IR spectroscopy of the composite and its
desorptive behavior were also investigated to identify the
mechanism of adsorption. The novel QCoPz–bentonite
composites obtained are likely to be used in ‘‘green
chemistry’’ and in a wide range of optical and/or catalytic
applications, especially those crucially important in the
petroleum and pulp/paper industries for waste water
cleaning (destruction of mercaptans, sulfides, phenol, and
halogenated aromatics, etc.) and removal of bad odor.
Keywords Clays � Dyes � Intercalation compounds �IR spectroscopy � Porphyrazine
Introduction
Porphyrazines can be regarded as porphyrin analogues with
meso nitrogen atoms replacing the meso carbons. This
alteration results in significant structural and electronic
changes within the macrocycle [1]. Porphyrazines, how-
ever, have received much less synthetic interest than the
related porphyrins and phthalocyanines [2]. They have a
wide variety of redox properties [3]. Furthermore, because
it is possible to control their photochemical and electro-
chemical properties by modification of the substituents and
selection of the central metal, the importance of porphyr-
azines in biological, chemical, and physical research is
likely to increase. Intensive research interest in peripher-
ally functionalized porphyrazines during the last decade
has shown that these tetrapyrrole derivatives should be
regarded as alternatives to the phthalocyanines that have
found extensive applications in many fields, including
materials science, photodynamic therapy of tumors, and as
pigments and dyes [4].
Inorganic–organic hybrids are popular and new func-
tional materials and their importance from a nanostructural
perspective is increasing [5]. Not only is simple hybrid-
ization of inorganic materials and organic compounds
expected but also control of orientation at the molecular
level. Clay minerals are known to be multilayered mate-
rials that yield wide two-dimensional spaces with highly
ordered nanostructured environments for chemical reac-
tions. Synthetic clay minerals can be used as well-
characterized inorganic hosts and have attracted increasing
interest, especially for their applications in photochemical
A. M. Sevim � A. Gul (&)
Department of Chemistry, Istanbul Technical University,
34469 Maslak, Istanbul, Turkey
e-mail: [email protected]
R. Hojiyev � M. S. Celik
Faculty of Mines, Department of Mineral and Coal Processing,
Istanbul Technical University, 34469 Maslak, Istanbul, Turkey
123
Monatsh Chem (2012) 143:385–400
DOI 10.1007/s00706-011-0599-y
and catalytic reactions [6]. Interest in intercalation of
compounds on to clay minerals can be attributed mainly to
the fact that host–guest interactions affect chemical, cata-
lytic, electronic, and optical properties of guest
components [7]. These composite systems not only have
improved catalytic activity, stability, and selectivity but
also enable easy recovery and reuse of the catalyst because
of the supporting environment [8]. Such processes are
currently demanded by environmentally friendly or
‘‘green’’ chemistry which takes three aspects unlimited
natural resources into account:
1. oxygen (from air) as oxidant;
2. often water as solvent; and
3. for photo-oxidations, use of visible light (solar
radiation) [9].
Adsorption of both phthalocyanines and porphyrins on
to clays are frequently investigated, along with the catalytic
and optical applications of the products. Examples include
biomimetic oxidation of hydrocarbons by clay-intercalated
metalloporphyrins and/or metallophthalocyanines [10], use
of molecular oxygen for catalytic oxidation of hydrocar-
bons with clay-intercalated porphyrins [11], photochemical
hole burning of cationic porphyrins intercalated in saponite
[12], removal and photodecomposition of n-nonylphenol
using clay with incorporated copper phthalocyanine [13].
There have been reports of unique hybrid materials in
which either 5,10,15,20-tetrakis(N-methylpyridinium-4-
yl)porphyrin or 5,10,15,20-tetrakis(N,N,N-trimethylanilin-
ium-4-yl)porphyrin (TMAP) cations are adsorbed on the
clay surface with high charge densities and without
aggregation completely neutralizing the surface negative
charges [14]. Despite a number of studies on porphyrin and
clay hybrids [15, 16], studies of clay–porphyrazine com-
posites and their properties are rare.
Sulfide, sulfite, thiosulfate, and mercaptans are by-
products of industrial processes and pollutants of waste and
natural water [17]. At low concentrations the toxic prop-
erties of aqueous solutions can be eliminated by bacterial
oxidation [18] but sulfide concentrations above
70–200 mg dm-3 inhibit bacterial metabolism. Waste
water from the oil industry contains sulfide up to
25 g dm-3. Complete oxidation of sulfur-containing to
non-toxic compounds, before discharging them into
waterways, is the necessary solution to this environmental
pollution problem [19]. Sulfide and other sulfur compounds
were effectively removed by strong oxidants (H2O2,
NaOCl) or catalytically and photocatalytically using metal
tetrapyrroles (especially phthalocyanines) in the presence
of air. Also toxic phenols and chlorinated phenols are
among the basic soluble pollutants of industrial and com-
munal waste water. Polychlorinated aromatics are
especially persistent in the environment, because of their
resistance to oxidation under aerobic conditions leading to
accumulation in the biosphere [20]. For destruction of
phenols and halogenated aromatics, a recently developed
method uses iron tetrasulfophthalocyanine as catalyst in the
presence of H2O2 as oxidant [21]. Another possibility for
waste water cleaning is photooxidation under visible light
irradiation. TiO2 has been used as a photoexcitable semi-
conductor but, because of the band gap of the colorless
TiO2, this process works in the UV region, where only 3%
of solar radiation is active. To overcome this problem of
UV absorption, photosensitizers such as phthalocyanines
and their derivatives, absorbing in the visible region of
light, must be used.
Bentonite is a smectite clay mineral of 2:1 layered sili-
cate that swells when treated with water. The inner layer is
composed of an octahedral sheet, which is situated between
two tetrahedral sheets. Substitution of Al3? for Si4? in the
tetrahedral layer and Mg2? or Zn2? for Al3? in the octa-
hedral layer result in a net negative surface charge in the
clay. The charge imbalance is offset by exchangeable cat-
ions, for example H?, Na?, or Ca2? on layer surfaces [22].
In this study we synthesized a water-soluble quaternary
cobalt porphyrazine (QCoPz) and studied its adsorption
from aqueous solutions on to negatively charged bentonite.
Equilibrium adsorption isotherms were measured for the
single-component system and the experimental data were
analyzed by non-linear regression using five commonly
used models.
Experimental data were analyzed using four adsorption
kinetic models: pseudo first-order, pseudo second-order,
simple Elovich, and interparticle diffusion. Detailed error
analysis was undertaken to investigate the effect of using
different error criteria to obtain the best-fit isotherm and
isothermal data which describe the adsorption process. For
this purpose, three different error functions were used:
residual root mean square error (RMSE), average residuals
(eave), and mean relative deviation modulus (Ee). The data
obtained from adsorption isotherms at different tempera-
tures were fitted to different adsorption models to calculate
thermodynamic quantities such as the free energy of
adsorption, heat of adsorption, and entropy of adsorption.
Ion-release measurement by AAS (atomic absorption
spectroscopy), FTIR techniques, and desorption studies
were performed to understand the mechanism of adsorption
process.
Results and discussion
Effect of solids concentration
To determine the amount of solid to be used in adsorption
experiments, a series of tests was performed with different
386 A. M. Sevim et al.
123
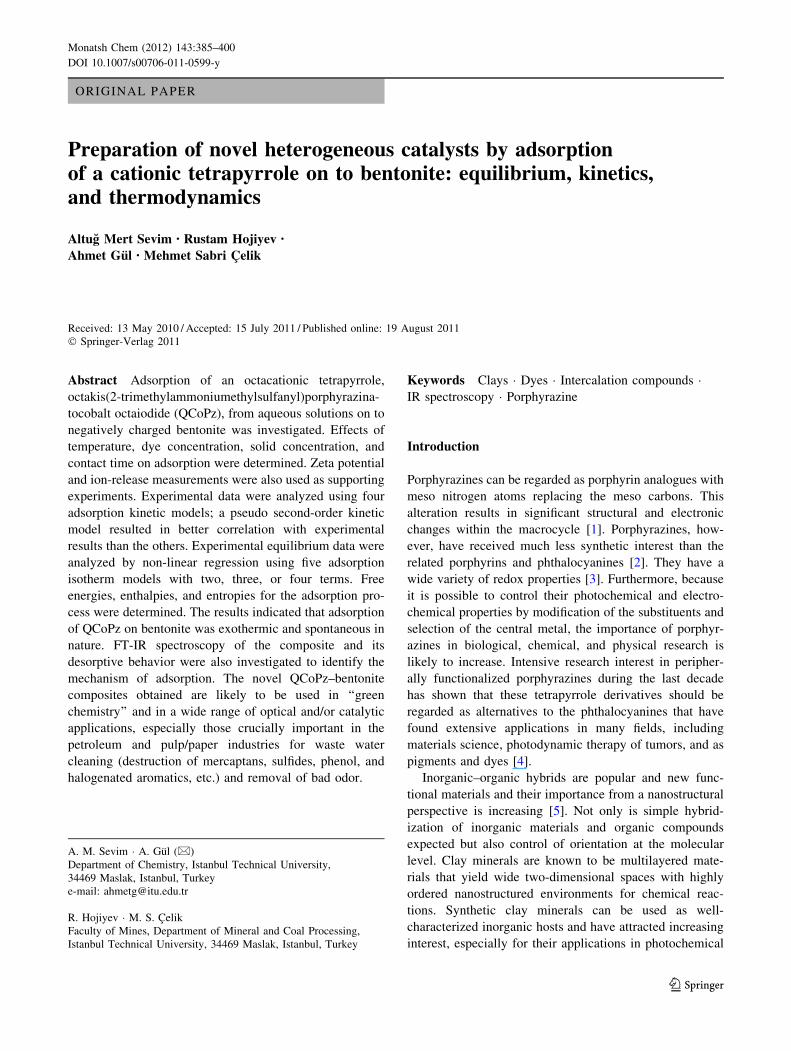
percentage solid concentrations at an initial dye concen-
tration of 1 mmol dm-3. Examination of Fig. 1a reveals
that adsorption density decreases with increasing percent-
age solid concentration and then remains practically stable.
At 0.1% solid concentration, the adsorption density is
0.9560 mmol g-1 and then decreases to 0.0487 mmol g-1
at 2% solid concentration. Consequently, an optimum solid
concentration of 0.1% was selected for further testing.
Effect of mixing time
The adsorption of QCoPz on to bentonite is presented in
Fig. 1b as a function of contact time. More than 99% of
QCoPz was adsorbed in approximately 5 min followed by
a constant adsorption upon further increasing the contact
time. Although the equilibrium is achieved in a short time,
taking the effect of extreme conditions into account a
contact time of 2 h was selected for further testing.
Electrokinetic experiments
Because the isomorphous exchange among ions within the
clay layers, a deficiency in positive charge or, in other
terms, abundance of negative charge occurs. This abun-
dance is compensated by adsorption of cations, for example
Na? and Ca2? on to the layer surface. Bentonite has a
permanent negative charge that increases owing to iso-
morphous substitution of Al3? for Si4? in the tetrahedral
layer and Mg2? for Al3? in the octahedral layer. It is
known from the literature that there is a direct relationship
between adsorption of any adsorbate on to a solid surface
and the change of zeta potential of this solid surface [23]. A
series of measurements were thus conducted to determine
the relationship between adsorption mechanism and zeta
potential, as depicted in Fig. 1c. Evidently, pure clay has a
zeta potential of -35.8 mV, which means that the ben-
tonite used in this study has a negative surface charge.
Because of adsorption of the QCoPz on to the bentonite,
the zeta potential becomes positive, and a final zeta
potential of ?20.24 mV was observed. This change proves
the presence of cationic adsorbate on the negatively
charged clay surface.
Change of pH during adsorption
Bentonite clay and QCoPz have natural pH 8.23 and 8.00,
respectively, in distilled water. Different concentrations of
the dye yielded a constant value of pH 7.30 after the
adsorption process.
Kinetic modeling
Adsorption of organic compounds by natural materials in
aqueous solution is a phenomenon with often complex
kinetics, because of their heterogeneous reactive surfaces.
Because the rate of adsorption controls the residence time
of adsorbate at solid–liquid interfaces, it is an important
factor in determination of the performance of the adsorp-
tion process [24]. Prediction of the adsorption kinetics
provides the most vital information for designing adsorp-
tion systems. Adsorption kinetics include the search for the
best model that best represents the experimental data as a
function of environmental conditions.
In this study, in order to determine the efficiency of
bentonite for adsorption of QCoPz (initial concentra-
tion = 1 mmol dm-3) a series of batch adsorption kinetic
experiments were performed at natural pH (7–8) and 25 �C
for a 2-h contact period. Pseudo first and second-order,
simple Elovich, and intra-particle diffusion kinetic models
were then used to fit the experimental data.
: 25 °C
: 25 °C
: 25 °C
0.0
0.2
0.4
0.6
0.8
1.0
1.2
0.0 0.5 1.0 1.5 2.0 2.5
adso
rpti
on d
ensi
ty/m
mol
g-1
solid concentration/%
: 25 °CCi : 1 mmol dm-3
pH: Natural (7-8) Mix. Time: 2h
0.930
0.935
0.940
0.945
0.950
0.955
0 100 200 300 400 500 600 700ad
sorp
tion
den
sity
/mm
ol g
-1
contact time/min
: 25 °CCi : 1 mmol dm-3
pH: Natural (7-8)Solid Conc. : 0.1%
-40
-30
-20
-10
0
10
20
30
0.00 0.01 0.02 0.03 0.04
zeta
pot
enti
al/m
V
Ce /mmol dm-3
: 25 °CpH: Natural (7-8)Solid Conc. : 0.1%
(A) (B) (C)
T
T
T
Fig. 1 Adsorption density of QCoPz versus solid concentration (a) and contact time (b) in the bentonite–QCoPz system; variation of zeta
potential with QCoPz concentrations (c)
Preparation of novel heterogeneous catalysts 387
123
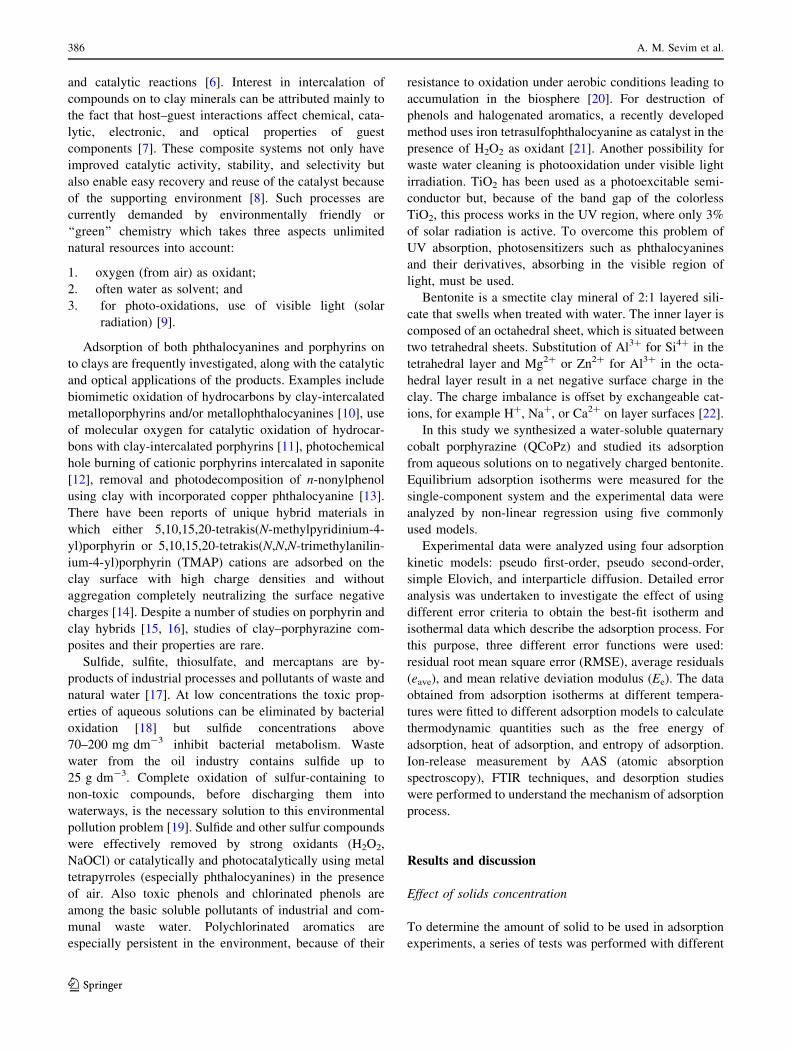
The pseudo first-order Lagergren equation [25] is gen-
erally expressed as:
dqt=dt ¼ k1 qe � qtð Þ ð1Þ
where qe and qt (mmol g-1) are the amounts of adsorbed
dye on the adsorbent at equilibrium and at time t, and k1 is
the rate constant of the pseudo first-order kinetic model.
After integration and applying boundary conditions t = 0
to t and qt = 0 to qt, the integrated form of the equation
becomes:
log qe � qtð Þ ¼ log qe � k1=2:303ð Þt ð2Þ
The plots of log(qe - qt) against t (shown in Fig. 2a) for
the pseudo first-order equation give a linear relationship
and k1 and qe values can be determined from the slope and
intercept, respectively, of this equation. The values of the
first-order model equilibrium rate constant k1, which is the
slope of the line in Fig. 2a, and the corresponding
correlation coefficients, are summarized in Table 1
together with the kinetic constants of the other models
used.
The theoretical value qe from the first-order kinetic
model was significantly different from the experimental
value and the correlation coefficient was also found to be
slightly lower. The first-order kinetic model for this system
did not suit the data well.
The kinetic data were further analyzed using pseudo
second-order kinetics [26], represented as:
dqt=dt ¼ k2 qe � qtð Þ2 ð3Þ
where k2 is the pseudo second-order rate constant
(mmol g-1 min-1), qe and qt are the adsorption capacity
(mmol g-1) at equilibrium and at time t, respectively. For
the boundary conditions of t = 0 to t and qt = 0 to qt, the
integrated form of equation becomes:
t=qt ¼ 1= k2q2e
� �þ t=qe ð4Þ
where k2q2e represents the initial rate of adsorption. If
second-order kinetics are applicable, the plot of t/qt versus t
should be linear. The values of k2 and qe obtained from the
pseudo second-order kinetic model, the correlation coeffi-
cients R2, and the experimental qexp are given in Table 1.
The values of pseudo second-order model variables qe and
k2 were determined from the slope and intercept of the t/qt
versus t plot (Fig. 2b).
According to the model, the calculated initial rate of
adsorption (k2q2e) of bentonite was 0.062 mmol g-1 min-1.
As can be seen from Table 1, the pseudo second-order
model adequately fits the data over the entire course of the
experiment with a high correlation coefficient ([0.98).
Moreover, the experimental adsorption capacities of the
adsorbent are close to the theoretical values estimated from
: 25 °C
: 25 °C
: 25 °C
: 25 °C
y = -0.1084x - 3.7866R² = 0.9591
-8
-7
-6
-5
-4
-3
-2
-1
0
0 5 10 15 20 25 30 35
log
(qe
-qt)
t / min
y = 1.0489x + 0.0617R² = 1
0
100
200
300
400
500
600
700
0 100 200 300 400 500 600 700
t /q t
t / min
y = 0.0082x + 0.926R² = 0.969
0.930
0.935
0.940
0.945
0.950
0.955
0.0 0.5 1.0 1.5 2.0 2.5 3.0 3.5 4.0
q t/m
mol
g-1
ln t
y = 0.0055x + 0.9266R² = 0.9417
0.930
0.935
0.940
0.945
0.950
0.955
0.960
0 1 2 3 4 5 6
q t/ m
mol
g-1
t0.5
(A)
(C) (D)
(B): 25 °C
: 25 °C
: 25 °C
: 25 °C
T
T
T
T
Fig. 2 Pseudo first-order (a),
pseudo second-order (b),
Elovich (c), and intraparticle
diffusion (d) plots for QCoPz
adsorption
388 A. M. Sevim et al.
123
the model. Hence, error analysis values are much lower
than those obtained by application of the pseudo first-order
model. For the bentonite–QCoPz system, these findings
revealed that the adsorption process follows the pseudo
second-order model.
The Elovich model, which is a general application of
chemisorption kinetics, assumes that the active sites of
adsorbents are heterogeneous and have different activation
energies for adsorption of organic compounds. The Elovich
model is expressed by the equation [27]:
dqt=dt ¼ a exp �b qtð Þ ð5Þ
For the boundary conditions t = 0 to t and qt = 0, the
integrated form of the equation becomes:
qt ¼ ð1=bÞ ½ln ðabÞ þ ln t� ð6Þ
Equation 6 is simplified as follows:
qt ¼ aþ b ln t ð7Þ
In accordance with the Elovich model the slope and
intercept of the plot of qt versus ln t, shown in Fig. 2c,
were used to calculate the constants a and b (Table 1).
The value of b (mmol g-1 min-1) is the initial adsorption
rate constant and a (mmol g-1) is related to the extent of
surface coverage and the energy of activation for
chemisorption. The value of the correlation coefficient
determined for the plot was 0.79. Moreover, the
calculated adsorption capacity values obtained from this
kinetic model do not fit the experimental adsorption
capacity values. The error analysis values are also
higher than those obtained from the pseudo second-order
model.
Last, adsorption kinetic data were analyzed to determine
whether intraparticle diffusion is the rate limiting step in
the adsorption process. The intraparticle diffusion approach
can be described by the equation [28]:
qt ¼ kpt0:5 ð8Þ
where qt (mmol g-1) is the concentration of QCoPz
adsorbed at time t and kp (mmol g-1 min-0.5) is the
intraparticle rate constant. This model also suggests that
the adsorption process is considered to be controlled by the
internal diffusion with a minor effect of external diffusion.
The plot of the fraction of QCoPz uptake against the square
root of contact time (t0.5) is shown in Fig. 2d. This figure
reveals that the straight line obtained for bentonite does not
pass through the origin. It has been suggested that this
occurs when external diffusion is dominant and
intraparticle diffusion is not a rate-limiting step. In this
case, the equation used to describe the model is:
qt ¼ kpt0:5 þ C ð9Þ
where C is the intercept and values of C give an idea about
the thickness of boundary layer (Table 1), i.e. the larger the
intercept the greater is the boundary layer effect.
Figure 3 compares the experimental and predicted qe
values for bentonite. Apparently, the pseudo second-order
model best fits bentonite for the whole contact time period
with the highest correlation constant and lowest error
analysis values.
Equilibrium modeling
The shape of an isotherm may be used to predict if an
adsorption system is ‘‘favorable’’ or ‘‘unfavorable’’. The
isotherm shape can also provide qualitative information on
the nature of the solute–surface interaction. In addition,
adsorption isotherms are developed to evaluate the capacity
of a material for the adsorption of a particular dye molecule
[29].
The adsorption isotherm of the bentonite–QCoPz system
at different temperatures is shown in Fig. 4. The adsorption
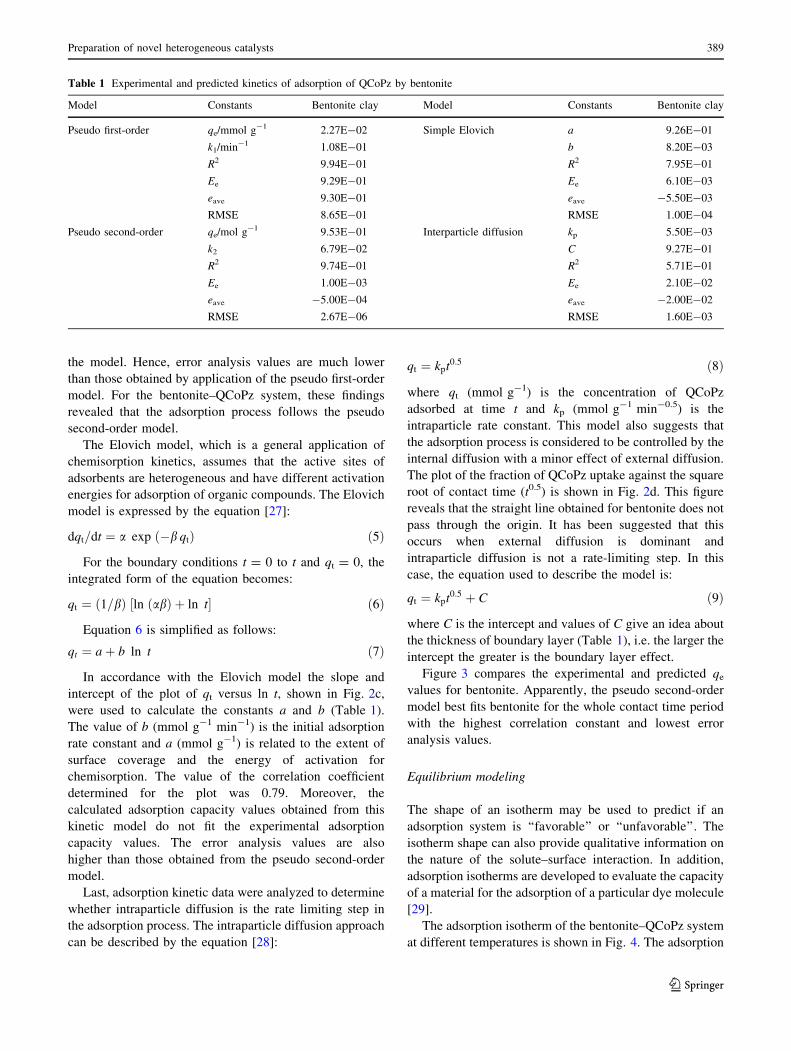
Table 1 Experimental and predicted kinetics of adsorption of QCoPz by bentonite
Model Constants Bentonite clay Model Constants Bentonite clay
Pseudo first-order qe/mmol g-1 2.27E-02 Simple Elovich a 9.26E-01
k1/min-1 1.08E-01 b 8.20E-03
R2 9.94E-01 R2 7.95E-01
Ee 9.29E-01 Ee 6.10E-03
eave 9.30E-01 eave -5.50E-03
RMSE 8.65E-01 RMSE 1.00E-04
Pseudo second-order qe/mol g-1 9.53E-01 Interparticle diffusion kp 5.50E-03
k2 6.79E-02 C 9.27E-01
R2 9.74E-01 R2 5.71E-01
Ee 1.00E-03 Ee 2.10E-02
eave -5.00E-04 eave -2.00E-02
RMSE 2.67E-06 RMSE 1.60E-03
Preparation of novel heterogeneous catalysts 389
123
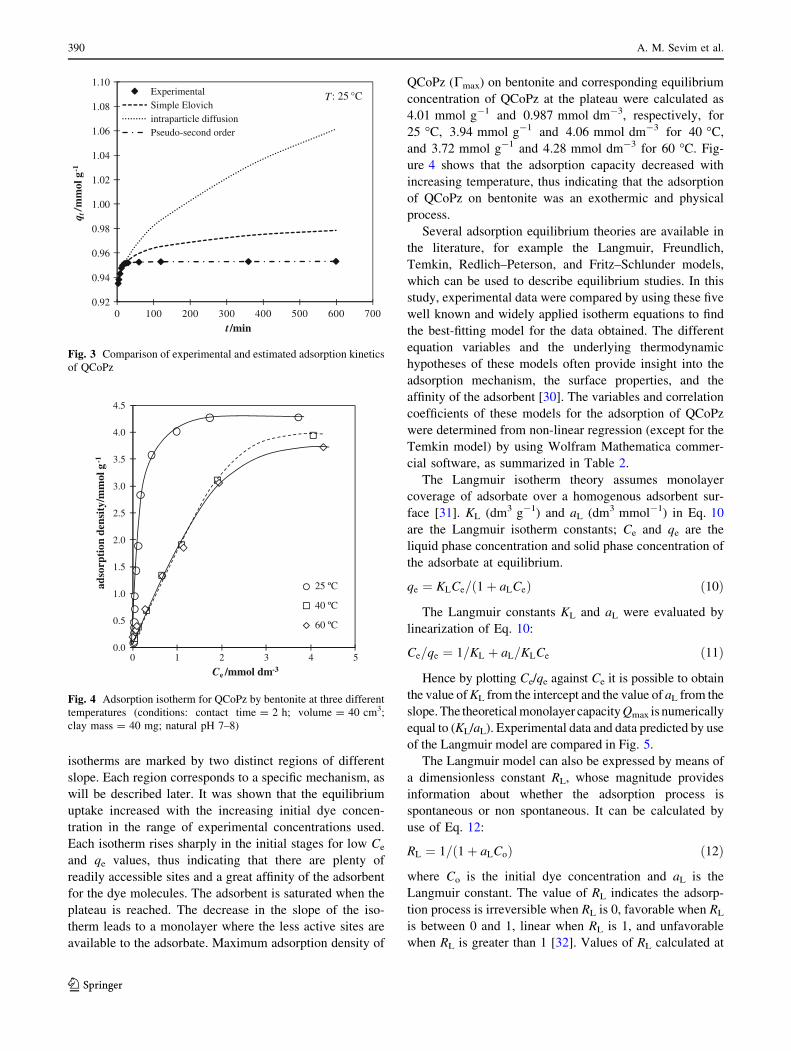
isotherms are marked by two distinct regions of different
slope. Each region corresponds to a specific mechanism, as
will be described later. It was shown that the equilibrium
uptake increased with the increasing initial dye concen-
tration in the range of experimental concentrations used.
Each isotherm rises sharply in the initial stages for low Ce
and qe values, thus indicating that there are plenty of
readily accessible sites and a great affinity of the adsorbent
for the dye molecules. The adsorbent is saturated when the
plateau is reached. The decrease in the slope of the iso-
therm leads to a monolayer where the less active sites are
available to the adsorbate. Maximum adsorption density of
QCoPz (Cmax) on bentonite and corresponding equilibrium
concentration of QCoPz at the plateau were calculated as
4.01 mmol g-1 and 0.987 mmol dm-3, respectively, for
25 �C, 3.94 mmol g-1 and 4.06 mmol dm-3 for 40 �C,
and 3.72 mmol g-1 and 4.28 mmol dm-3 for 60 �C. Fig-
ure 4 shows that the adsorption capacity decreased with
increasing temperature, thus indicating that the adsorption
of QCoPz on bentonite was an exothermic and physical
process.
Several adsorption equilibrium theories are available in
the literature, for example the Langmuir, Freundlich,
Temkin, Redlich–Peterson, and Fritz–Schlunder models,
which can be used to describe equilibrium studies. In this
study, experimental data were compared by using these five
well known and widely applied isotherm equations to find
the best-fitting model for the data obtained. The different
equation variables and the underlying thermodynamic
hypotheses of these models often provide insight into the
adsorption mechanism, the surface properties, and the
affinity of the adsorbent [30]. The variables and correlation
coefficients of these models for the adsorption of QCoPz
were determined from non-linear regression (except for the
Temkin model) by using Wolfram Mathematica commer-
cial software, as summarized in Table 2.
The Langmuir isotherm theory assumes monolayer
coverage of adsorbate over a homogenous adsorbent sur-
face [31]. KL (dm3 g-1) and aL (dm3 mmol-1) in Eq. 10
are the Langmuir isotherm constants; Ce and qe are the
liquid phase concentration and solid phase concentration of
the adsorbate at equilibrium.
qe ¼ KLCe= 1þ aLCeð Þ ð10Þ
The Langmuir constants KL and aL were evaluated by
linearization of Eq. 10:
Ce=qe ¼ 1=KL þ aL=KLCe ð11Þ
Hence by plotting Ce/qe against Ce it is possible to obtain
the value of KL from the intercept and the value of aL from the
slope. The theoretical monolayer capacity Qmax is numerically
equal to (KL/aL). Experimental data and data predicted by use
of the Langmuir model are compared in Fig. 5.
The Langmuir model can also be expressed by means of
a dimensionless constant RL, whose magnitude provides
information about whether the adsorption process is
spontaneous or non spontaneous. It can be calculated by
use of Eq. 12:
RL ¼ 1= 1þ aLCoð Þ ð12Þ
where Co is the initial dye concentration and aL is the
Langmuir constant. The value of RL indicates the adsorp-
tion process is irreversible when RL is 0, favorable when RL
is between 0 and 1, linear when RL is 1, and unfavorable
when RL is greater than 1 [32]. Values of RL calculated at
: 25 °C
0.92
0.94
0.96
0.98
1.00
1.02
1.04
1.06
1.08
1.10
0 100 200 300 400 500 600 700
q t/m
mol
g-1
t /min
ExperimentalSimple Elovichintraparticle diffusionPseudo-second order
: 25 °CT
Fig. 3 Comparison of experimental and estimated adsorption kinetics
of QCoPz
0.0
0.5
1.0
1.5
2.0
2.5
3.0
3.5
4.0
4.5
0 1 2 3 4 5
adso
rpti
on d
ensi
ty/m
mol
g-1
Ce /mmol dm-3
25 ºC
40 ºC
60 ºC
Fig. 4 Adsorption isotherm for QCoPz by bentonite at three different
temperatures (conditions: contact time = 2 h; volume = 40 cm3;
clay mass = 40 mg; natural pH 7–8)
390 A. M. Sevim et al.
123
25, 40, and 60 �C were in range between 0 and 1 which
indicate that adsorption is favorable under the operation
conditions studied.
The Freundlich expression Eq. 13 is an exponential
equation and therefore assumes that as the adsorbate con-
centration increases so does the concentration of adsorbate
on the adsorbent surface. Theoretically, using this expres-
sion, an infinite amount of adsorption can occur [33].
qe ¼ KFC1=ne ð13Þ
In this equation KF and n are the Freundlich constants
related to adsorption capacity and adsorption intensity,
respectively. This expression is characterized by the
heterogeneity factor, 1/n, and so the Freundlich isotherm
may be used to describe heterogeneous systems.
The Freundlich constants are empirical constants which
depend on several environmental factors. The value of 1/n
ranges between 0 and 1, and indicates the degree of
non-linearity between solution concentration and adsorp-
tion as follows. If the value of 1/n is equal to unity, the
adsorption is linear; if the value is below unity, this implies
that the adsorption process is chemical; if the value is
above unity, adsorption is a favorable physical process;
the more heterogeneous the surface, the closer the value of
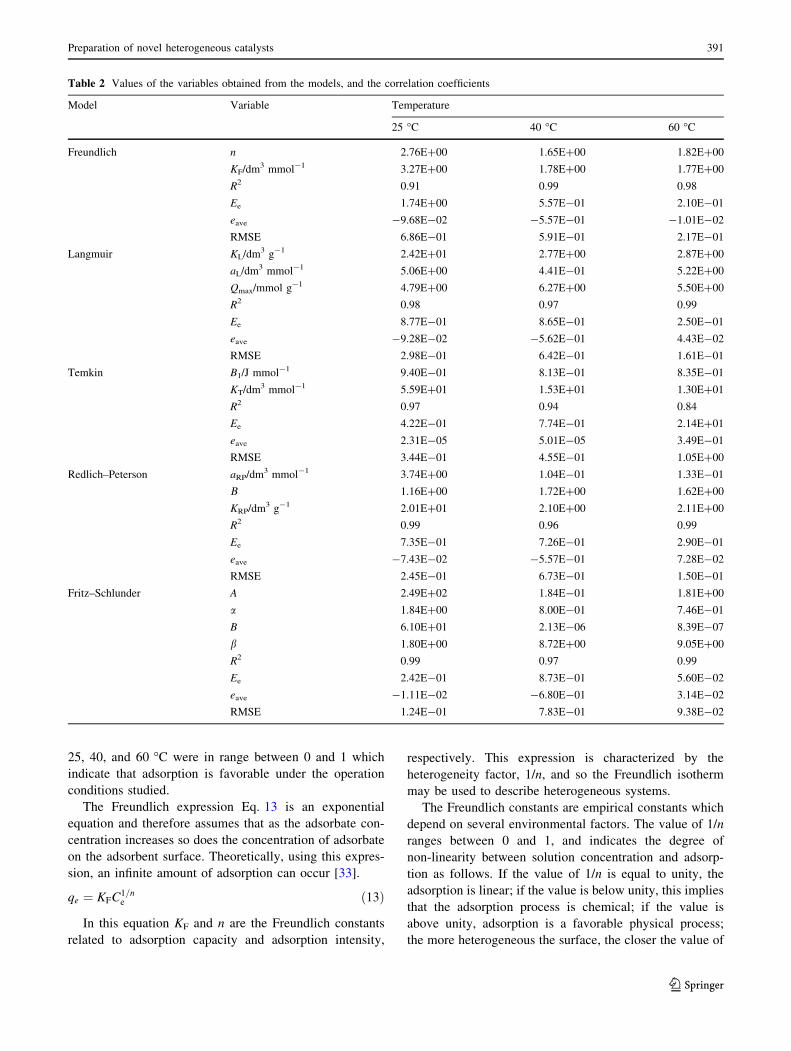
Table 2 Values of the variables obtained from the models, and the correlation coefficients
Model Variable Temperature
25 �C 40 �C 60 �C
Freundlich n 2.76E?00 1.65E?00 1.82E?00
KF/dm3 mmol-1 3.27E?00 1.78E?00 1.77E?00
R2 0.91 0.99 0.98
Ee 1.74E?00 5.57E-01 2.10E-01
eave -9.68E-02 -5.57E-01 -1.01E-02
RMSE 6.86E-01 5.91E-01 2.17E-01
Langmuir KL/dm3 g-1 2.42E?01 2.77E?00 2.87E?00
aL/dm3 mmol-1 5.06E?00 4.41E-01 5.22E?00
Qmax/mmol g-1 4.79E?00 6.27E?00 5.50E?00
R2 0.98 0.97 0.99
Ee 8.77E-01 8.65E-01 2.50E-01
eave -9.28E-02 -5.62E-01 4.43E-02
RMSE 2.98E-01 6.42E-01 1.61E-01
Temkin B1/J mmol-1 9.40E-01 8.13E-01 8.35E-01
KT/dm3 mmol-1 5.59E?01 1.53E?01 1.30E?01
R2 0.97 0.94 0.84
Ee 4.22E-01 7.74E-01 2.14E?01
eave 2.31E-05 5.01E-05 3.49E-01
RMSE 3.44E-01 4.55E-01 1.05E?00
Redlich–Peterson aRP/dm3 mmol-1 3.74E?00 1.04E-01 1.33E-01
B 1.16E?00 1.72E?00 1.62E?00
KRP/dm3 g-1 2.01E?01 2.10E?00 2.11E?00
R2 0.99 0.96 0.99
Ee 7.35E-01 7.26E-01 2.90E-01
eave -7.43E-02 -5.57E-01 7.28E-02
RMSE 2.45E-01 6.73E-01 1.50E-01
Fritz–Schlunder A 2.49E?02 1.84E-01 1.81E?00
a 1.84E?00 8.00E-01 7.46E-01
B 6.10E?01 2.13E-06 8.39E-07
b 1.80E?00 8.72E?00 9.05E?00
R2 0.99 0.97 0.99
Ee 2.42E-01 8.73E-01 5.60E-02
eave -1.11E-02 -6.80E-01 3.14E-02
RMSE 1.24E-01 7.83E-01 9.38E-02
Preparation of novel heterogeneous catalysts 391
123

1/n is to 0 [34]. This value is the adsorption density, and
because its value is between 1 and 10, the adsorption process
is considered to be satisfactory. If the value of n is less than 1,
the adsorption process is chemical in nature. The opposite
case indicates a physical adsorption process. In our study, the
values found for bentonite were around 1.65 and 2.75, which
proves that the adsorption is a spontaneous and physical
process. Experimental data and data predicted by the Lang-
muir model are compared in Fig. 5.
Redlich and Peterson [35] proposed an empirical equa-
tion incorporating three variables which may be used to
represent adsorption equilibria over a wide concentration
range and can be applied either in homogeneous or heter-
ogeneous systems because of its versatility. The Redlich–
Peterson equation is represented by Eq. 14:
qe ¼ KRPCe= 1þ aRPCbe
� �ð14Þ
where KRP (dm3 g-1) and aRP (dm3 mmol-1) are isotherm
constants, and b is an exponent which lies between 0 and 1.
This isotherm combines elements from both the Langmuir
and Freundlich equations, and the mechanism of adsorption
is a hybrid and does not follow ideal monolayer adsorption.
At high liquid-phase concentrations of the adsorbate
(which means the result of aRP 9 Cbe is bigger than 1),
Eq. 14 reduces to the Freundlich equation, i.e.:
qe ¼ KRP=aRPð ÞC1�be ð15Þ
where KRP/aRP and (1 - b) are the variables KF and 1/n,
respectively, of the Freundlich model. For b = 1, Eq. 14
reduces to the Langmuir isotherm. Experimental data and
data predicted by the Redlich–Peterson model are com-
pared in Fig. 5.
Temkin and Pyzhev [36] considered the effects of
indirect adsorbate–adsorbate interactions on adsorption
isotherms and suggested that the heat of adsorption of all
molecules in the layer would decrease linearly with cov-
erage. The Temkin isotherm equation is given by the
equation:
qe ¼ ln KTCeð Þ ð16Þ
Equation 16 can be expressed in its linear form as:
qe ¼ B1 ln KT þ B1 ln Ce ð17Þ
where
B1 ¼ RT=b ð18Þ
The adsorption data can be analyzed according to
Eq. 17. A plot of qe versus ln Ce enables determination of
the isotherm constants KT and B1 (Fig. 5). The constant B1
is related to the heat of adsorption (J mmol-1).
An important four-variable equation of Langmuir–
Freundlich type was developed empirically by Fritz and
Schlunder [37]. It is expressed by the equation:
qe ¼ ACae= 1þ BCb
e
� �b and a\1 ð19Þ
where qe is the amount adsorbed at equilibrium
(mmol g-1), Ce the equilibrium concentration of the
adsorbate (mmol dm-3), A and B are the Fritz–Schlunder
parameters, and a and b are the Fritz–Schlunder equation
exponents. At high liquid-phase concentrations of the
adsorbate, Eq. 19 reduces to the Freundlich equation:
qe ¼ ACa�be =B ð20Þ
where A/B and (a - b) are the variables KF and 1/n,
respectively, of the Freundlich model. For a = b = 1,
Eq. 19 reduces to the Langmuir equation, with B = aL and
A = KL.
When the curves obtained for bentonite are compared
(Fig. 5), experimental values are almost identical with the
data obtained by use of the Fritz–Schlunder adsorption
model. Table 2 indicates that the correlation constants
obtained for all temperatures and systems are equal to 0.99
and that error analyses yield the lowest values. For all
temperatures, the experimental data almost correlate to the
four-variable Fritz–Schlunder isotherm equation. This
good correlation is ascribed to the four-variable nature of
the model.
Thermodynamic evaluation of the adsorption process
The adsorption mechanism (i.e., chemical or physical) is
often an important indicator describing the type and level of
interactions between the adsorbate and the adsorbent. If
adsorption decreases with increasing temperature, it may be
indicative of a physical process, whereas the reverse is
0
1
2
3
4
5
6
0.0 0.5 1.0 1.5 2.0 2.5 3.0 3.5 4.0
q e/m
mol
g-1
Ce /mmol dm-3
Experimental
Freundlich
Langmuir
Temkin
Redlich-Peterson
Fritz-Schlunder
Fig. 5 Comparison of experimental and predicted adsorption iso-
therms of QCoPz on bentonite for all the models analyzed
392 A. M. Sevim et al.
123
generally true for chemisorption. In the bentonite–QCoPz
system, the decrease in adsorption with increasing temper-
ature and fast adsorption kinetics may suggest the presence
of physical adsorption. Nevertheless, this alone is not suffi-
cient to determine the type of adsorption. The type of
adsorption may be determined by thermodynamic quantities,
for example free energy of adsorption (DG�ads) and the heat of
adsorption (DH�ads) both of which can be obtained from the
adsorption data given in Fig. 4. A general isotherm for
adsorption at the solid–liquid interface, taking into account
the effect of size ratio (n) and lateral interaction coefficient
(a) between adsorbed molecules, has the form [38]:
h eð�2ahÞ= 1� hð Þn¼ KCe ð21Þ
where
K ¼ eð�DG�ads=RTÞ=55:5 ð22Þ
is the adsorbability of the adsorbate molecule at infinitively
low coverage, Ce is the equilibrium concentration in
mol dm-3, h is the degree of surface coverage of the
mineral with the collector molecule at (C/Cmax), R is the
gas constant (8.1314 J mol-1 K-1), T is the temperature in
K, and Cmax is the adsorption density at the plateau. The
free energy of adsorption can be calculated from Eq. 22 as
a function of h.
Calculation of DG�ads was performed using five models:
the Flory–Huggins [39], Frumkin [40], modified Frumkin
[41], Dubinin–Radushkevich, and Langmuir [42] equa-
tions. If the adsorption data obey these equations, the
variables, i.e., n, a, and K, are plugged into Eqs. 21 and 22
and the free energy of adsorption is calculated. The value
of n for the Flory–Huggins and modified Frumkin equa-
tions depend on the size of the adsorbate. The values of
pairs a and n pairs for the Frumkin, modified Frumkin,
Flory–Huggins, and Langmuir equations are 1,1; 2,1; 2,0;
and 1,0, respectively.
For instance, by rearranging Eq. 21 and taking the log-
arithms for n = 2 and a = 1, the modified Frumkin
equation is obtained:
ln h=Ce 1� hð Þ2h i
¼ 2ahþ ln K ð23Þ
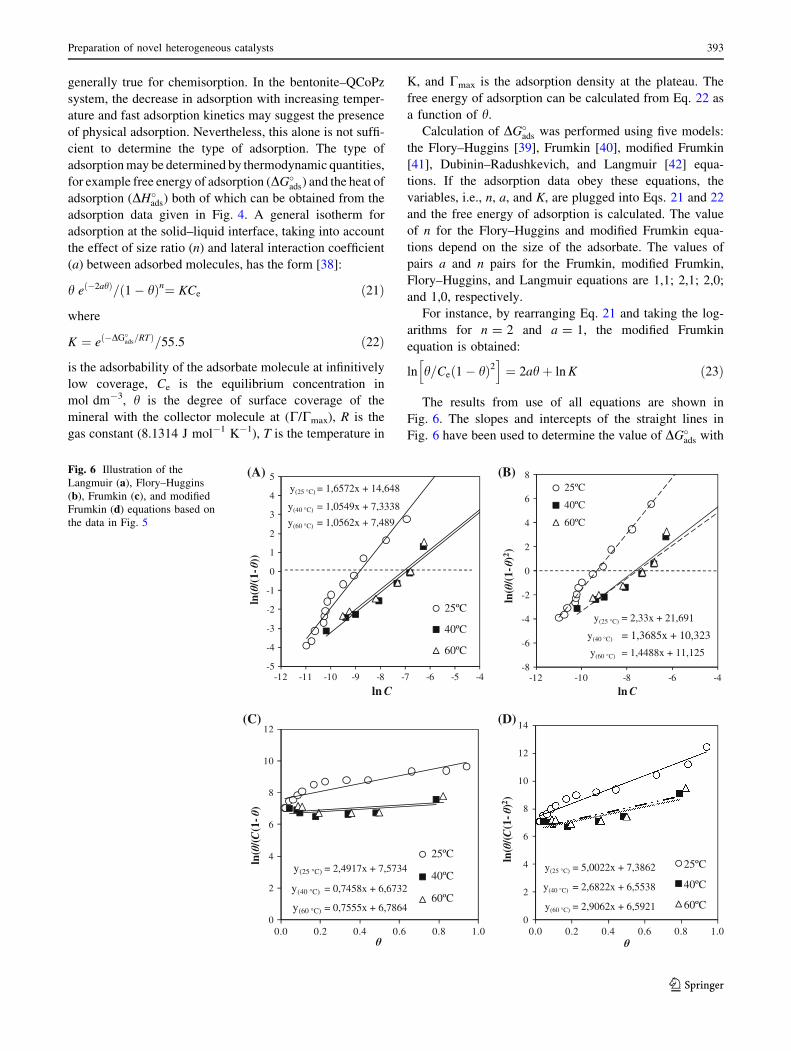
The results from use of all equations are shown in
Fig. 6. The slopes and intercepts of the straight lines in
Fig. 6 have been used to determine the value of DG�ads with
y(25 °C) = 2.4917x + 7.5734
y(40 °C) = 0.7458x + 6.6732
y(60 °C) = 0.7555x + 6.7864
y(25 °C) = 2.33x + 21.691
y(40 °C) = 1.3685x + 10.323
y(60 °C) = 1.488x + 11.125
y(25 °C)=1.6572x+14.648
y(40 °C)=1.0549x+7.3338
y(60 °C)=1.0562x+7.489
y(25 °C) = 2,4917x + 7,5734
y(40 °C) = 0,7458x + 6,6732
y(60 °C) = 0,7555x + 6,78640
2
4
6
8
10
12
0.0 0.2 0.4 0.6 0.8 1.0
ln(
/(C(1
-)
25ºC
40ºC
60ºC
y(25 °C) = 5,0022x + 7,3862
y(40 °C) = 2,6822x + 6,5538
y(60 °C) = 2,9062x + 6,59210
2
4
6
8
10
12
14
0.0 0.2 0.4 0.6 0.8 1.0
ln(
/(C(1
-)2 )
25ºC
40ºC
60ºC
y(25 °C) = 1,6572x + 14,648
y(40 °C) = 1,0549x + 7,3338
y(60 °C) = 1,0562x + 7,489
-5
-4
-3
-2
-1
0
1
2
3
4
5
-12 -11 -10 -9 -8 -7 -6 -5 -4
ln(
/(1-
))
ln C
25ºC
40ºC
60ºC
y(25 °C) = 2,33x + 21,691
y(40 °C) = 1,3685x + 10,323
y(60 °C) = 1,4488x + 11,125-8
-6
-4
-2
0
2
4
6
8
-12 -10 -8 -6 -4
ln(
/(1-
)2 )
ln C
25ºC
40ºC
60ºC
(B)
(D)(C)
(A)Fig. 6 Illustration of the
Langmuir (a), Flory–Huggins
(b), Frumkin (c), and modified
Frumkin (d) equations based on
the data in Fig. 5
Preparation of novel heterogeneous catalysts 393
123

the results presented in Table 3. DG�ads determines the
affinity of the mineral surface for the adsorbate molecules
at very low coverage. The term a, on the other hand,
represents the strength of lateral interactive forces among
QCoPz molecules which are adsorbed on the surface. The
magnitude of a increases with the magnitude of coating,
and indicates the intensity of the interaction. Negative
values of the a coefficient mean there is an interaction
between adsorbate molecules and, generally, polar moieties
of the adsorbate are interacting with each other. Positive
values of a indicate repulsion [43, 44]. As seen in Table 3,
the calculated a value is low and positive for bentonite–
QCoPz. The low value indicates that the interaction in the
adsorptive layer is of weak lateral nature. The positive
value, on the other hand, shows that polar moieties of the
adsorbate apply a repulsive force to each other. The
Frumkin equation and its modified form take into account
both the size ratio and the lateral interaction coefficient and
it seem to result in better predictions than the Langmuir
and Flory–Huggins equations.
Another equation that has been used to determine the
possible adsorption mechanism is the Dubinin–Radushke-
vich equation, which assumes a constant sorption potential
[45]. The linear presentation of this equation is expressed
by:
ln qe ¼ ln Qm � Ke2 ð24Þe ¼ RT ln 1þ 1=Ceð Þ ð25Þ
where e is the Polanyi potential, Qm is the monolayer
capacity (mol g-1), Ce is the equilibrium concentration
(mol dm-3), and K is a constant related to the adsorption
energy (mol2 J-2). Qm and K can be obtained from the
intercept and slope of the plot of ln qe versus e2.
The mean free energy of sorption, E, is calculated by use
of the equation:
E ¼ 2Kð Þ�0:5 ð26Þ
The Dubinin–Radushkevich variables and mean free
energy are given in Table 3. The magnitude of E is useful
Table 3 Thermodynamic data for adsorption of QCoPz on bentonite
Model Variable Temperature
298 K 313 K 333 K
1,000/T 3.36E?00 3.20E?00 3.00E?00
Cmax/mol g-1 4.30E-03 3.90E-03 3.70E-03
Langmuir KL/dm3 mol-1 6.90E?03 1.05E?03 1.20E?03
ln KL 8.84E?00 6.95E?00 7.09E?00
DG�ads/kJ mol-1 -3.11E?01 -2.66E?01 -2.69E?01
DH�ads/kJ mol-1 -3.97E?01 -3.97E?01 -3.97E?01
TDS�ads/kJ mol-1 -8.58E?00 -1.32E?01 -1.28E?01
Flory–Huggins KFH/dm3 mol-1 1.10E?04 1.89E?03 2.16E?03
ln KFH 9.31E?00 7.54E?00 7.68E?00
DG�ads/kJ mol-1 -3.30E?01 -3.01E?01 -3.24E?01
DH�ads/kJ mol-1 -3.70E?01 -3.70E?01 -3.70E?01
TDS�ads/kJ mol-1 -4.01E?00 -6.95E?00 -4.65E?00
Frumkin a 1.25E?00 3.70E-01 3.80E-01
K/dm3 mol-1 1.95E?03 7.91E?02 8.86E?02
ln K 7.57E?00 6.67E?00 6.79E?00
DG�ads/kJ mol-1 -2.87E?01 -2.78E?01 -2.99E?01
DH�ads/kJ mol-1 -1.78E?01 -1.78E?01 -1.78E?01
TDS�ads/kJ mol-1 1.10E?01 1.00E?01 1.21E?01
Modified Frumkin a 2.50E?00 1.34E?00 1.45E?00
K/dm3 mol-1 1.61E?03 7.02E?02 7.29E?02
ln K 7.39E?00 6.55E?00 6.59E?00
DG�ads/kJ mol-1 -2.83E?01 -2.75E?01 -2.94E?01
DH�ads/kJ mol-1 -1.81E?01 -1.81E?01 -1.81E?01
TDS�ads/kJ mol-1 1.02E?01 9.44E?00 1.13E?01
Dubinin–Radushkevich Qm/mol g-1 3.69E-05 1.54E-02 5.10E-03
K/mol2 J-2 7.13E-09 6.63E-09 3.14E-09
E/kJ mol-1 8.37E?00 8.68E?00 1.26E?01
394 A. M. Sevim et al.
123
for estimating the type of sorption reaction; generally an
energy range from 1 to 16 kJ mol-1 indicates that the
adsorption process is physical and a range from 8 to
16 kJ mol-1 indicates an ion-exchange reaction [45].
Therefore, the E values obtained from the above equation
(8.4–12.6 kJ mol-1) are practically in the ion-exchange
energy range, supporting the idea that for adsorption of
QCoPz species on to bentonite the ion-exchange
mechanism is very important.
Another very important thermodynamic value in deter-
mining the type of adsorption is the heat of adsorption
(DH�ads). This can be obtained from Van’t Hoff’s equation
[46]:
dðln KÞ=d 1=Tð Þ ¼ �DHoads=R ð27Þ
The slopes of ln K versus 1/T are used in Eq. 27 to
calculate DH�ads for each model. The results are presented in
Table 3, with the entropy values calculated by use of
Eq. 28 given below:
DG ¼ DH � T DS ð28Þ
The adsorption process is composed of two contributions,
enthalpic and entropic, which determine whether or not the
reaction is spontaneous. The negative value of free energy of
adsorption calculated according to all models indicates that
adsorption of QCoPz ions on the bentonite surface and
between the layers is spontaneous. The negative value of the
enthalpy (Table 3) means that heat is released from
the adsorption process. Generally, an exothermic adsorption
process signifies either physisorption or chemisorption
whereas an endothermic process is attributable unequiv-
ocally to chemisorption. In an exothermic process,
physisorption is distinguished form chemisorption by
considering the absolute value of the adsorption enthalpy.
Typically, the enthalpy of a physisorption process is less than
41.86 kJ mol-1 whereas the enthalpy of a chemisorption
process approaches 100 kJ mol-1. In this work the absolute
values of enthalpy are relatively low, approaching those
typical of physisorption. This conclusion is also supported by
the kinetics of adsorption which were complete in less than 5
min with 99% yield. The positive value of DS�ads indicates
that there is an increase in the randomness of the solid–
solution interface of the system during the adsorption
process. In ion-exchange processes, especially, water
molecules released into the bulk solution from the solid
surface cause an increase of entropy [47].
Desorption studies
To investigate the stability of QCoPz adsorbed on to ben-
tonite, desorption studies were conducted in distilled water.
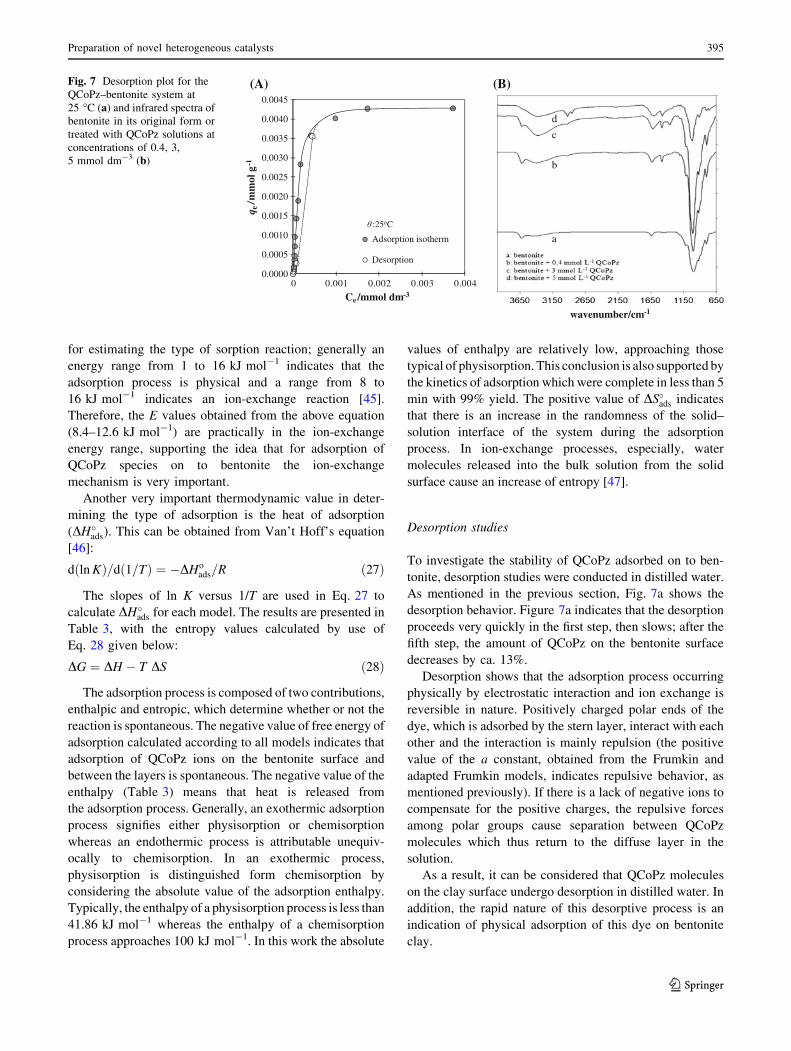
As mentioned in the previous section, Fig. 7a shows the
desorption behavior. Figure 7a indicates that the desorption
proceeds very quickly in the first step, then slows; after the
fifth step, the amount of QCoPz on the bentonite surface
decreases by ca. 13%.
Desorption shows that the adsorption process occurring
physically by electrostatic interaction and ion exchange is
reversible in nature. Positively charged polar ends of the
dye, which is adsorbed by the stern layer, interact with each
other and the interaction is mainly repulsion (the positive
value of the a constant, obtained from the Frumkin and
adapted Frumkin models, indicates repulsive behavior, as
mentioned previously). If there is a lack of negative ions to
compensate for the positive charges, the repulsive forces
among polar groups cause separation between QCoPz
molecules which thus return to the diffuse layer in the
solution.
As a result, it can be considered that QCoPz molecules
on the clay surface undergo desorption in distilled water. In
addition, the rapid nature of this desorptive process is an
indication of physical adsorption of this dye on bentonite
clay.
T: 25 °C
wavenumber/cm-1
(B)(A)
0.0000
0.0005
0.0010
0.0015
0.0020
0.0025
0.0030
0.0035
0.0040
0.0045
0 0.001 0.002 0.003 0.004
a
b
c
d
q e/m
mol
g-1
Ce /mmol dm-3
Adsorption isotherm
Desorption
:25oC
Fig. 7 Desorption plot for the
QCoPz–bentonite system at
25 �C (a) and infrared spectra of
bentonite in its original form or
treated with QCoPz solutions at
concentrations of 0.4, 3,
5 mmol dm-3 (b)
Preparation of novel heterogeneous catalysts 395
123

FT-IR spectral studies of QCoPz adsorbed
on to bentonite samples
FT-IR spectrometry is a useful tool for determining whe-
ther the adsorptive interaction between QCoPz and
bentonite is a physical or chemical process; FT-IR spectra
of dried composites can give an idea about this interaction.
Figure 7b shows the FTIR spectrum of bentonite. The
stretching vibrations of structural –OH groups were
observed at 3,627 cm-1, structural Si–O at 991 cm-1, and
stretching vibrations of structural AlAlOH, AlFeOH, or
AlMgOH groups generally between 915 and 880 cm-1.
Water in bentonite results in a broad stretching vibration
band at 3,417 cm-1. This peak generally has an overtone
shoulder peak at ca. 3,330 cm-1, because of the bending
vibration peak at 1,634 cm-1 [48].
FT-IR spectra of bentonite with different adsorbed
amounts of QCoPz are given in Fig. 7b. These spectra
show that low concentrations of the dye did not have an
effect; however, an initial concentration of 5 mmol dm-3
yielded signals attributable to the dye molecule at
2,921–2,850 and 1,473 cm-1. These signals prove the
adsorption of the dye molecule. In addition, this spectrum
indicates that reduced intensities of the bound water mol-
ecules at 3,417 and 3,627 cm-1 are because of exchange of
QCoPz with inorganic cations and bound water molecules.
Deformation of the band at 1,634 cm-1 (water of hydra-
tion) is evident after the adsorption process. Last, water
peaks are broadened, which indicates entrance of water
molecules to the structure. While QCoPz is being adsorbed
between layers, its adsorption is in aggregates or clusters,
thereby forming voids for water molecules [49]. Alterna-
tively, water molecules are coordinated at the axial
positions of the cobalt metal center during the adsorption
process.
IR spectra given in Fig. 7b clearly indicate that none of
the dye-containing clay samples furnished any peaks aris-
ing because of chemical (covalent) bonding. This is also an
indication of the physical adsorption behavior of the dye
molecule.
Mechanism of the adsorption process
The adsorption isotherms in Fig. 4 also contain two distinct
regions, each characterized by different adsorption rates
and mechanisms. In the first stage, adsorption takes place at
a lower rate and is governed by an ion-exchange process
and electrostatic interactions. However, the adsorption
continues to take place with increasing QCoPz concentra-
tion. In the second stage, the adsorption is mainly
characterized by strong p–p aggregates and electrostatic
interactions, but the ion-exchange process still continues to
take place at a lower rate as the release of sodium and
calcium ions (Fig. 8a, b) continues even in the plateau
region.
The free energy of adsorption (DG�ads) is composed of a
number of contributions. Among these, DG�elec;DG�solv;
DG�ion�exchange; and DG�agg are important [50]. Here DG�elec
is the electrostatic contribution to the total energy of the
interaction which occurs between quaternary ammonium
groups of the QCoPz and negatively charged bentonite
surfaces and layers, DG�agg represents the interaction
because of the association of porphyrazine molecules
(aggregation) at the interface, DG�solv is the contribution of
the solvation effects on the polar head of the adsorbate, and
DG�ion�exchange represents the exchange of similar ions (e.g.,
0.0
0.2
0.4
0.6
0.8
1.0
1.2
(A)
0.0
0.2
0.4
0.6
0.0 5.0 10.0 0.0 5.0 10.0
(B)
0.0
0.5
1.0
1.5
2.0
2.5
3.0
3.5
4.0
4.5
0.0 1.0 2.0 3.0 4.0
Total Adsorption
Ion Exchange
Ion Adsorption
0.2
0.3
0.4
0.5
0.0 2.0 4.0
adso
rpti
on/m
mol
g-1
Ce / mmol L-1
Ion Exchange
(C)so
dium
ion
conc
entr
atio
n/m
mol
dm
-3
cals
ium
ion
conc
entr
atio
n/m
mol
dm
-3
Ci /mmol dm-3 Ci /mmol dm-3Ce /mmol dm-3
Ce /mmol dm-3
adso
rpti
on/m
mol
g-1
Fig. 8 Released sodium (a) and calcium (b) ion concentrations as a function of initial QCoPz concentration under the adsorption conditions of
Fig. 5, and ion exchange, electrostatic (ion adsorption), and total adsorption isotherms of the QCoPz–bentonite system (c)
396 A. M. Sevim et al.
123
cations or anions) on the surface with those in the bulk and
ion exchange between QCoPz and ions which are between
bentonite layers and on the surface.
In our system, DG�ion�exchange; DG�elec; and DG�agg are
responsible for the adsorption reactions in the first and
second regions of the adsorption isotherm. Ion exchange
occurs mainly among Na? and Ca2? ions on the surface,
between layers and positively charged porphyrazine
ammonium groups. Formation of hydrogen bonds between
zeolite water and bound water has been proposed for a
number of cationic adsorbate systems, for example primary
amines. However, the quaternary ammonium groups,
which are surrounded by electron-donating CH3 substitu-
ents, and the absence of vacant electrons make hydrogen
bond formation impossible.
The significant increase in sodium and calcium ion
concentrations in Fig. 8a and b and the ion-exchange iso-
therm in Fig. 8c clearly shows that an ion-exchange
mechanism is responsible for the adsorption until nearly
0.372 mmol dm-3 equilibrium concentration. At this point,
calculations using Eq. 30 revealed the mechanism was
68% ion exchange and 32% electrostatic interaction [51].
However, electrostatic adsorption increased with increas-
ing equilibrium concentrations, it was, for example, 65%
for 0.468 mmol dm-3 and 86% for 0.171 mmol dm-3.
These results indicate that ion the exchange mechanism
proceeds very rapidly at the beginning of adsorption pro-
cess, and then electrostatic interactions become more
important than ion exchange through the plateau region
(Fig. 8c). The significant increase in the slope of the
adsorption isotherm in the second region is ascribed to the
aggregation p–p interactions among the adsorbed QCoPz
molecules.
%Ion exchange ¼ ZNa � Amount of sodium in solution
ZQCoPz � Amount of adsorbed QCoPz
� 100 ðZ ¼ Valence of ionÞ ð29Þ
The results in Fig. 8c are indicative of good agreement
with desorption behavior of QCoPz. Although low in
amount, fast desorption of QCoPz from the bentonite
surface into distilled water requires a substantial amount of
adsorbate molecules to be attached to clay surface by
electrostatic interactions (ion adsorption); calculations
performed using Eq. 29 and Fig. 8c indicate that
electrostatic interaction is a very important adsorption
mechanism.
It is known from the literature that negatively charged
smectite clays form very stable complexes with cationic
guests [52]. As a result, porphyrazine derivatives having
cationic moieties such as ammonium groups can easily be
intercalated into bentonite interlayers by means of elec-
trostatic interactions.
It is known that the properties of host materials and guest
molecules affect the adsorption structure of QCoPz in the
inter-layer space. The adsorption structure of the porphyrin
molecule, which is similar to our QCoPz, on the clay surface
or within the inter-layer space was investigated by X-ray
diffraction, electron spin resonance (ESR), dichroic absorp-
tion measurements, and dichroic absorption measurements
on a waveguide. According to X-ray diffraction (XRD)
measurements, tetrapyrrole derivatives are adsorbed on the
clay surface with orientation parallel to the clay surface [52].
Generally, the angle of orientation of the porphyrin relative to
the clay surface tends to increase as the charge density of the
clay increases [53]. Another clay mineral, saponite, which
has almost the same CEC value (0.997 meq g-1) as our
bentonite sample (0.987 meq g-1), was found to host tetra-
pyrrole molecules in an orientation parallel to the surface.
ESR experiments indicate that the orientation can also change
in response to atmospheric changes, for example humidity.
The structure of the porphyrazine affects the adsorption
structure of the porphyrazine in the clay complex. Meso-
tetrakis(5-trimethylammoniopentyl) porphyrin, which has a
flexible alkyl chain in the cationic portion, was used as
the cationic adsorbate. It seems that porphyrin adsorbs on
the clay with a non-parallel (tilted) orientation relative to
the surface [52].
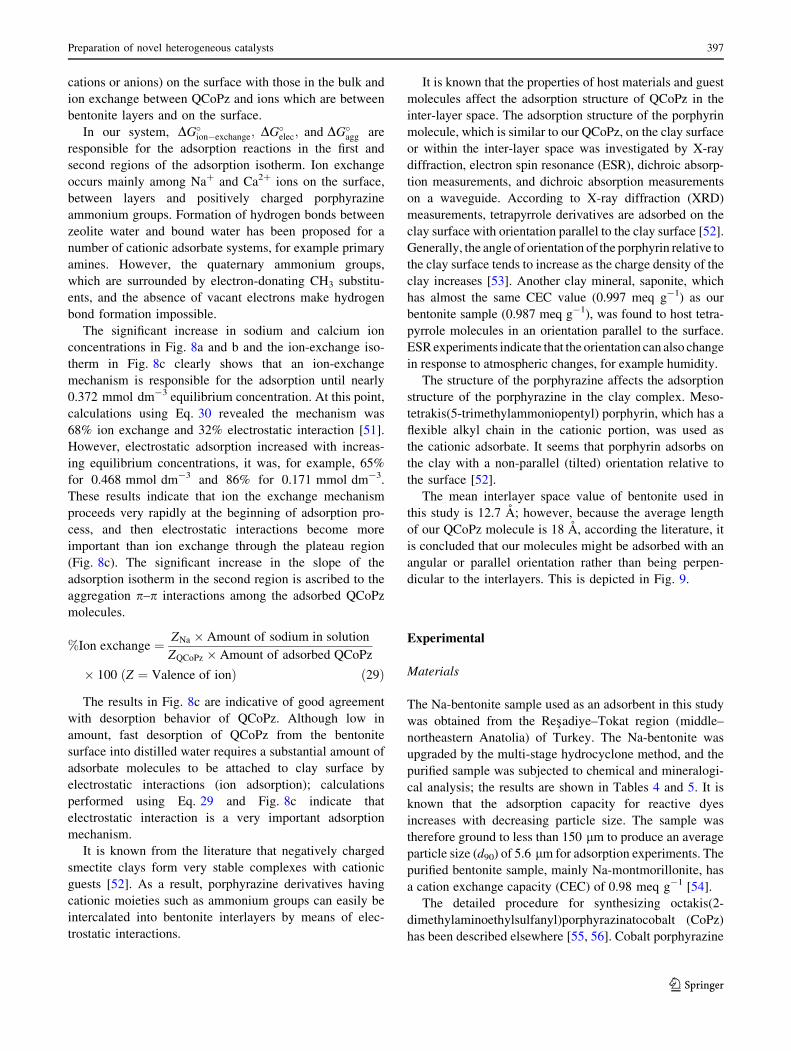
The mean interlayer space value of bentonite used in
this study is 12.7 A; however, because the average length
of our QCoPz molecule is 18 A, according the literature, it
is concluded that our molecules might be adsorbed with an
angular or parallel orientation rather than being perpen-
dicular to the interlayers. This is depicted in Fig. 9.
Experimental
Materials
The Na-bentonite sample used as an adsorbent in this study
was obtained from the Resadiye–Tokat region (middle–
northeastern Anatolia) of Turkey. The Na-bentonite was
upgraded by the multi-stage hydrocyclone method, and the
purified sample was subjected to chemical and mineralogi-
cal analysis; the results are shown in Tables 4 and 5. It is
known that the adsorption capacity for reactive dyes
increases with decreasing particle size. The sample was
therefore ground to less than 150 lm to produce an average
particle size (d90) of 5.6 lm for adsorption experiments. The
purified bentonite sample, mainly Na-montmorillonite, has
a cation exchange capacity (CEC) of 0.98 meq g-1 [54].
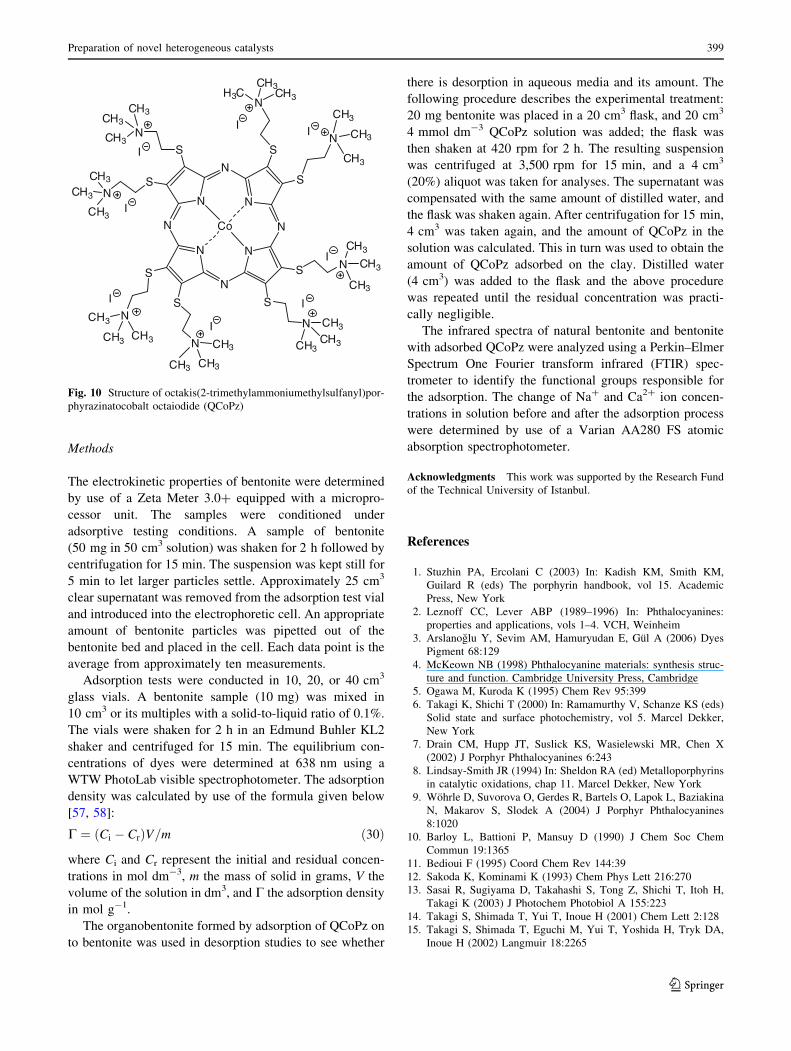
The detailed procedure for synthesizing octakis(2-
dimethylaminoethylsulfanyl)porphyrazinatocobalt (CoPz)
has been described elsewhere [55, 56]. Cobalt porphyrazine
Preparation of novel heterogeneous catalysts 397
123
was converted into the corresponding quaternized product
(QCoPz) by reaction with iodomethane in dichlorometh-
ane. CoPz (120 mg, 0.1 mmol) was dissolved in 10 cm3
dichloromethane and 1.6 cm3 iodomethane was added.
This mixture was stirred in the dark under nitrogen atmo-
sphere at room temperature for two days. The dark blue
product was precipitated by centrifugation and filtered,
then washed with dichloromethane (2–3 times) and
diethyl ether, and finally dried under vacuum for 12 h. The
yield of the water-soluble product (C56H104CoI8N16S8,
2,332 g mol-1) was 105 mg (45%). IR:�v ¼ 2; 960;
2; 930; 1; 620; 1; 480; 1; 330; 1; 215; 1; 150; 1; 010; 980; 910;
800; 750 cm�1: The UV–visible spectrum shows the main
absorbance bands in water (kmax) at 356 and 638 nm. The
chemical structure of the adsorbate is given in Fig. 10.
Distilled and deionized water with a conductivity of
2 9 10-6 mho cm-1 was used in all experiments. Exper-
iments were conducted at 25 �C unless otherwise specified.
Fig. 9 Arrangement of QCoPz
in the interlayer space of
bentonite: (a) tilted and
(b) parallel orientation
(T tetrahedral layer,
O octahedral layer,
R trimethylammonium-
ethylsulfanyl)
Table 4 Results from chemical analysis of the bentonite sample used in this study
Component Na2O MgO Al2O3 SiO2 P2O5 K2O CaO MnO TiO2 Fe2O3 LOI
% by weight 2.50 2.30 17.30 59.30 0.10 0.30 0.80 0.02 0.30 3.60 13.50
Table 5 Results from mineralogical analysis of the bentonite sample
used in this study
Mineral name Formula
Montmorillonite Na0.3(Al, Mg)2Si4O10(OH)2�4H2O
Orthoclase KAlSi3O8
Biotite KMg2.5Fe0.52?AlSi3O10(OH)1.75F0.25
Opal-CT SiO2 1.5(H2O)
Quartz SiO2
Calcite CaCO3
Amorphous –
398 A. M. Sevim et al.
123
Methods
The electrokinetic properties of bentonite were determined
by use of a Zeta Meter 3.0? equipped with a micropro-
cessor unit. The samples were conditioned under
adsorptive testing conditions. A sample of bentonite
(50 mg in 50 cm3 solution) was shaken for 2 h followed by
centrifugation for 15 min. The suspension was kept still for
5 min to let larger particles settle. Approximately 25 cm3
clear supernatant was removed from the adsorption test vial
and introduced into the electrophoretic cell. An appropriate
amount of bentonite particles was pipetted out of the
bentonite bed and placed in the cell. Each data point is the
average from approximately ten measurements.
Adsorption tests were conducted in 10, 20, or 40 cm3
glass vials. A bentonite sample (10 mg) was mixed in
10 cm3 or its multiples with a solid-to-liquid ratio of 0.1%.
The vials were shaken for 2 h in an Edmund Buhler KL2
shaker and centrifuged for 15 min. The equilibrium con-
centrations of dyes were determined at 638 nm using a
WTW PhotoLab visible spectrophotometer. The adsorption
density was calculated by use of the formula given below
[57, 58]:
C ¼ Ci � Crð ÞV=m ð30Þ
where Ci and Cr represent the initial and residual concen-
trations in mol dm-3, m the mass of solid in grams, V the
volume of the solution in dm3, and C the adsorption density
in mol g-1.
The organobentonite formed by adsorption of QCoPz on
to bentonite was used in desorption studies to see whether
there is desorption in aqueous media and its amount. The
following procedure describes the experimental treatment:
20 mg bentonite was placed in a 20 cm3 flask, and 20 cm3
4 mmol dm-3 QCoPz solution was added; the flask was
then shaken at 420 rpm for 2 h. The resulting suspension
was centrifuged at 3,500 rpm for 15 min, and a 4 cm3
(20%) aliquot was taken for analyses. The supernatant was
compensated with the same amount of distilled water, and
the flask was shaken again. After centrifugation for 15 min,
4 cm3 was taken again, and the amount of QCoPz in the
solution was calculated. This in turn was used to obtain the
amount of QCoPz adsorbed on the clay. Distilled water
(4 cm3) was added to the flask and the above procedure
was repeated until the residual concentration was practi-
cally negligible.
The infrared spectra of natural bentonite and bentonite
with adsorbed QCoPz were analyzed using a Perkin–Elmer
Spectrum One Fourier transform infrared (FTIR) spec-
trometer to identify the functional groups responsible for
the adsorption. The change of Na? and Ca2? ion concen-
trations in solution before and after the adsorption process
were determined by use of a Varian AA280 FS atomic
absorption spectrophotometer.
Acknowledgments This work was supported by the Research Fund
of the Technical University of Istanbul.
References
1. Stuzhin PA, Ercolani C (2003) In: Kadish KM, Smith KM,
Guilard R (eds) The porphyrin handbook, vol 15. Academic
Press, New York
2. Leznoff CC, Lever ABP (1989–1996) In: Phthalocyanines:
properties and applications, vols 1–4. VCH, Weinheim
3. Arslanoglu Y, Sevim AM, Hamuryudan E, Gul A (2006) Dyes
Pigment 68:129
4. McKeown NB (1998) Phthalocyanine materials: synthesis struc-
ture and function. Cambridge University Press, Cambridge
5. Ogawa M, Kuroda K (1995) Chem Rev 95:399
6. Takagi K, Shichi T (2000) In: Ramamurthy V, Schanze KS (eds)
Solid state and surface photochemistry, vol 5. Marcel Dekker,
New York
7. Drain CM, Hupp JT, Suslick KS, Wasielewski MR, Chen X
(2002) J Porphyr Phthalocyanines 6:243
8. Lindsay-Smith JR (1994) In: Sheldon RA (ed) Metalloporphyrins
in catalytic oxidations, chap 11. Marcel Dekker, New York
9. Wohrle D, Suvorova O, Gerdes R, Bartels O, Lapok L, Baziakina
N, Makarov S, Slodek A (2004) J Porphyr Phthalocyanines
8:1020
10. Barloy L, Battioni P, Mansuy D (1990) J Chem Soc Chem
Commun 19:1365
11. Bedioui F (1995) Coord Chem Rev 144:39
12. Sakoda K, Kominami K (1993) Chem Phys Lett 216:270
13. Sasai R, Sugiyama D, Takahashi S, Tong Z, Shichi T, Itoh H,
Takagi K (2003) J Photochem Photobiol A 155:223
14. Takagi S, Shimada T, Yui T, Inoue H (2001) Chem Lett 2:128
15. Takagi S, Shimada T, Eguchi M, Yui T, Yoshida H, Tryk DA,
Inoue H (2002) Langmuir 18:2265
N
N
N
N
N
N
NN
Co
S
N
CH3
CH3
SN
CH3
CH3
S
N
CH3
CH3
S
NCH3
CH3
S
N
CH3
CH3
S N
CH3
CH3
S
NCH3H3C
S
N
CH3
CH3
CH3
CH3
CH3
CH3
CH3
CH3
CH3
CH3
I
I
I
I
II
I
I
Fig. 10 Structure of octakis(2-trimethylammoniumethylsulfanyl)por-
phyrazinatocobalt octaiodide (QCoPz)
Preparation of novel heterogeneous catalysts 399
123
16. Van Damme H, Crespin M, Obrecht F, Cruz MI, Fripiat JJ (1978)
J Colloid Interface Sci 66:43
17. Elvers B, Hawkins S, Ravenscroft M, Schulz D (1989) Ullmann’s
encyclopedia of industrial chemistry, vol A13, 5th edn. VCH-
Verlag, Weinheim
18. Dannenberg S, Kroder M, Dilling W, Cypionka H (1992) Arch
Microbiol 158:93
19. Chanda M, Grinshpun A, O’Driscoll KF, Rempel GL (1984) J
Mol Catal 26:267
20. Gottschalk G, Knackmuss HJ (1993) Angew Chem Int Ed
32:1398
21. Meunier B, Sorokin A (1997) Acc Chem Res 30:470
22. Raghavacharya C (1997) Chem Eng World 32:53
23. Wakamatsu T, Fuerstenau DW (1973) AIME Trans 254:123
24. Erdinc A (2009) MSc Thesis, Bogazici University, Istanbul,
Turkey
25. Lagergren S (1898) Kungliga Svenska Vetenskapsakademiens,
Handlingar 24:1
26. Ho YS (2010) J Radioanal Nucl Chem 285:403
27. Gerente C, Lee VKC, Le Cloirec P, Mckay G (2007) Crit Rev
Environ Sci Technol 37:41
28. Dogan M, Alkan M, Turkyılmaz A, Ozdemir Y (2004) J Hazard
Mater B109:141
29. Gimbert F, Morin-Crini N, Renault F, Badot PM, Crini G (2008)
J Hazard Mater 157:34
30. Ozdemir AB, Turan M, Celik MS (2003) J Environ Eng 129:709
31. Langmuir I (1918) J Am Chem Soc 40:1361
32. Leechart P, Nakbanpote W, Thiravetyan P (2009) J Environ
Manag 90:912
33. Freundlich H (1906) Z Phys Chem 57:385
34. Al-Duri B (1996) In: McKay G (ed) Use of adsorbents for the
removal of pollutants from wastewaters, chap 7. CRC Press, New
York
35. Redlich O, Peterson DL (1959) J Phys Chem 63:1024
36. Temkin MJ, Pyzhev V (1940) Acta Physicochim 12:217
37. Fritz W, Schlunder EU (1974) Chem Eng Sci 29:1279
38. Sabah E, Saglam H, Kara M, Celik MS (1997) In: Proceedings of
fifth southern hemisphere meeting on mineral technology,
Argentina, p 277
39. Dhar HP, Conway BE, Joshi KM (1973) Electrochim Acta
18:789
40. Grchev T, Cvetkovska M, Stafilov T, Schultze JW (1991) Elec-
trochim Acta 36:1315
41. Frumkin AN, Damaskin BB (1964) In: Bockris JOM, Conway BE
(eds) Modern aspects of electrochemistry, vol 3. Butterworths,
London
42. Quan C, Khoe G, Bagster D (2001) Water Res 35:478
43. Sabah E (1998) PhD Thesis, Osmangazi University, Eskisehir,
Turkey
44. Kara M, Yuzer H, Sabah E, Celik MS (2003) Water Res 37:224
45. Krishna BS, Murty DSR, Prakash BSJ (2000) J Colloid Interface
Sci 229:230
46. Celik MS, Yoon RH (1991) Langmuir 7:79
47. Xin H, Nai-yun G, Qiao-li Z (2007) J Environ Sci 19:1287
48. Eren E, Afsin B (2008) J Hazard Mater 151:682
49. Hermosin MC, Martin P, Cornejo J (1993) Environ Sci Technol
27:2606
50. Celik MS, Somasundaran P (1988) J Colloid Interface Sci
122:163
51. Gulgonul I (2004) PhD Thesis, Istanbul Technical University,
Istanbul, Turkey
52. Takagi S, Eguchi M, Tryk DA, Inoue H (2006) J Photochem
Photobiol C 7:104
53. Ukrainczyk L, Chibwe M, Pinnavaia TJ, Boyd SA (1995) Envi-
ron Sci Technol 29:439
54. Erkan I (2008) MSc thesis, Karadeniz Technical University,
Trabzon, Turkey
55. Polat M, Gul A (2000) Dyes Pigment 45:195
56. Kavran G, Akkus H, Gul A, Erim FB (2002) J Sep Sci 25:514
57. Sabah E, Celik MS (2002) Sep Sci Technol 37:3081
58. Wang S, Li H, Xu L (2006) J Colloid Interface Sci 295:71
400 A. M. Sevim et al.
123