Preparation of lignin nanoparticles by chemical modification
11
1 23 Iranian Polymer Journal ISSN 1026-1265 Volume 23 Number 5 Iran Polym J (2014) 23:355-363 DOI 10.1007/s13726-014-0232-0 Preparation of lignin nanoparticles by chemical modification Iulian Andrei Gilca, Roxana Elena Ghitescu, Adrian Catalin Puitel & Valentin I. Popa
Transcript of Preparation of lignin nanoparticles by chemical modification

1 23
Iranian Polymer Journal ISSN 1026-1265Volume 23Number 5 Iran Polym J (2014) 23:355-363DOI 10.1007/s13726-014-0232-0
Preparation of lignin nanoparticles bychemical modification
Iulian Andrei Gilca, Roxana ElenaGhitescu, Adrian Catalin Puitel &Valentin I. Popa

1 23
Your article is protected by copyright and all
rights are held exclusively by Iran Polymer
and Petrochemical Institute. This e-offprint is
for personal use only and shall not be self-
archived in electronic repositories. If you wish
to self-archive your article, please use the
accepted manuscript version for posting on
your own website. You may further deposit
the accepted manuscript version in any
repository, provided it is only made publicly
available 12 months after official publication
or later and provided acknowledgement is
given to the original source of publication
and a link is inserted to the published article
on Springer's website. The link must be
accompanied by the following text: "The final
publication is available at link.springer.com”.

ORIGINAL PAPER
Preparation of lignin nanoparticles by chemical modification
Iulian Andrei Gilca • Roxana Elena Ghitescu •
Adrian Catalin Puitel • Valentin I. Popa
Received: 9 August 2013 / Accepted: 21 February 2014 / Published online: 12 March 2014
� Iran Polymer and Petrochemical Institute 2014
Abstract Lignin is the main natural aromatic polymer
and consists of about a quarter of lignocellulosic biomass.
That is why products obtained from lignin are very
attractive research topics, but it is also a very complex
issue due to its complicated structure which depends on the
separation method and plant species. To become a widely
used raw material, the basic characteristics and structure-
dependent properties must be elucidated, initially. For this
reason, it is necessary to obtain lignin with superior prop-
erties, to be able to compete with fossil resources. This
paper presents a chemical method to modify lignin by
hydroxymethylation to obtain nanoparticles. Nanotechnol-
ogy allows using chemical, physical and biological effects
that do not occur outside the nanoscale world. To find the
best conditions (from the average particle size distribution
point of view), three reaction parameters were varied: ratio
of lignin/aldehyde, pH and temperature. The following
output value has been the average particle size distribution.
The obtained data were processed with software in demo
version (Modde 9) and resulted regression equation allows
us to establish the optimum conditions. At the same time,
the reaction products thus synthesized were characterized
by FTIR spectroscopy, GPC, and 31PNMR spectroscopy.
The results confirm that using this reaction, it is possible to
synthesize nanoparticles from hydroxymethylated lignin.
Lignin derivatives containing high hydroxyl group content
have a potential utilization as phenol substitute in the
phenol formaldehyde resin synthesis, composites, biocides,
etc.
Keywords Hydroxymethylation � Lignin � Optimization �Nanolignin
Introduction
Nowadays, conventional raw material resources are limited
and become difficult to assure. Therefore, renewable
resources play an important role in the sustainable devel-
opment concept. Lignin is a biopolymer, the main aromatic
component in vegetal biomass, and it is the second most
abundant component of lignocellulosic biomass [1–3]
(about 28–30 % lignin content for softwood [4], 20–28 %
for hardwood [5], 15–21 % for annual plants [6, 7]) after
cellulose. The reactivity of lignin is determined by its
origin and particular structure and also by the chemical
structural modifications induced by separation methods.
At the same time, the reactivity of lignin can be increased
using different reactions such as hydroxymethylation [8],
epoxidation [9], carboxymethylation [10], esterification [11]
oxidation and sulfonation [12], a.s.o. The main advantage of
the hydroxymethylated lignin is its high content of hydroxyl
groups which allows using it as phenol substitute in phenol
formaldehyde resin synthesis [13], composites, biocides
systems and bioremediation [14–16]. For instance, when
lignin is hydroxymethylated, the resulting product is repor-
ted to replace up to 50 % of phenol in the phenol formal-
dehyde resins, without loss of properties [13, 17].
By modification of the parameters of hydroxymethylation
reaction (time, temperature, catalyst type, formaldehyde/
I. A. Gilca (&) � R. E. Ghitescu � A. C. Puitel � V. I. Popa
Department of Natural and Synthetic Polymers, Faculty of
Chemical Engineering and Environmental Protection, Gheorghe
Asachi Technical University of Iasi, 700050 Iasi, Romania
e-mail: [email protected]
R. E. Ghitescu
Empa, Swiss Federal Laboratories for Materials Science and
Technology, Laboratory for Protection and Physiology,
Lerchenfeldstrasse 5, 9014 Saint Gall, Switzerland
Iran Polymer and
Petrochemical Institute 123
Iran Polym J (2014) 23:355–363
DOI 10.1007/s13726-014-0232-0
Author's personal copy

phenol ratio), lignin derivatives with different characteristics
can be obtained. Thus, Schilling developed a method of
obtaining a submicron (about 300 A) lignin-based binder
resins for flexographic water-borne black ink formulation
using hydroxymethylation reaction [18].
Nanodispersions based on organic compounds, com-
pared with other substances are not persistent in the envi-
ronment. These nanodispersions can be used to achieve:
biocides, pharmaceuticals/antioxidants, plant bioregulators,
paints, etc. [14, 16, 18]. Taking into account the method
proposed by Schilling, we carried out a study to establish
the most convenient conditions for the synthesis of micro-
and nano-scale particle size. The obtained lignin deriva-
tives were characterized by FTIR spectroscopy, gel per-
meation chromatography and 31P NMR spectroscopy
techniques and the resulted modifications were confirmed,
as well.
Experimental
Materials
Sarkanda grass lignin (L2) obtained by an alkaline proce-
dure of delignification was supplied by Granit Recherche
Development Co., Switzerland. The characteristics of lig-
nin (1.05-OHtotal groups/C9; 0.91-OHphenolic/C9; 0.96-OCH3/
C9; 0.88-alkyl/aryl ratio; 0.88-carbonyl/C9; 0.82-syringyl/
guaiacyl ratio) were determined in previous work [8]. All
the other materials used were reagent grade.
Methods
A glass reactor equipped with a mechanical stirrer was
immersed in a water bath. A quantity of 10 g of lignin
(absolutely dry) was suspended in 47 mL of distilled water
and stirred for 2 h at room temperature. After that, the
heating was started to the set temperature. The reaction
time was kept constant at 4 h and the temperature was
varied between 50 and 95 �C. After the lignin suspension
reached the desired temperature, a 50 % sodium hydroxide
solution and an ammonia hydroxide (25 %) solution
(depending on pH) were added and stirred for another 2 h.
The pH of the mixture was varied in the range of 7.5–12.0
during the experiments. After 2 h of stirring, a formalde-
hyde solution (37 %) (depending on lignin/formaldehyde
mass ratio) was added to the reaction mixture. The lignin/
aldehyde ratio was varied between 0.5 and 1.5. A central
composite factorial (CCF) experimental design was used to
study the dependence of the particle size on varied reaction
parameters. The obtained product was recovered by pre-
cipitation at pH 2 with a solution of hydrochloric acid
(2 %), separated by centrifugation, washed and dried.
Characterization
Particle size distribution analysis of a suspension in dis-
tilled water of the modified lignin nanoparticles was carried
out using a Shimadzu SALD 7001 (Japan) particle size
analyzer. A single light source of violet laser combined
with a single optical system allows the size determination
of particles from 15 nm to 500 lm by laser diffraction
method.
FTIR spectra were recorded with a Digilab Scimitar
FTS2000 (USA) spectrophotometer using the KBr pellet
method. The data acquisition conditions were: spectral
width of 4,000–400 cm-1, 64 scans at a resolution of
4 cm-1. The pellet was prepared with a mixture of 200 mg
KBr and 2 mg of lignin sample. FTIR data were processed
using ACD Labs software.
Gel permeation chromatography was performed using a
Shimadzu LC 20AT (Japan) liquid chromatograph with a
SPD M20A ultraviolet diode array (UV) detector set at
280 nm. Two columns connected in series were used:
Agilent PL gel MIXED-D 5 lm, 1–40 K and PL gel 5 lm,
MW range 500 Da–20 kDa. Complete calibration was
achieved using polystyrene standards provided by Fluka
(Switzerland). THF was used as eluent, at flow rate of
0.5 mL/min. Before the injection, the lignin samples were
acetylated with acetyl bromide following the procedure
described by Lu and Ralph [19].
In the second GPC analysis variant, non-acetylated lig-
nin samples analysis was carried out using TSK-gel
GMPWxl GPC column (300 9 7, 8 mm, 500 Da–
8,000 kDa). Elutions were performed with a pH 11 phos-
phate buffer solution, at a flow rate of 0.5 mL/min. Cali-
bration curve was obtained using standards of poly(styrene
sulfonic acid) sodium salt, provided by Fluka
(Switzerland).
For 31PNMR, the lignin samples were derivatized with
2-chloro-4,40,5,50-tetramethyl-1,3,2-dioxaphospholane.
Samples were dissolved in a solvent (1.6/1: pyridine/chlo-
roform ratio) [20]. The 31P NMR spectra were performed on
a Bruker 300 NMR (Germany) spectrometer. The NMR
spectra were performed by Bruker Topspin software.
Results and discussion
Formaldehyde reacts with lignin in the presence of alkali
both by substituting the free 5 position in the phenolic
(guaiacyl) nuclei, and by Tollens reaction of the side chains
bearing carbonyl groups (Scheme 1). This reaction may be
continued with a condensation resulting in the decrease of
hydroxyl group content [21, 22].
During the hydroxymethylation process, formaldehyde
is added to lignin in alkaline medium. Three reactions can
356 Iran Polym J (2014) 23:355–363
Iran Polymer and
Petrochemical Institute 123
Author's personal copy

take place. The main one is Lederer–Manasse reaction,
where hydroxymethyl groups are incorporated to the lignin
aromatic rings (Scheme 1, reaction a), increasing the
reactivity of the molecule. Nondesirable reactions are the
Cannizzaro reaction, in which formaldehyde reacts with
itself, and Tollens reaction in which lignin side chains are
Scheme 1 Lignin
hydroxymethylation reactions (a
and b) and further condensation
reaction (c)
Table 1 Experimental variables and their normalization according to the experimental design model
Exp. no. Lignin/formaldehyde
ratio
Normalized
value [x]
pH Normalized
value [y]
Temperature
(�C)
Normalized
value [T]
Average particle
size (nm) [z]
1. 0.5 -1 7.5 -1 50 -1 0.189
2. 1.5 1 7.5 -1 50 -1 0.221
3. 0.5 -1 12 1 50 -1 0.26
4. 1.5 1 12 1 50 -1 0.279
5. 0.5 -1 7.5 -1 95 1 0.301
6. 1.5 1 7.5 -1 95 1 0.252
7. 0.5 -1 12.0 1 95 1 0.262
8. 1.5 1 12.0 1 95 1 0.145
9. 0.5 -1 9.75 0 72.5 0 0.24
10. 1 1 9.75 0 72.5 0 0.245
11. 1 0 7.5 -1 72.5 0 0.221
12. 1 0 12.0 1 72.5 0 0.201
13. 1 0 9.75 0 50 -1 0.101
14. 1 0 9.75 0 95 1 0.092
15 1 0 9.75 0 72.5 0 0.098
16. 1 0 9.75 0 72.5 0 0.081
17. 1 0 9.75 0 72.5 0 0.096
Iran Polym J (2014) 23:355–363 357
Iran Polymer and
Petrochemical Institute 123
Author's personal copy
substituted by aliphatic methylol groups (Scheme 1, reac-
tion b). Increasing temperature, hydroxymethyl groups
react at free positions of other lignin units or phenol to
form methylene bonds (Scheme 1, reaction c). The reac-
tivity of lignins in hydroxymethylation or cross-linking
depends on its source (softwood, hardwood or grass) on the
pulping conditions (pH, temperature, pressure) and on the
reaction conditions.
Optimization of reaction conditions
The lignin separated from Sarkanda grass by an alkaline
procedure was hydroxymethylated in different conditions
(Table 1). With the aim to establish optimum conditions to
synthesize nanoparticles based on hydroxymethylation of
lignin, the following parameters were considered: the lig-
nin/aldehyde mass ratio, pH and temperature. The depen-
dent variable was the average particle size. The obtained
data were used to optimize the hydroxymethylation reac-
tion conditions and to determine the correlation equation
between parameters and particle size. A demo version of
adequate modeling software was used.
Response surface methodology can be employed to
explore the contribution of a given set of independent vari-
ables (process parameters or system inputs) on a set of
dependent ones (process results or system outputs). The
coefficient of determination, R2, designates the fitness
between practical results and mathematical model. To
determine the model predictive power, the parameter Q2 is
calculated. This reflects the validation of prediction.
Parameter Q2 is the fraction of the variation of the response
predicted by the model according to cross validation and
expressed in the same units as R2. These parameters are used
together as diagnostic tool for the model. Values close to 1
are desirable, because they indicate an excellent model. In
practice, a Q2 value higher than 0.5 designates a good model.
The difference between R2 and Q2 should not to be more
than 0.2–0.3. The validation of prediction may be esti-
mated using Eq. (1):
Q2 ¼SStot � SSpred
� �
SStot
ð1Þ
where, SStot is the total sum of the squares of the difference
of the dependent variable and its grand mean; SSpred is the
prediction residual sum of squares, computed by squared
difference between observed dependent variable Y and
predicted dependent variable Y [23].
The multiple linear regression (MLR) fitting method
was used to validate experimental data and to generate a
mathematical equation which could be used for optimiza-
tion or for forecast results of hydroxymethylation reaction.
Based on statistical analysis results (p \ 0.05; F [ 1), a
particular form (a second-degree polynomial) for the
dependence of a system response as function of selected
independent variables was found as described by Eq. (2).
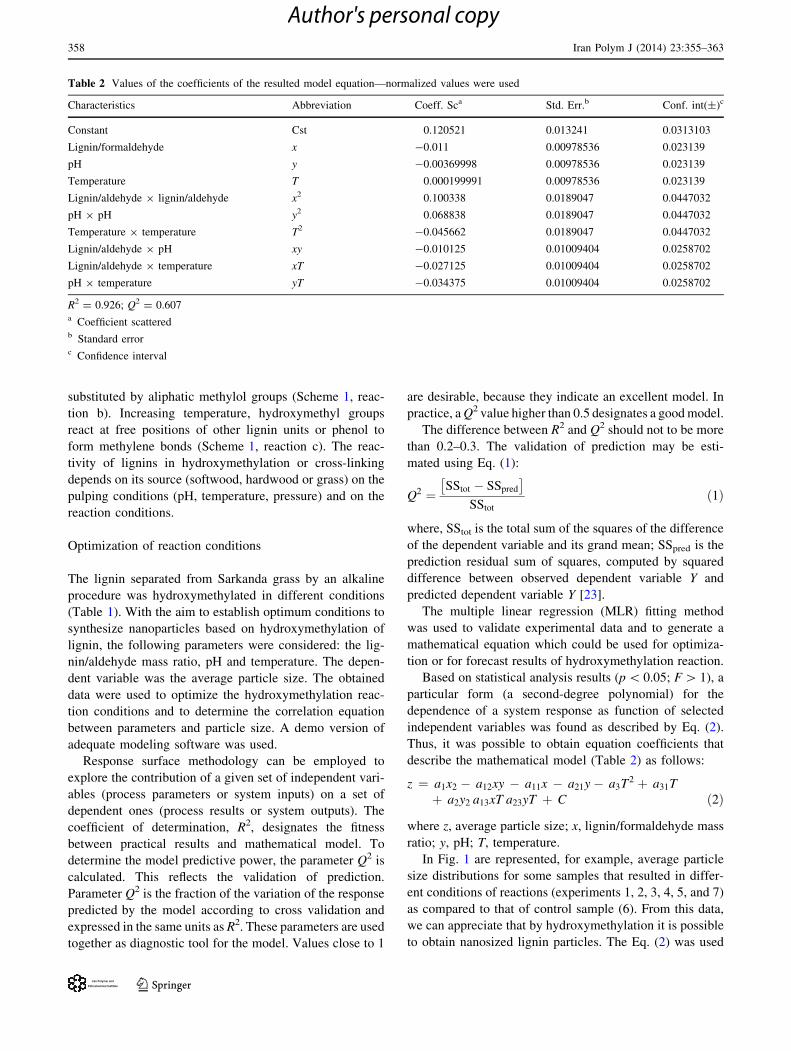
Thus, it was possible to obtain equation coefficients that
describe the mathematical model (Table 2) as follows:
z ¼ a1x2 � a12xy � a11x � a21y� a3T2 þ a31T
þ a2y2 a13xT a23yT þ C ð2Þ
where z, average particle size; x, lignin/formaldehyde mass
ratio; y, pH; T, temperature.
In Fig. 1 are represented, for example, average particle
size distributions for some samples that resulted in differ-
ent conditions of reactions (experiments 1, 2, 3, 4, 5, and 7)
as compared to that of control sample (6). From this data,
we can appreciate that by hydroxymethylation it is possible
to obtain nanosized lignin particles. The Eq. (2) was used
Table 2 Values of the coefficients of the resulted model equation—normalized values were used
Characteristics Abbreviation Coeff. Sca Std. Err.b Conf. int(±)c
Constant Cst 0.120521 0.013241 0.0313103
Lignin/formaldehyde x -0.011 0.00978536 0.023139
pH y -0.00369998 0.00978536 0.023139
Temperature T 0.000199991 0.00978536 0.023139
Lignin/aldehyde 9 lignin/aldehyde x2 0.100338 0.0189047 0.0447032
pH 9 pH y2 0.068838 0.0189047 0.0447032
Temperature 9 temperature T2 -0.045662 0.0189047 0.0447032
Lignin/aldehyde 9 pH xy -0.010125 0.01009404 0.0258702
Lignin/aldehyde 9 temperature xT -0.027125 0.01009404 0.0258702
pH 9 temperature yT -0.034375 0.01009404 0.0258702
R2 = 0.926; Q2 = 0.607a Coefficient scatteredb Standard errorc Confidence interval
358 Iran Polym J (2014) 23:355–363
Iran Polymer and
Petrochemical Institute 123
Author's personal copy

to study the influence of pH and lignin/formaldehyde ratio
(L/A) for temperatures of 50, 72.5 and 90 �C (Figs. 2, 3, 4).
From this graphical representation, the optimum conditions
to obtain a convenient particle size distribution were
established as: temperature = 72 �C, pH = 9.8, and lignin/
formaldehyde ratio = 1.
Fig. 1 Average particle size
distribution analysis; samples 1,
2, 3, 4, 5, 7 (according to the
Table 1) and sample 6 as
control sample
Fig. 2 Response surface
representation of average lignin
particle size (APS) distribution
as functions of pH and L/A ratio
at 50 �C
Fig. 3 Response surface
representation of average lignin
particle size (APS) distribution
as functions of pH and L/A ratio
at 72.5 �C
Iran Polym J (2014) 23:355–363 359
Iran Polymer and
Petrochemical Institute 123
Author's personal copy

Characterization of reaction products
FTIR analysis
FTIR spectroscopy was used to characterize the raw
material and to analyze the changes in the lignin structure
during the hydroxymethylation (Table 3) [24–26]. The
FTIR spectra obtained are characterized by a broad O–H
band at 3,400 cm-1 (which were increased in the case of
modified samples), an intense C–H band at 2,927 cm-1,
and another at 2,854 cm-1, typical of methoxyl groups and
also hydroxymethyl groups. The absorbance values at these
wavenumbers were increased for hydroxymethylated
samples. The aromatic skeletal vibration occurs at 1,600
and 1,500 cm-1. The band at 1,600 cm-1 was used for
normalization and its intensity was always set to 1.00. The
C–H deformations of asymmetric methyl and methylene
appeared at 1,470–1,460 cm-1, and the ether carbon–
oxygen bands appeared at 1,400–1,000 cm-1. The band at
1,370 cm-1 was due to the bending vibration of the phe-
nolic OH group. Bands at 1,140 and 1,035 cm-1 are
characteristic to secondary and primary OH groups,
respectively [27]. Also, a band at 836 cm-1, which is due
to the aromatic C–H out of plane vibration in p-hydroxy-
phenyl propane, was also detected (Fig. 5). More exact and
complete information was provided by 31P NMR spec-
troscopy technique.
GPC analysis
It is known that lignin molecular mass and its distribution
are parameters related to the physico-chemical properties
which are very important in the development of potential
applications. Molecular mass distribution may be used to
monitor the modification of lignin during performed
physico-chemical treatments [28].
After reaction, the resulted hydroxymethylated samples
along with non-modified lignin were characterized by GPC
using non-acetylated and acetylated derivatives. The main
advantages of gel permeation chromatography are acces-
sibility, short time of analysis, small quantities of sample
and the possibility of determining the molecular mass on a
very large scale. The results obtained from GPC are pre-
sented in Figs 6 and 7 and Tables 4 and 5. Both applied
variants evidenced that hydroxymethylation of lignin took
place by modification of average macromolecular mass.
According to calculation of the values obtained for Sark-
anda grass lignin (L2) and two hydroxymethylated samples
(selected from those corresponding from dimensional point
of view, Ex4, Ex7) was observed a decrease of the weight
average molecular mass (Mw) and at the same time an
increase of the number average molecular mass (Mn) for
both types of analysis. These data confirm the results
reported in a previous work [13]. Thus, the polydispersity
Fig. 4 Response surface
representation of average lignin
particle size (APS) distribution
as functions of pH and L/A ratio
at 90 �C
Table 3 Assignment of infra-red absorptions of lignin and its
derivatives
Characteristic bands
(cm-1)
Band origin
3410–3,460 Phenolic hydroxyl groups and aliphatic
structures stretching
2,945–2,920 C–H stretching of methyl or methylene group
2,840–2,835 Unconjugated C–O stretching
1,730–1,675 C=O stretching
1,610–1,695 Aromatic skeletal vibration
1,515–1,505 C–C stretching of aromatic skeletal
1,470–1,460 C–H stretching of aromatic skeletal
1,420–1,400 CH vibration of methyl group
1,370–1,330 Syringyl units vibration
1,330–1,325 Guaiacyl units vibration
1,160–1,130 OH stretching of secondary alcohol
1,044 OH stretching of primary alcohol
360 Iran Polym J (2014) 23:355–363
Iran Polymer and
Petrochemical Institute 123
Author's personal copy

index (PID) decrease proved that by hydroxymethylation, a
nanostructured polymer with a more uniform molecular
mass can be obtained.
However, there are some differences between the values
resulted using the two techniques. These can be explained
by association phenomena by hydrogen bonds including
fragments of lignin with different molecular mass of non-
acetylated samples, which are characterized by lower val-
ues. In case of acetylated lignin derivatives, the hydroxyl
groups were blocked, preventing molecular association and
thus the values of molecular mass and polydispersity
indices were higher.
Fig. 5 FTIR spectra of
Sarkanda grass lignin
unmodified (L2) and
hydroxymethylated (Ex4 and
Ex7) samples
Fig. 6 Molecular mass distribution of Sarkanda grass lignin unmod-
ified (L2) and hydroxymethylated (Ex4 and Ex7) samples for non-
acetylated step
Fig. 7 Molecular mass distribution of Sarkanda grass lignin unmod-
ified (L2) and hydroxymethylated (Ex7 and Ex4) samples for
acetylated step
Table 4 Molecular mass values of Sarkanda grass lignin unmodified
(L2) and hydroxymethylated (Ex7, Ex4) samples in non-acetylated
step
Sample
code
Average
molecular mass
(Mw) (g/mol)
Numeric average
molecular mass (Mn)
(g/mol)
Polydispersity
index (PID)
(Mw/Mn)
L2 135,424 14,485 9.34
Ex7 88,651 20,322 4.36
Ex4 115,883 26,409 4.38
Table 5 Molecular mass values of Sarkanda grass lignin unmodified
(L2) and hydroxymethylated (Ex7, Ex4) samples in acetylated step
Sample Average
molecular mass
(Mw) (g/mol)
Numeric average
molecular mass (Mn)
(g/mol)
Polydispersity
index (PID)
L2 190,240 17,784 10.69
Ex7 186,828 27,809 6.71
Ex4 117,333 16,273 7.20
Iran Polym J (2014) 23:355–363 361
Iran Polymer and
Petrochemical Institute 123
Author's personal copy

31P NMR analysis
NMR spectroscopy is a useful technique to observe the
evolution of functional groups during lignin modification.
The use of phosphorous-containing derivatizing reagents
for lignin analysis has grown in importance. The sensitivity
of a 31PNMR experiment is about 15 times less than that of
a proton NMR experiment. The range of 31P chemical
shifts is more than 1,000 ppm for a variety of phosphorous
compounds and the average line width is about 0.7 Hz
[29]. This technique was used to characterize non-modified
and hydroxymethylated lignin samples (Fig. 8; Table 6)
after derivatizing them with phosphorous compounds. The
results obtained allow to distinguish the different types of
functional groups which can be quantified by integrating
the following regions for: aliphatic between 150.8 and
146.3 ppm, condensed phenolic units (diphenylmethane
type) between 144.3 and 142.8 ppm, syringyl phenolic
units between 143.7 and 142.2 ppm, condensed phenolic
units (4-O-50 type) between 142.8 and 141.7 ppm, con-
densed phenolic units (5-50 type) between 141.7 and
140.2 ppm, guaiacyl and demethylated phenolic units
between 140.2 and 138.4 ppm, p-hydroxyphenolic units
between 138.6 and 136.9 ppm and carboxylic acids
between 135.6 and 133.7 [30–32].
After the hydroxymethylation reaction, spectra integra-
tion for unmodified Sarkanda grass lignin (L2) and modi-
fied by hydroxymethylation (samples Ex 4, Ex7), it was
observed that the peak area in chemical shift range
140–137 ppm decreases simultaneously with the increasing
of the peak area in 144,3–142,8 ppm chemical shift. Thus,
the introduction of hydroxymethyl groups in lignin mac-
romolecules was confirmed by 31PNMR spectra analysis
and also further condensation with diphenylmethane bonds
formation (Table 6).
Conclusion
Using hydroxymethylation reaction of lignin, it was pos-
sible to obtain nanoparticles and by mathematical modeling
optimum reaction conditions were established as being:
temperature = 72 �C, pH = 9.8, lignin/formaldehyde
ratio = 1. The nanoparticles were characterized from
Fig. 8 31PNMR spectra of
Sarkanda grass lignin
unmodified (L2) and
hydroxymethylated (Ex4 and
Ex7) samples
Table 6 Aliphatic, phenolic, and carboxylic hydroxyl groups content
determined in Sarkanda grass lignin unmodified (L2) and hydrox-
ymethylated (Ex4 and Ex7) samples
Functional groups L2 Ex4 Ex7
(OH, mmol/g) (OH, mmol/g) (OH, mmol/g)
Aliphatic 1.4615 2.4742 2.6285
Condensed phenol 1.0873 1.9238 1.9531
Guaicyl phenolic 0.6862 0.3675 0.6769
p-OH fenol 0.3898 0.2900 0.3329
Carboxylic acids 0.6594 0.8585 1.1405
362 Iran Polym J (2014) 23:355–363
Iran Polymer and
Petrochemical Institute 123
Author's personal copy

dimensional point of view. The modifications determined
by hydroxymethylation reaction were confirmed by FTIR
spectroscopy, GPC-chromatography and 31P-NMR spec-
troscopy techniques. All of the performed analysis show
that use of the proposed chemical method lead to hydrox-
ymethylated lignin nanoparticles.
Acknowledgments This paper was realised with the support of
POSDRU CUANTUMDOC ‘‘DOCTORAL STUDIES FOR EURO-
PEAN PERFORMANCES IN RESEARCH AND INNOVATION’’
ID79407 project funded by the European Social Found and Romania
Government. The authors are grateful to Dr. Claudia Crestini and Dr.
Federica Melone from University of Rome ‘‘Tor Vergata’’ for support
in GPC acetylated and 31P-NMR analyses.
References
1. Dimmel D (2010) Overview. In: Heitner C, Dimmel D, Schmidt J
(eds) Lignin and lignans: advances in chemistry, chap 1. CRC
Press, Boca Raton, pp 1–10
2. Xing W, Yuan H, Zhang P, Yang H, Song L, Hu Y (2013)
Functionalized lignin for halogen-free retardant rigid polyurethan
fooam: preparation, thermal stability, fire performance and
mechanical properties. J Polym Res 20:234–244
3. Sarkanen KV, Ludwing CH (1971) In: Sarkanen KV, Ludwing
CH (eds) Lignins: occurence, formation, structural and reaction.
Wiley, New York
4. Petrovici G, Popa VI (1997) Chimia si prelucrarea chimica a
lemnului (in Romanian). Lux Libris, Brasov
5. Pinkert A, Goeke DF, Marsh KN, Pang S (2011) Extracting wood
lignin without dizolving or degrading cellulose: investigations on
the use of food additive-derived ionic liquids. Green Chem
13:3124–3136
6. del Rio JC, Rencoret J, Gutierrez A, Nieto L, Barbero JJ, Ma-
trinez AT (2011) Structural characterization of guaiacyl-rich
lignins in flax (Linum usitatissimum) fibers and shives. J Agric
Food Chem 59:11088–11099
7. Sarkanen KV, Herget HL (1971) In Sarkanen KV, Ludwing CH
(eds) Lignins: occurence, formation, structural and reaction.
Wiley-Interscience, New York
8. Capraru AM, Ungureanu E, Trinca L, Malutan T, Popa VI (2012)
Chemical and spectral characteristics of annual plant lignins
modified by hydroxymethylation reaction. Cell Chem Technol
46:589–597
9. Malutan T, Nicu R, Popa VI (2008) Lignin modification by
epoxidation. BioResources 3:1371–1376
10. Gilca IA, Capraru AM, Popa VI (2011) Studies concerning the
obtaining and characterization of lignophenols derivatives. Bull
Polytech Inst Iasi 57:141–147
11. Maldhure A, Chaudhari AR, Ekhe JD (2011) Thermal and
structural studies polypropylene blended with esterified industrial
waste lignin. J Therm Anal Calorim 103:625–632
12. Xiang Y, Xu W, Ou E, Su Q, Chen L, Zhan Y, Xia X, Xiong Y,
Xiong Y (2013) Preparation and characterization of strongly
swellable modified-lignosulfonate hydrogel particles. Iran Polym
J 22:749–756
13. Malutan T, Nicu R, Popa VI (2008) Contribution to the study of
hydroxymethylation reaction of alkali lignin. BioResources
3:13–20
14. Popa VI, Capraru AM, Grama S, Malutan T (2011) Nanoparticles
based on modified lignins with biocide properties. Cell Chem
Technol 45:221–226
15. Gilca IA, Capraru AM, Grama S, Popa VI (2011) Agents for
wood bioprotection based on natural aromatic compounds and
their complexes with copper and zinc. Cell Chem Technol
45:227–231
16. Gilca IA, Popa VI (2013) Study on biocidal properties of some
nanoparticles based on epoxy lignin. Cell Chem Technol
47:239–245
17. Hu L, Pan H, Zhou Y, Zhang M (2011) Methods to improve
lignin’s reactivity as a phenol substitute and as a replacement for
other phenolic compounds: a brief review. BioResources
6:3515–3525
18. Schilling P (1993) Submicron lignin-based binders for water-
based black ink formulations. US Patent number 5192361
19. Lu F, Ralph J (1998) The DFRC method for lignin analysis. Part
3. NMR studies. J Wood Chem Technol 18:219–233
20. Argyropoulos DS (1994) Quantitative phosphouros-31 NMR
analysis of six soluble lignins. J Wood Chem Technol 14:65–82
21. Bernar P, Goncalves AR, Mandelli D, Ferreira MMC, Schuchart
U (1999) Principal component analysis of the hydroxymethyla-
tion of sugarcane lignin: a time depending study by FTIR.
J Wood Chem Technol 19:151–165
22. Bernar P, Goncalves AR, Mandelli D, Schuchart U (1999)
Eucalyptus organosolv lignins: study of the hydroxymethylation
and use in resols. Bioresour Technol 68:11–16
23. Eriksson L, Johansson E, Kettaneh-Wold N, Wikstrom C, Woold
S (2008) Design of experiments: principles and applications.
Umetrics AB, Umea
24. Alonso MV, Rodriguez JJ, Oliet M, Rodriguez F, Garcia J, Gi-
larranz MA (2001) Characterization and structural modification
of ammonic lignosulfonate by methylation. J Appl Polym Sci
82:2661–2668
25. Gilli E, Schmied F, Diebald S, Horvath AT, Teichert C,
Schennach R (2012) Analysis of lignin precipitates on ozone
treated kraft pulp by FTIR and AFM. Cellulose 19:249–256
26. Kang S, Xiao L, Meng L, Zhang X, Sun R (2012) Isolation and
structural characterization of lignin from cotton stalk treated in an
ammonia hydrothermal system. Int J Mol Sci 13:15209–15226
27. Nada AAMA, El-Sakhawy M, Kamel SM (1998) Infra-red spe-
croscopic study of lignins. Polym Degrad Stab 60:247–251
28. Gosselink RJA (2011) Lignin as a renewable aromatic resource
for the chemical industry. PhD Thesis, Wageningen University,
Wageningen, The Netherlands
29. Argyropoulos DS (2010) Heteronuclear NMR spectroscopy of
lignins. In: Heitner C, Dimmel D, Schmidt J (eds) Lignin and
lignans: advances in chemistry. chap 6, CRC Press, Boca Raton,
pp 245–265
30. Crestini C, Argyropoulos DS (1997) Structural analysis of wheat
straw lignin by quantitative 31P and 2D NMR spectroscopy. The
occurrence of ester bonds and a-O-4 substructures. J Agric Food
Chem 45:1212–1219
31. Granata A, Argyropoulos DS (1995) 2-Chloro-4,4,5,5-tetra-
methyl-1,3,2-dioxaphospholane, a reagent for the accurate
determination of the uncondensed and condensed phenolic moi-
eties and lignin. J Agric Food Chem 43:1538–1544
32. Argyropoulos DS, Bolker HI, Hetner C, Archipov Y (1993) 31P
NMR spectroscopy in wood chemistry. Part V. Quantitative
analysis of lignin functional groups. J Wood Chem Technol
13:187–212
Iran Polym J (2014) 23:355–363 363
Iran Polymer and
Petrochemical Institute 123
Author's personal copy