Study of new chemical derivatization techniques for lignin ...
309
HAL Id: tel-02612598 https://tel.archives-ouvertes.fr/tel-02612598 Submitted on 19 May 2020 HAL is a multi-disciplinary open access archive for the deposit and dissemination of sci- entific research documents, whether they are pub- lished or not. The documents may come from teaching and research institutions in France or abroad, or from public or private research centers. L’archive ouverte pluridisciplinaire HAL, est destinée au dépôt et à la diffusion de documents scientifiques de niveau recherche, publiés ou non, émanant des établissements d’enseignement et de recherche français ou étrangers, des laboratoires publics ou privés. Study of new chemical derivatization techniques for lignin analysis by size exclusion chromatography Esakkiammal Sudha Esakkimuthu To cite this version: Esakkiammal Sudha Esakkimuthu. Study of new chemical derivatization techniques for lignin analysis by size exclusion chromatography. Material chemistry. Université Grenoble Alpes [2020-..], 2020. English. NNT : 2020GRALI004. tel-02612598
-
Upload
khangminh22 -
Category
Documents
-
view
0 -
download
0
Transcript of Study of new chemical derivatization techniques for lignin ...

HAL Id: tel-02612598https://tel.archives-ouvertes.fr/tel-02612598
Submitted on 19 May 2020
HAL is a multi-disciplinary open accessarchive for the deposit and dissemination of sci-entific research documents, whether they are pub-lished or not. The documents may come fromteaching and research institutions in France orabroad, or from public or private research centers.
L’archive ouverte pluridisciplinaire HAL, estdestinée au dépôt et à la diffusion de documentsscientifiques de niveau recherche, publiés ou non,émanant des établissements d’enseignement et derecherche français ou étrangers, des laboratoirespublics ou privés.
Study of new chemical derivatization techniques forlignin analysis by size exclusion chromatography
Esakkiammal Sudha Esakkimuthu
To cite this version:Esakkiammal Sudha Esakkimuthu. Study of new chemical derivatization techniques for lignin analysisby size exclusion chromatography. Material chemistry. Université Grenoble Alpes [2020-..], 2020.English. �NNT : 2020GRALI004�. �tel-02612598�

THÈSE
Pour obtenir le grade de
DOCTEUR DE L'UNIVERSITE GRENOBLE ALPES Spécialité : 2MGE : Matériaux, Mécanique, Génie civil, Electrochimie
Arrêté ministériel : 25 mai 2016
Présentée par
Esakkiammal Sudha ESAKKIMUTHU
Thèse dirigée par Gérard MORTHA, Professeur, Grenoble INP et Co-encadrée par Nathalie MARLIN, Maître de Conférences, Grenoble INP préparée au sein du Laboratoire Génie des Procédés Papetiers (LGP2) dans l'École Doctorale I-MEP2 - Ingénierie - Matériaux, Mécanique, Environnement, Energétique, Procédés, Production
Étude de nouvelles techniques de derivation chimique de la lignine en vue de l'analyse par chromatographie d'exclusion stérique
Thèse soutenue publiquement le 30 janvier 2020, devant le jury composé de :
Monsieur Nicolas BROSSE Professeur des Universités, Université de Lorraine, Rapporteur
Monsieur Christophe GEANTET Directeur de Recherche, CNRS, Université Lyon 1, Rapporteur
Monsieur Sami HALILA Chargé de Recherche, CNRS, Université Grenoble Alpes, Examinateur
Monsieur Gérard MORTHA Professeur des Universités, Grenoble INP, Directeur de thèse
Madame Nathalie MARLIN Maître de Conférences, Grenoble INP, Co-encadrante
Madame Marie-Christine BROCHIER-SALON Ingénieur de Recherche, Grenoble INP, Invitée
Monsieur Dominique LACHENAL Professeur des Universités, Émérite, Grenoble INP, Invité

2

3
I would like to dedicate my thesis to
my beloved mother
“Mrs. Parvathi”

4

5
Acknowledgements
First of all, I am very grateful to my supervisors Prof. Gérard Mortha and Dr. Nathalie Marlin for
providing me this opportunity to pursue my research career. I would like to thank Prof. Gerard for his
wonderful guidance in analytical chemistry techniques, his guidance encourages and enlarges my
research knowledge and become an independent. I would like to express my sincere gratitude to Dr.
Nathalie for her constant guidance and motivation throughout my thesis. During my critical situation,
my supervisors understood and came forward to bring me out and move on. I am so lucky to have
them as my thesis supervisors. Without their support, I would not accomplish this thesis. I like to
thank Dr. Marie-Christine Brochier-Salon for part of my thesis work and I learnt a lot about NMR
techniques from her. I also thank, for her kindness and support.
I would like to thank jury members: Prof. Nicolas Brosse and Dr. Christophe Geantet and Dr. Sami
Halila for accepting the invitation. Thanks to Prof. Dominique Lachenal, Dr. Marie-Christine
Brochier-Salon for being part of my thesis jury.
Thanks to Dr. Luis Serrano, post doc for the collaborative work under the Qualin project, and thanks
to Dr. Fanny Bardot for the discussions on the lignin chemistry during my post-master program.
I would like to thank Prof. Christine Chirat and Prof. Dominique Lachenal for their support before
and during my PhD work. Thanks to all professors in Grenoble INP-Pagora, Prof. Naceur Belgacem,
Prof. Alain dufresne and Prof. Julien Bras.
Thanks to the Biochip technicians, David and Karine helped me a lot to learn new instruments and to
have hands-on experience with all analytical instruments. Thanks to Jessie, a technician, for helping
me during final stage of my thesis.
My special thanks to French ministry and the doctoral school ED-IMEP2 for funding and providing
me the great opportunity to perform my thesis. Thanks to Mme. Augustine Alessio for her great
support from the school.
I express my thanks to Elsa, who helped me in various aspects, motivated me to apply teaching
assistant, conferences etc. and also for her love and friendship.
Also, I like to thank my senior colleague Jennifer, Claire and Chamseddine. Thanks to Lakshmanan
anna and Seema for introducing about the post-master course and internship.
Thanks to my friends Axelle, Amina, Helene, Jahan, Camille, Gabrielle, Hugo, Johanna, Manon,
Fleur, Hippolyte and Flavien. They were all in my side during the hard situations to step-out of it.

6
I would also like to thank the administrative unit and Mme. Sylvie and HR department Mme. Anne
Marie, M. Stephane Vernac, Mme. Laurence Platel for their help in sorting-out administrative things.
Thanks to IT service M. Franck and Mme. Lydia for their good service and friendly nature.
Once again thanks to Dr. Nathalie for giving the opportunity to work as a teaching assistant and also
to Mme. Sandrine.
I like to express my sincere thanks to Sridevi Akka and Raja Anna, for motivating me to continue my
career and pursue the PhD, It is ever long memory for me. Thanks to Manikandan Anna and Kabila
Akka, you are always with us during our hard time.
My particular thanks to my parents Parvathi-Esakkimuthu and my uncle Selvaraj and aunty Ammachi.
Without them, I would not establish my career.
I wish to thank my family members, my sisters Shenbaga Devi and Indra, brother in-laws,
Prabhakaran and Nagarajan, aththai-mama Sakthi-Ramar, father-in-law Ponnuchamy, mother-in-law
Muthumariammal and sister-in-law Sangeetha and kutties Harini and Siddarth.
My special thanks go to my beloved husband Veerapandian. Without his endless love and support, I
would not succeed and thanks to my lovable boy Esakki Parthiban for his cooperation (not crying a
lot) to complete my thesis.

7

8

9
Introduction
Lignocellulosic biomass is considered as the main renewable source for conversion into wide
range of value-added applications and products, which could immensely replace fossil fuel
dependency. The biomass macromolecular components are mainly cellulose, hemicelluloses and
lignin. Lignin is the second most abundant biopolymer on earth after cellulose and it possesses a
highly-branched, three-dimensional aromatic structure with a variety of functional groups and
chemical linkages. In particular, lignin is bearing hydroxyl, methoxyl, carbonyl and carboxyl groups.
In the last few decades, researchers have made great efforts to characterize lignin for establishing
the synthesis formulation of various materials. Lignin is extensively used as a precursor for different
applications such as phenolic resins, surfactants, polyurethanes, epoxides, acrylics, and many other
products. The characterization of lignin in terms of chemical linkages, structural features, functional
groups and polymer chain length is of primary importance to evaluate the possible lignin applications.
Numerous analytical methods and techniques have been employed for lignin structural
characterization and reactivity study. Amongst, functional groups quantification (phenolic and
alcoholic hydroxyls, carbonyls and carboxyls) after lignin derivatization by various analytical
techniques, including wet chemical methods, and molar mass distribution (MMD) by size exclusion
chromatography (SEC), are the most prominent methods. However, MMD analysis for lignin is more
complex than for many other polymers due to the irregular, polar and partially branched structure of
lignin, leading to low solubility and partial aggregation in most SEC solvents. As a consequence, SEC
provides rather inaccurate results, which limits the possibilities for lignin valorisation and new
applications.
Most studies focused on the possible chemical modifications of lignin hydroxyl groups to decrease
lignin polarity and to improve its dissolution in different solvents. Till date, acetylation is the most
widely used derivatization method prior to SEC analysis. However, it exhibits several drawbacks;
typically, incomplete solubility, association effect between the molecules and aggregation inside the
column, etc. A majority of the lignin MMD studies have applied conventional SEC analysis using
polystyrene as standard polymer column calibration, due to the lack of lignin calibrants, and UV and
DRI (Differential Refractive Index) as in-line detectors. One important factor that mainly affects the
MMD results is the type of calibration standard used; polystyrene in most studies. Indeed, lignin
structural conformation is totally different from polystyrene, which leads to unreliable molar mass
data.
The main objective of this PhD work was thus to improve the SEC performance in the case of
lignin, by enhancing its solubility in various solvents using derivatization. Three different

10
derivatization methods were compared: acetylation, fluorobenzylation and fluorobenzoylation. The
two latter methods have been developed by Prof. M. Barrelle and collaborators about twenty years
ago, but never tested extensively for SEC application.
In this study, lignin reactivity during the derivatization reactions has been assessed using various
analytical methods (UV, IR, GC, 1H NMR, 13C NMR, 19F NMR) and the numbers and types of
hydroxyl groups present in the studied lignin samples have been quantified. Then the derivatized
lignins have been studied by SEC analysis for MMD determination. In addition to the investigation of
the lignin fluorobenzylation reaction for improving lignin behaviour in a SEC system, the MMD
analysis itself has been upgraded by the application of the universal calibration principle. Indeed, the
presence of an in-line viscometer in the LGP2 chromatographic system enabled to measure the
intrinsic viscosity of each eluted polymer fraction. Different polymer standards (polystyrene,
polymethylmethacrylate and cellulose acetate) have been tested and it was proven that universal
calibration provided better results than standard conventional calibration using polystyrene.
The present PhD manuscript is designed and organized as follows:
CHAPTER 1 provides an overview of the importance of lignocellulosic biomass in recent
decades for sustainable applications, and its components. In this section, the lignin
structure and the different chemical treatments employed for lignin isolation from
lignocellulosic biomass are discussed. Despite of various types of functional groups
present in lignins, the possible derivatization methods have been extensively analysed and
followed by the review of some relevant applications of lignin. Moreover, classical
techniques used for the quantification of different lignin functional groups are presented.
CHAPTER 2 describes the materials and methods used, in particular the different technical
lignin samples selected (Protobind 1000, Indulin, Organosolv, Kraft and Eucalyptus
Kraft). The analytical methods, operating conditions and protocols used are also described
in this section.
Results and discussions are presented in three CHAPTERS which are divided as follows:
Since lignin reactivity is mainly based on the free phenolic hydroxyl groups available in
the molecule, CHAPTER 3 investigates the acetylation as a proven method for lignin
phenolic hydroxyl groups derivatization. For that purpose, all the selected lignin samples
have been acetylated and then subjected to the aminolysis reaction, followed by a GC
analysis. Hence, the number of hydroxyl groups have been quantified and compared with
values obtained via other analytical techniques such as differential UV, 1H NMR, 13C
NMR, 31P NMR, IR, conductometric and potentiometric methods.

11
CHAPTER 4 is devoted to the investigation of the fluorobenzylation as a new
derivatization method to improve lignin analysis, by (1) decreasing lignin polarity thus
increasing its solubility in the SEC solvent, and by (2) giving access to structural
information after 19F NMR analysis. First the lignin functional groups reactivity towards
the fluorobenzylation reaction has been examined and the 19F NMR chemical shifts have
been verified. Fluorobenzylation has been primarily tested on lignin model compounds
(vanillin, vanillyl alcohol, Veratryl alcohol, acetovanillone and cellobiose) containing
phenolic and aliphatic hydroxyl groups. The reactivity and selectivity of fluoro-
derivatizations have been studied using 19F and 13C NMR spectroscopies. Based on the
results obtained on model compounds, commercial lignins have been characterized.
In CHAPTER 5, lignin fluorobenzylation and fluorobenzoylation have been applied for
SEC analysis improvement and compared to classical acetylation. Lignin derivatization is
necessary to favour the solubility and SEC behaviour of the polymer. Another new input in
this chapter is the use of universal calibration and the comparison with standard
conventional calibration. Two solvent systems have been tested and compared for SEC:
DMAc/LiCl and THF.
The main findings of this thesis work have been summarized in the CONCLUSION part, which also
contains a discussion of the future perspectives of this thesis work.

12

13
Contents
Introduction ........................................................................................................................................ 9
1 Bibliographic Study ............................................................................................................ 31
1.1 Introduction ........................................................................................................................... 31
1.2 Lignocellulosic Biomass ....................................................................................................... 33
1.2.1 Cellulose ....................................................................................................................... 34
1.2.2 Hemicelluloses .............................................................................................................. 36
1.2.3 Lignin ............................................................................................................................ 38
1.2.3.1 Introduction ............................................................................................................... 38
1.2.3.2 Linkages in Lignin .................................................................................................... 43
1.2.3.3 Isolation of lignin ...................................................................................................... 45
1.2.3.3.1 Kraft Pulping ....................................................................................................... 46
1.2.3.3.2 Sulphite Pulping .................................................................................................. 47
1.2.3.3.3 Soda pulping ....................................................................................................... 48
1.2.3.3.4 Organosolv pulping ............................................................................................. 48
1.3 Chemical Modification of Lignin ......................................................................................... 49
1.3.1 Methylation ................................................................................................................... 51
1.3.2 Hydroxyalkylation/Etherification ................................................................................. 51
1.3.3 Amination ..................................................................................................................... 53
1.3.4 Halogenation ................................................................................................................. 53
1.3.5 Nitration ........................................................................................................................ 54
1.3.6 Sulphonation ................................................................................................................. 55
1.3.7 Esterification ................................................................................................................. 55
1.3.8 Silylation ....................................................................................................................... 57
1.3.9 Oxidation/Reduction ..................................................................................................... 57
1.3.10 Allylation ...................................................................................................................... 58
1.3.11 Phenolation ................................................................................................................... 59
1.4 Lignin applications ................................................................................................................ 60
1.5 Lignin analysis: literature review .......................................................................................... 60
1.5.1 Lignin functional group analysis ................................................................................... 61
1.5.1.1 By ultraviolet spectroscopy (UV) ............................................................................. 61

14
1.5.1.2 Fourier Transform Infrared (FT-IR).......................................................................... 61
1.5.1.3 Titration methods ...................................................................................................... 62
1.5.1.3.1 Oximation............................................................................................................ 62
1.5.1.3.2 Borohydride method ........................................................................................... 63
1.5.1.4 Gas Chromatography (GC) ....................................................................................... 63
1.5.1.4.1 Periodate oxidation ............................................................................................. 63
1.5.1.4.2 Aminolysis .......................................................................................................... 63
1.5.1.5 NMR techniques ....................................................................................................... 64
1.5.1.5.1 1H NMR .............................................................................................................. 64
1.5.1.5.2 13C NMR ............................................................................................................. 64
1.5.1.5.3 31P NMR .............................................................................................................. 65
1.5.1.5.4 19F NMR Spectroscopy ....................................................................................... 66
1.5.2 Lignin molar mass distribution by Size Exclusion Chromatography (SEC)................. 69
1.6 Conclusion ............................................................................................................................ 75
2 Materials and Methods ..................................................................................................... 79
2.1 Materials ............................................................................................................................... 79
2.1.1 Technical lignins ........................................................................................................... 79
2.1.1.1 Commercial lignin samples ....................................................................................... 79
2.1.1.2 Eucalyptus Kraft lignin preparation at lab scale ....................................................... 79
2.1.2 Lignin like model compounds ....................................................................................... 80
2.1.2.1 Lignin-like model compounds for the study of hydroxyl group quantification ........ 80
2.1.2.2 Lignin-like model compounds for the study of carbonyl group quantification ........ 80
2.1.3 Chemicals used ............................................................................................................. 83
2.2 Methods................................................................................................................................. 84
2.2.1 Chemical Composition of technical lignins .................................................................. 84
2.2.1.1 Dry matter content of lignin ...................................................................................... 84
2.2.1.2 Ashes determination in lignin ................................................................................... 84
2.2.1.3 Sugar determination .................................................................................................. 84
2.2.2 Lignin washing with solvents ....................................................................................... 85
2.2.3 Lignin and Model Compounds Derivatization .............................................................. 85
2.2.3.1 Acetylation ................................................................................................................ 85
2.2.3.2 Fluorobenzylation and fluorobenzoylation ............................................................... 86
2.2.3.2.1 Fluorobenzylation of model compounds ............................................................. 86

15
2.2.3.2.2 Fluorobenzylation of the lignin ........................................................................... 86
2.2.3.2.3 Fluorobenzoylation of the lignin ......................................................................... 86
2.2.3.3 Derivatization with trifluorometylphenylhydrazine .................................................. 87
2.2.3.3.1 Model compounds derivatization ........................................................................ 87
2.2.3.3.2 Lignin derivatization ........................................................................................... 87
2.2.4 Analytical techniques for lignin phenolic hydroxyl group quantification .................... 89
2.2.4.1 UV method ................................................................................................................ 89
2.2.4.2 Aminolysis after lignin acetylation using gas chromatography ................................ 89
2.2.4.3 13C NMR analysis of acetylated lignin samples ........................................................ 91
2.2.4.4 Conductometric and potentiometric titration – Fast method ..................................... 91
2.2.5 Non-aqueous potentiometric titration method for carboxyl group determination ........ 91
2.2.6 NMR Analysis conditions ............................................................................................. 92
2.2.6.1 NMR analysis conditions for lignin phenolic hydroxyl groups quantification ......... 92
2.2.6.1.1 31P-NMR ............................................................................................................. 92
2.2.6.1.2 13C-NMR ............................................................................................................. 92
2.2.6.1.3 1H-NMR .............................................................................................................. 93
2.2.6.2 NMR analysis conditions for model compounds and sample preparation ................ 93
2.2.6.2.1 19F NMR .............................................................................................................. 93
2.2.6.2.2 13C NMR ............................................................................................................. 94
2.2.6.2.3 13C DEPT ............................................................................................................ 94
2.2.7 Lignin molar mass distribution analyses by Size Exclusion Chromatography (SEC) .. 94
2.2.7.1 SEC in the DMAc/LiCl system ................................................................................. 94
2.2.7.2 SEC in the THF system ............................................................................................. 95
2.2.8 Lignin and lignin derivatives study by FT-IR ............................................................... 96
2.2.9 UV- Solubility study on lignin ...................................................................................... 96
2.2.10 HPLC analysis of lignin model compound ................................................................... 96
3. Lignin Phenolic hydroxyl groups quantification using the aminolysis method
and comparison with other methods ...................................................................................... 99
3.1. Introduction ........................................................................................................................... 99
3.2. Commercial lignin samples used for phenolic hydroxyl group quantification ..................... 99
3.3. Chemical composition of the lignin samples ........................................................................ 99
3.4. Quantification of lignin phenolic hydroxyl groups ............................................................. 100
3.4.1. Aminolysis method ..................................................................................................... 100

16
3.4.2. Aminolysis followed by GC ....................................................................................... 101
3.5. Comparison of the aminolysis method with other analytical methods ............................... 106
3.5.1. FT-IR ........................................................................................................................... 106
3.5.2. Lignin hydroxyl phenolic group quantification by UV spectrophotometry ................ 108
3.5.3. Lignin hydroxyl group quantification by 1H NMR ..................................................... 109
3.5.4. Lignin hydroxyl group quantification by 13C NMR .................................................... 109
3.5.5. Lignin hydroxyl group quantification by 31P NMR .................................................... 111
3.5.6. Lignin hydroxyl and carboxyl group quantification by conductometric and pH-metric titrations (Fast method) ............................................................................................................... 113
3.6. Conclusion .......................................................................................................................... 116
4. Study of the reactivity of lignin model compounds toward fluorobenzylation
using 13C and 19F NMR: Application to lignin hydroxyl groups quantification by 19F
NMR 119
4.1. Introduction ......................................................................................................................... 119
4.2. Materials and methods ........................................................................................................ 120
4.3. Lignin model compounds fluorobenzylation followed by HPLC analysis ......................... 121
4.4. NMR analysis of fluorobenzylated model compounds ....................................................... 122
4.4.1. 13C NMR analysis ....................................................................................................... 122
4.4.2. 19F NMR analysis ........................................................................................................ 130
4.4.3. Hydroxyl groups quantification of the technical ORG- lignin by 19F NMR ............... 135
4.5. Solubility of fluorobenzylated ORG lignin ......................................................................... 136
4.6. Conclusions ......................................................................................................................... 137
5. A new universal calibration method for lignin size exclusion
chromatography (SEC) analysis using novel chemical derivatization methods ... 139
5.1. Introduction ......................................................................................................................... 139
5.2. Materials and Methods ........................................................................................................ 146
5.2.1. Technical lignins ......................................................................................................... 146
5.2.1.1. Commercial lignin samples ................................................................................. 146
5.2.1.2. Eucalyptus Kraft lignin preparation at lab scale ................................................. 146
5.2.2. Derivatizations ............................................................................................................ 147
5.2.2.1. Acetylation .......................................................................................................... 147
5.2.2.2. Fluorobenzylation ............................................................................................... 147
5.2.2.3. Fluorobenzoylation ............................................................................................. 147
5.2.3. Lignin molar mass distribution analyses by SEC ....................................................... 147

17
5.2.3.1. SEC conditions .................................................................................................... 147
5.2.3.2. Calibration curves ............................................................................................... 149
5.2.3.2.1. SEC-DMAc/LiCl system – Conventional calibration ...................................... 149
5.2.3.2.2. SEC-THF – Conventional calibration .............................................................. 150
5.2.3.2.3. SEC-THF – Universal calibration .................................................................... 152
5.2.3.2.4. Calibration Strategy for the integration of SEC chromatogram ....................... 154
5.3. Results and Discussion ....................................................................................................... 155
5.3.1. Molar mass distribution study of crude lignin samples in DMAc/LiCl ...................... 155
5.3.2. Solvent wash study...................................................................................................... 157
5.3.3. SEC analysis of solvent washed PB lignin – Crude and Derivatized ......................... 159
5.3.4. Chemical derivatization of technical lignins ............................................................... 162
5.3.4.1. FT-IR analysis ..................................................................................................... 162
5.3.4.2. 19F NMR spectra ................................................................................................. 164
5.3.5. Derivatized lignin analysis in SEC-DMAc/LiCl system ............................................ 172
5.3.6. Derivatized lignin analysis in THF system (system B) ............................................... 177
5.3.6.1. Derivatized Protobind (PB) lignin SEC-THF analysis using universal and conventional calibration methods (system B) ......................................................................... 177
5.3.6.2. Derivatized Indulin (IND) lignin SEC-THF analysis using universal and conventional calibration methods (system B) ......................................................................... 180
5.3.6.3. Derivatized Organosolv (ORG) lignin SEC-THF analysis using universal and conventional calibration methods (system B) ......................................................................... 182
5.3.6.4. Derivatized Kraft (KR) lignin SEC-THF analysis using universal and conventional calibration methods (system B) ......................................................................... 184
5.3.6.5. Derivatized Eucalyptus-Kraft (EUCA-KR) lignin SEC-THF using universal and conventional calibration methods (system B) ......................................................................... 186
5.3.7. General Discussion ..................................................................................................... 188
5.3.8. Calculation of the degree of polymerization (DP) ...................................................... 190
5.4. Conclusion .......................................................................................................................... 192
Conclusions and Perspectives .................................................................................................. 195
References ...................................................................................................................................... 201
Appendix A: Derivatization and Classification of model compounds containing
aldehyde and ketone functional groups using 1H, 13C and 19F NMR: Application
to lignin carbonyl groups quantification by 19F NMR ...................................................... 219
a) Introduction ............................................................................................................................. 219
b) Materials and methods ............................................................................................................ 221

18
i) 19F NMR analysis conditions .............................................................................................. 221
ii) Choice of model compounds............................................................................................... 222
c) Model Compound fluorination - in-situ kinetics ..................................................................... 226
i) Identification of the initial and reaction products ............................................................... 226
d) Fluorination kinetic study of model compounds ..................................................................... 233
i) Model compound fluorination kinetics in neutral medium ................................................. 233
ii) Model compound fluorination kinetics in acidic medium - results ..................................... 238
e) Lignin Carbonyl group quantification after fluorination ........................................................ 241
i) Lignin derivatization with CF3PH, followed by 19F NMR analysis .................................... 241
f) Conclusion .............................................................................................................................. 249
Appendix B: Fluorobenzylation: Number of mole hydroxyls calculations .............. 253
Appendix C: Fluorobenzoylation: Number of mole hydroxyls calculations ............ 257
Summary ......................................................................................................................................... 263
Résumé ............................................................................................................................................ 263
Résumé en Français .................................................................................................................... 265
19
Abbreviations
CA Cellulose acetate
CF3PH Trifluoromethylphenylhydrazine
DMAc/LiCl Dimethylacetamide/Lithiumchloride
DMF Dimethylformamide
DMAP Dimethylaminopyridine
DMSO Dimethylsulphoxide
DP Degree of polymerization
DRI Differential refractive index
DV Differential viscosity
EtOAc Ethylacetate
EU-KR Eucalyptus-Kraft lignin
FB Fluorobenzylation
FBC 4-fluorobenzylchloride
FBO Fluorobenzoylation
FT-IR Fourier transform-Infrared
GC Gas chromatography
GC-FID Gas chromatography – Flame ionization detector
GPC Gel permeation chromatography
HPSEC High performance size exclusion chromatography
H3PO4 Ortho-phosphoric acid
HPLC High performance liquid chromatography
IND Indulin lignin
KR Kraft lignin
LS Light scattering
MALS Multi-angle static light scattering
Mn Number average molecular weight
MMD Molar mass distribution
Mw Weight Average molecular weight
MPTF 4-methylbenzotrifluoride
NBu N- tetrabutylammoniumhydroxide
ORG Organosolv lignin
NMR Nuclear magnetic resonance

20
PB Protobind 1000
PD Polydispersity
PMMA Polymethylmethacrylate
PS Polystyrene
RT Retention volume
SEC Size exclusion chromatography
THF Tetrahydrofuran
Tg Glass transition temperature
UV Ultra-violet
Vh Hydrodynamic volume
Vr Elusion volume
η Intrinsic viscosity

21
List of Figures
Figure 1.1. Share of global primary energy consumption in the world in 2016 .................................. 31
Figure 1.2. Petroleum processing vs biomass to produce fuels and chemicals (Carlos Serrano-Ruiz et
al., 2011) ............................................................................................................................................... 32
Figure 1.3. Structural arrangement of cellulose, hemicelluloses and lignin in lignocellulosic biomass
(Brandt et al., 2013) .............................................................................................................................. 33
Figure 1.4. Lignocellulosic biomass to biorefinery applications (Laurichesse and Avérous, 2014) ... 34
Figure 1.5. Chemical structure of Cellulose polymer (Credou and Berthelot, 2014) .......................... 35
Figure 1.6. Chemical structure of main hemicellulose compounds (xylan and glucomannan) (Lee et
al., 2014) ............................................................................................................................................... 37
Figure 1.7. Softwood lignin structure and main linkages (Windeisen and Wegener, 2012) ................ 39
Figure 1.8. Partial structure of a hardwood lignin molecule from European beech (Le Floch et al.,
2015) ..................................................................................................................................................... 40
Figure 1.9. The three main precursors of lignin (monolignols) and their corresponding structures in
lignin ..................................................................................................................................................... 41
Figure 1.10. Lignin formation reaction (Zhang et al., 2012) ............................................................... 42
Figure 1.11. The most common unit linkages in lignin (Chakar and Ragauskas, 2004)...................... 43
Figure 1.12. Cleavage of β-O-4 linkage during kraft process ............................................................. 46
Figure 1.13. Reaction on lignin during acid sulphite cooking ............................................................ 48
Figure 1.14. Reaction of cleavage of non-phenolic β-O-4 structures in lignin (Heitner et al., 2016). 48
Figure 1.15. A schematic overview of various reactions for the synthesis of new chemical compounds
from lignin ............................................................................................................................................ 50
Figure 1.16. Methylation of lignin using various reaction conditions (Sadeghifar et al., 2012) .......... 51
Figure 1.17. Organosolv lignin oxyalkylation reaction using propylene carbonate (Kühnel et al.,
2015) ..................................................................................................................................................... 52
Figure 1.18. Etherification of lignin using 4-Fluorobenzylchloride (Sevillano et al., 2001) ............... 53
Figure 1.19. Synthesis of lignin amine product via the Mannich reaction(Wang et al., 2016) ............ 53
Figure 1.20. Halogenation of lignin into halolignin (Meister, 2002) ................................................... 54
Figure 1.21. Formation of nitrolignin using different reagents (Kai et al., 2016) ................................ 54
Figure 1.22. Synthesis of polyester from lignin and dicarboxylic acid (Saito et al., 2012) ................. 56
Figure 1.23. Esterification of lignin using the 4-fluorobenzoic anhydride chemical (Sevillano et al.,
2001) ..................................................................................................................................................... 56
Figure 1.24. Acetylation of lignin using acetic anhydride and pyridine .............................................. 57
Figure 1.25. Synthesis of silylated lignin from soda lignin and tert-butyldimethyl silyl chloride
(Buono et al., 2016) .............................................................................................................................. 57

22
Figure 1.26. Allylated products from different bioderived phenols by Tsuji–Trost reaction with allyl
methyl carbonate ................................................................................................................................... 59
Figure 1.27. Phenolation of lignin........................................................................................................ 59
Figure 1.28. Oximation of carbonyl groups ......................................................................................... 62
Figure 1.29. Reaction between carbonyl and trifluoromethyl phenyl hydrazine (CF3 Method) for
carbonyl group quantification in lignin ................................................................................................. 68
Figure 1.30. Reactions for carbonyl group determination using NaBH4 reduction followed by
fluorobenzoylation ................................................................................................................................ 68
Figure 1.31. A schematic diagram of GPC setup for molar mass distribution study equipped with
several detectors (equipment available at LGP2).................................................................................. 71
Figure 2.1. Lignin model compounds owing α-position carbonyl ....................................................... 80
Figure 2.2. Lignin model compounds owing β-position carbonyl ....................................................... 82
Figure 2.3. Lignin model compounds owing γ-position carbonyl ....................................................... 82
Figure 2.4. Lignin acetylation reaction ................................................................................................ 85
Figure 2.5. Fluorobenzylation of lignin using 4-benzylchloride .......................................................... 86
Figure 2.6. Fluorobenzoylation on fluorobenzylated lignin ................................................................. 87
Figure 2.7. 4-trifluoromethylphenylhydrazine derivatization applied on carbonyl containing
molécules .............................................................................................................................................. 88
Figure 2.8. GC chromatogram obtained for acetyl pyrrolidine and internal standard (1-methyl
naphthalene) .......................................................................................................................................... 90
Figure 3.1. (a) Acetylation of lignin – first step (b) Aminolysis of acetylated lignin – second step. 101
Figure 3.2. GC chromatogram of 1- acetyl pyrrolidine formation during PB1000 lignin de-acetylation
............................................................................................................................................................ 102
Figure 3.3. GC chromatogram of 1- acetyl pyrrolidine formation during the Organosolv lignin (ORG)
de-acetylation ...................................................................................................................................... 103
Figure 3.4. GC chromatogram of 1- acetyl pyrrolidine formation during Kraft lignin de-acetylation
............................................................................................................................................................ 104
Figure 3.5. Aminolysis of acetylated lignin samples, PB-lignin, ORG lignin, Kraft lignin and Indulin
lignin ................................................................................................................................................... 105
Figure 3.6. FT-IR spectra of crude and acetylated lignins (a) PB - Protobind lignin (b) ORG -
Organosolv lignin (c) Kraft lignin (d) IND- Indulin lignin ................................................................. 107
Figure 3.7. KF-Kraft lignin sample 13C-NMR spectrum and detail of the carboxyl zone. ................ 111
Figure 3.8. 31P-NMR spectrum of the PB-Protobind lignin sample ................................................... 112
Figure 3.9. Conductometric and acid-base titration curves for lignin samples .................................. 114
Figure 4.1. Schematic reaction of lignin fluorobenzylation (Cl-R-F: 4-Fluorobenzylchloride,
Lig=Lignin). ........................................................................................................................................ 120

23
Figure 4.2. Studied model compounds: Vanillin (1), Acetovanillone (2), Guaiacol (3), Vanillyl
alcohol (4), Veratryl alcohol (5) and D(+) Cellobiose (6) .................................................................. 121
Figure 4.3. HPLC chromatogram of acetovanillone (orange) and fluorobenzylated-acetovanillone
(blue) ................................................................................................................................................... 122
Figure 4.4. Fluorobenzylation reaction of lignin................................................................................ 123
Figure 4.5. Structure and number assignment of fluorobenzylated lignin model compounds ........... 124
Figure 4.6. 13C-NMR spectra of the mixture issued from the fluorobenzylation of Vanillyl alcohol (4)
in DMSO-d6........................................................................................................................................ 128
Figure 4.7. 13C-NMR spectra of the mixture issued from the fluorobenzylation of Veratryl alcohol (5)
in DMSO-d6........................................................................................................................................ 129
Figure 4.8. 19F-NMR spectra of fluoroderivatized model compounds. From top to bottom: Vanillin,
Acetovanillone, Guaiacol, Vanillyl alcohol and Veratryl alcohol. ..................................................... 133
Figure 4.9. Comparison of 19F-NMR spectra of fluorobenzylated ORG lignin (in blue) and
derivatized model compounds. (Note: Only phenol derivatization for 4)........................................... 135
Figure 4.10. Absorbance spectra of dissolved derivatized and underivatized ORG lignins in THF . 137
Figure 5.1. A schematic diagram of SEC setup for molar mass distribution, intrinsic viscosity and
hydrodynamic radius measurement equipped with several detectors ................................................. 140
Figure 5.2. Calibration curve of PS in DMAc/LiCl (system A, Polargel column setup) .................. 149
Figure 5.3. Conventional calibration curves of PS, PMMA and Cellulose acetate (CA). Different
retention times are chosen to calculate and compare the corresponding log (M). .............................. 151
Figure 5.4. Top: Global universal calibration curve including all points of PS, PMMA and Cellulose
acetate; and bottom: Individual universal calibration curves including data of each type of polymer154
Figure 5.5. SEC chromatograms of underivatized technical lignins, Indulin (left) and EU-KR
(Eucalyptus-Kraft) lignin, using system A in DMAc/LiCl (right). V0 and Vt represent the start and end
volumes used for peak area integration and calculation of the average molar masses. ...................... 155
Figure 5.6. SEC chromatograms of underivatized technical lignins in DMAc/LiCl. Left: Relative
abundance Vs Retention volume (mL). Right: Relative abundance Vs log M. .................................. 156
Figure 5.7. SEC chromatogram profiles of PB washed underivatized lignins, acetylated and
fluorobenzylated lignin samples in different solvents. Plot: Relative abundance vs Retention volume
(left) and Relative abundance vs log (M) (right). ............................................................................... 160
Figure 5.8. FTIR spectra of ethyl acetate washed PB, ORG, Indulin, KR (Kraft) and EU-KR
(Eucalyptus kraft) lignins, A – Acetylated, FB- Fluorobenzylated, FBO- Fluorobenzoylated........... 162
Figure 5.9. 19F NMR spectra of fluorobenzylated and fluorobenzoylated Protobind, Organosolv,
Indulin, Kraft and Eucalyptus-Kraft lignins. Chemical shifts relative to CFCl3. Internal standard: 2-
fluoroacetophenone ............................................................................................................................. 166

24
Figure 5.10. SEC chromatogram profiles of underivatized and derivatized (acetylated,
fluorobenzylated and fluorobenzoylated) of all studied lignin samples. Relative abundance vs
Retention volume (left) and Relative abundance vs log (M) (right) ................................................... 174
Figure 5.11. SEC – MMD universal calibration curve of PB lignin: relative abundance Vs retention
volume (left) and relative abundance Vs log (Mw) (right) (A - acetylated, FB - fluorobenzylated and
FBO - fluorobenzoylated) ................................................................................................................... 178
Figure 5.12. Comparison of universal and conventional SEC – MMD curves of relative abundance Vs
log(Mw) for A - acetylated, FB - fluorobenzylated and FBO - fluorobenzoylated PB lignin samples
............................................................................................................................................................ 179
Figure 5.13. SEC – MMD universal calibration curve of Indulin (IND) lignin: relative abundance vs
retention volume (left) and relative abundance vs log (M) (right) (A - acetylated, FB -
fluorobenzylated and FBO - fluorobenzoylated) ................................................................................ 180
Figure 5.14. Comparison of universal and conventional SEC – MMD curves of relative abundance Vs
log(Mw) for A - acetylated, FB - fluorobenzylated and FBO - fluorobenzoylated Indulin lignin
samples ................................................................................................................................................ 181
Figure 5.15. SEC – MMD universal calibration curve of Organosolv (ORG) lignin: relative
abundance vs retention volume (left) and relative abundance vs log (M) (right) (A - acetylated, FB -
fluorobenzylated and FBO - fluorobenzoylated) ................................................................................ 183
Figure 5.16. Comparison of universal and conventional SEC – MMD curves of relative abundance vs
log (M) for A - acetylated, FB - fluorobenzylated and FBO - fluorobenzoylated ORG lignin samples
............................................................................................................................................................ 183
Figure 5.17. SEC – MMD universal calibration curve of Kraft (KR) lignin: relative abundance vs
retention volume (left) and relative abundance vs log (Mw) (right) (A - acetylated, FB -
fluorobenzylated and FBO - fluorobenzoylated) ................................................................................ 185
Figure 5.18. Comparison of universal and conventional SEC – MMD curves of relative abundance vs
log (M) for A - acetylated, FB - fluorobenzylated and FBO - fluorobenzoylated Kraft lignin samples
............................................................................................................................................................ 185
Figure 5.19. SEC – MMD universal calibration curve of EUCA-KR lignin: relative abundance vs
retention volume (left) and relative abundance vs log (M) (right) (A - acetylated, FB -
fluorobenzylated and FBO - fluorobenzoylated) ................................................................................ 187
Figure 5.20. Comparison of universal and conventional SEC – MMD curves for EUCA-KR lignin;
A - acetylated, FB - fluorobenzylated and FBO - fluorobenzoylated . ............................................... 187
Figure 1. Carbonyl labeling with fluorinated hydrazine .................................................................... 219
Figure 2. Internal standards: a) GFB: Guaiacyl 4-fluorobenzoate, b) F3BP:
Trifluoromethylbenzophenone ............................................................................................................ 221

25
Figure 3. Fluorination kinetics of model compounds bearing α-position carbonyl group in neutral
condition ............................................................................................................................................. 233
Figure 4. Fluorination kinetics of model compounds bearing β-position carbonyl group in neutral
condition ............................................................................................................................................. 235
Figure 5. Fluorination kinetics of model compounds bearing γ -position carbonyl group in neutral
condition ............................................................................................................................................. 236
Figure 6. Polarisation of the carbonyl bond and polarization order according to substituents ......... 236
Figure 7. 13C NMR spectra in DMSO-d6 of: (a) CF3PH, (b) model compound 6 before derivatization,
(c) model compound 6 kinetic in neutral medium after 1 day, (d) model compound 6 kinetic in acidic
medium after 1h .................................................................................................................................. 237
Figure 8. 19F NMR spectra in DMSO-d6 of: (a) CF3PH, (b) model compound 6 kinetic in neutral
medium after 1 day, (c) model compound 6 kinetic in acidic medium after 1h ................................. 238
Figure 9. Reaction mechanism of the formation of hydrazine into acidic medium ........................... 239
Figure 10. Fluorination kinetics of model compounds bearing α -position carbonyl group in acidic
condition ............................................................................................................................................. 239
Figure 11. Fluorination kinetics of model compounds bearing γ -position carbonyl group in neutral
condition ............................................................................................................................................. 240
Figure 12. Carbonyl group conversion ratio with different experimental conditions ........................ 246
Figure 13. 19F NMR spectra of PB1000 lignin ethylacetate washed. (A) in-situ derivatization (B)
derivatization with the conventional method ...................................................................................... 248
Figure 14. 19F NMR chemical shift of CF3PH in function of pH ....................................................... 249

26

27
List of Tables
Table 1.1. Approximate lignin inter-unit linkage percentages found in softwood and hardwood
(Adler, 1977) ......................................................................................................................................... 44
Table 1.2. Various functional groups present in softwood and hardwood lignin of different types
(abundance per 100 C-9 units) .............................................................................................................. 45
Table 1.3. Properties of technical lignins according to the extraction process (Laurichesse and
Avérous, 2014) ...................................................................................................................................... 49
Table 1.4. Summary of all known characterization methods to determine phenolic hydroxyl group of
lignins, with the main advantages and disadvantages (Faix et al., 1992). ............................................ 69
Table 2.1. List of lignin model compounds containing α-position carbonyl group ............................. 81
Table 2.2. List of model compounds containing β-position carbonyl group ........................................ 82
Table 2.3. List of lignin model compounds containing γ-position carbonyl group .............................. 83
Table 2.4. Different kinetic conditions investigated for phenyl hydrazine derivatization ................... 88
Table 3.1. Chemical composition of the technical lignins, in % ........................................................ 100
Table 3.2. Comparison of phenolic hydroxyl group content in different technical lignins, from lignin
aminolysis ........................................................................................................................................... 106
Table 3.3. Comparison of phenolic hydroxyl group quantification (mmol/g) using aminolysis and UV
spectrophotometry ............................................................................................................................... 108
Table 3.4. Comparison of phenolic hydroxyl group quantification (mmol/g) using aminolysis and 1H
NMR spectroscopy .............................................................................................................................. 109
Table 3.5. Comparison of phenolic hydroxyl group quantification (mmol/g) using aminolysis and 13C
NMR spectroscopy .............................................................................................................................. 110
Table 3.6. Comparison of phenolic hydroxyl group quantification (mmol/g) using aminolysis and 31P
NMR spectroscopy .............................................................................................................................. 111
Table 3.7. Hydroxyl group determination (mmol/g) using 31P NMR spectroscopy ........................... 113
Table 3.8. Phenolic hydroxyl group quantification (mmol/g) using the fast titration method,
comparison with aminolysis and other methods ................................................................................. 115
Table 3.9. Comparison of carboxyl group quantification (mmol/g) using the fast method, the TnBAH
titration and 31P NMR ......................................................................................................................... 116
Table 4.1.13C NMR chemical shifts of FBC -CH2’ group (Figure 4.5) of products present in the
medium after lignin model compound derivatization ......................................................................... 124
Table 4.2. Mixture ratio of products obtained after the model compound fluorobenzylation, calculated
from 13C NMR data (organic part) ...................................................................................................... 125
Table 4.3. 13C NMR Chemical shifts (in ppm) of fluorobenzylated model compounds (C numbering
according to Figure 4.5) ...................................................................................................................... 126

28
Table 4.4. Mixture ratio of Veratryl alcohol (5) fluorobenzylation carried out with modified
conditions, calculated from 13C NMR data ......................................................................................... 129
Table 4.5. Mixture ratio of products obtained after cellobiose (6) fluorobenzylation, calculated from 13C NMR data after analysis of the organic and aqueous phases ........................................................ 130
Table 4.6. Conversion rate and mixture ratio of model compound fluorobenzylation, calculated from 19F NMR data ...................................................................................................................................... 131
Table 4.7. 19F NMR chemical shifts (in ppm) of fluorobenzylated model compounds ..................... 131
Table 4.8. Conversion rate and mixture ratio of Veratryl alcohol (5) fluorobenzylation carried out
using modified operating conditions, calculated from 19F NMR data ................................................ 134
Table 4.9. Conversion rate and mixture ratio of cellobiose (6) fluorobenzylation, calculated from 19F
NMR data after analysis of the organic and aqueous phases .............................................................. 134
Table 5.1. SEC conditions used for analysis of lignin samples using DMAc/LiCl and THF systems
............................................................................................................................................................ 148
Table 5.2. Molar mass (Da) of known PS standards with deviations between recalculated and true M
values .................................................................................................................................................. 149
Table 5.3. Calculation of MW (g mol-1) of different polymer standards obtained from conventional
calibration curve at different retention volumes (min) ....................................................................... 152
Table 5.4. Average molar mass data (Mn, Mw) / g mol-1, polydispersity (Mw/Mn) and average degree
of polymerization (DPn, DPw) of underivatized technical lignins in SEC-DMAc/LiCl systems ...... 157
Table 5.5. Solvent parameters for ethanol, ethylacetate and hexane ................................................. 158
Table 5.6. Before and after washing of PB lignin in different solvents and final yield in % ............. 158
Table 5.7. Average molar mass data (Mn, Mw in Da), polydispersity (Mw/Mn) and average degree of
polymerization (DPn, DPw) of crude PB lignin, washed PB lignin and derivatized (acetylated and
fluorobenzylated) PB lignin samples in SEC system A (direct dissolution, Polargel M column setup,
DMAc/LiCl as solvent, DRI detection, std. calibration with monodisperse polystyrene calibrants) . 161
Table 5.8. Total number of OH groups (in mmol/g) in fluorobenzylated lignin samples, determined by 19F NMR spectroscopy ........................................................................................................................ 167
Table 5.9. Total OH groups (in mol/mol aromatic unit) in fluorobenzylated lignin samples,
determined by 19F NMR spectra ......................................................................................................... 168
Table 5.10. Total number of OH groups (in mmol/g) in fluorobenzoylated lignin samples, determined
by 19F NMR spectra ............................................................................................................................ 169
Table 5.11. Total OH groups in fluorobenzoylated lignin in mmol/mol, determined by 19F NMR
spectroscopic analysis ......................................................................................................................... 171
Table 5.12. Calculated monomer molar mass in g.mol-1 of fluorobenzylated and fluorobenzoylated
lignin samples from 19F NMR ............................................................................................................. 172

29
Table 5.13. Average molar mass data (Mn, Mw in g.mol-1), polydispersity (Mw/Mn) and average degree
of polymerization (DPn, DPw) of underivatized and derivatized lignin samples in SEC-DMAc/LiCl
system (system A) ............................................................................................................................... 175
Table 5.14. Calculated degree of substitution (DS) based on Mn and Mw values for all lignin samples
............................................................................................................................................................ 177
Table 5.15. MMD of derivatized PB lignin from universal calibration with global curve fit and
individual curve fit and comparison with conventional calibration. Mn and Mw values in Da. .......... 179
Table 5.16. MMD of derivatized IND lignin from universal calibration with global curve fit and
individual curve fit and comparison with conventional calibration. Mn and Mw values in Da. .......... 182
Table 5.17. MMD of derivatized ORG lignin, from universal calibration with global curve fit and
individual curve fit, and comparison with conventional calibration. Mn and Mw values in Da. ......... 184
Table 5.18. MMD of derivatized Kraft pine lignin, from universal calibration with global curve fit
and individual curve fit, and comparison with conventional calibration. Mn and Mw values in Da. .. 186
Table 5.19. MMD of derivatized EUCA-KR lignin from universal calibration with global curve fit
and individual curve fit, and comparison with conventional calibration. Mn and Mw values in Da. .. 188
Table 5.20. Calculated average DP’s from universal calibration – Global curve fit. ........................ 190
Table 5.21. Calculated average DP’s from conventional calibration (using polystyrene standards) 191
Table 1. Model compounds owing α-position carbonyl .................................................................... 223
Table 2. Model compounds owing β-position carbonyl ..................................................................... 224
Table 3. Model compounds owing γ-position carbonyl ..................................................................... 224
Table 4. Other typical model compounds, without carbonyl functions.............................................. 226
Table 5. Model compounds 13C chemical shifts (ppm) in DMSO-d6 at 25°C, in bold of C=O
groups .................................................................................................................................................. 227
Table 6. Model compounds 1H NMR chemical shifts (ppm) in DMSO-d6 à 25°C .......................... 229
Table 7. Main chemical shifts as hydrazone formation evidence (ppm) 1H, 13C and 19F in DMSO-d6
at 25°C ................................................................................................................................................ 231
Table 8. Kinetic results (conversion rate in % and time in hours) and E/Z isomer in % of all model
compounds were compared in neutral and acetic medium. ................................................................ 234
Table 9. Lignin carbonyl group quantification by 19F NMR analysis after lignin derivatization using
the trifluoromethyl phenylhydrazine agent ......................................................................................... 243
Table 10. 13C NMR integral value of lignin (aromatic and methoxy groups) before and after F3PH
derivatization....................................................................................................................................... 244
Table 11. Different kinetic conditions investigated for carbonyl group study of PB Lignin ............. 245
Table 12. Reaction kinetics (mmol of C=O per gram) comparisons of in-situ method (Conditions 1 to
3) with conventional method .............................................................................................................. 247

30

31
CHAPTER
1
1 Bibliographic Study
In this chapter, a general overview of lignocellulosic biomass and its typical components are
illustrated. In addition, a focus on lignin is made, including the description of lignin structure with
different linkages and functional groups, and a review on chemical modifications and lignin
characterizations. Finally, motivations and outlines of this thesis work are provided.
1.1 Introduction
For decades, fossil resources are used for the production of fuels and chemical feed stocks,
contributing for more than 80% of the energy consumed in the world. Globally, the energy demand
has been tremendously increasing whereas fossil resources drop rapidly which affects the countries
that solely depend on petroleum. Increasing oil price, greenhouse gas emission and environmental
impacts are also the driven forces to search for alternative sources. Recently, a research activity
associated to energy sector shows that the energy demand would remarkably increase, over 60% by
2030 (Jacobson and Delucchi, 2009). From the statistical review of world energy in 2016, fossil fuel
is involved in around 85% of global energy consumption (Figure 1.1).

32
Figure 1.1. Share of global primary energy consumption in the world in 20161
Last few years, renewable energy field is overwhelming and renewable resources are thought to be
ideal candidates to replace fossil resources (Carlos Serrano-Ruiz et al., 2011). The renewable energies
comprised wind and solar-energies, and hydro-electricity. These new alternatives can partly substitute
natural gas and coal for the production of heat and electricity. However, they strongly depend on
natural processes such as the weather, geographical location etc and therefore they appear limited as
bioenergy sources.
Biomass, the main sustainable organic source on earth, including forestry and wood processing
residues, crop residues and animal wastes may be a better alternative. In particular, lignocellulosic
biomass is an interesting bioresource for the replacement of petroleum based fuels, chemicals and
carbon based materials (Ragauskas et al., 2006a) as it contains a large amount of carbon. It is also
renewable and readily available on earth and most importantly non-edible. Therefore, without
affecting food chain and land use, lignocellulosic biomass should allow sustainable production of
fuels and chemicals (Carlos Serrano-Ruiz et al., 2011).
The different steps for the production of fuels and chemicals from petroleum and biomass sources
are illustrated in Figure 1.2. This picture clearly shows that the conversion of biomass into fuels and
chemicals requires deep chemical changes along with multistep chemical processing and therefore it
is cumbersome comparing to petroleum where separation used fractional distillation.
1 https://www.financialsense.com/robert-rapier/renewable-gains-offset-coals-decline-in-2016
33%
24%
28%
5%
7% 3%
Oil
Natural gas
Coal
Nuclear energy
Hydroelectric
Modern renewables

33
Figure 1.2. Petroleum processing vs biomass to produce fuels and chemicals (Carlos Serrano-Ruiz et
al., 2011)
Many recent studies have been focused on the investigation of lignocellulosic biomass feed stock
conversion in to biofuels, power, heat and value added chemicals, and this concept is known as
biorefinery (Ragauskas et al., 2006a). In this biorefinery process, first generation biofuel-bioethanol
has been produced from sugar cane and sugar beet in order to reduce energy demand. However, the
major limitation is that the energy crops occupy the agricultural land which led for food demand. To
overcome this constraint, forestry and agricultural wastes (wheat straw and other residues), industrial
process residues, house hold wastes and aquaculture (algae and seaweeds) were investigated to make
second generation biofuels and chemicals through thermochemical or biochemical pathway
(Cherubini, 2010). Therefore, lignocellulosic biomass plays a vital role in the modern society for the
replacement of fossil fuel to overcome the energy demand and to decrease the most dangerous
greenhouse gas emission. In the following sections, detailed information about lignocellulosic
biomass is established.
1.2 Lignocellulosic Biomass
The typical cell wall of plant is made up of by a composite material called lignocellulosic biomass.
It is naturally composed of carbohydrate polymers, cellulose (35-83 % dry weight basis) and
hemicelluloses (0-30% dry weight basis) and of an aromatic amorphous polymer, lignin (1-43%).
Some other components such as extractives and minerals are also present but in minor quantities
(Dence and Lin, 1992). The composition of the lignocellulosic biomass varies with plant species and

34
environmental conditions (Cen et al., 2001). This composition and interactions between
lignocellulosic biomass components significantly affect the plant cell wall physicochemical
properties, therefore understanding each component percentage is important in every plant source to
further utilize for wide range of biorefinery applications.
Lignocellulosic biomass consists of crystalline cellulose fibrils bound by non-crystalline and a
matrix of hemicelluloses along with lignin (Wyman, 1994; Ramos, 2003). The typical structure of
lignocellulosic biomass is shown in Figure 1.3
Figure 1.3. Structural arrangement of cellulose, hemicelluloses and lignin in lignocellulosic biomass
(Brandt et al., 2013)
Lignocellulosic biomass is already widely exploited by the pulp and paper industry to convert it
into cellulosic fibres for paper and chemical applications. Today, pulp and paper mills investigate the
biorefinery concept to add, in the fibre line, new processes to extract added value products. The
biorefinery concept starts with pre-treatment processes such as conventional soda, kraft, organosolv
and sulphite pulping processes (a detailed explanation is given in the following section), with the final
objective to separate individual components for further valorisation into different potential
applications (Figure 1.4).

35
Figure 1.4. Lignocellulosic biomass to biorefinery applications (Laurichesse and Avérous, 2014)
1.2.1 Cellulose
Cellulose is the most abundant biopolymer and a main wood components; the worldwide estimated
amount is around 2x10⁹ tons year-1 (Sasaki et al., 2003). Cellulose is a linear homopolymer,
comprising linear glucan chains linked through repeating (14) glycoside bonds, β-D-glucopyranose
units, as shown in Figure 1.5.
Figure 1.5. Chemical structure of Cellulose polymer (Credou and Berthelot, 2014)

36
The dimer of cellulose is called cellobiose. The size of the cellulose polymer mainly described by
the degree of polymerisation (DP) varies depending on the plant species and environmental
conditions. The DP is determined through the number of anhydroglucose units present in the
cellulose. The average DP of cellulose ranges from 3000 to 15000 depending upon the source, with an
average DP of around 10 000 in wood (Jones et al., 2017). During cellulose extraction from wood, the
DP decreases till an average of 600 to 1200 (Lynd et al., 2002). Cellulose chains are arranged in
parallel and stabilised through strong lateral intramolecular and intermolecular hydrogen bonds.
Cellulose contains both crystalline and amorphous domains, forming rope like structures called
microfibrils (Milton, 1995). The cellulose possesses two ends, a reducing functional group in one end
and a non-reducing group in the other end (Habibi et al., 2010). In general, cellulose mostly exists in
crystalline phase in living plants and it has two allomorphs such as Iα and Iβ, (O’Sullivan, 1997)
whose differ in their hydrogen bond arrangements. It has been reported that crystalline cellulose
becomes amorphous when it is heated at 20˚C with a pressure of 25 MPa (Deguchi et al., 2006).
Dissolution of cellulose is non-trivial in either polar or non-polar solvents due to three hydroxyl
groups such as OH-C2, OH-C3 and OH-C6, which form a network of strong hydrogen bonds.
Hydrogen bonds are quite polar and the solvents are incapable of breaking these bonds to make
cellulose soluble. Interestingly, cellulose contains both hydrophilic (OH groups) and hydrophobic part
(CH2 groups), however the latter is dominant due to large amount of C-H groups in cellulose (Glasser
et al., 2012).
During the kraft pulping process, the cellulose fraction with low degree of polymerisation can be
dissolved directly in the liquor. In such alkaline conditions, cellulose depolymerisation is greatly
enhanced (Sjöholm et al., 1997). Cellulose is also affected in acidic environments. Organic acid-
catalysed reaction using oxalic and maleic acid for example and heterogeneous catalysts reactions are
also employed for cellulose depolymerisation yielding oligomers and glucose (Shrotri et al., 2018;
Stein et al., 2010).
Besides, various chemical reactions can be performed on cellulose hydroxyl groups to increase its
added value for chemical applications like oxidation, sulphonation and esterification (Sjostrom, 1993;
Gu et al., 2013). Furthermore, the reducing end or hemiacetal exists as aldehyde under equilibrium.
Therefore, the existence of aldehyde group in cellulose can undergo chemical derivatisation like
hydrazinolysis and the resulting product can used as adsorbent for efficient removal of Cd (II) and Pb
(II) ions from aqueous solution (Jia et al., 2017; Naven and Harvey, 1996).
Due to the large abundance of cellulose in nature, it is the most thoroughly exploited natural
polymer and it is valorised into many applications, the major one being in the pulp and paper industry.
In recent year, nanocellulose and microfibrillated cellulose have also gained considerable attention

37
due to interesting specific properties (low weight, biodegradability, high strength and stiffness etc). In
the future, they will be used in a wide range of applications, including bio-nanocomposite production,
paints, cosmetics, foods and pharmaceutical products (Siró and Plackett, 2010).
1.2.2 Hemicelluloses
Hemicelluloses are carbohydrate type branched biopolymers present in the secondary cell wall of
vegetal biomass. They are bound to cellulose through strong hydrogen bonds leading to a matrix
network with cellulose micro fibrils, that provides a strong structural backbone for the cell wall
(Mosier et al., 2005). Hemicelluloses are divided into four main groups: mannans, xylans and mixed-
linkage of xyloglucans and β-glucans (Ebringerová et al., 2005). It consists of mainly C-6 sugars such
as D-glucose, D-mannose, galactose and C-5 or pentoses sugars namely, L-arabinose and D-xylose.
The typical DP of hemicelluloses in wood is around 80-200 (Sjostrom, 1993), lower than cellulose
(Milton, 1995). Moreover, hemicelluloses occupy up to 50% of the vegetal biomass, and their
composition can vary in different plant or wood species and also within the parts of the lignocellulosic
substrate (for instance leaves, roots and stems). Xylans and glucomannans are the predominant
components in hemicelluloses (Figure 1.6).
(b)
Figure 1.6. Chemical structure of main hemicellulose compounds, (a) glucomannan (Prakobna et al.,
2015) (b) xylan (Horst et al., 2005)

38
Xylans are the major hemicelluloses type in hardwoods and herbaceous plants, constituting around
20-30% of the secondary cell wall (Gírio et al., 2010). Linear and slightly shorter branched polymers
called galactoglucomannan are the main components of softwood hemicelluloses (Sjostrom, 1993),
while in the cases of straw and grass hemicelluloses, glucurono-arabinoxylans, arabinoxylans and
arabino-glucuronoxylans are the dominant components (Gírio et al., 2010). In contrast to cellulose,
hemicelluloses are amorphous and shorter polymer and often more branched macromolecules, leading
to different properties. As an example, it is partly soluble in water (Albertsson et al., 2011).
During pulping processes, hemicelluloses are generally conserved for paper applications due to
their tendency of increasing the paper strength in particular, tensile, fold, and tear resistance
properties. (Anjos et al., 2004; Bajpai, 2018). Hemicelluloses also influence the pulp yield. In the
case of dissolving pulp applications, hemicelluloses are known to be undesirable impurities since they
affect the production and the reactivity of high purity cellulose. Various processes are employed for
removing hemicelluloses selectively, including alkaline, nitrine and cuen extraction and ionic liquids
extraction. (Froschauer et al., 2013; Puls et al., 2006; Sixta, 2008).
Hemicelluloses can be hydrolysed with the help of acids to break the macromolecule into
oligomers, and, after further reaction, to the formation of sugar monomers. Less severe conditions
than for cellulose may be employed for this conversion, because of the amorphous nature of
hemicelluloses. Hemicelluloses can be pyrolysed and decomposed into various products including the
formation of furfural, methylglyoxal, glycolaldehyde, acetaldehyde and C6 products etc (Zhou et al.,
2018).
Hemicelluloses could be valorised in various potential applications, such as protective colloids,
emulsifiers, plant gum for thickeners, stabilizers and adhesives (Kamm and Kamm, 2004; Zhang,
2008). In recent years, xylitol (Walther et al., 2001; Buhner and Agblevor, 2004) (from fermented
xylose) is used as a sweetener for the replacement of sucrose sugars for diabetic patients.
Furthermore, furfurals, produced from the chemical degradation of hemicelluloses, are used as a
solvent for lubricants, adhesives, coatings and furan resins etc (Kamm et al., 2008; Zhang, 2008).
1.2.3 Lignin
This section gives general introduction on lignin, structures of lignin, linkages present in lignin and
lignin isolation from the vegetal biomass via different pulping processes.
1.2.3.1 Introduction
Lignin research has been started more than a century ago. The name “lignin” is derived from the
Latin word lignum meaning wood, as reported in the Sarkanen work (Sarkanen and Ludwig, 1971).

39
During the year of 1838, Anselme Payen, first, recognised the composite behaviour of wood and
named the fibrous material as cellulose and the carbon rich substance as an encrusting material in
lignified cell walls. Later in 1865, Schulze introduced the term “lignin” and subsequently in 1957,
Adler proposed the first lignin model (Adler, 1957).
Lignin is the second most abundant aromatic biopolymer in plant, distinctly different from other
bio-polymers (cellulose and hemicelluloses) and covers the space inside the cell wall through cross
linkages with polysaccharides. It is covalently bonded to hemicelluloses and cellulose as well as with
cell wall glycoproteins. These interactions provide a strong structural support to the plant.
Polysaccharides in the plant cell wall are highly hydrophilic and more susceptible to water absorption,
however, crosslinked and hydrophobic character of lignin prevents the water absorption in to cell
wall.
The complex poly aromatic and highly branched structure of softwood and hardwood lignins is
shown in Figure 1.7 and Figure 1.8.
Figure 1.7. Softwood lignin structure and main linkages (Windeisen and Wegener, 2012)

40
Figure 1.8. Partial structure of a hardwood lignin molecule from European beech (Le Floch et al.,
2015)
The lignin content in wood exhibits large variations. For instance, softwood contains around 25 to
30 weight/percentage whereas it makes up 9 to 23 wt % in hardwoods (Sixta, 2008). Like softwood,
grasses also contain lignin from 10 to 30 wt %. It is interesting to note that tissues of some plants
such as nut shells present high amount of lignin, ranging from 30 to 40 wt % whereas in some soft
tissues like cotton seed hairs and leaves, no lignin is present (Sun and Cheng, 2002). Furthermore,
similar to the cellulose and hemicelluloses, lignin composition and proportion heavily vary with
respect to cell types in the plant species.
Lignin mainly consists of three major phenyl propane units: p-hydroxyphenyl (H), guaiacyl (4-
hydroxy-3-methoxyphenyl) (G) and syringyl (4-hydroxy-3,5-dimethoxyphenyl) (S) propane units.
These units originally come from the main precursors namely coumaryl, coniferyl and sinapyl
aromatic alcohols (Figure 1.9).

41
Figure 1.9. The three main precursors of lignin (monolignols) and their corresponding structures in
lignin
Straw and grass plants are made up of all three H, G and S units. G unit is the main unit in
softwood lignins, whereas in hardwood lignins, G and S units are dominant. Due to this diverse nature
of lignin, the exact lignin structure cannot be resolved completely (Hon, 1996) (Dorrestijn et al.,
2000).
There are various mechanisms explaining the formation of lignin macromolecule in plants through
different processes such as biological, chemical and biochemical ways. One theory believes that lignin
formation is totally controlled biochemically at proteinaceous level (Davin and Lewis, 2005). Another
important theory states that lignification starts with radical production through the oxidation by
various enzymes like peroxidases, phenol oxidases, and laccases etc, leading to dehydrogenated
monolignols (e.g., coniferyl alcohol) (Gang et al., 1999; Ralph et al., 2004; Vanholme et al., 2010).
The resulting radicals are significantly stabilised due to delocalisation of an unpaired electron and
consequently, these radicals randomly couple each other into macro polymer (Achyuthan et al., 2010).
For instance, the active radical intermediates are generated from the monolignol (coniferyl alcohol) by

42
oxidation of the phenol unit. The phenoxy radicals couple each other to the formation of lignin
polymer yielding units with different interunit linkages (Zhang et al., 2012). A schematic reaction of
the formation of lignin with different linkages is shown in Figure 1.10.
Figure 1.10. Lignin formation reaction (Zhang et al., 2012)
Lignin is hydrophobic compared with carbohydrate polymers such as cellulose and hemicellulose.
However, the number of hydroxyl groups present in the lignin is sufficient to play a crucial role as a
reactive site to form hydrogen bonds with water molecules. (Hatakeyama et al., 1983).
Due to its highly complex chemical structure, the precise structure of lignin is still unknown. The
lignin macromolecule is amorphous and presents conjugated systems leading to colour: native lignin
in wood is yellow and residual lignin in paper pulp is brown. Besides, almost all lignins in plants are
insoluble in inert solvents. Lignin is made of highly rigid molecules cross-linked each other,
restricting the molecular motion and therefore increasing the glass transition temperature (Tg). Tg of
kraft lignins and lignosulphonates is observed at 100 ºC, and Tg of hydrolysed lignin samples from
different industrial lignin plants are found in a temperature range of 70-85 ºC (Hatakeyama and
Hatakeyama, 2010).
Thermal decomposition of lignin has been investigated with the help of thermogravimetry (TG)
techniques. The results suggested that a slight mass variation occurred in the temperature range of 0 –
150 ºC which can be attributed to vaporization of residual water in the sample. Thermal
decomposition starts around 200 ºC and the extrapolated temperature for kraft lignin and

43
lignosulphonate are around 321 and 324 ºC, respectively. At 500 ºC, the residual mass of lignin was
found to be ca. 45% (Hatakeyama and Hatakeyama, 2010).
The calorific values of oven-dried hardwood and softwood are predicted to be 19.7 MJ/kg and 20.9
MJ/kg, respectively. The difference in heat values is due to the lignin content, higher in softwood in
comparison with hardwood. The estimated calorific value of cellulose, hemicelluloses and lignin are
17 MJ/kg, 16.63 MJ/kg and 21.13 MJ/kg, respectively. It has been known that moisture wood
produces low heat (15 MJ/kg) due the presence of water that consumes some energy for evaporation
during combustion process (Ince, 1979; Demirbaş, 2001; Spellman, 2011; Kim et al., 2017).
1.2.3.2 Linkages in Lignin
As seen in Figure 1.7, lignin exhibits a complex and irregular structure, because it is formed
through a random polymerisation process. The lignin linkages have been examined during
delignification processes or after breaking the lignin polymer units into monomers. The most widely
used techniques are oxidation (Hedges and Mann, 1979), pyrolysis (Faix et al., 1990), biodegradation
(Tien and Kirk, 1983) and acidolysis (Lapierre et al., 1991). Lignin structural elucidation has also
been investigated by various laboratory chemical methods, numerous NMR (Faix et al., 1994)
techniques, gas chromatography – mass spectrometry (GC-MS) (Faix et al., 1990), electron
microscopies (Fromm et al., 2003) and spectroscopic techniques (Faix, 1991; Atalla and Agarwal,
1985). The reported studies have found that the most typical linkages are β-O-4, β-5, α-O-4, 4-O-5, 5-
5, β- β and β-1 (Zakzeski et al., 2010; Syrjänen and Brunow, 2000; Chakar and Ragauskas, 2004)
(Figure 1.11).
Figure 1.11. The most common unit linkages in lignin (Chakar and Ragauskas, 2004)

44
Among them the β-O-4 linkage is the predominant. The hardwood lignin consists of around 60%
of β-O-4 linkages whereas it makes up to 40% in softwood lignin. The remaining 40% linkages in
hardwood lignin are rather evenly distributed among other linkages such as β-5, 5-5 and β-β etc.
However, in the case of softwood lignin, around 15% linkage goes for β-5 and 12% for 5-5 linkage
(Dorrestijn et al., 2000). The percentages of different linkages are illustrated in Table 1.1. Among all
linkages, the higher linkage content is obtained via position 5 of the aromatic ring which explains that
guaiacyl units are readily available whereas position 5 in syringly unit is preoccupied and blocked.
Table 1.1. Approximate lignin inter-unit linkage percentages found in softwood and hardwood
(Adler, 1977)
Linkage type Percentage (%)
Softwood Hardwood
β-O-4 45-55 60
5-5 19-22 9
β-5 9-12 6
4-O-5 4-7 6.5
β-1 7-9 1
β- β 2-4 3
As seen in the Figure 1.7 and Figure 1.8, it is clearly demonstrated that lignin contains numerous
functional groups and the most abundance of functional groups are illustrated in Table 1.2. Some
characteristic groups such as methoxyl, aliphatic, phenolic hydroxyl groups and carbonyl groups are
common and thus responsible for the chemical reactivity of lignin. However, it should be noted that
these functional groups can vary depending on the wood species and also differ within the cell walls
(Capanema et al., 2005; Javaid et al., 2019; Sjostrom, 1993).

45
Table 1.2. Various functional groups present in softwood and hardwood lignin of different types
(abundance per 100 C-9 units)
Functional groups Softwood lignin Hardwood lignin
Methoxyl 90 – 95 139 –158
Phenolic hydroxyl 20 – 30 10 – 15
Benzyl alcohol 30 – 45 40 – 50
Carbonyl 10 – 15 17 – 24
Aliphatic hydroxyl 115 – 120 88 – 166
1.2.3.3 Isolation of lignin
Due to its three-dimensional branched structure and the strong linkages between lignin units and
carbohydrates, lignin isolation is a tedious process. In the pulp and paper industry, lignin is partially
depolymerised to extract cellulose fibres. Lignin is a by-product of the cellulose fibre extraction, still
under-valorised.
Various extraction and isolation methods are used to recover lignin from the lignocellulosic
feedstock, which normally alter the structure, in particular the lignin functional groups and the lignin
physical and chemical properties so that the resulting extracted lignin is highly heterogeneous (Lora
and Glasser, 2002). The most common extraction techniques in pulp and paper industry are the Kraft,
Sulphite, Soda and Organosolv processes. The goal of these processes is to extract cellulose fibres
from lignocellulosic biomass: it is achieved by depolymerising lignin and making it soluble in the
liquid phase medium. Thus around 40-50 million tons per year of lignin are isolated worldwide
(Strassberger et al., 2014; Zoia et al., 2014), mainly through the Kraft process, the dominating pulping
process. Today extracted lignin is mainly burnt in the recovery boiler of the pulp mill to produce
energy, only a small fraction (2%) is commercially available for value added applications (Chakar and
Ragauskas, 2004).
Extracted lignin structure strongly depends on the pulping process from which lignin derives.
Moreover, isolation techniques can be categorised according to the chemical method used for
extracting lignin. Thus, the pulping processes and the impact on lignin structure are described in the
following sections.

46
1.2.3.3.1 Kraft Pulping
Kraft pulping is the most dominant cooking process, producing around 85% (about 43x106 tons per
year) of lignin worldwide (Ragauskas et al., 2006b; Suib, 2013). This process provides high quality
paper pulp with a yield between 45 to 50%, using various wood chips materials. This is the most
popular process because it produces resistant fibres and all the dissolved material is burnt in a
recovery boiler to harvest the energy required to run the mill. In this process, the wood chips are
mixed with an aqueous solution of sodium hydroxide (NaOH) and sodium sulfide (Na2S), also named
white liquor, in a large pressurized vessel called digester. The wood and white liquor mixture is
heated from 70˚C to 170˚C for about 2 hours or more. During the reaction, lignin is extensively
degraded and dissolved due to the breaking of ether linkages between lignin units. After the reaction,
two distinct phases are formed: small alkali soluble lignin fragments are in the liquid phase which
turns brown (black liquor), and the solid phase contains insoluble lignocellulosic fibres with residual
lignin. In parallel, a small portion of hemicelluloses and cellulose is also degraded and dissolved
(Gierer, 1980). For paper application, last lignin traces are eliminated by bleaching. During Kraft
pulping process, around 85-93 % lignin and 56-71 % hemicelluloses are removed (Patil et al., 2011).
Cellulose is conserved but it is partially depolymerised (DP in the range of 1000-1500). Soluble Kraft
lignin is recovered from the black liquor by acidification. Its number average molar mass (Mn) is
ranged from 1000 to 3000 Da (Polydispersity (PD) = 2.5–3.5) (Glasser et al., 1993). During the Kraft
process, reactions lead to structural changes in the isolated lignin. In particular, the most important
reaction is excessive cleavage of β-O-4 linkages that is responsible for connecting different
phenylpropane units in lignin. For instance, the sulphide ion accelerates the cleavage of the ether
linkages in phenolic units. Furthermore, the cleavage of oxygen-carbon is more feasible and
predominant than carbon-carbon bond in alkaline environment during cooking process and possible
reaction scheme is shown in Figure 1.12 (Gellerstedt, 2009).
Figure 1.12. Cleavage of β-O-4 linkage during kraft process
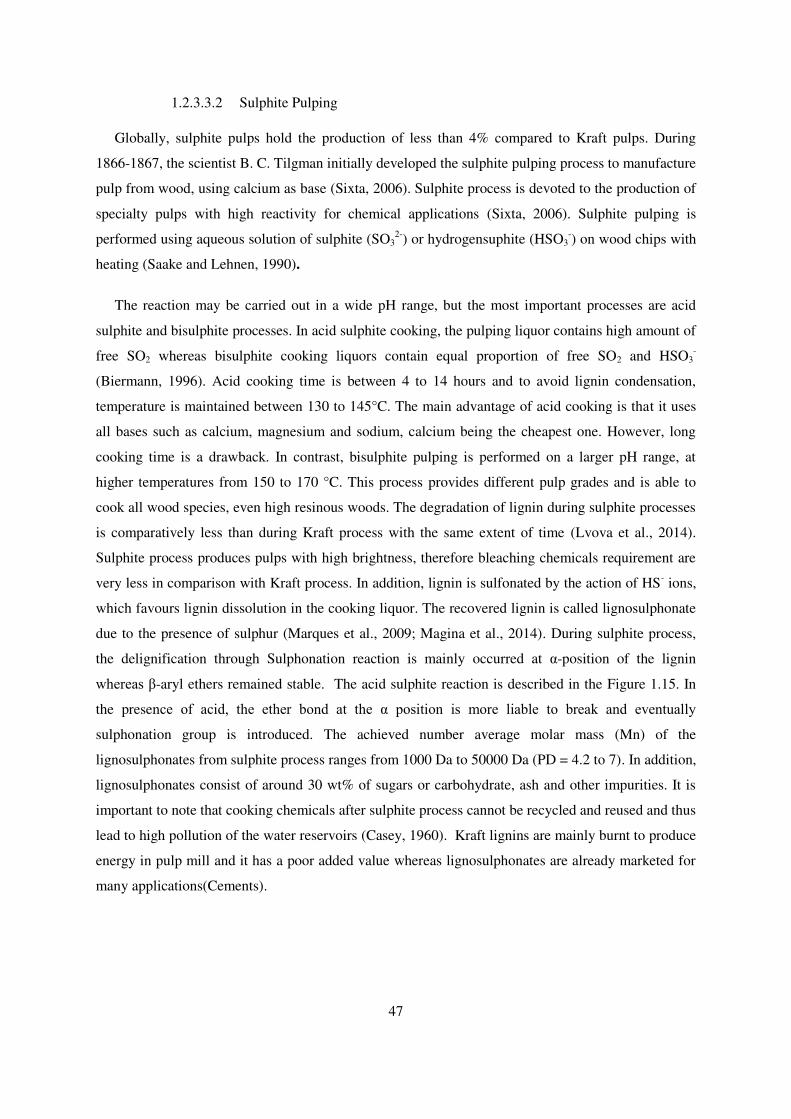
47
1.2.3.3.2 Sulphite Pulping
Globally, sulphite pulps hold the production of less than 4% compared to Kraft pulps. During
1866-1867, the scientist B. C. Tilgman initially developed the sulphite pulping process to manufacture
pulp from wood, using calcium as base (Sixta, 2006). Sulphite process is devoted to the production of
specialty pulps with high reactivity for chemical applications (Sixta, 2006). Sulphite pulping is
performed using aqueous solution of sulphite (SO32-) or hydrogensuphite (HSO3
-) on wood chips with
heating (Saake and Lehnen, 1990).
The reaction may be carried out in a wide pH range, but the most important processes are acid
sulphite and bisulphite processes. In acid sulphite cooking, the pulping liquor contains high amount of
free SO2 whereas bisulphite cooking liquors contain equal proportion of free SO2 and HSO3-
(Biermann, 1996). Acid cooking time is between 4 to 14 hours and to avoid lignin condensation,
temperature is maintained between 130 to 145°C. The main advantage of acid cooking is that it uses
all bases such as calcium, magnesium and sodium, calcium being the cheapest one. However, long
cooking time is a drawback. In contrast, bisulphite pulping is performed on a larger pH range, at
higher temperatures from 150 to 170 °C. This process provides different pulp grades and is able to
cook all wood species, even high resinous woods. The degradation of lignin during sulphite processes
is comparatively less than during Kraft process with the same extent of time (Lvova et al., 2014).
Sulphite process produces pulps with high brightness, therefore bleaching chemicals requirement are
very less in comparison with Kraft process. In addition, lignin is sulfonated by the action of HS- ions,
which favours lignin dissolution in the cooking liquor. The recovered lignin is called lignosulphonate
due to the presence of sulphur (Marques et al., 2009; Magina et al., 2014). During sulphite process,
the delignification through Sulphonation reaction is mainly occurred at α-position of the lignin
whereas β-aryl ethers remained stable. The acid sulphite reaction is described in the Figure 1.15. In
the presence of acid, the ether bond at the α position is more liable to break and eventually
sulphonation group is introduced. The achieved number average molar mass (Mn) of the
lignosulphonates from sulphite process ranges from 1000 Da to 50000 Da (PD = 4.2 to 7). In addition,
lignosulphonates consist of around 30 wt% of sugars or carbohydrate, ash and other impurities. It is
important to note that cooking chemicals after sulphite process cannot be recycled and reused and thus
lead to high pollution of the water reservoirs (Casey, 1960). Kraft lignins are mainly burnt to produce
energy in pulp mill and it has a poor added value whereas lignosulphonates are already marketed for
many applications(Cements).

48
Figure 1.13. Reaction on lignin during acid sulphite cooking
1.2.3.3.3 Soda pulping
Soda pulping process represents 5% of the pulp production. It is particularly used to treat annual
plants because they require less severe conditions compared to wood cooking (Suib, 2013). The
lignocellulosic raw material is cooked in a liquor containing sodium hydroxide or a mix of soda and
anthraquinone (Gierer et al., 1979). The produced lignins are sulphur free, they are called soda lignins
and they are recovered based on acid precipitation of black liquor and liquid/solid separation. Soda
lignins exhibit lower ash and sugar content compared to lignosulphonates (Nadif et al., 2002). The
number average molar mass (Mn) is comparatively lower than the weight of lignin coming from other
pulping processes due to multiple delignification reactions taking place during soda pulping. An
example reaction is shown in Figure 1.17 where the most frequent delignification reaction is the
cleavage reaction of non-phenolic β-O-4 bonds at alkaline conditions and the formation of phenolic
lignin and epoxide (Heitner et al., 2016). They vary from 800 to 3000 Da (PD = 2.5 to 3.5).
Figure 1.14. Reaction of cleavage of non-phenolic β-O-4 structures in lignin (Heitner et al., 2016).
1.2.3.3.4 Organosolv pulping
Organosolv pulping was mainly developed as an alternative for Kraft and sulphite pulping
(Muurinen, 2000). During the process, the temperature ranges from 180 to 200 °C (Balogh et al.,
1992; Sannigrahi and Ragauskas, 2013). Organic solvents are used as delignification agents in
association with water and acid as catalyst. The process leads to two distinct phases: the cellulose

49
enriched solid phase and the liquor phase containing hemicelluloses and lignin products (Xu et al.,
2006). Organosolv lignins are mostly produced through a strong treatment of biomass using various
solvents such as methanol, ethanol, acetic acid, peroxyformic acid, ketones and phenols at different
experimental conditions with different catalysts and reaction times. Various organosolv pulping can
be applied based the employing organic solvents: Organocell (methanol), Alcell (ethanol), Avidel
(formic and acetic acids), Acetosolv (acetic acid) and Milox (peroxyformic acid) (Gosselink, 2011;
Muurinen, 2000; Sridach, 2010). The most common processes are ethanol/water mixture for Alcell
and acetic acid with a small amount of HCl or H2SO4 for the production of Acetosolv lignin. The
cleavage of α-O-4 lignin linkages is the most dominant reaction whereas cleavage of β-O-4 linkages is
unlikely to occur, contrary to what happens in Kraft process (McDonough, 1993; S. Aziz and G.C.
Goyal, 1993; Sannigrahi and Ragauskas, 2013). The typical number average molar mass (Mn) of
organosolv lignins is 500 to 5000 Da (PD = 1.5 to 2.5).
All types of lignin are compared in the Table 1.3.
Table 1.3. Properties of technical lignins according to the extraction process (Laurichesse and
Avérous, 2014)
Lignin Type
Sulphur containing lignins Sulphur free lignins
Kraft Lignosulfonate Soda Organosolv
Raw materials Softwood
Hardwood
Softwood
Hardwood
Annual plants
Softwood Hardwood
Annual plants
Solubility Alkali
Organic solvents Water Alkali
Wide range of
organic solvents
Number average Molar mass
(Mn = g/mol) 1 000-3 000 15 000-50 000 800-3 000 500-5 000
Polydispersity (PD)
2.5-3.5 6-8 2.5-3.5 1.5-2.5
Glass transition temperature (Tg)
140-150 130 140 90-110
1.3 Chemical Modification of Lignin
Lignin’s high polarity due to variety of functional groups, poor thermal stability from amorphous
nature and difficult melt processing prohibit the direct use in numerous applications. As seen from the

50
above sections, lignin contains various types of functional groups such as hydroxyl (aliphatic and
phenolic), methoxyl, carbonyl and carboxylic groups. These functional groups foster the research and
development of lignin into value added applications. Therefore, a series of modifications can be
carried out on lignin functional groups to improve lignin chemical reactivity, solubility in organic
solvents and to reduce the brittleness of lignin derived polymers. Among various functional groups
present in lignin, hydroxyl groups are the primary choice for researchers: they can be modified using
simple reaction conditions and after reaction, new chemical reactive sites may be formed. Several
chemical modifications can be performed on lignin including methylation, amination, halogenation,
nitration, etherification, esterification, silylation and phenolation etc. These reactions can be
performed through either modification of hydroxyl groups or carbonyl groups or breaking linkages
into corresponding derivatized lignin products. They may also decrease the hydrophilicity of lignin
significantly and increase its compatibility with apolar polymers and dispersion into polymer matrix.
Possible chemical modifications are listed in Figure 1.15.
Figure 1.15. A schematic overview of various reactions for the synthesis of new chemical compounds
from lignin
Chemical modifications of lignin into new chemical lignin derivatives via a series of different
reactions are explained in the following sections.

51
1.3.1 Methylation
Methylation and/or demethylation are used in various synthetic applications. For instance, a major
part of the alkylated lignin is mixed with synthetic polymers (poly(ethylene oxide) (PEO), poly(ethylene
terephthalate) (PET), and poly(vinyl alcohol) (PVA) ) to prepare polymers blends (Kadla and Kubo,
2004; Sen et al., 2015). Methylation is carried out on phenolic hydroxyl groups. Lignin methylated
derivatives are produced using dimethyl sulphate (CH3)2SO4 (Lewis et al., 1930) in aqueous NaOH
without any side reaction; whereas, methylation with methyliodide CH3I in presence of an excess of
K2CO3 and N,N dimethylformamide HCO-N(CH3)2 has been reported as an ineffective and
unselective reaction (Sadeghifar et al., 2012). After methylation, the glass transition temperature (Tg)
was significantly reduced (153 to 128º C for the case of Kraft lignin) (Sadeghifar et al., 2012). These
typical reactions are shown in Figure 1.16.
Figure 1.16. Methylation of lignin using various reaction conditions (Sadeghifar et al., 2012)
The selective methylation of hydroxyl groups, especially phenolic –OH groups in lignin, leads to
less reactive phenyl methyl ether. Thus lignin reactivity is significantly reduced and used in polymer
formulations (Argyropoulos, 2013).
1.3.2 Hydroxyalkylation/Etherification
Hydroxyalkylation of lignin hydroxyl groups is applied to develop biodegradable plastic
composites. An example is the hydroxypropyl lignin homogeneously dispersed in a polymer matrix
(for example, soy protein plastic isolate) to improve the mechanical properties of the composite (Chen
et al., 2006). In particular, chemical modification by oxyalkylation was established to reduce the
brittleness of lignin-derived polymers and also to enhance visco-elastic properties for various

52
applications (Wu and Glasser, 1984). Several studies suggested that hydroxyalkylation can be
accomplished on different types of lignins with reagents such as 1,2 oxides, 1,2 carbonates and 1,2
sulphites with catalyst (alkali metal and alkali earth metal carbonate or hydroxide) or without catalyst
at temperatures varying from 20˚C to 250˚C. The weight ratio of lignin and oxyalkylating agent used
for this conversion is maintained at 3:1 (Allan, 1969; Christian et al., 1972). Wu et al. studied the
hydroxypropylation of lignin using propylene oxide under alkaline condition at 180˚C (Wu and
Glasser, 1984). Later Behzad Ahvazi et al. performed lignin based polyol synthesis from wheat straw
soda lignin using propylene oxide. This study particularly investigated the direct oxyalkylation of
lignin under acidic and alkaline conditions (Wu and Glasser, 1984; Pizzi and Walton, 1992; Lammers
et al., 1993; Aniceto et al., 2012). Another study examined a two-step reaction with maleic anhydride
and lignin followed by propylene oxide treatment (Thielemans and Wool, 2005). These results
concluded that the direct oxyalkylation under alkaline condition is more efficient in alkaline
conditions and leads to higher aliphatic hydroxyl group substitution (Ahvazi et al., 2011). Due to the
considerable risks associated with propylene oxide such as flammability, toxicity and carcinogenicity
characteristics, later, Kühnel et al. studied the oxyalkylation reaction by substituting propylene oxide
by “green” propylene carbonate as a reagent (Kühnel et al., 2015). The typical reaction is illustrated in
Figure 1.17. During the reaction lignin OH and PC, the ring opening process and two different
reaction products were obtained with respect to different nucleophilicity and steric hindrance of
OHaliph and OHphen. However, the formation of ether through OHphen attack is predominant because of
the catalyst K2CO3.
Figure 1.17. Organosolv lignin oxyalkylation reaction using propylene carbonate (Kühnel et al.,
2015)
Additionally, Sevillano et al., proposed a new derivatisation method to diminish the lignin polarity
in order to quantify the number of hydroxyl groups as well as use lignin as precursor for various
polymer applications. In this reaction, phenolic and primary aliphatic hydroxyl groups form into
Lignin.OH +
OrganosolvLignin PC
O O
O
LigninO
OH
LigninO
OH
LigninO
OH
+
for phenolic OH
-CO2
for aliphatic OH
-CO2

53
corresponding fluoro-ether derivatives using 4-fluorobenzylchloride. This reaction is known as
fluorobenzylation (see Figure 1.18 ).
Figure 1.18. Etherification of lignin using 4-Fluorobenzylchloride (Sevillano et al., 2001)
1.3.3 Amination
Lignin amines have been synthesised through the Mannich reaction. For example, low molecular
weight soda lignin fractions could react with amine and formaldehyde to get lignin amine. The
product may be recovered by precipitation using isopropanol (Figure 1.19).
Figure 1.19. Synthesis of lignin amine product via the Mannich reaction(Wang et al., 2016)
Lignin amines contain both amine and hydroxyl functional groups which increases the interfacial
bonding properties between polyvinyl chloride /wood-flour composites (act as a coupling agent) and
enhances mechanical performance of composites (Yue et al., 2011). Lignin amine is significantly used
as an additive in dye dispersant (Dilling and Samaranayake, 1999), asphalt emulsifier (Lin, 1985) and
flocculant (Hoftiezer et al., 1984).
1.3.4 Halogenation
Halogenation of lignin can carried out on aromatic moiety or on the side chains (Calvo-Flores et
al., 2015). The chlorination of lignin was first introduced by Cross and Bevan in 1882 (Cross and
Bevan, 1882) and halogenated lignins have been used in building materials and in consumer goods as
a fire retardant (Meister, 2000). Later, in 1913 Heuser et al. (Heuser and Sieber, 1913) investigated
OCH3
OH
L
HC
C
OH
CH2OH
O
F
CH2Cl
OCH3
O
L
HC
C
OH
CH2O
O
H2
C ArF
+
Ar = Ph
H2
C ArF
2-2 HCl
L= Lignin group
20% (C2H5)4NOH

54
the chlorination on spruce wood and the results showed that wood absorbed around 31% of its weight
of chlorine after 2h. Polčín (Polčín, 1954) investigated the reaction of alkali sulphite lignin with
chlorine gas and concluded that methoxy groups undergone oxidation and split from aromatic ring in
aqueous media leading to o-quinones formation. However, due to environmental issues, halogenated
lignin compounds, also called “halolignin” are not widely used. The corresponding reaction is given
in Figure 1.20. The chlorine molecule turns into radicals which attack the aromatic ring and replace
the hydrogen into chlorine substituted lignin compound.
Figure 1.20. Halogenation of lignin into halolignin (Meister, 2002)
1.3.5 Nitration
Nitration can be readily carried out with nitric acid HNO3 or with gaseous nitrogen dioxide NO2 as
nitrating agents. Nitrolignins are synthesised by the reaction of alkali lignin with a mixture of fuming
nitric acid and acidic anhydride with a molar ratio of 4:1 at a temperature below 0˚C, under ice bath.
After the reaction, the solid precipitate is recovered by ultra-centrifugation. Nitro group is introduced
in the aromatic ring and solubility of nitrolignins is similar to that of halolignins. The schematic
representation of lignin nitration is shown in Figure 1.21. The main application of this reaction is the
formation of interpenetrating polymer networks (IPN) which can be obtained by treating
polyurethane and nitrolignin.
Figure 1.21. Formation of nitrolignin using different reagents (Kai et al., 2016)

55
1.3.6 Sulphonation
Sulphite and Kraft pulping processes provide sulphur containing lignin. Lignin sulphonation
occurs during extraction processes as already shown in Figure 1.13. Klason used calcium chloride to
precipitate the ligninsulphonic acids (Klason, 1920) from sulphite pulping process. During this
process, the authors named the precipitated product “α-ligninsulphonic acid” and the remaining lignin
in the solution “β-lignosulphonic acid” (Lindsey and Tollens, 1892). In general, lignosulphonates
from the sulphite process contain more sulphur groups, i.e. a higher degree of sulphonation, than Kraft
Lignins. The presence of sulphonated groups enhances the polarity of lignosulphonates and thus they
are water soluble. The molecular weight of lignosulphonates is higher than that of Kraft lignin. It is
used in numerous applications, for instance, (i) as dispersants in cement admixtures and dye solutions,
(ii) in composites to enhance the hydrophilicity and (iii) as flocculants (to decrease the settling time of
solution or suspensions) in which sulfonated lignin-based products need to be cross-linked with other
compounds such as polyethylene glycol, tosylchloride, and formaldehyde (Aro and Fatehi, 2017).
1.3.7 Esterification
Synthetic polymers are used in many applications including textile and packaging industries. They
can be obtained through condensation of typical monomers such as alcohol and dicarboxylic acid
originating from petroleum resources. For instance, polyethylene terephthalate is obtained by treating
two monomers such as diol and dicarboxylic acid. As already know, the lignin macromolecule
possesses variety of functional groups, therefore it can substitute both monomers and/or either one
monomer in order to make processes and products sustainable and greener.
Several authors reported that lignin-based polyesters such as lignin-sobacoyl ester (Binh et al.,
2009), lignin – acetic/propionic/butyric anhydride esters (Fox and McDonald, 2010) and lignin-
telechelic polybutadiene esters (Saito et al., 2012) acquire thermal stability and the resulting polymers
exhibit large molecular weight with comparatively higher Tg (glass transition temperature). A typical
example of lignin esterification is shown in Figure 1.22. Lignin compound is treated with polyene
containing carboxylic acid groups at both ends in the presence of strong base into the formation of
polyester.

56
Figure 1.22. Synthesis of polyester from lignin and dicarboxylic acid (Saito et al., 2012)
Another esterification reaction has been reported in the literature, the fluorobenzoylation. It was
carried out with 4-fluorobenzoic acid anhydride (Sevillano et al., 2001) to convert lignin secondary
hydroxyl groups into corresponding fluoro-esters derivative (illustrated in Figure 1.23) for analytical
issues.
Figure 1.23. Esterification of lignin using the 4-fluorobenzoic anhydride chemical (Sevillano et al.,
2001)
Acetylation is another esterification reaction. Acetylation of lignin is performed with the
combination of acetic acid and acetic acid anhydride for the synthesis of lignin-acetyl esters (Faix,
1992; Buono et al., 2016). Acetylation was reported to enhance the photo-stability of jute fibres and
milled wood lignin and also it helps to brighten the ground wood pulps and thermomechanical pulps
by prohibit the photooxidation (Paulsson and Simonson, 2002). Acetylation of lignin reaction is given
in Figure 1.24, the lignin is treated with acetic anhydride. The lignin OH nucleophile attacks acetyl
group to the formation of acetylated lignin and acetic acid by-product.
C
OO
F
C
F
O
OCH3
O
L
HC
C
OH
CH2O
O
H2
C ArF
Ar - Ph
H2
C ArF
+
OCH3
O
L
HC
C
CH2O
O
H2
C ArF
Ar - Ph
H2
C ArF
O C
O
ArF
(F)ArCOOH+DMAP, Pyridine

57
Figure 1.24. Acetylation of lignin using acetic anhydride and pyridine
1.3.8 Silylation
In recent years, silylation is becoming one of the most popular methods to elucidate the structure
of lignin using 29Si NMR. The silylation reaction scheme is shown in Figure 1.25 for soda lignin.
Lignin hydroxyl groups in soda lignin have been silylated using tert-butyldimethyl silyl chloride
(TDMSCl). It should be noted that all hydroxyl groups present in the lignin were silylated. The
obtained silylated product enhanced the thermal stability and lowered the Tg of the lignin product
compared to acetylation (Buono et al., 2016).
Figure 1.25. Synthesis of silylated lignin from soda lignin and tert-butyldimethyl silyl chloride
(Buono et al., 2016)
1.3.9 Oxidation/Reduction
Lignin is sensitive to strong catalytic processes which cleave the linkages and turn lignin into
small fragments. This can be achieved by different treatments: oxidation, reduction and cracking
oxidation and cracking reduction reactions. They are detailed below.
Oxidation: C-O bonds and in particular ether bonds are the most predominant linkages in lignin.
Therefore, lignin fragmentation particularly focuses on the cleavage of ether linkages. This can be
OH
C
C
OH
CH2OH
C
O
H3C O
C
CH3
O
O
C
C
O
H2C
Pyridine
+
C
O
CH3
C
O
CH3
O C
O
CH3

58
done by the oxidative treatment of lignin using potassium permanganate/sodium periodate and/or
nitrobenzene oxidation (Wu and Glasser, 1979). Lignin fragmentation is additionally useful to
determine the initial structure of lignin (Gellerstedt and Lindfors, 1984; Harman-Ware et al., 2013;
Masingale et al., 2009). After full oxidation, products from lignin oxidation are a mixture of aromatic
compounds such as ketones, aldehydes, acid allylic alcohols and ethers etc, which may be eventually
used as precursors for various chemical syntheses (Zhang et al., 2009). Several researchers reported
that lignin oxidation can be done using various metal based catalysts, Schiff base catalysts and
porphyrin catalysts (Evtuguin et al., 1998; Gupta et al., 2009; Harris et al., 1938; Kuwahara et al.,
1984; Parpot et al., 2000).
Reduction or Hydrogenation: As stated above for C-O bonds, catalytic hydrogenation reaction
produces low oxygen content compounds, bio-oils and phenols. Harries et al. demonstrated that the
hydrogenation of hardwood lignin gives carbon rich compounds (Harris et al., 1938). Till date,
numerous homogeneous and heterogeneous catalysts have been reported for successful hydrogenation
of lignin (Pepper and Supathna, 1978; Pepper et al., 1966). In particular, heterogeneous catalyst
(copper-metal oxide) effectively produces lignin monomeric compounds that can be used for fuel
additives (Barta et al., 2010). Other catalysts such as Ni-Pd, phase transfer catalyst (chloro-1,5-
hexadiene)-rhodium) and RhCl3/trioctylamine generate phenols and aromatic ring compounds (Cyr et
al., 2000; Januszkiewicz and Alper, 1983; Nasar et al., 1994). Although, hydrogenation process
possesses some advantages (synthesis of high carbon containing compounds and fuel additives) the
main drawbacks remain that the reaction should be performed using high H2 pressure with strong
temperature and the reuse of catalyst after the reaction is difficult.
1.3.10 Allylation
Recently, Llevot et al., has developed a new catalytic highly efficient approach called Tsuji-Trost
allylation (Llevot et al., 2017) for converting hydroxyl groups in lignin with allyl methyl carbonate.
Various dialkyl carbonates are used as alkylation agent for hydroxyl groups including aliphatic and
aromatic hydroxyls. The resulting products contain new functional groups introduced into the lignin
structure. The authors found that phenolic –OH groups (shown in Figure 1.26) in lignin are selectively
converted into allyl derivatives with high yield. This particular method can be used to improve lignin
reactivity.

59
Figure 1.26. Allylated products from different bioderived phenols by Tsuji–Trost reaction with allyl
methyl carbonate
1.3.11 Phenolation
Phenolation reaction of lignin is used for phenol formaldehyde resin synthesis. Prior to the use of
lignin for resin synthesis, lignin molecules are activated by introducing phenol groups via
phenolation. Highest phenolation is achieved with hardwood organosolv and softwood sulphite
lignins whereas a weak activation is obtained for soda and softwood Kraft lignin (Podschun et al.,
2015). A recent study from Jiang et al., reported an effective phenolation of lignin with a minimal
amount of sulphuric acid and phenol as a solvent (Jiang et al., 2018). The results also demonstrated
that during phenolation, most of the ether linkages were cleaved. A scheme is provided in Figure 1.27.
Figure 1.27. Phenolation of lignin

60
1.4 Lignin applications
Lignin is a potential source of renewable material for the production of phenolic compounds
(Dorrestijn et al., 1999). Its derivatives are widely used in many applications like binders, adhesives,
antioxidants, disinfectants, resins, fibers, drugs and wood preservatives etc.
Lignin amines are used as additives, emulsifier, flocculants, dye dispersants and in polymer
synthesis namely polyurethanes, phenolic resins and epoxy resins etc (Yue et al., 2011).
Self-finding high density fibreboards were manufactured from industrial softwood Kraft lignin,
soda wheat straw lignin and hydrolysed wheat straw lignin (Tupciauskas et al., 2017).
Lignin antioxidant properties in polypropylene have been studied with different lignins extracted
from various botanical origins (addition of 1% lignin weight). The conclusion is that the solubility of
the lignin in polypropylene is a key parameter, more important than lignin phenolic content and lignin
intrinsic viscosity. Low molecular weight lignin and low phenolic content lead to increase lignin
solubility and gives better antioxidant property (Pouteau et al., 2003).
Activated Kraft and soda lignins are used as a binder and wood adhesive. Prior to the introduction
in various applications, lignins are activated through periodate oxidation to improve the reactivity.
Gosselink et al., developed fully renewable binders from lignin with poly furfural alcohol and
partially renewable lignin based phenol formaldehyde binder (Gosselink et al., 2011).
Organosolv lignins are used as a filler in ink, varnishes, paints and also used to increase the
viscosity of the polyether polyol and to improve the rheological properties (Belgacem et al., 2003).
Lignin acts as a macro-monomer in the synthesis of phenol formaldehyde resins and the modified
oxypropylated polyols are used in different polyurethane formulation (adhesive and foams) (Krässig,
1993).
1.5 Lignin analysis: literature review
Lignin phenolic hydroxyl group quantification and molar mass distribution are essential for lignin
valorisation. It provides useful information about the lignin structure and its degradation mechanism
(Dence and Lin, 1992). As seen in the above sections, due to high polarity and poor solubility of
lignin, lignin analysis is complex and there is no singular method to elucidate its chemical and
physical structure. Till date, many derivatization methods (acetylation, fluorobenzylation,
fluorobenzoylation and phosphorylation) are employed to replace lignin functional groups, followed
by their detection using different characterization techniques (UV, FT-IR, GC, NMR and GPC).

61
All classical methods are presented in the next paragraph as well their limitations.
1.5.1 Lignin functional group analysis
1.5.1.1 By ultraviolet spectroscopy (UV)
UV spectroscopy is a convenient and useful technique for quantitative and qualitative analysis of
the lignin in wood or black liquor. Lignin aromatic structure absorbs and exhibits maxima in the
ultraviolet region. The position and the intensity of the maxima depends on the type of lignin,
modification and solvent used for the analysis (Lin, 1992). Tiainen et al. used UV spectroscopy to
quantify phenolic hydroxyl groups in milled wood lignin, Kraft lignin and model compounds carrying
one aromatic hydroxyl group. This method uses the absorbance difference in the maxima close to 300
nm and 350 nm of the sample dissolved in alkali (lignin ionized form) and neutral (lignin non-ionized
form) medium, respectively. The authors found that the UV spectroscopic method results are
consistent with 1H NMR results for the case of milled wood lignin and Kraft lignin. However, UV
method gives too low phenolic values for modified lignins and model compounds bearing more than
one hydroxyl groups in the aromatic ring (Tiainen et al., 1999). Similarly, several authors conducted
UV analysis to quantify the phenolic hydroxyl group in alkaline solution by measuring the absorbance
before and after ionization using the maxima at 300 nm. At this region, phenolic hydroxyl group
conjugated with carbonyl group leads to erroneous phenolic hydroxyl group determination. Indeed,
the obtained absorbance from analysis is directly proportional to the purity of the lignin and sometime
low absorbance occurred due to the co-precipitation of other materials such as sugars and wax etc
(Tamminen and Hortling, 1999; Zakis, 1994). Although the UV method is a rapid method for
phenolic group measurements, limitations exists: the quantification of phenolic structures bearing
more than one phenolic hydroxyl groups is not reliable and the full solubility of lignin samples in the
medium is a prerequisite which is not always satisfied, depending on the lignin type (Serrano
Cantador et al., 2018; Tiainen et al., 1999).
1.5.1.2 Fourier Transform Infrared (FT-IR)
FT-IR is a rapid and widespread spectroscopic technique to analyse the lignin functional groups.
The advantages are the short analysis time, high sensitivity, easy use, direct analysis on solid samples
like wood, paper and pulp (Stenius, 2000) and convenient data handling (Faix, 1991). Lignin bands
are found at various ranges, from 1500 to 1600 cm-1 and also between 1470 and 1460 cm-1 (Wegener
et al., 2009). FT-IR is mainly used to qualitatively analyse different types of lignin along with various
functional groups including carbonyl, methoxyl, hydroxyl and carboxyl groups (Faix, 1991; Hortling
et al., 1997) and to follow the efficiency of derivatization reactions.

62
Examples of the use of FT-IR for lignin analysis are numerous. For instance, Ibrahim et al.
conducted a graft copolymerization of Kraft lignin with acrylamide. The authors found that lignin
shows absorption at 3417 cm-1 for phenolic or hydroxyl groups, 1638 cm-1 for aromatic ring and the
1462 cm-1 band has been attributed to C-H stretching (M.N. Mohamad et al., 2006). Similarly, Ghatak
carried out the experiment with wheat straw soda black liquor and reported a series of IR absorbance
bands. For lignin, the main bands are assigned as following: 3437 cm-1 to O-H stretching of hydroxyl,
2928 cm-1 to C-H stretching in methyl and methylene groups, 1637, 1604, 1516 cm-1 to aromatic
skeletons, 1331 cm-1 to syringyl ring C-O stretching and 1284 cm-1 to guaiacyl ring C-O. However,
some bands are difficult to evaluate due signal overlapping and the assignment of some bands is thus
complex (Ghatak, 2008). The major drawback of this method is that it is not quantitative.
1.5.1.3 Titration methods
1.5.1.3.1 Oximation
Lignin oximation is applied to determine the carbonyl group content. The reaction is performed
with hydroxylamine hydrochloride. In this direct method, all types of carbonyl groups (α-carbonyl
and o- and p-quinones) react, producing oxime and liberating HCl (Heuser, 1953). The liberated HCl
is titrated and the obtained value reveals the amount of carbonyl groups in the sample (Gierer and
Soderberg, 1959).
Zakis developed a modified oximation method (Zakis, 1994) because he stated that the previous
oximation followed by HCl formation relies on equilibrium and the hindered α C=O are poorly
reactive during the reaction. The author proposed to use DMSO as a solvent and triethanolamine
(TEA) compound in excess. In this case, TEA neutralizes the acid released during the reaction and
buffers the pH level. Moreover, the unreacted triethanol amine may also be titrated by potentiometric
and conductometric methods. This modified oximation method leads to quantify all types of carbonyl
groups in lignin (Zakis, 1994) (Figure 1.28).
Figure 1.28. Oximation of carbonyl groups
C O NH2OH..HCl C NOH HCl+ +
C O NH2OH..HCl+ (CH2CH2OH)3N+ C NOH H2O (CH2CH2OH)3NH+ Cl-+ + +

63
1.5.1.3.2 Borohydride method
Total carbonyl content in lignin could be determined by sodium borohydride reduction (NaBH4).
During the reaction, lignin carbonyl groups are reduced by NaBH4 and the excess amount of NaBH4 is
quenched by sulphuric acid, liberating hydrogen molecule. The liberated hydrogen molecule is
estimated by volumetric titration, meanwhile the same procedure is repeated without lignin sample,
called blank titration. The calculated difference value corresponds to the total number of carbonyl
content (Gierer and Soderberg, 1959; Marton and Adler, 1961; Marton et al., 1961). The main
drawback of this method is the accuracy that the obtained carbonyl content is about twice the values
and error is approximately 3 % or higher.(Lin and Dence, 1992)
1.5.1.4 Gas Chromatography (GC)
1.5.1.4.1 Periodate oxidation
Adler developed the estimation of free phenolic hydroxyl groups in softwood lignin through
periodate oxidation followed by GC analysis. The author treated guaiacol in aqueous solution with
excess of sodium periodate at 4˚C in a dark room. The reaction leads to oxidative demethylation and
subsequently methanol liberation and o-quinone formation. The formed methanol is stable (Adler et
al., 1955, 1959) and therefore, quantified by GC with an internal standard. This particular analytical
method provides the number of phenolic groups in the investigated guaiacol compound. However,
periodate oxidation does not allow the estimation of catechols and p-hydroxy phenyl units due to the
lack of methyl group adjacent to the phenolic position (Lai et al., 1990). This is a limitation for lignin
analysis.
1.5.1.4.2 Aminolysis
Aminolysis is a traditionally established method to determine the phenolic hydroxyl group content
in lignin. This method comprises the acetylation of the lignin sample, evaporation and drying,
followed by the aminolysis reaction and gas chromatography (GC) analysis. This multi-step method
was originally developed by Månsson and tested on acetylated lignin model compounds (Månsson,
1982) and also on milled wood lignin samples (Månsson, 1983). After acetylation, aromatic acetyl
groups are selectively deacetylated by pyrrolidine reagent (detailed analysis can be found in Chapter
3). This reagent mainly favours the deacetylation of aromatic acetyl groups under mild conditions
which is considerably much faster than the aliphatic acetyl groups. Then, the resulting 1-acetyl
pyrrolidine can be easily quantified by GC. The value is proportional to the number of phenolic
hydroxyl groups present in the lignin. However, there are some limitations in this method: (1) long
preparation time requires for lignin acetylation (2) some inherent imprecision arises in the estimation
of the phenolic groups due to the presence of lignin sugar residues.

64
Phenolic hydroxyl groups of spruce and aspen lignins were tested using aminolysis and periodate
oxidation methods. According to aminolysis method, spruce and aspen lignin phenolic hydroxyl
contents were reported as 0.649±0.029 and 0.445±0.031 mmol/lignin respectively, whereas periodate
oxidation gives 0.702±0.005 and 0.493±0.008 mmol/g lignin. The results of periodate oxidation show
higher phenolic content than aminolysis method. Moreover, the higher standard deviation obtained
with the aminolysis method is due to the numerous steps involved in the analysis (Lai et al., 1990).
1.5.1.5 NMR techniques
NMR spectroscopy is a powerful tool and 1H, 13C, 31P and 19F NMR are the most commonly used
NMR techniques for the structural characterization of lignin macromolecule.
1.5.1.5.1 1H NMR
The 100% natural abundance and high sensitivity of the proton nucleus significantly contribute to
use it as one of the spectroscopic technique. Pioneering work has been carried out by Lundquist’s
research group to quantify carboxylic, formyl, aromatic and methoxyl groups in lignin using 1H NMR
(Lundquist et al., 1979a, 1979b, 1980; Li, 1994). Ludwig et al. developed the methodology to analyse
the lignin as acetate derivatives using deuteriochloroform (Ludwig et al., 1964a, 1964b). During the
time of 1970 and 1980s, modern high frequency Fourier transform instruments have been employed to
get clear NMR spectra. Tiainen et al. quantified the phenolic hydroxyl groups in lignin by exchanging
phenolic proton in D2O (deuterated water or heavy water) without acetylation (Tiainen et al., 1999).
The major limitation of this method is the short chemical shift ranges (i.e., δ 12-0 ppm) so that 1H
NMR significantly suffers from severe signal overlapping (Lundquist, 1992).
1.5.1.5.2 13C NMR
13C NMR has broader spectral window and enhances signal resolution compared to 1H NMR. It
has been extensively used to study the complex lignin structure and it is an attractive technique for
functional group determination. After acetylation of lignin hydroxyl groups, carbon of methyl and
carboxyl groups gives signal respectively at 20.8 ppm and about 170 ppm without spectrum
overlapping. This signal offers good signal/noise (S/N) ratios, and for this reason, acetylated lignins
are usually used for the quantitative estimation of different hydroxyl groups. In the acetylated lignins,
the resolution of the carboxyl carbon signal allows to separate primary (170.8 ppm), secondary (170
ppm) and phenolic hydroxyl groups (168.9 ppm) (Robert and Brunow, 1984). Barrelle et al. also
quantified the ratio of aliphatic and phenolic hydroxyl groups of acetylated organosolv lignin using 13C NMR and found the value of 0.79 (Barrelle, 1993). Limitations associated with the 13C NMR
technique are the following: 13C nucleus is not sensitive enough (1/5800 compared to proton) and it
exhibits a limited natural abundance (1.1% only). Thus, huge sample quantity, long acquisition times

65
and high purity lignins without impurity (carbohydrate residues, ashes and extractives) are required
(Kaplan, 1998; Serrano Cantador et al., 2018).
1.5.1.5.3 31P NMR
The 31P NMR spectroscopic method has been developed by Argyropoulos et al. (Argyropoulos,
1994; Argyropoulos and Zhang, 1998; Argyropoulos et al., 1992, 1993; Berlin and Balakshin, 2014;
Hoareau et al., 2004; Zawadzki and Ragauskas, 2001). This technique rapidly became popular in
recent decades. 31P NMR spectroscopy enables the quantification of phenolic, aliphatic hydroxyl
groups and carboxylic groups of lignin in a single analysis.
Using lignin like model compounds after derivatization with 1,3,2-dioxaphospholanyl chloride (I),
spin lattice relaxation times and solvent effects in 31P NMR have been studied. The result showed that
spin lattice relaxation time (T1) of phosphorus nuclei attached to carboxylic acid is 5 s and phenol and
alcohol derivatives were 9 s and 8 s respectively. The chemical shifts of primary hydroxyls in β-O-4
model compounds of lignin were more sensitive to solvent concentration, whereas alpha and guaiacyl
hydroxyls were only slightly sensitive (Argyropoulos et al., 1993). The same author studied the
chromophores and carboxylic acids in mechanical pulp lignin using trimethyl phosphite derivatization
and quantified o-quinone groups using 31P NMR. These derivatizations form trimethyl phosphite-
carboxylic acid adduct along with o-quinone and coniferaldehyde adducts. The chemical shifts of
these adducts appeared at the same spectral region. The adsorption intensity of the carboxylic acid
adduct is highly dependent on the degree of ionization of the acid group. Thus, based on this
information, o-quinone group content is quantified by preventing trimethyl phosphite-carboxylic acid
adduct formation. Similar approach is used for semi-quantitative determination of quinonoid in
isolated lignin (Argyropoulos et al., 1992; Argyropoulos and Zhang, 1998). Initially, 1,3,2-
dioxaphospholanyl chloride (I) has been used as a phosphitylating agent (Argyropoulos, 1994;
Argyropoulos et al., 1993) for the quantification. Later, 2-chloro-4,4,5,5-tetramethyl-1,3,2-
dioxaphospholane (TMDP) has been used for a better signal separation, also with cyclohexanol as an
internal standard. Accurate determination of uncondensed and condensed phenolic moieties in lignin
have been determined (Granata and Argyropoulos, 1995).
Zawadzki and Ragauskas et al., found that TMDP/31P NMR method occasionally overlaps the
cyclohexanol-phosphite product with derivatized phenolic and aliphatic structures. Therefore, they
employed a series of N-hydroxy compounds as alternative internal standards, namely N- hydroxy-
phthalimide, 1-hydroxy-7-azabenzotriazole, endo-N-hydroxy-5-norbornene-2,3-dicarboximide and N-
hydroxy-1,8-naphthalimide. The obtained results revealed that these compounds were suitable as
internal standard and chemical shifts of phosphitylated N-hydroxy compounds are well separated
from lignin-derived components (Zawadzki and Ragauskas, 2001).

66
Compared to acetylation, the phosphitylation reaction is faster, since the reagent is introduced
directly in the NMR tube containing the lignin to be analysed. Although, a drawback of 31P NMR is
that the utilization of 2-chloro-4,4,5,5-tetramethyl-1,3,2-dioxaphospholane could slightly
underestimate the hydroxyl group content due to incomplete derivatization compared to the data
obtained by other analytical techniques applied to lignins (Berlin and Balakshin, 2014). Moreover,
this in-situ reaction generates hydrochloric acid which could partly degrade lignin, and the resulting
derivative is not stable so that the NMR acquisition should be done rapidly. Finally, the derivative
may not be recovered for further studies.
1.5.1.5.4 19F NMR Spectroscopy
19F NMR technique has been proposed to determine hydroxyl and carbonyl content. It has some
peculiar properties such as the natural abundance of the 19F nucleus which is 100% compared to
1.108% for 13C, the high gyromagnetic ratio and a wide range of chemical shift. Sensitivity of 19F
nucleus is 59 times larger than 13C. Moreover, 19F nucleus exhibits low spin lattice relaxation time.
Finally, the operating conditions are similar to that of 1H NMR. All these factors sufficiently decrease
the time and sample quantity needed for the analysis (Barrelle, 1993). The 19F NMR spectroscopy has
been applied for the quantitative determination of lignin phenolic and aliphatic hydroxyl groups
(Barrelle, 1993), carbonyl (Sevillano et al., 2001) and carboxyl groups (Barrelle et al., 1992).
Hydroxyl group determination: Two decades ago Barrelle et al., developed lignin phenolic and
aliphatic hydroxyl group determination by two main reactions such as fluorobenzylation and
fluorobenzoylation, followed by 19F NMR spectroscopy analysis (Barrelle, 1993). The authors
synthesised a series of lignin model compounds and conducted fluoroderivatizations (esterification
and etherification) along with guaiacol and p-hydroxyguaiacol. Phenolic hydroxyl groups were
converted into fluorobenzyl ethers using fluorobenzylation. In the case of fluorobenzoylation,
phenolic and aliphatic hydroxyl groups of model compounds were converted into fluorobenzoic acid
esters. These reactions can be performed in several ways: i) with classical pyridine and 2- or 4-
fluorobenzoic acid anhydride ii) fluoro-ester synthesis using phase transfer catalyst method (PTC)
with 2- or 4- fluorobenzoyl chloride: a two-step reaction iii) fluoro-etherification of phenolic hydroxyl
group through fluorobenzylation (4-fluorobenzyl chloride), followed by aliphatic hydroxyl group
esterification using pyridine-carboxylic acid anhydride. The obtained fluoro containing derivatives
were analysed by 19F NMR spectroscopy. The ratio of (1) phenolic and aliphatic -OH groups content
and (2) total number of hydroxyl groups have been calculated based on the quantitative internal
standard.
The same fluoroderivatization procedure has been used on organosolv lignin and on exploded
wood lignin (Barrelle et al., 1992). Phenolic hydroxyl groups in the organosolv lignin were etherified

67
using 4-fluorobenzyl chloride and the resulting derivative was treated with 4-fluorobenzoic acid
anhydride. This reaction yields a combined 4-fluorobenzylated-4-fluorobenzoic acid alkyl derivative.
The obtained 19F NMR results were compared to 13C NMR. Based on 19F NMR, the author found the
aliphatic-OH/ phenolic-OH groups ratio of organosolv lignin between 0.78 and 0.86. In addition, the
total hydroxyl group content was 0.3 moles per 100 g lignin. It should be noted that this derivatization
helps i) to distinguish the guaiacyl unit (G-lignin) from guaiacyl-syringyl (G-S) unit based on the
difference in 19F- chemical shift value of fluorobenzylated guaiacyl and fluorobenzylated syringyl; ii)
to determine the ratio of syringyl/guaiacyl units; and iii) to approximate the determination of α-C=O
content (Barrelle, 1995).
Carbonyl group determination: Glasser et al., reported the synthesis of lignin hydrazone
derivatives using pentafluorophenylhydrazine as a reagent (Glasser et al., 1980). Later, the authors
Lindner and Wegener applied this derivatization to quantify the amount of carbonyl group based on
the nitrogen content of lignin pentafluorophenylhydrazone (Lindner and Wegener, 1988). Fernandes
performed the carbonyl groups determination in several residual lignins from softwood unbleached
and bleached pulps using fluorophenylhydrazine as derivatizing agent (Fernandes, 1992). Faix et al.
has attempted to analyse pentafluorophenylhydrazone lignin derivative with the help of 19F NMR,
however this derivative shows rather complex 19F NMR spectra due to non-equivalent fluorine atoms
on the phenyl nucleus (Faix et al., 1998).
Ahvazi and Argyropoulos performed quantitative trifluoromethylation on lignin model compounds
containing ketones, aldehydes and quinone carbonyl groups. The carbonyl groups were
trifluoromethylated using (trifluoromethyl)trimethylsilane (TMS-CF3) in the presence of
tetramethylammonium fluoride (TMAF) followed by hydrolysis with aqueous HF (hydrogen
fluoride). The obtained fluoroderivatives were analyzed using 19F NMR and 3.3’-
bis(trifluoromethyl)benzophenone used as an internal standard. 19F NMR chemical shifts of
trifluoromethyl groups vary significantly and consistently with different classes of carbonyl groups
(Ahvazi and Argyropoulos, 1996a, 1996b; Ahvazi et al., 1999). Sevillano et al. performed the
organosolv lignin carbonyl group quantification with different derivatization methods, called direct
and indirect methods: i) lignin carbonyl groups were derivatized using trifluoromethylphenyl
hydrazine – CF3 method (direct method - Figure 1.29)

68
Figure 1.29. Reaction between carbonyl and trifluoromethyl phenyl hydrazine (CF3 Method) for
carbonyl group quantification in lignin
ii) in the case of indirect method, initially all lignin primary hydroxyl groups were
fluorobenzylated using 4- fluorobenzyl chloride, then the part of the fluorobenzylated lignins were
directly subjected to fluorobenzoylation by 4-fluorobenzoic anhydride. The carbonyl groups remain
unchanged (non-reduced part) during the reaction, whereas the other part of the fluorobenzylated
derivatives undergoes reduction with NaBH4. This reaction converts carbonyl groups into secondary
alcohol (reduced part) and is followed by fluorobenzoylation (Figure 1.30). The results showed that
trifluoro compounds exhibit a better NMR sensitivity with no loss of spectral resolution compared to
monofluoro compounds. Carbonyl content determination using CF3 method followed by 19F NMR has
shown a good correlation with indirect methods and modified oximation method results (see Figure
1.28). CF3 method produces reproducible results, it is easy to perform and it provides a clear and
simple NMR spectra (Sevillano et al., 2001).
Figure 1.30. Reactions for carbonyl group determination using NaBH4 reduction followed by
fluorobenzoylation
More recently, Constant et al., studied the carbonyl group content in lignin and industrial humins
using trifluoromethylphenylhydrazine derivatization. The reaction was performed directly in the NMR
tube using 19F NMR spectroscopy in a quantitative way. The results showed that the industrial
humins, indulin Kraft lignin and Alcell lignin contain 6.6, 1.7 and 3.3 weight % of carbonyl functions,
respectively. Aliphatic and conjugated carbonyl functions were also detected (Constant et al., 2017).
Table 1.4 summarizes various classical methods for phenolic hydroxyl group in lignin
determination. It is clearly seen that numerous methods have been employed for lignin functional
groups determination but each methods exhibit their own advantages and disadvantages (Faix et al.,
1992).

69
Table 1.4. Summary of all known characterization methods to determine phenolic hydroxyl group of
lignins, with the main advantages and disadvantages (Faix et al., 1992).
1.5.2 Lignin molar mass distribution by Size Exclusion Chromatography (SEC)
Molar mass distribution of lignins (MMD) is a crucial characterization to understand fundamental
properties of lignins such as their structure, physiochemical properties and reactivity for value-added
applications (Pellinen and Salkinoja-Salonen, 1985a; Baumberger et al., 2007). For industrial

70
applications, substitution of petrochemical based aromatic compounds by lignin based compounds for
polymer synthesis requires to know the exact molecular weight (El Mansouri and Salvadó, 2006).
Size-exclusion chromatography (SEC – also referred as gel permeation chromatography, GPC, a
variety of HPLC technique) is one of the preferred methods for MMD analysis of various polymers,
also much referred for lignin analysis. SEC operates the separation of macromolecules by size at
different elution time in a column filled with a nanoporous gel (stationary phase) and eluted with a
solvent in which the polymer is totally dissolved. The solvent should be chosen carefully so that it
fully swells and dissolves the polymer chains. Interactions between molecules, leading to molecular
aggregates, and interactions between polymer and stationary phase, should be fully inhibited. If good
conditions are attained, chromatographic separation occurs on the basis of the apparent hydrodynamic
volume and shape of the molecules in the gel pores, which is linked to molecular diffusivities, rather
than directly on the molecular masses (M). However hydrodynamic parameters and molar mass are
well related when the density and shape of the dissolved macromolecules do not vary unpredictably
with chain length, i.e. when the Mark-Houwink’s law applies well and exhibits almost constant
parameters (Chapter 5)
The classical SEC analysis uses the principle of standard calibration and requires the presence of
only in-line concentration detectors, generally UV-visible spectrophotometer or differential
refractometer (DRI). Dissolved monodisperse polymer standards are used to build a so-called
“standard calibration curve” which relates linearly (log M) versus retention time (RT) – or elution
volume (Vr) in the column. The unknown polymer sample mass is then calculated based on retention
time. However, since no lignin standards are commercially available, other polymers like polystyrene
standards are generally used, which makes quantification inaccurate. Another drawback of methods
based on column retention time only is flow dispersion through columns and tubings, which enlarges
the peaks. Mathematical corrections are possible to account for these phenomena, with again more or
less accuracy.
To overcome these drawbacks, molar mass detectors have been added in-line, typically light-
scattering (LS) detectors or viscometric detector (measure of the solution viscosity), developed during
the last 40 years (illustrated in Figure 1.31).
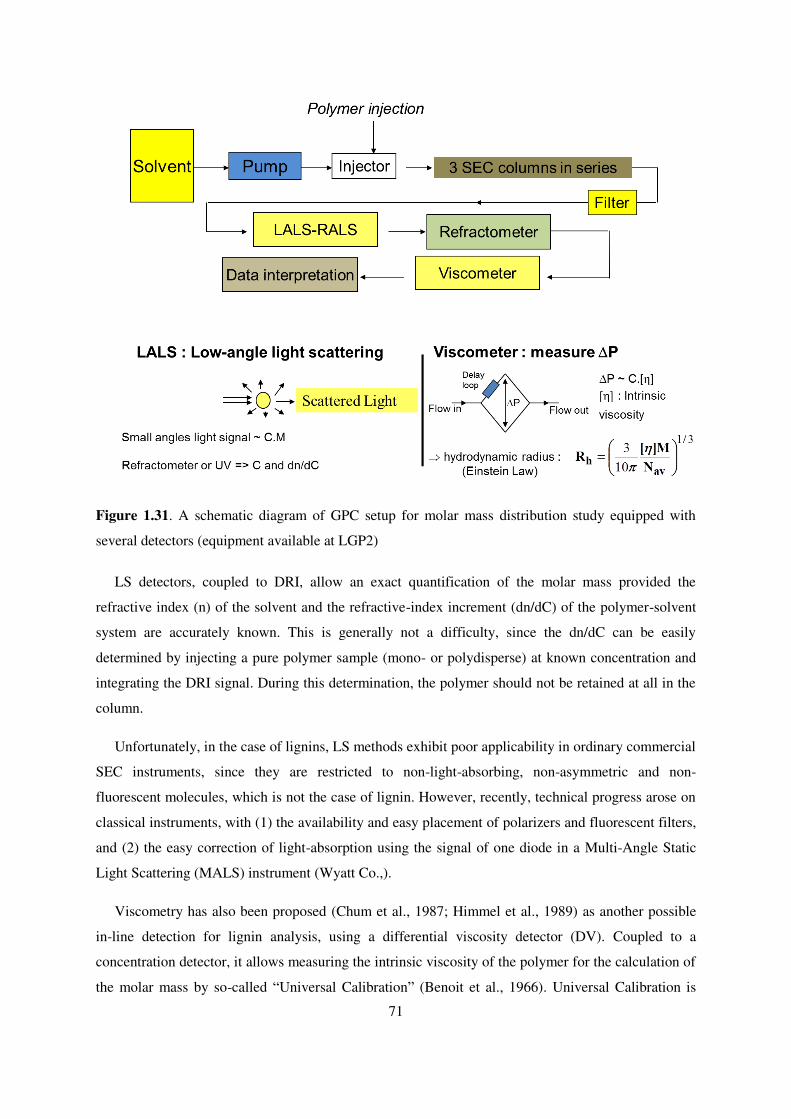
71
Figure 1.31. A schematic diagram of GPC setup for molar mass distribution study equipped with
several detectors (equipment available at LGP2)
LS detectors, coupled to DRI, allow an exact quantification of the molar mass provided the
refractive index (n) of the solvent and the refractive-index increment (dn/dC) of the polymer-solvent
system are accurately known. This is generally not a difficulty, since the dn/dC can be easily
determined by injecting a pure polymer sample (mono- or polydisperse) at known concentration and
integrating the DRI signal. During this determination, the polymer should not be retained at all in the
column.
Unfortunately, in the case of lignins, LS methods exhibit poor applicability in ordinary commercial
SEC instruments, since they are restricted to non-light-absorbing, non-asymmetric and non-
fluorescent molecules, which is not the case of lignin. However, recently, technical progress arose on
classical instruments, with (1) the availability and easy placement of polarizers and fluorescent filters,
and (2) the easy correction of light-absorption using the signal of one diode in a Multi-Angle Static
Light Scattering (MALS) instrument (Wyatt Co.,).
Viscometry has also been proposed (Chum et al., 1987; Himmel et al., 1989) as another possible
in-line detection for lignin analysis, using a differential viscosity detector (DV). Coupled to a
concentration detector, it allows measuring the intrinsic viscosity of the polymer for the calculation of
the molar mass by so-called “Universal Calibration” (Benoit et al., 1966). Universal Calibration is

72
based on the fact that the key parameter determining the retention time of macromolecules is the
hydrodynamic volume (Vh) and not the molar mass. As Vh is proportional to the product of molar
mass by the intrinsic viscosity, the measure of the viscosity by the in-line detector enables to get
access accurately to the polymer molar mass. In this method, standard polymers of known mass M
and intrinsic viscosity [] (in fact the specific viscosity at low polymer concentration) are injected in
the column, and the curve of Ln (M×[]), i.e. Ln(Vh), versus RT is constructed, with the noticeable
particularity that it should follow a unique straight line for different types of polymers. The straight
line is called “universal calibration curve”. This holds if the hydrodynamic principle of separation
applies correctly. Then, measuring the RT and [] value of an unknown polymer sample allows
calculation of its molar mass. This will be investigated in this PhD work.
A frequent discrepancy occurring in SEC analysis is polymer association, which also occurs with
lignin, due to polar interactions between the macromolecules and with the SEC system (Lindström,
1979, 1980; Sarkanen et al., 1981, 1982, 1984; Cathala et al., 2003; Connors et al., 1980; Norgren et
al., 2002). Such behaviour increases LS and viscometric signals leading to the overestimation of the
molar mass. Aggregate formation dominates in the case of underivatized lignins in a variety of
solvents, including non-aqueous solvents (DMF, DMSO, THF) and water-NaOH. In non-aqueous
solvents without the addition of electrolyte, the formation of association complex can exhibit as much
as three order of magnitude higher molar mass than real values (Tolbert et al., 2014). In case of lignin-
carbohydrate complexes, the elution properties of low molar mass carbohydrates in Sephadex
G25/dioxane-water (1:1) and Sephadex LH 20/DMF were affected by the existence of aromatic
groups in lignin-carbohydrate complexes, which causes retardation due to adsorption effects
(Kristersson et al., 1983). Similarly, the adsorption forces between gel and lignin molecules, polarity
and poor solubility issues leads to underestimation of molar masses (Chum et al., 1987). Lignin
aggregates in DMSO or DMF can be avoided by improving solvation of the macromolecules and by
forming H-bonds with electrolytes (Brown, 1967; Connors et al., 1980; Kristersson et al., 1983). The
addition of LiCl to DMF decreases lignin aggregates and bimodal elution profile turned to a single
peak (Connors et al., 2009). Similarly, Chum et al. (1987) used HPSEC because of its broad
availability and capacity to provide a wide range of molar masses (200 to 3x10⁶ g mol-1) in the case of
acetylated alkali lignin, organosolv lignin and ball-milled lignin in styrene-divinyl benzene (SDVB)
copolymer gels with DMF alone or DMF/LiBr as eluents. The result with DMF alone exhibited
multimodal elution behaviour due to aggregation phenomena, whereas the addition of 0.1 M LiBr
reduced lignin aggregates. Gosselink et al. studied the molar mass determination of AlcellTM
Organosolv lignin using HPSEC with different organic solvents: DMF/LiCl 0.2 M, and THF. The
obtained weight-average molar mass (Mw) was considerably lower in THF. It was concluded that
HPSEC of lignin in organic solvents provides poorly comparable inter-laboratory results (Gosselink et

73
al., 2004). Previously, the same conclusion had been drawn by Milne et al. on different lignins
analysed under identical standard conditions (Milne et al., 1992).
The early studies from Brown et al., and Faix et al., established that to decrease aggregates for
SEC analysis due to the presence of polar hydroxyl groups, derivatization by various methods,
typically acetylation, silylation and methylation was crucial (Brown, 1967; Faix et al., 1981).
Plant source, isolation method, functionality and molar mass distribution are determining factors
for the solubility of lignin in chromatographic solvents. Moreover no universal GPC method is
available for all types of lignins and in most cases, polystyrene gel with THF was used to calculate the
more reliable molar mass distribution for different varieties of lignins (Faix, 1992)
The GPC columns are calibrated with narrow molar-mass distribution polystyrene standards
and/or lignin model compounds in which the molar mass of these standards was determined by
ultracentrifugation. In this method, the centrifugal field is used for measuring the sedimentation rate
for the polymer. The molecular weight is calculated by Svedberg equation allowing for a sedimental
coefficient and a diffusion coefficient (Umoren and Solomon, 2016). Siochi et al., performed
hydroxypropylation of organosolv red oak lignin and determined the absolute molecular weight using
GPC/LALLS and GPC/DV (differential viscosity detector). Using GPC/LALLS detector, organosolv
red oak lignin Mw was found to be 11 500 g/mol whereas GPC/DV detector provides Mw value of
3 852g/mol. The obtained values with GPC/LALLS were three times higher than with GPC/DV. The
authors proposed that the obtained results by GPC/LALLS were complicated because of the influence
of sample absorbance and fluorescence, and the requirement of light polarisation correction. Thus the
author proposed GPC/DV as more convenient and quite acceptable detector to study the absolute
molar mass distribution of lignin (Siochi et al., 1990).
Glasser et al. also studied the absolute molecular weight distribution of hardwood, softwood and
annual plant lignins produced through Kraft and Organosolv pulping processes using GPC with a
differential viscosity detector and applying universal calibration with polystyrene standards. The
results illustrated that the investigated lignins (Indulin AT, Indulin, Eucalin, ORG lignin, Alcell
lignin, bagasse) exhibited Mw values between 3 000 and 20 000, polydispersity values between 2 and
12, Mark-Houwink exponential factors (α) value in the range of 0.17 and 0.35 and intrinsic viscosities
between 37 and 8 mL.g-1(Glasser et al., 1993).
Cathala et al. stated that DMF is known for lignin aggregation phenomena in SEC. To investigate
this effect the author chose milled wood lignin (MWL) from spruce and guaiacyl lignin synthetic
polymers (dehydrogenation polymers - DHP) as models for MMD study in SEC – DMF solvent using
LS detector. The results showed that bimodal elution profile occurred due to association effects

74
between the macromolecules. To account for this, the authors fractionated lignin samples in THF and
stated that THF-soluble fractions are responsible for low molar mass part and THF-insoluble fractions
were responsible for higher molar mass corresponding to DMF elution profile. The different molar
mass fractions were acetylated to break the association effect and characterized by SEC in THF and
THF-LiBr, combined with online viscometric detection and universal calibration. The authors showed
that Mark-Houwink plot of polymers exhibited low values, which evidences that polymers matrixes
are collapsed in THF and THF-LiBr. These results revealed that THF and THF-LiBr solvents are not
suited for acetylated samples dissolution. Moreover, the authors concluded that MWL and DHP molar
mass in DMF was overestimated, with values higher than 50 000-60 000, due to aggregation (Cathala
et al., 2003).
Collaborative study of SEC analysis of technical lignins has been performed in the frame of the
Eurolignin network to standardize the SEC chromatography methods. The authors performed
acetylation using 1:2 v/v of pyridine/acetic anhydride stirring at room temperature for 6 days prior to
the SEC analysis in THF system and styrene-divinylbenzene column was used for the analysis. The
authors studied SEC of acetylated bagasse soda lignin without and with removal of insoluble fractions
in the acetylation mixture. They reported that removal of insoluble fraction led to a lower proportion
of higher molar mass fractions (Baumberger et al., 2007).
HPSEC is commonly operated using styrene-divinylbenzene columns and the results are referred
to polystyrene calibration, although unprecise for lignin and lignin derivatives. Moreover, during the
analysis, unclear association effects of non-polar lignin still exists even after derivatization. (Pellinen
and Salkinoja-Salonen, 1985a). Incomplete lignin solubility in chromatographic solvents is also an
important source of error to investigate lignin molar mass. Once again, derivatization partially
overcomes such a difficulty and acetylation is most often used (Baumberger et al., 2007; Hatfield et
al., 1999). The latter studies have shown that using long reaction time, over 6 days, more than 90%
dissolution in THF can be achieved; although with same duration, Asikkala et al. reached only about
60% solubility in THF for Norway spruce milled-wood lignin (Asikkala et al., 2012). These authors
developed a “universal derivatization” using acetylbromide in glacial acetic acid to obtain complete
dissolution in 0.5 h in THF. However possible depolymerisation might occur since the derivatized
sample degradation is apparent after one month of aging at room temperature.
As already cited, polystyrene is the most often used standard although its linear structure differs
much from that of lignin. Lignin-like model compounds have been used for calibration and the
obtained Mw values were 2 to 3 times higher than with polystyrene calibration (Faix and Beinhoff,
1992). DRI, LALS and RALS coupled detectors were used to measure the molar mass of acetylated
lignin samples in THF, although with some difficulties linked to imperfect solubilization. In another

75
study, lignins fractions were separated by preparative GPC, reaching dispersity near to one, and such
fractions were compared to polystyrene standards. Lignin fractions and polystyrene standards
exhibited similar behavior over a wide range of molecular weight (Botaro and Curvelo, 2009).
Viscometry and other techniques, like MALDI-TOF-MS (matrix-assisted laser desorption
ionization time-of-flight mass spectrometry) have been reported in several studies to measure absolute
mass values. MMD by universal calibration was carried out on acetylated and hydroxypropylated
lignins in THF (Himmel et al., 1989; Siochi et al., 1990; Cathala et al., 2003; Gosselink et al., 2004;
Glasser et al., 1993). SEC with off-line MALDI-TOF-MS was originally proposed by Jacobs and
Dahlman (Jacobs, 2000; Jacobs and Dahlman, 2001; Rönnols et al., 2016) and later also studied by
Gosselink (Gosselink, 2011). However, MALTI-TOF is limited because the matrix plays a major role
in desorption/ionization process. As an example, the analysis of pole(ethylene)glycol shows two
different fragmentation pattern in 2,5-dihydroxybenzoicacid and dithranol matrixes (Wetzel et al.,
2003).
To summarize, despite the number of studies and techniques investigated until now, there is still a
certain level of uncertainty about real lignin molar mass values, and about the choice of which reliable
method should be preferably used. There is still room for improvement, as illustrated by the very
recent work of C. Crestini’s group (Lange et al., 2016). The authors studied the molar mass
distributions of different derivatized lignins (acetobromination, acetylation and benzoylation) with
particular column setup and standard data treatment. The results showed that the effect of column
setup and detector type significantly influenced the quality of GPC results.
1.6 Conclusion
Due to its complex nature, lignin analysis is difficult. However, to develop new ways of adding
values, lignin characterization, i.e. functional groups and molar mass determination, is a key issue.
Today lignin functional groups are classically quantified using tedious and costly methods, mainly
NMR spectroscopy-based methods, which require lignin derivatization and an access to NMR
equipment. As far as molar mass analysis is concerned, SEC is the reference method but it still suffers
from limitations. Macromolecule association and aggregation in the SEC system are major concerns
for polar chromatographic solvents (DMF), the presence of hydroxyl groups in lignin leads to poor
solubility in the non-polar chromatographic solvent (THF) and polystyrene polymers used as
calibrants do not provide accurate molecular weight. To overcome these issues, electrolyte in the
polar solvent is often added and lignin derivatization (mainly acetylation) prior to non-polar solvents
is carried out.
To further improve lignin analysis, this thesis work proposed:

76
(1) To develop a new fast method for lignin functional group analysis, the objective being to
facilitate the lignin analysis for lignin suppliers, without the need of costly equipment.
(2) To investigate a new lignin derivatization reaction for lignin SEC analysis enhancement. The
objectives are to increase lignin dissolution and reduce aggregation in the SEC system, and
also to use the universal calibration instead of standard calibration with polystyrene polymers.
For that purpose, lignin fluorobenzylation, previously developed for lignin functional groups
quantification by 19F NMR, has been studied.
Chapter 3 will present the new fast method developed for lignin functional groups determination,
whereas chapter 4 and 5 are devoted to lignin fluorobenzylation study and SEC analysis.
Before presenting the result chapter, chapter 2 will detail all the materials and methods used in the
PhD work.

77

78

79
CHAPTER
2
2 Materials and Methods
This chapter provides the detailed information on the materials and methods used in this thesis.
In the material section, different technical lignins and model compounds are presented. The model
compounds are chosen according to the nature of functional groups and their position, to elucidate the
reactivity toward different derivatization and to assign NMR signals for lignin samples
characterization. After, the different derivatization methods (acetylation, fluorobenzylation and
fluorobenzoylation) applied in the PhD work are described with main operating conditions. Then the
different analytical methods, UV, FT-IR, GC, NMRs (1H NMR, 13C NMR, 19F and 31P NMR) and fast
method (conductometric and potentiometric) used for quantifying the number of phenolic hydroxyl
groups, carboxyl groups and carbonyl groups present in the lignin samples are presented. Finally, SEC
methods (in DMAc/LiCl and THF) carried out for the study of lignin molar mass distribution, using
conventional and universal calibration are explained.
2.1 Materials
2.1.1 Technical lignins
2.1.1.1 Commercial lignin samples
Four industrial lignin samples have been used in this study: (i) Soda lignin from wheat straw
(Protobind 1000) (PB) was purchased from Green Value Enterprises LLC, (ii) Kraft lignin from pine
(KL) was provided by the Centre Technique du Papier (CTP) (Grenoble, France), (iii) Organosolv
lignin (ORG) (namely BioLignin® CIMV process using formic acid/acetic acid/water at 185-210ºC)
from wheat straw was purchased from CIMV Company, and (iv) Kraft Indulin AT lignin (IND) was
purchased from DKSH Switzerland Ltd (Serrano et al., 2018).

80
2.1.1.2 Eucalyptus Kraft lignin preparation at lab scale
A hardwood Kraft lignin from Eucalyptus has been also extracted at laboratory scale; the
extraction operating conditions are described in the following paragraph. Eucalyptus chips were
cooked using Kraft pulping process. 3 batches of 1200 g of wood chips were cooked using technical
grade Na2S and NaOH solutions. Effective and active alkalis were respectively 25 and 30% of NaOH
on wood. Sulfidity was adjusted to 30% and the liquor on wood ratio was 8. Dry matter content of
wood chips was measured as 87.4%. Cooking conditions used were heat up time of 40 min from 20˚C
to 165˚C followed by plateau time of 80 min at 165˚C. After completion of cooking, 9.5 L of black
liquor were extracted and transferred to the CTP (Centre Technique du Papier) Grenoble, France,
where the lignin was recovered using CO2 precipitation method followed by washing with diluted
sulfuric acid. Around 100 g of Eucalyptus cooked Kraft lignin were obtained from 4 L of black liquor.
Kappa number of the pulp was found to be 12.4% and the measured pulp yield was 50.0%.
2.1.2 Lignin like model compounds
2.1.2.1 Lignin-like model compounds for the study of hydroxyl group
quantification
5 lignin model compounds, commercially available were used: Vanillin (CAS: 121-33-5),
Acetovanillone (CAS: 498-02-2), Guaiacol (CAS: 90-05-1), Vanillyl alcohol (CAS: 498-00-0) and
Veratryl alcohol (CAS: 93-03-8), as well as one model of cellulose: Cellobiose (CAS: 528-50-7). All
model compounds were purchased from Sigma-Aldrich.
2.1.2.2 Lignin-like model compounds for the study of carbonyl group
quantification
Lignin model compounds used for carbonyl group quantification are listed in Table 2.1, Table 2.2,
and Table 2.3 below, and are referenced according to Figure 2.1, Figure 2.2 and Figure 2.3.
Figure 2.1. Lignin model compounds owing α-position carbonyl
R4
R5
R3
O
R8

81
Table 2.1. List of lignin model compounds containing α-position carbonyl group
Compound n°
R3 R4 R5 R8 Name CAS No
1 OMe OH H H- 4-Hydroxy-3-methoxy
benzaldehyde 121-33-5
2 OMe OH OMe H- 4-Hydroxy-3,5-
dimethoxybenzaldehyde 134-96-3
3 OMe OMe OMe H- 3,4,5-
Trimethoxybenzaldehyde 86-81-
7
4 H OH H Me- 4-Hydroxyacetophenone 99-93-
4
5 OMe OH OMe Me- 4-Hydroxy-3,5-
dimethoxyacetophenone 2478-38-8
6 H H H Me(C=O)Et- 1-Phenyl-1,4-pentanedione 583-05-1
7 H H H PhEt- 1,3-Diphenyl-1-
propaneone 1083-30-3
8 H OH H PhCH=CH- Benzylidene-(4-
Hydroxyacetophenone) 2657-25-2
9 H OMe H PhCH=CH- Benzylidene-(4-
Methoxyacetophenone) 959-23-9
10 OMe OMe H 2-(OMe)PhOCH(CH2OH)-
1-(3,4-Dimethoxy-phenyl)-3-hydroxyl-2-(2-
methoxy-phenoxy)-propan-1-one
10548-77-3
11 OMe OH H 2-
(OMe)PhOC(Me)(CH2OH)-
3-hydroxy-1-(4-hydroxy-3-methoxyphenyl)-2-(2-
methoxyphenoxy)propan-1-one
22317-34-6

82
Figure 2.2. Lignin model compounds owing β-position carbonyl
Table 2.2. List of model compounds containing β-position carbonyl group
Compounds
n° R3 R4 R7 R9 Name CAS No
12 H H H2 H- Phenylacetaldehyde 122-78-1
13 H OMe H2 Me- 4-Methoxypheylacetone 122-84-9
14 H H Me H- 2-Phenylpropionaldehyde 93-53-8
15 H H H2 iPr- 3-Methyl-1-phenyl-2-
butanone 2893-05-2
16 OCH2O OCH2O H2 Et- 1-(3,4-Methylenedioxy)-
phenyl-2-butanone 23023-13-4
Figure 2.3. Lignin model compounds owing γ-position carbonyl

83
Table 2.3. List of lignin model compounds containing γ-position carbonyl group
Compounds
n° R4 Re4 R10 Re10 Name CAS No
17 OMe Me- 4-(4-Methoxyphenyl)-2-butanone 104-20-1
18 OH Me- Hydroxy-phenyl-2-butanone 5471-51-2
19 H H 3-Phenylpropionaldehyde 104-53-0
20 OH 2,4,6-
(OH)3Ph-
2’,4’,6’-Trihydroxy-3-(4-
hydroxyphenyl)propiophenone 60-82-2
21 OCH2O Me 3,4-Methylenedioxybenzylacetone 55418-52-5
22 OH Me 4-Hydroxybenzylideneacetone 3160-35-8
23 OMe H 4-Methoxycinnamaldehyde 1963-36-6
24 OCH2O Me 3,4-
(Methylenedioxy)benzylideneacetone 3160-37-0
25 OMe Ph- 4-Methoxybenzylideneacetophenone 959-23-9
26 OH Ph- 4-Hydroxybenzylideneacetophenone 20426-12-4
27 OMe 4-
(OMe)Ph-
4,4’-
Dimethoxybenzylideneacetophenone 2373-89-9
28 OMe Ph2-
3-(4-Methoxyphenyl)-1-(2-Naphtyl)-
prop-2-en-1-one 22359-67-7
2.1.3 Chemicals used
In reaction:
Tetrabutylammonium hydroxide (CH3CH2CH2CH2)4N(OH) (CAS: 2052-49-5), 1M in methanol,
noticed NBu in the discussion, 4-fluorobenzyl chloride FC6H4CH2Cl (CAS: 352-11-4), noticed FBC
in the discussion, lithium chloride LiCl (CAS: 7447-41-8), 4-Trifluoromethylphenylhydrazine CF3PH
(CAS: 368-90-1), H3PO4 orthophophorinc acid(7664-38-2), 4-methylbenzotrifluoride (MBTF) (CAS:
6140-17-6) , 1-methyl naphthalene CAS (90-12-0), chromium (III) acetylacetonate, hydroxybenzoic
acid (CAS: 21679-31-2), cholesterol (CAS: 57-88-5), 2-chloro-4,4,5,5-tetramethyl-1,3,2-
dioxaphospholane (TMDP) (CAS: 14812-59-0) were purchased from Sigma-Aldrich.
Acetonitrile CH3CN 99.95% (CAS: 75-05-8), ethyl acetate CH3COOC2H5 99.5%, (CAS: 141-78-
6), noticed EtOAc in the discussion, sodium sulphate Na2SO4 99% (CAS: 7757-82-6) and diethyl
ether 99.5% (CH3CH2)2O (CAS: 60-29-7), methanol CH3OH (CAS: 67-56-1), Pyridine C5H5N (CAS:

84
110-86-1), acetic anhydride (CH3CO)2O (CAS: 108-24-7) were purchased from Roth and sodium
chloride NaCl (CAS: 7647-14-5) and HPLC grade tetrahydrofuran (CH2)4O (CAS: 109-99-9), noticed
THF in the discussion, was obtained from Acros.
Toluene C7H8 (CAS: 108-88-3) from Chimie-plus. 4-dimethyl –aminopyridine C7H10N2
(CAS:1122-58-3) from Lancaster and 4-fluorobenzoic acid anhydride C14H8F2O3 (CAS: 25569-77-1)
from Alfa-Aesar. Dimethylacetamide CH3C(O)N(CH3)2 from HPLC grade (CAS: 129-19-5), noticed
DMAc in the discussion and Dimethylsulfoxide DMSO purity ≥99.9% (CAS: 67-68-5) were
purchased from Roth. Dimethylformamide DMF (CAS: 68-12-2) from Sigma-Aldrich.
For SEC calibration, narrow polymer standards were used: polymethyl methacrylates (PMMA:
1520, 6840, 13200, 31380, 73850, 135300, 342700, 525000, 1026000, 2095000) were purchased from
Agilent and polystyrenes (PS: 1670, 4970, 10030, 28400, 64200) from Polymer Laboratories Ltd. A
broad polymer standard was also used: cellulose acetate (CAS: 9004-35-7) from Aldrich.
2.2 Methods
2.2.1 Chemical Composition of technical lignins
All the lignin samples were analysed in terms of chemical composition
2.2.1.1 Dry matter content of lignin
Dry matter content was gravimetrically determined by drying samples at 105 °C to constant weight
in an oven.
2.2.1.2 Ashes determination in lignin
The ashes content of all the lignin samples was obtained gravimetrically after in-furnace
calcination for 4 h at 525 °C.
2.2.1.3 Sugar determination
The lignin sample is treated with sulfuric acid using the Klason method (TAPPI standard T-13).
During the acid hydrolysis, all sugars pass into the liquid phase with the acid soluble lignin fraction
which is measured by spectrophotometry at 205 nm (TAPPI UM250 um-83). Monosaccharides were
quantified after the injection of 25 µL the Klason filtrate in high performance anion exchange
chromatography (HPAEC) with pulsed amperometric detection (PAD) (HAUSALO, 1985). Sugars
were eluted on a Dionex Carbopac PA1 column (4 mm x 250 mm) using a 2 mM of potassium
hydroxide solution at a flow rate of 1 mL/min. Fucose was used as internal standard to calculate the
sugars concentration (Cateto et al., 2008).

85
2.2.2 Lignin washing with solvents
The main motivation of solvent washing study is to find the suitable solvent for removing
impurities from the crude lignin samples. In this case, the PB1000 lignin was chosen for this study. 1g
of oven dried PB1000 lignin was washed using approximately 60 mL of different solvents (ethanol,
ethyl acetate and hexane) (16.5g/L). The washing is carried out in two steps: initially, 30 mL of
corresponding solvents were poured into the lignin sample and the mixture was stirred during about 1
hour, followed by vacuum filtrations through a 0.45 µm PTFE membrane. The recovered lignin
sample was added again into 30 mL of pure solvent and stirred for 24 hours and second filtration was
carried out. The filtered lignins were dried using vacuum-oven at 40°C. Based on the obtained results,
ethylacetate (EtOAc) solvent removed impurities and preserve the lignin compare to other solvents
and therefore it was selected for rest of the study.
2.2.3 Lignin and Model Compounds Derivatization
Prior to derivatization, all technical lignins are washed with EtOAc. The following paragraph give
the operating conditions of the derivatization reactions applied on the washed lignin samples
2.2.3.1 Acetylation
100 mg of lignin sample (according to the dry matter content) were acetylated (Figure 2.4) with 5
ml of pyridine and acetic anhydride mixture (1/1: V/V) at room temperature for 15 h in a round
bottom flask with continuous magnet stirring. After the reaction time, the mixture was quenched with
40 ml of 50% aqueous methanol and dried under vacuum. After methanol evaporation, the product
was washed with toluene three times (3 х 40ml) to remove residual pyridine and once with 40 ml of
99.5% methanol. Finally, the samples were freeze dried to ensure total solvent removal. Acetylated
lignin samples were used, first to develop the aminolysis reaction, and second, for quantitative 13C-
NMR analysis.
Figure 2.4. Lignin acetylation reaction
OH
C
C
OH
CH2OH
C
O
H3C O
C
CH3
O
O
C
C
O
H2C
Pyridine
+
C
O
CH3
C
O
CH3
O C
O
CH3

86
2.2.3.2 Fluorobenzylation and fluorobenzoylation
2.2.3.2.1 Fluorobenzylation of model compounds
100 mg of model compound were dissolved in 1 mL of NBu (tetra N-butylammonium hydroxide
in 1M methanol) solution and stirred for 1h at 50°C. Then 10 mL of acetonitrile were added followed
by 300 mg of 4-fluorobenzyl chloride (FBC), the derivatizing agent. The reaction mixture was stirred
at 50°C for overnight. After, distilled water (30 mL) and EtOAc (30 mL) were finally added to the
reaction mixture. The aqueous layer was separated and extracted with EtOAc (2×30mL). The
combined EtOAc layer was washed with distilled water (2×30 mL) and with saturated sodium
chloride solution (30 mL). The extracted EtOAc layer was dried with sodium sulfate, then filtered,
evaporated and analyzed without any further purification.
2.2.3.2.2 Fluorobenzylation of the lignin
Lignin fluorobenzylation was performed using the same experimental conditions as for the model
compounds and the reaction scheme is shown in Figure 2.5. Then the derivatized lignin recovery was
performed by precipitation in diethyl ether. This organic part forms a viscous precipitate, precipitated
again in ice cold distilled water. This precipitate was filtered through a 0.45 µm PTFE filter, washed
with distilled water several times and oven dried at 50˚C (Barrelle et al., 1992; Barrelle, 1995).
Figure 2.5. Fluorobenzylation of lignin using 4-benzylchloride
2.2.3.2.3 Fluorobenzoylation of the lignin
Fluorobenzylated lignins (100 mg) were dissolved in 2.5 mL of pyridine. After, 2.5 mg of 4-
dimethyl-aminopyridine (DMAP) and 150 mg of 4-fluorobenzoic acid anhydride were progressively
added into the reaction medium. The mixture was stirred for 48 h at 60˚C. Then derivatized lignins
were poured into ice cold water. The obtained precipitate is washed with distilled water several times
OCH3
OH
L
HC
C
OH
CH2OH
O
F
CH2Cl
OCH3
O
L
HC
C
OH
CH2O
O
H2
C ArF
+
Ar = Ph
H2
C ArF
2-2 HCl
L= Lignin group
20% (C2H5)4NOH

87
and filtered through a 0.45µm PTFE filters and dried in the oven at 40˚C. The reaction scheme is
given in figure 2.5.
Figure 2.6. Fluorobenzoylation on fluorobenzylated lignin
2.2.3.3 Derivatization with trifluorometylphenylhydrazine
This reaction is applied for lignin carbonyl group quantification.
2.2.3.3.1 Model compounds derivatization
Lignin model compound’s phenyl hydrazine derivatization reaction (Figure 2.7) was carried in the
following conditions: carbonyl model compounds / CF3PH ratio = 1M / 1M concentration. 50 mg of
model compound was first solubilized in 1 mL DMSO-d6, followed by the addition of the CF3PH
(trifluoromethyl phenylhydrazine) reagent, and by 2 drops of phosphoric acid (for the kinetics study in
acidic medium, see annexure A). For the kinetics study, after the acid addition, 19F and 13C NMR
spectra were registered regularly to control the rate of hydrazone formation. When the derivatization
has been completed, 1H, 13C and 2D NMR analyses have be performed to assign all signals belonging
to the resulting hydrazones.
2.2.3.3.2 Lignin derivatization
Lignin carbonyl groups were quantified using a conventional method and the “in-situ NMR kinetics
method”. The operating conditions of both methods are described in the following paragraphs.
Conventional method: 100 mg of lignin (PB lignin in the presented work) were dissolved in 4 mL
DMSO and 4 drops of orthophosphoric acid (H3PO4) were added, followed by 120 mg of 4-
trifluoromethylphenylhydrazine (CF3PH). The reactional mixture was stirred at room temperature for
48 hours. After the reaction time, reaction mixture was concentrated through solvent evaporation
method and precipitated in a large quantity of cold distilled water. The precipitate was washed several
C
OO
F
C
F
O
OCH3
O
L
HC
C
OH
CH2O
O
H2
C ArF
Ar - Ph
H2
C ArF
+
OCH3
O
L
HC
C
CH2O
O
H2
C ArF
Ar - Ph
H2
C ArF
O C
O
ArF
(F)ArCOOH+DMAP, Pyridine

88
times with cold water to remove the excess of reagent, and then dried in an oven at 40˚C for 24 hours.
The schematic derivatization reaction is presented in Figure 2.7.
Figure 2.7. 4-trifluoromethylphenylhydrazine derivatization applied on carbonyl containing
molécules
In-situ reaction kinetics: In-situ phenyl hydrazine derivatization kinetics of lignin (PB lignin in the
presented work) has been studied inside the 5 mm NMR tube, based on the different conditions
mentioned in the literature (Sevillano et al., 2001; Constant et al., 2017). Samples were prepared with
reagents ratios indicated in Table 2.4. Initially, the lignin sample and the internal standard, the 4-
methylbenzotrifluoride (MBTF), were dissolved in DMSO-d6 (0.7 mL). After dissolution, the
reagents CF3PH and H3PO4 (if necessary) were added and the reaction kinetics started to be recorded.
Table 2.4. Different kinetic conditions investigated for phenyl hydrazine derivatization
Conditions 1
This work
2
Sevilano (2001)
3
Constant (2017)
Reagents
Lignin 100 mg 100 mg 100 mg
reagent
4-trifluoromethylphenyl-hydrazine
(CF3PH)
120 mg 150 mg 93 mg
internal standard
4-methylbenzotrifluoride
(4-MBTF) 10 mg 10 mg 10 mg
ortho phosphoric acid
(H3PO4) 2 drops - -
Reaction temperature 25 ºC 25 ºC 40 ºC
Reaction duration (hours) 48 24 24

89
2.2.4 Analytical techniques for lignin phenolic hydroxyl group quantification
2.2.4.1 UV method
UV method works based on the wavelength shift between ionized and protonated phenolic
hydroxyl groups in lignin. The absorbance intensities in the ionization differences is related to the
phenolic hydroxyl groups content. In our case, the region of two maxima between 300 and 350 nm
was chosen to calculate the ionization difference in UV spectrum (Tiainen et al., 1999).
20 mg of lignin sample were dissolved in a mixture of 10 mL dioxane and 10 mL 0.2 M aqueous
NaOH solution. The solution was filtered through a 0.45 µm nylon filter to remove possible
undissolved particles. 4 mL of the lignin solution were diluted to 50 mL in three different aqueous
solutions (0.2 M NaOH solution, buffer pH 6 and buffer pH 12) to reach a final concentration in
lignin of 0.08 g/L.
The UV measurements were carried out with a Shimadzu UV-1800 in the range 200-600 nm using
the lignin solution in buffer pH 6 as reference. The absorbance of the maxima observed at 300 nm and
350 nm were used for the determination. The total phenolic hydroxyl group content per gram of lignin
was calculated according to the Equation 2.1 (Tamminen and Hortling, 1999).
Total OH phenolic content (mmol g⁄ ) = {0.425 x A300nm (NaOH) + 0.182 x A350nm (NaOH)} x a
Equation 2.1
where, A300nm = absorbance at 300 nm, A350nm = absorbance at 350 nm, a (L·g-1·cm-1) =
correction term = 1/(c·l)·10/17, c (g/L) = lignin solution concentration and l (cm) = path
length.
2.2.4.2 Aminolysis after lignin acetylation using gas chromatography
Internal standard calibration: To find the retention time of acetyl pyrrolidine and to make the
calibration curve, commercially available acetyl pyrrolidine was purchased and injected with internal
standard (1-methyl naphthalene). Internal standard and 1-acetyl pyrrolidine in dioxane were prepared
at a concentration of 10 mg/mL. Three different mixtures such as 1:2, 1:1 and 2:1 in mL of internal
standard and acetylpyrrolidine were prepared. 0.5 μL of these mixtures were injected into the GC to
determine the calibration constant k value which is discussed in the following paragraph. The GC
curve was calibrated with internal standard and the results were shown in Figure 2.8.

90
Figure 2.8. GC chromatogram obtained for acetyl pyrrolidine and internal standard (1-methyl
naphthalene)
The calibration constant k was calculated according to the following equation,
𝑘 = 𝐴𝑎 × 𝑊𝑠𝐴𝑠 × 𝑊𝑎 Equation 2.2
Where, Aa = chromatographic area of the product (1-acetyl pyrrolidine), As = chromatographic area
of the internal standard, Wa = weight of product (mg), and Ws = weight of internal standard (mg).
From the above equation, the calibration constant k value was found to be 0.517787.
Aminolysis: Aminolysis consists of a two-step reaction, acetylation followed by aminolysis. 100
mg of acetylated lignin (acetylation described in Chapter 2) was dissolved in 5 mL dioxane
containing 25 mg of internal standard (1-methyl naphthalene). To initiate the aminolysis reaction,
5mL of dioxane-pyrrolidine (1/1: v/v) reactant mixture was added at room temperature. The rate of 1-
acetyl pyrrolidine formation was followed by periodically (for instances: 5, 10, 20, up to 60 minutes)
injections of 0.5 μL reaction mixture into the gas chromatography equipment. 1-acetyl pyrrolidine
formation is equivalent to the total phenolic-OH content. A GC-Trace (ThermoQuest) gas
chromatograph was used with a flame ionization detector, helium as carrier gas, and a DB-5 capillary
0
100000
200000
300000
400000
500000
9.5 10.5 11.5 12.5 13.5
Pea
k I
nte
nsi
ty
Retention time(min)
1:21:12:1
1 - Methyl naphtahlene
Acetyl Pyrrolidine

91
column (30 m length, 320 µm internals diameter, 1 µm film thickness). The formation of 1-acetyl
pyrrolidine content has been calculated according to the Equation 2.3. The formation of acetylpyrrolidine (𝑚𝑚𝑜𝑙 𝑔⁄ lignin) = 𝐴 × 𝑊𝑠 × 1000𝐴𝑠 × 𝑊𝐿 × 𝑘 × 113 Equation 2.3
where, A = chromatographic area corresponding to the 1-acetyl pyrrolidine signal, As =
chromatographic area corresponding to the internal standard signal, WL = weight of lignin (dry
matter), WS = weight of internal standard (1-methyl naphthalene) and k = calibration constant
(obtained from a calibration curve). The obtained results have been plotted between the formation of
acetylpyrrolidine Vs retention time. The content of phenolic hydroxyl groups was calculated by
extrapolating the linear region to the zero time, as described by Dence and Lin, 1992 (Dence and Lin,
1992).
2.2.4.3 13C NMR analysis of acetylated lignin samples
350 mg of acetylated lignin was dissolved in 4 mL of DMSO-d6 with a further addition of 0.42
mL of relaxation agent, chromium (III) acetylacetonate in DMSO-d6 (50 mg/mL). The samples were
stirred a long time to ensure complete dissolution and then transferred into a 10 mm NMR tube for
spectrum recording. The NMR conditions are given in the paragraph devoted to NMR analysis
conditions.
2.2.4.4 Conductometric and potentiometric titration – Fast method
A rapid method in aqueous medium based on simultaneous conductometric and acidic-base
titration by pH was developed to determine the amount of phenolic hydroxyl groups in lignins. At the
same time, this method is able to provide the carboxyl content. The operating conditions of the
methods are described in the next section.
A solution made of 1 g of lignin, 500 mL of fresh deionized water, free of carbonates, and 8 mL of
sodium hydroxide (NaOH) 1M (large excess) was prepared. After being stirred until total dissolution
(around 15 min for most of the studied lignin samples), the solution was titrated back with 1M
hydrochloric acid (HCl) using a Schott automatic burette. Simultaneous measurements of conductivity
and pH were recorded with a Crison pH GLP 21 equipment. During titration, the titration vase was
protected from air by a plastic film, to prevent sodium hydroxide carbonation by atmospheric CO2.
2.2.5 Non-aqueous potentiometric titration method for carboxyl group
determination
Carboxyl groups in lignin could be quantified using a non-aqueous potentiometric titration method
with tetra-n-butylammonium hydroxide (TnBAH method) as titrating chemical (Lin and Dence,

92
1992). 175 mg of lignin and 25 mg of hydroxybenzoic acid are dissolved in 30 mL of DMF with
constant agitation during 5 minutes. After lignin dissolution, the solution is titrated using TnBAH
0.05M in isopropanol under N2 flow. Two inflection points appear during the titration, the first point
corresponds to the carboxyl content and the second to the total weak acids, carboxyl and phenolic
groups (COOH + ArOH).
2.2.6 NMR Analysis conditions
2.2.6.1 NMR analysis conditions for lignin phenolic hydroxyl groups
quantification
NMR spectroscopic measurements were conducted on a Bruker AVANCE400 spectrometer
equipped with a 5 mm BB/19F-1H/d Z-GRD probe and 10 mm probe for 13C operating at 100.612
MHz, 161.982 MHz for 31P and 400.130 MHz for 1H. Acquisition and data treatment were done using
the LINUX TopSpin 3.2 software. Different types of NMR analyses were applied for determining
phenol group content. They are explained in the following sections.
2.2.6.1.1 31P-NMR
The experiments were conducted at 298 K, with 3.37 s acquisition time, 10 s relaxation delay and a
60° pulse using a 30 ppm spectral width. Proton broad band decoupling was applied only during
acquisition time. 16k data points were used for data acquisition. Prior to Fourier transformation, zero-
filling at 64k was applied, followed by apodization with a 1 Hz exponential. Chemical shifts are given
relative to phosphoric acid (δ = 0 ppm). 30 mg of lignin was dissolved in 0.3 mL mixture of pyridine
and deuterated chloroform (1.6/1, v/v). 0.5 mL of DMF was added with 0.1 mL of cholesterol solution
(43 mg/mL) as internal standard and 0.1 mL of chromium (III) acetylacetonate solution (5 mg/mL) as
relaxation reagent. Finally, 0.1 mL of 2-chloro-4,4,5,5-tetramethyl-1,3,2- dioxaphospholane (TMDP
phosphitylation agent) is added to the mixture and vigorously stirred before the transfer into a 5 mm
NMR tube for recording the spectrum. The used solvents were stored during several days over 4 Å
molecular sieves.
2.2.6.1.2 13C-NMR
The experiments were conducted in deuterated solvent like DMSO-d6 at 323 K, with 1.1 s
acquisition time, 2.0 s relaxation delay and a 60° pulse using a 25000 Hz spectral width. Proton broad
band decoupling was applied only during acquisition time. 16k data points were used for data
acquisition on a spectral width of 240 ppm for 13C. Prior to Fourier transformation, zero-filling at 64k
was applied, followed by apodization with a 10 Hz exponential. Chemical shifts are given relative to

93
TMS (tetramethylsilane, δ = 0 ppm). The positions of the peaks were referred to DMSO-d6 signal at
39.5 ppm.
2.2.6.1.3 1H-NMR
The experiments were conducted at 298 K, with 3.4 s acquisition time, 4.6 s relaxation delay and a
30° pulse using a 15 ppm spectral width. 32k data points were used for data acquisition. Prior to
Fourier transformation, zero-filling at 64k was applied, followed by apodization with a 0.3 Hz
exponential. Chemical shifts are given relative to TMS (tetramethylsilane, δ = 0 ppm). The positions
of the peaks were referred with the two singlets for DMF as internal reference at 2.6 and 2.9 ppm. 10
mg of lignin was dissolved in 0.8 ml of deuterated solvent DMSO-d6 and 1 µL of DMF-d1. The
samples were left overnight with the 4 Å molecular sieves. The sample was transferred into a 5 mm
NMR tube and the spectrum was recorded. Thereafter 20% D2O (by volume) was added and a new
spectrum was recorded.
2.2.6.2 NMR analysis conditions for model compounds and sample preparation
2.2.6.2.1 19F NMR
The Bruker invgate sequence was used. The experiments were conducted with 1.25 s acquisition
time, 8.76 s relaxation delay and a 30° pulse using a 65 ppm spectral width. 64k data points for model
compounds were used for data acquisition. Prior to Fourier transformation, zero-filling at 64k was
applied, followed by apodization with a 0.3 Hz exponential. Chemical shifts are given relative to
CFCl3 (δ = 0 ppm). The positions of the peaks were referred for C6F6 as internal reference at -164.90
ppm.
For OH quantification, the experiments were conducted at 298 K, with 4.35 s acquisition time,
8.76 s relaxation delay and a 30° pulse using a 20 ppm spectral width. 64k data points were used for
data acquisition. Quantification and chemical shifts of peaks were referenced with 2-
Fluoroacetophenone as internal reference at -112.86 ppm.
Lignin model compound derivatives were dissolved in deuterated solvent DMSO-d6 (40-50
mg/0.7 mL) using C6F6 as a reference (-164.90 ppm / CFCl3). Lignin derivatives were dissolved in
DMSO-d6 (15-20 mg/0.7 mL) and quantification was done using 2-Fluoroacetophenone (3 mg) as
internal standard. The measurements were performed at 298 K. Chromium acetylacetonate was used
as relaxation agent.

94
2.2.6.2.2 13C NMR
Analysis were performed on derivatized model compounds only (same tubes were used for 19F and 13C experiments), at 298K, using the Bruker invgate sequence. The experiments were conducted with
0.648 s acquisition time, 20 s relaxation delay and a 45° pulse using a 250 ppm spectral width. Proton
broad band decoupling was applied only during acquisition time. 32 k data points were used for data
acquisition. Prior to Fourier transformation, zero-filling at 64 k was applied, followed by apodization
with a 2 Hz exponential. Chemical shifts are given relative to TMS (tetramethylsilane, δ = 0 ppm).
The positions of the peaks were referred to DMSO signal at 39.5 ppm.
2.2.6.2.3 13C DEPT
The Bruker dept sequence was used. The experiments were conducted with 0.648 s acquisition
time, 3.0 s relaxation delay, a last pulse at 135° to select CH2 carbons reversed compared to CH and
CH3, optimized for a 145 Hz coupling constant.
2.2.7 Lignin molar mass distribution analyses by Size Exclusion Chromatography
(SEC)
SEC analysis is indispensable in order to predict the molar mass of lignin to valorize it in a wide
range of applications. Due to their large variety of functional groups, lignins exhibit a high polarity
character leading to solubility issues in the SEC analysis. The following sections present the SEC
systems used (equipment, columns, operating conditions and solvents) in order to study the molar
mass distribution of lignin, as well as the different calibration methods (conventional and universal)
applied.
2.2.7.1 SEC in the DMAc/LiCl system
SEC analysis in DMAc was carried out using an OMNISEC system equipped with 2 polargel M
column (30 cm x 7 mm) and one pre-column (Agilent Co). Columns were purchased from Agilent.
0.5% of DMAc/LiCl (5g of LiCl dissolved in 1L of DMAc) was used as eluent with a flow rate of 1
mL/min and the column temperature was set at 70°C. DRI (Differential Refractive Index) was used as
detector. DMAc/LiCl system only standard conventional calibration curve was made using PS
standard. 100 μL of all the PS standards and lignin samples were injected at a concentration of 2 mg
in 1 mL of 0.5% DMAc/LiCl. The solutions are obtained as follows: 20 mg of underivatized lignin
samples were dissolved in 10 mL of 0.5% DMAc/LiCl during 3 weeks under continuous agitation.
For derivatized lignins, 10 mg of lignin samples were dissolved in 5 mL of 0.5% DMAc/LiCl during 5
days under continuous agitation. All stirred samples were filtrated (0.45 μm PTFE syringe filter)
before analysis.

95
2.2.7.2 SEC in the THF system
SEC analysis in THF system was carried out using a Malvern TDA 302 system equipped with
three 300×7.5mm Agilent PLGel mixed B (10 µm mixed B LS) columns and one pre-column (Agilent
co). RALS-LALS and in-line viscometer detectors at 35°C were used. THF system universal
calibration was made with the help of in line viscometric detector attached to the SEC and also the
results were compared with individual conventional calibration. For the standard calibration of the
columns, solutions of PS, PMMA and cellulose acetate polymer standards were prepared (0.4 mg/L to
1.6 mg/mL in THF). Lignin samples were prepared at the concentration of 10 mg/mL THF. 100µL of
samples and standards were injected into the SEC equipment with a flow-rate of 1 mL/min. Before
injection, sample dissolution was carried out in pure THF for 1 hour. The resulting solution was then
filtered through a 0.45 µm PTFE syringe filter.
In parallel of standard calibration, universal calibration was investigated. It used polystyrene (PS),
polymethylmethacrelate (PMMA) and cellulose acetate standards.
Universal calibration: A universal calibration curve was constructed with the concept of Mark-
Houwink relationship. This concept was first tested on polystyrene polymers by Benoit et al. (Benoit
et al., 1966) and stated that samples were eluted based on their hydrodynamic volume Vh, which
determines the elution volume.
Mark- Houwink relationship [𝜂] = 𝐾′𝑀𝑎
[η] is the intrinsic viscosity of the polymer in dL/g
K’ and a are Mark-Houwink constants, depending on the couple polymer/solvent
M is the molar mass of the polymer in g/mol
Based on the above equation, samples with same [η] and same molar mass (M) possess same
hydrodynamic volume. Thus, samples are eluted at same retention time. The obtained results were
used to plot the universal calibration curve between log ([η].M) Vs retention time. In our case, to
construct the universal calibration curve THF system equipped with in line viscometric detector was
used, it provides the intrinsic viscosity of the polymer. The detailed calibration study is presented in
the Chapter 5.

96
2.2.8 Lignin and lignin derivatives study by FT-IR
The Fourier Transform Infrared spectra for underivatized and derivatized lignin samples were
recorded on a Perkin Elmer spectrometer with absorbance mode using KBr pellets. Spectra were
recorded between 400 to 4000 cm-1 with 32 cumulative scans and 4 cm-1 resolution.
2.2.9 UV- Solubility study on lignin
To analyze the solubility of the fluorobenzylated and acetylated lignins in THF, UV
spectrophotometry was used. The analysis was carried out on a UV-1800 SHIMADZU UV
spectrophotometer between 190 nm to 750 nm. The maximum absorbance was observed at 280 nm.
Un-derivatized and derivatized lignins were dissolved in THF (5mg/mL). After 1h of dissolution time,
the solutions were filtered using a 0.45 µm PTFE filter to remove insoluble particles. Then the filtrate
was diluted up to 25 mL using THF before UV analysis.
2.2.10 HPLC analysis of lignin model compound
Underivatized and derivatized lignin model compounds were analyzed by HPLC to verify the
disappearance of the un-derivatized compound (original model compound) signal after the
derivatization reaction. The measurements were performed on a HPLC system with a spectra physics
1500 Pump instrument using ALLTIMA C18 10U (250 mm × 4.6 mm) column and a UV-visible
6000 spectra detector at 280nm. A mixture of acidified water (0.1% acetic acid in water) and
acetonitrile 90%/10% V/V was used as eluent with 0.6 mL/min flow rate and oven temperature set at
50˚C. 10µL of lignin model compounds and fluorobenzylated lignin model compounds solutions
(0.5mg in 50mL of acetonitrile) were injected. Prior to the analysis, samples were filtered through a
0.45µm PTFE filter.

97

98

99
CHAPTER
3
3. Lignin Phenolic hydroxyl groups
quantification using the aminolysis method and
comparison with other methods
3.1. Introduction
Hydroxyl groups and in particular phenolic hydroxyls are the locus of many possible reactions.
They are key functions for new lignin applications. Thus, this chapter is dedicated to quantifying the
number of phenolic hydroxyl groups present in different technical lignins. This can be done using
various quantification methods, directly on lignin or after lignin derivatization. The purpose of this
chapter was to study the aminolysis method. In that case, the hydroxyl groups on lignin are acetylated
and subsequent selective aminolysis is followed by GC-FID analysis. The obtained results are
compared with those from other characterizations, using different techniques, done in the frame of
another project (QUALIN project, Institut Carnot Polynat) carried out at LGP2 (Serrano et al., 2018).
3.2. Commercial lignin samples used for phenolic hydroxyl group
quantification
Four industrial lignin samples were used in this study: (i) Soda lignin from wheat straw (Protobind
1000) (PB) was purchased from Green Value Enterprises LLC, (ii) Kraft lignin from pine (KL) was
provided by the Centre Technique du Papier (CTP) (Grenoble, France), (iii) Organosolv lignin (ORG)
(namely BioLignin® CIMV process using formic acid/acetic acid/water at 105-110ºC) from wheat
straw was purchased from CIMV Company, and (iv) Kraft Indulin AT lignin (IND) was purchased
from DKSH Switzerland Ltd.

100
3.3. Chemical composition of the lignin samples
The chemical composition of the different technical lignins is given in Table 3.1. Lignin purity
was around 90% and ash and sugar contents were varying according to the lignin nature, in particular
according to the extraction process. Organosolv lignin exhibited the highest sugar content due to the
lighter extraction process using low temperature and weak acids. KF and IND, both from softwood
Kraft cooking, exhibited the lowest xylose content and the highest galactose content. Indulin lignin
showed highest ash content; it could be due to minerals used for its recovery and pine Kraft lignin
extracted at CTP showed lighter ash content due to three successive washes using 2% sulfuric acid in
order to remove the impurities.
Table 3.1. Chemical composition of the technical lignins, in %
Components
(% w/w) PB-Protobind
lignin
ORG-Organosolv
lignin
KF-Kraft lignin from pine
IND-Indulin lignin
Total lignin 92.4 89.2 93.7 95.7
Acid insoluble lignin 89.5 ± 1.2 87.8 ± 1.2 92.8 ± 0.3 94.7 ± 0.4
Acid soluble lignin 2.9 ± 0.2 1.4 ± 0.1 0.9 ± 0.2 1.0 ± 0.1
Total sugars 3.1 ± 0.2 7.2 ± 0.3 2.5 ± 0.1 2.6 ± 0.2
Glucose 1.0 4.3 0.2 0.3
Galactose 0.2 0.8 1.6 1.3
Xylose 1.5 1.3 0.2 0.5
Mannose - 0.2 - -
Arabinose 0.4 0.6 0.5 0.5
Ash 1.6 ± 0.1 1.2 ± 0.1 0.3 ± 0.1 2.9 ± 0.3
3.4. Quantification of lignin phenolic hydroxyl groups
3.4.1. Aminolysis method
Several studies have been carried out to determine phenolic hydroxyl group present in various
lignins. Among the existing methods, aminolysis is one of the prevalent for researchers because of
consistent results and reproducibility (Månsson, 1982; El Mansouri and Salvadó, 2007). This method
relies on a two-steps reaction, in which all the hydroxyl groups in lignin are acetylated in the first step

101
and then, the acetylated lignin undergoes aminolysis using pyrrolidine and regenerates the phenolic
hydroxyl group by producing 1-acetylpyrrolidine and the aliphatic acetates remains unchanged. The
typical reaction scheme is illustrated in Figure 3.1.
Figure 3.1. (a) Acetylation of lignin – first step (b) Aminolysis of acetylated lignin – second step.
The lignin phenolic hydroxyl groups are thus deduced from the quantification of 1-acetylpyrrolidine
using gas chromatography (GC) and a flame-ionization detector (FID).
3.4.2. Aminolysis followed by GC
The GC analyses have been performed for determining the rate of the aminolysis reaction for all
investigated lignins. During aminolysis, the rate of deacetylation of phenolic hydroxyl groups is
significantly faster than that of aliphatic hydroxyl group in presence of pyrrolidine under mild
conditions (Månsson, 1983). Therefore, the formation of acetyl-pyrrolidine corresponds to the amount
of aromatic acetyl groups initially present in the lignin. The resulting acetyl-pyrrolidine (the
byproduct) formation was analyzed by GC-FID. However, it should be noted that there is a possibility
that some aliphatic acetyl groups undergo deacetylation at a prolonged reaction time, leading to
overestimated hydroxyl group values.

102
First, the PB lignin sample was analyzed after different reaction times. The GC chromatograms
obtained are gathered in Figure 3.2. It is clearly seen that the acetyl-pyrrolidine formation (area under
the signal) increased with the reaction time during the first 20 minutes. After that duration, the
quantity of acetyl pyrrolidine stabilizes meaning that deacetylation is completed. Moreover, at 5 min
reaction time, the retention time of the product is 10.16 minutes. After, the acetyl pyrrolidine
formation increases, and it is eluted at slightly lower retention time: for instance, at 20 min, the
elution time found was 10.08 min; similar trend was observed with the higher reaction times.
Figure 3.2. GC chromatogram of 1- acetyl pyrrolidine formation during PB1000 lignin de-acetylation
A similar trend was also observed for the ORG lignin sample. The results are given in Figure 3.3.
After 5 min of acetyl-pyrrolidine formation, i.e. 5 minutes of reaction, the acetyl-pyrrolidine signal is
obtained at 9.98 min of retention time. Again, the quantity of acetyl-pyrrolidine was increasing with
reaction time before stabilization after 30 min when deacetylation is completed. However, in this
case, the rate of formation of acetyl-pyrrolidine is increased slowly after 5 minutes, whereas in the
case of PB lignin (Figure 3.2), the significant difference was obtained between 5 and 10 min. After
12 min of acetyl pyrrolidine production, the variation of retention time is lower. It is also seen from
the Figure 3.3 that signal at 50 min has a smaller area compared to 60 min and 43 min and the reason
of this variation could be raised from a deficient injection in the GC at this particular reaction time.

103
Figure 3.3. GC chromatogram of 1- acetyl pyrrolidine formation during the Organosolv lignin (ORG)
de-acetylation
Figure 3.4 presents the GC chromatograms of 1-acetyl pyrrolidine formation during the Kraft
lignin de-acetylation. Similar to other lignin samples, Kraft lignin de-acetylation leads to the same
behavior. It is interesting to compare the signal area of 1- acetyl pyrrolidine from Figure 3.2, Figure
3.3 and Figure 3.4. Among the tested lignin samples, Kraft lignin leads to the highest signal area.
Then PB lignin comes after, followed by ORG lignin. Because the quantity of 1- acetyl pyrrolidine
product is proportional to the phenolic hydroxyl content in lignin, it can be concluded that Kraft lignin
contains the highest quantity of phenolic hydroxyls. The calculation of phenolic hydroxyl groups is
presented in the following section.

104
Figure 3.4. GC chromatogram of 1- acetyl pyrrolidine formation during Kraft lignin de-acetylation
The similar GC chromatogram trend is observed for Indulin lignin (chromatogram is not shown here,
the aminolysis results are exhibited in Figure 3.5)
Amount (mmol) of acetyl pyrrolidine formation was calculated from the amount of initial lignin
and the area obtained from GC chromatogram after aminolysis using the following relation,
The formation of acetylpyrrolidine (𝑚𝑚𝑜𝑙 𝑔⁄ lignin) = 𝐴 × 𝑊𝑠 × 1000𝐴𝑠 × 𝑊𝐿 × 𝑘 × 113 Equation 3.1
where A = chromatographic area of the signal corresponding to 1-acetyl pyrrolidine and its retention
time obtained at 10 min, As = chromatographic area of the signal corresponding to the internal
standard (1-methyl naphthalene) and its retention time found at 13.4 min , L = weight of lignin in mg,
WS = weight of internal standard in mg, 113 = molecular weight of acetyl pyrrolidine (g/mole), k =
calibration constant and the detailed procedure for the calculation of k value can be found in the
materials and methods chapter (CHAPTER 2)
During aminolysis reaction, the samples were collected at different reaction time and injected into
the GC. Figure 3.5 represents the acetyl pyrrolidine formation at different reaction times for all the
examined lignin samples. It is clearly seen that within the 5 first minutes of reaction, the acetyl
pyrrolidine formation is rapidly increasing. It is continuously rising till 20 min and from 20 to 60 min
the acetyl pyrrolidine formation is relatively stable. Moreover, as already seen, Kraft lignin exhibits

105
higher acetyl pyrrolidine formation than PB, Indulin and ORG lignin samples. Most of the lignins,
after 20 min, reach a constant plateau; this clearly demonstrates that the phenolic acetates were de-
acetylated during this phase by the aminolysis process. The content of the 1-acetyl pyrrolidine formed
was calculated by extrapolating the linear region from 20 to 60 min at zero time (Dence and Lin,
1992). The corresponding value is directly proportional to the phenolic hydroxyl groups present in the
lignin samples.
Figure 3.5. Aminolysis of acetylated lignin samples, PB-lignin, ORG lignin, Kraft lignin and Indulin
lignin
The amount of phenolic hydroxyl groups in lignin samples is compared in Table 3.2. Each reaction
was repeated three times and the standard deviation of the corresponding samples are mentioned in
Table 3.2.

106
Table 3.2. Comparison of phenolic hydroxyl group content in different technical lignins, from lignin
aminolysis
Type of the lignin Phenolic hydroxyl groups mmol/g lignin
PB - Protobind 1000 lignin 3.4 ± 0.18
ORG - Organosolv lignin 2.4 ± 0.12
KF - Kraft lignin 4.0 ± 0.07
IND – Indulin lignin 3.6 ± 0.05
Among the examined lignin samples, Kraft lignin contains the highest amount of phenolic
hydroxyl groups, around 4.0 mmol/g, followed by Indulin (3.6 mmol/g) and PB (3.4 mmol/g) lignins.
Organosolv lignin exhibits the lowest phenolic hydroxyl group content, i.e. 2.4 mmol/g. It should be
stressed that softwood lignins (Kraft and Indulin) are known to contain more phenolic hydroxyl
groups than annual plant lignins (PB and ORG). The aminolysis results are thus logical.
It should be noted that PB and Organosolv lignins exhibit high sugar content, 3.1 ± 0.2 and 7.2 ±
0.3 respectively (Table 3.1), which possibly undergo the acetylation and deacetylation leading to an
overestimation of the results given by aminolysis. It is evident that the aminolysis method is more
sensitive to the sugar impurities than some other methods.
Salvado et al. carried out a similar study on the aminolysis method and lignin phenolic hydroxyl
determination. According to their results, Kraft lignin exhibits high phenolic hydroxyl groups
quantity, around 4.60 mmol/g with a standard deviation of 0.04. In addition, organosolv lignin
displays lower phenolic hydroxyl group content, with around 2.80 ± 0.10 mmol/g. These results are in
good agreement with our findings (El Mansouri and Salvadó, 2007).
3.5. Comparison of the aminolysis method with other analytical methods
The results given by the aminolysis method were compared with those obtained by other analytical
techniques such as FT-IR, differential UV, NMR and titration method. The following section presents
various techniques employed for the analysis and the obtained results.
3.5.1. FT-IR
FT-IR analysis, a non-quantitative analysis, is used to compare crude and acetylated lignins in
view of observing structural composition and differences before and after the derivatization. Figure
3.6 gives the FT-IR spectra of the four technical lignin samples used in this study.

107
Figure 3.6. FT-IR spectra of crude and acetylated lignins (a) PB - Protobind lignin (b) ORG -
Organosolv lignin (c) Kraft lignin (d) IND- Indulin lignin
(b)
(c)
(d)

108
It is clearly seen from the spectra that, in all cases, similar profiles with slight differences in
absorbance bands are obtained. The crude samples showed a typical signal at 3400 cm-1 which is
attributed to OH groups, and bands around 2950-2830 cm-1 corresponding to the vibration of CH bond
in methyl and methylene groups. The signals at 1595, 1515 and 1425 cm-1 represent typical aromatic
vibrations in lignin. The three main lignin structural units (S, G, H) show characteristic signals at
1330 cm-1 related to the breathing of the syringyl ring with CO stretching. Two adjacent bands at 1265
and 1210 cm-1 are associated to the breathing of the guaiacyl ring with CO stretching. The vibration of
CH in guaiacyl and syringyl units appears at 1150 and 1120 cm-1, respectively. Finally, the vibration
due to the CH linkage in syringyl and p-hydroxy structures can be observed between 810 cm-1 and
850 cm-1.
After acetylation, the typical band of -OH at 3400 cm-1 is considerably reduced compared to crude
samples, confirming that the corresponding -OH groups were derivatized. It should be noted that a
new band is observed at around 1750 cm-1. It is attributed to C=O bond of acetyl groups. Another
difference in signal intensity is obtained with derivatized lignins at 1250 cm-1. This is associated to the
formation of a new C-O bond in lignins. These results evidenced that there are substantial changes in
lignin structure after derivatization. Although, this method is simple and fast, acetylation can cause
problems due to incomplete derivatization and therefore the results are only qualitative.
3.5.2. Lignin hydroxyl phenolic group quantification by UV spectrophotometry
UV spectrophotometry is a direct, rapid and easy way for phenolic hydroxyl groups measurement
compared to aminolysis. It is applied on crude lignin, without prior lignin derivatization. However,
this method (described in chapter 2) only provides the total amount of phenolic hydroxyl groups
without any structural specification. Results are presented in Error! Reference source not found..
Table 3.3. Comparison of phenolic hydroxyl group quantification (mmol/g) using aminolysis and UV
spectrophotometry
Method PB-Protobind
lignin
ORG-
Organosolv
lignin
KF-Kraft
lignin
IND-Indulin
lignin
Aminolysis 3.4 ± 0.18 2.4 ± 0.12 4.0 ± 0.07 3.6 ± 0.10
UV-method 2.6 ± 0.02 1.7 ± 0.01 2.8 ± 0.01 3.4 ± 0.01
The UV method estimates lower amount of phenolic hydroxyl groups for all the studied lignins, in
particular for the Kraft lignin. The UV method is well known to present limitations; especially for the
quantification of some phenolic structures bearing more than one phenolic hydroxyl group (Tiainen et

109
al., 1999). Another important issue is that the method requires full lignin solubility in the solvents
(dioxane mixed with 0,2 M NaOH and dioxane mixed with an aqueous buffer at pH 6) which is not
straightforward for some samples. This limitation leads to the underestimation of the lignin phenolic
hydroxyl groups.
3.5.3. Lignin hydroxyl group quantification by 1H NMR
Aminolysis, UV and 1H NMR results are presented in Table 3.4.
1H NMR spectra are measured
directly on crude lignins. For this analysis, 10 mg of crude lignins are analysed in 5 mm NMR tubes.
Table 3.4. Comparison of phenolic hydroxyl group quantification (mmol/g) using aminolysis and 1H
NMR spectroscopy
Method PB-Protobind
lignin
ORG-
Organosolv
lignin
KF-Kraft
lignin
IND-Indulin
lignin
Aminolysis 3.4 ± 0.18 2.4 ± 0.12 4.0 ± 0.07 3.6 ± 0.10
UV-method 2.6 ± 0.02 1.7 ± 0.01 2.8 ± 0.01 3.4 ± 0.01
1H-NMR 1.8 ± 0.13 0.9 ± 0.07 2.7 ± 0.04 3.1 ± 0.23
Very low values are obtained with 1H-NMR spectroscopy for all lignins except IND lignin
compared to classical aminolysis method. To avoid the acetylation of the sample, the lignin sample
should be totally dissolved in deuterated solvents (D2O) with extreme care, i.e. total dryness in the
sample and solvents. These requirements make the method very tedious, time consuming and
sometimes lead to undervalued results. The large difference in phenolic hydroxyl group values from
1H NMR clearly indicates that this method fails to associate with other techniques and it evidences the
main drawback of this technique. Moreover, the use of a short spectral width range hinders the spectra
integration due to overlapping, lack of resolution and large proportion of protons in lignin (Blainski et
al., 2013).
3.5.4. Lignin hydroxyl group quantification by 13C NMR
13C NMR technique is an indirect method used for the quantification of phenolic hydroxyl groups
in lignin. Lignin samples are acetylated prior to analysis. Fourier transformation is applied to integrate
the signals in which the amounts of phenolic hydroxyl group’s areas are easily calculated based on the
relative integrals with respect to the internal standard. From the 13C NMR, the acetylated groups
signal area is quantified that gives the information of number of phenolic hydroxyl groups.

110
Aminolysis, UV method, 1H and 13C NMR results are presented in Table 3.5. 350 mg of acetylated
lignins are analysed in 10 mm NMR tubes used for the analysis.
Table 3.5. Comparison of phenolic hydroxyl group quantification (mmol/g) using aminolysis and 13C
NMR spectroscopy
Method PB-Protobind
lignin
ORG-
Organosolv
lignin
KF-Kraft
lignin
IND-Indulin
lignin
Aminolysis 3.4 ± 0.18 2.4 ± 0.12 4.0 ± 0.07 3.6 ± 0.10
UV-method 2.6 ± 0.02 1.7 ± 0.01 2.8 ± 0.01 3.4 ± 0.01
1H-NMR 1.8 ± 0.13 0.9 ± 0.07 2.7 ± 0.04 3.1 ± 0.23
13C-NMR 2.4 ± 0.04 2.0 ± 0.03 4.2 ± 0.06 3.6 ± 0.05
This method can quantify the total hydroxyl groups, including aromatic and aliphatic hydroxyls. It
should be mentioned that in both aminolysis and 13C NMR analyses, acetylated samples have been
used. This method shows that Kraft and Indulin lignins possess similar quantities of phenolic
hydroxyl groups, in the same range as with aminolysis. PB and organosolv lignin analysed with 13C
NMR show lower phenolic hydroxyl content than with the aminolysis method, and the reason can be
the interference of high sugar content during aminolysis. Contrary to aminolysis, 13C NMR analysis
predicts the phenolic hydroxyl group content regardless of sugar impurities and provides additional
structural information. For instance, on the 13C NMR spectra of the Kraft lignin (Figure 3.7), the
region between 165 and 175 ppm corresponds to the carboxyl groups issued from aliphatic and
aromatic hydroxyl groups acetylation. The spectrum also shows the pyridine residues derived from
the acetylation process even after successive evaporation and freeze-drying operations. The limitation
of the 13C NMR is incomplete acetylation, signal overlapping and time-consuming process.

111
Figure 3.7. KF-Kraft lignin sample 13C-NMR spectrum and detail of the carboxyl zone.
3.5.5. Lignin hydroxyl group quantification by 31P NMR
Nowadays, 31P-NMR is considered as the most referenced method. It provides detailed structural
information on lignin. For 31P NMR analysis, in-situ hydroxyl group phosphorylation is necessary,
directly in the NMR tube. Comparing with aminolysis, the derivatization reaction is different
(acetylation for aminolysis). The use of a phosphorylating agent and of an internal standard
(cholesterol) enables the clear differentiation of hydroxyl (aliphatic and aromatic) and carboxyl
groups. 31P NMR results are compared with aminolysis, UV and other NMR (1H, 13C) techniques in
Table 3.6.
Table 3.6. Comparison of phenolic hydroxyl group quantification (mmol/g) using aminolysis and 31P
NMR spectroscopy
Method PB-Protobind
lignin
ORG-Organosolv
lignin
KF-Kraft
lignin
IND-Indulin
lignin
Aminolysis 3.4 ± 0.18 2.4 ± 0.12 4.0 ± 0.07 3.6 ± 0.10
UV-method 2.6 ± 0.02 1.7 ± 0.01 2.8 ± 0.01 3.4 ± 0.01
1H-NMR 1.8 ± 0.13 0.9 ± 0.07 2.7 ± 0.04 3.1 ± 0.23
13C-NMR 2.4 ± 0.04 2.0 ± 0.03 4.2 ± 0.06 3.6 ± 0.05
31P-NMR 2.7 ± 0.1 1.3 ± 0.06 3.2 ± 0.16 3.2 ± 0.10

112
At the same time, 31
P-NMR is a non-sensitive method to impurities since sugars are not reactive
during phosphorylation (Korntner et al., 2015). This could be the reason why the 31
P NMR analysis
gives less phenolic hydroxyl groups for all the tested lignins compared to the aminolysis method. As
aminolysis, 31
P NMR is a tedious and complex determination since it requires a lignin derivatization
step and consumes time and expensive chemicals. After phosphorylation, the analysis should be
performed rapidly due to derivatized product instability and it requires an access to costly NMR
equipment, representing further limitations. The main benefit of the 31
P-NMR analysis is that it allows
a detailed quantification of syringyl, guaiacyl and p-hydroxyphenyl units (Cateto et al., 2008). Figure
3.8 shows the PB-lignin 31
P-NMR spectrum. In the Figure 3.8, the region from 137.5 ppm to 144 ppm
is associated to the different phenolic groups in lignin such as p-hydroxy OH (137.5 ppm to 138.5
ppm), guaiacyl OH (139 ppm to 139.8 ppm) and syringyl OH (142.2 ppm to 143 ppm) respectively.
The aliphatic OH groups region is found between 145.5 ppm to 149 ppm. Table 3.7 gives the
quantification of the different hydroxyl groups.
Figure 3.8. 31P-NMR spectrum of the PB-Protobind lignin sample

113
Table 3.7. Hydroxyl group determination (mmol/g) using 31P NMR spectroscopy
Lignin samples Aliphatic
OH
Syringyl
OH
Condensed
phenolic
OH
Guaiacyl
OH
p-
Hydroxy
OH
PB-Protobind lignin 1.50 0.67 0.86 0.82 0.35
ORG-Organosolv lignin 1.23 0.25 0.39 0.45 0.21
KF-Kraft lignin 1.87 0.24 1.30 1.50 0.16
IND-Indulin lignin 2.06 0.20 1.25 1.54 0.21
The detailed hydroxyl group quantification (Table 3.7) reveals the origin of each lignin sample.
Softwood lignin samples (Kraft lignin and Indulin lignin) logically present a combination between
high amount of guaiacyl units and small amounts of syringyl and p-hydroxyphenyl units. On the other
hand, non-wood lignin from agricultural residues (Organosolv lignin and PB lignin) presents
comparable structure proportions (Cateto et al., 2008).
3.5.6. Lignin hydroxyl and carboxyl group quantification by conductometric and pH-
metric titrations (Fast method)
A fast and easy method for lignin phenolic hydroxyl and carboxyl group determination has been
developed at LGP2. The idea is to provide a simple method for lignin producers to easily qualify the
technical lignins for various applications. The method is based on the combination of an aqueous
acid-base conductometric titration and pH-metric titration. A back titration with HCl is carried out
after adding an excess of sodium hydroxide on lignin to convert phenolic and carboxyl acid groups
into phenolate and carboxylate ions respectively. The method is presented in detail in CHAPTER 2 .
Figure 3.9 shows the three different end-titration volumes appearing along the conductometric and
pH-metric titrations in the tested lignin samples. V1 is detected by the change in the conductometric
curve slope from negative to slightly positive and V3 is detected by a sharper increase. They
correspond to the end-point titration volume of the hydroxyl ions added in excess (V1) and the start of
the hydrochloric acid excess introduced in the medium (V3). Between V1 and V3, phenolic hydroxyl
groups first, then carboxyl groups are protonated; but these two functional groups could not be
distinguished because they exhibit similar conductivities. However, due to their different pKa’s, a pH-
metric titration can discriminate phenolic and carboxyl groups. The titration of free phenols with
pKa’s in the range of 8-11.5 can be obtained by the volume difference between V2, corresponding to

114
pH close to 7, and V1. The remaining acidic groups, i.e. carboxyl groups, thus correspond to the
volume difference between V3 and V2.
Figure 3.9. Conductometric and acid-base titration curves for lignin samples
As clearly seen in Figure 3.9, all the examined lignin samples undergo a similar profile during the
titrations independently of the starting raw material and of the process applied to recover the lignin.
However, while the V3 titration volume is always rather precisely determined (because most
carboxylic acids in lignin have a pKa above 4.5, as reported by Zakis (Zakis, 1994)), a significant
imprecision may come from the V1 titration volume determination due to the presence of phenolic
components with high pKa values (up to 11.5 in condensed phenolic structures bearing an α-carbon
adjacent to the phenolic carbon). This is a limitation of this method.
The quantification of the phenolic hydroxyl groups in the technical lignins by this simple “fast
titration method” is given in Table 3.8 and is compared with other methods.

115
Table 3.8. Phenolic hydroxyl group quantification (mmol/g) using the fast titration method,
comparison with aminolysis and other methods
Method PB-Protobind
lignin
ORG-
Organosolv
lignin
KF-Kraft
lignin
IND-Indulin
lignin
Aminolysis 3.4 ± 0.18 2.4 ± 0.12 4.0 ± 0.07 3.6 ± 0.10
UV-method 2.6 ± 0.02 1.7 ± 0.01 2.8 ± 0.01 3.4 ± 0.01
1H-NMR 1.8 ± 0.13 0.9 ± 0.07 2.7 ± 0.04 3.1 ± 0.23
13C-NMR 2.4 ± 0.04 2.0 ± 0.03 4.2 ± 0.06 3.6 ± 0.05
31P-NMR
2.7 ± 0.1 1.3 ± 0.06 3.2 ± 0.16 3.2 ± 0.10
19F-NMR 2.176 1.673 2.277 2.331
Fast method 2.4 ± 0.03 1.5 ± 0.03 2.4 ± 0.03 2.7 ± 0.05
The fast titration method shows that Indulin, Kraft and PB lignins exhibit the highest phenolic
hydroxyl group content. This result is different from those obtained with aminolysis and other NMR
techniques, where Kraft lignin contains the highest value. Compared to aminolysis, the fast method
underestimates the number of hydroxyl groups in lignin and there is a big difference for the case of
Kraft lignin. It is interesting to note that most of the fast titration method results were in close
agreement with other conventional methods such as UV, 19
F NMR and 31
P NMR. The detailed
information for the quantification of phenolic hydroxyl groups using 19
F NMR can be found in
CHAPTER 5.
The fast titration method is also able to provide the quantity of carboxyl groups presents in lignins.
Table 3.9 compares the carboxyl groups determination of the analyzed lignin samples obtained by
three different methods: the fast method, non-aqueous potentiometric titration by tetra-n-
butylammonium hydroxide - TnBAH and 31P NMR (the detailed information on these methods are
given in Materials and Methods, CHAPTER 2).

116
Table 3.9. Comparison of carboxyl group quantification (mmol/g) using the fast method, the TnBAH
titration and 31P NMR
Method PB-Protobind
lignin
ORG-Organosolv
lignin
KF-Kraft
lignin
IND-Indulin
lignin
Fast method 1.6 ± 0.02 2.3 ± 0.05 1.2 ± 0.04 1.4 ± 0.02
TnBAH method 1.6 ± 0.04 1.3 ± 0.01 1.2 ± 0.03 1.1 ± 0.01
31P NMR 1.4 ± 0.07 1.1 ± 0.05 0.9 ± 0.04 0.9 ± 0.04
From Table 3.9, the analysis reveals lower carboxyl groups values in the case of 31P NMR and a
great similarity between the two titration methods except for the Organosolv lignin sample. Moreover,
the carboxyl content of all the analysed lignin samples was lower than the phenolic hydroxyl group
amount, except, again, for the Organosolv lignin sample. A higher carboxyl content compared to
phenolic hydroxyls is possible since the Organosolv lignin sample extraction process uses oxidative
conditions.
Although the fast titration method enables the quantification of both phenolic hydroxyl groups and
carboxyl groups, it has some inherent limitations: this method requires a large quantity of sample,
around 1g for the analysis, and does not give the structural units (S, G and H) composition present in
the lignin. Moreover, an error around 10−15% may be found for phenolic hydroxyl group
determination if the lignin samples present phenolic structures with high pKa values. For instance, the
calculated phenolic hydroxyl group value is about 2.4 mmol/g from the fast titration method in the
case of the PB lignin, whereas it was found around 3.4 mmol/g using aminolysis.
Comparing all analysed samples, the phenolic hydroxyl group values (in mmol/g) range in different
methods: 2.4 (ORG) to 4.0 (KF) (aminolysis), 1.7 (ORG) to 3.4 (IND) (UV), 0.9 (ORG) to 3.1 (IND)
(1H NMR), 2.0 (ORG) to 4.2 (KF) (13C NMR), 1.3 (ORG) to 3.2 (KF and IND) (31P NMR) and 1.5
(ORG) to 2.7 (IND) (fast titration method). It should be noted that all the methods gave lower
phenolic hydroxyl content for Organosolv lignin and higher phenolic hydroxyl content for Indulin or
Kraft (softwood lignins). Overall aminolysis method predicted higher phenolic content for all lignins
compared to the other analytical techniques and 1H NMR provided lowest phenolic content.
3.6. Conclusion
The aminolysis method was employed for phenolic hydroxyl group quantification in four different
technical lignin samples: Protobind 1000 lignin, Organosolv lignin, Kraft lignin and Indulin lignin.

117
Prior to aminolysis, the lignin samples have been acetylated to convert hydroxyl groups present in
lignin into corresponding acetylated derivatives. The derivatization was controlled by FT-IR: the
signal corresponding to hydroxyl functional group was significantly reduced after acetylation. The
aminolysis GC results revealed that Kraft lignin contains higher phenolic hydroxyl group content than
Indulin lignin, followed by Protobind and at least by the Organosolv lignin. The GC results were
compared with other analytical techniques such as UV, 1H NMR, 13C NMR, 31P NMR and a fast
titration method recently developed at LGP2. The obtained results demonstrated that aminolysis
results were comparable to 13C NMR results. This is not surprising since both methods used acetylated
derivatives. 13C NMR and 31P NMR are more complete techniques since they provide additional
information on the lignin structure. However, it should be stressed that the high complexity of NMR
techniques and time consuming associated with high cost of chemicals are the limitations of these
analyses. 1H NMR, UV and fast titration methods underestimated the phenolic hydroxyl groups
content and are penalized by signal overlapping (1H NMR), more than one phenolic hydroxyl groups
in phenyl unit (UV) and large quantity of sample, inability to quantify structural units, and inadequate
quantification of high pKa’s phenolic structures (fast titration method). However, for the fast titration
method, the error has been estimated to be close to 10-15%, which is satisfactory for a first industrial
characterization, easy to apply in laboratories without sophisticated analytical equipment. Moreover,
classical aminolysis also exhibits some drawbacks such as possible incomplete derivatization and the
overestimation of phenolic hydroxyl groups due to sugar impurities present in the samples. Some of
these limitations might be avoided by employing new derivatization methods such as
fluorobenzylation and fluorobenzoylation. The next chapter will study in detail some fluoro-
derivatization reactions on lignin-like model compounds, originally developed by Prof. Barrelle and
co-workers about 25 years ago at Grenoble University, but never applied by other groups due to
incomplete developments of the methods, to estimate the aromatic and aliphatic hydroxyl groups
using 19F NMR, while limiting the interaction with sugars impurities.

118

119
CHAPTER
4
4. Study of the reactivity of lignin model
compounds toward fluorobenzylation using 13C
and 19F NMR: Application to lignin hydroxyl
groups quantification by 19F NMR
4.1. Introduction
Two decades ago, Barrelle et al. developed 19F NMR spectroscopic analysis after lignin
derivatization by fluorinated compounds to quantify phenolic and aliphatic hydroxyl groups, and
carbonyl groups. Fluorobenzylation was used to quantify phenolic hydroxyl groups and primary
aliphatic hydroxyl groups, fluorobenzoylation for secondary aliphatic hydroxyl group, whereas
trifluoromethylphenylhydrazine derivatization enabled carbonyl groups determination (Barrelle, 1993,
1995; Barrelle et al., 1992; Sevillano et al., 2001). As for 13C NMR analysis, the derivatization was
carried out prior to the NMR acquisition. Although not much tested, this method offered several
advantages over 13C and 31P NMR techniques: the derivatization reaction is rapid (one day); the
derivative is stable so that it can be re-used for other analysis; due the natural abundance of 100% and
the high sensitivity of the 19F nucleus, the 19F-NMR acquisition times are quite low (less than 30 min
for lignin samples); and the quantitative analysis requires only few amount of lignin derivative (15
mg). However, up to now, the usage of this analytical method has been mostly restricted to carbonyl
quantification and not for hydroxyl groups determination, due to the variety of well-tested other
methods for –OH evaluation.
Therefore, in this work, we revisited the 19F NMR method to assess the fluorobenzylation reactivity
of hydroxyl groups of different natures, using the combination of 13C and 19F NMR analyses
performed on lignin model compounds. This work is thus a complement of Barrelle et al. studies, and

120
intends to prove that the 19F NMR lignin analysis is a robust method for lignin phenolic hydroxyl
groups quantification.
Therefore, this chapter is devoted to the study of lignin model compound fluorobenzylation, i.e. to
investigate the reactivity of lignin hydroxyl groups in such reaction, with the final objective to
quantify phenolic hydroxyl groups of technical lignin.
Five different lignin-like model compounds have been chosen according to the nature of the
hydroxyl groups bound to the different sites, such as aromatic and aliphatic hydroxyl groups. Since
lignins are often contaminated by sugars, and because sugars also bear hydroxyl groups, a cellulose
model compound has been also selected. All the model compounds have been subjected to the
fluorobenzylation reaction and the resulting products have been analyzed by 13C and 19F NMR
spectroscopy. In the following, 19F NMR analysis was successfully applied on a commercial lignin
(Organasolv - ORG) after fluorobenzylation in order to quantify its phenolic group content and also to
test its solubility in SEC organic solvent for the molar mass distribution study, presented in the next
chapter.
4.2. Materials and methods
The fluorobenzylation reaction is carried out using the 4-fluorobenzyl chloride (FBC) as
derivatizing agent. The model compounds and lignin samples are dissolved in tetra N-
butylammonium hydroxide in 1M methanol (NBu) solution and stirred for 1h at 50°C, before the
addition of the derivatizing agent. Then the reaction is continued at 50°C for overnight. After the
reaction time, the model compound derivatives are recovered using EtOAc extraction and successive
solvent evaporation. Lignin samples undergo the same reaction conditions whereas the derivatized
products are recovered by precipitation in diethyl ether (Barrelle et al., 1992; Barrelle, 1995). The
detailed experimental conditions are given in the Materials and Methods Chapter (CHAPTER 2).
The schematic diagram (shown in Figure 4.1) briefly describes the fluorobenzylation of hydroxyl
groups of lignin and their conversion into corresponding fluorobenzylated derivatives. Both aliphatic
and hydroxyl groups are likely to be derivatized. To investigate the derivatization extend, two NMR
techniques, 13C and 19F NMR, have been performed before and after derivatization.

121
Figure 4.1. Schematic reaction of lignin fluorobenzylation (Cl-R-F: 4-Fluorobenzylchloride,
Lig=Lignin).
Five different lignin like model compounds (illustrated in Figure 4.2) have been considered. They
were chosen based on the hydroxyl groups location which could be found in lignins. Vanillin (1) and
Acetovanillone (2) attribute a phenolic hydroxyl group with a carbonyl function in α position
(aldehyde and ketone respectively). Guaiacol (3) is the basic phenolic unit of lignin. Vanillyl alcohol
(4) consists of both aliphatic and aromatic hydroxyl groups, and Veratryl alcohol (5) contains only
one aliphatic hydroxyl group. A model of carbohydrate, D(+) Cellobiose (6), was also considered
because commercial lignins are usually contaminated by sugars containing hydroxyl groups (primary
and secondary OH) which may also undergo derivatization.
Figure 4.2. Studied model compounds: Vanillin (1), Acetovanillone (2), Guaiacol (3), Vanillyl
alcohol (4), Veratryl alcohol (5) and D(+) Cellobiose (6)
In addition to study the lignin fluorobenzylation reaction, the chemical shift assignments given by
Barrelle in his former works to quantify phenolic and aliphatic hydroxyl groups and carbonyl groups
will be verified (Barrelle et al., 1992; Barrelle, 1993, 1995). Indeed, earlier development of 19F NMR
studies was based on spectral folding, leading to possible wrong chemical shifts assignments and
sometimes to reverse shaped signals. Considering the current NMR technological development that
can now examine the whole spectral window, the present study proposes to re-investigate the 19F
NMR analysis in the context of lignin characterization. During our analysis on model compounds, the 19F NMR chemical shift assignments given by Barrelle will be confirmed.

122
4.3. Lignin model compounds fluorobenzylation followed by HPLC analysis
Qualitative HPLC analyses have been performed to verify the derivatization of the lignin model
compounds. The model compounds, before and after derivatization, have been analyzed using the
conditions given in the Materials and Methods chapter.
The retention time of Vanillin (1) was found at 29.32 min and after derivatization, the signal
intensity was significantly reduced. It confirms that most of the vanillin has reacted. Similarly, pure
Acetovanillone (2), Guaiacol (3) and Vanillyl alcohol (4) were eluted at 40.62 min, 39.42 min and
12.17 min respectively and after fluorobenzylation, no signal was recorded. These results confirm that
these model compounds reacted with FBC, the fluorobenzylated agent and that no more pure
compounds were present. As far as Veratryl alcohol (5) is concerned, before derivatization the model
compound was eluted at 28.38 min. After the fluorobenzylation, the same elution time was observed
without any reduction in intensity meaning that the Veratryl alcohol probably exhibits a poor
reactivity towards the fluorobenzylation reaction. Unfortunately, the fluoroderivatives did not give
any signal, probably because the HPLC analysis conditions (column and eluent) were not suited to
these less polar compounds.
As an example, the HPLC chromatogram before and after fluorobenzylation derivatization of
acetovanillone is presented in Figure 4.3. Pure acetovanillone provided a signal at a retention time of
40.62 min, whereas fluorobenzylated acetovanillone did not show any signal at this retention time.
This confirms the derivatization
Figure 4.3. HPLC chromatogram of acetovanillone (orange) and fluorobenzylated-acetovanillone
(blue)
-20
-10
0
10
20
30
40
50
60
70
38 39 40 41 42 43
Ab
sorb
an
ce(m
AU
)
Retention time(min)
Acetovanillone pure
FB Acetovanillone

123
4.4. NMR analysis of fluorobenzylated model compounds
4.4.1. 13C NMR analysis
First the derivatization reagent FBC and all the fluorobenzylated model compounds and their
reaction products after fluorobenzylation have been analyzed by both 19F and 13C NMR in the same
way using a quantitative mode. An example of typical fluorobenzylation reaction is shown in Figure
4.4.
Figure 4.4. Fluorobenzylation reaction of lignin
The following methodology has been adopted to study the fluorobenzylation: after the reaction,
distilled water and ethylacetate (EtOAc) were added to quench the reaction. The products of the
organic phase were recovered and dried without any purification. After freeze-drying, the products
were first analyzed by 19F NMR. After 19F signals detection, 13C NMR analysis was employed to
confirm, or not, that the F nucleus belongs to the lignin model derivative. This allows elucidating the
structure of the derivatized compounds and detecting all possible non-fluoro substituted products. The
chemical shifts and the specific hyperfine structures due to nJCF couplings were used for determining
the presence or not of F-(para-fluoro phenyl ring originating from FBC) structure. A
complementary DEPT sequence gives access to the unambiguously assignment of the CH2’ carbons
(present in different environments) (Figure 4.5), and the examination of their specific chemical shifts
enables to ascertain the occurrence of the fluoro derivatization (or not).

124
Figure 4.5. Structure and number assignment of fluorobenzylated lignin model compounds
Table 4.1 presents the 13C NMR chemical shift assignments of the methylene group located
between FBC and the model (Figure 4.5), of the different products recovered after the lignin model
compound derivatization.
Table 4.1.13C NMR chemical shifts of FBC -CH2’ group (Figure 4.5) of products present in the
medium after lignin model compound derivatization
c (in ppm) 45.3 57.54 62-63 69-71 72.81
Methylene group -CH2Cl -CH2N -CH2OH -CH2OR -CH2OMe
Compounds FBC NBu Aliphatic OH FBOH (a)
F-derivatized compounds FBOMe (b)
(a) FBOH: resulting product from the reaction of FBC with water. (b) FBOMe: resulting product from the reaction of FBC with MeOH (solvent of NBu)
The methylene group of FBC, (CH2Cl), and that of N-Bu (CH2N) were detected at 45.3 ppm and
57.54 ppm respectively in relation with the nature of the heteroatom (Cl or N). The FBC reagent could
react with water (from moisture) and/or methanol (present in NBu reagent) to form FBOH and/or
FBOMe. Their corresponding signals were seen in the range of 62-63 ppm and 72.81 ppm
respectively. Finally, the corresponding fluoroderivatized model compounds CH2OR signals were in
the range of 69-71 ppm.
To study the reactivity of the fluorobenzylation reaction on lignin model compounds, the reaction
products were not purified prior to the 13C NMR analysis. The reaction medium contained a mixture

125
of products such as the unreacted starting model compounds, fluorobenzylated model compounds (F-
derivatized compound), remaining pure reagent (FBC) and by products FBOH (produced by the
reaction of FBC with H2O) and FBOMe (produced by the reaction of FBC with MeOH). To quantify
each component at the end of the fluorobenzylation in the reaction medium, the total composition
inside the NMR tube was considered as 100%. Then a quantitative 13C NMR analysis was performed
on the reaction medium which remained perfectly homogeneous during the analysis time. In this way,
the ratio of each present moiety formed during the reaction could be determined (Table 4.2). The
fluorobenzylation reagent FBC purity was controlled by taking blank 13C NMR spectrum.
Table 4.2. Mixture ratio of products obtained after the model compound fluorobenzylation, calculated
from 13C NMR data (organic part)
Compounds Fluorobenzylation
YIELD, %
MIXTURE COMPOSITION
Unreacted
starting compound, %
F-derivatized Compound, %
FBC reagent, %
FBOH,
%
FBOMe,
%
NBu,
%
1 100 - 93.6 6.4 - - -
2 100 - 81.3 5.2 - 8.3 5.2
3 100 - 67.6 24.5 - 4.1 3.8
4 100 - 34.0 53.9 Traces 10.1 -
5 9 71.5 7.1 - Traces - 21.4
6 - - - - 74.0 - 26
FBC blank 94.1 - - 5.9 - -
FBC
reacted
- - - 7.9 - 92.1
According to 13C results, FBC contains 94.1% of pure FBC and 5.9% of FBOH. Similarly, a “FBC
blank reaction” was carried out with all the reagents except the model compound. After reaction,
7.9% of FBOH and 92.1% of NBu reagent have been recovered. No starting FBC signal has been
detected (Table 4.2): this clearly shows that the FBC reagent was totally converted into FBOH.
For lignin and carbohydrate model compounds, the fluorobenzylation yield could be calculated by
the following relation, Yield = (F-derivatized compound / (Unreacted pristine compound + F-

126
derivatized compound)) × 100. Results are given in Table 4.2. Moreover, the detailed 13C NMR
chemical shifts assignment of the fluoroderivatives is given in Table 4.3.
Table 4.3. 13C NMR Chemical shifts (in ppm) of fluorobenzylated model compounds (C numbering
according to Figure 4.5)
Compounds 1 2 3 4 5
Model
compounds
Part
C1 129.8 130.14 120.59 135.75 130.61
C2 109.9 110.4 112.22 110.76 110.51
C3 149.4 151.88 149.23 149.05 148.65
C4 153 148.79 147.66 146.38 148.30
C5 112.6 112.27 113.88 113.66 111.51
C6 125.8 122.92 121.25 118.45 120.04
OCH3 55.53 55.51 55.44 55.39 55.38 55.46
C=O - 196.2 - - -
HC=O 191.34 - - - -
CH2 (α) - - - 62.76 71.36
CH3 - 26.31 - - -
FBC part
C’H2 69.28 69.15 69.15 69.33 70.33
C’4 132.5 132.74 133.44 133.54 134.71
4JCF (Hz) 2.84
C’3,C’5 130.2 130.14 129.92 129.85 129.57
3JCF (Hz) 9.2
C’2,C’6 115.3 115.29 115.15 115.15 115.40
2JCF (Hz) 21.45
C’1 161.98 161.88 161.7 161.72 161.56
1JCF (Hz) 243

127
As seen in Table 4.2, it is interesting to note that the conversion achieved 100% with the lignin
model compounds (1), (2) and (3), containing only phenolic hydroxyl groups.
In the case of Vanillyl alcohol (4) bearing both phenolic and aliphatic hydroxyl groups, the
absence of starting model compound shows that its conversion was 100% (Table 4.2). Three different
compounds were found in the reaction mixture (shown in Figure 4.6): FBC, with its methylenic
carbon at 45.3 ppm, was the most abundant product (53.9%); FBOMe, issued from the reaction of
methanol with FBC, with its methyl group at 57.40 ppm and its methylenic carbon at 72.81 ppm,
represented the minor part (11%); and finally the fluoroderivatized Vanillyl alcohol was present at
35%. From these results, it could be concluded that the fluorobenzylation conversion of lignin
phenolic hydroxyl group was quite quantitative, as already seen with previous lignin model
compounds (1, 2 and 3). However, the remaining signal at 62.76 ppm corresponding to the methylene
carbon covalently bonded to the free aliphatic hydroxyl –CH2OH group and the absence of signal at
71 ppm corresponding to the –CH2OR aliphatic fluoroderivatized group shows that the conversion is
due solely to the phenolic hydroxyl (Table 4.3), with no reaction of the aliphatic hydroxyl group. This
is also confirmed by the integral measurements: the signal integrals of carbons belonging to the model
compound part display the following values: 0.34, 0.31 and 0.29 corresponding to –OCH3 (55.39
ppm), C1 (135.75 ppm) and CH2α (62.76 ppm), respectively. The integral of the C signal belonging to
the FBC part display the following values: 0.32, 0.32 and 0.77 corresponding to CH2’ (69.33 ppm),
C’4 (133.56 ppm) and C’3 and C’5 (129.87 ppm), respectively. This confirms unambiguously that
there is only one FBC moieties per model compound. So, the fluorobenzylation took place on the free
phenolic group only, without any reaction on the primary aliphatic hydroxyl function.

128
Figure 4.6. 13C-NMR spectra of the mixture issued from the fluorobenzylation of Vanillyl alcohol (4)
in DMSO-d6.
For the Veratryl alcohol (5), bearing only one aliphatic hydroxyl and no phenolic group, three
products were found (Table 4.2, Figure 4.7 and Table 4.3): the unreacted starting Veratryl alcohol,
with the –CH2OH and C1 signals respectively at 62.74 ppm and at 135.13 ppm, has been recovered in
the largest quantity (71.5%); then 21.4% of butyl ammonium (NBu) was found with its characteristic
signals at 13.46, 19.22, 23.09 and 57.54 ppm. This last signal, very close to the chemical shift of the
FBOMe methyl group (57.39 ppm), displayed a CH2 multiplicity (given with the DEPT sequence),
instead of CH3 multiplicity expected in the case of FBOMe, which confirmed undoubtedly the
assignment of this signal to the butyl ammonium moiety. Finally, the fluoroderivatized Veratryl
alcohol has been recovered as minor compound (7.1%). Its presence was confirmed with the
characteristic signal of the FBC part, and the chemical shifts modifications of –CH2-OR at 71.36 ppm
and of C1 at 130.61 ppm. Thus, the fluorobenzylation yield of the Veratryl alcohol (5), containing
only one aliphatic hydroxyl group, was found very low, about 9%, and most of the starting model
compound remained unchanged, which again suggests that aliphatic hydroxyls hardly react with FBC.
Moreover, no more FBC remained after the reaction.
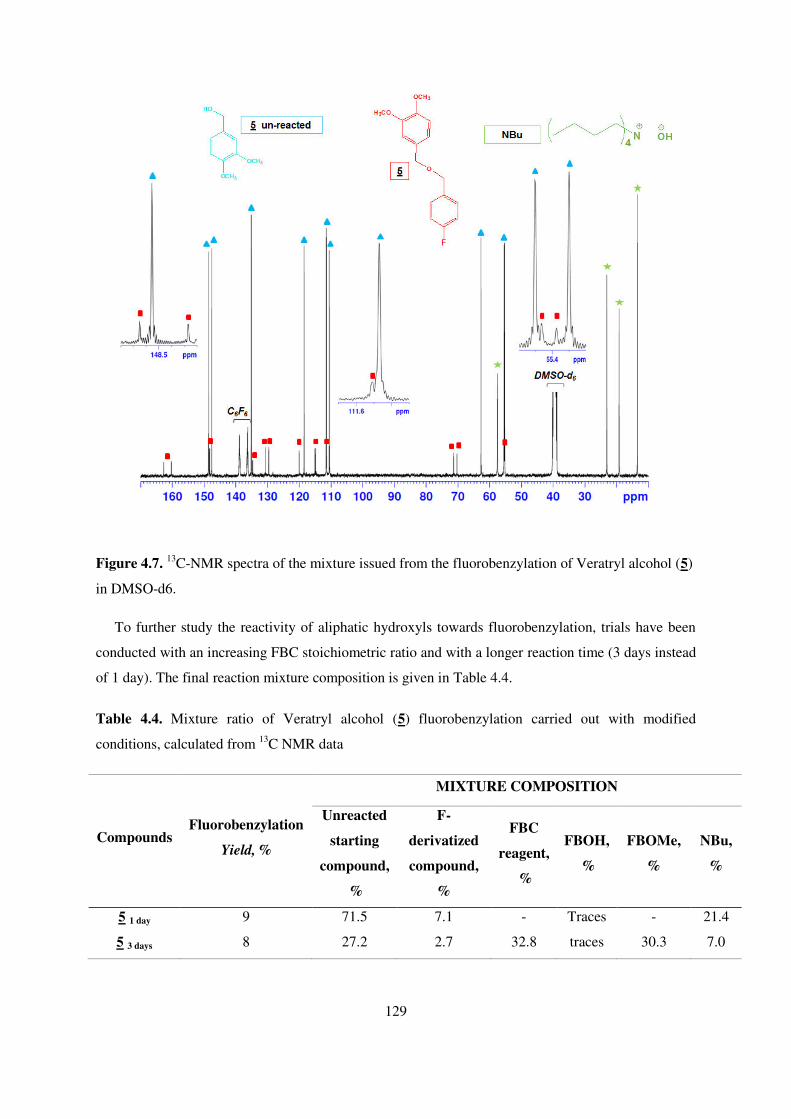
129
Figure 4.7. 13C-NMR spectra of the mixture issued from the fluorobenzylation of Veratryl alcohol (5)
in DMSO-d6.
To further study the reactivity of aliphatic hydroxyls towards fluorobenzylation, trials have been
conducted with an increasing FBC stoichiometric ratio and with a longer reaction time (3 days instead
of 1 day). The final reaction mixture composition is given in Table 4.4.
Table 4.4. Mixture ratio of Veratryl alcohol (5) fluorobenzylation carried out with modified
conditions, calculated from 13C NMR data
Compounds Fluorobenzylation
Yield, %
MIXTURE COMPOSITION
Unreacted
starting
compound,
%
F-
derivatized
compound,
%
FBC
reagent,
%
FBOH,
%
FBOMe,
%
NBu,
%
5 1 day 9 71.5 7.1 - Traces - 21.4
5 3 days 8 27.2 2.7 32.8 traces 30.3 7.0

130
These new derivatization conditions did not change the fluorobenzylation yield which remained
below 10%. In addition, a high quantity of FBC did not react and methanol fluorobenzylation
(methanol is the solvent of the added butyl ammonium) has been observed. As a conclusion, it is
evident that the fluorobenzylation was more efficient with phenolic hydroxyl than with primary
aliphatic hydroxyl groups. Therefore, the derivatization reaction conditions should be improved to get
access to all primary aliphatic hydroxyls.
As commercial lignins are usually contaminated by carbohydrates, also containing hydroxyls, the
D(+) cellobiose (6) was used as a sugar model compound. It was submitted to fluorobenzylation in the
same conditions as for the lignin models. The composition of the organic phase recovered after the
reaction is given in Table 4.6. The results revealed that no fluorinated product could be identified as
well as for the starting carbohydrate model compound. Only N-butyl ammonium (26%) and FBOH
(74%) have been detected. Because sugars are water soluble, the aqueous phase was also analyzed.
Results show that the aqueous phase reaction mixture contained only the starting cellobiose (10%)
and NBu reagent (90%) (Table 4.5). Considering that the total composition inside the NMR tube was
100%, the starting cellobiose (6) remained unchanged after the reaction. This clearly indicates that
hydroxyls of carbohydrates could not be fluorobenzylated. Therefore, lignin contamination by sugar
will not interfere with the 19F NMR analysis of fluorobenzylated lignins.
Table 4.5. Mixture ratio of products obtained after cellobiose (6) fluorobenzylation, calculated from 13C NMR data after analysis of the organic and aqueous phases
Compounds
MIXTURE COMPOSITION
Unreacted
starting
compound, %
F-
derivatized
Compound
FBC
reagent, % FBOH, % FBOMe, % NBu, %
6 Organic phase - - - 74 - 26
6 Aqueous phase 10 - - - - 90
After 13C NMR analysis, 19F NMR analysis has been performed. Results are presented in the
following section.
4.4.2. 19F NMR analysis
The reaction medium, obtained after the fluorobenzylation of the model compounds and
containing a mixture of different products, has been also analyzed by 19F NMR. According to 19F
NMR experiments, only fluorinated compounds can be detected, hence no signal for the starting
material, neither NBu, could be detected. So, the reaction mixture composition, expressed in %,
exhibits some differences between 13C and 19F NMR data.

131
19F NMR analysis results are presented in the Table 4.6 and Table 4.7 and the corresponding NMR
signals of fluorinated compounds are illustrated in Figure 4.8.
Table 4.6. Conversion rate and mixture ratio of model compound fluorobenzylation, calculated from
19F NMR data
Compounds
F-Compound
Conversion
Rate, %
MIXTURE COMPOSITION
F-derivatized
compound, %
FBC
reagent, % FBOH, % FBOMe, %
1 100 94.5 5.5 - -
2 100 86.3 6.3 - 7.4
3 100 72.3 23.3 - 4.4
4 98 38.8 55.9 1.1 10.2
5 16 89.7 - 10.3 -
6 0 - - 100 -
FBC - 99.9 - 0.1 -
FBC reacted - - - 100 -
Table 4.7. 19F NMR chemical shifts (in ppm) of fluorobenzylated model compounds
Compounds F (ppm) Nature
1 -116.36 -OH + Aldehyde ()
2 -116.49 -OH + Ketone ()
3 -116.89 -OH
4 -116.99 -OH
5 -117.50 CH2OH
6 - CH2OH
MeOF -117.49 CH3OH
FBC (blank) -115.85 CH2Cl
FBOH -118.7 CH2OH

132
Vanillin
Acetovanillone
Guaiacol
Vanillylalcohol

133
Figure 4.8. 19F-NMR spectra of fluoroderivatized model compounds. From top to bottom: Vanillin,
Acetovanillone, Guaiacol, Vanillyl alcohol and Veratryl alcohol.
From 19F NMR results, it could be seen that all the phenolic hydroxyl groups of 1, 2, 3 were
quantitatively fluorobenzylated giving signals at -116.36 ppm, -116.49 ppm and -116.89 ppm
respectively. Concerning the model compound 4, containing both aliphatic and phenolic OH, 19F
NMR confirmed that the conversion took place only in the phenolic region (-116.99 ppm) since no
peak has been detected in the aliphatic region. The 98% conversion rate comes from the derivatization
of the phenolic hydroxyl group alone. The aqueous phase has also been analyzed but no 19F signal
could be detected which confirmed that only phenols could be fluorobenzylated in the studied
conditions.
For the model compound 5, containing only one aliphatic hydroxyl group, after a reaction time of
one day, the conversion rate was very low, around 16% (Table 4.6). The signal of the detected
fluoroderivatized compound is assigned at -117.50 ppm (Table 4.7). Even after a longer reaction time,
Veratrylalcohol

134
3 days (Table 4.8), F-derivatized compound conversion rate did not increase; and simultaneously the
byproduct quantity rose, confirming the 13C NMR results: aliphatic hydroxyls are poorly reactive.
Table 4.8. Conversion rate and mixture ratio of Veratryl alcohol (5) fluorobenzylation carried out
using modified operating conditions, calculated from 19F NMR data
Compounds
F-Compound
Conversion
Rate, %
MIXTURE COMPOSITION
F-derivatized
compound
FBC
reagent, % FBOH, % FBOMe, %
5 1 day 16 89.7 - 10.3 -
5 3 days 12 4.9 46.0 0.6 48.5
In the case of cellobiose (6) (Table 4.6 and Table 4.7), no 19F signal could be detected in both
aqueous and organic phases. Moreover, it can be seen that the organic phase contained 100% of
FBOH originating from the reaction between FBC and water. The result is consistent with 13C NMR
data: hydroxyl groups of carbohydrates are not reactive.
Table 4.9. Conversion rate and mixture ratio of cellobiose (6) fluorobenzylation, calculated from 19F
NMR data after analysis of the organic and aqueous phases
Compounds
F-Compound
Conversion
Rate, %
MIXTURE COMPOSITION
F-derivatized
compound, %
FBC
reagent, % FBOH, % FBOMe, %
6 Organic phase 0 - - 100 -
6 Aqueous phase 0 - - - -
After studying the fluorobenzylation yield of lignin hydroxyl groups, the 19F NMR chemical shift
assignments given by Barelle (Barrelle et al., 1992; Barrelle, 1993, 1995) have been controlled since
working on folding spectra may have induced wrong assignments. It is pointed out that the whole
spectral window has been examined in this study. From the presented 19F NMR chemical shifts for all
investigated fluoroderivatized model compounds, it is clearly seen that the general shape of the signal
agrees with the work of Barrelle. Chemical shifts from -115 ppm to -117.3 ppm correspond to the
phenol group region, whereas poor reactive (16% in the total conversion in the case of veratryl
alcohol) primary aliphatic hydroxyl groups give signal between -117.3 ppm to -118.5 ppm. Moreover,
in the phenol region, phenol with a C=O in α position could be distinguished since they lead to
chemical shifts between -116.2 ppm to -116.6 ppm, which again falls in agreement with the
observations of Barrelle.

135
To conclude, 13C and 19F NMR results are in agreement with HPLC analyses and confirmed that
the conversion of phenolic hydroxyl of (1), (2), (3), and (4) model compounds was fully achieved
whereas the Veratryl alcohol (5) conversion was poor. Therefore, the results clearly establish that
fluorobenzylation is fully efficient on phenolic hydroxyl groups and less efficient on aliphatic
hydroxyls, and that no reaction occurs with saccharides.
4.4.3. Hydroxyl groups quantification of the technical ORG- lignin by 19F NMR
Based on model compounds reactivity towards fluorobenzylation, lignin derivatization and
solubility has been controlled. The commercial organosolv lignin sample (ORG) from CIMV
Corporation (France) has been analyzed using 19F NMR after fluorobenzylation. The 19F NMR
spectrum is given in Figure 4.9. Signal assignment was made with the help of the lignin model
compounds 19F NMR spectra. The finest signal at -118.7 ppm was assigned to FBOH originating from
the reaction of FBC with water. As seen from the previous sections, signals between -117.3 to -118.5
ppm were associated to aliphatic hydroxyl groups present in the lignin. Aromatic hydroxyl groups
region were assigned from -115 to -117.3 ppm in which a part of signal (-116.2 to -116.5 ppm)
corresponds to the existence of compounds containing α C=O group and -115.8 ppm was assigned for
FBC. The 19F NMR spectrum of analyzed model compounds clearly established the assignment of
ORG lignin which therefore can be used for understanding other lignin samples.
Figure 4.9. Comparison of 19F-NMR spectra of fluorobenzylated ORG lignin (in blue) and
derivatized model compounds. (Note: Only phenol derivatization for 4).
After 19F NMR signal assignment, OH function quantification has been done by integrals
comparison with an internal standard, the 2-fluoroacetophenone exhibiting a signal at -112.86 ppm.

136
According to 19F NMR quantification, the ORG lignin contains 1.71 mmol of phenolic hydroxyl
groups per gram of lignin and 0.120 mmol of primary aliphatic hydroxyl groups per gram of lignin.
The phenolic hydroxyl group result is in the same order as those obtained using the Fast method (1.5
mmol/g) , UV method (1.7 mmol/g) and 13C NMR after lignin acetylation (2 mmol/g). However
aminolysis method overestimated the phenolic hydroxyl group with a quantity of 2.4 mmol/g lignin
(Serrano Cantador et al., 2018). This confirmed that 19F NMR is a robust method for phenolic
hydroxyl group quantification in lignins.
4.5. Solubility of fluorobenzylated ORG lignin
In this section, the interest of the fluorobenzylation reaction to enhance lignin dissolution prior to
size exclusion chromatography (SEC) analysis for lignin molar mass determination is investigated.
Indeed free phenolic and aliphatic hydroxyl groups present in the lignin macromolecules increase
their polarity and limit their solubility in SEC solvents, either non-polar or partially polar (like THF,
DMF or DMAC), due to the formation of aggregates through intermolecular interactions of hydroxyl
groups (Sarkanen et al., 1981, 1984; Pellinen and Salkinoja-Salonen, 1985a). To overcome such a
difficulty, acetylation is usually performed prior to lignin SEC analysis despite some limitation as an
incomplete reaction and aggregates formation. Moreover, acetylation requires long reaction time
(Baumberger et al., 2007) to achieve maximum derivatization and even after acetylation, derivatized
lignins may not be fully soluble in THF (Asikkala et al., 2012). Incomplete lignin solubility in
chromatographic solvents is a major source of error in SEC analysis. Compared to acetylation, the
reported fluorobenzylation is easy to handle. In addition, the substitution of hydroxyl functions by
fluorobenzyl groups should decrease the polarity of the macromolecule due to the addition of
aromatic non-polar fluorobenzyl unit better than acetyl group (acetylation) for polarity reduction and
thus increase significantly the solubility in SEC non polar solvent (THF).
The solubility in THF has been examined on the fluorobenzylated ORG lignin using UV
spectrophotometry and compared with acetylated and underivatized lignins. Un-derivatized and
derivatized lignins were dissolved in THF (5mg/mL). After 1h of dissolution time, the solutions were
filtered using a 0.45µm PTFE filter to remove insoluble particles. Then the filtrate was diluted up to
25mL using THF before UV analysis. Underivatized, acetylated and fluoroderivatized ORG lignins
were dissolved at the same concentration in THF and analyzed by UV spectrophotometry at a
wavelength close to 280 nm, in the region of maximum light absorption by lignin (Figure 4.10).
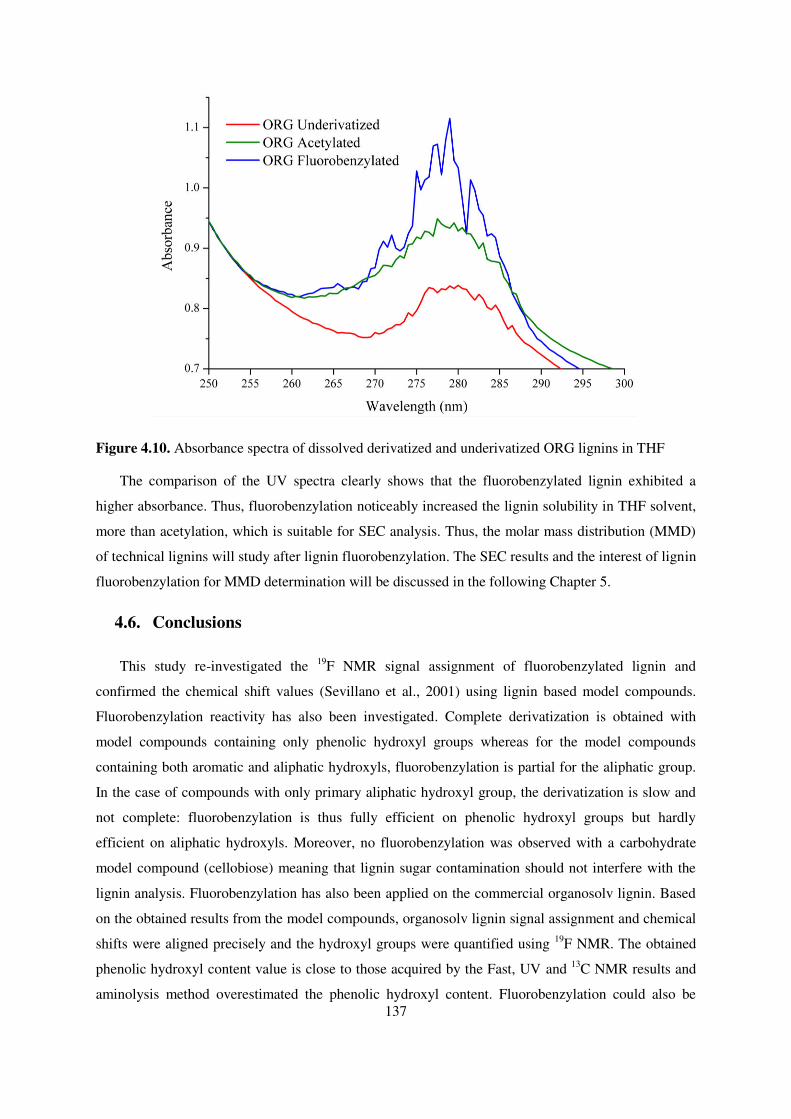
137
Figure 4.10. Absorbance spectra of dissolved derivatized and underivatized ORG lignins in THF
The comparison of the UV spectra clearly shows that the fluorobenzylated lignin exhibited a
higher absorbance. Thus, fluorobenzylation noticeably increased the lignin solubility in THF solvent,
more than acetylation, which is suitable for SEC analysis. Thus, the molar mass distribution (MMD)
of technical lignins will study after lignin fluorobenzylation. The SEC results and the interest of lignin
fluorobenzylation for MMD determination will be discussed in the following Chapter 5.
4.6. Conclusions
This study re-investigated the 19F NMR signal assignment of fluorobenzylated lignin and
confirmed the chemical shift values (Sevillano et al., 2001) using lignin based model compounds.
Fluorobenzylation reactivity has also been investigated. Complete derivatization is obtained with
model compounds containing only phenolic hydroxyl groups whereas for the model compounds
containing both aromatic and aliphatic hydroxyls, fluorobenzylation is partial for the aliphatic group.
In the case of compounds with only primary aliphatic hydroxyl group, the derivatization is slow and
not complete: fluorobenzylation is thus fully efficient on phenolic hydroxyl groups but hardly
efficient on aliphatic hydroxyls. Moreover, no fluorobenzylation was observed with a carbohydrate
model compound (cellobiose) meaning that lignin sugar contamination should not interfere with the
lignin analysis. Fluorobenzylation has also been applied on the commercial organosolv lignin. Based
on the obtained results from the model compounds, organosolv lignin signal assignment and chemical
shifts were aligned precisely and the hydroxyl groups were quantified using 19F NMR. The obtained
phenolic hydroxyl content value is close to those acquired by the Fast, UV and 13C NMR results and
aminolysis method overestimated the phenolic hydroxyl content. Fluorobenzylation could also be

138
successfully applied prior to lignin dissolution for SEC analysis since fluorobenzylation increased the
solubility of the macromolecule. The detailed SEC results will be discussed in the following chapter.

139
CHAPTER
5
5. A new universal calibration method for lignin
size exclusion chromatography (SEC) analysis
using novel chemical derivatization methods
5.1. Introduction
Molar mass distribution (MMD) is considered the key parameter to understand the reactivity and
physiochemical properties of lignin in order to find the alternate way for substituting petrochemical
based aromatic compounds (Pellinen and Salkinoja-Salonen, 1985a; Baumberger et al., 2007). For
instance, lignin molecule can be used for polymer synthesis applications, but the exact MMD of the
lignin sample should be known prior to use (El Mansouri and Salvadó, 2006). Various techniques
have been employed to determine the weight-average molar mass of polymers, Mw, and the number-
average molar mass of polymers, Mn, such as light scattering, ultra-centrifugation, membrane
filtration, mass spectrometry and pulse-field gradient NMR spectroscopy, and some of these methods
have been applied to lignin. In principle, crossing some of these methods should help to determine the
real molar mass distribution (MMD) of lignin, but still, a large area of uncertainty remains, and some
of these techniques are not accessible for routine experiments.
In recent decades, size-exclusion chromatography (SEC) has become the most popular analysis for
determining the MMD of various polymers, and it has also been applied for lignin analysis for several
decades. The principle of SEC is size separation of macromolecules at different elution time in a
column filled with a nanoporous gel, using a suitable, non-interacting solvent as eluent.
Complementary to SEC separation, a series of in-line detectors such as UV-visible spectrometer,
differential refractometer (DRI), light-scattering (LS) detector, viscometer and fluorescence detector
can be placed in-line at the end of the column set, which enables to calculate the MMD independently
without relying on the column standard calibration. In general, these detectors also provide
complement information to the SEC chromatogram, qualitatively and quantitatively, regarding MMD

140
and others parameters, such as functional groups content, fluorescent properties, intrinsic viscosity,
hydrodynamic radius, gyration radius, which are typical parameters depending of the polymer nature
and configuration in the solvent used.
The simplest SEC analysis uses the principle of standard calibration and requires the presence of
only in-line concentration detectors, generally UV-visible spectrophotometer or differential
refractometer (DRI). Monodisperse polymer standards dissolved in the eluent are used to build a
standard calibration curve, which is a linear plot of (log M) as a function of the sample retention time
(RT) – or its elution volume (Vr). Unknown polymer sample mass is then calculated from the
retention time (RT) in the column. However, in the case of lignin, no standard is commercially
available. This is why other polymers standards like polystyrene are often used, which makes
quantification inaccurate. Another drawback of methods based on RT only is the phenomenon of flow
dispersion through columns, valves and tubing, which is a cause of peak enlargement. Mathematical
corrections are theoretically possible to account for this, with more or less accuracy.
To overcome these drawbacks, molar mass detectors have been added in-line, typically light-
scattering (LS) detector or viscometric detector. The former measures the static scattered light
intensity and by coupling this information with polymer concentration determined by the DRI, the
value of Mw is derived, applying Lord Rayleigh’s theory. The latter measures the differential pressure
between two flow paths in capillaries, one with a higher viscosity containing the polymer in solution,
the other containing the pure solvent. Again coupling with the DRI measurement, the polymer
intrinsic viscosity is determined as being equal to the specific viscosity calculated at the very low
concentration used for these measurements. Both of these coupling techniques, DRI-LS and DRI-
viscometry have been slowly developed in-line to SEC for various polymer applications during the
last 40 years.
The system used in our laboratory is illustrated in Figure 5.1 below.

141
Figure 5.1. A schematic diagram of SEC setup for molar mass distribution, intrinsic viscosity and
hydrodynamic radius measurement equipped with several detectors
In principle, LS detector coupled to DRI allows an exact quantification of the molar mass provided
the solvent refractive index (n) and the refractive-index increment (dn/dC) of the polymer-solvent
system are both accurately known. This is generally not a difficulty, since the dn/dC can be easily
determined by injecting a pure polymer sample (mono- or polydisperse) at a known concentration and
integrating the DRI signal. A main condition is that the polymer should not be retained in the column.
Unfortunately, in the case of lignin analysis, the DRI-LS coupling method exhibits poor
applicability, since several conditions are not satisfied: molecules should be non-light-absorbing, non-
asymmetric and non-fluorescent, which is not the case of lignin. Recently, technical progress arose on
classical apparatuses: (1) the availability of fluorescent filters; (2) possibilities of light-absorption
correction using the signal of one diode in a MALS instrument (Wyatt Co.), and (3), use of polarized
light. In theory, corrections of this type should render possible the use of DRI-LS in the case of lignin.
But in France, this technique (from Wyatt Co.) is presently available in only one academic laboratory,
and there is no current information on the instrument precision in the case of lignin.
As already mentioned, UV-viscometry has also been proposed (Chum et al., 1987; Himmel et al.,
1989) as another possible in-line detection technique for lignin analysis. It allows to establish a so-
called “universal calibration curve”, following the well-known theory established by Benoit et al.

142
(1966). In this method, standard polymers of known mass M and intrinsic viscosity [] (in fact the
specific viscosity measured at very low polymer concentration) are eluted through the column. The
curve of Ln (M×[]) versus RT is then constructed, with the noticeable particularity that it should
follow a unique straight line for different kind of polymers with rather proximate space
configurations, when pure exclusion by apparent volume takes place (ideal behavior). This straight
line is called “universal calibration curve”. This holds if the hydrodynamic principle of separation
applies correctly. Then, simply measuring the RT and [] value of an unknown polymer, like lignin,
allows the calculation of its molar mass, using the universal calibration curve established with other
types of polymers for which standards are available.
Numerous SEC studies have been conducted for different lignin samples and model compounds in
different media, aqueous or organic, with different polarities (Pellinen and Salkinoja-Salonen, 1985b;
Stenlund, 1976). Aqueous SEC is made in alkaline conditions (NaOH), in which lignin dissolves
rather well. The advantage is that rather rapid dissolution is obtained, and no pre-derivatization is
required. Aqueous media is applied for strong hydrophilic lignin, for example, lignosulfonates.
Sarkanan et al. (Sarkanen et al., 1981, 1982) reported the use of mixed Sephadex G gel with 0.1 M
NaOH to determine the MMD of lignins. Similarly, various authors used water and dioxane mixture
with Sephadex G gel and LH gel to analyse lignin-related materials. However, typically, the acidic
groups (phenolic and carboxylic groups) present in the lignin dissociate at high pH and thus form
polyelectrolytes. This greatly influenced lignin performance in aqueous SEC. Various factors affected
the elution behaviour, such as molecule expansion, ion exchange, ion exclusion, ion inclusion and
even adsorption (Barth, 1980). These factors lead to delayed sample elution and obtaining a narrow
distribution was difficult. For this reason the use of aqueous GPC has been much discussed (Chen and
Li, 2000). Rather recently, Gosselink et al. reported that in aqueous SEC, the use of hydrophilic TSK
gel (Toyopearl HW-55(F)) and 0.5 M NaOH as eluent would minimize ionic interactions and
adsorption to the column.
In organic SEC systems, two kinds of organic media or eluent have been used: either polar organic
solvents, or non-polar solvents (THF, chloroform, toluene). In the former case, dimethysulfoxide
(DMSO), dimethyformamide (DMF) and dimethylacetamide (DMAc) are mostly reported, and in the
latter case, THF as the most popular non-polar solvent used in SEC. Using polar solvents enables
direct lignin dissolution without the requirement of derivatization. However, some association effects
remain and this phenomena can be partially reduced by adding lithium salts (LiCl, LiBr) (Chum et al.,
1987). Lignosulfonates, Kraft lignin, alkali lignin, steam explosion and Organosolv lignin samples
can be analysed with this system (Gosselink et al., 2004; Ringena et al., 2006). Using THF requires
derivatization of polar functions (Gellerstedt, 1992). The solubility of lignin in the eluent is also much
increased thus inhibiting aggregation or association effects. This particular method is assumed to be

143
the most efficient and reliable, because of good sample dissolution and stability in the solvent, and
narrow distributions can be obtained. Several derivatized lignin samples, such as Milled-Wood-Lignin
(MWL), Organosolv lignin, Kraft lignin, Steam-explosion lignin have been accurately analysed using
organic THF system (Baumberger et al., 1998; Faix and Beinhoff, 1992; Kubo et al., 1996; Thring et
al., 1996). Although, this method has several advantages, the main drawback is the requirement of
derivatization that might present conditions for partial degradation or selective recovery of the
polymer, depending on size of the recovered fractions. Reaction conditions and lignin recovery by
evaporation and/or precipitation should thus be optimized to overcome such issues.
As mentioned before, the effects of polymer association, due to lignin polar interactions, have been
studied by several researchers (Lindström, 1979, 1980; Sarkanen et al., 1981, 1982, 1984; Cathala et
al., 2003; Connors et al., 1980; Norgren et al., 2002). Such behavior increases LS and viscometric
signals, leading to overestimation of the molar mass. The formation of association complexes
dominates in the case of underivatized lignins in a variety of solvents, including non-aqueous solvents
(DMF, DMSO, THF) and water-NaOH. In non-aqueous solvents without added electrolyte, the
formation of such complexes can increase the molar mass by as much as three order of magnitude
(Tolbert et al., 2014). Lignin-carbohydrate complexes are also present, and the elution properties of
low molar mass carbohydrates in Sephadex G25/dioxane-water (1:1) and Sephadex LH 20/DMF were
affected by the existence of aromatic groups in lignin-carbohydrate complexes, which cause
retardation due to adsorption effects (Kristersson et al., 1983). Similarly, the adsorption forces
between gel and lignin molecule, polarity and poor solubility issues led to elution retardation and
apparent underestimation of the molar mass (Chum et al., 1987). Lignin association in DMSO or
DMF can be avoided by improving solvation of the sample molecules and by forming H-bonds with
electrolytes (Brown, 1967; Connors et al., 1980; Kristersson et al., 1983). The addition of LiCl to
DMF decreases lignin association and bimodal elution turned to a single peak (Connors et al., 2009).
Similarly, Chum et al. (1987) used HPSEC because of its broad availability and provide a wide range
of molar masses (200 to 3.106 Da) of acetylated alkali lignin, organosolv lignin and ball-milled lignin
in styrene-divinyl benzene (SDVB) copolymer gels with DMF alone or DMF/LiBr as eluents. The
result of DMF alone exhibited multimodal elution behaviour due to aggregation phenomena, whereas
the addition of 0.1M LiBr reduced lignin aggregates. Gosselink et al. studied molar mass
determination of AlcellTM Organosolv lignin using HPSEC with different organic solvents: DMF/LiCl
0.2 M, and THF. The weight-average molar mass (Mw) was considerably lower in THF. It was
concluded that HPSEC of lignin in organic solvents provides poorly comparable inter-laboratory
results (Gosselink et al., 2004). Previously, the same conclusion had been drawn by Milne et al. on
different lignins analysed under identical standard conditions (Milne et al., 1992).

144
The early studies from Brown et al., and Faix et al., had evidenced that to decrease aggregates for
SEC analysis due to polar hydroxyl groups, derivatization by various methods, typically acetylation,
silylation and methylation was crucial (Brown, 1967; Faix et al., 1981). Plant source, isolation
method, functionality and molar mass distribution are determining factors for the solubility of lignin
in chromatographic solvents. Moreover no universal SEC method is available for all types of lignins
and in most of studies in the past, columns containing non-polar polystyrene gels, eluted with THF,
have been used to calculate the more reliable MMD for different variety of lignins (Faix, 1992).
In most studies, the SEC columns are calibrated by polystyrene standards which are
commercially available. Lignin model compounds have also been used as standards, with molar mass
determined by ultracentrifugation. The molecular weight is calculated by Svedberg equation taking
into account sedimental and diffusion coefficients (Umoren and Solomon, 2016). Siochi et al.
performed hydroxypropylation of Organosolv red oak lignin and determined the absolute molecular
weight using SEC/LALLS (low-angle light scattering detector) and SEC/viscometry (differential
viscosity detector). Using SEC/LALLS, Mw of Organosolv red oak lignin was found to be 11500 Da,
whereas SEC/viscometry provided a Mw value of 3852 Da. Thus the obtained values with
SEC/LALLS were three times higher than with GPC/DV. The authors suggested that the obtained
results from SEC/LALLS were complicated because of the influence of sample absorbance and
fluorescence, and the need for light-polarization correction. Nevertheless, the author proposed
SEC/viscometry as convenient and quite acceptable to study the absolute lignin MMD (Siochi et al.,
1990).
Glasser et al. (1993.a) studied the absolute MMD of hardwood, softwood and annual plant
lignins produced by Kraft and Organosolv pulping processes, also using SEC/viscometry. A universal
calibration curve was established with polystyrene standards. The results illustrated that the
investigated lignins (Indulin AT, Indulin, Eucalin, Organosolv lignin, Alcell lignin, HSPA-bagasse)
have Mw values between 3000 and 20000 Da, polydispersity values between 2 and 12, Mark-
Houwink-Sakurada exponential factors (α) value in the range of 0.17 to 0.35, and intrinsic viscosities
between 3.7 and 8 mL/g.
Cathala et al. (2003) stated that DMF is known for lignin aggregation effect in SEC. To
investigate this effect the author has chosen spruce milled-wood-lignin (MWL) and guaiacyl lignin
polymers model (DHP) for MMD study in SEC – DMF solvent using light scattering detector. The
results showed that bimodal elution profile occurred due to association effects between the molecules.
To account for these effects, the authors fractionated the lignin samples in THF and stated that THF-
soluble fractions were responsible for low molar mass part and THF-insoluble fractions were
responsible for higher molar mass corresponding to DMF elution profile. The different molar mass

145
fractions were acetylated to break the association effect and characterized by SEC in THF and THF-
LiBr, combined with online viscometric detection and universal calibration. The authors observed that
Mark-Houwink-Sakurada plots exhibited low MH- exponents, which clearly indicates that the
polymers matrixes are collapsed in THF and THF-LiBr. These results apparently revealed that THF
and THF-LiBr would be rather poor solvents even for acetylated samples. Moreover, the authors
concluded that MWL and DHP molar mass in DMF was higher than 50000 – 60000 Da, due to
aggregation (Cathala et al., 2003).
Collaborative study of SEC analysis on technical lignins has been performed by the Eurolignin
network in an effort to standardize the SEC method. The authors performed acetylation using 1:2 v/v
of pyridine/acetic acid anhydride, stirring at room temperature for 6 days prior to the SEC analysis in
THF and styrene-divinylbenzene columns. The authors studied acetylated bagasse soda lignin without
and with removal of insoluble fractions in the acetylation mixture. They reported that removal of
insoluble fraction led to a lower proportion of higher molar mass fractions (Baumberger et al., 2007).
Nowadays, HPSEC are commonly operated using acetylated lignins and styrene-divinylbenzene
columns and the results are referred to polystyrene calibration, although unprecise for lignin
derivatives, because of still-existing unclear association effects of non-polar lignin even after
derivatization (Pellinen and Salkinoja-Salonen, 1985a).
Incomplete lignin solubility in chromatographic solvents is also an important source of error to
investigate lignin molar mass. As already discussed, derivatization partially overcomes this difficulty
and acetylation is most often used (Baumberger et al., 2007; Hatfield et al., 1999). The latter studies
have shown that using long reaction time, over 6 days, more than 90% dissolution in THF is attained.
But with same duration, Asikkala et al. reached only about 60% solubility in THF of Norway spruce
MWL (Asikkala et al., 2012). These authors developed a “universal derivatization” using
acetylbromide in glacial acetic acid to obtain complete dissolution in 30 min in THF. In these
conditions, derivatized sample degradation appears after one month of aging at room temperature.
As already mentioned, polystyrene is the most often used standard although its linear structure
differs much of that of lignin, partially cross-linked. Lignin-like model compounds have been used for
calibration and the obtained Mw values were 2 to 3 times higher than with polystyrene calibration
(Faix and Beinhoff, 1992). DRI, LALLS and RALS (right-angle LS detector) coupled detectors were
used to measure the molar mass of acetylated lignin samples in THF, although with some difficulties
linked to imperfect solubilisation. In another study, lignin fractions were separated by preparative
SEC, reaching dispersity value near to one, and such fractions were compared to polystyrene
standards. Lignin fractions and polystyrene standards exhibited similar behaviour over a wide range
of molecular weight (Botaro and Curvelo, 2009).

146
Viscometry and other techniques, like MALDI-TOF-MS (matrix-assisted laser desorption
ionization time-of-flight mass spectrometry) have been reported in several studies to measure absolute
mass values. MMD by universal calibration was carried out on acetylated and hydroxypropylated
lignins in THF (Himmel et al., 1989; Siochi et al., 1990; Cathala et al., 2003; Gosselink et al., 2004;
Glasser et al., 1993). SEC with off-line MALDI-TOF-MS was originally proposed by Jacobs and
Dahlman (Jacobs, 2000; Jacobs and Dahlman, 2001; Rönnols et al., 2016) and later also studied by
Gosselink (Gosselink, 2011). However, MALTI-TOF has a limitation that the matrix plays a major
role in desorption/ionization process. This is illustrated for instance in the study of Wetzel et al., that
dealt with the analysis of polyethylene glycol, which showed two different fragmentation pattern in
2,5-dihydroxybenzoicacid and dithranol matrixes (Wetzel et al., 2003).
As a summary, despite the number of studies and techniques investigated until now, there is still a
significant uncertainty about the real lignin molar mass values, and about the choice of a reliable
method to use. There is still room for improvement, as illustrated by the recent work of C. Crestini’s
group (Lange et al., 2016). This author studied the accurate MMD of different derivatized lignins
(acetobromination, acetylation and benzoylation) with three column setup connections and standard
calibration. The results stated that three column setup and two detectors set up (poly diode array- PDA
and RI) significantly influenced the quality of SEC results.
Therefore, this chapter focuses on SEC analysis (SEC) of 5 different commercial lignins, using
different types of derivatization and different solvents systems: Protobind 1000 (PB), Organosolv
(ORG), Indulin (IND), softwood kraft (KR) and Eucalyptus kraft (EU-KR) in organic solvents
(DMAc/LiCl and THF). Washing as a pretreatment has been carried out with different solvents
(ethanol, ethylacetate and hexane) prior to SEC analysis. MMD of the different derivatives
(acetylation, fluorobenzylation and fluorobenzoylation) where compared to that of underivatized
lignins. MMD obtained using direct dissolution in DMAc/LiCl, PolarGel M (Agilent Co.) column
setup, and direct dissolution and standard calibration, were compared to using derivatization, PLgel
column setup, dissolution of derivatives in THF solvent, and universal calibration using an in-line
coupling DRI-viscometry.
5.2. Materials and Methods
5.2.1. Technical lignins
5.2.1.1. Commercial lignin samples
Four industrial lignin samples were used in this study: (i) Soda lignin from wheat straw (Protobind
1000) (PB) was purchased from Green Value Enterprises LLC, (ii) Kraft lignin from pine (KL) was
provided by the Centre Technique du Papier (CTP) (Grenoble, France), (iii) Organosolv lignin (ORG)

147
(namely BioLignin® CIMV process using formic acid/acetic acid/water at 185-210ºC) from wheat
straw was purchased from CIMV Company, and (iv) Kraft Indulin AT lignin (IND) was purchased
from DKSH Switzerland Ltd (Serrano et al., 2018).
5.2.1.2. Eucalyptus Kraft lignin preparation at lab scale
Eucalyptus chips were cooked using the Kraft pulping process. 3 batches of 1200 g of wood chips
were cooked using technical grade Na2S and NaOH solutions. Effective and active alkalis were
respectively 25 and 30% of NaOH on wood. Sulphidity was adjusted to 30% and the liquor on wood
ratio was 8. Dry matter content of wood chips was measured as 87.4%. Cooking conditions used
were heat up time of 40 min from 20˚C to 165˚C followed by plateau time of 80 min at 165˚C. After
completion of cooking, 9.5 L of black liquor was extracted and transferred to CTP (Centre Technique
du Papier) Grenoble, France, where the lignin was recovered using CO2 precipitation method
followed by washing with diluted sulfuric acid. Around 100 g of Eucalyptus cooked Kraft lignin were
obtained from 4 L of black liquor. Kappa number of the pulp was found to be 12.4% and the
measured pulp yield was 50.02%.
Chemical compositions including acid soluble and insoluble lignin, total sugar and ash content of
the investigated lignin samples can be found in Chapter 3 (Table 3.1).
5.2.2. Derivatizations
5.2.2.1. Acetylation
100 mg of lignin samples (dry matter content basis) were acetylated with 5 ml of pyridine and
acetic anhydride mixture (1/1: V/V) at room temperature for 15 h in a round bottom flask with
continuous stirring. After the reaction time, the mixture was quenched with 40 ml of 50% aqueous
methanol and dried under vacuum. After methanol evaporation, the product was washed with toluene
three times (3 х 40ml) to remove residual pyridine and once with 40 ml of 99.5% methanol. Finally,
the samples were freeze-dried to ensure total solvent removal.
5.2.2.2. Fluorobenzylation
100 mg of lignin samples were dissolved in 1 mL of NBu (tetra N-butylammonium hydroxide in
1M methanol) and stirred for 1 h at 50°C. Then 10 mL of acetonitrile were added followed by 300 mg
of 4-fluorobenzyl chloride (FBC), the derivatizing agent. The reaction mixture was stirred at 50°C for
overnight. After the reaction time, the derivatized lignin recovery was performed by precipitation in
diethyl ether. Lignin produced a viscous precipitate in diethylether, precipitated again in ice-cold
distilled water. This precipitate was filtered through a 0.45 µm PTFE filter, washed with distilled
water several times and oven-dried at 50˚C (Barrelle et al., 1992; Barrelle, 1995).

148
5.2.2.3. Fluorobenzoylation
Fluorobenzylated lignins (100 mg) were dissolved in 2.5 mL of pyridine. After, 4-dimethyl-
aminopyridine (DMAP, 2.5 mg) and 4-fluorobenzoic acid anhydride (150 mg) were progressively
added into the reaction medium. The mixture was stirred for 48 h at 60˚C. Then derivatized lignins
were poured into ice-cold water. The obtained precipitate was washed with distilled water several
times and filtered through 0.45µm PTFE filters and dried in the oven at 40˚C followed by FT-IR, SEC
and 19F NMR analyses.
5.2.3. Lignin molar mass distribution analyses by SEC
5.2.3.1. SEC conditions
Table 5.1 demonstrates the conditions used for SEC analyses using different columns and
different organic solvents DMAc/LiCl and THF.
Table 5.1. SEC conditions used for analysis of lignin samples using DMAc/LiCl and THF systems
System A: DMAc/LiCl System B: THF
System Malvern GPCmax + column oven +
separate detectors (DiALS + DRI) &
Omnisec 4.6
Malvern TDA 302 & Omnisec 4.5
Column Two polargel M (30 cm x 7 mm) +
one pre-column (Agilent Co.)
Three (300 cm x 7.5 mm) PLGel mixed B
(10 µm mixed B LS) + one pre-column
(Agilent Co.)
Eluent 0.5% of DMAc/LiCl (5g of LiCl
dissolved in 1L of DMAc)
Pure THF (HPLC grade)
Flow rate 1 mL/min 1 mL/min
Column
temperature
70°C 35°C
Detector DRI (Differential Refractive Index)
(the DiALS detector is not used for
data treatment)
DRI, RALS-LALS and in-line viscometer
detectors

149
Standard Polystyrene (PS) 1660, 10050, 65500,
426600
PS: 1670, 4970, 10030, 28400, 64200
Polymethylmethacrylate (PMMA): 1520,
6840, 13200, 31380, 73850, 135300,
342700, 525K, 1026K, 2095K
Cellulose acetate (CA) – polydispersed
polymer sample (Aldrich) used as standard
Sample injection
volume
100 μL of lignin samples and standards 100 µL of lignin samples and standards
Lignin sample
concentration
2 mg/mL 10 mg/mL
Derivatization Acetylation, Fluorobenzylation,
Fluorobenzoylation
Acetylation, Fluorobenzylation,
Fluorobenzoylation
5.2.3.2. Calibration curves
5.2.3.2.1. SEC-DMAc/LiCl system – Conventional calibration
Firstly, the calibration curve has been made using system A, with homologous series of PS
standards, using the Polargel M column setup in DMAc/LiCl and DRI detection. The logarithm of
each molar mass was plotted against the retention volume (Vr) and the plot is illustrated in Figure 5.2.
Figure 5.2. Calibration curve of PS in DMAc/LiCl (system A, Polargel column setup)
y = -0.5252x + 12.202 R² = 0.9992
2.50
3.00
3.50
4.00
4.50
5.00
5.50
6.00
12 13 14 15 16 17
log
(Mw
)
Retention volume (mL)
PS
Linear (PS)

150
Recalculated molar mass of PS standards is presented in Table 5.2. It is clearly seen that the
deviation between recalculated molar mass and true molar mass for the low molar mass standards is
less than 4 % (1660 Da and 10050 Da). However, for higher molar mass standards, the error is
significantly higher. Therefore, this method may lead to estimation errors for high-molar mass lignin
fractions, above 50 kDa.
Table 5.2. Molar mass (Da) of known PS standards with deviations between recalculated and true M values
Mtrue (Da) Retention
volume (Vr) (ml) log Mtrue
Recalculated
mass (Mcalc)* Deviation**
1660 17.07 3.22 1726 -4.0%
10050 15.62 4.00 9970 0.8%
65500 14.14 4.82 59700 8.9%
426600 12.463 5.63 453656 -6.3%
* Recalculated mass from the calibration curve obtained by linear regression of log Mtrue vs. Vr ** Deviation = (Mtrue-Mcal)/Mtrue
5.2.3.2.2. SEC-THF – Conventional calibration
For SEC-THF analysis, three different polymer standards were selected (two monodisperse and one
polydisperse), with a common point, their linear molecular structure: PS (polystyrene), PMMA (poly
methylmethacrylate) and cellulose acetate (polydisperse). The molar mass of each sample is known,
either from manufacturer data (case of monodisperse standards), or from the analysis by SEC-
LALS/RALS-DRI coupling (using system B in THF, case of cellulose acetate). The plot of log (M)
against Vr using system A with DRI detection is shown in Figure 5.3. It is obvious that this
conventional method does not produce a unique curve for these different samples, all the data cannot
be aligned in a straight line. To estimate the magnitude of the differences in the molar mass
estimations using these different calibration curves, different retention times were chosen to calculate
the corresponding log (M). Table 5.3 shows that large differences in the estimated molar mass arise
from these different calibration curves. The same trend as in Figure 5.3 can be observed, i.e., at the
highest mass (lower retention volume), differences in the estimated molar mass M, calculated from
the different calibration curves, increases. This is a logical consequence of the fact that the three
calibration curves do not align, and moreover, they have different slopes. The general interpretation is
that polymers of different chemical nature have not the same density when they are dissolved in the
SEC solvent. Since chromatographic separation in SEC columns is based on apparent volume or
polymer pellet size rather than by apparent mass, the principle of universal calibration should lead to
much improved accuracy for the estimation of the true mass of the polymer.

151
Figure 5.3. Conventional calibration curves of PS, PMMA and Cellulose acetate (CA). Different
retention times are chosen to calculate and compare the corresponding log (M).

152
Table 5.3. Calculation of MW (g mol-1) of different polymer standards obtained from conventional
calibration curve at different retention volumes (min)
Retention
volume
(ml)
Chosen calibration curve
PS (standard 1) PMMA (standard 2) CA (standard 3)
Standard
Deviation
for M log (M)* M** log (M)* M** log (M)* M**
20.6 4.8 63100 4.9 79430 4.59 38905 20390
21.5 4.42 26300 4.52 33110 4.28 19054 7031
22.4 4.1 12590 4.2 15850 3.97 9333 3258
* read on the corresponding calibration curve at given retention volume
** recalculated from log M
Advantages and disadvantages of conventional calibration method
Advantages: (1) Conventional calibration is the simplest method to find MMD from SEC
experiments. Because of its simplicity, this method is still popular and widely used in industries
although the accuracy could be questioned. (2) The samples can be thoroughly analyzed in one hour
or less. (3) One single detector, providing a stable and accurate response at given polymer
concentration, is required for obtaining a chromatogram in order to calculate the MMD of the
polymer.
Drawbacks: Accuracy of MMD is guaranteed only when mono-disperse standards for a given
polymer are available. For an unknown polymer, the latter should possess the same apparent density
in solution as the known standards available, whatever the molar mass in the explored area. Mostly,
polystyrene is used as standard for lignin determination. Considering polystyrene, its linear structural
arrangement is far from three dimensional cross-linked network of lignin and therefore this method
should lead to erroneous estimation of the MMD in the case of lignin.
5.2.3.2.3. SEC-THF – Universal calibration
Universal calibration principle:
This concept relies on the Mark-Houwink-Sakurada (MHS) relationship and was first tested on
polystyrene polymers by Benoit et al. (Benoit et al., 1966) who stated that samples were eluted in a
SEC column on the basis of their hydrodynamic volume Vh, which determines the elution volume.
The MHS relationship is expressed as: [𝜂] = 𝐾′𝑀𝑎

153
where [η] is the intrinsic viscosity of the polymer, expressed in dL/g or in mL/g; K’ and a are Mark-
Houwink constants, depending on the polymer-solvent system; M is the molar mass of the polymer in
g/mol.
Based on the above equation, different polymer samples with same [η] and M should possess the same
hydrodynamic volume (proportional to the product [η].M), if they follow the same MHS relation
(same K and a). Thus, they will be eluted at same retention times in a given SEC column. The plot of
log ([η].M) vs. retention time should be unique, which is called the “universal calibration curve”.
In our study, we have used narrowly distributed standards to calibrate the SEC columns setup of
system B. The universal calibration curve was constructed using the in-line SEC-viscometry detector
available on system B. Monodispersed (PS, PMMA) and polydispersed (cellulose acetate) polymer
standards have been used. The curve of log ([η].M) vs. retention time is presented on Figure 5.4. It
should be mentioned that only 8 points were considered for the cellulose acetate calibration curve. It
is shown that all samples align on a single linear curve. Himmel et al., (Himmel et al., 1989) stated
that according to MHS relationship, “a” values of linear and flexible polymers were limited between
0.50 to 0.80. Indeed we found that for all of our investigated polymer standards, a and –K values lie in
this range: for PS, a values lie between 0.5 to 0.8, and –K between 3.1 and 5.1, respectively; for
PMMA, we found 0.6 to 0.8 for a, and 3.5 to 4.9 for K; and finally for cellulose acetate, we found
0.815 for a and 3.94 for -K.
In this method the molar mass of an unknown polymer sample is calculated based on the
viscometric response (intrinsic viscosity) and retention volume, and then, substituting these values to
the universal calibration curve provides the absolute molar mass of the sample.
In our study, we have made the universal calibration curve using global curve fit and individual
curve fit. Global curve fit means that all the three polymer data points were used together, and linearly
correlated to build a unique straight-line calibration curve. Individual fit means that one straight-line
calibration curve is based on the data of one given polymer. Results of both types of calibration
curves were compared.

154
Figure 5.4. Top: Global universal calibration curve including all points of PS, PMMA and Cellulose
acetate; and bottom: Individual universal calibration curves including data of each type of polymer
5.2.3.2.4. Calibration Strategy for the integration of SEC chromatogram
In this study, two different columns (Polargel M and PLgel columns, based on polystyrene
divinylbenzene gel) and solvent systems (DMAc/LiCl and THF) were used and five different
technical lignins were analyzed.
In the case of system A (DMAc/LiCl and two Polargel M columns), bimodal and trimodal elution
curves were found for some typical examples of technical lignins: Indulin and Eucalyptus Kraft
lignins chromatogram, as shown in Figure 5.5.
Similarly, in system B using THF and PLgel columns, bimodal elution and long tail in the high
molar mass region was found for Organosolv lignin (ORG). In this particular cases, integration of all
SEC peaks including the main peak and all the smallest peaks at high elution time, leads to very
extended MMD and an unacceptable range of molar mass, considering ORG lignin. In this regard, the

155
main peak of the chromatogram was only considered for MMD calculation, excluding front-tail and
small peaks that arise after the main peak.
In our study, single-peak chromatograms were observed in most of the analysis. In the cases when
additional peaks were observed (ex. EU-KR and Indulin), Figure 5.5 shows the procedure for MMD
calculation by selecting the particular area of the peak. From the obtained SEC chromatogram,
baseline should be adjusted because it is one important parameter in the calculation of the MMD. In
our case, the baseline is drawn for the selected peaks, from V0 (starting of the considered peak region)
to Vt (end point of the peak) which is then further integrated. The presented Indulin lignin SEC profile
(Figure 5.5) shows a uniform distribution and Vt point is selected when the distribution is close to
baseline. However, in the case of EU-KR lignin, the Vt point is chosen from the end of distribution in
order to eliminate the second peak on the integration calculation. In the present study, we use this
methodology to calculate MMD of lignin samples under study.
Figure 5.5. SEC chromatograms of underivatized technical lignins, Indulin (left) and EU-KR
(Eucalyptus-Kraft) lignin, using system A in DMAc/LiCl (right). V0 and Vt represent the start and end
volumes used for peak area integration and calculation of the average molar masses.
5.3. Results and Discussion
5.3.1. Molar mass distribution study of crude lignin samples in DMAc/LiCl
Molar mass study of different commercial lignin samples was first performed using system A
(SEC- DMAc/LiCl system with Polargel M columns, direct dissolution without derivatization). The
obtained SEC and MMD curves are plotted in Figure 5.6. The calculated average molar masses and
DP values are reported in Table 5.4.

156
Figure 5.6. SEC chromatograms of underivatized technical lignins in DMAc/LiCl. Left: Relative
abundance Vs Retention volume (mL). Right: Relative abundance Vs log M.
Figure 5.6 shows that the SEC chromatograms exhibit regular profiles except for the ORG lignin
with possibly a phenomenon of aggregation, considering the very early elution and more irregular
profile. Among the investigated lignin samples, Organosolv lignin contains higher amount of sugar
impurities because of lighter extraction process conducted. These molecularly dispersed species
interact with different structural elements, resulting in the association of molecular clusters of
different densities and resulting in broader distribution curve. The corresponding Mw (25270 Da)
value is considerably higher than for other lignins. Eucalyptus-Kraft (Hardwood lignin) and PB
(Grass lignin) exhibit the lowest Mw (in Table 5.4) (4080 and 5470). This could be due to more
severe cooking conditions: EU-KR was produced by Kraft cooking and PB was recovered from wheat
straw cooking using Soda process. Mw of softwood Kraft lignin (Pine Kraft lignin sample and
Indulin) were between 9000 – 11500 Da. EU-KR and PB lignins led to low Mn (2000 Da for EU-KR,
and 2600 Da for PB). Indulin and Pine Kraft are medium (3400 – 4000 Da). The highest Mn was
observed for Organosolv lignin (around 5000 Da). The ratio of Mw/Mn (dispersity) is below 3 for
most lignins, except for ORG (equal to 5), revealing more disperse population (likely due to
aggregates). Indulin and EU-Kraft exhibited some additional peaks possibly due to sugar or small
oligomeric impurities. In the case of EU-KR, only the main peak observed until 18.5 min was
considered for the comparison (full chromatogram shown in calculation strategy).

157
Table 5.4. Average molar mass data (Mn, Mw) / g mol-1, polydispersity (Mw/Mn) and average degree
of polymerization (DPn, DPw) of underivatized technical lignins in SEC-DMAc/LiCl systems
Sample Name Mn Mw Mw/Mn DPn DPw
PB1000 (grass lignin) 2,650 5,470 2.1 13 27
Organosolv (CIMV) 4,970 25,270 5.1 25 126
Indulin (softwood) 3,430 9,620 2.8 17 48
Kraft (softwood - Pine) 4,090 11,500 2.8 20 57
Eucalyptus – Kraft (hardwood) 2,030 4,080 2.0 10 20
Note: calculated DP values are based on a mean monomer mass of 200 g/mol for underivatized
lignin
Advantages and drawbacks of direct lignin analysis using DMAc/LiCl
Advantages: (1) The analysis can be performed with crude samples, therefore no washing is
needed, and it reduces the risk of losing small lignin fractions, and (2) no derivatization is required for
lignin samples and hence it avoids the potential risk of sample degradation or small fractions loss
during derivatization.
Drawbacks: (1) a very long dissolution time is required for technical lignins, about 4 to 5 weeks,
(2) higher probability of forming aggregates in the column could be responsible for obtaining high
MW in some cases, which affects the MW value in a significant manner, (3) the presence of impurities
like residual extractives and sugars may interfere in the apparent MMD determination.
5.3.2. Solvent wash study
Extraction of lignin from lignocellulosic biomass involves tedious chemical processes and the
extracted lignin contains certain amount of impurities such as sugars, organic extractives, fatty acids
and minerals. The washing of lignin can be performed to remove those impurities to avoid
interference with analysis and also increase the purity of the lignin. Numerous studies have been
attempted to extract/fractionate as well as enhance the purity of the lignin using various solvents such
as water/ethanol mixture, sulfuric acid, deionized water, acetone, dioxane, dichloromethane, ethyl
acetate, etc. (Alvarez-Vasco et al., 2016; Barta et al., 2013; Bauer et al., 2012; El Hage et al., 2009;
Mansouri and Salvadó, 2006; Schorr et al., 2014).

158
In this regards, three different solvents are chosen for this thesis work based on their polarity, for
instance, highly polar (ethanol), moderately polar (ethyl acetate) and non-polar (hexane) to select a
suitable solvent for the rest of the study. Table 5.5 summarizes the solvent properties of the
considered solvents and some physical properties (data from website2). The relative polarity and
dielectric constant of the ethanol are significantly higher than ethyl acetate and hexane. In addition,
the hexane has the relative polarity value of 0.009 which is almost negligible compared to the other
two solvents.
Table 5.5. Solvent parameters for ethanol, ethylacetate and hexane
Solvent Formula Relative
polarity*
Dielectric
constant (ɛ) Boiling point
(°C) Melting
point (°C) Density (g/ml)
Ethanol C2H6O 0.654 24.5 78.5 -114.4 0.789
Ethyl acetate C4H8O2 0.228 6.02 77 -83.6 0.894
Hexane C6H14 0.009 1.89 69 -95 0.655
* Relative polarity is normalized with respect to water polarity value of 1.
In the case of solvent wash study, we have considered only PB lignin for benchmark purposes. 1g
PB lignin was washed using approximately 60 mL of respective solvent (approximately 16.5 g/L).
The obtained results are illustrated in Table 5.6.
Table 5.6. Before and after washing of PB lignin in different solvents and final yield in %
PB1000 lignin
Solvent Starting
quantity (in g)
After washing
(in g)
Ethanol 1 0.291
Ethyl acetate 1 0.598
Hexane 1 0.903
It is clearly seen from the Table 5.6 that ethanol-washed PB lignin exhibits lower yield than other
solvent-washed lignin samples. The reason of small yield can be directly related to the polarity of
ethanol which is relatively high compared to ethyl acetate and cellulose acetate solvents. The obtained
yield from our study can be compared with references (Alvarez-Vasco et al., 2016; Bauer et al., 2012)
where it is reported that in the case of water/ethanol mixture, the increasing ethanol composition
2 https://sites.google.com/site/miller00828/in/solvent-polarity-table

159
produces lower yield of lignin. The obtained results lead to conclude that high polar nature of the
ethanol removes not only impurities but also lignin polymer chains of various size, because of the
very low yield. In contrary ethyl acetate wash produces a moderate effect which probably removes
only small lignin molecules. However, due to non-polarity, hexane solvent is not efficient for lignin
washing, it removes only non-polar impurities but is probably insufficient to remove polar ones.
5.3.3. SEC analysis of solvent washed PB lignin – Crude and Derivatized
In this section, SEC analysis was performed in DMAc/LiCl system with polystyrene standard for
washed PB lignin in different solvents to see the effect on the molar mass distribution, and compare
the results between crude and derivatized (acetylated and fluorobenzylated) lignins.
The obtained chromatograms can be compared in Figure 5.7 and the corresponding average molar
mass and degree of polymerization are presented in Table 5.7. It should be noted that the
chromatographic curves and the obtained Mn and Mw values showed that no significant differences
were observed for underivatized crude and hexane-washed PB. The results confirm that hexane as
non-polar solvent was not efficient for removing the smaller molar mass lignin fractions. In the case
of ethanol-washed PB, higher Mw (13310 Da) and Mn (6890 Da) values and sharp molecular weight
distribution curve in higher molar mass region explain that ethanol removes both impurities and small
molar mass lignin molecules present in the crude. In contrary, ethyl acetate washed PB exhibited a
uniform distribution curve and the MMD starts at lower molar mass region and the corresponding Mw
and Mn values are 10230 Da and 4380 Da, respectively. The obtained results revealed that ethyl
acetate is capable of washing lignin polymer without removing small lignin molecules and works as a
better solvent than other ones.
Figure 5.7 shows that the acetylated crude PB sample exhibits a broad distribution of retention
time and log M compared to derivatized washed lignins. DPn and DPw values were calculated by
assuming a mean molar mass value of 240 g/mol for the acetylated lignin monomer, and the results
are presented in Table 5.7. A clear difference is observed between crude-acetylated and washed-
acetylated lignin samples, except for hexane-washed lignin. Mn and Mw values of crude-acetylated
lignin were comparatively lower than other solvent-washed lignin samples, but only a small variation
occurred in the case of hexane-washed lignin. Ethanol-washed lignin exhibits higher Mn and Mw
values compared to the ethyl acetate-wash due to lack of small lignin molecules.
Like acetylation, fluorobenzylated PB lignin also shows similar trends (Figure 5.7) and the
calculated Mn, Mw and dispersity values are presented in Table 5.7, where it is shown that Mn and Mw
values of crude were smaller than ethyl acetate and hexane washed samples. Fluorobenzylated ethanol
washed sample showed higher Mn and Mw values that can be due to large tail in the high molar mass

160
region. DPn and DPw values were calculated on the basis of assuming a molar mass value of 251
g/mol for the fluorobenzylated lignin monomer. This value was obtained from preliminary result of 19F NMR (a detailed calculation is given in the following section).
Figure 5.7. SEC chromatogram profiles of PB washed underivatized lignins, acetylated and
fluorobenzylated lignin samples in different solvents. Plot: Relative abundance vs Retention volume
(left) and Relative abundance vs log (M) (right).
Abbreviations: UD – Underivatized, C – Crude, Et – ethanol, EA – ethyl acetate, H – Hexane.

161
Table 5.7. Average molar mass data (Mn, Mw in Da), polydispersity (Mw/Mn) and average degree of
polymerization (DPn, DPw) of crude PB lignin, washed PB lignin and derivatized (acetylated and
fluorobenzylated) PB lignin samples in SEC system A (direct dissolution, Polargel M column setup,
DMAc/LiCl as solvent, DRI detection, std. calibration with monodisperse polystyrene calibrants)
PB lignin /
SEC-DMAc/LiCl Mn Mw Mw/Mn DPn DPw
Underivatized
PB crude 2650 5470 2.1 13 27
PB Ethanol 6890 13310 1.9 34 67
PB Ethyl acetate 4380 10230 2.0 22 51
PB Hexane 2802 6397 2.3 14 32
PB – Acetylated
Crude 2390 6030 2.5 12 30
Ethanol 5900 14300 2.4 30 72
Ethyl acetate 3400 8900 2.6 17 44
Hexane 2540 6240 2.5 13 31
PB -Fluorobenzylated
Crude 5780 9860 1.7 29 49
Ethanol 5940 14150 2.4 30 71
Ethyl acetate 4910 8550 1.7 25 43
Hexane 3410 7380 2.2 17 37
By comparing the SEC profiles of the crude PB, with and without derivatization, it is shown that
the underivatized sample exhibits a broader distribution than the acetylated sample. In addition, there
is no significant difference in Mn and Mw values, with and without acetylation. In the case of the
fluorobenzylated crude lignin, SEC profiles exhibit a more uniform distribution compared to
underivatized and acetylated samples.
Therefore, it is clearly demonstrated that lignin fluorobenzylation yields to sufficient derivatization
to produce a uniform molar mass distribution. Furthermore, fluorobenzylation enhances lignin
solubility in other organic solvents like THF for SEC analysis.

162
Among the investigated washing solvents, ethyl acetate significantly removes the impurities
present in the lignin crude sample and the lignin polymer molecules are preserved.
5.3.4. Chemical derivatization of technical lignins
In this section, various technical lignins such as PB, ORG, IND, KR and EU-KR were subjected
to different chemical derivatizations such as acetylation, fluorobenzylation and fluorobenzoylation
and chemical analyses are described in the following sections.
5.3.4.1. FT-IR analysis
FT-IR analysis was performed for underivatized and derivatized (acetylated, fluorobenzylated and
fluorobenzoylated) lignins and spectra are shown in to confirm the derivatization. In particular, we
considered three different frequencies to understand the derivatization of lignin, such as –OH, -CH
and aromatic ring vibrations. From the Figure 5.8, in the case of underivatized lignin, –OH stretching
frequency is broad and easily seen in the range of 3600-3100 cm-1. –CH, –CH2 and –CH3 stretching
frequencies lies between 2800-3000 cm-1. Aromatic ring vibration is observed around 1600-1500 cm-1
and aromatic C-H out of plane absorption band visible at 856 cm-1. Guaiacyl, Syringyl and p-
hydroxyl phenolic C-H out of plane absorption can be seen at 754 cm-1.
According to FTIR spectra shown in Figure 5.8, –OH groups intensity in derivatized lignin was
decreased noticeably, compared to underivatized lignin. In particular, fluorobenzylated lignin –OH
groups intensity was slightly higher than in acetylated lignins, because of fluorobenzylation selectivity
toward phenolic and primary –OH groups, without significant reaction on secondary –OH groups. For
acetylated lignin, derivatization occurs on all types of –OH groups. This is clearly seen from –OH
peak intensity, which is significantly lower than in the case of fluorobenzylation. However the
remained –OH peak shows that acetylation on all –OH groups is incomplete. In the case of
fluorobenzoylation, the absence of –OH band indicates that all –OH groups were derivatized
successfully. Other IR region, 3000-2800 cm-1 belongs to the formation of new –CH, –CH2 and –CH3
groups and the corresponding IR intensity increased compared to underivatized lignin.
The frequency, 1750-1720 cm-1 is assigned to non-conjugated C=O of ester, ketones, aldehydes
and acids. Acetylated lignin increased band intensity ranges 1900-1700 cm-1, illustrates large extent of
esterification. Similarly, in the case of fluorobenzoylation, the formation of new ester groups
increases the band intensity in this region. 1700-1550 cm-1 is classified for conjugated C=O and C=C
stretching and the region of 1180-1080 cm-1 refers for new ether bond formation. Therefore, FTIR
analysis revealed that all investigated lignin samples were derivatized and can be used for further
analysis.

163

164
Figure 5.8. FTIR spectra of ethyl acetate washed PB, ORG, Indulin, KR (Kraft) and EU-KR
(Eucalyptus kraft) lignins, A – Acetylated, FB- Fluorobenzylated, FBO- Fluorobenzoylated
5.3.4.2. 19F NMR spectra
Fluoro-derivatized lignins were analysed by 19F NMR to determine the extent of hydroxyl groups
derivatization, based on the fluoro-derivatization work described in the previous chapters (Barrelle,
1995; Barrelle et al., 1992). As a summary, phenolic and primary aliphatic hydroxyl groups were
derivatized using 4-fluorobenzyl chloride and converted into their corresponding ether derivatives.
The fluorobenzylated lignin derivatives were forwarded to fluorobenzoylation using 4-fluorobenzoic
acid anhydride. Particularly, the secondary hydroxyl groups and remained phenolic groups from
fluorobenzylation were converted into their ester derivatives. All derivatized lignins were analyzed by 19F NMR. Figure 5.9 depicts 19F NMR spectra of all investigated fluorobenzylated and
fluorobenzoylated lignins. In the case of fluorobenzylation spectra, the broad spectral region
corresponds to fluorobenzylated lignin and phenolic hydroxyl groups, ranging from -115 to -
117.48 ppm (relative to C6F6) and primary aliphatic hydroxyl groups signals are assigned from -
117.48 to -118.5 ppm. In fluorobenzylated + fluorobenzoylated samples spectra, the right side broad
spectral region belongs to fluorobenzylated lignin, and the left side to fluorobenzoylated lignin. In
fluorobenzoylation region, phenolic hydroxyl groups were assigned from -104.6 to -107.24 ppm and
secondary hydroxyl groups from -107.24 to -108.64 ppm. Number of phenolic and aliphatic hydroxyl
groups was proportional to the area of the peak which is normally quantified based on the internal
standard, and the area of the internal standard (2-fluoroacetophenone) was fixed to 1. This method
provides the information about the number of total hydroxyl groups per gram of derivatized lignin
(mmol/g), which can be expressed as: 𝑛𝑂𝐻 = 𝐴𝐿 ∗ 𝑚𝐼𝑆 ∗ 1000 (𝑚𝐿𝐹 ∗ 138.14)⁄ in mmol/g lignin derivatized Equation 5.1
where: nOH= mmol/g lignin derivatized AL = Area of lignin mIS = mass of internal standard MIS = molar mass of internal standard (138.14 g) mLF = mass of lignin derivatized Internal standard IS = 2-fluoroacetophenone

165

166
Figure 5.9. 19F NMR spectra of fluorobenzylated and fluorobenzoylated Protobind, Organosolv,
Indulin, Kraft and Eucalyptus-Kraft lignins. Chemical shifts relative to CFCl3. Internal standard: 2-
fluoroacetophenone
It should be clarified that the fluorobenzylation reaction was employed for derivatization and
subsequent analysis of 19F NMR analysis. From this reaction, the phenolic and primary hydroxyl
groups were calculated in different lignins, as reported in Table 5.8. From this Table, the indulin Kraft
lignin shows higher amount of phenolic hydroxyl group than other types of Kraft lignins. Among the
investigated lignins, the annual plant ORG lignin contains the lowest amount of hydroxyl groups.

167
Table 5.8. Total number of OH groups (in mmol/g) in fluorobenzylated lignin samples, determined by 19F NMR spectroscopy
Lignin Fluorobenzylated Total OHCalculated
mmol/g lignin derivatized
Ph-OH 1˚-OH
PB 1.785 0.106 1.891
ORG 1.708 0.120 1.828
IND 2.451 0.078 2.529
KR 2.252 0.089 2.341
EU-KR 2.322 0.059 2.381
From the 19F NMR fluorobenzylation spectra, the areas of aromatic and aliphatic hydroxyl groups
were taken into account to calculate the number of moles of lignin derivatives, using the following
Equation 5.2, and values are presented in Table 5.9. In order to calculate the number of moles of
hydroxyl groups, the following parameters are required: ML = molar mass of lignin, MIS = molar mass
of internal standard, ALAr-OH = Area of lignin aromatic hydroxyl group, ALAli-OH = Area of lignin
aliphatic hydroxyl group, mL= Mass of lignin, mIS = mass of internal standard, MF = molar mass of
fluorobenzylated lignin, MHCl = molar mass of HCl. The step-by-step explanation of this equation can
be found in the Appendix B.
𝑛𝑂𝐻 = 𝑀𝐿𝑀𝐼𝑆 ∗ 𝐴𝐿𝐴𝑟−𝑂𝐻 ∗ 𝑚𝐼𝑆/𝑚𝐿∗ 1 / (1 − (𝑀𝐹 − 𝑀𝐻𝐶𝑙) ∗ (𝑚𝐼𝑆𝑚𝐿 ) ∗ 𝐴𝐿𝐴𝑟−𝑂𝐻 ∗ (1 + (𝐴𝐿𝐴𝑙𝑖−𝑂𝐻𝐴𝐿𝐴𝑟−𝑂𝐻 )))
Equation 5.2
Among the investigated lignins, fluorobenzylation reaction predicted that IND lignin contains the
highest total number of phenolic hydroxyls and little part of primary hydroxyls, totally about
0.697 mol/mol aromatic unit. It is followed by EU-KR lignin (0.642 mol/mol) and by KR lignin
(0.628 mol/mol). The least hydroxyl content was obtained for the case of ORG lignin (0.456
mol/mol). It can be pointed out that wheat straw or annual grass plants present lower hydroxyl groups
content than hardwood and softwood lignins.

168
Table 5.9. Total OH groups (in mol/mol aromatic unit) in fluorobenzylated lignin samples,
determined by 19F NMR spectra
Lignin
(mg)
IS
(mg)
FB carbonylated-
ArOH
FB
Ar-OH
Total
Ar-OH
primary-
OH Total OH
x y
PB (15.5)
4.3 A 0.328 0.561 0.889 0.053
N 0.449 0.027 0.476 ORG (15.5)
3.3 A 0.505 0.603 1.108 0.078
N 0.426 0.030 0.456 IND
(15.5) 3.2 A 0.494 1.146 1.640 0.052
N 0.675 0.021 0.697 KR (15)
5.1 A 0.282 0.633 0.915 0.036
N 0.604 0.024 0.628 EU-KR (15.4)
5.2 A 0.251 0.699 0.95 0.024
N 0.626 0.016 0.642 A – Area of the peak, N – number of moles, x and y represents number of moles of aromatic and
aliphatic hydroxyl groups (mol/mol), IS – internal standard.
From the fluorobenzylation spectra, the number of moles of aromatic (x) and aliphatic hydroxyl
groups (y) were calculated, and these values were used for the calculation of the monomer molar mass
based on the equation below (Equation 5.3), with ML = 200 g/mol, MF = 144.5 g/mol (FBC) and
MHCl = 36.5 g/mol. The calculated “M” value represents the monomer molar mass of fluorobenzylated
lignin which therefore will be used for determining the degree of polymerization of all lignin samples,
reported in Table 5.10.. 𝑀 = 𝑀𝐿 + (𝑥 + 𝑦)𝑀𝐹 − (𝑥 + 𝑦)𝑀𝐻𝐶𝑙 Equation 5.3
The fluorobenzylated lignin samples were forwarded to fluorobenzoylation in which the remained
hydroxyl groups are fluorobenzoylated. After the derivatization, the total number of hydroxyl groups,
including total phenolic and aliphatic hydroxyls in all lignins were calculated; values are reported in
Table 5.10. Comparing the two-wheat straw lignins (PB and ORG), the total phenolic hydroxyl group
content differs. Such a difference can be attributed to the totally different cooking processes employed
for their extraction. The PB lignin produced by soda cooking has higher phenolic and aliphatic
hydroxyl groups than the ORG lignin (from the CIMV organosolv cooking process which uses acetic
and formic acid at temperatures above 100°C). Considering various Kraft process lignins, IND lignin
showed highest total hydroxyl content, followed by the KR lignin (from pine) and the least quantity
was found for the EU-KR lignin. For instance, IND has 3.42 mmol/g and KR contains 3.145 mmol/g

169
of total hydroxyl groups, of which 2.33 and 2.277 mmol/g corresponds to phenolic hydroxyl for IND
and KR, 1.09 and 0.868 mmol/g aliphatic hydroxyl groups for IND and KR, respectively.
Chapter 3 has been dedicated to the quantification of phenolic hydroxyl groups using classical
aminolysis with NMR and fast wet chemistry methods. Comparing all analysed samples, the
calculated phenolic hydroxyl group content (in mmol/g) range from different methods:
(1) Aminolysis: PB-3.4, ORG-2.4, IND-3.6, KR-4.0
(2) UV-differential spectrometry: PB-2.6, ORG-1.7, 3.4-IND, KR-2.8
(3) 1H NMR: PB-1.8, ORG-0.9, IND-3.1, KR-2.7
(4) 13C NMR: PB-2.4, ORG-2.0, IND-3.6, KR-4.2
(5) 31P NMR: PB-2.7, ORG-1.3, IND-3.2. KR-3.2
(6) Fast wet chemical method: PB-2.4, ORG-1.5, IND-2.7, KR-2.7
It should be noted that all the above analysis exhibited lower phenolic hydroxyl content for
Organosolv lignin and higher phenolic hydroxyl group content for Indulin or Kraft (softwood lignins).
It is interesting to note that total phenolic content after fluorobenzoylation using 19F NMR results
were consistent with the result obtained by other methods. Detailed information can be found in
Chapter 3.
From the analysis of fluorobenzoylated lignins 19F NMR spectra and the determination of each
peak area, the following Equation 5.4 was used to calculate the –OH content in derivatized lignins.
Table 5.10. Total number of OH groups (in mmol/g) in fluorobenzoylated lignin samples, determined
by 19F NMR spectra
Lignin Fluorobenzylated Fluorobenzoylated Total OHPhenol
Total OHaliph
Total OHCalculated
mmol/g derivatized
lignin
Ar-OH 1˚-OH Ar-OH 2˚-OH
PB 1.802 0.051 0.374 0.851 2.176 0.902 3.078
ORG 1.110 0.057 0.563 0.643 1.673 0.700 2.373
IND 1.901 0.051 0.430 1.036 2.331 1.087 3.418
KR 1.938 0.060 0.339 0.808 2.277 0.868 3.145
EU-KR 1.840 0.058 0.397 0.490 2.237 0.548 2.785
The following parameters are used for the calculations and detailed derivation of this equation can
be found in Appendix C. MFBC = 144.5 g/mol, FBC = 4-fluorobenzyl chloride, MHCl = 36.47 g/mol,
HCl = hydrochloric acid, MFBAA = 262.2 g/mol, FBAA = 4-fluorobenzoic acid anhydride,

170
MFBA = 140.1 g/mol, FBA = Fluorobenzoic acid, MIS = 138.14 g/mol IS = Internal standard (2-
fluoroacetophenone), mIS = mass of internal standard, mLi = mass of lignin, ALiu = Area corresponding
to fluorobenzylated aromatic hydroxyl, ALiV = Area corresponding to fluorobenzoylated aromatic
hydroxyl, ALiy = Area of primary hydroxyls, ALiZ =Area of secondary hydroxyls.
𝑛𝑂𝐻𝑥 = 𝑀𝐿𝑀𝐼𝑆 ∗ 𝐴𝐿𝑖𝑥 ∗ (𝑚𝐼𝑆/𝑚𝐿𝑖)∗ 1/ [(1 − ( 𝐴𝐿𝑖𝑢 ∗ 𝑚𝐼𝑆)/(𝑀𝐼𝑆 ∗ 𝑚𝐿𝑖) ∗ (𝑀𝐹1 − 𝑀𝐻𝐶𝑙) ∗ (1 + (𝐴𝐿𝑖𝑌𝐴𝐿𝑖𝑢) + (𝑀𝐹2 − 𝑀𝐹𝐵𝐴) ∗ (𝐴𝐿𝑖𝑉 + 𝐴𝐿𝑖𝑍)𝐴𝐿𝑖𝑢 )]
Equation 5.4
The calculated total number of hydroxyl groups present in the lignin are reported in Table 5.11.
From fluorobenzoylation, it is estimated that IND lignin possesses the highest total number of
hydroxyl groups, followed by KR lignin. This trend differs from the results obtained by
fluorobenzylation, where EU-KR lignin exhibited more hydroxyl group than KR lignin. PB hydroxyl
group content is lower than for KR lignin, but higher than for EU-KR; ORG has the lowest content,
typically about one-half of the IND lignin. Considering the extraction process employed for the
investigated lignins, ORG lignin was extracted by the “lighter process”, in comparison to the aqueous
alkaline cooking processes that take place at much higher temperatures. This could play a significant
role on the total hydroxyl group quantity.
In order to calculate the monomer molar mass of fluorobenzoylated lignin samples, u, v, y and z
values were extracted from the fluorobenzoylated lignin 19F NMR spectra (in Table 5.11) and these
values were further substituted in the Equation 5.5 to find out monomer molar mass of
fluorobenzoylated lignin. The following components are considered for the monomer molar mass
estimation: MF2 = molar mass of fluorobenzoic acid anhydride (FBAA), MFBA = molar mass of
fluorobenzoic acid produced as by-product during fluorobenzoylation, F1= FBC molar mass of 4-
fluorobenzyl chloride = 144.5 g/mol, ML = 200 g/mol (molar mass of lignin monomer unit, assumed
to 200 g/mol in all the calculations)
𝑀 = 𝑀𝐿 + (𝑢 + 𝑦)(𝑀𝐹1 − 𝑀𝐻𝐶𝑙) + (𝑣 + 𝑧)(𝑀𝐹2 − 𝑀𝐹𝐵𝐴)
Equation 5.5

171
Table 5.11. Total OH groups in fluorobenzoylated lignin in mmol/mol, determined by 19F NMR
spectroscopic analysis
Lignin (mg)
IS (mg)
FBO Ar-
OH
FB Ar-
OH
Total Ar-
OH
2˚-OH 1˚-OH TOTAL OHaliph
Total OH
v u z y
PB
(16.7)
4.4 A 0.196 0.945 0.446 0.027
n 0.115 0.554 0.669 0.262 0.016 0.277 0.931
ORG
(15.5)
4.2 A 0.287 0.566 0.328 0.029
n 0.155 0.305 0.460 0.177 0.016 0.193 0.637
IND
(15.1)
4.8 A 0.187 0.826 0.450 0.022
n 0.141 0.623 0.764 0.339 0.017 0.356 1.119
KR
(16.3)
4.8 A 0.159 0.909 0.379 0.028
n 0.105 0.601 0.706 0.251 0.019 0.269 0.957
EU-KR (16.2)
5.2 A 0.171 0.792 0.211 0.025
n 0.116 0.536 0.652 0.143 0.017 0.160 0.794
A – Area of the peak, n – number of moles, u and v describes the number of moles of aromatic hydroxyl groups fluorobenzylated (mol/mol) and fluorobenzoylated (mol/mol), y and z represents the number of moles of primary aliphatic hydroxyl groups fluorobenzylated (mol/mol) and fluorobenzoylated (mol/mol) respectively.
Based on the 19F NMR results, the monomer molar mass of all lignins samples were calculated
using Equation 5.4 and Equation 5.5). As already mentioned, the average molar mass of the lignin
monomer was assumed to be 200 g/mol, and 240 g/mol for the acetylated lignin monomer. Values for
fluorobenzylated and flurobenzoylated lignin monomers are reported in Table 5.12. In the case of
fluorobenzylated monomers, the highest molar masses were found for the Kraft lignins, such as IND,
KR and EU-KR, followed by PB and ORG lignins. However, in the case of fluorobenzoylated
monomers, the trend is IND > KR > PB > EU-KR > ORG.
These results can be compared to hydroxyl groups contents in each lignin samples (given in Table
5.8 and Table 5.10). Softwood KR and IND lignins exhibited higher total hydroxyl group number
than hardwood Kraft and annual plant lignins, in which most of the phenolic hydroxyl groups were
derivatized during fluorobenzylation. IND lignin contains significant amount of aliphatic hydroxyl
groups which are derivatized during fluorobenzoylation. It is interesting to note that the wheat straw
PB lignin showed higher hydroxyl content than hardwood (Eucalyptus) Kraft lignin. ORG lignin (also
from wheat straw) exhibited least total hydroxyl content, however its aliphatic hydroxyl content was

172
higher than EU-Kraft lignin. Overall, these results revealed that Indulin lignin contains higher amount
of total hydroxyl groups than all other lignins.
Table 5.12. Calculated monomer molar mass in g.mol-1 of fluorobenzylated and fluorobenzoylated
lignin samples from 19F NMR
Lignin
Samples
Molar mass of monomer
FB FBO
PB 251 308
ORG 249 275
IND 275 328
KR 268 310
EU-KR 269 291
5.3.5. Derivatized lignin analysis in SEC-DMAc/LiCl system
All the investigated lignin samples were derivatized (acetylated, fluorobenzylated and
fluorobenzoylated) and the corresponding SEC-DMAc/LiCl chromatogram are shown in Figure 5.10
and the obtained molar mass data can be compared in Table 5.13. Comparing all lignin samples, a
narrow distribution of both underivatized and derivatized lignin is predominant in the case of PB,
Indulin and Eucalyptus Kraft lignin. Values in Table 5.13 shows no significant change in
polydispersity values.
The intriguing phenomenon has been obtained for the case of ORG lignin samples. Both
underivatized and fluorobenzoylated lignin show more uniform molar mass distribution than
acetylated and fluorobenzylated samples. It is clearly seen from the profile (in Figure 5.10) that
acetylated and fluorobenzylated ORG lignin showed higher proportion of higher-molar-mass
fragments in the low molar mass region, which clearly impacts the calculation of Mw (Table 5.13):
acetylated and fluorobenzylated samples have higher Mw than underivatized and flurobenzoylated
samples. This might be due to aggregation inside the column, and then, DMAc/LiCl system may not
be always appropriate for acetylated and fluorobenzylated samples.
In the case of acetylated KR lignin, a broad distribution was obtained and the SEC peak starts
earlier, i.e. in the higher molar mass region. The apparent Mw value (in Table 5.13) is twice higher
than for underivatized lignin. Lower polydispersity was found for fluorobenzylated lignin than
underivatized lignin.

173

174
Figure 5.10. SEC chromatogram profiles of underivatized and derivatized (acetylated,
fluorobenzylated and fluorobenzoylated) of all studied lignin samples. Relative abundance vs
Retention volume (left) and Relative abundance vs log (M) (right)

175
Table 5.13. Average molar mass data (Mn, Mw in g.mol-1), polydispersity (Mw/Mn) and average degree
of polymerization (DPn, DPw) of underivatized and derivatized lignin samples in SEC-DMAc/LiCl
system (system A)
Mn Mw Mw/Mn DPn DPw
PB
underivatized 2650 5470 1.9 13 27
Acetylated 4140 7820 1.9 21 39
Fluorobenzylated 3400 6580 1.9 17 33
Fluorobenzoylated 2490 6200 2.5 12 31
IND underivatized 3430 9610 2.8 17 48
Acetylated 2540 8970 3.5 13 45
Fluorobenzylated 2070 8210 4.0 10 41
Fluorobenzoylated 2190 7300 3.3 11 36
ORG
underivatized 4970 25270 5.1 25 126
Acetylated 4170 79600 19.1 21 398
Fluorobenzylated 3670 43200 11.8 18 216
Fluorobenzoylated 4040 15560 3.9 20 78
KR underivatized 3890 11340 2.9 19 57
Acetylated 4020 19690 4.9 20 98
Fluorobenzylated 2750 9150 3.3 14 46
Fluorobenzoylated 1970 7050 3.6 10 35
EU-KR
underivatized 2030 4080 2.01 10 20
Acetylated 3000 5690 1.9 15 28
Fluorobenzylated 1990 4060 2.0 10 20
Fluorobenzoylated 1680 3910 2.3 8 20
Comparing underivatized lignin samples, the highest molar mass was found for ORG lignin,
followed by Kraft, Indulin, and least value for PB and EU-KR. The broad distribution of ORG lignin
is due to the abundance of high molar mass components. However, in the case of EU-KR
underivatized sample, the peak does not start from the baseline and the lower mass region was
excluded for the calculation. Our obtained Mw values of Kraft underivatized lignin were in rather

176
good accordance with the data of Ringena al. (Ringena et al., 2006). However, the difference in Mn
introduced a small discrepancy in Mw/Mn (the author reported 5.5). The source of lignin and the
presence of low-molar mass components, and impurities, has a strong effect on the calculation of the
apparent Mn.
From overall SEC-DMAc/LiCl experiments, the results have evidenced that the different
derivatization methods significantly enhance the SEC profiles. Overall, the obtained results seem to
reflect the apparent Mw of the samples. Indeed, looking at the good regularity and good Gaussian
shape of the chromatographic profiles, aggregation behavior should be rather minimized; except
maybe for the case of acetylated lignin which for all samples exhibited much higher Mw and
dispersity. Another point which probably should play a favorable role is the polarity of both the SEC
columns (Polargel M type) and of the solvent used, DMAc/LiCl. Indeed, Li-salts (LiCl) are known to
counteract aggregation by ionic strength effects (Connors et al., 1980).
The DS (degree of substitution) of the acetylated lignin samples can be done by considering the
following expressions:
The lignin monomer mass is assumed to be: MLignin monomer = 200 g/mol Equation 5.6
The acetylated lignin monomer mass is: MAc-Lignin monomer = 200 + 42 x DS g/mol Equation 5.7
Assuming same DP for lignin and acetylated lignin:
DP = MLignin/ MLignin monomer = MAc-Lignin/ MAc-Lignin monomer Equation 5.8
From Equation 5.6Equation 5.7Equation 5.8, one obtains:
MLignin/ 200 = MAc-Lignin/ (200 + 42 x DS) Equation 5.9
Then, after rearrangement: DS = [(MAc-lignin/MLignin) – 1] x 200/42 Equation 5.10
Based on the apparent Mw and Mn data in Table 5.13 and on a molar mass of 220 g/mol for the
acetylated lignin monomer, DS values are reported in Table 5.14. Based on Mw, calculation leads to
rather high estimation for the DS of PB, Kraft and Eucalyptus Kraft lignin samples (since expected
values would be in a range of 1 - 2.5), negative DS for IND lignin (which has no meaning), and very
high substitution for ORG. This calculation is therefore not correct, probably because a unique molar
mass value was taken for the acetylated lignin monomer, without accounting for the DS itself.
As an overall conclusion of this paragraph, one can say that, despite good apparent solubility of lignin
samples in DMAc/LiCl, SEC behaviour remained at least partially imperfect with some samples.

177
Table 5.14. Calculated degree of substitution (DS) based on Mn and Mw values for all lignin samples
DS using Mn value DS using Mw value
PB 2.7 2.0
ORG -0.8 10.2
IND 1.2 -0.3
KR 0.2 3.5
EU-KR 2.3 1.9
5.3.6. Derivatized lignin analysis in THF system (system B)
In this section, the chosen lignin derivatives were analysed in SEC-THF, using PLGel columns.
Prior to the analysis, lignin samples were washed with ethyl acetate and derivatized (acetylated,
fluorobenzylated and fluorobenzoylated). We used chromatographic system B, working in THF and 3
PLgel columns (non-polar PSDVB gel), and 3 different polymers as standards (PS, PMMA, cellulose
acetate) to established standard and universal calibration curves:
(1) Universal calibration by plotting log ([].M) vs. retention volume as linear calibration curve,
either using individual polymer fit, or global fit (gathered data of all standard polymers)
(2) Conventional calibration by plotting log (M) vs. retention volume as linear calibration curve
using individual polymers as standard calibrants.
5.3.6.1. Derivatized Protobind (PB) lignin SEC-THF analysis using universal
and conventional calibration methods (system B)
Solubility tests of derivatized PB were performed in THF. The results showed that derivatization
enhanced the solubility in THF, and SEC single peak elution profile was found for all lignin samples.
In particular, PB derivatives exhibited better solubility in THF than the other lignin samples. PB
derivatives chromatograms are illustrated in Figure 5.11. Rather uniform Gaussian-type distributions
can be observed, except for the acetylated lignins which appears less regular and exhibits long tail in
the low-molar-mass region. Acetylation would retain lower molar fractions than the other
derivatization treatments. In the case of fluoro-derivatization, both the effect of the added mass, which
increases the hydrodynamic volume, and the decrease of polymer polarity, reduces the
macromolecular interaction in solution and with the column gel, and reduces the retention volume.
Applying universal or conventional calibration can be compared in Figure 5.12. From SEC-THF
chromatograms, the main peak has been chosen to determine the MMD. Using universal calibration

178
shifts the MMD towards higher molar mass. Such an effect can be observed for the three kinds of
derivatives (acetylation, fluorobenzylation and fluorobenzoylation).
In Table 5.15, Mn, Mw and polydispersity values of acetylated, fluorobenzylated and
fluorobenzoylated PB derivatives obtained by universal calibration can be compared with values
obtained by conventional calibration. In all cases of universal calibration, average molar mass values
using PS and PMMA as standards were rather close, whereas values using cellulose acetate as
standard were more distant. Again, the difference between universal and conventional calibration is
significant: M-average and Mw/Mn values obtained by conventional calibration appear 3 to 5 times
lower than those obtained by universal calibration.
As main conclusion of this paragraph focused on the study of PB lignin, it appears that the choice
of the calibration method plays a main role on the determination of the molar mass of the lignin.
An important difference was found between universal calibration and conventional calibration.
Universal calibration should be in principle a much better method than conventional calibration.
Universal calibration yielded significantly higher molar mass than conventional calibration, which
provided molar mass values of the same order of magnitude as values mainly reported in the
literature.
Figure 5.11. SEC – MMD universal calibration curve of PB lignin: relative abundance Vs retention
volume (left) and relative abundance Vs log (Mw) (right) (A - acetylated, FB - fluorobenzylated and
FBO - fluorobenzoylated)

179
Figure 5.12. Comparison of universal and conventional SEC – MMD curves of relative abundance Vs
log(Mw) for A - acetylated, FB - fluorobenzylated and FBO - fluorobenzoylated PB lignin samples
Table 5.15. MMD of derivatized PB lignin from universal calibration with global curve fit and
individual curve fit and comparison with conventional calibration. Mn and Mw values in Da.
Universal
(viscometric detector)
Conventional
(RI detector)
PB-Acetylated Mn Mw Mw/Mn Mp Mn Mw Mw/Mn Mp
Fit with Global curvea 380 10060 26.5 7780 - - - -
PS 330 9030 27.4 6910 560 2890 5.2 2500
PMMA 240 8260 34.4 5981 725 3640 5.0 3150
Cellulose acetate 700 13260 18.9 11090 856 2720 3.2 2620
PB-Fluorobenzylated
Fit with Global curvea 2000 9560 4.8 7980 - - - -
PS 1760 8570 4.9 7110 1450 3180 2.2 2930
PMMA 1400 7700 5.5 6200 1840 4000 2.2 3690
Cellulose acetate 3220 12890 4.0 11230 1770 3060 1.7 2990
PB-Fluorobenzoylated
Fit with Global curvea 3690 16140 4.4 9240 - - - -
PS 3230 14550 4.5 8250 2140 5390 2.5 3430
PMMA 2640 13510 5.1 7250 2710 6740 2.5 4320
Cellulose acetate 5640 20680 3.7 12850 2450 4660 1.9 3420
a = fit with global curve (PS, PMMA, Cellulose acetate)

180
5.3.6.2. Derivatized Indulin (IND) lignin SEC-THF analysis using universal and
conventional calibration methods (system B)
Indulin AT lignin is purchased from DKSH Switzerland Ltd., prepared using Kraft cooking
process on softwood tree. Fluoroderivatized Indulin AT lignin exhibited single peak elution profile in
THF. Acetylated and fluoroderivatized IND lignin SEC chromatogram profiles are shown in Figure
5.13. During the dissolution, acetylated IND lignin solubility in THF was poor compared to fluoro-
derivatives. From the Figure 5.13, more or less uniform MMD profiles for fluoro-derivatives can be
observed (less uniform than for PB lignin, see previous paragraph), while a broad and irregular
distribution was obtained for the acetylated derivative. It is due to the fact of incomplete solubility of
the acetylated IND sample. Elimination of the insoluble portion from acetylated IND led to extended
distribution towards lower molar mass regions.
Figure 5.13. SEC – MMD universal calibration curve of Indulin (IND) lignin: relative abundance vs
retention volume (left) and relative abundance vs log (M) (right) (A - acetylated, FB -
fluorobenzylated and FBO - fluorobenzoylated)
Comparing the MMD curves of the different derivatives (Figure 5.14) shows the same effect as
already observed with the PB lignin: a shift towards higher molar mass for the universal calibration
curves. Another visible shift is due to the added mass introduced by fluoro-derivatization, as
compared to the acetylation that introduces a smaller added mass on lignin monomers. Overall, as in
the case of PB lignin, the better global shape of the fluoro-derivatives curves indicates that fluoro-
derivatization promotes a better SEC behavior in non-polar columns.

181
Figure 5.14. Comparison of universal and conventional SEC – MMD curves of relative abundance Vs
log(Mw) for A - acetylated, FB - fluorobenzylated and FBO - fluorobenzoylated Indulin lignin
samples
Table 5.16 reports average mass and dispersity values for the IND derivatives. Acetylated IND
showed Mw values closer to fluorobenzoylated IND than to fluorobenzylated IND. This is due to the
width of the acetylated lignin MMD which extends in the high mass region, increasing the apparent
Mw. Also because the large width of the distribution, Mn value appears considerably lower than for
fluoroderivatives, which clearly explains the large variations in dispersity index. It is likely that
compared to the other derivatives, acetylated lignin contains larger number of small molecules which
contributes to the decrease of the Mn value. Probably because of the size selection process during the
precipitation procedure, fluoro-derivatives contain bigger molecular fractions, thus contributing to an
increase of Mn and decrease of dispersity index.

182
Table 5.16. MMD of derivatized IND lignin from universal calibration with global curve fit and
individual curve fit and comparison with conventional calibration. Mn and Mw values in Da.
Universal
(viscometric detector)
Conventional
(RI detector)
IND-Acetylated Mn Mw Mw/Mn Mp Mn Mw Mw/Mn Mp
Fit with Global curvea 1090 19920 18.3 12300 - - - -
PS 950 17980 18.9 10990 820 4530 5.5 3770
PMMA 720 16860 23.4 9690 1040 5680 5.5 4750
Cellulose acetate 1880 25150 13.4 16970 1160 3940 3.4 3700
IND-Fluorobenzylated
Fit with Global curvea 2440 15390 6.3 7600 - - - -
PS 2150 13890 6.5 6780 1660 4490 2.7 3040
PMMA 1750 13020 7.4 5920 2110 5630 2.7 3830
Cellulose acetate 3790 19480 5.1 10670 1970 3980 2.0 3090
IND-Fluorobenzoylated
Fit with Global curvea 3760 22270 5.9 9700 - - - -
PS 3320 20100 6.1 8650 1910 5040 2.6 3210
PMMA 2730 18870 6.9 7570 2420 6310 2.6 4050
Cellulose acetate 5780 28080 4.9 13550 2210 4400 2.0 3230
a = fit with global curve (PS, PMMA, Cellulose acetate)
5.3.6.3. Derivatized Organosolv (ORG) lignin SEC-THF analysis using universal
and conventional calibration methods (system B)
Organosolv lignin is obtained from the CIMV process i.e. cooking with a mixture of (formic
acid/acetic acid/water) at 105-110ºC for about 2-3 hours. As already mentioned, the ORG lignin
showed a bimodal elution behaviour in THF, and only the main peak was considered in our study for
comparison with the other lignin samples. The additional much smaller peak, observed in the very
high molar mass region, could be due to poor solubility and association effects.
From the Figure 5.15, it is observed that a broad distribution was obtained for ORG acetylated
lignin. It is clearly seen that a significant part of ORG acetylated lignin eluted outside the calibration
range or in the low-molar-mass region. Acetylated lignin solubility was very poor and only smaller
molar mass fractions were likely to dissolve. However, fluorobenzylated lignin solubility was much
better, although a small part of the lignin was still insoluble. It is therefore evident that a major part of
the distribution curve lies in the low molar mass region for acetylated samples. In the case of

183
fluorobenzoylated lignin, the uniform distribution obtained shows the good column behaviour toward
this sample. Consequently, the increased hydrodynamic volume drives the system at lower retention
time. Fluorobenzylated MMD exhibited an irregular curve due to poor viscometric response, which
affected the calculated log (M) value by universal calibration.
Figure 5.15. SEC – MMD universal calibration curve of Organosolv (ORG) lignin: relative
abundance vs retention volume (left) and relative abundance vs log (M) (right) (A - acetylated, FB -
fluorobenzylated and FBO - fluorobenzoylated)
The obtained MMD curves from universal and conventional methods can be compared in Figure
5.16. A large shift is observed between the methods. It should be noted that the conventional method
used polystyrene as standard and the molar mass of ORG lignin could probably not fit in the range of
the standard. This may explain the huge difference with the values obtained from universal
calibration.
Figure 5.16. Comparison of universal and conventional SEC – MMD curves of relative abundance vs
log (M) for A - acetylated, FB - fluorobenzylated and FBO - fluorobenzoylated ORG lignin samples
From Table 5.17, although extreme variations in apparent Mn and Mw values, the acetylated ORG
lignin dispersity index (Mw/Mn) is higher than for fluoro-derivatives. Dispersity index values around
1.5 to 2 for fluorobenzylated ORG lignin reveals that the partially soluble lignin contains uniform

184
molar mass fractions. In the case of fluorobenzoylated lignin, the solubility is even better than for the
two other derivatives and major part of the higher-molar-mass lignin increases the apparent Mw
values.
Table 5.17. MMD of derivatized ORG lignin, from universal calibration with global curve fit and
individual curve fit, and comparison with conventional calibration. Mn and Mw values in Da.
Universal
(viscometric detector)
Conventional
(RI detector)
ORG-Acetylated Mn Mw Mw/Mn Mp Mn Mw Mw/Mn Mp
Fit with Global curvea 2900 18950 6.5 17810 - - - -
PS 2530 16930 6.7 15850 770 2100 2.7 2380
PMMA 1940 14920 7.7 13660 980 2650 2.7 3010
Cellulose acetate 4950 26270 5.3 25500 1070 2160 2.0 2520
ORG-Fluorobenzylated
Fit with Global curvea 19750 32700 1.7 32630 - - - -
PS 17480 29170 1.7 29050 1680 2690 1.6 2500
PMMA 14610 25550 1.7 25100 2130 3390 1.6 3150
Cellulose acetate 29610 45760 1.5 46540 1930 2700 1.4 2620
ORG-Fluorobenzoylated
Fit with Global curvea 8600 34410 4.0 13540 - - - -
PS 7620 31030 4.1 12080 2240 4800 2.1 3180
PMMA 6400 28970 4.5 10570 2850 6020 2.1 4015
Cellulose acetate 12800 43720 3.4 18940 2500 4270 1.7 3210
a = fit with global curve (PS, PMMA, Cellulose acetate)
5.3.6.4. Derivatized Kraft (KR) lignin SEC-THF analysis using universal and
conventional calibration methods (system B)
Kraft lignin is obtained from pine softwood. Figure 5.17 exhibits almost similar SEC curves for
fluoroderivatives, and like for the other lignins, acetylated lignin displays a broad profile. MMD
curves for different derivatized KR lignin samples using conventional and universal method and
compared in Figure 5.18. The curve of acetylated lignin is shifted at higher log (M) and this clearly
shows the presence of higher molar fragments in the acetylated samples. From Table 5.18, the
acetylated lignin using universal calibration showed highest MMD compared to fluoro derivatives.

185
However, the Mn value is very low and greatly influences the dispersity value, compared to other
derivatization methods. Fluorobenzoylated lignin dispersity value is lower than for other derivatives
and the higher molar mass addition significantly increased the average Mw and Mn in this case.
Figure 5.17. SEC – MMD universal calibration curve of Kraft (KR) lignin: relative abundance vs
retention volume (left) and relative abundance vs log (Mw) (right) (A - acetylated, FB -
fluorobenzylated and FBO - fluorobenzoylated)
Figure 5.18. Comparison of universal and conventional SEC – MMD curves of relative abundance vs
log (M) for A - acetylated, FB - fluorobenzylated and FBO - fluorobenzoylated Kraft lignin samples

186
Table 5.18. MMD of derivatized Kraft pine lignin, from universal calibration with global curve fit
and individual curve fit, and comparison with conventional calibration. Mn and Mw values in Da.
Universal
(viscometric detector) Conventional (RI detector)
KR-Acetylated Mn Mw Mw/Mn Mp Mn Mw Mw/Mn Mp
Fit with Global curvea 540 31060 57.5 9520 - - - -
PS 470 28190 60.0 8490 750 5110 6.8 3100
PMMA 350 27270 77.9 7420 960 6380 6.6 3910
Cellulose acetate 990 37450 37.8 13340 1110 4290 3.9 3130
KR-Fluorobenzylated
Fit with Global curvea 2190 13670 6.2 6250 - - - -
PS 1930 12340 6.4 5570 1510 4170 2.8 2770
PMMA 1560 11550 7.4 4840 1920 5230 2.7 3490
Cellulose acetate 3430 17340 5.1 8840 1820 3710 2.0 2850
EU-KR-Fluorobenzoylated
Fit with Global curvea 3210 18190 5.7 6530 - - - -
PS 2840 16450 5.8 5830 2020 5580 2.8 3040
PMMA 2350 15630 6.7 5090 2570 6980 2.7 3830
Cellulose acetate 4860 22540 4.6 9170 2310 4730 2.0 3090
a = fit with global curve (PS, PMMA, Cellulose acetate)
5.3.6.5. Derivatized Eucalyptus-Kraft (EUCA-KR) lignin SEC-THF using
universal and conventional calibration methods (system B)
Hardwood Eucalyptus Kraft lignin was prepared using Kraft cooking at laboratory scale. The SEC and MMD curves in Figure 5.19 exhibit more uniform distribution for all derivatized lignins. A long tail can be seen for acetylated samples. Comparing universal and conventional calibrations from
Figure 5.20, a rather small shift (compared to other lignins) towards higher molar mass region can
be observed. Average molar mass values in Table 5.19 indicate that conventional calibration yields to
about 2 – 2.5 times lower average mass than universal calibration. With universal calibration,
acetylated and fluorobenzylated lignins showed similar Mw values, but as already seen for other
lignins, the acetylated lignin Mn value is lower than for the fluorobenzylated sample, which leads to
higher dispersity index for the acetylated EUCA-KR lignin.

187
Figure 5.19. SEC – MMD universal calibration curve of EUCA-KR lignin: relative abundance vs
retention volume (left) and relative abundance vs log (M) (right) (A - acetylated, FB -
fluorobenzylated and FBO - fluorobenzoylated)
Figure 5.20. Comparison of universal and conventional SEC – MMD curves for EUCA-KR lignin;
A - acetylated, FB - fluorobenzylated and FBO - fluorobenzoylated .

188
Table 5.19. MMD of derivatized EUCA-KR lignin from universal calibration with global curve fit
and individual curve fit, and comparison with conventional calibration. Mn and Mw values in Da.
Universal
(viscometric detector)
Conventional
(RI detector)
EU-KR-Acetylated Mn Mw Mw/Mn Mp Mn Mw Mw/Mn Mp
Fit with Global curvea 1260 8460 6.7 7270 - - - -
PS 1100 7580 6.9 6480 1010 3210 3.2 3070
PMMA 840 6820 8.1 5660 1300 4040 3.1 3870
Cellulose acetate 2150 11370 5.3 10200 1390 3080 2.2 3110
EU-KR-Fluorobenzylated
Fit with Global curvea 3390 8580 2.5 7000 - - - -
PS 3000 7680 2.6 6240 1780 3130 1.8 2870
PMMA 2500 6880 2.8 5430 2260 3940 1.7 3630
Cellulose acetate 5120 11610 2.3 9870 2040 3050 1.5 2940
EU-KR-Fluorobenzoylated
Fit with Global curvea 3630 13210 3.6 7990 - - - -
PS 3210 11890 3.7 7130 2040 4060 2.0 3200
PMMA 2670 10930 4.1 6240 2580 5100 2.0 4040
Cellulose acetate 5470 17200 3.1 11170 2300 3740 1.6 3230
a = fit with global curve (PS, PMMA, Cellulose acetate)
5.3.7. General Discussion
Our results are consistent with previously reported results using conventional SEC (Faix and
Beinhoff, 1980; Himmel et al., 1989). Faix et al. calculated MMD of various acetylated lignin
samples (Spruce, Bamboo, Beech, Aspen and Milled wood) using conventional calibration and
polystyrene standard. They found higher Mw and Mn for the acetylated lignin than for underivatized
lignin, and the dispersity values lie in the range of 1.8 to 3.6. Himmel et al. carried out SEC analysis
of different aspen lignin samples after acetylation using conventional calibration with UV and RI
detection, and universal method with viscometric detection. The author found dispersity values for
conventional calibration ranging from 3.4 to 4.2. Universal calibration yielded to higher Mw values,
about 1.5 to 2.5 times higher than conventional calibration. Moreover, Mw values determined by
universal calibration were in the same range than those determined by the sedimentation equilibrium
method.

189
Similarly, Nascimento et al. (Nascimento et al., 1992) calculated the apparent Mw values of four
lignins of eucalyptus grandis wood (milled wood lignin, Organosolv, Kraft-mild conditions, Kraft-
vigorous conditions) after acetylation with conventional calibration and polystyrene standards. The
author obtained broad MMD’s in all the cases, with two maxima found in the case of milled wood and
Organosolv process lignin samples, and thus excluded some macromolecular fractions for the
calculation of apparent Mw value. Like these researchers, we faced the same difficulty with the CIMV
Organosolv lignin. After peak selection Organosolv lignins exhibited higher Mw values than Kraft
lignin samples. On the other hand, Ringena et al. (Ringena et al., 2006) carried out SEC analysis of
various technical lignins without derivatization in DMSO/H2O/LiBr and DMAC/LiCl, and molar
mass values were calculated from conventional and universal calibration methods. Again, the
calculated apparent Mw values determined by conventional calibration were found lower than by
universal calibration. In conventional calibration, the result is much affected by the standards used as
well as by the linearity and slope of the calibration curve. Moreover, systematic deviation increases as
far as lignin fractions are of higher mass.
Among the three derivatization methods employed, acetylated samples exhibited the poorest
solubility in THF whereas fluorobenzylated and fluorobenzoylated lignin exhibited higher solubility.
Such a difference in solubility eventually affects the elution behaviour in the SEC column and results
in broad MMD.
It can also be noticed that acetylated derivatives were recovered by solvent evaporation instead of
liquid precipitation, and contain many smaller molecules, readily soluble in the chromatographic
solvents during dissolution. However, higher molar mass fractions still have solubility issues.
Precipitation methods used in the case of fluoroderivatization lead to a selection of higher molar mass
derivatives. Moreover fluoro-derivatives have a much-decreased polarity which enhances their
solubility while decreasing interactions with the column gel and association phenomena, especially in
THF as a non-polar solvent. All these effects contribute to an improvement of SEC profiles.
From the above discussion and observations, it can be concluded that all fluoro-derivatized lignin
samples showed uniform SEC and MMD profiles except Indulin and Organosolv lignin. Profiles were
generally better than for acetylated lignin samples. A more logical evolution for the molar mass data
can also be noticed, also characterized by higher Mw and dispersity’s (the data of acetylated lignin
may not be considered, due to the imperfection of the SEC profile). Higher dispersity might be
explained either by better solubility and SEC behaviour of the fluoro-derivatives in THF, or by the
better resolution obtained with the three PLGel columns in THF, compared to the two PolarGel
columns in DMAC-LiCl. Fluoroderivatization and universal calibration is a better choice to find

190
lignin absolute molar mass, to analyse the structural and chemical characteristics of lignin for
biorefinery application.
5.3.8. Calculation of the degree of polymerization (DP)
The degree of polymerization was calculated from the values of monomer molar mass. The
monomer molar mass of all derivatized lignins were calculated from the results of 19F NMR
spectroscopy. The average DP is simply equal to the average molar mass divided by the monomer
molar mass.
In table 5.20, the reported DPn and DPw values correspond to the use of chromatographic system B
(SEC in THF) and universal calibration with global curve fit. As already mentioned, it should be
noted that the molar mass for acetylated lignin was fixed at 240 g/mol. Similarly, DPn, DPw were
calculated using conventional calibration and values are reported in Table 5.21.
Table 5.20. Calculated average DP’s from universal calibration – Global curve fit.
*Monomer molar mass of FBZ and FBO lignins calculated from 19F NMR; Q = DPw/DPn = dispersity.
Molar mass of
monomer (g/mol) DPn DPw Q=DPw/DPn
PB
Acetylated 240 2 42 26.2
FB 251* 8 38 4.8
FBO 308* 12 52 4.4
IND
Acetylated 240 5 83 18.3
FB 275* 9 56 6.3
FBO 328* 11 68 5.9
ORG
Acetylated 240 12 79 6.5
FB 249* 79 131 1.7
FBO 275* 31 125 4
KR Acetylated 240 2 129 57.5
FB 268* 8 51 6.2
FBO 310* 10 59 5.7
EU-KR Acetylated 240 5 35 6.7
FB 269* 13 32 2.5
FBO 291* 12 45 3.6

191
Table 5.21. Calculated average DP’s from conventional calibration (using polystyrene standards)
Conventional Calibration
PS PMMA Cellulose acetate
Molar
mass of monomer
DPn DPw Q DPn DPw Q DPn DPw Q
PB
Acetylated 240 2 12 5 3 15 5 4 11 3
FB 251* 6 13 2 7 16 2 7 12 2
FBO 308* 7 18 3 9 22 2 8 15 2
IND
Acetylated 240 3 19 6 4 24 5 5 16 3
FB 275* 6 16 3 8 20 3 7 14 2
FBO 328* 6 15 3 7 19 3 7 13 2
ORG
Acetylated 240 3 9 2.7 4 11 2.7 4 9 2.0
FB 249* 7 11 1.6 9 14 1.6 8 11 1.4
FBO 275* 8 17 2.1 10 22 2.1 9 16 1.7
KR Acetylated 240 3 21 6.81 4 27 6.65 5 18 3.86
FB 268* 6 16 2.76 7 20 2.72 7 14 2.04
FBO 310* 7 18 2.76 8 22 2.72 7 15 2.05
EU-KR Acetylated 240 4 13 3.18 5 17 3.11 6 13 2.22
FB 269* 7 12 1.76 8 15 1.74 8 11 1.50
FBO 291* 7 14 1.99 9 18 1.98 8 13 1.63
*Monomer molar mass of FBZ and FBO lignins calculated from 19F NMR; Q = DPw/DPn = dispersity.
According to Table 5.20, universal calibration method predicted that polydispersity (Q) values for
acetylated lignins are considerably higher than for all other derivatives. This clearly demonstrates
acetylated lignin samples have the broadest distribution. Dispersity values in the case of conventional
calibration (Table 5.21) are much lower than with universal calibration.

192
5.4. Conclusion
Size exclusion chromatography analysis (SEC) was performed on five different commercial lignin
samples (Protobind 1000 (PB), Organosolv CIMV (ORG), Indulin (IND), pine Kraft (KR) and
Eucalyptus Kraft (EU-KR)) in two organic solvents (DMAc/LiCl and THF).
Solvent washing study on lignins showed that ethyl acetate, which exhibits an intermediate
polarity, works better than ethanol and hexane for lignin sample washing. MMD’s of underivatized
and derivatized lignins were studied in DMAc/LiCl solvent using conventional calibration as a first
classical method. The obtained results for all ethyl acetate-washed lignin samples demonstrated that
long dissolution time is needed for full dissolution of underivatized lignin, but washing improves
solubility. Different derivatizations (acetylation, fluorobenzylation and fluorobenzoylation) were
performed to overcome the long dissolution time. The results of FTIR, 19F NMR spectra confirmed
the derivatization and quantify the hydroxyl groups. Despite apparently good solvent solubility, SEC
behavior of underivatized and derivatized lignins in DMAc/LiCl remained imperfect. Moreover,
conventional calibration depends on the nature of the calibrant used and molar mass results are
significantly affected.
Universal calibration using DRI and viscometric detection (system B, in THF) was investigated to
develop a method that allows the determination of absolute lignin molar mass values. The obtained
MMD were compared to results from conventional calibration using different polymer standards. It
was well observed on the SEC curves that fluoro-derivatization enhanced the lignin solubility and
uniform MMD curves in THF could be obtained, a better result than for acetylated lignin samples.
However, it was found that universal calibration predicts 3 to 5 times higher molar mass compared to
conventional calibration. Compared to fluoro-derivatives, acetylated lignins exhibited lower Mn, due
to poor solubility of higher molar mass fractions, and higher dispersity index (Mw/Mn).
Comparing the results of DMAc/LiCl and THF system, differences between the two set of results
are significant. Each one is referred to different column systems and calibration methods, universal
calibration versus conventional calibration. In the DMAc system, results are based on calibration by
an inappropriate mono-disperse polymer, polystyrene, which differs from the cross-linked structure of
lignin and leads to an erratic estimation of the MMD (Jacobs, 2000). The non-uniform distribution as
well as aggregation behaviour in the conventional SEC method, using DMAc/LiCl, lead to a
significant deviation on the calculation of apparent Mw values. Introducing viscometry and universal
calibration lead to significantly different results.
However, despite promising results, we think that the FB and FBO derivatization methods
followed by SEC in THF, established at the moment, are still perfectible. Indeed, the quality of SEC

193
curves obtained were not good enough on some lignin samples, not as good as in DMAc-LiCl without
derivatization (as seen in the 1st part of the chapter). Only for the EU-KR and PB lignin, the curves
were rather good and fully regular, thus giving reliable Mw and Mn values. In the other cases, the
values were extremely affected by the high mass tailing and possibly also affected by retention in the
SEC columns used (PLgel in THF, maybe not the best column-solvent system to use with lignin
fluoro-derivatives). Both derivatization conditions and chromatographic conditions should still be
improved, paying attention to preserving the polymer from degradation during the derivatization
reactions.
As a summary, it was found that the new fluoro-derivatives exhibited an improved solubility and a
rather good behaviour in the SEC system used, at least for some of the lignin samples tested. Work is
still needed for optimisation of the SEC conditions, by testing other columns and solvents, like for
instance the Polargel M column system using DMAc-LiCl as solvent associated with a SEC system
allowing universal calibration. Moreover, derivatization conditions should be improved to increase the
recovery yield of the derivatized lignin, without excluding lowest molar mass fractions. Also, the
reason why such molar mass differences are observed between standard calibration and universal
calibration should be elucidated by further tests using other derivatives and columns.

194

195
Conclusions and Perspectives
The thesis objective was to investigate lignin derivation methods for lignin analysis, to quantity
functional groups and to determine lignin molar mass by size exclusion chromatography, the main
issue being to establish the structure and reactivity of technical lignins for value-added applications.
Lignin is a branched, three-dimensional aromatic polymer with a large variety of functional
groups, including hydroxyl, methoxyl, carbonyl and carboxyl groups. Lignin analysis is of primary
importance because of its possible usage as precursor for different applications such as for instance in
phenolic resins, polyurethanes, epoxides and acrylics, and other usages. However, lignin structure and
functional groups composition remain difficult to characterize, which limits the extent of possible new
applications. Another important parameter which influences the lignin usage is its molar mass which
can vary significantly, depending on the process type and conditions used for its extraction.
In general, molar mass distribution (MMD) can be determined by size exclusion chromatography
(SEC) analysis with column packed with either aqueous or organic polar or non-polar nanoporous
gels. Numerous studies have shown that lignins do not need to be derivatized. Direct lignin SEC
analysis, in alkaline-aqueous or in organic medium (DMF, DMAc, DMSO), are the simplest methods
employed in research laboratories. Some lignins, especially samples with highly polar character, may
form strong aggregates inside the SEC system which therefore significantly impacts the calculated
MMD. To overcome this issue, lignin functional group derivatization may be employed, especially on
hydroxyl groups since they are highly reactive and mainly responsible for lignin polarity. Among
possible derivatization methods, acetylation is the reference. Acetylated lignin derivatives exhibit
lower sample-column interaction, compared to underivatized lignin. SEC columns are usually
calibrated using standard calibration with polystyrene polymers of different known molar masses, and
the MMD is calculated from the (log M vs. Retention time) calibration plot. However, polystyrene is a
polymer with a linear structure, far from the lignin branched structure; thus, the obtained lignin MMD
value is not reliable and must be questioned.
In the present work, another derivatization method has been explored and compared with the well-
known acetylation, the lignin fluorobenzylation and fluorobenzoylation to further decrease lignin
polarity. All this work was done using five different technical lignin samples: Protobind 1000 lignin
(commercial lignin originated from soda cooking of wheat straw), Organosolv lignin (from the CIMV
process applied on wheat straw), Kraft lignin from pine and from Eucalyptus (prepared at lab. scale),
and Indulin lignin (commercial Kraft lignin).

196
First, lignin acetylation was applied on the technical lignins to study their reactivity through the
quantification of phenolic hydroxyl groups by aminolysis. Indeed, prior to aminolysis, the lignin
samples were acetylated to convert hydroxyl groups into their corresponding acetylated derivatives.
FT-IR spectroscopy confirmed that lignin hydroxyl groups were acetylated since the intensity of the
hydroxyl groups region significantly decreased. De-acetylation carried out during the aminolysis
reaction and followed by GC analysis, revealed that the Kraft lignin contains a higher phenolic
hydroxyl group content (4.0 mmol/g) than the Indulin lignin (3.6 mmol/g), followed by the Protobind
lignin (3.4 mmol/g) and by the Organosolv lignin (2.4 mmol/g). All these results are logical; softwood
lignins (Kraft and Indulin) are known to contain more phenolic hydroxyl groups than annual plant
lignins (PB and ORG). The aminolysis was compared with other analytical techniques such as UV, 1H
NMR, 13C NMR, 31P NMR and a “fast method” developed recently at LGP2 (by simultaneous
conductometric and potentiometric titration). It was demonstrated that aminolysis gave comparable
results as 13C NMR spectroscopy. This is not surprising since both methods used acetylated
derivatives. 1H NMR, UV and “fast method” underestimate the phenolic hydroxyl group content for
different reasons: in the case of 1H NMR, signal overlapping occurs; in the UV method, some
phenolic hydroxyl groups are not accounted; and the conductometric and potentiometric methods do
not quantify all the phenolic structural units (with the highest pKa’s). However, in the case of the
titration methods, the error has been estimated to be close to 10-15%, which is satisfactory for a first
industrial characterization. Moreover, classical aminolysis also exhibits some drawbacks such as an
incomplete derivatization and the overestimation of phenolic hydroxyl groups due to sugar impurities
present in the samples. For example, Protobind and Organosolv lignins display high sugars content,
3.1 ± 0.2 and 7.2 ± 0.3 mmol/g respectively. Polysaccharides possibly undergo the acetylation and
deacetylation reactions leading to an overestimation of the hydroxyl content results.
All these limitations, incomplete derivatization and the influence of impurities, can be avoided by
employing new derivatization methods such as fluorobenzylation and fluorobenzoylation. Our herein
reported studies on this topic have completed the original work from Barrelle and co-workers during
the 1990’s. The reactivity of hydroxyl groups typically encountered in lignin was first studied using
lignin model compounds submitted to fluorobenzylation. Lignin like model compounds were chosen
according to the nature of the hydroxyl groups bound to the different sites, such as aromatic and
aliphatic hydroxyl groups in order to better assess and precise fluorobenzylation reactivity towards a
variety of hydroxyl groups, as well as 19F NMR signal assignment. The selected model compounds
were the vanillin, the acetovanillone and the guaiacol, all containing an aromatic hydroxyl group, the
vanillyl alcohol with both aliphatic and aromatic hydroxyl groups, the veratryl alcohol bearing only an
aliphatic hydroxyl group, and finally a model of carbohydrate, the cellobiose, to study the possible
effect of polysaccharides impurities in lignins. Complete derivatization was obtained with purely

197
phenolic model compounds, whereas for the model compound containing both aromatic and aliphatic
hydroxyls, or only aliphatic, fluorobenzylation was partial. Fluorobenzylation is thus fully efficient on
phenolic hydroxyl groups but aliphatic hydroxyls are poorly reactive. Moreover, no fluorobenzylation
was observed with cellobiose, therefore, sugar contamination in lignin sample should not interfere
with the phenolic hydroxyl analysis. After the study of lignin model reactivity, the fluorobenzylation
reaction was applied on the Organosolv lignin and 19F NMR spectroscopy analysis was carried out for
hydroxyl group quantification. The obtained 19F NMR chemical shift assignments on the lignin
polymer were aligned precisely with chemical shifts obtained with lignin model compounds.
According to 19F NMR quantification, Organosolv lignin contains 1.71 mmol of phenolic hydroxyl
groups per gram of lignin, and only 0.120 mmol of primary aliphatic hydroxyl groups per gram of
lignin, which is a low and probably underestimated value, because of the lack of reactivity of
fluorobenzylation on aliphatic hydroxyls, as observed on model compounds. The phenolic hydroxyl
group content is in the same order as those obtained using the Fast method (1.5 mmol/g), UV method
(1.7 mmol/g), 31P NMR method (1.3 mmol/g) and 13C NMR after lignin acetylation (2 mmol/g).
However, the aminolysis method apparently overestimated phenolic hydroxyls, with a quantification
of 2.4 mmol/g lignin. These results confirmed that 19F NMR is a robust method for phenolic hydroxyl
group quantification in lignins. It is also stressed that fluorobenzylation significantly increases the
solubility of the lignin macromolecule meaning that this derivatization method could also be used to
enhance lignin behaviour in SEC systems.
Prior to MMD analysis, lignins have been washed to remove impurities. For that purpose,
several solvents have been tested on the Protobind 1000 lignin. Results revealed that ethyl acetate
worked as a better solvent for lignin washing than the two other selected solvents, ethanol and hexane,
because of the moderate polar nature of ethyl acetate. It was observed that during washing, the higher
polarity of ethanol leads to an important removal of all molar mass fractions of the lignin polymer,
including the higher mass, along with impurities, and an important decrease of washing yield.
Size exclusion chromatography (SEC) analysis was performed on five different commercial
lignins, i.e. Protobind, Organosolv, Indulin, Kraft and Eucalyptus Kraft lignins in organic solvents
(DMAc/LiCl and THF). As a first step, molar mass distributions of underivatized and derivatized
lignins were studied in a SEC system working in DMAc/LiCl as solvent (chromatographic system A
equipped with two Polargel M columns and a DRI detector) and using conventional standard
calibration. Three standard polymers used for calibration were compared (polystyrene, PMMA and
cellulose acetate). They exhibited fully linear calibration curves which significantly differed from
each other in terms of slope and Y-ordinate. The obtained results for all ethyl acetate washed
underivatized lignin samples showed that long dissolution time, about 4 to 5 weeks, was required to
fully solubilize all the lignins. In addition, the different derivatives (acetylated and fluorobenzylated

198
and fluorobenzoylated derivatives) were also tested in the same solvent system. FTIR and 19F NMR
analyses confirmed the derivatization and enabled hydroxyl groups quantification. The added mass on
each lignin samples during fluoro derivatization was calculated from 19F NMR spectra. Then the
MMD was analysed and the apparent Mn, Mw values determined through the conventional calibration
method with polystyrene standards. Although, fluoro-derivatization enhanced lignin solubility and
SEC behaviour in DMAc/LiCl, the molar mass results remain imprecise because of standard
calibration with polymers that do not fit correctly the structure of the lignin macromolecule. To
circumvent this, the universal calibration method was used to determine absolute molar mass values
of lignins, using viscometry as a complementary in-line detector, coupled to DRI detector
(chromatographic system B working in THF, equipped with three PLGel columns). It was first
verified that all standard polymers (polystyrene, PMMA and cellulose acetate) followed a unique
universal calibration straight line with the chromatographic system used. Lignin derivatives were then
tested, all of them being soluble in THF, and the obtained MMD results were compared to
conventional calibration. SEC results showed that fluoro-derivatives had a better solubility and
exhibited nicer MMD profiles in THF solvent, compared to acetylated lignins. It was found that
universal calibration calculation predicts 3 to 5 times higher molar mass values, compared to
conventional calibration. Acetylated lignin derivatives presented significantly lower Mn and higher
dispersity values than the fluoro-derivatives, for which the lowest molar mass fractions are not
retained during the recovery step by precipitation in ethyl-ether, in the derivatization protocol used.
Therefore, comparing the results of the two chromatographic systems used, one in DMAc/LiCl
and the other in THF, and the different calibration methods used, it can be conclude that important
differences were found. It seems that the fluorobenzylation and fluorobenzoylation protocols,
followed by SEC in THF, are not good enough at the moment. A molar mass selection occurs during
the final precipitation step that enables the recovery of the derivatives. Moreover, in the non-polar
solvent used (THF), the quality of SEC profiles of the fluoro-derivatives, although better than with
acetylation, was not good enough for some of the samples tested, not as good as in DMAc-LiCl
without derivatization with long dissolution time. Only for the Eucalyptus-Kraft and Protobind lignin,
the SEC profiles were fully regular, thus giving reliable Mw and Mn values. For the other samples, the
apparent Mw and Mn values for Indulin, Organosolv and Kraft lignins were extremely affected by
tailing in the high mass region, possibly due to some retention effect in columns (PLGel in THF is
suited for fully non-polar polymers, maybe not the best column-solvent system to be used if lignin
derivatives remain slightly polar). Therefore, fluoro-derivatization protocols and the column-solvent
system to use still need some improvement. As long as size-exclusion chromatograms will present
some insufficiencies, the uncertainty on the real lignin molar mass will remain, whatever the method
used for quantification (universal or conventional calibration). Therefore, to pursue the research on

199
fluoro-derivatives, which keep the advantage of low polarity and rapid dissolution, other solvents and
SEC systems should be employed, and as a first test to set-up, using DMAc-LiCl, Polargel M columns
and a SEC system that enables universal calibration should be attempted.
As final conclusion, the obtained results from this work on the different lignin samples
investigated can be used for the development of various value-added applications for lignin
utilization. Indeed, the number and types of hydroxyl groups were quantified by different methods,
and the molecular size and dissolution properties of the different lignins were comparatively
investigated. Moreover, fluoro-derivatization methods may also give a new insight for decreasing
lignin polarity, and further developments of well-established protocols will open a new route for
changing the polarity of lignins originated from different sources.

200

201
References
Achyuthan, K.E., Achyuthan, A.M., Adams, P.D., Dirk, S.M., Harper, J.C., Simmons, B.A., Singh, A.K., Achyuthan, K.E., Achyuthan, A.M., Adams, P.D., et al. (2010). Supramolecular Self-Assembled Chaos: Polyphenolic Lignin’s Barrier to Cost-Effective Lignocellulosic Biofuels. Molecules 15, 8641–8688.
Adler, E. (1957). Structural elements of lignin. Ind. Eng. Chem. 49, 1377–1383.
Adler, E. (1977). Lignin chemistry—past, present and future. Wood Sci. Technol. 11, 169–218.
Adler, E., Hernestam, S., Boss, E., and Caglieris, A. (1955). Estimation of Phenolic Hydroxyl Groups in Lignin. I. Periodate Oxidation of Guaiacol Compounds. Acta Chem. Scand. 9, 319–334.
Adler, E., Magnusson, R., Hansen, S.E., Sömme, R., Stenhagen, E., and Palmstierna, H. (1959). Periodate Oxidation of Phenols. I. Monoethers of Pyrocatechol and Hydroquinone. Acta Chem. Scand. 13, 505–519.
Ahvazi, B.C., and Argyropoulos, D.S. (1996a). 19F Nuclear Magnetic Resonance Spectroscopy for the Elucidation of Carbonyl Groups in Lignins. 1. Model Compounds. J. Agric. Food Chem. 44, 2167–2175.
Ahvazi, B.C., and Argyropoulos, D.S. (1996b). Quantitative trifluoromethylation of carbonyl-containing lignin model compounds. J. Fluor. Chem. 78, 195–198.
Ahvazi, B., Wojciechowicz, O., Ton-That, T.-M., and Hawari, J. (2011). Preparation of Lignopolyols from Wheat Straw Soda Lignin. J. Agric. Food Chem. 59, 10505–10516.
Ahvazi, B.C., Crestini, C., and Argyropoulos, D.S. (1999). 19F Nuclear Magnetic Resonance Spectroscopy for the Quantitative Detection and Classification of Carbonyl Groups in Lignins. J. Agric. Food Chem. 47, 190–201.
Albertsson, A.-C., Edlund, U., and Varma, I.K. (2011). Synthesis, Chemistry and Properties of Hemicelluloses. In Biopolymers – New Materials for Sustainable Films and Coatings, (John Wiley & Sons, Ltd), pp. 133–150.
Allan, G.G. (1969). Hydroxyesters of bark phenolic acids.
Alvarez-Vasco, C., Ma, R., Quintero, M., Guo, M., Geleynse, S., Ramasamy, K.K., Wolcott, M., and Zhang, X. (2016). Unique low-molecular-weight lignin with high purity extracted from wood by deep eutectic solvents (DES): a source of lignin for valorization. Green Chem. 18, 5133–5141.
Aniceto, J.P.S., Portugal, I., and Silva, C.M. (2012). Biomass-Based Polyols through Oxypropylation Reaction. ChemSusChem 5, 1358–1368.
Anjos, O., Santos, A., and Simões, R. (2004). Influence of hemicelluloses content on the paper quality produced with Eucalyptus globulus fibres. In Progress in Paper Physics Seminar 2004, pp. 50–52.

202
Argyropoulos, D.S. (1994). Quantitative Phosphorus-31 NMR Analysis of Six Soluble Lignins. J. Wood Chem. Technol. 14, 65–82.
Argyropoulos, D.S. (2013). High value lignin derivatives, polymers, and copolymers and use thereof in thermoplastic, thermoset, composite, and carbon fiber applications.
Argyropoulos, D.S., and Zhang, L. (1998). Semiquantitative Determination of Quinonoid Structures in Isolated Lignins by 31P Nuclear Magnetic Resonance. J. Agric. Food Chem. 46, 4628–4634.
Argyropoulos, D.S., Heitner, C., and Morin, F.G. (1992). P NMR Spectroscopy in Wood Chemistry - Part III. Solid State 31P NMR of Trimethyl Phosphite Derivatives of Chromophores in Mechanical Pulp. Holzforsch. - Int. J. Biol. Chem. Phys. Technol. Wood 46, 211–218.
Argyropoulos, D.S., Bolker, H.I., Heitner, C., and Archipov, Y. (1993). 31P NMR Spectroscopy in Wood Chemistry. Part IV. Lignin Models: Spin Lattice Relaxation Times and Solvent Effects in 31P NMR. Holzforsch. - Int. J. Biol. Chem. Phys. Technol. Wood 47, 50–56.
Aro, T., and Fatehi, P. (2017). Production and Application of Lignosulfonates and Sulfonated Lignin. ChemSusChem 10, 1861–1877.
Asikkala, J., Tamminen, T., and Argyropoulos, D.S. (2012). Accurate and reproducible determination of lignin molar mass by acetobromination. J. Agric. Food Chem. 60, 8968–8973.
Atalla, R.H., and Agarwal, U.P. (1985). Raman Microprobe Evidence for Lignin Orientation in the Cell Walls of Native Woody Tissue. Science 227, 636–638.
Bajpai, P. (2018). Chapter 2 - Wood and Fiber Fundamentals. In Biermann’s Handbook of Pulp and Paper (Third Edition), P. Bajpai, ed. (Elsevier), pp. 19–74.
Balogh, D.T., Curvelo, A.A.S., and De Groote, R. (1992). Solvent effects on organosolv lignin from Pinus caribaea hondurensis. Holzforsch.-Int. J. Biol. Chem. Phys. Technol. Wood 46, 343–348.
Barrelle, M. (1993). A New Method for the Quantitative 19F NMR Spectroscopic Analysis of Hydroxyl Groups in Lignins. Holzforsch. - Int. J. Biol. Chem. Phys. Technol. Wood 47, 261–267.
Barrelle, M. (1995). Improvements in the Structural Investigation of Lignins by 19F NMR Spectroscopy. J. Wood Chem. Technol. 15, 179–188.
Barrelle, M., Fernandes, J.C., Froment, P., and Lachenal, D. (1992). An Approach to the Determination of Functional Groups in Oxidized Lignins by 19F Nmr. J. Wood Chem. Technol. 12, 413–424.
Barta, K., D. Matson, T., L. Fettig, M., L. Scott, S., V. Iretskii, A., and C. Ford, P. (2010). Catalytic disassembly of an organosolv lignin via hydrogen transfer from supercritical methanol. Green Chem. 12, 1640–1647.
Barta, K., Warner, G.R., Beach, E.S., and Anastas, P.T. (2013). Depolymerization of organosolv lignin to aromatic compounds over Cu-doped porous metal oxides. Green Chem. 16, 191–196.
Barth, H.G. (1980). A Practical Approach to Steric Exclusion Chromatography of Water-Soluble Polymers. J. Chromatogr. Sci. 18, 409–429.

203
Bauer, S., Sorek, H., Mitchell, V.D., Ibáñez, A.B., and Wemmer, D.E. (2012). Characterization of Miscanthus giganteus Lignin Isolated by Ethanol Organosolv Process under Reflux Condition. J. Agric. Food Chem. 60, 8203–8212.
Baumberger, S., Lapierre, C., and Monties, B. (1998). Utilization of Pine Kraft Lignin in Starch Composites: Impact of Structural Heterogeneity. J. Agric. Food Chem. 46, 2234–2240.
Baumberger, S., Abaecherli, A., Fasching, M., Gellerstedt, G., Gosselink, R., Hortling, B., Li, J., Saake, B., and de Jong, E. (2007). Molar mass determination of lignins by size-exclusion chromatography: towards standardisation of the method. Holzforschung 61, 459–468.
Belgacem, M.N., Blayo, A., and Gandini, A. (2003). Organosolv lignin as a filler in inks, varnishes and paints. Ind. Crops Prod. 18, 145–153.
Benoit, H., Grubisic, Z., Rempp, P., Decker, D., and Zilliox, J.-G. (1966). Étude par chromatographie en phase liquide de polystyrènes linéaires et ramifiés de structures connues. J. Chim. Phys. 63, 1507–1514.
Berlin, A., and Balakshin, M. (2014). Chapter 18 - Industrial Lignins: Analysis, Properties, and Applications. In Bioenergy Research: Advances and Applications, (Amsterdam: Elsevier), pp. 315–336.
Biermann, C. (1996). Handbook of Pulping and Papermaking - 2nd Edition. In Handbook of Pulping and Papermaking, p.
Binh, N.T.T., Luong, N.D., Kim, D.O., Lee, S.H., Kim, B.J., Lee, Y.S., and Nam, J.-D. (2009). Synthesis of Lignin-Based Thermoplastic Copolyester Using Kraft Lignin as a Macromonomer. Compos. Interfaces 16, 923–935.
Blainski, A., Lopes, G.C., and De Mello, J.C.P. (2013). Application and Analysis of the Folin Ciocalteu Method for the Determination of the Total Phenolic Content from Limonium Brasiliense L. Molecules 18, 6852–6865.
Botaro, V.R., and Curvelo, A.A. da S. (2009). Monodisperse lignin fractions as standards in size-exclusion analysis. J. Chromatogr. A 1216, 3802–3806.
Brandt, A., Gräsvik, J., Hallett, J.P., and Welton, T. (2013). Deconstruction of lignocellulosic biomass with ionic liquids. Green Chem. 15, 550–583.
Brogdon, D.B.N., Mancosky, D.G., and Lucia, L.A. (2005). New Insights into Lignin Modification During Chlorine Dioxide Bleaching Sequences (I): Chlorine Dioxide Delignification. J. Wood Chem. Technol. 24, 201–219.
Brown, W. (1967). Solution properties of lignin. Thermodynamic properties and molecular weight determinations. J. Appl. Polym. Sci. 11, 2381–2396.
Buhner, J., and Agblevor, F.A. (2004). Effect of detoxification of dilute-acid corn fiber hydrolysate on xylitol production. Appl. Biochem. Biotechnol. 119, 13–30.
Buono, P., Duval, A., Verge, P., Averous, L., and Habibi, Y. (2016). New Insights on the Chemical Modification of Lignin: Acetylation versus Silylation. ACS Sustain. Chem. Eng. 4, 5212–5222.

204
Calvo-Flores, F.G., Dobado, J.A., Isac-García, J., and Martín-Martínez, F.J. (2015). Lignin and Lignans as Renewable Raw Materials: Chemistry, Technology and Applications (John Wiley & Sons).
Capanema, E.A., Balakshin, M.Yu., and Kadla, J.F. (2005). Quantitative Characterization of a Hardwood Milled Wood Lignin by Nuclear Magnetic Resonance Spectroscopy. J. Agric. Food Chem. 53, 9639–9649.
Carlos Serrano-Ruiz, J., Luque, R., and Sepúlveda-Escribano, A. (2011). Transformations of biomass-derived platform molecules: from high added-value chemicals to fuels via aqueous-phase processing. Chem. Soc. Rev. 40, 5266–5281.
Casey, J.P. (1960). Pulp and Paper: Chemistry and Chemical Technology, Volume 2, 3rd Edition.
Cateto, C.A., Barreiro, M.F., Rodrigues, A.E., Brochier-Salon, M.C., Thielemans, W., and Belgacem, M.N. (2008). Lignins as macromonomers for polyurethane synthesis: A comparative study on hydroxyl group determination. J. Appl. Polym. Sci. 109, 3008–3017.
Cathala, B., Saake, B., Faix, O., and Monties, B. (2003). Association behaviour of lignins and lignin model compounds studied by multidetector size-exclusion chromatography. J. Chromatogr. A 1020, 229–239.
Cen, Y.-P., Turpin, D.H., and Layzell, D.B. (2001). Whole-Plant Gas Exchange and Reductive Biosynthesis in White Lupin. Plant Physiol. 126, 1555–1565.
Chakar, F.S., and Ragauskas, A.J. (2004). Review of current and future softwood kraft lignin process chemistry. Ind. Crops Prod. 20, 131–141.
Chen, F., and Li, J. (2000). Aqueous Gel Permeation Chromatographic Methods for Technical Lignins. J. Wood Chem. Technol. 20, 265–276.
Chen, P., Zhang, L., Peng, S., and Liao, B. (2006). Effects of nanoscale hydroxypropyl lignin on properties of soy protein plastics. J. Appl. Polym. Sci. 101, 334–341.
Cherubini, F. (2010). The biorefinery concept: using biomass instead of oil for producing energy and chemicals. Energy Convers. Manag. 51, 1412–1421.
Christian, D.T., Nobell, A., Armstrong, T.S., and Look, M. (1972). Process for producing polyoxyalkylene ether-polyols from lignin and tannin and products so made.
Chum, H.L., Johnson, D.K., Tucker, M.P., and Himmel, M.E. (1987). Some Aspects of Lignin Characterization by High Performance Size Exclusion Chromatography Using Styrene Divinylbenzene Copolymer Gels. Holzforschung 41, 97–108.
Connors, W.J., Sarkanen, S., and McCarthy, J.L. (1980). Gel Chromatography and Association Complexes of Lignin. Holzforschung 34, 80–85.
Connors, W.J., Sarkanen, S., and McCarthy, J.L. (2009). Gel Chromatography and Association Complexes of Lignin. Holzforsch. - Int. J. Biol. Chem. Phys. Technol. Wood 34, 80–85.
Constant, S., Lancefield, C.S., Weckhuysen, B.M., and Bruijnincx, P.C.A. (2017). Quantification and Classification of Carbonyls in Industrial Humins and Lignins by 19F NMR. ACS Sustain. Chem. Eng. 5, 965–972.

205
Credou, J., and Berthelot, T. (2014). Cellulose: from biocompatible to bioactive material. J. Mater. Chem. B 2, 4767–4788.
Cross, C.F., and Bevan, E.J. (1882). XVI.—The chemistry of bast fibres. J. Chem. Soc. Trans. 41, 90–110.
Cyr, A., Chiltz, F., Jeanson, P., Martel, A., Brossard, L., Lessard, J., and Ménard, H. (2000). Electrocatalytic hydrogenation of lignin models at Raney nickel and palladium-based electrodes. Can. J. Chem. 78, 307–315.
Davin, L.B., and Lewis, N.G. (2005). Lignin primary structures and dirigent sites. Curr. Opin. Biotechnol. 16, 407–415.
Deguchi, S., Tsujii, K., and Horikoshi, K. (2006). Cooking cellulose in hot and compressed water. Chem. Commun. 0, 3293–3295.
Demirbaş, A. (2001). Relationships between lignin contents and heating values of biomass. Energy Convers. Manag. 42, 183–188.
Dence, C.W., and Lin, S.Y. (1992). Introduction. In Methods in Lignin Chemistry, (Springer, Berlin, Heidelberg), pp. 3–19.
Deng, D., Deng, P., Wang, X., and Hou, X. (2009). Direct Determination of Sodium Fluoride and Sodium Monofluorophosphate in Toothpaste by Quantitative 19F-NMR: A Green Analytical Method. Spectrosc. Lett. 42, 334–340.
Dilling, P., and Samaranayake, G.S. (1999). Mixtures of amine modified lignin with sulfonated lignin for disperse dye.
Dorrestijn, E., Kranenburg, M., Poinsot, D., and Mulder, P. (1999). Lignin depolymerization in hydrogen-donor solvents. Holzforschung 53, 611–616.
Dorrestijn, E., Laarhoven, L.J., Arends, I.W., and Mulder, P. (2000). The occurrence and reactivity of phenoxyl linkages in lignin and low rank coal. J. Anal. Appl. Pyrolysis 54, 153–192.
Ebringerová, A., Hromádková, Z., and Heinze, T. (2005). Hemicellulose. In Polysaccharides I: Structure, Characterization and Use, T. Heinze, ed. (Berlin, Heidelberg: Springer Berlin Heidelberg), pp. 1–67.
El Hage, R., Brosse, N., Chrusciel, L., Sanchez, C., Sannigrahi, P., and Ragauskas, A. (2009). Characterization of milled wood lignin and ethanol organosolv lignin from miscanthus. Polym. Degrad. Stab. 94, 1632–1638.
El Mansouri, N.-E., and Salvadó, J. (2006). Structural characterization of technical lignins for the production of adhesives: Application to lignosulfonate, kraft, soda-anthraquinone, organosolv and ethanol process lignins. Ind. Crops Prod. 24, 8–16.
El Mansouri, N.-E., and Salvadó, J. (2007). Analytical methods for determining functional groups in various technical lignins. Ind. Crops Prod. 26, 116–124.
Evtuguin, D.V., Pascoal Neto, C., Rocha, J., and Pedrosa de Jesus, J.D. (1998). Oxidative delignification in the presence of molybdovanadophosphate heteropolyanions: mechanism and kinetic studies. Appl. Catal. Gen. 167, 123–139.

206
Faix, O. (1991). Classification of Lignins from Different Botanical Origins by FT-IR Spectroscopy. Holzforsch. - Int. J. Biol. Chem. Phys. Technol. Wood 45, 21–28.
Faix, O. (1992). In Methods in Lignin Chemistry; Lin, SY; Dence, CW, Eds. Berl. Heidelb. Springer Berl. Heidelb. Doi 10, 978–3.
Faix, O., and Beinhoff, O. (1980). Short Note. Holzforsch. - Int. J. Biol. Chem. Phys. Technol. Wood 34, 174–176.
Faix, O., and Beinhoff, O. (1992). Improved calibration of highperformance sizeexclusion chromatography of lignins using lignin-like model compounds. Holzforschung 46, 355–360.
Faix, O., Lange, W., and Salud, E.C. (1981). The Use of HPLC for the Determination of Average Molecular Weights and Molecular Weight Distributions of Milled Wood Lignins from Shorea polysperma (Blco.). Holzforsch. - Int. J. Biol. Chem. Phys. Technol. Wood 35, 3–9.
Faix, O., Meier, D., and Fortmann, I. (1990). Thermal degradation products of wood. Holz Als Roh- Werkst. 48, 281–285.
Faix, O., Grünwald, C., and Beinhoff, O. (1992). Determination of Phenolic Hydroxyl Group Content of Milled Wood Lignins (MWL’s) from Different Botanical Origins Using Selective Aminolysis, FTIR, 1H-NMR, and UV Spectroscopy. Holzforsch. - Int. J. Biol. Chem. Phys. Technol. Wood 46, 425–432.
Faix, O., Argyropoulos, D.S., Robert, D., and Neirinck, V. (1994). Determination of Hydroxyl Groups in Lignins Evaluation of 1H-, 13C-, 31P-NMR, FTIR and Wet Chemical Methods. Holzforsch. - Int. J. Biol. Chem. Phys. Technol. Wood 48, 387–394.
Faix, O., Andersons, B., and Zakis, G. (1998). Determination of Carbonyl Groups of Six Round Robin Lignins by Modified Oximation and FTIR Spectroscopy. Holzforsch. - Int. J. Biol. Chem. Phys. Technol. Wood 52, 268–274.
Fernandes, J. (1992). Modifications structurales apportées à la lignine lors de la cuisson kraft et des stades de blanchiment des pâtes papetières. PhD Diss. INPG Grenoble Fr.
Fox, S.C., and McDonald, A.G. (2010). Chemical and Thermal Characterization of Three Industrial Lignins and Their Corresponding Lignin Esters. BioResources 5, 990–1009.
Fromm, J., Rockel, B., Lautner, S., Windeisen, E., and Wanner, G. (2003). Lignin distribution in wood cell walls determined by TEM and backscattered SEM techniques. J. Struct. Biol. 143, 77–84.
Froschauer, C., Hummel, M., Iakovlev, M., Roselli, A., Schottenberger, H., and Sixta, H. (2013). Separation of Hemicellulose and Cellulose from Wood Pulp by Means of Ionic Liquid/Cosolvent Systems. Biomacromolecules 14, 1741–1750.
Gang, D.R., Costa, M.A., Fujita, M., Dinkova-Kostova, A.T., Wang, H.-B., Burlat, V., Martin, W., Sarkanen, S., Davin, L.B., and Lewis, N.G. (1999). Regiochemical control of monolignol radical coupling: A new paradigm for lignin and lignan biosynthesis. Chem. Biol. 6, 143–151.
Gellerstedt, G. (1992). Gel Permeation Chromatography. In Methods in Lignin Chemistry, (Springer, Berlin, Heidelberg), pp. 487–497.
Gellerstedt, G. (2009). Chemistry of chemical pulping. Pulping Chem. Technol. 2, 91–120.

207
Gellerstedt, G., and Lindfors, E.-L. (1984). Structural Changes in Lignin During Kraft Pulping. Holzforschung 38, 151–158.
Ghatak, H.R. (2008). Spectroscopic comparison of lignin separated by electrolysis and acid precipitation of wheat straw soda black liquor. Ind. Crops Prod. 28, 206–212.
Gierer, J. (1980). Chemical aspects of kraft pulping. Wood Sci. Technol. 14, 241–266.
Gierer, J., and Soderberg, S. (1959). Über die Carbonylgruppen des Lignine. Acta Chern Scand 13, 127–137.
Gierer, J., Lindeberg, O., and Noren, I. (1979). Alkaline delignification in the presence of anthraquinone/anthrahydroquinone. Holzforschung 33, 213–214.
Gírio, F.M., Fonseca, C., Carvalheiro, F., Duarte, L.C., Marques, S., and Bogel-Łukasik, R. (2010). Hemicelluloses for fuel ethanol: A review. Bioresour. Technol. 101, 4775–4800.
Glasser, W.G., Drew, S.W., and Hall, P.L. (1980). Annual Report to NSF. 150.
Glasser, W.G., Davé, V., and Frazier, C.E. (1993). Molecular weight distribution of (semi-) commercial lignin derivatives. J. Wood Chem. Technol. 13, 545–559.
Glasser, W.G., Atalla, R.H., Blackwell, J., Malcolm Brown, R., Burchard, W., French, A.D., Klemm, D.O., and Nishiyama, Y. (2012). About the structure of cellulose: debating the Lindman hypothesis. Cellulose 19, 589–598.
Gosselink, R.J.A. (2011). Lignin as a renewable aromatic resource for the chemical industry.
Gosselink, R.J., van Dam, J.E., de Jong, E., Gellerstedt, G., Scott, E.L., and Sanders, J.P. (2011). Effect of periodate on lignin for wood adhesive application. Holzforschung 65, 155–162.
Gosselink, R.J.A., Abächerli, A., Semke, H., Malherbe, R., Käuper, P., Nadif, A., and van Dam, J.E.G. (2004). Analytical protocols for characterisation of sulphur-free lignin. Ind. Crops Prod. 19, 271–281.
Granata, A., and Argyropoulos, D.S. (1995). 2-Chloro-4,4,5,5-tetramethyl-1,3,2-dioxaphospholane, a Reagent for the Accurate Determination of the Uncondensed and Condensed Phenolic Moieties in Lignins. J. Agric. Food Chem. 43, 1538–1544.
Gu, J., Catchmark, J.M., Kaiser, E.Q., and Archibald, D.D. (2013). Quantification of cellulose nanowhiskers sulfate esterification levels. Carbohydr. Polym. 92, 1809–1816.
Gupta, K.C., Kumar Sutar, A., and Lin, C.-C. (2009). Polymer-supported Schiff base complexes in oxidation reactions. Coord. Chem. Rev. 253, 1926–1946.
Habibi, Y., Lucia, L.A., and Rojas, O.J. (2010). Cellulose Nanocrystals: Chemistry, Self-Assembly, and Applications. Chem. Rev. 110, 3479–3500.
Hao, N., Ben, H., Yoo, C.G., Adhikari, S., and Ragauskas, A.J. (2016). Review of NMR Characterization of Pyrolysis Oils. Energy Fuels 30, 6863–6880.
Harman-Ware, A.E., Crocker, M., Kaur, A.P., Meier, M.S., Kato, D., and Lynn, B. (2013). Pyrolysis–GC/MS of sinapyl and coniferyl alcohol. J. Anal. Appl. Pyrolysis 99, 161–169.

208
Harris, E.E., D’Ianni, J., and Adkins, H. (1938). Reaction of Hardwood Lignin with Hydrogen. J. Am. Chem. Soc. 60, 1467–1470.
Hatakeyama, H., and Hatakeyama, T. (2010). Lignin Structure, Properties, and Applications. In Biopolymers: Lignin, Proteins, Bioactive Nanocomposites, A. Abe, K. Dusek, and S. Kobayashi, eds. (Berlin, Heidelberg: Springer Berlin Heidelberg), pp. 1–63.
Hatakeyama, T., Hirose, S., and Hatakeyama, H. (1983). Differential scanning calorimetric studies on bound water in 1,4-dioxane acidolysis lignin. Makromol. Chem. 184, 1265–1274.
Hatfield, R.D., Grabber, J., Ralph, J., and Brei, K. (1999). Using the acetyl bromide assay to determine lignin concentrations in herbaceous plants: some cautionary notes. J. Agric. Food Chem. 47, 628–632.
HAUSALO, T. (1985). Analysis of wood and pulp carbohydrates by anion exchange chromatography with pulsed amperometric detection. Proc. 8th Int. Sympoium Wood Pulp Chem. Hels. 1985.
He, W., Du, F., Wu, Y., Wang, Y., Liu, X., Liu, H., and Zhao, X. (2006). Quantitative 19F NMR method validation and application to the quantitative analysis of a fluoro-polyphosphates mixture. J. Fluor. Chem. 127, 809–815.
Hedges, J.I., and Mann, D.C. (1979). The characterization of plant tissues by their lignin oxidation products. Geochim. Cosmochim. Acta 43, 1803–1807.
Heitner, C., Dimmel, D., and Schmidt, J. (2016). Lignin and lignans: advances in chemistry (CRC press).
Heuser, E. (1953). Analytik der Carbonylgruppe. Anal. Methoden George Thieme Stuttg. Fed. Repub. Ger. 434–472.
Heuser, E., and Sieber, R. (1913). Über die Einwirkung von Chlor auf Fichtenholz. Angew. Chem. 26, 801–806.
Himmel, M.E., Tatsumoto, K., Oh, K.K., Grohmann, K., Johnson, D.K., and Chum, H.L. (1989). Molecular Weight Distribution of Aspen Lignins Estimated by Universal Calibration. In Lignin, (American Chemical Society), pp. 82–99.
Hoareau, W., Trindade, W.G., Siegmund, B., Castellan, A., and Frollini, E. (2004). Sugar cane bagasse and curaua lignins oxidized by chlorine dioxide and reacted with furfuryl alcohol: characterization and stability. Polym. Degrad. Stab. 86, 567–576.
Hoftiezer, H.W., Watts, D.J., and Takahashi, A. (1984). Cationic reaction product of kraft lignin with aldehyde and polyamine.
Holzgrabe, U., Deubner, R., Schollmayer, C., and Waibel, B. (2005). Quantitative NMR spectroscopy—Applications in drug analysis. J. Pharm. Biomed. Anal. 38, 806–812.
Hon, D.N.-S. (1996). Cellulose and its derivatives: structures, reactions, and medical uses. Polysacch. Med. Appl. N. Y. USA Marcel Dekker 87–105.
Horst H. Nimz, Uwe Schmitt, Eckart Schwab, Otto Wittmann, Franz Wolf. (2005). "Wood" in Ullmann's Encyclopedia of Industrial Chemistry, Wiley-VCH, Weinheim.

209
Hortling, B., Tamminen, T., and Kenttä, E. (1997). Determination of Carboxyl and Non-Conjugated Carbonyl Groups in Dissolved and Residual Lignins by IR Spectroscopy. Holzforsch. - Int. J. Biol. Chem. Phys. Technol. Wood 51, 405–410.
Huang, F., Pan, S., Pu, Y., Ben, H., and J. Ragauskas, A. (2014). 19 F NMR spectroscopy for the quantitative analysis of carbonyl groups in bio-oils. RSC Adv. 4, 17743–17747.
Ince, P.J. (1979). How to estimate recoverable heat energy in wood or bark fuels. Gen Tech Rep FPL–GTR–29 Madison WI US Dep. Agric. For. Serv. For. Prod. Lab. 7 P 27 Cm 029.
Jacobs (2000). Absolute molar mass of lignins by size exclusion chromatography and MALDI-TOF mass spectroscopy. Nord. Pulp Pap. Res. J. 15, 120–127.
Jacobs, A., and Dahlman, O. (2001). Characterization of the Molar Masses of Hemicelluloses from Wood and Pulps Employing Size Exclusion Chromatography and Matrix-Assisted Laser Desorption Ionization Time-of-Flight Mass Spectrometry. Biomacromolecules 2, 894–905.
Jacobson, M.Z., and Delucchi, M.A. (2009). A path to sustainable energy by 2030. Sci. Am. 301, 58–65.
Januszkiewicz, K.R., and Alper, H. (1983). Exceedingly mild, selective and stereospecific phase-transfer-catalyzed hydrogenation of arenes. Organometallics 2, 1055–1057.
Javaid, R., Sabir, A., Sheikh, N., and Ferhan, M. (2019). Recent Advances in Applications of Acidophilic Fungi to Produce Chemicals. Molecules 24, 786.
Jia, Q., Zhang, W., Li, D., Liu, Y., Che, Y., Ma, Q., and Meng, F. (2017). Hydrazinolyzed cellulose-g-polymethyl acrylate as adsorbent for efficient removal of Cd(II) and Pb(II) ions from aqueous solution. Water Sci. Technol. 75, 1051–1058.
Jiang, X., Liu, J., Du, X., Hu, Z., Chang, H., and Jameel, H. (2018). Phenolation to Improve Lignin Reactivity toward Thermosets Application. ACS Sustain. Chem. Eng. 6, 5504–5512.
Jones, D., Ormondroyd, G.O., Curling, S.F., Popescu, C.-M., and Popescu, M.-C. (2017). 2 - Chemical compositions of natural fibres. In Advanced High Strength Natural Fibre Composites in Construction, M. Fan, and F. Fu, eds. (Woodhead Publishing), pp. 23–58.
Kadla, J.F., and Kubo, S. (2004). Lignin-based polymer blends: analysis of intermolecular interactions in lignin–synthetic polymer blends. Compos. Part Appl. Sci. Manuf. 35, 395–400.
Kai, D., Tan, M.J., Chee, P.L., Chua, Y.K., Yap, Y.L., and Loh, X.J. (2016). Towards lignin-based functional materials in a sustainable world. Green Chem. 18, 1175–1200.
Kamm, B., and Kamm, M. (2004). Principles of biorefineries. Appl. Microbiol. Biotechnol. 64, 137–145.
Kamm, B., Kamm, M., Schmidt, M., Hirth, T., and Schulze, M. (2008). Lignocellulose-based Chemical Products and Product Family Trees. In Biorefineries-Industrial Processes and Products, (Wiley-Blackwell), pp. 97–149.
Kaplan, D.L. (1998). Introduction to Biopolymers from Renewable Resources. In Biopolymers from Renewable Resources, D.L. Kaplan, ed. (Berlin, Heidelberg: Springer Berlin Heidelberg), pp. 292–322.

210
Kim, D., Park, K.Y., and Yoshikawa, K. (2017). Conversion of Municipal Solid Wastes into Biochar through Hydrothermal Carbonization. Eng. Appl. Biochar 31.
Klason, P. (1920). Constitution of the lignin of pine wood. Ber Dtsch Chem Ges B 53, 1864–1873.
Korntner, P., Sumerskii, I., Bacher, M., Rosenau, T., and Potthast, A. (2015). Characterization of technical lignins by NMR spectroscopy: optimization of functional group analysis by 31P NMR spectroscopy. Holzforschung 69.
Krässig, H.A. (1993). Cellulose – Structure, Accessibility and Reactivity (M. B. Huglin, Gordon & Breach Science Pub., Yverdon).
Kristersson, P., Lundquist, K., Simonson, R., and Tingsvik, K. (1983). Gel permeation chromatography of lignin carbohydrate compounds. Holzforsch.-Int. J. Biol. Chem. Phys. Technol. Wood 37, 51–53.
Krolikowski, P. (2004). The Use of 19F NMR to Monitor Organic Reactions on Solid Supports.
Kubo, S., Uraki, Y., and Sano, Y. (1996). Thermomechanical Analysis of Isolated Lignins. Holzforschung 50, 144–150.
Kühnel, I., Podschun, J., Saake, B., and Lehnen, R. (2015). Synthesis of lignin polyols via oxyalkylation with propylene carbonate. Holzforschung 69, 531–538.
Kuwahara, M., Glenn, J.K., Morgan, M.A., and Gold, M.H. (1984). Separation and characterization of two extracelluar H2O2-dependent oxidases from ligninolytic cultures of Phanerochaete chrysosporium. FEBS Lett. 169, 247–250.
Lachenal, D., Benattar, N., Allix, M., Marlin, N., and Chirat, C. (2005). Bleachability of Alkaline Pulps: Effect of Quinones Present in Residual Lignin. In 59th Appita Annual Conference and Exhibition: Incorporating the 13th ISWFPC (International Symposium on Wood, Fibre and Pulping Chemistry), Auckland, New Zealand, 16-19 May 2005: Proceedings, (Appita Inc.), p. 23.
Lai, Y.-Z., Guo, X.-P., and Situ, W. (1990). Estimation of Phenolic Hydroxyl Groups in Wood by a Periodate Oxidation Method. J. Wood Chem. Technol. 10, 365–377.
Lammers, G., Stamhuis, E.J., and Beenackers, A.A.C.M. (1993). Kinetics of the hydroxypropylation of potato starch in aqueous solution. Ind. Eng. Chem. Res. 32, 835–842.
Lange, H., Rulli, F., and Crestini, C. (2016). Gel Permeation Chromatography in Determining Molecular Weights of Lignins: Critical Aspects Revisited for Improved Utility in the Development of Novel Materials. ACS Sustain. Chem. Eng. 4, 5167–5180.
Lapierre, C., Pollet, B., and Monties, B. (1991). Heterogeneous distribution of diarylpropane structures in spruce lignins. Phytochemistry 30, 659–662.
Laurichesse, S., and Avérous, L. (2014). Chemical modification of lignins: Towards biobased polymers. Prog. Polym. Sci. 39, 1266–1290.
Le Floch, A., Jourdes, M., and Teissedre, P.-L. (2015). Polysaccharides and lignin from oak wood used in cooperage: Composition, interest, assays: A review. Carbohydr. Res. 417, 94–102.
Lewis, H.F., Shaffer, S., Trieschmann, W., and Cogan, H. (1930). Methylation of Phenol by Dimethyl Sulfate1. Ind. Eng. Chem. 22, 34–36.

211
Li (1994). A new method for the analysis of phenolic groups in lignins by ¹H NMR spectrometry. Nord. Pulp Pap. Res. J. 09, 191–195.
Lin, S.Y. (1985). Reaction product of lignosulfonate and unsaturated fatty amine.
Lin, S.Y. (1992). Ultraviolet Spectrophotometry. In Methods in Lignin Chemistry, S.Y. Lin, and C.W. Dence, eds. (Berlin, Heidelberg: Springer Berlin Heidelberg), pp. 217–232.
Lin, S.Y., and Dence, C.W. (1992). Methods in lignin chemistry (Springer Science & Business Media).
Lindner, A., and Wegener, G. (1988). Characterization of Lignins from Organosolv Pulping According to the Organocell Process Part 1. Elemental Analysis, Nonlignin Portions and Functional Groups. J. Wood Chem. Technol. 8, 323–340.
Lindsey, J.B., and Tollens, B. (1892). Ueber Holz-Sulfitflüssigkeit und Lignin. Justus Liebigs Ann. Chem. 267, 341–366.
Lindström, T. (1979). The colloidal behaviour of kraft lignin. Colloid Polym. Sci. 257, 277–285.
Lindström, T. (1980). The colloidal behaviour of kraft lignin. Colloid Polym. Sci. 258, 168–173.
Llevot, A., Monney, B., Sehlinger, A., Behrens, S., and R. Meier, M.A. (2017). Highly efficient Tsuji–Trost allylation in water catalyzed by Pd-nanoparticles. Chem. Commun. 53, 5175–5178.
Lora, J.H., and Glasser, W.G. (2002). Recent industrial applications of lignin: a sustainable alternative to nonrenewable materials. J. Polym. Environ. 10, 39–48.
Ludwig, C.H., Nist, B.J., and McCarthy, J.L. (1964a). Lignin. XII.1 The High Resolution Nuclear Magnetic Resonance Spectroscopy of Protons in Compounds Related to Lignin. J. Am. Chem. Soc. 86, 1186–1196.
Ludwig, C.H., Nist, B.J., and McCarthy, J.L. (1964b). Lignin. XIII.1 The High Resolution Nuclear Magnetic Resonance Spectroscopy of Protons in Acetylated Lignins. J. Am. Chem. Soc. 86, 1196–1202.
Lundquist, K. (1992). Proton (1H) NMR spectroscopy. In Methods in Lignin Chemistry, (Springer), pp. 242–249.
Lundquist, K., Sjöholm, R., Teien, G., Pakkanen, T., Servin, R., Sternerup, H., Wistrand, L.-G., Nørskov, L., and Schroll, G. (1979a). NMR Studies of Lignins. 2. Interpretation of the 1H NMR Spectrum of Acetylated Birch Lignin. Acta Chem. Scand. 33b, 27–30.
Lundquist, K., Mannervik, B., Nordfors, K., Nishida, T., Enzell, C.R., Reid, W.W., Yanaihara, N., and Yanaihara, C. (1979b). NMR Studies of Lignins. 3. 1H NMR Spectroscopic Data for Lignin Model Compounds. Acta Chem. Scand. 33b, 418–420.
Lundquist, K., Aasen, A.J., Daasvatn, K., Forsgren, B., Gustafsson, J.-Å., Högberg, B., and Becher, J. (1980). NMR Studies of Lignins. 4. Investigation of Spruce Lignin by 1H NMR Spectroscopy. Acta Chem. Scand. 34b, 21–26.
Lvova, L., Kirsanov, D., Natale, C.D., Legin, A., Kirsanov, D., Natale, C.D., and Legin, A. (2014). Multisensor Systems for Chemical Analysis : Materials and Sensors (Pan Stanford).

212
Lynd, L.R., Weimer, P.J., van Zyl, W.H., and Pretorius, I.S. (2002). Microbial cellulose utilization: fundamentals and biotechnology. Microbiol. Mol. Biol. Rev. 66, 506–577.
Magina, S., Marques, A.P., and Evtuguin, D.V. (2014). Study on the residual lignin in Eucalyptus globulus sulphite pulp. Holzforschung 69, 513–522.
Mansouri, N.-E.E., and Salvadó, J. (2006). Structural characterization of technical lignins for the production of adhesives: Application to lignosulfonate, kraft, soda-anthraquinone, organosolv and ethanol process lignins. Ind. Crops Prod. 24, 8–16.
Månsson, P. (1982). Selective deacetylation of aromatic acetates by aminolysis. Tetrahedron Lett. 23, 1845–1846.
Månsson, P. (1983). Quantitative determination of phenolic and total hydroxyl groups in lignins. Holzforsch.-Int. J. Biol. Chem. Phys. Technol. Wood 37, 143–146.
Marques, A.P., Evtuguin, D.V., Magina, S., Amado, F.M.L., and Prates, A. (2009). Structure of Lignosulphonates from Acidic Magnesium-Based Sulphite Pulping of Eucalyptus globulus. J. Wood Chem. Technol. 29, 337–357.
Martino, R., Gilard, V., Desmoulin, F., and Malet-Martino, M. (2005). Fluorine-19 or phosphorus-31 NMR spectroscopy: A suitable analytical technique for quantitative in vitro metabolic studies of fluorinated or phosphorylated drugs. J. Pharm. Biomed. Anal. 38, 871–891.
Marton, J., and Adler, E. (1961). Carbonyl groups in lignin III. Mild catalytic hydrogenation of Bjorkman lignin. Acta Chern Scand 370–383.
Marton, J., Adler, E., and Persson, K.-I. (1961). Carbonyl groups in lignin IV. Infrared absorption studies and examination of the volumetric borohydride method. Act Chern Scand 15, 384–392.
Masingale, M.P., Alves, E.F., Bose, S.K., and Francis, R.C. (2009). An Oxidant to Replace Nitrobenzene in Lignin Analysis. BioResources 4, 1139–1146.
Matera, R., Gabbanini, S., Valvassori, A., Triquigneaux, M., and Valgimigli, L. (2012). Reactivity of (E)-4-Hydroxy-2-nonenal with Fluorinated Phenylhydrazines: Towards the Efficient Derivatization of an Elusive Key Biomarker of Lipid Peroxidation. Eur. J. Org. Chem. 2012, 3841–3851.
McDonough, T.J. (1993). The chemistry of organosolv delignification. Tappi J. USA.
Meister, J. (2000). Polymer modification: principles, techniques, and applications (CRC Press).
Meister, J.J. (2002). Modification of lignin. J. Macromol. Sci. Part C Polym. Rev. 42, 235–289.
Milne, T.A., Chum, H.L., Agblevor, F., and Johnson, D.K. (1992). Standardized analytical methods. Biomass Bioenergy 2, 341–366.
Milton, F. (1995). The preservation of wood. Self-Study Man. Wood Treat. Coll. Nat. Resour. Univ. Minn. 102.
M.N. Mohamad, I., I. Nur, A., M.Y. Nor, N., and I. Mohd, S. (2006). Lignin Graft Copolymer as a Drilling Mud Thinner for High Temperature Well. J. Appl. Sci. 6, 1808–1813.

213
Mosier, N., Wyman, C., Dale, B., Elander, R., Lee, Y.Y., Holtzapple, M., and Ladisch, M. (2005). Features of promising technologies for pretreatment of lignocellulosic biomass. Bioresour. Technol. 96, 673–686.
Muurinen, E. (2000). Organosolv pulping – A review and distillation study related to peroxyacid pulping.
Nadif, A., Hunkeler, D., and Käuper, P. (2002). Sulfur-free lignins from alkaline pulping tested in mortar for use as mortar additives. Bioresour. Technol. 84, 49–55.
Nasar, K., Fache, F., Lemaire, M., Béziat, J.-C., Besson, M., and Gallezot, P. (1994). Stereoselective reduction of disubstituted aromatics on colloidal rhodium. J. Mol. Catal. 87, 107–115.
Nascimento, E.A., Morais, S.A., Machado, A.E., and Veloso, D.P. (1992). Studies of Eucalyptus grandis Lignin. Part II: High-Performance Size-Exclusion Chromatography of Milled Wood Lignin, Kraft and Organosolv Lignins. J Braz Chem Soc 3, 61–64.
Naven, T.J.P., and Harvey, D.J. (1996). Cationic Derivatization of Oligosaccharides with Girard’s T Reagent for Improved Performance in Matrix-assisted Laser Desorption/Ionization and Electrospray Mass Spectrometry. Rapid Commun. Mass Spectrom. 10, 829–834.
Norgren, M., Edlund, H., and Wagberg, L. (2002). Aggregation of lignin derivatives under alkaline conditions. Kinetics and aggregate structure. Langmuir 18, 2859–2865.
O’Sullivan, A.C. (1997). Cellulose: the structure slowly unravels. Cellulose 4, 173–207.
Parpot, P., Bettencourt, A.P., Carvalho, A.M., and Belgsir, E.M. (2000). Biomass conversion: attempted electrooxidation of lignin for vanillin production. J. Appl. Electrochem. 30, 727–731.
Patil, P.T., Armbruster, U., Richter, M., and Martin, A. (2011). Heterogeneously Catalyzed Hydroprocessing of Organosolv Lignin in Sub- and Supercritical Solvents. Energy Fuels 25, 4713–4722.
Paulsson, M., and Simonson, R. (2002). Acetylation of Lignin and Photostabilization of Lignin-Rich Mechanical Wood Pulp and Paper. In Chemical Modification, Properties, and Usage of Lignin, T.Q. Hu, ed. (Boston, MA: Springer US), pp. 221–245.
Pellinen, J., and Salkinoja-Salonen, M. (1985a). High-performance size-exclusion chromatography of lignin and its derivatives. J. Chromatogr. A 328, 299–308.
Pellinen, J., and Salkinoja-Salonen, M. (1985b). Aqueous size exclusion chomatography of industrial lignins. J. Chromatogr. A 322, 129–138.
Pepper, J.M., and Supathna, P. (1978). Lignin and related compounds. VI. A study of variables affecting the hydrogenolysis of spruce wood lignin using a rhodium-on-charcoal catalyst. Can. J. Chem. 56, 899–902.
Pepper, J.M., Steck, W.F., Swoboda, R., and Karapally, J.C. (1966). Hydrogenation of Lignin Using Nickel and Palladium Catalysts. In Lignin Structure and Reactions, (AMERICAN CHEMICAL SOCIETY), pp. 238–248.
Pizzi, A., and Walton, T. (1992). Non-Emulsifiable, Water-Based, Mixed Diisocyanate Adhesive Systems for Exterior Plywood - Part I. Novel Reaction Mechanisms and Their Chemical Evidence. Holzforsch. - Int. J. Biol. Chem. Phys. Technol. Wood 46, 541–547.

214
Podschun, J., Stücker, A., Saake, B., and Lehnen, R. (2015). Structure–Function Relationships in the Phenolation of Lignins from Different Sources. ACS Sustain. Chem. Eng. 3, 2526–2532.
Polčín, J. (1954). Study of alkali sulfite-lignin. I. Chlorination with hypochlorites. Chem. Pap. 4, 227–234.
Pouteau, C., Dole, P., Cathala, B., Averous, L., and Boquillon, N. (2003). Antioxidant properties of lignin in polypropylene. Polym. Degrad. Stab. 81, 9–18.
Prakobna, K., Kisonen, V., Xu, C. and Berglund, L, A. (2015). Strong reinforcing effects from galactoglucomannan hemicellulose on mechanical behavior of wet cellulose nanofiber gels. J Mater Sci 50, 7413–7423.
Puls, J., Janzon, R., and Saake, B. (2006). Comparative Removal of Hemiceluloses from Paper Pulps Using Nitren, Cuen, NaOH and KOH. Lenzing. Berichte 86, 63–70.
Ragauskas, A.J., Williams, C.K., Davison, B.H., Britovsek, G., Cairney, J., Eckert, C.A., Frederick, W.J., Hallett, J.P., Leak, D.J., Liotta, C.L., et al. (2006a). The Path Forward for Biofuels and Biomaterials. Science 311, 484–489.
Ragauskas, A.J., Nagy, M., Kim, D.H., Eckert, C.A., Hallett, J.P., and Liotta, C.L. (2006b). From wood to fuels: Integrating biofuels and pulp production. Ind. Biotechnol. 2, 55–65.
Ralph, J., Lundquist, K., Brunow, G., Lu, F., Kim, H., Schatz, P.F., Marita, J.M., Hatfield, R.D., Ralph, S.A., Christensen, J.H., et al. (2004). Lignins: Natural polymers from oxidative coupling of 4-hydroxyphenyl- propanoids. Phytochem. Rev. 3, 29–60.
Ramos, L.P. (2003). The chemistry involved in the steam treatment of lignocellulosic materials. Quím. Nova 26, 863–871.
Ringena, O., Lebioda, S., Lehnen, R., and Saake, B. (2006). Size-exclusion chromatography of technical lignins in dimethyl sulfoxide/water and dimethylacetamide. J. Chromatogr. A 1102, 154–163.
Robert, D.R., and Brunow, G. (1984). Quantitative estimation of hydroxyl groups in milled wood lignin from spruce and in a dehydrogenation polymer from coniferyl alcohol using 13C NMR spectroscopy. Holzforsch.-Int. J. Biol. Chem. Phys. Technol. Wood 38, 85–90.
Rönnols, J., Larsson, K., Jacobs, A., and Aldaeus, F. (2016). Absolute determination of softwood kraft lignin molar mass using MALDI-TOF mass spectrometry and pulsed field gradient NMR. In DIVA, pp. 143–146.
S. Aziz, and G.C. Goyal (1993). Kinetics of Delignification from Mechanistic and Process Control Point of View in Solvent Pulping Processes. In Proceedings of the TAPPI Pulping Conference, TAPPI, Atlanta, Georgia.
Saake, B., and Lehnen, R. (1990). Lignin in Ullmanns Encyclopedia of industrial chemistry. (American Cancer Society), pp. 303–315.
Sadeghifar, H., Cui, C., and Argyropoulos, D.S. (2012). Toward Thermoplastic Lignin Polymers. Part 1. Selective Masking of Phenolic Hydroxyl Groups in Kraft Lignins via Methylation and Oxypropylation Chemistries. Ind. Eng. Chem. Res. 51, 16713–16720.

215
Saito, T., H. Brown, R., A. Hunt, M., L. Pickel, D., M. Pickel, J., M. Messman, J., S. Baker, F., Keller, M., and K. Naskar, A. (2012). Turning renewable resources into value-added polymer : development of lignin -based thermoplastic. Green Chem. 14, 3295–3303.
Sannigrahi, P., and Ragauskas, A.J. (2013). Fundamentals of Biomass Pretreatment by Fractionation. In Aqueous Pretreatment of Plant Biomass for Biological and Chemical Conversion to Fuels and Chemicals, (Wiley-Blackwell), pp. 201–222.
Sarkanen, K.V., and Ludwig, C.H. (1971). Liguins. Occurrence, formation, structure, and reactions (New York.; Wiley-Interscience).
Sarkanen, S., Teller, D.C., Hall, J., and McCarthy, J.L. (1981). Lignin. 18. Associative Effects among Organosolv Lignin Componentst. 14, 9.
Sarkanen, S., Sarkanen, S., Teller, D.C., Abramowski, E., and McCarthy, J.L. (1982). Lignin. 19. Kraft Lignin Component Conformation and Associated Complex Configuration in Aqueous Alkaline Solution. Macromolecules 15, 1098–1104.
Sarkanen, S., Teller, D.C., Stevens, C.R., and Mccarthy, J.L. (1984). Lignin. 20. Associative Interactions Between Kraft Lignin Components. Macromolecules 17, 2588–2597.
Sasaki, M., Adschiri, T., and Arai, K. (2003). Production of Cellulose II from Native Cellulose by Near- and Supercritical Water Solubilization. J. Agric. Food Chem. 51, 5376–5381.
Schorr, D., Diouf, P.N., and Stevanovic, T. (2014). Evaluation of industrial lignins for biocomposites production. Ind. Crops Prod. 52, 65–73.
Sen, S., Patil, S., and Argyropoulos, D.S. (2015). Thermal properties of lignin in copolymers, blends, and composites: a review. Green Chem. 17, 4862–4887.
Serrano, L., Esakkimuthu, E.S., Marlin, N., Brochier-Salon, M.-C., Mortha, G., and Bertaud, F. (2018). Fast, Easy, and Economical Quantification of Lignin Phenolic Hydroxyl Groups: Comparison with Classical Techniques. Energy Fuels 32, 5969–5977.
Serrano Cantador, L., Esakkimuthu, E.S., Marlin, N., Brochier-Salon, M.-C., Mortha, G., and Bertaud, F. (2018). Fast, easy and economical quantification of lignin phenolic hydroxyl groups. Comparison with classical techniques. Energy Fuels 32, 5969–5977.
Sévillano, R.M. (1999). Structures des lignines résiduelles des pâtes chimiques: influence des méthodes d’extraction, des procédés de délignification et des essences de bois. Thesis.
Sevillano, R.M., Mortha, G., Barrelle, M., and Lachenal, D. (2001). 19F NMR Spectroscopy for the Quantitative Analysis of Carbonyl Groups in Lignins. Holzforschung 55, 286–295.
Shrotri, A., Kobayashi, H., and Fukuoka, A. (2018). Cellulose Depolymerization over Heterogeneous Catalysts. Acc. Chem. Res. 51, 761–768.
Siochi, E.J., Ward, T.C., Haney, M.A., and Mahn, B. (1990). The absolute molecular weight distribution of hydroxypropylated lignins. Macromolecules 23, 1420–1429.
Siró, I., and Plackett, D. (2010). Microfibrillated cellulose and new nanocomposite materials: a review. Cellulose 17, 459–494.
Sixta, H. (2006). Handbook of pulp. In Handbook of Pulp, (Wiley-VCH ; John Wiley, distributor]), p.

216
Sixta, H. (2008). Introduction. In Handbook of Pulp, (Wiley-Blackwell), pp. 2–19.
Sjöholm, E., Gustafsson, K., Norman, E., and Colmsjö, A. (1997). The effect of degradation on the strength of hardwood kraft pulp fibres. In Proc. 9th Int. Symp. Wood Pulping Chem, p. 106.
Sjostrom, E. (1993). Wood Chemistry: Fundamentals and Applications (Elsevier).
Spellman, F. (2011). Forest-Based Biomass Energy : Concepts and Applications (CRC Press).
Sridach, W. (2010). The environmentally benign pulping process of non-wood fibers. 17, 20.
Stankovikj, F., McDonald, A.G., Helms, G.L., and Garcia-Perez, M. (2016). Quantification of Bio-Oil Functional Groups and Evidences of the Presence of Pyrolytic Humins. Energy Fuels 30, 6505–6524.
Stein, T. vom, Grande, P., Sibilla, F., Commandeur, U., Fischer, R., Leitner, W., and María, P.D. de (2010). Salt-assisted organic-acid-catalyzed depolymerization of cellulose. Green Chem. 12, 1844–1849.
Stenius, P. (2000). Forest Products Chemistry - Part 3 (TAPPI).
Stenlund, B. (1976). Polyelectrolyte effects in gel chromatography. Adv. Chromatogr. 14, 38–74.
Strassberger, Z., Tanase, S., and Rothenberg, G. (2014). The pros and cons of lignin valorisation in an integrated biorefinery. RSC Adv. 4, 25310–25318.
Suib, S. (2013). New and future developments in catalysis: catalytic biomass conversion (Newnes).
Sun, Y., and Cheng, J. (2002). Hydrolysis of lignocellulosic materials for ethanol production: a review. Bioresour. Technol. 83, 1–11.
Syrjänen, K., and Brunow, G. (2000). Regioselectivity in lignin biosynthesis. The influence of dimerization and cross-coupling. J. Chem. Soc. Perkin 1 0, 183–187.
Tamminen, T., and Hortling, B. (1999). Isolation and characterization of residual lignin. In Progress in Lignocellulosics Characterization, (TAPPI Press), p.
Thielemans, W., and Wool, R.P. (2005). Lignin Esters for Use in Unsaturated Thermosets: Lignin Modification and Solubility Modeling. Biomacromolecules 6, 1895–1905.
Thring, R.W., Vanderlaan, M.N., and Griffin, S.L. (1996). Fractionation Of Alcell® Lignin By Sequential Solvent Extraction. J. Wood Chem. Technol. 16, 139–154.
Tiainen, E., Drakenberg, T., Tamminen, T., Kataja, K., and Hase, A. (1999). Determination of Phenolic Hydroxyl Groups in Lignin by Combined Use of 1H NMR and UV Spectroscopy. Holzforschung 53, 529–533.
Tien, M., and Kirk, T.K. (1983). Lignin-Degrading Enzyme from the Hymenomycete Phanerochaete chrysosporium Burds. Science 221, 661–663.
Tolbert, A., Akinosho, H., Khunsupat, R., Naskar, A.K., and Ragauskas, A.J. (2014). Characterization and analysis of the molecular weight of lignin for biorefining studies. Biofuels Bioprod. Biorefining 8, 836–856.

217
Tupciauskas, R., Gravitis, J., Abolins, J., Veveris, A., Andzs, M., Liitia, T., and Tamminen, T. (2017). Utilization of lignin powder for manufacturing self-binding HDF. Holzforschung 71, 555–561.
Umoren, S.A., and Solomon, M.M. (2016). Polymer Characterization : Polymer Molecular Weight Determination. p.
Vanholme, R., Demedts, B., Morreel, K., Ralph, J., and Boerjan, W. (2010). Lignin Biosynthesis and Structure. Plant Physiol. 153, 895–905.
Walther, T., Hensirisak, P., and Agblevor, F.A. (2001). The influence of aeration and hemicellulosic sugars on xylitol production by Candida tropicalis. Bioresour. Technol. 76, 213–220.
Wang, M., Sjöholm, E., and Li, J. (2016). Fast and reliable quantification of lignin reactivity via reaction with dimethylamine and formaldehyde (Mannich reaction). Holzforschung 71, 27–34.
Wegener, G., Przyklenk, M., and Fengel, D. (2009). Hexafluoropropanol as Valuable Solvent for Lignin in UV and IR Spectroscopy. Holzforsch. - Int. J. Biol. Chem. Phys. Technol. Wood 37, 303–307.
Wetzel, S., Guttman, C.M., and Flynn, K.M. (2003). The Influence of the Laser Energy and Matrix of MALDI on the Molecular Mass Distribution of Poly(ethylene glycol) | NIST. ACS PMSE Prepr. 88.
Windeisen, E., and Wegener, G. (2012). Lignin as Building Unit for Polymers-10.15.
Wu, L.C.-F., and Glasser, W.G. (1979). Utility of oxidative lignin determination methods for biodegraded lignocellulosic substrates. Biotechnol. Bioeng. 21, 1679–1683.
Wu, L.C.-F., and Glasser, W.G. (1984). Engineering plastics from lignin. I. Synthesis of hydroxypropyl lignin. J. Appl. Polym. Sci. 29, 1111–1123.
Wyman, C.E. (1994). Alternative fuels from biomass and their impact on carbon dioxide accumulation. Appl. Biochem. Biotechnol. 45, 897–915.
Xu, F., Sun, J.-X., Sun, R., Fowler, P., and Baird, M.S. (2006). Comparative study of organosolv lignins from wheat straw. Ind. Crops Prod. 23, 180–193.
Yue, X., Chen, F., and Zhou, X. (2011). Improved interfacial bonding of PVC/wood-flour composites by lignin amine modification. BioResources 6, 2022–2044.
Zakis, G.F. (1994). Functional analysis of lignins and their derivatives (TAPPI Press).
Zakzeski, J., Bruijnincx, P.C.A., Jongerius, A.L., and Weckhuysen, B.M. (2010). The Catalytic Valorization of Lignin for the Production of Renewable Chemicals. Chem. Rev. 110, 3552–3599.
Zawadzki, M. Quantitative Determination of Quinone Chromophore Changes during ECF Bleaching of Kraft Pulp; Institute of Paper Science and Technology: Atlanta, August 1999. PhD Thesis. Ph. D. Dissertation.
Zawadzki, M., and Ragauskas, A. (2001). N-Hydroxy Compounds as New Internal Standards for the 31P-NMR Determination of Lignin Hydroxy Functional Groups. Holzforschung 55, 283–285.
Zawadzki, M.A., and Ragauskas, A.J. (1999). Pulp properties influencing oxygen delignification bleachability.

218
Zhang, Y.-H.P. (2008). Reviving the carbohydrate economy via multi-product lignocellulose biorefineries. J. Ind. Microbiol. Biotechnol. 35, 367–375.
Zhang, J., Deng, H., Lin, L., Zhang, J., Deng, H., and Lin, L. (2009). Wet Aerobic Oxidation of Lignin into Aromatic Aldehydes Catalysed by a Perovskite-type Oxide: LaFe1-xCuxO3 (x=0, 0.1, 0.2). Molecules 14, 2747–2757.
Zhang, K., Bhuiya, M.-W., Pazo, J.R., Miao, Y., Kim, H., Ralph, J., and Liu, C.-J. (2012). An Engineered Monolignol 4-O-Methyltransferase Depresses Lignin Biosynthesis and Confers Novel Metabolic Capability in Arabidopsis. Plant Cell 24, 3135–3152.
Zhou, X., Li, W., Mabon, R., and Broadbelt, L.J. (2018). A mechanistic model of fast pyrolysis of hemicellulose. Energy Environ. Sci. 11, 1240–1260.
Zoia, L., Salanti, A., Frigerio, P., and Orlandi, M. (2014). Exploring Allylation and Claisen Rearrangement as a Novel Chemical Modification of Lignin. BioResources 9, 6540–6561.

219
Appendix A: Derivatization and Classification
of model compounds containing aldehyde and
ketone functional groups using 1H, 13C and 19F
NMR: Application to lignin carbonyl groups
quantification by 19F NMR
a) Introduction
13C NMR and 19F NMR techniques have been widely employed for the quantification of functional
groups present in lignin. For example, 13C NMR can be used for direct hydroxyl functional groups
measurement but some phenolic functionals were overlapped and therefore this technique couldn’t be
precisely assigned the spectrum. Labelling the position with either a most sensitive isotope nucleus
(19F, 31P), giving a new function, is another way around this problem. These techniques were
commonly used for OH functions measurements via acetylation, fluorosilylation or
phosphitylation(Zakis, 1994). Also, the absolute sensitivity and very good S/N (Signal/Noise) ratio of
19F NMR allow quantitative acquisitions rather rapid. In fact, it has been shown in chapter 4 that 19F
NMR technique has been used to understand the difference in chemical assignments of both aliphatic
and aromatic hydroxyls present in the model compounds. In addition, this method provides the
significant information regarding the reactivity of investigated model compounds towards
fluorobenzylation. The model compounds results were successfully incorporated into a lignin
compound (ORG lignin) to illustrate the chemical assignment as well as quantification of hydroxyl
groups. Therefore, it is evident that 19F NMR potentially offers a detailed picture for analyzing fluoro-
derivatized compounds.
In 2001, Sevillano et al., (Sévillano, 1999; Sevillano et al., 2001) performed 19F NMR analysis for
the quantification of carbonyl groups present in the lignin after different derivatizations such as
trifluoromethylphenylhydrazine, fluorobenzoylation of alcohol groups formed after NaBH4 reduction
of lignin. These derivatizations were compared with oximation method. The authors also investigated
five different model compounds containing aldehydes, ketones and quinones to assign the 19NMR
chemical shifts after trifluoromethylphenylhydrazine derivatization. The reaction between carbonyl
functional group of lignin with the trifluoromethyl phenylhydrazine is shown in Figure 1, followed by 19F NMR measurements to detect the resulting new hydrazone function and thus to quantify carbonyl
groups.
O H2N NH CF3 N NH CF3
+

220
Figure 1. Carbonyl labelling with fluorinated hydrazine
The authors were able to well-distinguish the carbonyl groups present in the aliphatic chain
(aldehydes and ketones) and aromatic ring (quinone) from the results and the peak assignments were
successfully applied to lignin sample. The results revealed that trifluoromethylphenylhydrazine is fast
and efficient method that provides a clear view of different carbonyls present in the system, i.e.,
aldehydes, ketones and quinone groups. This new method was applied and reported by several authors
as a specific technic for carbonyl measurements for lignin and lignocellulosic materials ((Brogdon et
al., 2005; Deng et al., 2009; El Mansouri and Salvadó, 2007; He et al., 2006; Holzgrabe et al., 2005;
Krolikowski, 2004; Lachenal et al., 2005; Martino et al., 2005; Matera et al., 2012; Zawadzki;
Zawadzki and Ragauskas, 1999). More recently, the Sévillano’s method had been used to quantify the
carbonyl functional groups in different bio-oils materials (Hao et al., 2016; Huang et al., 2014;
Stankovikj et al., 2016)
This section presents a more systematic study of the fluorination reaction with the fluorinated
hydrazine in order to validate this method as a technique for analyzing aldehyde and ketone groups in
lignins. The operating conditions of the fluorination reaction have been investigated in order to carry
out quantitative 19F NMR analysis. For that purpose, around twenty aldehyde and ketone model
compounds with the carbonyl function at α, β, and γ position with respect to the aromatic ring have
been selected. All the fluorination reactions have been carried out under in-situ condition (direct
reaction between the model and the derivatizing agent in the NMR tube) and the reaction kinetics
have been monitored by NMR to find the optimal operating conditions for obtaining a total chemical
reaction.
At the same time of this PhD work, Constant & al., (Constant et al., 2017) had undertaken a
similar study in the lignin field but more in the direction of industrial humin derivatives. The author
has studied different model compounds (which are byproduct in the lignin process and not the part of
the lignin structure) and modified some experimental conditions (for instance temperature, time). The
reactions were performed inside the NMR tube to minimize the potential loss during the handling, and
for non-symmetrical ketones the E and Z isomers were reported. However, there is no information
about the kinetics of the reaction and the authors considered that after 24 h the reaction was finished
as there is no significant evolution on the spectra.
In the present work, it is proposed to focus on the reaction kinetics using model compounds and
after to extend the study to the quantification of carbonyl groups in the technical Protobind 1000 (PB)
lignin using different conditions: conventional method (fluorination followed by the derivatized lignin

221
recovery using precipitation method) and comparison with the in-situ reaction kinetics with
Sévillano’s and Constant’s conditions.
b) Materials and methods
i) 19F NMR analysis conditions
Internal standard: First, the choice of the fluorinated compound as internal standard for both
chemical shifts analysis and quantification has been made. Sévillano made the choice of the guaiacyl
4-fluorobenzoate (GFB), a monofluorinated synthesized product. In our study, the
trifluoromethylbenzophenone (F3BP: mp = 114-116° C) (Figure 2) was chosen because it is a
trifluoromethyl compound more similar to fluorine-containing hydrazine : in our case, the internal
standard and the labelled compound to quantify exhibit same functional groups, which was not the
case with the GFB. Moreover, the fluorine atom directly borne by the aromatic carbon of GFB is
coupled with the aromatic protons which should be decoupled to avoid obtaining a “multiplet signal”
due to hetero coupling constant 3JHF (to avoid the nOe).
In addition, a CF3 group has a higher intensity than a single CF. The three fluorine atoms of the
trifluoromethyl group in F3BP are equivalent and give a single signal because the closest protons are 4
bonds distant (4JHF). It is then possible to work without any proton decoupling and therefore without
any integral perturbations due to the heteronuclear nOe
On the other hand, the chemical shifts of the CF3s atoms are close, making it possible to work with
a small acquisition spectral width, while CF and CF3 signals are separated from more than 50 ppm
leading to resolution decrease because most points of the acquisition are used to describe background
noise instead of the signal.
Figure 2. Internal standards: a) GFB: Guaiacyl 4-fluorobenzoate, b) F3BP:
Trifluoromethylbenzophenone

222
Relaxation delay: For quantitative measurements, it is very important to ensure that the chosen
relaxation delay d1 allows a full turn back to equilibrium for each compound (starting carbonyl
compound, hydrazine and resulting hydrazone). So, T1 relaxation time measurements have been
investigated for the internal standard, the fluorinated hydrazine, the resulting hydrazones, as well as
for the derivatized lignins using the inversion - recovery method. The measured times being less than
2 s for all compounds, a relaxation delay of 10 s has been chosen. In these conditions, all the species
present in solution have time to return to equilibrium and the measurements are carried out in a
quantitative mode.
Chemical shifts: The chemical shift of the internal standard F3BP in solution in DMSO-d6 is
compared to that of the hexafluorobenzene (C6F6) 101.025 ppm (-63.875 ppm / CFCl3).
Quantification.
As seen from the above section that F3BP compound contains a keto group which could easily
react with phenyl hydrazine. This compound was used as internal standard (IS) initially for
conventional measurement, however, no remaining hydrazine in the NMR tube, so no possibility of
reaction. For the kinetics study, at the beginning, F3BP was used with an internal coaxial tube (no
contact between IS and hydrazine). However, F3BP compound was placed with 4-
Methylbenzotrifluoride (MBTF), contains no keto group and therefore used for the kinetic
measurements. Moreover, no insert coaxial tube needed and hence easy for handling and calculation.
For the kinetics studies and conventional measurements, the internal standard (MBTF for kinetics,
F3BP for conventional) was weighed exactly and then added to the reaction medium. The amount of
lignin was also weighed precisely.
ii) Choice of model compounds
In their studies Sévillano & al., considered a limited number of model compounds with α –
carbonyls: 3 aldehydes and 1 ketone. Our work has been extended for a more systematic study,
considering around thirty commercial compounds, containing aldehyde or ketone functional groups in
the α-position (Table 1), β-position (Table 2) and γ-position (Table 3) of the aromatic ring. In
addition, compounds with hydroxyl or methoxy groups in 3 and 4 positions and 3, 4-ethylenedioxy
group have been selected. Compounds with a more complex structure have been also investigated: for
example, compounds 16, 21 and 24 containing aldehyde or ketone functions in a saturated aliphatic
chain and compounds 25, 26 and 27 carrying an additional aromatic unsaturation. These model
compounds could be encountered in lignocellulosic materials.

223
Table 1. Model compounds owing α-position carbonyl
Compound
n° R3 R4 R5 R7 Name
1 OMe OH H H- 4-Hydroxy-3-methoxy benzaldehyde
2 OMe OH OMe H- 4-Hydroxy-3,5-dimethoxybenzaldehyde
3 OMe OMe OMe H- 3,4,5-Trimethoxybenzaldehyde
4 H OH H Me- 4-Hydroxyacetophenone
5 OMe OH OMe Me- 4-Hydroxy-3,5-dimethoxyacetophenone
6 H H H Me(C=O)Et- 1-Phenyl-1,4-pentanedione
7 H H H PhEt- 1,3-Diphenyl-1-propaneone
8 H OH H PhCH=CH- Benzylidene-(4-hydroxyacetophenone)
9 H OMe H PhCH=CH- Benzylidene-(4-Methoxyacetophenone)
10 OMe OMe H 2-(OMe)PhOCH(CH2OH)- 1-(3,4-dimethoxy-phenyl)-3-hydroxyl-2-(2-
methoxy-phenoxy)-propan-1-one
11 OMe OH H 2-(OMe)PhOC(Me)(CH2OH)-
3-hydroxy-1-(4-hydroxy-3-methoxyphenyl)-2-(2-
methoxyphenoxy)propan-1-one

224
Table 2. Model compounds owing β-position carbonyl
Compounds
n°
R3 R4 R7 R9 Name
12 H H H H- Phenylacetaldehyde
13 H OMe H Me- 4-Methoxyphenylacetone
14 H H Me H- 2-Phenylpropionaldehyde
15 H H H iPropyl- 3-Methyl-1-phenyl-2-butanone
16 OCH2O OCH2O H Et- 1-(3,4-Methylenedioxy)-phenyl-2-
butanone
Table 3. Model compounds owing γ-position carbonyl

225
Compounds
n°
R4 Re4 R10 Re10 Name
17 OMe Me- 4-(4-Methoxyphenyl)-2-butanone
18 OH Me- Hydroxy-phenyl-2-butanone
19 H H 3-Phenylpropionaldehyde
20 OH 2,4,6-
(OH)3Ph-
2’,4’,6’-Trihydroxy-3-(4-
hydroxyphenyl)propiophenone
21 OCH2O Me 3,4-Methylenedioxybenzylacetone
22 OH Me 4-Hydroxybenzylideneacetone
23 OMe H 4-Methoxycinnamaldehyde
24 OCH2O Me 3,4-
(Methylenedioxy)benzylideneacetone
25 OMe Ph- 4-Methoxybenzylideneacetophenone
26 OH Ph- 4-Hydroxybenzylideneacetophenone
27 OMe 4-(OMe)Ph- 4,4’-
Dimethoxybenzylideneacetophenone
28 OMe Ph2- 3-(4-Methoxyphenyl)-1-(2-Naphtyl)-
prop-2-en-1-one
Other typical derivatives (Table 4), without any carbonyl group, but containing reactive functions
such as ethylenic bond, phenolic hydroxyl and carboxylic acid groups, have been tested. Normally,
none of these compounds should lead to the formation of hydrazine. Because lignin is a natural
macromolecule with numerous functional groups, it is important to control the selectivity of the
reaction and the absence of any secondary reaction which may lead to the detection of fluorinated
parasitic signals in the observation zone.

226
Table 4. Other typical model compounds, without carbonyl functions
Compound n° R7 Name
29 CO2H-CH2- 4-Hydroxy-3-methoxybenzoicacid
30 CH2OH- 4-Hydroxy-3-methoxybenzylicalcohol
31 CH2=CH-CH2- 4-Allyl-2-methoxyphenol
32 CH3-CH=CH- 2-Methoxy-4-propenylphenol
c) Model Compound fluorination - in-situ kinetics
i) Identification of the initial and reaction products
Before the derivatization, 1M solutions of carbonyl containing model compound (1 to 28) have
been prepared separately in DMSO-d6. Each model compound was analysed, and all its proton and
carbon chemical shifts were assigned using 13C and 1H NMR (Table 5 and Table 6)

227
Table 5. Model compounds 13C chemical shifts (ppm) in DMSO-d6 at 25°C, in bold of C=O groups
N° C1 C2 C3 C4 C5 C6 R3 R4 R5 R7 R8 R9 R10
1 129.66 114.42 131.73 164.20 131.73 114.42 55.56 191.13
2 127.24 107.10 148.17 142.17 148.17 107.10 56.06 56.06 191.09
3 131.34 106.68 153.31 142.87 153.31 106.68 55.95 60.12 55.95 191.68
4 128.65 115.67 130.69 162.65 130.69 115.17 195.98 26.17
5 127.49 106.25 147.54 141.00 147.54 106.25 56.09 56.09 196.20 26.22
6 136.45 128.63 127.77 133.46 127.77 128.63 198.52 36.34 ;32.14 ; 207.03 ; 29.62
7 141.20 128.60 127.85 133.0 127.85 128.60 198.97 28.44 ; 136.57 ; 128.20 ; 128.32 ; 125.79
8 142.67 131.32 115.52 162.61 115.52 131.32 187.16 130.26 ; 129.01 ; 134.94 ; 128.7 ; 122.2
9 143.04 130.84 113.93 163.18 113.93 130.84 55.44 187.35
130.44 ; 130.29 ; 134.78 ; 128.7 ; 128.8 ;
121.99
10 128.06 112.77 148.71 153.61 114.72 123.43 55.54 55.54 195.37
81.52 ; 62.68 ; 147.07 ; 149.32 ; 121.75 ;
110.9 ; 120.65 ; 55.81
11 126.7 111.8 146.7 152.43 116.6 122.0 55.53 196.27
92.2 ; 18.1 ; 75.12 ; 147.8 ; 149.3 ; 55.53 ;
114.7 ; 121.1 ; 121.4 ; 115.2
12 129.66 127.90 128.56 126.84 128.56 127.90 49.56 200.25
13 128.75 130.48 113.75 158.0 113.75 130.48 54.90 48.76 206.21 29.07
14 138.13 128.23 128.79 127.11 128.79 128.23 51.71 ; 201.62

228
14.40
15 134.99 129.51 128.10 126.29 128.10 129.51 46.53 211.18
39.53 ;
17.94
16 128.63 122.49 147.17 145.86 109.88 108.01 100.76 48.02 208.48
34.50 ;
7.54
17 131.95 129.06 113.64 157.47 113.64 129.06 54.86 28.24 44.42 207.57 29.58
18 131.17 129.0 115.1 155.47 115.1 129.0 28.39 44.57 207.81 29.68
19 125.88 128.17 128.28 128.28 128.28 128.17 27.47 44.33 202.52
20 131.64 129.16 115.06 164.6 115.06 129.16 29.44 45.46 204.23 155.39 ; 164.6
21 134.93 120.86 147.14 145.26 108.63 107.93 100.56 29.57 44.39 207.53 29.81
22 125.29 130.88 115.82 159.85 115.82 130.88 143.42 123.99 197.63 27.0
23 126.65 130.57 114.50 161.71 114.50 130.57 55.27 152.97 126.26 193.88
24 128.78 124.95 148.04 149.34 106.54 108.44 101.57 143.01 125.38 197.75 27.12
25 137.86 130.64 114.31 161.32 114.31 130.64 55.17 143.93 119.48 188.99 132.71 ; 128.6 ; 128.3 ; 127.24
26 125.73 130.98 115.87 160.2 115.87 130.98 144.54 118.53 189.05 138.02 ; 128.66 ; 128.3 ; 132.72
27 127.42 130.55 114.27 161.15 114.27 130.55 55.17 143.02 119.43 187.23 130.48 ; 113.81 ; 162.98 ; 55.34
28 127.34 130.65 114.29 161.29 114.29 130.65 55.16 143.79 119.54 188.72
132.29 ; 124.13 ; 134.89 ; 126.7 ;
128.23 ; 127.6 ; 135.2 ; 129.5

229
Table 6. Model compounds 1H NMR chemical shifts (ppm) in DMSO-d6 à 25°C
N° H2 H3 H4 H5 H6 R3 R4 R5 R7 R8 R9 R10
1 7.08 7.84 7.84 7.08 3.84 9.85
2 7.18 7.18 3.83 3.83 9.75
3 7.21 7.21 3.84 3.76 3.84 9.85
4 6.84 7.81 7.81 6.84 10.29 2.45
5 7.45 7.45 4.05 9.48 4.05 2.73
6 7.96 7.51 7.63 7.51 7.96 2.80 ; 3.21 ; 2.15
7 7.97 7.49 7.60 7.49 7.97 3.36 ; 2.95 ; 7.27 ;
7.16
8 8.1 6.93 6.93 8.1 7.7 ; 7.89 ; 7.83 ;
7.41 ; 7.42
9 8.16 7.06 7.06 8.16 3.83 7.91 ; 7.72 ; 7.84 ;
7.43 ; 7.42
10 7.29 6.74 7.34 3.73 3.73 5.28 ; 4.10 ; 6.66 ;
6.71 ; 3.75
11
6.75 7.65 6.80 3.8 10.15
1.56 ; 3.8 ; 5.76 ;
7.65 ; 6.80 ; 6.85 ;
3.80
12 7.24 7.30 7.35 7.30 7.24 3.22 9.69
13 6.87 7.10 7.10 6.87 3.72 3.65 2.08
14 7.29 7.24 7.36 7.24 7.29 3.75 ;
1.32 9.62
15 7.18 7.29 7.21 7.29 7.18 3.80 2.72 ;
1.02
16 6.73 6.80 6.62 5.95 3.61 2.44 ;
0.89
17 6.39 6.12 6.12 6.39 3.0 2.0 2.0 1.36
18 6.96 6.66 6.66 6.96 9.10 2.65 2.65 2.05
19 7.18 7.26 7.21 7.26 7.18 2.74 2.85 9.71

230
The exact quantities were calculated based on the number of C=O groups present in the model
compounds. For instance, if the model compound contains one C=O groups the one mole of CF3PH is
added in 1M/1M ratio. Similarly, if there are two C=O in the model compounds, the CF3PH quantity
was twice in comparison to only one C=O.
The quantities were calculated in mg to obtain final solutions one molar for carbonyl group. The
starting compound was dissolved with solvent in the NMR tube, and at time 0(t0), CF3PH solution
was added (for better handling CF3PH was previously dissolved with the same solvent, and the
quantity was previously calculated to lead a complete reaction 1:1 for each carbonyl group of the
compound). The total volume was 0.7mL for 5mm tubes, and 4mL for 10mm tubes.
Records of 1H, 13C and 19F NMR signals were performed at regular intervals after t0. The
derivatization reaction was followed directly in the NMR tube, following the evolution of the fluorine
signals. As the starting ratio of carbonyl / trifluoromethyl phenylhydrazine was 1 M / 1 M, the
decrease of the pristine hydrazine signal corresponds with the concomitantly occurrence and growth
of the new signal attributing to the hydrazone formation.
The control of the reacting products as well as the progress of the reaction was made by combining
the results obtained with the three nuclei: fluorine, carbon and proton. With 19F, the decrease of the
pristine hydrazine signal and the appearance of that of the resulting hydrazone, is followed. 13C NMR
analysis makes it possible to control the disappearance of C=O carbonyl, the appearance of the signal
corresponding to the formation of the C=N bond (region 145 ppm and 138 ppm) and the modification
20 7.0 6.65 6.65 7.0 2.75 3.21 5.79
21 6.76 6.76 6.63 5.93 2.68 2.68 2.06
22 7.51 6.82 6.86 7.51 10.04 6.58 7.50 2.26
23 7.56 6.98 6.98 7.56 3.78 6.69 7.60 9.59
24 7.30 6.92 7.15 6.06 6.65 7.50 2.27
25 8.13 6.98 6.98 8.13 3.77 7.75 7.75 7.80 ; 7.53 ; 7.62
26 8.11 6.87 6.87 8.11 10.2 7.61 7.51 7.73 ; 7.70 ; 7.53
27 8.13 6.98 6.98 8.13 3.78 7.69 7.72 7.80 ; 7.04 ; 3.82
28
8.00 6.99 6.99 8.0 3.77 7.78 7.97
7.84 ; 8.15 ; 8.20 ;
7.60 ; 7.60 ; 7.95 ;
8.89

231
of the aromatic carbon (C1) in para-position of CF3 (shift from 155 ppm towards 149 ppm). Moreover 1H NMR enables to follow the disappearance of the NH2 and that of the aldehyde proton. All other C
and H nuclei chemical shifts are slightly modified after reaction.
Table 7 summarizes the main changes, evidencing the hydrazone formation. In this table,
compound 0 corresponds to the starting reagent, the trifluoromethyl phenylhydrazine CF3PH. 19F
NMR also provides the additional information of E/Z isomers that exist in double bonds. In this case,
E isomer represents the higher priority groups or substituents present in the opposite side and vice-
versa. It is clearly seen form the Table 7 that the obtained values show no characteristic difference
between investigated aldehydes and ketone. These results are in well-agreement with recently
reported work from Constant et al(Constant et al., 2017).
Table 7. Main chemical shifts as hydrazone formation evidence (ppm) 1H, 13C and 19F in DMSO-d6
at 25°C

232
No. C=O C=N C1 Hald Hhydr F
0 155.22 -61.14
E Z
1 191.13 139.13 148.56 9.85 7.92 -61.54 -61.69
2 191.09 139.94 148.58 9.75 7.87 -61.53 -61.71
3 191.68 139.08 148.36 9.85 7.89 -61.61 -61.73
4 195.98 143.76 149.42 -61.51 -61.71
5 196.20 143.88 149.35 -61.56 -61.70
6 198.52
207.50
147.70
149.91
149.78
150.42
-61.52
-61.49
-61.66
-61.56
7 198.97 147.72 149.80 -61.67 -61.62
8 187.16 137.69 149.32 -61.85 -61.95
9 187.35 137.75 149.33 -61.91 -62.01
10 195.37 144.68 148.66 -62.05 -62.06
11 196.27 135.51 149.41 -61.67 -61.73
12 200.25 148.07 148.95 9.69 7.32 -61.54
13 206.21 148.05 149.55 -61.51 -61.52
14 201.62 145.52 148.92 9.62 7.27 -61.54 -61.69
15 211.18 149.66 153.64 -61.49 -61.50
16 208.48 149.54 151.74 -61.50 -61.51
17 207.57 149.95 150.34 -61.47
18 207.81 149.95 150.34 -61.47
19 202.52 142.26 148.86 9.71 7.28 -61.52 -61.67
20 204.23 149.12 149.81 -61.22 -61.45
21 207.53 150.07 150.46 -61.48
22 197.63 146.19 149.14 -61.51 -61.60
23 193.88 143.23 148.15 9.59 7.24 -61.62 -61.66
24 197.75 146.20 149.18 -61.71 -61.78
25 188.99 146.20 149.15 -61.94 -62.00
26 189.05 146.74 149.41 -61.99 -62.01
27 187.23 148.00 148.85 -61.41 -61.50
28 188.72 148.02 148.96 -61.90 -61.94

233
d) Fluorination kinetic study of model compounds
In this section, the kinetics of all considered model compounds against fluorination were
evaluated. It should be mentioned that there are two different conditions employed for this study: (1)
neutral medium – no additional reagent was added in NMR tube (2) acidic medium – in this case, a
small amount of orthophosphoric acid (2 drops) was added in the NMR tube. Only less reactive model
compounds were followed in acidic medium. The obtained kinetic results are discussed below.
i) Model compound fluorination kinetics in neutral medium
The fluorination kinetics of model compounds bearing α-position carbonyl (2 to 11) is
presented in Figure 3 and in Table 8. The obtained results illustrated that the compounds 2, 3 and 6
are rapidly derivatized and derivatization is total in less than 24 hours. For compounds 4 and 5, the
reaction is slower but again derivatization is efficient since after 72 hours the conversion is around
80%. On the other hand, model compounds 7, 8 and 11 lead to around 25 to 30% hydrazone
conversion after 72 hours reaction, which is very low compared to the above-mentioned compounds.
Moreover, the derivatization rate is also low. As for as model compounds 9 and 10 are concerned, the
carbonyl conversion is very low or almost null in neutral condition.
Figure 3. Fluorination kinetics of model compounds bearing α-position carbonyl group in neutral
condition

234
Table 8. Kinetic results (conversion in % and time in hours) and E/Z isomer in % of all model
compounds were compared in neutral and acetic medium.
Compound n° Species
Neutral medium Acidic medium Isomer E Isomer Z
conversion time conversion time
% (h) Rate, % (h) % %
1 Ald 100 3 - - 98 2
2 Ald 100 3 - - 99 1
3 Ald 100 3 - - 97 3
4 Ket 72 48 - - 99 1
5 Ket 83 48 - - 98 2
6 Ket + 0 24 100 1.5 20 80
(Ket ) 100 24 100 0.5 20 80
7 Ket 22 48 - - 25 75
8 Ket + Alkene 20 48 100 20 69 31
9 Ket + Alkene 6 48 100 18 67 33
10 Ket 0 48 100 16 55 45
11 Ket 19 48 - - 45 55
12 Ald 91 48 - - 100 0
13 Ket 93 48 - - 25 75
14 Ald 100 4 - - 95 5
15 Ket 85 48 - - 54 46
16 Ket 90 48 - - 60 40
17 Ket 100 8 - - 100 0
18 Ket 99 48 - - 100 0
19 Ald 78 48 - - 83 17
20 Ket 2 48 100 20 85 15
21 Ket 97 48 - - 100 0
22 Ket + Alken 65 48 - - 38 62
23 Ald + Alken 100 23 - - 75 25
24 Ket + Alken 61 48 100 0.25 32 68
25 Ket + Alken 6 48 100 14 61 39
26 Ket + Alken 26 48 100 15 58 42
27 Ket + Alken 0 48 100 18 65 35
28 Ket + Alken 0 48 100 16 61 39
29 Acid 0 48 0 24 x x
30 Alcool + Phenol 0 48 0 24 x x
31 Alken + Phenol 0 48 0 24 x x
32 Alken + Phenol 0 48 0% 24 x x

235
Ald - aldehyde, Ket – Ketone, E and Z isomer ratios (italic numbers and red color correspond to the
reaction in acidic medium)
Results for β-position carbonyl model compounds are shown in the Figure 4. The derivatization of
β-position carbonyl model compounds was achieved faster compared to α carbonyls. In particular, the
model compound 14 reached 100% conversion quite immediately and compounds 12, 13 and 16
reached 80 to 90% conversion within 24 hours. It is also noted that compound 15 reaches around 75%
conversion after around 24 hours and it attains the maximum conversion, around 90%, after 72 hours
reaction.
Figure 4. Fluorination kinetics of model compounds bearing β-position carbonyl group in neutral
condition
Fluorination kinetics of model compounds bearing γ-position carbonyl group in neutral condition
is shown in Figure 5. Compounds 20, 25, 26, 27 and 28, all bearing phenyl group at γ – position, show
poor reactivity with the CF3PH reagent in neutral condition and their corresponding conversion rate is
significantly low, around 30% or almost zero conversion. This low conversion could be explained by
the steric hindrance caused by phenyl ring. However, in the case of compounds 17, 18, 21 and 23, the
aliphatic substitution present at γ – position, enhances the conversion rate which reached 100% after
72 hours reaction. However, even after 48 hours reaction, the conversion rate was about 60 – 80 % for
compounds 19, 22, and 24.

236
Figure 5. Fluorination kinetics of model compounds bearing γ -position carbonyl group in neutral
condition
Comparing the conversion rate of model compounds with substituents at α, γ positions, the
compounds α: 9, 10 γ: 20, 25, 27, 28 revealed low conversion than other compounds. The low
conversion rate is directly associated to the polarization of C=O bonds. The carbonyl bond of
aldehydes and ketones has a high dipole moment (2.8 Debye on average) and this permanent double
bond polarization varies according to the substituents present in α and γ positions. The polarization of
C=O order is shown in Figure 6. The C=O groups with no or lower substituents at neighbouring
positions show a higher polarization than with higher number substitutions. Since, nitrogen from
hydrazine molecule is a nucleophilic atom with paired electrons, it is expected that nitrogenous
compounds could be linked to the carbonyl group.
Figure 6. Polarisation of the carbonyl bond and polarization order according to substituents
O
H
O
H
R
O
H
R2
O
R1
> >

237
It can be seen from the Table 8 and Figure 3, Figure 4 and Figure 5 that aldehydes are found much
more reactive than the corresponding ketones due to rather high polarization of aldehydes than
ketones. Among the investigated aldehydes, aldehydes at α position are the most reactive since the
conversion reached 100% in 3 hours. The more the carbonyl position is far from the aromatic ring, the
compound is less reactive by the cause of decreasing polarization of carbonyl bond. In fact, the
aldehyde at γ-position as in 19 compound (in Table 8) does not lead to a total reaction even after 48
hours (78% conversion), even if the reaction seems to be fast during the first minutes of reaction
(Figure 5). On the other hand, if a double bond is conjugated to the γ aldehyde, 23 for example, the
reactivity of the latter is much activated since there is total reaction after 24 hours.
As explained in the previous paragraph, ketones exhibit lowest reactivity. No complete reaction,
even after 48 hours, is observed, except for the compound 6 which is somewhat particular because it
is composed of two ketone groups, one in position and the other in δ position, the latter one being
included in the aliphatic chain. In fact, in the case of compound 6, only the ketone is converted into
hydrazone after 24 hours whereas ketone exhibits a poor reactivity since the C=O groups is still
clearly visible in 13C NMR (Figure 7). The corresponding chemical shift is lower than that of the δ
C=O group because of the conjugation with the aromatic ring. Finally, half of the CF3PH reagent
remained in the mixture as seen in 19F NMR spectra (Figure 8), which confirms that the derivatization
is not total.
Figure 7. 13C NMR spectra in DMSO-d6 of: (a) CF3PH, (b) model compound 6 before derivatization,
(c) model compound 6 kinetic in neutral medium after 1 day, (d) model compound 6 kinetic in acidic
medium after 1h

238
Figure 8. 19F NMR spectra in DMSO-d6 of: (a) CF3PH, (b) model compound 6 kinetic in neutral
medium after 1 day, (c) model compound 6 kinetic in acidic medium after 1h
Pursuing the analysis of ketone model compounds, it can be seen that carbonyl functions in γ-
position, as in compounds 17, 18 and 21 are more reactive than those in β-position, as in compounds
13, 15 and 16, with conversion rates respectively close to 100 and 90% after 48 hours reaction (Table
8). On the other hand, the ketones α (4, 5) are less reactive and their conversion is 72 % and 83 %
after 48 hours of reaction and compounds 10 and 11 are much less reactive or almost no reaction after
48 hours reaction time. The presence of conjugated ethylenic unsaturation greatly reduces reactivity;
the latter is even more affected by the presence of a second substituted or unsubstituted aromatic ring.
For compounds 8, 9, 20, 26, 25, 27 and 28, the choice of labelling the carbonyl in α or γ "priority"
position was chosen in comparison with lignin “fragment”. The position of the carbonyl groups
mainly referred for the lignin monomer unit (aromatic ring with OH and OMe group at position 3 and
4). In any case, for all these compounds, the conversion yield into hydrazone drops drastically or even
remains zero. The presence of an additional aromatic ring or ethylenic unsaturation completely
deactivates the reactivity by decreasing the polarization of the carbonyl bond.
ii) Model compound fluorination kinetics in acidic medium - results
The carbonyl group reacted with hydrazine in acidic medium and the possible reaction mechanism
is presented in Figure 9. The similar derivatization trials have been performed in the same operating
conditions, the only difference being the addition of orthophosphoric acid (2 drops) in the NMR tube.
The derivatization kinetics was followed only for the less reactive model compounds and the results
are illustrated in the Table 8.

239
Figure 9. Reaction mechanism of the formation of hydrazine into acidic medium
The fluorination reaction was studied in acidic medium because it is known that acidic conditions
increase the polarity of the starting carbonyl bond thus leading to the catalysis of the reaction. Model
compound fluorination kinetics are presented in Figure 10 and Figure 11. Only compounds exhibiting
low reactivity are investigated.
Figure 10. Fluorination kinetics of model compounds bearing α -position carbonyl group in acidic
condition
OH2N AH+
OH OH
H2N
A
- H+
OH
HN
A
- H2ON
A

240
Figure 11. Fluorination kinetics of model compounds bearing γ -position carbonyl group in neutral
condition
Figure 10 and Figure 11 show that α – position carbonyl (8, 9, 10) and γ-position carbonyl (20, 24,
25, 26, 27 and 28) unreactive model compounds in neutral condition, are much more reactive in
acidic medium and that the reaction is completed within a day. In all cases, 100% conversion rates are
achieved in less than 24 hours. It has been also observed that a reaction conversion rate for 24 was
only 61% after 48 hours of reaction in neutral medium and however, it becomes almost immediate in
acidic conditions.
As it could be seen on the 13C and 19F NMR spectra for model compound 6 (Figure 7 and Figure 8)
with ketone and δ- carbonyl positions. The compound 6 was chosen for acidic conditions, since
one does not react in neutral conditions 0% after 24 hours. Only the δ- position carbonyl react
faster in neutral medium, nevertheless the conversion of carbonyl at position becomes
predominant in acidic conditions. It should be mentioned that the compounds with β-position carbonyl
exhibited a rather good conversion rate in neutral conditions, thus testing acidic conditions were
unnecessary.
After full derivatization, in all cases, only one product has been identified by 1H and 13C NMR.
However, using 19F NMR analysis, two isomers E and Z (isomerism around the C = N double bond)
are found. E and Z isomers are present in variable proportions depending on the steric hindrance
around the carbonyl function. These isomers were detected more easily with 19F NMR than with 1H or 13C due to the higher sensitivity of fluorine nucleus in term of spectral width.

241
Moreover, in lignin macromolecule, carbonyl groups are "overlooked” among a multitude of other
functional groups. To be sure that the reaction with fluorinated hydrazine did not lead to the
production of spurious signals disturbing the NMR observations, lignin model compounds without
any carbonyl group have been investigated: phenol, methoxy, alcohol, ethylenic and carboxylic acid
groups containing model compounds, such as compounds 29 to 32. The fluorination reaction has been
performed first in neutral condition and then in acidic medium. 1H and 13C NMR spectra confirmed
that the starting compounds remain unchanged, even after longer (48 h) reaction time: all the starting
signals were detected without any modification. On 19F NMR spectra, the CF3PH signal and the
internal standard are detected only, with their initial ratios and without any change. Therefore, it is
clearly demonstrated that CF3-hydrazine derivatization is highly selective for carbonyl groups only.
All the results on model compounds are consistent with Constant’s work(Constant et al., 2017):
non-symmetrical ketone compounds lead to fluorinated derivatives with two forms, E and Z isomers.
Besides confirming the production of isomers, the ratio of each of them was calculated (Table 8).
From our analysis, it should be stressed that in order to derivatize all types of carbonyl group (α, β, γ),
the reaction should be performed in the acidic condition. In neutral medium, the conversion rate is
very low and takes a long reaction time. Finally, it is important to stress that other functional groups
such as hydroxyl, phenolic, carboxyl, etc., which are present in lignin macromolecule were not
sensitive to the derivatizing agent CF3PH.
e) Lignin Carbonyl group quantification after fluorination
i) Lignin derivatization with CF3PH, followed by 19F NMR analysis
The above method has been extended for lignin carbonyl group quantification, using only acidic
conditions to ensure that all possible aldehyde and / or ketone functional groups fully reacted
regardless of their chemical environment. Thus, several lignin samples (100mg) have been derivatized
with the trifluoromethyl phenylhydrazine (120mg) agent in acidic medium(4 drops of orthophosphoric
acid) and 4 mL of DMSO during 48 hours. After the reaction time, the derivatized product were
precipitated in large volume of distilled water(around 500 mL), then washed with cold water several
times to remove the residual reactants and the washed precipitate were dried in oven at 40°C. 19F
NMR analysis was carried out in a quantitative mode to determine the carbonyl group content. A 50
mg of derivatized lignin was solubilized into 0.7 mL of DMSO-d6. Then the internal standard 4
trifluoromethylbenzophenone (F3BP) (used for conventionally derivatized lignin samples) and 4-
Methylbenzotrifluoride-MBTF (used in in-situ reaction kinetics) was added to the solution. The exact
amounts of derivatized lignin and internal standard dissolved in DMSO-d6 were noted. The
quantitative 19F spectrum is recorded in less than 30 minutes. After 19F NMR quantitative data

242
acquisition and integral measurements, the number of aldehyde and ketone functions were calculated
according to the Equation , Equation 2 and Equation 3.
in mmol.g-1derivatized lignin
𝑛𝐶=𝑂 𝐹3𝐿 = 𝐴𝐿 × 𝑚𝐼𝑆 × 1000(𝐴𝐼𝑆 × 𝑚𝐹3𝐿 × 𝑀𝐼𝑆) Equation 1
in mmol.g-1non-derivatized lignin 𝑛𝐶=𝑂 𝐿 = 𝑛𝐶=𝑂 𝐹3𝐿[1 − (𝑛𝐶=𝑂 𝐹3𝐿 × 0.001 × (𝑀𝐹3𝑃𝐻 − 𝑀𝐻2𝑂))] Equation 2
in mmol.mol-1non-derivatized lignin
𝑛𝐶=𝑂 𝐿 = 𝐴𝐿 × 𝑚𝐼𝑆 × 1000[(𝐴𝐼𝑆 × 𝑚𝐹3𝐿 × 𝑀𝐼𝑆) − (𝐴𝐿 × 𝑚𝐼𝑆 × (𝑀𝐹3𝑃𝐻 − 𝑀𝐻2𝑂))] Equation 3
Where,
nC=O F3L = number of carbonyl groups in lignin derivatized
nC=O L = number of carbonyl groups in lignin non-derivatized
IS = Internal standard
AIS = Integral of the IS signal recorded in the 19F NMR signal, Generally = 1
mIS (mg) = mass of internal standard amount inside the tube
MIS (g) = molar mass of internal standard
MF3PH (g) = molar mass of 4-(trifluoromethyl)phenylhydrazine
mF3L (mg) = mass of derivatized lignin amount inside the tube
AL = Area of the lignin signal in the 19F NMR spectrum
Several lignin’s (after ethyl acetate washing) have been tested. Results are summarized in Table 9.
They are expressed in mmoles of carbonyl per mole or gram of non-derivatized lignin and in g of
carbonyl per g of derivatized lignin.

243
Table 9. Lignin carbonyl group quantification by 19F NMR analysis after lignin derivatization using
the trifluoromethyl phenylhydrazine agent
Ethylacetate
washed lignin
mmol of C=O (ketones, aldehydes)
per mol
non-derivatized L
per g
non-derivatized L
per g
F3-derivatized L
Indulin 0.157 0.784 0.698
Organosolv 0.246 1.232 1.031
Protobind 0.136 0.669 0.605
Kraft 0.210 1.044 0.932
Table 9 shows the results of mmol of C=O per gram of non derivatized and fluoroderivatized
lignin samples and mmol of C=O group per mol of non-derivatized lignin from the equation 1.1 to 1.3
based on the 19F NMR results. Four different technical lignins C=O groups were quantified using 19F
NMR, according to the results Organosolv lignin contains highest number of carbonyl groups than the
other lignins, next higher carbonyl group quantity observed with pine kraft lignins which is a
softwood lignin, indulin and Protobind lignins showed the lowest number of carbonyl groups. Indulin
and pine kraft lignin both were produced using kraft cooking process however the origin of the wood
is different. Pine is a softwood lignin and indulin is hardwood lignin. Softwood pine kraft lignin
showed higher carbonyl groups than hardwood indulin lignin sample, and Protobind lignin produced
from annual plant showed the least number of carbonyl groups.
To assess these results, complementary analyses have been done on the CTP Pine Kraft lignin. The
objective is to estimate the carbonyl group content via 13C NMR. For that purpose, a 13C NMR
quantitative analysis has been done on the lignin sample before and after the derivation with the
trifluoromethyl phenylhydrazine. Then the integrals of aromatic carbons from 160 to 100 ppm and of
the methoxy groups one at 56 ppm have been measured. Results are given in Table 10.

244
Table 10. 13C NMR integral value of lignin (aromatic and methoxy groups) before and after F3PH
derivatization.
19F NMR 13C NMR
Number of C=O / C9 unit
IAromatic
160 ppm to 100 ppm
IMethoxy
56 ppm
Pristine Lignin - 6 0.87
Derivatized Lignin 0.209 6 0.68
Derivatized Lignin
after 13C integrals
normalization
- 7.6764 0.87
In 13C NMR lignin quantitative analysis, the quantification per C9 skeletal unit (per mole) is
usually done by aromatic carbon integral normalization to 6 (6 aromatic carbons per skeletal C9
units). However, considering the lignin before and after derivatization, the only functional group
remaining unchanged is the methoxy one. The similar procedure has been tested with the systematic
study on model compounds. For an accurate 13C spectra normalization, the methoxy integral should be
kept constant, by multiplying all the integrals with the 0.87 / 0.68 ratio = 1.2794 (Table 10). Then, the
new value of the aromatic carbon integral becomes 7.6764, which represents 1.6764 increase in
comparison with that of the pristine lignin. This integral increase is only due to the following structure
modification:
N NH CF3
i.e. after the reaction with trifluoromethylphenylhydrazine, every carbonyl carbon (210 to 180 ppm)
disappears, at the same time, 8 supplementary carbon atoms appear, in the aromatic region
between160 to 100 ppm (CF3 125 ppm, C=N 160 ppm to 135ppm).
Finally, it could be assumed that the 1.6764 increase for the aromatic carbon integral corresponds
to 8 times carbon number per C9 unit. This gives 0.209 C=O. This value is similar to the 19F NMR
results (0.21) confirming that both methods consistent to the quantification of aldehyde and keto
groups quantification, especially for lignin materials.
i) Lignin derivatization kinetics studied in-situ in the 19F NMR tube
Constant et al. (Constant et al., 2017) studied the carbonyl quantification of humin materials, by
CF3PH derivatization at 40°C for 24 h, before NMR acquisition. In the present study, three methods
(our method, Constant and Sevillano) have been compared.

245
This work has been carried out on the Protobind1000 (PB) lignin after ethyl acetate washing. The
reaction was done using trifluoromethylphenylhydrazine (CF3PH) as derivatizing agent, in the
following conditions (Table 11):
Condition1: at room temperature in acidic medium - our present work
Condition2: at room temperature in neutral medium (Sevillano et al.,)
Condition3: at 40°C in neutral medium for 24 h (Constant et al)
Comparing all conditions, the present work followed the derivatization kinetics with 19F NMR for
72 h (3 days) at minimum in acidic medium.
Table 11. Different kinetic conditions investigated for carbonyl group study of PB Lignin
CONDITIONS
1
This work
2
Sevillano (2001)
3
Constant (2017)
REAGENTS
Lignin 100 mg 100 mg 100 mg
Reagent
4-Trifluoromethylphenyl
hydrazine (CF3PH) 120 mg 150 mg 93 mg
Internal sta60ndard
4-methylbenzotrifluoride 10 mg 10 mg 10 mg
Ortho phosphoric acid
(H3PO4) 2 drops - -
REACTION TEMPERATURE (°C) 25 25 40
REACTION DURATION (hours) 48 24 24
The 4-methylbenzotrifluoride has been chosen as internal standard in in-situ reaction kinetics since
it does not react with 4-(trifluoromethyl) phenylhydrazine (CF3PH). After 19F NMR quantitative data
acquisition and integral measurements, the aldehyde and ketone function quantity is deduced from the
Equation 4.
in mmol.g-1non-derivatized lignin
𝑛𝐶=𝑂 𝐿 = 𝐴𝐿 × 𝑚𝐼𝑆 × 1000(𝐴𝐼𝑆 × 𝑚𝐿 × 𝑀𝐼𝑆) Equation 4

246
Where,
AIS = Integral of IS, usually = 1
mIS (mg) = mass of internal standard amount inside the tube
MIS (g) = molar mass of internal standard
mL (mg) = mass of non-derivatized lignin amount inside the tube
AL = Area of the lignin integral
The results are given in mmol of C=O per gram of pristine lignin (starting before derivatization)
(Table 12 and Figure 12). In general, the reactions are carried in the lab scale (without using in situ)
which is referred as conventional method. The conventional method results were compared with other
conditions performed by in-situ method.
Figure 12. Carbonyl group conversion ratio with different experimental conditions
From Figure 12, after 24 h reaction, the maximum conversion of 0.72 was achieved with condition
1 (reaction in acidic medium). The final reached value was 0.76 mmol of C=O per gram of pristine
lignin. With condition 3, the conversion reached a plateau after 24 h reaction and no further spectral
changes on the 19F spectra after 24 h reaction. The obtained value for the carbonyl group conversion
0.545 was one-third smaller compared to that of our work.
With Sévillano conditions, condition 2, the result of model compounds showed that even after 3
days (72 h) no full carbonyl conversion was not achieved as confirmed with the low conversion rate
(0.486). The reaction was followed for 4 days reaction, there is no significant changes on the
conversion value.

247
Table 12. Reaction kinetics (mmol of C=O per gram) comparisons of in-situ method (Conditions 1 to
3) with conventional method
Time (h) nC=O
Condition 1
nC=O
Condition 2
nC=O
Condition3
nC=O
Conventional
method
0.25 0.293 0.164 0.222 0.744
0.5 0.346 0.180 0.248 0.744
1 0.385 0.210 0.293 0.744
2 0.411 0.253 0.327 0.744
3 0.454 0.269 0.363 0.744
4 0.508 0.282 0.384 0.744
5 0.536 0.292 0.369 0.744
6 0.549 0.301 0.389 0.744
8 0.596 0.314 0.409 0.744
10 0.620 0.336 0.422 0.744
12 0.642 0.336 0.444 0.744
16 0.693 0.357 0.478 0.744
20 0.704 0.375 0.499 0.744
24 0.726 0.401 0.509 0.744
48 0.770 0.448 0.525 0.744
72 0.760 0.486 0.537 0.744
96 0.769 0.545 0.744
112 0.764 0.744
The in-situ reaction kinetics (three different conditions inside NMR tube) is also compared with
the conventional reaction (reaction with CF3PH reagent for 48 h and lignin recovery through
precipitation) followed by the 19F NMR analysis. The value obtained from Equation 3 is 0.744 mmol
of C=O per gram of starting non-derivatized lignin.

248
The conventional method values were in good agreement with the condition 1 (our work). Based
on the results, we found that in order to get the complete carbonyl group conversion reaction at room
temperature in the acidic medium is adequate (condition 1), not necessary to increase the temperature
up to 40˚C (condition 3). Comparing (condition 2 and 3), heating the reaction mixture without acidic
condition significantly improves the reaction conversion in condition 3 than without heating
(condition 2).
Three different reaction condition (in-situ) were investigated for the PB1000 lignin and the
resulting 19F NMR spectra are shown in Figure 13 (Spectra A) and compared to the spectrum of
conventional derivatization, in which lignin was recovered through precipitation method (Spectra B).
Figure 13. 19F NMR spectra of PB1000 lignin ethylacetate washed. (A) in-situ derivatization (B)
derivatization with the conventional method
From the spectra issued, the slight shift in the in-situ kinetics observed on the residual signal of the
reagent (CF3PH) around -61.0 to -61.5 ppm is due to the effect of the pH of the reactional mixture
(acidic for condition 1 and neutral for condition 2 and 3). The pH was controlled it by drawing the
chemical shift variation of trifluoromethyl phenylhydrazine in function of pH in Figure 14. The NH-
NH2 function of this reagent was responsive to the pH, and this effect is noticeable on 19F NMR
chemical shifts. After formation, the hydrazones were not pH sensitive. This explains the small
shifting detected only for CF3PH reagent residual signal.

249
Figure 14. 19F NMR chemical shift of CF3PH in function of pH
f) Conclusion
In this chapter, various types of carbonyl lignin model compounds at positions α, β, γ and other
typical compounds have been investigated. Trifluoromethylphenyl hydrazine derivatization of model
compounds were performed inside the NMR tube (in-situ) and its reaction kinetics were observed at
neutral and acidic condition. The derivatization of model compounds containing carbonyl groups at β-
position was faster compared to α carbonyls. Compounds bearing phenyl group at γ – position, show
poor reactivity with the CF3PH reagent in neutral condition and their corresponding conversion rate is
significantly low. Few model compounds bearing α carbonyls showed poor reactivity in neutral
medium even after 72 hours of reaction time. In this case, the fluorination reaction was studied in
acidic medium because it is known that acidic conditions increase the polarity of the starting carbonyl
bond thus leading to the catalysis of the reaction. The results confirmed that the acidic condition
significantly improved the carbonyl conversion. The same method has been used to quantify the
carbonyl groups in lignin specifically.
Based on the model compounds results different technical lignins derivatization were studied using
in-situ reaction kinetics in acidic condition and the results were compared with other conditions
applied by Sévillano et al. and Constant et al. Our results show that CF3PH derivatization method is a
better choice for aldehyde and ketone compounds and the resulting hydrazone product was quantified
by 19F NMR analysis. The 19F NMR results revealed that higher amount of carbonyl group conversion
was achieved in both in-situ and conventional method in acidic medium. Whereas, other employed
conditions (2 and 3) exhibited lower carbonyl conversion.

250

251
References
Brogdon, D.B.N., Mancosky, D.G., and Lucia, L.A. (2005). New Insights into Lignin Modification
During Chlorine Dioxide Bleaching Sequences (I): Chlorine Dioxide Delignification. J. Wood Chem.
Technol. 24, 201–219.
Constant, S., Lancefield, C.S., Weckhuysen, B.M., and Bruijnincx, P.C.A. (2017). Quantification and
Classification of Carbonyls in Industrial Humins and Lignins by 19F NMR. ACS Sustain. Chem. Eng.
5, 965–972.
Deng, D., Deng, P., Wang, X., and Hou, X. (2009). Direct Determination of Sodium Fluoride and
Sodium Monofluorophosphate in Toothpaste by Quantitative 19F-NMR: A Green Analytical Method.
Spectrosc. Lett. 42, 334–340.
El Mansouri, N.-E., and Salvadó, J. (2007). Analytical methods for determining functional groups in
various technical lignins. Ind. Crops Prod. 26, 116–124.
Hao, N., Ben, H., Yoo, C.G., Adhikari, S., and Ragauskas, A.J. (2016). Review of NMR
Characterization of Pyrolysis Oils. Energy Fuels 30, 6863–6880.
He, W., Du, F., Wu, Y., Wang, Y., Liu, X., Liu, H., and Zhao, X. (2006). Quantitative 19F NMR
method validation and application to the quantitative analysis of a fluoro-polyphosphates mixture. J.
Fluor. Chem. 127, 809–815.
Holzgrabe, U., Deubner, R., Schollmayer, C., and Waibel, B. (2005). Quantitative NMR
spectroscopy—Applications in drug analysis. J. Pharm. Biomed. Anal. 38, 806–812.
Huang, F., Pan, S., Pu, Y., Ben, H., and J. Ragauskas, A. (2014). 19 F NMR spectroscopy for the
quantitative analysis of carbonyl groups in bio-oils. RSC Adv. 4, 17743–17747.
Krolikowski, P. (2004). The Use of 19F NMR to Monitor Organic Reactions on Solid Supports.
Lachenal, D., Benattar, N., Allix, M., Marlin, N., and Chirat, C. (2005). Bleachability of Alkaline
Pulps: Effect of Quinones Present in Residual Lignin. In 59th Appita Annual Conference and
Exhibition: Incorporating the 13th ISWFPC (International Symposium on Wood, Fibre and Pulping
Chemistry), Auckland, New Zealand, 16-19 May 2005: Proceedings, (Appita Inc.), p. 23.
Martino, R., Gilard, V., Desmoulin, F., and Malet-Martino, M. (2005). Fluorine-19 or phosphorus-31
NMR spectroscopy: A suitable analytical technique for quantitative in vitro metabolic studies of
fluorinated or phosphorylated drugs. J. Pharm. Biomed. Anal. 38, 871–891.

252
Matera, R., Gabbanini, S., Valvassori, A., Triquigneaux, M., and Valgimigli, L. (2012). Reactivity of
(E)-4-Hydroxy-2-nonenal with Fluorinated Phenylhydrazines: Towards the Efficient Derivatization of
an Elusive Key Biomarker of Lipid Peroxidation. Eur. J. Org. Chem. 2012, 3841–3851.
Sévillano, R.M. (1999). Structures des lignines résiduelles des pâtes chimiques: influence des
méthodes d’extraction, des procédés de délignification et des essences de bois. Thesis.
Sevillano, R.M., Mortha, G., Barrelle, M., and Lachenal, D. (2001). 19F NMR Spectroscopy for the
Quantitative Analysis of Carbonyl Groups in Lignins. Holzforschung 55, 286–295.
Stankovikj, F., McDonald, A.G., Helms, G.L., and Garcia-Perez, M. (2016). Quantification of Bio-Oil
Functional Groups and Evidences of the Presence of Pyrolytic Humins. Energy Fuels 30, 6505–6524.
Zakis, G.F. (1994). Functional analysis of lignins and their derivatives (TAPPI Press).
Zawadzki, M. Quantitative Determination of Quinone Chromophore Changes during ECF Bleaching
of Kraft Pulp; Institute of Paper Science and Technology: Atlanta, August 1999. PhD Thesis. Ph. D.
Dissertation.
Zawadzki, M.A., and Ragauskas, A.J. (1999). Pulp properties influencing oxygen delignification
bleachability.

253
Appendix B: Fluorobenzylation: Number of mole
hydroxyls calculations
This section presented to calculate the number of hydroxyl group present in the lignin which can be
obtained from fluorobenzylation derivatization of lignin.
The molar mass of initial lignin is ML = 200 g
x = Phenolic hydroxyl functions (φ-OH) mole of original lignin
y = aliphatic hydroxyl functions (1°)
After fluorobenzylation,
The molar mass of flurorobenzylated lignin is MLi
(1 – x – y) mole lignin non derivatized
1 mole “x” mole of lignin φ-OH fluoro derivatized
“y” mole of lignin aliphatic-OH fluoro derivatized
In the case of fluorobenzylation, lignin hydroxyl groups R| – OH (R| represents lignin), especially
phenolic hydroxyls are undergone fluorobenzylation using 4-Fluorobenzylchloride (F1) and form
fluorobenzylated lignin (lignin – ORF1).
R| – OH R| – ORF + HCl IS = Internal standard, Molar mass, MIS = 138.14 g
F = 4-Fluorobenzylchloride (FBC), Molar mass MF = 144.5 g
HCl, Molar mass MHCl = 36.47 g
Based on the fluorobenzylation, the molar mass of derivatized lignin is calculated from the following
relation. MLi – molar mass of derivatized lignin, ML – molar mass of initial or underivatized lignin.

254
𝑀𝐿𝑖 = 𝑀𝐿 + 𝑥 𝑀𝐻𝐶𝑙 + 𝑦 𝑀𝐹 − 𝑦 𝑀𝐻𝐶𝑙
Molar mass of fluoro derivatized lignin introduced 𝑀𝐿𝑖 = 𝑀𝐿 + (𝑥 + 𝑦) × ( 𝑀𝐹 − 𝑀𝐻𝐶𝑙) Equation 5
After substitution, 𝑀𝐹 − 𝑀𝐻𝐶𝑙 = 108.03 𝑔 Equation 6
Therefore, 𝑀𝐿𝑖 = 𝑀𝐿 + (𝑥 + 𝑦) × 108.03 Equation 7
From GPC analysis, the area of internal standard (AIS), integrated area of fluorobenzylated aromatic
ALix (φ-OH) and aliphatic ALiy (aliphatic-OH) hydroxyls lignin, mass of internal standard (mIS) and
mass of derivatized lignin (mLi).
𝐴𝐼𝑆 = 𝑘 × 𝑚𝐼𝑆𝑀𝐼𝑆 𝑘 = 𝐴𝐼𝑆 × 𝑀𝐼𝑆𝑚𝐼𝑆
Equation 8
𝐴𝐿𝑖𝑥 = 𝑘 × 𝑥 𝑚𝐿𝑖𝑀𝐿𝑖 𝑘 = 𝐴𝐿𝑖𝑥 × 𝑀𝐿𝑖𝑥 × 𝑚𝐿𝑖
Equation 9
𝐴𝐿𝑖𝑦 = 𝑘 × 𝑦 𝑚𝐿𝑖𝑀𝐿𝑖 𝑘 = 𝐴𝐿𝑖𝑦 × 𝑀𝐿𝑖𝑦 × 𝑚𝐿𝑖 Equation 10
From the above Equation 8, Equation 9, Equation 10, the following relations are derived, 𝐴𝐼𝑆 × 𝑀𝐼𝑆 × 𝑚𝐿𝑖 × 𝑥 = 𝐴𝐿𝑖𝑥 × 𝑀𝐿𝑖 × 𝑚𝐼𝑆 Equation 11 𝐴𝐼𝑆 × 𝑀𝐼𝑆 × 𝑚𝐿𝑖 × 𝑦 = 𝐴𝐿𝑖𝑦 × 𝑀𝐿𝑖 × 𝑚𝐼𝑆 Equation 12
Since, 𝐴𝐼𝑆 = 1
The Equation 11 can be written as
𝑥 = 𝐴𝐿𝑖𝑥 × 𝑀𝐿𝑖𝑀𝐼𝑆 × 𝑚𝐼𝑆𝑚𝐿𝑖 Equation 13
Similarly, Equation 12 becomes
𝑦 = 𝐴𝐿𝑖𝑦 × 𝑀𝐿𝑖𝑀𝐼𝑆 × 𝑚𝐼𝑆𝑚𝐿𝑖 Equation 14
Since, Equation 9 equals to Equation 10

255
𝑘 = 𝐴𝐿𝑖𝑥 × 𝑀𝐿𝑖𝑥 × 𝑚𝐿𝑖 = 𝐴𝐿𝑖𝑦 × 𝑀𝐿𝑖𝑦 × 𝑚𝐿𝑖 Equation 15
Rearranging the Equation 15, 𝑦 × 𝐴𝐿𝑖𝑥 × 𝑀𝐿𝑖 × 𝑚𝐿𝑖 = 𝑦 × 𝐴𝐿𝑖𝑥 × 𝑀𝐿𝑖 × 𝑚𝐿𝑖
𝑦 = 𝑥 × 𝐴𝐿𝑖𝑦𝐴𝐿𝑖𝑥 Equation 16
Substitute the Equation 16 to Equation 6,
𝑀𝐿𝑖 = 𝑀𝐿 + (𝑥 + 𝑥 × 𝐴𝐿𝑖𝑦𝐴𝐿𝑖𝑥) × 108.03
𝑀𝐿𝑖 = 𝑀𝐿 + 𝑥 × (1 + 𝐴𝐿𝑖𝑦𝐴𝐿𝑖𝑥) × 108.03 Equation 17
The Equation 13 can be modified by substituting Equation 17,
𝑥 = 𝐴𝐿𝑖𝑥 × 𝑚𝐼𝑆𝑚𝐿𝑖 × [𝑀𝐿𝑖𝑀𝐼𝑆 + 108.03𝑀𝐼𝑆 × 𝑥 × (1 + 𝐴𝐿𝑖𝑦𝐴𝐿𝑖𝑥) ] Equation 18
However, 𝑀𝐿𝑖𝑀𝐼𝑆 = 1,447 g
The Equation 18 becomes,
𝑥 = 1.447 × 𝐴𝐿𝑖𝑥 × 𝑚𝐼𝑆𝑚𝐿𝑖 + 𝑥 × 𝐴𝐿𝑖𝑥𝑀𝐼𝑆 × 108.03 × 𝑚𝐼𝑆𝑚𝐿𝑖 × (1 + 𝐴𝐿𝑖𝑦𝐴𝐿𝑖𝑥) Equation 19
𝑥 [1 − 108.03 × 𝐴𝐿𝑖𝑥𝑀𝐼𝑆 × 𝑚𝐼𝑆𝑚𝐿𝑖 × (1 + 𝐴𝐿𝑖𝑦𝐴𝐿𝑖𝑥) ] = 1.447 × 𝐴𝐿𝑖𝑥 × 𝑚𝐼𝑆𝑚𝐿𝑖
𝑥 = 1.447 × 𝐴𝐿𝑖𝑥 × 𝑚𝐼𝑆𝑚𝐿𝑖[1 − 108.03 × 𝐴𝐿𝑖𝑥𝑀𝐼𝑆 × 𝑚𝐼𝑆𝑚𝐿𝑖 × (1 + 𝐴𝐿𝑖𝑦𝐴𝐿𝑖𝑥) ]
Equation 20
Since, 𝑀𝐼𝑆 138.14 and therefore = 108.03138.14 = 0.782
After substituting the value, the Equation 20 turned into
𝑥 = 1.447 × 𝐴𝐿𝑖𝑥 × 𝑚𝐼𝑆𝑚𝐿𝑖[1 − 0.782 × 𝐴𝐿𝑖𝑥 × 𝑚𝐼𝑆𝑚𝐿𝑖 × (1 + 𝐴𝐿𝑖𝑦𝐴𝐿𝑖𝑥) ]
Equation 21
Similarly, for “y”

256
𝑦 = 1.447 × 𝐴𝐿𝑖𝑦 × 𝑚𝐼𝑆𝑚𝐿𝑖[1 − 0.782 × 𝐴𝐿𝑖𝑥 × 𝑚𝐼𝑆𝑚𝐿𝑖 × (1 + 𝐴𝐿𝑖𝑦𝐴𝐿𝑖𝑥) ]
Equation 22
From the above Equation 21and Equation 22, the x and y values are calculated. The obtained values
correspond to the mole-OH present per mole of original lignin. “x” and “y” values represent aromatic
and aliphatic hydroxyl groups in lignin molecule.

257
Appendix C: Fluorobenzoylation: Number of mole
hydroxyls calculations
This section devoted to calculating the number of moles of lignin is being derivatized using
fluorobenzoylation. In this case,
Initial lignin = ML = 200 g
u = Phenolic hydroxyl functions (φ-OH)
mole of original lignin v = Phenolic hydroxyl functions (φ-OH)
y = Primary hydroxyl functions (1°)
z = Secondary hydroxyl functions (2°)
After fluorobenzoylation,
Fluroro derivatized lignin, MLi = molar mass
(1 – u – v – y – z) mole lignin
“u” mole lignin derivatized (φ-OH: Fluorobenzylated)
1 mole “v” mole lignin derivatized (φ-OH: Fluorobenzoylated)
“y” mole lignin derivatized (aliphatic 1°-OH: Fluorobenzylated)
“z” mole lignin derivatized (aliphatic 2°-OH: Fluorobenzoylated)
In the case of fluorobenzylation, lignin hydroxyl groups R| – OH (R| represents lignin), especially
phenolic hydroxyls are undergone fluorobenzylation using 4-Fluorobenzylchloride (F1) and form
fluorobenzylated lignin (lignin – ORF1).
R| – OH R| – ORF1 + HCl IS = Internal standard, Molar mass MIS = 138.14 g
F1 = 4-Fluorobenzylchloride (FBC), Molar mass MF1 = 144.5 g

258
HCl, Molar mass MHCl = 36.47 g
After fluorobenzylation, the reaction is forwarded to fluorobenzoylation, treating fluorobenzylated
lignin (R| – ORF1) with 4-Fluorobenzoic Anhydride to give fluorobenzoylated lignin (lignin –
O(C=O)R||F1). In this reaction, remaining hydroxyls, mostly aliphatic hydroxyl groups are
fluorobenzoylated.
OH – R| – ORF1 F2R||C(=O)O – ORF1 + FBA
F2 = 4-Fluorobenzoic anhydride (FBAA),
Molar mass MF2 = 262.2 g
FBA, 4-Fluorobenzoicacid, Molar mass MFBA =
140.1 g
From the above reactions, molar mass of derivatized lignin (MLi) is thus calculated, 𝑀𝐿𝑖 = 𝑀𝐿 + 𝑢 𝑀𝐹1 − 𝑢 𝑀𝐻𝐶𝑙 + 𝑦 𝑀𝐹1 − 𝑦 𝑀𝐻𝐶𝑙 + 𝑣 𝑀𝐹2 − 𝑣 𝑀𝐹𝐵𝐴 + 𝑧 𝑀𝐹2 − 𝑧 𝑀𝐹𝐵𝐴
Equation 1
𝑀𝐿𝑖 = 𝑀𝐿 + (𝑢 + 𝑦) × (𝑀𝐹1 − 𝑀𝐻𝐶𝑙) + (𝑣 + 𝑧) × (𝑀𝐹2 − 𝑀𝐹𝐵𝐴) Equation 2
Substituting all molar mass values, the molar mass of derivatized lignin 𝑀𝐿𝑖 = 𝑀𝐿 + (𝑢 + 𝑦) × 108.03 + (𝑣 + 𝑧) × 122.1 Equation 3
The following relations can be obtained from GPC results. AIS – area of internal standard, MIS – molar
mass of internal standard, mLi – mole of lignin, ALiu – area of lignin fluorobenzylated (phenolic
hydroxyl group), MLi – molar mass of lignin, mIS – mole of internal standard, ALiv – area of lignin
fluorobenzoylated (phenolic hydroxyl group), ALiy – area of lignin fluorobenzylated (aliphatic 1°
hydroxyl group), ALiz – area of lignin fluorobenzoylated (aliphatic 2° hydroxyl group) 𝐴𝐼𝑆 × 𝑀𝐼𝑆 × 𝑚𝐿𝑖 × 𝑢 = 𝐴𝐿𝑖𝑢 × 𝑀𝐿𝑖 × 𝑚𝐼𝑆 Equation 4 𝐴𝐼𝑆 × 𝑀𝐼𝑆 × 𝑚𝐿𝑖 × 𝑣 = 𝐴𝐿𝑖𝑣 × 𝑀𝐿𝑖 × 𝑚𝐼𝑆 Equation 5 𝐴𝐼𝑆 × 𝑀𝐼𝑆 × 𝑚𝐿𝑖 × 𝑦 = 𝐴𝐿𝑖𝑦 × 𝑀𝐿𝑖 × 𝑚𝐼𝑆 Equation 6

259
𝐴𝐼𝑆 × 𝑀𝐼𝑆 × 𝑚𝐿𝑖 × 𝑧 = 𝐴𝐿𝑖𝑧 × 𝑀𝐿𝑖 × 𝑚𝐼𝑆 Equation 7
After rearranging the above equations Equation 4, Equation 5, Equation 6 and Equation 7,
𝑣 = 𝑢 × 𝐴𝐿𝑖𝑣𝐴𝐿𝑖𝑢 𝑦 = 𝑢 × 𝐴𝐿𝑖𝑦𝐴𝐿𝑖𝑢 𝑧 = 𝑢 × 𝐴𝐿𝑖𝑧𝐴𝐿𝑖𝑢
Substituting the v, y and z to the Equation 3,
𝑀𝐿𝑖 = 𝑀𝐿 + (𝑢 + 𝑢 × 𝐴𝐿𝑖𝑦𝐴𝐿𝑖𝑢) × 108.03 + (𝑢 × 𝐴𝐿𝑖𝑣𝐴𝐿𝑖𝑢 + 𝑢 × 𝐴𝐿𝑖𝑧𝐴𝐿𝑖𝑢) × 122.1 Equation 8
𝑀𝐿𝑖 = 𝑀𝐿 + 𝑢 [108.03 × (1 + 𝐴𝐿𝑖𝑦𝐴𝐿𝑖𝑢) + 122.1 × (𝐴𝐿𝑖𝑣 + 𝐴𝐿𝑖𝑧𝐴𝐿𝑖𝑢 )] Equation 9
The Equation 4 can be written as,
𝑢 = 𝐴𝐿𝑖𝑢 × 𝑚𝐼𝑆 × 𝑀𝐿𝑖𝐴𝐼𝑆 × 𝑚𝐿𝑖 × 𝑀𝐼𝑆 Equation 10
Since 𝐴𝐼𝑆 = 1, therefore
𝑢 = 𝐴𝐿𝑖𝑢 × 𝑚𝐼𝑆 × 𝑀𝐿𝑖𝑚𝐿𝑖 × 𝑀𝐼𝑆 Equation 11
Substitute Equation 11 to the Equation 9,
𝑢 = 𝐴𝐿𝑖𝑢𝑀𝐼𝑆 × 𝑚𝐼𝑆𝑚𝐿𝑖 × [𝑀𝐿 + 𝑢 [108.03 × (1 + 𝐴𝐿𝑖𝑦𝐴𝐿𝑖𝑢) + 122.1 × (𝐴𝐿𝑖𝑣 + 𝐴𝐿𝑖𝑧𝐴𝐿𝑖𝑢 )]] Equation 12
𝑢 = 𝐴𝐿𝑖𝑢 × 𝑚𝐼𝑆𝑚𝐿𝑖 × 𝑀𝐿𝑀𝐼𝑆 + 𝑢 × 𝐴𝐿𝑖𝑢𝑀𝐼𝑆× 𝑚𝐼𝑆𝑚𝐿𝑖 [108.03 × (1 + 𝐴𝐿𝑖𝑦𝐴𝐿𝑖𝑢) + 122.1 × (𝐴𝐿𝑖𝑣 + 𝐴𝐿𝑖𝑧𝐴𝐿𝑖𝑢 )]
Equation 13

260
And 𝑀𝐿𝑀𝐼𝑆 = 1.447
𝑢 × [1 − 𝐴𝐿𝑖𝑢𝑀𝐼𝑆 × 𝑚𝐼𝑆𝑚𝐿𝑖 [108.03 × (1 + 𝐴𝐿𝑖𝑦𝐴𝐿𝑖𝑢) + 122.1 × (𝐴𝐿𝑖𝑣 + 𝐴𝐿𝑖𝑧𝐴𝐿𝑖𝑢 )]]= 1.447 × 𝐴𝐿𝑖𝑢 × 𝑚𝐼𝑆𝑚𝐿𝑖
Equation 14
𝑢 = 1.447 × 𝐴𝐿𝑖𝑢 × 𝑚𝐼𝑆𝑚𝐿𝑖× 1[1 − 𝐴𝐿𝑖𝑢138.14 × 𝑚𝐼𝑆𝑚𝐿𝑖 [108.03 × (1 + 𝐴𝐿𝑖𝑦𝐴𝐿𝑖𝑢) + 122.1 × (𝐴𝐿𝑖𝑣 + 𝐴𝐿𝑖𝑧𝐴𝐿𝑖𝑢 )]]
Equation 15
𝑢 = 1.447 × 𝐴𝐿𝑖𝑢 × 𝑚𝐼𝑆𝑚𝐿𝑖[1 − 𝐴𝐿𝑖𝑢138.14 × 𝑚𝐼𝑆𝑚𝐿𝑖 [108.03 × (1 + 𝐴𝐿𝑖𝑦𝐴𝐿𝑖𝑢) + 122.1 × (𝐴𝐿𝑖𝑣 + 𝐴𝐿𝑖𝑧𝐴𝐿𝑖𝑢 )]]
Equation 16
Similarly, for the case of “v” calculation
𝑣 = 1.447 × 𝐴𝐿𝑖𝑣 × 𝑚𝐼𝑆𝑚𝐿𝑖[1 − 𝐴𝐿𝑖𝑢138.14 × 𝑚𝐼𝑆𝑚𝐿𝑖 [108.03 × (1 + 𝐴𝐿𝑖𝑦𝐴𝐿𝑖𝑢) + 122.1 × (𝐴𝐿𝑖𝑣 + 𝐴𝐿𝑖𝑧𝐴𝐿𝑖𝑢 )]]
Equation 17
and “y” calculation
𝑦 = 1.447 × 𝐴𝐿𝑖𝑦 × 𝑚𝐼𝑆𝑚𝐿𝑖[1 − 𝐴𝐿𝑖𝑢138.14 × 𝑚𝐼𝑆𝑚𝐿𝑖 [108.03 × (1 + 𝐴𝐿𝑖𝑦𝐴𝐿𝑖𝑢) + 122.1 × (𝐴𝐿𝑖𝑣 + 𝐴𝐿𝑖𝑧𝐴𝐿𝑖𝑢 )]]
Equation 18
and “z” calculation
𝑧 = 1.447 × 𝐴𝐿𝑖𝑧 × 𝑚𝐼𝑆𝑚𝐿𝑖[1 − 𝐴𝐿𝑖𝑢138.14 × 𝑚𝐼𝑆𝑚𝐿𝑖 [108.03 × (1 + 𝐴𝐿𝑖𝑦𝐴𝐿𝑖𝑢) + 122.1 × (𝐴𝐿𝑖𝑣 + 𝐴𝐿𝑖𝑧𝐴𝐿𝑖𝑢 )]]
Equation 19
The final values of “u, v, y, z” are in mole OH / mole of original lignin – non derivatized

261

262

263
Summary
Lignin is the second most abundant biopolymer on earth after cellulose and it consists of highly-
branched, three dimensional aromatic structures with variety of functional groups. This research work
was to establish lignin derivatization methods for lignin analysis, to quantify functional groups and to
determine lignin molar mass distribution (MMD) by size exclusion chromatography. Five different
technical lignin samples are considered: Protobind 1000 lignin, Organosolv lignin, Pine Kraft lignin,
Eucalyptus Kraft lignin and Indulin lignin. Lignin samples are derivatized through classical
acetylation method and new methods such as fluorobenzylation and fluorobenzoylation. The number
of hydroxyl present in the lignin samples are quantified through GC and NMR (1H, 13C, 19F and 31P)
techniques. The molar mass distribution of derivatized lignin samples are calculated using different
SEC columns with different solvents (DMAc and THF). Conventional and universal calibration
methods are used for MMD calculations. With this approach, new derivatization methods
significantly enhance the solubility in THF column system, and the universal calibration method
detects the three times higher molar mass than conventional calibration method.
Résumé
La lignine est le deuxième biopolymère et le plus abondant sur la planète après la cellulose. Elle se
compose de structures aromatiques tridimensionnelles hautement ramifiées, comportant divers
groupes fonctionnels. Ce travail de recherche visait à établir des méthodes de dérivatisation de la
lignine pour l'analyse de la lignine, à quantifier les groupes fonctionnels et à déterminer la distribution
de la masse molaire de la lignine (DMM) par chromatographie par exclusion de taille. Cinq
échantillons techniques de lignine sont pris en compte: la lignine Protobind 1000, la lignine
Organosolv, la lignine Pine Kraft, la lignine Eucalyptus Kraft et la lignine Induline. Les échantillons
de lignine sont transformés en dérivés par une méthode classique d’acétylation et de nouvelles
méthodes telles que la fluorobenzylation et la fluorobenzoylation. Le nombre d'hydroxyles présents
dans les échantillons de lignine est quantifié par des techniques GC et RMN (1H, 13C, 19F and 31P). La
distribution en masse molaire des échantillons de lignine dérivatisés est calculée en utilisant
différentes colonnes SEC avec différents solvants (DMAc et THF). Des méthodes d'étalonnage
conventionnelles et universelles sont utilisées pour les calculs MMD. Avec cette approche, les
nouvelles méthodes de dérivatisation améliorent de manière significative la solubilité dans le système
de colonne THF, et la méthode d'étalonnage universelle détecte la masse molaire trois fois supérieure
à la méthode d'étalonnage conventionnelle.

264

265
Résumé en Français
1. INTRODUCTION
La biomasse lignocellulosique est considérée aujourd’hui comme une alternative aux ressources
fossiles pour la production de matériaux biosourcés et cela dans de nombreuses applications de haute
valeur ajoutée. Cette ressource naturelle est composée de cellulose, hémicelluloses et lignine. La
lignine est le deuxième biopolymère le plus abondant sur Terre après la cellulose. Elle est constituée
de structures aromatiques tridimensionnelles fortement ramifiées, comprenant une grande variété de
groupements fonctionnels. En particulier, la lignine contient différentes unités phénylpropanes,
portant des fonctions hydroxyles, méthoxyles, carbonyles, et carboxyles. La lignine est utilisée
comme précurseur pour différentes applications comme dans les résines phénoliques, les
polyuréthanes, les époxydes et les acryliques. La caractérisation de la lignine et de ses groupements
fonctionnels est primordiale pour évaluer les applications possibles.
Au cours de ces dernières années, les chercheurs ont travaillé sur la caractérisation de la lignine pour
développer de nouveaux matériaux. De nombreuses méthodes et techniques analytiques ont été
utilisées pour étudier la structure et la réactivité de la lignine. Parmi elles, la quantification des
groupements fonctionnels (-OH, -C=O, -COOH) par dérivation et l’analyse de la distribution des
masse molaires (MMD) par chromatographie d’exclusion stérique (SEC) restent les plus largement
employées. Pourtant, l’analyse MMD de la lignine est complexe de par la structure irrégulière de ce
polymère, de par sa polarité et sa structure partiellement ramifiée, ce qui conduit à une faible
solubilité et des phénomènes d’agrégats dans la plupart des solvant de chromatographie. Ainsi,
l’analyse SEC donne des résultats quantitatifs insuffisants et peu fiables, ce qui limite les potentielles
voies de valorisation de la lignine dans de nouvelles applications. La plupart des études se focalisent
sur la modification des groupements hydroxyles de la lignine pour diminuer sa polarité et améliorer sa
dissolution dans les solvants. Les principales méthodes de dérivation sont l’acétylation, la
fluorobenzylation, la fluorobenzoylation et l’oximation. Par ailleurs, ces méthodes de dérivation
améliorent aussi la stabilité des lignines dissoutes dans les solvants de chromatographie de type THF
et DMAC-LiCl.
A ce jour, l’acétylation reste la méthode la plus utilisée pour dériver les fonctions hydroxyles avant
l’analyse SEC. Mais cette méthode présente de nombreux inconvénients : une solubilité de la lignine
dérivée incomplète, des associations entre molécules et la formation d’agrégats dans la colonne, etc.

266
De nombreuses études se sont concentrées sur l’analyse de la MMD de la lignine par chromatographie
SEC en utilisant le polystyrène comme calibrant (étalon) and des détecteurs UV et RI (réfractomètre)
dans la ligne. Avec ce type de détecteurs, il est impossible de distinguer des polymères par volume
d’élution. La MMD résultante n’est donc pas fiable. Un autre inconvénient est l’utilisation du
polystyrène comme calibrant, un polymère linéaire très différent de la lignine, polymère
tridimensionnel. Le comportement de la lignine dans les colonnes de chromatographie est donc très
éloigné de celui du polystyrène ce qui rajoute un doute sur la fiabilité de l’analyse.
L’objectif de la thèse est d’améliorer la solubilité de la lignine dans les solvants classiques de
chromatographie afin d’analyser plus justement la MMD de la lignine, ce qui permettra de développer
de nouvelles applications pour la lignine. Ce travail a conduit à utiliser différentes méthodes de
dérivation de la lignine comme l’acétylation, la fluorobenzylation et la fluorobenzoylation afin de
modifier la réactivité et la polarité de la lignine. En utilisant différentes méthodes analytiques (UV,
IR, GC, RMN 1H, RMN 13C NMR, RMN 19F), le nombre de groupes hydroxyles dans la lignine peut
être déterminé. De plus, l’utilisation d’un détecteur viscosimétrique dans la ligne de chromatographie
SEC permet aussi d’améliorer l’analyse. Enfin, différents calibrants (polystyrène,
polyméthylmétacrylate et acétate de cellulose) sont utilisés pour réaliser une calibration universelle
des colonnes afin de conduire à la MMD de la lignine la plus proche de la réalité. A notre
connaissance, cette méthodologie (calibration universelle et dérivation de la lignine par différentes
méthodes) est nouvelle, en particulier la comparaison de l’acétylation classique aux méthodes de
fluorobenzylation et fluorobenzoylation dans le système SEC-THF.
Le chapitre 1 présente la biomasse lignocellulosique, sa structure et ses applications potentielles, ainsi
que les méthodes usuelles permettant sa caractérisation, groupements fonctionnels et masse molaire.
Les limites de ces méthodes seront présentées.
Le chapitre 2 recense le matériel et les méthodes, en particulier les différents types de lignine étudiées
(Protobind 1000, Indulin, Organosolv, Kraft et Kraft Eucalyptus), et utilisées pour déterminer et
comparer les MMD à partir d’une calibration classique ou conventionnelle. Les méthodes de
dérivation de la lignine et les analyses SEC réalisées sont présentées en détails.
La réactivité de la lignine est liée à la présence de groupements hydroxyles phénoliques libres. Ainsi
dans le chapitre 3, les groupements hydroxyles de différentes lignines sélectionnées sont quantifiés
via une méthode éprouvée l’aminolyse, qui nécessite l’acétylation préalable de la lignine. Cette
méthode est comparée à d’autres techniques analytiques reconnues, directes ou indirectes (après
dérivation de la lignine) telles que la spectroscopie UV, la RMN 1H, 13C et 31P, la conductimétrie ou la
potentiométrie.

267
Les fluorodérivations sont des réactions intéressantes qui permettent de réduire la polarité de la
lignine, ce qui pourrait améliorer la solubilité de celle-ci dans les solvants de chromatographie utilisés
pour l’analyse de la distribution de masse. Par ailleurs, ces réactions permettent aussi la
quantification, par RMN du 19F, des hydroxyles dérivés, Le chapitre 4 s’intéresse donc à la
fluorobenzylation et à la fluorobenzoylation de la lignine. Ainsi la réactivité de différents composés
modèles de lignine contenant des hydroxyles phénoliques et/ou aliphatiques, lors de fluorodérivations
est étudiée par spectroscopie RMN du 19F et du 13C. Les résultats obtenus sont appliqués à la
quantification par RMN du 19F des fonctions hydroxyles de différentes lignines techniques.
A la suite de ce chapitre, la flurobenzylation est employée pour améliorer la solubilisation de la
lignine dans les solvants de chromatographie pour l’analyse de la distribution des masses molaires. En
2.425078 parallèle, une nouvelle méthode de calibration universelle est proposée grâce à l’utilisation
d’un détecteur viscosimétrique dans la ligne de chromatographie SEC. Les lignines techniques sont
acétylées et fluorobenzylées puis analysées dans deux systèmes de chromatographie : (1) système
avec le solvant DMAc/LiCl et calibration conventionnelle et (2) système avec THF et calibration
universelle. Ces deux systèmes sont comparés.
Enfin, ce manuscrit s’achève par une conclusion générale qui présente les principales avancées dans le
domaine de la caractérisation de la lignine, notamment l’analyse des groupements hydroxyles et la
distribution des masses molaires, améliorées grâce à la fluorobenzylation de la lignine.
Les paragraphes suivants présentent un résumé en français des différents chapitres.
2. CHAPITRE 1 – revue bibliographique
2.1. La structure de la lignine
La quantité de lignine varie selon la nature de la biomasse lignocellulosique. Les bois de résineux
contiennent 25 à 30% de lignine en poids alors que dans les feuillus, la teneur est de 9 à 23%. Dans
les plantes herbacées, on compte 10 à 30% de lignine. Par ailleurs, la composition de la lignine elle-
même est très variable selon la biomasse végétale considérée. La lignine est un hétéropolymère
constitué d’unités phényl-propane : p-hydroxyphényle (H), guaiacyle (4-hydroxy-3-méthoxyphényle)
(G) et syringyle (4-hydroxy-3,5-diméthoxyphényle) (S). Ces unités proviennent des principaux
précurseurs de la lignine dans la nature, les alcools aromatiques coumarylique, coniférylique et
sinapylique (Figure 15). Les plantes grasses et de type paille contiennent les trois unités H, G et S.
Dans les bois de résineux en revanche, l’unité G est majoritaire, et dans les feuillus, on trouve
principalement les unités G et S. Du fait de la grande diversité de la lignine (on devrait parler « de
lignines au pluriel… »), la structure exacte des lignines extraites ne peut pas être pleinement élucidée.

268
Figure 15. Les trois précurseurs de la lignine (monolignols) et les structures de lignine
2.2. Les liaisons dans la lignine
La lignine présente un grand nombre de liaisons. Les unités phényl propanes sont liées principalement
par des liaisons β-O-4, β-5, α-O-4, 4-O-5, 5-5, β- β et β-1. La proportion de ces différentes liaisons est
donnée dans le tableau 1.
Tableau 13. Proportion des liaisons inter-unité dans la lignine de résineux et de feuillus
Type de liaison Poucentage (%)
Résineux Feuillus
β-O-4 45-55 60
5-5 19-22 9
β-5 9-12 6 4-O-5 4-7 6,5
β-1 7-9 1
β- β 2-4 3
La lignine présente de nombreux groupes fonctionnels ; les plus abondants sont listés dans le tableau
2. Les groupes caractéristiques sont les méthoxyles, les hydroxyles phénoliques et aliphatiques, et les
groupes carbonyles. Ils sont à l’origine de la réactivité de la lignine. Leur proportion varie selon la
nature de la biomasse lignocellulosique.

269
Tableau 14. Groupes fonctionnels dans les lignines de résineux et de feuillus (abondance pour 100
unités C-9)
Groupes fonctionnels Lignine de résineux Lignine de feuillus
Méthoxyle 90 – 95 139 –158
Hydroxyle Phénolique 20 – 30 10 – 15
Alcool benzylique 30 – 45 40 – 50
Carbonyle 10 – 15 17 – 24
Hydroxy aliphatique 115 – 120 88 – 166
2.3. L’extraction de la lignine de la biomasse végétale
Il existe de nombreux procédés permettant d’extraire la lignine de la biomasse végétale. Ils altèrent
malheureusement la structure de la lignine, en particulier les groupements fonctionnels et les
propriétés physiques et chimiques de sorte que les lignines extraites sont très hétérogènes. Dans
l’industrie papetière, les méthodes d’extraction les plus répandues sont les procédés Kraft, sulfite,
soude et organosolv. L’objectif premier de ces procédés est d’isoler les fibres de cellulose de la
biomasse lignocellulosique pour des applications papetières. Ceci est réalisé en dépolymérisant la
lignine, ciment des fibres cellulosique dans la biomasse végétale, ce qui la rend soluble dans le milieu.
Ainsi, chaque année, c’est environ 40 à 50 millions de tonnes de lignine qui sont extraites dans le
monde, principalement à partir du procédé Kraft puisque c’est le procédé papetier dominant.
Aujourd’hui, la lignine extraite est majoritairement brulée dans la chaudière de l’usine de pâte pour
produire l’énergie nécessaire à son fonctionnement, seule une faible fraction, environ 2%, est
commercialisée pour des applications de haute valeur ajoutée.
La structure de la lignine dépend aussi fortement du procédé d’extraction dont elle est issue.
Le procédé Kraft, procédé papetier dominant dans le monde, produit environ 85% (environ 43x106
tonnes par an) de la lignine dans le monde. Ce procédé permet de produire des pâtes papetières de
qualité avec un rendement matière de 45 à 50% à partir de différentes essences de bois. Dans ce
procédé, les copeaux de bois sont placés dans une liqueur blanche composée d’une solution aqueuse
d’hydroxyde de sodium (NaOH) et de sulfure de sodium (Na2S), dans un réacteur pressurisé. Le bois
est « cuit » dans la liqueur blanche à des températures voisines de 150 à 170°C pendant au moins 2
heures. Pendant la réaction, la lignine est très fortement dégradée et dissoute dans la phase aqueuse
suite à la rupture de nombreuses liaisons entre différentes unités lignine.
.

270
Globalement le procédé sulfite produit 4% de la lignine extraite. Ce procédé est dédié à la production
des pâtes de spécialité, très réactives et utilisées pour des applications chimiques. Ce procédé utilise
une solution aqueuse contenant des ions sulfite (SO32-) ou bisulfite (HSO3
-). Là encore les copeaux
sont cuits à haute température avec cette liqueur blanche. Il existe deux procédés en fonction des
conditions de pH, le procédé sulfite ou le procédé bisulfite. Les lignines extraites sont soufrées et sont
appelées lignosulfonates. Elles sont contaminées par des sucres, restes de polysaccharides (cellulose,
hémicelluloses) liés à la lignine extraite.
Le procédé soude produit environ 5% des lignines extraites dans le monde. Il est particulièrement bien
adapté aux plantes annuelles car cette biomasse végétale requiert des conditions de cuisson moins
sévères que le bois. La biomasse lignocellulosique est cuite dans une solution aqueuse d’hydroxyde de
sodium ou un mélange soude et anthraquinone. Les lignines ainsi extraites ne contiennent pas de
soufre, elles sont appelées lignine soude et elles sont récupérées de la phase aqueuse par précipitation
acide et séparation liquide/solide. Les lignines soude contiennent moins de cendres et de sucres que
les lignosulfonates.
Le procédé organosolv a été développé comme une alternative « verte » aux procédés Kraft et sulfite
plus polluants. La cuisson est réalisée à des températures comprises entre 180 et 200°C, avec des
solvants organiques en association avec de l’eau et de l’acide pour catalyser la délignification de la
biomasse végétale. Plusieurs procédés existent selon la nature du solvant utilisé : le procédé
Organocell (méthanol), Alcell (éthanol), Avidel (acides formique et acétique), Acétosolv (acide
acétique) et Milox (acide peroxyformique). Les lignines extraites sont très différentes des lignines
extraites uniquement en milieu aqueux.
2.4. Les modifications chimiques de la lignine
La lignine contient de nombreux groupes fonctionnels : hydroxyles (aliphatiques et phénoliques),
méthoxyles, carbonyles et carboxyles (en minorité pour ces derniers). La richesse de la lignine en
groupements fonctionnels variés a favorisé la valorisation de cette dernière dans des applications de
haute valeur ajoutée. Ainsi, ces groupements peuvent être modifiés pour améliorer la réactivité
chimique de la lignine et sa solubilité dans les solvants organiques et pour réduire la fragilité des
polymères dérivés de la lignine. De nombreuses modifications peuvent être réalisées : méthylation,
éthérification, amination, halogénation, nitration, sulfonation, estérification, silylation et allylation.
2.5. Les applications lignine
La lignine est une source potentielle de composés phénoliques pour des applications matériaux
renouvelables. Les dérivés de lignine sont largement employés dans de nombreuses applications

271
comme dans les liants, les adhésifs, les antioxydants, les désinfectants, les résines, les fibres, les
médicaments et les protections du bois.
Les lignines de type amine sont employées comme additifs, émulsifiants, floculants, dispersants, et
pour la synthèse de certains polymères synthétiques comme les polyuréthanes, les résines
phénoliques et époxy.
Les panneaux de fibres de haute densité sont fabriqués à partir de lignine Kraft de résineux, de
lignine soude de paille de blé et de lignine de paille hydrolysée.
Les propriétés antioxydantes de la lignine dans les polymères de type polypropylène ont été
étudiées avec différentes lignines extraites de plusieurs origines botaniques (addition de 1% de
lignine en masse). La conclusion est que la solubilité de la lignine dans le polypropylène est un
paramètre clé, plus important que la teneur en groupements phénoliques ou la viscosité intrinsèque
de la lignine. La lignine de faible masse molaire et contenant peu de phénol est plus soluble dans la
matrice et conduit à de meilleures propriétés antioxydantes.
Les lignines Kraft et soude activées sont utilisées comme liants et adhésifs pour le bois. Les
lignines peuvent être activées par une oxydation au périodate afin d’améliorer leur réactivité. Des
chercheurs ont développé des liants 100% renouvelables à partir de lignine avec un alcool
polyfurfural et partiellement renouvelable avec un phénol formaldéhyde.
Les lignines organosolv sont utilisées comme charges dans les encres, vernis, peintures et aussi
pour augmenter la viscosité de polyol polyéther et pour améliorer leurs propriétés rhéologiques.
La lignine peut être source de macromonomères dans la synthèse de résine de type phénol
formaldéhyde et, elle peut, après oxypropylation, être employée dans la formulation de
polyuréthanes (adhésifs et mousses).
2.6. L’analyse de la lignine
L’analyse de la lignine est cruciale pour le développement de nouvelles applications de haute valeur
ajoutée. Les groupements fonctionnels peuvent être analysés par spectroscopie UV, FT-IR, par
chromatographie gaz (GC) ou par des techniques de RMN (1H, 13C, 19F, 31P). La caractérisation de la
distribution des masses molaires de la lignine est également fondamentale pour mieux comprendre les
propriétés de la lignine, que ce soient des propriétés de structure, des propriétés physico-chimiques ou
même la réactivité de la lignine. La chromatographie d’exclusion stérique (SEC – aussi appelée GPC
pour Gel Permeation Chromatography) est l’outils d’analyse le plus employé pour caractériser la
distribution des masses molaires des polymères et en particulier de la lignine. La SEC sépare les
macromolécules par taille dans une colonne remplie d’un gel nanoporeux. Les molécules de
différentes tailles sont éluées à différents temps de rétention. Le choix du solvant est très important, il
doit permettre le gonflement puis la dissolution totale du polymère sans le dégrader. De plus les
interactions entre les molécules conduisant souvent à des agrégats dans les colonnes et à des

272
interactions également avec la phase stationnaire du gel, doivent absolument être évitées. La présence
de groupes hydroxyles sur la lignine malheureusement limite sa solubilité dans les solvants de
chromatographie non polaires comme le THF et le polystyrène généralement employé comme
calibrant est loin de présenter une structure tridimensionnelle aussi complexe que la lignine de sorte
que les mesures de masses molaires ne sont pas des valeurs intrinsèques/absolues mais peuvent
uniquement être comparées entre différentes lignines. Pour surmonter ces difficultés analytiques, deux
méthodologies peuvent être utilisées : 1) l’addition d’électrolytes dans les solvants polaires et 2) la
dérivation de la lignine avant sa dissolution dans les solvants non polaires (exemple : acétylation de la
lignine). Le travail de thèse présenté a pour objectif de déterminer les masses molaires de différentes
lignines en utilisant de nouvelles méthodes de dérivation de la lignine et en appliquant le principe de
calibration universelle lors de l’exploitation des analyses SEC.
Avant de présenter les résultats, un bref descriptif des matériels et des méthodes utilisés est donné
dans le paragraphe qui suit.
3. CHAPITRE 2 – Matériels et méthodes
3.1. Les composés modèles de lignine
Cinq composés modèles de lignine commerciaux ont été utilisés : la vanilline (CAS: 121-33-5),
l’acétovanillone (CAS: 498-02-2), le guaiacol (CAS: 90-05-1), l’alcool vanillique (CAS: 498-00-0) et
l’alcool de vératryle (CAS: 93-03-8), ainsi qu’un modèle de cellulose, le cellobiose (CAS: 528-50-7).
Ces composés ont été achetés chez Sigma-Aldrich.
3.2. Les échantillons de lignine
Quatre lignines industrielles ont été utilisées : (i) Lignine soude de paille de blé (Protobind 1000) (PB)
achetée chez Green Value Enterprises LLC, (ii) Lignine Kraft de pin (KL) fournie par le Centre
Technique du Papier (CTP) (Grenoble, France), (iii) Lignine Organosolv (ORG) (BioLignin® CIMV-
procédé utilisant un mélange acide formique/ acide acétique/eau à 185-210ºC) issue de paille de blé et
achetée chez CIMV Company, et (iv) Lignine Kraft Indulin AT (IND) achetée chez DKSH
Switzerland Ltd. Enfin, de la lignine Kraft de feuillus a été obtenue au laboratoire via une cuisson
Kraft d’eucalyptus.
3.3. Les produits chimiques utilisés
Dans les réactions de dérivation :

273
Hydroxyde de tétrabutylammonium (1M dans le méthanol), noté NBu dans la discussion,
(CH3CH2CH2CH2)4N(OH) (CAS: 2052-49-5) et le chlorure de 4-fluorobenzyl, noté FBC dans la
discussion, FC6H4CH2Cl, (CAS: 352-11-4), LiCl (CAS: 7447-41-8), de chez Sigma-Aldrich.
Acétonitrile CH3CN 99,95% (CAS: 75-05-8), acétate d’éthyl noté EtOAc dans la discussion,
CH3COOC2H5 99,5%, (CAS: 141-78-6), sulfate de sodium Na2SO4, 99%, (CAS: 7757-82-6) et éther
éthylique (CH3CH2)2O, 99,5%, (CAS: 60-29-7), méthanol (CAS: 67-56-1), Pyridine (CAS: 110-86-1),
anhydride acétique (CAS: 108-24-7) de chez Roth et chlorure de sodium NaCl (CAS: 7647-14-5) et
tétrahydrofuran de grade HPLC, noté THF dans la discussion, (CH2)4O (CAS: 109-99-9) de chez
Acros. Toluène (CAS: 108-88-3) de chez Chimie-plus. 4-diméthyl –aminopyridine (1122-58-3) de
chez Lancaster et l’acide anhydride 4-fluorobenzoique (CAS: 25569-77-1) de chez Alfa-Aesar.
DMAc- de grade HPLC (CAS: 129-19-5) de chez Roth.
Pour la calibration SEC, des polymères standards/étalons sont utilisés : polyméthyl méthacrylates
(PMMA: 1520, 6840, 13200, 31380, 73850, 135300, 342700, 525K, 1026K, 2095K) de chez Agilent,
polystyrènes (PS: 1670, 4970, 10030, 28400, 64200) de chez Polymer Laboratories Ltd. De l’acétate
de cellulose de faible distribution de masse molaire de chez Aldrich est aussi utilisé.
3.4. Les méthodes utilisées
Composition chimique
La composition chimique des lignines est analysée, de même que leur teneur en matière sèche et en
cendres (calcination à 525°C pendant 4 heures).
Lavage des lignines avec des solvants
Les lignines sont lavées avec des solvants pour éliminer les impuretés. Une étude sur le lavage des
lignines est conduite sur la lignine PB1000. 1g de lignine PB1000 (équivalent masse sèche) est lavée
avec environ 60 mL de solvant (éthanol, acétate d’éthyl et hexane) (16.5g/L). Le lavage est réalisé en
deux temps : initialement, 30 mL de solvant est versé sur l’échantillon de lignine et le mélange est
agité pendant 1 heure environ, suivi par une filtration sous vide à l’aide d’une membrane en PTFE de
0,45µm. La lignine récupérée est de nouveau mélangée à 30 mL de solvant et agitée pendant 24 avant
filtration. La lignine filtrée est séchée sous vide à 40°C. A la suite de cette étude, l’acétate d’éthyle a
été sélectionné comme étant le solvant le plus intéressant pour laver les lignines à analyser.
Quantification des groupements hydroxyles de la lignine : acétylation
100 mg de lignine (équivalent masse sèche) sont acétylés (Figure 16) avec 5 ml de pyridine en
mélange avec de l’anhydride acétique (1/1: V/V) à température ambiante pendant 15 h dans un ballon
à fond rond sous agitation continue. Après ce temps de réaction, la réaction est stoppée par ajout de 40

274
ml d’un mélange méthanol/eau à 50% en volume puis le mélange est séché sous vide. Après
évaporation du méthanol, le produit est lavé trois fois avec du toluène (3 х 40ml) pour éliminer les
résidus de pyridine, puis à nouveau avec 40 ml de méthanol à 99,5%. Enfin, l’échantillon est
lyophilisé pour s’assurer de l’évaporation total des solvants. La lignine acétylée est utilisée pour
étudier la réaction d’aminolyse et pour des analyses RMN du 13C quantitatives.
Figure 16. Acétylation de la lignine
Fluorobenzylation des composés modèles
100 mg de composés modèles sont dissous dans 1 mL de NBu (hydroxyde de tétra N-butylammonium
dans le méthanol 1M) et mis à agiter pendant 1h à 50°C. Puis 10 mL d’acétonitrile sont ajoutés suivis
de 300 mg de chlorure de 4-fluorobenzyl (FBC), l’agent dérivant. La réaction est mise sous agitation
pendant une nuit à 50°C. Puis de l’eau distillée (30 mL) et EtOAc (30 mL) sont finalement ajoutés
dans le mélange réactionnel. La phase aqueuse est séparée et extraite par un lavage avec EtOAc
(2×30mL). La phase dans EtOAc est lavée avec de l’eau distillée (2×30 mL) et une solution saturée de
chlorure de sodium (30 mL). La phase extraite avec EtOAc est séchée avec du sulfate de sodium puis
filtrée et analysée sans autre purification.
Fluorobenzylation de la lignine
La fluorobenzylation de la lignine est réalisée dans les mêmes conditions expérimentales que celles
employées pour la dérivation des composés modèles. La réaction est présentée dans la Figure 17. Puis
la lignine dérivée est récupérée par précipitation dans l’éther diéthylique. Cette phase organique forme
un précipité visqueux, précipité à nouveau dans des glaçons d’eau distillée. Le précipité est filtré via
un filtre PTFE, 0,45 µm, lavé dans l’eau distillée plusieurs fois et séché à 50°C en étuve.
OH
C
C
OH
CH2OH
C
O
H3C O
C
CH3
O
O
C
C
O
H2C
Pyridine
+
C
O
CH3
C
O
CH3
O C
O
CH3

275
Figure 17. Fluorobenzylation de la lignine
Fluorobenzoylation de la lignine
Les lignines fluorobenzylées (100 mg) sont mises à dissoudre dans 2,5 mL de pyridine. Sont ajoutés
progressivement 2,5 mg de 4-diméthyl-aminopyridine (DMAP) et 150 mg d’acide anhydride 4-
fluorobenzoique. Le mélange est agité pendant 48 h à 60˚C. Puis les lignines dérivées sont transférées
dans de l’eau distillée glacée. Le précipité obtenu est lavé à l’eau distillée plusieurs fois et filtré via un
filtre en PTFE de 0,45µm puis séché à 40°C dans une étuve. Il est ensuite analysé par FT-IR, SEC et
RMN du 19F. La réaction de fluorobenzylation est présentée dans la Figure 18.
Figure 18. Fluorobenzoylation de la lignine
Quantification des groupes hydroxyles phénoliques de la lignine par spectroscopie UV
Cette méthode est bien connue de la littérature, elle ne sera pas décrite dans ce résumé.
Quantification des groupes hydroxyles phénolique de la lignine par aminolyse et GC
Pour initier la réaction d’aminolyse, 5mL d’un mélange dioxane-pyrrolidine (1/1: v/v) sont ajoutés sur
la lignine acétylée à température ambiante. La réaction est donnée dans la Figure 19.
C
OO
F
C
F
O
OCH3
O
L
HC
C
OH
CH2O
O
H2
C ArF
Ar - Ph
H2
C ArF
+
OCH3
O
L
HC
C
CH2O
O
H2
C ArF
Ar - Ph
H2
C ArF
O C
O
ArF
(F)ArCOOH+DMAP, Pyridine

276
Figure 19. Déacétylation de la lignine par la pyrrolidine (aminolyse)
La vitesse de formation de la 1-acétyl pyrrolidine est suivie dans le temps (après 5, 10, 20, jusqu’à 60
minutes) par injection de 0,5 μL du mélange réactionnel dans une chromatographie gazeuse. La
formation de la 1-acétyl pyrrolidine est équivalente à la quantité de OH phénoliques présents sur la
lignine. La quantité formée est calculée ainsi :
Formation de l′acétylpyrrolidine (𝑚𝑚𝑜𝑙 𝑔⁄ lignine) = 𝐴 × 𝑊𝑠 × 1000𝐴𝑠 × 𝑊𝐿 × 𝑘 × 113
avec, A = surface du signal de chromatographie attribué à la 1-acétyl pyrrolidine, As = surface du
signal de chromatographie attribué à l’étalon interne, WL = masse de lignine (matière sèche), WS =
masse de l’étalon interne (1-méthyl naphthalène) et k = constante de calibration (obtenue par la
courbe de calibration).
Analyse de la distribution des masses molaires de la lignine par chromatographie d’exclusion
stérique (SEC)
L’analyse SEC est indispensable pour estimer la masse molaire d’une lignine à valoriser. La grande
variété des groupes fonctionnels de la lignine augmente sa polarité ce qui la rend difficilement soluble
dans les solvants de chromatographie. Deux systèmes sont utilisés.
Système DMAc/LiCl
L’analyse SEC dans le DMAc est réalisée sur une ligne chromatographique OMNISEC équipée de 2
colonnes polargel M (30 cm x 7 mm) et d’une pré-colonne (de chez Agilent). Un mélange à 0,5% de
LiCl dans le DMAc (5g de LiCl dessous dans 1 L de DMAc) est utilisé comme éluant à un débit de 1
mL/min dans les colonnes chauffées à 70°C. Un réfractomètre (RI) est utilisé pour la détection. 100
μL de composés à analyser (lignine ou polymères calibrants) sont injectés à une concentration de 2
mg dans 1mL de DMAc/LiCl à 0,5%. Les solutions sont obtenues ainsi : 20 mg de lignine non dérivée
sont dissous dans 10 mL de DMAc/LiCl à 0,5% pendant 3 semaines sous agitation continue. Dans le
cas des lignines dérivées, 10 mg de lignine sont dissous dans 5 mL de DMAc/LiCl à 0,5% pendant 5

277
jours sous agitation continue. Toutes les lignines sont ensuite filtrées (0,45 μm filtre seringue en
PTFE) avant analyse.
Système THF
L’analyse SEC dans le THF est réalisée sur une ligne chromatographique Malvern TDA 302 équipée
de 3 colonnes 300×7,5mm Agilent PLGel mixed B (10 µm mixed B LS) et une pré-colonne. Une
triple détection RALS-LALS avec un viscosimètre en ligne à 35°C est utilisée. Pour la calibration des
colonnes, des solutions de polymères standards sont préparées (0,4 mg/L à 1,6 mg/mL dans le THF).
La lignine à analyser est dissoute à 10 mg/mL dans le THF pendant 1 heure. 100µL de solution
(lignine ou polymère standard) sont injectés dans le système SEC à un débit de 1 mL/min. La solution
est filtrée sur un filtre seringue en PTFE de 0,45 µm. Une calibration universelle est réalisée avec des
polymères standards de polystyrène (PS), de polyméthylméthacrylate (PMMA) et d’acétate de
cellulose.
Une calibration universelle est réalisée selon le concept de Mark-Houwink. Il affirme que les
polymères sont élués selon leur volume hydrodynamique Vh, qui détermine alors le volume d’élution.
Relation de Mark- Houwink [𝜂] = 𝐾′𝑀𝑎
[η], viscosité intrinsèque du polymère en dL/g
K’ et a sont les constantes de Mark-Houwink, elles dépendent du couple polymère/solvant
M est la masse molaire du polymère en g/mol
Sur la base de l’équation précédente, les échantillons de même [η] et même masse molaire (M)
possèdent des volumes hydrodynamiques identiques. Ainsi les échantillons sont élués au même temps
de rétention. Les résultats obtenus sont utilisés pour construire une courbe de calibration universelle
en traçant log ([η].M) en fonction du temps de rétention.
4. CHAPITRE 3 – Quantification des groups phénoliques de la lignine par aminolyse et
comparaison avec d’autres méthodes éprouvées
La quantification des hydroxyles phénoliques peut être réalisées avec différentes méthodes,
directement sur la lignine ou après dérivation de celle-ci. Ce chapitre propose d’étudier la méthode
d’aminolyse : les hydroxyles de la lignine sont acétylés puis une aminolyse est réalisée. Elle est suivie
par analyse GC.

278
4.1. Aminolyse suivie par GC
La réaction d’aminolyse est donnée dans la Figure 5. La quantité d’hydroxyles phénoliques est
déduite de la formation et de la quantification de la 1-acétylpyrrolidine par GC. Pendant l’aminolyse,
la vitesse de déacétylation des groupes hydroxyles phénoliques est significativement plus rapide que
celle des hydroxyles aliphatiques. Ainsi, la formation d’acétyl-pyrrolidine correspond à la quantité de
groupes acétyles aromatiques initialement présents sur la lignine. Attention il est aussi possible que
certains groupements acétyles aliphatiques subissent la réaction de déacétylation aux temps de
réaction prolongés, ce qui conduit à une surestimation de la teneur en groupements hydroxyles.
Pendant l’aminolyse, les échantillons sont collectés au cours du temps et analysés par GC. Au temps
zéro, la formation d’acétyl pyrrolidine est nulle. Au cours du temps, la quantité d’acétyl pyrrolidine
augmente. La Figure 20 présente l’évolution de la formation d’acétyl pyrrolidine au cours du temps
pour les différents échantillons de lignine étudiés. Il apparait clairement que pendant les 5 premières
minutes de réaction, la formation d’acétyl pyrrolidine augmente rapidement puis plus progressivement
jusqu’à 20 minutes et au-delà de 20 minutes, elle se stabilise. La lignine Kraft présente une formation
en acétyl pyrrolidine supérieure à celles des lignines PB, Indulin et ORG. La plupart des lignines,
après 20 min commence à présenter un plateau qui montre que les acétyles phénoliques ont été
déacétylés par la réaction d’aminolyse. La teneur en 1-acétyl pyrrolidine formée est calculée en
extrapolant la région linéaire entre 20 et 60 minutes au temps zéro. La valeur correspondante est
directement proportionnelle à la teneur en hydroxyles phénoliques présents dans les lignines étudiées.

279
Figure 20. Aminolyse des lignines acétylées, PB-lignine, ORG lignine, Kraft lignine et Indulin
lignine
Les teneurs en hydroxyles phénoliques dans les lignines sont comparées dans le Tableau 15. Les
réactions ont été répétées trois fois et les écarts type sont présentés.
Tableau 15. Comparaison des teneurs en hydroxyles phénoliques des lignines analysées par la
méthode d’aminolyse
Type de lignine Hydroxyles phénoliques mmol/g lignine
PB - Protobind 1000 lignine 3,4 ± 0,18
ORG - Organosolv lignine 2,4 ± 0,12
KF - Kraft lignine 4,0 ± 0,07
IND – Indulin lignine 3,6 ± 0,05
Parmi les lignines étudiées, la lignin Kraft est celle qui contient la plus grande quantité d’hydroxyles
phénoliques, environ 4,0 mmol/g, suivi des lignines Indulin (3,6 mmol/g) et PB (3,4 mmol/g). La
lignine Organosolv présente les plus faibles teneurs, i.e. 2,4 mmol/g. Il faut souligner que les lignines
de résineux (Kraft et Indulin) sont connues pour contenir davantage de groupements hydroxyles
phénoliques que celles issues de plantes annuelles (PB et ORG). Les résultats obtenus par aminolyse
sont donc logiques.
4.2. Comparaison entre l’aminolyse et d’autres méthodes analytiques
Les résultats de l’aminolyse sont comparés à ceux issus d’autres techniques analytiques éprouvées
comme les spectroscopies FT-IR, UV, RMN ou des méthodes de titration. Les résultats sont présentés
dans le Tableau 4.
Tableau 16. Quantification des hydroxyles phénoliques (mmol/g) – comparaison entre l’aminolyse et
d’autres méthodes analytiques.
Méthode Lignine
PB-Protobind ORG-Organosolv KF-Kraft IND-Indulin
Aminolyse 3,4 ± 0,18 2,4 ± 0,12 4,0 ± 0,07 3,6 ± 0,10
UV 2,6 ± 0,02 1,7 ± 0,01 2,8 ± 0,01 3,4 ± 0,01
1H-RMN 1,8 ± 0,13 0,9 ± 0,07 2,7 ± 0,04 3,1 ± 0,23
13C-RMN 2,4 ± 0,04 2,0 ± 0,03 4,2 ± 0,06 3,6 ± 0,05
31P-RMN
2,7 ± 0,1 1,3 ± 0,06 3,2 ± 0,16 3,2 ± 0,10
Titration rapide 2,4 ± 0,03 1,5 ± 0,03 2,4 ± 0,03 2,7 ± 0,05

280
Les différentes méthodes conduisent à des teneurs variables en hydroxyles phénoliques (en mmol/g) :
2,4 (ORG) à 4,0 (KF) (aminolyse), 1,7 (ORG) à 3,4 (IND) (UV), 0,9 (ORG) à 3,1 (IND) (1H RMN),
2,0 (ORG) à 4,2 (KF) (13C RMN), 1,3 (ORG) à 3,2 (KF et IND) (31P RMN) et 1,5 (ORG) à 2,7 (IND)
(titration rapide). A noter que toutes les méthodes analytiques révèlent que la lignine Organosolv
contient la plus faible teneur en hydroxyles phénoliques et que les lignines de résineux Indulin et
Kraft au contraire présentent les teneurs les plus importantes. Globalement l’aminolyse prédit des
teneurs en hydroxyles phénoliques légèrement plus élevées que les autres méthodes et la RMN 1H
conduit aux estimations les plus faibles.
La méthode rapide de titration acido-basique en milieu aqueux, mise au point récemment au LGP2,
est intéressante car elle renseigne sur la teneur en carboxyles des lignines. Le Tableau 17 présente les
teneurs en carboxyles obtenues via différentes méthodes analytiques comme la méthode rapide, une
titration potentiométrique en milieu non aqueux par l’hydroxyde de tétra-n-butylammonium - TnBAH
et la RMN du 31P.
Tableau 17. Comparaison des différentes méthodes de quantification des groupes carboxyles de la
lignine (mmol/g)
Méthode Lignine
PB-Protobind ORG-Organosolv KF-Kraft IND-Indulin
Titration rapide 1,6 ± 0,02 2,3 ± 0,05 1,2 ± 0,04 1,4 ± 0,02
TnBAH 1,6 ± 0,04 1,3 ± 0,01 1,2 ± 0,03 1,1 ± 0,01
31P RMN 1,4 ± 0,07 1,1 ± 0,05 0,9 ± 0,04 0,9 ± 0,04
Les plus faibles teneurs en carboxyles sont issues de l’analyse RMN 31P alors que les deux autres
méthodes conduisent à des valeurs similaires sauf dans le cas de la lignine Organosolv. De plus, les
teneurs en carboxyles des toutes les lignines sont inférieures aux teneurs en hydroxyles phénoliques,
encore une fois excepté pour la lignine Organosolv. Une teneur en carboxyles plus élevée qu’en
hydroxyles phénoliques dans la lignine Organosolv est possible car le procédé utilise des conditions
très oxydantes.
Les principales conclusions de ce chapitre sont les suivantes :
1. La méthode d’aminolyse révèle que la lignine Kraft contient une teneur en hydroxyles
phénoliques supérieure à celle de la lignine Indulin suivie par la lignine Protobind et enfin
Organosolv.

281
2. Les résultats de l’aminolyse sont comparables à ceux de la RMN 13C. Ceci est logique car les
deux méthodes utilisent de la lignine acétylée pour l’analyse.
3. La RMN du 1H, la spectroscopie UV et la méthode rapide sous-estiment la teneur en
groupements hydroxyles phénoliques : à cause notamment de recouvrements de signaux dans
le cas de la RMN du 1H ; à cause de la présence d’unités lignine présentant plus d’un
groupement phénol dans le cas de la méthode UV, et enfin en ce qui concerne la méthode
rapide, de grandes quantités de lignine sont nécessaires pour l’analyse et les résultats donnent
accès à une teneur globale d’hydroxyles sans information sur leur structure.
4. Enfin, l’aminolyse classique présente aussi des inconvénients comme une dérivation des
hydroxyles phénoliques incomplète et une surestimation de ces groupements due à la
présence d’impuretés de type sucres dans les lignines.
5. CHAPITRE 4 – Etude de la réactivité de composés modèles de lignine lors de la
fluorobenzylation par analyses RMN 13C et 19F : Application à la quantification des
hydroxyles phénoliques de la lignine par RMN du 19F
Il y a une vingtaine d’année, Barrelle et al. ont développé une méthode analytique utilisant la
spectroscopie RMN du 19F après dérivation de la lignine par des composés fluorés afin de quantifier
les groupes hydroxyles aliphatiques et phénoliques et les groupes carbonyles. La fluorobenzylation est
utilisée pour quantifier les hydroxyles phénoliques et les hydroxyles aliphatiques primaires, la
fluorobenzoylation pour quantifier les hydroxyles aliphatiques secondaires, alors que la dérivation par
la trifluorométhylphénylhydrazine permet la quantification des carbonyles. Ainsi le travail présent est
un complément des études de Barelle et a pour objectif de montrer que l’analyse de la lignine par
RMN du 19F est une méthode robuste pour la quantification des hydroxyles phénoliques.
5.1. Dérivation de composés modèles par fluorobenzylation
Cinq composés modèles de lignine (Figure 21) ont été sélectionnés selon la nature des hydroxyles liés
aux différents sites de l’unité phényl-propane, comme les hydroxyles aromatiques ou aliphatiques.
Les lignines étant souvent contaminées par des sucres, contenant eux même des hydroxyles, un
composé modèle de cellulose a aussi été sélectionné. Tous les composés modèles sont dérivés par
fluorobenzylation et les produits sont analysés par spectroscopie RMN 13C and 19F.

282
Figure 21. Composés modèles étudiés : Vanilline (1), Acétovanillone (2), Guaiacol (3), Alcool
vanillique (4), Alcool de vératryle (5) et D(+) Cellobiose(6)
La Figure 22 présente la réaction de fluorobenzylation des groupes hydroxyles de la lignine et leur
conversion en dérivés fluorobenzylés. Les groupes hydroxyles aliphatiques et aromatiques sont
supposés être dérivés.
Figure 22. Réaction de fluorobenzylation de la lignine (Cl-R-F: chlorure de 4-fluorobenzyl,
Lig=Lignine)
Les déplacements chimiques et la structure hyperfine due aux couplages nJCF sont utilisés pour
déterminer la présence ou non de structures aromatiques fluorées (originaires du FBC). Une séquence
complémentaire DEPT permet de distinguer les carbones de type CH2’ (présents dans différents
environnements) (Figure 23), et l’examen des déplacements chimiques permet aussi d’analyser la
présence ou non de dérivés fluorés.

283
Figure 23. Structure et numérotation des C des composés modèles de lignine et des modèles dérivés
Le Table 4.1 présente l’attribution des déplacements chimiques en RMN 13C des groupes de type
méthylène localisés entre le FBC et le composé modèle (Figure 23), pour différents produits récupérés
après la dérivation des composés modèles.
Tableau 18. Attribution des déplacements chimiques des CH2’ en RMN 13C.
c (en ppm) 45,3 57,54 62-63 69-71 72,81
Groupe méthylène -CH2Cl -CH2N -CH2OH -CH2OR -CH2OMe
Composé FBC NBu OH FBOH (a) Aliphatique
F-composé dérivé FBOMe (b)
(a) FBOH : Produit résultant de la réaction de FBC avec l’eau. (b) FBOMe : Produisant resultant de la réaction de FBC avec MeOH (solvant de NBu)
Les groupes méthylène du FBC, (CH2Cl), et ceux de N-Bu (CH2N) sont détectés à 45,3 ppm et 57,54
ppm respectivement grâce à de la nature de l’hétéroatome (Cl ou N). Le réactif FBC peut réagir avec
l’eau (qui provient de l’humidité des réactifs) et/ou avec le méthanol (présent dans le réactif N-Bu)
pour former FBOH et/ou FBOMe. Les signaux correspondants apparaissent dans la région de 62-63
ppm et 72,81 ppm respectivement. Enfin les signaux CH2OR attribués aux composés modèles sont
dans la région de 69-71 ppm.
Le rendement de fluorobenzylation est calculé à partir de la quantification de chaque composé présent
après réaction de dérivation (Table 5.1) : le composé modèle fluoré (F-modèle) mais aussi le composé
modèle initial (qui n’a pas réagi), le FBC restant et les deux sous-produits FBOH et FBOMe. En
considérant que la composition totale est égale à 100%, le rendement de dérivation est calculé comme
la quantité de F-model divisé par la somme des quantités de F-modèle et du modèle n’ayant pas réagi
(en %). L’attribution des déplacements chimiques en RMN du 13C des dérivés fluorés est donnée dans
le Table 4.3 .

284
Tableau 19. Quantités de produits obtenus après fluorobenzylation des composés modèles, calculées
à partir des donnée RMN du 13C (analyse de la partie organique)
Composé Fluorobenzylation
rendement, %
Composition du mélange
Modèle restant
%
F-Modèle %
FBC %
FBOH %
FBOMe %
NBu %
1 100 - 93,6 6,4 - - -
2 100 - 81,3 5,2 - 8,3 5,2
3 100 - 67,6 24,5 - 4,1 3,8
4 100 - 34,0 53,9 Traces 10,1 -
5 9 71,5 7,1 - Traces - 21,4
6 - - - - 74,0 - 26
FBC blanc 94,1 - - 5,9 - -
FBC réagi - - - 7,9 - 92,1
Tableau 20. Déplacements chimiques RMN 13
C (en ppm) des composés modèles fluorobenzylés (C
numérotés selon la Figure 23)
Composés 1 2 3 4 5 Partie
composés
modèles
C1 129,8 130,14 120,59 135,75 130,61 C2 109,9 110,4 112,22 110,76 110,51 C3 149,4 151,88 149,23 149,05 148,65 C4 153 148,79 147,66 146,38 148,30 C5 112,6 112,27 113,88 113,66 111,51 C6 125,8 122,92 121,25 118,45 120,04
OCH3 55,53 55,51 55,44 55,39 55,38 55,46
C=O - 196,2 - - - HC=O 191,34 - - - - CH2 (α) - - - 62,76 71,36
CH3 - 26,31 - - - Partie FBC C’H2 69,28 69,15 69,15 69,33 70,33
C’4 132,5 132,74 133,44 133,54 134,71 4JCF (Hz) 2,84 C’3,C’5 130,2 130,14 129,92 129,85 129,57 3JCF (Hz) 9,2 C’2,C’6 115,3 115,29 115,15 115,15 115,40 2JCF (Hz) 21,45
C’1 161,98 161,88 161,7 161,72 161,56 1JCF (Hz) 243

285
Le Table 5.1 montre que les composés modèles de lignine 1, 2, 3, contenant uniquement des
hydroxyles phénoliques, et 4, contenant à la fois des hydroxyles phénoliques et aliphatiques,
réagissent totalement. Le rendement de dérivation des modèles 1, 2 et 3 est de 100%. Par ailleurs pour
le modèle 4, le signal restant à 62,76 ppm correspondant au carbone de type méthylène –CH2OH, lié
de façon covalente à un groupe hydroxyle aliphatique ; et l’absence du signal à 71 ppm correspondant
au carbone –CH2OR du dérivé fluoré aliphatique montre que la conversion est due uniquement aux
groupes hydroxyles phénoliques ; les hydroxyles aliphatiques sont peu réactifs.
L’alcool de vératryle modèle 5, avec un hydroxyle aliphatique et aucun hydroxyle phénolique est très
peu converti (9%). Le principal produit de réaction est le composé modèle initial bien que le FBC,
l’agent dérivant, soit totalement consommé. Tous ces résultats suggèrent que les hydroxyles
phénoliques sont facilement dérivés alors que la fluorobenzylation des hydroxyles aliphatiques est
lente et seulement partielle.
Comme les lignines commerciales sont généralement contaminées par des sucres et que ces sucres
contiennent des fonctions hydroxyles, un modèle de sucre, le D(+) cellobiose (6) est aussi étudié.
Après fluorobenzylation, l’analyse de la phase organique de la réaction ne présente aucun signal
correspondant à un produit fluoré ni même au produit de départ (Table 4.2). Les sucres étant solubles
dans l’eau, la phase aqueuse est aussi analysée. Dans ce cas, aucun dérivé n’a été détecté, le seul
produit identifié est le sucre initial non modifié et le réactif NBu. Ainsi les hydroxyles des sucres ne
sont pas fluorobenzylés. La contamination en sucres des lignines ne devrait pas interférer avec
l’analyse des lignines dérivées par RMN du 19F.
Le mélange réactionnel obtenu après fluorobenzylation des composés modèles et contenant un
mélange de différents produits est aussi analysé par RMN du 19F. Etant donné que seuls les composés
fluorés sont détectés en RMN du 19F aucun signal correspondant au produit de départ ou au NBu ne
peut être enregistré. Ainsi, les compositions du mélange, exprimées en %, issues des analyses RMN
du 13C et RMN du 19F NMR sont différentes. Les résultats de RMN du 19F sont présentés dans les
Table 4.6 et Table 4. 7.

286
Tableau 21. Taux de conversion et quantités de produits obtenus après fluorobenzylation des
composés modèles, calculés à partir des donnée RMN du 19F
Composés F-Composé Conversion
Rate, %
Composition du mélange
F-composé dérivé, %
FBC récatif, %
FBOH, % FBOMe, %
1 100 94,5 5,5 - - 2 100 86,3 6,3 - 7,4 3 100 72,3 23,3 - 4,4 4 98 38,8 55,9 1,1 10,2 5 16 89,7 - 10,3 - 6 0 - - 100 -
FBC - 99,9 - 0,1 - FBC reacted - - - 100 -
Tableau 22. Déplacements chimiques en RMN du19
F (en ppm) des composés modèles fluorobenzylés
Composés F (ppm) Nature
1 -116,36 -OH + Aldehyde ()
2 -116,49 -OH + cétone ()
3 -116,89 -OH
4 -116,99 -OH
5 -117,50 CH2OH
6 - CH2OH
MeOH -117,49 CH3OH
FBC (blanc) -115,85 CH2Cl
FBOH -118,7 CH2OH
A partir des résultats RMN du 19F, on observe que les groupes hydroxyles phénoliques des composés
1, 2, 3 sont quantitativement fluorobenzylés et ils donnent des signaux à -116,36 ppm, -116,49 ppm et
-116,89 ppm respectivement. En ce qui concerne le modèle 4, contenant à la fois des OH aliphatiques
et phénoliques, la RMN du 19F confirme que la conversion a lieu uniquement dans la région des
phénols (-116,99 ppm) puisqu’aucun signal n’est détecté dans la région des aliphatiques. Le taux de
conversion de 98% provient de la dérivation des hydroxyles phénoliques uniquement. La phase
aqueuse a été aussi analysée mais aucun signal de 19F n’a pu être détecté ce qui confirme que seuls les
phénols peuvent être dérivés dans les conditions étudiées.
5.2. Analyse des hydroxyles phénoliques d’une lignine par RMN 19F
Suite à ces analyses sur composés modèles, des lignines industrielles sont analysées par RMN du 19F.
En particulier la lignine organosolv (ORG) de la compagnie CIMV Corporation (France) est étudiée

287
par RMN du 19F après fluorobenzylation. Le spectre de RMN du 19F est donné dans la Figure 24.
L’attribution des signaux est réalisée sur la base des déplacements chimiques déterminés pour les
composés modèles. Le signal le plus fin à -118,7 ppm est attribué à FBOH, produit de réaction de
l’agent dérivant FBC avec des traces d’eau. Comme vu précédemment, le signal entre -117,3 et -118,5
ppm est associé aux hydroxyles aliphatiques de la lignine. Les hydroxyles aromatiques sortent quant à
eux entre -115 et -117,3 ppm et la partie du signal entre -116,2 et -116,5 ppm est attribuée à
l’existence de composés contenant un groupe α C=O, alors que le signal à -115,8 ppm est dû au réactif
FBC.
Figure 24. Comparaison des spectres RMN du 19F de la lignine ORG fluorobenzylée (en bleu) et des
composés modèles de lignine dérivés (Note : Seuls les phénols sont dérivés dans le composés modèles
4)
L’analyse conduit aux résultats suivants : 1,71 mmole d’hydroxyles phénoliques et 0,120 mmole
d’hydroxyles aliphatiques par g de lignine ORG.
5.3. Amélioration de la solubilité de la lignine par fluorobenzylation
La fluorobenzylation est une réaction intéressante car elle améliore aussi la solubilité de la lignine
dans les solvants de chromatographie SEC pour la détermination de sa distribution des masses
molaires. La solubilité dans le THF a été étudiée sur la lignine ORG fluorobenzylée par
spectroscopies UV-visible et comparée avec celle de la lignine non dérivée ou acétylée. Ces trois
lignines ont été solubilisées dans les mêmes conditions, à même concentration dans le THF et
analysées par spectroscopie UV à 280nm, dans la région où la lignine absorbe la lumière (Figure
4.10).

288
Figure 25. Spectres d’absorbance UV des lignines ORG fluorobenzylée, acétylée et non dérivée dans le THF
La comparaison des spectres montre clairement que la lignine fluorobenzylée présente l’absorbance la
plus importante. La fluorobenzylation augmente notablement la solubilité de la lignine dans le THF,
davantage que l’acétylation, ce qui est très intéressant pour les analyses SEC.
6. CHAPITRE 5 – Méthode de calibration universelle pour l’analyse de la lignine par
chromatographie d’exclusion stérique – utilisation d’une nouvelle méthode de dérivation
L’analyse de la distribution des masses molaires (MMD) est cruciale pour comprendre la réactivité et
les propriétés physico-chimiques de la lignine. Bien que cette analyse existe déjà, il existe de
nombreux doutes sur la masse molaire de la lignine liés à la méthode choisie.
Le chapitre 5 est dédié à l’analyse des lignines par chromatographie d’exclusion stérique (SEC) dans
des solvants organiques (DMAc/LiCl et THF). Toutes les lignines commerciales sont dérivées
(acétylation, fluorobenzylation et fluorobenzoylation). La masse molaire des lignines dérivées et non
dérivées est ensuite calculée en utilisant une calibration standard dans le cas des analyses réalisées
dans le DMAc/LiCl ; et une calibration universelle dans le THF pour les lignines dérivées.
6.1. Conditions d’analyse SEC
Le Table 5.1 présente les conditions d’analyse SEC utilisant différentes colonnes et différents
systèmes organiques DMAc/LiCl et THF.

289
Tableau 23. Conditions d’analyse SEC utilisées pour l’analyse de la lignine, systèmes DMAc/LiCl et
THF
DMAc/LiCl THF
Système OMNISEC Malvern TDA 302
Colonne 2 polargel M (30 cm x 7 mm) + 1 Pré-colonne
3 (300 cm x 7,5 mm) Agilent PLGel mixed B (10 µm mixed B LS) + 1 pré-colonne
Eluant 0,5% de DMAc/LiCl (5g de LiCl dissous dans 1L de DMAc)
THF (grade HPLC)
Débit 1 mL/min 1 mL/min
Température de colonne 70°C 35°C
Détecteur RI (Réfractomètre) RI, RALS-LALS et détecteur viscosimétrique en ligne
Calibrants Polystyrène (PS) 1660, 10050, 65500,426600
PS : 1670, 4970, 10030, 28400, 64200 Polyméthylméthacrylate (PMMA) : 1520, 6840, 13200, 31380, 73850, 135300, 342700, 525K, 1026K, 2095K Acétate de cellulose (CA) – polymère standard polydispersé
Volume d’injection 100 μL de lignine ou de calibrant
100 μL de lignine ou de calibrant
Concentration en lignine 2mg/mL 10 mg/mL
Dérivation Acétylation, Fluorobenzylation, Fluorobenzoylation
Acétylation, Fluorobenzylation, Fluorobenzoylation
6.2. Courbes de calibration SEC
Système SEC-DMAC/LiCl – calibration conventionnelle
Généralement, la distribution des masses molaires est réalisée par calibration conventionnelle en
utilisant des polystyrènes (PS) de différentes masses molaires comme calibrants. Le logarithme de
chaque masse molaire est tracé en fonction du volume de rétention. La courbe de calibration est
donnée dans la Figure 5.2.

290
Figure 26. Courbe de calibration avec des PS pour le système DMAc/LiCl
Système THF – calibration conventionnelle
Pour le système THF, trois polymères standards ont été sélectionnés en fonction de leur structure
moléculaire. Des polymères monodisperses et polydisperses ont été choisis : PS (polystyrène),
PMMA (polyméthylméthacrylate) et l’acétate de cellulose, tous de masse molaire (Mw) connue. Puis
log (Mw) est tracé en fonction du volume de rétention des différents polymères en utilisant une
détection RI (Figure 5.3). On observe clairement que cette méthode de calibration conventionnelle ne
donne pas de courbe unique pour les 3 classes de polymères (Figure 5.3) car les valeurs de log (Mw)
ne sont pas alignées. Ainsi les valeurs de Mw calculées pour un échantillon de lignine seront
différentes selon le calibrant choisi.
y = -0.5252x + 12.202 R² = 0.9992
2.50
3.00
3.50
4.00
4.50
5.00
5.50
6.00
12 13 14 15 16 17
log
(Mw
)
Retention volume (mL)
PS
Linear (PS)

291
Figure 27. Courbe de calibration conventionnelle réalisée avec du PS, PMMA et de l’acétate de
cellulose. Différents temps de rétention sont choisis pour calculer et comparer les log (Mw)
correspondant aux différentes courbes de calibration.
Système THF – calibration universelle

292
Une courbe de calibration universelle a été construire en utilisant le concept de Mark-Houwink qui
stipule que les polymères sont élués sur la base de leur volume hydrodynamique Vh, qui détermine à
son tour le volume d’élution (voir chapitre 1).
Les résultats obtenus sont utilisés pour construire une courbe de calibration universelle en traçant, à
partir des différents polymères calibrants sélectionnés, log ([η].M) en fonction du temps de rétention.
Le principal avantage de cette méthode est que la masse molaire d’un polymère inconnu peut être
calculée à partir de la mesure de sa viscosité intrinsèque et du volume de rétention, reportés sur la
courbe de calibration universelle, ce qui conduit à la masse molaire absolue (ou intrinsèque) du
polymère.
Les différentes courbes de calibration réalisées avec les 3 polymères standards, PS, PMMA et acétate
de cellulose se superposent parfaitement, validant le concept de Mark-Houwink (Figure 5.4). Ainsi,
on obtient une calibration universelle.
Figure 28. En haut : Courbe de calibration universelle incluant tous les points des polymères PS,
PMMA et acétate de cellulose ; en bas : Courbes de calibration universelle des polymères standards
monodispersés (PS et PMMA) et polydispersé (acétate de cellulose), prises individuellement.

293
6.3. Intégration des chromatogrammes SEC
Dans cette étude deux types de colonnes (Polar et PL gel) et deux types de systèmes solvatant
(DMAc/LiCl et THF) sont utilisés. Dans le cas du sytème DMAc/LiCl – polar gel, les lignines,
notamment les lignines Indulin et Kraft eucalyptus, présentent des profils d’élution bimodales ou
trimodales (Figure 5.5). Dans le système THF – colonne PL, la lignine ORG présente un profil
d’élution bimodal qui “traine” aux masses molaires élevées. Dans ces cas particuliers, l’intégration
des signaux SEC en incluant tout le profil d’élution conduit à des valeurs de Mw surprenantes. Pour
corriger ces valeurs, les signaux qui trainent au niveau des fortes masses et ceux observés aux petites
masses sont excluent de l’intégration et du calcul des masses molaires. Nous avons choisi par ailleurs
de définir la ligne de base entre V0 (début des signaux intégrés) et Vt (fin de ces signaux). Ainsi pour
la lignine Indulin, présentée ici, le profil SEC (Figure 5.5) présente une distribution uniforme.
Figure 29. Chromatogrammes SEC des lignines Indulin (gauche) and Eucalyptus-Kraft, EU-KR
(droite), dans le DMAc/LiCl. V0 et Vt représentent les volumes de rétention de début et fin
d’intégration des signaux pour le calcul des masses molaires.
6.4. Distribution des masses molaires des lignines non dérivées dans le DMAc/LiCl
Les lignines non dérivées ont été analysées par SEC dans le système DMAc/LiCl. Les résultats sont
présentés dans la Figure 5.6. Les masses molaires moyennes et les degrés de polymérisation
correspondant sont donnés dans le Table 5.4.

294
Figure 30. Chromatogrammes SEC des lignines non dérivées analysées dans le système DMAc/LiCl,
gauche : Abondance relative en fonction du volume de rétention (mL), droite : Abondance relative en
fonction de log Mw
Tableau 24. Masses molaires moyennes (Mn, Mw) en g mol-1, polydispersité (Mw/Mn) et degrés de
polymérisation moyens (DPn, DPw) des lignines non dérivées, après analyse dans le système SEC-
DMAc/LiCl
Lignine Mn Mw Mw/Mn DPn DPw
PB1000 (plante annuelle) 2,650 5,470 2,1 13 27
Organosolv (plante annuelle) 4,970 25,270 5,1 25 126
Indulin (résineux) 3,430 9,620 2,8 17 48
Kraft (résineux, pin) 4,090 11,500 2,8 20 57
Eucalyptus – Kraft (feuillus) 2,030 4,080 2,0 10 20
6.5. Avantages et inconvénients de l’analyse directe des lignines non dérivées dans le DMAc/LiCl
Avantages : (1) l’analyse est réalisée sur l’échantillon tel quel, ainsi aucun lavage n’est nécessaire ce
qui réduit les risques de perte de certaines fractions de molécules (les plus petites) et (2) aucune
réaction de dérivation n’est requise, ce qui permet aussi d’éviter la dégradation de l’échantillon
pendant la dérivation.
Inconvénients : (1) la dissolution de l’échantillon est très longue, entre 4 à 5 semaines, (2) la
probabilité de former des agrégats dans la colonne de chromatographies est plus importante et cela
conduirait à obtenir des Mw plus élevées que la réalité, (3) la présence de sucres résiduels ou de
cendres peut interférer dans le calcul de la MMD et donc les masses des lignines impures pourraient
être mal évaluées.

295
6.6. Etude du lavage des lignines
L’extraction de la lignine de la biomasse lignocellulosiques utilise des procédés complexes et
difficiles à mettre en œuvre. Par ailleurs les lignines ainsi obtenues sont impures, elles contiennent des
sucres, des cendres, des minéraux. Pour éviter des interférences lors de leur analyse, les lignines sont
donc lavées pour éliminer au mieux ces impuretés. Trois solvants ont été sélectionnés en fonction de
leur polarité : l’éthanol, fortement polaire ; l’éthyl acétate moyennement polaire ; et l’hexane apolaire.
Les résultats ont montré que l’éthyl acétate est le solvant le plus adapté au lavage de la lignine.
6.7. Analyse des lignines fluorobenzylées
Les fonctions hydroxyles aliphatiques et phénoliques de la lignine sont dérivées par le chlorure de 4-
fluorobenzyle. Les dérivés fluorobenzylés de lignine sont soumis à la réaction de fluorobenzoylation
avec l’acide anhydride 4-fluorobenzoique. Après ces réactions, les hydroxyles secondaires et les
groupes phénoliques restant même après la fluorobenzylation sont convertis en dérivés de type esters.
Toutes les lignines dérivées sont analysées par RMN du 19F. La Figure 17 présente le spectre RMN 19F des lignines PB dérivées. Après fluorobenzylation, le signal spectral compris entre 115 et -117,48
ppm (/C6F6) correspond à la lignine fluorobenzylée et les hydroxyles phénoliques, alors que le signal
compris entre -117,48 et -118,5 ppm est attribué au hydroxyles aliphatiques primaires. Dans le cas des
lignines fluorobenzoylées, le signal de droite est dû à la lignine fluorobenzylée alors que le signal de
gauche correspond aux groupes fluorobenzoylés. Dans la région spectrale attribuée aux fonctions
fluorobenzoylées, les hydroxyles phénoliques sortent entre 104,6 et -107,24 ppm et les hydroxyles
aliphatiques secondaires entre -107,24 et -108,64 ppm. Le nombre de groupements hydroxyles
phénoliques et aliphatiques est proportionnel à l’aire sous les signaux, et est calculé en utilisant un
étalon interne dans le milieu. Il est ainsi possible de déterminer la quantité totale de groupes
hydroxyles, en mmol par gramme de lignine dérivée (mmol/g).
Figure 31. Spectres RMN du 19F de la lignine Protobind (PB) après fluorobenzylation et
fluorobenzoylation.

296
A noter que la fluorobenzylation de la lignine est employée pour améliorer la solubilité du polymère
mais aussi pour des analyses RMN du 19F NMR. A partir de cette réaction, les groupes hydroxyles
phénoliques et aliphatiques primaires peuvent être quantifiés (Table 5.8). On peut remarquer que la
lignine Indulin Kraft présente la teneur en hydroxyles phénoliques la plus importante par rapport aux
autres lignines Kraft. Parmi les lignines étudiées, la lignine ORG de plante annuelle contient, quant à
elle, la plus faible quantité de groupes hydroxyles.
Tableau 25. Quantité totale de groupes OH (en mmol/g) calculée à partir du spectre RMN du 19F des
lignines fluorobenzylées
Lignine Lignine fluorobenzylée Quantité totale de OHCalculée
mmol/g lignine dérivée
Ph-OH 1˚-OH PB 1,785 0,106 1,891
ORG 1,708 0,120 1,828 IND 2,451 0,078 2,529 KR 2,252 0,089 2,341
EU-KR 2,322 0,059 2,381
A partir de ces analyses RMN du 19F, la masse molaire moyenne d’une unité monomère de chaque
lignine testée a été calculée. Théoriquement, la masse molaire de la lignine acétylée est fixée à 220
g/mole. Pour les lignines fluorobenzylées et fluorobenzoylées, les résultats sont présentés dans le
Table 5.12. Pour les lignines fluorobenzylées, ce sont les lignines Kraft (IND, KR et EU-KR) qui
présentent les unités monomères de plus haute masse molaire, suivies par la lignine PB et la lignine
ORG. Dans le cas des lignines fluorobenzoylées, la tendance évolue ainsi : IND > KR > PB > EU-
KR > ORG. Ces résultats peuvent être comparés avec les nombres de groupements hydroxyles
présents dans chaque lignine (Table 5.8).
Tableau 26. Masse molaire du monomère de lignine fluorobenzylée (FB) et de lignine
fluorobenzoylée (FBO) en g mol-1, calculée d’après les analyses RMN du 19F
Lignine
Masse molaire du monomère
FB FBO PB 251 308
ORG 249 275
IND 275 328
KR 268 310
EU-KR 269 291

297
6.8. Analyse des lignines dérivées par SEC dans le système DMAc/LiCL
Toutes les lignines sont dérivées (acétylation, fluorobenzylation et fluorobenzoylation) et les
chromatogrammes SEC – DMAc/LiCl sont présentés dans la Figure 5.10. Les masses molaires
obtenues sont comparées dans le Table 5.13. Une distribution étroite des masses molaires est obtenue
dans le cas des lignines PB, Indulin et Eucalyptus Kraft, dérivées et non dérivées. Le calcul des
valeurs de Mn et Mw apparentes (Table 5.13) ne montre aucun changement significatif de
polydispersité.

298
Figure 32. Profils d’élution SEC des lignines non dérivées et dérivées (acétylation, fluorobenzylation
et fluorobenzoylation), abondance relative en fonction du volume de rétention (gauche) et abondance
relative en fonction de log (Mw) (droite)

299
Tableau 27. Masses molaires moyennes (Mn, Mw en g mol-1), polydispersité (Mw/Mn) et degrés de
polymérisation moyens (DPn, DPw) des lignines non dérivées et dérivées, après analyse SEC-
DMAc/LiCl
Mn Mw Mw/Mn DPn DPw
PB
Non dérivée 2650 5470 2,1 13 27
Acétylée 4967 9378 1,9 23 43
Fluorobenzylée 3400 6580 1,9 17 33
Fluorobenzoylée 2490 6200 2,5 12 31
IND
Non dérivée 3430 9610 2,8 17 48
Acétylée 2774 9790 3,5 14 49
Fluorobenzylée 2070 8210 4,0 10 41
Fluorobenzoylée 2190 7300 3,3 11 36
ORG
Non dérivée 4970 25270 5,1 25 126
Acétylée 4560 86840 19,1 23 434
Fluorobenzylée 3670 43200 11,8 18 216
Fluorobenzoylée 4040 15560 3,9 20 78
KR
Non dérivée 3890 11340 2,9 19 57
Acétylée 4390 21480 4,9 22 107
Fluorobenzylée 2750 9150 3,3 14 46
Fluorobenzoylée 1970 7050 3,6 10 35
EU-KR
Non dérivée 2030 4080 2,01 10 20
Acétylée 3280 6200 1,9 16 31
Fluorobenzylée 1990 4060 2,0 10 20
Fluorobenzoylée 1680 3910 2,3 8 20
6.9. Analyse des lignines dérivées par SEC dans le système THF
Analyse SEC-THF de différentes lignines dérivées – calibration conventionnelle et universelle
La fluoro dérivation améliore la solubilité des lignines dans le THF. En particulier la lignine PB
fluoro dérivée présente une meilleure solubilité que toutes les autres lignines dérivées. On observe

300
également, dans la Figure 33, que les lignines acétylées présentent des profils d’élution qui trainent
aux masses molaires élevées ; ceci montre que l’acétylation n’est pas adaptée pour une analyse de
lignine dans le système SEC-THF.

301
Figure 33. Profils d’élution SEC des différentes lignines dérivées – dans le système THF et
calibration universelle : Abondance relative en fonction du volume de rétention (gauche) et
abondance relative en fonction de log (Mw) (droite) (A - acétylée, FB - fluorobenzylée et FBO -
fluorobenzoylée)
L’abondance relative est tracée en fonction du logarithme de Mw pour toutes les lignines dérivées,
dans le cas de la calibration conventionnelle ou universelle (Figure 34). Avec la calibration
universelle, les masses molaires sont systématiquement supérieures par rapport à l’utilisation de la
calibration conventionnelle. En revanche les distributions présentent des profils similaires entre les
différentes lignines dérivées.

302
Figure 34. Comparaison entre la calibration conventionnelle et universelle – Profils d’élution SEC de
lignines dérivées – Abondance relative en fonction de log(Mw) (A - acetylatée, FB – fluorobenzylée
et FBO – fluorobenzoylée)
Les valeurs de Mn, Mw et de polydispersité des lignines acétylées, fluorobenzylées et
fluorobenzoylées obtenues par calibration universelle sont comparées à celles obtenues par calibration
conventionnelle (Tableau 28 à Tableau 32). Dans le cas de la calibration universelle, les valeurs de
Mn et Mw obtenues à partir des étalons PS et PMMA sont proches alors que lorsque l’on utilise
l’acétate de cellulose (polymère polydispersé) comme polymère calibrant, les valeurs de Mn et Mw

303
sont plus élevées et la polydispersité plus faible. Enfin, la calibration conventionnelle conduit à des
valeurs de Mw et de polydispersité 3 à 5 fois inférieures à celles obtenues à partir de la calibration
universelle.
Tableau 28. MMD de la lignine PB dérivée – analyse par calibration universelle avec la courbe de
calibration globale et les courbes individuelles (pour chaque polymère calibrant) – comparaison avec
la calibration conventionnelle. Mn et Mw en g/mole.
Calibration universelle
(Détecteur viscosimétrique)
Calibration conventionnelle
(Détecteur RI)
PB-Acétylée Mn Mw Mw/Mn Mp Mn Mw Mw/Mn Mp
Fit avec courbe globalea 380 10060 26,5 7780 - - - -
PS 330 9030 27,4 6910 560 2890 5,2 2500
PMMA 240 8260 34,4 5981 725 3640 5,0 3150
Acétate de cellulose 700 13260 18,9 11090 856 2720 3,2 2620
PB-Fluorobenzylée
Fit avec courbe globalea 2000 9560 4,8 7980 - - - -
PS 1760 8570 4,9 7110 1450 3180 2,2 2930
PMMA 1400 7700 5,5 6200 1840 4000 2,2 3690
Acétate de cellulose 3220 12890 4,0 11230 1770 3060 1,7 2990
PB-Fluorobenzoylée
Fit avec courbe globalea 3690 16140 4,4 9240 - - - -
PS 3230 14550 4,5 8250 2140 5390 2,5 3430
PMMA 2640 13510 5,1 7250 2710 6740 2,5 4320
Acétate de cellulose 5640 20680 3,7 12850 2450 4660 1,9 3420
a = Fit courbe globale (PS, PMMA, acétate de cellulose)

304
Tableau 29. MMD de la lignine IND dérivée – analyse par calibration universelle avec la courbe de
calibration globale et les courbes individuelles (pour chaque polymère calibrant) – comparaison avec
la calibration conventionnelle. Mn et Mw en g/mole.
Calibration universelle
(Détecteur viscosimétrique)
Calibration conventionnelle
(Détecteur RI)
IND-Acétylée Mn Mw Mw/Mn Mp Mn Mw Mw/Mn Mp
Fit avec courbe globalea 1090 19920 18,3 12300 - - - -
PS 950 17980 18,9 10990 820 4530 5,5 3770
PMMA 720 16860 23,4 9690 1040 5680 5,5 4750
Acétate de cellulose 1880 25150 13,4 16970 1160 3940 3,4 3700
IND-Fluorobenzylée
Fit avec courbe globalea 2440 15390 6,3 7600 - - - -
PS 2150 13890 6,5 6780 1660 4490 2,7 3040
PMMA 1750 13020 7,4 5920 2110 5630 2,7 3830
Acétate de cellulose 3790 19480 5,1 10670 1970 3980 2,0 3090
IND-Fluorobenzoylée
Fit avec courbe globalea 3760 22270 5,9 9700 - - - -
PS 3320 20100 6,1 8650 1910 5040 2,6 3210
PMMA 2730 18870 6,9 7570 2420 6310 2,6 4050
Acétate de cellulose 5780 28080 4,9 13550 2210 4400 2,0 3230
a=Fit courbe globale (PS, PMMA, acétate de cellulose)
Tableau 30. MMD de la lignine ORG dérivée – analyse par calibration universelle avec la courbe de
calibration globale et les courbes individuelles (pour chaque polymère calibrant) – comparaison avec
la calibration conventionnelle. Mn et Mw en g/mole.
Calibration universelle
(Détecteur viscosimétrique)
Calibration conventionnelle
(Détecteur RI)
ORG-Acétylée Mn Mw Mw/Mn Mp Mn Mw Mw/Mn Mp
Fit avec courbe globalea 2900 18950 6,5 17810 - - - -
PS 2530 16930 6,7 15850 770 2100 2,7 2380
PMMA 1940 14920 7,7 13660 980 2650 2,7 3010
Acétate de cellulose 4950 26270 5,3 25500 1070 2160 2,0 2520
ORG-Fluorobenzylée
Fit avec courbe globalea 19750 32700 1,7 32630 - - - -
PS 17480 29170 1,7 29050 1680 2690 1,6 2500

305
PMMA 14610 25550 1,7 25100 2130 3390 1,6 3150
Acétate de cellulose 29610 45760 1,5 46540 1930 2700 1,4 2620
ORG-Fluorobenzoylée
Fit avec courbe globalea 8600 34410 4,0 13540 - - - -
PS 7620 31030 4,1 12080 2240 4800 2,1 3180
PMMA 6400 28970 4,5 10570 2850 6020 2,1 4015
Acétate de cellulose 12800 43720 3,4 18940 2500 4270 1,7 3210
a=Fit courbe globale (PS, PMMA, acétate de cellulose)
Tableau 31. MMD de la lignine KR dérivée – analyse par calibration universelle avec la courbe de
calibration globale et les courbes individuelles (pour chaque polymère calibrant) – comparaison avec
la calibration conventionnelle. Mn et Mw en g/mole.
Calibration universelle
(Détecteur viscosimétrique)
Calibration conventionnelle
(Détecteur RI)
KR-Acétylée Mn Mw Mw/Mn Mp Mn Mw Mw/Mn Mp
Fit avec courbe globalea 540 31060 57,5 9520 - - - -
PS 470 28190 60,0 8490 750 5110 6,8 3100
PMMA 350 27270 77,9 7420 960 6380 6,6 3910
Acétate de cellulose 990 37450 37,8 13340 1110 4290 3,9 3130
KR-Fluorobenzylée
Fit avec courbe globalea 2190 13670 6,2 6250 - - - -
PS 1930 12340 6,4 5570 1510 4170 2,8 2770
PMMA 1560 11550 7,4 4840 1920 5230 2,7 3490
Acétate de cellulose 3430 17340 5,1 8840 1820 3710 2,0 2850
EU-KR-Fluorobenzoylée
Fit avec courbe globalea 3210 18190 5,7 6530 - - - -
PS 2840 16450 5,8 5830 2020 5580 2,8 3040
PMMA 2350 15630 6,7 5090 2570 6980 2,7 3830
Acétate de cellulose 4860 22540 4,6 9170 2310 4730 2,0 3090
a=Fit courbe globale (PS, PMMA, acétate de cellulose)
Tableau 32. MMD de la lignine EU-KR dérivée – analyse par calibration universelle avec la courbe
de calibration globale et les courbes individuelles (pour chaque polymère calibrant) – comparaison
avec la calibration conventionnelle. Mn et Mw en g/mole.

306
Calibration universelle
(Détecteur viscosimétrique)
Calibration conventionnelle
(Détecteur RI)
EU-KR-Acétylée Mn Mw Mw/Mn Mp Mn Mw Mw/Mn Mp
Fit avec courbe globalea 1260 8460 6,7 7270 - - - -
PS 1100 7580 6,9 6480 1010 3210 3,2 3070
PMMA 840 6820 8,1 5660 1300 4040 3,1 3870
Acétate de cellulose 2150 11370 5,3 10200 1390 3080 2,2 3110
EU-KR-Fluorobenzylée
Fit avec courbe globalea 3390 8580 2,5 7000 - - - -
PS 3000 7680 2,6 6240 1780 3130 1,8 2870
PMMA 2500 6880 2,8 5430 2260 3940 1,7 3630
Acétate de cellulose 5120 11610 2,3 9870 2040 3050 1,5 2940
EU-KR-Fluorobenzoylée
Fit avec courbe globalea 3630 13210 3,6 7990 - - - -
PS 3210 11890 3,7 7130 2040 4060 2,0 3200
PMMA 2670 10930 4,1 6240 2580 5100 2,0 4040
Acétate de cellulose 5470 17200 3,1 11170 2300 3740 1,6 3230
a=Fit courbe globale (PS, PMMA, acétate de cellulose)
Analyse SEC-THF de différentes lignines dérivées – Calcul des degrés de polymérisation (DP)
Le degré de polymérisation est calculé à partir des masses molaires des monomères, ces dernières
étant déterminées par l’analyse RMN du 19F NMR. Le degré de polymérisation en nombre est donné
par (DPn = Mn / masse molaire du monomère) et celui en poids par (DPw = Mw / masse molaire du
monomère). La polydispersité Q est égale à Q = DPw/DPn. Les valeurs de Mn et Mw sont issues de
l’analyse SEC dans le système THF avec la calibration universelle (courbe globale). Les valeurs de
DPn, DPw et Q (DPw / DPn) sont données dans le
Table 5.20. Dans le cas de la lignine acétylée, la masse molaire du monomère a été prise égale à 220
g/mol.

307
Tableau 33. DP calculés à partir de la calibration universelle (courbe globale) dans le système SEC-
THF
*Masse molaire des monomères des lignines FB-fluorobenzylées et FBO- fluorobenzoylées calculée à partir de
l’analyse RMN du 19F.
Les conclusions de ce chapitre sont les suivantes :
1. L’acétate d’éthyle est utilisé pour laver les lignines de leurs impuretés.
2. Différentes réactions de dérivation (acétylation, fluorobenzylation et fluorobenzoylation) ont
été réalisées sur la lignine afin de dissoudre la lignine dans le THF, la lignine étant
difficilement dissoute dans le DMAc/LiCl.
3. Les résultats SEC montrent que les fluoro-dérivations améliorent la dissolution de la lignine
et que cette dernière présente alors une distribution de masses plus uniforme que les lignines
acétylées (dans le système THF).
4. Comme l’analyse SEC dans le DMAc/LiCl avec calibration conventionnelle donne des
résultats imparfaits, une méthode de calibration universelle dans le système THF a été
développée. Elle utilise un viscosimètre en ligne dans la ligne de chromatographie afin
d’avoir accès à la MMD absolue du polymère.
5. L’analyse par calibration universelle prédit des masses molaires 3 à 5 fois supérieures à celles
obtenues par calibration standard. Les lignines acétylées présentent aussi des Mn plus faibles
et des polydispersités plus élevées, probablement car les fractions de lignine acétylée de
hautes masses sont plus difficiles à solubiliser.
6. Globalement la fluorobenzylation et la fluorobenzoylation de la lignine suivies de l’analyse
SEC dans le THF restent encore imparfaites à cause du solvant utilisé. En effet, la qualité des
Masse molaire du
monomère (g/mol) DPn DPw Q=DPw/DPn
PB Acétylée 220 2 46 26,2
FB 251* 8 38 4,8 FBO 308* 12 52 4,4
IND Acétylée 220 5 91 18,3
FB 275* 9 56 6,3 FBO 328* 11 68 5,9
ORG Acétylée 220 13 86 6,5
FB 249* 79 131 1,7 FBO 275* 31 125 4
KR Acétylée 220 2 141 57,5 FB 268* 8 51 6,2 FBO 310* 10 59 5,7
EU-KR Acétylée 220 6 38 6,7 FB 269* 13 32 2,5 FBO 291* 12 45 3,6

308
courbes SEC est moindre par rapport aux courbes obtenues dans le système DMAc/LiCl.
Seules les lignines EU-KR et PB présentent des profils d’élution réguliers, conduisant à des
valeurs de Mw et Mn fiables. Dans le cas des autres lignines, les valeurs obtenues sont
fortement affectées par les signaux aux hautes masses qui ont tendance à trainer,
probablement suite à des problèmes de rétention dans les colonnes (la phase PLgel dans le
système THF n’est peut-être pas adaptée aux dérivés fluorés de lignine).
7. Enfin, il faut noter que les différentes méthodes de dérivation testées peuvent aussi conduire à
la dégradation de la lignine, ainsi il est impératif d’optimiser ces réactions.
7. CONCLUSIONS
Ce travail de recherche a permis d’établir des méthodes de dérivation de la lignine pour l'analyse de la
lignine, de quantifier les groupes fonctionnels et de déterminer la distribution des masses molaires de
la lignine (MMD) par chromatographie par exclusion de taille. Cinq échantillons techniques de
lignine ont été étudiés : la lignine Protobind 1000, la lignine Organosolv, la lignine Pine Kraft, la
lignine Eucalyptus Kraft et la lignine Indulin. Les échantillons de lignine ont été transformés en
dérivés par une méthode classique d’acétylation et de nouvelles méthodes telles que la
fluorobenzylation et la fluorobenzoylation. Le nombre d'hydroxyles présents dans les échantillons de
lignine a été quantifié par des techniques GC et RMN (1H, 13C, 19F and 31P). La distribution en masse
molaire des échantillons de lignine dérivées a été calculée en utilisant différentes colonnes SEC avec
différents solvants (DMAc et THF). Des méthodes d'étalonnage conventionnelles et universelles ont
été utilisées pour les calculs et MMD. Avec cette approche, les nouvelles méthodes de dérivation de la
lignine améliorent de manière significative la solubilité dans le système de colonne THF, et la
méthode d'étalonnage universelle conduit à des masses molaires trois fois supérieures à celles issues
de la méthode d'étalonnage conventionnelle.