PteRu catalysts supported on carbon xerogels for PEM fuel cells
Upload
khangminh22Category
view
0download
0
Brigham Young University Brigham Young University
BYU ScholarsArchive BYU ScholarsArchive
Theses and Dissertations
2014-11-01
Preparation of Active, Stable Supported Iron Catalysts and Preparation of Active, Stable Supported Iron Catalysts and
Deactivation by Carbon of Cobalt Catalysts for Fischer-Tropsch Deactivation by Carbon of Cobalt Catalysts for Fischer-Tropsch
Synthesis Synthesis
Kamyar Keyvanloo Brigham Young University - Provo
Follow this and additional works at: https://scholarsarchive.byu.edu/etd
Part of the Chemical Engineering Commons
BYU ScholarsArchive Citation BYU ScholarsArchive Citation Keyvanloo, Kamyar, "Preparation of Active, Stable Supported Iron Catalysts and Deactivation by Carbon of Cobalt Catalysts for Fischer-Tropsch Synthesis" (2014). Theses and Dissertations. 5705. https://scholarsarchive.byu.edu/etd/5705
This Dissertation is brought to you for free and open access by BYU ScholarsArchive. It has been accepted for inclusion in Theses and Dissertations by an authorized administrator of BYU ScholarsArchive. For more information, please contact [email protected], [email protected].

Preparation of Active, Stable Supported Iron Catalysts and Deactivation by Carbon of Cobalt
Catalysts for Fischer-Tropsch Synthesis
Kamyar Keyvanloo
A dissertation/thesis submitted to the faculty of Brigham Young University
in partial fulfillment of the requirements for the degree of
Doctor of Philosophy
William C. Hecker, Chair Calvin H. Bartholomew
Morris D. Argyle John D. Hedengren W. Vincent Wilding
Department of Chemical Engineering
Brigham Young University
November 2014
Copyright © 2014 Kamyar Keyvanloo
All Rights Reserved

ABSTRACT
Preparation of Active, Stable Supported Iron Catalysts and Deactivation by Carbon of Cobalt Catalysts for Fischer-Tropsch Synthesis
Kamyar Keyvanloo
Department of Chemical Engineering, BYU Doctor of Philosophy
The first half of this dissertation reports the development of supported Fe FT catalysts
including the effects of various, carefully chosen preparation methods on the performance of alumina-supported iron/copper/potassium (FeCuK/Al2O3); it was determined that non-aqueous slurry impregnation and co-impregnation yielded catalysts with activities as high as any reported in the literature. Furthermore, the effects of support properties including pore size, hydroxyl group concentration, and support stabilizer were investigated for FeCuK/Al2O3 catalysts containing 20 or 40% Fe. For the first time, we report the performance of a supported Fe FT catalyst that is not only more active and stable than any supported Fe catalyst previously reported, but also has activity equivalent to that of the most active, unsupported catalysts. More importantly, the catalyst is extremely stable as evidenced by the fact that after 700 h on stream, its activity and productivity are still increasing. These catalyst properties result from the use of a novel γ-alumina support material doped with silica and pretreated at 1100°C. This unique support has a high pore volume, large pore diameter, and unusually high thermal stability. The ability to pretreat this support at 1100°C enables preparation of a material having a low number of acid sites and weak metal oxide-support interactions, all desirable properties for an FT catalyst.
The second half of this dissertation investigates the effects of operating conditions
including the partial pressures of CO and H2 and temperature on the deactivation by carbon of 25 wt% Co/ 0.25 wt% Pt/Al2O3 catalyst. It also reports the kinetics of the main FT reaction on this catalyst. As temperature increases, the H2 and CO orders for the main reaction (in the absence of deactivation) become more positive and more negative, respectively. A new mechanism was proposed to account for the inhibition effect of CO at high reaction temperatures, which includes H-assisted dissociation of CO to C* and OH*. Further, twelve samples of the CoPt/Al2O3 catalyst were tested over a period of 800 hours and XCO < 24%, each at a different set of CO and H2 partial pressures and temperature (220-250°C). At reaction temperature of 230°C, increasing PCO or PH2 increases the deactivation rate; possibly due to formation of polymeric carbons. The H2 and CO partial pressure orders for the deactivation rate at 230°C were found to be 1.12 and 1.43, respectively using a generalized-power-law-expression (GPLE) with limiting activity of 0.7 and 1st order deactivation. For a H2/CO of 2 (PH2 = 10 bar and PCO = 5 bar) the deactivation rate increases as process temperature increases from 220 to 250°C with an activation energy of 81 kJ/mol. However, at higher CO partial pressure (PCO = 10 bar) the deactivation rate for the Co catalyst of this study decreases with increasing temperature; this can possibly be attributed to the formation of more active cobalt sites at higher temperatures due to surface reconstruction.
Keywords: Fischer-Tropsch, supported iron, silica-stabilized alumina, cobalt catalyst, deactivation by carbon, kinetics

ACKNOWLEDGEMENTS
I would like to express my highest appreciation to my advisor, Dr. William Hecker for
his mentoring and guidance through research while giving me freedom to try new things and
responsibilities to become an independent researcher. I have enjoyed your encouragement,
friendship, and support—particularly the moments when we discovered new things and
approaches to solve scientific issues.
A very special thanks to Dr. Calvin Bartholomew who spent many hours teaching me
how to be a better scientist and writer. I have enjoyed every moment of our meetings in which
you patiently taught me the fundamentals of catalysis, especially catalyst preparation and
deactivation. Your guidance and support played a crucial role in my success.
I wish to acknowledge my committee, especially Dr. Morris Argyle and Dr. John
Hedengren, for their support and assistance. Also I would like to thank Dr. Brian Woodfield and
his group, especially Maryam Khosravi and Baiyu Huang, from the BYU Chemistry and
Biochemistry Department for their contribution; in fact, their unique silica-stabilized alumina
support was a key factor in our iron catalyst developments. My special thanks to Dr. Gary Jacobs
from the Center for Applied Energy Research at the University of Kentucky, for H2-TPD and
XANES/EXAFS work which was a vital part of our Co deactivation work. Thanks to Dr. J.W.
(Hans) Niemantsverdriet and Remco Lancee from Eindhoven University of Technology for XPS
results.
This work could have never been possible without the consistent help of the students of
the BYU Catalysis Laboratory. Many thanks to Grant Harper, Brad Chandler, Luke Harrison,
Jonathon Horton, Dane Bennion, Phillip Childs, Michael Albretsen, Logan Clark, Hector Perez,
Trent Okeson, Steven Lanham, McCallin Fisher, Jacob Knudson, and others who spent many
days and nights operating the test reactor, preparing and characterizing catalysts, and performing
modeling work. A special thanks to Trent Okeson for designing and building the unique wax-
extraction system to make characterization of spent catalysts possible.
Finally, I would like to thank my family for their countless love and support—my
mother, father, and two brothers (Kaveh and Pooria) who have had the most encouragement,
patience, love, and confidence in me. They have inspired me to continue to strive to be the best.
Thank you for always being there for me.

TABLES OF CONTENT
LIST OF TABLES ....................................................................................................................... ix
LIST OF FIGURES .................................................................................................................... xii
Chapter 1 Introduction................................................................................................................. 1
1.1 Fischer-Tropsch Synthesis ..................................................................................................1
1.2 FTS catalysts .......................................................................................................................4
1.2.1 Iron catalysts: supported vs. unsupported.....................................................................5
1.2.2 Cobalt catalysts: Deactivation modes ...........................................................................7
1.3 Objectives and overview of dissertation ...........................................................................17
Chapter 2 Experimental Techniques ........................................................................................ 19
2.1 Catalyst preparation...........................................................................................................20
2.1.1 Support........................................................................................................................20
2.1.2 Iron catalysts ...............................................................................................................21
2.1.3 Cobalt catalyst ............................................................................................................22
2.1.4 Bulk calcination, reduction, and passivation ..............................................................22
2.1.5 Activation procedure ..................................................................................................24
2.2 Catalyst characterization ...................................................................................................26
2.2.1 Nitrogen adsorption/desorption .................................................................................26
2.2.2 X-ray diffraction ........................................................................................................26
2.2.3 Thermo-gravimetric analysis (TGA) experiments .....................................................27
2.2.4 Temperature-programmed (TP) experiments with mass spectroscopy ......................29
2.2.5 Nuclear magnetic resonance (NMR) ..........................................................................33
2.2.6 X-ray photoelectron spectroscopy (XPS) ...................................................................34
2.2.7 XANES/EXAFS .........................................................................................................34
2.3 Activity, selectivity, and stability measurements ..............................................................36
2.3.1 Fixed-bed reactor description .....................................................................................36
2.3.2 Catalyst loading ..........................................................................................................37
2.3.3 Wax extraction of spent cobalt catalysts ....................................................................38
2.3.4 Rate and Selectivity Calculations ...............................................................................41
Chapter 3 Supported Iron: Effect of Preparation Variables .................................................. 43
v

3.1 Introduction .......................................................................................................................43
3.2 Experimental .....................................................................................................................47
3.2.1 Catalyst preparation ....................................................................................................47
3.2.2 Catalyst characterization .............................................................................................50
3.2.3 Activity and selectivity measurements .......................................................................50
3.3 Results ...............................................................................................................................51
3.3.1 Physical properties ......................................................................................................51
3.3.2 Catalyst reducibility ....................................................................................................55
3.3.3 Catalyst carbiding .......................................................................................................59
3.3.4 FTS performance ........................................................................................................63
3.4 Discussion .........................................................................................................................68
3.4.1 Choice of solvent: aqueous vs non-aqueous (K1 vs. K3) ...........................................69
3.4.2 Fe loading level: 20 wt% vs 40 wt% (K1 vs K2) .......................................................71
3.4.3 Potassium loading level: 4K/100Fe vs 8K/100Fe (K3 vs K4) ...................................72
3.4.4 Impregnation timing: sequential impregnation vs co-impregnation; direct surface promotion of the support (K3, K5, K6) .....................................................................72
3.5 Conclusion .........................................................................................................................74
Chapter 4 Supported Iron: Effects of Support Material and SiO2 Stabilizer ....................... 76
4.1 Introduction .......................................................................................................................76
4.2 Experimental .....................................................................................................................80
4.2.1 Catalyst preparation ....................................................................................................80
4.2.2 Catalyst characterization .............................................................................................81
4.2.3 Activity and selectivity measurements .......................................................................81
4.3 Results ...............................................................................................................................82
4.3.1 Physical properties ......................................................................................................82
4.3.2 Catalyst reducibility ....................................................................................................88
4.3.3 Catalyst carbiding .......................................................................................................95
4.3.4 FTS performance ........................................................................................................98
4.4 Discussion .......................................................................................................................103
4.4.1 Effects of support pore size, pore volume, and CO uptake ......................................106
4.4.2 Effects of hydroxyl group concentration ..................................................................109
vi

4.4.3 Effects of silica vs. lanthana stabilization of alumina support .................................111
4.5 Conclusions .....................................................................................................................116
Chapter 5 Kinetics of Deactivation of Cobalt FT Catalysts by Carbon: Effects of CO and H2 Partial Pressures and Temperature ........................................................................... 119
5.1 Introduction .....................................................................................................................119
5.2 Experimental ...................................................................................................................124
5.2.1 Catalyst preparation ..................................................................................................124
5.2.2 Reference catalysts (Ref. catalysts) ..........................................................................125
5.2.3 Activity and selectivity measurements .....................................................................126
5.2.4 Catalyst characterization ...........................................................................................127
5.3 Results .............................................................................................................................127
5.3.1 Reference catalysts (Ref. catalysts) ..........................................................................127
5.3.2 FTS performance with time ......................................................................................130
5.3.3 Nitrogen adsorption/desorption ................................................................................137
5.3.4 X-ray diffraction (XRD) ...........................................................................................139
5.3.5 Temperature programmed reduction (TPR) .............................................................141
5.3.6 XANES/EXAFS .......................................................................................................143
5.3.7 XPS Results ..............................................................................................................147
5.3.8 Temperature-programmed hydrogenation (TPH) on wax extracted catalysts ..........148
5.3.9 CO-chemisorption ....................................................................................................155
5.3.10 Extent of reduction (EOR), dispersion, and crystallite size .....................................158
5.4 Discussion .......................................................................................................................158
5.4.1 Exclusion of deactivation mechanisms other than deposits of carbonaceous or hydrocarbonaceous species ...................................................................................................158
5.4.2 Effects of polymeric carbon on catalyst properties, CO-uptake, and activity ..........161
5.4.3 Effects of PH2, PCO and H2/CO Ratio on Deactivation .............................................163
5.4.4 Effect of temperature on deactivation ......................................................................167
5.5 Conclusions .....................................................................................................................168
Chapter 6 Reaction and Deactivation Kinetics for Cobalt FTS ........................................... 170
6.1 Introduction .....................................................................................................................170
6.2 Methodology ...................................................................................................................172
vii

6.2.1 Kinetic and deactivation experimental designs and collection of data .....................172
6.2.2 Reaction and deactivation kinetics ...........................................................................174
6.2.3 Statistical analysis.....................................................................................................176
6.3 Results and discussion .....................................................................................................177
6.3.1 Kinetics of main reaction in the absence of deactivation .........................................177
6.3.2 Kinetics of deactivation ............................................................................................185
6.4 Conclusions .....................................................................................................................192
Chapter 7 Accomplishments, Future Work and Recommendation ..................................... 193
7.1 Accomplishments ............................................................................................................193
7.2 Future work and recommendation...................................................................................196
7.2.1 Catalyst preparation and pretreatment ......................................................................196
7.2.2 Main reaction kinetics and modeling ........................................................................198
7.2.3 Deactivation kinetics and modeling .........................................................................199
References .................................................................................................................................. 201
Appendix A. Calculations of expansion factor, rate of CO+H2, PH2 and PCO ................. 212
Appendix B. Comparison of integral and differential reactor performance .................. 214
Appendix C. Steady-state FB data for supported Fe catalyst (40Fe/AlSi) ...................... 216
Appendix D. Steady-state FB data in absence of deactivation for cobalt catalyst .......... 217
Appendix E. Rate expression derivation for Model 8, Chapter 6 ................................... 218
viii

LIST OF TABLES
Table 1.1. Current commercial GTL/FT plants [4, 5]. .....................................................................3
Table 1.2. Different carbon species on cobalt FT catalysts with their corresponding hydrogenation temperatures and conditions under which they were identified. ...........................14
Table 2.1. Overview of all the catalysts prepared in this study. ....................................................19
Table 2.2. Furnace temperature schedule for catalyst activation of supported iron catalysts. ......25
Table 2.3. Relative masses of catalyst and wax after H2-TPR for waxed and wax-extracted catalysts. .........................................................................................................................................41
Table 3.1. Preparation variable values for each of the six studied catalysts. .................................48
Table 3.2. Surface area, pore volume, and average pore diameter of St. Gobein support and six catalysts of this study. ..............................................................................................................52
Table 3.3. Fe0 and Fe3O4 particle sizes estimated from XRD. ......................................................54
Table 3.4. Actual extent of reduction after TPR. ...........................................................................57
Table 3.5. Theoretical extent of reduction. ....................................................................................57
Table 3.6. Extent of reduction following oxygen titration at 400°C. ............................................59
Table 3.7. CO uptakes on different catalysts measured by CO-TPD. ...........................................62
Table 3.8. Performance of six catalysts of this study in fixed-bed reactor tests. T = 260°C, H2/CO = 1, PH2
0 = 0.66 MPa, PCO0 = 0.66 MPa, Ptot = 2.2 MPa. ...................................................65
Table 3.9. Comparison of K1 and K5 performance with catalysts reported in the literature. .......69
Table 4.1. Surface area, pore volumes and pore diameters of calcined catalysts and supports. ....83
Table 4.2. Fe0, Fe3O4, Fe5C2 crystallite sizes estimated from XRD. Catalysts were reduced at 280°C in 10% H2/He for 10 h followed by 100% H2 for 6 h. 40Fe/AlG and 40Fe/AlSi were carbided at 280°C for 10 h in H2/CO=1. Reduced and carbided samples were carefully .............88
Table 4.3. Extents of Reduction determined from H2-TPR data. ..................................................90
Table 4.4. Concentrations of physisorbed water and OH groups for alumina samples. ................92
Table 4.5. Extent of reduction (EOR) to Fe metal determined from oxygen titration after reduction of each sample at 280°C with 10% H2/He in TGA. ......................................................94
ix

Table 4.6. Mass losses of reduction and carbiding stages as shown by syngas-TPR (Figure 4.8a). ..............................................................................................................................................96
Table 4.7. CO-chemisorption of the carbided catalysts, following 10 h of syngas at 280°C in TGA. ..............................................................................................................................................98
Table 4.8. Performance of six catalysts of this study in fixed-bed reactor. T = 260 °C, H2/CO = 1, PH2
0 = 0.66 MPa, PCO0 = 0.66 MPa, Ptot = 2.2 MPa.a..............................................................99
Table 4.9. Comparison of BYU 40Fe/AlSi with other supported Fe catalysts at 260°C. ............104
Table 4.10. Comparison of BYU 40Fe/AlSi with unsupported Fe catalysts at 260°C. ...............105
Table 5.1. Reference catalysts and CO exposure temperatures. ..................................................125
Table 5.2. Catalyst performance at ~100 h TOS for 25 wt% CoPt/Al2O3 at different partial pressures of H2 and CO at 230-250 °C and 20 bar. .....................................................................131
Table 5.3. Surface area, pore volume, and pore diameter of freshly reduced, Refs., and FB wax-extracted spent catalysts. ......................................................................................................139
Table 5.4. Results of EXAFS fitting parameters for catalysts and reference compound acquired near the Co K-edge. The fitting ranges were Δk = 3.5 – 9 Å-1 and ΔR = 1.5 – 2.9 Å. S0
2 = 0.9. ......................................................................................................................................146
Table 5.5. Integration of CH4 peaks for TPH on wax-extracted spent FB catalyst samples. ......155
Table 5.6. CO-uptake data on freshly reduced catalyst and wax-extracted spent FB catalysts. ..157
Table 5.7. Monolayer carbon equivalents of TPH peak areas following FT synthesis for 800 h at 230-250°C and 20 bar. ..........................................................................................................165
Table 6.1.Process conditions (feed H2 and CO partial pressures and reaction temperature) for seven deactivation experiments at 20 bar. ..............................................................................174
Table 6.2. Rate constants, pre-exponential factor, activation energy and reaction orders of H2 and CO for CoPt/Al2O3 at PCO
0 = 2.7-6 bar, PH20 = 6-12 bar and XCO < 24%. ......................178
Table 6.3. Different rate expressions and their corresponding assumptions. ..............................182
Table 6.4. Estimated kinetic parameters for two-parameter models. ..........................................183
Table 6.5. Estimated kinetic parameters for three-parameter models. ........................................184
Table 6.6. Deactivation rate parameters for d = 0, 0.5, 1, and 2 with a∞ of 0.3, 0.5, 0.7 obtained from fitting five sets of activity-time data at 230°C (Figure 6.5) for runs up to ~800 h....................................................................................................................................................186
x

Table 6.7. Comparison of the deactivation rate constants and a∞ values of this study with Sasol for cobalt FT catalyst..........................................................................................................191
xi

LIST OF FIGURES
Figure 1.1. Typical normalized activity vs. time for CoPt/Al2O3 under realistic FT conditions (230 °C, 20 bar, inlet feed of 50-60 vol.% H2 and 30-40 vol.% CO) [27]. ....................9
Figure 2.1. Schematic of fixed-bed reactor system for temperature-programmed experiments monitored with mass spectrometer. ...............................................................................................31
Figure 2.2. Process flow diagram of dual channel fixed bed reactor system. ................................37
Figure 2.3. Process flow diagram of wax extraction system using modified Soxhlet extraction........................................................................................................................................39
Figure 2.4. H2-TPR weight loss of a freshly reduced waxed catalyst before and after wax-extraction........................................................................................................................................40
Figure 3.1. Pore size distributions..................................................................................................53
Figure 3.2. X-ray diffraction patterns of passivated reduced catalysts with standards for γ-Al2O3, α-Fe, and Fe3O4. .................................................................................................................55
Figure 3.3. H2-temperature programmed reduction profiles of supported iron catalysts. .............56
Figure 3.4. Syngas-TPR profile of the alumina supported iron catalysts up to 350°C. .................60
Figure 3.5. (a) CO spectra and (b) CO2 spectra of CO-TPD after CO adsorption at 150°C. ........61
Figure 3.6. Catalyst activity at 250°C (PH20 = 0.66 MPa, PCO
0 = 0.66 MPa, Ptot = 2.2 MPa) vs. time on stream. .........................................................................................................................66
Figure 4.1. Pore size distribution of supports calculated from BET data using a new slab pore model [65] ..............................................................................................................................84
Figure 4.2. (a) BET surface area, (b) pore volume, and (c) average pore diameters of AlSi as a function of calcination temperature. The two sets of data for the pore diameter correspond to the two peaks in the bimodal distribution shown in Figure 4.2 and Table 4.1. .........................85
Figure 4.3. X-ray diffraction patterns of AlSi as a function of temperature confirming the AlSi support is essentially γ-alumina at 1100°C. ...........................................................................86
Figure 4.4. X-ray diffraction patterns of (a) reduced and (b) carbided catalysts. ..........................87
Figure 4.5. TPR profiles of the supported iron catalysts. ..............................................................89
Figure 4.6. Thermo gravimetric curves for dehydration and dehydroxylation of alumina samples. The samples were heated from room temperature to 1100°C in He flow and held for 2 h. ............................................................................................................................................91
xii

Figure 4.7. Ammonia-TPD measurements on AlSi calcined at 700, 900, and 1100°C demonstrating the reduction in acid sites as calcination temperature is increased. .......................93
Figure 4.8. Syngas-TPR profile of the alumina supported iron catalysts (a) up to 350 °C and (b) up to 700°C. Profiles were obtained by ramping in 10% syngas/He (H2/CO=1) at 3 °C/min up to 700°C........................................................................................................................97
Figure 4.9. Catalyst stability with time on stream at 250°C, H2/CO:1, total pressure of 2.2 MPa, 30-60 mesh size except for the catalyst of highest rate. .....................................................101
Figure 4.10. Comparison of first order rate constants for various supported and unsupported iron catalysts at 260°C. The left axis in represents the rate constant per gram of catalyst (blue) and right axis is the rate constant per gram of Fe (red). ....................................................103
Figure 4.11. Intrinsic activity as a function of average pore size of different aluminas used as catalytic supports. Note that the pore diameter value for AlSi of 25 nm was determined as an integrated average of the 2 major peaks in Figure 4.2. ...........................................................107
Figure 4.12. FTS rate (rate of (CO+H2) Fe catalysts measured at 260 °C (time on stream ~ 90 h) as a function of CO uptake of freshly carbided catalysts (carbiding for 10 hours at 280 °C). ...............................................................................................................................................108
Figure 4.13. Extent of carburization found from the third stage of syngas-TPR (Figure 4.8b) as a function of pore diameter of the support. Note that the pore diameter value for AlSi of 25 nm was determined as an integrated average of the 2 major peaks in Figure 4.2. .................110
Figure 4.14. (a) EOR to Fe metal as a function of hydroxyl group content, (b) catalyst activity (rate of (CO+H2) at 260 °C) as a function of EOR, and (c) extent of carbiding found from syngas-TPR as a function of EOR. .....................................................................................113
Figure 4.15. (a) 27Al MAS NMR for pure alumina and 5 wt% BYU silica-doped alumina (AlSi) (b) 29Si MAS NMR and 29Si CPMAS for 5 wt% BYU silica-doped alumina (AlSi). ......115
Figure 5.1. TPH profiles of reference catalysts (Refs. 1-4). ........................................................129
Figure 5.2. XPS spectra of the C 1s region for Ref. catalysts......................................................130
Figure 5.3. Relative activity vs. time for 25 wt% CoPt/Al2O3 at (a) Runs 1-5; all at 230°C, (b) Runs 3, 6, 7, and 10; all at PH2 = 10 bar and PCO = 5 bar, and (c) Runs 1, 5, 8, 9, 11; all at H2/CO of 1. ..................................................................................................................................133
Figure 5.4. CO conversion of FB run (Run 5) and repeated FB run (Run 5-repeat) at 230°C, 20 bar, PH2=10 = PCO = 10 bar. ....................................................................................................134
Figure 5.5. Productivity and methane selectivity of (a) Run 4 (PH2=10 bar, PCO=7.3 bar) (b) Run 5 (PH2=10 bar, PCO=10 bar) at 230°C and 20 bar, (c) Run 9 (PH2=10 bar, PCO=10 bar) at 250°C and 20 bar, and (d) Run 11 (PH2=10 bar, PCO=10 bar) at 220°C and 20 bar and (e)
xiii

methane selectivity of other runs showing relatively constant methane selectivity over 800 – 900 h.............................................................................................................................................137
Figure 5.6. X-Ray diffraction of, FB wax-extracted catalysts, calcined catalyst, freshly reduced catalyst, and ICDD standards. ........................................................................................141
Figure 5.7. TPR profiles of calcined fresh catalyst and wax-extracted spent catalysts for (a) Runs 1-5 and (b) Runs 6-9. ..........................................................................................................143
Figure 5.8. Normalized XANES spectra (Co K-edge) for calcined, freshly reduced, and wax-coated spent catalyst (Run 5: PH2 = PCO = 10 bar and 230°C). ............................................144
Figure 5.9. Co K-edge EXAFS k2-weighted Fourier transform magnitude spectra over (left) longer k-range of 2.5 – 10 angstroms-1 and (right) shorter k-range of 3.5- 9 angstroms-1 for (I) (solid) freshly reduced catalyst and (dashed) spent catalyst (Run 5: PH2 = PCO = 10 bar and 230°C) and (II) (solid) Co metal foil and (dashed) calcined catalyst. ..................................145
Figure 5.10. EXAFS results at the Co K-edge, including (a) (left) the raw k2-weighted χ (k) versus k (b) (middle) (solid line) the filtered k2∙χ (k) versus k and (filled circles) the result of the fitting; and (c) (right) (solid line) the Fourier transform spectra with (filled circles) the result of the fitting. Model was weighted to k2 to emphasize Co-Co scattering and only considered Co-Co metal coordination in the fitting. Because of the low quality of the spent catalyst spectra, the fitting range was 3.5 – 9 angstroms-1 and the r-range was 1.5 – 2.9 angstroms. (I) Co metal foil; (II) freshly reduced catalyst; (III) spent catalyst (Run 5: PH2 = PCO = 10 bar and 230°C). .............................................................................................................147
Figure 5.11. X-ray photoelectron spectra of the C 1s region for freshly reduced (without wax), freshly reduced wax-extracted, Ref. 1, and FB wax-extracted catalysts (a) Runs 1-5, (b) Runs 6-9. ................................................................................................................................150
Figure 5.12. TPH of wax-extracted spent catalysts and freshly reduced wax-extracted catalyst for (a) m/z=15 for Runs 1-5, (b) m/z=25 for Runs 1-5, and (c) m/z=15 for Runs 6-9. ..154
Figure 5.13. CO uptake decrease as a function of inlet partial pressures of H2 and CO for Runs 1-5; all at 230°C. .................................................................................................................157
Figure 5.14. (a) Average deactivation rate and (b) CO-uptake decrease from the value of CO-uptake for wax-extracted freshly-reduced sample (Table 5.6) as a function of polymeric carbon on FB wax extracted catalyst samples (Runs 1-9). ..........................................................164
Figure 6.1. Domain of H2 and CO partial pressures for reaction kinetic experiments in the absence of deactivation. ...............................................................................................................173
Figure 6.2. Effects of (a) PH2 at constant PCO (4 bar) and (b) PCO at constant PH2 (8 bar) on rate (mmol (CO)/gcat/h) at different temperatures for 25 wt% CoPt/Al2O3 catalyst. The rates are adjusted to the desired temperature with activation energy of 129 kJ/mol found from power-law fit as shown in Table 6.2. ...........................................................................................178
xiv

Figure 6.3. Apparent activation energies for CoPt/Al2O3 at 20 bar and different feed gas concentrations. .............................................................................................................................179
Figure 6.4. Proposed elementary steps for FTS on Co catalysts. ................................................180
Figure 6.5. Parity plot of best kinetic models for (a) two-parameter model 4 and (b) three-parameter model 8........................................................................................................................184
Figure 6.6. Deactivation data for CoPt/Al2O3 catalyst as a function of time at 230°C and 20 bar fit to GPLE (Equation 6.10) with (a) 𝑎𝑎∞= 0.7 and d = 1, (b) 𝑎𝑎∞= 0.7 and d = 0, (c) 𝑎𝑎∞= 0 and d = 1. ..................................................................................................................................188
Figure 6.7. Deactivation data for CoPt/Al2O3 catalyst at different temperatures (Run 3: 230°C, Run 6: 240°C, Run 7: 250°C), PH2 = 10 bar, PCO = 5 bar, Ptot = 20 bar fit to Equation 6.11...............................................................................................................................................189
Figure 6.8. Parity plot of an overall deactivation model (Equation 6.12) for all the deactivation data (Runs 1-7 and 10). Each data point is an average of activities over a period of 100 h. .......................................................................................................................................190
xv

Chapter 1 Introduction
This chapter provides background information on Fischer-Tropsch Synthesis (FTS),
compares unsupported and supported iron catalyst with brief information on iron catalyst
preparation, and discusses cobalt deactivation pathways including poisoning, sintering,
oxidation, cobalt aluminate formation, carbon deposition, bulk cobalt carbide, and surface
reconstruction.
1.1 Fischer-Tropsch Synthesis
Increasing global concerns regarding dwindling petroleum reserves, the environmental
impacts of oil production and transportation, and politically unstable sources of petroleum are
driving for the development of alternatives to conventional petroleum resources to supply liquid
fuels. Fischer-Tropsch Synthesis (FTS), the production of liquid hydrocarbons from synthesis
gas (CO and H2) is an economically and environmentally-sound method to produce fuels and
chemicals from natural gas, coal, and biomass. Processes which convert natural gas, coal, and
biomass to liquid fuels are referred to as gas-to-liquids (GTL), coal-to-liquids (CTL), and
biomass-to-liquids (BTL). FTS is a key step in GTL processes that are being developed and
commercialized to convert remotely located or flared natural gas to sulfur-free diesel fuel.
Because of the renewed interest in the FT process, many companies have invested
heavily into developing FTS technology; these include BP, ExxonMobil, Shell, Statoil,
1

Syntroleum, and ConocoPhilips [1]. Sasol with total production beyond 200,000 bbl/day and
Shell with a total production of 155,000 bbl/d of liquid fuels are the largest producers of diesel
and aviation fuels and chemicals via FTS. The main factors that have contributed to this
increasing interest in FT process are:
(1) Increasing prices of crude oil during the past decade to as high as $150/bbl ,which in the
past 3-4 years stabilized around $100/bbl. A recent study by de Smit and Weckhuysen [2]
showed a tripled output of peer reviewed FTS research papers since 1995 as the oil price
increased significantly. This revived activity has been very probably stimulated by the
increase in crude oil price, although it is also inspired by limitation in oil resources.
(2) Rapid economic and population growth and increasing demand for liquid fuels in large,
developing countries (e.g. China and India) has intensified and will continue to greatly
intensified the problem. While the United States is the largest petroleum consumer with
18.5 million barrels per day in 2013, demand is increasing in large countries, e.g., China
with a consumption of 10.3 million barrels per day. CTL process can be used in China
and India as they have large amounts of coal reserves. Interestingly, Sasol has announced
it will build CTL plants in the near future in both China and India [3].
(3) Improved environmental awareness and legislative constraints on CO2 and sulfur
emissions have made FTS technology even more attractive. Impacts of oil drilling, oil
spills, and flaring of co-produced natural gas are serious environmental concerns
surrounding oil production. Furthermore, synthesis fuels are much cleaner than those
produced from crude oil. For example, diesel fuel produced from CTL has a sulfur
content of less than 0.1 ppm and aromatic content of less than 1%.
2

Commercial FT plants currently operating or announced are represented in Table 1.1.
Two companies, Sasol and Shell, have proven GTL technologies which have been demonstrated
in commercial scale GTL plants. PetroSA has completed a semi-commercial demonstration of
FT technology at PetroSA’s Mosselbay GTL plant. Shell is currently producing 15,000 bbl/d of
diesel fuel from natural gas in Bintulu, Malaysia and 140,000 bbl/day of diesel in their Qatar
Pearl plant, which owns 15% of the world’s gas reserves [4]. Sasol’s recently-built Oryx-GTL in
Ras Laffan, Qatar jointly owned by Sasol and Qatar Petroleum has a nominal capacity of 34,000
bbl/day. Chevron in a joint venture with the Nigerian National Petroleum Corporation is
commissioning a 34,000 bbl/d GTL plant in Nigeria with a cobalt based FT catalyst, which uses
Sasol technology. The Escarvaros GTL plant has the same technology and capacity of Oryx-GTL
plant in Qatar and is expected to start up by mid 2014. Two commercial FT plants operated by
Sasol and PetroSA, use iron catalyst to convert natural gas to liquid. In both cases, unsupported
iron catalyst is being used. Sasol is using slurry and fluidized-bed CTL technologies for their
iron-based GTL plants in Sasolburg and Secunda to produce mainly chemicals.
Table 1.1. Current commercial GTL/FT plants [4, 5].
Company Location Catalyst type Plant capacity, bbl/day
Start-up date
Sasol Sasolburg, South Africa
Precipitated iron 5,000 1993
Shell Bintulu, Malaysia
Co/SiO2 Co/TiO2
14,500 1992
PetroSA Mosselbay, South Africa
Fused iron 22,000 1993
Sasol-QP (Oryx-GTL)
Ras Laffan, Qatar
Co/Al2O3 34,000 2007
Shell-QP (Pearl)
Ras Laffan, Qatar
Co/TiO2 140,000 2011
Chevron-Sasol
Escarvaros, Nigeria
Co/Al2O3 34,000 Mid 2014
3

1.2 FTS catalysts
Group 8 transition metals are known to catalyze the FT reaction. However, only Ni, Co,
Fe, and Ru have sufficient CO hydrogenation activity for commercial application. Nickel mainly
produces methane at FT reaction temperatures. It also forms nickel carbonyl which facilitates
sintering via atomic migration [6]. Ruthenium is the most active FTS catalyst; however, it is
prohibitively expensive and relatively scarce for use in industrial scales. As a result, iron and
cobalt catalysts are the best two options for commercial FT plants.
The choice of FT catalyst depends on the product distribution desired and the process that
is being used. The three key parameters of a catalyst are catalytic activity, selectivity, and
longevity. Iron generally produces more olefins and oxygenates than cobalt. The active phase in
cobalt FT catalysts is the metallic state while for iron catalysts the active sites are probably iron
carbides [7-9].
The principal stoichiometric reactions in FTS include:
𝐶𝐶𝐶𝐶 + 3𝐻𝐻2 → 𝐶𝐶𝐻𝐻4 + 𝐻𝐻2𝐶𝐶 -247 kJ/mol (1.1)
𝐶𝐶𝐶𝐶 + 2𝐻𝐻2 → −𝐶𝐶𝐻𝐻2 + 𝐻𝐻2𝐶𝐶 -165 kJ/mol (1.2)
𝐶𝐶𝐶𝐶 + 𝐻𝐻2𝐶𝐶 → 𝐻𝐻2 + 𝐶𝐶𝐶𝐶2 -42 kJ/mol (1.3)
Oxygen produced from CO dissociation can generally be removed in two ways: (1)
oxygen removal as water which occurs with a selectivity of about 99% for cobalt catalysts, and
(2) oxygen removal as CO2 which occurs with a selectivity of 30-50% for iron catalysts because
of their high water-gas-shift (WGS; reaction 1.3) activity. Given their low WGS activity and
high selectivities for liquid and waxy hydrocarbons, Co catalysts are highly preferred for GTL.
4

On the other hand, since iron catalysts can produce H2 via the WGS at a selectivity of 30-50%,
they are better suited for CTL and BTL which produce syngas of lower H2/CO ratios.
1.2.1 Iron catalysts: supported vs. unsupported
Typical commercial iron FT catalysts consist of unsupported iron promoted with copper,
potassium, and texturized with silicon oxide. Potassium and copper promoters have found wide
use in the preparation of commercial iron FT catalyst. Potassium is a chemical promoter which
increases the extent of CO dissociation on Fe, surface coverage of C relative to H, and decreases
methane selectivity [10]. Copper serves as a reduction promoter, i.e., it helps the Fe reduce at
lower temperatures, dissociates H2 which spills over to Fe oxide, and thereby improves
reducibility of iron. When both Cu and K are present, the reduction and carbiding processes are
faster [10] resulting in a higher population of carbide nucleation sites than with only one
promoter present [11]. An oxide of silicon or aluminum is typically added to the catalyst at
relatively low concentrations (5-20%) as a textural promoter, i.e., providing higher surface area
and thermal stability to the catalyst. If an oxide of high thermal stability such as Al2O3, SiO2, or
TiO2 is used as the majority compound (> 50 wt%) for supporting Fe, the resulting catalyst is
called a supported Fe catalyst.
Several publications from Bukur et al. [7, 8, 12, 13] describe development of active,
selective and stable precipitated iron catalysts (unsupported) including one containing
3Cu/4K/16SiO2 per 100 parts Fe with a reaction rate or activity in the form of a weight-time
yield of 450 mmol (CO+H2)/gFe/h/MPa at 260 °C and 2.2 MPa. This activity is among the
highest reported for iron catalysts. Unfortunately, despite favorable high activity and selectivity
properties, these unsupported iron catalysts are generally weak mechanically which can lead to
5

high rates of attrition during their use in slurry bubble column reactors (SBCRs). Catalyst
attrition causes formation of 1-10 micron diameter particles that are very difficult to separate
from product wax in SBCRs. The use of binder materials in the catalyst can decrease the attrition
problems somewhat, but may also decrease catalyst activity. Nevertheless, commercial entities
have developed attrition-resistant, unsupported Fe FT SBCR catalysts for 5 m SBCRs through
the generous use of binders [14-16]; however, these catalysts still suffer attrition due to the
higher gas velocities in 10 m SBCRs. Moreover, if sufficient binder is incorporated, the
composition of the “unsupported catalyst” approaches that of a supported catalyst of high metal
loading.
Thus, in principle an alumina-supported iron catalyst is likely to be stronger and more
attrition resistant than an unsupported Fe catalyst incorporating binders [17]. Unfortunately, in
practice previous attempts to develop supported iron FT catalysts have met with limited success
as most of these catalysts were found to have low activity and high methane selectivity [9, 17,
18]. For example, Bukur et al. [12, 18] reported an Fe catalyst supported on SiO2 to be nearly
three times less active than their most active unsupported catalyst (100 vs. 269
mmol(CO+H2)/gcat/-MPa/h) while their alumina-supported catalyst was even less active (~60
mmol(CO+H2)/gcat/-MPa/h). The Davis group [17, 19] found a similar result, i.e., their most
active alumina-supported Fe catalyst was still 5-fold less productive than unsupported iron (0.09
vs. 0.45 gHC/gcat/h) and had high methane selectivity. The poor performance of these catalysts can
be attributed to less than ideal preparation methods and support materials favoring strong Fe
oxide-support interactions and attendant low reducibility to active Fe carbides, decoration of the
active carbide phase by support moieties [18, 20], or some combination of the above.
6

In this dissertation we report, for the first time, the successful preparation of a very active
and stable supported Fe LTFT catalyst, i.e. an Fe/Cu/K catalyst on a silica-doped γ-alumina
(AlSi) support material of high thermal stability but having weak interactions with Fe oxide. Key
factors leading to the excellent performance of this catalyst were (1) the use of non-aqueous, wet
impregnation in a rotary evaporator for catalyst preparation, (2) utilization of a new silica-
stabilized alumina (AlSi) support with very high pore volume and large pores, (3) high
temperature pre-treatment of the AlSi support to give a minimal concentration of surface OH
groups which are known to interact strongly with Fe precursors during impregnation to form Fe
oxide, and (4) stabilization of Fe phases against sintering due to the presence of silica on the
support surface. We also prepared an Fe/Cu/K catalyst on three conventional γ-alumina supports
and an unsupported FeCuKSi for comparison.
1.2.2 Cobalt catalysts: Deactivation modes
Cobalt catalysts are currently the leading candidates for industrial applications of FTS,
especially GTL. The state-of-the-art cobalt FT catalyst consists of four components with the
following formulation:
(1) Cobalt metal as an active phase (typically 15-30 wt%)
(2) A noble metal promoter (Pt, Ru, Re, Pd) (typically 0.05-1.0 wt%)
(3) A high surface area oxidic support (Al2O3, SiO2, TiO2)
(4) A support structural promoter (Zr, Ba, La, Si)
Cobalt catalysts are usually dispersed on an oxide support to maximize efficiency and
stability. Iglesia et al. [21, 22] found a linear correlation between FTS reaction rates and metal
dispersion at larger cobalt crystallites (d >10 nm), suggesting consistent with Johnson et al. [23],
7

that specific activity or turnover frequency (TOF) is constant in well-reduced catalysts
containing moderately-large Co crystallites. Fischer et al. [24] found the turnover frequency
(TOF) to increase with crystallite diameter up to 12 nm. Den Breenjen [25] found the TOF to
increase up to an average Co crystallite diameter of 6 nm, above which it was found to be
constant.
Small cobalt crystallites when supported on oxide supports such as silica, alumina, and
titania are more difficult to reduce due to strong interaction of metal oxide with the support.
Thus, they are often promoted with noble metals, most especially Pt, Re, Ru, or Pd, to improve
the reduction behavior of cobalt oxide crystallites. Typically, metal loadings of Pt and Ru
are0.05-0.1 wt% due to their high costs; moreover, higher loadings of Pt and Pd produce
excessive light gas selectivity; Re and Pd may be used in concentrations up to 1 wt%. Moreover,
it has been shown that Pt and Ru noble metals inhibit polymeric carbon formation by gasifying
carbon atoms or carbon oligomers or by increasing the barriers for C-C coupling [26].
In addition to important factors such as activity, selectivity, and mechanical strength, the
improved stability or longevity of cobalt FT catalysts is crucial to make their use economically
viable. After 80 years of research on FTS, the fundamentals of the process including deactivation
pathways remain subjects of debate. Understanding catalyst deactivation pathways is essential
for improving catalyst stability and effective regeneration procedures. A typical deactivation
profile for Co FT catalysts under industrially relevant conditions is shown in Figure 1.1 [27]. The
activity loss consists of two stages; the first initial deactivation regime can last a few days to
weeks and the second stage is the long-term deactivation regime.
8

Figure 1.1. Typical normalized activity vs. time for CoPt/Al2O3 under realistic FT conditions (230 °C, 20 bar, inlet feed of 50-60 vol.% H2 and 30-40 vol.% CO) [27].
As is apparent, the slope of activity (RIAF) is changing with time suggesting multiple
deactivation mechanisms. The proposed mechanisms of Co FT catalyst deactivation include (1)
poisoning, (2) sintering, (3) oxidation, (4) cobalt aluminate formation, (5) carbon deposition, (6)
bulk cobalt carbide formation, and (7) Co surface reconstruction. These deactivation phenomena
are discussed briefly below.
1.2.2.1 Poisoning
Poisoning is strong chemisorption of species on catalytic sites, thereby blocking the sites
for reaction. Syngas produced from biomass or coal usually contains a large amount of sulfur
and/or nitrogen compounds. Sulfur is a known poison for metals since it adsorbs rapidly and
irreversibly. It can physically block three- or four-fold adsorption/reaction sites [28]. Because of
the strong chemical bond it electronically modifies the adjacent cobalt sites. Co and Fe suffer 3-4
orders of magnitude activity loss above 15-30 ppb of H2S [29]; hence sulfur compounds in the
feed must be reduced to less than 50 ppb. Nitrogen compounds such as NH3 and HCN are also
poisons for FT catalysts. Their effect is less severe than sulfur compounds and their poisoning is
9

somewhat reversible in pure H2 or syngas; however, reducing their level to 50 ppb is
recommended. Sulfur and nitrogen compounds can be removed by ZnO and acidic adsorbent
guard beds, respectively.
1.2.2.2 Sintering
Sintering is agglomeration of metal crystallites which causes loss of catalytic surface
area. It is a thermodynamically driven process, whereby smaller, more unstable crystallites grow
to form larger counterparts with lower surface energy. Temperature is the most important
variable in sintering. Mobility of surface metal atoms is significant above the Tamman
temperature, one- fourth of the bulk melting point. The Tamman temperature for cobalt is 253°C,
not far from low temperature FT conditions [30]. Considering that FTS is highly exothermic
reaction and hot spots may arise during the reaction, the potential for sintering is therefore
relatively high. There is a good agreement in the literature on the importance of sintering as one
of the main deactivation mechanisms during FTS on Co. High temperature and water accelerate
the process. Recently, a water-assisted sintering was proposed by Sadeqzadeh et al. [31, 32].
They postulate that water can partially oxidize surface cobalt metal to form CoO which has a
higher surface diffusivity and hence higher probability of colliding and agglomerating with
another CoO.
Sintering is a crystallite size dependent process. Smaller crystallites grow during the
reaction to form larger counterparts. Sasol reported a 30% drop in activity by sintering of cobalt
crystallites [33]. The starting cobalt crystal diameter was 9 nm and it leveled off at about 14 nm
after 15 days of commercially-relevant FT operation.
10

1.2.2.3 Oxidation
There is still debate whether oxidation occurs during commercial FTS. The debate arises
from the fact that water, the most abundant byproduct of Co FTS, is an oxidizing agent and may
cause surface oxidation of cobalt crystallites. Oxidation is likely to be more important at high CO
conversions where the partial pressure of water is high. However, the recent publications
provide evidence that Co oxidation does not occur at realistic reaction conditions [27, 30, 34,
35]. Thermodynamic calculations have shown that cobalt crystallites larger than 4.4 nm in
diameter cannot oxidize in common FT conditions (PH2O/PH2 < 1.5, corresponding to 75% CO
conversion). That suggests the bulk oxidation of metallic cobalt is not feasible under realistic
FTS conditions using a typical FT catalyst. Saib et al. [34] removed wax-coated cobalt FT
catalyst samples, having an initial average crystallite diameter of about 6 nm, at various time
intervals during reaction in a slurry bubble column reactor, for characterization of the oxidation
states of Co by X-ray absorption near edge spectroscopy (XANES). The catalysts were protected
in wax from oxidation during the characterization. They found that the cobalt crystallite
diameters of above 6 nm are stable to oxidation during realistic FT conditions and that a gradual
increase of cobalt metal crystallite size was observed with time. Thus, based on recent
publications, oxidation of cobalt crystallites with diameters above 4 nm does not occur under
realistic FT reaction conditions.
1.2.2.4 Cobalt aluminate formation
There is also debate on the contribution of cobalt alumina formation as a deactivation
mechanism during FT reaction. Deactivation by cobalt aluminate is often described as the
formation of irreducible species at the expense of active metallic cobalt. CoO is apparently
needed as an intermediate for the formation of cobalt aluminate [5]. This aluminate formation is
11

kinetically hindered at FTS temperatures. However, water which is the main byproduct of FTS
can increase the rate of CoO formation for small crystallites (dc < 4 nm) and consequently effect
cobalt aluminate formation [36].
Although other researchers reported significant deactivation by formation of cobalt
aluminate [37, 38], recent work of Niemantsverdriet’s group showed the effect to be very small
[35, 39]. Their XANES results on wax-coated spent catalysts demonstrated that cobalt oxide is
undergoing more reduction during the reaction and less than 2-3 wt% cobalt aluminate is
produced at the expense of residual CoO present in the catalyst following the reduction. This
observation led them to conclude that cobalt aluminate formation does not significantly
contribute to deactivation during realistic FT conditions.
1.2.2.5 Carbon deposition
CO dissociation is one of the key elementary steps in FTS. The carbon (C or CHx)
formed in this reaction can be converted to FT products via hydrogenation or to stable surface
carbon species over time which adversely affect activity through site poisoning or blockage.
Although long chain hydrocarbons are the desired products in FTS, those of very high molecular
weight can accumulate on the surface blocking sites and/or block small mesopores retarding the
rate of diffusion of the reactants from catalyst particles. Carbon in the form of oligomers or
graphitic layers may (1) strongly chemisorb on Co crystallites or physically adsorb in
multilayers, in either case blocking available active sites for reaction and (2) partially or
completely plug mesopores limiting accessible to reactants or removal of products. Deactivation
by carbon is typically long-term and accounts for the latter stage of activity loss shown in Figure
2.1.
12

Different forms of carbon with different surface reactivity can build up on the surface
during FT reaction. Table 1.2 summarizes various carbon species on cobalt FT catalysts. Atomic
carbon or surface carbides are isolated carbon atoms with carbon-metal bonds resulting from CO
dissociation. Bulk carbide refers to CoxC structure formed by diffusion of carbon into the bulk
metal. Surface carbide can be a precursor to these bulk species or to the formation of oligomers.
CHx species are active precursors for formation by FTS of longer chain hydrocarbon products;
however, these precursors may also form strongly adsorbed high-molecular weight
dehydrogenated hydrocarbons known as coke. It has been proposed that the carbon is mostly
present as CHx during FT reaction which is a hydrogen-enriched environment [40], while others
proposed carbon atoms as most abundant surface species during the FT reaction [30, 41, 42].
Polymeric carbon refers to oligomers of carbon species that are connected with covalent
bond. It may also refer to carbon chains that contain hydrogen. Polymeric carbon is a less
reactive carbon than atomic carbon and can form from polymerization of CHx species. It may
also include aromatic rings with alkyl chains of different length such as graphene or polynulear
aromatics [43].
Graphene, the most stable form of carbon, is a single layer of carbon atoms packed into a
benzene rings structure [5]. It is also considered as a precursor to graphite. The graphene species
has strong C-C bonds and weaker C-metal bonds.
13

Table 1.2. Different carbon species on cobalt FT catalysts with their corresponding hydrogenation temperatures and conditions under which they were identified.
Reaction conditions
Carbon species Catalyst Temp, °C H2/CO Pressure, bar Thyda, °C Ref.
CHx Co (0001) 220 1 1 <100 [44, 45]
Atomic carbon Co/Al2O3 250 CO only 1 180-200 [46]
Bulk carbide Na-Co/Al2O3 240 2 50 <250 [47]
Hydrocarbons Co/Al2O3 220-230 1-3 20 250-330 [48, 49]
Polymeric C Co/Al2O3 220-230 1-3 24 400-500 [48-50]
Graphene Co/SiO2
Co/Al2O3
200
350
2
CO only
1
1
>620
520-550
[51]
[48, 49] a Thyd = Temperature of hydrogenation
These different types of carbon have different reactivities with hydrogen. Therefore, the
most useful characterization technique successfully employed to distinguish and quantify
different surface carbons and/or hydrocarbons is temperature-programmed hydrogenation (TPH)
of deactivated catalysts at elevated temperatures while monitoring methane evolution in a mass
spectrometer. Using TPH of wax-extracted cobalt FT catalysts removed from their slurry bubble
column reactor, Moodley et al. [48] found that polymeric carbon builds up with time on the
catalyst surface, causing the long-term deactivation. Since the focus of the second part of this
thesis is on deactivation of cobalt FT catalysts by carbon, more specific studies and pertinent
data will be provided later in the corresponding chapters.
1.2.2.6 Bulk cobalt carbide
Since the active phase in cobalt FTS is cobalt metal, formation of cobalt carbide causes
activity loss. The activation energy for diffusion of carbon into cobalt (145 kJ/mol) is much
14

higher than iron (44-69 kJ/mol) suggesting that reduced Co catalysts are less likely to form
cobalt carbide.
Industrial experience by Syntroleum [52] and Sasol [4] on Co/Al2O3 showed formation of
bulk cobalt carbide during an upset condition in the presence of pure CO over a short time period
(2-8 h). Catalyst performance was severely lowered as evident by a 50% drop in CO conversion
and a doubling of the methane selectivity. These experiments show that Co carbide is likely to
form when a Co catalyst is exposed accidentally, to a high concentration of CO with little H2
present; moreover, if bulk cobalt carbide forms, it is stable in a syngas environment.
Other researchers showed formation of cobalt carbide during FTS. Jacobs et al. [53]
found formation of Co2C on Co/Al2O3 used in a CSTR (18 bar, 220°C, and H2/CO = 2) with
synchrotron XRD. This is in agreement with the work of Tavasoli et al. [54] who also detected
Co2C peaks in XRD spectra on Ru/Co/Al2O3 catalysts tested at 220°C, 20 bar, and H2/CO = 2 for
over 40 days. Ducreux et al. [55] also observed the formation of Co2C on Co/Al2O3 and
Ru/Co/TiO2 catalysts by in situ XRD and related to the deactivation at 230°C, 3 bar and H2/CO =
9.
On the other hand, XRD and XANES characterizations of spent cobalt catalysts run for
several months in a slurry bubble column reactor did not show any cobalt carbide formation [48].
Cobalt carbide was also not found on Co/Al2O3 in a CO rich environment (H2/CO = 1) at 220 °C
and 20 bar after 260 h time on stream in a CSTR [49].
Accordingly, there is not much consensus from the previous literature whether cobalt
carbide forms during realistic FTS conditions. Bulk carbide is considered a metastable species,
especially in the presence of H2 [30] and is rarely observed with ex situ techniques [56].
15

1.2.2.7 Surface reconstruction
Surface reconstruction a process which results in substantive changes in surface structure
due to adsorption or reaction; the process may involve either an increase or decrease in surface
roughness and/or -surface energy, with the attendant formation of more or less stable surfaces
which can contribute to either higher or lower activity. The detection of these phenomena may
not be done by ex situ techniques and requires sophisticated instrumentation such as in situ STM
or EXAFS coupled with theoretical computations.
Bezemer et al. [57] reported surface reconstruction of cobalt supported on carbon
nanofibers with crystallite diameters ranging over 2.6-27 nm. Performing EXAFS on spent
catalysts revealed a decrease in the first shell Co-Co coordination number after exposure to
synthesis gas, indicating a reconstruction of the cobalt surface during FTS to one of lower
surface energy. Only this deactivation mechanism was detected, i.e., no sintering, oxidation or
carbon deposition was observed. Density functional theory (DFT) calculations were also
conducted on (111) and (100) fcc-cobalt surfaces with following adsorbates: B, N, O, CO, CH2,
CH, and C[58]. Only carbon was predicted to induce reconstruction. These calculations predict
that a coverage of 50% carbon on fcc-Co (111) surface will reconstruct the surface to fcc-
Co(100) followed by a clock type reconstruction. The adsorption energy of carbon was predicted
to be stabilized by 15 kJ/mol compared to unreconstructed surface, thus predicting formation of
stable carbon species which could cause deactivation.
Conversely, it was also reported that reconstruction can result in the formation of the
active sites for FTS. Wilson and de Groot [59] reported restructuring of a model flat Co (0001)
surface to triangular cobalt islands under CO hydrogenation conditions (250°C, 4 bar, H2/CO =
2). It has also been proposed that additional B5 sites, considered to be active sites for CO
16

dissociation, are produced during reconstruction [60]. Thus, reconstruction during FTS can be
accompanied by a change in surface density resulting in the creation of step sites and additional
B5 sites.
1.3 Objectives and overview of dissertation
An original objective of the current work was to investigate the effects of process
conditions on the deactivation by carbon of a supported Fe FT catalyst. To do so, we studied the
preparation of active, stable supported iron catalysts, which, in fact, led to the development of
the most active, stable supported Fe catalyst to date; indeed it was found that for Fe/AlSi catalyst
activity increases over 700 h of time on stream. By the time the supported Fe catalyst had been
developed, an increasing, widespread, global interest in deactivation of cobalt catalysts used in
GTL was highly evident; moreover, our group was in a strong position to contribute
substantially. Thus, with the enthusiastic concurrence of my advisors, I switched my study to
conduct a more focused, comprehensive investigation of deactivation on carbon of a
representative cobalt FT catalyst. This then became my second principal objective along with
development of the supported Fe catalyst. The same concepts learned in preparing the supported
Fe catalyst were exercised in the preparation of the cobalt catalyst, and in fact, the same silica-
doped alumina support, that was the key factor in developing the supported Fe catalyst, was used
for Co.
Given that background, the remainder of the dissertation (7 chapters altogether) consists
of a chapter addressing experimental methods, two chapters addressing development of results
for the supported Fe catalysts, two chapters summarizing results for Co deactivation, and a final
chapter with future work recommendations. A preview of Chapters 2-7 follows:
17

Chapter 2 describes the apparatus and experimental procedures used in the catalyst
preparation and characterization of iron and cobalt catalysts.
Chapter 3 focuses on the optimization of catalyst preparation variables for supported iron
FT catalysts, which includes catalyst characterizations, activity, selectivity, and stability results.
Chapter 4 discusses the effect of support properties and SiO2 stabilizer on the activity and
stability of supported iron FT catalysts. It also reports on the successful preparation of the most
active supported Fe FT catalyst to date and a catalyst that is very stable with no deactivation
during 700 h time on stream.
Chapter 5 focuses on the effect of partial pressures of CO and H2 and temperature on the
deactivation by carbon deposition for the cobalt FT catalyst by different characterization
techniques on the freshly reduced and wax-extracted spent catalysts.
Chapter 6 reports results of the comprehensive study of the kinetics of both the main
reaction and deactivation reaction for the cobalt FT catalyst and describes the development of a
macrokinetic model based on a proposed mechanism for main reaction and general power-law
expressions (GPLE’s) for deactivation.
Chapter 7 identifies possible future works.
18

Chapter 2 Experimental Techniques
This chapter describes the preparation procedures for the catalyst used in this study,
catalyst characterization techniques, a wax-extraction technique used to remove the wax from
spent cobalt catalysts, and activity, selectivity, and stability measurements performed using a
Fixed-bed reactor. Table 2.1 summarizes preparation methods and compositions of the catalysts
prepared in this study, which includes ten supported Fe catalyst, one unsupported Fe, and one
supported Co catalyst.
Table 2.1. Overview of all the catalysts prepared in this study.
Catalyst Solvent Deposition method
Support type
Metal, wt%
Promoter loading Timing of impregnation
FeCuKSi1 -- SDP2 -- 75 Fe 4K/5Cu/16Si/100Fe -- K1 – 20Fe/AlG
NA3 SI4 AlG5 20 Fe 4K/7.5Cu/100Fe Sequential
K2 – 40Fe/AlG
NA SI AlG 40 Fe 4K/7.5Cu/100Fe Sequential
K3 A6 IWI7 AlG 20 Fe 4K/7.5Cu/100Fe Sequential K4 A IWI AlG 20 Fe 8K/7.5Cu/100Fe Sequential K5 A IWI AlG 20 Fe 4K/7.5Cu/100Fe co-impregnation8
K6 A IWI AlG 20 Fe 4K/7.5Cu/100Fe Sequential 20Fe/AlA NA SI AlA9 20 Fe 4K/7.5Cu/100Fe Sequential 20Fe/AlC NA SI AlC10 20 Fe 4K/7.5Cu/100Fe Sequential 20Fe/AlSi NA SI AlSi11 20 Fe 4K/7.5Cu/100Fe Sequential 40Fe/AlSi NA SI AlSi 40 Fe 4K/7.5Cu/100Fe Sequential CoPt/Al2O3 NA SI AlSi 25 Co 0.25 wt% Pt co-impregnation 1 Unsupported Fe catalyst 7 IWI = Incipient wetness impregnation 2 Solvent-deficient precipitation 8 Fe, Cu and K are added at the same time in each impregnation step 3 NA = Non-aqueous 9 Alfa-aesar 4 SI = Slurry impregnation 10 Alumina provided by Cosmas Inc. 5 St. Gobein alumina 11 Silica-doped alumina provided by Cosmas Inc. 6 A = Aqueous
19

2.1 Catalyst preparation
2.1.1 Support
2.1.1.1 Alumina support stabilization with La
γ-Al2O3 supports (Alfa Aesar and St. Gobein aluminas) were stabilized with La to
improve the thermal stability. The alumina support was first dried in air at 100°C for 2 h and
calcined to 400°C for 2 h. A chelating agent of Ethylenediaminetetraacetic acid (EDTA,
Mallinckrodt Chemicals, 99.4%) and the La precursor of lanthanum nitrate (La(NO3)3.6H2O,
Fisher Scientific, > 98% pure) were dissolved and poured onto buffer-submerged alumina and
stirred in a rotary evaporator for 4 h. The buffer was acetic acid/acetate and produced a constant
pH of 5. The solution then was poured off and the impregnated alumina was washed and stirred
in rotary evaporator with HPLC grade water for 1 h. This washing was repeated twice and then
the support was dried under vacuum at 55 °C overnight. Next, the La2O3-Al2O3 was bulk
calcined in air using three temperature ramping steps: (1) ambient temperature to 100°C at 0.5
°C /min, soaked for 1 hour, (2) 100 to 120°C at 1 °C/min, soaked for 16 hours, and (3) ramped to
700°C at 1 °C/min for 8 h.
2.1.1.2 Silica-doped alumina support (AlSi)
A silica-doped alumina support (AlSi) was prepared using a “one-pot” solvent-deficient
method starting with aluminum isopropoxide (AIP, C9H21O3Al, granular, 98+%) and tetraethyl
orthosilicate (TEOS, SiC8H20O4, liquid, 99.9%), both purchased from Alfa-Aeser. Specifically,
water was added to AIP in a 5:1 molar ratio and mixed briefly. TEOS was then added with a
small amount of additional water (1:2 molar ratio) in a quantity sufficient to give 5 wt% silica in
20
the final support material. The resulting mixture was then stirred for 30 minutes in a Bosch
mixer, followed by thermal treatment at 700°C in air for 2 h to form gamma alumina after
heating at ~2.5 °C/min. The product was then cooled to room temperature after which it was
heated to 1100°C over 5 h and held at 1100°C for 2 h [61-63].
2.1.2 Iron catalysts
2.1.2.1 Unsupported iron catalyst
Solvent deficient precipitation (SDP) produces metal oxide nanomaterials [61, 64] which
can be used as supports, oxide catalysts, or catalyst precursors. An unsupported Fe catalyst was
prepared by SDP to compare to the supported Fe catalyst made in this study. A dry mixture of
iron nitrate (Fe(NO3)3.9H2O, Sigma Aldrich, 98%), copper nitrate (Cu(NO3)2.2.5H2O, Sigma
Aldrich, 98%), potassium bicarbonate (KHCO3, Sigma Aldrich, 100 wt% dry basis), and silica
was added to ammonium bicarbonate ((NH4)HCO3, Merk) in a solvent deficient environment
and mixed for half an hour. After precipitation, the resulting material (without washing) was
dried at 120°C overnight and calcined at 300°C for 16 h. The resulting oxide precursors are
denoted throughout as FeCuKSi.
2.1.2.2 Supported iron catalysts
As different techniques were used to optimize the preparation of supported Fe catalysts,
the details of those preparations will be discussed fully in Chapters 3 and 4.
21

2.1.3 Cobalt catalyst
One Co/AlSi catalyst was prepared and used for all the deactivation tests of this study.
The 5% silica contained in AlSi improves its thermal stability, and allowed the support to be
calcined at 1100°C to remove most of the acidic sites. After this step the Co/AlSi catalyst was
then prepared by co-impregnation of the support with a non-aqueous solution (50% iso-propanol
and 50% acetone; both from Fisher Scientific, 99.8%) containing desired amounts of cobalt
nitrate (Cu(NO3)2.6H2O, Sigma Aldrich, 98%) in three steps. In the first two steps 10 wt% Co
was dissolved in a volume of solution corresponding to 2.5 times above incipient wetness and
was then placed in a rotary evaporator and mixed for 12 h to give an uniform Co deposition. The
catalyst was then dried slowly in vacuum at 50°C for 12 h followed by 80°C in air overnight.
After drying, the samples were calcined at 250°C for 16 h in air. For the third step (last step), an
amount of tetraammineplatnium(II) nitrate (Pt(NH3)4(NO3)2, Sigma Aldrich, 99.995%)
calculated to give 0.25 wt% Pt in the final catalyst was dissolved in HPLC water and mixed with
sufficient cobalt nitrate non-aqueous solution to add 5 wt% Co to the final catalyst in a rotary
evaporator for 12 h mixing, followed by additional drying and calcination steps. Nominal
composition (on a relative mass basis) of synthesized catalyst was 25Co/0.25Pt/74.75Al2O3.
2.1.4 Bulk calcination, reduction, and passivation
Temperature programmed oxidation (TPO) and temperature-programmed reduction
(TPR) measurements of representative samples of each catalyst of this study were carried out in
a thermo-gravimetric analyzer (TGA) to determine the temperature program for the calcination
and reduction, respectively, of each catalyst.
22

2.1.4.1 Supported and unsupported iron catalysts
Precursors for all the iron catalysts above were bulk calcined (5–10 g material) at 300°C
in flowing air at a GHSV of > 2000 for about 20 h. Temperature was ramped from ambient to
140-160°C at 0.5 °C/min, soaked for 2 hour, then ramped to 210°C at 0.5 °C/min, soaked for 2
hours, and finally ramped to 300°C at 0.5 °C/min for the final soak at 300°C for 10 h.
Calcined iron catalysts were reduced at 280-320°C in 10% H2/He followed by 100% H2
at a GHSV of > 2000. Temperature was ramped from ambient temperature to 120°C at 0.5
°C/min, soaked for 1 hour, then ramped to 190-210°C at 0.5 °C/min, soaked for 2 hours, and
finally ramped to 280-320°C at 0.5 °C/min for 10 h in 10% H2. Following the 10 hour soak, the
composition was switched to 100% H2 for an additional 6 hour soak at 300°C. The catalyst was
then cooled in He to less than 30°C. The reduced catalyst was carefully passivated by first
exposing it to flowing air in helium (< 1% air) followed by gradually increasing the
concentration of air so that the wall of the metal reactor tube in contact with the bed had less than
3°C temperature increase.
2.1.4.2 Cobalt catalyst
Approximately 80 g of cobalt catalyst was bulk calcined at 250°C in flowing air at a
GHSV of > 2000. Temperature was ramped from ambient temperature to 100°C at 0.5 °C /min,
soaked for 2 hour, then ramped to 130°C at 0.5 °C/min, soaked for 2 hours, and finally ramped to
250°C at 0.5 °C/min for 6 h.
The catalyst was further reduced in hydrogen at 450 °C with a GHSV of > 2000 for 64
hours. It was intentionally reduced at high temperature for a longer time than normal to re-sinter
cobalt crystallites and start with larger cobalt crystallites to prevent deactivation by sintering
23

during the FT reaction. Temperature was ramped from ambient temperature to 135 °C at 1
°C/min, soaked for 2 hour, then ramped to 230°C at 0.5 °C/min, soaked for 2 hours, and finally
ramped to 450°C at 0.5 °C/min for 16 h in 10% H2. Following the 16 hour soak, the composition
was switched to 100% H2 for an additional 32 hour soak at 450°C. Then the catalyst was
passivated as previously described in section 2.1.6.1.
2.1.5 Activation procedure
All catalysts tested in the FB system were activated in syngas (CO and H2) following in
situ reduction in H2.
2.1.5.1 Supported iron catalysts
First, calcined catalysts were reduced in situ at 280-320°C in 10% H2/He for 10 h
followed by 100% H2 for 6 h. After reduction, the furnace temperature was reduced to 180°C in
H2 and reactants were introduced at a composition of 30% H2/30% CO/4% Ar/36% He). The
system was then pressurized to 20 atm and the furnace temperature was increased gradually to ~
260°C according to the temperature schedule shown in Table 2.2 to get to a catalyst bed
temperature of 280°C. During the temperature increase for the activation step, the flow rates
were adjusted to get 50-60% CO conversion at the final temperature. Conversion and
temperature during activation was intentionally higher to speed up the time required to carbide
the catalyst, fill the pores with wax, and achieve steady state activity. Activation was considered
complete only after the ratio of standard deviation to GC peak area was less than 0.02 for
effluent values of H2, CO, and Ar. This usually took 12-24 h. After the activation, the
temperature was reduced to the desired temperature and the flow rates were also adjusted to get
CO conversion of less than 25% to gather kinetic data.
24

Table 2.2. Furnace temperature schedule for catalyst activation of supported iron catalysts.
Temperature, °C Ramp, °C /min Hold, h 180-205 1 1 215 0.2 2 225 0.2 2 235 0.2 4 245 0.2 4 260 0.2 12
2.1.5.2 Cobalt catalyst
Passivated catalysts were first re-reduced in situ at 450°C in 100% H2 for 13 h. After
reduction, the furnace temperature was decreased to 150°C in H2 and the reactants were
introduced at a composition of 50% H2/25% CO/3% Ar/22% He). The system was then
pressurized to 20 atm. The furnace temperature was then increased to 190°C at 0.5 °C/min,
soaked for 4 h, then ramped to 200°C with the same ramp rate for a 14 h soak. Then the
temperature was increased to the desired deactivation temperature at 0.5 °C/min with soaking for
4-6 h for each 5 °C. Different holding times were used to have the total time of 24 h to get to the
desired furnace temperature. During the temperature increase for the activation step, the flow
rates were adjusted to get about 50-60% CO conversion at the final temperature. A rigorous
activation procedure was used to ensure a gradual filling of the pores and to prevent runaway
problems. After getting to steady-state the activation was considered complete. After the
activation, the desired partial pressures were adjusted. The flow rates were also adjusted to give a
CO conversion of less than 25%. Low conversions were used not only to give differential
kinetics but also to favor carbon deposition and lower partial pressures of water.
25

2.2 Catalyst characterization
2.2.1 Nitrogen adsorption/desorption
Surface area (SA), pore volume (Vpore), and pore size distribution (PSD) were calculated
by nitrogen adsorption/desorption isotherms measured using a Micromeritics TriStar 3000
instrument. The samples (0.1-0.3 g) were degassed 120°C for 12 h before measurement.
Passivated spent cobalt catalysts were degassed at 30°C in He to prevent further oxidation. The
average pore diameter and pore size distribution (PSD) of each of the four alumina support
materials were calculated from BET data using a new slab pore model and method proposed by
Huang et al. [65] and modified to fit a log-normal PSD [66].
2.2.2 X-ray diffraction
To estimate crystallite diameters, X-ray diffraction patterns were collected for all the
catalysts using a PANalytical X’Pert Pro diffractometer with a Cu source and a Ge
monochromator tuned to the Cu-Kα1 wavelength (λ = 1.54 A° ). Samples (reduced and
passivated) were scanned from 10 to 90° using a step size of 0.016° and a step time of 350 s.
Diffraction patterns were compared to standard patterns in the database. The average crystallite
thicknesses were calculated from the Scherrer equation using the Fe3O4, Fe, and Fe5C2 peaks
located at 2θ= 37.3°, 44.9°, and 43.1°, respectively and for cobalt metal at 2θ= 44.5°. Reduced
and wax-extracted spent cobalt catalyst samples were carefully passivated by first exposing each
to flowing air in helium (< 1% air) at room temperature followed by gradually increasing
concentrations of air in helium while monitoring the temperature of the catalyst bed.
26

2.2.3 Thermo-gravimetric analysis (TGA) experiments
TPO, TPR, oxygen titration, CO chemisorption, and hydroxyl group measurement were
performed on 10–40 mg samples of various catalysts in a Mettler Toledo TGA/DSC 1 equipped
with an automated GC 200 gas controller. The flow rates of H2, CO/Ar (~11.8% Ar), and air
were set by valved rotameters, but a GC 200 controller and the TGA software (both from Mettler
Toledo) were used to switch the gases automatically during all experiments, and thus run
multiple experiments without the necessity of human hands. All the gases were purchased from
Airgas at a 99.95% purity.
2.2.3.1 Temperature-programmed oxidation (TPO)
TPO experiments were used to determine appropriate temperature ramps and soaks for
controlling byproduct decomposition at low rates. The rate of mass loss was monitored during a
constant temperature ramp of 3 °C/min from ambient temperature to 700°C in 100 mL/min of
70–80% air/He.
2.2.3.2 Temperature-programmed reduction (TPR)
TPR experiments were performed to determine catalyst reduction protocols. 10-20 mg of
calcined samples were exposed to a reducing gas mixture of 10% H2/He (H2-TPR) or 10%
syngas (H2:CO = 1) in He (syngas-TPR), while the temperature was increased at 3 °C/min from
ambient (~25°C) to 700°C. In order to deconvolute the weight loss due to release of strongly
absorbed water, another set of TGA experiments were performed on the calcined catalysts using
the same temperature profile with time, but under pure He flow. The weight loss due to water
desorption was subtracted from the total weight loss of the corresponding TPR.
27

2.2.3.3 Oxygen titration
Oxygen titration experiments were performed in the TGA to determine the extent of
reduction (EOR) to Fe or Co metal following reduction. The calcined catalyst samples (10-20
mg) were reduced in situ under flowing hydrogen for 16 h at the appropriate reduction
temperature. They were then flushed in flowing He at 10°C below the reduction temperature and
during subsequent heating to 400°C. 10% O2 was introduced through the catalyst bed at 400 °C
and the amount of oxygen consumed by the sample was found by the increased weight. The
extent of reduction to Fe metal (or Co) was calculated assuming that iron in metallic state or in
FeO state was oxidized to Fe2O3 (and Co or CoO to Co3O4). Full oxidation of Cu to CuO was
also assumed for iron catalysts and Pt to PtO for Co catalyst.
Equations 2.1 and 2.2 were used in the calculation of dispersion and average Co
crystallite diameter, respectively as follows.
%𝐷𝐷 =1.18𝑋𝑋
𝐸𝐸𝐶𝐶𝐸𝐸 × 𝑊𝑊 2.1
𝑑𝑑 =94
%𝐷𝐷 2.2
where H2-uptake is denoted as X, catalyst weight as W, dispersion as D, and cobalt crystallite
diameter as d.
2.2.3.4 CO-Uptake
Gravimetric carbon monoxide adsorption was used as a relative measurement of CO
chemisorption site density. Iron or cobalt catalysts were reduced in the TGA in 10% H2/He at the
appropriate reduction temperature and then cooled to room temperature for iron catalysts and to
28

100°C for the cobalt catalyst, where the CO chemisorption uptakes were measured in 10%
CO/He.
CO uptakes for iron catalysts were also measured under reaction conditions as the active
phase for iron catalysts is iron carbide. Catalysts were in-situ reduced in the TGA in 10% H2/He
at 280°C and cooled to 180°C. Flow was then switched to synthesis gas (H2/CO/He:
0.05/0.05/0.9 mol) and the sample was heated to 280°C at 1 °C/min and held for 10 h. Following
these steps, the samples were cooled to room temperature, and CO chemisorption uptakes were
measured in 10% CO/He.
2.2.3.5 Hydroxyl group content measurement
Thermogravimetric analysis (TGA) was performed for alumina samples to determine
hydroxyl group content. Pre-calcined alumina samples (St. Gobein (AlG), Alpha-Aesar (AlA),
Cosmas alumina (AlC) at 700°C and silica-doped alumina (AlSi) at 1100°C) were heated at a
rate of 5 °C/min from room temperature to 1100°C in a He flow of 80 ml/min and held for 2 h.
The weight loss between 130 and 1100°C was used to determine the hydroxyl group content.
2.2.4 Temperature-programmed (TP) experiments with mass spectroscopy
Temperature-programmed experiments such as temperature-programmed desorption
(TPD) and temperature-programmed hydrogenation (TPH) were performed on a computer-
automated fixed-bed reactor system shown schematically in Figure 2.1. All gases were purified
before flowing to the reactor system to remove low level impurities such as iron carbonyls,
hydrogen sulfide, oxygen, water, etc. A description of the purification system is found in
Critchfield’s Thesis [67].
29

A quartz reactor with an internal diameter of 5 mm was used for atmospheric pressure
experiments. The middle of the tube was bulb-shaped to minimize pressure drop and temperature
gradients through the catalyst bed. The powdered catalyst was supported on a glass frit with
porosity of 15-40 µm. For high-pressure experiments, ¼ inch stainless steel tube with a ring
slightly smaller than the inner diameter of the tube to support a stainless steel mesh, quartz wool,
and catalyst was used. Gas flow to the reactor was controlled by a set of mass flow controllers
(Brooks 5890E). The mass flow controllers were interfaced with the computer via National
Instruments FieldPoint analog input and output modules (-10 to +10 V) while interfacing of the
thermocouple (used to measure reactor temperature) with the computer was accomplished with a
thermocouple FieldPoint module. Reactor bed temperature was measured by thermocouples in
contact with the bed. After leaving the reactor, the exit gas and liquid effluent passed through a
hot trap (90-110°C) and a cold trap (0°C) to collect heavy hydrocarbon and liquid products
formed in the high pressure FT reaction. A three-way valve was used after the reactor to send the
effluent to the traps or directly to the mass spectrometer bypassing the traps). The latter was used
for the cases when there was no liquid or wax production, such as atmospheric FT reaction.
Gases leaving the cold traps flowed through spring-loaded back pressure regulators (Swagelok
Co., KBP1J0G4A5A20000, typically set to 300 psig) to control the reactor pressure.
30
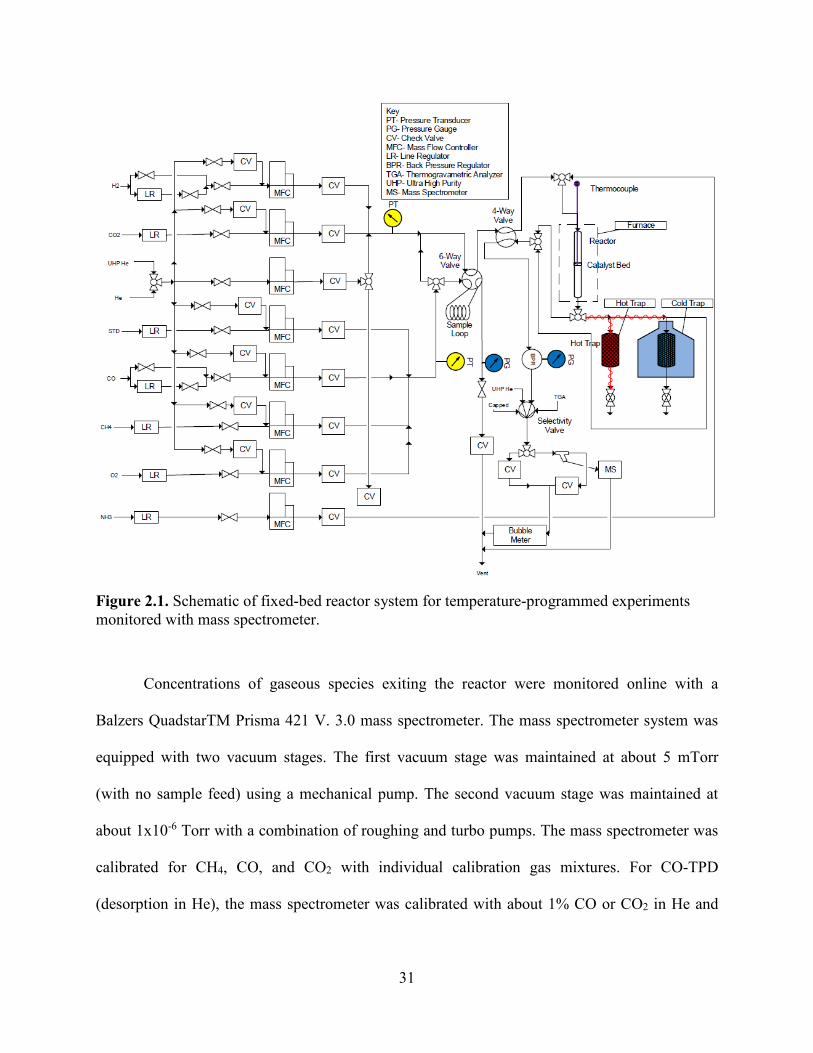
Figure 2.1. Schematic of fixed-bed reactor system for temperature-programmed experiments monitored with mass spectrometer.
Concentrations of gaseous species exiting the reactor were monitored online with a
Balzers QuadstarTM Prisma 421 V. 3.0 mass spectrometer. The mass spectrometer system was
equipped with two vacuum stages. The first vacuum stage was maintained at about 5 mTorr
(with no sample feed) using a mechanical pump. The second vacuum stage was maintained at
about 1x10⁻⁶ Torr with a combination of roughing and turbo pumps. The mass spectrometer was
calibrated for CH4, CO, and CO2 with individual calibration gas mixtures. For CO-TPD
(desorption in He), the mass spectrometer was calibrated with about 1% CO or CO2 in He and
31

for TPH (desorption in H2) the calibration gas was about 1% or 10% CH4 in H2 for atmospheric
FTS reaction and high pressure reaction, respectively.
2.2.4.1 Temperature-programmed desorption of CO (CO-TPD)
About 150 mg of calcined cobalt catalyst was loaded into the reactor. The sample was
reduced in situ by flowing 25 ml/min H2 and 25 ml/min He at 450°C for 6 h. Following
reduction, the sample was cooled to 430°C and purged with He for about 1 h. After purging, the
sample was cooled to adsorption temperature. The gas switched to 10% CO in He (total flow of
30 ml/min) at 25, 50, 100, and 150°C for 1 h and purged again in He to ambient temperature.
Then, CO was desorbed in 10 ml/min He at a heating rate of 20 °C/min. CO (m/z of 28), CO2
(m/z of 44 and 28) was monitored and recorded during desorption. The observed signals were
subsequently converted to concentrations and mole fractions of CO and CO2 with the
corresponding calibration.
Also CO-TPD experiments were done for supported iron catalysts (Chapter 3) with the
same procedure described for cobalt except 0.35 g of catalyst was reduced in situ with flowing
50 vol% H2/He at 280°C, then purged in He at 260°C. The CO adsorption temperature was
150°C.
2.2.4.2 Temperature-programmed desorption of NH3 (NH3 -TPD)
Ammonia-TPD experiments were performed on silica-doped alumina support to
determine total acid sites. A sample of 100 mg was degassed in-situ at 550°C for 1 h under
helium flow of 30 sccm. The sample was cooled to adsorption temperature of 100°C. After 1 h of
NH3 adsorption, it was switched to He to remove any physisorbed ammonia. The sample was
32

then heated in 10 sccm He flow with a ramp rate of 5 °C/min to 500°C. The effluent gas
concentrations were determined using a Pfeiffer Vacuum ThermoStar mass spectrometer and
were quantified to give number of acid sites.
2.2.4.3 Temperature-programmed hydrogenation (TPH)
TPH experiments were performed to identify different carbon species on the cobalt
catalyst. About 25 mg of wax-extracted spent cobalt catalyst was loaded into the TP reactor.
Following adsorption of carbon containing species onto the catalysts at given partial pressures
and temperature, the catalyst was hydrogenated in 100% H2 (10 ml/min) while ramping from
room temperature to 900°C at 5 °C/min. CH4 with m/z of 15 and 16 (instead of just 16 to avoid
interference from ionized oxygen from water vapor) was monitored with mass spectrometry.
Formation of heavier hydrocarbons, m/z of 25 and 43 were also measured.
2.2.5 Nuclear magnetic resonance (NMR)
NMR spectra were obtained on a Bruker Avance I 400 (9.6 T) NMR instrument using a 7
mm (29Si) or a 4 mm (27Al) broadband MAS Probe. All spectra were obtained at room
temperature, and a spinning speed of 12.5 kHz for 27Al and 4 kHz for 29Si. The 1D 29Si MAS
NMR spectra were obtained using a single pulse Block decay using a 240 s recycle delay, while
the 1H-29Si CPMAS spectra was obtained using a 5 ms contact time. The 27Al MAS spectra were
obtained using a single pulse Bloch decay. The 27Al chemical shift was referenced to 1M
Al(H2O)6+ in water δ = 0.0 ppm, and the 29Si referenced to Q8M8 δ = +12.6 ppm with respect to
TMS (δ = 0 ppm). Spectral simulations were performed using DMFIT [68]. NMR experiments
were done at Sandia National Laboratories in Albuquerque.
33

2.2.6 X-ray photoelectron spectroscopy (XPS)
The XPS measurements for cobalt catalysts were carried out on a Kratos AXIS Ultra,
equipped with a monochromatic Al Kα X-ray source and a delay-line detector (DLD). The
powder samples were dispersed on conducting carbon-tape in the glovebox and the samples were
transferred in an inert environment to the measurement chamber. Spectra were obtained using the
aluminium anode (Al Kα = 1486.6 eV) operating at 150 W. For the survey scans, a constant pass
energy of 160 eV was used and for the region scans, the constant pass energy was 40 eV.
Quantification and fitting of the obtained spectra was done use the CasaXPS software and all
binding energies were references to the binding energy of the Al 2p peak for the alumina support
at 74.4 eV. These experiments were carried out at Eindhoven University of Technology in
Niemantsverdriet’s group.
2.2.7 XANES/EXAFS
The electronic structure and local atomic structure of calcined, reduced, and spent cobalt
catalysts were investigated by XAS near the Co K-edge in transmission mode at the Soft X-ray
Microcharacterization Beamline (SXRMB) at the Canadian Light Source, Inc. The spectra (in
energy space) were background subtracted and normalized with a Victoreen function and further
normalized using a two-polynomial method with degree 1 for the pre-edge and post-edge
regions. Changes in the oxidation state of cobalt was analyzed by comparing the XANES region
of the spectra using the WinXAS [69] software. EXAFS spectra were also treated using the
WinXAS software. After background removal and normalization (previously described), the
spectra were converted to k-space and background subtracted in k-space using a cubic spline fit.
The data for the calcined catalyst, freshly reduced catalyst, and cobalt metal foil were first
analyzed qualitatively over a wider k-range of 2.5 – 10 Å-1. However, it was of primary
34

importance to compare the used FTS catalyst to the freshly reduced one. In that case, the used
catalyst spectra were of lower quality. To improve the signal to noise ratio, 4 scans were
averaged together. The data were smoothed (Fourier smoothing level of 8) and the useful k-range
was shorter (3.5 – 9 Å-1). For the purpose of comparison, the calcined catalyst, freshly reduced
catalyst, and cobalt foil were subjected to the same procedures over the shortened k-range.
Co K-edge experimental data (k2∙χ(k)) over the shortened k-range were fitted with
theoretically generated spectra derived from structural models, assuming the presence of Co
metal. With the use of the ATOMS software [70], structural information for FCC Co was
transformed into spatial coordinates, which were then employed by the FEFF software [71] to
calculate the scattering paths. The scattering paths were thus used as inputs for the FEFFIT
software [72] to generate theoretical χ(k), which were compared to their experimental
counterparts. Because of the shortened k-range, it was not possible to obtain a physically
meaningful fitting of the data with a complex model consisting of both Co-Co coordination from
Co metal and Co-O from CoO. Thus, to deemphasize the contribution from CoO and emphasize
the contribution from Co-Co in the metal, a k-weighting of 2 was employed. Structural fitting
parameters used in the model included: a global lattice expansion coefficients, a global ∆e0, a
global Debye-Waller factor, and local coordination numbers, Ni. The range for the fitting was 1.5
– 2.9 Å. These experiments were carried out at Canadian Light Source Inc. by Dr. Gary Jacobs
from University of Kentucky Center for Applied Energy Research (CAER).
35

2.3 Activity, selectivity, and stability measurements
2.3.1 Fixed-bed reactor description
The catalyst activity, selectivity, and stability as a function of temperature, PH2, PCO, and
time were measured under differential conditions (low conversion) in a fixed-bed reactor system
containing two reactor beds in parallel. A flow diagram of the reactor system is shown in Figure
2.2. He, CO/Ar (containing 12% Ar which was included as a tracer), and H2 were purified by
flowing through absorbents described by Critchfield [67] to remove low level impurities such as
iron carbonyls, hydrogen sulfide, oxygen, water, etc. Each reactor inlet flow system uses three
mass flow controllers (Brooks 5850E) for the reactants (He, CO, and H2) and one mass flow
controller (Brooks 5850E) to control the total feed gas composition. The feed gas to each reactor
is split two ways with one part going to a bypass line controlled by a dome-loaded back pressure
regulator (Grove Valve and Regulator Co. S-91XW typically set to 340 psig) and one line with
mass flow controller that fed the corresponding downflow reactor. After leaving the reactor, the
exit gas and liquid effluent passed through a hot trap (90-110°C) and a cold trap (0°C) to collect
heavy hydrocarbons and liquid products. Gases leaving the cold traps flow through spring-loaded
back pressure regulators (one for each reactor, GO Regulator Co., BP8L-1D11IU118, typically
set to 300 psig) to control the reactor pressure. The effluent gaseous product is analyzed using an
HP5890 gas chromatograph equipped with a thermal conductivity detector (TCD) and 60/80
carboxene-1000 column. Both reactors are encased in the same three zone tube furnace. Furnace
temperatures are controlled by three Omega controllers. Reactor bed temperatures are measured
by thermocouples in contact with the catalyst beds.
36

Figure 2.2. Process flow diagram of dual channel fixed bed reactor system.
2.3.2 Catalyst loading
The reactor tubes were fitted with a ring slightly smaller than their inner diameter to hold
a metal mesh support. Two stainless steel screens, coarse (100 mesh) and fine (400 mesh) were
placed on top of the ring to provide support for the catalyst bed. Enough quartz wool was placed
over the mesh to prevent catalyst loss. Each sample was diluted with quartz sand or silicon
carbide at a ratio of 10 to 1 (diluent/catalyst) to improve isothermality in the catalytic zone.
Quartz wool was also placed on top of the catalyst bed. After reaction spent cobalt catalyst
samples were retained to study the effect of different operating conditions on the deactivation
behavior and mechanism of Co catalyst.
37

2.3.3 Wax extraction of spent cobalt catalysts
During the low temperature FTS process with a cobalt catalyst, molten product
hydrocarbon wax acts as the liquid phase in the reactor. After the FTS reaction the furnace
temperature was cooled to room temperature which allowed this protective wax layer to congeal.
This wax layer can interfere with several characterization measurements; therefore, an extraction
procedure was developed to remove it. This approach is a modified version of Soxhlet extraction
allowed the wax extraction in an inert environment, vacuum drying, and passivating the catalyst
for further ex situ characterizations in the same set up. The procedures used for wax extraction
ensured that an argon or vacuum atmosphere protected the air sensitive catalyst at all times.
The Soxhlet extraction set-up consisted of 3 sections: a 300 ml Schlenk flask, a ‘filter’
unit with an internal glass frit (porosity = 15 μm) and 30 ml volume and a water-cooled
condenser. A check valve was used on top of the condenser to eliminate the diffusion of air from
the condenser to the system. The schematic of this system is shown in Figure 2.3. The entire
system was evacuated and flushed with helium repeatedly.
Tetrahydrofuran (THF, CH2(CH2)2CH2O, Mallinckrodt Chemicals, stabilized THF) was
used as a solvent to extract the wax. During the extraction process the solvent was heated by an
oil bath and boiling THF vapour and 10 ml/min He were allowed to pass through the frit which
holds the wax protected cobalt catalyst. The vapor condensed and formed a liquid layer on top of
the frit (surrounding the catalyst sample). Helium was used to ensure an oxygen-free system.
After the glassware was ¾ full of THF, the THF was removed from oil bath and allowed to cool.
Cooling allowed the THF to fall through the glass frit, leaving the wax-free catalyst behind. The
glassware containing the catalyst was closed while the THF was removed and replaced with
fresh THF. A vacuum was then pulled on the system to remove the air introduced to the flask
38

containing THF before opening the valve of glassware containing the catalyst. This procedure
was done 8-12 times before drying the catalyst in vacuum overnight. These 8-12 cycles were
needed to make sure the catalyst particles were sufficiently wax-free. After drying, the catalyst
was passivated in air and helium starting with 1% O2 and slowly increasing the oxygen content
for 24 h, preparing the catalyst for ex situ measurements. The advantage of this method
compared to traditional Soxhlet extraction is that clean THF is continuously recycled to the
sample and also the wax-extraction, drying, and passivation can be carried out in the same
container without the need of transferal in a glove-box.
Figure 2.3. Process flow diagram of wax extraction system using modified Soxhlet extraction.
39

2.3.3.1 Extent of wax extraction
Samples of freshly reduced catalyst were tested and compared before and after intentional
exposure to wax and wax extraction to establish a reference against the other FB wax-extracted
spent catalysts (e.g. amount of wax, TPH peaks for wax) and to understand the extent of wax-
extraction. To prepare the “waxed” catalyst, 0.2 g freshly reduced catalyst was added to 0.2 g
melted FTS wax over a hot plate, mixed, and then wax-extracted. To determine the effect of wax
extraction, H2-TPR was performed on the freshly reduced catalyst before and after waxing and
wax-extraction, comparing the weight loss (Figure 2.4). As shown in Table 2.2 wax extraction
removed 91.3% of the wax. Furthermore, freshly reduced wax-extracted sample was evaluated
by BET, XPS, CO-uptake, and EOR and compared with freshly reduced catalyst without wax. It
was found that wax-extraction does not change the properties of the catalyst as will be discussed
fully in Chapter 5.
Figure 2.4. H2-TPR weight loss of a freshly reduced waxed catalyst before and after wax-extraction
40

Table 2.3. Relative masses of catalyst and wax after H2-TPR for waxed and wax-extracted catalysts.
ID Mass of catalyst Mass of wax Wax/Catalyst Extracted 93.5 6.5 0.07 Waxed 55.4 44.6 0.805
2.3.4 Rate and Selectivity Calculations
Gas compositions were found from GC chromatograms from which values for the rate of
reaction and selectivity were calculated according to the following relationships.
Equation 2.2 is the reactor performance equation assuming differential reactor conditions.
This assumption was checked for CO conversion of 72% and it was found that the error for CO
rate constant is 0.6% (Appendix B).
𝑊𝑊𝐹𝐹𝐶𝐶𝐶𝐶0
=𝑋𝑋𝐶𝐶𝐶𝐶−𝑟𝑟𝐶𝐶𝐶𝐶
(2.2)
where W is the weight of catalyst, 𝐹𝐹𝐶𝐶𝐶𝐶0 is the inlet CO molar flow rate, 𝑋𝑋𝐶𝐶𝐶𝐶 is the CO conversion,
and −𝑟𝑟𝐶𝐶𝐶𝐶 is the rate of CO consumption. Calculation of rate depends only on the determination
of CO conversion as W and 𝐹𝐹𝐶𝐶𝐶𝐶0 are known or measured directly.
Ar was premixed with CO as an internal inert tracer to allow an exact measurement of
CO conversion (XCO) by using GC peak area (PA) and GC molar response factors (RF) as
follows:
nn0
=𝑦𝑦𝐴𝐴𝐴𝐴0
𝑦𝑦𝐴𝐴𝐴𝐴 (2.3)
41

𝑋𝑋𝐶𝐶𝐶𝐶 = 1 −𝑛𝑛𝐶𝐶𝐶𝐶𝑛𝑛𝐶𝐶𝐶𝐶
0 = 1 −𝑦𝑦𝐶𝐶𝐶𝐶 × 𝑛𝑛𝑦𝑦𝐶𝐶𝐶𝐶0 × 𝑛𝑛0
= 1 −𝑦𝑦𝐶𝐶𝐶𝐶 × 𝑛𝑛0 ×
𝑦𝑦𝐴𝐴𝐴𝐴0𝑦𝑦𝐴𝐴𝐴𝐴
𝑦𝑦𝐶𝐶𝐶𝐶0 × 𝑛𝑛0= 1 −
𝑦𝑦𝐶𝐶𝐶𝐶 𝑦𝑦𝐴𝐴𝐴𝐴�𝑦𝑦𝐶𝐶𝐶𝐶0
𝑦𝑦𝐴𝐴𝐴𝐴0�
= 1 −PACO×RFCO
PAAr×RFAr�
PACO0 ×RFCO
PAAr0 ×RFAr
�= 1 −
PACOPAAr�
PACO0
PAAr0�
(2.4)
where 𝑛𝑛𝐶𝐶𝐶𝐶 is outlet molar flowrate of CO and 𝑛𝑛𝐶𝐶𝐶𝐶0 is inlet molar flowrate of CO. Since the inlet
and outlet flowrates of Ar are equal (𝑛𝑛𝐴𝐴𝐴𝐴 = 𝑛𝑛𝐴𝐴𝐴𝐴0 ; 𝑦𝑦𝐴𝐴𝐴𝐴 = 𝑦𝑦𝐴𝐴𝐴𝐴0 ), the calculation of CO conversion is
independent of GC calibration due to the use of the inert tracer.
In contrast, calculation of selectivity (S) is dependent on the response factors of each
species since they appear in Equation 2.5.
𝑆𝑆𝐴𝐴 =𝑛𝑛𝐴𝐴
𝑛𝑛𝐶𝐶𝐶𝐶0 − 𝑛𝑛𝐶𝐶𝐶𝐶
=𝑦𝑦𝐴𝐴 × 𝑛𝑛
𝑛𝑛𝐶𝐶𝐶𝐶0 × 𝑋𝑋𝐶𝐶𝐶𝐶
=𝑦𝑦𝐴𝐴 × 𝑛𝑛0 ×
𝑦𝑦𝐴𝐴𝐴𝐴0𝑦𝑦𝐴𝐴𝐴𝐴
𝑋𝑋𝐶𝐶𝐶𝐶 × 𝑦𝑦𝐶𝐶𝐶𝐶0 × 𝑛𝑛0 =
𝑃𝑃𝐴𝐴𝐴𝐴 × 𝐸𝐸𝐹𝐹𝐴𝐴𝑃𝑃𝐴𝐴𝑟𝑟�
�𝑃𝑃𝐴𝐴𝐶𝐶𝐶𝐶0 × 𝐸𝐸𝐹𝐹𝐶𝐶𝐶𝐶
𝑃𝑃𝐴𝐴𝑟𝑟0� � × 𝑋𝑋𝐶𝐶𝐶𝐶 (2.5)
42

Chapter 3 Supported Iron: Effect of Preparation Variables
This chapter focuses on the optimization of catalyst preparation variables for supported
iron FT catalysts, which includes catalyst characterizations, activity, selectivity, and stability
results.
3.1 Introduction
Cobalt (Co) catalysts have been the subject of far more Fischer-Tropsch Synthesis (FTS)
research than iron (Fe) catalysts due to their longevity and favorable reaction rates. However,
commercial Fe has advantages over Co including lower cost, lower methane selectivity, and high
water-gas shift activity. Commercial Fe catalysts produced for FTS are unsupported. Therefore,
very little work on supported Fe catalysts is reported in the literature [9, 17, 18].
Since the 1950’s, the South African company Sasol has been one of the few in industry to
prefer Fe catalysts [73]. Sasol has worked mostly with Fe/Cu/K/SiO2 as an unsupported Fe
catalyst. Bukur et al. [12] reported a weight-time yield of 450 mmol (CO+H2)/gFe/h/MPa and a
C2+ hydrocarbon productivity of 0.86 gHC/gFe/h for 100Fe/3Cu/4K/16SiO2 at 260°C and 2.2 MPa.
Despite their high activity and favorable selectivity, unsupported Fe catalysts are generally too
weak mechanically to be used in slurry bubble column reactors (SBCR’s), which are the most
thermally efficient and economical reactors [9]. Unfortunately, the severe conditions inside
SBCR’s grind weaker catalysts into fine powders, resulting in excessive catalyst loss and
43

plugging in the catalyst recovery system. These fine powders also render catalyst separation from
the product nearly impossible. The US Department of Energy (DOE) performed a demonstration
with a precipitated catalyst in a SBCR and found that attrition of the catalyst quickly plugged the
filtering system, which required the reactor to be shut down within 24 h of startup [9]. O’Brien et
al. [17] also concluded that supported Fe catalysts are far more attrition resistant than
unsupported catalysts. They reported that unsupported precipitated catalysts, even with spray
drying prior to calcination, were abraded from an initial particle size distribution of 30–50 µm
down to 1–3 µm in just 24 h.
Among supported FT catalysts, the prevalent reasons for preferring Co catalysts over Fe
are the inferior rates and selectivities of supported Fe catalysts [74]. Strong metal-support
interaction is thought to cause lower activity by reducing the extent of reduction and
carburization of the iron [15, 75]. Studies led by Sasol have shown supported Fe catalysts have
poor reaction rates and selectivities, compared to unsupported Fe catalysts, due to promoters
forming chemical bonds with the support [76]. Therefore, success of supported Fe catalysts may
depend on discovery of a preparation technique that weakens these chemical bonds. Since
supported iron catalysts have not been extensively studied, the possibility exists that additional
research could allow preparation of supported catalysts with improved activity and selectivity
properties in addition to good attrition resistance.
A few published studies on supported Fe are available. They have concluded that aqueous
impregnation yields strong interactions between iron and potassium oxides and the support,
leading to low reducibility of iron or poor iron-promoter contact [18, 20]. Xu and Bartholomew
[9] attributed low reducibility of supported catalysts to ineffective preparation methods. In their
study, they prepared a silica-supported catalyst (10%Fe/1%Pt/0.2%K/SiO2) using a non-aqueous
44

evaporative impregnation method. They even removed the water molecules of hydration by
bubbling He through the nitrate salt at 80°C. The group also prepared a catalyst without K and
another without K or Pt. The three resulting catalysts had high extent of reduction (60–80%) at
300 °C in H2, moderately high dispersion (5–16%), and moderate FTS activity, although the
methane selectivity was still high (6–10%).
Although both aqueous and non-aqueous supported Fe catalysts have been prepared, no
studies were identified that directly compared aqueous and non-aqueous preparation methods.
Other researchers have explored promotion of supported Fe catalysts. The two promoters
which have been used in preparation of commercial unsupported Fe FT catalyst are potassium
(K) and copper (Cu). Because CO and H2 can both be reducing agents, redox properties of the
catalyst during FTS are crucial. The addition of K on Fe-based catalysts affects the catalytic
activity for both Fischer-Tropsch Synthesis and the concurrent water-gas shift reaction [77, 78].
The K also affects methane, olefin, and higher hydrocarbon selectivity [78]. Davis [77]
investigated the effect of K at different conversions. They found that at low conversions, the
lowest potassium loading exhibited the highest activity and at high conversions the activity was
slightly enhanced by K addition in the range of K loading in their study (K loading: 0.36-2.2
atomic%). Much higher CO conversions were obtained on 0.02 K/Fe atomic ratio catalysts than
K-free catalysts [10]. A K content of 0.04 K/Fe atomic ratio did not exhibit an increase in FTS
activity. Thus, the level of promoter loading appears to make a critical difference.
Success of a preparation method also depends on the timing and relative order in which
these promoters are impregnated onto the support. Bukur et al. [18] studied supported Fe
catalysts on alumina (Al2O3) and silica (SiO2) which were prepared by co-impregnation of ferric
45

nitrate, copper nitrate, and potassium bicarbonate in successive steps to desired levels. They
compared the performance of these two catalysts to the performance of two unsupported,
precipitated catalysts prepared similarly. Bukur et al. estimated the extent of reduction from
Fe2O3 to metallic Fe as 19–26% at 400°C for both their alumina-supported and silica-supported
Fe/Cu/K catalysts. Their silica-supported catalyst, however, was only one third as active as their
most active precipitated Fe/Cu/K/SiO2 catalyst when compared per gram catalyst (100 vs. 269
mmol(CO+H2)/gcat/MPa/h at 260°C) and their alumina-supported catalyst was only one fifth as
active (i.e., about half as active as the silica-supported catalyst). The methane selectivity of the
alumina-supported catalyst was comparable to the unsupported catalysts (3–4 mol%, carbon
atom basis), while the methane selectivity of the silica-supported catalyst was higher (6–7 mol%,
carbon atom basis).
O’Brien et al. [17] used a different impregnation method for preparing supported Fe
catalysts. Ferric nitrate, copper nitrate, and potassium nitrate were melted at 70°C and slowly
added to silica, alumina, magnesium silicate, or magnesium aluminate supports. The
performance of these supported catalysts was compared with an Fe/Cu/K/SiO2 precipitated
catalyst. The best supported catalyst produced in the study was only one-fifth as productive (on a
per gram catalyst basis) as the unsupported catalyst and again displayed higher selectivity to
methane. O’Brien et al. did not report extent of reduction and dispersion for their catalysts.
Supported catalysts are one of the viable catalysts for use in SBCR’s. Although many
preparation techniques have been used, the reported data lack enough consistency to isolate the
effect of specific preparation variables. Determining a single preparation method’s influence on
the properties of a catalyst requires greater consistency. This study has examined four important
variables in the preparation of supported Fe catalysts and held all other variables constant to
46

systematically investigate each variable’s effect. The goal was to gain deeper insights into these
preparation methods as a step toward designing a preparation method capable of producing
catalysts with both attrition resistance adequate for use in SBCR’s and high activity
characteristic of precipitated catalysts. A series of K-promoted Fe catalysts supported on alumina
(Al2O3) were prepared to examine the effect of the following variables: (1) impregnation method
(aqueous incipient wetness or non-aqueous slurry), (2) Fe loading level, (3) K loading level, and
(4) timing of impregnation (sequential impregnation or co-impregnation of K and Fe, and with or
without direct K promotion of the support).
3.2 Experimental
3.2.1 Catalyst preparation
3.2.1.1 General preparation description
The six catalysts examined in this paper (all Fe/Cu/K/Al2O3) are identified as K1–K6.
The timing and specific procedure for loading these metals was distinct for each of these six
catalysts. These six combinations of procedures were carefully chosen to yield the most
information and data about the effects of each preparation variable. Table 3.1 catalogs the values
of each of the 4 preparation variables for the six catalysts.
47
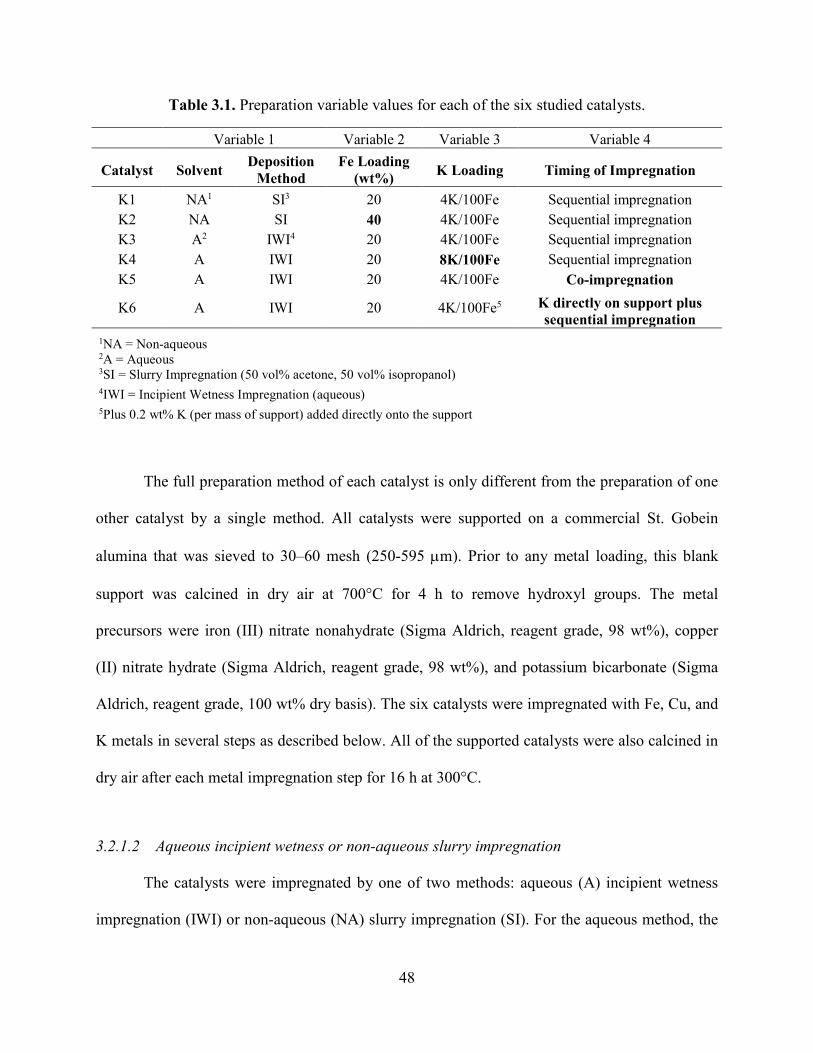
Table 3.1. Preparation variable values for each of the six studied catalysts.
Variable 1 Variable 2 Variable 3 Variable 4
Catalyst Solvent Deposition Method
Fe Loading (wt%) K Loading Timing of Impregnation
K1 NA1 SI3 20 4K/100Fe Sequential impregnation K2 NA SI 40 4K/100Fe Sequential impregnation K3 A2 IWI4 20 4K/100Fe Sequential impregnation K4 A IWI 20 8K/100Fe Sequential impregnation K5 A IWI 20 4K/100Fe Co-impregnation
K6 A IWI 20 4K/100Fe5 K directly on support plus sequential impregnation
1NA = Non-aqueous 2A = Aqueous 3SI = Slurry Impregnation (50 vol% acetone, 50 vol% isopropanol) 4IWI = Incipient Wetness Impregnation (aqueous) 5Plus 0.2 wt% K (per mass of support) added directly onto the support
The full preparation method of each catalyst is only different from the preparation of one
other catalyst by a single method. All catalysts were supported on a commercial St. Gobein
alumina that was sieved to 30–60 mesh (250-595 µm). Prior to any metal loading, this blank
support was calcined in dry air at 700°C for 4 h to remove hydroxyl groups. The metal
precursors were iron (III) nitrate nonahydrate (Sigma Aldrich, reagent grade, 98 wt%), copper
(II) nitrate hydrate (Sigma Aldrich, reagent grade, 98 wt%), and potassium bicarbonate (Sigma
Aldrich, reagent grade, 100 wt% dry basis). The six catalysts were impregnated with Fe, Cu, and
K metals in several steps as described below. All of the supported catalysts were also calcined in
dry air after each metal impregnation step for 16 h at 300°C.
3.2.1.2 Aqueous incipient wetness or non-aqueous slurry impregnation
The catalysts were impregnated by one of two methods: aqueous (A) incipient wetness
impregnation (IWI) or non-aqueous (NA) slurry impregnation (SI). For the aqueous method, the
48

support was impregnated with enough aqueous solution containing the desired amount of iron
nitrate and copper nitrate to just fill the pores (10 wt% Fe per loading step). The water was then
slowly evaporated over 12 h at 80 °C to leave only the precursors and the support.
For the non-aqueous impregnation method, an equivolume mixture of acetone and
isopropanol was chosen as the solvent. Once the appropriate amount of precursor was added, the
solution was mixed for 12 h at atmospheric pressure in a Yamato RE800 rotary evaporator
turning at 30 rpm. Next, the solvent was evaporated over 12 h at a pressure of 70 mm Hg
absolute, while still rotating at 30 rpm.
3.2.1.3 Iron loading level
Most preparation methods included 20 wt% Fe, but one catalyst (K2) was loaded to 40
wt% Fe. Fe and Cu salts were always added simultaneously in 10 wt% Fe steps at the same
relative Cu atomic ratio (7.5 Cu/100 Fe). Therefore, Fe and Cu were loaded onto K2 in four
separate steps, while all other catalysts had two Fe and Cu loading steps. Each loading step was
always followed by calcination.
3.2.1.4 Potassium loading level
Except for catalyst K5, K was added in steps separate from the Fe and Cu addition. For
most of the catalysts, K was added in the atomic proportion of 4 K/100 Fe. For K4, the
potassium loading was doubled to 8 K/100 Fe. K6 also included additional K promoter loaded
directly on the alumina support, which will be described in detail in section 2.1.5.
49

3.2.1.5 Timing of impregnation
All catalysts, except K5, were prepared by first loading all Fe and Cu together, 10 wt%
Fe at a time, and then loading all K in a separate last step. Loading K in a separate step this way
is called “sequential impregnation.” For K5, all of the salts, including K, were added
simultaneously in each step, which is called “co-impregnation.” Co-impregnation was only
examined for aqueous incipient wetness impregnation because the potassium bicarbonate is not
soluble in the non-aqueous solvent.
For the final catalyst, K6, 0.2 wt% potassium (per g support) was added directly onto the
support by aqueous incipient wetness impregnation prior to any impregnation of Cu or Fe.
3.2.2 Catalyst characterization
Several characterization techniques were used in this study including: BET, XRD, H2-
TPR, syngas-TPR, EOR, CO-TPD. These techniques were fully explained in Chapter 2 and our
published paper [79].
3.2.3 Activity and selectivity measurements
The details of activity and selectivity measurements were described in Chapter 2 and are
summarized here.
Fischer-Tropsch synthesis (FTS) was conducted in a fixed-bed reactor (stainless steel, 3/8
inch OD) described previously [80]. Each sample (0.25 g, 250–590 µm) was diluted with 1 g
quartz sand or silicon carbide to approach isothermal conditions in the catalytic zone.
Before FTS, the samples were reduced in situ at 280–320°C in 10 mol% H2 in He for 10
h, followed by pure H2 for 6 h. After cooling to 180°C, the system was then pressurized to 2.1
50

MPa in a syngas of 63 mol% H2 plus CO in He with H2:CO = 1. Three calibrated Brooks (model
number 5850) mass flow controllers were used to produce the reactant mixture from three feed
gas cylinders (Airgas, 99.95 mol% H2; Airgas, 88.2 mol% CO with 11.8 mol% Ar as an internal
standard; and Airgas, 99.995 mol% He). The catalysts were activated at 280 °C for 48-90 h with
a target CO conversion level of ~50% during this carburization period. Activity and stability data
were then obtained over the next 300–400 h as reaction temperatures were varied from 220°C to
260°C.
After leaving the reactor, the exit gas and liquid effluent passed through a hot trap (90°C)
and a cold trap (0°C) to respectively collect heavy hydrocarbon waxes and liquid products. The
effluent gaseous product was analyzed using an HP5890 gas chromatograph equipped with a
thermal conductivity detector and 60/80 carboxen-1000 column to analyze the carbon containing
reactants and products up to C2. CO conversion and selectivities were determined from the
calibrated GC analysis, with aid of the Ar internal standard (premixed with the CO reactant).
3.3 Results
3.3.1 Physical properties
3.3.1.1 Nitrogen adsorption/desorption
Results from the nitrogen physisorption analysis, including specific surface area (SA),
pore volume (Vpore), and average pore diameter (dpore) for the calcined samples, are summarized
in Table 3.2. The surface areas of the calcined catalysts were 152–169 m2/g. Pore volumes were
0.45–0.54 cm3/g, and average pore diameters were 15.9–17.4 nm. Compared to the fresh St.
51

Gobein alumina support, these values represent a decrease after impregnation and calcination on
average of 24%, 23%, and 9% for SA, Vpore, and dpore, respectively.
Table 3.2. Surface area, pore volume, and average pore diameter of St. Gobein support and six catalysts of this study.
Catalyst BET surface area,
m2/g Pore volume,
cm3/g Average pore diameter,
nm St Gobein 216 0.65 18.1
K1 167 0.54 17.4 K2 152 0.45 16.4 K3 167 0.51 15.9 K4 162 0.49 15.9 K5 164 0.52 15.9 K6 169 0.51 16.9
At equivalent Fe loadings, the non-aqueous catalyst has a slightly larger pore volume
than the aqueous catalyst (0.54 cm3/g for K1 and 0.51 cm3/g for K3). Doubling the Fe loading
decreases the pore volume by 17% (0.45 cm3/g for K2).
Figure 3.1 shows the pore size distributions for all six catalysts. All of the aqueous
catalysts (K3 to K6) exhibit broad bimodal distributions, with a large initial peak at about 7 nm
and a second peak at about 15 nm. This first peak is especially large for K4 and K6 (the two
more potassium-rich catalysts). The two non-aqueous catalysts (K1 and K2) appear to have
simple, Gaussian-like, unimodal distributions about a peak at 15 nm. However, closer
examination of K1 shows that a smaller peak appears at about 7 nm, precisely the same pore size
as the first peak in the aqueous catalysts. This first peak disappears for the higher Fe loading
(K2).
52

Figure 3.1. Pore size distributions
3.3.1.2 X-ray diffraction
X-ray diffraction patterns of all six catalysts after reduction at 280 °C and passivation
confirm the presence of γ-Al2O3 with α-Fe0 and/or Fe3O4, except in the case of K6. The
crystallite sizes for Fe3O4 and Fe0 are given in Table 3.3. The Fe peaks for K6 were undetectable
due possibly to crystallite sizes below the detection limit (~3 nm) or due to overlap with alumina.
53

Table 3.3. Fe0 and Fe3O4 particle sizes estimated from XRD.
Catalyst XRD
Fe3O4 particle size, nm
Fe0 particle size, nm
K1 5.6 K2 6.4 11.6 K3 6.4 4.9 K4 8.6 K5 7.3 K6 No Fe detected
Figure 3.2 shows the XRD patterns for all six catalysts. Overlapping alumina peaks dwarf
the Fe0 peak for all catalysts with 20 wt% Fe (K1 and K3 through K5). In contrast, the 40 wt%
Fe catalyst, K2, has a large Fe0 peak beside an alumina peak, which is visible as a shoulder to the
right.
As shown in Figure 3.2, the first five prepared catalysts displayed Fe0 peaks. Table 3.3
shows that doubling the Fe loading doubles the Fe0 crystallite size (11.6 nm for K2 compared to
5.6 nm for K1). At equivalent Fe and K loading, the aqueous catalyst (K3) has a slightly smaller
Fe0 crystallite size than the non-aqueous catalyst (K1) (4.9 vs. 5.6 nm respectively). All else
being equal, doubling K loading increases the Fe0 size by 75% (K4 vs. K3). Dry et al. [81]
similarly found that K promotion increases the crystallite size of Fe metal. However, when
additional potassium is impregnated directly onto the support as in K6, the opposite effect is
observed. The increased basicity of the support likely provides a more favorable surface
interaction, which leads to higher dispersion and apparently, to crystallite sizes below the XRD
detection limit.
54

Figure 3.2. X-ray diffraction patterns of passivated reduced catalysts with standards for γ-Al2O3, α-Fe, and Fe3O4.
3.3.2 Catalyst reducibility
3.3.2.1 H2-TPR
H2-TPR was used to investigate the effect of preparation variables on the reduction
behavior of the catalysts. As shown in Figure 3.3, the reduction of all six catalysts occurred in
three stages with temperature ranges of 205-240°C, 310-390°C, and 470-630°C, respectively for
the first, second, and third stage. The first stage is reduction from Fe2O3 to intermediate Fe3O4
and/or FeO and appears to contain two peaks, with the less intense peak generally appearing as a
55

low temperature shoulder in Figure 3.3. Catalysts K2 and K5 have two distinct peaks in this first
stage, but the rest of the catalysts have shoulders centered at a temperature of ~205°C. This
shoulder may be assigned to the reduction of CuO to Cu and/or Fe2O3 to Fe3O4.The second stage
is an intermediate peak associated with further reduction to Fe metal. The third stage, which
occurs at high temperatures, could be due to reduction of an iron-support compound, such as iron
aluminate, that is too amorphous to be detected by XRD.
The highest peak on all catalysts occurs during the first stage of reduction and is
relatively sharp. In contrast, the second stage, with its associated peak, is much broader,
indicating that the second stage is slower.
Figure 3.3. H2-temperature programmed reduction profiles of supported iron catalysts.
56

The extent of reduction for each TPR peak, reported in Table 3.4, was calculated by
dividing the measured weight loss by the theoretical weight loss corresponding to each transition
from Fe2O3 to Fe, including the complete reduction of CuO to Cu. The extents of reduction for
the first stage (from ~205°C to 240°C) range from 20.9 to 41.0%. These values are considerably
higher than the theoretical value shown in Table 3.5 for reduction of Fe2O3 to Fe3O4 including
CuO to Cu (14.8% extent of reduction), but closer to the theoretical value for the reduction of
Fe2O3 to FeO (36.1% extent of reduction). This suggests that the intermediate phase in the
reduction of Fe2O3 to Fe is likely FeO, rather than Fe3O4. This observation is consistent with
Zhang et al. [82] who reported that FeO, not Fe3O4, is the intermediate for supported Fe
catalysts. As reported in Table 3.4, the extents of reduction for the second stage (33.5–48.8%),
which is FeO to Fe metal, are less than the theoretical value (63.9%), indicating that some FeO
remains in each of the six catalysts.
Table 3.4. Actual extent of reduction after TPR.
Catalyst Extent of reduction, %
First stage Second stage K1 31.4 39.6 K2 20.9 34.1 K3 38.0 42.6 K4 40.7 33.5 K5 37.8 48.8 K6 41.0 47.8
Table 3.5. Theoretical extent of reduction.
Theoretical Extent of Reduction, %
Fe2O3 → Fe3O4 14.8 Fe2O3 → FeO 36.1
FeO → Fe 63.9
57

The highest peak for the non-aqueous catalysts (K1 and K2) occurs at lower temperatures
than the four aqueous catalysts (~220°C vs 230–245°C). However, as mentioned previously, a
low temperature shoulder or peak occurs around 205°C for all of the catalysts. K1 and K2 also
have the smallest extents of reduction for both the first and second stages. K2 has an even
smaller extent of reduction than K1, indicating that the additional 20 wt% Fe relative to K1 is
only partially reducible. For K3 and K4, the temperatures where the highest peaks occur in the
first two reduction stages are very comparable (~230°C and 330°C, respectively). However, both
of these peaks for K5 and K6 have shifted to much higher temperatures, to ~245°C for the first
stage and to ~400°C (70°C higher) for the second. This shift to higher temperatures indicates that
K5 and K6 are more difficult to reduce than the other four catalysts.
3.3.2.2 Oxygen titration
The extent of reduction for the six catalysts calculated after oxygen titration at 400°C
(preceded by hydrogen reduction at 280°C) ranged from 25–44%, as shown in Table 3.6. The
non-aqueous catalysts (K1 and K2) again have lower EOR than the aqueous catalysts (K3–K6):
25–30% vs. 38–44%. The catalyst with 40 wt% Fe loading (K2) has a lower EOR (and is more
oxidized) than 20 wt% Fe (K1), despite having larger metallic Fe crystallites (shown in Table
3.3). Co-impregnation (K5) results in the lowest EOR among the aqueous catalysts.
The catalysts with higher K loadings, whether added during the last stage of catalyst
preparation (K4) or added to the support (K6), retain the highest extent of reduction (42–44%)
following oxygen titration.
58

Table 3.6. Extent of reduction following oxygen titration at 400°C.
Catalyst EOR, % K1 30.0 K2 25.0 K3 40.5 K4 44.3 K5 38.4 K6 42.4
3.3.3 Catalyst carbiding
3.3.3.1 Syngas-TPR
To evaluate the reduction/carburization behavior of the catalysts, syngas-TPR’s were
performed on the calcined catalysts. Figure 3.4 shows the results of these syngas-TPR profiles
for the six catalysts up to 350°C, the range over which the reduction/carburization of the
catalysts are performed. The observed weight losses under a H2/CO atmosphere are a
combination of several competing reactions including: (1) reduction of Fe2O3 to lower iron
oxides or iron metal (the first two peaks, 150-200°C) and (2) carbiding of the iron oxides or iron
metal to iron carbides (the last peak, 280-310°C). The two step reduction of Fe2O3 to lower iron
oxides or iron metal and its carbide occur at lower temperatures for the non-aqueous catalysts,
K1 and K2. K2, with 40 wt% Fe, reduces at lower temperatures compared to K1 with 20 wt% Fe,
but the reduction peak area for K2 is nearly the same as K1, which indicates a lower extent of
reduction, as previously observed during the H2-TPR. Interestingly, increasing the potassium
loading in the case of K4 compared with K3 appears to facilitate easier reduction and carbiding.
Co-impregnation of iron and potassium in catalyst K5, intended to produce better contact
between them, results in lower reduction temperatures for the first two peaks; however, the
carburization temperature does not change significantly and remains ~305°C.
59

Figure 3.4. Syngas-TPR profile of the alumina supported iron catalysts up to 350°C.
3.3.3.2 CO-TPD
CO adsorption and dissociation on the iron surface are key elementary steps in FTS [28].
To study the effects of the various preparation variables on CO adsorption, desorption, and
dissociation, the amount of CO and CO2 evolved during CO-TPD were measured after pre-
adsorption of CO, as shown in Figure 3.5a and 3.5b respectively. Mass spectroscopy
measurements indicate two peaks: the first peak (~220°C) is attributed to desorption of
molecular CO (see Equation 3.1), while the second broad peak at higher temperatures (between
~450 and 650°C) is attributed to desorption of CO after recombination of dissociated carbon and
oxygen on the surface (see Equation 3.2).
CO + * ↔ CO* (3.1)
CO* + * ↔ C* + O* (3.2)
60

In Figure 3.5a, the first peak is much smaller than the second peak, which shows that CO
dissociates readily on the surface at an adsorption temperature of 150°C. For the aqueous
catalysts (K3–K6), the second peak (recombination peak) is a wide or bimodal peak, beginning
at significantly lower temperatures (428–455°C) compared to the same peak for the non-aqueous
catalysts (~530°C). On the non-aqueous catalysts, in contrast, recombined CO elutes in a single
peak at ~600°C. This second peak ends at ~650°C for all six catalysts.
Comparing Figure 3.5b with Figure 3.5a, the CO2 desorption patterns are qualitatively
quite different, where the CO2 desorbs at up to three different temperatures, indicating up to
three different sites at which CO2 is formed. The three peaks include a relatively large one at low
temperatures (230–255°C) and progressively smaller peaks at higher temperatures (390–415°C
and 605–650°C).
Figure 3.5. (a) CO spectra and (b) CO2 spectra of CO-TPD after CO adsorption at 150°C.
Table 3.7 shows the amount of CO and CO2 evolution and the total (CO+CO2) uptake on
each catalyst. As expected, the Fe loading had a large positive effect on the total (CO+CO2)
uptake, since additional Fe creates more adsorption sites (61.6 µmol/gcat for K1 vs 104.1
61

µmol/gcat for K2). However, on a per gram Fe basis, the 40 wt% Fe catalyst absorbs less CO than
the 20 wt% Fe catalyst (260 µmol/gFe for K2 vs 308 µmol/gFe for K1), indicating that not all of
the additional Fe in K2 is available on the surface. Among the 20 wt% Fe catalysts, the two
catalysts with additional potassium (K4 and K6) had the highest total (CO+CO2) uptake. For K4,
with twice as much potassium as K3, molecular CO desorption did not change (see the 1st peak
of Figure 3.5), but dissociated CO that recombined and desorbed (the 2nd peak of Figure 3.5)
increased from 19.5 to 47.3 µmol/gcat. The additional potassium on the support of K6 decreased
desorption of molecular CO to a mere 0.2 µmol/gcat, but increased the total (CO+CO2) uptake to
99.0 µmol/gcat compared to 80.3 µmol/gcat for K3. Co-impregnation (K5) slightly lowered
(CO+CO2) uptake (compared to K3). K1 and K5 have very comparable CO and CO2 desorption
behavior.
Table 3.7. CO uptakes on different catalysts measured by CO-TPD.
CO signal, µmol/gcat
CO2 signal, µmol/gcat
Total CO + CO2 uptake, µmol/gcat
CO: Low temp peak
CO: High temp peaks
Total CO Peaks
K1 1.4 12.4 13.8 47.8 61.6 K2 1.5 49.2 50.7 53.4 104.1 K3 4.4 19.5 23.9 56.5 80.3 K4 4.2 47.3 51.5 72.2 123.8 K5 4.7 12.4 17.1 43.4 60.6 K6 0.2 39.2 39.4 59.5 99.0
62

3.3.4 FTS performance
3.3.4.1 Catalyst activity and selectivity
Activity/selectivity data were obtained at similar conversion levels of 19–28%,
temperatures of 220–260°C, a total pressure of 2.2 MPa, and a constant H2:CO feed ratio of 1.0
for the common particle size of 250 to 590 μm (30-60 mesh); therefore, measured values of
activity and selectivity for the six catalysts are directly comparable. The activity for another
sample of K5 with a smaller particle size of 125-177 μm (80-120 mesh) was also reported. At the
operating conditions reported in Table 3.8, the catalysts have a range of reaction rates from 95 to
160 mmol (CO+H2)/gcat/h. Apart from the preparation variables selected and discussed in this
paper, these catalysts were prepared identically. Therefore, the preparation variables examined in
this paper have the largest effects on the differences in performance of the catalysts.
K5 and K6 were the most active catalysts, while K2 and K4 were the least active.
Interestingly, K2 and K4 had the largest Fe loading and the largest K loading respectively. K1
and K5 had slightly better selectivity, as measured by methane production, than the other four
catalysts (16–16.4% vs. 17.2–18%). Comparison of activity data from K1 (non-aqueous) with
activity data from K3 (aqueous) shows that the non-aqueous slurry impregnation yields catalysts
with 14% higher reaction rates (130 vs. 114 mmol (CO+H2)/gcat/h) and slightly lower methane
selectivities (16.0% vs. 17.9% methane). Surprisingly, doubling the Fe loading level from 20
wt% (K1) to 40 wt% (K2) decreased the reaction rate by 17%. Similarly, doubling K promotion
from 4K/100Fe (K3) to 8K/100Fe (K4) lowered the reaction rate by 17%, while methane
selectivity did not improve. On the other hand, direct K promotion of the support in addition to
4K/100Fe (K6) led to a significantly improved observed reaction rate (as compared with K3).
63

However, as will be shown, direct K promotion sacrifices catalyst stability. Co-impregnation
yielded a catalyst (K5) with a rate 40% higher than one prepared by sequential impregnation
(K3). Co-impregnation also led to lower methane selectivity compared to sequential
impregnation (16.4% compared to 17.9%).
The most active catalyst, K5, was also tested with an average particle diameter of ~150
µm (80-120 mesh). The rate increased about 31% and methane and CO2 selectivities decreased
from 16.4 to 13.2% and 41 to 33%, respectively as average catalyst particle size decreased by a
factor of 3 from 420 to 150 µm. A rate increase of only 31% with a decrease in particle diameter
of almost a factor of 3 indicates a minimal and decreasing pore diffusion effect. The productivity
of K5 also increased about 34% to 0.75 gHC/gcat/h. The next most active supported iron catalyst
(K1) was also tested at the smaller particle sizes, but no significant changes in rate or selectivity
were observed, further indicating the negligible pore diffusion effect for the catalysts at the
conditions of this study.
3.3.4.2 Catalyst stability
The reaction rate was periodically measured at 250°C over time to directly compare the
stability of the catalysts. Figure 3.6 shows the results of these measurements as a function of time
on stream. (Data prior to ~60 h on stream during the induction period of catalyst carburization
are not shown because the temperature and flow conditions were optimized for catalyst
activation.) The non-aqueous catalysts, K1 and K2, are the most stable. Although K5 and K6
were initially the most active catalysts, this stability analysis conducted at 250°C reveals that
neither is very stable. K6, in particular, deactivates to nearly half its initial rate in only 175 h on
64

stream. Extrapolating this steep rate of deactivation beyond the measured 235 h on stream, K6
would have the lowest activity of the six after 300 h or less.
Table 3.8. Performance of six catalysts of this study in fixed-bed reactor tests. T = 260°C, H2/CO = 1, PH2
0 = 0.66 MPa, PCO0 = 0.66 MPa, Ptot = 2.2 MPa.
Catalyst ID K1 K2 K3 K4 K5 K6 Catalyst particle size 30-60b 30-60 30-60 30-60 30-60 80-120b 30-60 Time on stream, h 95 126 119 119 118 60 120 Space velocity, Nl/gcat/h 23 23 21 19 21 22 23 CO conversion, % 21 19 19 20 28 19 24 Ratec 130 108 114 95 160 210 149 Hydrocarbon Selectivityd, mol% CH4 16.0 17.2 17.9 18.0 16.4 13.2 17.5 C3+ 76 75 73.6 73.1 74.5 81.5 73.1 CO2 selectivity, % 39.5 42.7 40.2 43.9 40.9 33.3 42.4 Catalyst productivitye 0.47 0.39 0.39 0.33 0.56 0.75 0.49 a 30-60 mesh size is equivalent to 250-595 µm. b 80-120 mesh size is equivalent to 125-177 µm. c mmol (CO+H2)/gcat /h b CO2-free basis c gHC /gcat/h
Initially, K5 likewise has a favorable reaction rate, but quickly deactivates. It is unclear
whether the reaction rate is stabilizing for K5 after 300 h on stream. If so, K5 could possess the
best combination of activity and stability of any catalyst in this study. This lab plans to conduct
an additional stability study with K5 in the future, but the data available at this time are
insufficient to distinguish the performance of either K1 or K5 as preferable over the other. For a
comprehensive view of the quality of these six catalysts, the activity and selectivity
characteristics of the catalysts shown in Table 3.8 should be considered in light of this stability
analysis.
65

Figure 3.6. Catalyst activity at 250°C (PH20 = 0.66 MPa, PCO
0 = 0.66 MPa, Ptot = 2.2 MPa) vs. time on stream.
3.3.4.3 Activity comparison to literature
The FTS performance of the two best catalysts in this study (K1 and K5) was compared
with some of the best Fe catalysts reported in the literature, including both supported and
unsupported Fe catalysts. The reported data were collected at a variety of reactant concentrations
and temperatures. Therefore, to make the comparison, a simple model was used to estimate an
apparent reaction rate constant, which accounts for differences in partial pressures. A first-order
reaction with respect to hydrogen and zero order in CO was assumed to calculate the apparent
reaction rate constant.
A brief summary of the experimental conditions in this study follows to facilitate
comparison with the literature results. The temperature and total pressure of K1 and K5 were
66

held constant at 260°C and 2.2 MPa. These supported catalysts were sieved to a particle size of
80-120 mesh (average particle diameters of 150 µm). For this comparison study, the reaction was
performed at relatively high conversions (up to 70%) to directly compare the reaction rates and
productivities with the literature reports at similar conversion levels, and the ratio of H2/CO in
the feed was about 0.67. Other catalysts reported in literature and shown in Table 3.9 were tested
at nearly the same conditions. This comparison to the literature data is limited by these
inconsistencies in operating conditions. As is well-reported in literature [83], higher conversion
and lower H2/CO result in slightly lower activity and lower methane selectivity. In addition, the
catalysts in this paper were tested in a fixed bed reactor, while most other reported FTS rates
were measured in slurry reactors. The values shown in Table 3.9 can be used to further
understand the effects of the techniques used to prepare K1 and K5.
The catalysts reported in Table 3.9 are among the most competitive reported in the
literature to date. Using rate per MPa for comparison removes much of the bias of differing
conversions and H2/CO ratios. Although K5 (supported iron) has a lower rate than the most
reactive unsupported catalyst in Table 3.9, TAMU1 (154 vs 269 mmol (CO+H2)/gcat/MPa/h), K5
produced virtually the same rate as a commercial unsupported catalyst, from Ruhrchemie, as
reported by Bukur’s group [84] (154 vs. 155 mmol (CO+H2)/gcat/h, respectively).
The activities of K1 and K5 are superior to any supported catalysts reported in the
literature prior to publication of our recent work on Fe supported on silica doped alumina
(described in Chapter 4) [85]. Both K1 and K5 have 17-40% higher reaction rates than the next
most reactive supported catalyst (TAMU2, 40Fe/SiO2). Per gram Fe, the extremely high reaction
rates of K1 and K5 demonstrate how effective the Fe is utilized in each catalyst (570 mmol
(CO+H2)/gFe/MPa/h for K1 and 770 mmol (CO+H2)/gFe/MPa/h for K5).
67

Hydrocarbon selectivities (based on methane production) for K1 and K5 are less
favorable than those prepared by Bukur et al. (see Table 3.9). The C1 selectivity of K5 on a CO2-
free basis is higher (11.4 vs. 7%) than that of Bukur’s supported catalyst (TAMU2). This lab
recently reported successful preparation of a supported Fe catalyst using a thermally stable silica-
doped alumina support (AlSi) [85]. This catalyst yielded a methane selectivity of 9.6% at similar
operating conditions (reaction T = 260°C, H2/CO = 0.66, and XCO = 72%) to TAMU2. In
addition, this AlSi-supported Fe catalyst is more active than all the catalysts in Table 3.9 [85].
More significantly for this similar AlSi-supported Fe catalyst, increasing the conversion from 23
to 72% resulted in only moderately lower activity, with the 1st order rate constant decreasing
from 396 to 325 mmol (CO+H2)/gcat/MPa/h), and productivity decreasing from 0.72 to 0.50
gHC/gFe/h. The activities of the catalysts in the present study are 1.5-3 times higher than the other
supported iron catalysts reported in Table 3.9.
3.4 Discussion
By carefully pairing and comparing catalysts with only one dissimilar preparation
variable, the direct effects of each specific preparation method on catalyst activity, selectivity
and stability can be discerned. The differences in each pair of catalysts are analyzed below and
labeled by their associated preparation variable.
68

Table 3.9. Comparison of K1 and K5 performance with catalysts reported in the literature.
Catalyst
BYUa TAMU1b Ruhrchemiec TAMU2d TAMU3e U. Kentuckyf BYU-Xug
Run ID K1 K5 Unsupp. Unsupp. SiO2/supp Al2O3/supp Al2O3/supp SiO2/supp
Literature ref. This study [12] [84] [18] [18] [17] [9]
Reactor Fixed bed slurry slurry slurry slurry slurry Fixed bed
Temp., °C 260 260 260 260 260 260 250 265
Pressure, MPa 2.2h 2.2h 2.2 1.5 1.5 1.5 1.3 1
Inlet H2/CO 0.67 0.68 0.68 0.67 0.67 0.67 0.7 1
Space velocityi 5.0 3.7 3.5 2.2 1.4 1.3 0.68 1.9 TOS, h 183 183 86 100 100 300 150
XCO, % 39 70 84 66 60 77
Rate (-rCO)j 38k 52k 76 38 18 14
Rate constantl 114m 154m 269 155 101 50.7 62.1
Rate constantn 570m 770m 450 290 300 150 621
H.C. selectivities, wt% o CH4 10 11.4 3 5.3 7 3.5 5.8 6.8 C3+ 85.8 83.6 90.1
C1+C2 14.2 16.4 6.3
Cat. prod.p 0.26 0.29 0.51 0.27 0.076 0.3
Cat. prod.q 1.3 1.45 0.86 0.51 0.35 3 a 100Fe/7.5Cu/4K/400Al2O3. b 100Fe/3Cu/4K/16SiO2. c 100Fe/5Cu/4.2K/25SiO2. d 100Fe/5Cu/6K/139SiO2. e 100Fe/5Cu/9K/139Al2O3. f 100Fe/6Cu/8.1K/250Al2O3. g 10Fe/1Pt/0.2K/88.8SiO2. h PH2
0 = 0.66 MPa, PCO0 = 0.66 MPa, Ptot = 2.2 MPa
i Nl/gcat/h. j mmol (CO)/gcat/h k average rate from inlet to the outlet of reactor
l mmol (CO+H2)/gcat/MPa/h m an isothermal integral reactor model was used to calculate the rate constants with a rate expression of the form kPH2; volume change factors of -0.44 and -0.425 were assumed for K1 and K5, respectively. n mmol (CO+H2)/gFe/MPa/h o CO2 free basis. p gHC/gcat/h, where HC are defined for BYU catalysts as C3+ q C3
+ productivity: gHC/gFe/h, where HC are defined for BYU catalysts as C3+
3.4.1 Choice of solvent: aqueous vs non-aqueous (K1 vs. K3)
Control of distribution of active precursors is dependent upon the impregnation method and
drying step. A uniform distribution in incipient wetness impregnation is usually difficult to
obtain. However, wet impregnation in a rotary evaporator greatly facilitates uniform filling of the
69

pores with the precursor solution. Recently, Sasol showed that slurry impregnation, as in the case
of the non-aqueous preparation method, leads to better dispersion compared to an incipient
wetness preparation method [86, 87]. Also, several papers from de Jong’s group showed that
improved dispersion in turn improves stability; higher dispersion introduces physical voids
between active sites, thus reducing sintering [75, 88, 89].
Tymowski et al. [90] conducted a set of transmission electron microscopy (TEM)
tomography experiments that show water does not wet pores smaller than 50 nm, while non-
aqueous solvents wet pores as small as 4 nm. This difference allows non-aqueous impregnation
to disperse the active phase throughout a wider range of pore sizes, leading to improved
dispersion and activity. In addition, the metal deposited in this smaller range of pores (4 nm to 50
nm) with non-aqueous solvents may strengthen the pores against collapse. This may explain why
K1 has slightly larger pore volume than K3 (0.54 vs. 0.51 cm3/g). As observed in the BET results
section, K1 exhibits a muted first peak at 7 nm that corresponds to peaks in the aqueous
catalysts. The non-aqueous catalyst’s first peak disappearing may be due to smaller pores (5–7
nm in diameter) being filled with Fe during impregnation. This argument also explains why this
first pore size distribution peak on K2 (40 wt % Fe) has disappeared altogether.
During drying of each sample after impregnation, especially the ones using an aqueous
solution, capillary transport may cause the active precursor to accumulate at pore entrances,
ultimately leading to a shell-type distribution of metals. Tymowski et al. [90] also hypothesized
that metals could be drawn out of pores in the drying step of preparation, leading to pore
plugging. Iglesia’s group [10] proposed that sintering can occur via pore mouth pinching in the
last stages of evaporation of the solvent during preparation. They stated that this sintering is
particularly severe for solvents with high surface tensions. Therefore, the lower surface tension
70

of the non-aqueous solvent (50 vol% acetone, 50 vol% isopropanol) may lead to better
dispersion for K1 and K2 by way of less disruptive drying. (The surface tensions of acetone,
isopropanol, and water at 20°C are 23.4, 23.0, and 72.8 mN/m, respectively.)
As stated in the preparation section, K1 and K2 were prepared in a rotary evaporator with
non-aqueous slurry solution, while the aqueous catalysts were prepared by incipient wetness
impregnation. Both the slurry impregnation and the non-aqueous solution likely contributed to
improve the uniform distribution of the active precursors, consequently resulting in higher
activity (130 vs. 114 mmol (CO+H2)/gcat/h) and better stability for K1.
3.4.2 Fe loading level: 20 wt% vs 40 wt% (K1 vs K2)
Bukur et al. [18] stated that high metal loading for supported Fe catalysts is essential to
achieve high reactor productivity. However, pore plugging can be exacerbated by higher metal
loadings. In this study, as previously mentioned, doubling the Fe loading actually decreased the
reaction rate per g of catalyst by 17%. The additional Fe in K2 (20 wt% more than K1) appears
to block the pores from reactants, as evidenced by a 17% lower pore volume of K2 than K1. In
addition, H2-TPR results show that the additional Fe in K2 is harder to reduce than K1. For each
support, an optimal Fe loading exists that fills the pore volume without blocking reactants from
accessing the pores. This optimal loading level likely depends on the pore volume of the support
used. In another paper produced by our group (see Chapter 4) [83], catalysts on another support
(with double the pore volume of St. Gobein alumina) exhibited improved activity with 40 wt%
Fe compared to 20 wt% Fe. For the procedure used to prepare K1 and K2, a critical threshold
exists somewhere below 40 wt% Fe for maximum surface area per gram Fe. Therefore, the
optimal Fe loading for catalysts on the St. Gobein support must be a loading less than 40 wt%.
71

3.4.3 Potassium loading level: 4K/100Fe vs 8K/100Fe (K3 vs K4)
Generally, K promotion of FT catalysts is thought to increase activity of both FTS and the
water-gas shift reaction. Davis [77] studied trends for potassium-promoted FTS at various
conversion levels. He found additional K actually decreases FTS activity at low CO conversions,
where K seems to act as a poison. As conversion increases, hydrogen becomes a limiting reagent
and FTS begins to depend on hydrogen formed by the water-gas shift reaction. At high
conversion, K slightly enhances the FTS activity. Therefore, at intermediate conversions, a K
loading exists that produces a catalyst with maximum FTS activity. Specifically, Li et al. [10]
observed that K addition above the amount required to create surface density of 2 atom/nm2 does
not increase reaction rate.
For this particular set of catalysts, the additional K applied to K4 appears to have surpassed
the loading for maximum rate (for operation at low conversions, <28%). This explains why K4
has a lower reaction rate than K3. Alternatively, Torres Galvis et al. [88] showed that lowering
the Fe carbide particle size on carbon nanofibers increased the catalytic activity. In the case of
K4, doubling the K loading increased the crystallite sizes of Fe metal (8.6 vs. 4.9 nm), which
may also contribute to the lower activity observed of K4 compared to K3. Surprisingly, the
methane selectivity of K4 was virtually unaffected by the additional K at this level of CO
conversion (20%).
3.4.4 Impregnation timing: sequential impregnation vs co-impregnation; direct surface
promotion of the support (K3, K5, K6)
Catalyst preparation by co-impregnation (K5) produces a rate 40% larger than sequential
impregnation (K3). H2-TPR results (Figure 3.3) for K5 reveal the reason for this significant
difference: the profile for K5 exhibits shifts to higher temperatures for the first and second peak,
72

by 15°C and 70°C, respectively, compared to the profile for K3. The addition of K and Fe
simultaneously seems to have placed the two metals in close contact, making K5 less reducible
[77]. This close contact is likely also the cause of the improved reaction rate and methane
selectivity for co-impregnation (K5). This TPR peak shift is coupled with a lower EOR than the
other aqueous catalysts, likely again due to intimate contact of Fe and K.
Dry and Oosthuizen [81] reported that K+ ions are an effective promoter because they
increase surface basicity. Surface basicity improves dissociation of CO and leads to production
of longer hydrocarbons. CO-TPD results demonstrate higher (CO+CO2) uptake on K6 than K3
(99 vs. 80.3 µmol/gcat) as surface basicity increased by loading of K on the support. Therefore,
adding K on the support increased the rate by 31% (relative to K3). Unfortunately, the data
presented in Figure 3.4 clearly demonstrate that K6 is not a stable catalyst. During the first 200 h
of testing, K6 deactivated dramatically due probably to carbon deposition on the surface of the
catalyst, or possibly redistribution of the potassium.
CO-TPD showed that K4 and K6 both have significant dissociation of CO on the surface.
Recently, Ribeiro et al., [91] using in-situ TPR-extended X-ray absorption fine structure/X-ray
absorption near edge spectroscopy (EXAFS/XANES), found that the rate of carburization
correlates with the basicity of the alkali oxide, which is consistent with higher CO dissociation
on both K4 and K6 that have higher potassium loading. Furthermore, they reported that the Hägg
carbide is the most abundant iron carbide, which is consistent with our observations for K1, with
the XRD reported in Chapter 4; Figure 4.4b. Both of these potassium-rich catalysts probably
deactivate due to carbon deposition brought on by basic catalyst surfaces. Addition of K on the
surface of the alumina clearly exacerbated the deactivation of K6 compared to not adding it (K3).
73

H2-TPR results show a shift to higher reduction temperatures for K6 compared to K3. This
effect is not simply caused by additional potassium, because K4 exhibited no such change.
Possibly, the peaks for K6 have shifted due to Fe or FeO interacting with the potassium-modified
surface of the alumina.
3.5 Conclusion
The effects of the four catalyst preparation variables studied by comparing the catalyst
performance of pairs of catalysts with only a single preparation variable differing between them
were significant. The resulting observations are summarized below:
1. Aqueous incipient wetness vs. non-aqueous slurry: K1 (non-aqueous slurry) has 14%
higher activity and improved stability compared to K3 (aqueous incipient wetness). Non-
aqueous solvents allow for a more gentle drying process that apparently does not disturb
the impregnated Fe within the pore.
2. Fe loading level: K1 (20 wt% Fe) has a 17% higher reaction rate than K2 (40 wt% Fe)
per gram of catalyst. In this case, lower Fe loading may avoid blocking the pores on St.
Gobein alumina and so yields greater rates compared to the higher Fe loading.
3. K loading level: K3 (4 K/100 Fe) has a 20% higher reaction rate than K4 (8 K/100 Fe).
Additional K beyond 4 K/100 Fe acts as a poison at the low conversions used in this
study (<28%).
4. Timing of impregnation: K5 (co-impregnation) has a 40% higher rate than K3
(sequential impregnation) at 260°C. Co-impregnation of Fe and K yields a catalyst with
intimate contact between Fe and K inside the catalyst pores. K6 (direct K promotion of
the support) deactivates sharply in the first 200 h on stream, while K3 (no K promotion of
74

the support) is far more stable. Direct K-promotion of the support increases the FTS
reaction rate, but also appears to increase the rate of carbon deposition.
Based on these results, we predict that the optimal sequence of preparation methods (for
this St. Gobein alumina support) combines non-aqueous slurry impregnation with co-
impregnation of Fe and K metals, with 20 wt% Fe and 4 K/100 Fe. The optimal preparation
method also does not directly promote the support with K. The optimal Fe loading could be less
than or greater than 20 wt%, but an Fe loading as high as 40 wt% blocks the pores limiting
reactant access to active sites. Likewise, the optimal K loading could be less than or greater than
4 K/100 Fe, but must be less than 8 K/100 Fe for low CO conversions. Since K1 and K5 had the
best activity, stability, and selectivity performance of the six catalysts, perhaps a catalyst
prepared by both non-aqueous slurry impregnation (K1) and co-impregnation (K5) would
perform better than K1 and K5. Unfortunately, a catalyst could not be prepared with this
combination of preparation variables because the potassium precursor (potassium bicarbonate) is
not soluble in the non-aqueous solvent. Another potassium precursor that would allow successful
combination of these two preparation methods may yield superior catalysts. Measured
performance of K1 and K5 demonstrates that supported Fe catalysts can have high reaction rates
and high productivity, even more promising than all of the supported iron catalysts from the
literature compared in this paper.
75

Chapter 4 Supported Iron: Effects of Support Material and SiO2 Stabilizer
This chapter discusses the effect of support properties and SiO2 stabilizer on the activity
and stability of supported iron FT catalysts. It also reports on the successful preparation of the
most active supported Fe FT catalyst to date and a catalyst that is very stable with no
deactivation for 700 h time on stream.
4.1 Introduction
The Fischer-Tropsch (FT) Synthesis (FTS) is a commercially proven, economically
viable, and environmentally sound process for the production of hydrocarbon fuels from natural
gas, coal, and biomass. Nevertheless, improvements in catalyst technology are desirable to
improve the efficiency and economy of this process. Iron catalysts are considered to be more
favorable than cobalt catalysts for the production of long-chain hydrocarbons from coal or
biomass because of their low cost, low methane selectivity, and high water-gas shift (WGS)
activity; WGS activity is needed for internal production of H2 during FTS because of the
inherently low H2/CO ratios in syngas from coal or biomass.
Typical commercial iron FT catalysts consist of unsupported iron promoted with copper,
potassium, and silicon dioxide. Precipitated FeCuK catalysts have been used successfully at
Sasol for more than 50 years to produce long-chain hydrocarbons from coal synthesis gas in their
low-temperature Arge tubular fixed-bed reactors [76]. Several publications from Bukur et al. [7,
76

8, 13] describe development of active, selective and stable precipitated iron catalysts. Upon
optimization of catalyst composition and pretreatment conditions, a weight-time yield of 450
mmol (CO+H2)/gFe/h/MPa and a C2+ hydrocarbon productivity of 0.86 gHC/gFe/h for
100Fe/3Cu/4K/16SiO2 at 260°C and 2.2 MPa were reported [12]. This activity is among the
highest reported for iron catalysts. Unfortunately, despite favorable high activity and selectivity
properties, precipitated iron catalysts are generally mechanically too weak for use in slurry
bubble column reactors (SBCRs) due to high rates of attrition of fine particles leading to
difficulty in solid/wax separation. For example, extensive catalyst attrition was observed in an
SBCR reactor operated by DOE at LaPorte, Texas requiring shutdown after only one day of
operation [92]. Spray drying the catalyst with silica binders followed by calcination has been
used by Sasol and Synfuels China to alleviate this problem [14] but the attrition resistance of
unsupported Fe catalyst may not be adequate for the long-term, given higher rates of attrition
observed during high velocity operation in large diameter SBCRs [93].
It is well known that supported metal catalysts have high attrition resistance due to the
inherently high mechanical strength of the support [17]. Supports also generally (1) facilitate
preparation of catalysts with much higher dispersion of the active phase or phases and (2)
stabilize the active phase(s) against sintering [76].
Previous attempts to develop supported iron catalysts have largely met with limited
success, i.e. most of these catalysts were found to have low activity and high methane selectivity
[9, 17, 18]. Interestingly, the poor catalyst performance can be correlated in most cases with
preparation methods which led to strong Fe oxide-support interactions and low reducibility or in
the case of Fe/carbon catalysts contamination or decoration of the active phase by the support [9,
18, 20]. For example, Cagnoli et al. [94] studied the influence of Al2O3 and SiO2 supports on the
77

activity and selectivity of iron catalysts of very high dispersion and small crystallite size (average
diameters of 1.2 and 1.4 nm for Al2O3 and SiO2 respectively). The activity of the alumina
supported catalyst was one order of magnitude lower than the silica supported. Since the
crystallite diameter in both catalysts was the same, this difference in activity was attributed to
higher metal-support interaction of the iron with alumina. This assumption was also verified by
the formation of two compounds; namely, FeAlO3 and FeAl2O4. The alumina supported catalyst
also showed higher methane selectivity and lower olefin selectivity. Bukur et al. [13] found that
the FTS activity was decreased by the addition of silica or alumina to precipitated Fe (basis of
100 parts of Fe) as follows: unpromoted unsupported > 8 Al2O3 ~ 8 SiO2 > 24 Al2O3 > 24 SiO2
>100 SiO2. The order can be explained by a lower extent of reduction of Fe and lower
effectiveness of potassium due to its interaction with the alumina or silica. In another study of
supported Fe Bukur et al. [18] found the silica-supported catalyst was nearly three-fold less
active than their group’s most active precipitated (unsupported) iron catalyst on a per gram
catalyst basis (100 vs. 269 mmol(CO+H2)/gcat/MPa/h) while the alumina-supported catalyst was
5 fold less active.
In contrast to other studies [18, 81, 94], O’Brien et al. [17] found Fe/Al2O3 to be twice as
active as Fe/silica but still 5-fold less productive than unsupported iron (0.09 vs. 0.45 gHC/gcat/h).
Methane selectivity was also higher on silica-supported catalysts, which is opposite from the
results observed in Cagnoli’s study [94].
Barrault et al. [95] found that the activity of iron dispersed on high surface area alumina
was lower and its methane selectivity higher than for iron dispersed on low surface area alumina;
activity was highest on an alumina of mid-range surface area (80 m2/g). These results
78

corroborate the hypothesis that well-dispersed iron generally interacts strongly with the support,
leading to low activity and high methane selectivity.
Rameswaren and Bartholomew [20] demonstrated that iron interaction with the support
declines with decreasing hydroxyl concentration of the support. Increasing the dehydroxylation
temperature enhanced the TOF and decreased methane selectivity. Xu and Bartholomew [9]
adapted the same principles in their preparation of 10% Fe/silica and FePt/silica catalysts via
nonaqueous evaporative impregnation of a previously dehydroxylated silica support.
Nevertheless, their reported activity was still 4-fold lower than Bukur’s best unsupported catalyst
(62 vs. 269 mmol(CO+H2)/g cat/MPa/h) probably due to the low Fe loading.
Weakly interactive 𝛼𝛼-alumina and carbon nanofiber supports were used by de Jong’s
group [75] to decrease the interaction between iron and the support for high temperature FT to
produce olefins. Iron oxide crystallite size was reported to be 14 ± 5 nm on a 6% Fe/α-Al2O3
catalyst. Unfortunately, the low-surface area support limited Fe loading and metal dispersion to
less than optimal. In another paper, de Jong et al. [88] showed that activity increases with
decreasing iron carbide particle size on an inert support.
In summary the catalytic performance of supported Fe catalysts and particularly the
effects of support properties on their activity and stability have not been thoroughly investigated.
Previous efforts to develop an active, supported Fe catalyst have been largely unsuccessful, in
our opinion, due to strong Fe oxide-support interactions and low reducibility caused by less than
optimal choices of preparation method, support material and support pretreatment. Consequently,
the purpose of the subject study was to investigate systematically the role of the support
variables. To acquire a reliable data set, six different catalysts were prepared on alumina supports
79

using the same preparation method and amount of active components (including 20% Fe) except
two catalysts with higher (40%) Fe loading. Selecting four different alumina supports with
different physical and chemical properties and two different Fe loadings allowed us to
investigate the effects on catalyst activity and stability of:
(1) physical properties of the support, e.g. pore volume and pore diameter.
(2) surface chemistry of the support, i.e. hydroxyl groups which can be controlled by
thermal pretreatment of the support.
(3) silica vs. lanthana as a stabilizer.
It will be demonstrated that by carefully tailoring these properties it was possible to
develop alumina-supported Fe catalysts having higher activity per gram than previously reported.
The use of silica-stabilized alumina, which enables high temperature dehydroxylation while still
maintaining high surface area and large pore volume, was a key to producing very active and
stable catalysts. This approach may have general application to improvements in catalyst
performance resulting from higher dispersion and lower metal oxide-support interactions.
4.2 Experimental
4.2.1 Catalyst preparation
A series of six alumina supported iron catalysts with four different alumina supports (St.
Gobein alumina (AlG), Alfa-Aesar alumina (AlA), AlC, and AlSi; the last two made by Cosmas
Inc.) were investigated in this study. To increase the thermal stability of the supports, 3 wt% La
was added to AlG, AlA, and AlC, while AlSi consisted of alumina doped with 5% SiO2 as
80

described previously [85]. The supports were first sieved to 30-60 mesh and calcined at 700°C in
air for 4 h prior to impregnation, except AlSi, which was calcined at 1100°C. All four catalysts
were promoted with Cu and K and prepared by slurry impregnation using a non-aqueous solution
(50% iso-propanol and 50% acetone) containing desired amounts of ferric nitrate and copper
nitrate in multiple steps. In each step 10 wt% Fe with the desired amount of Cu was dissolved in
a volume of solution corresponding to 10% above incipient wetness and then was placed in a
rotary evaporator and mixed for 12 h to give uniform Fe and Cu deposition. After each
impregnation, the catalysts were dried very slowly in vacuum at 50 °C followed by 80 °C in an
oven overnight and calcined at 300 °C for 16 h. Following the final addition step of Fe and Cu,
potassium was added by incipient wetness impregnation as potassium bicarbonate. Nominal
compositions (on a relative mass basis) of reduced catalysts were 100Fe/7.5Cu/4K/400Al2O3 for
a nominal iron loading of 20% and 100Fe/7.5Cu/4K/150Al2O3 for an iron loading of 40%.
Preparation of unsupported iron catalyst (FeCuKSiO2) was described previously in Chapter 2
(section 2.1.1).
4.2.2 Catalyst characterization
Several characterization techniques were used in this study including: BET, XRD,
hydroxyl group measurement, NH3-TPD, H2-TPR, syngas-TPR, EOR, NMR. These techniques
were fully described in Chapter 2 and our published paper [83].
4.2.3 Activity and selectivity measurements
Fischer-Tropsch Synthesis (FTS) was conducted in a fixed-bed reactor (stainless steel,
3/8 inch OD) described previously [80]. Each sample (0.25 g, 250-590 µm) was diluted with 1 g
quartz sand or silicon carbide to improve isothermality in the catalytic zone.
81

Before FTS, the samples were reduced in situ and the temperature was ramped to 280-
320°C from room temperature in 10% H2/He for 10 h followed by 100% H2 for 6 h. After
cooling to 180°C, the system was then pressurized to 2.2 MPa in a syngas of 63 mol% H2 plus
CO in He with H2:CO = 1. The catalysts were activated at 280°C for 48-90 h with a target CO
conversion level of ~50% during this carburization period. Activity and stability data were then
obtained over the next 200-700 hours as reaction temperatures were varied from 220°C to 260°C.
After leaving the reactor, the exit gas and liquid effluent passed through a hot trap (90°C)
and a cold trap (0°C) to collect heavy hydrocarbons and liquid products. The effluent gaseous
product was analyzed using an HP5890 gas chromatograph equipped with a thermal conductivity
detector and 60/80 carboxene-1000 column. CO conversion and selectivities were determined
with aid of an Ar tracer.
4.3 Results
4.3.1 Physical properties
4.3.1.1 Nitrogen adsorption/desorption
The average pore diameter and pore size distribution (PSD) of each of the four alumina
support materials were calculated from BET data using a new slab pore model and method
proposed by Huang et al. [65] and modified to fit a log-normal PSD [66].
The BET data for calcined catalyst samples and unimpregnated supports are summarized
in Table 4.1. The surface areas for the four supports ranged from 216 to 288 m2/g; the average
pore diameters (1st peak) were 9.6-18.1 nm, and pore volumes were 0.60-1.06 cm3/g. Most of the
82

samples had a narrow Gaussian-like unimodal pore size distribution as shown in Figure 4.1.
However, for AlSi a broad bimodal distribution with some macroporosity (dp > 50 nm) was
observed; these large pores are expected to better accommodate diffusion of reactants in and
products out of the pores than in the other catalysts. The first and second peak for AlSi are
centered at 17.3 and 45.2 nm, respectively (a small peak around 8 nm for AlSi is not considered).
Figure 4.2 shows the BET surface area, pore volume, and pore diameter of the AlSi as a function
of calcination temperature from 700 to 1200°C. At elevated calcination temperatures up to
1200°C, the AlSi support still has very good BET properties with surface area of 110 m2/g, pore
volume of 0.59 cm3/g, and pore diameter of 29.5 nm at 1200°C. As is apparent, the BET
properties for AlSi are much higher than for conventional alumina supports such as St. Gobein at
the same calcination temperature of 700°C. For instance, the pore volume of the AlSi is 1.83
cm3/g (see Figure 4.2); three times higher than that of St. Gobein alumina (0.65 cm3/g) at 700°C.
AlSi has the highest pore diameter and pore volume among all the supports. On the other hand,
for AlC a very narrow pore size distribution centered at 9 nm is evident.
Table 4.1. Surface area, pore volumes and pore diameters of calcined catalysts and supports.
Sample BET surface area, m2/g
Pore volume, cm3/g
Average pore diameter, nm 1st peak 2nd peak
AlG 216 0.65 18.1 - 20Fe/AlG 204 0.55 17.4 - 40Fe/AlG 152 0.46 16.4 - AlA 228 0.84 16.0 - 20Fe/AlA 209 0.62 15.0 - AlC 288 0.60 9.6 - 20Fe/AlC 247 0.45 9.0 - AlSi 224 1.06 17.3 45.2 20Fe/AlSi 216 0.82 20.7 33.1 40Fe/AlSi 173 0.64 21.8 28.5
83

Figure 4.1. Pore size distribution of supports calculated from BET data using a new slab pore model [65]
After impregnation with 20 wt% Fe and calcination, surface area and pore volume (Vpore)
decreased on average by 10 and 22%, respectively; average decreases in surface area and Vpore
following addition of 40% Fe were 26 and 34% respectively. Nevertheless, the pore volume of
40Fe/AlSi is comfortably high (0.64 cm3/g), even with 40% iron loading. Decreases in average
pore diameter with increases in Fe loading were generally small (about 10%). However, in the
case of 40Fe/AlSi, the diameter of the primary peak increased by 20% and that of the secondary
peak decreased by 37%.
84

Figure 4.2. (a) BET surface area, (b) pore volume, and (c) average pore diameters of AlSi as a function of calcination temperature. The two sets of data for the pore diameter correspond to the two peaks in the bimodal distribution shown in Figure 4.2 and Table 4.1.
4.3.1.2 X-ray diffraction
Figure 4.3 shows the XRD data for the AlSi at different calcination temperatures. From
the XRD data it is observed that the alumina in the AlSi remains γ-alumina up to 1100°C, theta
peaks start to appear at 1200°C, and alpha peaks appear at 1300°C. By contrast, Horiuchi et al.
[96] observed for their silica-doped alumina the theta phase appeared at 1100°C.
85

Figure 4.3. X-ray diffraction patterns of AlSi as a function of temperature confirming the AlSi support is essentially γ-alumina at 1100°C.
X-ray diffraction patterns of all catalysts reduced at 280 °C and passivated confirmed the
presence of 𝛾𝛾-Al2O3, Fe0 and/or Fe3O4. As shown by data in Figure 4.4a and Table 4.2, all
catalysts contained Fe0 and/or a significant fraction of Fe3O4 as might be expected for such a low
reduction temperature. The only difference between X-ray diffraction patterns of reduced
samples was the width and intensity of Fe or Fe3O4 peaks. No potassium or copper were detected
in XRD, probably because of their low concentrations and/or high dispersions. In addition, XRD
patterns of the carbided 40Fe/AlG and 40Fe/AlSi (see Figure 4.4b) at 280 °C for 10 h in
H2/CO=1 shows Fe5C2. The average Fe3O4, Fe0 and Fe5C2 diameters as calculated from the peaks
located at 2𝜃𝜃=37.3°, 2𝜃𝜃=44.9°, and 2𝜃𝜃=43.1°, respectively, are given in Table 4.2. It was not
possible to estimate crystallite diameter (dcrstlt) for Fe0 from XRD for 20Fe/AlSi, since average
dcrstlt was too small.
Estimated crystallite diameters of Fe0 (dFe0) or Fe3O4 (dFe3O4
0) in the case of 20Fe/AlSi
are smaller than average pore diameters of the support calculated from nitrogen desorption
86

branches (dpore). An interesting observation is that the dFe0 for the catalysts (20Fe/AlC and
20Fe/AlA) in which Fe interacted most strongly with the support (i.e. extent of reduction was
lowest)) were roughly 50-70% of their corresponding support pore diameters, while the catalysts
with higher extent of reduction (20Fe/AlG and 20Fe/AlSi) had crystallite diameters in the same
range of only 23-29% of their corresponding support pore diameter, which may indicate
relatively little agglomeration of primary iron particles to larger particles, even though dpore of
20Fe/AlSi is 25% larger than that of 20Fe/AIG. By increasing iron loading to 40% from 20%,
the estimated particle size (dFe0) for Fe/AlG was nearly doubled. In both carbided samples
(40Fe/AlG and 40Fe/AlSi), the dcrstlt for Fe5C2 was around 8 nm.
Figure 4.4. X-ray diffraction patterns of (a) reduced and (b) carbided catalysts.
That the average crystallite sizes calculated from XRD are lower than the average pore
diameters of their corresponding supports suggests that most of the crystallites are located inside
the pores.
(a) (b)
87

Table 4.2. Fe0, Fe3O4, Fe5C2 crystallite sizes estimated from XRD. Catalysts were reduced at 280°C in 10% H2/He for 10 h followed by 100% H2 for 6 h. 40Fe/AlG and 40Fe/AlSi were
carbided at 280°C for 10 h in H2/CO=1. Reduced and carbided samples were carefully passivated in 1% O2/He.
Catalyst XRD, nm
Reduced catalysts Carbided catalysts dFe0/dpore
Fe3O4 Fe0 Fe5C2 20Fe/AlG 5.6 0.31 40Fe/AlG 6.4 11.6 8.1 0.64 20Fe/AlA 8.0 0.50 20Fe/AlC 6.6 0.69 20Fe/AlSi 5.2 40Fe/AlSi 4.4 9.4 7.9 0.42
4.3.2 Catalyst reducibility
4.3.2.1 H2-Temperature programmed reduction (H2-TPR)
H2-TPR was used to investigate the effect of the different alumina materials and metal
loading on the reduction behavior of catalysts. As shown in Figure 4.5, the reduction process on
supported catalysts occurred in three stages. The first two peaks (below about 400°C) likely
indicate a two-step reduction of Fe2O3 to iron metal with intermediate iron oxides (Fe3O4, FeO).
The third stage which occurs at high temperatures is probably due to the presence of a surface Fe
aluminate.
Maximum reduction rate for the first reduction peak are centered between 217 and
250°C. The second stage of reduction is much slower on all six catalysts as indicated by lower
peak intensities. Extent of reduction (EOR) was determined by dividing the actual weight loss by
the theoretical weight loss corresponding to conversion of Fe2O3 to Fe and of CuO to Cu. Values
for EOR are reported in Table 4.3 for stage 1, stage 2, and overall reduction. For the low
temperature range (stage 1) they vary between 20.9 and 31.4% which is higher than the
88

theoretical value for reduction of Fe2O3 to Fe3O4 and CuO to Cu (14.8%) and lower than the
theoretical value for the reduction of metal oxides to FeO and Cu (36.1%). This suggests that
after stage 1 reduction (up to 280°C) the iron, on average, is reduced further than to Fe3O4, but
well short of being Fe metal (100%), and may well be a mixture of FeO and Fe3O4. The most
reduced of the six catalysts are 20Fe/AlG and 40Fe/AlSi.
Figure 4.5. TPR profiles of the supported iron catalysts.
The reduction process for the second stage is less than the theoretical value for FeO → Fe
(63.9%) and the overall (combined) reduction is significantly less than 100% for all catalysts
indicating none are close to being all Fe metal. Four of the catalysts have overall EOR’s in the
70-74% range. These values would be consistent with 40% FeO and 60% Fe metal. Among the
catalysts, 40Fe/AlSi has a sharp narrow peak for the first stage compared to broader peaks for the
other catalysts and its low-temperature reduction area shifted to 20°C lower and ends sooner with
increased Fe loading (from 20 to 40%). This shift was not seen for the AlG support. Lower
89

reduction temperatures imply easier reduction and weaker metal-support interactions. These TPR
results were consistent with the XRD results as indicated by the fact that the weight losses for the
first peak up to 280°C were between the amount required to go to Fe3O4 and FeO.
Table 4.3. Extents of Reduction determined from H2-TPR data.
Catalyst Extent of iron reduction1, % First stage Second stage Combined 20Fe/AlG 31.4 39.6 71.0 40Fe/AlG 20.9 34.1 55.0 20Fe/AlA 21.9 49.5 71.4 20Fe/AlC 28.4 23.3 51.7 20Fe/AlSi 24.9 49.5 74.4 40Fe/AlSi 30.4 39.8 70.2
a determined by dividing the actual weight loss by the theoretical weight loss corresponding to conversion of Fe2O3 to Fe and of CuO to Cu
Note : theoretical reduction from Fe2O3 to Fe3O4 and CuO to Cu is 14.8% theoretical reduction from Fe2O3 to FeO (and CuO to Cu) is 36%
4.3.2.2 Hydroxyl group measurement
The hydroxyl group contents of calcined alumina samples were determined using TGA.
Generally, during temperature-programmed heating of a high surface area oxide (e.g. alumina or
silica) in inert gas or vacuum, two mass loss events are observed: (1) removal of physisorbed
water at low temperatures and (2) removal of hydroxyl groups as water at high temperatures
[97]. As shown in Figure 4.6, the first step (removal of physisorbed water) is abrupt in the range
of 25-130°C. The second step, due to slow dehydration of alumina hydroxide, is observed by a
weight loss in the range of 130-1100 °C which occurs by the following reaction:
2Al(OH)3 → Al2O3 + 3H2O (4.1)
In this study, pre-calcined alumina samples (AlG, AlA, AlC at 700 °C and AlSi at 1100
°C) were heated from room temperature to 1100 °C in He flow and held for 2 h (Figure 4.6). As
observed in Figure 4.6, the weight loss curves for AlG and AlA follow similar trends, while that
90

for AlSi shows a mass loss up to 600 °C and becomes unchanged after 600 up to 1100 °C.
Among the samples, AlC had the highest rate of dehydration and dehydroxylation. After
reaching 1100 °C, there can be seen a constant decrease in mass for all the samples, although it
has a slower rate for AlC and AlSi. This constant rate loss might be attributed to the
dehydroxylation of final OH groups as the porous structure starts to collapse from the γ-alumina
phase to α-alumina.
Figure 4.6. Thermo gravimetric curves for dehydration and dehydroxylation of alumina samples. The samples were heated from room temperature to 1100°C in He flow and held for 2 h.
To deconvolute the peaks and distinguish between dehydration and dehydroxylation, we
ran another TGA experiment in which the temperature was held at 130°C for 2 h to desorb
physisorbed water from the alumina surface. The selection of 130°C for dehydration is in
agreement with the literature [97] where the desorption of water is claimed to be complete
between 100 – 130°C. The mass of the sample of this point after dehydration is designated as
W130.
91

The hydroxyl group content of the given support was then determined as moles of
hydroxyl removed per gram of alumina, as follows:
𝑛𝑛𝐶𝐶𝑂𝑂 = 2(W130 − W1100)𝑀𝑀𝑂𝑂2𝐶𝐶 × 100
(4.2)
where (W130– W1100) is the mass loss (wt%) occurring between 130°C and 1100°C. These weight
losses were used to determine moles of hydroxyls left per gram of alumina at some given
temperature above 130°C.
The physisorbed water content determined for W130 values and the total hydroxyl group
content of aluminas at 1100°C are presented in Table 4.4. The AlSi had the lowest OH group
content and that for AlC was the highest among the alumina samples. The greater the OH group
content, the higher amount of physisorbed water was found on the samples. This result is
consistent with the fact that alumina is hydrophilic in nature because of the presence of hydroxyl
groups on the surface [98].
Table 4.4. Concentrations of physisorbed water and OH groups for alumina samples.
AlG AlA AlC AlSi
Firsta mass loss, % 2.7 3.4 5.5 2.6 Secondb mass loss, % 3.6 3.9 5.1 2.4 Physisorbed water, mmol/gAl2O3 1.5 1.9 3.1 1.4 OH group content, mmol/gAl2O3 4.0 4.4 5.6 2.7
a weight loss up to 130°C b weight loss between 130 and 1100°C
4.3.2.3 Acidity measurements
The total acidity of the AlSi support at different calcination temperatures were
determined using NH3-TPD measurements. As shown in Figure 4.7, a dehydroxylation
temperature of 1100°C is very effective in removing most of the acidic sites on AlSi, i.e., the
92

acid site concentration is only 48 µmol/gcat compared to 162 and 236 µmol/gcat on AlSi calcined
at 900 and 700°C, respectively. Decreasing OH group content and acidic sites by calcining the
support material at high temperatures makes the surface of the alumina more hydrophobic, which
decreases the likelihood of further hydroxylation during catalyst preparation and FT reaction in
which water is formed [9, 99]. Another advantage of removing hydroxyl groups and acidic sites
by calcining at high temperatures is to reduce cracking to light hydrocarbons and formation of
methane via a formate species [100].
Figure 4.7. Ammonia-TPD measurements on AlSi calcined at 700, 900, and 1100°C demonstrating the reduction in acid sites as calcination temperature is increased.
4.3.2.4 Oxygen titration
The extent of reduction to iron metal (EOR) after hydrogen reduction at 280°C was
measured using oxygen titration, and the results are shown in Table 4.5. They range from 15 to
31% with the two AlSi supported catalysts showing two of the highest values. High EOR of
Fe/AlSi might be explained by the fact that the AlSi was calcined at higher temperature than the
other supports (1100°C vs. 700°C), which leads to lower hydroxyl groups on the alumina
93

surface. Surprisingly, 20Fe/AlG had the highest extent of reduction among supported catalysts
with 20% iron loading, although the support was calcined at 700°C. The EOR results are
consistent with the TPR, which showed lower reduction temperature for 20Fe/AlG and
40Fe/AlSi.
The EOR values measured in this study for the AlSi and AlG catalysts were higher than
those reported by Bukur and Sivaraj [18] on alumina- and silica-supported FeCuK catalysts after
reduction in H2 at about 400°C (19-26%), while they are lower than those for silica-supported
FePtK (EOR: 70% after reduction in H2 at 300°C) reported by Xu and Bartholomew [9].
However, the extent of reductions found by different techniques should be compared with care.
Borg et al. [101] reported significantly higher values for extent of reduction calculated from H2-
TPR than those from oxygen titration data on cobalt supported catalysts. They suggest that
oxidation of reduced catalysts with oxygen at 400°C is not complete. Therefore, for our
supported Fe catalysts, our oxygen titration measurements may be giving low values of EOR due
to oxidation of iron metal to Fe3O4, FeO or Fe2O3 or to a mixture of these, instead of all Fe2O3 as
is assumed in the calculation. Nevertheless, the results should be meaningful on a relative basis.
Table 4.5. Extent of reduction (EOR) to Fe metal determined from oxygen titration after reduction of each sample at 280°C with 10% H2/He in TGA.
Catalyst EORa, % 20Fe/AlG 30 40Fe/AlG 25 20Fe/AlA 16.3 20Fe/AlC 15 20Fe/AlSi 27 40Fe/AlSi 31
a 95% confidence interval was determined to be ± 2.3% of each EOR value
94

4.3.3 Catalyst carbiding
4.3.3.1 Syngas-TPR
Although H2-TPR provides useful information on the relative reducibility of the calcined
form of the different catalysts, it does not provide information on the reduction/carburization
process under actual pretreatment and FT conditions. In the latter case, the catalyst is exposed to
syngas to form iron carbides which are apparently the active phase in FT [7-9]. To estimate the
reduction/carburization behavior of our catalysts, we performed syngas-TPR on the calcined
catalysts. Figure 4.8 focuses in on the syngas-TPR profiles of the six supported iron catalysts of
this study; part (a) shows the profiles up to 350°C and inverts the spectra so that weight loss is
shown as positive peaks and part (b) shows the entire profiles up to 700°C, including large
weight gain between 350-700 °C. The observed weight changes under a H2/CO atmosphere are a
combination of several competing reactions including: (1) reduction of Fe2O3 to lower iron
oxides or iron metal; (2) carbiding of the iron oxides or iron metal to iron carbides (e.g. Fe5C2);
and (3) carbon deposition (carburization) by Boudouard reaction (2CO → C + CO2). Stage (1) is
weight losing and stage (2) can be weight losing or weight gaining depending on whether the
iron carbide is formed from Fe oxide or Fe metal; here the net change is weight losing for stage
2. Stage 3 is weight gaining due to carbon deposition. In Figure 4.8a, for most of the catalysts,
there are two peaks observed at low temperatures (150-220°C), attributed to reduction of Fe2O3
to lower iron oxides and a third peak (290-320°C) representing the carbiding step. The weight
losses per iron atom are shown in Table 4.6 for the reduction stage (first two peaks) and the
carbiding stage (third peak). For reference, 30% would signify complete reduction of Fe2O3 to
Fe0. The reduction peaks for 20Fe/AlG are narrower compared with broader peaks for 20Fe/AlSi
and 20Fe/AlC, which shows a facile reduction for 20Fe/AlG. The reduction of 20Fe/AlC is more
95

complete but also ends at high temperatures. The reduction on 20Fe/AlA is done sooner at
around 223°C, but it has lower weight loss than the other 20% iron catalysts. Both 40Fe/AlSi and
40Fe/AlG have lower reduction temperatures compared to their corresponding 20% Fe catalysts,
but the reduction peak area for 40Fe/AlG is nearly the same as 20Fe/AlG, which suggests lower
extent of reduction. 40Fe/AlSi has easier reduction/carbiding than 20Fe/AlSi as evidenced by
lower reduction/carbiding temperatures and sharper reduction peaks. Theoretical weight losses
for reduction of Fe2O3 to Fe3O4, FeO, Fe and iron carbide (χ-Fe5C2) are approximately: 3.3, 10,
30, and 24%, respectively. The experimental weight losses (9-28%) vary greatly but suggest all
samples are reduced to at least FeO on average (except 40Fe/AlG).
The data (Table 4.6) indicate that the carbiding of all catalysts was incomplete, since total
weight losses (reduction + carbiding) were less than 24%. The reduction starts at lower
temperatures in syngas-TPR compared with H2-TPR (Figure 4.5), which shows CO to be a more
effective reducing agent. These results, along with the H2-TPR results which suggested FeO as
an intermediate, are not inconsistent with the reduction/carbiding process under H2 and CO (1:1)
of Fe2O3 → FeO → iron carbide.
Table 4.6. Mass losses of reduction and carbiding stages as shown by syngas-TPR (Figure 4.8a).
Catalyst Mass loss per iron atom, % Reduction stage
(1) Carbiding stage (2)
Total (1) + (2)
20Fe/AlG 14.5 5.5 20.0 40Fe/AlG 6.2 4.6 10.8 20Fe/AlA 9.2 3.5 12.7 20Fe/AlC 14.3 2.8 17.1 20Fe/AlSi 10.2 4.8 15.0 40Fe/AlSi 7.5 4.4 11.9
96

Figure 4.8b shows that in the third stage, weight gained by carburization, there are very
large peaks around 460-480°C. This sudden increase in weight indicates that carbon deposition is
the dominate reaction after 330°C, and shows the carburization extent of these catalysts.
20Fe/AlC had the lowest weight gain, and 20Fe/AlG, 20Fe/AlSi and especially 40Fe/AlSi had
the highest gains. Weight gain on 40Fe/AlSi was twice that of all others. Zhang et al. [82]
performed CO-TPR on unsupported iron manganese promoted with Cu and K. Their results
show that their carburization peaks were only slightly larger than the reduction peaks, but in our
case, for our supported iron catalysts, the carburization peaks (stage 3, carbon deposition) were
5-10 times larger than the reduction peaks.
Figure 4.8. Syngas-TPR profile of the alumina supported iron catalysts (a) up to 350 °C and (b) up to 700°C. Profiles were obtained by ramping in 10% syngas/He (H2/CO=1) at 3 °C/min up to 700°C.
4.3.3.2 CO-chemisorption
CO chemisorption uptake data were obtained for each catalyst as an indication of their
active site densities. It is believed that iron carbide is the active site during FTS for iron catalysts
[9]; therefore, CO-uptake measurements were carried out on the carbided catalysts, and the
results are shown in Table 4.7. These range from 121-280 µmol/gcat for 20% Fe loading and 288-
97

355 µmol/gcat for 40% Fe loading, and show a trend of increasing uptake with increasing the
loading. Higher CO uptake for 20Fe/AlSi among 20% Fe catalysts implies having higher activity
as it has more iron carbide sites.
Table 4.7. CO-chemisorption of the carbided catalysts, following 10 h of syngas at 280°C in TGA.
Catalyst CO uptake, 𝜇𝜇mol/ga
20Fe/AlG 204 40Fe/AlG 262 20Fe/AlA 176 20Fe/AlC 121 20Fe/AlSi 280 40Fe/AlSi 355
a per gram calcined catalyst
4.3.4 FTS performance
4.3.4.1 Activity and selectivity
Table 4.8 compares FTS performance including CO conversion, CO+ H2 conversion,
CO+H2 activity (reaction rate), selectivity, and productivity for the six alumina supported iron
catalysts of this study. All data were obtained at approximately the same differential reactor
conversion level (18-21%) and at 260 °C; therefore, measured values of activity and selectivity
are directly comparable. It is clear for these data that the support material does make a
difference, as the activities of the four catalysts at 20% Fe loading vary by over a factor of two
(63 – 133 mmol(CO+H2)/gcat/h). The catalyst supported on AlG (St. Gobein) and AlSi (BYU)
aluminas are the most active, whereas those on AlA (alfa-aesar) and AlC (BYU) are the least
active. The effect of increasing weight loading from 20 to 40% depends greatly on support: for
AlSi the activity on a per mass of catalyst basis increases by 20%, while for AlG the activity
98

decreased by ~ 16%. CO2 selectivity as an indicator of the extent of the water-gas shift reaction
is the highest for the AlG support and lowest for the AlSi support. Increasing iron loading tends
to increase the WGS activity, e.g. the CO2 selectivities are 30.8 and 38.1% for 20Fe/AlSi and
40Fe/AlSi, respectively. Steady-state methane selectivity is 11.2% on 20Fe/AlC compared to
15.5-17.3% on the other supports; however, the activity of 20Fe/AlC is also the lowest.
Accordingly, productivity of C3+ hydrocarbons is the lowest for 20Fe/AlC. It is the highest for
the 20Fe/AlG and the two AlSi, which are very similar (0.45-0.47 gHC/gcat/h).
Table 4.8. Performance of six catalysts of this study in fixed-bed reactor. T = 260 °C, H2/CO = 1, PH2
0 = 0.66 MPa, PCO0 = 0.66 MPa, Ptot = 2.2 MPa.a
Catalyst ID 20Fe/AlG 40Fe/AlG 20Fe/AlA 20Fe/AlC 20Fe/AlSi 40Fe/AlSi b Space velocity, Nl/gcat/h 22.5 22.3 15.0 10.4 22.4 22.0
Time on stream, h 95 126 177 95 149 246 CO conversion, % 20.9 18.7 19.2 21.3 18.6 20.2 (H2+CO) Conversion, % 20.7 17.3 20.4 22.1 21.7 20.7
Activity, mmol(CO+H2)/gcat/h 129.6 107.5 84.3 63.2 133.2 153.3
CO2 selectivity, % 39.5 42.7 38.7 34.7 30.8 38.1 H.C. selectivityc, % CH4 16.1 17.3 16.3 11.2 15.6 15.5 C3+ 76.5 75.1 73.9 83.2 76.7 76.0 Catalyst productivity, gHC/gcat/h 0.47 0.39 0.29 0.25 0.47 0.45
a All catalyst samples were 30/60 mesh. b This test was conducted at 256 °C, the activity was corrected to 260 °C using EA = 100 kJ/mol. c CO2-free basis.
4.3.4.2 Stability
Figure 4.9 shows changes in activity (mmol (CO+H2)/gcat/h) as a function of time on
stream up to between 250 and 700 hours for the six catalysts of this study for the common
particle size of 250 to 590 μm (30-60 mesh). It also shows the activity for another sample of
40Fe/AlSi with a smaller particle size of 125-177 μm (80-120 mesh). (Note there are some gaps
99

in the data in Figure 4.9 since the catalysts were being tested at different conditions to obtain
other data that are not shown.) Unsupported iron catalyst (FeCuKSiO2) was also prepared and
tested in this laboratory to compare with supported catalysts. The initial activities on these
catalysts were collected after activation, which took 60-100 hours. Most supported iron catalysts
had higher initial activity than FeCuKSiO2 except 20Fe/AlA and 20Fe/AlC. Except for Fe/AlSi,
Fe/alumina catalysts deactivated after the activation period. 20Fe/AlA started with higher
activity than 20Fe/AlC (62 vs. 40 mmol (CO+H2)/gcat/h), but the activity dropped to nearly the
same as 20Fe/AlC after 190 h on stream. Among the catalysts, 20Fe/AlA had the highest
deactivation rate after 190 h on stream with a 31% drop in activity followed by 20Fe/AlG with a
9% drop. Both catalysts reached steady-state after 130-190 h on stream. But the activity of
40Fe/AlG continues to decrease linearly at a deactivation rate of 6% even after 350 h on stream.
With the exception of Fe/AlSi catalysts, activity loss was least for 20Fe/AlC. On the other hand,
activity was observed to increase for both Fe/silica-doped alumina (AlSi) catalysts even after 700
h. Indeed the activity for 40Fe/AlSi (80/120) after 700 h was about 13% higher than its initial
activity. In addition, activities for 20Fe/AlSi and 40Fe/AlSi (30/60) followed the same stability
trends of increasing activity with time on stream; 20Fe/AlSi increased 12.8% in 700 h and the
40Fe/AlSi increased 7% in 470 h.
4.3.4.3 Catalyst particle size effect
As noted above, all catalysts were initially tested at a 30-60 mesh particle size (250-595
µm, average = 420 µm), but the 40Fe/AlSi was also tested at 80-120 mesh, (average = 150 µm)
to investigate the effect of pore diffusion resistance. It was not believed that there would be an
effect as the activation energy for the six Fe/alumina catalysts ranged from 110 to 145 kJ/mol,
which is larger than the value of 100 kJ/mol reported in previous literature [102]. Surprisingly,
100

activity increased about 30% (see Figure 4.9), and methane selectivity decreased slightly from
15.5 to 14.3% (compare to Table 4.8) as average catalyst particle size decreased by a factor of 3
from 420 to 150 µm. Also, the fact that the rate increase was only 30% with a decrease in
particle diameter of almost 3 times indicates a minimal and decreasing pore diffusion effect.
Figure 4.9. Catalyst stability with time on stream at 250°C, H2/CO:1, total pressure of 2.2 MPa, 30-60 mesh size except for the catalyst of highest rate.
4.3.4.4 Comparison to literature
It is instructive to compare the FTS performance of our best catalyst (40Fe/AlSi) with
results reported in the literature for other Fe based catalysts. To do so, a simple kinetic model
was used to estimate apparent first order reaction rate constants (1st order in H2 and zero order in
CO), which accounts for relatively moderate differences in total pressure, partial pressures, and
101

reactor type [18]. Figure 4.10 and Tables 4.9 and 4.10 compare the performance of the 40Fe/AlSi
(150 µm) catalyst with results reported previously for supported and unsupported Fe catalysts.
Previous to this work, it was generally observed that unsupported Fe catalysts are
significantly more active than supported Fe catalysts. The apparent rate constant (per gram of
catalyst) for our alumina-supported catalyst (40Fe/AlSi) is 3 times more active than the silica-
supported catalyst reported by Bukur et al., and 6-fold more active than their alumina-supported
(297 vs 51 mmol (H2+CO)/gcat/MPa/h). Moreover, the rate constant (per gram of catalyst) of our
40Fe/AlSi is nearly 10% higher than that of the most active unsupported catalyst of Bukur et al.;
i.e. 297 mmol (H2+CO)/gcat/MPa/h versus 269 mmol (H2+CO)/gcat/MPa/h, and 65% more active
on a per g Fe basis, i.e. 743 vs 450 mmol (H2+CO)/gFe/MPa/h. In addition, the catalyst
productivity is the same per gram catalyst and about 40% higher per g of Fe. The C3+ selectivity
on a CO2-free basis of the 40Fe/AlSi is slightly lower (86 vs 90%) since CH4+C2H6 selectivity is
higher (12.4 vs. 6.3%) for 40Fe/AlSi.
A comparison to Xu and Bartholomew [9] shows our CO depletion rates (-rCO) are about
six times those reported for their FePtK/SiO2, even though 40Fe/AlSi was tested at slightly lower
temperatures (260 vs. 265°C). Results from Mobil’s unsupported iron catalysts are also regarded
as one of the most successful runs in a slurry reactor. For essentially the same process conditions
of temperature and H2/CO, but higher pressure (2.2 vs. 1.5 MPa), our alumina-supported iron
catalyst is significantly more active than their unsupported iron catalyst (743 vs. 265 mmol
(CO+H2)/gFe/MPa/h). A recent test by the Davis group on an unsupported iron catalyst shows
higher productivity than our 40Fe/AlSi (0.72 vs. 0.50 gHC/gcat/h) [78]. Activity and productivity
comparisons are also made to other unsupported and supported catalysts in Figure 4.10 and
102

Tables 4.9 and 4.10 including comparisons to industrial catalyst from Ruhrchemie [84] as well as
academic catalysts from UC Berkeley [10] and U. Kentucky [17, 103].
Figure 4.10. Comparison of first order rate constants for various supported and unsupported iron catalysts at 260°C. The left axis in represents the rate constant per gram of catalyst (blue) and right axis is the rate constant per gram of Fe (red).
4.4 Discussion
The results of this work demonstrate for the first time the preparation of a supported Fe
catalyst of high activity and stability for Fischer-Tropsch Synthesis. This was made possible
through (1) use of a non-aqueous, wet slurry impregnation method which facilitates a uniform
spatial distribution of Fe, Cu, and K over the support while minimizing oxidation of the iron
precursor (details are reported in [79]); (2) incorporation of a silica-stabilized alumina support
(a) of high thermal stability enabling dehydroxylation of the support at a very high temperature
(1100 °C) which in turn prevents strong interaction of iron oxide with the oxide support thereby
facilitating Fe reduction to the carbide while preventing Fe-support compounds; (b) of large pore
volume, and pore diameter which facilitates incorporation of high Fe loadings (e.g. 40 wt.%)
103
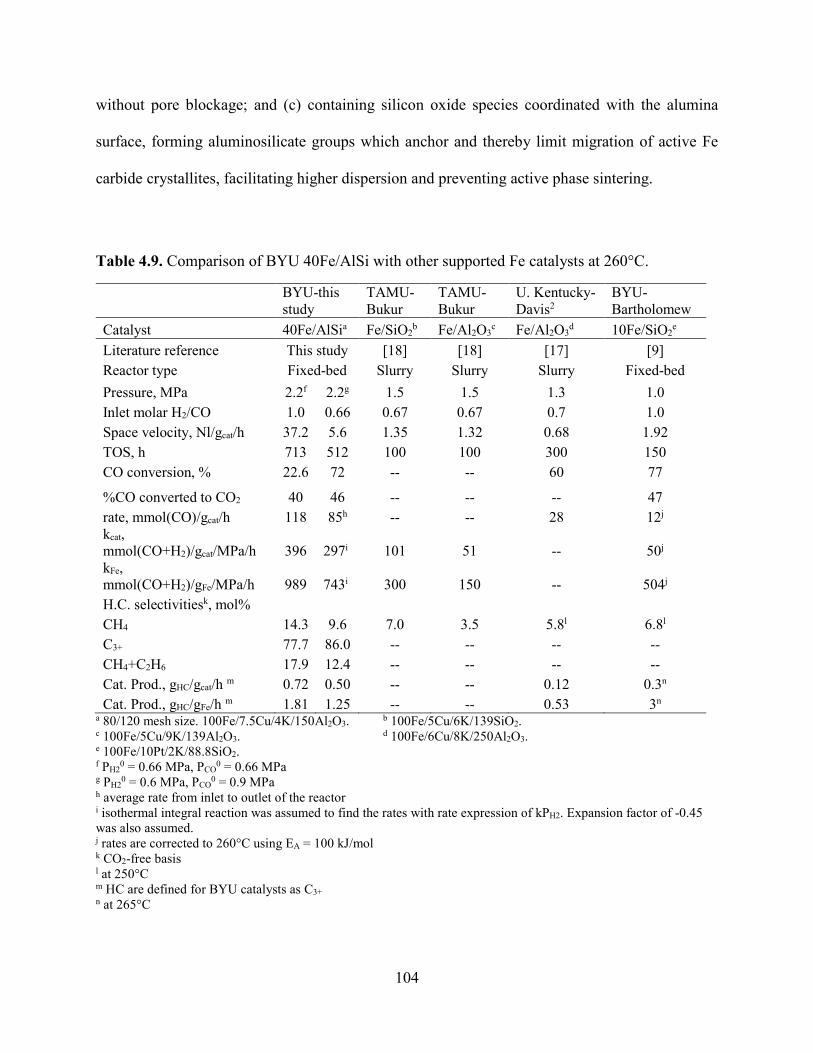
without pore blockage; and (c) containing silicon oxide species coordinated with the alumina
surface, forming aluminosilicate groups which anchor and thereby limit migration of active Fe
carbide crystallites, facilitating higher dispersion and preventing active phase sintering.
Table 4.9. Comparison of BYU 40Fe/AlSi with other supported Fe catalysts at 260°C.
BYU-this study
TAMU-Bukur
TAMU-Bukur
U. Kentucky-Davis2
BYU-Bartholomew
Catalyst 40Fe/AlSia Fe/SiO2b Fe/Al2O3
c Fe/Al2O3d 10Fe/SiO2
e
Literature reference This study [18] [18] [17] [9] Reactor type Fixed-bed Slurry Slurry Slurry Fixed-bed Pressure, MPa 2.2f 2.2g 1.5 1.5 1.3 1.0 Inlet molar H2/CO 1.0 0.66 0.67 0.67 0.7 1.0 Space velocity, Nl/gcat/h 37.2 5.6 1.35 1.32 0.68 1.92 TOS, h 713 512 100 100 300 150 CO conversion, % 22.6 72 -- -- 60 77
%CO converted to CO2 40 46 -- -- -- 47 rate, mmol(CO)/gcat/h 118 85h -- -- 28 12j
kcat, mmol(CO+H2)/gcat/MPa/h 396 297i 101 51 -- 50j
kFe, mmol(CO+H2)/gFe/MPa/h 989 743i 300 150 -- 504j
H.C. selectivitiesk, mol% CH4 14.3 9.6 7.0 3.5 5.8l 6.8l
C3+ 77.7 86.0 -- -- -- -- CH4+C2H6 17.9 12.4 -- -- -- -- Cat. Prod., gHC/gcat/h m 0.72 0.50 -- -- 0.12 0.3n
Cat. Prod., gHC/gFe/h m 1.81 1.25 -- -- 0.53 3n
a 80/120 mesh size. 100Fe/7.5Cu/4K/150Al2O3. b 100Fe/5Cu/6K/139SiO2. c 100Fe/5Cu/9K/139Al2O3. d 100Fe/6Cu/8K/250Al2O3. e 100Fe/10Pt/2K/88.8SiO2. f PH2
0 = 0.66 MPa, PCO0 = 0.66 MPa
g PH20 = 0.6 MPa, PCO
0 = 0.9 MPa h average rate from inlet to outlet of the reactor i isothermal integral reaction was assumed to find the rates with rate expression of kPH2. Expansion factor of -0.45 was also assumed. j rates are corrected to 260°C using EA = 100 kJ/mol k CO2-free basis l at 250°C m HC are defined for BYU catalysts as C3+ n at 265°C
104

Table 4.10. Comparison of BYU 40Fe/AlSi with unsupported Fe catalysts at 260°C.
BYU-this study
TAMU-Bukur
Kentucky-Davis
Berkeley-Iglesia Ruhrchemie Mobil
Catalyst 40Fe/AlSia Unsupp.b Unsupp.c Unsupp.d Unsupp.e Unsupp.
Literature reference This study [12] [78] [10] [84] [104] Reactor type Fixed-bed slurry slurry FB slurry slurry Run temperature, °C 260 260 260 260 235 260 257 Pressure, MPa 2.2f 2.2g 2.2 1.30 2.14 1.5 1.5 Inlet molar H2/CO 1 0.66 0.68 0.67 2.0 0.67 0.73
Space velocity, Nl/gcat/h 37.2 5.6 3.5 11.0 2.2 2.3h
TOS, h 713 512 314 86 475
CO conversion, % 22.6 72 84 79 51 66 90
rate, mmol(CO)/gcat/h 118 85i 76 38 34j
kcat, mmol(CO)/gcat/Mpa/h 194 184k 170 185l 97 kcat, mmol(CO+H2)/gcat/MPa/h 396 297k 269 155 kFe, mmol(CO+H2)/gFe/MPa/h 989 743k 450 290 265j
H.C. selectivitiesm, mol% CH4 14.3 9.6 2.6 5.3 2.3
C3+ 77.7 86.0 90.1 92
CH4+C2H6 17.9 12.4 6.3 5
Cat. Prod., gHC/gcat/h n 0.72 0.50 0.51 0.74 0.27 Cat. Prod., gHC/gFe/h n 1.81 1.25 0.86 1.22 0.51 0.44j
a 80/120 mesh size. 100Fe/7.5Cu/4K/150Al2O3. b 100Fe/3Cu/4K/16SiO2. c 100Fe/5.1Si/2Cu/3.0K. d Fe/Zn/K/Cu. e 100Fe/5Cu/4.2K/25SiO2. f PH2
0 = 0.66 MPa, PCO0 = 0.66 MPa
g PH20 = 0.6 MPa, PCO
0 = 0.9 MPa h Nl/gFe/h i average rate from inlet to outlet of the reactor j rates are corrected to 260°C using EA = 100 kJ/mol k isothermal integral reaction was assumed to find the rates with rate expression of kPH2. Expansion factor of -0.45 was also assumed. l rates are corrected to 260°C using EA = 100 kJ/mol m CO2-free basis n HC are defined for BYU catalysts as C3+
The results of this study provide new data and activity-structure correlations for six
Fe/K/Cu catalysts on four alumina supports, each having unique physical and chemical
105

properties and all of commercial or semi-commercial origin. Following discussion addresses the
effects on activity and stability of support properties, including physical properties, hydroxyl
group concentration, silica stabilizer, and Fe loading; it also includes an important correlation of
steady-state activity with CO adsorption on freshly carbided catalysts.
It should be emphasized that this study did not focus on selectivity or selectivity
correlations. The supported catalysts discussed have not yet been optimized for selectivity. The
authors acknowledge that the methane selectivity for the supported materials is undesirably high.
Thus, the clear need for further separate study to reduce methane selectivity for supported Fe
catalysts is recognized.
4.4.1 Effects of support pore size, pore volume, and CO uptake
Catalytic activity tests in this study were designed to measure intrinsic catalytic activity;
samples for testing were prepared as coarse powders (average diameter of 450 microns) which
according to our calculations and experience have adequately short paths for pore diffusion to
minimize pore diffusional resistance under typical reaction conditions for an iron catalyst of
typical activity. However, as previously mentioned (see section 3.4.3) the reaction rate of
40Fe/AlSi was sufficiently high that a 30% higher rate was observed on smaller (150 micron)
catalyst particles. Effects of pore diffusion on rate are likely to be proportionally smaller for the
other catalysts of lower activity. Moreover, a strong correlation of steady-state activity after
about 100 h of reaction with CO uptake for freshly carbided catalysts (shown later in the
discussion) suggests that initial steady-state rates, including 150 micron catalyst particles for the
unusually active 40Fe/AlSi, are close to intrinsic and hence largely free of a pore diffusional
disguise.
106

Our results (Figure 4.11) show intrinsic activity correlates positively with pore diameter;
a rough trend of increasing activity with increasing pore volume was also apparent (but is not
shown in this paper). Similar results were reported by Saib et al. [105] and Khodakov [106] for
cobalt/silica catalysts, i.e. the cobalt-time yield was enhanced by increasing the pore diameter up
to 35 nm [106]. Saib et al. [105] showed that extent of reduction of cobalt in Co/silica increases
with increasing pore diameter which appeared to translate to higher Co surface area. A similar
correlation from this study of Fe catalysts is presented in the following section. However, Xu et
al. [9] have shown that intrinsic activity does not correlate with the quantity of bulk carbide in
the working Fe catalyst.
Figure 4.11. Intrinsic activity as a function of average pore size of different aluminas used as catalytic supports. Note that the pore diameter value for AlSi of 25 nm was determined as an integrated average of the 2 major peaks in Figure 4.2.
It is also possible to correlate activity with chemisorbed uptakes of CO or H2 on the
active iron carbide phase. Indeed, a strong correlation of activity with CO uptake on carbided
107

samples is evident in Figure 4.12 for the six catalysts of this study. Our correlation between
active site density and FTS activity is consistent with Xu et al. [9], who correlated FTS activity
and H2 uptake on used, carbided samples.
Figure 4.12. FTS rate (rate of (CO+H2) Fe catalysts measured at 260 °C (time on stream ~ 90 h) as a function of CO uptake of freshly carbided catalysts (carbiding for 10 hours at 280 °C).
Thus, trends in initial steady-state intrinsic rates (Figures. 4.11 and 4.12) for our
supported Fe catalysts may be largely due to the extent of surface carbides formed during the
syngas carbiding processes which is likely to be affected by the extent of Fe oxide reduction in
the earlier H2 reduction step (addressed in the next section) and by support surface area, pore
diameter, and pore volume. That fouling and/or partial blockage of pores with inactive carbons
contributes to loss of activity of 40Fe/AlG is consistent with the limited capacity of the AlG
support due to a low pore volume to accommodate inactive carbons. This conclusion is
supported by syngas-TPR data in Figure 4.8b and extent of carburization data (Figure 4.13). For
example, Figure 4.13 shows a correlation between the extent of carburization found from the
third stage of syngas-TPR (Figure 4.8b) and pore diameter of the support. Large pore sizes
108

characteristic of Fe/AlSi facilitate the long-term accessibility of active sites inside the pores for
the reaction; moreover, a large pore volume provides more available space to accommodate
carbon depositing during the reaction and limits the possibility of pore blockage. This
phenomenon can be exacerbated if the active phase is not evenly distributed throughout the
pellet, e.g., is found close to the pore entrance. Thus, in small diameter pores, carbon could be
deposited at the pore entrance limiting access of the reactants. That pore blockage and lower
dispersion (typically observed at higher metal loadings) may be a problem in the 40Fe/AlG
relative to 20Fe/AlG is evident from the low values of CO uptake/%Fe ratios of 6.6 and 10.2
µmol/g-%, respectively. The absence of this problem can be inferred from Figure 4.13 showing
twice the extent of carburization for 40Fe/AlSi relative to 20Fe/AlSi, while on the other hand,
the inability to accommodate only slightly more carbon is apparent from the extent of
carburization for 40Fe/AlG compared with 20Fe/AlG.
4.4.2 Effects of hydroxyl group concentration
The results of this study provide evidence of correlations between hydroxyl group
concentration on the alumina surface, extent of reduction in H2, and activity. Figure 4.14a shows
a correlation of decreasing hydroxyl group concentration with increasing extent of reduction,
while Figure 4.14b shows a correlation of increasing catalytic activity with increasing extent of
reduction. These results imply that (1) a lower OH group content is associated with a higher
extent of reduction; i.e. a weaker metal oxide-support interaction, and that (2) a higher extent of
reduction is associated with higher catalyst activity. For example, as OH group concentration
decreases from 5.6 mmol/gAl2O3 for AlC to 2.7 mmol/gAl2O3 for 20Fe/AlSi, the extent of
reduction increases from 15% to 27% (20% Fe loading), and consequently activity is doubled
109

from 63.2 to 133 mmol(CO+H2)/gcat/h. Thus, it appears that a higher extent of reduction in H2
leads to higher surface carbide surface area during carbiding in syngas.
Figure 4.13. Extent of carburization found from the third stage of syngas-TPR (Figure 4.8b) as a function of pore diameter of the support. Note that the pore diameter value for AlSi of 25 nm was determined as an integrated average of the 2 major peaks in Figure 4.2.
This result is consistent with that of Rameswaran and Bartholomew [20], who reported
high dispersion of iron particles on dehydroxylated alumina associated with a higher TOF for
FTS. A study conducted by Brenner et al. [107] revealed that oxidation to Fe(III) occurs on the
OH groups of hydroxylated alumina, and therefore produces a high density of FeO crystallites
which are difficult to reduce and carbide. Based on their work and the results presented in this
study, it appears that the nucleation of FeO particles is favored on hydroxylated alumina surfaces
while highly reducible Fe2O3 and Fe3O4 clusters are formed in the near absence of surface OH
groups. Moreover, because FeO interacts strongly with the alumina supports, reduction in H2 and
110
or syngas is more difficult. Thus, 20Fe/AlA and 20Fe/AlC with higher concentrations of surface
hydroxyls have lower extents of reduction explaining in part their lower initial activities.
A positive correlation between catalyst activity and extent of reduction to Fe metal
following reduction in H2 is evident in Figure 4.14b. However, since the working catalyst in FTS
is Fe carbide, a correlation between extent of reduction and extent of carbiding would be more
meaningful. Extent of carbiding was calculated by dividing the observed mass loss for the
carbiding stage of syngas-TPR (stage 2 in Figure 4.8a and Table 4.6) by the theoretical mass loss
of 14% corresponding to the carbiding of FeO to Fe5C2. We assumed FeO to be a short-lived
intermediate phase for the reduction/carbiding process from Fe2O3 to Fe carbide. As shown in
Figure 4.14c, the extent of carbiding correlates linearly with extent of reduction. While this may
explain further the positive correlation between reaction rate and EOR in H2 in Figure 4.14b, the
most important correlation is activity versus chemisorption sites for the carbided catalyst shown
previously in Figure 4.12.
4.4.3 Effects of silica vs. lanthana stabilization of alumina support
Sintering has been reported as one of the deactivation pathways in FTS [88]. It is
characterized by the growth of active phase crystallites with an accompanying loss of catalytic
surface area. It has been shown in previous work [108] that small carbide crystallites are not
stable during FTS, especially at high conversions where water partial pressures are likely to be
high enough to oxidize iron carbide crystallites.
111

112

Figure 4.14. (a) EOR to Fe metal as a function of hydroxyl group content, (b) catalyst activity (rate of (CO+H2) at 260 °C) as a function of EOR, and (c) extent of carbiding found from syngas-TPR as a function of EOR.
The results of this work show that all catalysts supported on La-stabilized alumina
undergo significant deactivation (see Figure 4.9). This is more pronounced for 20Fe/AlA and
40Fe/AlG. On the other hand, iron catalysts supported on silica-doped alumina are very stable;
indeed, the activity of 40% Fe/AlSi increases up to 700 hours on stream. 20Fe/AlSi and
20Fe/AlG with nearly the same crystallite sizes (~ 5.5 nm) have initially about the same activity,
but 20Fe/AlSi is much more stable than 20Fe/AlG during FTS.
Silica-doped alumina, itself, has been shown to be inherently highly thermally and
hydrothermally stable. For example, Horiuchi et al. [109] reported that high surface areas and
pore volumes of supports containing 2.5-10% silica in alumina prepared by an aerogel method
were stable even following heating to 1300 °C in air. Their work also reveals that a monolayer of
silica may exist on the surface of alumina doped with 8% silica; however, Si atoms were also
detected in the bulk structure by 29Si NMR. This and other previous studies provide evidence that
113

cation vacancies in alumina are occupied by Si atoms, which suppress surface diffusion of Al
atoms at elevated temperatures. 27Al MAS NMR spectra of pure alumina and 5% silica doped
alumina (AlSi) samples show peaks at δ ~ +15, 40, and 75 ppm (Figure 4.15a). These peaks are
assigned to aluminum in octahedral, tetrahedral, and five coordinated environments, respectively
[110, 111]. These results show that the percent of tetrahedral Al in alumina with 0% silica and
5% silica is constant (Figure 4.15a). We believe that aluminum in tetrahedral sites is not replaced
by silicon as reported by Heemeier et al. [112], but rather Si enters the tetrahedral vacancies in
the defect spinel structure of alumina and forms a Si-Al spinel phase of high porosity and
structural stability. Alumina with silica wt%< 28 forms a Si-Al spinel structure [113]. 29Si MAS
NMR (Figure 4.14b) also shows a peak from -81 to 89 ppm which is attributed to Si(OAl)4 and
Si(OAl)3OH. No peak is observed at -110 ppm which is assigned to the separate SiO4 phase,
confirming that silicon ions form a Si-Al spinel phase and retard the alpha to gamma transition.
This suggests why AlSi maintains its structure to significantly higher temperatures than
conventional γ-aluminas. The inherent structural stability of this Si-doped alumina spinel
accounts for the enhanced support porosity and thermal/hydrothermal stability of the γ-Al2O3
phase at high temperatures, i.e. up to 1200 °C. The enhanced thermal and hydrothermal stability
of this support may explain in part the exceptional stability of Fe/AlSi catalysts.
114

Figure 4.15. (a) 27Al MAS NMR for pure alumina and 5 wt% BYU silica-doped alumina (AlSi) (b) 29Si MAS NMR and 29Si CPMAS for 5 wt% BYU silica-doped alumina (AlSi).
This high thermal stability of silica-doped alumina enables high temperature
dehydroxylation of the support, while maintaining the γ-Al2O3 structure with high surface area
and large pore volume and pore diameters. The other supports which have La2O3 as a stabilizer
exhibit faster transformation of γ-Al2O3 to α-Al2O3 as evidenced by faster rate of weight loss in
TGA experiments (Figure 4.6). Thus, they could not be dehydroxylated at 1100 °C like AlSi
which has silica as a stabilizer.
The stability of Fe/AlSi may also derive from the apparent relatively stronger interaction
of Fe carbide crystallites with the silica/alumina surface leading to a high resistance to sintering.
The small primary crystallite size of silica-doped alumina, estimated from XRD to be around 5
nm and its high surface area are consistent with a Si-Al spinel structure, a large fraction of which
115

resides on the surface. Since iron interacts relatively strongly with silica surfaces, Si-O or Si-O-
Al groups on the surface of said support could anchor iron carbide crystallites to the support
surface and prevent their migration and agglomeration associated with sintering [90, 114]. This
hypothesis is consistent with the work of van Steen’s group [114] who recently found that
surface silicate groups play an important role in inhibition of the sintering process. This
anchoring is consistent with slightly lower EOR for 20Fe/AlSi than 20Fe/AlG (30 vs. 27%);
however, the EOR is still higher than the other supports which had higher hydroxyl group
concentration. Thus, a higher dispersion of iron carbide particles on the dehydroxylated support
and the associated higher active site density serve to increase catalyst activity while the
silica/alumina support prevents sintering by anchoring Fe carbide crystallites to the silica-rich
surface.
Furthermore, Mogorsi et al. [114] found that surface silicate groups result in an increase
in the hydrogen availability on the surface by reducing the strength of CO adsorption. An
increased surface hydrogen will result in an increase in activity. This result is also consistent
with what we found for Fe/Si-Al2O3, which showed an enhanced activity compared with Fe/La-
Al2O3 as it has surface silicate groups.
4.5 Conclusions
Preparation and testing of six supported Fe FT catalysts using the same preparation
procedure but four different alumina materials and two different Fe weight loadings were carried
out to investigate the direct effects of support properties including physical properties, surface
chemistry, and use of SiO2 vs. La2O3 as a stabilizer on the performance of the catalysts.
116

(1) The data from this study demonstrate a strong relationship between the properties of the
starting support and the activity and stability of the final catalyst. The activity of four
20% Fe catalysts using different support materials vary by over a factor of two, the most
active being ~3 times more active and productive than Bukur’s silica supported Fe FT
catalyst. The stabilities of these catalysts are also very different. The activity of
20Fe/AlA dropped by 31% after 190 h on stream, while the activity of 20Fe/AlSi
increased by 13% after 700 h.
(2) Effects of Fe loading vary greatly depending on support pore sizes and pore volume.
The activity of Fe/AlG decreased by 17% when Fe loading was increased from 20 to
40% whereas the activity of Fe/AlSi with larger pore volumes and diameters increased
by 15%.
(3) Large pore volume and pore diameters of the support accommodate higher Fe loading
without pore blocking. This large pore volume may also help in uniform distribution of
the active phase into the pore and greater accessibility of the active phase to the
reactants. The correlation of higher carburization at higher loading for Fe/AlSi is
consistent with its larger pore volume which accommodates a greater amount of carbon.
A positive correlation between intrinsic activity and pore diameter of the support was
also found.
(4) Correlations are evident between OH groups removed from the support surface, extent
of reduction and activity. Higher calcination temperature of the AlSi support resulted in
greater removal of the hydroxyl groups and more effective reduction/carbiding (higher
EOR), which consequently lead to higher activity.
117

(5) Silica as a dopant in alumina improves performance in two ways: (a) it suppresses the
phase transformation of γ-Al2O3 to α-Al2O3 at elevated temperatures and thus it enables
effective dehydroxylation of the alumina surface at high temperatures, (b) it anchors the
active phase to the alumina surface and prevents active phase crystallites from
deactivation by sintering.
118

Chapter 5 Kinetics of Deactivation of Cobalt FT Catalysts by Carbon: Effects of CO and H2 Partial Pressures and Temperature
This chapter reports the effect of partial pressures of CO and H2 and temperature on the
deactivation by only carbon deposition in the absence of other forms of deactivation for the
cobalt FT catalyst. The freshly reduced and wax-extracted spent catalysts were characterized by
BET, XRD, H2-TPR, XPS, XAENS/EXAFS, TPH, CO-chemisorption, and EOR.
5.1 Introduction
Alumina supported cobalt catalysts are typically preferred for gas-to-liquid (GTL)
processes instead of iron catalysts because of their high hydrocarbon synthesis activity, low
water-gas shift activity, and high selectivity to linear paraffins [115]. However, over several
months (9-12 months) of operation expensive cobalt catalysts deactivate, losing up to 30-50%
activity with a similar drop in hydrocarbon productivity. Understanding causes/mechanisms of
deactivation is of great importance in maximizing catalyst life and improving FTS economics.
Proposed mechanisms for cobalt catalyst deactivation are (1) poisoning, (2) oxidation, (3)
cobalt-support interactions, (4) sintering of cobalt nanoparticles, and (5) carbon and heavy
hydrocarbon deposition [5, 35]. The latter two mechanisms have been shown to have the most
effect on Co FT catalysts, while the former three can be excluded as deactivation mechanisms for
commercial FT conditions [35]. For commercial conditions sintering of cobalt nanoparticles
usually occurs within the first 10-15 days on stream, but appears to be negligible after that [33].
119

By choosing the right experimental procedures, however, sintering of cobalt nanoparticles can be
limited to occur the first few hours on stream and then diminish [32, 116-118]. Thus, carbon
deposition is the mechanism that causes deactivation over the whole life cycle of Co FT catalysts
(9-12 months).
Menon [119] has classified FTS as a carbon insensitive reaction due to the presence of
high partial pressures of hydrogen during the FT reaction. However, Moodley et al. [48] have
shown that, over long periods of time, carbon deposits on the surface of the catalyst, forming
stable oligomeric and polymeric carbon that will not leave the surface of the catalyst at FTS
conditions. Carbon may (1) act as a poison by binding irreversibly to the catalyst surface and
blocking available active sites for reaction [28, 48, 49], (2) physically plug mesopores and
thereby decrease the accessibility of the reactants and products to the gas phase [28], (3) form
bulk cobalt carbide which can cause activity loss [120], (4) electronically inhibit the activity by
subsurface carbon [121], and (5) reconstruct the surface which may either increase or decrease
activity [40, 43, 58]. Bulk cobalt carbides are metastable during FTS and are apparently not
observed using XANES on wax protected cobalt catalysts after several months of FT reaction in
a slurry bubble column reactor [34]. However, their formation has been reported by other groups
using in situ [55] and synchrotron XRD [120]. Surface reconstruction could work as a
deactivation mechanism to form less active planar sites and also assist in the formation of the
active sites for FTS [35]. Carbon deposition and buildup appears to be one of the main reasons
for the deactivation of the catalyst over the full life of the catalyst [58]. While carbon is clearly
implicated in surface reconstruction and deactivation by poisoning and pore plugging, heavy
hydrocarbons (hard waxes, i.e. 50+ carbon atoms) have also been proposed to clog catalyst
pores. Niemela and Krause [122] have observed deactivation of Co/SiO2 due to the presence of
120

wax in the pores of the catalyst. Pennline and Pollack [123] showed that removing wax, by
Soxhlet extraction and hydrogen treatment, from deactivated cobalt catalysts supported on
zeolite, renewed the catalyst to be as active as a freshly reduced catalyst. Although regenerating
catalysts at low temperatures removes wax from the surface of the catalyst, hydrogen-resistant
carbon remains on the surface of the catalyst preventing catalysts from performing at original
values of productivity. Moodley et al. [48] carried out temperature-programmed hydrogenation
(TPH) of wax-extracted cobalt catalyst samples, removed from a 100 barrel/day slurry bubble
column FT reactor after they had been aged over a period of 6 months, to identify the type of
carbon species formed as a function of time on stream. They found that the fraction of more
reactive atomic carbon and wax diminishes over time, while more stable polymeric carbon
species are gradually formed and thought to cause the observed deactivation.
The effects of H2 and CO partial pressure on the deactivation by carbon of cobalt FT
catalysts have been examined in a few studies [31, 49, 124-126]. Moodley [4] used TPH to study
a 20 wt% Co/Pt/Al2O3 catalyst at low pressure FTS conditions (1 bar, 230°C) for only 3 h time
on stream (TOS) to determine the effects of different H2/CO ratios on formation of polymeric
carbon. Keeping the CO partial pressure constant, they found that lower H2/CO ratios produce
more stable polymeric carbon species. In view of the low pressure and TOS, these results may
have qualitative value but cannot be applied quantitatively to FTS at high pressure and long term
reaction.
Peña et al. [49] observed that a lower H2/CO ratio increases the amount of strongly
adsorbed hydrocarbons on a 15 wt% Co/Al2O3 in a continuously stirred tank reactor (20 bar,
220°C, XCO,t=0 = 30%), thereby blocking catalyst pores and contributing to a faster rate of
deactivation. By deconvolution of TPH profiles, they showed that the amount of polymeric
121

carbon did not change noticeably and; therefore, was not causing the deactivation. These
previous results agree with conventional wisdom, which holds that lower H2/CO causes faster
deactivation, since higher H2/CO ratio would more likely result in removing the carbon from the
surface by hydrogenation. For example, Dry [121] showed that a lower PH2/(PCO)2 ratio
increased the rate of carbon deposition for iron catalysts; the same concept could be applied for
cobalt catalysts as well. However, other studies have determined the opposite effect of this
conventional thought. Peña et al. [125] showed that a higher H2/CO ratio increased the rate of
deactivation on a 15 wt% Co/Al2O3 catalyst at high-temperature FTS conditions (230°C, 20 bar,
XCO,t=0 = 60-70%). Careful inspection of their TPH results showed that higher H2/CO ratio led to
higher amounts of polymeric carbon formation, which can cause the deactivation at a higher
H2/CO ratio. Peña et al. [49] also showed that high conversion (XCO = 70%) nearly doubles
carbon deposition (12.5 vs. 5.6 wt%) compared with lower conversion (both at H2/CO = 1). This
is not consistent with conventional wisdom, where higher XCO increases higher partial pressures
of H2O thereby gasifying the carbon and reversing carbon deposition [125].
Sintering, oxidation and formation of cobalt-support compounds are also observed at
higher H2/CO ratios and higher conversions. Bremaud et al. [124] observed a faster rate of
deactivation with an increase in H2/CO ratio, postulating that an increased H2/CO ratio would
form more water and thus lead to deactivation by oxidation. Sadeqzadeh et al. [31] showed as
well, using Co/Al2O3, that higher H2/CO ratios at constant gas flow rate increased the rate of
deactivation of the catalyst by sintering of cobalt crystallites. Also, Zhou et al. [126] found that
higher H2/CO ratios increase the rate of deactivation on Co/SiO2; from TPR and XPS data, they
postulated greater interaction between the support and the cobalt which forms Co silicate at
higher H2/CO ratios. At high conversion (XCO = 80.1%), Tavasoli et al. [54] observed
122

deactivation by cobalt aluminate formation, confirmed by TPR and XRD. Thus, it appears that
sintering or cobalt-support compound formation can seriously complicate studies of deactivation
by carbon.
Just as different partial pressures affect deactivation rate, different operating temperatures
also affect the deactivation of the catalyst in FTS. Moodley’s work [4] on the effect of
temperature on cobalt catalysts indicates that increasing temperature increases the rate of
deactivation. His work was done using a 20 wt% Co/Pt/Al2O3 at temperatures of 240, 260, and
270°C at H2/CO: 1.6 and 20 bar. Sadeqzadeh et al. [127] showed that increasing the temperature
from 220°C to 240°C increases the rate of deactivation for 25 wt% Co/Pt/Al2O3 at H2/CO: 2, 20
bar, and XCO = 60-70%. In contrast to other studies [4, 127], Ma et al. [128] found that
deactivation rate decreases with temperature for 25 wt% Co/Ru/Al2O3 catalyst at 2.5 MPa,
H2/CO: 2.1, and XCO ≤ 60%, possibly due to a more stable catalytic structure at higher
temperatures.
To summarize, the previous studies show contradictory effects, e.g. that both higher and
lower H2/CO ratios result in faster deactivation due to the formation of carbon, cobalt-aluminate,
and/or sintering. Further, these forms of deactivation were not, in general, studied separately. In
addition, these studies varied CO and H2 partial pressures together rather than separately;
therefore, it is not possible to understand the individual effects H2 and CO partial pressures on
Co FT catalyst deactivation. Thus, there are no previous systematic studies of the effects of
partial pressures of H2 and CO on long-term deactivation by carbon deposition for Co FT
catalysts in the absence of other forms of deactivation. In addition, there are only a few studies
for the effect of temperature on deactivation by carbon [4, 127, 128]; and their conclusions are
123

contradictory concluding that increasing the operating temperature can both decrease and
increase deactivation for Co FTS.
Consequently, the purpose of the current study was to investigate, systematically, the
effects of H2 and CO partial pressures and temperature on the deactivation of Co FT catalysts by
carbon. Eleven deactivation runs (as well as a repeat run) at 220-250°C and 20 bar were
completed in a FB reactor each for 700-900 h time on stream (TOS), changing the partial
pressure of H2, CO or temperature, while keeping the other parameters constant. This study
provides, for the first time, new data defining quantitatively the long-term deactivation by carbon
for cobalt FT catalysts in the absence of the other deactivation mechanisms. Sintering was
eliminated through design of a catalyst with relatively large Co crystallites and a very stable
support; plugging of pores by heavy waxy hydrocarbon was avoided by using a large pore
support; and both H2O-assisted sintering and formation of cobalt-support compounds were
eliminated by operating at lower conversions (lower partial pressures of H2O). The data and
perspectives gathered from this study should enable operation at substantially lower rates of
deactivation and provide the possibility of significantly increasing catalyst life.
5.2 Experimental
5.2.1 Catalyst preparation
The 25 wt% Co/ 0.25 wt% Pt/Al2O3 catalyst used for all the deactivation tests for this
study was prepared with silica-doped alumina support (calcined at 1100°C prior to impregnation)
and reduced in H2 at 450°C for 72 h as described in Chapter 2. This high reduction temperature
124

was purposefully selected to have large cobalt crystallites and slow down sintering as a
deactivation mechanism.
5.2.2 Reference catalysts (Ref. catalysts)
In order to understand the type of carbon species binding to the surface of our catalysts,
four reference catalysts were prepared and pretreated in CO at specific conditions which enabled
specific carbonaceous species to form on the surface of the catalyst as previously described by
Moodley et al. [48].
The unsupported Co and CoPt and supported CoPt/Al2O3 catalysts were reduced in
flowing 50% H2 (balance He), while ramping at a rate of 1 °C/min from room temperature to
450°C, then holding for 6 h. After reduction, the temperature was lowered to 430°C and the
catalyst was purged in He for 90 min. The temperature was then lowered to the desired reaction
temperature (250°C for Co, CoPt, CoPt/Al2O3 and 350°C for CoPt/Al2O3), where the catalyst
was treated in CO for 16 h as summarized in Table 5.1. The temperature was then lowered in He
until reaching room temperature, then the catalyst was passivated in 1% O2 (balance He).
Table 5.1. Reference catalysts and CO exposure temperatures.
Ref. Catalyst CO exposure temp, °C 1 CoPt/Al2O3 250 2 CoPt 250 3 Co 250 4 CoPt/Al2O3 350
125

5.2.3 Activity and selectivity measurements
Fischer-Tropsch Synthesis (FTS) was conducted in a fixed-bed reactor (stainless steel,
3/8 inch OD) described previously [80]. Each sample (0.20 g, 63-90 µm) was diluted with 2 g
silicon carbide to improve isothermality in the catalytic zone.
Before FTS, the passivated catalysts were re-reduced in situ up to 450°C for 6 h in 100%
H2. After cooling to 150°C, the system was then pressurized to 20 bar in syngas (H2/CO = 2, 10
bar H2, 5 bar CO, balance He), and the temperature was slowly ramped from 150°C to 220-250°C
for 48-72 h to gradually fill up the pores and prevent runaway reaction with a target CO
conversion level of ~50% at the final temperature for the run. The partial pressures were then
adjusted to the desired partial pressures for the run and the total flowrate was increased to give a
CO conversion of less than 25% which was used for all runs to favor carbon deposition and
lower partial pressures of water. Activity and stability data were then obtained over the next 700-
900 hours as inlet partial pressures and temperature remained constant.
After leaving the reactor, the exit gas and liquid effluent passed through a hot trap
(~90°C) and a cold trap (~0°C) to collect heavy hydrocarbons and liquid products. The effluent
gaseous product was analyzed using an HP5890 gas chromatograph equipped with a thermal
conductivity detector and 60/80 carboxene-1000 column. CO conversion and selectivities were
determined with the aid of an Ar tracer. The gas chromatograph was calibrated only for
hydrocarbons CH4 and C2H6; therefore, selectivities of C3+ rather than C5
+ were determined in
this study.
After the catalytic test, each of the catalysts was covered by wax produced during the
fixed bed test and transported to a wax extraction system as described in section 2.3.3.
126

5.2.4 Catalyst characterization
Several characterization techniques were used in this study including: BET, XRD, H2-
TPR, XANES/EXAFS, XPS, TPH, EOR, and CO-uptake. These techniques were fully explained
in Chapter 2. In addition to the calculation of EOR from oxygen titration (see section 2.2.3.3) it
was also determined from TPR experiments. Passivated, reduced samples were re-reduced up to
800°C in the TGA, and any weight loss occurred after 450°C, which was the bulk reduction
temperature, was used in the calculation to find the weight of unreduced cobalt.
H2-uptake was measured by TPD for the freshly reduced catalyst and found to be 175
µmol/g and it was carried out at University of Kentucky Center for Applied Energy Research
(CAER). H2-uptake measurement (purging step at room temperature) was done at. CO-uptake for
the freshly reduced catalysts was 227 µmol/g giving a surface CO/Co ratio of 0.62, assuming a
surface H/Co ratio of one. The H2-uptake for the freshly reduced catalyst was used in
combination with the EOR to calculate Co dispersion, site density, and Co crystallite size. CO-
uptakes were measured for spent catalysts and compared with the CO-uptake of the fresh
catalyst.
5.3 Results
5.3.1 Reference catalysts (Ref. catalysts)
The three Ref. catalysts described in section 5.2.2 (alumina supported CoPt, unsupported
CoPt, and unsupported Co) were reduced in 50% H2 (balance He) at 450°C for 6 h, and purged at
430°C in He for 90 minutes. The sample temperature was then lowered to 250°C (for samples of
all three catalysts) and 350°C for a second sample of CoPt/Al2O3 catalyst, exposed to flowing
127

CO for 16 h, cooled to room temperature, and passivated in 1% O2/He. Several tests (TPH, XRD,
XPS, BET) were subsequently conducted on these four reference catalysts (Ref.). The TPH
results are displayed in Figure 5.1. TPH profiles of Refs. 1-3 consist mainly of low and medium
temperature peaks around 215-280 and 430-490°C, which can be assigned to cobalt carbide and
polymeric carbon, respectively (two carbide peaks in the case of Ref. 2). Presence of the carbide
was further confirmed by XRD (not shown here) and XPS (Figure 5.2) on Ref. 1-3. The Ref. 4
TPH profile consists of a single high-temperature (HT) peak at 560°C which can be associated
with graphitic carbon (very small HT peaks are observed for the Ref. 3).
XPS was used to determine type of carbon on the surface of these Refs. and C 1s XPS
signals are shown in Figure 5.2. A very low-intense C 1s peak at 284.5 eV is observed for
passivated freshly reduced catalyst which was not covered with wax nor exposed to FTS
probably due to carbon contamination inside the XPS chamber or from the supporting
conducting carbon tape [49]. The XPS spectrum for the freshly reduced wax-extracted catalyst
exhibited a peak at 284.9 eV, which corresponds to –CH2-CH2– molecular fragments [23].
According to literature, the peak at ~284.5 eV for Refs. 1 and 2 (supported and unsupported
Pt/Co treated at 250°C) can be attributed to polymeric carbon [40, 49]. The XPS C 1s spectrum
of Ref. 4 (supported Pt/Co treated at 350°C) displayed an intense peak at 283.5 eV, which can be
assigned to graphitic carbon. Thus, there is a clear distinction from XPS (283.5 vs 284.5 eV)
between graphitic carbon formed at 350°C and polymeric carbon formed at 250°C. The higher
intensity of the graphitic carbon peak in Ref. 4 compared to the peak for polymeric carbon in
Ref. 1 shows much larger quantity (> 20 x) of deposited carbon consistent with the higher
intensity of TPH profile for Ref. 4. Although a higher binding energy for graphitic carbon at low
coverage is expected, the observed lower binding energy of graphitic carbon compared to
128

polymeric carbon in this study can be explained by differential sample charging due to a higher
coverage of carbon overlaying a conducting layer.
Comparison of the TPH profiles for Refs. 1-3 allows us to understand the effects of the
alumina support and Pt promoter on the binding strength of carbon to the surface of the catalyst:
(1) a lower peak temperature of 428°C for Ref. 2 vs. 490°C for Ref. 1 indicates that polymeric
carbon is more resistant to hydrogenation on supported CoPt (Ref. 1) than on unsupported CoPt
(Ref. 2) and (2) polymeric carbon is more stable in the absence of Pt as evidenced by the higher
peak temperature for Co (Ref. 3) vs. CoPt (Ref. 2); Moreover, reactive atomic carbon (LT peak)
is predominant for CoPt (Reference 2) relative to Co (Ref. 3), while on Co (Ref. 3) polymeric
carbon dominates the surface.
Figure 5.1. TPH profiles of reference catalysts (Refs. 1-4).
129

Figure 5.2. XPS spectra of the C 1s region for Ref. catalysts.
5.3.2 FTS performance with time
Eleven samples of a 25 wt% CoPt/Al2O3 were tested over a period of 800 hours, each at a
different set of CO and H2 partial pressures and temperature (220-250°C) while inlet flowrates
were held constant. Each catalyst sample was activated at reaction temperature, 20 bar, H2/CO =
2, and XCO = 50% for 70 h. At 70 h TOS PH2, PCO and total flowrate were adjusted to the desired
partial pressures and ~ 20% CO conversion and the system was allowed to come to steady-state
within 100 h TOS. Initial steady-state activity and selectivity data at 100 h are reported in Table
5.2. The catalyst activity shown for Run 3 at standard conditions (H2/CO = 2, 230°C, 20 bar) of
58.4 mmol/gcat/h is 70% higher than a value of 34.8 mmol/gcat/h reported by Pena et al. [125] for
a similar Co catalyst at nearly the same process conditions. As seen from the data in Table 5.2
130

initial activity of our catalyst, increases with increasing partial pressure of hydrogen and
decreases with increasing partial pressure of CO. Moreover, at higher H2/CO ratios higher
productivities and higher methane selectivities are observed. For example, the methane
selectivity dropped from 14.0 to 4.2% when H2/CO decreased from 2 to 1 at 220°C. Also, as
temperature increases CH4 selectivity and the rate increase and C3+ decreases.
Table 5.2. Catalyst performance at ~100 h TOS for 25 wt% CoPt/Al2O3 at different partial pressures of H2 and CO at 230-250 °C and 20 bar.
Run
Temp., °C
PH2, bar
PCO, bar
H2/CO
Rate, mmol/gcat/ha
XCOa ,
%
Productivityb, gHC/gcat/h
H.C. Selectivityc, %
CH4 C2 C3+
1 230 5 5 1 34.4 16.2 0.42 9.8 1.1 86.5
2 230 15 5 3 81.6 22.9 0.89 20.6 1.9 77.1
3 230 10 5 2 58.4 21.2 0.67 15.4 1.8 81.8
4 230 10 7.3 1.4 44.6 22 0.52 13.1 1.7 83.5
5 230 10 10 1 37.8 20.5 0.47 7.35 1.8 88.6 5-
repeat 230 10 10 1 34.9 21.5 0.42 8.9 2.7 85.3
6 240 10 5 2 92.7 24 1.03 18 2.2 78.8
7 250 10 5 2 244 24 2.54 21.2 3.4 73.7
8 240 5 5 1 41.4 20.5 0.48 11.1 2.1 82.7
9 250 10 10 1 78.7 19.2 0.96 9.4 1 86.8
10 220 10 5 2 33.0 22.1 0.33 14.0 1.6 83.6
11 220 10 10 1 22.5 21.4 0.25 4.2 1.0 92.8 a CO conversion b Productivity is defined as C3
+
c Hydrocarbon selectivity
Starting at 100 h, rate data and hydrocarbon selectivities were measured over 700 h to
determine deactivation rates. Relative or normalized activity (activity of the catalyst at time t
131

divided by the activity of the given catalyst) versus time on stream is reported in Figure 5.3.
Each test was conducted at about 20% (± 4%) CO conversion and hence a low partial pressure of
H2O, thereby minimizing Co-support spinel formation. Oxidation of small Co crystallites or
H2O-assisted sintering was not observed due to the high reduction temperature and large Co
crystallite sizes used. Run 5 (PH2 = PCO = 10 bar) was repeated to check the reproducibility of the
FB deactivation runs as shown in Figure 5.4. After the initial activation period, the CO
conversion of both runs followed the same trend of deactivation for 700 h, confirming the
reproducibility of our tests. At 230°C, the highest rates of deactivation were observed in Runs 2
and 5, involving the highest and lowest H2/CO ratios of this study (Run 2: H2/CO = 3; Run 5:
H2/CO = 1). The result for Run 2 was unexpected, since we had supposed that deactivation rate
would be lower for a higher H2/CO ratio (this phenomenon will be discussed later). Surprisingly,
the lowest rate of deactivation was observed in Run 1, for which the H2/CO ratio was the same as
in Run 5 but partial pressures were lower (i.e., in Run 1, PH2 = PCO = 5 bar).
Relative activities versus TOS at different temperatures are shown in Figures 5.3b and
5.3c. Figure 5.3b compares the effect of temperature on deactivation rate at H2/CO of 2. It is
clear that deactivation rate increases with temperature at PCO of 5 bar and H2/CO of 2. When
comparing Run 1 and Run 8 (PH2 = 5 bar; PCO = 5 bar) in Figure 5.3c, the deactivation rate, again
increases with increasing temperature; however, this is not the case for Runs 5, 9, and 11 (PH2 =
PCO = 10 bar), where deactivation rate decreases with increasing temperature.
132

Figure 5.3. Relative activity vs. time for 25 wt% CoPt/Al2O3 at (a) Runs 1-5; all at 230°C, (b) Runs 3, 6, 7, and 10; all at PH2 = 10 bar and PCO = 5 bar, and (c) Runs 1, 5, 8, 9, 11; all at H2/CO of 1.
133

Figure 5.4. CO conversion of FB run (Run 5) and repeated FB run (Run 5-repeat) at 230°C, 20 bar, PH2=10 = PCO = 10 bar.
Methane selectivity remained constant with TOS in Runs 1-3, 6-8, and 10 (Figure 5.5e);
however, in Runs 4 (Figure 5.5a), 5 (Figure 5.5b), 9 (Figure 5.5c), and 11 (Figure 5.5d) all at
higher partial pressures of CO (Run 4 at PCO = 7.3 bar, other at PCO = 10 bar), a trend of
increasing CH4 selectivity is observed over 600-800 h. This result is consistent with Peña et al.
[125], who only observed an increase in CH4 selectivity at high partial pressures of CO as CO
conversion decreased due to deactivation by carbon. Productivities for Runs 1-3, 6-8, and 10
were observed to decrease proportional to the decrease in rate; however, decreases in
productivity for Runs 4, 5, 9, 11, as shown in Figure 5.5 due to both deteriorating selectivity and
decreasing rate, since both the rate and methane selectivity are changing as the catalyst
deactivates.
134

135

136

Figure 5.5. Productivity and methane selectivity of (a) Run 4 (PH2=10 bar, PCO=7.3 bar) (b) Run 5 (PH2=10 bar, PCO=10 bar) at 230°C and 20 bar, (c) Run 9 (PH2=10 bar, PCO=10 bar) at 250°C and 20 bar, and (d) Run 11 (PH2=10 bar, PCO=10 bar) at 220°C and 20 bar and (e) methane selectivity of other runs showing relatively constant methane selectivity over 800 – 900 h.
5.3.3 Nitrogen adsorption/desorption
Through the use of nitrogen adsorption/desorption BET surface area, average pore
diameters, and pore volume of the reduced catalyst, Refs., and each of the wax-extracted spent
catalysts were determined using a new slab pore model and method proposed by Huang et al.
[65] and modified to fit a log-normal PSD [66]. These data are summarized in Table 5.3. A broad
bimodal pore size distribution was found for the freshly reduced catalyst with the first and
second peaks centered at 12.6 and 40.2 nm, respectively. The freshly reduced wax-extracted
catalyst was also tested to determine the effect of residual wax on the BET, indicating that (1) the
BET surface area was within experimental error of the freshly reduced catalyst and (2) that the
total pore volume was only slightly lower (6%) than the freshly reduced catalyst. The BET
results of the Refs. indicate that polymeric carbon (Ref. 1) decreases both surface area and total
pore volume by 16 and 20%, respectively, while graphitic carbon (Ref. 4) causes a significant
137

increase in surface area (Table 5.3) relative to the reduced catalyst, probably because of the large
surface area of graphitic carbon. It appears that graphitic carbon forms in the larger pore
diameters of the catalyst since the second pore diameter peak for the reduced catalyst dropped
from 40.2 to 16.4 nm. Nevertheless, the catalyst still has a higher pore volume than Ref. 1
(polymeric carbon).
After FT reaction at different process conditions, the surface area and pore volume of the
catalyst samples after wax-extraction decreased by 0 - 27% and 15 - 25%, respectively. Among
the catalysts at 230°C, the lowest surface area was found for Run 5 which had high partial
pressures of H2 and CO (PCO = PH2 = 10) but a H2/CO ratio of 1. In addition at 230°C, the lowest
pore volume was for Runs 1 and 5 (H2/CO = 1); however, the highest pore volume was for Run 2
with higher H2/CO (H2/CO = 3). Total pore volume and surface area, on average, are lowest on
catalysts tested at 240°C and highest on catalysts tested at 250°C. The differences in terms of
pore volume and BET surface seem to be significant because they are outside the confidence
intervals as shown with the freshly reduced catalyst.
138

Table 5.3. Surface area, pore volume, and pore diameter of freshly reduced, Refs., and FB wax-extracted spent catalysts.
Catalyst (T - PH2/PCO)
BET Surface Area, m2/g
Average Pore Diameter, nm
Total Pore Volume, cm3/g
Peak 1 Peak 2 Reduceda 111± 5.8b 12.6 40.2 0.639 ± .0180b
Reduced Wax-Extractedc 106 14.3 38.6 0.603
Ref. 1d 97 14.4 38.3 0.521
Ref. 4e 152 12.1 16.4 0.56 Run1
(230°C - 5/5) 95 13.4 40.2 0.487
Run 2 (230°C - 15/5) 94 14.4 40.2 0.54
Run 3 (230°C - 10/5) 111 14.3 36.3 0.516
Run 4 (230°C - 10/7.3) 93 12.8 38.2 0.522
Run 5 (230°C - 10/10) 81 13.2 36.3 0.499
Run 6 (240°C - 10/5) 101 13.8 34.6 0.503
Run 7 (250°C - 10/5) 103 12.9 44.4 0.511
Run 8 (240°C - 5/5) 85 12.8 32.9 0.478
Run 9 (250°C - 10/10) 92 13.9 36.4 0.501
a Freshly reduced sample without wax b 95% Confidence Interval found using Student’s t-test with 3 degrees of freedom
c Freshly reduced wax-extracted sample d Ref. 1 is Pt/Co/Al2O3 treated in CO at 250°C e Ref. 4 is Pt/Co/Al2O3 treated in CO at 350°C
5.3.4 X-ray diffraction (XRD)
XRD measurements were conducted for the catalysts before and after the FT reaction and
compared against standards as shown in Figure 5.6. Each scan of the wax extracted catalysts
compares very well to the freshly reduced catalyst, showing mainly the presence of cobalt and
139

the alumina support. A small peak for Co3O4 at 2θ = 36.9° is present for all samples, including
the calcined sample, except for Run 4. Thus, Co3O4 is apparently present in the passivated
samples (except for Run 4), although other workers have assigned this peak to CoO after
passivation [48, 49]. No peaks are apparent where the most intense (2θ = 36.5°) line for bulk
CoO is expected, even though 8.8% of the bulk cobalt is estimated to be present as CoO after
reduction in hydrogen (see section 5.3.9). By assuming passivation would oxidize the first three
monolayers of Co, Co3O4 was estimated to be present with 334 μmol Co3O4/gcat, while CoO
would only be present with 250 μmol CoO/gcat. Unreduced CoO is typically present as a surface
CoAl2O4 spinel (observed by TPR) which is indistinguishable from the Al2O3 support [129].
Bulk cobalt carbide (Co2C) also appears to be absent from the wax-extracted catalysts even
under hydrogen poor conditions (H2/CO=1, Runs 1, 5, 8, and 9), which is consistent with Peña et
al. [49] and Moodley et al. [48]; however, this does not necessarily indicate that bulk cobalt
carbide does not exist on the catalyst because it is rarely seen by ex situ characterizations [56].
Using the Scherrer equation, the average cobalt metal crystallite diameter of the freshly reduced
catalyst and wax-extracted FB catalysts after 700-800 h TOS was estimated to be about 12 nm
indicating that sintering did not occur (determined using 2θ = 44.3°). The XRD profiles (not
displayed) for the wax-extracted spent FB catalyst samples tested at different temperatures are
the same as the samples tested at 230°C meaning no cobalt carbide was found and the estimated
cobalt crystallite size was found to be ~12 nm.
140

Figure 5.6. X-Ray diffraction of, FB wax-extracted catalysts, calcined catalyst, freshly reduced catalyst, and ICDD standards.
5.3.5 Temperature programmed reduction (TPR)
The nine wax-extracted spent catalysts were tested using H2-TPR to determine formation
of cobalt aluminate and different carbon species on the surface. The calcined catalyst was used as
a Ref. to determine the peak position and extent of cobalt aluminate formation. As can be seen in
Figure 5.7, there are three significant peaks but four stages of mass loss in the calcined catalyst:
(1) transformation of bulk Co3O4 to bulk CoO indicated by two peaks below 200 °C (the first of
which is probably due to reduction of Co in the near vicinity of Pt), (2) reduction of bulk CoO to
Co occurring at 330°C (3) progressive reduction from 400 to about 535°C of strongly bound
CoO (to Al2O3), and (4) reduction of cobalt aluminate to cobalt metal at 560°C. From the relative
peak areas, about 3% of the cobalt in the calcined sample is present as aluminate. This cobalt
aluminate peak is also present in the spent catalysts (Runs 1-5) but to a greater extent than in the
calcined catalyst. Cobalt aluminate formation is 6 - 7 wt% of the cobalt for Runs 1-5 if the peak
141

areas are compared to that for the calcined catalyst. The other peaks on the wax-extracted spent
catalysts cannot be compared to the peaks found on the calcined catalyst, since the peaks on the
calcined catalyst show the weight loss of oxygen due to reduction of Co3O4 to Co.
There appears to be additional stages of mass loss in each of the wax-extracted spent
catalysts besides the cobalt aluminate peak. These stages of mass loss, occurring at temperatures
of about 180, 230, and 420, could be assigned to residual wax and/or atomic carbon and/or bulk
cobalt carbide, residual wax in narrow pores and/or oligomers, and polymeric carbon,
respectively. It should be noted that among the catalysts tested at 230°C Runs 1 and 5 display the
greatest formation of wax/hydrocarbons (the first two peaks) on the surface, while Run 2 has the
lowest. Interestingly, Runs 1 and 5 had hydrogen poor conditions (H2/CO = 1) and Run 2 had
hydrogen rich condition (H2/CO = 3). Since the H2-TPR weight losses of spent catalysts can be
from oxygen loss of the passivation step and/or physisorbed water in addition to carbon
hydrogenation, the identification of carbon species is done more accurately with TPH
characterization (see section 5.3.7).
For the FB catalysts run at different temperatures, the results are very similar to the FB
catalysts run at 230°C. Cobalt aluminate formation with 700-900 h TOS increased, ranging from
5.5 - 7 wt% increase of the cobalt for Runs 6 - 9, with Run 7 (250°C) having the highest cobalt
aluminate formation. This amount of cobalt aluminate formation is in the same range as the
cobalt aluminate formation of the catalysts run at 230°C, showing that temperature does not have
a large effect on cobalt aluminate formation. Also, the most carbon present is on both catalysts
run at 250°C (Run 7 and Run 9) regardless of ratio.
142

Figure 5.7. TPR profiles of calcined fresh catalyst and wax-extracted spent catalysts for (a) Runs 1-5 and (b) Runs 6-9.
5.3.6 XANES/EXAFS
To determine whether cobalt crystallites oxidize during FTS, wax coated cobalt samples
which experienced the most deactivation among the catalysts tested at 230°C (Run 5) were
removed from the FTS reactor after 800 h and analyzed with XANES and EXAFS. Figure 5.8
143

compares the normalized XANES spectra of the calcined, freshly reduced, and wax-coated spent
catalyst (Run 5) samples with that of the reference Co metal foil. By comparison with the
literature, the line shape of Co in the calcined catalyst resembles Co3O4 [130] and the freshly
reduced catalyst contains both an oxidized component and cobalt metal. The shift in the energy
of the white line to lower energy indicates that the oxide component is no longer Co3O4, but
rather CoO [130]. In comparing the spectra of the freshly reduced and spent catalyst samples, the
decrease in the white line intensity after running FTS indicates that the spent catalyst sample is
more reduced than that of the freshly reduced one.
Figure 5.8. Normalized XANES spectra (Co K-edge) for calcined, freshly reduced, and wax-coated spent catalyst (Run 5: PH2 = PCO = 10 bar and 230°C).
The left-hand side of Figure 5.9 compares the Fourier transform magnitude spectra of the
freshly reduced catalyst with that of the Co metal foil and the calcined catalyst. Qualitatively, the
144

freshly reduced catalyst contains two major contributions, Co-Co metal coordination and Co-O
coordination from CoO. One cannot rule out a contribution from Co-Co in CoO. The data are
consistent with XANES that the freshly reduced catalyst is a mixture of Co metal and CoO.
The right-hand side of Figure 5.9 compares the Fourier transform magnitude spectra of
references and catalysts for the shortened k-range, in order to compare with the spent catalyst
sample. The spent catalyst sample shows an increase in the peaks for Co-Co metal coordination
in both the first and second shells. Increased Co-Co coordination may come from two sources:
(1) reduction of CoO and/or (2) sintering processes (e.g., agglomeration of Co metal or Ostwald
ripening).
Figure 5.9. Co K-edge EXAFS k2-weighted Fourier transform magnitude spectra over (left) longer k-range of 2.5 – 10 angstroms-1 and (right) shorter k-range of 3.5- 9 angstroms-1 for (I) (solid) freshly reduced catalyst and (dashed) spent catalyst (Run 5: PH2 = PCO = 10 bar and 230°C) and (II) (solid) Co metal foil and (dashed) calcined catalyst.
145

An attempt was made to fit the chi data over the shortened k-range in order to fairly
compare the freshly reduced and spent catalyst samples. On the left hand side of Figure 5.10, it is
obvious that the amplitude is greater for oscillations associated with Co-Co metallic coordination
in the spent catalyst sample (i.e., IIIa) relative to the freshly reduced one (IIa), by comparison
with the Co metallic foil reference spectrum (Ia). It was not possible to obtain a physically
meaningful fitting by including both Co-O from CoO and Co-Co metallic coordination in a
complex model. Nevertheless, a reasonable fitting of the data was obtained by de-emphasizing
the Co-O contribution and emphasizing the Co-Co metallic contribution by employing a k2
weighting during fitting. Comparisons of the filtered data (r-range of 1.5 – 2.9 Å) with the
theoretical fitting are provided in both k-space (b) and r-space (c). The fitting is good at the high
k-range as expected, and poorer in the low k-range. The fitting parameters are listed in Table 5.4.
An increase in Co-Co metal coordination number is observed after running FTS in comparison
with the freshly reduced catalyst sample. The r-factor was 0.038, which is a reasonable (but not
excellent) fitting over such a shortened k-range.
Table 5.4. Results of EXAFS fitting parameters for catalysts and reference compound acquired near the Co K-edge. The fitting ranges were Δk = 3.5 – 9 Å-1 and ΔR = 1.5 – 2.9 Å. S0
2 = 0.9.
Sample Description
N Co-Co in
Co0
R Co-Co in Co0
(Å)
e0
(eV) σ2
(Å2) r-factor
Co foil 12 2.484 (0.0095)
5.86 (1.57)
0.00705 (0.00048)
0.038
Freshly reduced catalyst 3.9 (0.89)
Spent catalyst sample 5.0 (0.40)
146

Figure 5.10. EXAFS results at the Co K-edge, including (a) (left) the raw k2-weighted χ (k) versus k (b) (middle) (solid line) the filtered k2∙χ (k) versus k and (filled circles) the result of the fitting; and (c) (right) (solid line) the Fourier transform spectra with (filled circles) the result of the fitting. Model was weighted to k2 to emphasize Co-Co scattering and only considered Co-Co metal coordination in the fitting. Because of the low quality of the spent catalyst spectra, the fitting range was 3.5 – 9 angstroms-1 and the r-range was 1.5 – 2.9 angstroms. (I) Co metal foil; (II) freshly reduced catalyst; (III) spent catalyst (Run 5: PH2 = PCO = 10 bar and 230°C).
5.3.7 XPS Results
The FB wax-extracted spent catalyst samples were evaluated by XPS in the Co 2p and
the C 1s regions. XPS can provide quantitative chemical information on catalyst surfaces to a
depth of 0.3 − 3 nm [28]. The fact that a cobalt signal is visible after wax extraction implies the
wax has been removed to submonolayer levels. Since the catalyst was passivated in-situ after
wax extraction, some surface cobalt oxide is expected; therefore, the Co 2p spectra (not shown
147

here) do indicate the presence of both metallic cobalt and cobalt oxide. This is consistent with
the results of Moodley et al. [48], who also observed metallic cobalt and cobalt oxide on the
surface of their wax-extracted catalyst samples after several days on stream.
Figure 5.11 shows the XPS C 1s spectra for freshly reduced (without wax), freshly
reduced wax-extracted, and wax-extracted spent catalyst samples. The very low-intensity C 1s
peak for the freshly reduced passivated sample can be attributed to carbon contamination in the
XPS chamber or from the supporting conducting carbon tape, as mentioned in section 5.3.1. All
peaks for wax-extracted spent catalyst samples appear at binding energies of 284.2 to 284.8 eV.
From the XPS data for Ref. 1 (Figures 5.2 and 5.11), the C 1s peak at about 284.5 eV can be
assigned to amorphous polymeric carbon. Since this peak (284.5 eV) is broad, it may also
include a contribution at 284.9 eV due to long chain hydrocarbon products, consistent with a
peak observed at the same energy for the freshly-reduced catalyst surface after wax-extraction.
The XPS C 1s spectra for wax-extracted catalyst samples of Runs 1, 3 and 5 consist of a broad
peak centered at 284.8 eV which may correspond to mixture of polymeric carbon and wax, with
wax (284.9 eV) predominating. Peaks at 283.0 eV and 283.5 eV corresponding to the carbon in
the form of cobalt carbide and graphitic carbon (Ref. 4; Figure 5.2), respectively were not
observed in the C 1s XPS spectra of all five spent wax-extracted catalysts, suggesting the
absence of cobalt carbide or graphitic carbon after FT reaction.
5.3.8 Temperature-programmed hydrogenation (TPH) on wax extracted catalysts
TPH was used to identify the types of carbon present on the surface of the wax-extracted
spent catalysts. The methane evolution profiles for the series of catalyst samples tested at 230°C
and 240-250°C are shown in Figure 5.12a and 5.12c, respectively. A freshly reduced catalyst
148

which was coated in wax, wax-extracted, and then passivated was also characterized using TPH
to determine the peak position for wax and extent of wax left on the surface following extraction.
It is evident that there are three peaks associated with three different types of carbonaceous
species based on their reactivity toward hydrogen around 250, 300, and 360-420°C for FB wax-
extracted samples. The freshly reduced wax-extracted sample only consists of the first two peaks
and the only source of carbon is the residual hydrocarbons that are still present after Soxhlet wax
extraction. Therefore, the first two peaks can be associated at least to some extent to waxy
hydrocarbons. The second peak for this sample is broader at around 300°C, which may
correspond to the transformation of hydrocarbons during hydrocracking of residual wax [48].
149

Figure 5.11. X-ray photoelectron spectra of the C 1s region for freshly reduced (without wax), freshly reduced wax-extracted, Ref. 1, and FB wax-extracted catalysts (a) Runs 1-5, (b) Runs 6-9.
It has been reported that atomic or surface carbidic carbon is hydrogenated at around
200°C [50]; therefore a part of the first peak can also be assigned to atomic carbon. Bulk cobalt
carbide can also contribute to the TPH profiles, since it is hydrogenated at around 250°C.
However, bulk cobalt carbide was not detected by XRD, although this does not rule out the
possibility of the carbide, because bulk cobalt carbide is reportedly metastable and may not be
detectable with ex situ techniques [56].
To further confirm the presence of wax, higher mass numbers were recorded by mass
spectroscopy to determine the presence of ethane due to hydrocracking of wax (Figure 5.12b).
The mass spectrum of C2H6 consist of two peaks at the same two lowest temperatures as Figure
5.12a but not much of the 3rd peak, indicating that a significant portion of peaks 1 and 2
corresponds to the hydrogenation of waxy hydrocarbons.
150

The second peak of the TPH profile for the freshly reduced wax-extracted sample is
much broader and lower intensity than the first peak, while the second peak of FB wax-extracted
samples (except for Runs 2 and 6) is of higher intensity . This indicates that the second peak of
the TPH profile for spent catalysts can, in addition, be due to oligomeric carbons, which are
intermediate species in the formation of a more stable polymeric carbon.
The third peak (Runs 1-9, Figure 5.12a and 5.12b) can be assigned to hydrogen-resistant
polymeric carbon and high molecular weight, condensed hydrocarbons (coke) starting around
360°C and ending about 500°C. It should be noted that peak 3 cannot be observed on the wax
extracted, freshly reduced catalyst indicating the absence of these types of carbons/coke in that
sample.
Comparing the TPH profiles of spent catalysts and Refs. provides further information on
the nature of carbon deposits on CoPt/Al2O3. The Refs. were prepared by depositing carbon via
CO disproportionation at 250 and 350°C to produce a catalyst containing carbon without the
presence of wax. Both atomic and polymeric carbons were deposited on alumina supported
cobalt and unsupported cobalt catalysts during CO disproportionation at 250°C (Ref. 1 and Ref.
2). Based on the TPH data for the Ref. samples (Section 5.3.1), the less reactive carbon observed
at high temperature (> 360°C) for TPH profiles of spent catalysts can clearly be assigned to
polymeric carbon associated with the metal. That the higher temperature peak for the TPH
profile of Ref. 1 (supported CoPt) is observed at about 60°C higher temperature relative to Ref. 2
(unsupported CoPt) suggests that a portion of the polymeric carbon is also present on the
support.
151

A high temperature peak observed for polymeric carbon at around 470°C for Ref.
samples 1-3 (treated with CO at 250°C) is about 90°C higher than the high temperature peak
(third peak) of TPH profiles (Figure 5.12a and 5.12c) for spent catalysts (Runs 1-9). The peak at
higher temperature for the Ref. samples can be assigned to non-hydrogenated polymeric carbon
since they were treated with CO (no H2). On the other hand, hydrogenated polymeric carbons are
likely present on spent catalysts after FT reaction, in both CO and H2, as evident by lower
temperature of hydrogenation, indicating that this hydrogen-containing polymeric carbon is
easier to hydrogenate.
From the TPH profile for Ref. 4, the catalyst treated with CO at 350°C, a new very high
temperature peak is observed at 560°C which is assigned to non-hydrogen-containing graphitic
carbon. Since this peak is not observed on the spent catalysts, the stable carbon on spent catalysts
which occurs at around 360°C and ends at about 500°C is likely not non-hydrogen-containing
graphitic carbon. These results do not rule out the possibility of graphene being present in the
spent catalyst and thus hydrogenated during TPH at 360-500°C. For the Ref. 1 sample
(supported Pt/Co) treated in only CO, a peak at 280-300°C was not observed, although it was
observed in the spent catalysts at 280-300°C after FTS in CO and H2. Therefore, peak 2 for the
spent catalysts is likely due to waxy hydrocarbons and/or hydrogenated precursors located in the
pores of the alumina for the spent catalysts (Figure 5.12a and 5.12c).
152

153

Figure 5.12. TPH of wax-extracted spent catalysts and freshly reduced wax-extracted catalyst for (a) m/z=15 for Runs 1-5, (b) m/z=25 for Runs 1-5, and (c) m/z=15 for Runs 6-9.
The methane evolution of the TPH profiles was deconvoluted with Gaussian peaks using
a similar procedure used by Xu and Bartholomew [127] for spent iron catalysts and Moodley et
al. [48] for spent Co/Al2O3 catalysts. Integration of peak areas for the TPH profiles is reported in
Table 5.5. From the peak areas, it is observed that the amount of less reactive species (Peak 3) is
increasing as the partial pressure of both CO and H2 increase (Runs 2 and 5 with 15/5 and
10/10). In addition, the combination of peaks 1 and 2 for runs tested at 230°C (Runs 1-5), which
is mostly wax and hydrocarbons, is higher for Runs 1 and 5 (H2/CO = 1) and lowest for Run 2
(H2/CO = 3). This observation is consistent with the fact that lighter hydrocarbons are formed at
higher H2/CO ratios.
154

The amount of polymeric carbon is increasing as the temperatures increases at H2/CO = 2
(Runs 6, 7, and 3). However, the amount of less reactive carbon decreases with temperature
(Runs 3 and 9) at H2/CO ratio of 1 with PH2 = PCO = 10.
Table 5.5. Integration of CH4 peaks for TPH on wax-extracted spent FB catalyst samples.
Catalyst (T – PH2/PCO)
Peak 1, μmol/gcat
Peak 2, μmol/gcat
Peak 3, μmol/gcat
Total, μmol/gcat
Fresh reduced 196 380 0 576 Run1
(230°C - 5/5) 502 1046 536 2084 Run 2
(230°C - 15/5) 262 468 944 1673 Run 3
(230°C - 10/5) 299 697 632 1628 Run 4
(230°C - 10/7.3) 314 812 788 1914 Run 5
(230°C - 10/10) 588 1942 1662 4191 Run 6
(240°C - 10/5) 345 604 702 1651 Run 7
(250°C - 10/5) 627 816 1091 2535 Run 8
(240°C - 5/5) 443 602 1056 2102 Run 9
(250°C - 10/10) 667 1431 1483 3581
5.3.9 CO-chemisorption
CO chemisorption was used to determine Co surface area before and after FT reaction,
and thus loss of surface area during reaction. These losses could be due to deposited carbon that
blocks active cobalt sites and/or sintering that can also reduce cobalt surface area. To evaluate
the effect of sintering and hydrogen resistant carbon (polymeric carbon), CO-uptakes were
performed, in which the wax-extracted spent catalysts were re-reduced in H2 at different
temperatures (350°C and 450°C). Re-reducing the wax-extracted spent catalysts at 450°C
removes almost all of the deposited carbon, allowing sintering’s effect to be determined. CO-
uptake values for wax-extracted FB catalysts reduced at 450°C were comparable to the freshly
155

reduced catalyst (not shown here), indicating that no sintering happened during~800 h TOS. It
should be noted that the catalysts were already bulk-reduced at 450°C for 72 h and they were re-
reduced at the same temperature before CO-uptake measurements; therefore, change of
dispersion due to reduction is not expected.
CO-uptake values of wax-extracted spent FB catalysts re-reduced at 350°C are compared
to the freshly reduced catalyst in Table 5.6. As seen by the uptake value for the freshly reduced
wax-extracted catalyst (212 µmol/gcat), re-reducing the spent catalysts at 350°C removes most of
the wax present on the catalyst, leaving mainly polymeric carbon on the surface of the catalyst. A
significant decrease (20-40%) in CO-uptake values was observed for the spent FB catalysts
(wax-extracted) indicating the interaction of polymeric carbon species with cobalt. CO uptake
decreases and fraction of original Co sites lost increases as the total pressure of H2 and CO
increases (Figure 5.13). The lowest CO-uptake values for catalyst samples tested at 230°C were
seen for Runs 2 and 5, the FB runs with the highest total pressure of CO and H2. Run 1 with the
lowest total pressure of CO and H2 and Run 3 as our standard condition (H2/CO=2) are shown
displayed with the highest CO-uptakes after reaction for catalyst samples tested at 230°C. At
H2/CO of 2, CO-uptake decreases as the temperature increases to 250 from 230°C.
156

Table 5.6. CO-uptake data on freshly reduced catalyst and wax-extracted spent FB catalysts.
Catalyst (T - PH2/PCO)
CO-uptakea, µmol/gcat
Freshly reducedb 227
Freshly reduced wax-extractedc 212
Run1 (230°C - 5/5) 191
Run 2 (230°C - 15/5) 150
Run 3 (230°C - 10/5) 186
Run 4 (230°C - 10/7.3) 168
Run 5 (230°C - 10/10) 141
Run 6 (240°C - 10/5) 171
Run 7 (250°C - 10/5) 157
Run 8 (240°C - 5/5) 162
Run 9 (250°C - 10/10) 145
a All catalysts were re-reduced at 350°C to obtain CO-uptake values. b Freshly reduced catalyst without wax
c Freshly reduced catalyst coated in wax and then the wax was extracted as described in section 5.3.2.
Figure 5.13. CO uptake decrease as a function of inlet partial pressures of H2 and CO for Runs 1-5; all at 230°C.
157

5.3.10 Extent of reduction (EOR), dispersion, and crystallite size
The EOR of the freshly reduced catalyst at 450°C was estimated, from the TPR profile
(section 5.2.4) to be 91.2%. Assuming the EOR for the Pt promoter to be 100%, the dispersion
for freshly reduced catalyst was estimated to be 8.6% from the EOR and measured H2 uptake
(Section 5.2.4). The cobalt crystallite diameter is calculated from the dispersion to be 10.9 nm in
good agreement with the measured value from XRD of 12 nm.
The EOR for wax-extracted FB spent catalyst samples was determined using TPR and
also oxygen titration by re-reducing the catalysts at 450°C to remove any hydrogen resistant
carbon. The EOR of each of the wax-extracted FB spent catalyst samples (Runs 1-9) was nearly
the same (91 ± 2%) as for the freshly reduced catalyst.
5.4 Discussion
The results of this study provide (1) new data regarding the effects of partial pressures of
CO and H2, temperature, and polymeric carbon on the rate of deactivation during FTS under
commercially representative FT reaction conditions over a period of 800 h and (2) insights into
the types and distributions of carbonaceous species deposited under these conditions of
synthesis.
5.4.1 Exclusion of deactivation mechanisms other than deposits of carbonaceous or
hydrocarbonaceous species
The results of this study show for the first time the impact of carbon deposition by
polymeric carbon on the deactivation of FT cobalt catalysts in the absence of other deactivation
158

mechanisms. It is emphasized that our catalyst and experiments were purposely designed to
isolate the effects of carbon on deactivation.
(1) Poisoning by sulfur and nitrogen compounds was not an issue because (a) high purity
gases were used and the preparation of the catalyst involved materials of high purity and (b) no
change in CO-uptake was observed for the Co catalyst regenerated in H2 at 450°C for 3 h,
conditions which would not remove a significant quantity of adsorbed sulfur or completely
remove adsorbed nitrogen species.
(2) Oxidation of Co metal to Co oxide was avoided by having a negligible fraction of
cobalt particle sizes less than 2 nm [35] (our average crystallite diameter of 12 nm), and by
running the FB system at XCO between 16 and 24%, thereby keeping the partial pressure of water
low enough to prevent oxidation. XANES results show that the catalyst does not undergo
oxidation during these FTS conditions. Instead a gradual reduction over an 800 h period takes
place with the spent sample closely resembling the spectrum of a Co foil. This is consistent with
the literature for the initial decay period prior to leveling off for both research [131] and
commercial [34] Co catalysts.
(3) Our observation of only 3 wt% increase in cobalt aluminate formation for the wax-
extracted spent catalyst relative to the calcined catalyst indicates that Co aluminate formation is a
relatively minor cause of deactivation. Saib et al. [34] have concluded that aluminate is not
formed via oxidation of active cobalt metal; instead, CoO present in the working catalyst is the
principal intermediate in the formation of cobalt aluminate. Given our observation that EOR is
not changed during 800 h of reaction, i.e. EOR is 91% ± 2% for both freshly reduced and re-
reduced (at 450°C) wax-extracted spent catalysts, and net reduction was found from
159

XANES/EXAFS results after 800 h TOS, we conclude in agreement with Saib et al. and Jacobs
et al. [34, 131] that none of the metallic Co in our catalysts forms an aluminate; instead, Co
aluminate is formed from the unreduced CoO, i.e. about 3% Co aluminate and 6% CoO are
present in the freshly reduced catalyst, while about 6% Co aluminate and less than 3% CoO are
present in the re-reduced, wax-extracted spent catalyst.
(4) Data from this study obtained by XRD, CO-chemisorption, and EOR provide clear
evidence that sintering of cobalt nanoparticles did not contribute to the deactivation of the
catalyst, i.e., the dispersion of the cobalt particles remained the same before and after reaction.
The absence of sintering can be attributed to a careful design of the catalyst, using a stable silica-
doped alumina support [62, 83, 85] and a high reduction temperature (450°C) to produce large
cobalt crystallites [average crystallite diameter (ACD) of 12 nm] stable against sintering. That no
sintering was observed in our catalysts having an ACD of 12 nm after 30 day (800 h) runs is
consistent with the observations of Overett et al. [33, 35] that following a 100 day test, cobalt
ACD increased to 12-14 nm from an initial value of 9 nm; all of the sintering occurred during the
first 10 days and was contributed to 30% loss in activity.
EXAFS results show an increase in Co-Co metal coordination for a spent catalyst sample
after 800 h TOS, which can be assigned to (1) reduction of CoO and/or (2) sintering. Since no
sintering was observed with XRD analysis of the catalyst sample before and after the reaction
and is consistent with XANES results, the increase in Co-Co metal coordination can be due to
net reduction of CoO.
From the forgoing discussion it is evident that deactivation mechanisms other than those
related to deposition of polymeric carbons and hydrocarbons do not contribute significantly to
160

the deactivation of our Co catalysts over a wide range of partial pressures of H2 and CO and
temperatures; therefore, it is concluded that this study is unique and singular for better
understanding the impact of carbon only on the deactivation of Co FTS catalysts.
5.4.2 Effects of polymeric carbon on catalyst properties, CO-uptake, and activity
We previously discussed (in the Introduction) how different forms of carbon can cause
deactivation in different ways. Our investigation focused on deactivation of Co FT catalysts by
wax, atomic carbon, and polymeric carbon (some of which may be condensed hydrocarbons).
Bulk cobalt carbide was not observed (by XRD) on our spent catalysts; this observation is
consistent with Moodley et al. [48] who reported no cobalt carbide presence even after several
months of FT operation with a commercial Co catalyst similar to ours.
Our results show that accumulation of atomic carbon and clogging of catalyst pores by
heavy wax left after wax-extraction are not important deactivation pathways. In fact, TPH
profiles for Runs 1-5 (Fig. 5.10a) show that the largest amounts of atomic carbon and wax were
present in Runs 1 and 5 (as indicated by the areas of Peak 1), yet the deactivation rate of Run 5 is
the greatest and Run 1 is the least of all the FB catalyst tests (Figure 5.3). Moreover, following
Run 2, the FB test with the second highest deactivation rate (Figure 5.3), the catalyst was found
to contain the least amount of atomic carbon and wax (see Peak 1 in Figure 5.12a). BET data for
wax-extracted, spent catalyst samples (Table 5.33) are consistent with the Peak 1 areas for TPH
in that the lowest pore volumes, i.e., the largest amounts of hard wax, were found in Runs 1 and
5, while the highest pore volume (smallest quantity of hard wax) was found in Run 2. Thus, it is
evident that the quantity of residual, hard wax does not correlate with deactivation rate in these
runs. In other words, these results indicate that residual hard wax does not lower activity by
161

physically blocking pores at least for our catalysts. This result contradicts those of previous
studies [49, 122, 123] where wax was observed to clog catalyst pores. Our observation can be
explained by the exceptionally high mesopore volume (1.06 cm3/g following calcination at
1100°C [85]) of the silica-doped alumina support used for our catalysts thus preventing complete
blockage by wax of the large catalyst pores. Indeed, the pore volume of our freshly reduced
catalyst is 0.649 cm3/g, nearly twice the pore volume of the Co/Al2O3 catalyst (0.35 cm3/g) used
by Peña et al [49, 125]. Moreover, after 700-900 h TOS, pore volumes of wax-extracted catalyst
samples test in Runs 1 and 5 of 0.487 cm3/g and 0.499 cm3/g respectively (Table 5.3), are
substantial, even though these two catalysts contain the largest quantities of residual, hard wax of
the five catalyst samples tested at 230°C (Figure 5.12b). The pore volumes of the wax-extracted
catalyst samples (0.48 to 0.52 cm3/g) are a factor of two larger than those of other studies (0.23-
0.31 cm3/g) [49, 125]. Therefore, the pore volumes of the wax-extracted spent catalyst samples
of this study are apparently above the threshold at which wax blocks catalyst pores, and
contributes to deactivation.
Recently, it has been proposed that polymeric carbon causes long-term deactivation for
cobalt FT catalysts [48, 49]. Our results also show a positive correlation between average
deactivation rate (-∆a/∆t) and the quantity of polymeric carbon on the catalyst determined by
TPH (Peak 3) after 30 days (800 h) (Figure 5.14a) and between CO uptake decrease and
polymeric carbon (Figure 5.14b), in both cases for the same catalyst treated at five different sets
of H2 and CO partial pressures at 230°C and four different sets of temperatures and partial
pressures. Based on our experimental results showing a gradual drop in activity with time
(Figure 5.3), it appears that polymeric carbon gradually forms during reaction, is stable at FTS
conditions, and based on the loss of CO-uptake after 30 days, occupies cobalt metal sites, thereby
162

decreases activity, the extent of which varies with reaction conditions (PH2, PCO, T). Given that
(1) CO-uptake measurements were evaluated after regenerating the catalyst at 350°C, which
removed atomic carbon, oligomeric carbon, and most of the wax (Peaks 1 and 2) thus leaving
only polymeric carbon and (2) the original CO uptake was completely recovered after partially
regenerating in H2 the freshly-reduced, wax-extracted catalyst at 350°C, it follows that the
decrease in CO-uptake for spent catalysts was only due to site-poisoning by polymeric carbon. It
should be emphasized that catalyst dispersion would not have changed during H2 regeneration at
350°C, since the catalyst was originally bulk reduced at 450°C.
5.4.3 Effects of PH2, PCO and H2/CO Ratio on Deactivation
Based on the quantitative measurement of different carbon species on the spent catalysts
as a function of H2 and CO partial pressures, the effective monolayers of atomic, oligomeric, and
polymeric carbon (or polymeric hydrocarbons) after 800 h TOS are calculated as shown in Table
5.7. Assuming that the amount of residual wax was similar for all five wax-extracted spent
catalyst samples, the amount of wax found from TPH of the freshly reduced wax-extracted
catalyst was subtracted from those of the wax-extracted spent catalyst samples to find the
amounts of atomic and oligomeric carbons present in Peaks 1 and 2, respectively; these corrected
quantities for Peaks 1 and 2 and the quantity of polymeric carbon (Peak 3) were further
normalized to the total number of Co sites from H2 chemisorption. The calculated data indicate
that roughly a monolayer of atomic carbon is formed on the Co surface in Runs 1 and 5
involving a H2/CO ratio of one at 230°C, while only a 0.19 to 0.34 of a monolayer of atomic
carbon is formed at higher H2/CO ratios at 230°C. Moreover, there are trends of decreasing
atomic and oligomeric carbons with increasing H2/CO ratio. Except for Runs 2, 3, 6 and 8,
several monolayers of oligomeric carbon form while 1.5-4.7 monolayers of polymeric carbons
163

(or condensed hydrocarbons) form on all nine samples. It should be noted that higher combined
partial pressures of H2 and CO at a total pressure of 20 bar (balance is He) and 230°C favor the
formation of polymeric carbon.
Figure 5.14. (a) Average deactivation rate and (b) CO-uptake decrease from the value of CO-uptake for wax-extracted freshly-reduced sample (Table 5.6) as a function of polymeric carbon on FB wax extracted catalyst samples (Runs 1-9).
164

Table 5.7. Monolayer carbon equivalents of TPH peak areas following FT synthesis for 800 h at 230-250°C and 20 bar.
Catalyst
(T - PH2/PCO) Peak 1a Peak 2a Peak 3b
Run1 (230°C - 5/5)
0.87 1.9 1.5
Run 2 (230°C - 15/5)
0.19 0.25 2.7
Run 3 (230°C - 10/5)
0.29 0.90 1.8
Run 4 (230°C - 10/7.3)
0.34 1.2 2.3
Run 5 (230°C - 10/10)
1.1 4.5 4.7
Run 6 (240°C - 10/5)
0.43 0.64 2.0
Run 7 (250°C - 10/5)
1.2 1.2 3.1
Run 8 (240°C - 5/5)
0.71 0.64 3.0
Run 9 (250°C - 10/10)
1.3 3.0 4.2
a Peaks 1 and 2 of TPH profiles consist of atomic and oligomeric carbons in addition to wax, respectively. a,b Carbon monolayers were found by subtracting the amount of wax found from TPH profile for freshly-reduced wax-extracted catalyst from those of the spent catalysts divided by total number of cobalt sites found from H2-uptake. The amount of residual wax was assumed to be the same for all the wax-extracted spent catalyst samples.
While other groups [31, 49, 124-126] studied the effects of H2/CO ratio at a constant total
pressure without diluent, our results show that effects of partial pressures of H2 and CO must be
evaluated separately. Moreover our results show that increasing PCO at constant PH2 (decreasing
H2/CO ratio), increases deactivation rate, while increasing PH2 at constant PCO (increasing H2/CO
ratio) also increases deactivation rate. It follows logically that increasing total pressure in the
absence of a diluent increases deactivation rate via the formation of polymeric carbon species.
Our observation is consistent with that of Sadeqzadeh et al. [31] who found that higher total
syngas pressure increases the deactivation rate for cobalt FT catalysts, although they did not
attribute it to a specific cause.
165
It is important to address possible reasons for higher rates of polymeric carbon or
condensed hydrocarbon formation causing higher rates of deactivation at high partial pressures
of hydrogen. We hypothesize that higher partial pressures of CO result in higher carbon coverage
which facilitates C-C coupling to form carbon oligomers which further couple to hydrogen-poor
polymeric chains, rings, and layers. It is reported that at higher partial pressures of hydrogen
carbons deposited on iron catalysts are gasified, thereby reducing the extent of carbon-induced
deactivation [132]. Logically, one might suppose that increasing H2 partial pressure would
decrease the extent of deactivation by carbon on Co catalysts. However, we observe that during
FTS at 230°C higher rates of polymeric carbon formation occur at higher partial pressures of
hydrogen, consequently causing faster deactivation (see Figure 5.3). Our observation is in
agreement with Peña et al. [49] who previously reported that at the same flowrate (but different
conversions, most notably at higher conversion) formation of polymeric carbon and thus
deactivation rate increases with increasing H2/CO ratio. However, it should be noted that in their
study, catalyst deactivation probably occurred by more than one mechanism, especially in
experiments at high conversion and thus high PH2O, which, the same group indicated in a separate
paper, can facilitate deactivation through “water-assisted sintering” [31]. Recently, Weststrate et
al. [40, 43] proposed that polymeric carbon can be formed on cobalt catalysts via cyclo-
polymerization reactions with C2Hx species as intermediates. Thus, higher H2 partial pressures
can possibly increase the probability for the formation of C2Hx species and consequently
aromatic structures and/or hydrogenated polymeric carbons. Aromatic ring formation is expected
to be an irreversible process, resulting in carbon build-up under FTS conditions.
166

5.4.4 Effect of temperature on deactivation
Formation of polymeric carbon was also evaluated at different temperatures using H2/CO
= 2 as a baseline condition. As temperature increases from 230 to 250°C, the amount of
polymeric carbon or hydrogenated polymeric carbon increases from 1.8 to 3.1 monolayers (Table
5.7); consequently, the rate of deactivation increases. This observation is consistent with
Moodley et al. [4] who found that polymeric carbon and deactivation rate increased with
temperature (240-270°C) at H2/CO = 1.7 and P = 20 bar. Sadeqzedah et al. [127] also found
increasing temperature increases deactivation rate. However, this trend does not exist when
comparing Runs 5 and 9, where the deactivation rate at 250°C (Run 9) is less then at 230°C (Run
5). Recent density functional theory calculations on fcc-Co (111) show that a carbon coverage of
50% will reconstruct the surface to fcc-Co(100) followed by a clock type reconstruction [58]. On
the other hand, surface reconstruction is a dynamic process which results in simultaneous
roughening of the surface to produce active edge and B5 sites with an attendant increase in
surface energy, and also formation of less active planar sites, thereby lowering the surface energy
[35, 58-60]. As is apparent in Table 5.7, the atomic carbon monolayer is increasing as
temperature increases from 230 to 250°C. Therefore, it can be hypothesized that cobalt structure
tends to become more stable at higher temperatures and high CO partial pressures, resulting in
lower deactivation rate. This observation is consistent with Ma et al. [128], who also found
higher deactivation at lower temperatures for 25 wt% Co/Ru/Al2O3 catalyst at 2.5 MPa,
H2/CO:2.1, and attributed this phenomenon to changes in Co structure.
167

5.5 Conclusions
Twelve samples of a 25 wt% Co/ 0.25 wt% Pt/Al2O3 (Al2O3 is doped with 5 mol% SiO2
as a stabilizer) were tested over a period of 800 hours and XCO < 24%, each at a different sets of
CO and H2 partial pressures and temperature (220-250°C). This study provides, for the first time,
new data defining quantitatively the long-term deactivation by carbon deposition for cobalt FT
catalysts in the absence of the other deactivation mechanisms. Sintering, oxidation, cobalt-
support formation, and physically plugging of pores by heavy waxy hydrocarbons were
eliminated through design of a catalyst with relatively large Co crystallites (~12 nm), a very
stable and large pore support (Vp = 1.06 cm3/g), and by operating at low conversions (XCO <
24%) and thus low partial pressures of H2O.
1- Deactivation may be caused by either polymeric carbons or condensed hydrocarbons.
Thus, at a reaction temperature of 230°C, deactivation rate increases with (a) increasing
PCO at constant PH2 (decreasing H2/CO ratio) due to formation of a hydrogen-poor,
polymeric carbons (graphitic-like) or (b) increasing PH2 at constant PCO (increasing
H2/CO ratio) due to formation of hydrogen-rich, condensed polymeric hydrocarbons.
2- At low CO partial pressure (PCO = 5 bar; H2/CO = 2 and 1), deactivation rate increases
with increasing temperature; however, at high partial pressure of CO (PCO = 10 bar) and
H2/CO of 1, deactivation rate increases as temperature decreases.
3- There is a positive correlation between average deactivation rate (-∆a/∆t) and the quantity
of polymeric carbon deposited on the catalyst after 800 h.
4- There is a correlation between average deactivation rate and the fraction of Co sites lost
during 800 h runs.
168

5- At high partial pressures of CO (> 7.5 bar) regardless of operating temperature, methane
selectivity increases as the catalyst deactivates; however, methane selectivity was
constant over 800 h at low CO partial pressure (PCO = 5 bar).
169

Chapter 6 Reaction and Deactivation Kinetics for Cobalt FTS
This chapter reports results of the comprehensive study of the kinetics of both the main
reaction and deactivation reaction for the cobalt FT catalyst and describes the development of a
macrokinetic model based on a proposed mechanism for main reaction and general power-law
expressions (GPLE’s) for deactivation.
6.1 Introduction
As discussed fully in Chapter 5, a number of recent papers [49, 124-127] have addressed
the effect of H2/CO ratio and temperature for the deactivation by carbon of cobalt FT catalysts.
There is not much agreement regarding effects of H2/CO on the deactivation of cobalt catalysts.
Contrary to conventional wisdom that higher H2/CO ratio would more likely result in removing
the carbon from the surface by hydrogenation [121], other researchers [31, 124-127] reported
faster deactivation by sintering, cobalt aluminate formation and also carbon deposition at higher
H2/CO ratios. Part of this discrepancy is due to the fact that there has been no single systematic
study to investigate the effect of the partial pressures of H2 and CO separately, since previous
studies have varied the partial pressures together rather than separately.
These same kinds of contradictions have also been observed for effects of temperature on
the deactivation of Co by carbon. While increasing temperature has been reported to increase the
rate of deactivation [4, 127], Ma et al. [127] have reported a slower deactivation rate at 220°C
170

than 205°C for 25 wt.% Co/Ru/Al2O3 catalyst hypothesizing that a more stable catalytic structure
was created at higher temperatures.
Among the previous papers addressing the deactivation kinetics for Co FT catalyst [31,
32, 49, 54, 124-127, 133], deactivation rates in several [54, 126, 133] were fit to unrealistic
simple power-law expressions (SPLE’s), which predict a zero value for activity at long times on
stream (TOS), while it has been reported that Co activity typically trends to a limiting value
during FTS [116]. Argyle et al. [116] address this issue in their paper. The authors observe that
SPLE models’ fit deactivation data for sintering and carbon deposition poorly, yielding
unrealistic deactivation orders of 4-15, while first or second order general power-law expressions
(GPLE’s), which include a non-zero value of limiting activity, fit most data very well, consistent
with physically meaningful systems. In their study [116] activity-time data from several previous
studies involving different deactivation mechanisms were fitted to 1st and 2nd order GPLE
expressions. It was found that activity-time data involving simultaneous mechanisms could be
modeled; for example, a combination of 1st and 2nd order GPLE models for carbon deposition
and sintering, respectively, provides a very precise fit of activity-time data.
Recently, Sadeqzadeh et al. [127] developed a semi-empirical/mechanistic model to
represent the activity-time data (deactivation by carbon) at different temperatures and syngas
ratios. It was assumed that atomic carbon formed from CO dissociation is the principal cause of
deactivation. Their model assumes that the decrease in available active sites for FT reaction with
time is a function only of CO partial pressure. The main reaction rate expression was multiplied
by available site coverage to incorporate the activity changes with time. However, several
limitations of this model are evident: (1) atomic carbon, a precursor to chain growth of
hydrocarbons, is a relatively short-lived active center; the presence of which doesn’t contribute
171

to deactivation, and (2) activity-time data were collected only up to 100 h TOS, and thus cannot
be used predicting long-term deactivation by carbon observed to occur over hundreds of hours.
It is apparent from a careful review of the literature that no previous comprehensive study
has been conducted of the quantitative effects of H2 and CO partial pressures and of temperature
on deactivation kinetics by inactive carbons of Co FTS catalysts. One of the principal objectives
of this dissertation study was to conduct such an experimental study of these effects coupled with
development of model to fit the resulting data. In this chapter activity-time data are reported for a
CoPt/Al2O3 catalyst during reaction and simultaneous carbon deposition as a function of PH2,
PCO, and temperature. Eight deactivation runs at FT conditions (220-250°C and 20 bar) for a 25
wt% Co/ 0.25 wt% Pt/Al2O3 catalyst were carried out in a FB reactor over 800-900 h at different
partial pressures of H2 and CO and H2/CO ratio as presented in Chapter 5. It is demonstrated that
these seven experimental deactivation data sets can be statistically well fit by first or second
order GPLE models. Since the deactivation mechanism and models are coupled with those of the
main reaction, a separate kinetic study of the main reaction in the absence of deactivation was
also performed at T = 210-240°C, H2/CO = 1.5-3, and P = 20 bar.
6.2 Methodology
6.2.1 Kinetic and deactivation experimental designs and collection of data
Reaction kinetic experiments were carried out for 25 wt% Co/ 0.25 wt% Pt/Al2O3 using a
fractional factorial design with four levels of temperature (210, 220, 230, 240°C) and three levels
of PH2 (6, 8, 12 bar) and PCO (2.7, 4, 6 bar) as shown in Figure 6.1 to study the effect of each
factor on response values and provide a sufficiently wide range of experimental data needed for
172

developing a representative rate expression with concentration and temperature dependencies. To
minimize catalyst pore resistance, catalyst particles with a diameter of 63-88 µm (170-230 mesh
size) were used. The baseline conditions were repeated to assess if catalyst deactivation had
occurred during the experimental runs. No deactivation was observed over the 450 h period in
which data were taken.
Figure 6.1. Domain of H2 and CO partial pressures for reaction kinetic experiments in the absence of deactivation.
To determine deactivation rates, eight samples of the cobalt catalyst were tested over a
period of 800-900 h, each at a different set of CO and H2 partial pressures and temperature (in
the range of 220-250°C) while flowrate was held constant (see Table 6.1). Each catalyst sample
was activated at the desired deactivation temperature (furnace temperature was ramped slowly to
get to the deactivation temperature), 20 bar, H2/CO = 2, and XCO of 50% for 70 h. At 70 h TOS
PH2, PCO and total flowrate were adjusted to reach desired partial pressures and about 20%
conversion reaching steady-state within 100 h. Starting at 100 h, activity-time data were
obtained.
173

Table 6.1.Process conditions (feed H2 and CO partial pressures and reaction temperature) for seven deactivation experiments at 20 bar.
Run Temp., °C
PH2, bar
PCO, bar H2/CO
1 230 5 5 1
2 230 15 5 3
3 230 10 5 2
4 230 10 7.3 1.4
5 230 10 10 1
6 240 10 5 2
7 250 10 5 2
10 220 10 5 2
6.2.2 Reaction and deactivation kinetics
The FTS reaction and deactivation kinetics can be linked by the activity of the catalyst.
Activity (a) is a primary function of time, and a secondary function of temperature and
concentrations and is defined as the CO rate normalized by the initial rate.
𝒂𝒂 =−𝑟𝑟𝐶𝐶𝐶𝐶
(−𝑟𝑟𝐶𝐶𝐶𝐶)𝑡𝑡=0=
−𝑟𝑟𝑚𝑚(−𝑟𝑟𝑚𝑚)𝑡𝑡=0
(6.1)
The rate of the main reaction (rm) and deactivation rate (rd) are defined as follows:
−r𝑚𝑚 = 𝑘𝑘(T)𝑓𝑓1(T, C)𝐚𝐚 (6.2)
r𝑑𝑑 = −d𝐚𝐚 / dt = 𝑘𝑘𝑑𝑑 𝑓𝑓2(T, C) 𝐚𝐚𝑑𝑑 (6.3)
where k(T) is the rate constant, f1(T, C) and f2(T, C) are functions of reactant and product
concentrations and temperature for the main reaction and deactivation, respectively, subscript ‘d’
stands for deactivation and superscript ‘d’ is the order of deactivation.
174

A generalized power-law equation (GPLE) was proposed by Fuentes [115] which results
in more reasonable reaction orders, e.g. first or second order, compared to simple power law
expressions in which the 𝑎𝑎∞ term is omitted. This deactivation rate equation is in the form of
−d𝐚𝐚 / dt = 𝑘𝑘𝑑𝑑 𝑓𝑓(C) (𝒂𝒂 − 𝒂𝒂∞)𝑑𝑑 (6.4)
where 𝑎𝑎∞ is the activity at infinite reaction time. Intrinsic kinetics are coupled with the
deactivation kinetics; therefore, the catalyst must be studied under conditions of deactivation as
well as without deactivation to determine the kinetic parameters in each equation.
Since the CO conversion for reaction kinetics and deactivation kinetic runs was kept at
less than 24%, differential conditions could be assumed (as a special case for FTS) and the
CSTR performance equation was used to predict the CO rate.
𝑊𝑊𝐹𝐹𝐶𝐶𝐶𝐶0
=𝑋𝑋𝐶𝐶𝐶𝐶−𝑟𝑟𝑚𝑚
(6.5)
Since the partial pressures of CO and H2 are changing as the catalyst deactivates,
Equations 6.4 and 6.5 should be solved simultaneously.
In reaction rate modeling, estimates of pre-exponential factor (A0) and the activation
energy (E) for a rate constant k are known to be highly statistically correlated.
𝑘𝑘 = 𝐴𝐴0 exp�−𝐸𝐸 𝐸𝐸𝑅𝑅� � (6.6)
This correlation means that (1) estimate of A0 can vary over a wide range for a given E
(and vice-versa) and (2) such data may not be reliable enough to be used in mechanistic
interpretations or reactor design, especially when extrapolation beyond measured temperatures is
175

needed. A reduction in correlation between A0 and E of Equation 6.6 is proposed by Box [118]
which can be achieved by reparameterization as follows:
𝑘𝑘 = 𝑘𝑘∗ exp�−𝐸𝐸𝐸𝐸�
1𝑅𝑅−
1𝑅𝑅𝑎𝑎𝑎𝑎𝑎𝑎
�� (6.7)
where
𝑘𝑘∗ = 𝐴𝐴0 exp �−𝐸𝐸 𝐸𝐸𝑅𝑅𝑎𝑎𝑎𝑎𝑎𝑎� � (6.8)
and 𝑅𝑅𝑎𝑎𝑎𝑎𝑎𝑎 is a reference temperature, usually the mean temperature. This reparameterization was
used for estimating the kinetic parameters of the main reaction.
6.2.3 Statistical analysis
Once the kinetic data in the absence of deactivation were obtained, the nlsLM function in
the R package minpack.lm was used to fit the kinetic models to the data [132]. The nlsLM
function uses a modified Levenberg-Marquardt fitting algorithm. To check how well each model
fit the data, a lack-of-fit (L.o.F) test was performed by comparing the variability between the raw
data and the model predictions to the variability in raw data obtained at the same conditions. An
insignificant lack-of-fit test indicates that predictions from the model at a certain set of
conditions will be as accurate as performing additional experiments at those conditions. Models
with lack-of-fit P-values greater than 0.10, are assumed to be significant and cannot be ruled out
based on statistics. While macrokinetics and statistics cannot be used to prove that a model
represents the only reaction pathway that FTS takes, they can tell us if it is a plausible kinetic
pathway.
176

6.3 Results and discussion
6.3.1 Kinetics of main reaction in the absence of deactivation
Rate data obtained for the CoPt/Al2O3 catalyst at 20 bar over a range of temperatures
(210-240°C) and H2/CO ratios (1.3-3) are listed in Table D.1 (Appendix D) and plotted as a
function of partial pressures of hydrogen and CO in Figure 6.2. Rate data from reaction at
different feed concentrations and temperatures were regressed using the power-law expression in
Equation 6.9 to give exponents listed in Table 6.2.
𝑟𝑟𝑚𝑚 = 𝑘𝑘(𝑃𝑃𝑂𝑂2)𝑥𝑥(𝑃𝑃𝐶𝐶𝐶𝐶)𝑦𝑦 (6.9)
Activity of the catalyst increases with increasing PH2 and the H2 order becomes more
positive at higher temperatures (Table 6.2 and Figure 6.2); H2 order (proportional to the slope of
rate vs PH2) ranges from 0.56 to 0.77. At low temperatures (210-220°C) CO consumption rate
increases with increasing CO partial pressure (positive CO order), while the rate decreases with
increasing PCO (negative CO order) at high temperatures (230-240°C). As shown in Table 6.2,
CO order changes from a positive value of 0.31 at 210°C to a negative value of -0.64 at 240°C.
CO has a strong inhibition influence over cobalt catalysts to the extent that it has a significantly
negative reaction order under commercially relevant reaction conditions [117].
The average H2 and CO orders of 0.69 and -0.53 and activation energy of 129 kJ/mol
were obtained using all the rate data in the temperature range of 210-240°C regressed to the
power-law expression of Equation 6.9 and using Equation 6.7 for the temperature dependence
and minimizing squared errors.
177

Figure 6.2. Effects of (a) PH2 at constant PCO (4 bar) and (b) PCO at constant PH2 (8 bar) on rate (mmol (CO)/gcat/h) at different temperatures for 25 wt% CoPt/Al2O3 catalyst. The rates are adjusted to the desired temperature with activation energy of 129 kJ/mol found from power-law fit as shown in Table 6.2.
Table 6.2. Rate constants, pre-exponential factor, activation energy and reaction orders of H2 and CO for CoPt/Al2O3 at PCO
0 = 2.7-6 bar, PH20 = 6-12 bar and XCO < 24%.
Temp., °C k a,
mmol/g/h/bar(x+y)
Ab
mmol/g/h/bar0.16
Eact,
kJ/mol
H2 order (x) CO order (y)
210 2.85 -- -- 0.56 0.31
220 5.94 -- -- 0.66 0.12
230 29.9 -- -- 0.70 -0.51
240 48.8 -- -- 0.77 -0.64
210-240 -- 6E14 ± 1E14 129 ± 6 0.69 ± 0.008 -0.53 ± 0.008 a rate constant unit is mmol/g/h/barx+y, where x and y are the H2 and CO reaction orders, respectively.b pre-exponential factor was estimated for the temperature range of 210-240°C. Rate data were adjusted to the desired temperature with activation energy of 129 kJ/mol found from power-law fit.
Rate data are also plotted in Arrhenius form in Figure 6.3 for different feed gas
concentrations and activation energies of 107-169 kJ/mol are predicted. Interestingly, the
reaction is more temperature dependent (higher activation energy) as CO partial pressure is
decreased (constant PH2) but activation energy does not change as hydrogen partial pressure is
decreased (constant PCO).
178

Figure 6.3. Apparent activation energies for CoPt/Al2O3 at 20 bar and different feed gas concentrations.
Changes in both H2 and CO orders with temperature and activation energy with feed
concentration argue for use of a shifting-order rate expression such as Langmuir-Hinshelwood
(LH) type. The other advantage of LH model is that it can be applied more reliably for
extrapolation of rate to different temperatures and feed concentrations.
A sequence of elementary steps for the FT reaction on a cobalt catalyst is proposed in
Figure 6.4, in which CO dissociates via parallel H-assisted and unassisted routes (Carbide
mechanism). The direct CO dissociation (step 3) forms C* and O* from CO*, while subsequent
reactions with H* yield the CH2* monomers (steps 4, 10). The O* atoms formed in step 3 are
removed as H2O via stepwise reactions with H*.
In the parallel H-assisted CO activation route (step 5, Figure 6.4), CO* forms formyl
intermediates (HCO*) via reactions with H* or atomic carbon and OH* (step 5’). For cobalt
catalysts, the activation barrier for H* addition to the C-atom in CO* (to form HCO*) is
predicted from the UBI-QEP, a bond order-binding energy model, to be smaller than for
179

unassisted CO* dissociation (101 vs. 153 kJ/mol, respectively) [134]. HCO* can dissociate to
CH* and OH* with further reaction with H* or subsequent hydrogenation at the O* atom in
HCO* species can also happen to form hydroxymethylene (HCOH*) intermediates with even
much lower activation barrier of 51.9 kJ/mol [134]. HCOH* dissociation then leads to CH*
species that ultimately form monomers and initiators required for chain growth (step 10). OH*
groups formed in step 8 are removed as H2O.
Figure 6.4. Proposed elementary steps for FTS on Co catalysts.
The LH models considered in this study have been organized into two model classes: (1)
direct CO dissociation (Carbide mechanisms) and (2) hydrogen assisted dissociation and are
presented in Table 6.3 with their corresponding assumptions made to derive the rate expression.
1. 𝐶𝐶𝐶𝐶 + ∗ ↔ 𝐶𝐶𝐶𝐶∗ 2. 𝐻𝐻2 + 2 ∗ ↔ 2𝐻𝐻∗
Direct Dissociation 3. 𝐶𝐶𝐶𝐶∗ + ∗ ↔ 𝐶𝐶∗ + 𝐶𝐶∗ 4. 𝐶𝐶∗ + 𝐻𝐻∗ → 𝐶𝐶𝐻𝐻∗ + ∗
Oxygen Removal 8.𝐶𝐶∗ + 𝐻𝐻∗ ↔ 𝐶𝐶𝐻𝐻∗ + ∗
9.𝐶𝐶𝐻𝐻∗ + 𝐻𝐻∗ → 𝐻𝐻2𝐶𝐶 + 2 ∗
H-Assisted Dissociation
5. 𝐶𝐶𝐶𝐶∗ + 𝐻𝐻∗ ↔ 𝐻𝐻𝐶𝐶𝐶𝐶∗ + ∗ 5’. 𝐶𝐶𝐶𝐶∗ + 𝐻𝐻 ∗ ↔ 𝐶𝐶∗ + 𝐶𝐶𝐻𝐻∗
6. 𝐻𝐻𝐶𝐶𝐶𝐶∗ + 𝐻𝐻∗ ↔ 𝐻𝐻𝐶𝐶𝐶𝐶𝐻𝐻∗ + ∗ 7. 𝐻𝐻𝐶𝐶𝐶𝐶𝐻𝐻∗ + ∗ → 𝐶𝐶𝐻𝐻∗ + 𝐶𝐶𝐻𝐻∗
OH Removal 9.𝐶𝐶𝐻𝐻∗ + 𝐻𝐻∗ → 𝐻𝐻2𝐶𝐶 + 2 ∗
10. 𝐶𝐶𝐻𝐻∗ + 𝐻𝐻∗ → 𝐶𝐶𝐻𝐻2∗ + ∗
180

Reaction 5’ was also included in derivation of Model 8 (derivation of Model 8 is shown in
Appendix E). Each rate expression was derived with various assumptions for rate-determining
step and most abundant surface intermediates (MASI), and these are indicated in Table 6.6.
Kinetic parameters obtained by least square fits of rate data to each model and their
corresponding P-values for two-parameter and three-parameter models are reported in Tables 6.4
and 6.5, respectively. Power-law model parameters are also shown in Table 6.5 for comparison.
As mentioned in section 6.2.3 the criteria for discriminating between the models is selected to be
a P-value of above 0.1. The power-law predicts the data more reliably than LH models 2 and 6
since its P-value of 0.065 is larger than 0.030. Among the two-parameter models, it seems that
model 5 with a P-value of 0.34 provides the best fit. However, the estimated heat of CO
adsorption (the denominator term, 𝐾𝐾′𝑃𝑃𝐶𝐶𝐶𝐶) was found to be a positive value of 148 kJ/mol instead
of a negative value. Therefore, it is not consistent with physical reality, i.e. the proposed
mechanism using the CO adsorption elementary step (step 1 in Figure 6.4) to get the 𝐾𝐾′𝑃𝑃𝐶𝐶𝐶𝐶 term.
This is also true for models 1 and 3 predicting a positive value for heats of CO adsorption.
Therefore, the only two-parameter model for which its predicted kinetic parameters are
consistent with theory and has a P-value of above 0.1 is model 4, which will be used to represent
the main reaction rate expression for the deactivation study.
181
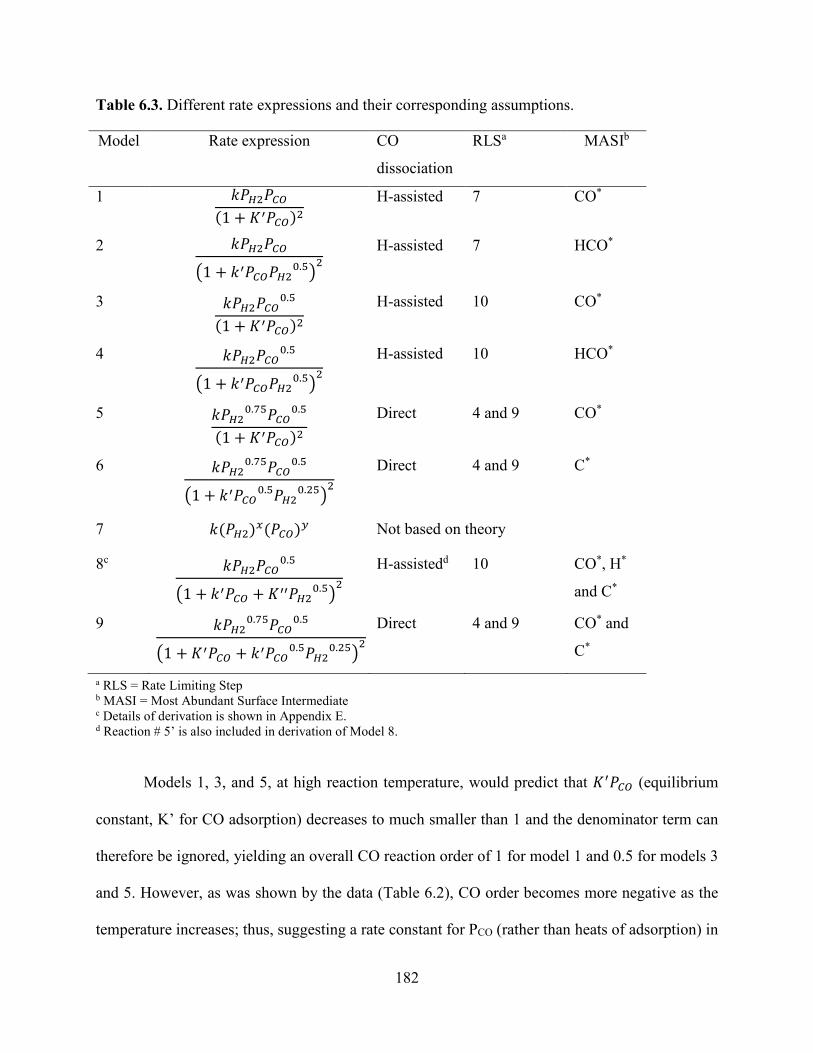
Table 6.3. Different rate expressions and their corresponding assumptions.
a RLS = Rate Limiting Step b MASI = Most Abundant Surface Intermediate c Details of derivation is shown in Appendix E. d Reaction # 5’ is also included in derivation of Model 8.
Models 1, 3, and 5, at high reaction temperature, would predict that 𝐾𝐾′𝑃𝑃𝐶𝐶𝐶𝐶 (equilibrium
constant, K’ for CO adsorption) decreases to much smaller than 1 and the denominator term can
therefore be ignored, yielding an overall CO reaction order of 1 for model 1 and 0.5 for models 3
and 5. However, as was shown by the data (Table 6.2), CO order becomes more negative as the
temperature increases; thus, suggesting a rate constant for PCO (rather than heats of adsorption) in
Model Rate expression CO
dissociation
RLSa MASIb
1 𝑘𝑘𝑃𝑃𝑂𝑂2𝑃𝑃𝐶𝐶𝐶𝐶(1 + 𝐾𝐾′𝑃𝑃𝐶𝐶𝐶𝐶)2
H-assisted 7 CO*
2 𝑘𝑘𝑃𝑃𝑂𝑂2𝑃𝑃𝐶𝐶𝐶𝐶�1 + 𝑘𝑘′𝑃𝑃𝐶𝐶𝐶𝐶𝑃𝑃𝑂𝑂20.5�
2 H-assisted 7 HCO*
3 𝑘𝑘𝑃𝑃𝑂𝑂2𝑃𝑃𝐶𝐶𝐶𝐶0.5
(1 + 𝐾𝐾′𝑃𝑃𝐶𝐶𝐶𝐶)2 H-assisted 10 CO*
4 𝑘𝑘𝑃𝑃𝑂𝑂2𝑃𝑃𝐶𝐶𝐶𝐶0.5
�1 + 𝑘𝑘′𝑃𝑃𝐶𝐶𝐶𝐶𝑃𝑃𝑂𝑂20.5�2
H-assisted 10 HCO*
5 𝑘𝑘𝑃𝑃𝑂𝑂20.75𝑃𝑃𝐶𝐶𝐶𝐶0.5
(1 + 𝐾𝐾′𝑃𝑃𝐶𝐶𝐶𝐶)2 Direct 4 and 9 CO*
6 𝑘𝑘𝑃𝑃𝑂𝑂20.75𝑃𝑃𝐶𝐶𝐶𝐶0.5
�1 + 𝑘𝑘′𝑃𝑃𝐶𝐶𝐶𝐶0.5𝑃𝑃𝑂𝑂20.25�2
Direct 4 and 9 C*
7 𝑘𝑘(𝑃𝑃𝑂𝑂2)𝑥𝑥(𝑃𝑃𝐶𝐶𝐶𝐶)𝑦𝑦 Not based on theory
8c 𝑘𝑘𝑃𝑃𝑂𝑂2𝑃𝑃𝐶𝐶𝐶𝐶0.5
�1 + 𝑘𝑘′𝑃𝑃𝐶𝐶𝐶𝐶 + 𝐾𝐾′′𝑃𝑃𝑂𝑂20.5�2
H-assistedd 10 CO*, H*
and C*
9 𝑘𝑘𝑃𝑃𝑂𝑂20.75𝑃𝑃𝐶𝐶𝐶𝐶0.5
�1 + 𝐾𝐾′𝑃𝑃𝐶𝐶𝐶𝐶 + 𝑘𝑘′𝑃𝑃𝐶𝐶𝐶𝐶0.5𝑃𝑃𝑂𝑂20.25�2
Direct 4 and 9 CO* and
C*
182

the denominator to yield an overall negative CO order at high temperatures. On the other hand,
the reaction order for H2 increases at higher temperatures suggesting a heat of adsorption term
for H2 in the denominator, which can be negligible at higher temperatures and results in more
positive overall H2 order. By considering these effects, the three-parameter model 8 (see Table
6.5) with rate expression involving a PCO term with rate constant and heat of adsorption for PH2
resulted in a rate expression with by far the best P-value of 0.48. Adding another term in the
denominator of model 5 by assuming two MASIs’ as presented in model 9 only slightly
increases the P-value to 0.37 from 0.34; however, as mentioned earlier this model is not
consistent with theory as it was found a positive value for heat of CO adsorption.
Table 6.4. Estimated kinetic parameters for two-parameter models.
Model Aa,
mmol/g/h/barx+y
E,
kJ/mol
𝐴𝐴′a,
mmol/g/h/barx+y
𝐸𝐸′(∆𝐻𝐻),
kJ/mol
P-value
1 8.1E41
± 2E41
389 ± 40 4.7E18
± 1E18
181 ± 23 0.076
2 3.7E26
± 1E26
244 ± 48 1.9E8
± 6E6
87 ± 39 0.03
3 6.8E30
± 1E30
286 ± 19 1.9E17
± 4E16
173 ± 19 0.09
4 7.1E23
± 1E23
219 ± 19 5E9
± 1E8
105 ± 25 0.10
5 2.4E28
± 2E27
260 ± 11 5.4E14
±1E8
148 ± 12 0.34
6 4.8E37
± 5.5E37
339 ± 103 1.4E13
± 9.9E12
124 ± 55 0.03
a pre-exponential unit is mmol/g/h/barx+y, where x and y are the H2 and CO reaction orders, respectively.
183

Table 6.5. Estimated kinetic parameters for three-parameter models.
Model Aa E,
kJ/mol
𝐴𝐴′a or xb,
𝐸𝐸′(∆𝐻𝐻) or yb
kJ/mol
𝐴𝐴′′a 𝐸𝐸′′ (∆𝐻𝐻),
kJ/mol
P-value
7 6E14
± 1E14
129 ±
6
0.69 ±
0.008
-0.53 ± 0.008 -- -- 0.065
8 1.8E26
± 1.4E26
234
± 126
9.2E13
± 3.8E12
137
± 67
6.8E-3
± 3.7E-3
-18.6
± 14
0.48
9 4.1E26
± 1.3E26
242
± 51
2.9E14
± 5.7E13
146
± 31
7.4E-3
± 7.5E-3
-9.3
± 139
0.37
a pre-exponential unit is mmol/g/h/barx+y, where x and y are the H2 and CO reaction orders, respectively. b x and y are the H2 and CO reaction orders, respectively used in Equation 6.9 (power-law model).
The parity plots of the preferred kinetic models with two-parameters (model 4) and three-
parameters (model 8) are shown in Figure 6.5. As discussed earlier the three-parameter model
with equilibrium constant for hydrogen and rate constant for CO in denominator clearly predicts
the data very well with r2 of 0.994.
Figure 6.5. Parity plot of best kinetic models for (a) two-parameter model 4 and (b) three-parameter model 8.
184

6.3.2 Kinetics of deactivation
Eight samples of the cobalt catalyst were tested over a period of 800-900 h, each at a
different set of CO and H2 partial pressures and a range of temperature, higher than for the
reaction kinetic studies, while flowrate was held constant (see Table 6.1). Measurement of
deactivation rate by carbon in the absence of the other deactivation mechanisms was achieved
by: (1) operating at CO conversions less than 24% and lower partial pressures of water,
conditions which favor carbon deposition while preventing water-assisted sintering and
oxidation; and (2) reducing the Co catalyst at a high temperature (450°C) to ensure that the
average crystallite size was sufficiently large to obviate sintering.
6.3.2.1 Effects of H2 and CO partial pressures
The five sets of activity-time data at 230°C for different partial pressures of H2 and CO as
shown in Table 6.1 were fit to a concentration-dependent GPLE deactivation rate model of the
form
−d𝐚𝐚 / dt = 𝑘𝑘𝑑𝑑 𝑃𝑃𝑂𝑂2𝛼𝛼 𝑃𝑃𝐶𝐶𝐶𝐶𝛽𝛽(𝒂𝒂 − 𝒂𝒂∞)𝑑𝑑 (6.10)
Activity at infinite reaction time (𝒂𝒂∞) was varied between 0 and 0.7, while deactivation
order (d) was held constant at 1; in another set of experiments, while holding 𝒂𝒂∞ constant at 0.7,
d was varied in the range of 0 to 2. Values of rate constant (𝑘𝑘𝑑𝑑), H2 and CO orders and r-squared
(r2) are reported in Table 6.6.
It is apparent from data in Table 6.6 that the fit improves at higher values of 𝒂𝒂∞;
moreover, r2 increases from 0.75 to 0.89 as deactivation order increases from 0 to 1 at a 𝒂𝒂∞ of
0.7, although, the values of r2 are the same within experimental error for d = 1 and 2. As d
185

increases from 0 to 2, H2 and CO orders increase from 0.83 and 0.95 to 1.36 and 1.83,
respectively. H2 and CO orders at 𝒂𝒂∞ of 0.7 and d of 1 were found to be 1.12 and 1.43,
respectively, indicating that the deactivation rate at 230°C increases as either or both partial
pressures of H2 and CO increase, as discussed in Chapter 5. At 230°C and 𝒂𝒂∞ = 0.7, zero, first
and second order deactivation rate constants were found to be 1.66 × 10⁻⁴, 1.66 × 10⁻⁴, and 2.16
× 10-4 day-1, respectively.
Table 6.6. Deactivation rate parameters for d = 0, 0.5, 1, and 2 with 𝐚𝐚∞ of 0.3, 0.5, 0.7 obtained from fitting five sets of activity-time data at 230°C (Figure 6.5) for runs up to ~800 h.
d = 0 d = 0.5 d = 1.0 d = 2.0 𝒂𝒂∞ 𝑘𝑘𝑑𝑑a
×104 α β r2 𝑘𝑘𝑑𝑑a
×104 α β r2 𝑘𝑘𝑑𝑑a
×104 α β r2 𝑘𝑘𝑑𝑑a
×104 α β r2
0 1.66 0.83 0.95 0.75 1.45 1.00 0.87 0.77 1.27 0.90 1.05 0.79 1.0 1.15 0.97 0.83 0.3 1.66 0.83 0.95 0.75 1.62 1.03 0.89 0.78 1.21 1.01 1.16 0.81 1.60 1.03 1.25 0.86 0.5 1.66 0.83 0.95 0.75 1.71 0.91 1. 1 0.80 1.82 0.99 1.18 0.84 2.16 1.12 1.40 0.89 0.7 1.66 0.83 0.95 0.75 1.53 1.0 1.22 0.84 1.66 1.12 1.43 0.89 2.16 1.36 1.83 0.90
a deactivation rate constant with units of bar-(α+β)day-1.
Activity-time data at 230°C, different partial pressures with corresponding 1st and zero
order GPLE fits with 𝒂𝒂∞ values of 0 and 0.7 are plotted in Figure 6.6. The linear zero order
GPLE does not fit the data well, since the slope of the data decreases with increasing time. On
the other hand, for a 𝒂𝒂∞ of 0.7, more curvature is evident which is closer to the nonlinear
deactivation profiles. Apparently, the postulated model needs to be refined. Nevertheless,
qualitative trends are captured well by the first order GPLE; it should also be emphasized that the
deactivation data are plotted over a relatively narrow range of activity. By comparison, fits of the
data to a SPLE are not even close to the data trends.
The approximate fit of the data to a 1st order GPLE with 𝒂𝒂∞ of 0.7 is consistent with
results of Argyle et al. [116] who found that a 1st order GPLE predicts deactivation rates due to
186

carbon deposition better than other models. They also reported a large non zero value of 𝒂𝒂∞
(0.56) from the first order GPLE fit of activity-time data for a 20 wt% Co/ 0.05 wt% Pt/Al2O3
reported by Moodley et al. [48]. That this value (𝒂𝒂∞ = 0.56) is somewhat lower than our value of
0.72 could be explained by obviously faster catalyst deactivation in Moodley’s experiment and
by an early (1-15 days) contribution due to sintering. Given the similar conditions for the two
studies, a rough quantitative comparison of deactivation rates is possible.
6.3.2.2 Effects of temperature
Activity-time data for FTS were obtained in the FB reactor at four relatively high reaction
temperatures (220, 230, 240, and 250°C) to study effects of reaction temperature on carbon
deactivation rates of cobalt in FTS. All FTS tests were conducted over about 800 h at 20 bar with
the same initial feed concentration (PH2 = 10 bar, PCO = 5 bar, H2/CO=2, remainder He); Runs 3,
6, 7, and 10, respectively; see Table 6.1.
187

Figure 6.6. Deactivation data for CoPt/Al2O3 catalyst as a function of time at 230°C and 20 bar fit to GPLE (Equation 6.10) with (a) 𝒂𝒂∞= 0.7 and d = 1, (b) 𝒂𝒂∞= 0.7 and d = 0, (c) 𝒂𝒂∞= 0 and d = 1.
As the initial feed concentration was the same for all four runs, activation energy for
deactivation could be estimated from the Arrhenius dependence of the concentration-independent
GPLE rate expression of the form
188
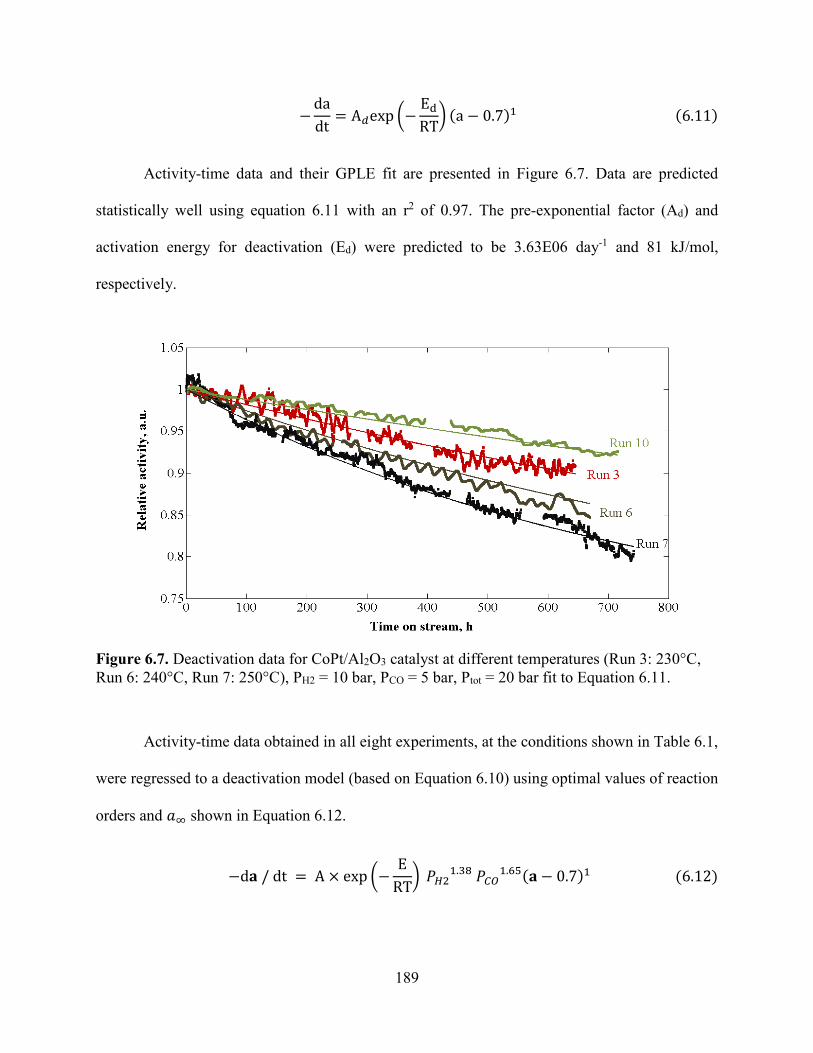
−dadt
= A𝑑𝑑exp �−EdRT� (a − 0.7)1 (6.11)
Activity-time data and their GPLE fit are presented in Figure 6.7. Data are predicted
statistically well using equation 6.11 with an r2 of 0.97. The pre-exponential factor (Ad) and
activation energy for deactivation (Ed) were predicted to be 3.63E06 day-1 and 81 kJ/mol,
respectively.
Figure 6.7. Deactivation data for CoPt/Al2O3 catalyst at different temperatures (Run 3: 230°C, Run 6: 240°C, Run 7: 250°C), PH2 = 10 bar, PCO = 5 bar, Ptot = 20 bar fit to Equation 6.11.
Activity-time data obtained in all eight experiments, at the conditions shown in Table 6.1,
were regressed to a deactivation model (based on Equation 6.10) using optimal values of reaction
orders and 𝑎𝑎∞ shown in Equation 6.12.
−d𝐚𝐚 / dt = A × exp �−E
RT� 𝑃𝑃𝑂𝑂21.38 𝑃𝑃𝐶𝐶𝐶𝐶1.65(𝐚𝐚 − 0.7)1 (6.12)
189

The pre-exponential factor and activation energy based on all 8 runs were found to be
71.5 bar-3.03day-1 and 72 kJ/mol, respectively.
Figure 6.8 shows a parity plot of experimental and calculated values of activity for all
eight deactivation data sets regressed to a GPLE form represented in Equation 6.12. Each data
point in Figure 6.8 represents an average of activities over a period of 100 h.
Figure 6.8. Parity plot of an overall deactivation model (Equation 6.12) for all the deactivation data (Runs 1-7 and 10). Each data point is an average of activities over a period of 100 h.
6.3.2.3 Comparison of deactivation kinetics with literature
Recently, Argyle et al. [116] studied the modeling of previously published experimental
deactivation data for Co FT catalysts using GPLE expressions. They deconvoluted the sintering
and/or cobalt aluminate formation from the overall deactivation rate enabling their independent
calculation of deactivation kinetic parameters for carbon deposition. As shown in Table 6.7, at
the same operating conditions (T = 230°C, H2/CO = 2, and P = 20 bar), for similar cobalt
catalysts and with carbon deposition as the principal deactivation mechanism, the reported 1st
190

order deactivation rate constant is 3.7E-02 day-1 for a Sasol Co FT catalyst, which is two times
higher than determined for the cobalt catalyst used in this study (1.7E-02 day-1). Moreover,
limiting activity for our catalyst is predicted to be 0.7 compared with 0.56 for Sasol Co catalyst.
Activity is predicted to drop to 71% of the initial activity at 200 days for the cobalt catalyst in
this study calculated from 1st order concentration-independent GPLE form. However, for the
Sasol cobalt catalyst the activity at 200 days is estimated to reach the limiting activity of 56%. At
a reaction temperature of 250°C the deactivation rate constant is shown to be 3.0E-02/d which is
20% lower than the value for Sasol’s cobalt catalyst operated at 230°C.
Moodley et al. [4] also investigated effects of temperature on the deactivation of a cobalt
FT catalyst in FTS at 20 bar, H2/CO of 1.6 and TOS of 20 days at three different temperatures of
240, 260, 270°C. They reported an activation energy of 69 kJ/mol for the formation of polymeric
carbon. The activation energy found in the present study (65 kJ/mol) is in very good agreement
with their value.
Table 6.7. Comparison of the deactivation rate constants and 𝐚𝐚∞ values of this study with Sasol for cobalt FT catalyst.
Catalyst and reference TOS, days
T, °C H2/CO P, bar
kdb,
day-1 Ed
c, kJ/mol
𝑎𝑎∞d
25 wt% Co/0.25 wt% Pt/Al2O3 This study
27-30
230 250
2 2
20 20
1.7E-02 3.0E-02
72 0.7 0.7
20 wt% Co/0.05 wt% Pt/Al2O3 Moodley et al. [4, 48] – Sasol a
18-55 230 2 20 3.7E-02 69 0.56
a The deactivation rate constants and 𝑎𝑎∞ values were reported in the work by Argyle et al. [116] for deactivation only by carbon deposition b kd is the first order deactivation rate constant for carbon deposition with units of day-1 c Activation energy for deactivation by carbon with unites of kJ/mol d Normalized activity a is defined as the rate at time t divided by the initial rate; 𝑎𝑎∞ is the asymptotic normalized activity.
191

6.4 Conclusions
1- The dependence of reaction rate on PH2 becomes more positive and on PCO becomes
more negative as temperature increases; in fact CO order changes from +0.31 to -0.64 as
temperature increases from 210 to 240°C, respectively.
2- Activation energy does not change with PH2 at constant PCO while it does increase
from 107 to 169 kJ/mol as PCO decreases from 6 to 2.7 bar.
3- A denominator term which includes PCO should increase with temperature to account
for negative dependence of CO with temperature; using θC as a MASI is consistent with this.
4- Addition of K’’PH2 as a 3rd denominator term allows change in PH2 dependency and
thus improves the fit of all the data to give the best fit.
5- 1st order GPLE with 𝒂𝒂∞ of 0.7 was found to reasonably predict the deactivation data.
6- At 230°C, deactivation rate by carbon deposition increases as both partial pressures of
CO and H2 increase with H2 order of 1.38 and CO order of 1.65 using 1st order GPLE with 𝒂𝒂∞ of
0.7.
7- At H2/CO of 2, deactivation rate increases with increasing temperature from 220 to
250°C with activation energy of 72 kJ/mol.
192

Chapter 7 Accomplishments, Future Work and Recommendation
7.1 Accomplishments
Five most important overall contributions of this work to the technology of FT:
1- We developed a very active and stable supported Fe FT catalyst that is more active than
any supported Fe FT catalyst previously reported and competitive with the best
unsupported catalysts. More importantly, the catalyst is extremely stable, as evidenced by
the fact that after 700 h on stream, its activity and productivity are still increasing. The
key factor to this development was hydrothermally stable silica-doped alumina with large
pore volume and pore diameter.
2- We developed a kinetic model for Co FT catalyst based on a realistic sequence of
elementary steps which includes hydrogen-assisted dissociation of adsorbed CO and a
parallel step which leads to carbon on the surface. It fits all 24 data points over a large
range of temperature, PH2 and PCO and the fit was excellent (r2 value = 0.996).
3- We carried out an extensive study to investigate the effects of H2 and CO partial
pressures and temperature on the deactivation by carbon for Co FT catalyst by running
twelve experiments over 800 h TOS, each at different T, PH2, and PCO. We provided, for
the first time, new data defining quantitatively the long-term deactivation by carbon
deposition in the absence of the other deactivation mechanisms.
193

4- We developed a deactivation model as a function of time, T, PH2, and PCO which fits eight
deactivation runs including ~ 20,000 data points with r2 value of 0.91. We also
determined the activation energy for deactivation of 72 kJ/mol (at H2/CO = 2).
5- We designed and developed a unique wax-extraction system which enabled us to
characterize spent catalysts with ex-situ techniques after removing the wax. All the
important steps including wax-extraction, vacuum drying, and passivation are done in the
same system without the need of transferring the catalyst after wax-extraction in a glove-
box to drying or passivation set-ups.
Ten specific discoveries/observations:
1- Large pore volume and pore diameters of the support accommodate higher metal loading
without pore blocking. They may also aid uniform distribution of the active phase into
the pores and greater accessibility of the active phase to the reactants; in fact, a
correlation between intrinsic activity and pore diameter of the support was found in this
study.
2- Large pore volume and pore diameters of the support also accommodate a greater amount
of carbon and help in retarding the deactivation due to blockage of the pores by carbon
deposits.
3- Silica is a more effective stabilizer than La for alumina supports. Silica as a dopant in
alumina suppresses the phase transformation of γ-Al2O3 to α-Al2O3 at elevated
temperatures and thus it enables effective dehydroxylation of the alumina surface at high
temperatures.
194

4- Higher calcination temperature of the support results in greater removal of the hydroxyl
groups and more effective reduction/carbiding (higher EOR), which consequently lead to
higher activity.
5- Silica may anchor the active phase to the alumina surface and prevents active phase
crystallites from deactivation by sintering.
6- The absolute values of H2 and CO partial pressures effect deactivation by carbon for Co
FT catalyst independently. In fact, deactivation rate increases with either increasing H2 or
CO partial pressures.
7- A higher quantity of polymeric carbon formed during FT reaction leads to higher
deactivation rates.
8- A higher quantity of polymeric carbon also correlates with Co sites lost during reaction.
9- The effect of temperature on deactivation by carbon for Co FT catalyst depends on feed
composition and/or H2/CO ratio. At H2/CO of 2, deactivation rate increases with
increasing temperature; however, at H2/CO of 1, the opposite trend was found;
deactivation rate decreases with increasing temperature.
10- Regardless of temperature, methane selectivity increases as catalyst deactivates during
FT reaction at high partial pressures of CO. However, methane selectivity was constant
over 800 h at low CO partial pressure (PCO = 5 bar).
195

7.2 Future work and recommendation
Based on the foregoing observations, the following future scientific investigations and
activities are recommended.
7.2.1 Catalyst preparation and pretreatment
• As shown in Chapter 4, support material can significantly affect the activity, selectivity,
and stability of the final catalyst. One of the important factors is the calcination
temperature of the support. A paper that we’re currently writing is considering four
calcination temperatures of silica-doped alumina (AlSi) (700, 900, 1100, 1200°C) to
study the effect of support calcination temperature on the properties of the final catalyst.
The preliminary H2-TPR, syngas-TPR and Mossbauer spectroscopy results show that
supported Fe catalyst is more reducible with higher extent of reduction and carbiding
when the AlSi is calcined at higher temperature. XRD results are also confirming mainly
Fe3O4 phase for the catalyst with a support calcined at temperatures of 700 and 900°C,
while both Fe3O4 and Fe0 are present at higher calcination temperatures (1100 and
1200°C). FB tests for 40Fe/AlSi catalysts demonstrate over a factor of four increase in
the activity when the AlSi was calcined at 1200°C compared with 700°C.
• 40Fe/AlSi prepared and tested in this study showed promising activity and stability; in
fact, the activity is 3-6 times higher than other reported supported Fe catalysts [9, 17] and
no deactivation was observed in 700 h TOS. The only drawback of this catalyst is its
undesirably high methane selectivity. Therefore, studying the effect of preparation
variables on the methane selectivity is of primary interest. One of the important variables
that has a large effect on methane selectivity is potassium loading and its precursor. It has
been shown that chelated metal complexes such as citrates would result in better
196
dispersion [135]. Furthermore, an unsupported Fe catalyst prepared in this lab with Fe,
Cu and K citrate precursors showed very promising methane selectivity but low activity.
Doubling the potassium loading did not affect the methane selectivity as shown in
Chapter 3; however, it should be noted that it was tested on St. Gobein alumina support
(rather than AlSi) and potassium bicarbonate was added at the end in a separate step
(sequential impregnation). Recently, we’ve tested an Fe catalyst supported on AlSi with
eight parts potassium using potassium citrate prepared by a co-impregnation method to
have better Fe and K contact. Methane selectivity was only 3% compared with 9% for
40Fe/AlSi reported in Chapter 4 tested at 260°C, H2/CO of 1, and 20 bar; however, the
catalyst with higher potassium deactivated by 25% after 300 h TOS. More tests are
needed to identify separate effects of potassium citrate and higher potassium loading.
More specifically, two catalysts are being prepared; namely, 8KB-40Fe/AlSi and 4KC-
40Fe/AlSi (KB = potassium bicarbonate and KC = potassium citrate).
• All of the catalysts were prepared at the same copper loading of 7.5 parts per 100 part Fe.
Copper is known to be a hydrogenolysis catalyst which can favor the formation of light
hydrocarbons. It would be interesting to study the effect of different loadings of copper
on activity and selectivity. A catalyst with lower Cu loading (4Cu/100Fe) was prepared
and will be tested. In addition, because of the synergistic effect of Cu and K, they should
be optimized simultaneously for supported Fe catalyst. The optimal Cu and K loadings
for unsupported Fe catalyst were found to be 1 and 2 nm-2, respectively [10].
• Others have shown a nearly 100% increase in catalyst activity and significant effect on
selectivity by using an optimized pretreatment for iron FT catalysts [8, 9, 12]. For
example, very recently Chun et al. [136] reported a highly selective Fe FT catalyst
197

pretreated in CO2-containing syngas. The reduction/carbiding of catalysts in this study
were not optimized, but significant effect in activity and selectivity are expected from
optimized catalyst pretreatment and reduction/carbiding procedures.
• Some variables that may affect cobalt catalyst properties especially methane selectivity
but which were not investigated in this work include, but are not limited to, higher
calcination temperature of the support (1200°C), modification of the support with basic
elements such as Ba, K, Mg, or Mn, use of cobalt citrate as a precursor, and co-
impregnation preparation (adding cobalt and noble metal in each step).
7.2.2 Main reaction kinetics and modeling
• There is very limited kinetic data for supported Fe catalyst since other researchers have
failed to prepare an active supported Fe catalyst. A partial pressure study for the most
active catalyst (40Fe/AlSi; Appendix C) of this study was done at a single temperature of
250°C; however, it would be very valuable to do a partial pressure study at different
temperatures similar to what was done for the cobalt catalyst (Chapter 6) and compare the
kinetics of the supported Fe catalyst with unsupported Fe catalysts or even with
supported cobalt catalysts.
• More than a dozen kinetic rate expressions have been proposed for unsupported Fe
catalyst and it is virtually impossible to distinguish between some models based on
statistics when only macrokinetic data are available. Therefore, a combination of
macrokinetic and microkinetic modeling are needed to better understand the mechanisms
involving CO hydrogenation. This project is also in progress as we are still developing a
microkinetic model for supported cobalt catalyst. Pre-exponential factors for the
microkinetic model are found based on transition state theory and activation energies are
198

estimated by UBI-QEP [134] using heats of adsorption for C, H, and O. This work can
also be done for supported Fe catalyst but kinetic data at different temperatures are
needed.
7.2.3 Deactivation kinetics and modeling
• As shown in Chapter 4, all of the supported Fe catalysts showed some deactivation within
300-400 h TOS; except, Fe supported on AlSi which was extremely stable; in fact, the
activity was increasing after a month of operation. The science of supported Fe FT
catalyst will benefit from future studies on understanding why the Fe catalyst supported
on AlSi does not deactivate while the other catalysts supported on different alumina
supports do deactivate. We’ve recently started a project to study that by characterizing
the freshly carbided samples and wax-extracted spent catalyst samples of 20Fe/AlSi,
20Fe/AlG, and 20Fe/AlA.
• There is still a lot to learn for the deactivation of cobalt catalysts. A few of the things,
which were not investigated in this work include, but are not limited to: (1) the effect of
deactivation on product distribution by analyzing liquid and wax products, (2) the effect
of conversion on the deactivation of cobalt catalysts by carbon deposition in the absence
of other deactivation mechanisms; this can be done using a catalyst with relatively large
cobalt crystallite sizes, and (3) the effects of partial pressures of H2 and CO at higher
temperatures rather than just at 230°C, which was carried out in this study.
• Theoretical works, such as DFT calculations, are needed to understand the effect of
reconstruction on catalyst deactivation or activation at different temperatures and carbon
coverages. This work will help in understanding why faster deactivation was observed at
199

lower temperatures and high CO partial pressures, while deactivation rate increases with
temperature at low CO partial pressures.
• Developing a deactivation model based on theory can impact FT science and technology.
The deactivation mechanism by carbon deposition via C2Hx species to form benzene
rings, which can also include hydrocarbon chains, proposed by Niemanstverdriet’s group
[40, 43] can be used as a starting point to derive deactivation rate expressions based on
elementary steps for deactivation by carbon deposition.
200

References
[1] R. Oukaci, A.H. Singleton, J.G. Goodwin Jr, Comparison of patented Co F–T catalysts using fixed-bed and slurry bubble column reactors, Applied Catalysis A: General, 186 (1999) 129-144.
[2] E.d. Smit, B.M. Weckhuysen, The renaissance of iron-based Fischer-Tropsch synthesis: on the multifaceted catalyst deactivation behaviour, Chemical Society Reviews, 37 (2008) 2758-2781.
[3] J. Sarkar, Platt's International Coal Report, in, 2007, pp. 17.
[4] D.J. Moodley, On the Deactivation of Cobalt-based Fischer-Tropsch Synthesis Catalysts, in, Eindhoven University of Technology, 2008.
[5] D.J. Moodley, J.v.d. Loosdrecht, A.M. Saib, J.W. Niemantsverdriet, Advances in Fischer-Trospch Synthesis, Catalysts, and Catalysis, in: B.H. davis, M.L. Occelli (Eds.) Advances in Fischer-Trospch Synthesis, Catalysts, and Catalysis, CRC Press Taylor & Francis group, 2010, pp. 49-81.
[6] J.R. Rostrup-Nielsen, J. Sehested, J.K. Nørskov, Hydrogen and synthesis gas by steam- and C02 reforming, in: Advances in Catalysis, Academic Press, 2002, pp. 65-139.
[7] D.B. Bukur, M. Koranne, X. Lang, K.R.P.M. Rao, G.P. Huffman, Pretreatment effect studies with a precipitated iron Fischer-Tropsch catalyst Applied Catalysis A: General, 126 (1995) 85-113.
[8] D.B. Bukur, X. Lang, Y. Ding, Pretreatment effect studies with a precipitated iron Fischer–Tropsch catalyst in a slurry reactor, Applied Catalysis A: General, 186 (1999) 255-275.
[9] J. Xu, C.H. Bartholomew, J. Sudweeks, D.L. Eggett, Design, synthesis, and catalytic properties of silica-supported, Pt-promoted iron Fischer–Tropsch catalysts, Topics in Catalysis, 26 (2003) 55.
[10] S. Li, S. Krishnamoorthy, A. Li, G.D. Meitzner, E. Iglesia, Promoted Iron-Based Catalysts for the Fischer–Tropsch Synthesis: Design, Synthesis, Site Densities, and Catalytic Properties, Journal of Catalysis, 206 (2002) 202-217.
[11] S. Li, G.D. Meitzner, E. Iglesia, Structure and Site Evolution of Iron Oxide Catalyst Precursors during the Fischer−Tropsch Synthesis, The Journal of Physical Chemistry B, 105 (2001) 5743-5750.
201

[12] D.B. Bukur, X. Lang, Highly Active and Stable Iron Fischer−Tropsch Catalyst for Synthesis Gas Conversion to Liquid Fuels, Industrial & Engineering Chemistry Research, 38 (1999) 3270–3275.
[13] D.B. Bukur, X. Lang, D. Mukesh, W.H. Zimmerman, M.P. Rosynek, C. Li, Binder/support effects on the activity and selectivity of iron catalysts in the Fischer-Tropsch synthesis, Industrial & Engineering Chemistry Research, 29 (1990) 1588–1599.
[14] Y. Yang, H.-W. Xiang, L. Tian, H. Wang, C.-H. Zhang, Z.-C. Tao, Y.-Y. Xu, B. Zhong, Y.-W. Li, Structure and Fischer–Tropsch performance of iron–manganese catalyst incorporated with SiO2, Applied Catalysis A: General, 284 (2005) 105-122.
[15] H.-J. Wan, B.-S. Wu, X. An, T.-Z. Li, Z.-C. Tao, H.-W. Xiang, Y.-W. Li, Effect of Al2O3 Binder on the Precipitated Iron-Based Catalysts for Fischer-Tropsch Synthesis, Journal of Natural Gas Chemistry, 16 (2007) 130-138.
[16] Y. Yang, H. Xiang, R. Zhang, B. Zhong, Y. Li, A highly active and stable Fe-Mn catalyst for slurry Fischer–Tropsch synthesis, Catalysis Today, 106 (2005) 170-175.
[17] R.J. O’Brien, L. Xu, S. Bao, A. Raje, B.H. Davis, Activity, selectivity and attrition characteristics of supported iron Fischer–Tropsch catalysts, Applied Catalysis A: General, 196 (2000) 173-178.
[18] D.B. Bukur, C. Sivaraj, Supported iron catalysts for slurry phase Fischer–Tropsch synthesis, Applied Catalysis A: General, 231 (2002) 201-214.
[19] R.J. O'Brien, L. Xu, R.L. Spicer, B.H. Davis, Activation study of precipitated iron Fischer-tropsch catalysts, Energy & Fuels, 10 (1996) 921-926.
[20] M. Rameswaran, C.H. Bartholomew, Effects of preparation, dispersion, and extent of reduction on activity/selectivity properties of iron/alumina CO hydrogenation catalysts, Journal of Catalysis, 117 (1989) 218.
[21] E. Iglesia, Design, synthesis, and use of cobalt-based Fischer-Tropsch synthesis catalysts, Applied Catalysis A: General, 161 (1997) 59-78.
[22] E. Iglesia, S.L. Soled, R.A. Fiato, Fischer-Tropsch Synthesis on Cobalt and Ruthenium. Metal Dispersion and Support Effects on Reaction Rate and Selectivity, Journal of Catalysis, 137 (1992) 212-224.
[23] B.G. Johnson, C.H. Bartholomew, D.W. Goodman, The role of surface structure and dispersion in CO hydrogenation on cobalt, Journal of Catalysis, 128 (1991) 231-247.
[24] N. Fischer, E. van Steen, M. Claeys, Structure sensitivity of the Fischer–Tropsch activity and selectivity on alumina supported cobalt catalysts, Journal of Catalysis, 299 (2013) 67-80.
202

[25] J.P. den Breejen, P.B. Radstake, G.L. Bezemer, J.H. Bitter, V. Frøseth, A. Holmen, K.P.d. Jong, On the Origin of the Cobalt Particle Size Effects in Fischer−Tropsch Catalysis, Journal of the American Chemical Society, 131 (2009) 7197-7203.
[26] N. Balakrishnan, B. Joseph, V.R. Bhethanabotla, Effect of Pt and Ru promoters on deactivation of Co catalysts by C deposition during Fischer–Tropsch synthesis: A DFT study, Applied Catalysis A: General, 462– 463 (2013) 107– 115.
[27] J. van de Loosdrecht, B. Balzhinimaev, J.A. Dalmon, J.W. Niemantsverdriet, S.V. Tsybulya, A.M. Saib, P.J. van Berge, J.L. Visagie, Cobalt Fischer-Tropsch synthesis: Deactivation by oxidation?, Catalysis Today, 123 (2007) 293-302.
[28] C.H. Bartholomew, R.J. Farrauto, Fundamentals of Industrial Catalytic Processes, Second ed., John Wiley & Sons, 2006.
[29] C.H. Bartholomew, P.K. Agrawal, J.R. Katzer, Sulfur Poisoning of Metals, in: H.P. D.D. Eley, B.W. Paul (Eds.) Advances in Catalysis, Academic Press, 1982, pp. 135-242.
[30] N.E. Tsakoumis, M. Rønning, Ø. Borg, E. Rytter, A. Holmen, Deactivation of cobalt based Fischer–Tropsch catalysts: A review, Catalysis Today, 154 (2010) 162-182.
[31] M. Sadeqzadeh, S. Chambrey, S. Piché, P. Fongarland, F. Luck, D. Curulla-Ferré, D. Schweich, J. Bousquet, A.Y. Khodakov, Deactivation of a Co/Al2O3 Fischer–Tropsch catalyst by water-induced sintering in slurry reactor: Modeling and experimental investigations, Catalysis Today, 215 (2013) 52-59.
[32] M. Sadeqzadeh, J. Hong, P. Fongarland, D. Curulla-Ferré, F. Luck, J.B.D. Schweich, A.Y. Khodakov, Mechanistic Modeling of Cobalt Based Catalyst Sintering in a Fixed Bed Reactor under Different Conditions of Fischer−Tropsch Synthesis, Industrial & Engineering Chemistry Research, 51 (2012) 11955−11964.
[33] M.J. Overett, B. Breedt, E.d. Plessis, W. Erasmus, J.v.d. Loosdrecht, Sintering as a deactivation mechanism for an alumina supported cobalt Fischer-Tropsch synthesis catalyst, in: Prepr. Pap.-Am. Chem. Soc., Div. Petr. Chem., 2008, pp. 126-128.
[34] A.M. Saib, A. Borgna, J. van de Loosdrecht, P.J. van Berge, J.W. Niemantsverdriet, XANES study of the susceptibility of nano-sized cobalt crystallites to oxidation during realistic Fischer–Tropsch synthesis, Applied Catalysis A: General, 312 (2006) 12-19.
[35] A.M. Saib, D.J. Moodley, I.M. Ciobîcă, M.M. Hauman, B.H. Sigwebela, C.J. Weststrate, J.W. Niemantsverdriet, J. van de Loosdrecht, Fundamental understanding of deactivation and regeneration of cobalt Fischer–Tropsch synthesis catalysts, Catalysis Today, 154 (2010) 271-282.
[36] P.H. Bolt, in, University of Utrecht, 1994.
203

[37] A.M. Hilmen, D. Schanke, K.F. Hanssen, A. Holmen, Study of the effect of water on alumina supported cobalt Fischer–Tropsch catalysts, Applied Catalysis A: General, 186 (1999) 169-188.
[38] G. Jacobs, T.K. Das, P.M. Patterson, J. Li, L. Sanchez, B.H. Davis, Fischer–Tropsch synthesis XAFS: XAFS studies of the effect of water on a Pt-promoted Co/Al2O3 catalyst, Applied Catalysis A: General, 247 (2003) 335-343.
[39] D.J. Moodley, A.M. Saib, J.v.d. Loosdrecht, C.A. Welker-Nieuwoudta, B.H. Sigwebela, J.W. Niemantsverdriet, The impact of cobalt aluminate formation on the deactivation of cobalt-based Fischer–Tropsch synthesis catalysts, Catalysis Today, 171 (2011) 192-200.
[40] C.J. Weststrate, A.C. Kizilkaya, E.T.R. Rossen, M.W.G.M. Verhoeven, I.M. Ciobica, A.M. Saib, J.W. Niemantsverdriet, Atomic and Polymeric Carbon on Co(0001): Surface Reconstruction, Graphene Formation, and Catalyst Poisoning, Journal of Physical Chemistry C, 116 (2012) 11575-11583.
[41] J.C.W. Swart, A Theoretical View on Deactivation of Cobalt-Based Fischer-Tropsch Catalysts, in: Department of Chemical Engineering, University OF Capetown, 2008.
[42] J.C.W. Swart, L.M. Ciobica, R.A. van Santen, E. van Steen, Intermediates in the formation of graphitic carbon on a flat FCC-Co(111) surface, Journal of Physical Chemistry C, 112 (2008) 12899-12904.
[43] C.J. Weststrate, I.M. Ciobica, A.M. Saib, D.J. Moodley, J.W. Niemantsverdriet, Fundamental issues on practical Fischer–Tropsch catalysts: Howsurface science can help, Catalysis Today, 228 (2014) 106-112.
[44] I.J.C. Geerlings, M.C. Zonnevylle, C.P.M. De Groot, The Fischer-Tropsch reaction on a cobalt (0001) single crystal, Catalysis Letters, 5 (1990) 309-314.
[45] T. Koerts, The reactivity of surface carbonaceous intermediates, in, Eindhoven University of Technology, 1992.
[46] D.-K. Lee, J.-H. Lee, S.-K. Ihm, Effect of Carbon Deposits on Carbon Monoxide Hydrogenation over Alumina-Supported Cobalt Catalyst, Applied Catalysis, 36 (1988) 199-207.
[47] C. Mirodatos, E. Brum Pereira, A. Gomez Cobo, J.A. Dalmon, G.A. Martin, CO hydrogenation over Ni- and Co-based catalysts: Influence of alkali addition on morphological and catalytic properties, Topics in Catalysis, 2 (1995) 183-192.
[48] D.J. Moodley, J. van de Loosdrecht, A.M. Saib, M.J. Overett, A.K. Datye, J.W. Niemantsverdriet, Carbon deposition as a deactivation mechanism of cobalt-based Fischer-Tropsch synthesis catalysts under realistic conditions, Applied Catalysis A: General, 354 (2009) 102-110.
204

[49] D. Peña, A. Griboval-Constant, V. Lecocq, F. Diehl, A.Y. Khodakov, Influence of operating conditions in a continuously stirred tank reactor on the formation of carbon species on alumina supported cobalt Fischer–Tropsch catalysts, Catalysis Today, 215 (2013) 43– 51.
[50] D.-K. Lee, J.-H. Lee, S.-K. Ihm, Effect of Carbon Deposits on Carbon Monoxide Hydrogenation over Alumina-Supported Cobalt Catalyst, Applied Catalysis, 36 (1988) 199-207.
[51] A. Barbier, A. Tuel, I. Arcon, A. Kodre, G.A. Martin, Characterization and catalytic behavior of Co/SiO2 catalysts: Influence of dispersion in the Fischer-Tropsch reaction, Journal of Catalysis, 200 (2001) 106-116.
[52] V. Gruver, X. Zhan, J. Engman, H.J. Robota, S.L. Suib, M. Polverejan, Deactivation of a Fischer-Tropsch catalyst through the formation of cobalt carbide under laboratory slurry reactor conditions, in: Prepr. Pap.-Am. Chem. Soc. Div. Pet. Chem., 2004, pp. 192-194.
[53] G. Jacobs, P.M. Patterson, Y. Zhang, T. Das, J. Li, B.H. Davis, Fischer–Tropsch synthesis: deactivation of noble metal-promoted Co/Al2O3 catalysts, Applied Catalysis A: General, 233 (2002) 215-226.
[54] A. Tavasoli, R.M.M. Abbaslou, A.K. Dalai, Deactivation behavior of ruthenium promoted Co/-gamma-Al2O3 catalysts in Fischer-Tropsch synthesis, Applied Catalysis A: General, 346 (2008) 58-64.
[55] O. Ducreux, J. Lynch, B. Rebours, M. Roy, P. Chaumette, In situ characterisation of cobalt based fischer-tropsch catalysts : A new approach to the active phase, in: A. Parmaliana, D. Sanfilippo, F. Frusteri, A. Vaccari, F. Arena (Eds.) Studies in Surface Science and Catalysis, Elsevier, 1998, pp. 125-130.
[56] F. Tihay, G. Pourroy, M. Richard-Plouet, A.C. Roger, A. Kiennemann, Effect of Fischer–Tropsch synthesis on the microstructure of Fe–Co-based metal/spinel composite materials, Applied Catalysis A: General, 206 (2001) 29-42.
[57] G.L. Bezemer, J.H. Bitter, H.P.C.E. Kuipers, H. Oosterbeek, J.E. Holewijn, X. Xu, F. Kapteijn, A.J. van Dillen, K.P. de Jong, Cobalt Particle Size Effects in the Fischer−Tropsch Reaction Studied with Carbon Nanofiber Supported Catalysts, Journal of the American Chemical Society, 128 (2006) 3956-3964.
[58] I.M. Ciobica, R.A.v. Santen, P.J.v. Berge, J.v.d. Loosdrecht, Adsorbate induced reconstruction of cobalt surfaces, Surface Science, 602 (2008) 17–27.
[59] J. Wilson, C. de Groot, Atomic-Scale Restructuring in High-Pressure Catalysis, The Journal of Physical Chemistry, 99 (1995) 7860-7866.
[60] I.M. Ciobica, R.A. van Santen, Carbon Monoxide Dissociation on Planar and Stepped Ru(0001) Surfaces, The Journal of Physical Chemistry B, 107 (2003) 3808-3812.
205

[61] C.H. Bartholomew, B.F. Woodfield, B. Huang, R.E. Olsen, L. Astle, Method for making highly porous, stable metal oxide with a controlled pore structure, in: Brigham Young University, USA, 2011.
[62] M.K. Mardkhe, Facile Synthesis and Characterization of a Thermally Stable Silica-Doped Alumina with Tunable Surface Area, Porosity, and Acidity, in: Department of Chemistry and Biochemistry, Brigham Young University, Provo, 2014.
[63] M.K. Mardkhe, B.F. Woodfield, C.H. Bartholomew, A method of producing thermally stable and high surface area Al2O3 catalyst supports, in: Brigham Young University, USA, 2013.
[64] S. Liu, Q. Liu, J. Boerio-Goates, B.F. Woodfield, Preparation of a wide array of ultra-high purity metals, metal oxides, and mixed metal oxides with uniform particle sizes, Journal of Advanced Materials, 39 (2007) 18-23.
[65] B. Huang, C.H. Bartholomew, B.F. Woodfield, Improved calculations of pore size distribution for relatively large, irregular slit-shaped mesopore structure, Microporous and Mesoporous Materials, 184 (2014) 112-121.
[66] C. Chu, M. Hamidy, K. Nobe, Pore-size distributions of coper oxide-alumina catalysts, Journal of Chemical & Engineering Data, 16 (1971) 327–331.
[67] B.L. Critchfield, Statistical Methods For Kintetic Modeling Of Fischer-Tropsch Synthesis On A Supported Iron Catalyst, in, Brigham Young University, Provo, 2006.
[68] D. Massiot, F. Fayon, M. Capron, I. King, S. Le Calvé, B. Alonso, J.-O. Durand, B. Bujoli, Z. Gan, G. Hoatson, Modelling one- and two-dimensional solid-state NMR spectra, Magnetic Resonance in Chemistry, 40 (2002) 70-76.
[69] T. Ressler, WinXAS: a Program for X-ray Absorption Spectroscopy Data Analysis under MS-Windows, Journal of Synchrotron Radiation, 5 (1998) 118-122.
[70] B. Ravel, ATOMS: crystallography for the X-ray absorption spectroscopist, Journal of Synchrotron Radiation, 8 (2001) 314-316.
[71] J.J. Rehr, R.C. Albers, Theoretical approaches to x-ray absorption fine structure, Reviews of Modern Physics, 76 621.
[72] M. Newville, B. Ravel, D. Haskel, J.J. Rehr, E.A. Stern, Y. Yacoby, Analysis of multiple-scattering XAFS data using theoretical standards, Physica B: Condensed Matter, 208–209 (1995) 154-156.
[73] M.E. Dry, in part A, The Fischer-Tropsch Synthesis, in: J.R. Anderson, M. Boudart (Eds.), Springer-Verlag, 1981, pp. 159-255.
[74] R.B. Anderson, The Fischer-Tropsch Synthesis, Academic Press, New York, 1984.
206

[75] H.M.T. Galvis, J.H. Bitter, C.B. Khare, M. Ruitenbeek, A.I. Dugulan, K.P.d. Jong, Supported Iron Nanoparticles as Catalysts for Sustainable Production of Lower Olefins, Science, 335 (2012) 835-838.
[76] M.E. Dry, in part A, in: J.R. Anderson, M. Boudart (Eds.) The Fischer-Tropsch Synthesis, Springer-Verlag, 1981, pp. 159-255.
[77] B.H. Davis, Technology development for iron Fischer-Tropsch catalysis, in, University of Kentucky, 1999.
[78] W. Ma, G. Jacobs, U.M. Graham, B.H. Davis, Fischer-tropsch synthesis: effects of K loading on the water-gas shift reaction and liquid hydrocarbon formation rate over precipitated iron catalysts, Topics in Catalysis, 57 (2014) 561-571.
[79] K. Keyvanloo, J.B. Horton, W.C. Hecker, M.D. Argylea, Effects of Preparation Variables on an Alumina-Supported FeCuK Fischer-Tropsch Catalyst, Catalysis Science & Technology, (2014).
[80] K.M. Brunner, Novel iron catalyst and Fixed-Bed reactor model for the Fischer-Tropsch synthesis, in: Chemical Engineering Department, Brigham Young University, Provo, 2012.
[81] M.E. Dry, G.J. Oosthuizen, The correlation between catalyst surface basicity and hydrocarbon selectivity in the Fischer-Tropsch synthesis, Journal of Catalysis, 11 (1968) 18-24.
[82] C.-H. Zhang, Y. Yang, B.-T. Teng, T.-Z. Li, H.-Y. Zheng, H.-W. Xiang, Y.-W. Li, Study of an iron-manganese Fischer–Tropsch synthesis catalyst promoted with copper, Journal of Catalysis, 237 (2006) 405–415.
[83] K. Keyvanloo, W.C. Hecker, B.F. Woodfield, C.H. Bartholomew, Highly Active and Stable Supported-Iron Fischer-Tropsch Catalysts: Effects of Support Properties and SiO2 Stabilizer on Catalyst Performance, Journal of Catalysis, 319 (2014) 220-231.
[84] W. Ma, Y. Ding, V.H.C. Vazquez, D. Bukur, Study on catalytic performance and attrition stregnth of the Ruhrchemie catalyst for the Fischer-Tropsch synthesis in a stirred tank slurry reactor, Applied Catalysis A: General, 268 (2004) 99-106.
[85] K. Keyvanloo, M.K. Mardkhe, T.M. Alam, C.H. Bartholomew, B.F. Woodfield, W.C. Hecker, Supported Iron Fischer−Tropsch Catalyst: Superior Activity and Stability Using a Thermally Stable Silica-Doped Alumina Support, ACS Catalysis, 4 (2014) 1071.
[86] P.J.v. Berge, J.v.d. Loosdrecht, E.A. Caricato, S. Barradas, Process for producing hydrocarbons from a synthesis gas, and catalysts therefor, in: Sasol Technology, 1999.
[87] P. Gibson, The Development and Commercialization of a Supported Cobalt Fischer-Tropsch Synthesis Catalyst for the Sasol Gas-to-Liquids Process, in: Syngas Convention, Cape Town, South Africa, 2012.
207

[88] H.M.T. Galvis, J.H. Bitter, T. Davidian, M. Ruitenbeek, A.I. Dugulan, K.P.d. Jong, Iron Particle Size Effects for Direct Production of Lower Olefins from Synthesis Gas, Journal of the American Chemical Society, 134 (2012) 16207−16215.
[89] H.M.T. Galvis, J.H. Bitter, C.B. Khare, K.P.d. Jong, Production of lower olefins from synthesis gas, in: N.O.f.S. Research (Ed.), 2012.
[90] B.d. Tymowski, Y. Liu, C. Meny, C. Lefèvre, D. Begin, P. Nguyen, C. Pham, D. Edouard, F. Luck, C. Pham-Huu, Co–Ru/SiC impregnated with ethanol as an effective catalyst for the Fischer–Tropsch synthesis, Applied Catalysis A: General, 419-420 (2012) 31-40.
[91] M.C. Ribeiro, G. Jacobs, B.H. Davis, D.C. Cronauer, A.J. Kropf, C.L. Marshall, Fischer-Tropsch Synthesis: An In-Situ TPR-EXAFS/XANES Investigation of the Influence of Group I Alkali Promoters on the Local Atomic and Electronic Structure of Carburized Iron/Silica Catalysts, The Journal of Physical Chemistry C, 114 (2010) 7895-7903.
[92] B.L. Bhatt, E.S. Schaub, E.C. Hendorn, D.M. Herron, D.W. Studer, D.M. Brown, in: G.J. Stiegel, R.D. Srivastava (Eds.) Proceedings of the Liquefaction Contractors Review Conference, US Department of Energy, Pittsburgh, PA, 1992, pp. 403.
[93] P. Gibson, Syngas to Hydrocarbons: The Sasol Journey, in: Syngas Convention, Cape Town, South Africa, 2012.
[94] M.V. Cagnoli, S.G. Marchetti, N.G. Gallegos, A.M. Alvarez, R.C. Mercader, A.A. Yeramian, Influence of the support on the activity and selectivity of high dispersion Fe catalysts in the Fischer-Tropsch reaction, Journal of Catalysis, 123 (1990) 21-30.
[95] J. Barrault, C. Forquy, J.C. Menezo, R. Maurel, Selective hydrocondensation of CO to light olefins with alumina-supported iron catalysts, Reaction Kinetics and Catalysis Letters, 15 (1980) 153-158.
[96] T. Horiuchi, L. Chen, T. Osaki, T. Sugiyama, K. Suzuki, T. Mori, A novel alumina catalyst support with high thermal stability derived from silica-modified alumina aerogel, Catalysis Letters, 58 (1999) 89-92.
[97] S. Ek, A. Root, M. Peussa, L. Niinistö, Determination of the hydroxyl group content in silica by thermogravimetry and a comparison with 1H MAS NMR results, Thermochimica Acta, 379 (2001) 201-212.
[98] C. Picard, A. Larbot, J. Sarrazin, P. Janknecht, P. Wilderer, Ceramic membranes for ozonation in wastewater treatment, Ann. chem. Sci. Master, 26 (2001) 13-22.
[99] H. Fang, J.F. Gao, H.T. Wang, C.S. Chen, Hydrophobic porous alumina hollow fiber for water desalination via membrane distillation process, Journal of Membrane Science, 403-404 (2012) 41-46.
[100] W.H. Lee, C.H. Bartholomew, Multiple reaction states in CO hydrogenation on alumina-supported cobalt catalysts, Journal of Catalysis, 120 (1989) 56-271.
208

[101] Ø. Borg, S. Eri, E.A. Blekkan, S. Storsæter, H. Wigum, E. Rytter, A. Holmen, Fischer–Tropsch synthesis over γ -alumina-supported cobalt catalysts: Effect of support variables, Journal of Catalysis, 248 (2007) 89–100.
[102] W.H. Zimmerman, D.B. Bukur, Reaction kinetics over iron catalysts used for Fischer-Tropsch Synthesis, The Canadian Journal of Chemical Engineering, 68 (1990) 292.
[103] W. Ma, G. Jacobs, U. Graham, B. Davis, Fischer–Tropsch Synthesis: Effect of K Loading on the Water–Gas Shift Reaction and Liquid Hydrocarbon Formation Rate over Precipitated Iron Catalysts, Topics in Catalysis, 57 (2014) 561-571.
[104] J.C.W. Kuo, Two stage process for conversion of synthesis gas to high quality transportation fuels, in, Mobil Research and Developement Corp., Paulsboro, N.J., 1985.
[105] A.M. Saib, M. Claeys, E.v. Steen, Silica supported cobalt Fischer–Tropsch catalysts: effect of pore diameter of support, Catalysis Today, 71 (2002) 395–402.
[106] A.Y. Khodakov, Fischer-Tropsch synthesis: Relations between structure of cobalt catalysts and their catalytic performance, Catalysis Today, 144 (2009) 251–257.
[107] A. Brenner, J. R. L. Burwell, The surface chemistry of molybdenum in states of lower oxidation on alumina, Journal of Catalysis, 52 (1978) 353-363.
[108] C.H. Bartholomew, M.W. Stoker, L. Mansker, A. Datye, Effects of pretreatment, recation, and promoter on microphase structure and Fischer-Tropsch activity of precipitated iron catalysts, Studies in Surface Science and Catalysis, 126 (1999) 265-272.
[109] T. Horiuchi, T. Osaki, T. Sugiyama, K. Suzuki, T. Mori, Maintenance of large surface area of alumina heated at elevated temperatures above 1300 C by preparing silica-containing pseudoboehmite aerogel, Journal of Non-Crystalline Solids, 291 (2001) 187-198.
[110] W.E.E. Stone, G.M.S.E. Shafei, J. Sanz, S.A. Selim, Association of soluble aluminum ionic species with a silica-gel surface: a solid-state NMR study, The Journal of Physical Chemistry, 97 (1993) 10127-10132.
[111] F.R. Chen, J.G. Davis, J.J. Fripiat, Aluminum coordination and Lewis acidity in transition aluminas, Journal of Catalysis, 133 (1992) 263-278.
[112] M. Heemeier, M. Frank, J. Libuda, K. Wolter, H. Kuhlenbeck, M. B¨aumer, H.-J. Freund, The influence of OH groups on the growth of rhodium on alumina: a model study, Catalysis Letters, 68 (2000) 19–24.
[113] A.K. Chakraborty, Range of solid solutions of silica in spinel type phase, Advances in Applied Ceramics, 105 (2006) 297-303.
[114] R.P. Mogorosi, N. Fischer, M. Claeys, E.v. Steen, Strong-metal–support interaction by molecular design: Fe–silicate interactions in Fischer–Tropsch catalysts, Journal of Catalysis, 289 (2012) 140-150.
209

[115] G.A. Fuentes, Catalyst deactivation and steady-state activity: A generalized power-law equation model, Applied Catalysis, 15 (1985) 33-40.
[116] M.D. Argyle, T.S. Frost, C.H. Bartholomew, Cobalt Fischer–Tropsch Catalyst Deactivation Modeled Using Generalized Power Law Expressions, Topics in Catalysis, 57 (2014) 415–429.
[117] J. van de Loosdrecht, F.G. Botes, I.M. Ciobica, A. Ferreira, P. Gibson, D.J. Moodley, A.M. Saib, J.L. Visagie, C.J. Weststrate, J.W. Niemantsverdriet, 7.20 - Fischer–Tropsch Synthesis: Catalysts and Chemistry, in: J. Reedijk, K. Poeppelmeier (Eds.) Comprehensive Inorganic Chemistry II (Second Edition), Elsevier, Amsterdam, 2013, pp. 525-557.
[118] G.E.P. Box, Fitting empirical data, Annals of the New York Academy of Sciences, 86 (1960) 792–816.
[119] P.G. Menon, Coke on catalysts - harmful, harmless, invisible and beneficial types Journal of Molecular Catalysis, 59 (1990) 207-220.
[120] G. Jacobs, P.M. Patterson, Y. Zhang, T. Das, J. Li, B.H. Davis, Fischer–Tropsch synthesis: deactivation of noble metal-promoted Co/Al2O3 catalysts, Applied Catalysis A: General, 233 (2002) 215–226.
[121] M.E. Dry, Sasol's Fischer-Tropsch experience, Hydrocarbon Processing, 61 (1982) 121-124.
[122] M.K. Niemela, A.O.I. Krause, The long-term performance of Co / SiO2 catalysts in CO hydrogenation, Catalysis Letters, 42 (1996) 161-166.
[123] H.W. Pennline, S.S. Pollack, Deactivation and regeneration of a promoted transition-metal-zeolite catalyst, Industrial & Engineering Chemistry Product Research and Development, 25 (1986) 11-14.
[124] M. Bremaud, P. Fongarland, J. Anfray, S. Jallais, D. Schweich, A.Y. Khodakov, Influence of syngas composition on the transient behavior of a Fischer–Tropsch continuous slurry reactor, Catalysis Today, 106 (2005) 137-142.
[125] D. Peña, A. Griboval-Constant, C. Lancelot, M. Quijada, N. Visez, O. Stéphan, V. Lecocq, F. Diehl, A.Y. Khodakov, Molecular structure and localization of carbon species in aluminasupported cobalt Fischer–Tropsch catalysts in a slurry reactor, Catalysis Today, 228 (2014) 65-76.
[126] W. Zhou, J.-G. Chen, K.-G. Fang, Y.-H. Sun, The deactivation of Co/SiO2 catalyst for Fischer–Tropsch synthesis at different ratios of H2 to CO, Fuel Processing Technology, 87 (2006) 609-616.
[127] M. Sadeqzadeh, S. Chambrey, J. Hong, P. Fongarland, F. Luck, D. Curulla-Ferré, D. Schweich, J. Bousquet, A.Y. Khodakov, Effect of Different Reaction Conditions on the Deactivation of Alumina-Supported Cobalt Fischer–Tropsch Catalysts in a Milli-Fixed-Bed
210

Reactor: Experiments and Modeling, Industrial & Engineering Chemistry Research, 53 (2014) 6913-6922.
[128] W. Ma, G. Jacobs, B. Todic, D.B. Bukur, B.H. Davis, Fischer-Tropsch synthesis: Influence of process conditions on deactivation of Ru and Re promoted 25%Co/Al2O3 catalysts, in: 23rd North American Catalysis Society Meeting, Louisville, Kentucky, US, 2013.
[129] P.H. Bolt, F.H.P.M. Habraken, J.W. Geus, Formation of Nickel, Cobalt, Copper, and Iron Aluminates fromα- andγ-Alumina-Supported Oxides: A Comparative Study, Journal of Solid State Chemistry, 135 (1998) 59-69.
[130] G. Jacobs, Y. Ji, B.H. Davis, D. Cronauer, A.J. Kropf, C.L. Marshall, Fischer–Tropsch synthesis: Temperature programmed EXAFS/XANES investigation of the influence of support type, cobalt loading, and noble metal promoter addition to the reduction behavior of cobalt oxide particles, Applied Catalysis A: General, 333 (2007) 177-191.
[131] G. Jacobs, W. Ma, B.H. Davis, Influence of Reduction Promoters on Stability of Cobalt/γ-Alumina Fischer-Tropsch Synthesis Catalysts, Catalysts, 4 (2014) 49-76.
[132] www.r-project.org.
[133] Q. Qin, D. Ramkrishna, Modeling of Surface Structure of Supported Catalysts. Application to Deactivation of FT Reactors Industrial & Engineering Chemistry Research, 43 (2004) 2912-2921.
[134] S. Storsæter, D. Chen, A. Holmen, Microkinetic modelling of the formation of C1 and C2 products in the Fischer–Tropsch synthesis over cobalt catalysts, Surface Science, 600 (2006) 2051–2063.
[135] A.J. van Dillen, R.J.A.M. Terörde, D.J. Lensveld, J.W. Geus, K.P. de Jong, Synthesis of supported catalysts by impregnation and drying using aqueous chelated metal complexes, Journal of Catalysis, 216 (2003) 257-264.
[136] D.H. Chun, J.C. Park, S.Y. Hong, J.T. Lim, C.S. Kim, H.-T. Lee, J.-I. Yang, S. Hong, H. Jung, Highly selective iron-based Fischer-Tropsch catalysts activated by CO2-containing syngas, Journal of Catalysis, 317 (2014) 135-143.
211

Appendix A. Calculations of expansion factor, rate of CO+H2, PH2 and PCO
Calculations of the expansion factor:
Two main reactions for Fe FTS:
𝐶𝐶𝐶𝐶 + 2𝐻𝐻2 → 𝐶𝐶𝐻𝐻2 + 𝐻𝐻2𝐶𝐶 (1)
𝐶𝐶𝐶𝐶 + 𝐻𝐻2𝐶𝐶 → 𝐶𝐶𝐶𝐶2 + 𝐻𝐻2 (2)
Calculation is done for 40Fe/AlSi reported in Table 4.9.
SCO2 = 46% SCH4 = 9.6% SC2H6 = 2.8%
We are assuming: SC2H4 = 2.8% SC3 = 4% SC4 = 3%
PH20 = 6 atm PCO0 = 9 atm PHe = 5 atm
ygas = SCH4 + SC2H6 + SC2H4 + SC3 + SC4 = 22.2%
Overall reaction considering SCO2 of 46%:
𝐶𝐶𝐶𝐶 + 0.62𝐻𝐻2 → 0.54𝐶𝐶𝐻𝐻2 + 0.46𝐶𝐶𝐶𝐶2 + 0.08𝐻𝐻2𝐶𝐶 Assumptions: Water remains in gas phase C5+ as liquid phase 1.62 + 5/9 (He) 0.46 + 0.54 × ygas + 5/9 (He)
2.17 moles 1.13 moles
𝜀𝜀 =𝑁𝑁𝑇𝑇 − 𝑁𝑁𝑇𝑇0𝑁𝑁𝑇𝑇0
𝜀𝜀 = 1.13−2.171.13
= −0.479 Expansion factor for the given feed composition
Calculation of rCO + rH2 from rCO and SCO2:
212

-rCO = r1 + r2 -rH2 = 2r1 – r2
-rCO -rH2 = 3r1
- r1 = -rCO (1 - SCO2)
-(rCO + rH2) = -3 × rCO (1 - SCO2)
Calculation of PrH2 and PCO in terms of XCO:
𝑃𝑃𝑂𝑂2(𝑋𝑋𝐶𝐶𝐶𝐶) =𝑃𝑃𝑂𝑂20 − 2𝑃𝑃𝐶𝐶𝐶𝐶0 × 𝑋𝑋𝐶𝐶𝐶𝐶(1 − SCO2) + 𝑃𝑃𝐶𝐶𝐶𝐶0 × 𝑋𝑋𝐶𝐶𝐶𝐶 × SCO2
(1 − 𝜀𝜀𝐶𝐶𝐶𝐶 × 𝑋𝑋𝐶𝐶𝐶𝐶)
𝑃𝑃𝑂𝑂2(𝑋𝑋𝐶𝐶𝐶𝐶) = 𝑃𝑃𝐻𝐻20−𝑃𝑃𝐶𝐶𝐶𝐶0×𝑋𝑋𝐶𝐶𝐶𝐶(3SCO2−2)(1−𝜀𝜀𝐶𝐶𝐶𝐶×𝑋𝑋𝐶𝐶𝐶𝐶)
Outlet PH2 in terms of XCO
𝑃𝑃𝐶𝐶𝐶𝐶(𝑋𝑋𝐶𝐶𝐶𝐶) = 𝑃𝑃𝐶𝐶𝐶𝐶0(1−𝑋𝑋𝐶𝐶𝐶𝐶(1−SCO2))(1−𝜀𝜀𝐶𝐶𝐶𝐶×𝑋𝑋𝐶𝐶𝐶𝐶)
Outlet PCO in terms of XCO
213

Appendix B. Comparison of integral and differential reactor performance
Rate and rate constant calculations with integral and differential methods:
Calculations are done for 40Fe/AlSi reported in Table 4.9 at XCO = 72%.
PH20 = 0.6 MPa PCO0 = 0.93 MPa Ptot = 2.2 MPa W = 0.2 g
VCO0 = 8.2 ml/min XCOf = 0.72 SCO2 = 0.458
PSTP = 101325 Pa TSTP = 273.15 K R = 8.314 Pa.m3/mol.K
𝐹𝐹𝐶𝐶𝐶𝐶0 =𝑃𝑃𝑆𝑆𝑇𝑇𝑃𝑃 .𝑉𝑉𝐶𝐶𝐶𝐶𝐸𝐸.𝑅𝑅𝑆𝑆𝑇𝑇𝑃𝑃
= 21.952 𝑚𝑚𝑚𝑚𝑚𝑚𝑚𝑚/ℎ
Integral method:
𝑊𝑊𝐹𝐹𝐶𝐶𝐶𝐶0
= �1
−𝑟𝑟𝐶𝐶𝐶𝐶
𝑋𝑋𝐶𝐶𝐶𝐶𝐶𝐶
0𝑑𝑑𝑋𝑋𝐶𝐶𝐶𝐶
𝑟𝑟𝐶𝐶𝐶𝐶 = 𝑘𝑘𝐶𝐶𝐶𝐶 .𝑃𝑃𝐶𝐶𝐶𝐶−0.221.𝑃𝑃𝑂𝑂20.877
𝑃𝑃𝐶𝐶𝐶𝐶 = 𝑓𝑓(𝑋𝑋𝐶𝐶𝐶𝐶) See appendix A
𝑃𝑃𝑂𝑂2 = 𝑓𝑓(𝑋𝑋𝐶𝐶𝐶𝐶) See appendix A
𝑘𝑘𝐶𝐶𝐶𝐶 =𝐹𝐹𝐶𝐶𝐶𝐶0𝑊𝑊
�1
𝑘𝑘𝐶𝐶𝐶𝐶 .𝑃𝑃𝐶𝐶𝐶𝐶(𝑋𝑋𝐶𝐶𝐶𝐶)−0.221.𝑃𝑃𝑂𝑂2(𝑋𝑋𝐶𝐶𝐶𝐶)0.877
𝑋𝑋𝐶𝐶𝐶𝐶𝐶𝐶
0𝑑𝑑𝑋𝑋𝐶𝐶𝐶𝐶
𝑘𝑘𝐶𝐶𝐶𝐶 = 151.115 𝑚𝑚𝑚𝑚𝑚𝑚𝑚𝑚𝑔𝑔.ℎ.𝑀𝑀𝑃𝑃𝑎𝑎0.656 Integral value of CO rate constant
𝑘𝑘𝐶𝐶𝐶𝐶𝑂𝑂2 = 3𝑘𝑘𝐶𝐶𝐶𝐶 . (1 − SCO2)
214

𝑘𝑘𝐶𝐶𝐶𝐶𝑂𝑂2 = 245.713 𝑚𝑚𝑚𝑚𝑚𝑚𝑚𝑚𝑔𝑔.ℎ.𝑀𝑀𝑃𝑃𝑎𝑎0.656 Integral value of CO+H2 rate constant
𝑋𝑋𝐶𝐶𝐶𝐶𝑎𝑎𝑎𝑎𝑎𝑎 =𝑋𝑋𝐶𝐶𝐶𝐶𝐶𝐶
2= 0.36
𝑟𝑟𝐶𝐶𝐶𝐶𝑎𝑎𝑎𝑎𝑎𝑎 = 𝑟𝑟𝐶𝐶𝐶𝐶(𝑋𝑋𝐶𝐶𝐶𝐶𝑎𝑎𝑎𝑎𝑎𝑎) = 82.802 𝑚𝑚𝑚𝑚𝑚𝑚𝑚𝑚𝑔𝑔.ℎ
Average rate from inlet to outlet of the reactor
Differential method:
𝑟𝑟𝐶𝐶𝐶𝐶 =𝑋𝑋𝐶𝐶𝐶𝐶𝐶𝐶.𝐹𝐹𝐶𝐶𝐶𝐶0
𝑊𝑊= 79.027
𝑚𝑚𝑚𝑚𝑚𝑚𝑚𝑚𝑔𝑔. ℎ
𝑃𝑃𝑂𝑂2𝑎𝑎𝑎𝑎𝑎𝑎 =𝑃𝑃𝑂𝑂20 + 𝑃𝑃𝑂𝑂2(𝑋𝑋𝐶𝐶𝐶𝐶𝐶𝐶)
2= 0.458 𝑀𝑀𝑃𝑃𝑎𝑎
𝑃𝑃𝐶𝐶𝐶𝐶𝑎𝑎𝑎𝑎𝑎𝑎 =𝑃𝑃𝐶𝐶𝐶𝐶0 + 𝑃𝑃𝐶𝐶𝐶𝐶(𝑋𝑋𝐶𝐶𝐶𝐶𝐶𝐶)
2= 0.891 𝑀𝑀𝑃𝑃𝑎𝑎
𝑘𝑘𝑑𝑑𝑑𝑑𝐶𝐶𝐶𝐶 =𝑟𝑟𝐶𝐶𝐶𝐶
𝑃𝑃𝐶𝐶𝐶𝐶𝑎𝑎𝑎𝑎𝑎𝑎−0.221.𝑃𝑃𝑂𝑂2𝑎𝑎𝑎𝑎𝑎𝑎0.877
𝑘𝑘𝑑𝑑𝑑𝑑𝐶𝐶𝐶𝐶 = 152.677 𝑚𝑚𝑚𝑚𝑚𝑚𝑚𝑚𝑔𝑔.ℎ.𝑀𝑀𝑃𝑃𝑎𝑎0.656 Differential value of CO rate constant using
average values of PH2 and PCO
𝑘𝑘𝑎𝑎𝐴𝐴𝐴𝐴𝑚𝑚𝐴𝐴 = 𝑘𝑘𝑑𝑑𝑑𝑑𝐶𝐶𝐶𝐶−𝑘𝑘𝐶𝐶𝐶𝐶𝑘𝑘𝑑𝑑𝑑𝑑𝐶𝐶𝐶𝐶
= 1.023% The error between the integral and differential rate constant
215

Appendix C. Steady-state FB data for supported Fe catalyst (40Fe/AlSi)
Table C 1. Steady-state kinetic data for 40Fe/AlSi catalyst for T = 230-260°C, PH2 = 2-9 atm, PCO = 3-9 atm and P = 20 atm.
T, °C
TOS, h
Inlet PH2
a Inlet PCO
a H2/CO CO rateb
H2+CO ratec XH2 XCO
HC Prod.d
SCH4, %
SCO2, %
SC2H6, %
SC3+, %
250 96 6.3 6.3 1.0 57.6 125.1 0.19 0.16 0.39 8.9 34.7 2.2 51.3 230 121 6.3 6.3 1.0 17.5 42.6 0.12 0.08 0.14 8.9 26.4 1.9 59.8 261 149 6.3 6.3 1.0 109.6 224.2 0.22 0.21 0.70 9.1 37.7 2.4 48.1 240 177 6.3 6.3 1.0 31.9 71.8 0.19 0.15 0.22 8.5 34.2 2.2 52.3 220 201 6.3 6.3 1.0 8.8 20.1 0.15 0.12 0.06 7.9 30.5 2.1 56.8 250 217 6.3 6.3 1.0 60.5 135.0 0.21 0.17 0.40 9.0 35.5 2.3 50.5 261 223 6.3 6.3 1.0 112.6 228.3 0.22 0.21 0.71 9.2 38.4 2.4 47.3 250 245 3.9 6.0 0.7 42.7 82.6 0.28 0.20 0.26 6.8 43.0 1.8 46.0 251 266 8.8 5.9 1.5 79.9 183.0 0.15 0.18 0.55 11.5 31.3 3.0 51.2 251 282 6.0 4.0 1.5 41.0 93.6 0.15 0.18 0.27 11.4 33.8 2.9 49.6 250 292 6.3 6.3 1.0 61.9 133.1 0.20 0.17 0.41 9.1 35.8 2.3 49.9 261 318 6.3 6.3 1.0 114.8 236.5 0.23 0.22 0.71 9.4 38.9 2.5 46.4 250 341 5.7 8.7 0.7 55.7 108.1 0.29 0.20 0.35 6.9 40.5 1.8 47.9 250 358 1.9 3.0 0.7 30.3 54.9 0.26 0.21 0.17 7.2 45.1 1.8 44.0 250 382 3.0 3.0 1.0 40.1 78.8 0.19 0.20 0.24 9.1 41.8 2.2 44.0 250 400 8.5 8.6 1.0 75.4 160.0 0.21 0.19 0.50 9.1 35.2 2.4 50.2 250 417 6.3 6.3 1.0 62.5 131.0 0.19 0.17 0.40 9.3 37.5 2.4 47.7 260 441 6.3 6.3 1.0 114.9 234.0 0.23 0.22 0.70 9.6 40.0 2.6 44.9 260 463 3.9 5.9 0.7 83.6 153.0 0.30 0.23 0.49 7.4 44.2 1.9 43.8 261 540 6.3 6.3 1.0 112.7 230.8 0.23 0.21 0.66 9.9 41.3 2.7 43.1 250 545 6.3 6.3 1.0 61.5 132.0 0.20 0.17 0.38 9.6 39.1 2.5 45.1 250 573 6.3 6.3 1.0 61.5 130.8 0.19 0.17 0.39 9.5 38.1 2.4 46.6 250 598 6.3 6.3 1.0 62.6 134.8 0.20 0.17 0.39 9.5 38.3 2.5 46.3 250 628 6.3 6.3 1.0 62.6 133.0 0.20 0.17 0.39 9.5 38.2 2.4 46.3 261 653 6.3 6.3 1.0 118.4 240.8 0.24 0.23 0.72 9.5 39.7 2.6 45.2 261 680 5.7 8.7 0.7 106.2 200.2 0.32 0.24 0.63 7.5 43.4 2.0 43.9 250 702 6.3 6.3 1.0 65.1 136.8 0.20 0.18 0.41 9.2 37.8 2.3 47.3 261 713 6.3 6.3 1.0 117.9 237.9 0.23 0.23 0.71 9.6 40.2 2.6 45.2
a atm b mmol(CO)/gcat/h c mmol(CO+H2)/gcat/h d gHC/gcat/h
216

Appendix D. Steady-state FB data in absence of deactivation for cobalt catalyst
The steady state activity and selectivity data in absence of deactivation for 25 wt% Co/0.25 wt%
Pt/AlSi is presented in Table D.1.
Table D 1. Steady-state kinetic data for 25 wt% Co/0.25 wt% Pt/AlSi catalyst for T = 210-240°C, PH2 = 6-12 bar, PCO = 2.6-6 bar and P = 20 bar.
T, °C
Inlet PH2
a Inlet PCO
a Feed
H2/CO rate,
mmol/g/h XCO XH2
HC Productivity,
gHC/gcat/h SCH4,
% SCO2,
% SC2H6,
% SC3+,
% 210 11.96 3.99 3.00 17.4 0.13 0.10 0.15 26.60 0.31 1.36 71.73 210 7.96 5.98 1.33 15.7 0.16 0.25 0.16 12.26 0.87 1.14 85.73 210 7.95 4.01 1.98 14.4 0.22 0.22 0.14 21.08 0.56 2.73 75.63 210 7.98 2.67 2.99 12.2 0.28 0.19 0.10 32.12 0.48 1.90 65.51 210 5.97 4.00 1.49 11.1 0.17 0.25 0.11 16.12 0.92 1.46 81.50 220 11.96 3.99 3.00 36.9 0.14 0.08 0.33 25.63 0.38 1.65 72.34 219 7.97 3.99 2.00 26.6 0.10 0.12 0.25 20.76 0.61 1.63 77.00 219 7.97 5.98 1.33 27.8 0.07 0.11 0.28 14.28 0.98 1.26 83.48 220 5.98 3.99 1.50 22.7 0.08 0.14 0.22 17.67 1.00 1.65 79.68 219 7.99 2.65 3.01 25.8 0.15 0.11 0.22 27.86 0.55 2.00 69.60 220 11.96 3.99 3.00 34.8 0.13 0.08 0.32 25.45 0.34 1.59 72.62 231 7.97 4.00 1.99 69.9 0.15 0.17 0.67 19.95 0.82 3.11 76.12 235 7.98 2.66 3.00 103.3 0.30 0.24 1.05 28.03 0.92 3.12 67.93 232 7.96 5.98 1.33 56.4 0.07 0.12 0.57 14.62 1.33 1.41 82.64 231 5.99 3.99 1.50 50.2 0.09 0.13 0.44 17.13 1.13 1.76 79.98 232 11.96 3.99 3.00 91.2 0.15 0.12 0.68 26.55 0.50 1.92 71.02 231 7.97 4.00 1.99 67.5 0.14 0.16 0.66 19.80 0.83 3.01 76.36 239 7.96 3.99 1.99 100.0 0.19 0.21 0.95 19.80 1.06 2.25 76.89 242 11.96 3.99 3.00 146.8 0.24 0.19 1.09 37.03 1.23 3.87 57.87 238 5.98 3.99 1.50 70.0 0.14 0.21 0.69 16.92 1.46 1.94 79.68 238 7.97 5.98 1.33 65.2 0.09 0.15 0.65 15.43 1.53 1.55 81.49 241 7.98 2.65 3.01 134.5 0.33 0.24 1.15 28.62 0.89 3.95 66.54 239 7.96 3.99 1.99 95.1 0.17 0.20 0.93 19.90 0.98 2.20 76.92
a bar
217

Appendix E. Rate expression derivation for Model 8, Chapter 6
𝐶𝐶𝐶𝐶(𝑔𝑔) + 𝑆𝑆 ↔ 𝐶𝐶𝐶𝐶 − 𝑆𝑆 (1)
𝐻𝐻2(𝑔𝑔) + 2𝑆𝑆 ↔ 2𝐻𝐻 − 𝑆𝑆 (2)
𝐶𝐶𝐶𝐶 − 𝑆𝑆 + 𝐻𝐻 − 𝑆𝑆 → 𝐶𝐶 − 𝑆𝑆 + 𝐶𝐶𝐻𝐻 − 𝑆𝑆 (3)
𝐶𝐶𝐶𝐶 − 𝑆𝑆 + 𝐻𝐻 − 𝑆𝑆 ↔ 𝐻𝐻𝐶𝐶𝐶𝐶 − 𝑆𝑆 + 𝑆𝑆 (4)
𝐻𝐻𝐶𝐶𝐶𝐶 − 𝑆𝑆 + 𝐻𝐻 − 𝑆𝑆 ↔ 𝐶𝐶𝐻𝐻 − 𝑆𝑆 + 𝐶𝐶𝐻𝐻 − 𝑆𝑆 (5)
𝐶𝐶 − 𝑆𝑆 + 𝐻𝐻 − 𝑆𝑆 → 𝐶𝐶𝐻𝐻 − 𝑆𝑆 + 𝑆𝑆 (6)
𝐶𝐶𝐻𝐻 − 𝑆𝑆 + 𝐻𝐻 − 𝑆𝑆 → 𝐶𝐶𝐻𝐻2 − 𝑆𝑆 + 𝑆𝑆 (7)
𝐶𝐶𝐻𝐻 − 𝑆𝑆 + 𝐻𝐻 − 𝑆𝑆 → 𝐻𝐻2𝐶𝐶(𝑔𝑔) + 2𝑆𝑆 (8)
𝐾𝐾1 = 𝜃𝜃𝐶𝐶𝐶𝐶𝑃𝑃𝐶𝐶𝐶𝐶𝜃𝜃𝑉𝑉
⇒ 𝜃𝜃𝐶𝐶𝐶𝐶 = 𝐾𝐾1𝑃𝑃𝐶𝐶𝐶𝐶𝜃𝜃𝑉𝑉
𝐾𝐾2 = 𝜃𝜃𝐻𝐻2
𝑃𝑃𝐻𝐻2𝜃𝜃𝑉𝑉 ⇒ 𝜃𝜃𝑂𝑂 = 𝐾𝐾2
12� 𝑃𝑃𝑂𝑂2
12� 𝜃𝜃𝑉𝑉
𝐾𝐾4 = 𝜃𝜃𝐻𝐻𝐶𝐶𝐶𝐶𝜃𝜃𝑉𝑉𝜃𝜃𝐶𝐶𝐶𝐶𝜃𝜃𝐻𝐻
⇒ 𝜃𝜃𝑂𝑂𝐶𝐶𝐶𝐶 = 𝐾𝐾4𝜃𝜃𝐶𝐶𝐶𝐶𝜃𝜃𝐻𝐻𝜃𝜃𝑉𝑉
= 𝐾𝐾1𝐾𝐾212� 𝐾𝐾4𝑃𝑃𝐶𝐶𝐶𝐶𝑃𝑃𝑂𝑂2
12� 𝜃𝜃𝑉𝑉
𝑑𝑑𝜃𝜃𝐶𝐶𝑑𝑑𝑡𝑡
= 0 ⇒ 𝑟𝑟3 = 𝑟𝑟6 ⇒ 𝑘𝑘3𝜃𝜃𝐶𝐶𝐶𝐶𝜃𝜃𝑂𝑂 = 𝑘𝑘6𝜃𝜃𝐶𝐶𝜃𝜃𝑂𝑂 ⇒ 𝜃𝜃𝐶𝐶 = 𝑘𝑘3𝑘𝑘6𝐾𝐾1𝑃𝑃𝐶𝐶𝐶𝐶𝜃𝜃𝑉𝑉
𝑑𝑑𝜃𝜃𝐶𝐶𝐻𝐻𝑑𝑑𝑡𝑡
= 0 ⇒ 𝑟𝑟7 = 𝑟𝑟5 + 𝑟𝑟6
𝑑𝑑𝜃𝜃𝐶𝐶𝐻𝐻𝑑𝑑𝑡𝑡
= 0 ⇒ 𝑟𝑟8 = 𝑟𝑟5 + 𝑟𝑟3
𝑟𝑟5 is quasi-equilibrium; therefore, the net is zero.
⇒ 𝑟𝑟7 = 𝑟𝑟6 and 𝑟𝑟8 = 𝑟𝑟3 but since 𝑟𝑟3 = 𝑟𝑟6, then 𝑟𝑟8 = 𝑟𝑟7.
𝑟𝑟8 = 𝑟𝑟7 ⇒ 𝑘𝑘7𝜃𝜃𝐶𝐶𝑂𝑂𝜃𝜃𝑂𝑂 = 𝑘𝑘8𝜃𝜃𝐶𝐶𝑂𝑂𝜃𝜃𝑂𝑂 ⇒ 𝜃𝜃𝐶𝐶𝑂𝑂 = 𝑘𝑘7𝑘𝑘8𝜃𝜃𝐶𝐶𝑂𝑂
218

𝐾𝐾5 = 𝜃𝜃𝐶𝐶𝐻𝐻𝜃𝜃𝐶𝐶𝐻𝐻𝜃𝜃𝐻𝐻𝐶𝐶𝐶𝐶𝜃𝜃𝐻𝐻
⇒ 𝜃𝜃𝐶𝐶𝑂𝑂2 = 𝐾𝐾5𝑘𝑘8𝑘𝑘7
𝜃𝜃𝑂𝑂𝐶𝐶𝐶𝐶𝜃𝜃𝑂𝑂 ⇒ 𝜃𝜃𝐶𝐶𝑂𝑂 = �𝐾𝐾1𝐾𝐾2𝐾𝐾4𝐾𝐾5𝑘𝑘8𝑘𝑘7
�12� 𝑃𝑃𝐶𝐶𝐶𝐶
12� 𝑃𝑃𝑂𝑂2
12� 𝜃𝜃𝑉𝑉
Site balance:
1 = 𝜃𝜃𝑉𝑉 + 𝜃𝜃𝐶𝐶𝐶𝐶 + 𝜃𝜃𝑂𝑂 + 𝜃𝜃𝐶𝐶 + 𝜃𝜃𝑂𝑂𝐶𝐶𝐶𝐶 + 𝜃𝜃𝐶𝐶𝑂𝑂 + 𝜃𝜃𝐶𝐶𝑂𝑂
1 = 𝜃𝜃𝑉𝑉 + 𝐾𝐾1𝑃𝑃𝐶𝐶𝐶𝐶𝜃𝜃𝑉𝑉 + 𝐾𝐾212� 𝑃𝑃𝑂𝑂2
12� 𝜃𝜃𝑉𝑉 +
𝑘𝑘3𝑘𝑘6𝐾𝐾1𝑃𝑃𝐶𝐶𝐶𝐶𝜃𝜃𝑉𝑉 + 𝐾𝐾1𝐾𝐾2
12� 𝐾𝐾4𝑃𝑃𝐶𝐶𝐶𝐶𝑃𝑃𝑂𝑂2
12� 𝜃𝜃𝑉𝑉 +
�𝐾𝐾1𝐾𝐾2𝐾𝐾4𝐾𝐾5𝑘𝑘8
𝑘𝑘7�12�
(1 +𝑘𝑘7𝑘𝑘8
)𝑃𝑃𝐶𝐶𝐶𝐶12� 𝑃𝑃𝑂𝑂2
12� 𝜃𝜃𝑉𝑉
If we assume 𝑟𝑟7 is hydrogenation step:
𝑟𝑟𝑂𝑂𝐶𝐶 𝐶𝐶𝑚𝑚𝐴𝐴𝑚𝑚𝑎𝑎𝑡𝑡𝑑𝑑𝑚𝑚𝑓𝑓 = 𝑟𝑟𝐶𝐶𝑂𝑂2 = 𝑟𝑟7 = 𝑘𝑘7𝜃𝜃𝐶𝐶𝑂𝑂𝜃𝜃𝑂𝑂
𝑟𝑟 =(𝐾𝐾1𝐾𝐾4𝐾𝐾5𝑘𝑘7𝑘𝑘8)1 2� 𝐾𝐾2𝑃𝑃𝐶𝐶𝐶𝐶
12� 𝑃𝑃𝑂𝑂2
�1 + 𝐾𝐾1𝑃𝑃𝐶𝐶𝐶𝐶 + 𝐾𝐾212� 𝑃𝑃𝑂𝑂2
12� + 𝑘𝑘3
𝑘𝑘6𝐾𝐾1𝑃𝑃𝐶𝐶𝐶𝐶 + 𝐾𝐾1𝐾𝐾2
12� 𝐾𝐾4𝑃𝑃𝐶𝐶𝐶𝐶𝑃𝑃𝑂𝑂2
12� + �𝐾𝐾1𝐾𝐾2𝐾𝐾4𝐾𝐾5𝑘𝑘8𝑘𝑘7
�12�
(1 + 𝑘𝑘7𝑘𝑘8
)𝑃𝑃𝐶𝐶𝐶𝐶12�𝑃𝑃𝑂𝑂2
12� �
2
If we assume 𝜃𝜃𝐶𝐶𝐶𝐶, 𝜃𝜃𝑂𝑂, 𝜃𝜃𝐶𝐶 as MASI, then:
𝑟𝑟 =(𝐾𝐾1𝐾𝐾4𝐾𝐾5𝑘𝑘7𝑘𝑘8)1 2� 𝐾𝐾2𝑃𝑃𝐶𝐶𝐶𝐶
12� 𝑃𝑃𝑂𝑂2
�1 + 𝐾𝐾1𝑃𝑃𝐶𝐶𝐶𝐶 + 𝐾𝐾212� 𝑃𝑃𝑂𝑂2
12� + 𝑘𝑘3
𝑘𝑘6𝐾𝐾1𝑃𝑃𝐶𝐶𝐶𝐶�
2 =(𝐾𝐾1𝐾𝐾4𝐾𝐾5𝑘𝑘7𝑘𝑘8)1 2� 𝐾𝐾2𝑃𝑃𝐶𝐶𝐶𝐶
12� 𝑃𝑃𝑂𝑂2
�1 + (1 + 𝑘𝑘3𝑘𝑘6
)𝐾𝐾1𝑃𝑃𝐶𝐶𝐶𝐶 + 𝐾𝐾212� 𝑃𝑃𝑂𝑂2
12� �
2
219
Copyright © 2022 FDOKUMEN