Edwin Fischer and Bach Performance Practice of the Weimar ...
Upload
independentCategory
view
1download
0
Journal of Catalysis 246 (2007) 91–99
www.elsevier.com/locate/jcat
Effects of manganese oxide promoter on the CO and H2 adsorptionproperties of titania-supported cobalt Fischer–Tropsch catalysts
Fernando Morales, Emiel de Smit, Frank M.F. de Groot, Tom Visser, Bert M. Weckhuysen ∗
Inorganic Chemistry and Catalysis, Department of Chemistry, Utrecht University, Sorbonnelaan 16, 3584 CA Utrecht, The Netherlands
Received 6 October 2006; revised 3 November 2006; accepted 10 November 2006
Available online 22 December 2006
Abstract
The adsorption properties of manganese-promoted Co/TiO2 Fischer–Tropsch (FT) catalysts were investigated by diffuse reflectance infraredspectroscopy (DRIFTS) using CO and H2 as probe molecules. Manganese was found to be closely associated to the FT active Co0 sites at thesurface of the catalysts. With increased MnO loading, CO preferentially binded linearly to surface metal sites. Manganese also decreased theextent of Co–TiO2 interactions, increasing the Co0 dispersion, resulting in higher H2 chemisorption uptake. Furthermore, with increasing MnOloading, FT catalytic tests at 1 bar and 220 ◦C revealed an increase in C5+ selectivity and olefinic products. These findings suggest that MnOspecies induce both structural and electronic promotion effects, resulting in higher metal dispersions and lower hydrogenation activity of thecatalyst, ultimately enhancing the overall FT catalytic performance. The findings also suggest that MnO catalyzes the water–gas shift reaction,thereby changing the syngas feed composition and affecting overall catalyst performance.© 2006 Elsevier Inc. All rights reserved.
Keywords: Fischer–Tropsch synthesis; Cobalt; Manganese; Promotion; DRIFTS
1. Introduction
Fischer–Tropsch (FT) technology, in which high molecularweight hydrocarbons are synthesized by catalytic hydrogena-tion of CO using Co-based catalysts, is to play a major rolein the expected shift from crude oil to natural gas (GTL) andbiomass (BTL) as feedstock for chemical industries [1–3]. Aneffective way to improve FT catalytic performance is to addsmall amounts of promoters to the catalyst materials [4]. Pro-moters have been shown to strongly affect the physicochemicaland catalytic properties of the cobalt active sites and thus can beused to tune the reaction selectivity toward the desired productrange distributions [4–7].
Recently, we have reported the benefits of using man-ganese as a promoter for Co/TiO2 catalysts [5,7]. Adding smallamounts of manganese was shown to improve the selectivityand in some cases the activity in the FT reaction. Advancedcharacterization techniques (e.g., in situ XAS, STEM-EELS,
* Corresponding author.E-mail address: [email protected] (B.M. Weckhuysen).
0021-9517/$ – see front matter © 2006 Elsevier Inc. All rights reserved.doi:10.1016/j.jcat.2006.11.014
and XPS) have provided new insights into the active site com-position and the state and location of the manganese promoter[5–8]. For instance, using manganese in Co/TiO2 catalysts wasfound to decrease the amount of Co0 surface atoms after reduc-tion treatments [8], which has a clear impact on FT selectivity,such as suppression of CH4 production. Furthermore, it hasbeen shown that manganese can react with cobalt to formCo3−xMnxO4 mixed-oxide compounds, leading to decreasedcobalt reducibility in the catalysts [6]. We also observed that re-duction in H2 results in redispersion of the cobalt phase and theformation of MnO species closely associated with Co0 particleswhen catalysts were prepared using the homogeneous deposi-tion precipitation (HDP) method [7]. Although the structuralpromotion effects of manganese have been widely reported,relatively few studies have focused on the electronic promot-ing effects of manganese on FT catalysts [9–12]. Therefore, atpresent the exact effect of manganese on the cobalt active sitesand its role during the FT reaction remain somewhat unclear.
Infrared spectroscopy is a powerful technique for investi-gating the surface properties of catalysts, particularly their ac-tive sites, especially when used in combination with CO andCO/H2 as probe molecules [13–18]. Manganese promotion in

92 F. Morales et al. / Journal of Catalysis 246 (2007) 91–99
RuMn/Al2O3 [9], CoMn/Al2O3 [12], and unsupported Mn–Co[10] catalysts were previously studied by this technique. Forthe Co/TiO2 system, conventional transmittance infrared spec-troscopy is hardly possible due to a considerable drop in trans-mission after reduction treatments [19]. However, as has beendemonstrated for Fe/Al2O3, Co/Al2O3 [20], and Co/TiO2 cata-lysts [21], diffuse reflectance infrared spectroscopy (DRIFTS)is a useful alternative for studying low transmitting materials.
CO probe molecules can accept electron density from metalsurface sites, resulting in metal–carbonyl complexes. Thesecomplexes are characterized by IR absorption bands at 2100–1800 cm−1. The shift from the vibrational energy of gas-phaseCO (2143 cm−1) can be explained in terms of simple molec-ular orbital (MO) theory. The 5σ orbital of the CO moleculeforms a σ bond with an empty orbital of the metal, and forelectron-rich surfaces, back-donation from the metal d-orbitalsinto the antibonding π∗-orbitals of the CO molecule occurs,weakening the C≡O bond. The result is a red shift of the COstretching frequency compared with “free” CO gas and the ap-pearance of bands caused by CO linearly and bridged bondedto the cobalt metal surface. The precise position of these bandscan provide valuable information about the electron density ofthe metal sites [9,22,23]. Furthermore, the intensity ratio of thelinear and bridged bonded bands can be used as a measure forthe electronic state of the Co nanoparticles [24].
In this study, CO and CO/H2 mixtures were used to probe thesurface of Co/TiO2 catalysts promoted with different amountsof MnO. The objective of this work was to characterize, in asystematic way, the surfaces of Co/TiO2 catalysts altered withincreasing amounts of manganese. By monitoring the positionof the absorption bands of surface-bonded CO molecules, wehave obtained information on the nature of the surface cobaltsites before and during the FT reaction. Additional character-ization of the catalysts was done with XRD, TPR, TEM, andH2-chemisorption to investigate other physicochemical prop-erties of the catalysts. In addition, catalytic performance forFT was measured (1 bar, 220 ◦C, H2/CO = 2) to evaluate thechanges in activity and selectivity after addition of MnO.
2. Experimental
2.1. Catalyst preparation
Cobalt (∼8 wt%) was deposited onto a TiO2 support (De-gussa P25, surface area 45 m2/g, pore volume 0.27 cm3/g)according to the HDP method [25], using cobalt nitrate (Merck)precursor solutions and urea (Acros) as the precipitation agent.The TiO2 powder was suspended in an aqueous solution con-taining cobalt nitrate, and the pH was slowly increased by ureadecomposition at 90 ◦C under continuous stirring for 18 h. Afterfiltering the solution and drying the solid at 120 ◦C overnight,the precursor material was loaded with various amounts of man-ganese (1.21, 2.15, 2.89, and 2.95 wt%) by the incipient wetnessimpregnation (IWI) method. Finally, the samples were calcinedin air flow at 400 ◦C for 4 h (at a heating ramp of 10 ◦C/min)to obtain the oxidized catalyst precursors coded as HCoxMny ,where x and y refer to the relative amounts of Co and Mn,
respectively. An overview of the catalysts and their respectivemetal loadings is presented in Table 1.
2.2. Catalyst characterization
Cobalt and manganese loadings in the calcined catalystswere determined by X-ray fluorescence (XRF) using a SpectroX-lab 2000 instrument. The same materials were analyzed byX-ray diffraction (XRD) using an Enraf-Nonius CPS 120 XRDapparatus equipped with a curved position-sensitive INEL de-tector and a CoKα1 radiation source (λ = 1.78897 Å). The linebroadening of the Co3O4 diffraction peaks localized at 70◦ and77◦ 2θ values was used to estimate the crystallite sizes, accord-ing to Scherrer’s equation.
Temperature-programmed reduction (TPR) experimentswere performed with Micromeritics Autochem-II instrumentequipped with a thermal conductivity detector (TCD). The sam-ples were initially dried in an Ar flow at 120 ◦C for 20 min; oncethe TCD signal was stable, the gas stream was switched to 5%H2/Ar, and the temperature was raised from 40 to 700 ◦C at arate of 10 ◦C/min.
Reduced and passivated HCo, HCo20Mn3, and HCo20Mn5samples were analyzed by transmission electron microscopy(TEM) in a Tecnai 20 FEG TEM microscope operating at200 kV and equipped with an EDX analyzer. About 50 mg ofeach catalyst was pretreated in a tubular glass reactor (3 mmdiameter). The samples were dried in a flow of air at 120 ◦Cfor 30 min and subsequently reduced in a 50% H2/He flow at350 ◦C for 2 h (at a heating ramp of 5 ◦C/min). Passivation wascarried out at 150 ◦C in a flow of 20% CO2/He for 30 min.After passivation, the samples were unloaded from the reactor,crushed, ultrasonically dispersed in ethanol, and dropped on aholey carbon film on a copper grid for TEM analysis.
H2 chemisorption measurements were carried out using aMicromeritics ASAP 2010C instrument. Before the measure-ments were started, the samples were dried in a He flow at120 ◦C for 30 min, followed by reduction in a 50% H2/Heflow at 350 ◦C for 2 h (ramp = 5 ◦C/min). The H2 adsorptionisotherms were measured at 150 ◦C, the temperature recom-mended by Reuel and Bartholomew [26]. The percentage cobaltdispersion was calculated assuming complete reduction and astoichiometry of one hydrogen atom adsorbed per cobalt sur-face atom [26].
DRIFTS experiments were carried out using a Perkin–ElmerFTIR 2000 series infrared spectrometer at a resolution of4 cm−1; 50 scans were accumulated for each spectrum. Thespectrometer was equipped with a Harrick “Praying Mantis”DRIFTS accessory along with a reactor cell with CaF2 win-dows. The powdered samples were loaded in the reactor celland reduced in a H2 flow at 350 ◦C for 2 h (at a heating rateof 5 ◦C/min). Subsequently, the samples were cooled to roomtemperature in a He flow. At this temperature, a backgroundspectrum was recorded. Next, CO was fed to the cell for 30 min.DRIFT spectra were recorded after purging the cell with He.For the CO/H2 adsorption experiments, the samples were ac-tivated using the same reduction procedure. After reduction,the temperature was decreased to 220 ◦C in flowing He. Back-

F. Morales et al. / Journal of Catalysis 246 (2007) 91–99 93
Table 1Physicochemical properties of the Co-based FT catalyst materials under study together with the XRD, TEM, and H2 chemisorption results
Sample code Coa
(wt%)Mna
(wt%)XRD peakmaximum
Co3O4 sizeb
(nm)H2 uptake(mmol/g)
Co (%)dispersion
TEM(nm)
HCo 7.77 0.0 77.36 24.7 0.010 1.23 2–7HCo20Mn2 7.01 1.21 77.28 24.0 0.024 3.02 –HCo20Mn3 6.98 2.15 77.18 19.2 0.037 4.63 2–10HCo20Mn4 7.12 2.89 77.09 11.3 0.021 2.67 –HCo20Mn5 6.54 2.95 77.20 14.0 0.017 2.20 2–6
a Determined by XRF, assuming the Co and Mn to be present in the form of Co0 and MnO.b Calculated from the average values obtained between the reflections located at 70◦ and 77◦ 2θ values.
ground spectra were collected before the gas feed was switchedto CO/H2 mixture (1/2 v/v). DRIFT spectra were continuouslyrecorded during 2 h of reaction. Finally, the cell was purgedwith He once again, and additional spectra were measured.
2.3. Catalyst testing
Catalysts were tested at 1 bar and 220 ◦C using CO/H2(1/2 v/v) after reduction treatments in H2 at 350 ◦C for 2 h. Typ-ically, 50 mg of catalyst sample (particle size, 0.21–0.50 mm)was diluted in SiC (particle size, 0.22 mm) to prevent temper-ature gradients within the catalyst bed, and then loaded intoa tubular glass fixed-bed reactor (diameter, 3 mm). The reac-tor was placed in a tubular quartz oven, and the temperatureinside and near the bottom of the catalyst bed was monitoredusing 2 type-K thermocouples. Gas hourly space velocities of3010 h−1 were used in all experiments, leading to CO con-versions of ∼1%. Product analysis (C1–C20) was carried outon-line using a Varian CP-3800 gas chromatograph equippedwith a flame ionization detector and fitted with a 50-m CP-Sil5 CB column. All reactor lines were maintained at 130 ◦C toprevent the condensation of heavier hydrocarbon products. Allreaction products were analyzed from the gas (vapor) phase.
3. Results and discussion
3.1. Manganese as structural promoter element
XRD patterns obtained for the Co/TiO2 and Co/Mn/TiO2oxidized samples are displayed in Fig. 1. Distinct diffractionlines originating from TiO2 (anatase and rutile phases) can beobserved, as can other small lines centered at 36◦, 52◦, 70◦,and 77◦ 2θ values, corresponding to a Co3O4 phase. The latterpeaks are clearly wider than those originating from TiO2, indi-cating smaller-sized Co3O4 crystallites. On the other hand, theCo3O4 reflections become weaker with increasing manganeseloading. This effect is attributed to a loss of crystallinity as a re-sult of the interaction between Co3O4 and manganese to forma Co3−xMnxO4-type solid solution [6,7,27]. The existence ofCo–Mn-mixed species is also suggested by the position of theCo3O4 reflections, which all appear at slightly smaller 2θ val-ues in the Mn-promoted catalysts. The latter phenomenon re-sults from a decrease in the cell parameter on incorporation ofMn3+ into the Co3O4 lattice [28]. The Co3O4 particle sizes es-timated from the diffraction peaks at 70◦ and 77◦ 2θ values vary
Fig. 1. XRD patterns of the HCo (a), HCo20Mn2 (b), HCo20Mn3 (c), HCo20-Mn4 (d), and HCo20Mn5 (e) catalysts after the calcination treatment.
from 24 nm in HCo to around 11–14 nm in the Mn-promotedcatalysts (Table 1). Note that because adding manganese affectsthe crystallinity of Co3O4 particles, the particle sizes calculatedby Scherrer’s equation are not completely accurate, because ofthe neglected contribution of crystallite strain to the diffractionline broadening. However, the large differences in the Co3O4particle sizes indicate that manganese affects both the size andcrystallinity of the Co3O4 particles as a result of a physico-chemical interaction between these compounds during the cal-cination treatment.
The TPR reduction results for all samples presented in Fig. 2show 3 distinct peaks centered around 275, 350, and 450 ◦C,corresponding to a 2-step reduction process from Co3O4 toCoO and Co0 [7,8]. Because the catalysts were calcined be-fore TPR analysis, organic or nitrate residues are not expected,and all TPR peaks can be unambiguously assigned to the re-duction of cobalt species. Analysis of the peak areas indicatesthat the first peak originates from the reduction of Co3O4 toCoO, whereas the other two peaks stem from the subsequentreduction to Co0. As revealed by the TPR profiles, manganesehampers the reduction of CoO to Co0 in the Mn-promoted cat-alysts, as indicated by the higher relative intensity of the peakcentered at 450 ◦C.
Due to the presence of mixed Co–Mn oxides, as alreadysuggested by the XRD results, we considered a reliable quan-tification of the peak areas infeasible. The results are in good
94 F. Morales et al. / Journal of Catalysis 246 (2007) 91–99
Fig. 2. TPR profiles of the calcined HCo (a), HCo20Mn2 (b), HCo20Mn3 (c),HCo20Mn4 (d), and HCo20Mn5 catalysts (e).
agreement with our previous studies, from which we concludedthat adding manganese to Co/TiO2 catalysts decreased cobaltreducibility and, consequently, segregation over the TiO2 sur-face during the reduction process [7].
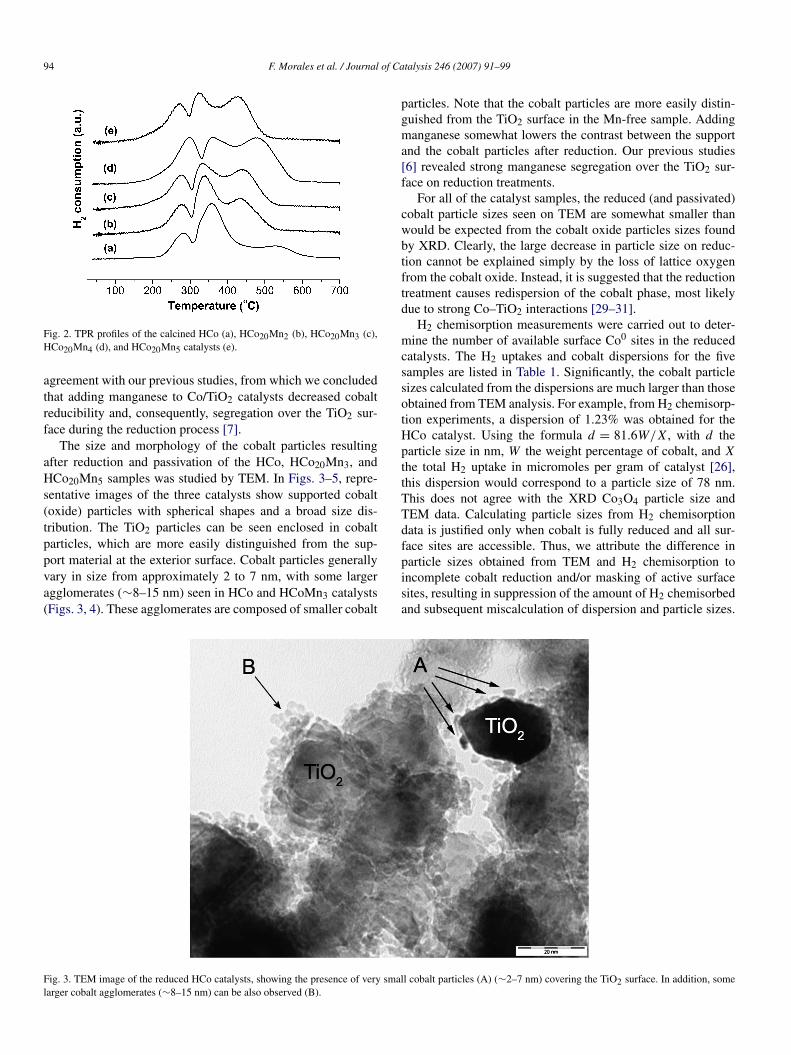
The size and morphology of the cobalt particles resultingafter reduction and passivation of the HCo, HCo20Mn3, andHCo20Mn5 samples was studied by TEM. In Figs. 3–5, repre-sentative images of the three catalysts show supported cobalt(oxide) particles with spherical shapes and a broad size dis-tribution. The TiO2 particles can be seen enclosed in cobaltparticles, which are more easily distinguished from the sup-port material at the exterior surface. Cobalt particles generallyvary in size from approximately 2 to 7 nm, with some largeragglomerates (∼8–15 nm) seen in HCo and HCoMn3 catalysts(Figs. 3, 4). These agglomerates are composed of smaller cobalt
particles. Note that the cobalt particles are more easily distin-guished from the TiO2 surface in the Mn-free sample. Addingmanganese somewhat lowers the contrast between the supportand the cobalt particles after reduction. Our previous studies[6] revealed strong manganese segregation over the TiO2 sur-face on reduction treatments.
For all of the catalyst samples, the reduced (and passivated)cobalt particle sizes seen on TEM are somewhat smaller thanwould be expected from the cobalt oxide particles sizes foundby XRD. Clearly, the large decrease in particle size on reduc-tion cannot be explained simply by the loss of lattice oxygenfrom the cobalt oxide. Instead, it is suggested that the reductiontreatment causes redispersion of the cobalt phase, most likelydue to strong Co–TiO2 interactions [29–31].
H2 chemisorption measurements were carried out to deter-mine the number of available surface Co0 sites in the reducedcatalysts. The H2 uptakes and cobalt dispersions for the fivesamples are listed in Table 1. Significantly, the cobalt particlesizes calculated from the dispersions are much larger than thoseobtained from TEM analysis. For example, from H2 chemisorp-tion experiments, a dispersion of 1.23% was obtained for theHCo catalyst. Using the formula d = 81.6W/X, with d theparticle size in nm, W the weight percentage of cobalt, and X
the total H2 uptake in micromoles per gram of catalyst [26],this dispersion would correspond to a particle size of 78 nm.This does not agree with the XRD Co3O4 particle size andTEM data. Calculating particle sizes from H2 chemisorptiondata is justified only when cobalt is fully reduced and all sur-face sites are accessible. Thus, we attribute the difference inparticle sizes obtained from TEM and H2 chemisorption toincomplete cobalt reduction and/or masking of active surfacesites, resulting in suppression of the amount of H2 chemisorbedand subsequent miscalculation of dispersion and particle sizes.
Fig. 3. TEM image of the reduced HCo catalysts, showing the presence of very small cobalt particles (A) (∼2–7 nm) covering the TiO2 surface. In addition, somelarger cobalt agglomerates (∼8–15 nm) can be also observed (B).

F. Morales et al. / Journal of Catalysis 246 (2007) 91–99 95
Fig. 4. TEM images of the reduced HCo20Mn3 catalysts, showing the presence of very small cobalt particles (∼2–10 nm) not so well distinguished from the TiO2surface. A large cobalt agglomerate is indicated by the arrow.
Fig. 5. TEM image of the reduced HCo20Mn5 catalyst, showing the presence of small (∼2–6 nm) cobalt particles at the TiO2 surface as indicated by the arrows.
Comparing our results with reported data on cobalt supportedon CNF catalysts [32–34] suggests that TiO2 is responsible forthe decreased cobalt reducibility. It is well known that strongmetal–support interaction (SMSI) effects can occur when TiO2
is used as a support material [29–31]. SMSI effects originatefrom a partial reduction of the TiO2 surface during reduc-tion treatment, leading to the formation and migration of TiOx
species over the catalyst surface. The formation and migrationof TiOx overlayers could indeed cause a masking of surface Co0
sites and thereby decrease H2 chemisorption uptake, leading to
the calculation of very low dispersions and very large particlesizes.
H2 uptake increases in the MnO-promoted catalysts withmanganese loadings of 1.21 and 2.15 wt%, after which it de-creases again with higher loadings. Because a fraction of theMnO spreads over the TiO2 surface during reduction, it mightprevent to some extent the SMSI effects of TiO2 on Co0 sur-face sites, thereby increasing H2 uptake. At higher manganeseloadings, however, MnO begins to cover cobalt surface sites aswell, lowering H2 uptake.
96 F. Morales et al. / Journal of Catalysis 246 (2007) 91–99
Fig. 6. DRIFTS spectra measured after CO adsorption at RT for the variousCo/TiO2 and Co/Mn/TiO2 catalysts reduced at 350 ◦C.
3.2. Manganese as electronic promoter element
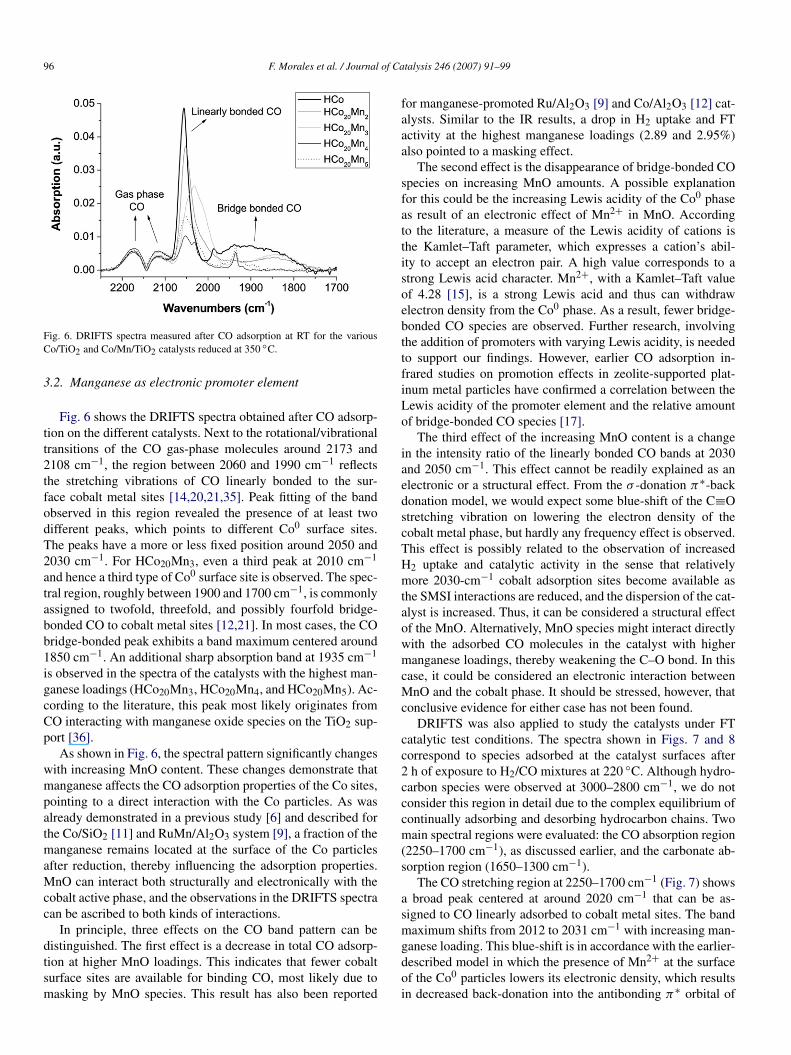
Fig. 6 shows the DRIFTS spectra obtained after CO adsorp-tion on the different catalysts. Next to the rotational/vibrationaltransitions of the CO gas-phase molecules around 2173 and2108 cm−1, the region between 2060 and 1990 cm−1 reflectsthe stretching vibrations of CO linearly bonded to the sur-face cobalt metal sites [14,20,21,35]. Peak fitting of the bandobserved in this region revealed the presence of at least twodifferent peaks, which points to different Co0 surface sites.The peaks have a more or less fixed position around 2050 and2030 cm−1. For HCo20Mn3, even a third peak at 2010 cm−1
and hence a third type of Co0 surface site is observed. The spec-tral region, roughly between 1900 and 1700 cm−1, is commonlyassigned to twofold, threefold, and possibly fourfold bridge-bonded CO to cobalt metal sites [12,21]. In most cases, the CObridge-bonded peak exhibits a band maximum centered around1850 cm−1. An additional sharp absorption band at 1935 cm−1
is observed in the spectra of the catalysts with the highest man-ganese loadings (HCo20Mn3, HCo20Mn4, and HCo20Mn5). Ac-cording to the literature, this peak most likely originates fromCO interacting with manganese oxide species on the TiO2 sup-port [36].
As shown in Fig. 6, the spectral pattern significantly changeswith increasing MnO content. These changes demonstrate thatmanganese affects the CO adsorption properties of the Co sites,pointing to a direct interaction with the Co particles. As wasalready demonstrated in a previous study [6] and described forthe Co/SiO2 [11] and RuMn/Al2O3 system [9], a fraction of themanganese remains located at the surface of the Co particlesafter reduction, thereby influencing the adsorption properties.MnO can interact both structurally and electronically with thecobalt active phase, and the observations in the DRIFTS spectracan be ascribed to both kinds of interactions.
In principle, three effects on the CO band pattern can bedistinguished. The first effect is a decrease in total CO adsorp-tion at higher MnO loadings. This indicates that fewer cobaltsurface sites are available for binding CO, most likely due tomasking by MnO species. This result has also been reported
for manganese-promoted Ru/Al2O3 [9] and Co/Al2O3 [12] cat-alysts. Similar to the IR results, a drop in H2 uptake and FTactivity at the highest manganese loadings (2.89 and 2.95%)also pointed to a masking effect.
The second effect is the disappearance of bridge-bonded COspecies on increasing MnO amounts. A possible explanationfor this could be the increasing Lewis acidity of the Co0 phaseas result of an electronic effect of Mn2+ in MnO. Accordingto the literature, a measure of the Lewis acidity of cations isthe Kamlet–Taft parameter, which expresses a cation’s abil-ity to accept an electron pair. A high value corresponds to astrong Lewis acid character. Mn2+, with a Kamlet–Taft valueof 4.28 [15], is a strong Lewis acid and thus can withdrawelectron density from the Co0 phase. As a result, fewer bridge-bonded CO species are observed. Further research, involvingthe addition of promoters with varying Lewis acidity, is neededto support our findings. However, earlier CO adsorption in-frared studies on promotion effects in zeolite-supported plat-inum metal particles have confirmed a correlation between theLewis acidity of the promoter element and the relative amountof bridge-bonded CO species [17].
The third effect of the increasing MnO content is a changein the intensity ratio of the linearly bonded CO bands at 2030and 2050 cm−1. This effect cannot be readily explained as anelectronic or a structural effect. From the σ -donation π∗-backdonation model, we would expect some blue-shift of the C≡Ostretching vibration on lowering the electron density of thecobalt metal phase, but hardly any frequency effect is observed.This effect is possibly related to the observation of increasedH2 uptake and catalytic activity in the sense that relativelymore 2030-cm−1 cobalt adsorption sites become available asthe SMSI interactions are reduced, and the dispersion of the cat-alyst is increased. Thus, it can be considered a structural effectof the MnO. Alternatively, MnO species might interact directlywith the adsorbed CO molecules in the catalyst with highermanganese loadings, thereby weakening the C–O bond. In thiscase, it could be considered an electronic interaction betweenMnO and the cobalt phase. It should be stressed, however, thatconclusive evidence for either case has not been found.
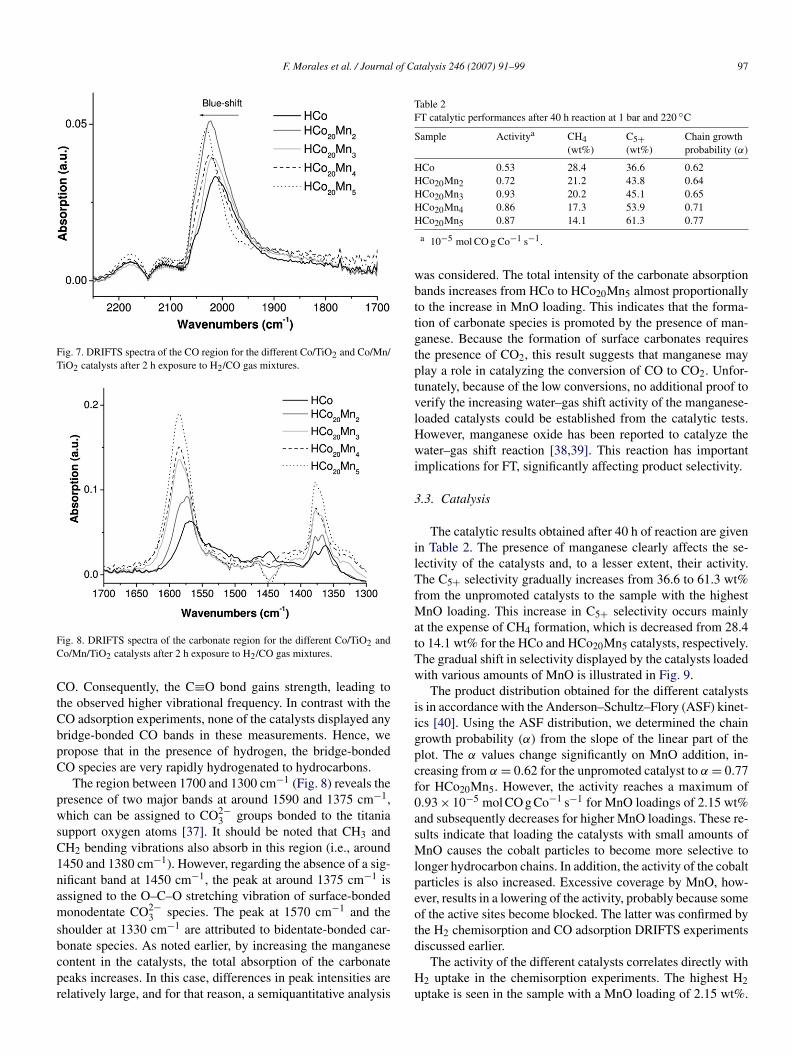
DRIFTS was also applied to study the catalysts under FTcatalytic test conditions. The spectra shown in Figs. 7 and 8correspond to species adsorbed at the catalyst surfaces after2 h of exposure to H2/CO mixtures at 220 ◦C. Although hydro-carbon species were observed at 3000–2800 cm−1, we do notconsider this region in detail due to the complex equilibrium ofcontinually adsorbing and desorbing hydrocarbon chains. Twomain spectral regions were evaluated: the CO absorption region(2250–1700 cm−1), as discussed earlier, and the carbonate ab-sorption region (1650–1300 cm−1).
The CO stretching region at 2250–1700 cm−1 (Fig. 7) showsa broad peak centered at around 2020 cm−1 that can be as-signed to CO linearly adsorbed to cobalt metal sites. The bandmaximum shifts from 2012 to 2031 cm−1 with increasing man-ganese loading. This blue-shift is in accordance with the earlier-described model in which the presence of Mn2+ at the surfaceof the Co0 particles lowers its electronic density, which resultsin decreased back-donation into the antibonding π∗ orbital of
F. Morales et al. / Journal of Catalysis 246 (2007) 91–99 97
Fig. 7. DRIFTS spectra of the CO region for the different Co/TiO2 and Co/Mn/TiO2 catalysts after 2 h exposure to H2/CO gas mixtures.
Fig. 8. DRIFTS spectra of the carbonate region for the different Co/TiO2 andCo/Mn/TiO2 catalysts after 2 h exposure to H2/CO gas mixtures.
CO. Consequently, the C≡O bond gains strength, leading tothe observed higher vibrational frequency. In contrast with theCO adsorption experiments, none of the catalysts displayed anybridge-bonded CO bands in these measurements. Hence, wepropose that in the presence of hydrogen, the bridge-bondedCO species are very rapidly hydrogenated to hydrocarbons.
The region between 1700 and 1300 cm−1 (Fig. 8) reveals thepresence of two major bands at around 1590 and 1375 cm−1,which can be assigned to CO2−
3 groups bonded to the titaniasupport oxygen atoms [37]. It should be noted that CH3 andCH2 bending vibrations also absorb in this region (i.e., around1450 and 1380 cm−1). However, regarding the absence of a sig-nificant band at 1450 cm−1, the peak at around 1375 cm−1 isassigned to the O–C–O stretching vibration of surface-bondedmonodentate CO2−
3 species. The peak at 1570 cm−1 and theshoulder at 1330 cm−1 are attributed to bidentate-bonded car-bonate species. As noted earlier, by increasing the manganesecontent in the catalysts, the total absorption of the carbonatepeaks increases. In this case, differences in peak intensities arerelatively large, and for that reason, a semiquantitative analysis
Table 2FT catalytic performances after 40 h reaction at 1 bar and 220 ◦C
Sample Activitya CH4(wt%)
C5+(wt%)
Chain growthprobability (α)
HCo 0.53 28.4 36.6 0.62HCo20Mn2 0.72 21.2 43.8 0.64HCo20Mn3 0.93 20.2 45.1 0.65HCo20Mn4 0.86 17.3 53.9 0.71HCo20Mn5 0.87 14.1 61.3 0.77
a 10−5 mol CO g Co−1 s−1.
was considered. The total intensity of the carbonate absorptionbands increases from HCo to HCo20Mn5 almost proportionallyto the increase in MnO loading. This indicates that the forma-tion of carbonate species is promoted by the presence of man-ganese. Because the formation of surface carbonates requiresthe presence of CO2, this result suggests that manganese mayplay a role in catalyzing the conversion of CO to CO2. Unfor-tunately, because of the low conversions, no additional proof toverify the increasing water–gas shift activity of the manganese-loaded catalysts could be established from the catalytic tests.However, manganese oxide has been reported to catalyze thewater–gas shift reaction [38,39]. This reaction has importantimplications for FT, significantly affecting product selectivity.
3.3. Catalysis
The catalytic results obtained after 40 h of reaction are givenin Table 2. The presence of manganese clearly affects the se-lectivity of the catalysts and, to a lesser extent, their activity.The C5+ selectivity gradually increases from 36.6 to 61.3 wt%from the unpromoted catalysts to the sample with the highestMnO loading. This increase in C5+ selectivity occurs mainlyat the expense of CH4 formation, which is decreased from 28.4to 14.1 wt% for the HCo and HCo20Mn5 catalysts, respectively.The gradual shift in selectivity displayed by the catalysts loadedwith various amounts of MnO is illustrated in Fig. 9.
The product distribution obtained for the different catalystsis in accordance with the Anderson–Schultz–Flory (ASF) kinet-ics [40]. Using the ASF distribution, we determined the chaingrowth probability (α) from the slope of the linear part of theplot. The α values change significantly on MnO addition, in-creasing from α = 0.62 for the unpromoted catalyst to α = 0.77for HCo20Mn5. However, the activity reaches a maximum of0.93 × 10−5 mol CO g Co−1 s−1 for MnO loadings of 2.15 wt%and subsequently decreases for higher MnO loadings. These re-sults indicate that loading the catalysts with small amounts ofMnO causes the cobalt particles to become more selective tolonger hydrocarbon chains. In addition, the activity of the cobaltparticles is also increased. Excessive coverage by MnO, how-ever, results in a lowering of the activity, probably because someof the active sites become blocked. The latter was confirmed bythe H2 chemisorption and CO adsorption DRIFTS experimentsdiscussed earlier.
The activity of the different catalysts correlates directly withH2 uptake in the chemisorption experiments. The highest H2uptake is seen in the sample with a MnO loading of 2.15 wt%.

98 F. Morales et al. / Journal of Catalysis 246 (2007) 91–99
Fig. 9. Influence of the MnO loading on the FT activity and the C5+ and CH4 selectivity of the Co/TiO2 and Co/Mn/TiO2 catalysts under study.
Fig. 10. Influence of MnO on the paraffin to olefin ratio for the HCo (a), HCo20-Mn2 (b), HCo20Mn3 (c), HCo20Mn4 (d), and HCo20Mn5 (e) catalysts.
This sample also exhibits the highest activity in the FT reaction.This further confirms the possibly important role of manganesein optimizing the amount of accessible cobalt metal sites by de-creasing the interaction between the cobalt phase and the TiO2
support.Catalytic testing further showed that the presence of MnO
had a profound effect on the paraffin/olefin selectivity of thecatalysts. Increasing the MnO loading gradually increased thefraction of olefin products. This effect is illustrated in Fig. 10,which shows the paraffin-to-olefin (P/O) ratio as a function ofMnO loading. As shown, the P/O ratios for all of the hydro-carbon fractions are clearly decreasing with increasing MnOloading. This indicates a decreased hydrogenation ability ofcobalt particles with the addition of MnO. This effect is di-rectly involved in the increased production of olefins in the
Mn-promoted catalysts, because the chain growth terminationstep by H2 addition is suppressed. Consequently, the hydrocar-bon chains adsorbed at the cobalt surface have a greater chanceto grow, thereby resulting in longer hydrocarbon chains as prod-ucts. We note that strictly paraffin-to-olefin ratios should becompared at the same conversion. However, because lower P/Oratios were observed at higher conversion, the effect of the MnOpromoter should be even more pronounced when compared atequal conversion rates.
By comparing the paraffin-to-olefin ratios obtained for thevarious samples with the linear-to-bridge CO-intensity ratiomeasured by DRIFTS, it is noteworthy that the appearance ofa more intense bridge CO absorption band may suggest thatthe catalysts are active in hydrogenation reactions, because abridge-adsorbed CO molecule has a weaker C–O bond and thuscan be more easily hydrogenated. The HCo catalyst presentedthe strongest bridge CO adsorption and also the highest CH4selectivity. Hence, a higher relative concentration of bridge-bonded CO species may possibly lead to a low C5+ selectivity,because these species are rapidly hydrogenated at the catalystsurface, leading to the formation of mainly CH4. The resultsclearly indicate that MnO at the surface of the Co0 particlessuppresses CH4 formation by decreasing the likelihood of hy-drogenation reactions in FT synthesis.
4. Conclusion
The presence of manganese in Co/TiO2 catalysts results indecreased cobalt reducibility as a result of the intimate asso-ciation between cobalt and manganese oxide species. At highmanganese loading (>2.15 wt%), hydrogen chemisorption isstrongly suppressed in Co/Mn/TiO2 catalytic systems as a resultof the coverage of cobalt active sites by TiOx and MnO species.In this respect, the presence of small amounts of manganeseappears to increase the available Co0 surface, presumably by
F. Morales et al. / Journal of Catalysis 246 (2007) 91–99 99
preventing SMSI between cobalt and TiO2. Accordingly, cat-alytic activity reaches a maximum at intermediate manganeseloadings.
Except for these structural promotion effects, the use ofDRIFTS in combination with CO and CO/H2 demonstrated thatMnO remains closely associated with cobalt particles during theFT reaction, acting as an electronic promoter on the Co0 surfacesites. Mn2+ withdraws electron density from the Co0 sites, pro-ducing a relatively greater amount of linearly bonded CO. Thisresults in a lower hydrogenation rate under FT reaction condi-tions, as illustrated by the formation of more olefins. As a result,the catalysts have a higher C5+ product selectivity.
Finally, adding manganese to the Co/TiO2 system resulted inan increase in surface carbonate species during the FT reaction.It is suggested that MnO itself is a catalyst for the water–gasshift reaction, converting CO to CO2 and thereby affecting cat-alyst performance.
Acknowledgments
The authors gratefully acknowledge Shell Global Solutionsfor financial support. The authors thank H. Oosterbeek, H. Kui-jpers, and C. Mesters (Shell Global Solutions) for their inputand fruitful discussions and Fouad Soulimani for his help andsupport during the DRIFTS experiments.
References
[1] S.E. Colley, R.G. Copperthwaite, G.J. Hutchings, S.P. Terblanche, M.M.Thackeray, Nature 339 (1989) 129.
[2] M.E. Dry, Catal. Today 71 (2002) 227.[3] H. Schulz, Appl. Catal. A 186 (1999) 3.[4] F. Morales, B.M. Weckhuysen, Catalysis (Specialist Periodicals Reports,
The Royal Society of Chemistry) 19 (2006) 1.[5] F. Morales, F.M.F. de Groot, O.L.J. Gijzeman, A. Mens, O. Stephan, B.M.
Weckhuysen, J. Catal. 230 (2005) 301.[6] F. Morales, D. Grandjean, F.M.F. de Groot, O. Stephan, B.M. Weckhuy-
sen, Phys. Chem. Chem. Phys. 7 (2005) 568.[7] F. Morales, D. Grandjean, A. Mens, F.M.F. de Groot, B.M. Weckhuysen,
J. Phys. Chem. B 110 (2006) 8626.[8] F. Morales, F.M.F. de Groot, P. Glatzel, E. Kleimenov, H. Bluhm, M.
Havecker, A. Knop-Gericke, B.M. Weckhuysen, J. Phys. Chem. B 108(2004) 16201.
[9] S.T. Hussain, Ads. Sci. Technol. 13 (1996) 489.[10] M. Jiang, M. Koizumi, T. Ozaki, M. Yamada, Appl. Catal. A 209 (2001)
59.[11] K.J. Klabunde, Y. Imizu, J. Am. Chem. Soc. 106 (1984) 2721.
[12] J.L. Zhang, J. Ren, J.G. Chen, Y.H. Sun, Acta Phys. Chim. Sin. 18 (2002)260.
[13] J.A. Anderson, M.F. Garcia (Eds.), Supported Metals in Catalysis, Imper-ial College Press, London, 2005.
[14] A. Davydov, Molecular Spectroscopy of Oxide Catalyst Surfaces, Wiley,New York, 2003.
[15] Y. Marcus, Ion Properties, Dekker, New York, 1997.[16] J.W. Niemantsverdriet, Spectroscopy in Catalysis, VCH Verlag, Wein-
heim, 1993.[17] T. Visser, T.A. Nijhuis, A.M.J. van der Eerden, K. Jenken, Y. Ji, W. Bras,
S. Nikitenko, Y. Ikeda, M. Lepage, B.M. Weckhuysen, J. Phys. Chem.B 109 (2005) 3822.
[18] B.M. Weckhuysen (Ed.), In Situ Spectroscopy of Catalysts, American Sci-entific Publishers, Stevenson Ranch, 2004.
[19] A.A. Davydov, M.P. Komarova, V.F. Anufrienko, N.G. Maksimov, Kinet.Katal. 14 (1973) 15.
[20] V.B. Kazansky, A.V. Zaitsev, V.Y. Borovkov, A.L. Lapidus, Appl. Catal.40 (1988) 17.
[21] B. Mothebe, D.J. Duvenhage, V.D. Sokolovskii, Stud. Surf. Sci. Catal. 107(1997) 1.
[22] J. Ryczkowski, Catal. Today 68 (2001) 263.[23] R.A. van Santen, P.W.N.M. van Leeuwen, J.A. Moulijn, B.A. Averill
(Eds.), Catalysis: An Integrated Approach, second, revised and enlargeded., Elsevier, Amsterdam, 1999, p. 508.
[24] B.L. Mojet, J.T. Miller, D.C. Koningsberger, J. Phys. Chem. B 103 (1999)2724.
[25] A.J. van Dillen, J.W. Geus, L.A.M. Hermans, J. van der Meijden, Stud.Surf. Sci. Catal. 2 (1997) 677.
[26] R.C. Reuel, C.H. Bartholomew, J. Catal. 85 (1984) 63.[27] Q. Liang, K. Chen, W. Hou, Q. Yan, Appl. Catal. A 166 (1998) 191.[28] J.L. Martin de Vidales, E. Vila, R. Rojas, O. Garcia, Chem. Mater. 7 (1995)
1716.[29] G.L. Haller, D.E. Resasco, Adv. Catal. 36 (1989) 173.[30] M.A. Vannice, J. Catal. 11 (1982) 225.[31] T. Komaya, A.T. Bell, Z. Wengsieh, R. Gronsky, F. Engelke, T.S. King,
M. Pruski, J. Catal. 149 (1994) 142.[32] G.L. Bezemer, P.B. Radstake, U. Falke, H. Oosterbeek, A.J. van Dillen,
K.P. de Jong, J. Catal. 237 (2006) 152.[33] G.L. Bezemer, P.B. Radstake, V. Koot, A.J. van Dillen, J.W. Geus, K.P. de
Jong, J. Catal. 237 (2006) 291.[34] G.L. Bezemer, U. Falke, A.J. van Dillen, K.P. de Jong, Chem. Commun. 6
(2005) 731.[35] A.A. Davydov, N. Coville, Russ. Chem. Bull. 44 (1995) 1866.[36] K. Nakamoto, Infrared and Raman Spectra of Inorganic and Coordination
Compounds, Part B, Applications in Coordination, Organometallic, andBioinorganic Chemistry, fifth ed., Wiley, New York, 1997.
[37] L.F. Liao, C.F. Lien, D.L. Shieh, M.T. Chen, J.L. Lin, J. Phys. Chem. B106 (2002) 43.
[38] M.J. Keyser, R.C. Everson, R.L. Espinoza, Appl. Catal. A 171 (1998) 99.[39] T. Riedel, M. Claeys, H. Schulz, G. Schaub, S.S. Nam, K.W. Jun, M.J.
Choi, G. Kishan, K.W. Lee, Appl. Catal. A 186 (1999) 201.[40] E. Iglesia, Appl. Catal. A 161 (1997) 50.
Copyright © 2022 FDOKUMEN