Direct reprogramming of oligodendrocyte precursor cells into ...
Upload
independentCategory
view
7download
0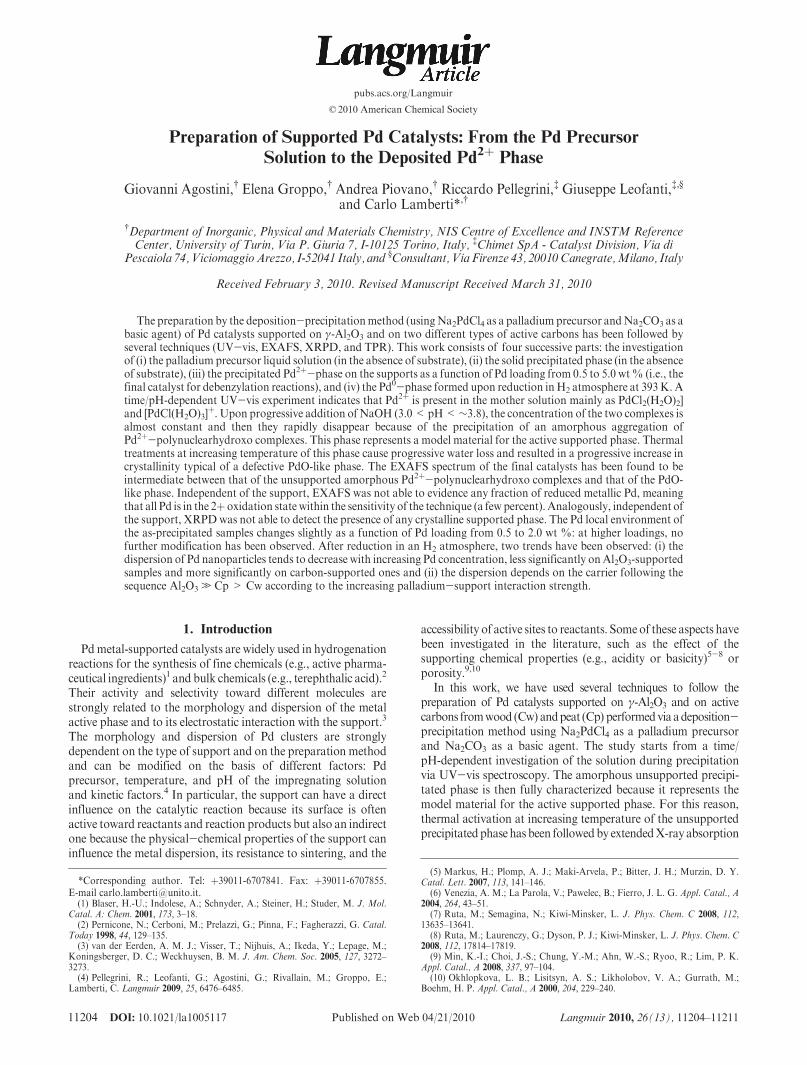
11204 DOI: 10.1021/la1005117 Langmuir 2010, 26(13), 11204–11211Published on Web 04/21/2010
pubs.acs.org/Langmuir
© 2010 American Chemical Society
Preparation of Supported Pd Catalysts: From the Pd Precursor
Solution to the Deposited Pd2þ
Phase
Giovanni Agostini,† Elena Groppo,† Andrea Piovano,† Riccardo Pellegrini,‡ Giuseppe Leofanti,‡,§
and Carlo Lamberti*,†
†Department of Inorganic, Physical and Materials Chemistry, NIS Centre of Excellence and INSTM ReferenceCenter, University of Turin, Via P. Giuria 7, I-10125 Torino, Italy, ‡Chimet SpA - Catalyst Division, Via di
Pescaiola 74, ViciomaggioArezzo, I-52041 Italy, and §Consultant, Via Firenze 43, 20010Canegrate,Milano, Italy
Received February 3, 2010. Revised Manuscript Received March 31, 2010
The preparation by the deposition-precipitationmethod (usingNa2PdCl4 as a palladium precursor andNa2CO3 as abasic agent) of Pd catalysts supported on γ-Al2O3 and on two different types of active carbons has been followed byseveral techniques (UV-vis, EXAFS, XRPD, and TPR). This work consists of four successive parts: the investigationof (i) the palladium precursor liquid solution (in the absence of substrate), (ii) the solid precipitated phase (in the absenceof substrate), (iii) the precipitated Pd2þ-phase on the supports as a function of Pd loading from 0.5 to 5.0 wt% (i.e., thefinal catalyst for debenzylation reactions), and (iv) the Pd0-phase formed upon reduction in H2 atmosphere at 393K. Atime/pH-dependent UV-vis experiment indicates that Pd2þ is present in the mother solution mainly as PdCl2(H2O)2]and [PdCl(H2O)3]
þ. Upon progressive addition of NaOH (3.0< pH<∼3.8), the concentration of the two complexes isalmost constant and then they rapidly disappear because of the precipitation of an amorphous aggregation ofPd2þ-polynuclearhydroxo complexes. This phase represents a model material for the active supported phase. Thermaltreatments at increasing temperature of this phase cause progressive water loss and resulted in a progressive increase incrystallinity typical of a defective PdO-like phase. The EXAFS spectrum of the final catalysts has been found to beintermediate between that of the unsupported amorphous Pd2þ-polynuclearhydroxo complexes and that of the PdO-like phase. Independent of the support, EXAFS was not able to evidence any fraction of reduced metallic Pd, meaningthat all Pd is in the 2þ oxidation state within the sensitivity of the technique (a few percent). Analogously, independent ofthe support, XRPDwas not able to detect the presence of any crystalline supported phase. The Pd local environment ofthe as-precipitated samples changes slightly as a function of Pd loading from 0.5 to 2.0 wt %: at higher loadings, nofurther modification has been observed. After reduction in an H2 atmosphere, two trends have been observed: (i) thedispersion of Pd nanoparticles tends to decrease with increasing Pd concentration, less significantly onAl2O3-supportedsamples and more significantly on carbon-supported ones and (ii) the dispersion depends on the carrier following thesequence Al2O3 . Cp > Cw according to the increasing palladium-support interaction strength.
1. Introduction
Pdmetal-supported catalysts are widely used in hydrogenationreactions for the synthesis of fine chemicals (e.g., active pharma-ceutical ingredients)1 and bulk chemicals (e.g., terephthalic acid).2
Their activity and selectivity toward different molecules arestrongly related to the morphology and dispersion of the metalactive phase and to its electrostatic interaction with the support.3
The morphology and dispersion of Pd clusters are stronglydependent on the type of support and on the preparation methodand can be modified on the basis of different factors: Pdprecursor, temperature, and pH of the impregnating solutionand kinetic factors.4 In particular, the support can have a directinfluence on the catalytic reaction because its surface is oftenactive toward reactants and reaction products but also an indirectone because the physical-chemical properties of the support caninfluence the metal dispersion, its resistance to sintering, and the
accessibility of active sites to reactants. Someof these aspects havebeen investigated in the literature, such as the effect of thesupporting chemical properties (e.g., acidity or basicity)5-8 orporosity.9,10
In this work, we have used several techniques to follow thepreparation of Pd catalysts supported on γ-Al2O3 and on activecarbons fromwood (Cw) andpeat (Cp) performedvia adeposition-precipitation method using Na2PdCl4 as a palladium precursorand Na2CO3 as a basic agent. The study starts from a time/pH-dependent investigation of the solution during precipitationvia UV-vis spectroscopy. The amorphous unsupported precipi-tated phase is then fully characterized because it represents themodel material for the active supported phase. For this reason,thermal activation at increasing temperature of the unsupportedprecipitatedphasehas been followedby extendedX-ray absorption
*Corresponding author. Tel: þ39011-6707841. Fax: þ39011-6707855.E-mail [email protected].(1) Blaser, H.-U.; Indolese, A.; Schnyder, A.; Steiner, H.; Studer, M. J. Mol.
Catal. A: Chem. 2001, 173, 3–18.(2) Pernicone, N.; Cerboni, M.; Prelazzi, G.; Pinna, F.; Fagherazzi, G. Catal.
Today 1998, 44, 129–135.(3) van der Eerden, A. M. J.; Visser, T.; Nijhuis, A.; Ikeda, Y.; Lepage, M.;
Koningsberger, D. C.; Weckhuysen, B. M. J. Am. Chem. Soc. 2005, 127, 3272–3273.(4) Pellegrini, R.; Leofanti, G.; Agostini, G.; Rivallain, M.; Groppo, E.;
Lamberti, C. Langmuir 2009, 25, 6476–6485.
(5) Markus, H.; Plomp, A. J.; Maki-Arvela, P.; Bitter, J. H.; Murzin, D. Y.Catal. Lett. 2007, 113, 141–146.
(6) Venezia, A. M.; La Parola, V.; Pawelec, B.; Fierro, J. L. G. Appl. Catal., A2004, 264, 43–51.
(7) Ruta, M.; Semagina, N.; Kiwi-Minsker, L. J. Phys. Chem. C 2008, 112,13635–13641.
(8) Ruta, M.; Laurenczy, G.; Dyson, P. J.; Kiwi-Minsker, L. J. Phys. Chem. C2008, 112, 17814–17819.
(9) Min, K.-I.; Choi, J.-S.; Chung, Y.-M.; Ahn, W.-S.; Ryoo, R.; Lim, P. K.Appl. Catal., A 2008, 337, 97–104.
(10) Okhlopkova, L. B.; Lisitsyn, A. S.; Likholobov, V. A.; Gurrath, M.;Boehm, H. P. Appl. Catal., A 2000, 204, 229–240.

DOI: 10.1021/la1005117 11205Langmuir 2010, 26(13), 11204–11211
Agostini et al. Article
fine structure (EXAFS) spectroscopy, X-ray powder diffraction(XRPD), and temperature-programmed reduction (TPR). Suc-cessively, a characterization of the supported active phase hasbeen carried out byEXAFS. Finally, Pdmetal nanoparticles havebeen obtained by reducing the dried precipitated samples in anH2
atmosphere at 393 K. Metal particle dispersion has been inves-tigated by combining CO chemisorption for the whole set ofsamples with EXAFS spectra collected on the most highly loadedsamples.
The large emphasis on the as-precipitated Pd2þ samples isjustified by the fact that unreduced catalysts are directly usedwithout prereduction treatments in somehydrogenation reactionssuch as debenzylation.11 Conversely, when reduced Pd catalystsare investigated, a systematic examination of the as-precipitatedPd2þ phase allows us to discriminate between precipitation andreduction effects in determining the final characteristics of the Pd0
nanoparticles.
2. Materials, Experiments, and Methods
2.1. Sample Preparation and Nomenclature. SupportedPd samples have been prepared in the Chimet Laboratories on γ-Al2O3 (surface area = 121 m2 g-1; pore volume= 0.43 cm3 g-1)and on twodifferent activated carbons, fromwood (hereafter Cw:surface area = 980 m2 g-1; pore volume = 0.62 cm3 g-1) andpeat (hereafter Cp: surface area = 980 m2 g-1; pore volume =0.47 mm3 g-1) origin, following the deposition-precipitationmethod4,12-14 with Na2PdCl4 as a palladium precursor andNa2CO3 as a basic agent. For each support, the following Pdloadings have been prepared: 0.5, 1.0, 2.0, 3.5, and 5.0 wt % Pd.With the terminology Pd/Al2O3, Pd/Cw, and Pd/Cp, we indicatethe generic catalysts prepared on alumina, Cw and Cp. When weare referring to a specific catalyst, then its Pd loading in wt % isreported in parentheses (i.e., Pd(1.0)/Al2O3 indicates 1.0 wt%Pdsupported on alumina). As a reference, an unsupported samplehas been prepared following a similar procedure adopted for thecatalyst preparation, hereafter Pduns. All catalysts and Pduns havebeen carefully washed until complete Cl- removal has beenachieved and have remained in their wet condition until measure-ment. The Pduns sample has been divided into four subsets, threeof which have been dried at 393, 493, and 773 K, hereafter calledsamples Pduns(393), Pduns(493), and Pduns(773). Reduced Pdnanoparticles have been obtained from the as-precipitated sam-ples by drying at 393K and treatment in anH2 atmosphere at 393K. Reduced samples will be named Pd/Cw_H2, Pd/Cp_H2, andPd/Al2O3_H2, with obvious meanings.
2.2. UV-Vis Spectroscopy. The nature of the Pd-solvatedspecies in the Na2PdCl4 mother solution during the Pd precipita-tion process has been monitored by means of UV-vis spectro-scopy performed in transmissionmode on aVarianCary 300 scaninstrument, whereas the precipitated phase has been investigatedby UV-vis in reflectance mode on a Perkin-Elmer Lambda 19instrument.
2.3. TPR and CO Chemisorption. A Micromeritics Auto-chem 2910 instrument has been used for both the TPR and COchemisorption measurements.
For the TPRmeasurements, the instrument is equipped with aCryoCooler device for reaching subambient temperature by
means of liquid nitrogen. A molecular sieve trap has been putbetween the sample holder and the detector in order to absorbwater that is formed during the reduction process. A wet sample(100 mg) has been introduced in the sample holder and dried insitu by nitrogen flow at 393K for 2 h.15 Then the sample has beencooled to 153K underAr flow (50 cm3min-1). After this step, theflow was switched to 5% H2 in Ar (50 cm3 min-1) and wasmaintained throughout the analysis. Once a baseline was estab-lished, the temperature rampwas started at a rate of 5Kmin-1 upto 623 K. TPR experiments on Pduns(393), Pduns(493), and Pduns-(773) reference compound samples have been carried out on10 mg of sample following the same procedure described abovefor the catalysts.
CO chemisorption measurements have been performed by adynamic pulse method at 323 K on samples prereduced in the H2
atmosphere at 393 K, with the same procedure as described forTPRmeasurements, by usingHe instead ofN2. ACO/Pd averagestoichiometry of 1 has been assumed for the calculation ofdispersion. This assumption has been verified by a parallel seriesof measurements performed in a static volumetric apparatus onthree samples reduced at two different temperatures (393 and673 K) with H2 and O2 as probe molecules that give a O/Pdaverage stoichiometry of close to 1.16,17 The two methods/techniques give a CO/O ratio in the 0.94-1.13 range, which isstrong support for the assumption that the CO/Pd averagestoichiometry is 1.
2.4. X-ray Absorption Spectroscopy. EXAFS spectra intransmission mode with a high signal-to-noise ratio require theprecise calibration of sample thickness. However, when workingon samples where the Pd concentration varies within 1 order ofmagnitude (from 0.5 to 5.0 wt %), significant changes in thesample thickness are required: 35 to 9 mm (18 to 4 mm) for Pd/C(Pd/Al2O3) catalysts. For this reason, an ad hoc homemadesample holder (vide infra, Figure 2a) whose construction hasbeen inspired from the cells for liquidswas adopted.The thicknessof the cell, representing an excellent compromise between simpli-city and efficiency, can be optimized within the 4-50 mm range.The samples were hosted as wet unpressed powders and wereprotectedwith parafilmduring themeasurement toavoid apartialdrying effect. As far as reduced catalysts are concerned, the as-precipitated samples, in the form of self-supported pellets ofoptimized thickness, have been located inside an ad hoc conceivedcell18a that allows in situ evacuation at 393 K (in this case), in situremoval of the H2O reduction product, cooling down at roomtemperature and XAFS collection under vacuum conditions.
X-ray absorption experiments at the Pd K-edge (24350 eV)were performed at the BM26A beamline18b of the ESRF facility(Grenoble, France). Thewhite beamwasmonochromatized usinga Si(111) double crystal; a harmonic rejection has been performedusing Pt-coated silicon mirrors. The following experimental geo-metrywas adopted: (1) I0 (10%efficiency), (2) sample, (3) I1 (40%efficiency), (4) reference Pd foil, and (5) I2 (80% efficiency). Thissetup allows a direct energy/angle calibration for each spectrumby avoiding any problem related to small energy shifts due to thesmall thermal instability of the monochromator crystals.19 TheEXAFS parts of the spectra were collected with a variablesampling step in energy, resulting in Δk = 0.05 A-1 up to
(11) Pearlman, W. M. Tetrahedron Lett. 1967, 8, 1663–1664.(12) Geus, J. W.; van Dillen, A. J. Preparation of Supported Catalysts by
Deposition-Precipitation. In Handbook of Heterogeneous Catalysis; Ertl, G.,Kn€ozinger, H., Weitkamp, J., Eds.; VCH: Weinheim, Germany, 1997; Vol. 1, pp240-257.(13) Simonov, P. A.; Likholobov, V. A. Physicochemical Aspects of Preparation
of Carbon-Supported Noble Metal Catalysts. In Catalysis and Electrocatalysis atNanoparticle Surfaces; Wieckowski, A., Savinova, E. R., Vayenas, C. G., Eds.; MarcelDekker: New York, 2003; pp 409-454.(14) Bertarione, S.; Prestipino, C.; Groppo, E.; Scarano, D.; Spoto, G.;
Zecchina, A.; Pellegrini, R.; Leofanti, G.; Lamberti, C. Phys. Chem. Chem. Phys.2006, 8, 3676–3681.
(15) Pellegrini, R.; Leofanti, G.; Agostini, G.; Bertinetti, L.; Bertarione, S.;Groppo, E.; Zecchina, A.; Lamberti, C. J. Catal. 2009, 267, 40–49.
(16) Prelazzi, G.; Cerboni, M.; Leofanti, G. J. Catal. 1999, 181, 73–79.(17) Agostini, G.; Pellegrini, R.; Leofanti, G.; Bertinetti, L.; Bertarione, S.;
Groppo, E.; Zecchina, A.; Lamberti, C. J. Phys. Chem. C 2009, 113, 10485–10492.(18) (a) Lamberti, C.; Prestipino, C.; Bordiga, S.; Berlier, G.; Spoto, G.;
Zecchina, A.; Laloni, A.; La Manna, F.; D’Anca, F.; Felici, R.; D’Acapito, F.;Roy, P. Nucl. Instrum. Methods B 2003, 200, 196–201. (b) Nikitenko, S.; Beale,A. M.; van der Eerden, A. M. J.; Jacques, S. D. M.; Leynaud, O.; O'Brien, M. G.;Detollenaere, D.; Kaptein, R.; Weckhuysen, B.M.;W., B. J. Synchrotron Radiat. 2008,15, 632–640.
(19) Lamberti, C.; Bordiga, S.; Bonino, F.; Prestipino, C.; Berlier, G.; Capello,L.; D’Acapito, F.; Llabres i Xamena, F. X.; Zecchina, A.Phys. Chem. Chem. Phys.2003, 5, 4502–4509.

11206 DOI: 10.1021/la1005117 Langmuir 2010, 26(13), 11204–11211
Article Agostini et al.
20 A-1, with an integration time that linearly increases with kfrom 4 to 25 s/point to account for the low signal-to-noise ratio athigh k values.
The extraction of the χ(k) function has been performed usingthe Athena code.20 For each sample, two consecutive EXAFSspectra have been collected and corresponding χ(k) functionshave been averaged before data analysis. EXAFS data analysishas been performed using Arthemis software.20 The phase andamplitudes have been calculated by the FEFF6 code21 and havebeen successfully checkedwith Pdmetal foil. For each sample, theaveraged k3χ(k) function was Fourier transformed in the Δk =2.00-15.75 A-1 interval. For the Pduns model compound, theexperimental spectrum was fitted in R space in the ΔR =1.00-4.06 A range (2ΔkΔR/π > 25). At higher R values, theEXAFS spectra of the Pd2þ phase are dominated by noise, asappreciable in the plots reported in the Supporting Information,where the same curves are reported up to 10 A.
2.5. X-ray Powder Diffraction. XRPD data on the refer-ence samples were collected at BM26A18b in parallel with EXAFSmeasurements with a circular position-sensitive INEL CPS 590detector (sample-to-detector distanceR=50 cm) at an energy of24.00 keV corresponding to λ = 0.5165 A after 5 min ofintegration time. The experimental conditions were optimal forX-ray absorptionmeasurements (self-supported pellets, diluted inBN) but were not optimized for diffraction experiments for tworeasons: (i) the sample is placed in the center of the detector circlewith a precision of∼5 mm (i.e., channel-angle calibration is nece-ssary for any acquisition) and (ii) the sample cannot be consideredto be a point source of the diffracted beam because its thickness,optimized for EXAFS, is nonnegligible (on the order of milli-meters) so as to cause peak-broadening effects. The channel-anglecalibration was performed a posteriori using the well-definedpeaks of the BN phase that acts as an internal standard. Thisprocedure allows us to compare the different patterns qualita-tively, thus observing the progressive crystallization of the PdOphase, in addition to the EXAFS data. Unfortunately, for thereasons outlinedabove aquantitativeRietveld refinementwas notpossible.
3. Unsupported Precipitated Pd2þ Phase
3.1. In Situ UV-Vis Monitoring of the Precipitation
Process. The deposition-precipitation method used to preparePd/Cw, Pd/Cp, and Pd/Al2O3 samples implies the instantaneousprecipitation of the Pd2þ species of the acidic precursor whose pHvalue immediately reaches that of the alkaline slurry. In this way,we are unable to follow the rapid pHchangeof theNa2PdCl4 dropin time. Consequently, to follow the nature and abundance of thePd2þ-solvated species spectroscopically during the precipitationprocess we decided to invert the process, adding increasingamounts of base to the starting water solution of Na2PdCl4(3.2 � 10-4 M, pH 3.0, no support is present in this case). Aftereach base addition, the pH of the solution was recorded and anegligible fraction of the liquid has been sampled for UV-vismeasurements in transmission mode. The results are displayed inFigure 1a,b. The optical spectrum of the starting Na2PdCl4solution (black curve) is characterized by two main absorptionbands at 48000 and 42500 cm-1 that, according to the litera-ture,22 are ascribed to the charge-transfer (CT) transition of[PdCl(H2O)3]
þ and [PdCl2(H2O)2] complexes, respectively. Thetwo weaker components at 24500 and 33500 cm-1 are associatedwith two CT bands of the same species characterized by a muchlower extinction coefficient. From the equilibrium constants
reported elsewhere,23 the expected concentrations in the adoptedconditions are∼50% [PdCl2(H2O)2], ∼40% [PdCl(H2O)3]
þ, and∼10% [PdCl3(H2O)]-. The main spectroscopic feature of thislast, less-abundant species expected at 41800 cm-1 is not visible inFigure 1a because its extinction coefficient is too low.22 Uponprogressive additionof base (i.e., increasing the pH), the twomainCT bands are almost unaffected until pH∼3.8, when they rapidlydisappear because of the precipitation of the Pd2þ phase(Figure 1c), hereafter called Pduns.3.2. Structural Characterization of the Unsupported
Pd2þ Precipitated Phase. The optical properties of the pre-cipitated phase,mainly constituted of Pd2þ-polynuclearhydroxocomplexes,24-26 have been investigated byDRSUV-vis spectro-scopy (Figure 1c). No vestige of the well-defined CT bands ofisolated [PdClx(H2O)4- x]
2-x complexes was present in the UV-visDRS spectrum, testifying that all Pd2þ ions lie in anaggregatedphase characterized by a broad CT band at much lower energycentered at around 20000 cm-1.
The XRD pattern (not reported) of Pduns reveals its amorphousnature. Therefore, to obtain structural information, we usedEXAFSspectroscopy,which is able todetermine the local structurearound the absorbing atom (Pd in this case) also in the absence oflong-range order. The EXAFS spectrum of Pduns is shown inFigure 2c,d in both k- and R-spaces. The |FT| is dominated by afirst-shell contribution centered at around 1.6 A and by a weakerand complex contribution at a longer distance (two peaks at 2.7and 3.2 A, respectively). To model our EXAFS data, we con-structed the cluster reported in Figure 2b on the basis of thestructural model proposed for the Pd2þ-polynuclearhydroxo
Figure 1. (a) From black to brown curves, evolution of thetransmission UV-vis spectra of the Na2PdCl4 precipitation solu-tion (3.2� 10-4 M) as a function of the pH increase (where only aselection of curves have been reported). The CT bands of[PdCl(H2O)3]
þ and [PdCl2(H2O)2] complexes are identified bycircle and diamond symbols, respectively. (b) Absorption intensityof the two main CT components as a function of pH. The colorcode adopted in part b allows us to recognize the selected curves inpart a. (c) UV-vis DRS spectrum of the precipitated Pd(OH)2phase (K.M. = Kubelka-Munk).
(20) Ravel, B.; Newville, M. J. Synchrot. Radiat. 2005, 12, 537–541.(21) Ankudinov, A. L.; Ravel, B.; Rehr, J. J.; Conradson, S. D. Phys. Rev. B
1998, 58, 7565–7576.(22) Elding, L. I.; Olsson, L. F. J. Phys. Chem. 1978, 82, 69–74.
(23) Elding, L. I. Inorg. Chim. Acta 1972, 6, 647–651.(24) Troitskii, S. Y.; Chuvilin, A. L.; Kochubei, D. I.; Novgorodov, B. N.;
Kolomiichuk, V. N.; Likholobov, V. A. Russ. Chem. Bull. 1995, 44, 1822–1826.(25) Troitskii, S. Y.; Chuvilin, A. L.; Bogdanov, S. V.; Moroz, E. M.;
Likholobov, V. A. Russ. Chem. Bull. 1996, 45, 1296–1302.(26) Rotunno, F.; Prestipino, C.; Bertarione, S.; Groppo, E.; Scarano, D.;
Zecchina, A.; Pellegrini, R.; Leofanti, G.; Lamberti, C. In Preparation of Pd/CCatalysts: From the Pd-Precursor Solution to the Final Systems; Gaigneaux, E. M.,Devillers, M., De Vos, D. E.,Hermans, S., Jacobs, P. A., Martens, J. A., Ruiz, P., Eds.;Studies in Surface Science and Catalysis; Elsevier: Amsterdam: 2006; Vol. 162,pp 721-728.
DOI: 10.1021/la1005117 11207Langmuir 2010, 26(13), 11204–11211
Agostini et al. Article
complexes by Troitskii et al.24 In this model, Pd2þ-polynuclear-hydroxo complexes form filaments of about 100Pdatoms.Becauseour EXAFSdata exhibits signal at up to 4 A (Figure 2c,d), we havetruncated the cluster to the labeled atoms in Figure 2b.
The local environment of Pd2þ consists of planar coordinationsquares of PdO4 units linked via two (O1a) or one (O1b) oxygenbridges with different geometry. The remaining Pd-O bondconnects an OH group (O1c). To limit the number of scatteringpaths and thus free parameters in the EXAFS fit, PdO4 unitslinked via two oxygen bridges are forced to be coplanar, resultingin two Pd (Pd0 and Pd1 in Figure 2b) and six O atoms in the sameplane. Moreover, Pd2 has been forced to lie on the same plane.Even if such a geometrical approximation seems to be very crude,it does not affect the fit results; in fact, nomultiple scattering (MS)path involving Pd0 and Pd1 or Pd0 and Pd2 has significant weight,so both Pd1 and Pd2 scatterers contribute with their singlescattering (SS) signal only, from which no relative angle can beestimated.According to thismodel, themost important scatteringpaths are the SSPd0-O1 (4-fold degenerate), Pd0-Pd1, Pd0-Pd2,Pd0-O2, the collinear MS involving diametrically opposite O1
atoms, and the MS triangular paths involving Pd0 and twoadjacent O1 atoms. The three Pd0-O1a, Pd0-O1b, and Pd0-O1c
distances can, in principle, be different. A fit of the first-shellcontribution (0.9-2.0 A range in Figure 2) with two independent
oxygen shells resulted, within experimental error, in the samedistance and Debye-Waller factors for the two shells. Conse-quently, we assumed all Pd-O1 distances to be equivalent (withinthe accuracy of the technique). Therefore, the EXAFS spectrumwas optimized with the following 10 free parameters: a singleamplitude factor (S0
2) and a single energy shift (ΔE) common toall paths, the Pd0-O1, Pd0-Pd1, Pd0-Pd2, and Pd0-O2 distances(RO1,RPd1,RPd2, andRO2), and their correspondingDebye-Wallerfactors (σO1
2, σPd12, σPd2
2, and σO22). The quantitative results of the
fit are reported inTable1, and thequalityof the fit canbeappreciatedin Figure 2c,d for k and the R space, respectively. Optimizeddistances RO1 = 2.02 ( 0.004 A and RPd1 = 3.03 ( 0.01 A allowus to determineR=83( 3�. Analogously, RPd2= 3.42( 0.03 Aimplies δ= 135( 5�, and finally RO2= 3.66( 0.04 A results inθ = 75 ( 8�.
The quality of the EXAFS fit (Rfactor = 0.027) validates thestructuralmodel proposedbyTroitskii et al.24 and implies that thenature of the precipitated phase is a [Pd(OH)2]n colloid character-ized by high local order (strongEXAFS signal up to 4.1 A) and bypoor long-range order (XRD silent). With respect to the modelproposed in 1995 by Troitskii et al.,24 the higher quality of ourEXAFS data allows us to improve the local geometry bydetermining the R, δ, and θ angles fixed at 90, 122, and 90� inprevious work. The basic validation of the model proposed byTroitskii et al.24 is very important because it proves that Cl- ionsthat are present in the first coordination shell of Pd2þ when it ispresent in solution (CT bands in Figure 1a) leave the Pd2þ
environment in the precipitated phase so that no Pd-Cl signalis present in the EXAFS spectrum.3.3. Thermal Treatment of the Unsupported Pd2þ Pre-
cipitated Phase. It has just been shown that Pduns is anamorphous, nonstoichiometric Pd-hydroxide phase. As will bereported in section 4, Pd2þ-supported samples exhibit a degree oflocal order higher than that found on Pduns; hence, more orderedPd2þ model compounds are needed. For this reason, the Pdunssample has been subjected to progressive thermal treatments atincreasing temperature, resulting in a gradual transformation intoa more ordered Pd-oxide phase: samples Pduns(393), Pduns(493),and Pduns(773).
The properties of the Pduns phase at each activation tempera-ture have been investigated by XRPD (Figure 3a), EXAFS(Figure 3b,c), and TPR (Figure 3d). Starting with XRPD, thePduns phase (pattern not reported) did not present any diffractionpeak distinguishable from the background besides those of theBN phase used as a diluent. The crystallization and sinteringprocesses of the starting amorphous Pduns phase upon increasingthe treating temperature are clearly visible, on qualitativegrounds, from the XRPD patterns reported in Figure 3a. Themost intense reflection of the PdO phase at 2θ = 9.5� due tothe (110) plane (dspacing = 3.18 A) is already visible after heatingto 393 K, resulting in a broad peak (fwhm = 1.14�). Thermaltreatments at 493 and 773 K progressively reduce the fwhm to0.95 and 0.28� respectively, with the concomitant appearance ofnew well-defined reflections of the PdO phase (see asterisks)reflecting the occurrence of a disorder-order transition.
Note that BN used to optimize the EXAFS measurementsresults in well-defined, sharp diffraction peaks that scarcelyinterfere with the Pd-oxide phase. The intensity of the BNdiffraction peaks is strongly affected by the pressure adopted toprepare the pellets (compare the gray and black patterns inFigure 3a); the effect is due to preferred orientations. Smallerchanges in the relative intensity of the BN peaks measured in thedifferent samples can be explained in terms of slightly differentpressures adopted in the pellet preparation.
Figure 2. (a) Photograph of the ad hoc-designed high-energyEXAFS cell. The cell is optimized for powdered samples. (b)Pd(OH)2 cluster used to model the EXAFS signal up to 4.1 Aaround the absorbing Pd atom (labeled as Pd0). Gray and redspheres representPdandOatoms, respectively.Hatoms,which areunable to contribute significantly to the EXAFS signal, have beenomitted. The model has been constructed from the studies ofTroitskii et al.24,25 The structural parameters optimized in theEXAFS fit are the Pd-O first-shell distance (considered to beequivalent for O1a, O1b, and O1c atoms), the Pd0-Pd1, Pd0-Pd2,and Pd0-O2 distances, and the corresponding Debye-Wallerfactors. Angles R and δ differ from the ideal 90� of square-planargeometry in order to account for the optimized Pd0-Pd1,Pd0-Pd2, and Pd-O1 distances. Because the two PdO4 unitscentered in Pd0 and Pd2 are linked via a single oxygen bridge(O1b), the PdO4 unit centered on Pd2 is, in principle, free to rotate.The optimized Pd0-O2 distance allows us to evaluate the angle θbetween the Pd0-Pd2 and Pd2-O2 vectors. (c) Comparison be-tween experimental (scattered black dots) and best fit (red full line)in k space, adopting a k3 weight. (c) k3-weighted, phase-uncor-rected k3 χ(k) functions reported in part c. Both the modulus andimaginary parts have been reported. Vertical arrows in parts (c)and (d) indicate the FT and the fit ranges, respectively.

11208 DOI: 10.1021/la1005117 Langmuir 2010, 26(13), 11204–11211
Article Agostini et al.
Figure 3b,c reports the k3-weighted, phase-uncorrected FT ofthe EXAFS signal of the precipitated Pduns phase and thatobtained after subsequent heating of the sample to 393, 493,and 773 K. The crystallization process that occurred on samplePduns(773) K is clearly observed by EXAFS because the corre-sponding FT exhibits a signal up to R = 4.5 A, typical of long-range-orderedmaterials, but for the as-precipitated phase and thesample heated to 493 K, the signal stops at around 3.5 A.
Going intomore detail, the EXAFSdata reported inFigure 3b,c confirm on local grounds what was concluded in the XRPDstudy discussed above. The first shell signal (around 1.6 A) isbasically unaffected by the heating process because all Pd atomslie in square-planar geometry, independent of the degree ofhydroxylation and sintering (Figure 3b); this invariance will alsohold for catalysts (section 4). Conversely, the second and thirdpeaks (around 2.7 and 3.2 A) are significantly modified andincrease in intensity according to the formation of new, moreordered Pd-O-Pd bridges upon dehydroxylation (Figure 2b).Of particular interest is the peculiar inversion between theintensity of these two peaks that can be considered to be theEXAFS fingerprint of effective dehydroxylation. It is evident thatboth hydroxide and oxide phases have very similar EXAFSspectra, with imaginary parts that are almost totally in phase(Figure 3c). On this basis, it is evident that on the catalyst samples,where Pdmetal, hydroxide, and oxide phases can possibly coexist,it will be virtually impossible to discriminate EXAFS databetween hydroxide and oxide phases.
The TPR pattern of sample Pduns (orange curve in Figure 3d)exhibits the main reduction peak starting at 252 K with a Tmax of264 K. This peak is followed by a shoulder that is at least partiallydue to hydride formation and by the successive negative peak dueto hydride decomposition.15 Upon heating, the main Pd2þ reduc-tion peak is shifted to higher temperatures with a starting tem-perature of ∼263 K for both Pduns(493) and Pduns(773) and Tmax
values of 274 and277KforPduns(493) andPduns(773), respectively.We can conclude that the dehydration caused by calcination isresponsible for the increase in the reduction temperature by∼10K.This is the behavior expected as a consequence of the increase inorder, which decreases the density of surface defects that act aspreferential starting points for the reduction process.
4. Supported Precipitated Pd Phase from 0.5 to5.0 wt %
The use of the deposition-precipitation method to preparesupported palladium catalysts directly provides palladium in anunreduced state (oxide/hydroxide) deposited into the pores of thecarrier material. The investigation of this Pd phase is importantnot only because it represents an indispensable step in thepreparation of supported Pd nanoparticles but also because theseunreduced catalysts can be used in hydrogenation reactionswithout further treatment (e.g., debenzylation11). Furthermore,the final industrial catalyst, being either in a reduced or unreducedstate, is almost always kept in thewet form for safetyhandling andstorage and is loaded as such into the hydrogenation reactor.Therefore, in this section, we have characterized the catalysts inthe original wet state because the drying pretreatment could alterthe catalyst properties, specifically, the degree of reduction of Pd.The local environment of Pd in Pd/Cw, Pd/Cp, and Pd/Al2O3
systems has been investigated as a function of Pd loading from0.5 up to 5.0 wt %.
As an example, Figure 4a,b reports bothmoduli and imaginaryparts of the k3-weighted, phase-uncorrected FT of the EXAFSsignal for the as-precipitatedPd/Cw samples. The spectra of Pduns
Table 1. Summary of the EXAFS Fit of the Pd(OH)2 Precipitated Phasea
Pd0-O1 Pd0-Pd1 Pd0-Pd2 Pd0-O2 ΔE
R(A) σ2(A2) R(A) σ2(A2) R(A) σ2(A2) R(A) σ2(A2) eV S02
2.023 ( 0.005 0.0041 ( 0.0005 3.03 ( 0.01 0.0040 ( 0.0005 3.42 ( 0.03 0.007 ( 0.002 3.66 ( 0.04 0.008 ( 0.005 2.5 ( 0.9 0.96 ( 0.07
aThe fit validity can be appreciated from the quality factor R = 0.027 and from the low values of main correlations among optimized variables:S0
2/σO12 = 0.79 and ΔE/RO1 = 0.75. (The remaining correlations are below 0.7 in absolute value.).
Figure 3. XRPD, EXAFS, and TPR of the precipitated Pd(OH)2phase as such (Pduns, orange curves) and thermally treated at 393,493, and773K(red, green, andblue curves, respectively). (a)XRPDpatterns collected just before the EXAFS data collection. Samplesare in the form of pellets of optimized thickness for absorptionmeasurements that have been pressed with BN to make them self-supporting. For comparison, the XRPD patterns collected onpressed and unpressedBNare also reported (black and gray curves,respectively). Beam energy=24 keV, corresponding to λ=0.5165A. (b) k3-weighted, phase-uncorrected FT of the EXAFS signal. (c)The same as for part b for the imaginary part. (d) TPR patterns.
Figure 4. (a) Modulus of the k3-weighted, phase-uncorrected FTof theEXAFS signal ofPd/Cwsampleswith increasingPd loadingsof 0.5, 1.0, 2.0, 3.5, and 5.0 wt% for samples Pd(0.5)/Cw, Pd(1.0)/Cw, Pd(2.0)/Cw, Pd(3.5)/Cw, and Pd(5.0)/Cw, respectively. (b)The same as in part a for the imaginary part. Pd(OH)2 and PdOmodel compounds heated to 773 K are also reported for compar-ison. (c) Corresponding TPR curves.

DOI: 10.1021/la1005117 11209Langmuir 2010, 26(13), 11204–11211
Agostini et al. Article
and Pduns(773) are also reported for comparison. The data on Pd/Cw reported in Figure 4a,b are almost equivalent, showing theoxidic nature of the Pd precursor at any investigated loading. Inparticular, the signal is intermediate between that for modelcompound Pd(OH)2 and that for model compound PdO heatedto 773 K. The third-shell contribution (centered at around 3.2 A)shows a small intensity increase upon increased Pd loading, andsaturates (at 2.0 wt % Pd) at a value much lower than thatobserved for PdOheated to 773K, indicating the dispersed natureof the oxidic Pd precursors on the Cw support. IndependentXRPDmeasurements (not shown) are characterized by the broadbumps typical of carbons and did not show the presence of anycrystalline phase. In the EXAFS spectra, no evidence of reducedPd metal is appreciable. According to the sensitivity of thetechnique, we can affirm that if reduced Pd particles are presentat this stage then their concentration is below 1 to 2%. Thisevidence is important, particularly for samples prepared oncarbon supports, where the presence of several chemically activespecies could, in principle, have a reducing effect on the pre-cipitated phase.
The effects of the nature of the support and of the Pd loadingsare shown in Figure 5, where the data for both low and high Pd-loaded samples on the three supports are reported. At the lowestinvestigated loadings (Figure 5a), the difference in particle dimen-sions of the amorphous PdO precursor is appreciable from theintensity of the higher shell signal at 2.3-3.5 A: Pd/Cp< Pd/Cw< Pd/Al2O3. For the 5.0 wt % Pd-loaded samples (Figure 5b),this trend holds but becomes borderline within the sensitivity ofthe technique.
All TPR profiles (Figures 4c and 5c,d) have two main features:(i) complex H2 consumption formed by a peak plus a shoulder inthe 260-330 K region due to the Pd2þ f Pd0 reduction and thesurface PdHx and bulk Pd-hydride phase formation and (ii)a negative peak due to Pd-hydride decomposition. Note that1.0 wt % Pd-supported samples have been chosen to be repre-sentative of the low loaded catalysts in TPR experiments becausethe results obtained on 0.5 wt % Pd samples resulted in a TDCsignal that was too low.
TPR results can be summarized as follows. (a) The TPRprofileof the Pduns sample is markedly different from those of the
supported catalysts, and the same holds true for the EXAFSspectra. (b) The starting temperature of reduction (Tstart) as wellas the peak temperature (Tpeak) of Pd/Cw samples decreases withincreasing Pd concentration, more markedly at low Pd concen-tration and only slightly at high concentration (Figure 4c). Thistrend mirrors that observed in the FT of the EXAFS spectra(Figure 4a,b). TPR is more sensitive than EXAFS to Pd con-centrationbecauseTstart and consequentlyTpeak dependon the Pdcrystal surface rather than on the bulk. (c) Conversely, samplessupportedonAl2O3 are characterized byTPRandEXAFS resultsthat are much less dependent on the Pd loading: the main peaktemperature ranges from 268 to 273 K in Pd/Al2O3 samples andfrom 267 to 278 K in Pd/Cw samples. (d) The difference amongthe supports is clearly observed at low Pd loading (Figure 5a,c),but it is much less visible at high loading (Figure 5bd); inparticular, the Tpeak of Pd/Cw and Pd/Al2O3 samples differs by5 and 1 K for Pd(1.0) and Pd(5.0) samples, respectively.
Analogies and differences observed among the different sam-ples byEXAFS spectroscopy are fully supported by parallel TPR,with the latter being more sensitive to the type of support and Pdconcentration because it is affected by a Pd surface that is, in turn,more sensitive to these characteristics. In summary, under theadopted preparation conditions, Pd precipitation occurs in theliquid phase (i.e., independently of the presence and nature ofthe support (section 3.1). Besides the very first steps in theprecipitation process (0.5 and 1.0 wt%Pd), this results in sampleshaving a Pd2þ-supported phase that has the same Pd localenvironment (Figure 5b) and the sameH2 reducibility (Figure 5d).
5. H2-Reduced Pd Nanoparticles from 0.5 to 5.0 wt %
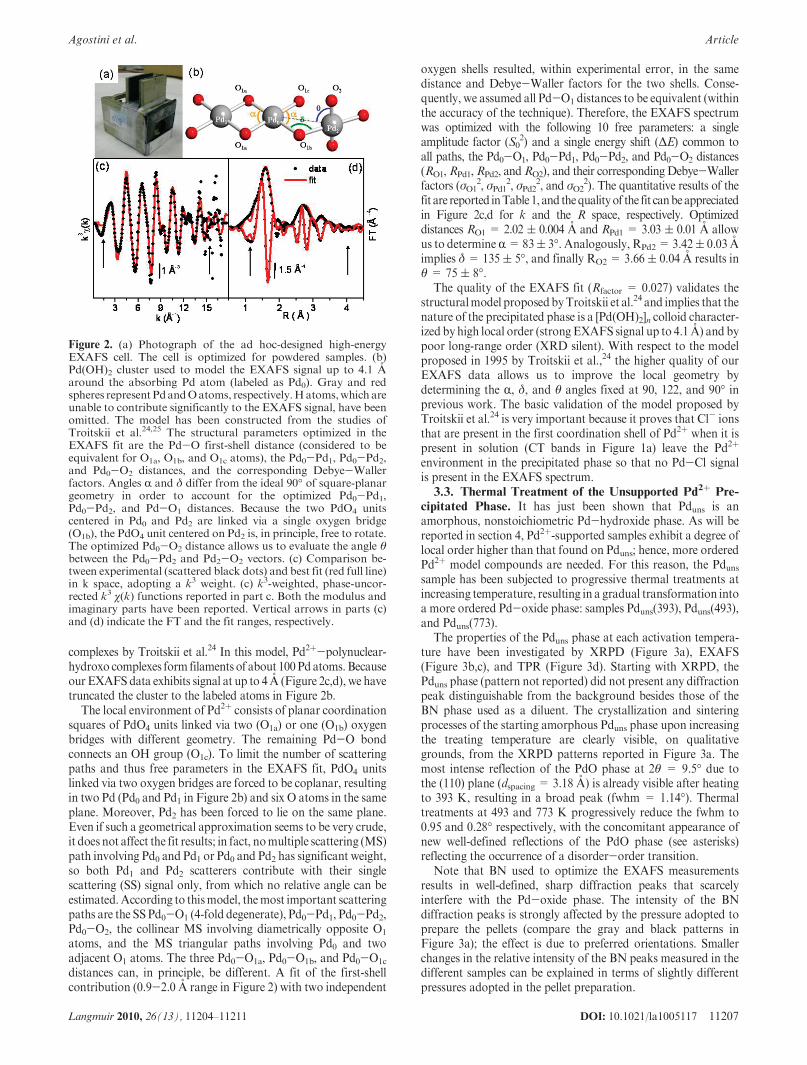
From the TPR experiments reported in section 4, we learnedthat 393 K (in an H2 atmosphere) is by far a safe temperature toallow complete Pd2þ f Pd0 conversion for all as-precipitatedsamples. This hypothesis is verified by the total absence ofhydrogen consumption in TPR experiments made after in situH2 reduction at 393 K (curves not reported). This result isconfirmed by the XANES spectra reported in Figure 6a for thehighest loaded samples. Pd(5.0)/Cw_H2, Pd(5.0)/Cp_H2, andPd(5.0)/Al2O3_H2 samples show virtually indistinguishableXANES spectra that are red shifted by about 3 eV with respectto the edge of the as-precipitated samples. (See the spectrum ofsample Pd(5.0)/Cw reported for comparison.) The XANESspectra of the reduced samples are perfectly aligned with that ofthe Pd foil but exhibit smaller oscillations in the near-edge regionbecause of the nanometer size of the metal particles.
The nanometric nature of the Pd metal particles is betterappreciated in the k3-weighted, phase-uncorrected Fourier trans-form (FT) of the EXAFS spectra14,17,27-34 (Figure 6b). In allcases, H2 reduction completely modifies the FT curves of the as-precipitated samples, showing the disappearance of the first-shell
Figure 5. (a) Modulus of the k3-weighted, phase-uncorrectedmodulus of the FT of the EXAFS signal of 0.5 wt% Pd supportedon Cw, Cp, and Al2O3. (b) The same as for part a for the 5.0 wt%Pd-supported catalysts. (c) TPR curves of 1.0 wt % Pd supportedon Cw and Al2O3. (d) The same as for part c for the 5.0 wt % Pd-supported catalysts. Gray dashed lines in parts c and d show thesmall differences in the reduction temperature.
(27) Frenkel, A. I.; Hills, C. W.; Nuzzo, R. G. J. Phys. Chem. B 2001, 105,12689–12703.
(28) Keresszegi, C.; Grunwaldt, J. D.; Mallat, T.; Baiker, A. J. Catal. 2004, 222,268–280.
(29) Caravati, M.; Meier, D. M.; Grunwaldt, J. D.; Baiker, A. J. Catal. 2006,240, 126–136.
(30) Grunwaldt, J. D.; Caravati, M.; Baiker, A. J. Phys. Chem. B 2006, 110,25586–25589.
(31) Sun, Y.; Frenkel, A. I.; Isseroff, R.; Shonbrun, C.; Forman, M.; Shin,K. W.; Koga, T.; White, H.; Zhang, L. H.; Zhu, Y. M.; Rafailovich, M. H.;Sokolov, J. C. Langmuir 2006, 22, 807–816.
(32) Frenkel, A. Z. Kristallogr. 2007, 222, 605–611.(33) Knecht, M. R.; Weir, M. G.; Frenkel, A. I.; Crooks, R. M. Chem. Mater.
2008, 20, 1019–1028.(34) Groppo, E.; Liu, W.; Zavorotynska, O.; Agostini, G.; Spoto, G.; Bordiga,
S.; Lamberti, C.; Zecchina, A. Chem. Mater. 2010, 22, 2297–2308.
11210 DOI: 10.1021/la1005117 Langmuir 2010, 26(13), 11204–11211
Article Agostini et al.
Pd-O signal around 1.6 A and of the higher-shell contributions ofthe oxidic phase around 2.7 and 3.2 A, accompanied by the rise inthe Pd-Pd first-shell signal at 2.5 A together with the typicalhigher shell peaks of the fcc structure at around 3.7, 4.5, 5.1, 5.8,and 7.0 A. All of these features are significantly less intense thanthe corresponding features of the Pd metal foil (gray curve),reflecting a decrease in the average coordination number, asexpected in the case of nanometer-sized Pd particles. Amongreduced supported samples, a trend is observed indicating thatthe average Pd particle size on the three different supports isslightly different and follows the Pd(5.0)/Al2O3_H2 < Pd(5.0)/Cp_H2 < Pd(5.0)/Cw_H2 order.
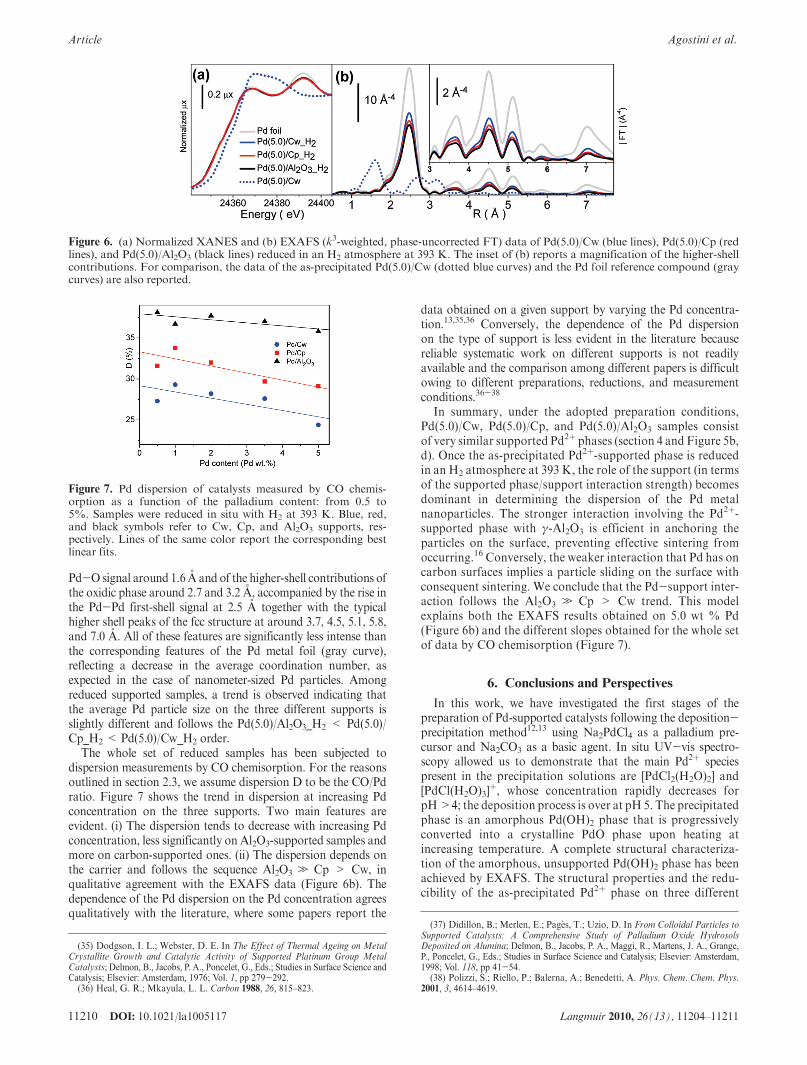
The whole set of reduced samples has been subjected todispersion measurements by CO chemisorption. For the reasonsoutlined in section 2.3, we assume dispersion D to be the CO/Pdratio. Figure 7 shows the trend in dispersion at increasing Pdconcentration on the three supports. Two main features areevident. (i) The dispersion tends to decrease with increasing Pdconcentration, less significantly on Al2O3-supported samples andmore on carbon-supported ones. (ii) The dispersion depends onthe carrier and follows the sequence Al2O3 . Cp > Cw, inqualitative agreement with the EXAFS data (Figure 6b). Thedependence of the Pd dispersion on the Pd concentration agreesqualitatively with the literature, where some papers report the
data obtained on a given support by varying the Pd concentra-tion.13,35,36 Conversely, the dependence of the Pd dispersionon the type of support is less evident in the literature becausereliable systematic work on different supports is not readilyavailable and the comparison among different papers is difficultowing to different preparations, reductions, and measurementconditions.36-38
In summary, under the adopted preparation conditions,Pd(5.0)/Cw, Pd(5.0)/Cp, and Pd(5.0)/Al2O3 samples consistof very similar supported Pd2þ phases (section 4 and Figure 5b,d). Once the as-precipitated Pd2þ-supported phase is reducedin an H2 atmosphere at 393 K, the role of the support (in termsof the supported phase/support interaction strength) becomesdominant in determining the dispersion of the Pd metalnanoparticles. The stronger interaction involving the Pd2þ-supported phase with γ-Al2O3 is efficient in anchoring theparticles on the surface, preventing effective sintering fromoccurring.16 Conversely, the weaker interaction that Pd has oncarbon surfaces implies a particle sliding on the surface withconsequent sintering. We conclude that the Pd-support inter-action follows the Al2O3 . Cp > Cw trend. This modelexplains both the EXAFS results obtained on 5.0 wt % Pd(Figure 6b) and the different slopes obtained for the whole setof data by CO chemisorption (Figure 7).
6. Conclusions and Perspectives
In this work, we have investigated the first stages of thepreparation of Pd-supported catalysts following the deposition-precipitation method12,13 using Na2PdCl4 as a palladium pre-cursor and Na2CO3 as a basic agent. In situ UV-vis spectro-scopy allowed us to demonstrate that the main Pd2þ speciespresent in the precipitation solutions are [PdCl2(H2O)2] and[PdCl(H2O)3]
þ, whose concentration rapidly decreases forpH>4; the deposition process is over at pH 5. The precipitatedphase is an amorphous Pd(OH)2 phase that is progressivelyconverted into a crystalline PdO phase upon heating atincreasing temperature. A complete structural characteriza-tion of the amorphous, unsupported Pd(OH)2 phase has beenachieved by EXAFS. The structural properties and the redu-cibility of the as-precipitated Pd2þ phase on three different
Figure 6. (a) Normalized XANES and (b) EXAFS (k3-weighted, phase-uncorrected FT) data of Pd(5.0)/Cw (blue lines), Pd(5.0)/Cp (redlines), and Pd(5.0)/Al2O3 (black lines) reduced in an H2 atmosphere at 393 K. The inset of (b) reports a magnification of the higher-shellcontributions. For comparison, the data of the as-precipitated Pd(5.0)/Cw (dotted blue curves) and the Pd foil reference compound (graycurves) are also reported.
Figure 7. Pd dispersion of catalysts measured by CO chemis-orption as a function of the palladium content: from 0.5 to5%. Samples were reduced in situ with H2 at 393 K. Blue, red,and black symbols refer to Cw, Cp, and Al2O3 supports, res-pectively. Lines of the same color report the corresponding bestlinear fits.
(35) Dodgson, I. L.; Webster, D. E. In The Effect of Thermal Ageing on MetalCrystallite Growth and Catalytic Activity of Supported Platinum Group MetalCatalysts; Delmon, B., Jacobs, P. A., Poncelet, G., Eds.; Studies in Surface Science andCatalysis; Elsevier: Amsterdam, 1976; Vol. 1, pp 279-292.(36) Heal, G. R.; Mkayula, L. L. Carbon 1988, 26, 815–823.
(37) Didillon, B.; Merlen, E.; Pag�es, T.; Uzio, D. In From Colloidal Particles toSupported Catalysts: A Comprehensive Study of Palladium Oxide HydrosolsDeposited on Alumina; Delmon, B., Jacobs, P. A., Maggi, R., Martens, J. A., Grange,P., Poncelet, G., Eds.; Studies in Surface Science and Catalysis; Elsevier: Amsterdam,1998; Vol. 118, pp 41-54.
(38) Polizzi, S.; Riello, P.; Balerna, A.; Benedetti, A. Phys. Chem. Chem. Phys.2001, 3, 4614–4619.

DOI: 10.1021/la1005117 11211Langmuir 2010, 26(13), 11204–11211
Agostini et al. Article
supports (alumina, active carbons from wood and from peat)have been successively investigated by means of EXAFS andTPR as a function of palladium loading (from 0.5 to 5.0 wt %Pd). In all as-precipitated samples, no appreciable amount ofthe Pd metal phase has been detected by EXAFS, meaning thatthe upper limit of the reduced metal phase is 1 to 2%. In thesesamples, the average Pd local environment is intermediatebetween that observed for amorphous Pd(OH)2 and crystal-line PdO phases. A clear evolution of the EXAFS signal alongthe loading is observed, which saturated at 2.0 wt % Pd. Theeffect of the support is appreciable at the lowest loading wherethe highest shell signals exhibits an intensity that increasesupon moving from Cp through Cw to Al2O3, reflecting theincreasing order of the amorphous supported phase. The sametrend holds for the maximum investigated loading, but thedifferences become much less evident.
Once the samples are reduced in an H2 atmosphere to metalnanoparticles, two trends are observed: (i) the dispersion tends todecrease with increasing Pd concentration, less significantly onAl2O3-supported samples and more significantly on carbon-supported ones and (ii) the dispersion depends on the carrierfollowing the sequence Al2O3 . Cp > Cw. This trend has been
explained in terms of a different Pd0-support interactionstrength.
The differences among the supports (Al2O3, Cp, and Cw),barely appreciable in the as-precipitated phase, become dramaticupon H2 reduction at 393 K under dry conditions. This factimplies that the reduction process deeply affects the character-istics of the supported metal nanoparticles. In future work wewill investigate the effect of different reduction condition incomparing dry and wet reductions and using different reducingmolecules.
Acknowledgment.We thank F. Rotunno, who performed thetime/pH-dependent UV-vis study reported in Figure 1a. Weacknowledge the whole staff of the BM26 beamline at the ESRFand S. Nikitenko in particular for important and competentsupport during PdK-edgeEXAFSdata collection.We also thankMassimo Graziani (Chimet S.p.A.) for the CO chemisorptionmeasurements.
Supporting Information Available: FT of all EXAFScurves plotted up to R = 10 A. This material is availablefree of charge via the Internet at http://pubs.acs.org.
Copyright © 2022 FDOKUMEN


![Metal-Free and Pd II -Promoted [2+3] Cycloadditions of a Cyclic Nitrone to Phthalonitriles: Syntheses of Oxadiazolines as well as Phthalamide-Pd II and Dihydropyrrolyl-iminoisoindolinone-Pd](https://static.fdokumen.com/doc/165x107/6345c8bc6cfb3d406409d73e/metal-free-and-pd-ii-promoted-23-cycloadditions-of-a-cyclic-nitrone-to-phthalonitriles.jpg)