k DEPOSITED o - Oxford University Research Archive
330
ECOLOGICAL GBMSTICS OF TRIFQLIUM REPSNS A Thesis, with Abstract, submitted by k DEPOSITED o ' THESIS - o C o J.(J. PU3BY, M.A. New College for the degree of Doctor of Philosophy in the University of Oxford 1965
-
Upload
khangminh22 -
Category
Documents
-
view
0 -
download
0
Transcript of k DEPOSITED o - Oxford University Research Archive

ECOLOGICAL GBMSTICS OF TRIFQLIUM REPSNS
A Thesis, with Abstract,
submitted by
k DEPOSITED o' THESIS -
o Co
J.(J. PU3BY, M.A.
New College
for the degree of
Doctor of Philosophy
in the University of Oxford
1965

ABSTRACT
The theory of Evolution by Natural Selection deals
substantially with events now past, and with processes too slow
for contemporary study. Experimental studies of evolution are
possible, but are liable to the criticism that they deal with
artificial, or at least extreme and atypical situations,
involving rapid evolutionary change. Such criticism can be
avoided to a degree by studying situations now in equilibrium.
It is suggested that interesting results may be obtained
by studying polymorphisms, and comparing the equilibria reached
in populations of an organism in different environments. The
chosen approach was to find a case of polymorphism convenient
to study, followed by an attempt to interpret the pattern of
its variation in terms of features of environments where a
morph was common selecting in its favour, and vice versa.
The material presented falls into three parts.
1) Material and Methods: Background and Preliminary Studies.
The system chosen for study was the white V-shaped leaf
markings of Trifolium repens. The species is widespread,
abundant, and variable; the character is expressed on vegeta
tive organs, and is therefore always accessible; and the known
variation in this character had already been interpreted in
terms of the action of a set of several alleles at one locus.

ii
The results of crosses indicate general agreement with
previous reports. One heterozygous plant apparently largely
failed to transmit one allele, Vfe , through the pollen.
Segregations indicate that a new phenotype, 'smeared 1 , is
determined by a particular Vn allele. Two more new phenotypes,
'shaded* and 'marginal 1 are described. The places where these
and other rare phenotypes have been found are listed. New
reports and the author's other experience are combined with
previous reports in a new general account of leaf marking in
the species, which also deals with at least three distinct
classes of red markings. There appears to be more variation,
implying more alleles, than previous accounts allow for, andV» T "P
reportedly distinct types, for example, V , V and V , seem
to be linked by a series of intermediates, among which clear
dividing lines are hard or impossible to draw.
Experimental studies relating to the techniques of
population sampling are reported. Scarification by 10 to 20
minutes exposure to concentrated sulphuric acid was chosen to
deal with hard seed. The effect of a restricted number of
mother plants on the accuracy of a seed sample is discussed;
predictions concerning the frequencies of different .types in
progeny from single heads grown separately were roughly
consistent with observations. Possible differences between
vegetative aind seed samples are discussed. Korph frequencies
in a sample of plants bearing inflorescences were not found to

iii
be significantly different from those of the whole vegetative
sample. The consequences of this species 1 ability to repro
duce vegetatively are discussed, and a brief clone-mapping
project is described.
The procedures used to obtain and score material, and to
obtain information about its background are described. The
amounts of material of different types from different sources
is summarised in Table 6.2. Problems involved in estimating
gene frequencies are discussed, and the derivation of the values
used to represent the different morph frequencies is outlined;
they are basically phenotypic frequency figures, gene frequency
calculations being used only where it was found to be necessary.
2) Observations on Population Samples.
Polymorphism in respect of white leaf marks was found to
be present in all except 15 out of 624 samples. The commonest
group of phenotypes are the 'simple V-marks', referred to as
*L*. The next commonest is the unmarked type, '0', present
in all except 72 out of 624 samples, with an overall frequency
among the plants scored of 17 per cent.
Study of the sample data reveals a deficiency of the
double marked phenotypes expected to be showed by V yV plants.
This is explained as the result of a degree of dominance of
V y in such combinations; the effect of such dominance is
allowed for in the frequency figures representing the frequency

iv
of 'L 1 marks, and of double-marks containing two members of
the 'L-series' of simple-V-produeing alleles.
The possibility of demonstrating interaction between the
frequencies of different morphs is discussed. There are
indications of lower frequencies of 'By f , »B f , and *F f marks
when the unmarked phenotype is common.
The possibilities for the main object of the work, dis
covering associations between morph frequencies and environ
mental factors are shown in Table 8.1, giving the sets of data
presentable for particular methods of analysis.
Data on 148 British samples, scored in the field by the
author, were treated by Multiple Regression Analysis (using
the KDF 9 Computer of the Oxford Computing Laboratory), to
test for association of morph frequencies with geographical
location, altitude, and soil pH. Significant increases in the
proportion of unmarked plants are shown with greater distance
north and higher altitude.
Frequency data for all the classes of morphs described
is shown in the form of maps, of the British Isles, Western
Europe, and the whole of the species 1 natural range. These
maps confirm the northwards increase in frequency of the
unmarked form found in Britain. Maps for the rare morphs
show various patterns, most of which seem to involve central
regions of higher frequency north of the Mediterranean
(France - Alps - Greece) with lower frequencies elsewhere.

Regression analysis of a set of seed samples from Spain
supports the conclusion from British vegetative samples of an
increase in unmarked frequency with higher altitude. Examina
tion of the information about the background of other samples
suggests higher unmarked frequencies in pastures than on waste
ground, meadows being intermediate.
British data suggest an association with wet, and partic
ularly with badly-drained sites, with trodden paths, and with
dense vegetation. There are patterns of response to water
regime elsewhere but (e.g. Polish data) they tend to suggest
the opposite association, of high unmarked frequency with dry
conditions.
3) Comparison with other species.
New observations are reported on some other related
species. Available information on marking in other species
of Xrifolium is reviewed, and it is pointed out that it is
scattered, difficult of access (much unpublished), and some
times ambiguous or contradictory.
Summary of this data indicates the presence of white
V-markings in nearly 30 species of Trifolium. and its absence
in at least as many more. fcarks are probably entirely absent
in subgenus Chronosemium and perhaps in part of subgenus
Trifolium. but seem to occur in most of the other subgenera
for which there is information. When marks are present, it

vi
appears that they are nearly always variable. Only three
species are definitely reported as always marked, and in
two of these there is variation between different types of
marking. This suggests that the factors producing or
preserving polymorphism in j}. re pens act also in other marked
species. The presence cf red leaf marks of various kinds is
reported in 21 species of Irifolium.
Also in the tribe Trif olieae . both red and white V-markings
are found in Parochetus communis Material grown by the author
showed great variability within each plant in leaf mark, but no
clear differences between plants. Red leaf marks, variable,
and in some cases approaching a V-shape, are also found in
Medicago .
Several lines of evidence indicate relationships between
the white markings, and the various red marking systems in
It is suggested that the white and red V-markings•
have a common evolutionary origin.
Some examples of leaf marking with analogous properties
in genera unrelated to T.. repens are also briefly reviewed.
In discussion some possible challenges to the validity
of the results claimed are discussed, and evidence is presented
suggesting that the reported genetic clines in unmarked
frequency are real. Selective factors affecting urjiiarked

vii
frequency are tentatively suggested to be temperature and
water regime. The problem of relating these to markings on
leaves is discussed, and also the possibility that the phenomena
of leaf marking are by-products of unknown processes, and are
of no intrinsic importance. It is suggested that the inter
actions between red and white markings support the hypothesis
that leaf markings themselves are of selective importance;
and some possibilities as to what form this selective importance
might take are mentioned.
Possibilities for further work indicated in the course
of the studies presented here are discussed. They include
studies on important problems of population dynamics, which
affect the design of techniques for sampling for leaf markings,
but in which also observations on leaf markings could be used
as means to ends of wider significance.
Ways in which the methods used in the present study
could be improved in a repeated study are suggested; however,
it is felt that the clines observed provide a starting point
for experimental work, and that this might be more rewarding
than further descriptive work.

viii
ACKNOWLEDGEMENTS
I should like to express my thanks to Professor C.D.
Darlington for the opportunity to work for three years as a
research student in the Botany School, Oxford, and for the
opportunity to finish this thesis while on his staff as
Departmental Demonstrator; also to Professor J.L. Harper
for the facilities available during a year on the staff of
the Agricultural Botany Department, University College of
North Wales, Bangor. Thanks are due to the Nature Conservancy
for the Post-Graduate Research Studentship which I held in
Oxford from 1960 to 1963.
I should like to thank my supervisor, Professor E.A.
Bevan, for his encouragement and stimulation. I should like
to thank Fr. k. Ellis Davies, and Iir. Norman Young, of the
Welsh Plant Breeding Station, for providing material, for much
correspondence and discussion, and for the opportunity to
include here data from their records. I should like to thank
Kr. Vincent Connolly for the opportunity to score the samples
he had grown at the Agricultural Institute, Oak Park, Carlow,
Eire, and for the Institute's hospitality during my visit.
Among other workers on Tr.i.fQ^iinq, I should particularly
like to thank Dr. Alice M. Evans and Professor J.L. Brewbaker
for much assistance in correspondence and for permission to
use their unpublished data appearing in Chapter IX. Thanks

are due to many other correspondents, particularly those
who provided seed samples in response to my requests.
I must thank also the Director of Oxford University
Computing Laboratory for the opportunity to use the EDF 9
Computer, and Dr. D.F. Mayers for guidance in doing so.
Finally I would like to thank Kr. Peter burner, Mrs. J. hoore,
!'!rs. J. Pitt and Miss Janet Bell for help in producing the
photographs and diagrams.

TABLE OF CONTENi'3
ABSTRACT i
ACKNOWLEDGEMENTS viii
iABLE 0? CONTENTS x
LIST 0? FIGURES xii
PART 1. INTRODUCTION
Chapter I. 1-16
Significance and Value of Morph Frequency Surveys
Chapter II. 17-33
The Species
Chapter III. 34 - 48
Leaf friarking Phenotypes and Genotypes :
Range of Variation, and Genetical Basis
PART 2. PRELIMINARY AND GENERAL STUDIES
Chapter IV. 49 - 94
Variation and Inheritance of Leaf Markings
Chapter V. 95-120
Principles of Population Sampling

XI
Page
PART 3. POPULATION SAMPLING
Chapter VI. 121-139
Materials and Methods
Chapter VII. HO - 151
Results I. Internal Comparisons of Samples
Chapter VIII. 152 - 219
Results II. Correlation with the Environment
PART 4. COMPAHATIVE STUDIES
Chapter IX. 220 - 259
Leaf Marking in Species Related to T,. repens
Chapter X. 260 - 267
Leaf Markings in Other Families
PAR? 5. GK3NERAL DISCUSSION 268 - 277
REFERENCES 278 - 295
APPENDICES 296 - 309

xii
LIST OF FIGURES
Figure
Photographs
IV(i) High simple V-mark with heavy smearing
IV(ii) Leaves from two 'marginal 1 marked plants
IV(iii) Red V-mark on a broken-with-yellow-tip white mark
IV (iv) Double mark, outer part bluish, inneryellowish with conspicuously smeared tip
IV(v) Mark with irregular discontinuous wings and conspicuous smearing of the tip
IV(vi) Filled-in i^ark
IV(vii) Double Mark of Low and Basal V's, the two marks appearing to cross over one another
61
64
72
75
75
84
90
V(iii)
V(iv)
V(v)
VII (ii)
No-Mark and Double-Mark Frequencies in Single Heads: Theory
M
II
tl
(a)
(b) and (c)
Distribution of Apparent Clones
Distribution of Apparent Clones
'0* and Simple 'LL f Frequencies in Samples of 90 or more
106
107
108
119
120
137
! 0' and Corrected *LL f Frequencies in Samplesof 90 or more 139
Frequencies of Unmarked Plants 141
Predicted and observed Frequencies of *YL'Phenotypes among all 'Y 1 Phenotypes 145

xiii
Figure
Scatter Diagrams - British Field-Scored Data
VIII(i) Unmarked Frequency - Northing 176
VIII(ii) Corrected 'LL' Frequency - Northing 177
VIII(iii) Basal toark Frequency - Northing 178
VHI(iv) Filled-In Kark Frequency - Northing 179
VIII(v) Unmarked Frequency - Easting 180
VIII(vi) Corrected 'LL 1 Frequency - Easting 181
VHI(vii) 'Broken-Yellow 1 Frequency - Easting 182
VIII(viii)Unmarked Frequency - Altitude 183
Vlll(ix) Corrected 'LL' Frequency - Altitude 184
Maps
VIII(x) British Isles : Unmarked Frequency 189
VHI(xi) British Isles : By Frequency 190
VHI(xii) British Isles : Corrected LL Frequency 191
VIII(xiii)Western Europe : Unmarked Frequency 192
VHI(xiv) Western Europe : By Frequency 193
VIII(xv) All Natural Range, Large Scale : UnmarkedFrequency 194
VIII(xvi) All Natural Range, Large Scale : By Frequency 195
VIII(xvii)All Range, Smaller Scale : By Frequency 196
VHI(xviii) All Range, Smaller Scale : B Frequency 196
VHI(xix) All Range, Smaller Scale : Ba Frequency 197
VIII(xx) All Range, Smaller ocale : F Frequency 197

xiv
Figure Page
VHI(xxi) All Range, Smaller Scale : H Frequency 198
VHI(xxii) All Range, Smaller Scale : Corrected LLFrequency > 98
VHI(xxiii) Spanish Samples : Unmarked Frequency - 201Altitude Scatter Diagram

P A ,i T I
INTRODUCTION

CHAPT3R I
SIGNIFICANCE AKD VALUE OF MQRPH-FREQUENCY SURVEYS
1. Methods of Studying Natural Selection.
It is believed that evolutionary change is brought about
by the selective effect of the environment on the organisms
living in it. Over very long periods, members of fossil
sequences show continued changes in almost all characters.
If, however, one desires to show evolution in action by con
temporary studies on living organisms, it seems necessary to
choose rather unusual situations of rapid evolutionary change.
Such changes can most easily be seen as the readjustment
which follows a change of environment and selective pressures,
or also following the introduction by mutation or gene flow
of a favourable mutation not previously present. Situations
of altered selection are on the whole rare in nature, and
those studied include very many artificial ones concerning
populations in more or less completely controlled laboratory
conditions. The natural cases are rare but well known;
for example, the spread of melanism in moths in industrially
polluted areas, affecting over eighty species in Britain
(Ford, 1964, p. 248), and the evolution of resistance to
myzomatosis by European and Australian rabbit populations,

following the introduction of virulent strains of myxoma
virus (Fenner, 1959). There are also cases of cyclical
selection which may contribute nothing directly to long
term evolutionary change; for example, seasonal fluctuations
in the frequencies of different chromosome arrangements in
Drosophila pseudoobscura (Dobzhansky, 1951, pp. 118-9);
irregular fluctuations in the frequency and selective value
of the medionigra gene in the Cothill population of Panaxia
dominula (Ford, 1964, pp. 113-7). Such examples must be
atypical when compared with the greater part of the selection
experienced by natural populations in the wild. Host selec
tion may be expected to be relatively steady, and most
populations may be expected to be close to equilibrium with
regard to characters thus selected. It is in many ways
easier to study cases of response to catastrophically altered
selection, but if steadier selection which has already pro
duced an approach to equilibrium is felt to be more typical of
what is actually happening in nature, a special interest
attaches to any investigation that may be possible of such
selection and its consequences.
One way in which such an investigation can be attempted
is by comparisons between populations of the same species
established in different environments, and each presumably
adapted to its own environment. Differences between the
genetic constitution of the different populations should

reflect differences in the selective experience to which
these populations have been and are being exposed. Such
an investigation can be begun, on the one hand, by observing
genetic variation, and attempting to relate it to environ
mental variation. This is the approach adopted here in
studying leaf marking in Trifolium repens. and by Daday (I954£,b;
1958) in his work on cyanogenesis in the same species. On
the other hand, one can choose an aspect of environmental
variation, and look for genetic differences in adaptation to
it. Examples of this approach, again in Trifolium repens.
are studies demonstrating adaptation to particular day-length
regimes (Oibson, 1957), or soil-types (Bradshaw and Snaydon,
1959).
By the first approach we choose an aspect of genetic
variation, and look for possible selective factors to explain
the pattern of variation. We aim to portray the variation
in selection which determines the pattern of genetic variation
affecting a particular facet of the genotype. To do this we
must try to compose a new and special picture of the environ
ment, in which some apparently conspicuous features may be
neglected, while other obscure ones may become important.
Further, we must try to distinguish between the few environ
mental features which actually cause the selection studied,
and those, perhaps many and perhaps more apparent, which are
only correlated, more or less closely, with the actual

selective agency. Vie may use the genetic make-up of the
populations in each environment and the difference between
those in different environments as a coded record of the
different selective pressures each population has experienced.
When we have observed that genetic variation is demonstrable,
we can next attempt to discover differences in the underlying
selection which is acting, and to understand the mechanism
of the code by which the organism displays the presence and
pattern of variations in this selection.
The second type of approach referred to above enables
one to choose an environmental factor which is easy, or
important, to study, and perhaps one whose extreme variation
is felt certain to provide results in the form of genetic
differences; the first approach involves choosing the type
of genetic factor, one which is easily accessible for study,
and perhaps one which is easy to describe. Discontinuous
variation may offer the opportunity to describe rather than
to measure, and may simplify all mathematical work by one
order of complexity. In both cases a species must be chosen;
requirements one can suggest for a successful study of this
kind are that the species chosen should be distributed in a
sufficiently numerous and variable range of environments,
that each local population should be sufficiently isolated
to have diverged from the others, and that sufficient
variation should be available in each population in the
character studied, so that one can feel confident that the

genetic situation expresses the selection acting, that a
different balance of selective forces could have achieved
different results.
2. Balanced Polymorphisms.
a. Suitability for Studies of Evolution.
Balanced polymorphisms are systems which meet these
requirements well; variation is discontinuous and cp.alita-
tive, and can generally be seen to be present, however the
frequencies may be modified, in all populations. Ford
(1940) has defined polymorphic situations as those in which
two or more forms of a species coexist in the same area at
frequencies too great to be explained by recurrent mutation.
Such a situation may be a state of transition towards fixa
tion of one form, or it may be an accidental expression of
characters too trivial to experience selection strong or
consistent enough to bring about fixation. If however it
is widespread and persistent it would seem extremely likely
that the variability is maintained by some mechanism such as
heterozygous advantage. 'This would make it very difficult
for any selective fluctuation to eliminate variation and fix
one homozygous form. Commonly such an equilibrium involves
at least two selective factors, the heterozygote being«
superior to one homozygote in one respect, to the other in
another. The frequency of the three types would vary
according to the relative importance of the two factors, and

if one of them has a predominant effect, one homozygote may
be very rare. However, fixation would only follow if one
selective factor vanished completely.
Such a polymorphic situation is characteristically sensi
tive and responsive to selection over a middle range of gene
frequency, but more and more resistant to greater pressures
which might produce fixation. It provides a system tfiich may
be very responsive to variations in the selective action of
the environment. It should also be remembered that it may
respond to other environmental variation as well as to
variations in the selective pressures which maintain its
stability.
In the investigation of a particular example of poly
morphism, the questions to which it is appropriate to seek
answers fall into two groups, though the content of the answers
may overlap. The first group concern the preservation of the
polymorphism against selective pressure towards fixation.
This aspect is of interest since strong selective pressures
may be seen in continuous action, yet producing no change.
The consequences on the rest of the gene pool of persistent
variation at one locus are also of importance. The second
group of questions involve the use of the polymorphic system
as a responsive but robust measure expressing peart of the
variations in selection actually experienced by populations
in different environments. This may or may not provide
access to the basic selective pressures protecting the

existence of the polymorphism, but is also of interest in
producing a picture, through the organisms 1 own eyes as it
were, of the variation and action of some of the selective
pressures affecting the population.
This work has been mainly concerned with an attempt to
map variations in the frequency of different forms in a poly
morphic system, in an attempt to provide answers to these
questions, particularly the second group.
b. Achievements of the Study of Polymorphism.
It is interesting to refer to some of the cases of poly
morphisms which have been studied already, particularly those
where the method of study or the sequence of discovery, or
the nature of the material, have some connection with those
in the work to be described below. More extensive general
reviews can be found in Huxley (1955), Ford (1964).
The classic example of the appropriateness of the attempt
to relate morph frequencies to environmental variables is
that of the sickle cell allele in man. The high frequency
of the anaemic homozygotes for this allele in certain areas
can be understood when it is realised that the heterozygotes,
who are not hampered by symptoms of anaemia, are in fact
highly favoured by resistance to the subtertian form of
malaria which is common in these areas (Allison, 1954).
The approach projected for the work described below
consists of comparing morph frequency and environmental

8
variables between a number of populations, searching for
correlations between the two, and an attempt to determine
which environmental variables are most closely related to
the environmental factors which actually act selectively,
and perhaps to identify the factors which have a selective
action discriminating between the genetic factors whose
variation was studied. Precisely this sequence has been
successfully followed for another character in the same
organism as that chosen for this work.
Certain genotypes confer on leaf tissue of Trifolium
repens the ability to release HCN when detached from the
plant. This requires the presence of a dominant allele
controlling the presence of the HCN-producing substrates,
and of a second allele controlling the presence of the enzyme
by which HCN production from them is catalysed (Corkill, 1942;
Atwood and Sullivan, 1943)* It can be shown that in this,
and in another species (Lotus corniculatus) with the same
property, certain predators - voles, rabbits, slugs, snails
- avoid the cyanogenic plants (Jones, 1962). Why then are
some plants not cyanogenic? Several papers by Daday (1954a,
b, 1958) showed that the frequency of non-cyanogenic forms
rose in the North-Bast of Europe, and at higher altitudes in
the Alps. This implied counter-selection, favouring the
non-cyanogenic types, by a factor acting particularly strongly
in these areas, and the obvious interpretation was that this
was some expression of winter temperature. Working from

this clue, it was possible for Daday (1962, 1965) "-'
to show that the growth of cyanogenic plants was retarded,
relative to that of non-cyanogenic plants, when exposed to
frost, and that this was the result of the release of HCN
in vivo and consequent metabolic inhibition. The release
of HCN was produced by activation of the enzyme by low
temperatures, which could also be demonstrated in vitro,
In this case selective forces acting against each pheno-
type have been identified, one - the effect of cold - as a
result of the indications provided by a geographical mapping
of the variations in gene frequency. The two known factors
together offer a logically sufficient explanation of the
known situation, except that the reason for the prevalence
(and therefore presumed stability) of polymorphism, rather
than uniformity at most individual sites, is not clear. In
some other systems the prevalence of polymorphism is explained
by demonstrable heterozygous advantage, though disruptive
selection or possibly gene flow could also contribute.
The predator-selection effect, in contrast to that of
cold, was first demonstrated by comparisons within populations
and by experiment. If there were grounds for predicting
variations in the intensity of selective predator pressure in
particular environments, it would be possible to make and
test predictions of gene frequencies above or below those
predicted on the basis of the local winter temperature regime.

10
o. Survey of Examples of Plant Polymorphism.
Examples of plant polymorphism apart from those involving
reproductive compatibility or major structural heterozygosityo< oA(juM%
are relatively few in number, «ftdt-less completely explained(c$. exxvwyta rt|ovtJ fcr ^ T^W-* £««ftf) <v~( l^uxiu-, / ( 1Sty
than that quoted abovej^. It seems worth while to survey and
compare the cases for which information could be discovered.
One may contrast two types of 'case history 1 . In the first,
observations of frequency distribution patterns were the
starting point, leading to some degree towards the identifi
cation of selective factors (as in the case of the cold effect
in the cyanogenesis system described above, and as hoped for
in the work to be described below). In the other type,were
selective factors/first demonstrated by within-population
comparisons, observational and experimental, and predictions
about natural distribution pattern were derived from these
before any comparison between natural populations was attempted.
The cases to be described will be arranged with clear cases
of the first type at the beginning, and clear cases of the
second type at the end.
In a second respect, the polymorphisms described below
fall into three groups. Firstly, chromosomal polymorphisms,
mostly involving supernumerary chromosomes. Secondly, poly
morphisms where there are only two viable pljenotypes, the
homozygous dominant and the heterozygote, the homozygous
recessive being lethal. In both of these types one of the

11
selective factors necessary to explain the balance of the
polymorphism would be easily recognisable under any conditions,
the factor being lethality or sublethality, substantially
immune to adjustment by differences in environment. The
third class includes cases where the more easily distinguished
(recessive) homozygote is viable and probably has a selective
advantage under some conditions, at least when compared with
the other homozygote.
In Nicandra physalioides the selective pressures acting
on a polymorphism based on the presence of either one or two
isochromosomes, and controlling seed dormancy, v/ere identified
because the dormant form was absent in seedlings emerging in
the year of planting new seed, but frequent in a population
which had reappeared from seed in the soil after several
years' absence (Darlington and Janaki-Ammal, 1945). An
increase with increased altitude of the frequency of glaucous
forms in three species of Eucalyptus was attributed by Barber
(1955) to differences in frost activity. In Pisum arvense.
morph frequencies for thin or thick waxy layers on the leaves
are correlated with variation in humidity, as for instance
between the British Isles and Central Europe. The frequency
of thick wax layers was shown to rise over four generations
of reproduction in a dry environment (Scheibe, 1955).
In other cases, geographical patterns which can be
identified as those of some particular environmental factor
are known, although one cannot come so close to identifying

12
an actual selective agent. In Dactylis glomerata ssp
.ludaica the frequency of heterozygotes for albino recessives,
unexpectedly high in all populations, was found to be higher
on terra rossa than on rendzina soils (Apirion and Zohary,
1961), Two patterns of distribution of supernumerary
chromosomes should also be mentioned. Supernumeraries are
more frequent in populations of Festuca pratensis on clay
than on non-clay soils (Bosemark, 1956), and in Centaurea
scabiosa they appear to be less common in oceanic climates
and more so in continental climates (Frost, 1958). A cline
in the frequency of red leaf-flecks has been described in
Arum maculatum. flecked forms being commoner in the south
(Prime, 1955b). In Atropa belladonna, homozygous recessives
with yellow-green flowers are commoner as one moves eastward
in Britain; they are less hardy, and are restricted to
sheltered sites (Buraett, unpublished, quoted in Huxley, 1955).
Geographical heterogeneity in morph frequencies has been
recorded in some other cases, suggesting heterogeneity in
selection, though without any pattern of environmental cor
relation being identified. Fruiting head structure in
Aegilops epeltoides was polymorphic, with widely varying
frequencies of two alleles at the locus concerned, in nearly
all the populations studied in Israel and Turkey (Zohary and
Imber, 1963). Variation in the frequency of a hairy recessive
was widespread in Digitalis purpurea (Saunders, 1918). Dis
tinct heterogeneity was found in supernumerary chromosome

13
frequency between a small number of populations of Lilium
call03urn (Kimura and Kayano, 1961).
In other cases there have been discovered appreciable
frequencies of heterozygotes for lethals, or frequencies of
heterozygotes higher than could be predicted from overall
gene frequencies, or heterozygotes occurring in the wild for
alleles at loci controlling major characters which seem
unlikely to be of trivial selective importance. Such evi
dence suggests that further investigation would demonstrate
a balanced polymorphic system. Examples include high
frequencies of carriers of albino recessives in Dactylis
glomerata ssp woronowii (Curran, 1961), of albino and other1937,
lethal recessivee in Trifolium pratense (R.D. Williams,/1939);
high frequencies of heterozygotes foi* fruit colour, for
albino recessives, and for one particular S-allele in Prunus
avium (W. Williams and Brown, 1956); and the occurrence of
heterozygotes for the distribution of heterochromatic
chromosome segments in Trillium and Paris (Darlington and
Shaw, 1959), in Fritillaria. Tulbaghia. Oestrum and Hvacinthus
(Dyer, 1963) and for different nucleolar chromosomes in
Allium paniculatum (Ved Brat, 1965).
The second type of case history of discovery is well
exemplified by the work on the distribution of waxy bloom on
the stems of populations of Ricinus oommunia naturalised in
Peru. It was observed that plants carrying the dominant

14
allele producing wax failed to fruit under the foggy con
ditions common at coast level, while the wax-less recessive
homozygote fruited freely. Subsequently it was shown that
there was a gene-frequency dine between all-waxy populations
at high altitudes exposed to bright light, and all-wax-less
populations at sea level (Harland, 1947). The case of
anthocyanin pigment variation in Chloris gayana (Bogdan, 1963)
could have been mentioned above, as an example of observation
of geographical pattern followed by experimental demonstration
of differences in fitness. However it does not seem to be
clearly established that the observed variation in nature is
controlled by the same genetic system as that studied experi
mentally. The experiments concerned a rare phenotype com
pletely lacking anthocyanin, determined by recessive homo-
zygosity at two duplicate loci; it was shown that the double
recessive phenotype had reduced growth rate and viability,
but increased resistance to drought and Helminthosporium
attack. These selective factors may also discriminate between
the more or less intensely pigmented forms whose quantitative
variation was observed in collections from the wild. Further
study might show that the recessives do have appreciable
frequencies in wild populations. If either of these possi
bilities turns out to be true and the experimental observations
are shown to be relevant to natural situations in the field,
then this would be the first case, after cyanogenesis in
Trifolium repens. where different and opposing environment-

15
dependent selective factors have been identified in a plant polymorphism.
3. The Example Chosen.
The work presented below concerns the polymorphism for the presence of various forms, or the absence, of white leaf markings in Trifolium repens, white clover.
This species seems suitable for this kind of work since it is an outbreeder, is known to be variable in many respects, and is widespread. (These points and those which follow will be expanded and documented in following chapters.) It is also the species in which the two-locus polymorphism for cyanogenesis described above has been so successfully investi gated. Because of its agricultural importance a considerable amount of published work is available to answer many of the questions one would ask as a background to this work.
The character chosen is one which is expressed by the plant in the vegetative condition. Coexistence of different leaf-mark phenotypes in the same population has already been reported, and two studies describing a simple mechanism of inheritance of this character have been published.
The main difficulties involve the expression of the character and the diagnosis of the different phenotypes, which is not as simple as the previous work would suggest, and the abundance of deliberate sowings of cultivated seed, which requires care in the choice of populations sampled.

16
Other complications are associated with the perennial and
vegetatively spreading habit of the species, rendering
individual genotypes potentially infinite in age and size.
Selection may indeed be acting largely or exclusively in
some communities in the vegetative phase, as the establish
ment of new genotypes as seedlings in an undisturbed closed
grassland community may be very rare.
The principal concern of this work has been the descrip
tion and comparison of the frequencies of different mark
phenotypes in different natural populations, and the attempt
to relate any variation in frequencies to variation in
environment.
This method is particularly appropriate for investigating
this situation since no hypothesis explaining the selective
values of presence and absence of marking is readily avail
able to the intuition, and one alternative is to look for a
clue from the pattern of distribution of the different types.

17
CHAPTER II
THE SPECIES
1. Growth ?orm and Reproduction.
The primary shoot of a seedling of Trifolium repena is
erect, but its growth is limited, and after the earliest seed
ling stages a plant of this species grows in the form of pros
trate runners or stolons, from which leaves on erect petioles
arise at regularly spaced nodes. Many of the nodes develop
adventitious roots, especially when in contact with the soil.
At each node a vegetative branch or an inflorescence may arise,
any development from the axil normally becoming visible soon
after the leaf at that node is fully developed. Once rooted,
each stolon is more or less self-sufficient; older parts of
the stems commonly die off, leaving the runners to grow and
branch more or less indefinitely. In some larger-growing
cultivated strains there is a drop in vigour and yield once
contact with the deeper primary root has been lost (westbrooks
and Tesar, 1955), and then the survival of isolated runners inoJUo
competition is limited (cf. Carnahan, 196Q). The achievement
of flowering may further limit survival (Oibson, 1957), and
these forms are used as annuals or biennials. For them,
the 'persistence 1 the breeder considers consists of per
sistence of contact between the stolons and the primary root
system (Crowder and Craigmiles, 1960). The British wild

18
form, on the other hand, is truly perennial, and perhaps
potentially immortal, Harberd (1961) has deduced clonal
ages of the order of centuries in Festuca rubra from the
distance apart at which apparently identical phenotypes
were recovered. In £. repens he found smaller total extent
of clones, which he attributed to greater sensitivity to
local variations in the environment, but he suggests
(Harberd, 1963) that there is no reason to assume any shorter
lifetime for clones in T. repens than in F. rubra.
Flowering heads are perhaps most abundant in May and
June, but can also be found in plenty in July and August.
This suggests that the species requires Long-Day conditions
for inflorescence initiation and development, and this has
been confirmed experimentally (Roberts and Struckmeyer, 1938;
Hollowell, 1952; McCloud and Cole, 1951 - quoted by Cribson,
1957; Laude ejt aj... 1958; Haggar, 1961). Flowering may
however stop before the period of long days is over (Haggar,
1961), and in my own experience, all mature plants in the
greenhouse have stopped flowering by August (a month or so
earlier than in the field) while summer sown seedlings may
flower for the first time in September. This suggests that
following flowering there is a temporary loss of the ability
to respond to what would otherwise be an adequate flowering
stimulus. This fits in with the finding that a period of
cold or short days may be required before the return of the
readiness to respond - again for a limited length of time -

19
to long days (Thomas, 1961). One clone has been found in
Arizona which had only a short day requirement (Beatty and
Gardner, 1961). Cold conditions (for instance at night)
may also facilitate - or even replace - the Long Day require
ment (Roberts and Struckmeyer, 1938; Laude e_t aJL. 1958;
Britten, 1961; Beatty and Gardner, 1961). There is variation
in the response of individual clones (Britten, 1960; Haggar,
1961), and variation between populations which appears to
represent adaptation to local conditions, longer day-lengths
being required by forms adapted to high latitudes (Gibson,
1957). Whyte (1960) suggests that the extra vegetative
vigour of non-flowering plants may make strains adapted to the
photoperiodic regime of high latitudes attractive for culti
vation at low latitudes.
There is no obvious mechanism for seed dispersal, though
Erith (1925) considers the size of the seeds small enough to
be such an adaptation. They are usually retained in the pod
when the head falls, and if the head then becomes damp, a
cluster of germinating seedlings can often be seen emerging
from it. Suckling (1952) showed that some of the seed can
pass unharmed through the intestinal tract of sheep (which
certainly do not avoid eating the heads, and may favour them),
and a consequence may be deposition of seed in a new site.
Man-made open or new habitats such as embankments anl roadside
verges which are apparently suitable for the species often
have only scattered, though thriving, single patches. This

20
suggests that at least in the absence of free access for
larger grazing animals there is a bottleneck at the stage of
dispersal into new habitats.
The seeds which can survive passage through a sheep are
apparently the impermeable, dormant 'hard 1 seeds which con
stitute over half of many wild collections. Nearly all the
seed in some seed collections of wild origin, if threshed by
hand, require scarification by abrasion or by treatment with
concentrated sulphuric acid before they will germinate. Samples
commercially available have been somewhat scarified by friction
during mechanical threshing, and bred strains will probably
have been selected to some extent (if only unconsciously) for
full and early germination. They may therefore contain a
lower proportion of hard seed.
Dispersal in space can occur by vegetative means, when
there is a continuous sequence of favourable microenvironments
available, and this may be as important as seed as a space-
dispersal mechanism. The main function of seed in the life
cycle may rather be the achievement of persistence in a local
ity, or 'dispersal in time 1 . Disturbance of soil, especially
when combined with the provision of lime and other fertilisers,
can be followed by the appearance of a strong stand of 'volun
teer' white clover, even if growing plants of clover have been
absent from the site for some years (Hollowell, 1952). In
some grassland the clover population may have to migrate
continually, any one patch being dominated alternately by grass

21
and clover (cf. Lieth, 1960).
The growth habit of the species protects the growing
points from damage by grazing, and the rapid production of
new leaves also adapts the plant to tolerate frequent loss of
leaves by grazing or mowing. Large and irregular fluctuations
in sward height are a feature of vegetation subjected to preda-
tion or cropping of this kind, and the remarkable plasticity
of the process of petiole elongation (Kerner, 1895) serves as
an adaptation to bring each leaf into a favourable position for
light interception whatever the conditions. This species is
considered an important component of established herbage com
munities exploited agriculturally (meadows and pastures), and
its seed is included in seed mixtures intended to produce
similar vegetation. Some of the cultivated varieties, especi
ally the larger growing ones, are lacking in persistence, but
because of their vigorous early growth they are favoured for
use in short-term leys and for undersowing as a catch-crop in
stubble. They are also included for the sake of their con
tribution in early years in seed mixtures intended for inter
mediate or long-term leys. The cultivated strains which
first interested farmers all belonged more or less to this
relatively short-lived and luxuriant type. More recently has
been appreciated the value of more persistent plants closer to
the wild type in sowings designed to produce long leys or new
permanent pasture. Strains of this type also have been
produced by the plant breeders (W. Williams, 1945).

22
2. Habitat, Natural Distribution, and Introduction by Man.
The species is found in semi-natural communities exploited
agriculturally - pastures and meadows - and on similar natural
short grassland communities, such as cliff-tops, dunes, and
warrens. In Britain, it is rarely abundant above 1000 ft.,
though it is sometimes found up to 3000 ft. This limit is
probably due to the generally low pH, and low base and phos
phate content of heavily leached highland soils, rather than
to any intrinsic effect of altitude (Snaydon and Bradshaw,
1962; Holding and King, 1963).
The natural distribution of the species extends through
out Europe, parts of North Africa, and much of Western Asia,
as far east as Lake Baikal (according to Komarov, 1945, Quoted by
Daday, 1958), and as far south as upland areas in Palestine,
Iraq, Iran, west Pakistan and India.
Deliberate introduction as an agricultural plant, or
other more accidental introductions by man have now led to
its establishment in natural communities throughout the North
and South temperate Zones: ^siatic USSR, China, Japan, North
America, Australia, South Africa, and most recently South
America, where according to Daday (1958) it is still quite
rapidly being distributed into new areas. It also grows
will now in some tropical areas, especially at high altitudes;
Hawaii (Britten, 1961), Costa Rica, Gruatemala and Venezuela
(Daday, 1959), and Colombia (Daday, 1958; Crowder, 1960);

23
and is in cultivation in Nigeria and Kenya (in litt.,
Bogdan, 1961), though no naturalised populations are (yet)
reported
The map of the species' distribution published by Daday
(1958) shows that he regards its presence in Iceland as due
to introduction. The samples described below however include
two described by the sender as of native Icelandic origin.
Daday regards its presence in Morocco and Algeria as natural,
as also in the Canaries, where he notes that it has been
recorded in undisturbed native vegetation. A sample from the
Azores is included below, from material 'considered wild 1 ,
though the collector suggests it may be descended at least
in part from early introduction both from North America and
Europe. Pickering (1879), quoted by Ware (1925), says that
the white clover now found in the Azores and in Madeira was
carried there by European colonists.
According to Gramble (1935) the species has run wild from
introductions in high altitude pastures in the Nilgiri Hills
in South India. Two samples from this area are recorded
below. The presence of the species in the Nilgiri Hills was
referred to by Hooker (1879). He also described as probably
introduced plants of £. repens occurring at high altitudes in
Ceylon. The samples recorded below also include one from
Ethiopia which might represent a previously unrecorded exten
sion of its natural range.

24
Carrier and Bort (1916) (cf. also Ahlgren and Sprague
(1940)) quote several interesting but inaccessible references
about the early spread of this species in Eastern North
America. Among them, Smyth (1887) quotes Benjamin Franklin
writing of the presence of this species in the area in 1749*
Christopher Gist, travelling in 1750, found the species in
abundance as far inland as southern Ohio and Kentucky.
Strickland (1801) describes his observations of the rapid
spread cf the species during the 1790's. Kalm (1749) des
cribes the abundance of the species in Canada, and Carrier
and Bort suggest that it was distributed by the French mission
aries to the Indians in many of the areas they penetrated,
including Ohio, and rnerhaps south to the Mississippi valley.
Seed was taken to Japan in 1846 (Daday, 1958), to
Western North America rather later, e.g. Washington State
1850-1860, New Zealand about 1880 (in litt., Daly 1961), and
Alaska 1920 (Daday, 1958). Polunin (1959) cites Lange (1887)
referring to its presence in West Greenland as an introduction
Established in waste and pastured areas. It was found in
Uruguay from 1915 onwards (Cortobarrfa, in litt. 1961), and
reached Brazil more recently (Daday, 1958), and is also
present now on Kerguelen Island in the South Indian Ocean (in
litt., Bost, 1961). Many of these reports (Western North
America,(Daday, 1958), Colombia (Crowder, 1960), Kerguelen)
indicate that, as might be expected, the species is first
found after introduction in areas disturbed by man, for example

near buildings and roads.
3. Oenetic Variability and the Mechanism of Outbreeding.
The great variability of this species has been demonstrated
in a number of reports (Ware, 1925; R.D. Williams, 1931b,
Ahlgren and Sprague, 1940; Dessureaux, 1949; Wolter, 1958;
Britten, 1960, 1961; Dunn et al.. 1962; Goombe, 1962; Beinhart
eJL al., 1963) and is more briefly referred to elsewhere (Haller,
1768 (quoted by Ware, 1925); De Vries, 1907; dtapledon, 1924;
V. Williams, 1945), and is accepted as one of the notable
features of the species. The selection of improved strains
has exploited this variation, and may appear to have added to
it, if plants from introductions of selected strains, or their
descendants, are included in what are supposed to be wild
samples. However, the diversity in the wild species is well
demonstrated by further studies which are concerned with
variation between populations, interpreted as ecotypic adapta
tion (Oibson, 1957; Snaydon and Bradshaw, 1962; King, 1963).
Indications of considerable intra-population variation also
occur in several of these works, and the work of Harberd (1963)
suggests that this variability may provide for adaptation to
environmental differences on the most detailed local scale,
between adjacent plants. This appears to be a greater degree
of local adaptation than in the other species he studied; in
other species, each clone had spread out more or less equally
in all directions, but in clover the distributions of each

26
clone suggested that spread in some directions was much
harder than in others (interpreted as respectively up and
down, and at right-angles to, ecological gradients).
Qualitative variation, dividing the plants into discrete
classes, is also present with regard to cyanogenesis (Mirande,
1912; R.D. Williams, 1939; Corkill, 1942; Atwood and
Sullivan, 1943), whose distribution has been studied by Daday,
(1954a, b, 1955, 1958, 1962, and 1965); with regard to
white and red leaf marking, which wiH be discussed below;
with regard to flower colour, though most of this variationBfcr3 , mlj-Crnti^VS,
is restricted to a few populations (Coombe, 1961;^and cf.
Brewbaker, 1962); and in the presence of particular members
of the _S-allele series controlling the incompatibility system.
This incompatibility system is of the type also described
^ Oenothera. Nicotiana, and Prunus; the pollen expresses the
one J-allele in its own haploid genotype and is inhibited on
any style containing that allele. The prevalent variability
within populations, and much of that which made possible
differentiation in adaptation between different populations,
can be attributed to the presence of this system. The high
level of heterozygosity to which the species is adjusted is
indicated by a reduction of vigour of 30 per cent after one
generation of enforced selfing (Atwood, 1938, quoted by
Carnahan, 1960).

27
Unfertilised florets remain barren (Darwin, 1891;
Ware, 1925). The incompatibility mechanism reduces seed
set on artificial selfing considerably in comparison with
seed set in crosses made by the same technique with foreign
pollen. This reduction is reported as from 732 seed in
743 florets in outcrosses to 6 seed in 500 selfed florets,
a factor of 82 (Ware, 1925); as reduction by a factor of
20 or more (R.i). Williams, 1931b); or even by a factor of
about 350 (Zwingli, 1956, using Swiss wild material). The
achievement of even these relatively low yields of selfed
seed requires the physical event of pollen transfer; in
the wild any pollinating insect would be very likely to
carry some foreign pollen, and after pollen-tube competition
the number of seeds derived from selfing might be lower still.
Under artificial selfing, Williams found that only 26?<> of
his plants showed any seed set by 'pseudo-self-compatibility 1 ,
though Zwingli found it in 137 out of 153. This variation
between plants in the ability to set seed on selfing may be
heritable (Atwood, 1942a). There is also a much smaller
proportion of plants which are fully self-compatible as a_P
result of the presence of a 'fertility* allele, S , in the
S series (Atwood, 1942b) and these only produce 19/* outcrossed
seed when exposed to bee pollination (Atwood, 1945). The
frequency of these self-fertile plants is low; not more than
1 or 2# (R.D. Williams, 1931b), 1 in 615 (Atwood, 1941), or
5 in 153 (Zwingli, 1956),

28
Crosses between unrelated plants are nearly always
compatible; 1 incompatible out of 155 crosses (R.D. Williams,
1931 a), 5 and 4 respectively incompatible out of two sets
of 136 crosses each among plants from one wild population
(Zwingli, 1956). This suggests the presence of large numbers
of S-alleles, Detailed studies by Atwood (1942c, 1944) prove
that nearly all the alleles sampled are different, at least
39 different alleles being present in one sample. Zwingli's
method does not sample the alleles so thoroughly, but proves
there must be at least fourteen different alleles in both his
sets of 17 wild plants. In At wood f s work, the plants sampled
were all crossed vith an S.-homozygous plant produced by self ing,
One plant was taken from each progeny, and all these chosen
progeny plants were crossed together. They all had one
allele in common, from the homozygous parent, and therefore
any identity between two of the sampled alleles would be
revealed by incompatibility in one of the crosses. Only
one allele was represented in this testing scheme from each
parent plant, removing the possibility of bias in subsequent
calculations resulting from the presumed absence of homo-
zygotes in the sample. It is possible to calculate from
Atwood*s results best Estimates and probability limits for
the number of different alleles in the whole population from
which the sample was drawn. This has been done, by the
method described by Bateman (1947), and the results are set
out below. These results point even more definitely than

29
the observations reported above to the conclusion that this
species has a highly efficient outbreeding system, which can
prevent selfing, and a proportion of crosses between relatives,
at the cost of quite infrequent infertility between unrelated
plants. The calculations suggest that an estimate of the
order of 100 different S-alleles is not at all unreasonable.
Table II.1. Estimate of the Number of S-alleles in I. repens.
Source of data: Origin of Material.
Atwood, 1942c
Various origins
Various origins
" stock alleles added
Atwood, 1944
Isolated population, between 1000 and 10,000 plants
100 acres, not isolated
Numbers ofalleles
ProvedSampled to be
differ ent
Calculated numbers of alleles in 'whole population 1Minimum Best Kali-
mum
26
34
41
25
27
34
59
38
55
325 13000
78 194
114 285
49
49
36
39
41
64
65
118
110
245
(Probability =0-95 that true value lies within these limits)
4. Cytology and Genetics.
Most species of Trifolium have a chromosome number 2n=14
or 16. (Bleier, 1925; Karpechenko, 1925; uexelsen, 1928).
However, as first reported by Wexelsen (1928), Trifolium repens
is an exception with 2n = 32 (this report also claims that the

large non-persistent Ladino varieties have larger chromosomes
than other varieties). Although this chromosome number
strongly suggests that the species is tetraploid, meiosis is
regular and diploid-like with 16 bivalents (Atwood and Hill,
1940). Genetic evidence confirms this with aoout a dozen
cases of disomic inheritance. A different type of evidence
for a double structure of the £. repens genome derives from
the discoveries of a pair of duplicate loci with complementary
dominant alleles controlling a mottling of the leaves which
resembles virus symptoms (Atwood and Kreitlow, 1946), of
another pair of loci, dominant alleles at either of which
suppress cyanidin pigmentation of the corolla, and possibly
of a third pair controlling a condition of rudimentary corolla
(Brewbaker, 1962). Recently \i.3. Davies (1965) has observed
segregations for a sterile unifoliate form which can, in
contrast to these previous findings, most easily be explained
as being produced by tetrasomic inheritance. i'his suggests
that for at least one of the sets of homologous and homo-
eologous chromosomes divergence between the two presumed
ancestors was slight, and not great enough to prevent pairing
between the genomes. Small chromosome size may account for
the absence of tetravalents or other distinctive features in
ineiosis. i'he conclusion would seem to be that this species
is a segmental allopolyploid, close to the ideal allotetraploid
but showing the properties of an autotetraploid in a few respects

31
This implies that it originated by hybridisation, associated
with a doubling of chromosome number, between two diploids,
probably well separated as different species, but retaining
some similarity in the structural organisation of their
hereditary material.
Although t^e inheritance and expression of some characters
in this species has been intensively studied, only 11 loci are
definitely known. They were listed by 3rewbaker (1962) as
follows: the 3. locus controlling incompatibility; the Ac and
Li loci controlling cyanogenesis; V and .1 loci controlling
white and red leaf markings;. the pairs of duplicate loci(r^CMKvO
controlling virus-like mottling and/cyanidin corolla pigmenta-(o>«&. 66Yt^ WN St~'£Lj JS jwwvj ~v> cQjwuit+,3: (Tu^(i t <4t&))
tion/; a 'blush 1 locus controlling a fainter corolla pigment;
and a locus controlling a rare non-clasping attitude of the
bracts (? stipules). $o linkage has been demonstrated between
any of these loci (Garnahan et al.. 1955; Brewbaker, 1962;
Ghakravarty, 1963b).
5. Hybridisation, Interspecific Relationships, and Phylogeny.
Hybridisation is generally difficult in this genus, and
for Trifolium repens has only been reported with three other
species: with J?. nigrescens (Trimble and Hovin, 1960), the
F, being fertile if the cross was carried out with colchicine-
treated 4n parents (Brewbaker and Keim, 1953); with £. uniflorum
(Pandey, 1957; Evans, 1962a), and according to Starzycki (1959,

32
1961) with £. pratense. a surprising cross to achieve
between what are regarded as different subgenera, followed
by genetically and cytologically remarkable segregations in
later generations. Some degree of embryo development also
occurred in crosses with £. hvbridum. T. alexandrinum.
T. arvense. and £. subterraneum (Evans, 196?). The last
three species are generally classified by taxonomists in
positions remote from T,. repens; the hybridisation criterion
of affinity shows few parallels with judgments based on
morphology.
T. nlgrescens is a diploid, 2n = 16. £he fertile hybrid
from colchicine-treated T. repens (8x) and T. nigrescene (4x)
is therefore an allohexaploid, 6x = 48, whose constitution
could be represented R.R.R^RpM. Studies of the genetics of
these hybrids (Brewbaker and Keim, 1953; Brewbaker, 1962)
revealed tetrasomic inheritance for the loci controlling
incompatibility (^-locus), white leaf-marking (Y-locus), red
leaf-flecking (R-locus), and possibly also for the determinant
of the property found in T. repens of rooting at the nodes of
the creeping stems, which appeared to be recessive in the
hybrid, but reappeared in a small proportion of the Pg. The
evidence suggests a greater degree of pairing, and presumably
of homology, between the genome of £. nigrescens and one of
the genomes of the allotetraploid ^. repens than between the
two T. repens genomes themselves. It also suggests that the

33
loci showing tetrasomic inheritance in these families are
derived from that one of the supposed diploid ancestors of
T. repens which is relatively closely related to 21 nigrescens
Morphologically, the best candidate as a close relative
and perhaps ancestor of j?. repens is ^. occidentale. It is
diploid (2n = 16), self-fertile, and practically uniform
(Coombe, 1961). These peculiarities require that it should
be set apart from T. repens. but the close morphological
resemblance between the two species, and the apparent relative
scarcity of _£. occidentale. probably explain why it had not
attracted notice earlier.
1?. occidentale has so far only been recorder* in the
Channel"Isles, the western-most part of Cornwall, and the
Scilly Isles (Coombe, 1961), and in north-west France, on the
coasts of western Brittany and the Cotentin peninsula (Ge"hu,
1963). ;£ nigrescens is found around the Mediterranean
(Taubert, 1894), but not in Britain. It is not difficult to
imagine that the origin of £. repens could have been from a
species like T. nigrescens and one very like T. occidentale.
the incompatibility system (and the V-locus controlling white
leaf marks) being inherited from the former, and the node-
rooting habit and a number of other morphological features
from the latter.

34
CHAPTER III
LEAF MARKING- PHENOTYP33 AKD OENOTYPES
C? VAitUJJIQN, AKi) GkduSJ?ICAL
1 . Heports of the Presence and Occasional Absence of Leaf- Markings .
In the Flora of the British Isles (Olapham, Tutin and Warburg, 1962) we find italicised as a distinguishing character °f i- re pens 'Leaflets ... usually with a whitish angled band towards the base.' The observations recorded below confirm this description.
The qualification that the mark is only 'usually 1 present is supported by many Dublished references, as well as by the results newly presented here; in nearly all samples there is a minority of completely unmarked plants. The possession of the mark is in fact used as a key character in the work quoted; most other floras give it much less prominence and many do not mention it at all. In fact, the possibility of confusion would be somewhat less than might appear, since unmarked plants would often have closely similar neighbours, recognisable as the same species, but marked; the results presented below show that even a majority of unmarked plants is very rare. The species with which T. re pens could most easily be confused are those sharing its growth-form, with prostrate stems rooting at the nodes. Of these, the recently distinguished and local T. occidentals is always unmarked, and T. fragiferum never has

more than a faint yellowish-green mark (see below), and is
often unmarked, and has often in fact been described as
uniformly unmarked.
A number of quite early works as well as some contemporary
floras and monographs mention or illustrate markings of the
kind we are concerned with. Many of these references make
neither the shape, nor the colour, nor the position of the
marks clear, and most do not refer to their variability. The
result is a degree of confusion with red marks, which will
also be described here. The marks we are principally con
cerned with are whitish, placed in the centre of the leaflet, \
and crescent- or inverted V-shaped. They are sometimes absent,
but marked plants are generally in the majority. In contrast,
the commonest type of red markings consist of scattered flecks
of irregular shape, only slightly more common in the region
of the midrib, and rarely present at all, and certainly not
conspicuously so, in a majority of any population.
Sowerby's English Botany (1794) contains no mention of the
markings in the text, though the presence in 1?. pratense.and
the variability of similar markings in T. glomeratum are
mentioned. However, an illustration of T. repens shows an
exaggeratedly clear mark.
Oray (1821) first mentions the red marks and the variable
presence (in this species) of the wh&e marks, saying 'Leaves
often spotted with brown and white 1 , but makes no reference to
the differences in shape, position, and frequency between the

36
two kinds of marks.
Sir J.3. Smith (1829) is more explicit about the white
marks: 'Leaflets ... mostly with pale, curved, transverse
stripe 1 . This lacks only an indication of the position of
the mark, and, in common with all except recent specialised
genetical references, any mention of the variability between
different types of marked phenotype. He also indicates that
the frequency of the white stripe is greater than that of the
red flecks: 'mostly* as against 'sometimes 1 . Two more early
references worth mentioning are those of Lowe (1868) 'the
leaflets are mostly pale- or dark-spotted 1 , and a rather
puzzling remark by Kirk (1899) 'leaflet ... often with a dark
spot'.
Reichenbach (1903) illustrates both marked and unmarked
plants, but without referring to marks in the text. De Vries
(1907) refers to the abundance in clovers of 'elementary species
which can be discerned by criteria including the presence or
absence of whitish spots on the leaflets.
2. Terms used to refer to the White V-shaped markings on Leaflets.
The fullest description of these markings would be
'whitish inverted-V leaflet markings controlled by the V-locus'.
Very many different phrases have been used, different authors
stressing different aspects in the name they choose. There
is no clear standard name, though the terms V-locus and V-
alleles seem to be accepted, as arbitrary labels rather than

37
as descriptive names. White V-markings (Stanford et al..
1960) or leaflet V-markings would seem the best short descrip
tive phrases, or simply V-markings or V-marks (Carnahan et al.,
1955; Stanford et al.. 1960), although some important publica
tions have used the typographically strange-looking 'V-leaf
markings 1 (Brewbaker, 1955; Brewbaker and Carnahan, 1956;W.E.
Zwingli, 1956;/ Davies, 1963). Elsewhere have appeared simply
'leaf markings'(Dolan, 1962), which is confusing, since not
intended to cover red flecking; 'patterned leaf markings'
(Brown, 1947), 'light coloured V marking' (Brigham and Wilsie,
1955)t 'light leaf markings' (Coombe, 1961) and 'genetical leaf
markings' (Harberd, 1963). Another unusual description is the
'water-mark' (Hollowell, 1952). The description of the shape
as a 'V seems firmly established in genetical literature,
though descriptions like crescent-shaped or horseshoe-shaped
(Bentham and Hooker, 1924) appear especially in earlier
taxonomic works. If the standard position of a leaflet is
thought of as stalk downward, the V ir strictly speaking
inverted, and Hossain (1961) actually prints an inverted V,
referring to *A -shaped spots'. Especially perhaps in the
smaller growing wild forms, the rrerk ir in fact often curved
or even reentrant at the tip, and these would be better des
cribed as inverted U- or W-marks. Other rrarks are restricted
to a small triangle, the 'V-point f , or to a pair of irregular
spots either side of the midrib, and would not at once be

38
associated with a description of V-marks.
I shall refer simply to leaf markings, or to white leaf-
markings, when it is necessary to distinguish them from 'red*
markings (also described as brown, black, or purple), ifaich
differ in shape, position and physical basis. A more correct
epithet, as used in the Flora and quoted above, would be
'whitirh 1 , since the colour is rarely if ever white, except
by contrast with the darker green background. Compared to
a norm of a pale green colour in the mark, particular marks
can be described, relatively, as chalky-white, yellowish,
silvery-rretallic, or bluish.
3. V<hite Leaf Markings: Structural Basis.
Kajanus (1912) concluded that the similar V-mark in
j?. pr a tense results from a reduced growth rate of the palisade
cells relative to the epidermis, and that because the palisade
tissue is looser than normal, the cells are exposed to stronger
light and their chlorophyll is bleached; this would explain
his finding that there is either less or paler chlorophyll in
the tissue in the marked area. Hector (1936) suggested that
there is a reduction in the number of chloroplasts in marked
parts of leaflets in Trifolium.
Carnahan et al. (1955) studied the structure of the marked
tissue and show a picture of a transverse section in the region
of the mark. They found 'that the palisade cells in the leaf
V-mark area are less elongated, smaller, more irregularly

39
shaped and that there are more intercellular spaces between
them than in the mesophyll of no-mark leaves'. other leaf
tissues appear to be normal.
Two main factors producing the paleness of the mark seem
to be clear, both resulting presumably from the occurrence of
abnormally few cell divisions in the developing tissue. These
are an increase in light reflection from an increased number
of intercellular spaces filled with air, and an overall reduction
in chlorophyll content caused by the reduction in the number of
cells. It is also possible that the cells of the modified
palisade, which are certainly less distinctive in shape than
normal ones, may be defective in other aspects of palisade cell
differentiation, such as the number apd content of the chloro-
plasts.
The leaflets develop folded, with the adaxial faces which
bear the mark pressed together, and remain folded until they
reach almost their full size. I have opened by hand folded
leaflets that were almost ready to open themselves t and find
that the mark is clearly visible, though the background colour
of the leaf is not quite so dark, and provides slightly less
contrast. The fact that the mark can develop when there is
always at least one leaflet's thickness of spongy mesophyll
between it and any light implies that the bleaching suggested
by £ajanus is of little or no importance, at least in this
speciest if the spongy mesophyll remains green, it is diffi
cult to see how a layer of cells beyond it could be bleached.

40
4. Discovery of the Mechanism of Crenebic Control of White Leaf Markings.
The first report on the inheritance of white leaf -markings
is attributed by Brewbaker (1955) to Atwood
(1937-1944: cf. Atwood and Sullivan, 1943). Before this time
the inheritance of leaf markings in 1?. pratense had been studied
by several workers (Kajanus, 1912; Gtoaelin, 1914; 1916;1939;
H.D. Williams, 1931b, 1937;/ Wexelsen, 1932) and later by
Smith (1 Q 50). Atwood *s results agree with the finding in the
other species that the absence of white mark is recessive to its presence. (fV T. ^ rnte^-e- jjttaxU, 4 <PP -l^- 1 ^ 0-)
In 1?. re pens, crosses between unmarked plants never give
marked progeny; crosses between unmarked and marked plants
give progeny of which either half or none are unmarked; and
crosses among the marked progeny of unmarked plants produce a
segregation of three marked to one unmarked (Brewbaker, 1955,
Table I; Oarnahan et. al. , 1955, Tables II, V). These results
provide a firm foundation for the conclusion that absence of
marking can be attributed to the homozygous presence of a
recessive allele for no-mark at one particular locus.
The recessivity of no-mark, indicated by segregations of
3 marked to 1 unmarked plants, has been confirmed by data
published on crosses carried out for other purposes by Brigham
and Wilsie (1955), Zwingli (1956) and Chakravarty (I963b).
According to Brewbaker (1955), Atwood (1937-1944) 'reported
that several leaf marking types were useful as genetic markers

41
in white clover investigations 1 . xhis seems to be the
first mention of the existence of more than one kind of mark.
Brown (1947* also as quoted by Brewbaker, 1955)» concluded
that these V-markings *ere controlled by members of a multiple
allelic series, of which he listed eight members. 3rewbaker
and Anderson (1952) mention seven alleles, and make the point
that heterozygotes oetween different positive mark alleles
express both marks. Detailed accounts followed, with illus
trations, of this work (Brewbaker, 1955)» and of similar work
carried out by Carnahan et al. (1955). xheir conclusions
and terminology were combined in a joint paper (Brewbaker and
Carnahan, 1956) in which eleven different alleles were named,
all at the one V-locus, including a new one discovered by
Pandey (unpublished). Both alleles were expressed in most,
though not all, of the heterozygotes between these alleles
other than the recessive for no mark.
j?he mark-types listed by Brewbaker anl Carnahan (1956)
are listed in Table 3.1. below. The phenotypic code is an
extension of that used by Brewbaker (1955), extended according
to manuscript notes in the margin of the copy he sent me of
the joint paper. i'he alleles and descriptions are as in the
joint paper, though the order has been changed. 1 have added
my own phenotypic code, which 1 think is simpler, showing
generally the same letter as the superscript in the allele
name; and also some comments on the application of the descrip
tions.

Table
3.1,
Description
of l
eaf-
mark
ing
types, based
on Bre
wbak
er and Carnahan,
1956
.
Phen
otyp
ic
Alle
le
Description
Code
(J
LB)
0 A1
Aj
A C B D B
Vh
V1
V1 vp rba
rbd rby
No mark
Full V
- Pull V
- Full V
- 7-point
Basal
V
high
low
Fill
ed V
Filled V,
gr
een
base
(Pandey)
Broken V
Broken V
dom
inan
t
Brok
en V
yel
low
tip
Comment
(JGP
)
Rece
ssiv
e
Poss
ibly
pa
rts
of a
cont
inuo
us ra
nge;
certainly
there
are
more
than f
our
alle
les.
For
most
purposes L.have
grouped
them to
geth
er u
nder T
r and
L,
as 'simple
marks',
in c
ontr
ast
to
thos
e below.
Clea
rly di
stin
ct from t
he 'L-series'
of 's
impl
e V-marks
f.
Touches
marg
in
very l
ow,
but very acu
te,
and can b
e confused with som
e high Vs.
Ofte
n only a
n or
dina
ry V-mark shape
is really w
hite
- within i
t, only a
paler
green
than th
e upper
half of
the
leaflet;
'Lf.
Unless th
is is the
mark described as
Lf,
I ha
ve no
t seen t
his.
Wide,
abru
pt,
central
'break
1 - mark
blui
sh-s
ilve
ry.
Brew
bake
r illustrates
a heterozygote be
twee
n these
two,
bu
t I
have
no
evidence fo
r co
nsid
erin
g mo
re than o
ne br
oken
-V a
llele.
I would
incl
ude
here
all
case
s of
+
broken m
arks with faint or
un
dete
ct-
able
yellow t
ip if th
e mark is ch
alky
white
and
tapers to
ward
s the
break.
Phen
otyp
ic
Code
(J
OP)
0 H L (P) Ba F Lf B Y, By
B(y)
B(

43
5. iiechanism of Expression and Interaction of Leaf -marking Alleles .
Dominance is described in three situations. (1) All
other alleles are dominant to the recessive v for no mark.
According to Brewbaker (1955), heterozygotes with v could not
be distinguished from homozygotes for each allele and they
can therefore be considered fully dominant. Vexelsen (1932)['fcrurCv-tr Zi<Xrt>U £l9f£J W^=ve^ cN/si-j y\*j-^V<JL ptcwA/CA^^v^. Uj ^/"^cv^X
records a similar observation in j?. pratense: ^ (2) When a
larger mark overlaps a smaller, it is only possible to dis
tinguish one mark; thus, V Vp and V V a may simply appear as1 f 1 ]?, and for some types of V , V V may appear only as ?, and
% 7^ as I. This may depend on the size of the leaves; small-
leaved field- 0rown _/ V and V 7 plants appeared with I and
T phenotypes respectively, while the larger-growing greenhouse
cuttings from these plants showed clear separation so that a
double mark phenotype could be recognised. (3) In the combina- U J
tion J. Jr only a broken mark phenotype appears, and the area
where the J£-point could have appeared regains green.
Generally, however, it seems as though each mark expresses
itself independently; in a heterozy.^ote, all areas which can
be marked by the action of either allele are so marked; a
single dose being enough (full dominance, ^ mentioned above,
over v) to produce full intensity of marking* Brewbaker (1955)
describes this situation as mosaic dominance, which seems to
imply that each allele has both a property of making some area
whitish, and of keeping other areas green; but that in a

44
heterozygote, the allele which would act to make any area
whitish always is expressed in that area, showing dominance,
although in some other part of the leaf the positions may be
reversed, and the allele would be recessive in areas which it
would tend to keep green.
Brewbaker (1955) also introduces a suggestion which could
explain the similar tf-shape of the different marks. He pub
lishes a diagram showing the positions of the different marks
superimposed as a 'concentric 1 set of V's; and suggests that
these 'represent time-zones in leaflet ontogeny at which V
allele s operate to prevent the normal elaboration of chloro
phyll in the tissues 1 .
6. Red Leaf-1 arkings in T. repens.
I'he red leaf -markings in ±. repens fall into three classes.
ilne first is a sroup of marks occurring only in combination withhv (W ' E '
the V y allele at the locus controlling the white marks /Davies,
1963). i'he second is a group under genetic control at a dis
tinct 2-locus, the commonest being sporadic red flecking,
mentioned above and referred to in many descriptions of theW.E.
species (Carnahan e_t aL. , 1955; /Davies, 1963). Both show
considerable dependence on favourable environmental conditions
for clear expression. rhis is even more true of the remainder
of the marks, a heterogeneous group whose genetic basis, and
some may have none, has not been investigated.
he red markings associated with V ^ may only depend onT

45
the presence of V ^ to permit their expression, bub for one
at least it has been shown that the red mark is controlled
by a genetic factor completely linked to the 7 ^ allele
(Hovin and <J-ibson, 1961). j?his being so, it seems possible
tnat the other marks may be under similar control - linked
to V ^, as well as limited to V ^-containing plants.
J}he most familiar of these in the wild is a red marking
affecting the apical sector of the leaf, largely confined to
the terminal leaflet, with a sharp boundary running parallel
to veins on the base of the terminal leaflet or the distal
side of a lateral leaflet, and often a diffuse distal boundary
so that the colour does not extend to the leaflet tip. The
expression of this mark depends on favourable environmental
conditions which seem to be bright light and relatively low
temperature. In the greenhouse it rarely appears at all.
It would seem that there is some variability in its expression
from plant to plant, and it would not be possible at present
to say that any 7Dy plants completely lack the ability to
express this phenotype.
.Chere are three other rare marks in this grou^, also
only appearing in V ^ derivatives.
Uhe second is a dark purple mark, usually a thin line
following precisely all the irregularities of the inside edge
of the white V, or of both white V's in a double-marked plant.
Under favourable conditions, other spots may appear away from
the white V's on the leaflet base. Ihe colour is distinct

46
from that of all the other 'red* markings discussed here; when faintly expressed it appears to be no more than a dark green line along the white V.
The third mark is a red V-shaped mark, fairly acute and straight sided. It does not occupy exactly the area of any of the white marks 1 have seen combined with it. wn the different leaves of a plant, and the different progeny of a cross, it may vary in expression from a thin red line, to a heavy 7 with a lighter red dusting over all the leaf; but unlike the other red marks in this class, it is only on exceptionally small leaves that it disappears altogether under any conditions. It seems that this mark has only been found in one area in the wilu. All the specimens seen in Britain are derived from a plant sent to the .-elsh riant Breeding Jtation by ^r. r.L. Gribson, and presumably that was related to the plants found in a garden and in a pasture near Spartanburg, oouth Carolina, oy r.r. Paul i'aoor ana Dr. J-ibson respectively (rlovin and Sibson, 1961; personal communication, Jibson, 1964). It seems remarkable that this mark should have been found only iu an area in which the spe-jj.es is not native. "enetical studies have shown that this mark is completely linked to the V y allele.
JJhe fourth red mark associated uith V ^ is a red speckling confined to the tip of the white and yellow V, halfway up the midrib. Like the first two types, it requires favourable conditions Tor its expression.

47
A second class of red markings are those controlled by
the R-locus (Garnahan et al.. 1955). ^he first reference
to the genetics of these marks is probably that of ^rith (1928)
who reported dominance of the red leaf character of a var.
purpureum.
The system Carnahan describes is based on four alleles,
each dominant to those lower in the series. i'he basal
recessive, r, produces no pigmentation. Xhe next allele,f
R , produces scattered flecks whose intensity and perhaps
frequency is influenced by the environment. ihe other alleles
are Rm , which produces an irregular stripe of red along the
midrib, and R , which produces red pigment over the whole
upper surface of the leaf except very close to the margin.
Garnahan reports that the pigment is confined to the epidermalthat
cells, and/pigmented areas are much commoner in the upper
epidermis.
Brewbaker (1962), listing known genetic factors in the
species, refers to the H locus controlling red leaf, and to
an PI locus controlling red leaf flecks, and says that all the
factors he lists are independent in inheritance. If the VI
locus in his own work is independent, and if Carnahan 1 s reporti "P of R -H allelism is correct, there must be two separate loci
with alleles which can produce red flecking. other reports
of the dominance of red flecking (Stanford et al. 1960,
Bule.e_t al.. 1^/64; might refer to either of these, out describef
them as si .

48
These marks seem to represent a system completely
unrelated to the V-mark system, and without interaction
with it, except that Garnahan reports that the red colour
in a Rm phenotype was appreciably less intense on the basal
part of the leaf, after it crossed the white V, in a V y
plant.
This system of marks is described and illustrated by
W.E. Davies (1963) who uses Carnahan's terminology of onefa R-locus. He describes a new allele R with a higher
f frequency of red flecks than other R alleles.
The third class of markings, without established
genetic basis, include types of bronzing, perhaps a patho
genic symptom^ and also some cases where red pigment develops
in the white mark. The existence of types (referred to as
'mutants' presumably because of their scarcity) with red
pigment in the white mark is briefly mentioned by W. Williams
(1964). New observations on these markings will be described
below, but one earlier reference which may concern them is
that of Allan (1940) who describes 'white to purple blotches
or flecks' (my underline), and may be referring to something
more complex than the white V-marks and R-locus red flecks
simply superimposed.

PART 2
PRELIMINARY AND GENERAL
STUDIES

49
CHAPTER IV
VARIATION AND INHERITANCE OF LEAF MARKINGS
1. Artificial Crossing.
Stock plants showing the range of leaf-mark phenotypes,
and new plants with interesting phenotypes which had been
collected in the field, were kept in the greenhouse and at an
early stage in the work a number of crosses were carried out.
Later, the field and seed-sample work prevented any further
development of the crossing programme beyond the first generation.
The results of the crosses from which reasonably large progenies
were obtained are shown below.
Crosses were carried out without emasculation, and without
testing for self-fertility, and selfing is therefore a possible
explanation of some unexpected progeny. Nevertheless, all that
is known about the species indicates that a large majority of
progeny in all crosses can be attributed to crossing. The
recipient heads were thinned down to less than twenty florets,
and the keel petals removed by grasping them with forceps just
below their tip. This would often remove the anthers as well,
leaving the style completely exposed. Pollen was picked up on
a folded V of stiff card, whose point was scooped into the keel
of a number of florets of the pollen parents. Seed was collected
when the peduncle began to turn brown, between four and six weeks
after the cross was made.

50
The plants used were of various origins, distinguished
by the first letter of the label. A and B were plants received
at the Oxford Botany Department at various times from the ¥elsh
Plant Breeding Station as leaf marking phenotype stocks, to
demonstrate the allele combinations as teaching material. The
B group had been received before 1960, and had been kept primarily
as stock plants for the different phenotypes for cyanogenesis.
The A group were collected from the VI.P.B.3. in autumn 1960 as
leaf-marking specimen plants. The ¥ plants were wild growing
plants collected on the old pastures beside the river Thames at
the Oxford University Farm, Wytham.
Grosses
(1) Grosses between simply marked and unmarked plants
Gross Female Male
a 59 S12 ¥30 0 L S12 is V^v. Possibly some16 7 vv progeny scored as 0.
S12L
W300
Progeny Comment and Conclusionrl__
b 96 ¥18 0
¥1-2 0 L B ¥1-2 is V^v. B plant L 22 37 1 contamination?
c 98 ¥23 L
¥18 0
Total for L x 0 ;1:1
0 L 8 11
Observed Expected
04650.5
¥23 is
L 55 50.5 P > 0.1

51
(2) Crosses between plants with simple mark phenotypes.
Cross Female
d 66
e 78
f 91
g 115
h 48
i 116
Male
S12 D2L L
, cf. (a))
B6 W?L L
Progeny
0 L 9 21
0 L LL
4 29 1
B6
Lcf.
W98L
(V3
W14L
(V3
B6L
W21 0
L 2
(e))
B6L
Lv f cf. e, f)
B6L
Lv, cf. e, f)
W97 0L 5
L
5
L19
L
25
L
29
cf. e,f)(highish)
Here compare also:
J 89
Comment and Conclusion
D2 also V1^.
LL by contamination, or by
slight difference between
parent V alleles. ¥7 also
V v heterozygote.
W21 also heterozygous.
W98 does not contain v.
W14 does not contain v.
H LH W97 contains v; its mark allele is different enough to produce a clear double mark, but not for certain recognition as a single.
B13 W14 LH L
(V1?1 , cf. h)
L LH Confirms ¥14 no recessive,
23 24 and suggests its V^ alleles
are the same as the v" in
B13-
Total for crosses (between marked plants)with unmarked progehyiL 0
Observed 101 20
Expected (3:1) 90.75 30.25 0.05 ) P 0.02

52
(3) Crosses between other phenotypes and unmarked plants.
Cross Female Male Progeny Comment and Conclusion
k 53 W24LH
W30
0
1 131 U13.4i W30 LH 0
m 104 W300
G8.8 LH
W30 0
W29LF
F
12
L
7
n 52
o 82 W29 W30LF 0
(reciprocal of n)
p 113 W30 W86 0 LF
q 57
r 85
A14HF
B14LB
W30 0
W30 0
L 14
H L 0 2 15 1
L
10
F
0
5
FLO
27 11 22
10 19 1
F H
31 26
L B 0
24 11 3
Clear double mark in parent, but marks not classifiable in F 1 .
Poor discrimination between V v and Vv. One mark com pletely missed.
Again, no discrimination between L and H in progeny. Several progeny not iden tified as marked. Selfing or poor expression.
Good confirmation of W29 as VV.
0 presumably by poor expression of mark in Vv.
Good confirmation of W86 as V V . 0 as above, or by selfing or contamination.
Good confirmation of A14as V V .
Fits B14 as V1?13 if unmarked u
progeny are V v with poor expression.
General conclusions. Unmarked plants were scored in three crosses
where they could not be attributed to selfing (1, o, r), and this
probably reflects the fact that the seedlings were scored rather

53
young, and probably not under optimal conditions. The first
three crosses (k, 1, m; cf. i above) make the point that it is
much easier to identify two alleles as different when they are
in the same plant and can produce a double mark, than when they
are in leaves of different sizes and shapes in different plants,
when no confident diagnosis is often possible. This suggests
that there may be much more diversity among 'Yr 1 alleles than
can be proved by comparison of different plants with single marks.
(4) Grosses of other phenotypes with simple-marked plants known to be heterozygous for v.
Cross
s 51
Female Male
A12BH
B6L
cf. e,f)
Progeny
H LH B LB 0
40 6 24 25 2
t 61 B1
FH
W7
L
cf. e)
F L LH 0
15 14 2 1
u 67 D2 L
, cf. d)
A12HB
L 17
BL
5
0
3
Some V! probably had very faint L-mark, or had it fused with or overlapped by H-mark. Unmarked plants i»probably V v (cf. r).
L-mark probably overlapped by F - v-hr*scored as F. SomeV V probably scored L,some vV as L or 0.
Poor expression of V bin Vv andscored as L ?

54
(5) Crosses between other phenotypes.
Cross Female Male Progeny
v 4 A23 LL?
A13LH
LH LL 6 3
H 7
w 9 A13 A?LH HI
(re cipro cally)
H HL HI LY 14 22 25 19
X
y
z
aa
bb
cc
dd
ee
ff
16
50
36
19
30
125
10
A6Ba
B14 BL
A12HB
A15HBa
A15 HBa
W25LF
A5 BF
A23LH
A12BH
B13HL
A23 HL
A27 YL
W70 LL?
A17F
H 27
B 6
H 20
H 12
HY 7
L 8
F 35
L 25
BL 9
LH 8
HL 4
YBa 2
LH 8
FB 37
15 A6 A21 Ba F Ba BaF 11 11
, (according to label (VDav, cf. x)56 W29
FLA10 YF
F 29
Y 23
LBa 19
BH 7
BH 5
HBa 14
LBa 3
LF 3
0 1
0 3
FL 1
HBa 16
LH 8
BL 13
Ba 1
Ba 1
HF 7
YL 5
L 1
F 2
(according to label - appears (cf. n, o) LF)
gg 99A V28 W29 F LF L LF LF 951
Comment and Conclusion
Two kinds of double-mark progeny; three different alleles involved.
G-ood fit to B V xMany of Y progeny had noclear yellow tip.
Oood fit to Vbav x V^1 .
Gtood fit to vV1 x VbVh .
Possibly some confusion between V and V marks.
HBa noted as variable while scoring; includes
Ba by self ing? L contaminant.Ba by self ing?
F are probably
Conclude A17 VfVf . 0 probably seed contaminant in soil.
elude VfVba . 0 by self-F progeny presumably in-clud< ing?
Some v'v1 scored F?VVV presumably scored Y or YL.
Some scored as F?
hh 7 A15HBa
A7HY
H HBa HY HB Ba Some V"VWJf failed to show 23321 yellow tip, scored as HB.

55
Further conclusions .
( 1 ) Progeny of yellow-tip plants , carrying the V y allele , with
recognisable chalky white mark tapering towards the midrib, do
not always show any yellow tip (crosses w, hh).
(2) V behaves as dominant to V a and sometimes to V by overlap
(t, cc, ee, ff, gg).
(3) The presence of unmarked scores where they cannot have
arisen by self ing suggests that some L, Ba and B plants can be
scored as 0 perhaps especially when young (s, o, r, u, ee),
similarly V V as I (cross u).
(4) X seems to show suppressive dominance, and reduce the
expression of V to L, and that of V to nothing. Further
evidence to support this will be reported below.
Otherwise the results can be explained on the published one-
locus basis if a certain amount of se.lfing, possibly pollen
contamination, and contamination by seed known to appear in -the
compost is allowed for.
(6) Exceptional results: A18 (BBa) transmitting only one allele through pollen.
In cross 11, A18 BBa and A12 BH were crossed reciprocally
with each other. The parents are assumed to be V V a and VH
the expectation and the results of the two crosses are shown.

56
y^yb (yny? Vb
HBa BBa HB B H Ba
Expectation 1111
A18 female x A12 male 812 882 1
A12 female x A18 male 10 7
I'his suggests very strongly that when used as male parent, A18
provided only one class of pollen, V .
A18 was also used as male in cross 3t with less clear results.
A6 Ba (V %, cf. crosses x and ee above) x A18 BBa.
Oenotypes y, ybyba yby
Phe no types Ba BBa B 0
Expected 2 1 1
Observed 16 11 3
These results, taken alone, could also be explained as the resultVk V^ V»« V>
of poor expression of V in V V and V v. In view of the result
in cross 1 1 , it appears that they could represent a less extreme
case of the same phenomenon; only two plants out of 21 definitely
received a V allele through the pollen, though others, 0 or 3a,
may have done so without it being scored. Unfortunately no
further crosses were made with this plant, now dead, or its
progeny.
2. Expression of Leaf Markings: The Influence of Leaf Size, Age and Environment.
Explanation of the results of the above crosses make it
necessary to suppose that some marks were not observed, or

57
identified wrongly, when they were expected to be present. The
broken mark for example was often faint where it was seen, and it
would not he surprising if it were overlooked in other similar,
or even f ainter, cases.
Mark development seems to bear an alloxnetric relationship
to leaf size. The smaller the leaf absolutely, the smaller
relatively and the less conspicuous is the leaf marking. This
can be seen most easily on the small leaves which even the
largest growing clones produce at early stages of side shoot
development, especially under conditions favourable to frequent
branching, and also on the small leaf-like structures produced in
the inflorescence by plants infected with phyllody virus. There
would be a more serious difficulty in mark description when all
the leaves were small, or had developed under conditions un
favourable to clear mark expression; bright light and moderately
low temperatures seem to enhance the clarity of the marks.
Under other conditions the mark on normally marked plants may
be reduced to a small roundish spot on each half-leaflet, or
only sporadically occurring on an occasional half-leaflet.
Under favourable conditions f such extremely reduced marks are
less common, and the faintest marks recognised are well extended
but very narrow and faint streaks across the leaflet.
The consequences of poor expression of the marks would be
the apparent absence of some marks, the lack of detail of others,
so that distinctive marks might be classified only as simple
marks, and lack of doubleness of double marks - so that, for

58
instance, a jrV ^ plant in which the yellow tip was still
visible would be scored as By only, jrV^ as L, or V V as ?,
which amounts to effective dominance.
These considerations qualify the value of scorings under
unfavourable conditions - in the field in winter or early spring,
or on very old plants grown for a long time in the same soil in
pots, or to some extent at all times, in plants with genetically
controlled small leaf size. This might Is ad to an underestima
tion of the variability in small-leaved populations.
Small leaves are also produced by the seedling, and the
development of marks in the seedling may be different for other
reasons. The basal mark appears to develop later than the
others - not until after the sixth leaf or so - and this may
explain its apparent absence in some progenies of the crosses
above.
In red clover, which has an elongated flowering stem
bearing leaves, P.E. Smith (1950) records that while some plants
exhibited clear marks on the first unifoliate leaf, others showed
no marks until flowering, when they appeared only on the bract
leaves on the flowering stem. In £. repens there are no leaves
specially related to the inflorescence, and I have seen no
indication that there is any difference in marking between
vigorous but entirely vegetative stolons and those bearing
flowers, though weakened stolons which would probably bear no
flowers might have leaves of reduced size with less clear marks.

59
Smith described other plants with marks present only
at the seedling stage. This may correspond to a phenomenon
seen in some of my plants. When the first leaves of near
mature size were scored (fifth or sixth leaves) they had marks,
and perhaps unusually clear and solidly white ones, making a
sharp contrast with the green parts of the leaf. Later
scorings showed them as unmarked or very faintly marked. If
the observation that these were all unusually clear marks is
accurate, it supports the suggestion that the same phenomenon.Sevrev^
was occurring in all these cases. Plvs specimens were seen;
three from large seed samples from near Copenhagen (#43, N44,
N45), two from seed collected on different plots on the
'Park Orass» at Eothamsted (N132, N133), and two in
Gumpenstein, oteiermark, Austria (N104).
3. New Phenotypes not previously described.
The smeared mark: a new allele with exaggerated
expression in the seedling.
In one cross (listed as s above) a V V plant (A12) was
fertilised by a jHr plant (B6, whose heterozygosity was shown
in crosses e, f, and i, with other single-marked plants, where
unmarked progeny appeared). When first scored, on the appearance
of the unifoliate and first trifoliate leaf, it was discovered
that a number of seedlings with filled-in marks had been attrib
uted to this cross. Later scoring of about the tenth leaf
showed that these seedlings did after ^11 fit the expected

60
phenotypes; no filled marks were present, though then and later
a number of the plants which had been filled-in showed some degree
of 'smearing 1 of the mark, with stripes running down from the
mark between outlines parallel to the lateral veins, filled withan
vhite. A photograph of leaves from/unusually well developed
example is shown in Fig. IV(i). Assuming the apparent filled-in
phenotype and the smearing were expressions of the same property,
the occurrence in the progeny can be shown as follows:
Allele received from ^ plant A12 VhVb V
Genotype of Progeny Vbv vN1 V*V ,
Phenotype B (or 0) BL H (H or) HL
Total 26 25 40 6
Smeared - 32 3
Not smeared 26 25 83
Smearing appeared only in those progeny which had received the
JZr allele from the mother, and smearing must be produced either
by that aHele, or by other factors which can interact with that
allele only. Some degree of smearing occurs in many simple
mark phenotypes, and this probably accounts for the scoring of
some smeared plants among the V progeny in two other crosses
involving this same plant. In one of them, (with a plant
presumed to be V V ), confusion between diagnosis of BL and 3H
phenotypes could account for what appeared to be V V progeny
with smearing. Nevertheless both show a significant excess of

61
Figure IV (i)
(51 )53
High simple V-mark with heavy smearing

62
smearing in the plants receiving the jf1 allele from A12.
Cross 50 Progeny classesyt> Vh
Female Male VbVb VbV1 vV1 V1!^1
B14 A12 B BL BH LH
69 78 1rb irh
smeared - 2 3 7 sm210
not smeared 6 7 4 1 135
= 8.90
0.01 > P> 0.001 yb yk
Cross 36 ybyk y^y1 y^yn ynyh
Female Male
A12 B13
ybyh yhyl ^ ^ 20 8 yb yh
smeared 2 4 15 6 sm 6 21
not smeared 3 9 5 2 12 7\'2 r» p£
^( 1 ^ *
0.81 >P >0.001
Total: Progeny of three crosses with A12.
Allele from A12 carried by progeny
Vb Vh Total
Plants not smeared 76 23 99
Plants smeared 8 66 74
Total 84 89

63
The marginal mark; a new allele or a modification of the broken
mark.
One further distinctive leaf-mark phenotype has not appar
ently been described before. This is the marginal marking, which
has the appearance of a widely broken mark, with the bluish-
silvery appearance by which the broken mark is usually distin
guishable, and is 'smeared* down the edges of the leaflet
(smearing in low and high simple marks is normally mainly central),
The marginal mark can occur in a double-mark phenotype combined
with a simple low or high V-mark. Photographs of leaves from
two plants with the simple marginal mark phenotype appear as
Fig. IV(ii).
This type of mark has been seen only in two samples of
seed sent from areas at 1600 metres altitude near Sondrio in the
Italian Alps. One of these samples contained only one marginal
marked plant, the other, 33 marginal or double-marks including
marginal out of 96. The complete sample consisted of loose
florets, which produced in all about 300 seed; it could there
fore have been derived from only a few heads, though a specific
request had been made that at least ten heads be used in each
sample. Other samples sent by the same collector had recog
nisable heads - respectively 6, 4, 14, and 21. It thus seems
likely that the mark was derived from taore than one, perhaps
several parents, and must occur with a moderately high frequency
in the population sampled. The sample was unusual in two other
ways. There were very few plants showing simple V's - four

64
Figure IV (ii)
)4
Leaves from two 'marginal 1 marked plants

65
showing simple V's alone, one double mark with two simple V's,
and 9 showing combinations with broken or marginal marks. Also,
there were very many broken marks and derivatives: 49 in all.
As this type of mark is similar in position and identical in
colour to the marginal mark, it seems likely that there is a
connection between this and the high frequency of marginal marks.
There might be two alleles, frequent in this population because
of similar selective value, or recent origin of one from the
other by mutation; or modifying factors might be affecting a
single allele - V - in the 33 scored as M of the 82 plants
showing either broken or marginal marks. If this could be
shown to be the case, it would be the first clear case of an
effect on white leaf-markings in 3?. re pens caused by another
part of the genotype.
Shading distal to mark; another new phenotype.
Another phenotype which does not fit into the standard
pattern is one in which all the part of the leaf distal to a
normal simple 7 is slightly shaded with white, and thus appears
paler than the part proximal to the mark. This phenotype is
only visible under some environmental conditions, and was not
seen in any of the progeny of crosses carried out with one plant
showing it. Genetic determination is however suggested by its
absence from many other plants growing under the same conditions
as the one showing it.
This has been seen in one plant collected from riverside

66
pasture at the University Farm, Vytham, Oxford, in two plants
from Sussex, in one from Ferrybridge, Yorkshire, and in one (W
from Aberystwyth.
Summary: new phenotypes outside the range previously described.
Four distinct phenotypes are described which have not
been reported previously. These are the marks which occur only,
or much more conspicuously in the seedling; smearing of (some)
high marks under genetical control: marginal mark - probably
related in some way to broken mark; and distal shading.
Smeared and marginal marks may represent new alleles
related to V;1 and V respectively, or may represent the effects
of modifiers specific to certain alleles. If so, other
genetic loci controlling the white leaf marks beside the
V-locus must be postulated.
The marks restricted to the seedling, and the distal
shading, only occur in a small minority of plants, and unless
they are pathogenic in origin, this suggests that they also
are genetically determined.
4. Red Leaf Marking Phenotypes and -their Occurrence.
Three classes of red marks were described above, the
third claBB consisting of several phenotypes whose genetics
has not been investigated: some may be of purely environmental,
perhaps pathogenic, origin.
Two of these newly described phenotypes appear to interact
with the white mark in their expression. One, occurring only

67
in a few plants when growing in bright light, is the develop
ment of some pink or purplish pigment precisely in the area of
the white mark. This 'colour in the white mark 1 phenotype does
not seem to be associated with any distinctive white mark (not
with V y ). Its rarity suggests a genetic basis for the ability
to express it. The same point was made by ¥. Williams (1964).Sevet/v
in a brief reference to these marks. It has been seen in ̂ re
plants, of the following origins:
Sample no. 044 GreeceC48 Helinburg, Straubing, Bavaria, GtermanyN45 Kagsrnosen, Vanlose, Copenhagen, Denmark
_ N92 Sieros^aw, Poland, Near Poznan.
On a traffic island at a road junction near Oxford, presumably from a deliberately sown seed mixture.
In the last mentioned plant the red pigment was often brilliantf Irx-HveSe pU*l>^ iV-£ i~ rWl*- VX*U <*V £«^A/*ti. rtA*/, I Ua/*< oiiccv«A t^Jt HU. f^Q«rJt+Sl KWO CSAA^^^-A- b. *4+- «yvJCTdta-|w^o
f crimson, much more conspicuous than in the other cases mentioned.v _ ̂
It is possible that the description (Allan, 1940) of J?. rep ens
as having 'white to purple blotches or flecks' may refer in part
to these cases. A possible further example of this phenomenon
is the plant whose photograph appears below as Fig. IV(iv). The
distal component of this apparent double mark was always rela
tively blue, but in certain conditions (early summer) also
appeared to develop some pink to purplish pigmentation. This
did not appear in the proximal, yellower, part of the marking,
to which belongs the conspicuous reentrant mark tip.
The second phenotype interacting with the white mark is a
bronzing of the leaf, associated with a slight stiffening of the
leaf into a convex shape, and is restricted to the oldest leaves.
Neither the pigment nor the expansion of the tissue occur in the

68
area of the white mark. Leaf bronzing does not always inter
act with the white mark in this way; it may be a stage in leaf
senescence, a response to the physiological conditions, or a
result of pathogen attack (e.g. virus infection).
Of the red marks associated with the V y allele, the 'red
wash' spreading over the distal part of the leaf is quite
common, though expressed only under certain conditions, and
rarely seen in the greenhouse.
I have seen the red V only in material derived from the
original American discoveries, but the blue V and the red
speckling in the V-tip have occurred occasionally in the samples
studied, usually as one isolated plant in a sample. Blue V
tracing inner edge of white.V:
044 Greece N7 Kerasovon, Greece (several plants)053 Yugoslavia N41 Damhusengen, Vanl^se, Copenhagen054 Yugoslavia N82 Barlinek, Szczecin, Poland057 Yugoslavia N110 La Fre*taz, Vaud, Switzerland074 Turkey N155 Sondrio, Italian Alps.
Red speckling in V-tip
N45 Kagsmosen, Vanl^se, Copenhagen, Denmark N83 Cedynia, Szczecin, Poland 5T87 Lubiaszdw, Radomsko, #6dz, Poland N90 Kamieii Pomorski, Wolin, Szczecin, Poland N125 Between Kotukarara and Springfield, S. Island, New
ZealandSP Pasture near Bangor, North Wales Beside a track along a low cliff overlooking the harbour,
Aberystwyth Plant collected by Mr. V. Connolly near Clonakilty, 0. Cork
Both are detectable only under some conditions favouring
the production of large strong leaves.

69
Of the R-locus phenotypes, I have never seen R wild,
although it is found as a cultivated plant in gardens, particu
larly a nearly sterile form with a high frequency of multiple
leaflets.
The only Rm phenotypes I have found wild showed only R
phenotype when grown in the greenhouse. They were found on
riverside pastures at the University Farm, Wytham.
Red flecking, on the other hand, is quite common in wild
plants, although because of its uncertain expression no attempt
was made to score for it, and no comment can be made on its
distribution. As well as varying in the clarity of the flecks,
plants clearly vary genetically (as well as phenotypically) in
the frequency - which ranges from one on ten or more leaves to
ten or more per leaflet. The size of the flecks also varies
between individuals somewhat more than within them; one plant
with particularly small, very abundant flecks was obtained
from G-iessen^near Frankfurts-^-'"7^
It is remarkable that these various types of red marking,
though quite different in physical basis, show so many inter
actions with the white marking system. In genetic control, one
class may be determined by factors closely linked to a particular
allele at the V-locus. The position of the mark on the leaf,
in the case of the blue V, possibly of the V-tip red speckling,
and certainly in the cases of red pigment in the white mark, is
related to the position of the white V. Although the distal
red wash and the red fleck for instance can be seen
superimposed on each other, they seem to respond

70
to similar environmental conditions as each other, and the*
same as the white marks respond to, to a lesser extent. Both
types, except the blue V, appear the same colour. As Carnahan
reports, one of the R-locus phenotypes, ^m , interacts with the
V y allele in expression, being fainter inside the white V.
Two other red pigment patterns, reported above, show pigment
either restricted to, or excluded from the area of the white
mark. Vatkin Williams (1959) suggests that the white marks
are 'ghosts' of an earlier pigment pattern which involved
simultaneous loss of green pigment and development of red;
the two systems would have become dissociated more recently.
The interactions between the white marking system and various
red markings, listed above, and the existence of a V-shaped red
marking supports some connection between the two systems, though
the red V does not in fact precisely overlap any white V. The
very rare cases of red pigment in the white y mentioned above
are the only examples known in this species of red and white
markings covering exactly the same area, as postulated by
Watkin Williams. Although several other Trifolium species
have both red and white 7 or V-point markings, the only comparable
example seems to be in Parochetus communis . where a faint pig
mentation may develop throughout the white V, though there may«U*^U cverCsvfp^Mj e<~
be ajcompletely separate, and more heavily pigment ed, red V,
and scattered red flecks, iitgher up on tho loaf The markings
in other species will be more fully described below. An

71
illustration (Fig. IV(iii)) shows a plant with the red V,
and outside it, only slightly overlapped by it, the chalky-white
wings of the By mark (yellow tip very poorly developed if at
all) with which it is associated in inheritance.
5, G-eneral Account of the Variability and Classification of White Markings
The material presented above has consisted of an account
of the previous descriptions of leaf marking phenotypes, followed
by a number of specific points arising from observations made in
the course of this work. It seems valuable to attempt to com
bine these in a single review, in which the experience gained
in this work can set a perspective for a summary of all the
available information.
The size of the marked area on a leaflet can be defined in
terms of two variables, the extension of the mark across the
leaflet, and the width of the marked band measured parallel to
the midrib. Because of the variation in leaf size these measure
ments should be thought of as proportions of the leaflet rather
than as absolute sizes; and precise values for them would be
impossible.
The width of the mark may vary, or parts of the lateral
extent of the leaflet may be unmarked. The 'wings' of most
marks taper towards the margin. Pew marks reach all the way
to the margin, but if the end of the 'wing' of the mark comes
close to the margin it tapers there, at least, and is generally
curved downwards towards the leaflet base. Where the wings of

72
Figure (III)
Red V-mark on a broken-with-yellow-tip white
mark (yellow tip poorly expressed).

the mark do not run right up to the midrib, they may taper,
or may stop abruptly, leaving a green stripe along the midrib
(particularly conspicuous in some very acute basal marks), or
may leave a more extensive break in the mark. On the other
hand the mark may continue across the midrib, or may have a
region of greater width, forming a conspicuous thickened point
to the V, so that the lower, proximal outline of the mark is
more curved or obtusely angled than the distal outline. The
tip of the mark may extend up the midrib, producing concavities
or reentrant angles on either side. Between any tapering at
the ends of the wings, and any tapering, break, or expansion
at the midrib, there is often a region of more or less constant
width.
Other respects in which different marks may differ are the
regularity of the outline of the mark, the abruptness or gradual-
ness of the change from marked to unmarked tissue, and the
uniformity of the whiteness of the tissue within the mark.
Especially in well-extended but narrow marks, it is obvious
that the mark outline is not a smooth line running across the
leaflet, but is irregular to some extent. In thinner marks,
the mark may actually be discontinuous (for example, the wings
of the mark in Figure IV (v) and in Figure IV (vi) below).
£he width is more or less constant; as though mark development
occurs more or less separately in a series of strips of tissue
divided by lines parallel to the lateral veins, producing a

74
constant width of mark, but sometimes showing some displace
ment between adjacent strips. When this displacement ismark
marked, the segments of the/outline produced by the displace
ment and running parallel to the lateral veins may be straight er
and more sharply marked than the rest. (This may be seen in
Fig. IV(i) above, and very strikingly in Fig. IV(iv) and IV(v)
which appear together below.)
A case was described above of smearing of the mark appear
ing to be specially frequent, and possibly under specific
genetic control, in one family of plants. A degree of smearing,
in which the width of the mark is not constant within each
strip, but where there are occasional extensions downwards
towards the midrib, is quite common, though not as conspicuous
as in the family referred to. It is usually confined to the
region close to the midrib, where in an acute mark it produces
a thickened triangular mark tip. Smearing of the mark tip in
this way may be quite regular in some phenotypes, and when it
is accompanied by a similar displacement of the distal margin
also near the midrib, the result may be an 'inverted-W shaped
mark with a reentrant tip. In such cases, the straightness
and sharpness of the parts of the mark outline running parallel
to the lateral veins at right angles to the normal direction isc/j
" - \/ <
Two very clear examples of such smeared and more or less
reentrant tips are shown in Figures IV(iv) and IV(v) which
follow. Both are extreme in that they combine such a tip with

Figure IV (iv) 75
C44-166
Double mark, outer part bluish, inner yellowish with conspicuously smeared tip.
Figure IV (v)
044-69
Kark with irregular discontinuous win-s and conspicuous smearing of the tip.

76
very weakly developed wings. Figure IV(iv) is noteworthy
in another respect, since the mark appears to be double.
This can be recognised not from separation of two marks by
unmarked tissue, but by the difference between the colour of
two adjacent marked regions. The proximal part, including
all the smeared stripes at the tip is yellowish-green, while
the distal part is bluish, and showed an even greater contrast
under some conditions when it appeared to develop a faint red
pigmentation, as described as a rare phenomenon above. This
certainly did not extend to the yellowish part of the mark.
If this is correctly interpreted as a double-mark phenotype
produced by a heterozygote, the smearing is either a property
of only one allele, or at least, only extends the tissue marked
in the colour of one allele, and the apparent anthocyanin
pigmentation is associated only with the mark produced by the
other allele.
The character which has been most important in previous
mark classifications is probably the most useful; this is the
position of the V on the leaflet, between the base and the tip.
The trends of the wings meet at a point on the midrib usually
between about three and seven-eighths of the way from the
leaflet base to the tip, though the actual mark may lie below
this in a reentrant mark, or extend above it in some true
V-shaped marks.

77
Another important variable in the appearance of the mark
is the angle which the two 'wings' make with each other. This
may be very acute (less than 45 ) or quite obtuse (approaching
135°)» although some apparently almost flat marks also occur,
if the wings do not extend far and there is some development
towards a reentrant tip.
The combination, in heterozygotes producing double marks,
of marks at different positions and lying at different angles
can produce double marks overlapping at the wings but separated
in the centre, producing an (uninverted) 'A 1 shape; or marks
joined in the centre but spreading apart away from the mjdrib.
Although mark angle may be affected by leaflet shape, the fact
that both these types occur demonstrate that angle is a
variable property of the alleles themselves, not completely/cf Ca.Sfa
determined by the height of the mark along the midrib. u(ic ff . ^oa z<\
Another property of the mark phenotypes is the development
of whitish colouring in parts of the leaflet outside the V-shaped
band. A rare 'shaded 1 phenotype with the distal part of the
leaf pale has been described above. The rather variable class
of filled-in marks show the alternative condition - modification
of the colour of the part of the leaflet below the V.
The published pictures of filled-in marks (Brewbaker, 1955;
Garnahan, 1955; V.E* Davies, 1963) seem to be confusing, as
they are very extreme types, and most plants showing s ome degree
of filling-in seem to resemble an ordinary simple V much more
than these. However, even in Brewbaker's and Davies 's

illustrations one can make out the V-shape at the edge of the
mark as more intensely white than the region within it. A
less extreme example is in fact shown by "^ a vies to illustrate
the expression of red flecking. It seems possible that the
'spread V 1 found by Pandey (Brewbaker, 1955), with a spot of
chlorophyll at the base of the leaflet, may be an example of a
moderately filled-in mark. The intensity of the whiteness in
the filled-in area may not be uniform; it may be greater at
the leaflet base, or on the other hand it may be concentrated
near the V-mark in the centre of each half-leaflet, as though
in these cases it was a very faint basal acute mark. In
Fig. IV(vi) appears a picture of one of the most heavily filled-
in phenotypes seen in the plants of wild origin used in this
work. This shows a very irregular and broken V-mark, and also
an irregular distribution of the white shading of the 'filling-
in f , which is concentrated close to the mid-rib.
It seems probable that a complete series of transitional
forms between an extreme filled-in and a simple mark could be
found, both as inter-plant genetic variation, and also by
intra-plant phenotypic variation. Whether the genetic
differences reflect a range of different alleles, or the effect
of modifying factors is not clear. When parent plants have
a fairly intensely filled-in mark it is also s een in their
progeny, but this does not discriminate between these alterna
tives. Further generations of crossing, or crosses between
heavily and faintly filled-in plants would provide a better

79
indication.
Another series of transitional forms approaching the
filled-in condition runs through the types of smeared marks,
although, except in the seedlings, no more than an occasional
half-leaflet has been seen with a completely filled-in mark
in a plant showing smearing.
One last important character is the colour of the marked
area, which may be relatively densely white, or faint and
bluish, or yellow or pale green compared to other marks.
Figure IV(iv) above shows a plant whose mark is interpreted
as double on the basis of difference in colour between yellowish-
green and bluish. The difference is fairly clear even in a
black-and-white photograph, the fainter, outer half of the
stripe of marking being the bluish component. x'here seems to
be no published reference to variation in colour between
different marks in T. repens (compare the designation of a
separate locus controlling white or yellow colour of the mark
in £* prat ens e by Wexelsen (1932)). .j'ven the full accounts by
Brewbaker (1955) and Carnahan et al. (1955) refer to colour
only in connection with the By phenotype (cf. also D.R. Davies
and Wall, 1959, 1960). Allan (1940) refers to 'white to
purplish 1 marking and may possibly be acknowledging this
variation, though he is presumably referring mainly to the
two principal classes of white and red marks.
The characters by which the mark on a particular leaf may
be described may be listed as follows:

80
COLOUR and INTENSITY of colour-contrast with green background
POSITION of mark (high or low) between leaflet base and tip
EXTENSION of mark on each half-leaflet towards midrib andmargin
WIDTH of the marked band, measured at right angles toextension
VARIATION IN WIDTH - marginal and midrib ends tapered orabrupt, or centre of mark expanded to a triangular tip
REGULARITY OF OUTLINE - smooth or irregular
3HARPNESS OF OUTLINE - abrupt, or gradual and diffuse
SHAPES OF OUTLINES, distal and proximal - projecting tip,angular, curved, reentrant
ANOLS between the straight parts of the two wings
SMEARING- of the mark - position and amount
FILLING-IN or SHADING, whitening of leaflet proximally ordistally.
Clones or genotypes may be further described in terms of the
consistency of mark phenotypes in leaves of the same status
(particularly, the sporadic incidence of smearing), and the
effect of leaf size, the stage of maturity, the state of vigour
or weakness, and the environmental conditions on the phenotype
produced.
A 'taxonomy* of mark types would look for tendencies for
reourrence of certain combinations of characters, at greater
frequencies than related combinations. To take a clear example,
broken marks, with a central gap extending half way or more
from the midrib, normally extend all the way to the margin,
have a bluish or metallic appearance, lie at a fairly obtuse

81
angle fairly hi^h on the leaf, and have a continuous, not very
irregular, and fairly sharp outline, with a uniform intensity
of marking within it. This combination of characters is fairly
well isolated from intermediate combinations, and would seem to
qualify as a 'natural group 1 of marks, since most marks showing
several of these characters are found to share the others.
The studies of leaf-mark inheritance carried out by Brew-
baker and Carnahan seem to have been caitded out with a small
group of plants, probably chosen for their mutual distinctness.
Acquaintance with the range of natural variation demonstrates a
wider and much less discrete range of variation; it is only by
arguments such as that in the paragraph above that one can point
to marks which can be grouped under one label - hypothetically
as produced by a distinct allele.
Some comments may now be made on the value of the reported
set of alleles and named mark types in describing the observed
variation. A distinction may be drawn between the generally
rare marks with distinctive properties - broken, broken with
yellow tip, filled-in, basal - and the 'simple* marks, ranging
from ^ow to high.
The types of distinctive marks distinguished are fairly
acceptable.
Broken mark was quoted above as a good example of a dis
tinct mark type. Its nearest 'relative* is the marginal mark,
which shares all its properties except that it spreads downwards
on the leaflet from the mark. It may or may not be a distinct

82
allele - it is certainly a distinguishable phenotype.
Broken marks with yellow tip is perhaps the most distinc
tive of all the marks, but includes a wider range of variation
than broken mark, and has other peculiarities, such as its
double structure and its interactions at various levels with
red markings. The yellow tip is not in fact the most useful
diagnostic feature, since many leaves and some whole clones(q. p .£S n*=k(0, f-7» y o^ PrylTO.O)
fail to show it, or show it only very faintly. / There is how
ever a clear class of marks with a rather hi^h 7, somewhat
broken (though much less than the simply 'broken 1 mark), and
tapering towards the midrib, and chalky white in colour,
producing an unusually sharp contrast with the leaf. /.any of
these show some amount of yellow tip, and many can develop the
'red wash' on the terminal leaflet. At the other extreme, some
leaves (especially perhaps on seedlings?) show very conspicuous
yellow tips, and the white mark is reduced to a discontinuous
string of dots. The mark is very definitely double in appear
ance; as well as differing in colour, shape and position, the
two components differ in outline - the yellow mark having a
diffuse, fairly smooth outline, while the white mark has a
rather sharp, sometimes irregular outline.
There are some marks, also double, with a slightly differ
ent combination of characters. The tip is yellow-green or pale
green and less diffuse in outline, and the wings are bluish-
metallic, rather than chalky. This could be interpreted as a
double mark produced by a combination of a broken and a simple

mark with an enlarged point and little extension. However,SlvMjU
these/marks do not appear frequent in the samples Vliere thii-
combination appears, and it may represent a second type ofTtaju. .M-e^ta ivtrc Sc^f-e<C. «<> Y (cj-. f>- i2<i)
double mark controlled by one allele. / Dhis phenotype was seen
in the following samples:
Jommon in N97-5 Skopje, Yugoslavia N97-8 Zagreb, "
Occasional in N156 Italian AlpsN159 " "
Possible, not N97-2 Kutina, Yugoslaviadefinitely N82 Barlinek, Szczecin, Polandidentified N92 Sieros^aw, Poznan, Poland
N96 Krynica, Krakow, Poland.
The filled-in marks are certainly variable, and it seems
likely that the existence of a number of filled-in alleles is
needed to explain it. As well as varying in the intensity of
filling-in, they vary in the width, and the shape (acute-pointed,
curved, or reentrant) of the tip. Although a clear distinction
between simple marks and filled-in marks can be made - all<TA pU^wCo
marks/N showing any filling in can be called filled-in marks -
there seems to be a continuous range, and the V-mark at tho
edge of the filled-in area varies in much the same way as do
the simple marks without filling in. Marks like those used to
illustrate filling-in by Brewbaker (1955), Camahan (1953) and
W.E. Davies (1963) are extremely rare in the wild; much
commoner are phenotypes with faint filling-in, or a trace only,
Visible on the best-developed leaves. The mark shown in
Fig. IV(vi) shows more intense (though also irregular) filling-in
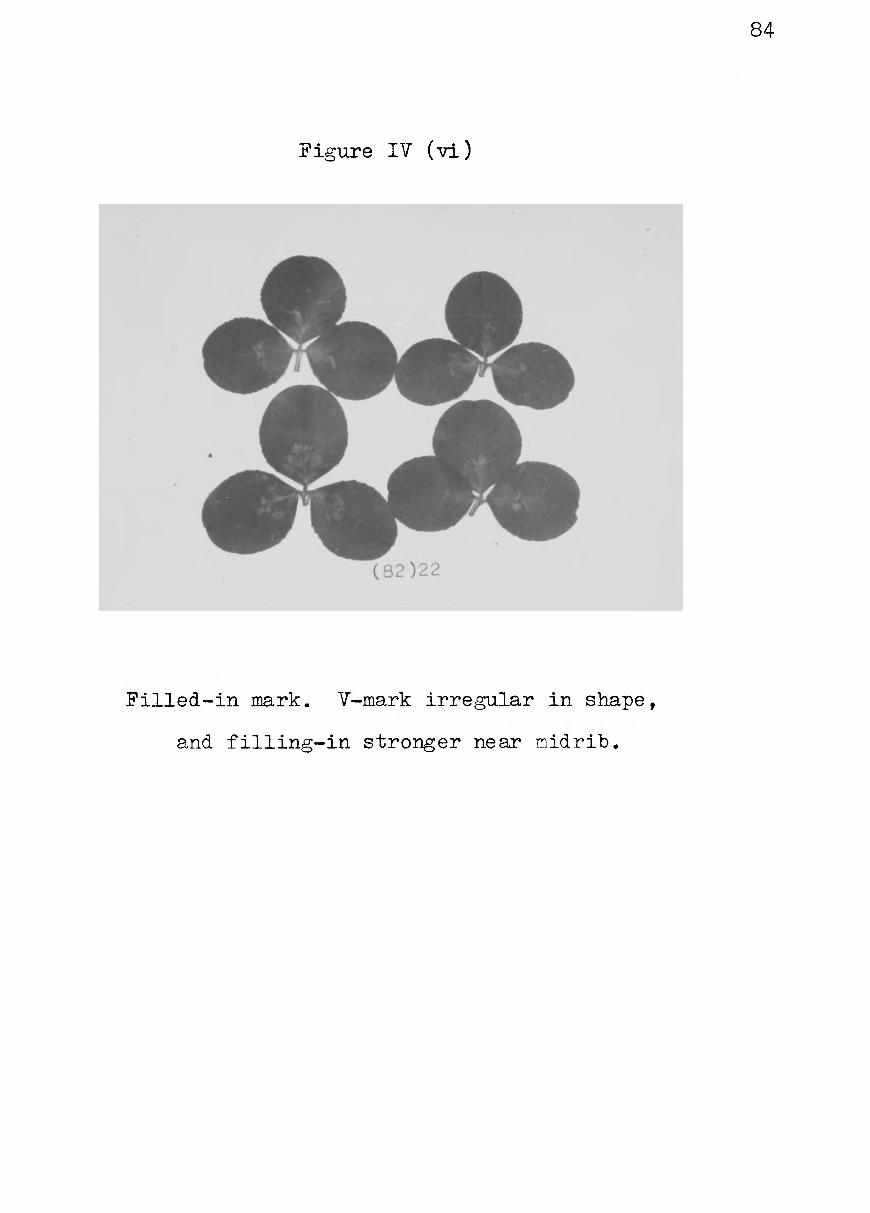
84
Figure IV (vi)
(82)22
Filled-in mark. V-mark irregular in shape,
and filling-in stronger near midrib.

85
than most of the plants of wild origin scored as P (or at
first as If) in this work. The irregularity and fragmentation
of its V-mark, as opposed to the continuous broad m?rk shown by
Davies, and the smooth, diffuse outline of the mark shown for
Tr by Brewbaker, illustrate the point made above about the
variability of the V-mark within this class.
The basal marks have less Distinctive properties - a very
acute shape, the wings approaching the margin very near the
leaflet base, and a yellowish-green rather than whitish colour.
However, they do seem to be a distinct group. The lowest of
other V's are not acute, and confusion would be most likely with
the more acute high V's. The basal class does seem to include
some variation. The basal mark in Fig. IV(vii) below falls
more or less in the centre of this range. Some marks have
tips over half way up the midrib, have a clear green area beneath
them, and tapered tips curving inwards towards the midrib at
the ends of the wings. At the other extreme are marks like
that illustrated for Vba by Brewbaker (1955), not reaching half
way up the leaf, rather blotchy and irregular in intensity,and
without sharp outlines, and either with no green area proximal
to the mark, or a green stripe on either side of the midrib which
as wide at the mark tip as at the base. This could be regarded
as a central break in the mark, as seen in many simple T^-marks,
as much as an area enclosed by the mark.
The simple marks without the distinctive features of those
mentioned above present a much more complicated picture, which

86
the published description? ?eem much more inadequate for.
In the population data which will be presented "below, they have
all been grouped together ns f l f marks, thou~^ in some cases a
note has been made that some of them should be described as high
7our previously described alleles fall in this class; hi :rrh,
intermediate and low Y's, and V-point.
Two kinds of particularly high mark are found. One is
relatively flat and obtuse, quite thin, and light green. -One
second, mainly found in large-leaved plants, is more acute,
broad, and yellowish-green. Among the lower V-marks, three
relatively distinct rare types may be mentioned first. One is
quite broad, a faint silvery colour, and has the tip of its
straight V slightly more than half way up thn midrib. ihis,
or double r^arks including it, occurs in over half the seeds from
one head, and sporadically in other heads in sample ?T45i from<fp-H|.
Kagsmosen, Vanlpse, Copenhagen, Denmark.^ Single plants with
possibly comparable marks were seen in
N 42 Damhusengen, Yanl^se, Copenhagen, DenmarkN103 (Jrobming, Steiermark, AustriaN111 Les Allieres, ?ribourg, SwitzerlandN122 New Zealand.
One mark lies in a similar position, but is much thinner and
sharp-edged, and although quite continuous, it is distinguished
by a very definite bluish colour, as distinct as that in a
typical broken mark, or more so. It was found as follows
Common N92 Sieros^aw, Poznan, Poland
One plant N82 Barlinek, Szczecin, PolandN83 Cedynia, Szczecin, Poland

87
Possible examples X97-2 Kutina, YugoslaviaN95 Regiestow f Krakow, Poland.
A third lies very low on the leaf, and consists of a broad
white band, fairly smoothly curved, little more than a quarter
of the way up the midrib. A fourth less rare and less dis
tinctive type resembles the last, showing a steadily curved,
broadish band, whiter than some other marks, crossing the mid
rib just below its half-way point.
The remainder - the majority - of the simple marks aref
harder to divide. Pour extreme types may be described, though
without definitely claiming that there is any clustering round
them or deficiency of intermediate types.
One of these types, perhaps the intermediate V, is a fairly
straight sided V, fairly acute, and with its tip over half-way
up the leaflet. It resembles the acuter high V, except that
it is not quite so broad, so acute, or so high in position.
It may be rather less regular in outline and texture at the
tip. The second corresponds to V-point, when most fully
expressed. The outline of the mark is acute on the distal
side, but curved on the proximal side, so that there is a
triangular marked tip, and the wings are thin or only slightly
extended. The texture within the mark may be uneven - speckled,
op showing the triangle is composed of a number of smearing
stripes. In small-leaved plants, this, and the two next
mentioned, account for all the clearest marks. The next is
also seen in larger leaves; it is centrally placed, and the

S3
moderately extender' wings lie fsirly obtusely. The centre
of the mark is rlightly thinner, and depressei to make a curve
of the mark as a whole, or slightly reentrant, vith -rail
smeared stripes with sharp outlines parallel to the lateral
veins showing near the midrib on the lower side. The last
type has a very marked reentrant smeared central region, and
the wiags are very thin, and run down quite acutely from the
ends of the smeared stripes, producing a distinctive W-shape.
Some plants show intermediate conditions between these two
reentrant marks and the V-point type, the upper part of the
point being developed only on some leaflets, and the first
mentioned intermediate V and the V-point are linked by forms
with well developed win?s, an acute distal outline, and various
degrees of smearing within the tip at the centre.
In particularly small leaved plants, these simple marks
become less and less distinguishable, and a type with a whitish
spot either side of the midrib, slightly extended outwards,
can correspond to any of these types, or to filled-in types.
Basal or broken marks tend to disappear completely, though
the distinctively white colouring of the wings of the broken
mark with yellow tip makes at least some plants of this form
recognisable under conditions when no other type could be
identified as anything Tbiit 'simple V.

Discussion of the mechanism of expression of the white mark.
Brewbaker (1955) has suggested that the marks represent a
concentric set of zones which were at the same sta^e of develop
ment at the time some disturbing factor came into action, for a
limited period. The existence of heterozygous types where marks
with separated tips converge towards the margin (e.g. the acute
high V and the curved mark with the thin centre) show that an
increase of acuteness does not follow necessarily from lower
position, and the converse arrangement (e.g. the two high V's,
or the curved thin-centred V and the V-point lying lower),
where wings diverge from an overlapping tip, show the angle
changing faster than is conformable with his hypothesis. nore
positive evidence is the overlapping of marks - the tip of one
lying above, and its wings below, the other. .this happens with
the combination of moderately high-reaching basal marks and the
flatter low marks, such as the curved thin-centred (as shown in
the phenotype illustrated in Fig. IV(vii)); and with the faint
broad silvery V and the curved mark, and in this case the dis
tinctive colour and outline of the silvery mark serve to dis
tinguish the components. 3uch phenotypes could not be produced
by a simple timing control. However, the idea of such a timing
control has attraction as an explanation of the phenomenon of
smearing, in which the disturbance of the normal process of leaf
development continues in a part of the differentiating zone after
it should have stopped. The regular smearing which produces
reentrant or triangular tips illustrates the sort of interaction

90
Figure IV (vii)
N96-1
Double mark of Low and Basal V's, the two
marks appearing to cross over one another.
(This phenotype is not consistent with
Brewbaker's theory of concentric time zones
of V-allele activity.)
91
of the mechanism of timing of mark-allele exprassion v ith
position between rridrib ard margin which would also be neeied
to explain the interchange of position of mark? which cross
each other. The autonomy of small partr of the differentiating
zone such as those which produce smeared stripes ir shown by the
irregularities seen in the wings of some marks, as though both
the beginning and the end of the 'marked 1 type of development
had come a little early or late.
This local autonomy of small regions of tissue producingR.
the mark is supported by the observations of/Davies and Wall
(1959, 1960, 1961). They irradiated two clones of Vbyv with
gamma rays for a brief period. The first si^ns of somatic
mutation appeared between four and ten weeks later (depending
on the season) and 'were recognised as an absence of, or a
change in, a small portion of the leaf mark. Later leaflets
had larger segments of nutant tissue, then whole leaflets and
ultimately whole leaves and tillers were mutant*.
'A considerable number of the mutations observed were small
gaps either in the white V or yellow tip 1 and by the same
criteria 'No spontaneous mutation was found in the control
plants utilised in all the experiments considered here (ca.
10,OCX) leaves)'. The small gaps must therefore have been
caused by mutation and have been clearly distinguishable from
any natural irregularity of the leaf. In other words, a
change in the genotype of a small group of cells could prevent
them contributing to the mark. Although some response at a

higher level to morphogenetic fields in the leaf as a whole
must determine which fraction, if any, of the cells in the
developing leaflet express the marl*, some ability to respond
is also required of the cells involved.
The fact that the effect of mutation is to eliminate narked
areas supports the idea indicated by the dominance of the
positive properties of the alleles that the production of
markings is a positive process, interfering with a normal
process of development which is provided for completely by quite
other factors. thought of in this way, and if one assumes
one dose of an allele is sufficient to produce its full effect,
the joint expression in heterozygotes is exactly what would be
expected. Independent action of the allelee is all that need
be postulated, and Brewbaker's idea of 'mosaic dominance* seemsi
an unnecessary complication,
R. Davies and ball's work (1959) produces some other
results of interest. The latest appearing mutant phenotypes
were those affecting the largest amount of tissue, and some,
presumably affecting cells in the meristem itself, affected
whole tillers. These new self-reproducing phenotypes, as well
as completely unmarked forms, included some where only the white
mark had been lost, leaving a yellow point; some where only the
yellow tip had been lost, leaving a broken white mark which
ft. Davies and Wall equate with the known broken mark. Indeed
the mark they illustrate has neither the sharp contrast nor the

93
tapering by which V y m^rks with faint points were distinguished
above from broken marks. These component ^he no types were quite
common; considering areas of a leaflet or more, 103 cases of
loss of the whole mark occurred, 80 of loss only of the white V,
and 18 of loss only of the yellow point. Other stable pheno-
types, which no frequency is quoted for, include modified narks,
with the white jart reduced in intensity, or broken up into spots,
These results confirm that such features as the intensity and
regularity of the mark are genetically controllable, though
they do not indicate whether they are controlled at the V-locus.
Unfortunately, ^. Javies and Wall's tillers with mutant
phenotypes all behaved in crosses as unchanged V ^v. presumably
they were all chimaeras, and the mark development is completely
accounted for by a tissue layer which is not involved in
garnetogenesis. There may have been as many similar mutants in
the gametogenic layer - but having no effect on the visible
phenotype, these were not selected for closer examination andVv
crossing. Their results also suggest that the V y allele
contains two functions which can be destroyed or modified
separately. This could be so if the V v allele involved a
reduplication of the chromosome segment containing the V-locus,
and if so, other genetic material involved in the reduplication
might control the red markings associated with this and not
with other V alleles.

94
Some complexity in the structure of this locus seems
acceptable >- in view of the lar^e number of different alleles -
11 published, and if the diversity described above is determined
by the V-locus, the number must be considerably larger.
Lrewbaker (1955) found some BL and some 0 progeny (only one and
two plants respectively, out of 38) in the progeny of a 7 _f x vv
cross, and sug0ested that they might result from intra-locus
recombination in the heterozygous parent. The C at least could
not be derived fromselfin^;.

95
CHAPTER V
4 PRINCIPLE Gii1 POPULATION
1. Introduction: Discussion of Problems, and Experimental Studies Related to Them.
The main, object of this work has been to obtain data on
the distribution of different leaf-mark phenotypes in naturally
established populations of white clover, in the hope of finding
regularities in the distribution pattern from which it might be
possible to deduce the kind of selective pressures which may be
acting for or against particular alleles.
Such a pattern might be discernible by comparison of
neighbouring populations, or only as a gradual trend over a
large area. An attempt has therefore been made to combine
study of samples within a limited area (Southern Britain) on
which relatively complete information can be obtained, with
the study of samples collected from a wide range of sources
overseas, particularly in the areas where the species was
established before its spread was assisted by deliberate or
accidental introduction by man.
Samples used have been both of seed and vegetative material.
Vegetative samples describe genotypes which have actually sur
vived for some length of time in the wild, whereas seed samples
are relatively unselected. Arguments of convenience favour
seed samples, which can be stored for a year or more with
negligible loss of viability until it is convenient to grow

96
them, and can be simply and safely sent by post, for which
reason most of the samples originating outside Britain are
seed samples. Seed samples are grown in more or less uniform
favourable conditions, giving good and comparable expression
of the phenotypes. It is usually convenient, on the other
hand, to score vegetative material in the field, and few of
the samples described have been grown up after collection.
Studying these phenotypes which have developed under a range
of somewhat adverse field conditions mus t to some extent reduce
the accuracy of the descriptipns recorded.
The comparability of seed and vegetative samples is a
complex problem. Aspects of it are discussed in more detail
below, together with experimental studies concerned with some
of these aspects.
Experimental Studies bearing on Sampling Procedures.
Before drawing any conclusions from the results of scoring
the samples, one should consider the possibility that the tech
niques of obtaining and handling the sample may have biased the
sample in a way that -would alter the results. A seedling
sample for ex&mple muct be grown for some time before scoring
(modifications of the leaf mark phenotypes on the earliest
leaves have been referred to above). Some seedlings die
before or after planting out, some seed swells but does not
germinate, other viable seed remains hard and unswollen. Any
of these causes mi^ht ap^ly selectively to some genotypes more

97
than others. The problem of the hard seeds which do not
imbibe water is discussed below, and experiments are described
to discover the technique best suited to obtaining the maximum
yield of seedlings from each sample.
The samples used have been obtained in various ways, and
before using them to reveal any correlation with environmental
features, one has to consider the possibility that different
sampling techniques may introduce different biases, and produce
results which are not comparable. Even if perfectly random
sampling techniques were used, seed and vegetative samples
would still be of different sets of objects; although a
biologist may predict a connection between the genetic composi
tion of a population of plants and the seed they carry, this
similarity may not be complete.
Within a reproductive cycle, long term stability of adap
tation to environment is compatible with a selective equilibrium
in which selection favours certain genotypes in the processes
leading to seed formation, and others in the processes of
development from seed to maturity. V.here suc^ a dynamic, cyclical
equilibrium of genetic response to selection occurred, vegetative
and seed samples would include different proportions of each
genotype. The possibility that such discrimination mi^ht
affect the leaf-mark genotypes being studied should be considered;
and if a bias was found, it might in fact identify part of the
selection which one would expect to account for the stability of
a polymorphism. A comparison is described below between leef-

98
marking frequencies, in a vegetative sample, and in a sample
of the plants bearing inflorescences, which would reveal some
of such effects; the results in this case are not significant.
A complete study of this kind would involve comparison of several
phases of the population; vegetative material, plants producing
flowers, genotypes of pollen reaching recessive 'tester 1 plants,
genotypes of mother plants weighted in proportion to the number
of seeds they bear, the seed produced in any one season, and the
seed lying dormant in the ground. The transitions between each
of these phases represent opportunitieo for selective discrimina
tion for or against particular genotypes.
The possibilities of differences between the genetic com
position of the different phases are perhaps even nore clear
when one considers the inadequacies of the idea of a steady flow
through phases of a life cycle. Many of these phases are
phases of multiplication, and in a population in equilibrium
this must mean later elimination with scope for selection.
The idea of a continually flowing cycle may itself be somewhat
inappropriate in & species such as this.
Vegetative reproduction can certainly be very effective in
a species like this one. A set of observations are described
below to illustrate a method which could be used to describe
the extent to which single clones can expand. If vegetative
reproduction completely took over the functions of dispersal
and persistence, as it seems it could over quite Ion* pe

99
a seed collection would not be the next phase in a cycle, but
a sterile side branch; and in view of the difficulties in
establishment, this is probably true of a large majority of
any seed population in any case. Conversely, from the long
term view in which genetic variation, seed dispersal, and dormant
survival are necessary, the long life and large size which some
clones can attain vegetatively in stable environments, without
any selection for sexual fertility, may make their contribution
to a vegetative sample deceptive by the inclusion of sub-fertile
genotypes with a restricted genetic future.
Another respect in which apparently similar samples may
not be strictly comparable concerns not the actual values
recorded for different phenotype frequencie?, but their accuracy.
The number of plants scored in each sample is generally taken as
indicating the accuracy of the results, but considerably larger
sampling error than thus estimated will be present in samples
derived from a set of individuals not chosen independently. A
vegetative sample in which plant? were chosen from a very
restricted area or very close together might well sample the
same genotype several times (cf. Harberd, 1958), although the
indications are that the area which any one clone occupies to
the extent of excluding others is much smaller than the area
which its spread can reach. In seed samples, the members of
the sample fail to be independent when they con*i?t of seed
from the same head, with a common maternal parent, and possibly

100
a quite restricted number of pollen parents. Where the sample
is taken from a large batch of seed, this is less important,
but when the sample consists of all the seed from as few as
five or six heads, a large part of the sampling error depends
on the sampling of those five or six parents, not on the forty
or fifty progeny. Small samples consisting of loose florets
or seed are liable to this problem to an unknown extent - they
may represent the whole production of a few heade, or a propor
tion, selected more or less at random, frorr many rnore. Some
observations are described below on the Feeds grottrr s eparately
from each head, in a few samples where the heads arrived intact;
the divergence of the scores for the progeny of each head give
some idea of the effect this easily underestimated sampling
error can have. Such a study should also rrake possible some
identification of the maternal genotypes, but the interpretation
of the data in this way was more difficult than v»n expected.
seed Hardness.
One factor which may bias the scoring of a seed sample is
the failure to germinate of hard seed. Xhese are the seed in
which the impervious layer developed in the testa is complete,
preventing the penetration of water, without which the seed can
neither swell to escape its coat, nor start to develop. The
proportion of hard seed is lower in commercial samples, partly
because of selection in previous generations for prompt germina
tion, and partly because of damage to the impervious layer

101
occurring during mechanical threshing. Wild samples intact
in the head or floret, and threshed by hand, are often 90 or
even 100$ hard when tested on moistened filter paper pads.
To obtain germination of hard seed some process of scari
fication is necessary to break the>^ impervious layer. Two
principal types of scarification are available; mechanical,
by abrasion, and chemical^ by treatment with a corrosive
material such as concentrated sulphuric acid. Abrasion by
rubbing with sandpaper can produce germination of every seed
in a sarrple (Chakravarty, 1963a); however it is reputed to
depend on the personal touch of the experimenter, and it would
be difficult to repeat a successful treatment when the treat
ment cannot be quantified. This is an important objection,
as a slight excesc of violence of any scarification treatment
beyond the amount needed to break the hardness of a seed can
produce damage ?nd death of the embryo. A quantifiable mechan
ical s car if icnt ion treatment was devised, consisting of shaking
the seed in a g") o s o screw-topped "bottle, carter-filled vith
silver sand, by means of 9 Ficroid ?lask ShgVer. The results
of the longest treatment of this kind, fifty minutes, are com
pared with various len<rths of sulphuric acid treatment in
table 5.1 which shows the experimental results obtained with
samples of commercial ^eed, including one vMc^ h?d been
previously discovered to show an unusually hi^ freiuproy of
hard seeds.

102
Table 5.1.
Material
Comparison of Scarification Treatments
Treatment Number Numberof seeds remainingtreated hard
3184 None (hardsample ) (Pre-dried)Acid:
overCaCl,
10 min.20 rain. 55 min.
403
150 UP 148
105
27 o
Percentageremaininghard
31 00
(normal)
Fone
Shaking
Acid:
Tone
3haking
Acid:
*
10 20 40
.
10 2040
(Pre-dried) over CaC/l«
50 min.
min. min. irdn.
50 min.
min* min.min.
Acid: 10 min. 20 min. 40 min.
299
2^2
148 99
134
310
290
152 138 159
147 158 148
35
32
10 2 1
42
33
10
12 9
11.7
11.3
6.8 2.0 0.7
13.5
11.4
2.00.7 0.0
8.2 5.7 2.0
26.1
18.0 6.1 4.1
i?rom these results it appears that the shaking treatment was
almost completely ineffective.
The 40 minute acid treatments showed a number of plants
damaged by the treatment, with brown radida® which did not grow,
although the cotyledons were green, and swelled, and the seed
ling escaped from the testa. The single treatment by which the
maximum proportion of growing seedlings could be produced would
seem to be 20 minutes acid treatment, and this was used for
most of the seed samples which were handled.

103
However, if repeated treatments were possible, and if the
maximum possible recovery of seedlings was desired, a series of
shorter treatments, perhaps 10 minutes, would seem preferable,
applied to the hard seeds remaining at each stage following an
initial germination without scarification.
3. Examination of Separate Heads within 3eed Samples.
A second problem arises in connection with samples provided
specifically for this work. These were often quite small, and
such small samples could most easily be collected by including
all the seed of a small number of heads. Therefore, although
the seed number might be quite large, and might represent a
similarly large number of pollen parents, they might represent
very few seed parents, and exaggerated values of rare genetic
factors would appear when a seed parent happened to carry such
a factor. A request was made that at least five heads should be
used; in the samples which arrived with the heads more or less
intact, they could be counted.
A few samples with the heads more or less intact were
grown up with each head kept separate, and points from these
results are shown below (Figures V(ii), V(iii)).
Variation between progenies of different heads within a
sample can have several causes, all of which may be involved
in the cases to be described. These are: Variation between
the maternal genotypes; Variation between the pollen popula
tions to which they were exposed, resulting from difference in
location or flowering time, or from the pollinating insect(s)
having visited few, perhaps unrepresentative heads to collect

pollen; Sampling variation in the production from diploid
parents of particular haploid gametic genotypes involved in
the fertilisations which actually produced the seed; and
inaccuracies in scoring. A larger number o^ he^.ds in the
sample would reduce the effect of the second cause, and a
larger number of seedlings derived from each mother plant
would reduce the third.
It was hoped that the progenies would fall into clear
classes according to maternal genotype. Using the total
progeny as a sample representing the parental population,
the frequency of unmarked plants may be take^ as an e stimate2 of v , where v is the frequency (presumed to be the same
in the progeny and the parents) of the recessive allele.
1 - v is then the frequency of all other alleles, and the
frequency of plants not containing the recessive can be
predicted to be (1 - v) . Only a proportion of these are
visibly double marked; let h be the proportion of thesep (1 - v) constituted by the observed doubly marVscl plants
in the progeny.
Considering mother plants l?ckin~ the recessive, a pro
portion v of their progeny will receive it fro- pol"! en parents,
while a proportion 1 - v will lack it, will have two active
marking alleles, and may develop double marks. If the
progeny of sufficient such mother plants ere combined, the
mean frequency of double marks should be h(l - v). However,
progenies of individual plants can be expected to ^ve

105
different values, depending on the probability of occurrence
in the pollen of alleles which will produce double marks in
combination with the alleles carried by each plant. i.other
plants carrying rare and distinctive marking alleles will
produce more double marked progeny, those with cociaon alleles,
fewer than the prediction for thy whole group.
The frequencies of the differently marked types of progeny
in the aggregate progeny of each type of parent may be predicted
as set out below.
.Cable 5.2. Predicted Phenotype Frequencies in Seed carried byCertain Katernal Q-enotypes.
Female £ype of ProgenyparentalGenotype Unmarked Simply marked Doubly marked
w v 1 - v none
Vv v/2 Kl-vMv+Hl-h)(1-v) 4-hd-v)
TV none v + (1-h)(l-v) h(l-v)
Among the heads in each class, the frequency of unmarked plants
should vary only as a result of variation in the frequency of
the various alleles in the pollen, and the effect of chance in
meiotic segregation; the frequency of double marked plants will
also vary from the above values according to the particular
alleles carried by the parent, and the predicted values are only
means for the whole class of heads. figure 7(i) illustrates
the predicted pattern of results.

106
Figure V (i). Theoretical MoiaT for No-Mark and Double-?Jark ;7 requencier,- in Progeny o? - ing^le Heads.
Arbitrary Valuas chosen for Llodel :
v = ? ; =0.25
<D
o0$ <D
I
= Means of C-roaps -4-. opulation ^
0-4
oIU0,
oe0$
10 txD
<Dtn
Ttt -wr O A
Progenie? of« vv motherF, proportion v of population.
Progenies of Vv mothers , proportion of p°P
Progenies of VV mothers, proportion (1-T/ of pop*
0-2 0-3 0-4
Frequencies of Double-marked seedlings from each head*
Lov/er freqtiencias of double marked progeny from mothers wi t h c ommond r a .11 e 1 a 5 »
Higher frequenoies of double marked progeny from mothers with rarer

107
O0!
§
o I,0,
fcf)doSOS
tn bO C •Hi- 1 TiO4>CO
4)^dt.
oCO®
•H O
3 rr* <b(x,
Figure V (ii)» No-^ark and Double-Mark Frequ.vicies in Tingle Heads.
(a) Sample N 45.
X Predicted ^roup Means.
® Means of Observed Groups,
Population Mean*
0 4
0 3
0-2
o-i
\
\\(4., 5)
\'*
(w)
\
W0 0-1 (4,0) (3^0)0-2 '^To) 0-3 (iT.o) 0«
Frequencies of Double-narked seedlings from each head.
Beside each point are shown the number of plants of each type (double-marked first) by which the point -was plotted, to give an indication of the sampling error*

Frequencies of Unmarked Plants
o£
o9K_>
0 C
—— t —— ̂ i(V•g
ca
O»t>
O Occr t-«0)
3 P 1K-ot•
to
Nl
P
GO
Ih-«nt-5>>IV3
<3
H«
»
« okP
o 6
Frequencies of Unmarked PlantsoKJ9OJ
o
01
O o
1=p 1cr
6H- (* CO
h*p03 H«
P CR
KAP PL CO
ROT

109
i'able 5.3. Data from scoring progenies of single heads,used in preparation of figures V(ii), V(iii;.
iTotation0 (Number of) plants with unmarked phenotype (w homozygotes) D (Number of) olants with double marks ft Number of plants in whole samplev = vw-x Estimated frequency of recessive allele
Ph = D/N(l-v) Proportion, showing double marks, of the calculatednumber of plants with two active simple alleles
(1 ) Numbers of Heads and °eedlings
(Loose seed, and heads with less than 12 seedlings scored, counted only in totals)
Number of heads Median seedlins
r:42 N43 145
plotted
11813
(2)
scored per head
183228
Kean seedlings scored per head
24.240.3 37.u
numbers of different types
Progenies with no 0 Progenies with 0
3umOther ..eedlings
Combined x'otal
T^P
N
74 175
2^9
17
266
c
33
333
36
D
912
213
24
N69
230
?9?23
322
N430
22 ~
1
23
D
^7
386
44
II130
'166
15
482
KM 5
0
rn -/ -
50—
50
jj
31 36'"'•7'•> i
8
75
(3) Calculations on whole samplesK D V =/T?
L
N45((^,v), i
266 322 481
l|h(l-v),iv,f A }v4; ^.o-^i
hole ^op.
3623 50
/ &.rr
or(i-v) 20.2260.2530.340
0.1430.1870.231
N42 N43
O.Oi/0 0.1350.137 0.0710.156 0.104
24 0.36844 0.26775 0.322
ind ^h(1-v),0j are the predicted class means) y-jftcies of Progenie3 plotted
V/ithout 0 itb 0 Progenies i> Progenies i) 0
3 0.122 8 0.171 0.0692 0.101 6 0.096 0.1355 0.238 8 0.149 0.107

110
The results for three samples in which the seeds from
each head were grown and scored separately are shown, plot
ting the frequency of unmarked against the frequency of double-
marked plants. The predicted values of these frequencies for
the three classes of mother plants are also marked, together
with mean frequencies for the whole population, and for the
heads appearing to fall into each class.
•"here is little indication of the progenies containing
both doubly marked and unmarked plants being clearly separated
from the progenies lacking one type (and plotted on one or other
axis), although there is some indication that the progenies
without unmarked plants have a higher frequency of double marks
than the progenies with both types. None of the progenies
observed seems to fit the expected class of progeny of an un
marked plant, with no double marked p.nd a hi^h frequency of
unmarked ylants.
A clearer indication of the possible effect on a population
sample of sampling variation when few female parentp are chosen
can be seen if rare, distinctive alleles are considered. A
generally low frequency would be expected in all heads, derived
from s low frequency of the allele in the pollen of the population,
but there would also be occasional heads with strikingly differ
ent hi ;̂ h frequencies, near 50 per cent, among the progeny, when
the allele was carried by the mother plant. T^ble 5.4 shows
the occurrence in the heads of sample N45 of phenotypes including
the broken, and broken-with-yellow-tip phenotypes, B and Y,

111
attributed to the alleles Vb and Vby .
2able 5.4. Frequencies of^rare marks in separate heads in thesame sample (N45) 4 <^ p ^-
Head r°tal Y B Y BSeedlings Seedlings Seedling? Frequency Frequency
A 24 0 0 -B 19 0 5 - 0.26C 17 0 0 -3 28 1 0 0.04a 70 o o -H 18 0 10 - 0.56J S3 0 0 -K 59 0 0 -L 42 0 0 -;: 43 9 8 0.21 0.19;; 20 o o -0 29 2 1 0.07 0.03C 14 0 0 -
Other 1£- . nseed 13Total 481 13 24 0.027 0.050
The riant bearing he?d H (possibly ^Iso that bearing head B),
would seem to be a heterozygote for V ; it is tempting to sup
pose that in progeny IX -?lso only one allele was involved, al-
thou,j;li confused in the scoring, the parent being heterozygous
for it. Tl:3 totalled progeny indicates a gene frequency for
the two alleles together of approximately 0.04. It is rather
eurprising that eirht of the thirteen heads, including the
three largest progenies, show no trace of these alleles. It
might be that each pollinator carries pollen from a very small
number of heac?s f in which case rare allele? would either be
entirely absent, or present at relatively high frequencies
within each head's progeny.

112
Livergen.ee of Forph Frequencies in Vegetative and Other Samples.
There is a source of confusion in the comparison between
seed and vegetative samples which i;: of greater biological
interest than the statistical problem described above. In
most cases only a minority o p ^eed wan damaged in scarification,
remained hard, or died after planting out: the Reed s:-nple is
thus relatively unselected compared to a "ample of genotypes
actually established in the field, and nay contain new recom-
binant genotypes which have never been exposed to most of the
selective factore affectinj this species. Jven in so tar as
selection in the germination phase represented a genetic dis
crimination, this would only be one, rather rlistinct^part. of
the selection experienced in nature. It is possible that some
plants could be established in the fi?ld and yet function very
poorly as seed producers, and any genetic factors predominantly
occurring in such plants would be underreprevented in a seed
sample. Cther _^?notypes mi~ht correspondingly maintain them
selves in the population by producing many need in spite of
mediocre vegetative performance, an^l they would be over-
represented in a seed sample. Any systematic difference in
the scores produced by tre two ^?thods could affect, for example,
the comparison between the ^ritish Isles (11620 out of 12232
scores are of ve^et?tive rraterial) with the rest of the world
(20530 out of 21041" scores are of seedlings).

113
Unfortunately no direct comparison of seed samples and
vegetative samples from the same population is available.
However, one comparison is available which would reveal some
of the factors which would be expressed by any difference between
seed and vegetative samples. As shown in 'fable 5.5, this
consists of comparisons between a random sample of leaves, and
a random s ample of inflorescences (that is, of the leaf -marking
phenotypes of the runners carrying particular inflorescences).
i'able 5«5»
Site
Blenheim 1
i;arston 1
Karston 2
l-larston 3
Karston 4
rlars ton 5
Comparison of frequencies of marked and unmarked plants in vegetative and floral samples.
i'ype of Sample
!; umber of marked
Number of unmarked
Percentage of unmarked
TOTAI
V?
V£
V'i1
VJ? 1
VF
VJ?Tf \i
j?
18?3
A 535
3229
2326
6056
4431
222200
178
94
11
64
74
56
4527
48.625. B
16.710.3
3.03.3
20.713.3
10.46.7
10.?16.2
16.8511.63
V: nearest leaf to sample point, or others on same stolon.
?: Fearest inflorescence to sample point followed back to find and score the leaves on the same stolon.

114
Overall, the difference between the two types of sample in
frequency of unmarked plants is not significant (0.2 >P> 0.1),
with more unmarked plants in the vegetative sample. If it
proved to be significant in a larger sample, it might be
because some weak plants flowering little if at all might
produce small leaves on vhich faint marks might not be expressed
clearly enough for recognition; such plants, occurring only in
the vegetative sample, could be scored as unmarked when they
should be scored as marked.
4. The Sample Unit: xha consequences of vegetative reproduction on the concept of the individual.
She capacity £or vegetative reproduction by stolons which
this species has means that each genotype can not only survive
over long periods, but parts of it may come to be considerably
separated in space, and the clone may at the same tiine increase
considerably in size. At any time a population will contain
clones of very different sizes and degrees of dispersion. It
would be very difficult to sample in a way that would give each
genotype an equal chance of being represented; even if repeated
countings of the same genotype could be eliminated, it would be
impossible in a sample, as opposed to a complete population
study, to eliminate the greater chance for a small clone of
being omitted from the sample. Different clones interpenetrate
even when intact, the physical connections between parts of tie
same clone quickly disappear, and parts of the clone might lie

115
separated by an area from which the clone was absent (cf.
Harberd, 1963). Genetically identical stolons could only be
identified by an elaborate comparison of genetically controlled
characters after growth under standard conditions, particularly
by identity of self-sterility alleles leading to mutual steril
ity between parts of the same clone (cf. Ilaruera, 1958, 1961;.
j.ven if such a sample of genotypes was possible, it would not
represent a single set of zygotes, but a selected set of zygotes
derived in different numbers from many years' production of seed.
The sampling methods which may most easily be devised
sample leaves, and a clone's chance of be in; included in the
sample therefore depends on the number of leaves it carried.
Increase in size of a clone represents a positive selective
adjustment within the population as much as diminution or
elimination of another genotype represents a negative effect
of selection - the clones represented more than once in a sample
are probably those whose large extent reveals their successful
adaptation to the environment. 3uch a sample is therefore
one phase of selection further on in the life cycle than the
seedlings from which it arose, and this selection represents
part of the selection which will determine how much seed will
be produced; all other things being equal, more seed will be
formed on the larger plants, and in so far as a leaf sample
gives different representation to larger and smaller clones,
it is providing a prediction of the effect variations in size
will have on the next seed population.

116
It is worth noting however, that iardy-Weinberg type
calculations of allele frequencies have less validity when
applied to such a sample than when applied to a set of seed
produced at the same time and unselected. Heterozygotic
advantage, one of the classic factors producing stable poly
morphisms, would have its maximum effect in a «am pie which had
been exposed to selection at all stages from fertilisation to
vegetative maturity. ouch a sample might include a higher
proportion of the heterozygotes than random assortment would
predict.
Although a leaf sample may be regarded as adequately
representing the population, the study of variation in clone
size remains of interest in connection with the comparability
of seed and vegetative samples. Knowledge of the extent of
variation in clone size would indicate the scale of importance
of one of the processes by which an established vegetative
population would come to differ from the populations of seed
lings from which it was derived. Study of clone size would
also provide information about the possible achievements of
vegetative reproduction. tohere there is continuity in time
and space, the functions of persistence and dispersal could be
carried out in this species by purely vegetative means. It
certainly seems likely that in a dense grassland community,
so long as there is little disturbance to produce open bare
soil, establishment by newly germinating seedlings may be very

117
rare indeed. In such a situation, which might be semi
permanent, a seed sample would not be a part of a cycle,
providing a preview of the genetic material of a future popula
tion; and genotypes might become widespread in the population
which had very low sexual fertility, and which therefore would
make little contribution to a seed sample.
The species is variable enough that many clones can be
definitely seen to be different on a very rapid examination,
and a population of plants growing in the same environment can
be divided into a number of phenotypic groups different from
each other, each of which may consist of more than one, or of
only one clone. Although the possibility that two similar
plants are not the same clone cannot be dismissed until after
prolonged growth under standard conditions, and demonstration
of identical S-allele genotypes producing mutual sterility,
the distribution of such apparent clones provides at least an
indication of the results which might be obtained from a more
thorough study.
Even if plants of a species mapped are described in only
two genotypic classes, knowledge of the size of patches of each
type is one step towards estimating a lower limit to mean clone
size (though the interpenetration of different clones may con
fuse the picture). The opposite approach to the problem of
clone size and age is provided by studying physical connections
between growing systems and deducing past connections from the

118a
orientation of living material. The most intensive study of
this kind known to me is that of Prime (1955a). Apart from
Harberd's work (1961, 1962, 1963), other noteworthy studies
on vegetative reproduction and persistence in plant populations
are those of Soyrinki (1938, 1939), Lieth (i960) and Tamm (1964).
A brief study on this topic was carried out by the author
on a dense patch of clover near a gateway in a field at the
Oxford University Farm, Wytham. The scarcity of grass may
have been due to trampling and puddling of the soil by cattle
passing through the gate during the previous winter, and if so,
some or much of the clover may have been Bcent seedlings (the
observations were made in mid-May). Whatever its origin, the
density of clover made this a rather unusual area, but also
made it suitable for this investigation.
The area, 3.0 x 1.2 metres, was divided into 360 quadrats,
10 cm. square. In all, 19 apparent clones could be distin
guished, by examination of leaf mark, leaf colour, and leaf
size and shape. The phenotypes occurring in each quadrat were
recorded. The results are summarised by rable 5*6, and illus
trated by Figures V(iv) and V(v). The results show a very
great variation in the size of the apparent clones, and also
that the distinct phenotypes interpenetrate quite freely.

118b
Table 5.6. Mapping of Apparent Clones.Number of
Area: 3.0 x 1.2 metres Designation quadratsof phenotype containing
360 x 10 cm. sq. quadrats each clone
6 314Distinct Number of Number of 8 139Phenotypes quadrats records 1 110per quadrat 15 46
4 360 0 0 13 191 89 89 18 172 176 352 5 153 75 225 11" 144 19 76 14 95 1 5 11 f 8
«•«——» __•»«_ 1O *7
360 747 17 47 210 216 23 19 1
19 1
19 pheno- 747 records types

119
Figure V (iv) .
Distribution of Apparent Clones of Trifolium repens Area mapped: 1.2 x 3.0 metres, in 10cm. sq. quadrats^
-X- •x=x- •-X---X - . -
X • • •
• • •
. . . .
- • --X
-----XX
- • - • -X-
. . - . .
. . - - _ .
. . - - . .
- -x-xxx
Key to Map of Clones /Quadrat
1 clone2 clones
- 3 clonesx 4 clonesH 5 clones
xxxxxxxxxxxxxxxxxxxxxxxxx xxxxxxxxxxxxxxxxxxxxXX XXXXXXXxxxxxxxxxxxx xxxxxxxxxxxxXXX XXXXXXXxxxxxxxxxxxx xxxxxxxxxxxx xxxxxxxxxxxx xxxxxxxxxxxx xxxxxxxxxxxx xxxxxxxxxxxx xxxxxxxxxxxx xxxxxxxxxxxx xxxxxxxxxxxx xxxxxxxxxxxx xxxxxxxxxxxx xxxxxxxxxxxx xxxxxxxxxxx
XXXX XXXXXXXxxxxxxxxxxxx xxxxxxxxxxxxX XXXXXX X X XX XXXXX X XXX XXX
XXXXX XX X XXXXX XI
Clones /Quadrat Clone 6
X X XX XxxxxXXXXXXXXXXXXXXXXXXX XXXXXXXXXXX XXXXX XXXXXXXXXXX XXXXXXXX XXXXxxxxxxxxxxxx xxxxxxxxxxxx xxxxxxxxxxxx xxxxxxxxxxxx xxxxxxxxxxxx xxxxxxxxxxxx
XXXXXXXXXXXXxxxxxxxxxxxx xxxxxxxxxxxXXXXX XXX X XXXX XXXX XX XXXXXX X XXXXXXXXxxxxxxxx xxxxxxxxxX XXXXXXXX
XXXXXX XXXX
XXX XX
XXXXXXXX XXXXXXXXXXXXX
XXXX XXXXXXXXXXXX XXXXXXXXX
Clone 8 Clone 1 Clone 15

120
Figure V (v) .
Distribution of Apparent Clones of Trifolium repens . Area mapped : 1.2 x 3.0 metres, in 10 cm. sq. quadrats.
x xx xxx xxx x xxxx xx x x x xXX
XXXX X X XXXxxx
XX
xxxxx xxx
XXXX XXX
XX X X
xxxxxxxxx
xxxxXX X X
Clone 4 Clone 13 Clone 18
XXXX
XXXX
Clone ll f
Clone 11"
XX XXxxxxx xxxxx
XX X Xxxx Xx xX XtxX
Clone 5
X XClone xxx 14
X
Clone17
Clone 12
xxxX X XX

PART 3
POPULATION SAMPLING

121
CHAPTER VI
>iATERIALS AND METHODS
1. Sources of Material and Data.
The intention of the work was to combine the study of
vegetative samples collected and s cored in the field in Britain
with the study of the plants grown up from seed samples obtained
as widely as possible in the species* range overseas. Requests
for seed samples were made to Universities, Agricultural Research
Departments and FAO Representatives in a large number of coun
tries both in the species' natural »nge and in areas of recent
introduction associated with man. The requests were made by
means of a circular letter of the type described by Daday (1954a),
requesting five or more seed-bearing heads of T. repens from
ecologically differing sites around the area in which the
person addressed was working. Samples were to consist of
plants which were wild or established as wild, and a request
was made for information about the nature of the Habitats
chosen. The response varied, from close adherence to the
terms of the request, to the sending of packets of commercial
varieties or of other species, or to no reply at all.
Because of limitations of time, materials and space, not all
the material received was used. An attempt was made to
obtain a balanced coverage of the natural singe (especially
of areas not covered by samples obtained from other sources

122
described below), and the samples not used were mostly from
areas where there were many other samples, or from outside
the natural range.
Vegetative samples were collected around Oxford and on
field trips to North-East England, Yorkshire, the East Midlands,
Sussex, and North Wales. They were taken from agricultural
land as well as from more natural and less disturbed habitats,
but the samples were mostly taken where it seemed likely from
the appearance of the land that ploughing had never occurred or
would have been impossible because of the steepness or irregul
arity of the ground, or where local enquiry obtained information
that the land had definitely not been ploughed to 12ie informant's
knowledge.
During the course of the work opportunities became avail
able to include data from two other sets of samples. The first
were plants grown at the Agricultural Institute, Oak Park,
Carlow, Eire. These were many samples of widespread origin,
mostly obtained through the United States Department of
Agriculture Plant Introduction Service, and intended to provide
material as a basis for a selection programme for early growth
in spring. I was able to score these plants in person during
a week's visit to Carlow, and to obtain information, there and
from the U.S.D.A., about tj» origin of the samples. This
always gave the country of origin, but often no more details.
The second set of material was data recorded by the
staff of the Welsh Plant Breeding Station on a number of samples

123
grown there over the last ten years, comprising both seed and
vegetative material from a wide variety of sources, mostly
outside Britain.
Cultivated strains were not included in the seeds used in
Oxford, but both the Carlow and W.P.B.S. collections contained
some samples which were definitely of cultivated origin,
and many more of uncertain origin which may well not have been
wild. Many of these were probably local varieties selected
only on a bulk basis, and probably representing the effects of
the local natural selective forces fairly well. Exclusion of
all the cultivated and doubtful varieties would have meant a
considerable reduction of the amount of data, and particularlyJ
of its geographical coverage/. The only samples omitted there
fore have been cultivated strains within the British Isles, for
which area more samples are available with fuller backgrounds,
and cultivated strains which had been grown outside their region
of origin, and therefore did not represent an equilibrium with
selective forces of any area.
The scoring system used by the Welsh Plant Breeding
Station is based, like my own, on the reports and terminology
of Brewbaker and Carnahan, and differs mostly in the retention
of discrimination between high and low simple Vs. The
following table describes the results recorded in Oxford by
myself and at the W.P.B.S. for three seed lots, obtained from
the FAO, of which material was received and grown in both places.

124
The results show that the two scoring systems do not produce
incompatible results. The phenotype labels are my own and
represent a 'translation 1 of those initially used by the
W.P.B.S. whose discrimination between L and H is also ignored.
Table 6.1. Comparability of author's and W.P.B.S.Scoring.
Comparison of phenotype distributions in samples from the same
batches of seed scored at Oxford, and at Aberystwyth by W.P.B.S.
staff.Total 0 L+H LL Y LY FT F LF
Belmonte - OuardaPortugal Oxford N4 99 20 47 1 20 8 1 - 2PAO 3584 yp-Bg 2777 49 e 32 -9----
RamadaPortugal Oxford N5 71 -59 8-2-2MO 3608 wpBS 27?8 go -44 16----
Kout s ouf lianaGreece Oxford N6 71 - 50 18 3 -FAO 3642 WPBS
Table 6.2 summarises briefly the contributions made by the
different sources mentioned. A fuller table in Appendix I
breaks this down in more detail.
The term 'sample' throughout refers to a group of plants,
or the seedlings grown from a group of heads, collected in the same
area by the same person on the same occasion. The word 'sample'
always refers to a set of plants (in two or three cases only, a
collection consisting of a single plant, or from which only one
plant survived to be scored).

125
Table 6.2. Summary of origins of the material providingdata.
Numbers of Samples Plants
Vegetative samples, scored in the fieldin Britain 192 9497
Vegetative material grown in greenhouse andscored by author 23 377
Seed t mostly foreign, grown and scored inOxford 72 6504
Vegetative material from 8. Ireland, scoredat Carlow 19 900
Seed, mostly foreign, scored at Carlow 172 8928
Vegetative material, mostly British, scoredby W.P.B.S. 55 1136
Seed samples, mostly foreign, scored byW.P.B.S. 153 6034
Total 685 33273
2. Procedures used in Sampling
i) Collection of Vegetative Samples.
The aim in choosing the plants for these samples was to
obtain a fairly random and representative sample with a minimum
of time-consuming complication, so that samples could be collected
from as many sites as possible.
The quickest method, chosen for most of the samples, was
to walk irregularly within an area of twenty or thirty yards
across, stopping at regular internals (every second, third or
fourth pace) and studying the leaf nearest to the tip of the
forward foot when one halted;, if there was one within a two-

126
foot diameter circle in front of and touching that point.
If the phenotype was not clear, and particularly if the plant
appeared to be unmarked, the stolon bearing the leaf was
followed back until other leaves had been found which made a
more certain decision possible. A sample of forty or fifty
plants was generally aimed at, though smaller numbers occur
where the species was hard to find, or shortage of time limited
the extent of the search, and larger ones where more time was
available and no alternative second site was available. In
some cases the path followed was more extensive and regular,
especially if there was some indication of heterogeneity in
the area of vegetation chosen. Where such heterogeneity was
very marked, or where the results of the scoring suggested
heterogeneity whether anticipated or not, soil samples were
taken separately in the different areas.
ii) Description and Measurement of Fnvironmental Factors.
Soil samples were collected, and pH values obtained, for
about two-thirds of the sites sampled. Turves approximately
one inch cube were cut out and brought back to the laboratory.
Duplicates were collected from the sites near Oxford for which
pH values were quoted, and at Aberystwyth; pH values were then
obtained separately and averaged. Soil was obtained from the
underside of these turves, corresponding therefore to a depth
between half an inch and an inch in situ. A record was kept
of the colour and texture of the soil.

127
For estimation of pH f a small volume of soil was placed
in a glass tube, and an approximately equal volume of distilled
water was added. The mixture was shaken thoroughly and allowed
to stand. The liquid was then poured into the sample holder of
a battery-operated portable pH Meter (Analytical Measurements
Ltd., Richmond, Surrey), and a reading to one tenth of a pH
unit taken after thirty to sixty seconds when the needlfe had
stopped moving.
One possible source of error in these values arises from
the length of time the samples were kept before scoring; often
several cays, sometimes up to a fortnight. Those from Horth
v*ales, particularly, were mostly very damp when collected, and
were kept for about a fortnight in more or less air-ti^at
conditions before scoring. Their low pH values could be partly
due to the accumulation under these conditions of carbon dioxide
produced by decomposition of organic matter.
The location of the site as a grid reference to the nearest
tenth of a kilometre, and the altitude, generally to the nearest
ten feet, were recorded for all samples. Notes of a more
qualitative kind were also taken of the steepness of slope,
aspect, and degree of shelter or exposure of the site, of any
indications of water shortage or excess, of the type of vegetation
with some details of associated species, of the type of agricul
tural treatment, and if possible of the kinds of large grazing
animals on the site.

128
(iii) Procedure used in Handling 3eed Samples.
tohen the sample was larger than about 100 seeds, only
about that number were used. Where there were distinct heads,
an attempt was made to produce a representative rather than a
random sample by taking a group of florets from each head.
In accordance with the results of the seed scarification
experiments described above, a scarification treatment of 20
minutes was used on the seed samples, and repeated on any hard
seed left after the germination treatment. This consisted of
exposure to light and warmth on moist filter paper pads in petri
dishes covered with a plastic cover with a ventilation hole.
The seedlings which germinated were plated out, usually with
the cotyledons fully spread and about half an inch of root,
into seed boxes at a spacing of approximately 1-J- inches. A
certain number died because of slug damage, and through drought
when watering arrangements failed. In some samples the number
of survivors was reduced to less than a quarter.
Final scorings were not carried out until nearly all the
plants had produced at least six leaves, by which time many
plants had begun to produce stolons.
3. Scoring and Expression of Results.
a) Initial Scoring.
Scoring was carried out and described basically in terms
of the phenotypes attributed to the alleles described by
Brewbaker and Carnahan, as shown in Table 6»"5 (cf. Table 3.1»

129
page 42 above).
Table 6.3. Correspondence of Allelic Symbols and PhenotypicSymbols used in Scoring.
Allele v V1 Vh Vby Vb Vf Vba
Phenotype 0 L H Y B F Ba
Double phenotypes are described by a combination of two of these
symbols: e.g. LY, LBa, IP, presumed to be respectively VV y ,v1vba , vVy.
The hardest discrimination was between Y, and B or derived
phenotypes. The class Y was used to include all cases, with or
without a yellow tip, if the mark was white rather than bluish,
and if the inner end of the mark tapered, approached more than
half way to the midrib, and appeared to lie on a relatively
acute V, especially near the midrib. For some marks with a
clear colour difference between a yellow-greenish tip and
bluish silvery wings, the choice between Y and BL had to be
decided, sometimes with great difficulty, according to whether
the central yellower portion had distinct wings or was only a triangular tip. (4 pt^r <Wl«fi c^ p r S2-Sl)
Many plants, while showing traces of f illing-in - the
colour proximal to the mark being paler than that distal to it
- seemed much closer to the V phenotype than to the
phenotype as previously described. These were at first scored
as Lf , but have all been classed as F below.

130
It became clear early in the scoring that the clear
distinction of a class of high simple marks, suggested by theTti T
reported existence of only V (high) and V1 (low) and perhaps
If" (intermediate) marks, was impossible to apply consistently,
and that if the simple mark phenotype was to be divided at all,
many more forms would have to be distinguished. The distance
separating the marks in some double-marked forms ms less than a
quarter of the separation in others, which seemed to be con
clusive proof of heterogeneity among what was called the L class.
All simple marks appear together as L, and all double marks
combining two simple marks as LL.
Notes were made of unusually high marks , though it is
not claimed that there was a consistent standard. In the
Carlow scorings, a class of !„ marks was described as well as
H, In the Oxford seedling scorings, each nark was described
in terms of position, shape and intensity. The position scores
were in five grades, 1, 1-m, m, m-h, and h. The H description
occurred quite frequently in the W.P.B.S. scoring system, and
area by area, a closer fit to it was reached in the other two
groups of samples by including the intermediate as well as the
extreme class. The H frequencies appearing below are therefore
a combination of the three different (and possibly internally
inconsistent) standards. Very few scores of high marks were
made in the British field samples, and these samples are omitted
from the H-frequencies, as these low values represent

disinclination to use this rather vague description at least
as much as a possible real low frequency.
Corresponding to Brewbaker and Carnahan's 7P allele
(V-point) the w.P.3.3. scoring system distinguished a pheno-
typic class P, which has been added into the L class in the
tabulations below of the data obtained from W.f.B.3. records.
The possibility of a clear dividing line seems to be even less
than between H and L, and no attempt was made to use this cate
gory in the majority of my own scorings.
Other details noticed in scoring or in plants kept as
specimens of unusual phenotypes concern very rare phenotypes,
and are not presented below, details of the examples of these
phenotypes having been given above. These include the marginal
phenotype, incorporated with the totals for the broken pheno-
type in the two Italian Alps samples in which it appears, some
relatively distinctive simple marks, included in scores below
as L, and a number of anthocyanin-mark phenotypes, including
those associated with the V y allele.
b) The possibility of Calculating Gene Frequencies from the Data.
The simplest case is that of rare alleles whose expression
is assumed always to be recognisable. If they are rare, vir
tually all plants recorded as showing them will be heterozygotes,
and a close estimate of gene frequency can be made by halving the
phenotype frequency. A frequency £ of a dominant allele
produces phenotypee showing its presence with a frequency of

132
? p 2p(1-p) + p = 2p - p . If ^ is small, this expression is
approximately equal to 2p. The inaccuracy in estimation of
gene frequency in this way is an underestimate of the true
frequency by a proportion of the true value p/2.
For a recessive allele, the frequency of the gene can be
estimated as the square root of the frequency of the recessive
phenotype. In this case, the unmarked phenotype has a fre
quency generally below 30 per cent, and this means that estimated
gene frequencies are considerably larger than the frequencies of
the recessive phenotype, which may be based on a count of only
one or two plants; the transformation to gene frequencies
greatly exaggerates the effect of this sampling error.
The frequency of a frequent dominant allele cannot be
accurately estimated by a simple halving, as above. It must
be calculated by grouping all the other alleles as a single
class of recessives, and calculating their frequency as the
square root of the frequency of all phenotypes not expressing
the allele in question. The estimate of the dominant allele's
frequency is the difference between this figure and unity.
The same procedure can be used for a group of alleles together,
for example the whole class of simple V-alleles. It is possible
in principle to treat all the alleles in this system as dominants
except the no-mark allele, since the heterozygotes between the
other alleles are mil supposed to express both alleles they
contain. However, there is evidence that this does not happen

reliably in practice in respect of the heterozygotes between
V y and at least the simple V-alleles, these two classes
together accounting for the vast majority of phenotypes other
than the unmarked types. Since it is not possible to regard
VI as dominant in plants carrying V ^, a frequency estimate for
V can only be made among the other plants. (V^y is not so-
common that this means an important reduction in the accuracy
of the estimate.) This provides an estimate of the frequency
of x among alleles which are not V y , and the appropriate
correction must be applied to this figure if it is desired to
express V frequency in the whole population.
c) Choice of Phenotype Frequencies as Basis for Present ation and Statistical Analysis of Data.
The greatest source of inaccuracy in the conversion of
this data to gene frequencies is the exaggeration of sampling
error in estimates of the recessive allele's frequency on the
basis of a small number of plants. This results from the
square root transformation needed to convert phenotype into
gene frequency, and the error is at a maximum in the range of
frequency of the recessive with which we are concerned.
Because of this and of the complexity of the calculations
needed to determine the other allele frequencies, the total of
all estimated frequencies often shows considerable divergence
from unity. The calculations also involve unproven assumptions
about random mating and random sampling, and indeed about the
whole genetic system controlling these markings.

134
It was therefore decided not to use gene frequency cal
culations where avoidable, and the frequency figures presented
below and used in the statistical analysis are basically
frequencies of phenotypic classes. Seven morph frequency
parameters have been used. The first is the frequency o.f the
unmarked form. The next four are the frequencies of all plants
showing respectively the broken-with-yellow-tip, the broken,
the basal, and filled-in marks. That is, the 'Y f figure ia the
summed frequency of Y, YL and YH, IP, etc. The terms Y, 3, Ba
and F are used inclusively in those cases where double marks are
not referred to separately. As was pointed out above, for rare
dominant alleles these phenotype frequencies are close t o twice
the gene frequencies which could be deduced from them, and so
any conclusions drawn will be virtually the same, with the
saving of an elaborate mathematical step of doubtful soundness.
All plants appear in one of the above classes, or in the scores
from which the L class below is derived. The marginal and
derived phenotypes are counted as contributing to the B class.
The last two parameters are less simply derived, but are
intended to describe the frequency of the simple 'L 1 marks, and
of the LL double marks between members of this class. In both
cases allowance has been made for the partial dominance of V y
over V1 , as a result of which a proportion of V yV plants are
believed to have been scored as Y rather than YL. (Some
evidence for this dominance has been presented above, and more
will be presented in the next chapter.) The measure of L

135
frequency stands seventh, and consists of the frequency of
plants showing one or more L marks among the plants not
showing By marks. Any YL scores therefore do not contribute,
and LL plants are only scored once, while other double mark
plants, e.g. LBa, IF, are counted twice, once in this and once
in another group. Dhis measure of L frequency refers to
frequency among the class of marks excluding By, rather than
to absolute frequency in the population. It also distinguishes
and separates, better than a direct L frequency meaaure would,
the distribution of L from that of 0. In about half the
samples these (as fractions of N) are each other's complements,
and together include all the sample, and therefore map virtually
the same distribution pattern, one positively, the other
negatively.
Standing sixth is the figure representing the frequency
of LL scores. This is conceived to represent the amount of
diversity among the alleles in the L class, in a way that would
depend on frequencies of distinctive alleles as well as the
number of different inter-allelic combinations which could
produce recognisable double marks. It is calculated by
expressing the observed number of double-L plants scored in
a sample as a proportion of the calculated number of plants
containing two alleles in the ]r~ class. This was decided
after it was noticed that there was a lower proportion of LL in
samples with high frequencies of 0 (the unmarked type). This

136
can be seen from the scatter diagram in Figure VI(i), which
shows 0 and LL frequencies for the largest samples. This
negative correlation was attributed to presumed high frequen
cies of recessive alleles concealed in other phehotypic classes
such as L (containing Vrv plants as well as Vf*V ). However
heterogeneous the alleles classified as ]H were, few or no
double marks would be seen if most of them were combined only
with the recessive? the test whether two V alleles are
different enough to produce a recognisable double mark only
arises when they are combined together. The calculated figure
is still a very complex derivative, depending on the frequencies
and degrees of distinctness of some unknown number of alleles,
but by this treatment the contribution to it of the frequency
of the unmarked allele at least is allowed for.
Allowance is also made in these calculations for the
effect of dominance by V y . If X is the number of plants not
showing a By mark, and "ff is the number showing neither a By
nor an L mark (mostly unmarked), the frequency of the jr" allele
group among the non-By plants (and among the non-7 ^ alleles)
can be estimated as 1 - JTIW • ^he square of this is then
a prediction of the frequency, again among non-By plants, of
]rT*- plants. Multiplying this by the number of non-By plants,
?, gives a divisor which can be used to derive a frequency of
double marks among this number, from the number of double marks
actually scored. The final expression for LL frequency is

0.7
oE! 93 cr
0-6
137Figure VI (i)
Frequencies of Unmarked and Double-marked Seedlings in all samples of 90 or more.
To show fall-off in LL frequencies whan 0 is frequent, indicating the need to apply a correetion to figures of LL frequency*
• British FieldSamples (Vegetative)•
Seed, Grown at:• Carlow A W.P.S.J.
Oxford
r/"
G•H
V)
I °'4 i-\
^
(0
b
r0.3
-tFrequency of Double-Marked Plants in Sample.

138
thenLL
K. (1 -which is the proportion, among the calculated number of plants
carrying two jr* alleles, which are scored as double-marked.
For an 0 frequency the same as the overall mean, this would be
two or three times the directly expressed frequency of LL plants
in the whole sample. Figure VI (ii) shows a plot of the same
samples as Fig. VT(i) after correction.

1 3->
Frequencies of Unrarked and Corrected Frequency of Double-Marked Seedlings in all Samples of 90 or more.
c•H
(C•PadrHPL,•d <D
«Mo
oIoJL.
0 7
0 6
05
0 4
0-3
02
01
•i .
y.
For comparison with the preceding figure to show the effect of replacing
LL by ^ r LL_____
British Field Samples(Vegetative),
^•eedj groTSft at:Car 1 or.'W.P.B.S. Oxford
01 0-2 03 0-4
Frequency of Double-Marked Plants - Corrected,

140
CHAPTER VII
RESULTS I. INTERNAL COMPARISONS OF SAMPLES
1. Generality of Polymorphism, and Occurence of Unmarked Type.
Some conclusions can be drawn from a study of the sample
data before attempting to investigate correlation with environ
mental factors.
The first notable feature is the generality of the poly
morphism, as shown in liable 7.1* only six samples provide
serious evidence of uniformity.
Table 7.1. Numbers of Uniform and Polymorphic Samples
All samples Samples Uniform of 10 or more larger than 30
All unmarked 1 1
All marked: Ko variationbetween marks 14 5
Polymorphic
All marked: Several different 5g ,omark-types
Unmarked and marked (one ormore types 551 present together) ___
Total 624
Figure VII(i) shows the distribution with regard to the frequency
of the unmarked phenotype. It is absent in 72 out of 624
samples, as the table above shows, and all mai?I:s are absent in

141
VI•H
F7V / /'////
00
0} -P S03
rH
CD
f;crj
O
r!
C71 CD
£
• An T TI q u 1,1 TV A rv J
o o
oo

141
one. The mode of the distribution lies at a frequency
between five and ten per cent. The overall frequency among
the grand total of all the plants sampled is 17.3 per cent.
Slightly more than half the samples fall below 15 per cent fre
quency, eighty per cent below 30 per cent frequency, and only
five per cent exceed 50 per cent frequency of the unmarked form.
2. Evidence for Effective Dominance by the By Allele.
A conspicuous feature of many samples which include plants
with the broken- with-yellow-tip mark is the small proportion of
these plants which show double-marked phenotypes combining the
By mark with another mark. The By mark, when present, rarely
exceeds 1© per cent frequency, and over such a frequency range
an allele would be expected to occur predominantly in a hetero
zygous state, and in most samples, half or more of such hetero-
zygotes would be with other mark-producing alleles, and could
be expected to show double marks.
To express this deficiency precisely, it is necessary to
make calculations of gene frequencies, though bearing in mind
the assumptions necessary for such calculations, and the
qualified significance of the conclusions, as discussed above.
To simplify the situation, we can describe the population
in terms of three alleles; V y producing the broken mark with
yellow tip, v, the recessive allele producing no mark, and V
the commonest simple V representing all other alleles producing

143
other marks. There will then be four phenotypic classes,
produced by the genotypes shown in Table 7.2.
Table 7.2. Summary Classification of Phenotypes and Genotypesin connection with possible Dominance by V y over V and other alleles.
Phenotypes Genotypes
0 w
L V-W, V1V1
Y Vbyv, VbyVby ; and V^V1 (by dominance)
TL V y V (when dominance not effective).
The frequency of the recessive allele can be calculated as the
square root of the frequency of the 0 phenotype. For V y , as
top dominant, the calculation is slightly more complicated.
If X represents the number of plants not showing the V y mark,
and N the total number of plants » in the sample , /X/N is the
frequency of all alleles except V y , calculated from the frequency
of 'homozygotes 1 between these 'recessives 1 . i'he difference
between this and 1 is the estimate of V y frequency. An
estimate of ]r" frequency is then available as the remainder
when the sum of (v) and (V y ) is subtracted from 1 . ^rombv 1 these values one can calculate predicted frequencies of V Jv
heterozygotes, expected to show double marks, and of the other
V y derivatives expected to show the Y phenotype, V y V y and
V yv. figure VII (ii) shows the proportions of double marked YL

144
Figure Yll(ii)
Predicted and Observed Frequencies of 'YL 1 Phenotypes among
all 'Y 1 Phenotypes.
This graph plots all samples with 5 or more plants
showing a mark of the 'broken-with-yellow-tip 1 type, whether
alone or combined in a double mark.
The purpose of it is to display whether the number of
double marked By-derivatives predicted by gene-frequency cal
culations in fact appears, or whether there is generally a
deficiency, which could be attributed to some VyV hetero-
zygotes being scored simply as Y, as a result of some kind of
dominance by Vy .
Calculation of Predicted Proportion
Data; N = Total number of plants in sample
0 = Number of unmarked plants
X = Number of plants not showing any By mark.
Estimated Allele Frequencies;
(v) = /0/N Recessive for no-mark
(Yy ) = 1 - /X/N Dominant for By mark
(V1 ) = 1 - (Vy ) - (v) All others, mostly V1 .
Prediction: - _——PrMHtnethummed Frequencies (VyVy ), (Vyv),
2(Vy )(V1)_______ = (V1 ) (Vy ) 2-f2(Vy )(v)-f2(Vy )(V1 )

145
Figure VII (ii)
Predicted and Observed Frequencies of 'YL' Phenotypes among all 'Y' Phenotypes
KeyHollow Symbols :Samples without unmarked plants
• D Carlow SeedA A W.P.B.S. Seed+ O Oxford Seed• British Veg.T Giessen Veg.
0.0 o-i 0-2 0-3 0-4 0-5 0-6 0-7
Predicted Frequencies
0-8 0.90.0
0

146
phenotypes, among the total number of plants showing any
phenotypes attributed to V y, (Y + YL), observed values being
plotted against predicted ones. To permit reasonably accuratebv estimates of V J frequency, the data is restricted to samples
containing 5 or more plants showing the phenotypes Y or YL
(including YF, YB etc.).
When the frequency of the recessive is low, its estimation
by this method is inaccurate, and it is possible that in most
samples where it is not recorded it may be present at a frequen
cy as high as 10 per cent (1 per cent recessive homozygotes
would more often than not fail to be found in samples of less
than 50). Using an estimated frequency of zero in the cal
culations would increase the proportion of YL plants predicted,
and increase the discrepancy between observation and prediction.
Points based on calculations assuming zero frequency of the
recessive are therefore distinguished in the plotting.
Table 7.3 summarises the distribution of the points
plotted in the figure, and the conclusion that there is effec
tive dominance of V ^ over (many) other mark-producing alleles
is inescapable, and is not affected by counting out the samples
without unmarked plants* This dominance need not be produced
entirely by suppression of the clarity of the second mark,
Especially on smaller leaves, two marks may lie so close as to
overlap, and a simple V could be taken for part of the white
broken V, or as a rather extensively developed yellow tip.

147
Table 7.3. Deficiency of YL Phenotypes (Double Marks derivedfrom Vby .
Samples with 5 or more plants showing Vby mark (Y and TL)
Samples with atleast one un- All samplesmarked plant
No YL plants at all 8 9
0 - 5($ of predicted 12 15
50-100$ of predicted 16 21
Less YL than predicted 36 45
More YL than predicted 6 6
rhis apparently single mark would then be scored as Y because
of its double colour and structure. (If any appreciable number
of these had been scored as L, the effect shown here would dis
appear or be reversed.) However, the simple marks lie in a
wide range of positions, not all of which would neatly overlap
with the By mark* iJvidence was also mentioned abcve^that the
simple mark in recognisable YL plants is often unusually faint,
and could often come close to being mistaken for an extended
yellow tip with wings running below the white part of the mark.
It therefore seems probable that a truly suppressive dominance
does exist, and plays some part in the effect shown here.
It would be difficult to explain these results by challen
ging the assumptions made in calculating gene frequencies,
except possibly by a systematic deficiency (in seedling samples

148
as well as field collections exposed to selection) of unmarked
homozygotes, leading to underestimation of the frequency of the
recessive allele. A failure of random mating would have to
be in the direction of assortative mating among By plants,
leading to an excess of V yV y homozygotes, whereas the lowv»__
frequency of V y suggests selection against them. An explana
tion by selective loss would mean low fitness of most types of
heterozygote of V y , which is hard to reconcile with the
presence of this allele, at low frequency, in about 40 per
cent of the samples.
3. Interrelations of Different Morph Frequencies.
It was felt that it might be possible to find some kind
of pattern among the different morph frequencies, one morph
tending to occur with, or to avoid, another. This would imply
that some causal sequence ms operating and needed explanation,
even if no environmental correlations could be found at all.
Morph frequency figures (seven variables, cf. Chapter VI,
Section 5(c)) were prepared for all samples of 25 or more, with
out any combination of samples except between a few samples of
closely related origin, all too small to be included alone.
This provided 541 sets of frequencies, of which 207 were based
on samples from the British Isles. Regression analyses were
carried out on this data by computer (cf. Chapter VIII, Section
3 below), and on the data subdivided geographically.

149
A considerable problem arises at the beginning of this
analysis, in the precise articulation of a null hypothesis of
independence of the frequencies of two different morphs.
Especially for frequent morphs, a negative association would
be inherently likely (and between 0 and L clearly occurs),
since a high frequency of one would set a limit to the possible
frequency of the other. More specifically, if one was to
investigate the regression of, for example, Y frequency on 0
frequency: should one's null hypothesis be of constant Y
frequency, or of a constant proportion of Y among the plants
that are not 0 ? As one assumes a considerable concealed
frequency for the recessive gene, a yet more extreme hypothesis
would be a constant frequency of V ^ among the complement to the
gene frequency of the recessive. This raises again the reser
vations about gene frequency calculations expressed above.
Calculations were carried out on the basis of the first
and second of these hypotheses; for the second, that is,
frequencies of Y, B, F and Ba were expressed as proportions of
the complement of 0 frequency. The result can be seen in a
shift towards the positive of the regressions of these frequencies
on 0 frequency, compared to the regressions of the simple
frequencies themselves. (Correction based on gene frequency
calculations would produce a farther change in the same direction.)
It is not jfelt that the problem of choosing the analytical
method hss been satisfactorily solved, and only the results of

150
the simplest analyses will be reported here, briefly. There
were substantial differences between the results of these
analyses when carried out on British and on non-British data.
This may indicate further scope for investigation, but until
such investigations are carried out, it further weakens the
conclusions.
.Oable 7.4. Simple Regressions between Morph Frequencies.
Dependent Variable
Independent Sign and Significance level of Regression Variable
All data All except British Isles (541 samples) British Isles
(334 samples) (207 samples)
Y
Y/1-'u»
B
Ba Ba/1-'0 f
'0'
''0
t :' : 1
•o 1•c 1•o 1
—
-
-
-
—
+
^
0
0
0
0
N
K
0
.001
.2
.02
.05
.3.
. 0.
.01
- 0
- N
- 0
- 0
+ 0
+ 0
- 0
.05
.3.
.2
.4
.2
.1
.1
—
+
(-
(-
-
-
.
N'
0
0
0
0
0
0
.3.
.2
.3)
• 4)
.02
.05
.1
*
*
F/I-'C 1 'C 1 - 0.02 - 0.3 - 0.1
LL (corr.)'O 1 - 0.05 + 0.4 - 0.01
* Cnly two B scores in Br. Is. out of about 10,000 plants.
rhe clearest of these results shows a negative regression
of I on 0, but this is largely removed by the correction, which,
as mentioned above, is not as strong as a correction on the

151
basis of gene frequency would be. The negative regressions of B and F on 0 are much less affected by the correction, and seem to be established as significant.

152
CHAPTER VIII
RESULTS II: CORRELATION WITH THE ENVIRONMENT
1. Introduction. Previous Reports concerning Morph Frequencies.
Early references to the existence of white leaf markings,
and to the fact that they were neither always present nor always
absent, were mentioned above. The relative frequencies of
different phenotypes are less often mentioned.
Early references refer only to the presence and absence of
marks, without discriminating between different types of marks,
and appear to include no precise descriptions of frequency.
The earliest reference to frequency is probably Oray (1821)
'often spotted with brown or white 1 . The 'brown 1 and white
spots are presumably respectively the H red flecking and white
V-mark phenotypes, though their difference in position and shape
is not mentioned; and 'often 1 is probably the least committal
quantitative term available. A clearer reference on both
counts is given by Sir J.E. Smith (1829) 'mostly with a pale
transverse stripe'.
Similarly, Bentham and Hooker (1924) 'usually bearing a
mark in the centre, which has been compared to a horseshoe',
and Clapham, Tutin and Warburg (1962) 'usually with a whitish
angled band towards the base' indicate that the presence of the
mark is commoner than its absence.
Brewbaker (1955) was the first to give an indication of

153
the relative frequencies of more than two phenotypic classes.
He refers to absence of mark, full V, broken V, and V-point
as the commonest types of marking, excluding by implication
filled V, basal V and broken V with yellow point, and double
marked plants, the other phenotypes he describes.
Garnahan et al. (1955) were the first to attempt precise
description of the frequencies of particular marks. They
reported on the frequencies in 480 progenies (meaning presum
ably 480 seedlings) of unmarked plants in a polycross nursery
of 242 clones, and equated these allele frequencies with those
in the pollen reaching the 'testers' in this artificial though,
for leaf marks, presumably unselected population. Prom these
gene frequencies he predicted phenotype frequencies in a whole
population, which he compared with observations on 'more than
2400 plants representing several diverse seed sources'. In
spite of the apparent independence of the two sources of
material, the results showed substantial agreement, except for
a deficiency of double marks. His allele frequencies showed
the recessive as the commonest allele (0.31) f followed by a
large class of simple V-alleles, mostly low and intermediate
(altogether 0.53), and as rarities broken (0.08) and broken
with yellow tip (0.01).
Regional floras and local monographs may be looked to as
possible sources of information on frequencies in particular
areas, for comparison with the references in the two British

154
Floras mentioned. However, many fail to mention leaf
marking, and those that do may only refer to the existence
of marks and their lack of taxonomic value (Hossain, 1961)
or to variation in marking within the species, without refer
ring at all to frequency (Foury, 1954; Healy, 1961; Hossain,
1961, p. 413). De Basto Folque (1949: Portugal) and Vicioso
(1953: opain) both refer to leaflets 'frequently 1 marked with
white. Polunin (1959: Arctic) refers to leaflets 'usually
with a whitish spot towards the base'. There is certainly no
indication of a difference between different areas. Especially
as the marks can be seen only with difficulty if at all in
herbarium specimens, it may be that some of the reports refer
to general knowledge about the species rather than strictly
local observations.
Other published data on leaf mark frequency refer ex
clusively to frequencies in cultivated strains. Garnahan et al.
(1955) mentions that Louisiana white clover contained no broken
or broken with yellow tip marks, and Kent had no plants with
double V or a double mark of broken V and simple V.
The clones chosen by Stanford et al. (1960) as parents of
the new synthetic variety 'Pilgrim 1 included one unmar&$d out of
21 clones, but many of the other clones proved to be hetero
zygous, and the expected frequency of unmarked plants in the
first generation, calculated from the parental genotypes deduced
from scoring the progeny of each separately, was 13.7 per cent;

155
frequencies found lay between 9 and 15 per cent. They found
no clear pattern of divergence of leaf-mark frequencies in popul
ations multiplied at several different sites (Stanford e_t al.,
1962).
W.3. Davies and Young (1963) recorded unmarked and broken
yellow frequency for nine strains. These included the 3100
No Mark strain, which was deliberately selected for homozygosity
for the unmarked recessive so that genetic contamination during
increase could be recognised. Unmarked plants are present in
all the other strains, at frequencies from 1.7$ in Kersey,
around 5$ in Kent wild white, 3100, and NZ Certified Mother
Seed, 10$ in Ladino, about 15$ in S184 and NZ Permanent Pasture,
and 34.6$ in English Dutch clover. Apart from Kent, with no
broken-with-yellow-tip, the broken-yellow frequency values,
though lower, were more uniform, varying from 1.6$ in S184 to
3.7$ in 3100.(i4S4i)
Daday, in oorreopondonco, referred to observations during
his growing and scoring of world-wide samples for cyanogenesis,
and suggests that the clarity, conspicuousness and diversity of
the marks and their frequency, as opposed to the unmarked form,
increase towards the south in Europe.
2. Information Available about Original Background of Samples.
Quantitative data suitable for statistical treatment are
available only for the samples collected by the author in the
British Isles, and for these only with regard to geographical

156
location, altitude, and in most cases soil pH. For these
factors, an exact analysis is possible by Multiple Regression,
leading to the estimation of precise Regression Coefficients
for each allele on each environmental variable, and precise
estimates of the significance of these coefficients (whether
they differ significantly from zero correlation).
Although a fairly accurate geographical location is known
for many of the seed samples obtained from overseas, only the
country of origin of others is known. This applies particularly
to the samples grown at Carlow and the Welsh Plant Breeding
Station, not obtained specifically for this work. When data
is available for a large number of countries, .a large part of
any distinct general distribution pattern would be shown by
mapping, even if only a single value in plotted for each country,
calculated from the sum of aHL samples (cf. Appendices IJI'and III).
In fact, for the rarest alleles, it is necessary to go beyond
this, and sum the data for adjacent groups of countries to
produce large enough numbers of the rare phenotypes in each
group for quantitative expressions of their frequency to have
any degree of accuracy. These groupings of countries have been
arranged, so far as possible, to combine countries with relatively
similar overall frequencies of markings.
Data can therefore be presented more or less quantitatively
for consideration of possible correlations as shown in Table 8.1.

157
Table 8.1. Methods of Analysis and Sets of Data.
Data
British Veget., field-scored.
H (not all)
All British Is.
Western Europe
All Nat. Range
WPBS Collections Spain and Portugal
WPBS Collections South Wales
H
Polish Samples
Swiss Samples
Other Foreign Samples
British Samples, field scored
Environmental Factor
Grrid Reference Altitude
Soil pH
Location
Location
Country
AltitudeWet/dry Agric. Use
Rye-Grass
Agric. Use
Agric. Use Wet/Dry
Agric. Use
All factors
AH factors
Morph Frequencies
G,Y fBa, F,LL,L.
0,Y,LL
0,Y
0,Y,B,Ba, F,LL,H0,Y,B,Ba, F,LL,L0,Y,F
0,Y,Ba LL,L
0,Y,F
0
0
Kethod of Investigation
Multiple Regression (and Scatter Diagrams)
Mapping
Mapping
Mapping
Simple Regression Contingency Tables
Simple Regression
Contingency Tables
Contingency Tables
Contingency Tables
Direct Com parisons within groups of samples.

3. Multiple Regression Analysis of British Field-Scored Data.
a) Data and Treatment.
Data was tabulated for 148 samples of 25 or more plants
collected in Britain and scored, mostly in the field, by the
author.
The data for each sample consist of Grid Reference to the
nearest 0.1 km., and Altitude, expressed in feet, generally to
the nearest 10 feet, though in some cases (especially high
altitude values) only to the nearest 100 feet.
Information from smaller samples was incorporated where
possible, either by combining small samples or by adding a small
sample to a nearly larger one. Such combinations were of course
made only between samples closely similar in location and
altitude.
All the morph frequency parameters are expressed to three
places of decimals as absolute frequencies. No figure for the
frequency of the broken mark appears since no such marks were
scored in these samples. For the complex expressions represen
ting LL and L frequency, calculations where samples were com
bined were made on each sample separately, and the numerators
and denominators of the final fraction added before division.
The four remaining frequencies refer to 0, Y, Ba, and F marks
(cf. above, Chapter VI, Section 3(c)).
Soil pH data expressed to one tenth of a pH unit were
available for over half of these samples. The data were

159
tabulated for a second treatment as 90 samples with soil pH
data as well as the other figures referred to above. In a
few cases more than one soil pH value was available within
the sample, and the plants could be allocated to two areas
corresponding to these soil samples. Where this was so, and
the pH values differed, the sample was split, provided the
parts each contained 25 or more plants. 3ix samples visited
twice, but only tested for pH once, appear each as two sets of
figures in the first tabulation, but only combined as one in
the data including pH.
No attempt has been made to weight the values according
to sample size and the corresponding accuracy of the frequency
measurements except by the exclusion of samples smaller than 25.
A large amount of material is available from a restricted
range of habitats in a restricted area near Oxford: (riverside
pastures at the University Farm, Wytham). Ihe possibility of
bias resulting from this is partly allowed for by condensing
the 28 samples of 25 plants or more to 14 in the first set of
data; only 8 of these appear in the data with pH values, as
the sites of the others had been ploughed up when revisited to
collect soil.
It was mentioned above that the soil pH values for material
from North Wales may have been biassed by the treatment of the
samples before scoring. The data with pH values was therefore

160
presented again for full analysis without these seventeen
samples, to see whether this would affect the regression
coefficients on pH and their significance. Removal of this
block of data also greatly reduces the amount of variation of
Grid Reference in the East-West direction, as all but four of
the remaining samples lie within a belt about 200 km. wide
running North to South, (it is also true to a lesser extent
of the fuller sets of data, that they represent a considerably
greater North-South range than Sast-West. This accounts for
the greater significance of regression coefficients, of the
same size, on northing as opposed to easting.)
To investigate the possibility of any effect of the still
large group of samples from Vytham, a repeated treatment of
each of the three sets of data indicated so far was carried
out with the Wytham samples excluded.
A seventh set of data was prepared to indicate to what
degree differences between the conclusions drawn irom the two
main sets of data were due, on the one hand to the exclusion
of the particular samples which had no pH values (and the
modifications in other sample), and to what extent it was due
to the incorporation of pH data in the analysis. For this
purpose the data tabulated with pH values were taken, but the
pH values were ignored.

161
Table 8.2. British Field Samples: Sets of Data used inStatistical Treatments.
Number of NumberIndependent ofVariables Samples
1. All data 3 148
2. All data except Wytham 3 134
3. Data with pH values 3 90
4. Data with pH values 4 90
5. Data with pH values except Wytham 4 82
6. Data with pH values except N.Wales 4 73
7. Data with pH values except A N. Vales and Wytham 4
Independent Variables: 3* 3rid Reference (East and North),Altitude.
4: Orid Reference, Altitude, Soil pH.
Dependent Variables : 6: 0, Y, Ba, F, £L, L frequencies.
Multiple Regressions were calculated for each of the morph
frequency variables in each of the sets of data described above
on the set of independent variables indicated in Table 8.2.
This was done by means of the KDF 9 Computer at the Oxford
Computing Laboratory, using a library tape (Stat. 15) for
Oeneral Multiple Regression Analysis prepared by the laboratory
staff.

162
b) Results of Multiple Regression Analyses: Presentation.
The first of the tables which follows (Table 8.3) shows
all the pairs of variables which reach a significance value of
0.2 in any of the seven analyses listed above (Table 8.2). The
next three Tables (Tables 8.4, 5, 6) show the full set of means
and standard errors of the variables, and all the regression
coefficients for three of the analyses. These refer to the
full set of 148 samples, and to the set of 90 samples which
have soil pH values, the latter analysed both with and without
inclusion of the soil pH data.
When reading these tables, it should be remembered that
smaller regression coefficients for the same level of signifi
cance will be found when the variation of the corresponding
dependent variable is small. The standard error of the P
frequency figure is less than a tenth of those of the 0 and L
figures; the corresponding regression coefficients would be
expected to stand in the same proportion if they reach similar
levels of significance.
It should be remembered that the L and LL figures shown
are not simple frequencies, but are respectively (L^/)f) and
(LL / X.d-./Ly/X) 2 ). The correction applied to LL allows
principally for the negative relation between 0 and uncorrected
LL frequency (cf. Chapter VI, Section 3(c) and Figures VI.1 and 2)
If its use was distorting the data appreciably there would tend
to be hi^h values of corrected LL frequency where 0 was high.
In Act t tte regression coefficients for 0 and LL on two of the

163
three main variables, Northing and Altitude, are large and
opposite in sign, an rffect opposite to any that could have
been produced by the correction. On the other hand, LL shows
a clear regression on Easting opposing that of L, which sug
gests that the correction has not been inadequate.
The presentation of results of the seven analyses side
by side in fable 8.3 permits comparisons between the different
analyses to reveal the effects of the differences between the
different sets of data. The opportunities for these compari
sons may be summarised as follows:
1. Inclusion in the Analysis of Soil pH as fourth Indep. Variable:
Compare Columns 3 and 4; more detail in Tables 8.5 and 6.
2. Exclusion of Samples from Sites without pH Values:Compare Columns 1 and 3 (more details in Tables 8.4 and 5); or compare Columns 2 and 5•
3* Removal of Wytham Samples:Compare Columns 1 with 2, 4 with 5, or 6 with 7.
4. Removal of North Wales Samples:Compare Column 4 with 6, or 5 with 7.
Khen the reader's concern is not with these comparisons, Columns
1 and 4 (and Tables 8.4 and 6) will be of most use, but it
should be remembered that comparison between them involves
both of the first two effects listed above.

164
Table 8.3. The Most Significant Correlations between MorphFrequencies and i&ivironmental Factors.
This Table shows the Regression aoefficients. with Estimates of
their Significance Levels, derived by Multiple Regression
Analysis, for all pairs of variables whose Significance Level
passes P » 0.2 in any of these sets of Data.
Notes for Tables 8.5-6
1) Variables Used in Multiple Regression Analysis.
Independent: Environmental Factors.(refer to number quoted above each column of Table)
3: Orid Ref. f Basting and Northing: Altitude.4: Grid Ref. t Easting and Northing; Altitude; Soil pH.
Dependent: Morph Frequencies0 Frequency of Unmarked PhenotypeY Frequency of Phenotypes showing Broken-with-Yellow-Tip.Ba Frequency of Phenotypcs showing Basal marks.F Frequency of Phenotypes showing Filled-in marks.LL (= LL/X.(1-/W/7)* representing the Frequency of
Double marks consisting of two *L f Simple V-Marks. L (= Lit/it) representing Frequency of Simple V-Marks (*L I ).
2) Regression Coefficients Approximate Total Range expressed as among Samples.v
Change, in parts per thousand, (100 km. Eastward 200 km. of Morph Frequency per (100 km. Northward 550 km.
(1000 ft. Upward 1900 ft.
3) Significance and *** ** * N.3.
Probability Levels P <0.001 P < 0.01 P < 9.65 P > 0.4
Figures appearing below the Regression Coefficient in each cell of the Table are the greatest Significance value (lowest Probability value) passed by the calculated value of t.

165
Table 8.3 (continued)
Data Set: (cf. Table 8.2)
Number of Indep. Vars.
Eny. Factor
N
N
1 2 All All
exc, WWith pH v±tj pH With pH With pH With pH
exc. w Avn ^ m -w,
4
0
LL
Ba
0
L
LL
L
LL
N
N
N
B
E
E
+21.70 +26.110.01 0.001** *•**
-21.58 -24.910.01 0.001** ***
- 6.25 - 6.920.02 0.01* **
- 0.97 - 1.210.4 0.3
- 0.61 - 0.740.3 0.2
r-19.23 -17.910.3 0.3
+16.72 +15.710.4 0.3
- 8.96 - 9.H0.2 0.2
+ 4-21 + 4.100.1 0.2
+22.16 +22.24 +23.87 +22.24 +23.880.05 0.05 0.02 0.05 0.02* * * * *
-18.60 -18.77 -19.81 -18.37 -19.430.1 0.1 0.1 0.1 0.1
- 6.48 - 6.52 - 8.32 -10.56 -12.750.2 0.2 0.1 0.05 0.02
* *
- 2.83 - 2.87 - 3.42 - 3.42 - 4.010.2 0.2 0.1 0.2 0.1
- 0.65 - 0.58 - 0.80 - 0.55 - 0.77N.S. N.S. N.S. N..3. N.S.
-27.90 -27.41 -22.43 -20.89 -16.310.1 0.2 0.2 0.4 N.S.
+28.20 +27.10 +23.28 +20.27 +17.110.1 0.2 0.2 0.4 N.S.
-15.43 -15.66 -18.98 -40.17 -45.400.05 0.05 0.02 0.001 0.001* * * *•** ***
+ 4.26 + 4.89 + 4.79 + 7.51 + 7.260.2 0.1 0.2 0.1 0.2
+81.32 +92.72 +18.80 +18.17 +16.27 +22.48 +23.65Alt 0.05 0.01 N.S. N.S. N.S. N.S. N.S.
* **
-79.12 -87.78 -24.68 -23.29 -20.78 -35.63 -36.30Alt 0.05 0.01 N.S. N.S. N.S. N.S. H.S.
* **-18.35 -19.99 -44.49 -44.19 -46.27 + 8.62 + 6.810.2 0.2 0.05 0.05 0.05 N.S. N.S.

16
Table 8.4. Multiple Regression on Grid Reference and Altitude.
Regression Coefficients and Significance Levels for all British Field-Scored Data (148 Samples;,
Coefficients represen change of frequency(parts per thousand)
per
Mean Standard Error
Dependent Mean freq. Variable and Stan
dard Error
0 0.2723 tO. 1467
Y 0.0149 ±0.0207
Ba 0.0070 +CK0182
P 0.0021 £ ±0.0086
LL 0.0206 +0.0469
T 0.7200 11 ±0.1440
t OridBasting100 km.
Eastward
Reference Northing100 km.
Northward4238.2 km. 3450.3 km. ± 75.92 km. ±1695 km.
-19.23 0.3
+ 4.210.1
+ 1.66 U.S.
+ 1.28 0.3
- 8,96 0.2
4-16.72 0.4
+21.70 0.01 **
- 0.86N.S.
- 0.97 0.4
- 0.61 0.3
- 6.25 0.02 *
-21.58 0.01 **
Altitude
1000 ft. Upward387.6 feet 331.7 feet
-1-81.32 0.05 *
- 5.24 0.4
- 1.83 N.S.
+ 1.48 N.S.
-18.35 0.2
-79.120.05 *

167
Table 8.5. Multiple Regression on Grid Reference and Altitude.
Regression Coefficients and Significance Levels for all data which also have soil pH values (90 samples, as expressed for Regr. on 4 Variables).
Coefficients represent change of frequency (parts per thousand)
per
Meanstandard Error
Dependent Mean freq. Variable and Stan
dard errorn 0.2260 u ±0.1182
T 0.0117 1 +0.0189
Ba 0.0083 ^ +0.0204
v 0.0032 * +0.0107
TT 0.0247 11 ±0.0513
T 0.7689 L +0.1195
Grid Reference Easting Northing
100 km. Eastward
4340.2 km.±867.3 km.
-27 . 90 0.1
+ 4.26 0.2
+ 0.10 N.a.
+ 1.68 0.3
-15.43 0.05 *
+28.20 0.1
100 km. Northward
2846.2 km.±1297 km.
+22.16 0.05 *
+ 1.02N.S.
- 2.83 0.2
- 0.58K.3.
- 6.48 0.2
-18.60 0.1
Altitude
1000 feet Upward
335.4 feet± 274.8 feet
+18.80N.S.
- 4.77N.J.
- 1.66N.S.
+ 3.96 N.S.
-44.49 0.05 *
-24. $8N.b.

168
Table 8.6. Multiple Regression of Orid Reference, Altitude andSOU pH.
Regression Coefficients and Significance Levels for all Data with ^ioil pH values (90 samples).
Coefficients represent change of frequency (parts per thousand per
Mean Standard Error
Dependent Variable
0
Y
3a
P
LL
L
Kean freq. and Stan dard Error
0.2260 ±0.1182
0.0117 ±0.0189
0.0083 ±0.0204
0.0032 ±0.0107
0.0247 ±0.0513
0.7689 ±0.1195
Grid Reference Easting Northing
100 km. Eastward
4340 km. ± 867 km.
-27.41 0.2
+ 4.89 0.1
+ 0.75 N.S.
+ 1.570.4
-15.66 0.05 *
+27.10 0.2
100 km. Northward
2846 km. ±1297 km.
+22.24 0.05 *
- 0.92N.S.
- 2.87 0.2
- 0.60 N.S.
- 6.52 0.2
-18.77 0.1
Altitude
1000 feet Upward
335.4 feet ±274.8 feet
+18.17N.S.
- 5.56N.S.
+ 1.94N.d.
+ 4.09N.S.
-44.19 0.05 *
-23.29N.S.
Soil pH
1 pH Unit more Alkaline
pH 6.18 ±pH 1.06
- 8.95N.3.
-11.32N.S.
+ 4.04N.S.
+ 1.860.4
+ 4.15N.S.
+19.75tim$*

169
c) Results of Multiple Regression Analyses: Interpretation.
These results give a clear indication that Soil pH (as
measured) can explain .very little if any of the observed variation.
None of the coefficients of regression on pH reach aren a signifi
cance level of P = 0.4 in any of the analyses. Another expres
sion of the apparent irrelevance of pH is seen when Columns 3 and
4 of Table 8.3 are compared; the inclusion of pH as a fourth
independent variable in the analysis has had practically no effect
on the coefficients of regression on the other variables or their
significance.
On tie other hand, the two principal analyses (Columns 1 and
4) differ considerably, and comparison of Columns 1 and 3 shows
that this is due almost entirely to the change in the set of
samples used. The main feature of this change was the exclusion
of nearly all the samples from the North-East of England. This
greatly reduced the amount of variation in Northing, and also in
altitude, as most of the high altitude samples were in this group.
This would be expected to make it harder to establish the signifi
cance of a regression on either of these variables even if equally
well followed by the morph frequencies. Thus there is decline
in significance without appreciable change in regression coefficien
for the regression of 0 on N, of LL on N, of F on N, and very
clearly for 0 on Altitude. The principal exception is the
regression of II on Altitude (cf. also Ba on N). The effect
here is a considerable increase in both the significance and the
coefficient, which could be explained in two ways. On the one

170
hand there may be heterogeneity in the application of this
correlation, the block of samples which were removed being
exceptions from it, so that while they remained they concealed
it. Alternatively, the effect is unreal, and in the smaller
sample the more restricted range of habitats studied produced
an unrepresentative picture of variation in the species. The
variation in Easting remains substantially unchanged, however,
and a greater part of the variation in morph frequencies is
attributed to it; there is an increase in coefficient and in
significance for 0, L and LL> regressions on Easting.
The effect of removing the Wytham samples (already somewhat
reduced in numbers to limit their contribution) is to increase
the coefficient and especially the significance of all the
regressions on N, and also to some extent on 0 and L on Altitude.
This is what would be expected if a group of samples near the
centre of the range of northing were removed, having had rather
untypical morph frequencies for that part of the range. It wiH
be seen from the maps below that the Wytham group and from
Appendix II that the 'South Midlands' group (dominated by Wythan),
resemble the northern s amples rather than their neighbours. It
appears that these samples do have distinctive properties, and
that they would be capable of producing bias if over-represented.
The removal of the North Wales samples was intended to
eliminate any bdas caused by possible inaccuracy in their pH data.
No appreciable pH effects are present, either before or after
removal of these samples. Any effect of removing a bias might

171
therefore not be recognised, and none was. As mentioned above,
removal of these samples greatly restricts the amount of variation
in Easting and also (this group containing the bulk of the high
altitude samples with pH values) in altitude, and thus reduces
the possibility of establishing regressions on these factors.
The regressions of 0 and L lose considerably in significance,
and that of Y increases its coefficient without appreciable
change in significance. On the other hand high levels of sig
nificance are revealed for the regression of LL on E. (Although
reacting to Easting in the same direction as 0, the LL regression
reaches its highest significance here while the 0 regression
becomes fainter). The same choice of interpretations applies
as above to LL on Altitude. This removal of the North Wales
samples has an even more dramatic effect on regression of LL
on Altitude; not only does it remove its significance, previously
at P = 0.05, but it removes the regression completely, replacing
it by a small one of opposite sign. This suggests that the
previously significant regression depended entirely on (some of)
the North Wales samples being extreme in altitude and LL frequency.
d) Comparison of Simple and Multiple Regression Analysis.
By simple regression analysis of a morph frequency with
regard to one environmental factor alone, the attempt is made to
explain all the variation in morph frequency in terms of that
independent variable. Simple regression coefficients are there
fore usually larger and appear to be more significant than multiple

172
regression coefficients. It can be argued that the amount by
which the simple exceeds the multiple regression coefficient
is a spurious contribution, which can be eliminated by allowing
for the effect of the other environmental variables measured.
Therefore, the multiple regression coefficients have been
presented here as the best available estimates of the extent of
the correlation. (It is also true that they would probably be
reduced still further if other environmental variables were
allowed for, and that the multiple regression coefficientsmay
presented/remain overestimates,)
However, these multiple regression coefficients only allow
for two or three of very many possible environmental variables.
The simple regression coefficient for each environmental factor,
though overestimated, is not biased by allowance for particular
environmental factors chosen merely because measurements of them
were available. It is also a better basis for comparison with
other data where only one environmental factor is measured (cf.
below, Jection 5, part (a)).
Simple regression coefficients and their significance 3.evels
are presented in Table 8.7 for comparison with the correspondiig
multiple regression coefficients, all being derived from calcula
tions involving Orid Reference and Altitude for the full set of
148 British field-scored samples (set 1 in Table 8.3 above).
The principal differences are significance at or near 5/' for
association of high Y frequency with southern position and low

173
Table 8.7.
Mean,. S.
0.27230.1467
Comparison of Simple and Multiple Regression Coefficients.Simple R.C.'s above . Multiple R.C.'s below.
Easting Northing Altitude
423.8 km. ± 75.9 km.
-50.27 +15.44o.oT **-19.23 +16.37 0.3"
345.0 km. ±169.5 km.
+30.93 + 6.69 0.001 ***
+21.70 +7.44 O.OT **
387.6 ft. ±331.7 ft.
+135.79 +34.82 0.001 ***
+81.32 ±36.79 0.05 *
0.0149 + 0.0207
+5.73 +2.21 0.05 *
+4.21 +2.47 0.1""
•1.99 +1.00 0.05 *
•0.86 +1.12N.3.
-9.96 +5.11 0.1
-5.24 ±5.55 0.4
Ba 0.0070 + 0.0182
+2.79 ±1.97 0.2
+1.66 +2.21N.S7
-1.40 +0.88 0.2""
-0.97 +1.00 0.4"
-4.85 ±4.53 0.3
-1.83 ±4.97N.S.
F 0.0021 + 0.0086
+1.61 +0.93 0.1"
+1.28 +1.04 0.3~
-0.73 ±0.42 0.1
-0.61 +0.47 0.3"
-0.59 ±2.15U.S.
+1.48 +2.34
LL 0.0206 ± 0.0469
-0.74 ±5.11N.S.
-8.96 +5.54 0.2"
-5.94 ±2.23 0.01 **
-6.25 ±2.52 0.02 *
•23.27/±11.53 0.05 *
.18.35 +12.45 0.2
0.7200 ± 0.1440
+47.33 ±15.20 0.01 **
+16.72 +16.11 0.4
•30.19 +6.57 0.001 ***
•21.58 +7.32 0.0? **
-131.48 +34.23 0.001 ***
-79.12 +36.21 0.0*5 *
Units: Morph Frequencies: Absolute Frequencies.Coefficients: change in morph frequency in parts per
thousand per 100 km. or 1000 ft.Data: 148 Field-scored British samples (set 1 in Table 8.3).

174
altitude, and the absence among the simple regressions of any
indication of dependence of LL on distance east.
e) Results of Multiple Regression Analyses: Conclusions.
A clear positive regression of 0 (unmarked frequency) on
northing is consistently present throughout these analyses, of
the order of 0.02 or 0.025 0-frequency change per 100 km. Its
significance is considerably clearer when the full range of
variation in northing is included. ihis is more markedly true
for the regression of 0 on Altitude, which is of the order of
0.085 increase in 0 frequency for 1000 feet increase in altitude,
Regression coefficients and significance values for L
closely parallel those of 0, with change of sign, but are gener
ally slightly smaller. Because of this, and because, as has
been said above, the L figure certainly combines a number of
different phenotypes, no further reference will be made to the
L regressions; they can be assumed to be the opposite of the 0
regressions.
The regression of LL on Northing is also clear; the
correction used to produce the LL figure almost certainly
weakened it.
With so many variables and so many comparisons, perhaps
one significance level of 5 per cent might be reached by chance.
The three clear cases above, with significance levels well past
5 per cent, therefore together make a strong case for denying
that leaf-marking frequencies are unresponsive to environmental

175
differences, for denying therefore that they could be of no*
selective importance.
It is less clear how to interpret the cases where sig
nificance is reached only after removal of some samples for
reasons unconnected with the factors concerned. The principal
examples are the regression of LL on Hasting and on Altitude.
However, the coefficients in the complete set of data, though
not significant, are large enough to suggest that these
regressions may be real. More data would be needed to estab
lish significance for regressions of this size, and this is
true also of the other weaker regressions listed in Table 8.3.
Scatter diagrams (Figures VIII(i) to (ix)) follow, to
illustrate the actual distribution of the samples with respect
to the nine most clearly indicated regressions, listed in
fable 8.3. The samples with no pH values (whose removal
produces the differences between analyses 1 and 3) and those
from Wytham are plotted with different symbols. On each Scatter
Diagram is shown the simple regression line, morph frequency on
environmental factor, for the two variables concerned. The
simple regression equation is shown with the diagram, using the
units shown on the diagram (absolute morph frequencies, kilo
meters (arid Ref.) and feet (altitude)), in the form:
Frequency (Predicted)) = (Mean ilorph Frequency, + S..3.)
+ (Simple Regression Coefficient, + 3.E.)x ((Environmental
actor (Measured)) - (Mean for environmental .Factor, + S.L.)).

176
Figure VIII (i)
Samples with Soil pH values(Wytham)
'O' Frequency - Northing Scatter Diagram
Samples without * Soil pH values
° (Wytham) a
0-8
070)
oa
06
TD 0)
03
6CD
O
05
0-4
u cCJ 3cr a>VH
PH
0-3
0-2
0-1 •I m oa*
• I
100South
200 300 400 500(Unit : Kilometres)
Grid Reference : Northing
600 700
North
Simple Reg. Eq. : (O) - 0.2723(+0.1467) + 0.000309(+0.000067) (GR(N)km - 345(+170))

17
0-30
Figure VI11 (ii) Corrected 'LL' Frequency - Northing ScatterDiagram
Samples with m Samples without ASoil pH values Soil pH values (Wytham) n (Wytham) A
0-25
CD
0 20
in CO
0-15Q
a
DS-, 0-10
0-05
100 200
South300 400 500
(Unit : Kilometres) Grid Reference ; Northing
-{*»*M
600
North
Simple Reg. Eq. : (LL) = 0.0206(0.0469) - 0.000059(+0..000022) (GR(N)km - 345(4-170))

CO 3 "E CD CD ^Q • M . . ^ 03 II C b 0 ,^1
^o 1 ~
l o o I — •
oo to *^"' 1 0 o 0 c 0 1 — '1 o 0
0 o 0 \o ^^ 0 50 O ^ 3 * Co
Cn
"+ !^J o s— ̂
iCO o c p-
10 2^%
^
? 51
<•> O«
^
0CD
G
1 J
^-*
£*>
MCD
i-
1 -!_
. ft
CD
••3 O rD
/%
i— >
•«
• i —
• 41
0
0
^ 3
°0
fi
Hi
HJC
CD
3^ w
CTQ
Ui s •»•
o- oZ
°
0 HJ
ft cr
Fre
que
ncy
of
'B
a1 ,
Bas
al
Mark
an
d D
erive
d
Phe
noty
pes.
O
o
0
0
0
O
0
OO
Oo
— '
— '
— •
K>
*•
O-
00
O
*J
*•
VA
I.
m
m m
r "j
• *
_ k,
1
•BD
&
«i^
•
•
0
•
•
J i; _••
• • •• »i 1 i
^
—
•^
m•
• •
• •
~ >. ^.••
•» •«* fe* ^^^ •» » ^0 ^^ »( I
»
• "
": • ' > i ' 1
h-1
-
eg H! CD
CO
COO
c
03 <;
^
&
3 §
^73*0
j^
?
?
» ?
n •<
i-1-
•C-
p ^
"^C
'-'
•rt
S^en
^
03 03aa
cn 03 I—"
^'
P HJ *"
HJ CD K*J CD
CO
CO
OX
— s
OP
<
•<
^ &
3ft
T3
i— i
i— >
cr
H-
n> ^.
P
^
W
Oa
^ ^
< ^
13>-^
P
!-•
3/1—
' ft
C'
c tr
^
CD
O
°^en
c
CO 0
>_>
». P
^CD
0°
H! D 03 HJ P 3

179 Figure VIII (iv) Filled-in Mark Frequency - Northing Scatter Diagram
0-07
cfi 0-06D C-
o
ex,
^ 0-05•i-H5H1) Q"Cc c;d•r o-o4
0*03
OaCDPcr a;in
0*01
Samples with Soil pH values
(Wytham)
Samples without Soil pH values
(Wytham)
Simple Reg. Eq. : (F) = 0.0021(4-0.0086) - 0.0000073(+0.0000042) (GR(N)km - 345(4-170))
(Unit : Kilometres) Grid Reference : Northing
North

180
Figure VIII (v)
Samples with Soil pH values
(Wytham)
'O' Frequency - Easting Scatter Diagram
Samples without Soil pH values
a (Wytham) A
0-8
0-7
0)a
a a <u
cu 0.3^ !H CO
6cD 0-4
0-3
uc
0)
0-2
0-1
0-0
250West
t
B.
300 350 400 450(Unit : Kilometres)
Grid Reference : EastingSimple Reg. Eq. : (O) = 0.2723(-K).1467) - 0.000503(-K).000154) (GR(E)km -
East
424(+76))
550

181
0-30
Figure VIII (vi) Corrected 'LL 1 Frequency - Easting Scatter Diagram
• Samnlps without ASamples with Soil pH values
(Wytham) a
Samples without Soil pH values
(Wytham)
r.> 0-25
CJ
e• ft CO
>•»—IOW 0-20
ctf
O Q 0-15
'J c0)Or1 O
o-io
QJ *—' O D
0-05OU
0-00 *r—LWest
250
(Unit : Kilometres) 9 East300 350 400 450 500 550
Grid Reference : Easting Simple Reg. Eq. : (LL) - 0.0206(-f0.0469 - 0.000007(+0.000051) (GR(E)km - 424(+76))

182
Figure VIII (vii) 'Broken-Yellow' Mark Frequency - Easting ScatterDiagram
Samples with Samples without Soil pH values Soil pH values
(Wytham) a (Wytham) ACO0)a^0.14C
0-125-1 0)Q-aacti
~0-10
I0-08
V-irt 0-06
C 0)
0-04
oCQ
•t
CQ
^0-02a <u§•
ooo
A oc»
West250 300
(Unit : Kilometres)350 400
Grid Reference : Easting
East500 550
Simple Reg. Eq. : (Y) = 0.0149(40.0207) + 0.000057(+0.000022) (GR(E)km - 424(+76))

183Figure VIII (viii) O' Frequency - Altitude Scatter Diagram
Samples with Soil pH values
(Wytham)
Samples without Soil pH values
(Wytham)
A
A
0-8
• o-70)a>>*->oc<D 0»6
X! CL,
TD0) ^5n o«5nJg CD
.*0.4
A A
• A AA
4^- ^.'Y>>0-3Uc <u 3 cr a> M
P^ ^ mAm^*+
fc0-2
0-1
A
A
• A.
' .1
0*0
40 0 • 00 1200 1600 2000
Altitude (Unit : Feet) Simple Reg. Eq. : (O) = 0.2723(+0.1467) + 0.000136(^0.000035) (Alt(ft) - 388(+332))

Cor
rect
ed '
LL
1 F
requ
ency
(D
oubl
e M
arks
„ of
'Sim
ple
V's
')
o o
oO
-
L
Mo
m
o
I u> OO
O
C
OJ
Co
Ki
o D
o o k> o o o
;
co c
oO
Oi
&
3
p c n> CO
^
CO
COO
OP
^
t± 3
rt
*O
oj
HI-I
CD3
Mc.
<
^P
i2.i—
1 rt
c cr
CD
oCO
C
- •8 H 0) 0 o HJ H
0)
O
rt
0) a r CD I I ^—~ H a CD
CO o p rt
rt CD n 2 S
P
if^
P 3

185
4. Mapping.
A set of maps follows below to illustrate the geographical
distribution of frequencies of the various phenotypes.
a) British Isles. (Of. Appendix III (a)).
Figures VIII(x) to (xii) show frequencies of the unmarked,
broken-with-yellow-tlp, and corrected frequencies of IL double-
marks for the British Isles. They include other data as well
as that from field scored samples analysed in the section above.
Each circle represents a sample or more often a group of
samples added together. As distinct from the field-scored
samples, those circles which represent principally material
grown and scored in the greenhouse are marked with a broken
outline.
i'hese maps illustrate clearly the North-South cline in
the frequency of the unmarked form, the higher frequency of
the broken-yellow marks in the South-^ast, and the higher
frequency of the IL type tov/ard the west (which is supported
by the inclusion of samples from Ireland).
b) Western Europe. (Of. Appendix III (b)).
Figures VIII(xiii) and (xiv) show for Western ^urope
all the samples (except very small ones) which can be precisely
located, those very close together being grouped. Samples or
groups of sairples based (mainly),on vegetative material are
indicated by broken outlines.

186
A north-south cline in 0 frequency is not so clear,
but there are definitely lower values around the Mediterranean
(with the exception of the unmarked sample from Sicily). Fre
quencies of By seem to move in the opposite direction and
reach high values around the Medit erranean.
c) Whole of Natural Range. (Cf. Appendices III(c), Jll(d)).
Figures VIII(xv) and (xvi) show all the samples available
for most countries. However, in some countries (France, Poland,
Spain, Portugal) where all or nearly all the samples are precisely
located, it is possible to represent several groups of samples,
and in this case unlocated samples are ignored. Two samples,
indicated by broken outlines, are included, from Ethiopia and
the Azores, which are probably outside the natural range. It
should be borne in mind that compared to these and other out
lying samples on the whole-range maps, the central circles
representing many combined samples are very much larger:
extreme values in the small isolated peripheral samples are
less important than they may appear on the maps.
Because of the apparent difference (cf. part (a)) between
British field scores and others, the British data in these two
large-scale maps is based only on greenhouse-grown and scored
material. Almost all of the Irish material was vegetative,
and. was &rown transplanted, but in the open, and is included here.
i'he group of smaller scale maps (Figures VTII(xvii-xxii))
show frequencies for all the rare phenotypes, including the

187
high V-marks (H), which have not been mentioned before in
this chapter. For them the only British data used has been
that not scored in the field. Inconsistencies in the scoring
of these marks were discussed above (Chapter VI, Section 3(a))
and it was pointed out that the virtual essence of H scores
in the British field scored data was probably due to reluctance
to make the distinction between H and L, rather than to a
genuine extremely low frequency. This presumption is supported
by the appearance of a moderately high frequency of H scores in
the other British data. It should be remembered that any
plants scored as HL will have contributed both to the H fre
quency map and the LL frequency map.
d) Conclusions.
In Section 3 an estimate of 2 to 2£ per cent per 100 km.
was obtained for the slope of the North-south 0 frequency cline.
This predicts a change of frequency of about 30 per cent between
the North Mediterranean, and North Britain and South Scandinavia.
Even in Figure VIII(xv) where the British 0 frequencies have
been considerably reduced by the exclusion of field scored
material, the presence of a cline at least half as steep as
the British one is supported by the map, although in detail it
looks like an abrupt change as the Mediterranean coast is
approached, rather than a smooth cline. Inclusion of the
field-scored data would make the cline appear considerably
steeper (of. Figure VHI(xiii)).

188
Among the other maps, only those of F and Ba show
simple clines; i' frequency increasing towards the south
east, and Ba frequency towards the north-west. The LL map
suggests high frequency in the centre but especially towards
the south-west and to some extent towards the north-east, and
low values both in the north-west and the south-east. The
B and M, By, and H maps all suggest regions of high frequency
in the centre of the range, for B and M in the Alps and the
Balkans, for By in the Pyrenees and in G-reece, and for H in
France. The By distribution seems particularly complex, and
could be interpreted as a low frequency periphery, a (semi-)
circular belt of high frequency, and a central region of low
frequency which coincides with the region of high B frequency,

1 89
Fig Vlll(x)Frequency of Unmarked PhenotypeOin British Isles Full circle z Sample. O 25-99 100% Frequency Size 'O 100 or more

I9O
Fi8 Vlll(Xi)Frequency of By and derived Phenotypes in British teles Full circle : Sample O 25-99
5% Frequency Size Q 100 or more
Miles60 120

191
Fig VIII(Xii) Corrected Frequencies of LL Double-marked Phenotypes in British Isles Full circle - Sample O 25-99 20% Frequency Size Q 100or more
Miles60 120

192
Fig.VIII xiii Frequency of Unmarked
Phenolype O in Western Europe, Known Locations
Full circle - IOO% Frequency
Sample ° l4 ~ 39
Size O 40H99(J)2OOormone

193
FigVIII xiv Frequency of By and
Phenotypes in Western Europe, Known Locations
de ~ , O 14-39Sample
O 4O-I99 Size ^
(^J2OOormore
derivedFull Circle =
2O% Frequency

Freq
uenc
y of
unm
arke
d Ph
enot
ype
O t
hrou
ghou
t N
atur
al R
ange
O
3O
-I2
4
O
125-
499
QsO
Oorm
ore
Full
circ
le
-
IOO
% F
requ
ency
Sam
ple
Size
O

Freq
uenc
y of
By
and
deriv
ed P
heno
type
s th
roug
hout
Nat
ural
Ran
ge
O 3
O-I
24
O 1
25-4
99
OsO
Oorm
ore
Full
circ
le
z
2O%
Fre
quen
cySa
mpl
e
Size
cn

196
v .. ~- ~^0u- s T
Broken Yellow Tip By Full Circle= 2O%
Sample
Size
Broken mark B Full Circle = 5%
Q2OO107OO C J OVW7OO

197
Basal mark Bo Full Circles 5%
Filled-in markF Full Circle * IO %
Size

198
High simple V-mark H_ Full Circle = 5 %
Double mark (simple Vs) LL£orrected)Full Circle. 2O%
OP to20° O200to7DO

199
5. Other Sets of Data sufficient for Quantitative Comparisons,
a) W.P.B.3. Collections in Spain and North Portugal.
The data acquired from the welsh Plant Breeding Station
included a large number of samples from the north-west of the
Iberian Peninsula with detailed descriptions of their original
sites. 46 samples from which 25 plants or more had been
scored were provided with figures of the altitude of the
original site. Simple regressions for each morph frequency
were calculated on altitude. The results are shown in Table
8.8, and the simple regression coefficients for the British
data (cf. Table 8.7) are included for comparison. It will
be seen that there is fairly close agreement between the two
sets of figures, though one is based on seed samples from Spain,
and the other on vegetative material scored in the field in
Britain. The main conclusion is that there is a clear increase
of 0 frequency with altitude. A scatter diagram of the
Spanish data is shown in Figure VHI(xxiii).
Although the background descriptions are detailed, it
is difficult to use much of the information. One simple
procedure is to arrange the samples in order of morph frequency
and observe which environmental features appear to cluster at
oae or other end of the series.

Table 8.8 Spanish Collections: Regression on Altitude.
Simple Regression Coefficients for each Horph frequency on Altitude. Figures for British field-scored data in brackets for comparison.
Units: Mean and Standard Errors of Frequencies in a bsolute proportions; Coefficients: Changes in frequency in parts per thousand per 1000 ft.
Morph Frequency Regression Standard oignificanceCoefficient 3rror (P-level)
0
iean Q TpO •-&»
0.1089 +0.1287 +30.02(+135.79
+14.45 * OJ)5 +-A.82 *** 0.001)
0.0412 +0.0652 -8.91 (-9.78
+7.55 +5.14
0.3 0.1 )
B 0.0017 +0.0103 -0.17 +1.21 N.S. (No B scored in Britain)
Ba 0.0036 +0.0100 -2.02(-4.85
+1.14 +4.53
0.1 0.3)
0.0177 4-0.0490 +2.05(-0.59
±5.92 ±2.15 N.3.)
LI 0.1382 +0.1535 -18.73(-23.27
+17.64 +11.53
0.3 0.05)
0.8659 +0.1344 -32.69(-131.48
+15.03 ±34.23
* 0.05 *** 0.001)
Lean Altitude 1658.0 +1287.0

201Figure VIII (xxiii)
Spanish Samples : 'O* Frequency - Altitude Scatter Diagram
0-7
S"cu
0)
cdea D
0-5
0-4
0-3
OC! 0)
o-i
1000
Altitude (Unit : Feet)
2000 3000 4000 5000
Simple Reg. Eq. : (O) = 0.1089(+0.1287) + 0.000030C+0.000014) (Alt(ft) - 1658(+1281))

20;
By this method the following species and genera appeared
to some extent to be associated with high 0 frequency: Holcus
spp., Festuca rubra, and Gynosurus; with low 0 frequencies,
Trifolium pratense. T. fragiferum. Festuca arundinacea and
Lolium spp. The procedure for listing the species w»s, it
is understood, not very systematic, and too much weight should
not be attached to these lists.
There appeared to be associations of high 0 frequency
with wetness, and with pastures as opposed to waste places and
roadsides. The second classification appeared to have some
relation to F frequency; and figures for Y frequency and dry-
ness are also presented for comparison with those in Part (c)
below. The numbers of plants are summed for all samples with
similarly described sites.
Table 8.9. Morph Frequencies and Agricultural Use of Site.
N 0 0/N F F/N 0 (Unmarked)
Meadow 832 96 0.115 10 0.0120 X?^ = 46.64
Combined Mea- 221 dow and PasturePasture 910
Waste 535
Eoadside 259
Undescribed 240
Total 2997
0.0
36 0.0396
13 0.0243
16 0.0618
15 0.063 - 0-0
343 0.114 75 0.0250
32
143
50
7
0.145
0.157
0.093
0.027
P« 0.001•***
F (Filled-in)
X^5) = 42.83
P « 0.001 *•**

203
Table 8.10. Morph Frequences and Vater Regime in SpanishSamples.
Wet or Moist
Irrigated
Near Water
Dry but near Water
Dry
Undescribed
Total
N
916
346
267
304
477
687
!997
0
98
18
98
44
28
58
344
0/N
0.107
0.052
0.367
0.145
0.020
0.084
0.115
Y
34
17
3
8
25
30
117
Y/N
0.037
0.049
0.011
0.026
0.052
0.044
0.039
0 (Unmarked)
X^5) = 204.85
P « 0.001***
Y (Broken- Yellow )
X( 5) = 10.51
0.1> P>0.05
It will be seen from these figures that there is clear hetero
geneity between the habitats in the first three comparisons.
In the first case, 0 seems to be frequent in pastures and in
frequent on roadsides; and F frequent in both these habitats
but rare where there was any mowing. In the second case, it
is difficult to summarise the patterns; the conditions
favouring high 0 could perhaps be adequate water with good
drainage.
b) Old Hye-G-rass Pastures in South Wales.
A second set of data of some size, also from the welsh
Plant Breeding Station, consisted of seed samples from old
rye-grass pastures in coastal Konmouth and Glamorgan. 19
samples in all with more than 15 plants were analysed, by

Simple and Multiple Regression. Although Grid Reference
and Altitude were known, they were all within very narrow
ranges, and gave no approach to significance except in the
case of LL frequency increasing northward (away from the sea). One other quantified factor with a greater range of variation was the estimated percentage of rye-grass in the field
(Range: 0-60>S). Results of simple regression analysis for the morphs present appear in Table 8.11.
Table 8.11. Simple Regression Coefficients on Percentage ofRye-Grass in Original fields of Monmouth and Glamorgan Samples.
Unit: Increase in frequency parts per thousand per 10$ increase in estimated rye-grass content.
Rye-Grass Estimated Percentage: Mean 25.26 + c'.ii. 18.32$
Mean 3.E. Coefficient Significance(P Level)
0 0.1207 -1-0.0854 +12.45 0.3Y 0.0082 +0*0250 +6.31 * 0.05Ba 0.0058 +6.0184 +1.64 N.S.LL 0.0256 +0.0566 -0.10 N.S.L 0.8765 +0.0852 -11.77 0.3
The frequency of Y seems to follow the percentage of rye-grass,
as perhaps also does that of 0.
Some differentiation of 0 frequencies also seems to
exist according to the type of management; this is shown in
Table 8.12.

205
Table 8.12. .South Wales Samples: 0 Frequency and Management
Mown only 48 8 0.167 ~xf,N = 5.15
Mown and grazed 151 11 0.073 u;
Grazed only 279 45 0.1390.2 > P > 0.1
Undescribed 109 13 0.119
Total 632 77 0.122
(Mown + Grazing) 199 19 0.095)
Saltings 44 2 0.045
There are apparently higher 0 values in grazed than mown
fields, though the small number of fields only mown and not
grazed are out of line, as are the sea-side 'salting' pastures.
c) Polish oeed Samples.
A set of 17 seed samples from various parts of Poland
grown and scored at Oxford provide descriptions of the original
habitats as wet or dry and mown, grazed or waste, and permit
comparisons of morph frequencies among the different classes.
Table 8.13. Polish Samples: 0 Frequency and Mown, Grazed orWaste.
N 0 0/N F F/N 0 F
Pasture 374 95 0.254 3 0.008 X^ = 32.70 58.49
Meadow 292 45 0.154 3 0.010P < 0.001 < 0.001
Waste 302 27 0.089 35 0.116 *** ***
Total 968 167 0.173 41 0.042

Table 8*14. Polish Samples: 0 and Y Frequency and Wetness.
N 0 0/N Y Y/N 0 Y
Dry 276 76 0.275 1 0.004 ~Xf9 f 32.02 42.63
Intermediate „,-„ TA A <cn n A n<n or Undescribed 467 70 0.150 9 0.019P < 0.001 < 0.001
Wet 225 21 0.093 23 0.102 *** ***
Total 968 167 0.173 33 0.034
The figures for F and agricultural use of the land are included
for comparison with those above (Table 8.9); all the 35 j? or
derived scores from waste land are in one sample ('wayside
place* at Wilczowice Stare, near L<5dz) without which there would
be no indication of any effect of this factor on F frequency.
d) Swiss Samples.
This type of analysis, summing samples sharing a certain
feature to isolate its effects, depends on the features con
cerned being distributed independently; a genuine causal
relationship with one factor could catase an apparent effect of
another factor if the two environmental factors were correlated.
Such associations are almost inevitable when there are very few
separate samples. The last candidate for this type of
analysis is a set of seven Swiss samples.

207
Table 8.15. Swiss Samples: Korph Frequencies and Mown or Orazed.
N 0 0/N Ba Ba/N F P/N Basal
Only Pasture 443 61 0.138 4 0.009 1 0.002 X?, x = 9-57
Frequently Mown 403 54 0.134 17 0.042 7 0.017(1)
P < 0.01 *•*mied-in
Total 846 115 0.136 21 0.025 8 0.009 By exact test:chance of this or more uneven dis tribution = 0.032 *
e) Vegetative Samples from Qiessen, near Frankfurt, Gtermany.
Heath Pasture
Meadow
N
2215
0
61
0/N 0/N
0.273 ) all over 0.189 0.067 ) 1000 ft.
62 16 0.258 ) all below 0.258
0 / Altitude
X^j = 2.55
0.2 > PSports Field 33 15 0.454 ) 1000 ft.
Bight sets of vegetative samples were received, and were grown
up in the greenhouse before scoring. The higher 0 frequencies
appear to be associated either with low altitude (if so, in
opposition to much other data), or with the different type of
habitat.
6. Smaller Groups of Foreign Seed Samples.
i'hese samples can only be presented individually, and
correlations can at most be suggested, and put on record for
comparison with other sets of samples.

208
i) Vanlffse, near Copenhagen, Denmark (cf. Chapter V, Table 5.3above)
N 0 0/NMeadow on filled-in lake*dather dryKeadow (gone out of cultivation).Dry, sandy, uncultivated.Boggy, very wet, little cultivated
i
High 0 frequency perhaps associated with dryness.
N41 N42N43 N44 N45
21 266 322 108 481
3 3623 52 50
0.143 0.135 0.071 0.4810.104
ii) Sondrio, Italian Alps.N 0 0/N L
No. of HeadsL/N 3+M B+M/N
N155 ? N156 (6) N157 (4) N159(14)
9671 4289
12 3
24 12
0.125 0.042 0.571 0.135
1655 1867
0.167 0.775 0.428 0.752
82 20
11
0.854 0.282 0.0 0.123
meadow.pasture.dry stream bed,pasture.
High 0 in dry stream bed, low L in meadow.
iii) Austria: Oumpenstein and Orobming, Steiermark.0 N 0/N Exposure
N103(24) 134 11 0.082 meadow 2600 ft. FlatN104(13) 124 18 0.145 pasture 2400 ft. NorthN105(13) 131 26 0.198 pasture 2400 ft. South
High 0 in pasture.
iv) New Zealand (naturalised wild-growing populations)
A set of 12 samples was obtained from points at regular
intervals along a steadily rising transect from Motukarara at
about 30 feet above sea level to Springfield at 1100 feet,
45 miles to the west. Unfortunately, in spite of the favour
able arrangement of these samples, no clear trend could be
recognised.

209
Sample Ho. 120 121 122 123 124 125 126 127 128 129 130 131Scored 10 56 20 48 12 36 28 54 37 41 17 41Unmarked 220111 544 20 9937
0/N .20 .38 .05 .23 .42 .11 .14 .37 .24 .22 .18 .17
7. Small Groups of British Field-Scored Samples.
The association between morph frequencies and quantita
tively measured environmental factors has been dealt with above
in Section 3* For the remaining features of variation, the
only method of presentation possible seems to be comparison of
samples of closely similar origins but divergent morph frequencies,
in the hope of discovering associations between the morph fre
quency differences and the remaining differences in background.
For each comparison, an explanation can only be suggested;
a stronger indication would only be provided if a similar
pattern appeared in several such comparisons.
Because of their low frequencies, it is not possible to
make any useful comparisons of frequencies of any other morphs
except the unmarked type.
i) Wytham, Oxford. Field 3A. arid Ref. SP 471 f01 . N 0 0/N
01 25 21 0.84 Centre of field, water standing after rain.02 13 1 0.08 Sloping bank within 2-3 ft. of river.(Transect 200 yards long across field, from South to North)
1 48 15 0.31 30 ft. from stream.10 39 20 0.51 Close to patch of Caltha.2 43 16 0.37 Some Juncus; water standing after rain.3 59 9 0.15 Drier than (2).4 89 22 0.25 Near dense Juncus.
11 40 18 0.45 Near dense Juncus.5 41 15 0.37 Middle of dense Juncus.7 33 14 0.42 Behind raised river bank.6 27 6 0.41 Bank beside River Thames, 1-2 ft. higher.

21)0
The presence of Juncus and Caltha can probably be taken
as an indication of persistent waterlogging and bad drainage;
drainage would be best beside the stream and the r:ver, which
in summer would be 2 or 3 feet below the field level.
There would seem to be an association between high 0
frequency and bad drainage.
These samples were collected in areas only about 20 feet
across; it seems likely that different parts of the same clones
may have been sampled several times, and that the sampling
error is therefore greater than would appear at first sight
from the above figures.
ii) Wytham, Oxford. Field 3B. Orid Ref. SP 468 101.
N 0 0/N1 54 22 0.40 Near stream bank.2 37 9 0.24 Higher drier part (molehills).3 17 3 0.18 Behind raised river bank.4a 61 13 0.21 Kiddle of field, some Juncus.4b 40 33 0.83 Centre of field, away from drainage.5 34 11 0.32 Very damp, abundant Juncus.
These results are consistent with the association of high
0 frequency with bad drainage reported in (i), though they are
not so clear.
iii) Wytham, Oxford. Field 13- &rid Ref. SP 472.098-
Higher part of field, 3-4 ft. above other1 40 11 0.282 15 2 0.133 76 8 0.114 115 50 0.44 )I lc ?1 n*K* \ Riverside lower part of field,o 45 ^5 u.po )1 43 (0.75))

211
There would appear to be a divergence of 0 frequency between
the two halves of the field, which can probably be attributed
to the change in height affecting the drainage in the same way
as above.t
iv) Blenheim Park, Woodstock, Oxon. arid Ref . oP 440 163.
1 35 17 0.49 Short worn turf beside drive, dry, exposed.2 50 11 0.22 Clearing beside lake, longer grass, damper,
sheltered .
High 0 in exposed dry conditions, short turf.
v) Marston Perry, near Oxford, arid ,ief. SP 522 090 (One field).
1 91 13 0.14 Mixture of short turf and longer grass.2 60 2 0.03 Close-grazed turf near footpath.3 59 10 0.17 Close-grazed, exposed, dryish.4 123 11 0.09 Longer grass, damper, sheltered by trees.5 84 11 0.13 10 ft. lower than others on river bank.6 90 41 0.46 Longer grass close to hedge, sheltered.
No clear pattern.
vi) Sherbum, Co. Durham. Orid Hef. NZ 332 414.
1 50 19 0.38 Waste ground beside road, long grass;clover mostly in short turf on trodden paths.
2 75 21 0.28 Hard grazed pasture, with thistles.4 50 17 0.34 Hill top, floor of disused quarry. Clover
only on paths, acid-soil vegetation elseTf&ere5 49 17 0.35 On and beside more or less bare paths among
dense bushes.6 31 6 0.19 Open hill top, long grass.
High 0 in sheltered places and on trodden compacted soil.
vii) Volsingham, Co. Durham. Orid Refs. NZ 075 367, 073 378.
Hill 79 19 0.24 xiich pasture, N-facing slope, 600 ft. Town 1 54 24 0.44 Damp ground, narrow strip beside river. Town 2 45 15 0.33 Same field, 10ft. higher (about 450 ft.);
dryish pasture field.High 0 in damp place, low 0 in more fertile field.

212
viii) Stoneygate, Co. Durham. Orid Refs. N£ 350 508, 342 508.
1 159 44 0.28 Coarse grass, thistles.2 175 32 0.18 Finer grass, better pasture, closer grazed.
High 0 in denser vegetation.
ix) Thropton, Northumberland, arid Ref. NU 029 026.
1 130 59 0.45 Oliver bank, silt left by flood; rough grass.2 85 25 0.29 Slightly higher, firm ground, drier, closer
grazed.High 0 with dampness, less intensive use, longer grass.
x) Oxton, Berwickshire, arid Ref. NT 497 536. (Adjacent fields).
1 50 31 0.62 Rich fertile close grazed pasture.2 31 9 0.29 Coarser grass, few patches close grazed.High 0 with greater fertility, more intensive use.
xi) Transect up North side of Chanctonbury Hill, Sussex, from Buncton Manor Farm (low, N. end of transect, sandy soil) and Bushovel Farm to high ground at South end on chalk hills. arid Refs. TQ 147 136 - TQ 140 122.
Alt.(feet) AspectB.M.Fm. 134 23 0.17 Close fine turf 130 flatBush 1 59 3 0.05 Coarser grass, thistles 180 (S)
2 53 12 0.23 Longer grass, less clover 150 flat3 132 17 0.13 Rough grass 180 (N)
Cha. 2 83 22 0.27 Fine turf on slope, mole- ,on «hills, little clover. ^
3 30 6 0.20 Coarse turf. 700 NNo clear pattern.
xii) Between Fulmer ane Kingston, Sussex, arid Ref. TQ 385 093 - TQ 384 079. Transect up northern side of hills.
Altitude Aspect 1 70 21 0.30 Pasture, long grass 100 S3 57 3 0.05 Waste, long grass 140 NW4 27 2 0.07 waste, long grass 200 Kw5 57 10 0.18 Hillside fairly long grass 340 £6 19 3 0.16 Valley on hillside, mixed 40Q .,
short turf and tussocks.7 41 4 0.10 ^teep slope, hillside, do. 430High 0 in pasture, low on waste.
-V I\ J_l

213
xiii) Barton Hill, Yorkshire. 2rid Ref. 33 720 655.Alt. pH
1 85 19 0.22 Hilltop, rough pasture on 260 6.0sand
2 52 11 0.21 West facing, damper, finer 150 6.9grass
3 66 21 0.32 Damp, flat, almost on level 110 (6.0of plain to W., finer grass ( 6.6
Third sample appeared to have more 0 in ons part; more acid soil sample collected there.
Higher 0 with dampness and perhaps with acidity (especially if overall trend of increase with altitude is allowed for).
xiv) Saltergate, Yorkshire. Grid Ref. ,33 852 939.100 yd. Strip of roadside verge above steep west-facing slope.
N 28 9 0.32 Brown soil, pH 7.2C 48 8 0.17 Dark brown, pH 6.4S 11 - 0.0 Black soil, pH 5.5No other visible difference except that clover was less abundant on the more acid soil.Strong suggestion of higher 0 on less acid soil.
xv) Warter, Yorkshire. Grid Ref. SB 844 505.All in one field, grazed by cattle (and rabbits).
2 48 4 0.08 Top of field, slight slope, brown loam.3 53 18 0.34 Slightly lower, steep SB slope, on sandy
soil round rabbit holes.4 41 11 0.27 Flat damper bottom of field, 100 ft. lower,
dark loam.
xvi) Market Harborough, Leics. Grid Ref. SP 743 873.
1 90 6 0.07 Waste ground, herb layer not closed.2g 66 4 0.06 (Same field, ) Areas of very close grazed turf21 25 5 0.20 (horse pasture)Areas of longer grass.(significance of difference between the last two, 0.1 >P> 0.05). High 0 perhaps where clover part of dense vegetation.

xvii) Llangollen, Denbighshire. Grid Refs. ,J 228-243 402-421.
1 145 50 0.35 Fine dense turf. Exposed 660 5.7 flat2 80 26 0.33 Rough pasture (gorse); clover
only on short-grazed 1250 5.2 flat patches
3 34 20 0.59 Fine dense turf. Clover q,0mostly near and on track y^ A , °
4p 11 8 0.7 Path, close trodden turf QAn 4O m . 4g 8 2 0.25 Close to above, little cloveryuu " w5 r 50 12 0.24 Dense turf, dryish pasture 460 5.3 NW6 60 16 0.27 Rich damper pasture 370 6.3 flat7 64 23 0.36 Rough pasture between main
road and river, with 320 4.9 00 tussocks
High 0 on trodden paths, lower with high pH.
xviii) Ty'n-y-Maes, near Bethesda, Caerns. Grid Ref. SH 636 636.
1 37 7 0.19 Dry S-facin^ hillside; clover in depressions.2 27 13 0.48 Flat marsh land level with river.3 40 13 0.33 On earth bank below road; damp, above marsh.
High 0 in dampest conditions.
xix) Northpark, Sussex. Grid Ref. TQ 051 157. Transect across wet pasture field, almost completely surrounded by woodland.
12
34
56
7450
6986
5910
27
116
84
0.030.14
0.160.07
0.140.4
Dry corner, 5 ft. higher.Damp ground beyond grid of drainage channels,
Juncua abundant.Banks of drainage channel.?ira ground near drainage channel, little
Juncus.Lowest part of field, abundant Juncus .Less Juncus . not quite so low as (5).
Higher 0 frequency with worse drainage.

215
xx) Bangor, Gaerns. Combined results of several areas near harbour; Penrhyn Port and Penrhyn Estate, quayside, carttrack in woodland, pasture, and waste ground.
Closed, ungrazed veg.PastureOpen vegetation
Shaded Exposed
Short, clos e-grazed Not close-grazed
562139
3284
3680
55
13
320
518
0.090.240.33
0.090.24
0.140.23
Higher 0 frequency in:
Open vegetation
Ixposed conditions
Longer herbage.
xxi) Definog, Brecknockshire. Grid Ref. SN 925 279.
On flat strip of ground between stream (3-4 ft. below field level) and W-facing slope in higher part of field.
1 29 6 0.21 10 feet from stream.2 38 14 0.37 50 feet from stream, at foot of slope.
Higher 0 with worse drainage.
Features which these comparisons suggest may be associated
with high 0 frequency are dampness, trodden paths and perhaps
denser as opposed to close-grazed herbage. The dampness
factor appears not to extend to well-drained positions such
as river banks. It would seem plausible to combine the first
two features, suggesting that compacted, badly aerated and
waterlogged soil produces a higher frequency of unmarked plants.
It may be remembered that the opposite association between 0
frequency and wetness was suggested above (Section 6, Part (c)
and Part (f,i)). Wetness was also considered in Part (b)
(Spanish samples), with results which were less clear, though
higher 0 values were found in places described as near water
than those described as wet.

216
8. Conclusions.
a) Unmarked Phenotype.
The most abundant clearly definable class is that of
unmarked plants CO 1 ), and it is about their frequency patterns
that the most indications of reaction to the environment are
available. An association of 0 frequency with greater distance
north is the most definite of the results of the multiple
regression analysis of the British field-scored data (Figure
VIII(i)) and is supported by the mapping of data from the rest
of the natural range (Figs. VIII(x), (xiii), (xv)). When
attempting to link up the two sets of data, there is a strong
suggestion that the frequencies of 0 are hi^ier in the field-
scored samples (cf. Figure VIII(x)).
A second factor affecting 0 frequency appears to be altitude,
on the basis of the British data (figure VIII(viii)) and also
the Spanish data (Figure Vlll(xxiii)). There is also a sug
gestion in the British data of higher 0 frequency further west.
The type of agricultural exploitation, or its absence,
appears to affect 0 frequencies. Low 0 frequencies appear
on waste ground (Spanish and Polish data) and higher frequencies
under grazing than mowing (Polish, Spanish, S. Wales and Austrian
data)*
There are several indications of effects of wattr regime,
but the pattern is not simple. In the Bolish samples, dry
sites showed higher 0 frequencies; and this may be supported

217
by data from Denmark and the Italian Alps. Dhe Spanish
samples offer a more confused picture, with higher 0 frequency
on intermediate sites. In the British field data on the other
hand, high 0 frequencies in wet places are indicated by several
comparisons (particularly the transects in fields at Wytham and
Northpark). Again there is a suggestion that good water supply
is not the factor alone, so much as excessive water supply,
leading perhaps to exclusion of air by waterlogging.
Phis can be linked with the finding of high 0 frequency
on trodden paths as opposed to longer nearby vegetation in some
British samples. On the other hand, denser vegetation in
contrast to short grazed (rather than short-worn) seems to be
associated with increased C frequencies (particularly the horse-
grazed pasture at Market Harborough).
b) Simple I-alleles.
The frequencies of L are the complement of those of 0,
and reflect the same environmental patterns.
The measure of heterogeneity among the L marks, presented
as the corrected LL frequency, shows an increase with southern
and western position and low altitude in the British isles
(Figures Vlll(ii), (vi), (ix), (xii)). This fits the indica
tion of the map (Figure Vlll(xxii)) of low frequencies in the
extreme northwest (and southeast) of the lange rising to a
ridge of high frequencies between them.
H frequency is presented only by means of one map

(Figure VTII(zxi )) which suggests a high frequency around
France, and somewhat lower frequencies elsewhere. If the
contribution of H (plants scored as LH) were removed from the
LL map, defining the class of L-marks more narrowly, it would
be converted to two regions of high frequency in northeast
and southwest Europe, with a trough, or at least a saddle,
of low frequency between them,
c) Frequencies of the Broken-yellow mark may increase
towards the east in the British Isles (Figures Vlll(vii), (xi)),
which would fit the decline towards the edge of the range shown
by the maps (Figures Vlll(xiv), (xvi), (xvii)). Both British
and Spanish data suggest a slight decrease towards higher
altitudes. The Polish data suggest an association with wet
ness, but this may only reflect a general tendency to move in
the opposite direction to 0 frequency.
d) The Broken mark is apparently absent from Britain and
rare elsewhere. Its high frequency in Switzerland, Yugoslavia,
and Greece lies in the same area as the isolated occurrence of
the marginal type, and supports the idea of a connection between
them. This has been assumed, and K frequencies added into the
figure presented in the map (Figure VHI(xviii)).
e) The Basal mark is generally rare, and within Britain
only shows a slight association with low altitude (also in
the Spanish data) and with southern position (Figures VHI(iii)),
which opposes the interpretation of the map pattern

219
(Figure VHI(xix)) as a dine rising to the northwest, and
suggests it should rather be a falling off in all directions
from a centre of high frequency in Prance.
f) I'he Filled-in mark frequency is also slightly associated
with southern position in Britain (Figure VIII(iv)), which fits
the map pattern of an increase towards the south and east
(though this does not extend beyond Europe: Figure VIII(xx)).
There are also suggestions in the Spanish and Polish data that
it may be more frequent on waste ground and less frequent in
meadows.

PART 4
COMPARATIVE STUDIES

20
CHAPTER IX
LEAP HARKING IN SPECI3S RELATED TO T. RJSP2KS
1. Significance and Possibility of Comparisons.
iAhere is a polymorphism in T. repens for the presence
(and variation) or absence of whitish V-shaped leaf markings.
One may presume that the effective expression of this character
depends on the interaction of many genetically determined pro
cesses, but the observed variation in phenotype can probably
all be accounted for by a set of alleles at one locus.
Even in an outbreeding species, drift or selection would
tend to eliminate genetic variation. There is a strong presump
tion that examples of variation actually found are rarely those
which have recently arisen and may soon disappear, but very
often those which have persisted because of some balancing
mechanism opposing any tendency towards fixation. Evidence
of a long history of the presence of such variation would provide
a very strong argument for the existence of such a mechanism.
The presence of markings of a similar kind exclusively
in a restricted group of related species would be a strong
indication of inheritance of the basic mechanism producing the
markings from a common ancestor. The distribution, within such
a group, of uniformly marked, variably marked, and uniformly
unmarked species might give some further information on the
ability to survive under selection, both of the mechanism by

221
which marks can be produced, and of any mechanism favouring
the persistence of variation in this respect.
Markings very similar in appearance have been described
in other species of Trifolium. Their appearance in related
species suggests they may be truly homologous and have common
ancestry. Similar markings have also been mentioned and
illustrated by Healy (1953) in Parochetus communis. also in
the Trifolieae (Willis, 1955). Unfortunately most of the
rather few reports of marking in Trifolium are much less
detailed.
Red markings of various types resembling those in j?. repens
have also been described in other related species. Letails of
these are also of interest here bcause there are reasons such
as the occurrence of V-shaped markings both red and white,
which suggest some connection between the two. Some references
also confuse the two colours.
In Medicago arabica (also in the Trifolieae) the leaflets
are 'usually blotched 1 (Clapham et al., 1962). This 'purplish-
brown blotch ... is sometimes absent 1 (Healy, 1953; cf. Taubert,
1894). I have seen specimens of Medicago with a red blotch
which was thumbnail- or ores cent-shaped, and more directly com
parable with V-markings in Trifolium. A blotch also occurs in
k. intertexta (Stahl, 1896). I do not know of any other report
of comparable markings in the Leguminosae.

222
It seems plausible to assume that the mechanism by which
white V-markings are produced in these species arose only once,
in a population ancestral probably at least to all the genus
Trifolium and Parochetus. i'he coincidence of shape and the
genetical and physiological associations between red and white
markings suggest that one may have arisen in connection with
the other (cf. p. 69), and that the ancestor from which at
least the red V-marks are derived is also ancestral to Medicago.
Direct investigation of many other species would have
been £eyond the possible scope of this work. Some observations
made in other species of frifolium and on Parochetus communis
will however be described below.
An attempt has also been made to collect information on
the occurrence of markings in other species. The published
references are few and scattered - the only published reference
principally concerned with leaf markings which refers to them
in more than two species is Brewbaker (1955), who lists seven
other species in which marks like those of T. repens occur.
The greatest amount of information compiled specifically about
leaf markings is unpublished.
Markings presumably often seem, to taxonomists concerned
to give a general description of species, to be of trivial
importance, and because of their variability of even less use
in species identification. Perhaps also for reasons of space,

many authors of floras and monographs make no mention of them
at all. Others do mention them in some species - most commonly
in T;. repens and I. prat ens e - but in some cases omit any
reference under these species while referring to markings in
other cases. For example, there is no reference under £. repens
in Grenier and 0-odron (1848), though four other species are
referred to as having markings; and none under T« pratense in
Bentham and Hooker (1924) though marks are referred to in three
other species. A most remarkable case is that of Lowe (1868)
who actually refers to the absence of markings in four species,
and to its presence in four others, but makes no reference to
them under £. prat ens e. Most authors only refer to marks when
they are present, and lack of reference suggests therefore that
markings are absent, though the examples above show that this
is not reliable. No author seems to have gone so far as to say
that since markings occur in some species, their presence or
absence should be referred to systematically in all; and among
those references that are made there are often differences of
phraseology without difference of meaning, suggesting no
standardisation.
The questions one would like to ask about each species
begin with whether white V-shaped markings occur at all. Many
references refer to markings without any indication of their
shape or position, and often not of their colour. Descriptions
like 'leaflets spotted 1 , or 'leaflets often marked 1 probably

224
refer to white marks, but are ambiguous. Further confusion
between the white and red marks is produced by some remarks
about frequency: for example, Gibelli and Belli (1891) on
T. fragiferum; 'usually with whitish or <krk marks'. Similarly,
Allan (1940) in T. repens 'often variously marked with white
to purple blotches or flecks', and Ascherson and Graebner
(1906-1910) on T. pratense 'often with dark or light half-moon-
shaped or irregular spots'. This latter presumably refers to
light half-moon-shaped V-marks and to dark irregular sipots:
the former are usually present, and the latter probably very
scarce. Further Questions one would ask about each species
are whether there is variation between different types of
marking, and if so, what thsir relative frequencies are.
Many references do not answer these questions clearly.
Because of the scattered, incomplete and sometimes ambiguous
nature of the published information on this topic, because
quite a large amount of unpublished information is available,
and because all the sources available were insufficient to
answer any of the questions above for more than a fraction of
the genus, it seemed worth while to tabulate together all the
information that could be found before proceeding to draw any
conclusions from it about correlations of marking with
phylogeny.. _ _
Out of 290 species^(Clapham, Tutin and Warburg, 1962),
some indication of the presence of white markings has been
found and is presented below for about -twenty-fivo species, and

225
statements of absence of white marking for thirty more.
Because most authors have only or usually referred to marks
when present it seems likely that many at least of the better-
known species not mentioned below also lack marks, and do not
appear because no author consulted felt a need to say so
positively. The twenty-five marked species thus probably
represent a sample of rather more than the fifty-five species
reported on below.
For many of the species on the list the information,
particularly about the occurrence of variation and relative
frequency of different forms is far from adequate. In other
cases confirmations would be valuable since in several of the
cases where there are a number of reports they are not identical
or even compatible. For ether species there is too much
detail relevant to present in the table, and this information
has been added after the table in the form of notes.
Before presenting the table general accounts will be
given for some species for which there is particularly abundant
information. New observations made on these species in the
context of the present work will also be described.
2. T. pratense
a) New Observations.
Many of the £. repens habitats investigated contained
£• Pratense. and some acquaintance with its phenotypes was
acquired, though no systematic scoring was done. The

226
phenotypes previously reported (see below) have all been seen -
unmarked, central, basal, and apical V, the central-position
V particularly being variable from very broad to thin, and
sometimes being reduced to a triangular V-point.
Two plants were seen in a pasture at the Oxford University
Farm, Wytham, with moderately broad central marks, but with
on one half-leaf let of some leaves a mark extending to the base
of the leaflet. This did not seem to affect less than half a
leaflet at a time, but otherwise rather resembles the 'smeared 1
variation of some V-marks described above in j?. re pens. The
description of what may be the same phenotype by Smith (1950)
is referred to below.
Only one plant of T- prat ens e with any kind of red leaf
marking has been seen during this work. This plant, with an
intense red flecking, was found growing as a weed in the garden
of the Oxford Botany School. The flecks in their colour, sharp
outlines, and some elongation parallel to the lateral veins of•f
the leaflet resembled the R flecked phenotype of T. repenst
they differed in being larger and more frequent, covering about
a quarter of the upper surface of the leaflet, and by being no
less frequent near the leaflet margin than near the midrib.
Ascherson and Qraebner's rather unclear reference, mentioned
above, could well be to a similar type.

227
b) Genetic Control of Whitish Leaf Marking in I. pratense.
fhis is the only species for which genetical information
comparable to that on :£. re pens has been published; genetical
investigations were in fact carried out on this species many
years before £. repens. and the same is true of work on the
anatomical basis of the marking (Kajanus, 1912).
The presence of the marks was mentioned by Sowerby (1794)
and Smith (1829), though without mentioning theJr variation.
Variation was mentioned by Grenier and Oodron (1848).
Kajanus (1912) first reported the presence of mark
as genetically dominant to absence in this species. He also
reported variation among the marked types and a genetical basis
for it, central leaf spot being dominant to basal. Grmelin
(1914, 1916) published similar observations. Wexelsen (1932)
made many observations on leaf markings in the segregating
families produced by successive generations of sib-crossing
in a programme designed to produce inbred lines of j}. pratense.
He did not apparently do any systematic crossing to investigate
the interactions of the various segregating systems he found
affecting leaf markings.
He confirms the dominance of the presence of leaf mark,
and records that heterozygotes for the factors for presence and
absence of mark were no less strongly marked than the marked
homozygotes. He reports one plant whose progeny segregated as
though the parent was heterozygous for marking, although scorings

228
before it died recorded it as unmarked. This, and some
unusual segregations, are taken to indicate mark-suppressor
genes. In inbred lines breeding true for leaf marking he
distinguishes three marked phenotypes, with marks small, large,
and extended (towards the leaflet apex), as well as unmarked
forms. The difference between large and small is unifactorial,
large being dominant, while segregations for large and extended
show no clear pattern. He reports a phenotype with a weak
mark; strong and weak marks segregated sometimes unifactorially
and sometimes apparently bifactorially with strong mark dominant
(3:1 and 15s1 ratios). He reports unifactorial determination
of leaf-mark colour, yellow mark being dominant to white. He
also reports oligogenic variation in leaf colour. Other abnor
mal phenotypes in his inbred families include albino and yellow
seedlings, seedlings with a mosaic of white spots or entirely
white, and a form whose cotyledons have a Qarge yellow spot in
the centre.
P.E. Smith (1950) presenting, in a thesis, work apparently
not further published, reports crosses carried out specifically
to investigate leaf mark inheritance. He confirms the reces-wX
sivity of the allele m for no mark, and its epistasis to the
genes modifying the mark.
He reports that Mb, the allele determining central as
opposed to basal mark (nib), is very closely linked to the M/m
locus. The difference between this and a one-locus-three

229
allele system more closely resembling the T. repens V-locus
is that a chromosome carrying the recessive epistatic factor
m, giving an unmarked homozygote, can also carry the dominant
factor Mb, and thus, combined -with a chromosome M mjb from a
line pure breeding for basal mark, can produce in the F., a
central mark, different from both parental phenotypes.
He reports a pair of complementary factors, A/a and T/t.
epistatic to Mb/mb. giving an apical mark in an# K A T
genotype. However, he also records some plants as having
both apical and central marks, though there is no place for
this phenotype in his table of genotype-phenotype relationships.
He reports some central marks having white markings also
below the white mark - and that this occurs sometimes only on
some leaves of the plant, while others have normal central marks
The occurrence of what may be this phenotype is referred to as
a new observation above.
Smith also reports that while the markings are plainly
visible on the first unifoliate leaf in some plants, in others
no marks were shown until the bracts on the flowering stem.
Some plants behaving as Mm in crosses were never recorded as
marked at all. This resembles the case quoted by Wexelsen.
In other plants, the mark was seen only in the seedling. The
possibility, and some evidence of similar variation with time
in ]?. repens has been discussed above.
Thus, in 3!. pratense. four separate loci at least have
been described affecting the mark phenotype, and each has been

230
described as possessing only two alleles. Altogether, as
complete as possible a contrast with the one-locus-many allele
system found in £. repens.
This suggests that although the underlying mechanism for
the production of marks may be homologous in these species, and
can be traced back to a common ancestor, the genetic mechanism
producing contemporary variation in leaf-mark phenotypes are
largely if not completely unrelated; the V/v and K/m do at
least resemble one another in dominance, which leaves the Mb.
A, and T loci without known variable homologues in J?. repens.
c) Red Leaf-Markings in j?. pratense.
The observation of a single, isolated example of a
£. pratense plant with red fleckings on the leaves has been
referred to above. Ascherson and Oraebner (1906-1910) des
cribe T. pratense as 'often with dark or light half-moon shaped
or irregular spots'. 'Lightish half-moon shaped* clearly
enough refers to the whitish V-marks which my experience and
other reports (Kajanus, 1912; Healy, 1953; Foury, 1954)
indicate as usually present. 'Dark' and 'irregular 1 together
may then refer to a fleck marking like that described, though
there is no other evidence that this occurs often.
R.D. Williams (1937) describes complete linkage between
M, Mb. and yellow-mark colour loci, and an 'anthocyanin factor 1 .
W. Williams (1964, p. 15, cf. 74), quoting this source, says
'the presence or absence of pigment in the mark behaves as an

231
additional allele of the leaf mark series 1 , but I understand
(personal communication) that, although this remark immediately
follows reference to red markings, he is referring in this
sentence to yellow or white colour, not the anthocyanin factor.
Evidence for rare, irregular flecked, red marks has been
mentioned above. It is surprising also to find references,
in American floras (from outside the species' natural range),
to T. pratense leaflets *often with a purplish spot near the
middle 1 (Rydberg, 1922, cf. Abrams, 1944).
3» ±. nigrescens; Homology with JT. re pens at V-locus.
One of the few hybridisations achieved in this genus is
between T. repens (2n = 32) and £. nigrescens (2n = 16). When
colchicine-treated autotetraploid parents are used, a fertile
allohexaploid hybrid is produced (Brewbaker and Keim, 1953).
Segregation in Fp and backcrosses suggest tetrasomic inheritance
for the V-locus and the 3 incompatibility locus. Prom this it
is concluded that the T. nigrescens genome is closely similar
to one genome of the presumed autotetraploid bivalent-forming
£• repens. and specifically that the allohexaploid possesses
four chromosomes bearing the V-locus, all sufficiently similar
to pair easily. In a later paper Brewbaker (1962) says that
further unpublished work confirms the horology. This suggests
that T. repens inherited its V-locus from a diploid parent,
closely related to T. nigrescens, which itself shows polymorphism
for leaf-marking. T. nigrescens occurs in the Mediterranean
area (Taubert, 1894; Hossain, 1961), not extending to the

232
British Isles; in most taxonomic treatments it is placed fairly
near T. repens; an important difference is that it does not
root at stolon nodes and is annual.
4. !• fragiferum; New Observations, and Previous ConflictingReports.
This species is referred to by Smith (1829), Lowe (1868),
and de Basto Folque (1949) as unmarked, and many authors who do
refer to marks in other species where they report their occurrence
make no mention of them in this species, suggesting that they
are taken to be absent. Oibelli and Belli (1889) however say
that it usually has whitish or dark marking on the upper surface
of the leaflet. Evans (see below) also refers to the presence
of marks.
In the course of this work this species has been observed
and collected and grown in the greenhouse (sometimes being mis
taken for unmarked 3?. repens). It was observed that although
an unmarked form was common and perhaps predominant, some plants
showed a faint thin yellowish-green V about half-way up the
leaflet. Most of these plants, and some with no detectable
pale V, also had a thin red V, lying parallel to the pale V
when present and a millimetre or so closer to the tip of the
leaflet. These observations of marks all refer to plants
collected in riverside fields at Wytham, near Oxford; marks
are perhaps less frequent or even absent in other populations.
This red V may correspond to the dark marks referred to by
Oibelli and Belli.

233
5. Other Species of Trifolium.
a) British opecies not described as rsarked in the Flora.
In the Flora of the British Isles (Clapham, Xutin and
Warburg, 1962), the reference to the frequent presence of white
markings in j?. re pens. £. pratense. and j?. medium leaves at
least a suggestion that the other species described are un
marked. In fact, for £. ochroleucon part of the description
by which it is keyed out is 'leaflets never spotted 1 (thus
distinguished from J?. pratense and £. medium). There are three
species with full descriptions not referring to markings in the
Flora, and not positively described for presence or absence of
markings elsewhere; £. ornithopodioides. i'. strictum. and
£• micranthum (though this may be what, Brewbaker means by
'£• filiforme (? dubium)*). It seems likely that they are un
marked, though they have not been included in the tabulations.
On the other hand, there are references elsewhere to
markings in species which are described in the Flora without
reference to markings. References in the Key to Varieties of
Subterranean Clover, and by Brewbaker to markings in jD. incarnatum.
seem specific enough that there is no occasion to question them.vvUl
The preferences to markings in T. florae ratum are both over 100
years old, bat 1 very specific, e.g. dowerby, (1794) 'Leafletsa V-WArk V> illu&trA&Jl Uj CUfcW"~et«A f»«7
often marked wioh a transverse white or yeHowisli spot': j For
T. dubium. there is only a passing reference to marking
(Brewbaker, 1955) not repeated by this author in his later,list;

234
this is opposed by 3vans' report of it as unmarked. 1). scabrum
is described by Lowe (1868) as 'pale-spotted 1 and by Lojacono
(1891) as 'white-marked'. In both cases information from
direct observation would be particularly interesting.
b) New Observations.
Z- dubium has been seen frequently around Oxford, nevei?
with any kind of marking.
A visit was made to a locality for T. scabrum. Pen Oinas
Hill, Aberystwyth, and material was collected of £. scab rum.
T. dubium. and £. campestre. T. scabrum was scarce, two small
patches being found, about fifty plants in all. None showed
any form of marking* No white marks were seen in the other
species either, but in both, plants with occasional red flecks,
irregular in shape and elongated along the leaflet lateral
veins, were seen; one plant out of twenty in j?. campestre.
and two out of a larger number in £. dubium.
Brewbaker, and Lowe and Lojacono, may indeed have seen
white-marked plants of T. dubium and T. scabrum. respectively,
but it does seem fair to be very reluctant to accept the report
of marking in T. dubium.
Plants of £. hybridum have been examined, sown in fields
in Britain and among seedlings growing from seed sent from
Bulgaria as T* repens. As reported by various authors, they
are never marked.
Plants of Trifolium medium were examined growing wild in
Tatranska Lomnica, Czechoslovakia. Some groups of ten or

235
twenty plants all lacked markings, in others a minority showed
very faint central white spots, often shapeless, while a few
of these, and one plant with a distinctly much clearer mark,
approached the broad lowish flattish V-shape illustrated in
Clapham, Tut in and Warburg ,(19 57).
&• jferochetus communis; White and Red V-markings outside frifolium.
Healy (1953) illustrates a V-shaped mark in Parochetus
communis. and also describes it as usually having dark flecks
on the leaflets. Ae the only member of the Trifolieae (willis,
1955) and outside the genus Trifolium to show white V-marks
this is of some interest. (Red spots in the centre of the
leaflet, sometimes approaching a crescent shape, are known in
Medicago,)
The species is native at high altitudes in the Fast Indies
(Oliver, 187t), but is found also in tropical Africa (Willia,
$955). The Botanic Garden of the University of Marburg an
der Lahn, Germany, lists this species in their exchange list,
and from them a seed sample was requested and obtained.
On examination of twenty plants five weeks old, mostly
with a dozen or so leaves and one or two runners an inch long,
they all showed some sign of marking. Younger plants in a less
brightly lit position showed much less conspicuous marking, but
(consistently with Healy's description) no clear variation could
be seen between plants under the same conditions. As in Healy's
illustration, the white mark is lower on the leaflet than is ever

seen in T. r epens . The mark is very obtuse, almost flat,
and each wing of the mark is slightly convex distally, so that
at the midrib there is a slightly reentrant configuration.
All the plants showed some sign of red markings, consisting of
irregular scattered flecks, but also of a red 7, which was at
this stage almost exactly superimposed on the white V when both
were well developed. The red V was slightly more distally
placed than the white V, and several weeks later they were
often completely separated. The clarity of both markings
varied greatly from leaf to leaf - the majority of leaves at
five weeks old showed no trace of either V-mark, only scattered
red flecks; all the plants however showed some trace of both
V-markings. The clarity of the two types of marking was
fairly closely correlated; sometimes both were present on one
side of a leaflet and absent on the other, but at other times
one might appear with full clarity without the other. Healy
does not refer to this great degree of intra-plant variation,
nor to the red V.
When both marks wer4 well developed, but separated, as in
the older plants, a fainter development of red pigment was often
seen in the area of the white V. There seem thus to be parallels
here to the separate red V and to the development of red pigment
precisely confined to the white V, both described above in
T. repens. * •" - *T I/t
<>j ^ ix-ko^. o^A t ^U Cfi*J i

237
7. Table of Information on Occurrence and Variation of Leaf- Marking Phenotypes in species of Trifolium.
a) Sources of Information.
Leaf-mark phenotypes of a few species are mentioned in
many floras and monographs. The largest number of species with
marks referred to is probably in Qibelli and Belli's series of
papers (Oibelli and Belli, 1887, 1889a, b, 1891, 1892, 1893;
Belli, 1894).
The most important unpublished source is a list received
indirectly from Professor J.L. Brewbaker. It was prepared by
him in about 1960, representing the extent of his knowledge to
date concerning twenty-five species he had worked with, and
others in Dr. E.A. Hollowell's collection, making thirty-seven
in all. The table was prepared to combine information about
breeding system, chromosome number and leaf marking occurrence
and variation.
Dr. A.I-JL. ^vans has provided a similar list with details
of twenty-seven species, on the basis of observations made
during her thesis work.
Other information has been acquired in the course of
correspondence with some of the authors arising from the papers
quoted (Gillett, 1952; Hossain, 1961); the anonymous 'Varietal
Key to Subterranean Clover', prepared at the Waite Agricultural
Research Institute, Australia, was lent by Prof. J. Black after
a request for further information after reading a paper by him
(Black, 1960).

238
information was obtained from the cyclostyled list
of 'Seeds Available and descriptive Notes' from ilegional Plant
Introduction, U.J. bept. of Agriculture, Geneva, liew York,
prepared by Dr. D. Dolan.
Information was also obtained in correspondence with
Mr. A.V. Bogdan, of the National Agricultural Research Station,
Kitale, Kenya, and arising out of this, with a former worker
at Kitale, Dr. J.C. Edwards.
In the table below, these unpublished sources are referred
to by name only; other dated references appear in the main
reference section. Under each species, information is given
in order of publication, one line for each source. Authors'
names have been added to some specific names where they were
not given in the source, but where there is any confusion or
complication, these names are given exactly as they appaar in
each source. 3ome references to .T. repens and T,. pratense
have been omitted; for the other species this is a complete
list of the references discovered.

239
b) Notation used in Table IX. 1 to represent descriptions.
V/hite Marks
0 Unmarked .
+ Marks occur (whitish).
V " " " ; some reference to shapeand position.
++ or VY Marks occur, and are of more than one kind.
+ ,0 or V,C i.arks occur, but some plants are unmarked.
(Letters as used by Brewbaker, 1955; one letter alone indicates no variation, more than one refer to a range of marVs in a variable sp e cie s . )
0 Unmarked .
A Simple mark.
B Broken mark.
G V-point.
Forms clearly indicated as more common stand first, followed by semi-colon.
Red Marks
R iied or dark marks, shape and position not clearlyindicated .
RV Red V-shaped marks.
RT Red tip associated with a whitish V.^ RF Scattered red flecks (cf. R in £. repens ) .
RL Whole leaf red (cf. R1 in I), repens).
+ (after red-mark symbol) Common.
+ Variable (relative frequencies with and without ~" not indicated).
, usually not present.
f* Mark illustrated as well as described.
S U* Information based only on illustrations, noreference or description in text.

240
Table IX.1. Information on the Leaf-Mark Phenotypes ofTrifolium species.
SPECIES WHITE MAR&3 RED MRKS SOURCE
agrarium L. (aureum Poll.) 0 agrarium (aureum) 0
alexandrinum L.
ambiguum M.Bieb. 2x=166x=48
arvense L.
baccarinii Chiov.
berytheum Boiss.
bocconii Savi
campestre Schreb.(procumbens L)
campestre
carmeli Boiss.
cernuum Brot.
ciliolatum Benth,
dalmaticum Vis.
davisii Hoss.
00
0; AC,A,B,&c (Note 1)
* +
A, ?0
0
0
0
0
00
0
0
* +
diffusum Ehrh. (as pratense ssp diffusum)V
diffusum Ehrh, +
dubium Sibth. (minus Sm. ) 0 dubium +
0
RV
RV
R + RV
Evans Brewbaker
Evans Brewbaker
Evans EvansBobrov, 1947 Brewbaker, 1955 Brewbaker
Evans
Bogdan
Evans
Brewbaker
Evans
Brewbaker (this thesis)
Evans
Brewbaker
librams, 1944
de Visiani (1847-52)
Hossain, 1961 Hossain
Gibelli+B 1889 bobrov 1949
Brewbaker 1955 (this thesis)

241
SPECIES
echinatum M.Bieb.
elizabethae (Jrossh.
filiforme (? dubium) (filiforme L ? p.p.)
fragiferum L.
WHITE MARKS RED MARKS SOURCE
glomeratum L.
hirtum All.
hybridum L.
incarnatum L.
isthmocarpum Brot.
johnstonii 01iv./~ . Q johnstonii (Note
lappaceum L.
lupinaster L.
maritimum Huds. (squamosum 1)
** +
0
00
R
**
0; faint A RV +
V,0 0; V 0
•»• (Note 2) R7 +0 ""
0; + (? R)RV
0; VC 0 0
0 0,A,C
0,A 0,A
00
0
0
0
Brewbaker
Bobrov, 1947
Brewbaker
J.3. Smith 1829Lowe 1868Gibelli4-B. 1891de Basto F. 1949Evans(this thesis)
3owerby 1794 J.E. Smith 1829 Lowe 1868 Clapham, T&W 1957Evans
Gibelli+B. 1889 Brewbaker Hossain 1961 Hossain
Bentham & H, 1924 Bobrov, 1949 Evans Brewbaker
Evans Brewbaker
Poury 1954 Brewbaker
Brewbaker
Brewbaker
"vans
Evans
mattirolianum Chiov. Bogdan

242
01'
medium L.
mexicanum Hemsl.
michelianum Savi
nigrescens Viv.
occidentale Coombe
ochroleucon Huds.
pallidurn
physodes S£ev.
polymorphum Poir.
pratense L.
WHITS MARKS HZ) MRK3 30URO
0,A,CV0,A
0; V faint; V clear
0
C f A
+,0RI
often spotted
RF +
0,A,B il -f
0; ?V(Note 4) 3? - 0C
0
0
0; +
V-shaped spots ilV
0
V V
sometimes.-' spotted V,0 Uote 5) V; 0
RF-f
.vansBrewbaker 1955 Brewbaker DolanGlapham, T&W,
1957, 1962 (this thesis)
Brewbaker
Brewbaker 1955 Brewbaker
Lojacono 1891 ABch.&S. 1906-
1910Borg 1927 de Basto ?.
1949
0,V?
Brewbaker 1955 Brewbaker
Coombe 1961Kvans Qehu 1963
Clapham, T&W 1962
Brewbake r
aibelli+B. 1891 de Basto F.
1949Hossain 1961 Ho s sainBrewbaker
Sowerby 1794 J.3. Smith 1829 ^renier-fG-. 1848 Jibelli+B. 1889 Kajanus 1912 Omelin 1914,
1916 Ascherson-»-0
1906-10

'43
SPECIES WHITE MARKS RED MARKS
pratense L.(c6ntd.) +,0further genetical variation
'often dark spot near the middle 1 .
further genetical variation V; 0 V; 0
cf. diffusmm (pratense ssp. diffusum)
00
procumbens L.procumbens (agrarium) 0
(procumbens L. p.p. = agrarium Huds.)
purpureum Loisl. 0
radiosumdiosum A (radiosum Whlbg. = globosum L. )
refiexum L.
repens L.
A.BUi1 ) RT in whiteB
**
0
** +, V;
0
00
0,many V'sRP
V-locusV-locus; Double-V marks0,A,B,C; other V's
0; other V's
.c-locus; 4 alleles
SOURCE
Borg 1927 Wexelsen 1932
Abrams 1944
de Basto.?. 1949 P.E. Smith 1950 Healy 1953 Poury 1954 Brewbaker 1955 Glapham, TiVJ,1957, 1962
Brewbaker (this thesis)
Lowe 1868 Brewbaker
Brewbaker
Brewbaker
Brewbaker
3owerby 1794 tfray 1821 J.^. "mith 1829 Lowe 1868 Lojacono 1891 Reichenbach 1903 Bentham+H. 1924 Borg 1927 Atterod 1937-44 Allan 1940 Brown 1947 Brewbaker+A. 1952 Brewbaker 1955 Garnahan et al.
1955
do.Red V (assoxj. Vby )Hovin + 0. 1961
C Glapham et al.^~~1962

244
repens L. (contd.)
resupinatum L.
ruepellianum Fres. (cf. subrotundum)
scabrum L.
scutatum Boiss.
semipilosum Fres.
perhaps two
spumosum L.
squarrosum L.
stellatum L.
striatum,L.
subrotundum Steud.
V-locus R-locusOther red (assoc V
(New Phenotypes, see above)
,0
** RV00
0
(ii) 6)
0
0
0,A,white midrib0white midrib; V
often spotted + ,0
0** c0,0
00
RT
0,0
0,A,CHV-point
(Oillett 1952 places the greater part of this species in 1. ruepellianum. q.v.)
subterraneum L.
(Note 7)V+ ,0 0,+
sometimes spotted
Davies 1963 do.
(this thesis)
Lowe 18681891
Borg 1927 Allan 1940 Foury 1954
Brewbaker
Lowe 1868 Lojacono 1891 (this thesis)
Brewbaker
EvansBrewbakerBogdanEdwards
Orenier+G. 1848 Lojacono 1891 Jibelli-fB. 1892 de Basto ". 1949 Foury 1954 Brewbaker
Evans Brewbaker
Brewbaker
Brewbafe r
Brewbaker
Orenier+O. 1848 Lowe 1868 Gdbelli+B. 1893 de Basto F. 1949

eubterraneum I
euffocatum L.
tembense Fres.
tomentosum 1.
uniflorum L. variegatum Nutt.
vavilovi iS
vesiculosum Savi
C,+ RF + Healy 1953V,0 Foury 1954+ Brewbaker 1955
Red If. (1 dom.gene) Brockwell 1956
++4-
0
iied leaf only ex- pressed if nitrogen shortage
•oRed If It, base + ' BRed V distal to"" white
Red base or RV point
000
0
+ ,0 V,0 -h,0 V
sspp. multistriatum Koch V,0mutabile~Porten- 0; faint mark
-A , ^ schlag
V ? always
Parochetus communis Buch. Ham* *
RV + RF ? always
rankel+ . 1958
Evans
1960)
Black 1960
Anon (cf .
Lowe 1868
Brewbaker
BrewbakerEvans Brewbaker
Svans
arenier-i-G.1848 3-ibelli-i-B . 1892 Asch.+(K 1906-10 Bobrov 1949 Vicioso 1953 Evans
1892 1892
Healy 1963 (this thesis)

2.16
Note 1.
In hexaploid T. ambiguum. Jvans refers to some phenotypes
as resembling the low, high, broken, -aid broken-with-yellow-tip
phenotypes of T. repens. as well as to unmarked plants, and also
to two new phenotypes. These contain a V with a reentrant apex
made up by straight segments running out from the midrib at a
slight slope towards the leaflet tip; more than half way to the
leaflet margin these turn at a sharp angle and thin extensions
run towards the leaflet base. In one of these types, the re
entrant an^le is filled by a yellow blotch. The other, simpler
mark sounds rather like a more extreme version of the 'V 1 mark,
with 'smearing 1 confined to the midrib region, described above
in T. jgepens.
Note 2.
According to Oibelli and Belli (1889), a form £. hirtum
All. var. pictum Roth has been described, with reddish coloration
on the leaflets. They grew plants of this form from seed
received from xiotanic Gardens at Lyon and Madrid, and observed
that the red mark was irregularly arrow-shaped, or less often
without a definite shape. This mark was very distinct in some
forms, but quite absent in others. Below this mark when present,
(it is not clear whether this means on the same part of the leaf
and covered by the mark, or lower down the leaflet towards the
base), there was almost always an irregular whitish zone. These
authors do not feel that the other morphological differences from

'47
the species supposed to distinguish this form are clear enough
to give it taxonomic recognition.
Note 3.
According to Gillett (in litt.) the true £. Johns to nii
Oliv. is now classified as a subspecies - J\ burchellianum Ser.
ssp Johnstonii (Oliv) Cufod.; but the name £. Johns to nii Oliv
has been commonly misapplied by writers on agriculture in Kenya
to a plant which is in fact j?. semipilosum Fres. var. glabrescens
Oillett (cf. Gklllet, 1952), though the two may be related. It
is therefore possible that material described under this name
may belong to either of these two taxa.
Note 4.
i» occidentale shows little variation. Among the ten
clones originally described by Coombe, most were identical and
unmarked. One has 'dark markings along the lateral veins*
(perhaps equivalent to R in i\ repens). Another has 'obscure
yellowish-white markings on the leaflets'; it is not cloar that
these should be regarded as comparable to the V-markings in
other species.
Note 5.
Gribelli and Belli (1889) describe the main species
!• Pratense as often marked with a whitish crescent- or arrow-
shaped mark. As varieties they describe var. sativum Kchbch.
and describe for the first time var. collinum (Uib. et B.). One

character in which the two descriptions differ is leaf-marking,
though the authors do not lay any special stress on it. Var.
sativum is described as having a large, arrow-shaped white mark,
while var. collinum is described as lacking arrow- or crescent-
shaped marking.
Note 6.
According to Edwards the form of T. semipilosum with the
white band along the midrib is morphologically rather distinct,
and consistently breeds true for the leaf mark phenotype. It
may be genetically isolated and taxonomically distinct from the
other T. semipilosum, which include both V-marked and some
unmarked plants.
Mote 7.
The W&ite Varietal Key (Anon.) uses mark characters to
identify varieties of 3?. subterraneum and Foury (1949) refers to
a V-mark being present in some varieties and not in others.
Since the species is self-fertile, the cultivated varieties are
probably strictly inbred and genetically uniform, and the
uniformity of each one and the consistent differences between
them in this respect do not suggest any particular action of
selection on leaf-marks as a similar situation might in an out-
breeding species.

24°
8« Infra-generic Arrangement of Marked and Unmarked Species.
Having gathered this information, one would like to com
pare it with a phylogenetic arrangement of the species concerned.
Gillett (in litt.) quotes an account by Geringe in De Candolle's
Prodromus (1825) as the most recent survey of all the species
in the genus. There have been many treatments of species in
particular areas since that time, some with more or less
ambitious attempts to set up a system of infra-generic classifi
cation. Unfortunately these arrangements all-differ, and even
the authors least concerned with phylogenetic speculation in
effect produce a classification of their own if they attempt
infra-generic classification jat all, by combining selected
features from a number of their predecessors.
None of them mentions all the species for which data is
listed above, and so one is forced to using references in one
or more other classifications to place several of the species
in relation to whichever is accepted as the principal authority.
It is difficult or impossible to know whether they are then
placed in a way that the principal authority would accept, since
it can be clearly seen to disagree on other points with any
secondary authorities consulted.
The most recent account, dealing with 90 species in one
of the main regions of diversity in the genus, is that of Hossain
(1961), from whom is taken the classification used below into
eight subgenera, and of subgenus Amoria into four sections.

250
This much as a basis for the classification is substantially
compatible with other authorities; these groups seem more or
less accepted, though there is disagreement about ways of com
bining them. Hossain differs from most other authors, who use
the term s ection for his subgenera, and subgenus for an initial
division of the genus into two parts, 3ubgenera La^opus (Hossain f s
subgenera Irifolium and Qalycomorphum) and Jrifoliastrum (the
remainder). Hossain says "J?he genus Drifolium consists of
several major and distinct natural groups" (his eight subgenera)
"which, however, are not very closely related. inhere is no
obvious link between these different groups and no sign of
hybridisation. Combining these two groups under two subgenera
(mainly on the basis of the presence or absence of the floral
bracts) leads to an artificial grouping rather than to a natural
one."
Hossain's subgenus Trifolium (some authors 1 section Lagopus)
and section Amoria contain particularly large numbers of species
for which leaf mark data is available. Jection Amoria has been
subdivided into subsections roughly according to the arrangement
used by i^aubert (1894). Subgenus Drifolium has been split into
very small groups, without classifying these at a higher level
into sections in any of the differing ways used by, for example,
Lojacono (1883), G-ibelli and Belli (1889b), Hubert (1894) or
Bobrov (1949).

251
Table IX.2. Taxonomic Arrangement of Trifolium species, withtheir Leaf-Markings.
Notation:
0
V
WV
o,v
Only unmarked plants reported.
Marks reported, no report of unmarked forms.
All marked, more than one kind of marked phen6type.
Both unmarked and marked individuals occur.
0,VW Unmarked and several kinds of marked individuals occur.
Symbols for red marks as above; any type known is recorded, even if rare.
In most cases, the reports for each species have been simplified to a single note; only the more irreconcilable contradictions are shown as such, with a colon separating the two versions.
Classification
Subgenus 1 Drifolium
>pecies
medium
pratense diffusumpallidum
hirtum lappaceum
arvense
bocconei
White Marks Red Marks
0,WV
0,VWV
0
0, V 0
0
scabrum 0 : V dalmaticum
RF, ?RV
RV
RV
striatum 0, V
stellatum 0
incamatum 0, "V /V"
scut at urn 0
RT
purpureum

Classification Species V.Tiite Marks Red Karks
Subgenus 2 Calycomorphum
Subgenus 3 Paramesue
oubgenus 4 Involucrarium
Subgenus 5 3-alearia
Subgenus 6 Listylus
Subgenus 7 Amoria Section 1 Lupinaster
section 2 Cryptosciadium
Section 3 Amoriajubsection 1 Thalia
alexandrinum 0 vavilovi 0 berytheum 0 carmeli 0
echinatum 0 maritimuin 0 (squamoemm)
squarrosum 0
ochroleucum 0 davisii V
subterraneum O f VYV radiosum V (globosum;
variegatum \T7Y
tomentosum 0 resupinatum 0 : V physodes 0, Vfrajiferum 0 : C,V
spumosum 0, Vvesiculosum 0, V
ssp. multistriatum 0, /ssp. mutabile 0, V
lupinaster 0
uniflorum 0
hybridum 0 : 0,V repens C,VVT occidentale 0, ?semipilosum
&c
.IV
RVRV
stripe)

253
Classification Species .\ihite Ilarks Red Larks
ambiguum 0,WVelizabethae VJohnstonii 0
Subsection 2 Neoamoria
subsection 3 Isthmocarpa
Subsection 4 Fistulosa
Section 4 ^icrantheum
Subgenus 8 Ghronosemium
reflexum ciliolatum O f V mexicanum 0 polymorphum 0
subrotundum 0 > VY7 mattirolianum ^ baccarinii tembensenigrescent 0,WV isthmocarpum 0, V
michelianum
cernuujn 0glomeratum 0 : 0,Vsuffo catum 0
agrarium 0(aureum)
procumbens u(agrarium)
campestre C(procumbens)
dubium 0(minus)
filiforme 0(dubium)
JiV RV RI
RT
Parochetus communis RV -f it?

154
9. Conclusions.
The first conclusion that stands out from the above data
is that the leaf mark character is very often, perhaps always,
variable. Of the eight species noted as 'V 1 in the second
table above (including one of two conflicting accounts for
T. resupinatum and T. d^bium). seven amount only to statements
of the occurrence of marks without specifically excluding the
occurrence of unmarked plants. The exception, T.mdiosum. is
reported as 'A 1 (cf. Table IX.1) by Brewbaker in his unpublished
lipt where variation is explicitly described in many other
species.
Secondly, this variation almost always involves the
occurrence of an unmarked form. Beyond the eight cases
referred to, in only two further species are marks (variable)
reported without unmarked forms. Of all the twenty-five or so
species where marks are reported, only for these two, T.
variegatum and T. :reflexum, and for T. radiosum. is there an
indication of any strength of the absence of unmarked forms;
and two of these three are among the ten species for which
there is reported variation among the marked forms, leaving
only 3?. radiosum as marked and not variable.
The first impression produced by the taxonomic arrangement
of the leaf-mark descriptions of the species is that the markings
occur in all the subdivisions of the genus. On closer examina
tion, two possible exceptions appear. The only report of
marking in subgenus Ghronosemium is that by Brewbaker (1955)

255
for T. dubium. and it is opposed by Evans 1 report of the
absence of mark, implicitly by the absence of any other
reference to the absence of marks (e.g. in the Flora of the
British Isles) in this quite common species, and by my own
observations.
Secondly, a part of the subgenus ffrifolium seems to lack
marks; species related to J?. purpureum. T. alexandrinum.
!• maritimum. and T, squarrosum. ilhis corresponds to a
greater part of v/ibelli and Belli's section Stenostoma. with
the exclusion of jD. ochroleucon and j?. davisii (newly described
by Hossain, as a close relative of _£. canescens). Alternatively,
the unmarked group comprises Bobrov f s section otenostoma. with
the same exception, and of part of his section Hiantia. which
includes another unmarked species, £. arvense. and another
marked one, £. hirtum.
One further aspect of importance that arises in the
earlier sections of this chapter is the remarkable difference
between the systems of genetical control of the various markings
in £• re pens and j?, pratense. the only species where genetical
work on leaf markings has been published in any detail.
Homology between the two species could not be argued for more
than the principal epistatic K-locus in £. pratense. whose
recessive allele for no mark could correspond to the recessive
allele at the V-locus in £. repens.

256
The virtual absence of uniformly marked species suggests
that there is an intrinsic property of the mark-producing system,
perhaps expressed as an inferiority of the marked dominant homo-
zygote, which very effectively opposes the fixation of marked
types. Evidence pointing in the same general direction exists
within Ti . re pens. where wild, populations are very nearly always
variable; and, in spite of a generally low frequency of unmarked
plants, they rarely lack the unmarked type. Gene frequencies
of ten per cent or more could easily have been undetected in the
populations sampled as all marked, few of vhich were larger than
100 plants (cf. figure VII (i)).
ouch an effect would also be produced if a selective
process acting on the end products of the gene activity - in
this case perhaps the leaf mark itself - acted so as to favour
diversity as such. This would resemble the situation in certain
prey animals, (cf. Ford (1964), p. 160 and p. 274). 3e Ruiter
(1952) has shown that some predators may learn to recognise
each morph as food separately, A morph with a high frequency
would be liable to predation by a correspondingly large number
of predator individuals which might not predate the other morphs.
A role for such a mechanism in maintaining polymorphism has been
suggested by Cain and Sheppard (1954) with regard to banding in
the snail, Cepaea nemoralis. and by Kettlewell and 3erry (1961)
in a polymorphism for (non-industrial) melanism in the moth,
Amathes glareosa.

257
Whatever this hypothetical force opposing the fixation
of marking might be, it would appear to actions is tently
throughout the genus, and would have to be inseparable from
the most fundamental properties of the genes which produce the
marking.
If one accepts that all the marks have a common origin,
then there is a strong case for believing that all marked
forms had a continuous sequence of marked ancestors, tracing
back to a common ancestral population, and the argument above
suggests that these would all have been members of poly
morphic populations. It would then follow, unless the taxono-
mists 1 judgments are a very poor guide to phylogeny, that all,
or many, of the now unmarked species are derived from ancestral
populations that were marked or probably polymorphic for marking.
This implies many occasions on which populations became fixed
in the unmarked condition; suggesting that the forces
preventing fixation of marking act specifically against fixation
only of a marked type.
A modification of this conclusion would follow if sup
pressor genes were postulated; then a continuous sequence of
marked ancestors of all marked populations would not be assumed.
For example, in the case of 1. pratense. fixation of ma would
conceal all the effects of the other loci* The concept of a
suppressor implies that such a mechanism would conceal rather
than destroy or replace the detailed and perhaps quite elaborate

258
genetic resources controlling the physiological production
of marking. (The presumed complexity of this mechanism is
one reason for supposing that the capacity to produce marks
only arose once, the other being their visible resemblance in
different species.) Taking the m gene in T. pratense as an
example of a potential suppressor of the kind suggested requires
the further assumption that the bulk of this elaborate mechanism
would still be present in mm plants, either elsewhere on the
genome, or at an K-locus whose inactivity was due to a small
reversible change rather than complete lo^s.
If there were such suppressors, marked or polymorphic
populations could be derived b/ a simple mutational change from
unmarked ancestors. If some of the present unmarked species
had suppressed the marking system as opposed to losing it,
such species should be liable to occasional mutation revealing
the marked character. One could test this using artificial
mutr.genic treatments.
If the conclusion of a continuously acting force preventing
fixation of marking is not accepted, the widespread occurrence
of polymorphism for marking must be traced to more than one
case of occurrence and establishment of new genetic variation,
perhaps by the rrutation of a suppressor. The genetic mechanisms
controlling the variation might then not be homologous, though
the underlying mechanism producing marking would still be so*
If variation had been established several times, this would
provide grounds for thinking that the apparent advantage,

259
suggested by its prevalence, which polymorphism for leaf
marking confers on a population, is a property of variability
in the phenotype we recognise, leaf marking, and not of some
hidden property of the locus controlling the polymorphism,
which in this case would differ from species to species.
This would mean, not only that the vari tion observed at the
V-locus would be of selective significance, but that the
variation in the actual character we observe is selectively
important.

260
CHAPTER X
LEAF-MARKINGS IN OTHER FAMILIES
1. Introduction.
It may be of some value to consider cases in other genera
where leaf-markings are found sharing some of the properties of
those of Trifolium repens.
First one may list the significant properties of the leaf
marks of £. repens.
White marks.
Red marks.
Interrelations.
V shape
Produced by modification of palisade structure and perhaps of chloroplasts
(Jenetically variable.
Flecks Rfm T
Central or extensive patches R , R , Red on tip (assoc. By).
V-shapes Red V, Blue V (assoc. By); fainter red in other white Vs.
Gtenetically and environmentally variable.
Coexistence in same species of white and red marks
Coexistence of systems of genetic variability
Coexistence of V-shaped marks in both colours
Interaction in expression (red-inrtf mark, partial suppression of Rm in VDV ,approximation of Blue V mark to inner side of white mai& and other mark if heterozygous)
Association in genetic control (V y-controlled red marks).

261
2, Ranunculus species
The genus which seems to have the most points of resem
blance to 'jCrifolium. including occurrence in similar habitats
such as short, grazed pasture, is Ranunculus . Three species that
I have noticed have both red and pale marks.
In Ranunculus ficaria the white marks are sharp edged,
small flecks and may be more or less arranged in an arc, none
being very close to the margin or to the base of the leaf.
The red mark is a sharp edged irregular streak up the midrib
from the base. Stahl (1896) reports that they develop more
clearly in nioist shady places, and may almost vanish in a cold
,
In Ranunculus omatophyllus there is a similar red mark,
centrally placed, and extended along the three main ribs.
Ihere are pale patches, located below the marginal sinuses
between the main veins. (In this species the margin consists
of a series of convex segments linking sinuses alternately
associated with main veins and with pale patches.) These
patches however are not sharp edged.
A similar situation can be seen in Ranunculus repens .
with pale diffuse-edged patches associated with the major
sinuses. Eere however the distribution of 'red 1 , effectively
blackish, colour is different; it does not occur in sharp
edged uniform patches, but as a speckling which only becomes
continuous in the centre of a marked area, or on very extensively

262
pigmented leaves, and is distributed more sparsely and fades
out at the margin. In this case there does seem to be an
association with the pale patches, or both may be associated
with a third factor; the pale patches occur below, prozimally
to some sinuses, and the densest part of the pigmented patch,
when this is moderately developed, is beside the base of the
sinus - the pigmented patches occurring in pairs beside each
of the sinuses that has a pale patch associated.
3. G-enetically Dominant Pattern Variegations.
The white V-markings of Trifoliuci are an example in which
a set of cells of the same genetic constitution differentiate
so as to produce a variegated pattern. The majority of such
cases are produced by often rare recessive factors. However,
Tilney-Bassett and Kirk (1966?, in press) list some examples
of dominant pattern genes (Hiorth, 1931; Gorrens, 1931;
Parker, 1933).
The most interesting of these for comparison with the
V-locus of I. repens is that of Collinsia bicolor (Hiorth, 1931)
Five dominant and one recessive allele are described at one
locus, producing various combinations of white spots or white
veins on the leaves and cotyledons. When an allele producing
white veins, and an allele producing white spots, in the coty
ledons, are combined, the heterozygotes have both white veins
white spots on the cotyledons. Here, as in £, repens» is

263
applicable the interpretation that dominance is the result
of each allele being active to disturb (in places) a process
provided for by other genetic material (cf, p. 92 ). However(^tv/tx
the analogy breaks down at a structural level - these /jnarks
are produced in the epidermis. Another analogy exists
however, since in this species there are also red markings
which (1) affect the principal leaf veins (one of the white-
marks alleles produces white areas round all the veins) and
(2) are closely linked with the white-mark locus.
Extensive variation in leaf appearance involving red
marking as well as white is also known in Coleus (and here the
white marking is an absence of chlorophyll, not a light
reflecting blister). Correns (1931) reports the dominance
of a variegation expressed as a central leaf blotch; on cross
ing green and variegated plants nearly all the progeny were
variegated. The expression varied in the selfed progeny of
variegated plants, ranging from a large blotch to a mid -vein
stripe, or even to scattered spots.
Parker (1933) describes a condition with scattered yellow
spots on the leaves of Phase olus vulgar is this is only partially
dominant, as the spots were larger and more nearly fused to
gether in the hoinozygote. toith. this example we return to the
. and perhaps find a closer analogy in £. re pens
with the dominant (complementary) factors producing Atwood
and Kreitlow's (1946) mottling rather than with V-marks.

264
In the tetraploid Cyclamen persicum there are a number
of differing leaf marks produced by epidermal blisters.
Seyffert (1955) after work on experimentally produced poly-
haploids (2x) refers to variation affecting leaf marking at
two loci f and quotes a case of 9s3:4 segregation. However,
after further work (Seyffert, 1957 and in litt.) he lists fourOYlUj
alleles at^one locus. These are a basal recessive for no
mark, and a series of three dominant alleles, dominant over
each other in sequence. ihe top dominant produces a peri
pheral mark round the edge of the leaf, the next a circular
medial band, and the last a central blotch. The medial
phenotype is the most common in wild (tetraploid) populations.
The phenotype produced by the top dominant, peripheral, is
(in the greenhouse) less vigorous and produces smaller flowers.
Other photographs of Cyclamen were obtained in correspondence
to illustrate these marks (cf. Wellensiek, 1961). These show
some variation in the intensity of the medial mark, and illus
trate the central mark with a separate fainter band round it
in the medial position, a compound phenotype not described by
Seyffert.
4. Arum macula turn.
In Arum macula turn, some plants have a number of red
patches on the leaves - and in some cases, the larger of these
areas are distorted and bulge out above or below the leaf.

265
Pethybridge (1903) records that in the flat marked areas,
the leaf is thinner, mostly due to a shortening of the palisade
cells, in which the pigment is located. The intercellular
spaces also seem to be larger in the marked areas, and in the
distorted spots, the pigment may also, or only occur in theIT s u~ » <-»«"-* t-^Uu) s«j,.
spongy mesophyll. { It does not occur in the epidermis, as doesn*-v
the pigment, in some at least (R-alleles, Oarnahan et al. , 1 955/)
of the Jrifolium red markings. These marks therefore combine
features both of the white and of the red markings in Trifolium;
that is, a modification of leaf structure (specifically a less
organised and differentiated palisade), associated with the
presence of red pigment.
These marks do not seem to be subject to environmental
variation. Each plant consistently produces either marked or
unmarked leaves. The data of Colgan (1911) suggest that it is
under oligogenic control: eleven seeds gathered from a marked
plant transplanted into his garden and growing with two other
marked plants as its only near neighbours, grew up to include
six entirely unmarked plants.
Prime (1955b) publishes a map of the frequency of the
unmarked and marked forms ; in Lancashire and Yorkshire and
further south, the marked forms comprise 10 to 20 or rarely
30 per cent of the population. North of this they are rare or
absent , except north of the line which is thought to mark the
limits of the species 1 natural distribution in Scotland; it

266
is thought that these are introduced plants, which may have
been chosen with discrimination in favour of markings. In
Gtermany, on the other hand, the spotted form is commoner in
the north.
5. Analogies with Trifolium repens markings.
Among the examples above there are analogies particularly
in Gollinsia bicolor and Cyclamen persicumto the dominant ex
pression controlled by a multiple allele series seen in
Jrifolium re pens. Analogies to T. repens in a second respect
are shown by the association of red and white markings in
Collinsia bicolor and Ranunculus spp.
A further point of resemblance is in the shape and appear
ance of the whole marks. Red V or crescent shapes on the leaf
aro known also in Polygonum persicaria and a very regular V of
almost uniform width was seen on a plant labelled as Polygonum
capitatum. now in the Oxford Botanic Garden.
However, the mark on the whole leaf, as opposed to the
leaflet, is in Trifolium roughly circular or polygonal, and
comparison of shape is then possible between T. repens V-marks
and the white marks of Cyclamen, with the red 'zone 1 of
Pelargonium zonal e_ and P. hederif oliun^ and perhaps with the
spots in Aruft maculatum: though not forming a continuous band,
the larger spots all lie along an oval line parallel to the
leaf margin and about half way from it to the attachment of
the petiole. One could extend the analogy in the same way to
cover the ring of white flecks in Ranunculus ficaria.

267
6. Discussion.
Very many other plants show leaf markings of many kinds,
both 'white 1 and 'red 1 . They are perhaps more abundant in
flora exotic to Britain,as can be seen in tropical glasshouses;
one of the most conspicuously variable groups is Begonia.
Little comparative work seems ever to have been done on
leaf markings or on their significance. One of the few dis
cussions is that of Stahl (1896). He suggests, firstly for
red coloration, three functions: to discourage animals (and
reportc experimental evidence supporting this); to accelerate
warming of the leaf (and showed differences of the order of a
degree soon after exposure to light); and possibly to convert
light of some wavelengths to others which could be absorbed
by chlorophyll (the absorption spectra of chlorophyll and
'erythrophyll' are as he points out closely complementary).
For white leaf patches, he mentions only effects on temperature,
reporting in Anthurium crystallinum a temperature difference of
a third of a degree immediately after exposure to light, and
in Begonia argyrostigma and Pteris cretica albolineata that
the white flecks cool more slowly than the green tissue.

fed 02
OVJ
I

268
CHAPTER XI
GENERAL DISCUSSION
1) The Conclusions and their Validity.
It was stated in the introduction that no obvious
explanation of the significance of leaf markings was available
to the intuition. On this basis it would be possible to sug
gest that leaf markings were of no selective importance, and
that at least in a variable outbreeding species their variation
might occur in spite of rather than because of the action of
selection. The principal conclusion reached by this work is
that the unmarked form is significantly more frequent further
north and further uphill. These two points, and especially
the second, seem to eliminate the possibility that the
differences between the marking alleles are too trivial to
be of selective importance.
One might attempt to explain away a simple overall cline
as a side-effect of some other phenomenon, or as a result of
gene flow between centres of population which had diverged in
this respect by drift during a period of isolation. However,
the rise in unmarked frequency with altitude cannot be dis
counted int-this way when it occurs in separated areas, for
example, both in Britain and in Spain.
Mark expression is dependent to an extent on environment,
and plants growing in unfavourable conditions show their marks

269
less clearly and may sometimes effectively lose them. The
increase of unmarked frequency in the field-scored British
samples could be supposed (as more definitely could the higher
unmarked frequency in field- than greenhouse-scored material)
to be a consequence of distance north and higher altitude
providing lower temperatures and less light, and making mark
expression and recognition difficult. The results, it would
be argued, represent a change in phenotype of purely environ
mental origin, and no change in genotype. The author's assess
ment of the extent to which environmental influences on
expression could account for the results suggests that the
results are substantially real. This assessment is admittedly
subjective, and it may be felt that prejudice in favour of
finding a positive result could have biased it. However, the
parallel altitude dine in the Spanish material cannot be
attacked in the same way, as these plants were all scored at
Aberystwyth under standard (or at least not systematically
different) conditions. The latitude cline across Europe can
be defended in the same way; if these clines exist elsewhere,
they are probably true, as they appear to be, in British
material.
Other studies of polymorphism were discussed in the
introduction, and it was suggested that the next step after
discovering a pattern was to explain it as that of some
particular selective factor. With regard to cyanogenesis,

270
the common feature deduced by Daday (1954a, b, 1958) from
altitude and latitude clines was an effect of temperature,
and subsequent experiment substantiated this conclusion (Daday,
1962, 1965).
The most definite factors associated with high unmarked
frequency are distance north, higher altitude (one is tempted
to follow Daday and deduce low temperature as the common factor);
(in Britain, at least) wet (waterlogged), or compacted soil,
and dense vegetation. The distribution pattern is not neces
sarily explicable in terms of one principal factor. However,
if there is one, it might be something related to increased
wetness and poor soil aeration. On the basis of the available
data it is not possible to go beyond these two suggestions of
temperature and water regime as the selective factors.
2) The Significance of Leaf Markings.
A second question remains unanswered: is it leaf
markings and their variation that matters, or is leaf marking
a trivial by-product of some other activity of the V-locus, about
which nothing has been directly observed? Wetness or low
temperature may be the important selective factors, but it is
hard to see any connection with markings on leaves. It would
seem reasonable to suggest that the markings are side effects
of alleles which achieve something, quite different, related
to one of these selective factors.

271
We perceive the markings as a result of the reflection
of light from the leaf. Interaction with light seems almost
certain to be part of the true significance, if any, of leaf
markings as opposed to the system which produces them. The
suggestion by 3tahl (1896) that leaf markings alter the tempera
ture regime for the marked tissue is the sort of explanation
wanted, but his experimental results (mostly on red marks, and
in other species) indicate only small temperature differences,
confined to occasions of rapid light intensity change. One
could perhaps approach by means of the pattern of the dines
demonstrated and suggest that in northern latitudes and at
high altitudes there is more frequent cloud and less light, and
therefore markings, reducing photosynthetic capacity, are dis
favoured. This could mean that markings are favoured else
where (and even in these places, since they are present in a
majority in samples from all areas) because light supply is
above optimal: this is hard to believe. Otherwise, even if
the cline is explained, the positive significance of markings
still needs an explanation.
The interactions between red and white markings have
been referred to in several places in the text. Developing
Watkin Williams 1 suggestion (1959, p. 15), one might suppose
that following the evolution of red marks, modification of the
underlying (or nearby) tissue was also favoured, that the
system evolved to achieve this was distinct, became separated,

272
and developed its own selective advantages: in Trifolium repens
to-day most plants show white markings but no red ones.
The complete linkage between V y and red V in Trifolium
repens (Hovin and Oibson, 1961; V.E. Davies, personal comm.)
may therefore have evolved because variation at both loci
affected the same character. This would accord with the
prediction of Fisher (1930, p. 117) that selection would favour
close linkage af loci affecting the same phenotypic character.
The double character (in expression, and in mutability, cf.
R. Davies and Wall (1959)) of the Vby allele could perhaps
indicate, as the mechanism by which this linkage was brought
about, a reconstruction of part of the chromosome, involving re
duplication of the V-locus, including a locus affecting red leaf
pigmentation. This whole region might fail to recombine with
normal chromosomes, explaining the complete linkage of the red
V only to V y among the V-alleles.
Linkage (complete) is also reported in T. pratense between
the loci controlling mark presence and position, white or yellow
mark colour, and an 'anthocyanin factor' (R.D. Villiams, 1937).
One may also compare the genetic linkage in Oollinsia bioolor
between loci for red and white markings along the leaf veins
(Hiorth, 1931).
If the close linkage in this case has evolved because it
has been selected for, it is implied that there are powerful
selective forces acting on the leaf markings that we see, since
the physiological and morphological bases of the two markings

273
are very different, and they seem to be related only by their shape and position on the leaf. More circumstantial evidence supporting the possibility of selective significance of red and white leaf markings in other plants has been referred to above, for example in Ranunculus spp.
What, we may still ask, is the significance of what should perhaps be regarded as, at least in origin, a combined red and white marking system? Stahl's three suggestions remain: the improvement of temperature regime, or of light utilisation (though liha observed clines suggest lower frequencies of markings where stress in these respects would be greater); or, some effect on animals.
A number of cases of markings of similar shape, mostly approximating to a circular shape, were referred to in Chapter X. It seems possible that such a shape would, like a flower, stand out against a less ordered background of vegetation, attract an animal's attention, and in some way modify its behaviour to the plant's advantage. Markings could perhaps serve as secondary foci of visual attraction to pollinators (the inflorescence in this species is perhaps visually less conspicuous from a distance than single flowers of simpler and more striking geometrical sbapes). On the other hand, they might serve as warning signs to predators: the marks in Trifolium repens are generally commoner in the areas where cyanogenesis is commoner (cf. Daday 1954a, 1958)

274
and it has been shown experimentally that cyanogenic forms are recognised, and are avoided, by some predators (Jones, 1962).
3) Points arising for further investigation
The previously published accounts of the genetics of leaf marking in this species are not challenged by this work, though somewhat modified (for example in respect of the frequent effective dominance of V v over 7). It appears however that there is much more variation than they recognise. The question whether this variation can be attributed entirely to the V-iocus was raised above in connection with the marginal mark phenotype. Senetical investigation of this and several of the other phenotypes described might supply an answer and would break new ground.
The studies described in Chapter V suggest a whole field of investigation of the dynamics of population structure. This is a different, wider, and more difficult but perhaps more significant topic than the matter of leaf markings which concerns us here. Even in so far as population structure affects sampling procedures in Trifolium repens. the studies described go only a short way towards discounting possible causes of incorrect conclusions in studies on leaf markings. There is great scope for quantitative investigation of the rate of establishment and expansion of new genotypes, and of

275
displacement of others, in different kinds of vegetation,
and for quantitative study of variation between different
genotypes in effectiveness of the various component processes
of vegetative and sexual reproduction. It would probably be
found that sexual fertility and vegetative competitive ability
differed between seed and vegetative samples, because of the
different selective processes to which they had most recently
been exposed. Differences might also be found in respect of
the frequencies of more easily described polymorphic characters
such as leaf markings. The studies reported, on the genetic
composition of single heads, and on mapping of clone size,
illustrate how genetic variation, particularly of vegetatively
expressed polymorphisms such as leaf marking and cyanogenesis,
could be used as a tool in investigation of population dynamics.
Only a degree of progress can be claimed with regard to
the main problem of defining the environmental variables whose•Hot \f-as~i tuUjffvv i/v*
variation I morph frequencies reflects. One way to improve
this would be a repeated study of the same kind with improved
methods. It can be suggested that these should include the
use only of vegetative samples, of larger size, perhaps sampled
in a more precisely standardised way, and all grown up after
collection in standard conditions before scoring. A more
systematic coverage of different habitats and different parts
of the species' range would be desirable, as would fuller and

276
more quantitative information on the sample sites, measured
and presented in the same way for each site. Juch a study
would involve a great deal of labour, both in preparation and
execution, and indefinite expansion along these lines could be
expected to lead to diminishing returns.
The dines already appearing in this study provide a
starting point for another more radical approach by experimental
studies. Direct study of relative growth of marked and un
marked types as affected by the possible selective factors
(suggested above to be aspects of temperature and water regime)
are clearly indicated as part of the next step in attacking the
main problem. G-enetic variation, both that between different
marked types and also that abundantly present in the rest of
the genotype, would need to be allowed for by careful design of
such experiments. This could be done partly by extensive
replication, and partly by comparisons between marked and
unmarked progeny of the same cross, or within inbred lines.
With regard to the other species, future work would
clearly -have to replace the rather bibliographical treatment
above by a great deal of direct observation on material of as
many species as possible, and from as many sources as possible.
Morph frequency surveys in the field, particularly on ;£. pratense.
could be combined with those on £• repens.

:77
The systems of inheritance of leaf markings described
in £. re pens and £. pratense are very different. It would
be interesting to study the genetics of differing leaf markings
in other species of Trifolium. especially the genetics of
differences between marked types, as well as between them and
the unmarked type. Further information of this kind would
provide a much better foundation for discussion of the relation
of leaf markings and their polymorphisms to phylogeny.

278
REFERENCES
Abrams, L. (1944)Illustrated Flora of the Pacific States. Vol. II. Stanford.
Ahlgren, O.K. and Sprague, H.B. (1940)Bull. N.J. Agric. Expt. Sta. , 676.
A Study of Variability in White Glover (Trif olium repens L.) and its Relation to Pasture Improvement.
Allan, H.H. (1940)A Handbook of the Naturalised Flora of New Zealand. D.3.I.R. Bulletin No. 8J. Wellington.
Allison, A.G. (1954)Trans. Roy. Soc. Trop. Med. and Hyg. f £8, 312-318.
The Distribution of the Sickle Cell trait in East Africa and elsewhere, and its Apparent Relationship to the Incidence of Subtertian Malaria.
Anonymous (University of Adelaide, Waite AgriculturalResearch Institute)
Key for Distinguishing the Commoner Strains of Subterranean Clover ( Trif olium subterraneum) .
Apirion, D. and Zohary, D. (1961)Oenetics, 46, 393-399.
Chlorophyll lethal in natural populations of the orchard grass iDactylis glomerata L. ssp. judaica). A case of balanced polymorphism in plants.
Ascherson, P. and Sraebner, P. (1906-1910)Synopsis der Mitteleuropaischen Flora. Band VI, Teil 3- (Engelmann, Leipzig).
Atwood, S.S. (1937-1944)Ann. Repts. U.S. Regional Pasture Res. Lab., State College, Pennsylvania.
Atwood, 2.d. (1938)2nd Ann. ttept., U.S. Reg. Pasture Res. Lab., pp. 24-28.
Self-pollination in Legumes.
Atwood, S.S. (1941)Genetics, 26> 137.
Cytogenetic basis of incompatibility in Trif olium repens .

279
Atwood, o.JJ. (1942a)J. Agric. Res., 64. 699-709.
Grenetics of pseudo-self-compatibility and its relation to cross-incompatibility in Trifolium repens.
Atwood, S.S. (I942b)J. Amer. Soc. Agron., 34. 353-364.
Gtenetids of Self-Compatibility in Trifolium repens.
Atwood, 3.3. (I942c)Genetics, 2£, 129-130 (Abs.) and 333-338.
Oppositional alleles causing cross incompatibility in Trifolium repens.
Atwood, 3.S. (1944)G-enetics, 22, 428-435.
Oppositional Alleles in Natural Populations of Trifolium repens.
Atwood, 3.3. (1945)J. Amer. Soc. Agron., 37. 991-1004.
Behaviour of the Self-Compatibility ?actor and Its Relation to Breeding Methods in Trifolium repens.
Atwood, o.S. and Hill, Helen D. (1940)Amer. J. Bot., 2J, 730-735.
Regularity of meiosis in microsporocytes of rrifolium repens.
Atwood, S.S. and Kreitlow, K.W. (1946)Amer. J. Bot., £1, 91-100.
Studies of a genetic disease of Trifolium gpens simulating a virosis,
Atwood, 3.3. and Sullivan, J.T. (1943)J. Hered., M, 311-320.
Inheritance of Cyanogenetic glucoside and its hydro- lyzing enzyme in Trifolium repens.
Barber, H.N. (1955)Evolution, 2, 1-14.
Adaptive gene substitutions in Tasmanian Sucal^pts. 1. Grene controlling the development of glaucousness.
Bateman, A.J. (1947)Nature, 160. 337-
Number of 3-alleles in a population.

280Beaty, E.R., Powell, J.D. , and Young, V/.G. (1965)Crop Science, 5., 284
Amclo ^rrov.'leaf Clover.Beatty, D.W. and Gardner, F.P. U96i;
Crop Science, 1, 323-326Effect of Photoperiod and Temperature on Flowering of White Clover (Srifolium repens L.)
Beinhart, 3., Oibson, P.B., Halpin, J.E. and Hollowell, E.A.Crop Science, £, 89-92.
Selection and Evaluation of White Clover Clones. III. Clonal Differences in Branching in Relation to Leaf Area Production and Persistence.
Belli, S. (1894)Memorie delle Reale Accademia delli ocienze di Torino, Ser II, XLIV. 233-292.
Rivista critica delle specie di 'Trifolium* italiane, comparate con quelle straniere, delle Sezione 'Lupinaster* (Buxbaum).
Bentham, 3. and Hooker, Sir J.D. (1924) Handbook of the British Flora.
Black, J.N. (1960)Australian Jour. Agric. Res., 11. 277-291.
The significance of petiole length, leaf area, and light interception in competition between strains of subterranean clover CTrifolium subterraneum L.) grown in swards.
Bleier, H. (1925)Jb. wiss. Bot., 6£, 604-636
Chromosomenstudien bei der (Jattung Trifolium.
Bobrov, T̂ .&. (1947)Acta Inst. Bot. Acad. $c. URSS Ser 1(6), 164-336.
(Revision of clovers of USSR).
Bogdan, A.V. (1963)Heredity, j.8, 365-368
Chloris gayaha without anthocyanin coloration.
Borg, J. (1927)Malta Flora. (I4alta).
Bosemark, N.O. (1957)3ereditas, H, 211-235
On Accessory Chromosomes in Festuca pratensis. V. Influence of Accessory Chromosomes on Fertility and Vegetative development.

PP1
Bradshaw, A.D. and Snaydon, R.W. (1959)Nature, 183. 129-130
Population Differentiation within Plant Species in Response to Soil Factors.
Brewbaker, J.L. (1955)J. Hered., 46, 115-123
V-Leaf Markings of White Clover.
Brewbaker, J.L. (1962)J. Hered., £J, 163-167
Cyanidin-Red White Clover. A Duplicate Recessive Mutant in Trifolium repens L.
Brewbaker, J.L. and Anderson, V.P. (1952)Genetics, 37. 568
Multiple alleles conditioning leaf markings in Trifolium repens.
Brewbaker, J.L. and Camahan, H.L. (1956)J. Hered., ££, 103
Leaf marking alleles in White Clover - Uniform Nomenclature.
Brewbaker, J.L. and Keim, W.F. (1953)Amer. Nat., 8J, 323-326
A Fertile Interspecific Hybrid in Trifolium; 4n T. repens x 4n j?. nigreecens.
Brigham, R.D. and Wilsie, C.P. (1955)Agronomy J., 47. 125-127
Seed setting and vegetative vigour of Ladino clover (Trifolium repens Leyss) clones and their diallel crosses.
Britten, E.J. (1960)Science, 131. 100-101.
Genetical and Environmental Control of Flowering in Trifolium repens in the Tropics.
Britten, E.J. (1961)Agronomy J., 53. 11-14
The Influence of Genotype and Temperature on Flowering in Trifolium repens.
Brockwell, J. (1956)J. Austral. Inst. a#ric. ^ci., 22, 260-265
The use of the red leaf strain of subterranean clover for rapid evaluation of strain effectiveness in Rhizobium trifolii.
Brown, K.G. (1947)Abstracts, 1947 Keeting, American Society of Agronomists.
Inheritance of patterned leaf-markings in white clover.

282
Bula, R.J., May, R.G., Garrison, C.3., Rincker, C.M. andMcAllister, D.R. (1964)
Crop Science, 4, 295-297Growth Responses of White Clover, Trifolium repens L., progenies from Five Diverse Geographic Locations.
Cain, A.J. and Sheppard, P.M. (1954)Genetics, 22, 89-116
Natural Selection in Cepaea.
Carnahan, H.L. (1960)Agronomy J., %2, 302
A comparison of 1st and 2nd synthetic generation forage yields of Ladino and white clover in association with Bromegrass.
Carnahan, H.L., Hill, Helen D., Hanson, A.A. and Brown, K.Gr.(1955)
J. Hered., 46, 109-114 Inheritance and frequencies of leaf markings in white clover.
Carrier, L. and Sort, K.S. (1916)J. Amer. 3oo. Agron., 8, 256-266
History of Kentucky bluegrass and white clover in the United Dtates.
Chakravarty, A.K. (I963a)Indian J. Genet, and PI. Breeding, 23. 185-196
Inheritance of Cyanogenesis in White Clover.
Chakravarty, A.E. (I963b)Indian J. Genet, and PI. Breeding, 22, 197-204
Linkage Relationships between genes controlling Cyanogenesis in White Clover and the genes for V-shaped Leaf marking, self-incompatibility and growth.
Clapham, A.R., Tutin, T.G. and Warburg, "5.F. (1957)Flora of the British Isles. Illustrations (Part 1) Drawings by Sybil J. Roles.
Clapham, A.R., Tutin, T.G. and Warburg, E.'r. (1962) Flora of the British Isles (Second Edition).
Colgan, N. (1911)Irish Naturalist, XX, 210-217
On the Inheritance ofTitted Leaf-Blot chings in Arum maculatum and on Floral Variations in this species.
Coombe, ^.E. (1961)watsonia, £, 68-87
Trifolium occidentale. a New Species related to £. repens.

263
Corkill, L. (1952)NZ J. oci. Tech., 2±, A, 1-16.
Cyah6g*nesis in white clover (Trifolium repens L.). VI. Experiments with high glucoside, and glucoside-free strains.
Correns, G. (1931)3.3. Preuss. AkacU Wiss., 220-231
Vererbungsversuche mit buntblattrigen 3ippen. XI Goleus hybridus forma (?) albopicta.
Crowder, L.V, (1960)Agronomy J., £1, 608-609
£he response of white clover varieties grown at high elevations in Colombia.
Crowder, L.G. and Craigmiles, J.P. (1960)Agronomy J., ££, 382-385
Effect of soil temperature, soil moisture, and flowering on the persistence and forage production of white clover stands.
Curran, £.1. (1963)Nature, 197. 105-106
Balanced i-olymorphism in Daotylis glomerata ssp woronowii.
Daday, H. (I954a)Heredity, 8, 61-78
Oene Frequencies in wild populations of Jrifolium repensI. Distribution by latitude.
Daday, H. (I954b)Heredity, 8, 377-384
Gene Frequencies in wild populations of Trifolium repeas.II. Distribution by Altitude.
Daday, H. (1955)J. Brit. Orassl. 3oc., 10, 266-274
Gyanogenesis in strains of white clover.
Daday, H. (1958)Heredity, 12, 169-184
Gtene Frequencies in wild populations of Trifolium re pens.III. v/orld Distribution.
Daday, I. (1962)Ann. Kept., Div. of Plant Industry, O.S.I.R.O., Canberra
(a) p. xiii 1962. Natural Selection in Cyanogenetic Strains of Vvhite Clover.(b) p. 14 Mechanism of natural selection.

284
Daday, H. (1965)Heredity, 20, 355-365
Gene Frequencies in Trifolium repens. IV. Mechanism of Natural Selection.
Darlington, C.B. and Janaki-Ammal, E.K. (1945)Ann. Bot., IX (N.S.), 267-281
Adaptive isochromosomes in Nicandra.
Darlington, C.D. and Shaw, Q.W. (1959)Heredity, JJ, 89-121
Parallel Polymorphism in the heterochromatin of TrJUlium spp.
Darwin, G. (1891)The Effects of Cross and Self-Fertilisation in the Vegetable Kingdom (Third Edition).
Davies, D.R. and Wall, B.T. (1959)Nature, 18^, 1957 bv
Separation by gamma-irradiation of two elements at the V y locus in Trifolium repens.
Davies, D.H. ani Wall, B.T. (1960)Heredity, J£, 1-15 bv
Induced mutations at the V * locus of Trifolium repens.I. Effects of Acute, Chronic and Fractionated dosera of gamma-radiation on induction of somatic mutations.
Davies, D.R. and Wall, T:.T. (1961)Gtenetics, 46, 787-798 .
Induced mutations at the V y locus of Trifolium repeag.II. Reduction below the additive base line by fractionated doses of gamma-radiation.
Davies, W.E. (1963)Leaf Markings in Trifolium repens.in Teaching (Jenetics, ed. C.D. Darlington and A.D.Bradshaw. (Oliver and Boyd. Edinburgh and London).
Davies, W.E. (1965)Demonstration at Gtenetical Society Summer Meeting,Aberystwyth.
Davies, W.E. and Young, N.R. (1963)Ann Rept. (1962), WelgfcPl. Breed. Sta., 33-35.
The use of genetic markers for the identification of white clover cultivars.
De Basto Folque, K.A.P. (1949) Melhorainento, 1, 11 -120
Subsidies para o e"studo do ge'nero Trifolium L. em Portugal.

De Reuter, L. (1952)Behaviour, 4, 222-232
-Some experiments on the camouflage of stick caterpillars.Dessureaux, L. (1949)
Agriculture (Montreal), 6, 127-131Variability des populations""non selectionne'es de trefle blanc Ladino.
De Visiani, d.. (1847-1852)Flora Dalmatica. Lipsiae. Vols. II, III.
De Vries, H. (1907)Plant Breeding. Comments on the Experiments of Nilsson and Burbank. London.
Dobzhansky, 0?. (1951)Genetics and the Origin of Species. Columbia Press, New York.
Dolan, D.D. (1962)N.Y. State Agr. Exp. Sta., Reg. Plant Introd., Geneva, ft.Y. Seeds Available and Descriptive Notes, 1960 and 1961 Scorings. Forage Legumes and Grass. (cyclostyled).
Dunn, G.M., Calder, F.W. and Kilpatrick, ,i.A. (1962)Agr. Zxp. Sta., Univ. of New Hampshire, 3ta. Tech. Bull. 104. Variation in white clover in relation to improvement, pp.1-22.Dyer, A.F. (1963)
Chromosoma, VJ, 545-576Allocyclic segments of chromosomes and the structural heterozygosity that they reveal.
Erith, A.G. (1924)Ivhite Clover (Trif olium re pens L.). A Monograph. London.
Erith, A.G. (1928)J. Genetics, 12, 351-355
Some hybrids of varieties of white clover (Irifolium repens L.)Evans, A.M. (1962)
jiuphytica, H, 164-176 Species hybridization in Irifolium. I. Methods of overcoming species incompatibility.
Fenner, P. (1959)B. Ked. Bull., JL5>, 240-245 Myxomatosie.

286
Fisher, R.A. (1930)The Genetical Theory of Natural Selection. (Of. Second Edition. Dover, New York, 1958).
Ford, B.B. (1940)Polymorphism and Taxonomy.in £lie New Systematics, ed. J. Huxley, Clarendon Press,Oxford.
Ford, E.B. (1964)Ecological Gtenetics. Methuen, London.
Foury, A. (1954)Les le'gumineuses fourrageres au Laroc. Rabat. Service de la recherche agronomique.
Frankel, O.K. and Williams, J.D. (1958)J. Aust. Inst. Agric. 3c±., 2£, 162-163
A record of natural crossing in subterranean clover.
Frost, S. (1958)Hereditas, 44, 75-111
The Geographical Distribution of Accessory Chromosomes in Gentaurea scabiosa.
aamble, J.S. (1935)Flora of the Presidency of Madras. Vol* I. London.
ae*hu, J-M. (1963)Bull. ooc. Bot. Nord. France, XVI. 203-209
Repartition de Trifolium occidentale D.B. Coombe dans l f Quest de la France et observations 3cologiques.
Oibelli, 0. and Belli, 3. (1887)Atti Accad. 3ci. Torino, XXII. 628-672
Intorno alia morfologia differenziale esterna ed alia nomenclatura delle specie di Trifolium della sezione Amoria (Presl.) crescenti spontanae in Italia.
Gibelli, a. and Belli, S. (1889a)Malpighia, III. 193-233, contd. 305-319.
Rivista critica della specie di 'Trifolium* italiejie della Sezione * Chronosemium Ser. in DC Prodr 1 *
Sibelli, 0. and Belli, S. (1889b)i*iem. it. Accad. sci. Torino, £er 2, XXXIX. 245-426
Rivista critica e descrittiva della specie di Trifolium italiane e affini comprese nelle Sezione Lagopus Koch.

Gibson, P.B., and Trsutner, J.L. (19&5> 287Crop Science, 5, 477-479
Growth of V/hite Clover with and without Primary Hoots.
Gibelli, 0. and tfelll, 3. 11891JMem. :t. Accad. sci. Torino, Ser. 2, XLI. 149-224
Rivista critica delle specie di Trifolium italiane, comparate con quelle del reste d'Europa e delle regione circummediter- ranee delle sezioni G-alearia Presl. - Paramesus Presl. - Micrantheum Bresl.
Gibelli, G. and Belli, S. (1892)Mem. R. Acoad. sci. Torino, Ser. 2, XLII. 179-222
Rivista critica delle specie di Trifolium italiane, comparate con quelle del reste d'Suropa e delle regione circmnmediterranee delle sezione 'Jrigantheum Nobis (Fdstyllus Presl. p.p.).
Gibelli, G. and Belli, S. (1893)Mem.R. Accad. sci. Torino, 3er. 2, XLIII. 169-228
Rivista critica delle specie di Trifolium italiane, comparate con quelle del reste d'Europa e delle regione circummediter- ranee delle sezioni Calycomorphum Presl. - Cryptosciadium Celak.
Gibson, P.B. (1957)Agronomy J., 49. 213-215
Effect of flowering on the persistence of white clover.
Gillett, J.B. (1952)Kew Bull., i, 367-404
The genus Trifolium in Southern Arabia and in Africa south of the Sahara.
Gmelin, H.K. (1914)Kededeelingen van de Rijks Hoogere Land-, Tuin- en Boschbouwschool, Del 7, Afl. 5»(First series of investigations with reference to the improvement of red clover.)
Gmelin, H.II. (1916)Culture, 28, 414-430
Proefnemingen met Roode Klaver. Tweed Reeks Van Onderzoekingen met Betrekking Tot De Roode Klaververedeling.
Gray, S.j?. (1821)Anatomical arrangement of British Plants. Vol. II.
Grenier, 1-1. and Godron, M. (1848) i'lore de France. Vol. I.
Haggar, R.J.,(196'1)Nature, 191. 1120
Flower Initiation in Kent wild White Clover (Trifolium repens L.) under Controlled Environmental Conditions.

288
Haller, A. von (1768)Historia Stirpium indiginarum Helvetiae. Vol. I. Bern.
Harberd, D.J. (1958)Nature, 181. 138
A Spurious Significance in Qenecological Trials.
Harberd, D.J. (1961)New Phytol., 60, 184-206
Population Structure in Festuca rubra L.
Harberd, D.J. (1962)New Phytol., 6J., 85-100
Jome observations on natural clones in Festuca ovina.
Harberd, D.J. (1963)fcew Phytol., 62, 198-204
Observations on Natural Clones of Trifolium repens L.
Harland, 3.0. (1947)Heredity, i, 121-125
An alteration of gene frequency in Ricinus communis due to climatic conditions.
Healy, A.J. (1961)N.Z. Weed Control Proceedings, 22-38
The Identification of Glovers in New Zealand.
Hector, J.M. (1936)Introduction to the Botany of Field Crops. Vol. II. Central News Agency, Johannesburg.
Hiorth, S. (1931)2. indukt. Abst. Vererbungslehre, 2i, 236-269
Genetische Versuche mit Collinsia II. Die Blatt- ind Kotyl- edonenzeichnungen von Oollinsia bicolor.
Holding, A.J. and King, J. (1963) Plant and Soil, 18, 191-198
The effectiveness of indigenous populations of Rhizobium trifolii in relation to soil factors.
Hollowell, L.A. (1952)Ladino and other tthite Clovers.in Forages. Hughes, Ii.i-»., heath, n.a. and i^etcalfe, D.3Towa State College Press, pp. 180-189-
Hooker, Sir J.D. (1879)Flora of British India. London.

289
Hossain, M. (1961)Notes, Hoy. Bot. Gdn., (Edinburgh), XXIII. 387.
A revision of Trifolium in the Nearer East.
Hovin, A.to. and v>ibson, P.B. (1961)J. Hered., ^2, 295-296.
A Red Leaf Marking in Vhite Clover.
Huxley, J. (1955)Heredity, £, 1-52
Morphism and Evolution.
Jones, B.A. (1962)Nature, 193. 1109
Selective Bating of the Acyanogenic Form of the Plant Lotus corniculatus L. by various animals.
Kajanus, B. (1912)jiotanisker Uotiser, Lund, 39-44
Uber die Blattzeichnung des Rotklees.
Kalm, P. (1819)In John Pinkerton's Voyages and Travels. London
Karpechenko, 3-.D. (1925)Bull. Appl. Bot. and PI. Breeding, !£, 271-279
Earyologische dtudien uber die (Jattung Trifolium L.
Kerner von Piarilaun, A. and Oliver, *\W. (1895)The Natural History of Plants. Blackie, London.
Kettlewell, H,D.B. and Berry, R.J. (1961)Heredity, H, 403-4H
The study of a cline.
Kimura, M. and Kayano, H. (1961)Genetics, 16, 1699-1712
The Kaintenance of Supernumerary chromosomes in wild populations of Lilium callosum by preferential segregation.
King, J. (1963)Plant and Soil, 1§, 221-224
Ecotypic differentiation in Trifolium repens.
Kirk, J. (1899)The Students' Flora of New Zealand. Wellington.
Komarov, V.L.Flora URSS Editio Academiae Scientiarum U.K.3.3., Moscow.

290
Lange, J. (1887)Meddelelser om 9r0foland, 2, 233-308
Conspectus Flora G-roenlandicae. 1). Tillaeg til ^anerogameme og Karsporeplanterne.
Laude, H.i-,., Stanford, 13.H. and Jnloe, A.J. (1958)Agronomy J., 50, 223-225
Photoperiod, temperature, and competitive ability as factors affecting the seed production of selected clones of Ladino clover.
Lieth, H. (1960)Patterns of Change within Grassland Communities, pp. 27-39. in The Biology of Weeds, ed. J.L. Harper. Blackwells, Oxford.
Lo^acono Pojero, i-i. (1883)Nuovo giorn. botan* ital., 225 ff.Glavis specierum Trifoliorum.
Lojaeono Pojero, M. (1891)?lora Sicula. Vol. I, Part 2. Palermo.
Lowe, R.r. (1868)Manual Plora of kadeira. London.
McCloud, D.3. and Cole, V/.A. (1951)Proc. 48th Annual Conv. of ASSOC. of Southern Agricultural Workers, pp. 137 ff.
The Effect of Photoperiod on the Flowering of Ladino andLouisiana White Clovers.
Mirande, M. (1912)C.R. Acad. 3ci. Paris, 155. 651-653
2ur la presence de Vacide cyanhydrique dans le trefle rampant (Trifolium repens L.).
Oliver, D. (1871)Flora of Tropical Africa. London.
Pandey, K.K. (1957)J. Hered., XLVIII. 278-281
A s elf-compatible hybrid from a o?oss between two self- incompatible species in Trifolium.
Parker, k.C. (1933JJ. Hered., 2£, 481-486
The inheritance of a yellow spot character in the bean.
Pethybriige, G.H. (1903)Irish Naturalist, 1j> f 145-151
The leaf-spots of Arum macula turn.

291
Pickering, 0. (1879)Chronological History of Plants. Boston.
Polunin, N. (1959)Gircum-Polar Arctic Flora. Oxford University Press.
Prime, C.T. (1955a)watsonia, £, 175-178
Vegetative Reproduction in Arum maculatum.
Prime, C.D. (1955b)Watsonia, £, 181-185
Variation in Arum maculatum
Reichenbach, L. and iieichenbach, H.G-. (1903)Icones florae Germaniae et Helveticae. Vol. XXII.
Roberts, *l.H. and Struckmeyer, B.E. (1938)J. Agr. Res., £6, 633-677
The effects of temperature and other environmental factors upon the photoperiodic responses of some of the higher plants.
Rydberg, P.A. (1922)Flora of Rocky Mountains and Adjacent Plains. (2nd ?d.). New York.
Saunders, 3.It. (1918)J. Gtenetics, J, 215-228
On the occurrence, behaviour, and origin of a smooth- stemmed form of the common foxglove (Digitalis purpurea).
Scheibe, A, (1955)Zuchter, 2£> 97-103
Die Wirkung der natiirlichen Auslese bei Pisum arvense. Formen mit und ohne Vachsschicht.
Seringe, (1825) Trifolium.in Prodromus Systematis Naturalis Regni Vegetabilis, Vol. II, A.P. de Candolle, Paris.
Seyffert, V. (1955)XIV Int. Hort. Congress, Netherlands, 929-937.
Der Oenetik der Cyclamenfarben.
oeyffert, *. (1957)aartenwelt, ^L (4), 57-58.

292
Smith, 3ir J.B. (1829)English Flora, Vol. III. London.
jmith, P.E. (1950)The Inheritance of Leaf Markings in Red Clover (Trifolium pratense L.)Ph.D. Thesis, Pennsylvania State College. Doctoral Dissertation Series. Publication No. 2243. (Microfilm copy in Library of Welsh Plant Breeding Station, Aberystwyth).
Smyth, A.H. (1887)Life and Writings of Benjamin Franklin, £, 383.
Snaydon, R. and Bradshaw, A.D. (1962) J. Brit, Orassl. Soc., VJ. 113
Xhe performance and survival of contrasting natural populations of white clover when planted into an upland Festuca/Agrostia sward.
Sowerby, J. (1794)English Botany. Vol. III.
Soyrinki, N. (1938)Ann. Bot. Soc. Zool.-Bot. Fenn. Vanamo, 11. 1-323
Studien uber die generative und vegetative Vermehrung der Samenpflanzen in der alpinen Vegetation Petsamo- Lapplands.
Soyrinki, N. (1939)Iiem. Soc. Fauna et Flora Fennica, 15. 201-209
Generative und Vegetative Vermehrung in der alpinen Vegetation Petsamo-Lapplands.
Stahl, a. (1896)Annales du Jardin Botanique de Buitenzorg, XIII. 137-215.
Ueber bunte Laubblatter.
jtanford, E.H., Laude, H.M. and JSnloe, J.A. (1960)Agronomy J., £2!, 149-152
Effect of harvest dates and location on the genetic composi tion of the Syn-j generation of Pilgrim Ladino clover.
Stanford, E.H., Laude, H.K. and Booysen, P. de V. (1962)Crop £c., 2, 497-500
Effect of Advance in Generation Under different Harvesting Regimes on the Grenetic Composition of Pilgrim Ladino Clover.
Stapledon, R.O. (1924)Jour. Min. Agr. (a.B.), 30, 33-38
White Clover.

293
Starzycki, S. (1959)Hodowla Rodlin Aklimatyz. Kasiennictwo, 2, 277-319
Zmiennos*d mieszaiicdw koniczyny bia^ej (Trifolium repens L.) z koniczyna czerwona, (Trifolium prat ens e I . ) . (Variability of hybrids between white clover and red clover.)
Starzycki, S. (1961)Hodowla Ros*lin Aklimatyz. Nasiennictwo, £, 285-330
Badania nad mieszygatunkowymi koniczyn 'Trifolium repens L. x Trifolium praten^e 1 ... (Studies on interspecific clover hybrids.)
Strickland, W. (1801)Observations on the Agriculture of the United States. Kept. British Bd. Agric.
Suckling, F.E.T. (1952)N.Z. J. 3ci. Tech., 2J, A, 64-77.
Dissemination of white clover (Trifolium repens ) by sheep.
Tamm, C.O. (1964)Proc. X Int. Bot. Gong., Edinburgh. Abst. No. 629.
Survival of individual perennial herbs, with some remarks on the role of plant persistence in vegetation dynamics.
Taubert, P. (1894)Leguminosae . In Angler and Prantl, Die Naturliche Pflanzenfamilien. Leipzig, i'eil III* Abth. 3. pp. 70-388 (Trifolium. 249-254).
Thomas, R.3. (1961)Aust. J. Agric. Res., 12, 227-238
The influence of environment on Seed Production Capacity in Vnite Clover (Trifolium repens L.). 1. Controlled Environment Studies.
Tilney-Bassett, R.A.3. and Eirk, J.T.O. (1966?: In press).The Plastids: their structure, biochemistry and genetics. L.H. Freeman, & Co., London.
J.P. and Hovin, A.W. (1960) Aj^ronomy , J . , 52. 485
___ Interspecific hybridization of certain Trifolium specieso-C. Rfi)
~
Ved Brat, S. (1965)Chromosoma, 16. 486-499.
Oenetic Systems in Allium. I. Chromosome variation.
Vicioso, C. (1953)Tre*boles Espanoles. Revision del genero Trifolium.
Cons. 3up. de Invest. C lent. , Institute Botanico A. Cavanilles, i ladrid .

294
Ware, W.h. (1925)J. agric. Jci., i£, 47-67
Experiments and observations on forms and strains of Trifolium rerens L.
Wellensiek, 3.J. (1961)Euphytica, tO, 259-268
ihe Breeding of Dipioid Cultivars of Cyclamen peraicum.
toestbrooks, F.3. and i'esar, 1..B. (1955)Agronomy J., ££, 403-410.
Tap Root Survival of Ladino Clover.
Wexelsen, K. (1928)Univ. Calif. Publ. Agric. ^ci. f 2, 555-376
Chromosome numbers and morphology in Trifolium.
Wexelsen, H. (1932)Hereditas,i& 219-240.
.Segregations in red clover (Trifolium prat ens e L.).
V,hyte, R.O. (1960)Crop Production and Environment. (2nd. Ed.). London.
Williams, R.i). (1931a)Bull, ftelsh PI. Breed. 3ta. f H12. 209-216.
Self- and Cross-fertility and flowering habits of certain herbage grasses and legumes.
Williams, it.D. (1931^)Imp. Bur. Plant Genetics, Herbage Plants, Bull., £, 46-76.
Methods and Technique cf Breeding Red Clover, White Clover, and Lucerne.
Williams, H.D. (1937)Rept. IVth. Int. (Jrass. Congr., Aberystwyth, 238-250.
Genetics of Red Clover and its bearing on Practical Breeding.
Williams, rt.D. (1939)J. Jenet. f 2L 9 441-458, 459-482
3-enetics of Chlorophyll Deficiencies in -*ed Clover - Trifolium pratense L.I. Albinos.
II. Yellow seedling factors.
Williams, W. (1945)Bull. Welsh PI. Breed. Cta. f H16. 19-26
Varieties and Strains of Red and White Clover - British and foreign,Section B. The Varieties of white Clover used in British Agriculture.

295
Williams, W. (1964)'3-enetical Principles of Plant Breeding. Blackwells, Oxford.
v.illiams, w. and Brown, A.O. (1956)Heredity, 10, 237-245.
Oenetic Response to selection in Cultivated Plants: Grene Frequencies in Prunus Avium.
willis, J.G. (1955)A j^ictionary of the Flowering Plants and Ferns. Cambridge University Press.
v.olter, J. (1958)Ann. Univ. I . Curie-Sk^odowska, Sect. J., JJ, 297-325.
Badania nad krajowymi popiilacjami konicxyny biaZej (Trifolium repens L.). (Investigations on native populations of white clover.)
Zohary, D. and Imber, D. (1963)Heredity, 18, 223-231
Grene tic dimorphism in fruit types in Aegilops speltoides.
Zwingli, W. (1956)Thesis (D. Tech. v/iss.), Eidg. Tech. Hochsch., l-urich.
Untersuchun^en uber die Fertilitatsverhaltnisse in schweizerischen Vieissklee-Populationen mit erganzenden zytologischen Studien.
Published in full: Z ,Pf lanzenz . , 36.» 237-288

Appendix I
Table
of N
umbers o
f Samples
and
Plants a
nd Their
Countries
of O
rigin.
The
table
is presented
so t
hat
it i
s possible t
o see
how many s
amples a
nd plants
are
based
on s
eed
and
how
many o
n vegetative m
aterial;
seed s
amples are
underlined i
n the
figures
for
the
British
Isles, the
majority b
eing v
egetative, and
vice v
ersa t
he
minority o
f vegetative samples
is u
nderlined
elsewhere.
The
table
also s
hows h
ow
many o
f the
samples
from each
country
were g
rown a
nd s
cored
by t
he a
uthor
in O
xford
(and a
few i
n Bangor), how
many were
grown
at C
arlow
and
scored t
here b
y the
author,
and
how
many w
ere
grown
and
scored b
y the
staff
of t
he Welsh
Plant
Breeding S
tation,
and within each grouping b
y country
of o
rigin
and
place
of s
coring,
indicates
which
samples
were known
to be of established, spontaneous
growing
wild o
rigin, which
are
unrepresentative of t
heir p
op\ilation o
r represent
bred s
trains,
and
for
which
there
is n
o information
to indicate w
hich o
f these
is the
case.
In e
ach cell o
f the
table, the
first
figure r
epresents
the
number o
f samples,
and
the
second the
total
number o
f plants contained
in t
hem.
Place
Scored
Wild o
r Selected
Vegetative
Seed
Combined
Total
TOTAL
Field
Wild
Summary
of Totals
Oxford
Oak
Park
Wild
? Wild
?Carlow
Seltd.
Welsh
P.B.3.
Wild
? Seltd
289
192 94
9723
377
19900
551136
39621363
68533273
1929497
83
68
23966
2010
58
32
1^3
35
138^82
1435
6385
1907
5102
2010
58
69
3 13
123
356180
324
533
6385
1907
92
3 —
—6557

Part 1.
Natural
Range
outside
British
Isles
(Seed
unless underlined).
Field
Oxford
Carlow
Welsh
P.B.S.
Place
Grown
and
Scored
TOTAL
Wild o
r Selected
Wild
Iceland
Norway
Sweden
Finland
Russia
Poland
Denmark
Germany
Netherlands
Belgium
France
2 5 6 2 1 24 9 21 11 2
30 361
294
282 86
1462
1414 638
451 59
26 1067
Switzld &
Lcht 19 1342
Italy
17
776
Spain
57 3
222
Portugal
Morocco
Austria
Hungary
Yugoslavia
Greece
Bulgaria
Turkey
Lebanon
Israel
Iran
Afghanistan
West P
akistan
Totals
(Pt. 1)
18
678
7 8 3 27 15 1 10 2 7 16 12 6
161
613 93
1545
1031 59 713
130
405
723
428
249
334 18
312
Wild
2 30
Wild
Seltd
Wild
2 1 18 5 8 1 7 5 2 3 4 2 1
^ M
213
1
275
1197
1198
152 82 846
300
170
389
375
1199 59
1 rr
99
3 1 2 2 3 7
3 148
31
28
51
10
7 2 2 2 3 2105
18 9
1 50
5 1120
12
67 12 9 5
^s
^ ^ A
147 86
96
110
116
327
200
316
345 87 88 89 158 89 914
687
299 90 57 587
313
221
3 1 7 3 1 1 1 1 1 1 2 2 1 3
147 58
330
116 49 50 40 150 30 40 274
150 49 115
(14
( 1 49 (10
( 2 A 1 1
468) 23)
2879 377) 12)
16 56 28
2 1 4 1 3 1 1 3 5 3 5 1 2 1 4 2 2 1 3 1
49 7
169 48
60 8 10 90 11
2 67 106 56 66 4
151 49 90 40 78 20
5465
104
28
-224
303
5422
1598
83
463866
1280
Seltd
1 54

Part 2.
British
Isles
(Vegetative
unless underlined)
Field
Oxford
Oak
Park
Wild
Wild
? Wild
?TOTAL
NB E
ng.
SB S
cot.
Lanes &
Yorks
wales & M
(N)
N. Midlands
Wales
& M
(S)
S. Midlands
South-East
Cornwall,
So.Is.
Unlocated
Ireland
Total
(Pt. 2) Part
3,Azores
Canada
U.S.A.
Jamaica
Costa Rica
Peru
Brazil
Uruguay
Argentina
New
Zealand
Australia
Japan
India
Ethiopia
South Africa
Total
(Pt. 3)
Carlow
Seltd
Welsh
P.B.S.
Wild
?Seltd
46 18 39 23 31 65 33 7 1 23 286
12471 732
1150
1127 886
2847
1762 178 58
1021
2232
45 15 23 14 6 60 29 192
2462 701
960
14
152
982
227
2482
2+1
238+93
1683
1917
199497
483
Outside
Natural
Range
(All a
re S
eed
1 5 18 1 1 1 1 1 3 15 10 3 3 1 1 65
106
249
719 58 46 40 19 50 176
518
461
120 88 39 40
2729
1 106
1 103
5
12
400
14
5609
1900
1 2900
Samples]
230
6 1 1 1 2 3 2 1 17230
58 52.
108
) 278
458 46 50 139
1197
2
48 39
7855
1 3i+1 9
2+23 2 4
2+5
2 55
2. 31 2+29
145 21+632
34 79 50+128
621 1
1236
152 38 119
309
4 2 1 1 1 2 5 3 1 21
§ 8 146 55
1 4
40 19 37 80 145
120 40
1722
4rv> VD CO

Appendix I
I
Numbers
and
Frequencies
of m
ain Marking
Types, by C
ountries of O
rigin.
These
figures
are
the
totals of a
ll p
lants
showing
each m
ark;
that is,
double
marks
(except
LL)
are
counted
twice, and
the
sum
of t
he other
figures
on each
line
may
therefore
exceed t
hat
of the
'total
1 figure.
LY scores
are
added
into t
he L
total, and
the
L figures
are
therefore
not
quite
equivalent t
o those
used b
elow i
n the
statistical
treatment, where
allowance
is made f
or the
dominance
of 7"^
by c
ount
ing
L only a
mong p
lants
not
showing
Y.
""
The figures
for
two
countries
(Prance
and
Italy) are
divided, geographically
defined
groups with distinctive m
arking f
requencies b
eing separated from t
he (larger)
remainder, in which remain
the
samples
not
located
more p
recisely t
han by t
he country
of o
rigin.
The
table
is presented
in t
hree parts, the
British
Isles
and
the
samples
from
outside
the
species' natural
range
being
removed
into separate sections.
NB«
A decimal
point
should b
e read b
efore
the
frequency
figures.
Except f
or t
hose
for
the
totals,
they a
re presented
as parts
per
t'lousand.
IX)

Area
Total
0B+M
BaT
B+M
Ba£art 1.
Natural
Range
of Species
(excluding B
riti
sh I
sles)
Iceland
Norway
Sweden
Finland
Russia
Poland
Denmark
Germany
Netherlands
Belg
ium
France (exc,
SB)
Fran
ce,
South-east
Spain
Portugal
Morocco
Swit
zld &
Lent
Austria
Italian
Alps
Italy
(exc.
A, S)
Sicily
Hungary
Yugoslavia
Greece
Bulg
aria
Turkey
Lebanon
Israel
Iran
Afghanistan
West Pakistan
Total, Pt
. 1.
30 361
294
282 86
1462
1414 638
451 59 905
162
3222 678
161
1342 613
300
438 38 93
1545
1031 59 713
130
405
723
428
249
11 82 78 48 26 308
211
152 71 5
104 5
346 69 6
197 88 51 29 38 32 113 19 2
115 1 1 71 137 37
15 261
212
225 49
1068
1151 434
380 51 750
138
2711 572
136
1108 519
158
399 .. 59
1348 967 53 561
129
402
628
253
209
_. 1 7 10 — 47 30 29 5 4 76 39 158 47 22 40 3 4 14 — 1 38 59 — 42 — 3 27 42 3
_ — — — _ 3 29 6 — .. 9 2 6 — — 1 1113 2 - — 80 44 — 10 - — 10 5 2
_ 12 - — 9 8 4 5 2 1 6 — 18 — — 20 — — 1 - 1 12 1 - - — - 2 - -
5 27 2 3 6 43 19 7 - — 7 - 75 5 - 13 4 4 - — 1 41 28 6 - — — 5 1 1
367
227
265
170
302
211
149
238
157
085
115
031
107
102
037
147
144
170
066
1000 344
073
018
034
161
008
002
098
320
149
500
723
721
798
570
731
814
712
843
864
829
852
841
844
845
826
847
527
911
- — 634
872
938
898
788
992
993
869
592
839
— .
003
024
135
. — -
032
021
045
021
068
084
241
049
069
137
030
005
013
032
— ...
011
025
057
_, — 059
—- ,
007
037
098
012
— _
•__
— .«— .
«. — .
002
021
009
—— .
— .
010
012
002
—— .
——
001
002
377
005
———— M.
- —————
052
043
——
014
— -
.. — .
014
012
008
——
033_ — ...
105
005
003
008
004
017
007— »
006
— — •
——
015
——— -
002
— .-
011
008
001— -
—— ,
— -
— .—
003
————
167
075
007
011
070
029
013
011
— .-— .
008
. . — .-
023
007— .
010
007
013
- — •
— —
011
027
027
102— -
————
007
002
004
18312
2453 14
966
751
323
102
303
1340
8173
0410
0176
0056
0165
o o

Area
NE E
ng.
+ SE Scot,
Lanes
Yorks
Wales
+ Marches
N North Mi
dlan
ds
Wales
+ Ma
rche
s 3
Sout
h Mi
dlan
ds
Sout
h-Ea
st
Cornwall,
Sc.
Is.
•Eng
1 unlocated
Ireland
Tota
l, Pt.
2.
Azores
Canada
Unit
ed States
Trop.
America
Temperate
S. Am
eric
aNew
Zealand
Australia
Japan
India
(Nilgiri H
s)Et
hiop
iaSouth Africa
Total, Pt
. -5.
Combined T
otal
otal
2471 732
1150
1127 886
2847
1762 178 58
1021
0
900
164
326
218
136
734
303 11 5
177
L Part
1545 557
803
891
744
2085
1405 165 51 841
Y 2. 18 11 12 15 5 22 41 2 1 2
B+M
Ba
1 British
Isle
sY
Ba
1223
2 2974 9
087
129
106
249
719
163
226
518
461
120 88 39 40
Part 3
.7 33 82 17 33 107 37 20 8 6
99 205
579
139
180
408
374
100 80
7 63 9 20 12 67
40
— — — — — . . «. — 2 2
Outside
1 — 38 1 3 - 7 1 — — - 51
10 1 7 13 4 17 20 4 — 3 79
1 3 7 1 1 3 10 1 1 2 30
Natural
— 1 2 1 - 4 1 «M — — — 9
— 5 17 — 2 4 2 — — - — 30
364
224
283
193
153
258
172
052
086
173
2431
Rang
e066
133
114
104
146
207
080
167
091
154
— —
1283
625
761
698
791
840
732
797
927
879
824
7429 934
823
805
853
796
788
811
833
909
821
1000
8193
007
015
010
013
006
008
023
011
017
002
0105 ...
028
088
055
088
023
145
— -
. — .
026
— - —
0656
...
— .—
- — .— .
— ..— *
...
— .
— -
002
0002 009
——
053
006
013
-.-
015
008— .
...
——
0187
004
001
006
012
005
006
011
122— .
003
0065 ...
004
003
006— .
008
002
...
—— .
...
——
0033
0004
004
006
001
001
001
006
006
017
002
0025 ...
020
024
— .—
009
008
004
...
...
...
——
0110
2729
350
2236
179
3327
3 5777 26
289
1059
376
190
363
1736
?90
1 °3
180057
0113
0109 o

Appe
ndix
II
I(a)
Fr
eque
ncy
Data U
sed
in British Is
les
Maps (Figures VIII (x-xii)
0 0/N
Y Y/
N
Oxto
nj Blainslie
Jedb
urgh
Wool
er;
*Ber
wick
Thropton;
Longframlington
Morp
eth;
Lo
nghi
rst;
Se
aton
Sluice
Bell
ingh
am;
Ghollerford
Catt
on;
Thir
lwal
l; ailsland
Dirt
Pot;
Moss
Koor
Bran
cepeth;
Sunn
ysid
e;Wolsingham;
Stan
hope
;Ro
okho
peSherburn;
Ston
eyga
te
Saltergate
Malton;
Bart
on H
ill
Wart
er;
Flkt.
Weighton
Ferrybridge
*Gre
at House
(Helmshore)
Bang
or(*); *K
ewbo
roug
h;*Port
Dino
rwic
'n-y
-Mae
s; Na
nt F
fran
con;
arid R
ef.
NT5054
NT65
21
NT99
30
NU0502
NZ2585
NY9478
NY7062
NY8542
NZ0838
NZ35
46SB8594
SE7468
SB86
463B4823
SD78
21SH
5772
N
Llyn O
gwen
*P
en-y
-Pas
s Betws-y-Coed
Llangollen
Oobo
wen
*0swestry
Burt
on J
oyce
; La
mble
y;Dorket
Morl
ey;
*Dov
edal
e; Sw
arke
ston
(Bri
tain
:
Llug
wy V
alley; SH6960
Capel
Gurig
3H79
57
SJ24
41
3J3035
SJ2930
SK63
46
SK37
40
122
160
131
271
155
156
167
249
464
594 87 253
248
113 31 146
374 80 452 69 29 258
162
59 36 33 111 49 73 65 153
164
157 17 60 66 19 2 29 87 28 157 241
87 39
484
225
252
410
316
468
389
614
353
264
195
237
266
168
065
200
233
350
347
348
034
337
245
1 3 5 1 5 2 3 3 6
008
019
015
008
011
020
008
027
021
038
013
012
LL
00
LL F
rea.
(Cor
r.J
1 00
4 — 5 1
035
031
115
087
014
049
: Sa
mple
or
(Jroup sc
ored
in g
reenhous
e;
if g
reat
er p
art
of g
roup,
Plotted
with b
roke
n ou
tlin
e on m
ap).
Corrected
LL F
requency c
alculated
as sum
of a
ll L
L scores d
ivid
ed b
y sum fo
r each
samp
le of j
£-(1-/W
/ ?)
2.
o

Appe
ndix
II
I(a)
co
ntin
ued
CJro
by;
Markfield
*Med
bour
ne;
Skef
fing
ton;
*C
h.La
ngto
n; *T
ur L
angton;
Mkt.Harborough;
Rothwell
Isha
m*H
olkh
amAb
erys
twyt
h; *C
lara
ch
Defi
nog
*Grlamorgan
*Mon
mout
hBu
rfor
d; Gh
. Norton
Mars
ton;
Woodstock;
Shot
over
; *0
xfor
d Wytham;
Coth
ill;
Witt
enham
*Creslow
*Rothamsted
*Romney Marsh
Sels
fiel
dFulmer-Kings to
n; Newhaven
Chanctonbury;
Wigg
onho
lt;
Northpark
Midhurst;
Hemley (Sx)
Nutcombe;
Mark
's B
dge
*Scilly
Isle
s
Thurles
Waterford
Ardm
ore
Clonakilty
Fermoy
Mallow
Tallow
*Bantry
(Ireland
:
Orid
Ref
.
SK4910
3P7488
3P89
75
TF8944
3N58
81
3N92
28
3S92
683T3784
SP29
20SP
5210
3P48
09
3P81
22TL
1311
TR0430
TQ3534
TQ3908
TQ10
14
N0
0/H
x) ge
Lat.
52.4
2N52
.15N
51.57N
51.38N
52.08N
52.08N
52.06N
51 -41
N
SU89
23SU8738
3V9211
Long
.7.50W
7.08W
7.42
W8.53W
8.17
W8.
39V
7.59
W9.27W
200
32
411
47
34 62 170 67 57 575
122
4 9 38 20 5 72 19
268
208 64 87 72 94 107 54
55 45 11 11 10 18 14 5
160
114
118
145
224
299
088
125
156
Y 7 2
205
216
172
126
139
191
131
093
Y/N
035
005
048
009
786
176
198
8 00
9 12 16 1 7 5 2 1 20
1664 34 238 79 98 340
881
236
128 40
548 3 8 5 16 54 129 60 37 0
329
088
034
063
163
175
146
252
289
——
13 1 — - 1 2 29 3 6 2
008
029
—— .
—— .
010
006
033
013
047
050
004
011
LL
LI F
req.
(Corr.;
2 02
7
5 026
7 149
1 073
4 01
92
044
049
044
062
043
113
057
009
059
8 083
7 079
9 151
3 137
5 H6
1 034
2 06
4
Seed
Sam
ple,
pl
otte
d with
scor
ed a
t Ca
rlow
.)broken o
utline.
All
othe
rs transplanted,
Q

Appendix I
II(b)
Frequency Data Use
d for
West
ern
Europe Maps (Figures V
III
(xiii, xiv)
Ulvila (Finland)
Rogaland (N
orwa
y)Va
g^ne
s (N
orwa
y)Va
nl^s
e (Denmark)
Jutland
(Denmark)
Vogar, Th
ing
(Iceland)
Botn E
yjafjaraar (Iceland)
Kamien P
omor
ski
(Poland)
Grre
dzie
o; Barlinek (Poland)
Cedynia
(Pol
and)
Pozn
an";
Ko
byle
pole
; Plewiska;
Sier
osla
w; Za
krze
wp
Bierutowice, Ka
rkon
osze
(Poland)
Wilczowice St
are
(Poland)
Jasierf
(Poland)
Lubiaszow
(Pol
and)
Kr
ynic
a (P
olan
d)
2egi
esto
w (Poland)
Suwa
^ki
(Poland)
Stra
ubin
g, Bavaria
(Germany)
Hohe
nhei
m (Germany)
G-ie
ssen
(Germany)
((Veget.))
Rhei
ms (F
ranc
e)
Loch
rist
, Le Conquet
(France)
Croz
on;
Pentrez
Pla^e
(France)
Roue
n; Is
neau
vill
e (France)
Yvetot (France)
Chamffleuri
(Fra
nce)
Ho
udan
(F
ranc
e)
Bernay (F
ranc
e)
Foug
eres
(F
ranc
e)
Tre*ogat (France)
Gord
emai
s (France)
Lat.
61.26N
59
N67
-17N
55.3
0N57
N
63-59N
66
N53
.58N
53-0
2N53
N52
.25N
50.30N
52.0
5N51.30N
51.1
0H49
.25N
49.39N
54.0
5N48.53N
48.43N
50.36N
49.3
0N48
. 1 0N
48.1
2N49
.32N
49.37N
48.50N
48.4
8N48.05N
48.21N
47.5
5N47.18N
Long
.21.56B
6 B
14.243
12.30E
9.30E
22.2
4W1 9
V,
H.49E
15-0
8E14
.20E
16.53S
16.3
0E19
.10E
19.4
0E19.20E
20.5
6E20
.40B
22.5
5E12
.53B
9.15B
8.42E
4.00
E4.
45V
4.20
W1.02B
0.45E
2.40
S1.
36E
0.04W
1.1 2W
4.15W
1.53
W
Tota
l27
5 40 312
1198 48 14 16 77 44 18 474 40 44 58 61 47 250
229 20 40 132 40 20 122
128 30 20 40 20 119 39 40
0 47 16 60 164 9 1 10 12 9 1
115 4 2 10 8 10 31 61 1 4 38 16 122
1 1 1 10 1 18 0 2
0/N
171
400
192
137
188
071
625
156
205
056
243
100
045
172
131
213
124
266
050
100
288
400
050
180
008
033
050
250
050
151
— .—
050
Y 10 — 1 27 — — — _ — 17 3 1 5 M 1 — — 1 6 9 3 — 14 — — — 49 — — — — — __ 1 —
Y/lf
036
— — _
003
023
...
...
...
221
068
056
011
...
023
. — .
...
021
024
039
150
...
212
...
—— .
...
383
— .— .
— .— .
— ..
026
——

Appendix I
II(b)
continued
Chantonnay (France)
S.Andre* d
e Lancize
(France)
(Nv* of)
Kontpellier
(France)
Aigues M
ortes
(France)
(NV
of)
Gavaillon
(France)
Belmonte -
Guard a
(Portugal)
Ramada (Portugal)
Estremoz -
Redondo (Portugal)
Castello d
e Vide (Portugal)
Pocinho
(Portugal)
Outerio; Milhao;
Grrandais;
Vinhaes; Vinhaes
- Chaves;
Vinhaes
- Vilar
d'Ossos
(Portug*
La C
oruna: Arteijo; Garballo
(Spain)
Guitiriz;
Baamonde (Spain)
Bar a
lia; Vega d
e Valcarce;
Villafranca
del
Bierzo;
Torenp;
Paramo d
el S
il;
Folgoso
de la
Ribeira; Astorga
(Spain)
Leon -
Oviedo
(Spain)
Ribadesella; Gangas d
e Onis;
Oolunga
(Spain)
Oseja
de ^ajambre;
Cangas d
e Onis - Riano
(Spain)
Mediano
(Spain)
Vega d
el R
io Gallego? Aula D
ei,
Zaragoza (Spain;
Lat.
46.41N
44.15N
43.35N
49.32N
43.52N
40 . 2
0N38.50N
38.44N
39.26N
41 .08N
41.49N
*i) 43.16N
43.1 ON
42.40N
42.56N
43.26N
43.11N
42.21N
41.45N
Pamplona;
Larrasoana;
Ao±z (Spain)
42.51N
ErroJ
Roncesttalles
(Spain)
Bailo
(Spain)
Sierra G
uadarrama
(Spain)
Kuelas d
el P
an -
Fonfria;
Fonfria
- Alsanices
(Spain)
42.57N
42.31N
41
N41.37N
Long.
1 .03V
3.45E
3.40E
4.05E
4.59E
7 . 20V
9 . 20V
7.43V
7.26V
7.07V
7.02V
8.29V
7.49V
6.30V
5.41V
5 . 08V
5.03V
0.10V
0.50V
1.32V
1 . 26
V.0.48V
4 V
6.08V
Total
29 33 50 39 30 148
194 19 28 18 153
164
377
463
218.
200
159 38 56 282 76 86 74 108
0 8 2 - - 1 28 — 3 1 1 23 2 47 34 23 6 26 2 - 13 2 7 27 66
0/N
276
061
————
033
189
——
158
036
056
150
012
125
073
106
030
164
053
——
046
026
081
365
611
Y 1 6 10 20 3 38 4 - 1 — 2 11 — 22
1 11 8 - 12 26 12 — . 1 3
Y/N
034
182
200
513
100
257
021
_.._
036— .
013
067— .
048
005
055
050
——
214
092
158
..— .—
014
028
XJ1

Appendix III(b) continued
Marin; Cangas;
Meano;
Armentera; Viascon
(Spain)
Pontevedra -
Lalin;
Lalin;
Silleda; Monte
Pedroso,
Santiago?
3nfesta
(Spain)
(South o
f) Marrakesh
(Morocco)
Le P
ont; Ghangins;
La F
re*tazi
Les
Allieres (Switzerland)
Lat.
42.25N
42.46
.
31.13*
46.40N
Long*
8.42V
8.17W
8.00W
6.40B
Orsieres;
Bluche;
: *lpage P
rid
A£i ^ZK
i oc^
(Switzerland)
46.06N
7*25E
Zurich;
Stein-a#-Rhein (Switz. )47.23N
Schaanwald,
Liechtenstein
Ardez
(Switzerland)
Gruppo B
ernin© ,
Valmalenco
(Italy)
Sondrio
(Italy)
Pisa (Italy)
Sicily
Grobming (Austria)
Gumpenstein
(Austria)
Michelbach ; Ruppr e
ch t
shaf e
n (Austria)
Pajtacyujtmeny,
Martonvasor
( Hungary)
Kutina (Yugoslavia)
Zagreb;
Maksimir (Yugoslavia)
Beltinci (Yugoslavia;
Bokanjac L
ac,
Zadar
(Yugoslavia)
Mostar (Yugoslavia)
Skopje (Yugoslavia)
Kerasovon
(Greece)
Koutsouf li
ana
(Greece)
Yannina
(Greece)
Br K
jupria,
Rhodopus Kts.
(Bulgaria)
47.11N
46.47^
46 . 20N
46.11N
43.43N
37
N47 . 2
8N47.29F
48 .
1 0K"
47.15N
45.28K
45.49N
46 . 30N
A A
f\TtCT
44 . 07-W
43 . 20N
42 . OON
40.20N
39.45K
39.40N
42
N
8.33E
9*312
10.13B
9.50E
9.52E
10.24E
15
B13»55B
14.56B
15.50B
18.45B
16.472
16.00B
16.15B
15.13^
17.49E
21.28E
20.45B
21.1 OB
20.51E
24
B
Total
284
338 72 550
346 66 40 28 42 256 50 38 134
255 66 40 119
133 48 31 116
109
128
127 40 59
0 27 46 76 46 14 .— 9 24 27 6 38 11 44 13 21 .. 14 7 ••• 1 _ •M*
TM 1 2
0/N
095
136
138
133
212
...
321
571
105
120
1000 082
173
197
525
...
105
146
...
009
mm^
mf
•M^«W
_____
025
034
Y 1 12 20 31 3 5 . Q 1 3 _ _ — £' - . 3 •~ ,^ ^ 38 6 —
Y/N
004
036
278
056
009
076
...
..._
024
012— .
...
...
...
——
——
...
023
...
...
lin n
•»«•••
297
047
_. — .

Appendix I
II(b)
continued
*FjJ E
ngland,
SE S
potland
()*Yorkshire
G-reat House, Rossendale,
Lanes.
*North W
ales (West) ()
*Llangollen
etc.
()
Aberystwyth;
Clarach
South
Wales
(+)
*North Midlands
()
Holkham, Norfolk
*0xon. and Berks
()
Rothamsted;
Creslow, Bucks.
*Sussex
and
3urrey
Romney Marsh
St.
Mary's,
ocilly I
sles
Thurles
Waterford
Tallow;
Ardmore; Mallow;
Fermoy
Clonakilty;
Bantry
Total
2302 701 31 600
550
170
699
1065 62
2575 272
1683 79 40 268
208
337
141
(British I
sles
835
162 2
144
182 38 97 209 9
723 11 298 5 55 45 53 16
!ite
()
Majority o
f samples
scored a
t Jome of s
amples scored at ^ite
3ome of samples
not
scored at s
ite.
0/N
363
231
065
240
331
224
139
196
145
281
040
177
063
205
216
157
113
18 11 6 6 5 12 3 211 41 2 1
Y/N
008
016
010
011
007
011
048
008
004
024
CQ50
004
007

Appe
ndix
III(c)
Frequency
Data u
sed
for
Larger Scale
Maps of Whole
Rang
e (Figures VI
II (xv, xv
i))
Data a
s for
Countries, se
e Ap
pend
ix I
I, with the f
ollo
wing
exceptions:
N. No
rway
(Vagffnes)
3. Norway (Rogaland)
(Nor
way:
om
itte
d)
N.ii.
Pola
nd (SuwaXki)
N.W.
Poland
S. Po
land
N, Fr
ance
N.
V.T .
Fran
ce
S.E. Fr
ance
(France: om
itte
d)
N.I3
. Sp
ain
Cent
ral
Spai
n (S
. Ouaderraraa)
N.l/.
:pain
Extreme
K.W.
Sp
ain
(Spain:
omit
ted)
N.
Portugal,
Central
N.Vf.
Spai
n S.
Po
rtug
al
N. Br
itai
n (greenhouse-scored on
ly)
S. Britain
(greenhouse-scored o
nly)
Total
312 40 (9)
229
731
502
258
389
162
(258
)
538 74 992
1211
(417
)279
389
240
1278
0 60 16 (6)
61 182 65 28 52 5
(24) 24 27 88 123
(3D
90 32 '34 141
0/N
192
400
266
249
129
109
134
031
045
365
089
102 - 323
082
142
110
Y 1 — H 9 30 8 49 2 39 (25) 50 1 42 24 (38) 5 45 3 12
I/N
003
— .-.
.-"_,-
.
039
041
016
190
005
241
093
014
042
020
*.- .
018
116
013
009
o 00

Append
ix I
II(d)
Frequency
Data u
sed
in S
maller Scale
Maps o
f Wh
ole
Range:
Figures
VIII
Tota
l Y
B+M
Ba
? H
LL
Y B+
l ba
FH
(xvii-xxii)
LL
Est.
,No.
of
corr
.)
V1Britain
1(scoring f
or 'H
1)Ireland
N. F
rance
S. Fr
., NE.
Sp.
NW.
op.,
Portugal
Morocco
Sicily
Italy
(ex. A.,
3.)
Swit
z.,
It.
Alps
Neth
., Belg., Germ.
Den.
, Sw
ed.,
3.Nor.
Finland
N. No
rway
Icel
and
Russia
Pola
ndAustria, Hungary
Yugoslavia
Greece
Bulgaria
Turkey
Isra
el,
Lebanon
Iran
Afghanistan
West P
akistan
present
only b
y introduction.
Azores
106
- 1
2 ——
009
—— —— ——
034
58.5
3 Ethiopia
39
1 2
1 026
—— —— ——
051
077
12.95
The
last column s
hows th
e di
viso
r for
the
(corrected) LL f
requency f
i^ur
^s,
that is,
the
number o
f pl
ants
ca
lcul
ated
to
possess
two
alleles
in t
he V^
-V*1
grou
p,
'e:
'' ca
lcul
ated
as
the
sum
of Y
(1./7T7Y)2
for
eacn sample.
1211
1641
1021 895
710
3362 161 38 438
1642
1148
1748 282
321 30 86
1462 706
1545
1031 59 713
535
723
428
249
of
127 2 76 89 155 22 — . H 44 38 37 10 1 - - 47 4 38 59 — .
42 3 27 42 3range:
— 2 9 7 1 — — 2114 6 29 .— — — ~ -
_ — 3 180 44 .. 10 . — 10 5 2
76
28
3 2
6 7
4 -
14
80— —
—
..1 —
20
178
74
21-
312
27— •-
- 5
9 6
8 43
1 6
12
411
28 62
5-
-2
5 1 1
41 16 48 23 43 4 — 2 56 10 47 8 11 — .— 16 8 y2 14 .. 13 12 13 — 2
Mapp
ed a
s broken
115
011
28
002
34
085
77
125
207
046
2 13
7
5 032
74
027
20
033
139
021
6 135
6 003
- ——
- — .
62
032
29
006
76
025
60
057
14 ——
20
037
22
006
20
037
3 09
81
012
circ
le .
...
002
010
010
0003 . — 005
069
005
017
...
. — . — ...
002
0014 052
043
...
014
...
014
012
008
ooe
003
007
006
004— .
002
012
007
002— .
037
. — -
105
005
0014 008
001
— ..
003
...
003
...
— -
Trifolium
003
002
008
— ..
024
——
——
010
006
012
011
034
167
070
029
008
027
027
102
007
...
007
002
004
025
016
054
032
013
025
005
034
009
027
028
034
. — .
. — .
021
011
021
014
...
018
922
018
...
008
040
078
099
229
148
030
026
135
0^9
239
063
070
— .
— ..
163
115
101
091
512
060
046
060
041
011
2908.83
357.
64344
. 93
335.78
1401.86
66.14
...
195.
86547.47
336.49
580.46
94.8
685
.67
2.57
10.14
380.29
252.
60755.35
659.45
27.3
7331.60
474.33
331 .6
072.78
94.59
re pe
ns probably