
PRELIMINARY DECISION Energex determination 2015−16 ...
309
7-0 Attachment 7 – Operating expenditure | Energex preliminary determination 2015–20 PRELIMINARY DECISION Energex determination 2015−16 to 2019−20 Attachment 7 − Operating expenditure April 2015
-
Upload
khangminh22 -
Category
Documents
-
view
0 -
download
0
Transcript of PRELIMINARY DECISION Energex determination 2015−16 ...
7-0 Attachment 7 – Operating expenditure | Energex preliminary determination 2015–20
PRELIMINARY DECISION
Energex determination 2015−16
to 2019−20
Attachment 7 − Operating
expenditure
April 2015

7-1 Attachment 7 – Operating expenditure | Energex preliminary determination 2015–20
© Commonwealth of Australia 2015
This work is copyright. In addition to any use permitted under the Copyright Act 1968, all
material contained within this work is provided under a Creative Commons Attributions 3.0
Australia licence, with the exception of:
the Commonwealth Coat of Arms
the ACCC and AER logos
any illustration, diagram, photograph or graphic over which the Australian Competition and
Consumer Commission does not hold copyright, but which may be part of or contained
within this publication. The details of the relevant licence conditions are available on the
Creative Commons website, as is the full legal code for the CC BY 3.0 AU licence.
Requests and inquiries concerning reproduction and rights should be addressed to the Director,
Corporate Communications,
Australian Competition and Consumer Commission,
GPO Box 4141, Canberra ACT 2601
Inquiries about this publication should be addressed to:
Australian Energy Regulator
GPO Box 520
Melbourne Vic 3001
Tel: (03) 9290 1444
Fax: (03) 9290 1457
Email: [email protected]
7-2 Attachment 7 – Operating expenditure | Energex preliminary determination 2015–20
Note
This attachment forms part of the AER's preliminary decision on Energex's 2015–20
distribution determination. It should be read with all other parts of the preliminary
decision.
The preliminary decision includes the following documents:
Overview
Attachment 1 – Annual revenue requirement
Attachment 2 – Regulatory asset base
Attachment 3 – Rate of return
Attachment 4 – Value of imputation credits
Attachment 5 – Regulatory depreciation
Attachment 6 – Capital expenditure
Attachment 7 – Operating expenditure
Attachment 8 – Corporate income tax
Attachment 9 – Efficiency benefit sharing scheme
Attachment 10 – Capital expenditure sharing scheme
Attachment 11 – Service target performance incentive scheme
Attachment 12 – Demand management incentive scheme
Attachment 13 – Classification of services
Attachment 14 – Control mechanism
Attachment 15 – Pass through events
Attachment 16 – Alternative control services
Attachment 17 – Negotiated services framework and criteria
Attachment 18 – Connection policy
7-3 Attachment 7 – Operating expenditure | Energex preliminary determination 2015–20
Contents
Note ...............................................................................................................7-2
Shortened forms ..........................................................................................7-7
7 Operating expenditure ..........................................................................7-9
7.1 Preliminary decision .......................................................................7-9
7.2 Energex's proposal ....................................................................... 7-10
7.3 Assessment approach .................................................................. 7-12
7.4 Reasons for preliminary decision ............................................... 7-21
7.4.1 Forecasting method .................................................................. 7-23
7.4.2 Base opex ................................................................................. 7-23
7.4.3 Rate of change .......................................................................... 7-28
7.4.4 Step changes ............................................................................ 7-29
7.4.5 Debt raising costs ...................................................................... 7-30
7.4.6 Interrelationships ....................................................................... 7-30
7.4.7 Assessment of opex factors ...................................................... 7-31
A Base year opex .................................................................................... 7-34
A.1 Summary ....................................................................................... 7-35
A.1.1 Preliminary determination adjustments ...................................... 7-35
A.1.2 Why the service providers' revealed opex is not an appropriate
starting point for estimating total forecast opex ........................................ 7-36
A.1.3 Summary responses to Ergon Energy's submissions ................ 7-46
A.2 Ex ante incentive regulation and the role of benchmarking ..... 7-49
A.2.1 Ex ante incentive regulation ...................................................... 7-49
A.2.2 Contrast with a cost of service regime ....................................... 7-51
A.2.3 How benchmarking helps manage incomplete information about
efficient costs ........................................................................................... 7-53
A.2.4 Benchmarking is part of the regulatory framework ..................... 7-55
7-4 Attachment 7 – Operating expenditure | Energex preliminary determination 2015–20
A.2.5 Benchmarking is a common regulatory tool ............................... 7-57
A.3 Assessment approach .................................................................. 7-59
A.3.1 Our approach to benchmarking since May 2012 ....................... 7-62
A.3.2 How our approach is consistent with NER requirements ........... 7-64
A.3.3 Our approach is consistent with incentives ................................ 7-78
A.3.4 The benchmarking we rely on in our approach is robust, reliable and
reasonable ............................................................................................... 7-80
A.4 Our benchmarking is robust, reliable and reasonable .............. 7-84
A.4.1 Preliminary determination .......................................................... 7-84
A.4.2 Benchmarking findings .............................................................. 7-87
A.4.3 Submissions on NSW and ACT benchmarking.......................... 7-90
A.5 Category analysis and qualitative review ................................. 7-130
A.5.1 Findings from the service providers' proposals ........................ 7-131
A.5.2 Category analysis .................................................................... 7-137
A.5.3 Detailed review........................................................................ 7-148
A.6 The net impact of operating environment adjustments .......... 7-156
A.6.1 Preliminary decision ................................................................ 7-157
A.6.2 Approach to operating environment factors ............................. 7-160
A.6.3 Customer factors ..................................................................... 7-165
A.6.4 Endogenous factors ................................................................ 7-171
A.6.5 Geographic factors .................................................................. 7-191
A.6.6 Jurisdictional factors ................................................................ 7-213
A.6.7 Network factors ....................................................................... 7-229
A.7 The benchmark comparison point and adjustments to base opex .
7-252
A.7.1 Preliminary position ................................................................. 7-252
A.7.2 Reasons for preliminary position ............................................. 7-254
A.8 Adjustments to base year expenditure ..................................... 7-265
A.8.1 Treatment of provisions ........................................................... 7-265

7-5 Attachment 7 – Operating expenditure | Energex preliminary determination 2015–20
A.8.2 Service classification change .................................................. 7-266
A.8.3 Category specific forecasts ..................................................... 7-266
A.8.4 Non-recurrent expenditure ...................................................... 7-267
A.8.5 Step changes .......................................................................... 7-267
A.8.6 Reallocation of expenditure between functional areas ............. 7-267
A.9 Estimate of final year expenditure............................................. 7-268
B Rate of change ................................................................................... 7-269
B.10 Position .................................................................................. 7-269
B.11 Energex proposal .................................................................. 7-270
B.12 Assessment Approach ......................................................... 7-272
B.13 Reasons for position ............................................................ 7-276
B.13.1 Overall rate of change ............................................................. 7-276
B.13.2 Price growth ............................................................................ 7-277
B.13.3 Output growth ......................................................................... 7-283
B.13.4 Productivity growth .................................................................. 7-286
C Step changes ..................................................................................... 7-291
C.14 Position .................................................................................. 7-291
C.15 Energex's proposal ............................................................... 7-292
C.16 Assessment approach .......................................................... 7-293
C.17 Reasons for position ............................................................ 7-295
C.17.1 Proposed step changes ........................................................... 7-296
C.17.2 Proposed base year adjustments ............................................ 7-298
C.17.3 Proposed non recurrent expenditure ....................................... 7-300
C.17.4 Demand management ............................................................. 7-301
C.17.5 Increased overheads allocated to opex ................................... 7-303
D Forecasting method assessment ..................................................... 7-305
D.18 Position .................................................................................. 7-305
7-6 Attachment 7 – Operating expenditure | Energex preliminary determination 2015–20
D.19 Energex's proposal ............................................................... 7-305
D.20 Assessment approach .......................................................... 7-305
D.21 Reasons for position ............................................................ 7-306
7-7 Attachment 7 – Operating expenditure | Energex preliminary determination 2015–20
Shortened forms Shortened form Extended form
AEMC Australian Energy Market Commission
AEMO Australian Energy Market Operator
AER Australian Energy Regulator
augex augmentation expenditure
capex capital expenditure
CCP Consumer Challenge Panel
CESS capital expenditure sharing scheme
CPI consumer price index
CPI-X consumer price index minus X
DRP debt risk premium
DMIA demand management innovation allowance
DMIS demand management incentive scheme
distributor distribution network service provider
DUoS distribution use of system
EBSS efficiency benefit sharing scheme
ERP equity risk premium
Expenditure Assessment Guideline Expenditure Forecast Assessment Guideline
for electricity distribution
F&A framework and approach
MRP market risk premium
NEL national electricity law
NEM national electricity market
NEO national electricity objective
NER national electricity rules
NSP network service provider
opex operating expenditure
7-8 Attachment 7 – Operating expenditure | Energex preliminary determination 2015–20
Shortened form Extended form
PPI partial performance indicators
PTRM post-tax revenue model
RAB regulatory asset base
RBA Reserve Bank of Australia
repex replacement expenditure
RFM roll forward model
RIN regulatory information notice
RPP revenue pricing principles
SAIDI system average interruption duration index
SAIFI system average interruption frequency index
SLCAPM Sharpe-Lintner capital asset pricing model
STPIS service target performance incentive scheme
WACC weighted average cost of capital
7-9 Attachment 7 – Operating expenditure | Energex preliminary determination 2015–20
7 Operating expenditure
Operating expenditure (opex) refers to the operating, maintenance and other non-
capital expenses, incurred in the provision of network services. Forecast opex for
standard control services is one of the building blocks we use to determine a service
provider's total revenue requirement.
This attachment provides an overview of our assessment of opex. Detailed analysis of
our assessment of opex is in the following appendices:
Appendix A—Base year opex
Appendix B—Rate of change
Appendix C—Step changes
Appendix D—forecasting method assessment.
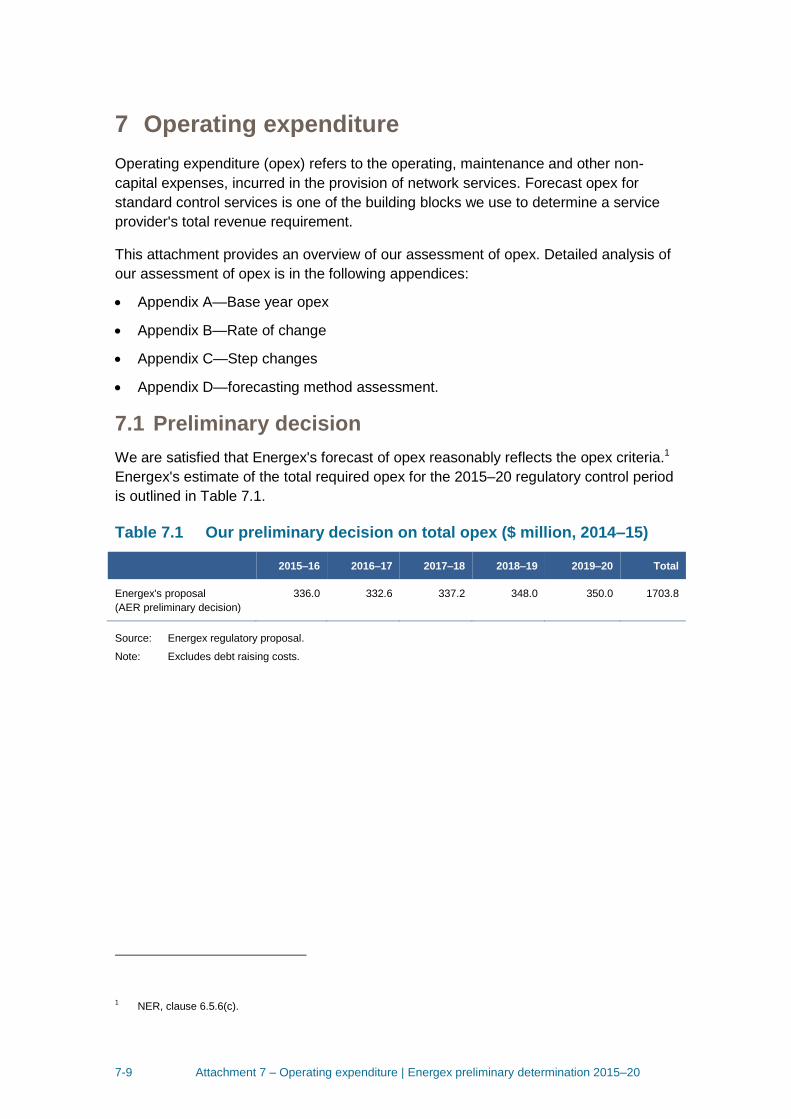
7.1 Preliminary decision
We are satisfied that Energex's forecast of opex reasonably reflects the opex criteria.1
Energex's estimate of the total required opex for the 2015–20 regulatory control period
is outlined in Table 7.1.
Table 7.1 Our preliminary decision on total opex ($ million, 2014–15)
2015–16 2016–17 2017–18 2018–19 2019–20 Total
Energex's proposal
(AER preliminary decision)
336.0 332.6 337.2 348.0 350.0 1703.8
Source: Energex regulatory proposal.
Note: Excludes debt raising costs.
1 NER, clause 6.5.6(c).
7-10 Attachment 7 – Operating expenditure | Energex preliminary determination 2015–20
7.2 Energex's proposal
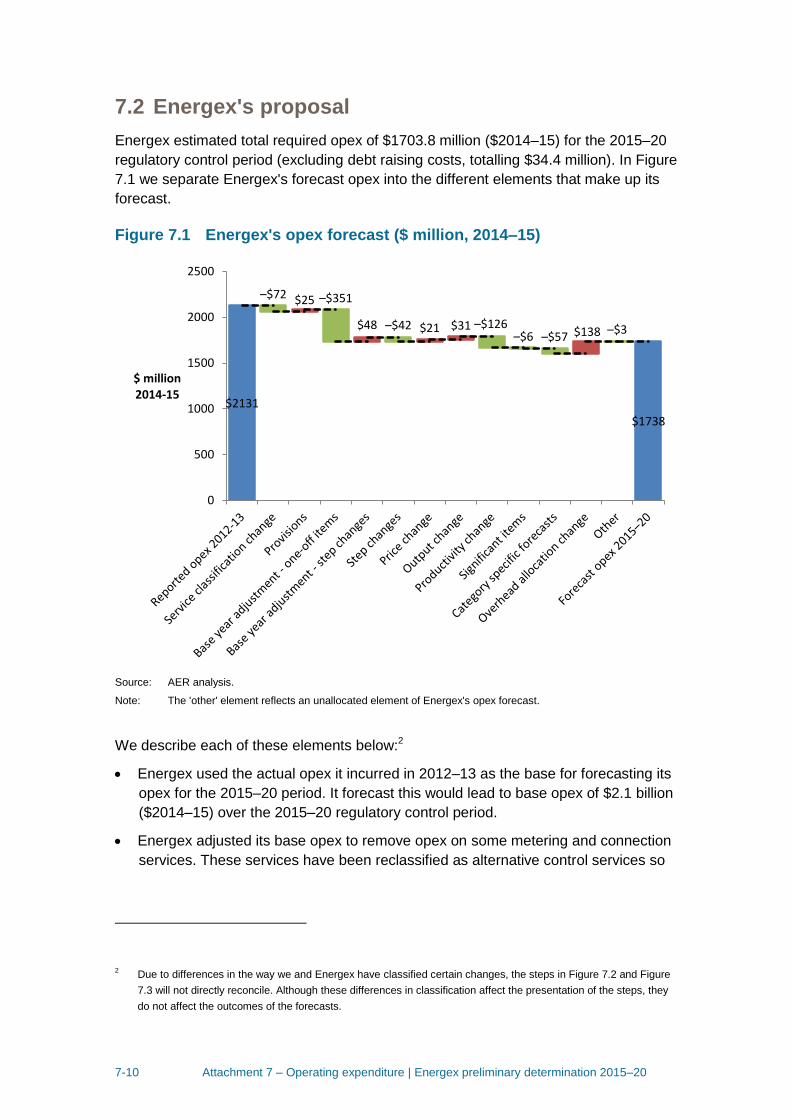
Energex estimated total required opex of $1703.8 million ($2014–15) for the 2015–20
regulatory control period (excluding debt raising costs, totalling $34.4 million). In Figure
7.1 we separate Energex's forecast opex into the different elements that make up its
forecast.
Figure 7.1 Energex's opex forecast ($ million, 2014–15)
Source: AER analysis.
Note: The 'other' element reflects an unallocated element of Energex's opex forecast.
We describe each of these elements below:2
Energex used the actual opex it incurred in 2012–13 as the base for forecasting its
opex for the 2015–20 period. It forecast this would lead to base opex of $2.1 billion
($2014–15) over the 2015–20 regulatory control period.
Energex adjusted its base opex to remove opex on some metering and connection
services. These services have been reclassified as alternative control services so
2 Due to differences in the way we and Energex have classified certain changes, the steps in Figure 7.2 and Figure
7.3 will not directly reconcile. Although these differences in classification affect the presentation of the steps, they
do not affect the outcomes of the forecasts.
$2131
$1738
$25
$48 $21 $31 $138
–$72 –$351
–$42 –$126–$6 –$57
–$3
0
500
1000
1500
2000
2500
$ million2014-15
7-11 Attachment 7 – Operating expenditure | Energex preliminary determination 2015–20
need to be removed from Energex's standard control services opex. This reduced
Energex's forecast by $72 million ($2014–15).
Energex adjusted its forecast for movements in provisions in its base year. This led
to a $25 million ($2014–15) increase in its forecast opex.
Energex identified non-recurrent costs in its base year. Removing these costs
reduced its forecast opex by $351 million ($2014–15).
Energex identified step changes that occurred between the base year and the
2015–20 period. These led to an increase of $48 million ($2014–15) in Energex's
forecast of total opex.
Energex identified step changes forecast to occur during the 2015–20 period.
These led to a decrease of $42 million ($2014–15) in Energex's forecast of total
opex.
Energex accounted for forecast growth in prices related to labour price increases,
materials price increases, and contractor price decreases. This forecast of price
growth increased Energex's opex forecast by $21 million ($2014–15).
Energex forecast output growth would increase its opex forecast by $31million
($2014–15).
Energex subtracted $126 million ($2014–15) from its total opex forecast for forecast
productivity growth.
Energex identified some significant items: non-recurrent changes in costs not
included in the base year. These items led to a decrease in Energex's opex
forecast of $6 million ($2014–15).
Energex forecast some cost categories using category specific methods. The
change in these costs over the period led to a decrease of $57 million ($2014–15)
in Energex's forecast of total opex.
Energex forecast that changes in the relative shares of capex and opex in totex
would lead to an increase in the amount of overheads allocated to opex. This was
forecast to increase Energex's opex by $138 million ($2014–15).
7-12 Attachment 7 – Operating expenditure | Energex preliminary determination 2015–20
7.3 Assessment approach
Our assessment approach, outlined below, is, for the most part, consistent with the
Guideline.3 We decide whether or not to accept the service provider's total forecast
opex. We accept the service provider's forecast if we are satisfied that it reasonably
reflects the opex criteria.4 If we are not satisfied, we replace it with a total forecast of
opex that we are satisfied does reasonably reflect the opex criteria.5
It is important to note that we make our assessment about the total forecast opex and
not about particular categories or projects in the opex forecast. The Australian Energy
Market Commission (AEMC) has expressed our role in these terms:6
It should be noted here that what the AER approves in this context is
expenditure allowances, not projects.
The service provider’s forecast is intended to cover the expenditure that will be needed
to achieve the operating expenditure objectives. These objectives are:7
1. meeting or managing the expected demand for standard control services over the
regulatory control period
2. complying with all applicable regulatory obligations or requirements associated with
providing standard control services
3. where there is no regulatory obligation or requirement, maintaining the quality,
reliability and security of supply of standard control services and maintaining the
reliability and security of the distribution system
4. maintaining the safety of the distribution system through the supply of standard
control services.
We assess the proposed total forecast opex against the opex criteria set out in the
NER. The opex criteria provide that the total forecast must reasonably reflect:8
1. the efficient costs of achieving the operating expenditure objectives
2. the costs that a prudent operator would require to achieve the operating
expenditure objectives
3. a realistic expectation of the demand forecast and cost inputs required to achieve
the operating expenditure objectives.
3 We did not apply the DEA benchmarking technique. We outline the reasons why we did not apply this technique in
section A.4 of our base opex appendix. 4 NER, clause 6.5.6(c).
5 NER, clause 6.5.6(d).
6 AEMC, Final Rule Determination: National Electricity Amendment (Economic Regulation of Network Service
Providers) Rule 2012, 29 November 2012, p. vii. 7 NER, clause 6.5.6(a).
8 NER, clause 6.5.6(c).
7-13 Attachment 7 – Operating expenditure | Energex preliminary determination 2015–20
The AEMC noted that '[t]hese criteria broadly reflect the NEO [National Electricity
Objective]'.9
In deciding whether or not we are satisfied the service provider's forecast reasonably
reflects the opex criteria we have regard to the opex factors.10 We attach different
weight to different factors when making our decision to best achieve the NEO. This
approach has been summarised by the AEMC as follows:11
As mandatory considerations, the AER has an obligation to take the capex and
opex factors into account, but this does not mean that every factor will be
relevant to every aspect of every regulatory determination the AER makes. The
AER may decide that certain factors are not relevant in certain cases once it
has considered them.
The opex factors we have regard to are:
the most recent annual benchmarking report that has been published under clause
6.27 and the benchmark operating expenditure that would be incurred by an
efficient distribution network service provider over the relevant regulatory control
period
the actual and expected operating expenditure of the distribution network service
provider during any preceding regulatory control periods
the extent to which the operating expenditure forecast includes expenditure to
address the concerns of electricity consumers as identified by the distribution
network service provider in the course of its engagement with electricity consumers
the relative prices of operating and capital inputs
the substitution possibilities between operating and capital expenditure
whether the operating expenditure forecast is consistent with any incentive scheme
or schemes that apply to the distribution network service provider under clauses
6.5.8 or 6.6.2 to 6.6.4
the extent the operating expenditure forecast is referable to arrangements with a
person other than the distribution network service provider that, in our opinion, do
not reflect arm’s length terms
whether the operating expenditure forecast includes an amount relating to a project
that should more appropriately be included as a contingent project under clause
6.6A.1(b)
the extent to which the distribution network service provider has considered and
made provision for efficient and prudent non-network alternatives
9 AEMC, Final Rule Determination: National Electricity Amendment (Economic Regulation of Network Service
Providers) Rule 2012, 29 November 2012, p. 113. 10
NER, clause 6.5.6(e). 11
AEMC, Final Rule Determination: National Electricity Amendment (Economic Regulation of Network Service
Providers) Rule 2012, 29 November 2012, p. 115.
7-14 Attachment 7 – Operating expenditure | Energex preliminary determination 2015–20
any relevant final project assessment conclusions report published under
5.17.4(o),(p) or (s)
any other factor we consider relevant and which we have notified the distribution
network service provider in writing, prior to the submission of its revised regulatory
proposal under clause 6.10.3, is an operating expenditure factor.
For this determination, there are two additional operating expenditure factors that we
will take into account under the last opex factor above:
our benchmarking data sets including, but not necessarily limited to:
(a) data contained in any economic benchmarking RIN, category analysis RIN,
reset RIN or annual reporting RIN
(b) any relevant data from international sources
(c) data sets that support econometric modelling and other assessment
techniques consistent with the approach set out in the Guideline
as updated from time to time.
economic benchmarking techniques for assessing benchmark efficient expenditure
including stochastic frontier analysis and regressions utilising functional forms such
as Cobb Douglas and Translog.12
For transparency and ease of reference, we have included a summary of how we have
had regard to each of the opex factors in our assessment at the end of this attachment.
More broadly, we also note in exercising our discretion, we take into account the
revenue and pricing principles which are set out in the National Electricity Law.13
This attachment sets out our general approach to assessment. Our approach to
assessment of particular aspects of the opex forecast is also set out in more detail in
the relevant appendices.
The Expenditure Forecast Assessment Guideline
After conducting an extensive consultation process with service providers, users,
consumers and other interested stakeholders we issued the Expenditure forecast
assessment guideline (the Guideline) in November 2013 together with an explanatory
statement.14 The Guideline sets out our intended approach to assessing operating
expenditure in accordance with the NER.15
12
This is consistent with the approach we outlined in the explanatory statement to our Expenditure Forecast
Assessment Guideline. See, for example, p. 131. 13
NEL, s. 16(2); s. 7A. 14
AER, Expenditure forecasting assessment guideline - explanatory statement, November 2013. 15
NER clause 6.5.6.
7-15 Attachment 7 – Operating expenditure | Energex preliminary determination 2015–20
We may depart from the approach set out in the Guideline but if we do so we give
reasons for doing so. In this determination for the most part we have not departed from
the approach set out in the Guideline. 16 In our Framework and Approach paper for
each service provider, we set out our intention to apply the Guideline approach in
making this determination.
Our approach is to compare the service provider's total forecast opex with an
alternative estimate that we develop ourselves.17 By doing this we form a view on
whether we are satisfied that the service provider's proposed total forecast opex
reasonably reflects the opex criteria. If we conclude the proposal does not reasonably
reflect the opex criteria, we use our estimate as a substitute forecast. This approach
was expressly endorsed by the AEMC in its decision on the major rule changes that
were introduced in November 2012. The AEMC stated:18
While the AER must form a view as to whether a NSP's proposal is reasonable,
this is not a separate exercise from determining an appropriate substitute in the
event the AER decides the proposal is not reasonable. For example,
benchmarking the NSP against others will provide an indication of both whether
the proposal is reasonable and what a substitute should be. Both the
consideration of "reasonable" and the determination of the substitute must be in
respect of the total for capex and opex.
Our estimate is unlikely to exactly match the service provider's forecast because the
service provider may not adopt the same forecasting method. However, if the service
provider's inputs and assumptions are reasonable, its method should produce a
forecast consistent with our estimate.
If a service provider's total forecast opex is materially different to our estimate and we
find no satisfactory explanation for this difference, we may form the view that the
service provider's forecast does not reasonably reflect the opex criteria. Conversely, if
our estimate demonstrates that the service provider's forecast reasonably reflects the
opex criteria, we will accept the forecast.19 Whether or not we accept a service
provider's forecast, we will provide the reasons for our decision.20
Building an alternative estimate of total forecast opex
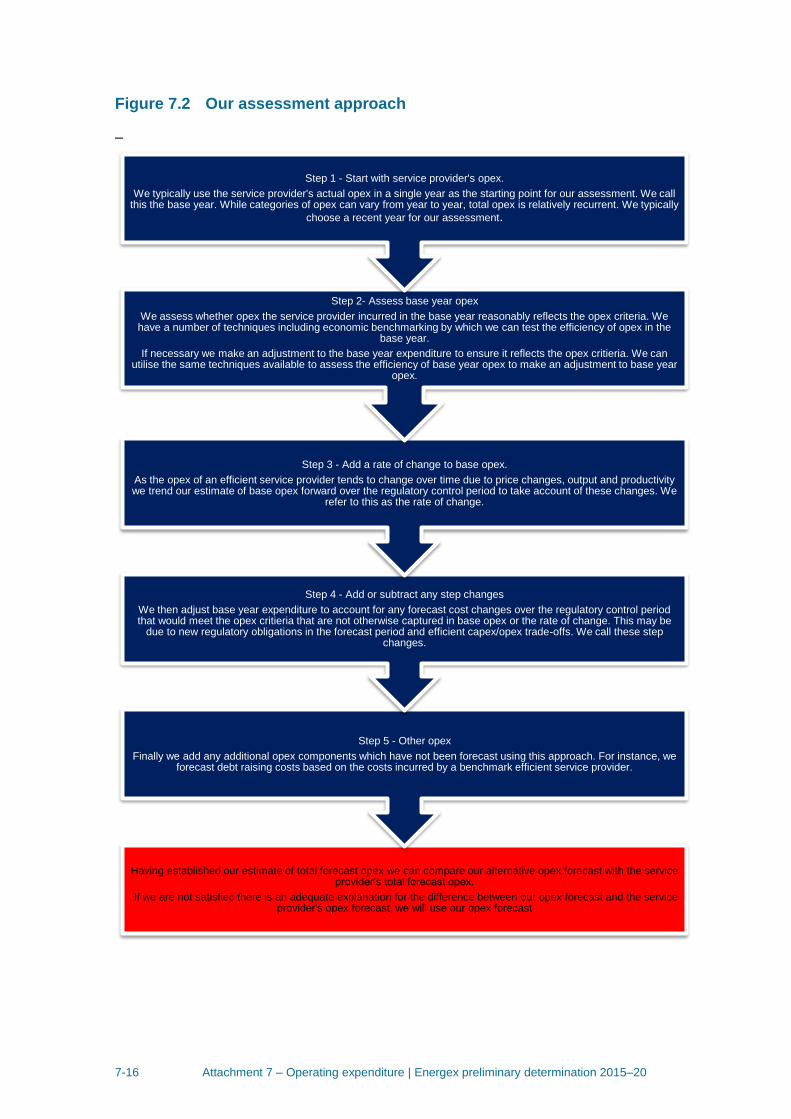
Our approach to forming an alternative estimate of opex involves five key steps which
we outline below in Figure 7.2.
16
We did not apply the DEA benchmarking technique. We outline the reasons why we did not apply this technique in
section A.4 of our base opex appendix. 17
AER, Expenditure forecast assessment guideline, November 2013, p. 7. 18
AEMC, Final Rule Determination: National Electricity Amendment (Economic Regulation of Network Service
Providers) Rule 2012, 29 November 2012, p. 112. 19
NER, clause 6.5.6(c). 20
NER, clause 6.12.1(3)(ii).
7-16 Attachment 7 – Operating expenditure | Energex preliminary determination 2015–20
Figure 7.2 Our assessment approach
–
Having established our estimate of total forecast opex we can compare our alternative opex forecast with the service provider’s total forecast opex.
If we are not satisfied there is an adequate explanation for the difference between our opex forecast and the service provider's opex forecast, we will use our opex forecast
Step 5 - Other opex
Finally we add any additional opex components which have not been forecast using this approach. For instance, we forecast debt raising costs based on the costs incurred by a benchmark efficient service provider.
Step 4 - Add or subtract any step changes
We then adjust base year expenditure to account for any forecast cost changes over the regulatory control period that would meet the opex critieria that are not otherwise captured in base opex or the rate of change. This may be
due to new regulatory obligations in the forecast period and efficient capex/opex trade-offs. We call these step changes.
Step 3 - Add a rate of change to base opex.
As the opex of an efficient service provider tends to change over time due to price changes, output and productivity we trend our estimate of base opex forward over the regulatory control period to take account of these changes. We
refer to this as the rate of change.
Step 2- Assess base year opex
We assess whether opex the service provider incurred in the base year reasonably reflects the opex criteria. We have a number of techniques including economic benchmarking by which we can test the efficiency of opex in the
base year.
If necessary we make an adjustment to the base year expenditure to ensure it reflects the opex critieria. We can utilise the same techniques available to assess the efficiency of base year opex to make an adjustment to base year
opex.
Step 1 - Start with service provider's opex.
We typically use the service provider's actual opex in a single year as the starting point for our assessment. We call this the base year. While categories of opex can vary from year to year, total opex is relatively recurrent. We typically
choose a recent year for our assessment.
7-17 Attachment 7 – Operating expenditure | Energex preliminary determination 2015–20
Underlying our approach are two general assumptions:
1. the efficiency criterion and the prudence criterion in the NER are complementary
2. actual expenditure was sufficient to achieve the expenditure objectives in the past.
We have used this general approach in our past decisions. It is a well-regarded top-
down forecasting model that has been employed by a number of Australian regulators
over the last fifteen years. We refer to it as a ‘revealed cost method’ in the Guideline
(and we have sometimes referred to it as the base-step-trend method in our past
regulatory decisions).
While these general steps are consistent with our past determinations, we have
adopted a significant change in how we give effect to this approach, following the
major changes to the NER made in November 2012. Those changes placed significant
new emphasis on the use of benchmarking in our opex analysis. We will now issue
benchmarking reports annually and have regard to those reports. These benchmarking
reports provide us with one of a number of inputs for determining forecast opex.
We have set out more detail about each of the steps we follow in constructing our
forecast below.
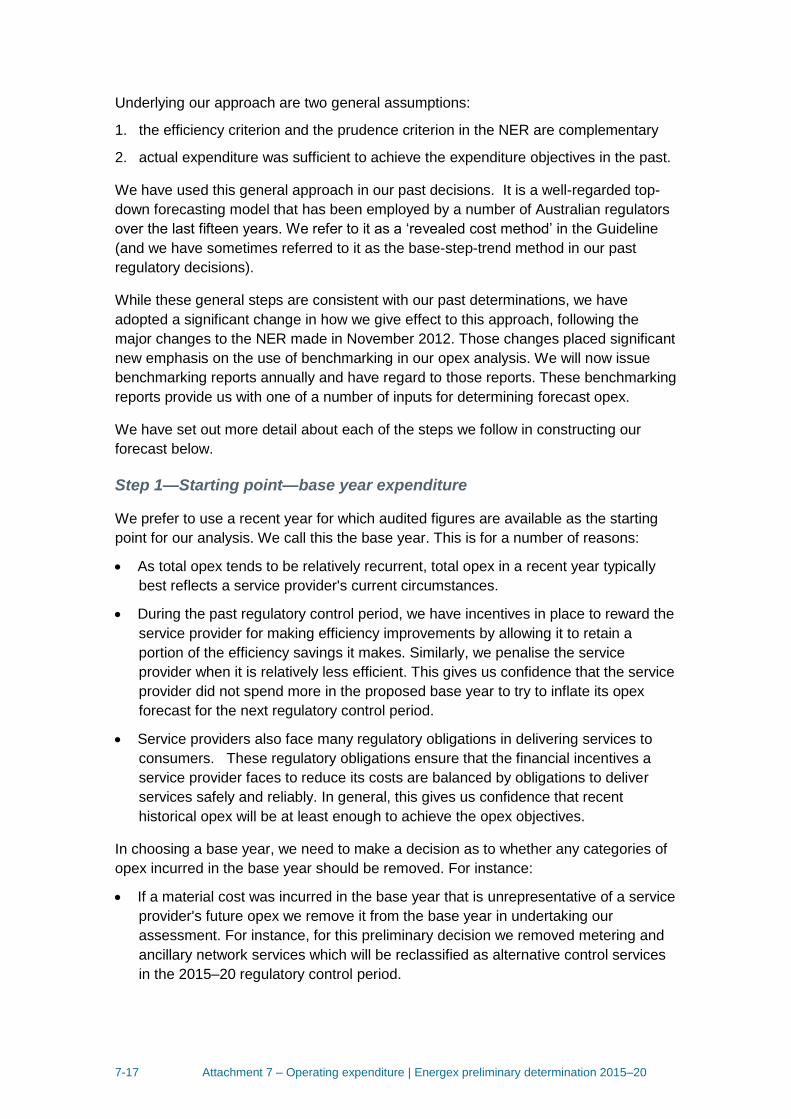
Step 1—Starting point—base year expenditure
We prefer to use a recent year for which audited figures are available as the starting
point for our analysis. We call this the base year. This is for a number of reasons:
As total opex tends to be relatively recurrent, total opex in a recent year typically
best reflects a service provider's current circumstances.
During the past regulatory control period, we have incentives in place to reward the
service provider for making efficiency improvements by allowing it to retain a
portion of the efficiency savings it makes. Similarly, we penalise the service
provider when it is relatively less efficient. This gives us confidence that the service
provider did not spend more in the proposed base year to try to inflate its opex
forecast for the next regulatory control period.
Service providers also face many regulatory obligations in delivering services to
consumers. These regulatory obligations ensure that the financial incentives a
service provider faces to reduce its costs are balanced by obligations to deliver
services safely and reliably. In general, this gives us confidence that recent
historical opex will be at least enough to achieve the opex objectives.
In choosing a base year, we need to make a decision as to whether any categories of
opex incurred in the base year should be removed. For instance:
If a material cost was incurred in the base year that is unrepresentative of a service
provider's future opex we remove it from the base year in undertaking our
assessment. For instance, for this preliminary decision we removed metering and
ancillary network services which will be reclassified as alternative control services
in the 2015–20 regulatory control period.
7-18 Attachment 7 – Operating expenditure | Energex preliminary determination 2015–20
Rather than use all opex in the base year, service providers also often forecast
specific categories of opex using different methods. We must also assess these
methods in deciding what the starting point should be. If we agree that these
categories of opex should be assessed differently, we will also remove them from
the base year.
As part of this step we also need to consider any interactions with the incentive
scheme for opex, the Efficiency Benefit Sharing Scheme (EBSS). The EBSS is
designed to achieve a fair sharing of efficiency gains and losses between a service
provider and its consumers. Under the EBSS, service providers receive a financial
reward for reducing their costs in the regulatory control period and a financial penalty
for increasing their costs. The benefits of these reductions in opex flow through to
consumers as long as base year opex is no higher than the opex incurred in that year.
Similarly, the costs of an increase in opex flow through to consumers if base year opex
is no lower than the opex incurred in that year. If the starting point is not consistent with
the EBSS, service providers could be excessively rewarded for efficiency gains or
excessively penalised for efficiency losses in the prior regulatory control period.
Step 2—Assessing base year expenditure
Regardless of the base year we choose, the service provider's actual expenditure may
not reflect the opex criteria. For example, it may not be efficient or management may
not have acted prudently in its governance and decision-making processes. We must
test whether actual expenditure in that year should be used to forecast efficient opex in
the next regulatory control period.
As we set out in the Guideline, to assess the efficiency of a service provider's actual
expenditure, we use a number of different techniques.21
For instance, we may undertake a detailed review of a service provider's actual opex.
For this preliminary decision, we have reviewed Energex’s IT and labour practices.
Benchmarking is particularly important in comparing the relative efficiency of different
service providers. The AEMC highlighted the importance of benchmarking in its
changes to the NER in November 2012:22
The Commission views benchmarking as an important exercise in assessing
the efficiency of a NSP and informing the determination of the appropriate
capex or opex allowance.
By benchmarking a service provider's expenditure we can compare its productivity
over time, and to other service providers. For this decision we have used Multilateral
21
AER, Expenditure forecast assessment guideline, November 2013, p. 22. 22
AEMC, Final Rule Determination: National Electricity Amendment (Economic Regulation of Network Service
Providers) Rule 2012, 29 November 2012, p. 97.
7-19 Attachment 7 – Operating expenditure | Energex preliminary determination 2015–20
Total Factor Productivity, Partial Factor Productivity and several opex cost function
models to assess Energex’s efficiency.23
We also have regard to trends in total opex and category specific data to construct
category benchmarks. We have also used this information to inform our assessment of
the efficiency of base year expenditure. In particular, we can use this category
analysis data to identify sources of spending that are unlikely to reflect the opex criteria
over the forecast period. It may also lend support to, or identify potential
inconsistencies with, our broader benchmark modelling.
If we determine that a service provider's base year expenditure does not reasonably
reflect the opex criteria, we will not use it as our starting point for our estimate of total
forecast opex. Rather, we will adjust it so it reflects an efficient, recurrent level of opex
that does reflect the opex criteria. To arrive at an adjustment, we use the same
techniques we used to assess the service provider's efficiency.
Step 3—Rate of change
Once we have chosen a starting point that reflects the opex criteria, we apply an
annual escalator to take account of the likely ongoing changes to opex over the
forecast regulatory control period. Opex that reflects the opex criteria in the forecast
regulatory control period could reasonably differ from the starting point due to changes
in:
price growth
output growth
productivity growth.
We estimate the change by adding expected changes in prices (such as the price of
labour and materials) and outputs (such as changes in customer numbers and demand
for electricity). We then incorporate reasonable estimates of changes in productivity.
Step 4—Step changes
Next we consider if any other opex is required to achieve the opex objectives in the
forecast period. We refer to these as ‘step changes’. Step changes may be for cost
drivers such as new, changed or removed regulatory obligations, or efficient
capex/opex trade-offs. As the Guideline explains, we will typically include a step
change only if efficient base year opex and the rate of change in opex of an efficient
service provider do not already include the proposed costs.24
23
The benchmarking models are discussed in detail in Appendix A, which details our assessment of base opex. 24
AER, Expenditure forecast assessment guideline, November 2013, p. 24.
7-20 Attachment 7 – Operating expenditure | Energex preliminary determination 2015–20
Step 5—Other costs that are not included in the base year
In our final step, we make any further adjustments we need for our opex forecast to
achieve the opex objectives. For instance, our approach is to forecast debt raising
costs based on a benchmarking approach rather than a service provider’s actual costs.
This is to be consistent with the forecast of the cost of debt in the rate of return building
block.
After applying these five steps, we arrive at our total opex forecast.
Comparing the service provider's proposal with our estimate
Having established our estimate of total forecast opex we can test the service
provider's proposed total forecast opex. This includes comparing our alternative total
with the service provider’s total forecast opex. However, we also assess whether the
service provider's forecasting method, assumptions, inputs and models are
reasonable, and assess the service provider's explanation of how that method results
in a prudent and efficient forecast.
The service provider may be able to adequately explain any differences between its
forecast and our estimate. We can only determine this on a case by case basis using
our judgment.
This approach is supported by the AEMC’s decision when implementing the changes
to the NER in November 2012. The Commission stated:25
the AER could be expected to approach the assessment of a NSP's
expenditure (capex or opex) forecast by determining its own forecast of
expenditure based on the material before it. Presumably this will never match
exactly the amount proposed by the NSP. However there will be a certain
margin of difference between the AER's forecast and that of the NSP within
which the AER could say that the NSP's forecast is reasonable. What the
margin is in a particular case, and therefore what the AER will accept as
reasonable, is a matter for the AER exercising its regulatory judgment.
If we are not satisfied there is an adequate explanation for the difference between our
opex forecast and the service provider's opex forecast, we will use our opex forecast in
determining a service provider's total revenue requirement.
25
AEMC, Final Rule Determination: National Electricity Amendment (Economic Regulation of Network Service
Providers) Rule 2012, 29 November 2012, p. 112.
7-21 Attachment 7 – Operating expenditure | Energex preliminary determination 2015–20
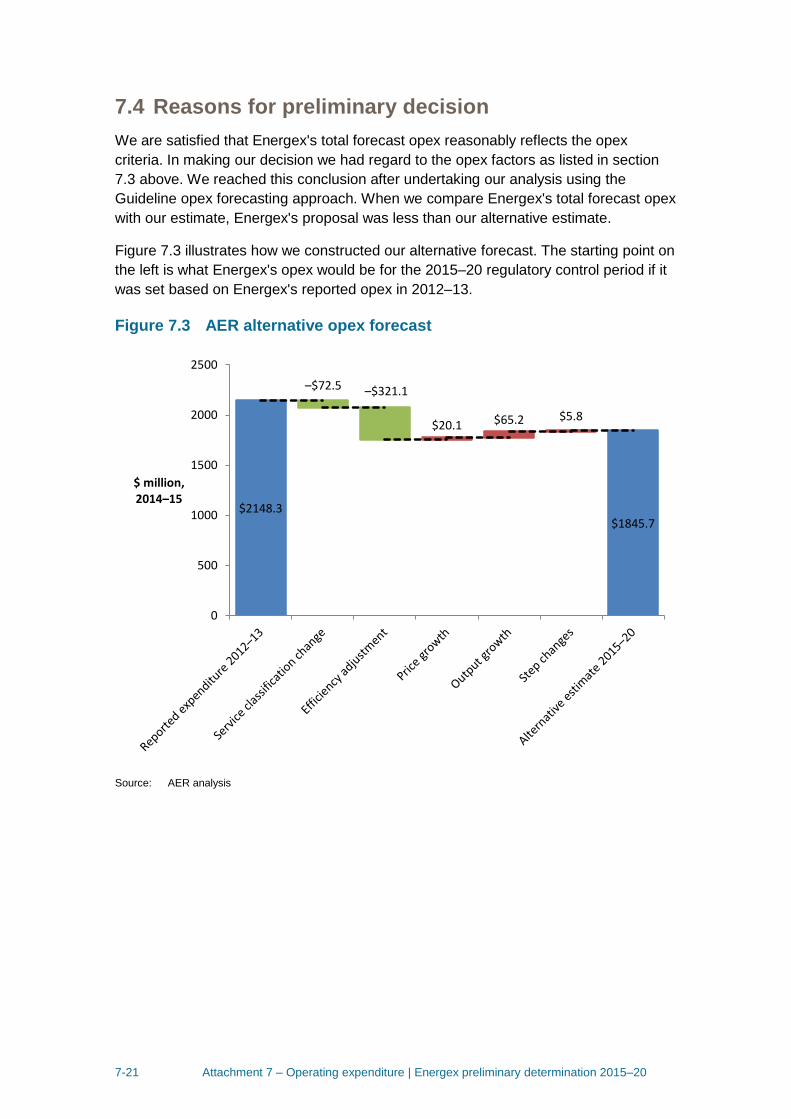
7.4 Reasons for preliminary decision
We are satisfied that Energex's total forecast opex reasonably reflects the opex
criteria. In making our decision we had regard to the opex factors as listed in section
7.3 above. We reached this conclusion after undertaking our analysis using the
Guideline opex forecasting approach. When we compare Energex's total forecast opex
with our estimate, Energex's proposal was less than our alternative estimate.
Figure 7.3 illustrates how we constructed our alternative forecast. The starting point on
the left is what Energex's opex would be for the 2015–20 regulatory control period if it
was set based on Energex's reported opex in 2012–13.
Figure 7.3 AER alternative opex forecast
Source: AER analysis
$2148.3$1845.7
$20.1 $65.2 $5.8
–$72.5 –$321.1
0
500
1000
1500
2000
2500
$ million, 2014–15
7-22 Attachment 7 – Operating expenditure | Energex preliminary determination 2015–20
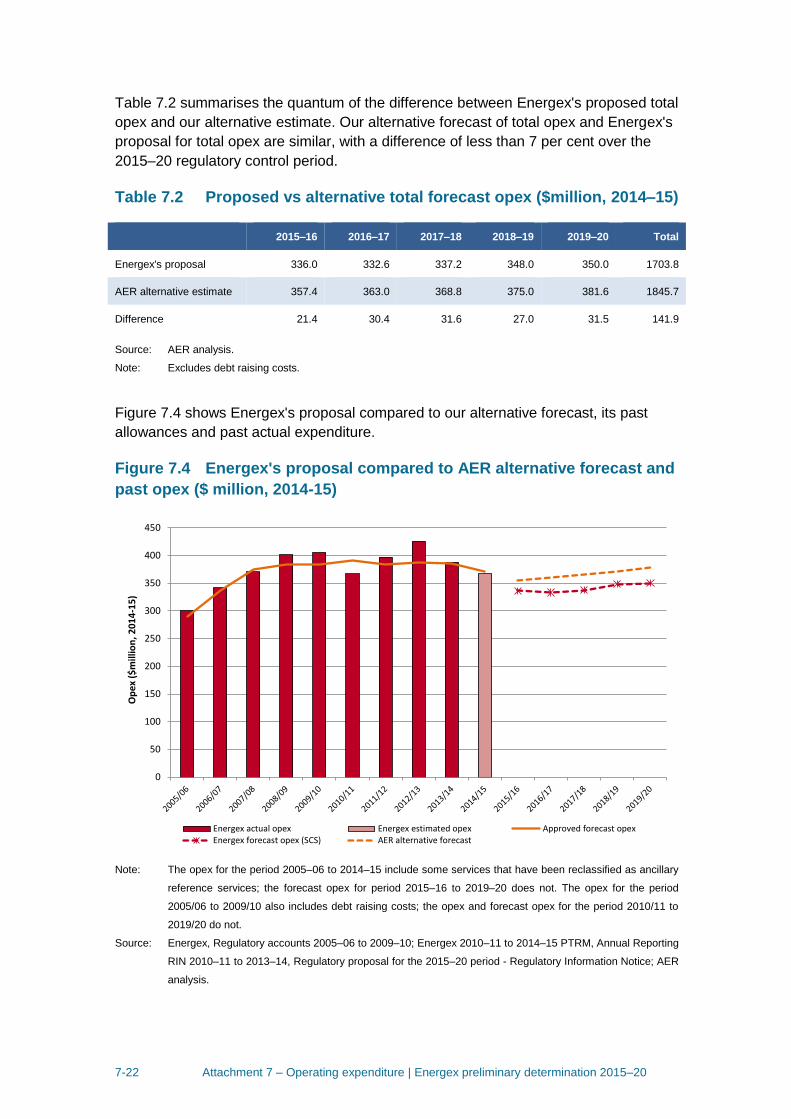
Table 7.2 summarises the quantum of the difference between Energex's proposed total
opex and our alternative estimate. Our alternative forecast of total opex and Energex's
proposal for total opex are similar, with a difference of less than 7 per cent over the
2015–20 regulatory control period.
Table 7.2 Proposed vs alternative total forecast opex ($million, 2014–15)
Source: AER analysis.
Note: Excludes debt raising costs.
Figure 7.4 shows Energex's proposal compared to our alternative forecast, its past
allowances and past actual expenditure.
Figure 7.4 Energex's proposal compared to AER alternative forecast and
past opex ($ million, 2014-15)
Note: The opex for the period 2005–06 to 2014–15 include some services that have been reclassified as ancillary
reference services; the forecast opex for period 2015–16 to 2019–20 does not. The opex for the period
2005/06 to 2009/10 also includes debt raising costs; the opex and forecast opex for the period 2010/11 to
2019/20 do not.
Source: Energex, Regulatory accounts 2005–06 to 2009–10; Energex 2010–11 to 2014–15 PTRM, Annual Reporting
RIN 2010–11 to 2013–14, Regulatory proposal for the 2015–20 period - Regulatory Information Notice; AER
analysis.
0
50
100
150
200
250
300
350
400
450
Op
ex
($m
illio
n,
20
14
-15
)
Energex actual opex Energex estimated opex Approved forecast opexEnergex forecast opex (SCS) AER alternative forecast
2015–16 2016–17 2017–18 2018–19 2019–20 Total
Energex's proposal 336.0 332.6 337.2 348.0 350.0 1703.8
AER alternative estimate 357.4 363.0 368.8 375.0 381.6 1845.7
Difference 21.4 30.4 31.6 27.0 31.5 141.9
7-23 Attachment 7 – Operating expenditure | Energex preliminary determination 2015–20
While we are satisfied that Energex's total forecast opex reasonably reflects the opex
criteria, we have taken a different view to Energex on component elements of the total
opex forecast based on our analysis.
The key elements of our alternative forecast and the areas where elements of our
forecast differs to Energex is discussed below.26
7.4.1 Forecasting method
As noted above, our estimate of total opex is unlikely to exactly match Energex's.
Broadly, differences between the two forecasts can be explained by differences in the
forecasting methods adopted and the inputs and assumptions used to apply the
method. We have reviewed Energex's forecast method to identify if and where
Energex's forecasting method departed from the method set out in the Guideline (the
guideline forecasting method). Where Energex's forecasting method did depart from
the guideline forecasting method we considered whether this departure explained the
difference between Energex's forecast of total opex and our own. We also considered
whether adopting Energex's approach was required to produce an opex forecast that
reasonably reflects the opex criteria, having regard to the opex factors.
In appendix D we set out our consideration of Energex’s forecasting methodology in
determining our alternative estimate opex for the 2015–20 regulatory control period.
Having considered the differences between the guideline forecasting method and
Energex's method, we are satisfied that the guideline forecasting method produces an
opex forecast that reasonably reflects the opex criteria. We have not used category
specific forecasting methods to separately forecast any of Energex's opex categories
other than debt raising costs in our substitute total opex forecast. We formed our
alternative estimate of total opex using the guideline forecasting method with all opex
categories other than debt raising costs included in base opex.
Energex, however, did forecast some categories of opex using category specific
methods. The change in these costs over the period reduced Energex's forecast of
total opex by $57 million ($2014–15).
7.4.2 Base opex
We first assessed Energex's proposed base year of 2012–13. We tested Energex's
base opex in 2012–13 using overall benchmarking techniques. We then examined the
drivers of the results of these benchmarking techniques by examining key components
of opex.
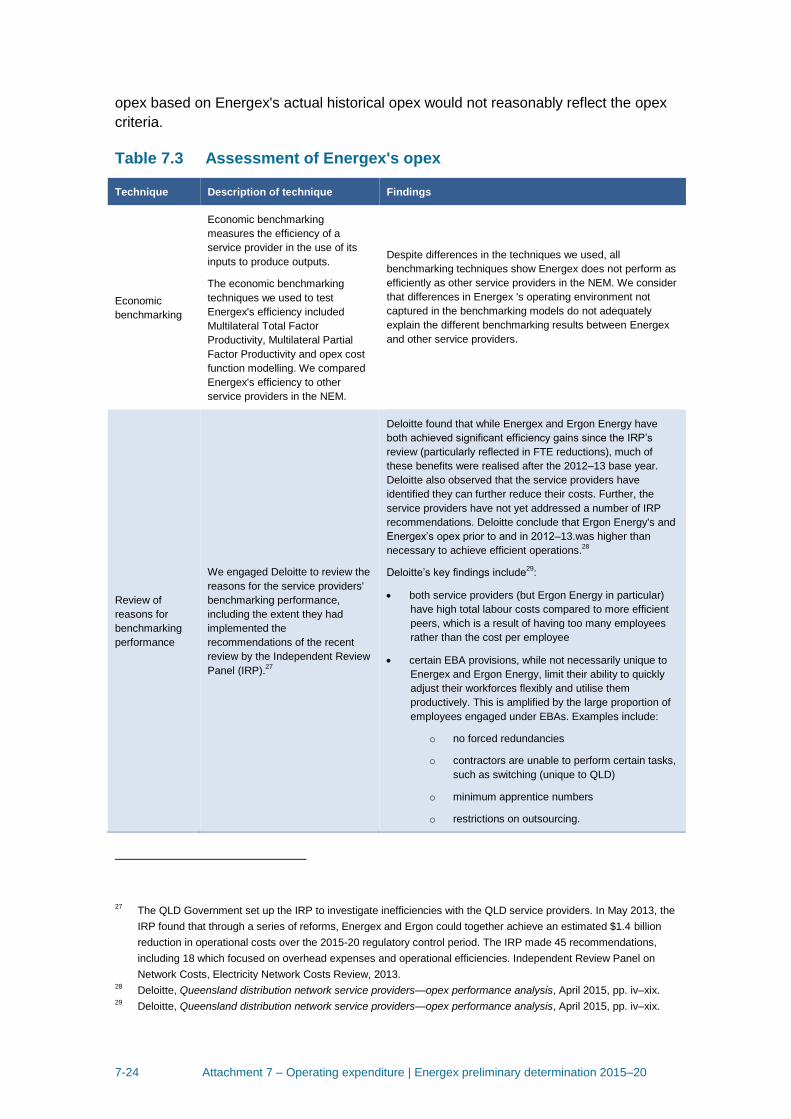
The main techniques we used to test the efficiency of Energex's base opex are
outlined in Table 7.3. Our findings from our detailed review support our overall
benchmarking findings, which suggest that Energex's actual base opex is materially
inefficient. Therefore, without an efficiency adjustment, we consider a forecast base
26
For each of these parts of opex, our analysis is supported by an appendix.
7-24 Attachment 7 – Operating expenditure | Energex preliminary determination 2015–20
opex based on Energex's actual historical opex would not reasonably reflect the opex
criteria.
Table 7.3 Assessment of Energex's opex
Technique Description of technique Findings
Economic
benchmarking
Economic benchmarking
measures the efficiency of a
service provider in the use of its
inputs to produce outputs.
The economic benchmarking
techniques we used to test
Energex's efficiency included
Multilateral Total Factor
Productivity, Multilateral Partial
Factor Productivity and opex cost
function modelling. We compared
Energex's efficiency to other
service providers in the NEM.
Despite differences in the techniques we used, all
benchmarking techniques show Energex does not perform as
efficiently as other service providers in the NEM. We consider
that differences in Energex 's operating environment not
captured in the benchmarking models do not adequately
explain the different benchmarking results between Energex
and other service providers.
Review of
reasons for
benchmarking
performance
We engaged Deloitte to review the
reasons for the service providers'
benchmarking performance,
including the extent they had
implemented the
recommendations of the recent
review by the Independent Review
Panel (IRP).27
Deloitte found that while Energex and Ergon Energy have
both achieved significant efficiency gains since the IRP’s
review (particularly reflected in FTE reductions), much of
these benefits were realised after the 2012–13 base year.
Deloitte also observed that the service providers have
identified they can further reduce their costs. Further, the
service providers have not yet addressed a number of IRP
recommendations. Deloitte conclude that Ergon Energy's and
Energex’s opex prior to and in 2012–13.was higher than
necessary to achieve efficient operations.28
Deloitte’s key findings include29
:
both service providers (but Ergon Energy in particular)
have high total labour costs compared to more efficient
peers, which is a result of having too many employees
rather than the cost per employee
certain EBA provisions, while not necessarily unique to
Energex and Ergon Energy, limit their ability to quickly
adjust their workforces flexibly and utilise them
productively. This is amplified by the large proportion of
employees engaged under EBAs. Examples include:
o no forced redundancies
o contractors are unable to perform certain tasks,
such as switching (unique to QLD)
o minimum apprentice numbers
o restrictions on outsourcing.
27
The QLD Government set up the IRP to investigate inefficiencies with the QLD service providers. In May 2013, the
IRP found that through a series of reforms, Energex and Ergon could together achieve an estimated $1.4 billion
reduction in operational costs over the 2015-20 regulatory control period. The IRP made 45 recommendations,
including 18 which focused on overhead expenses and operational efficiencies. Independent Review Panel on
Network Costs, Electricity Network Costs Review, 2013. 28
Deloitte, Queensland distribution network service providers—opex performance analysis, April 2015, pp. iv–xix. 29
Deloitte, Queensland distribution network service providers—opex performance analysis, April 2015, pp. iv–xix.
7-25 Attachment 7 – Operating expenditure | Energex preliminary determination 2015–20
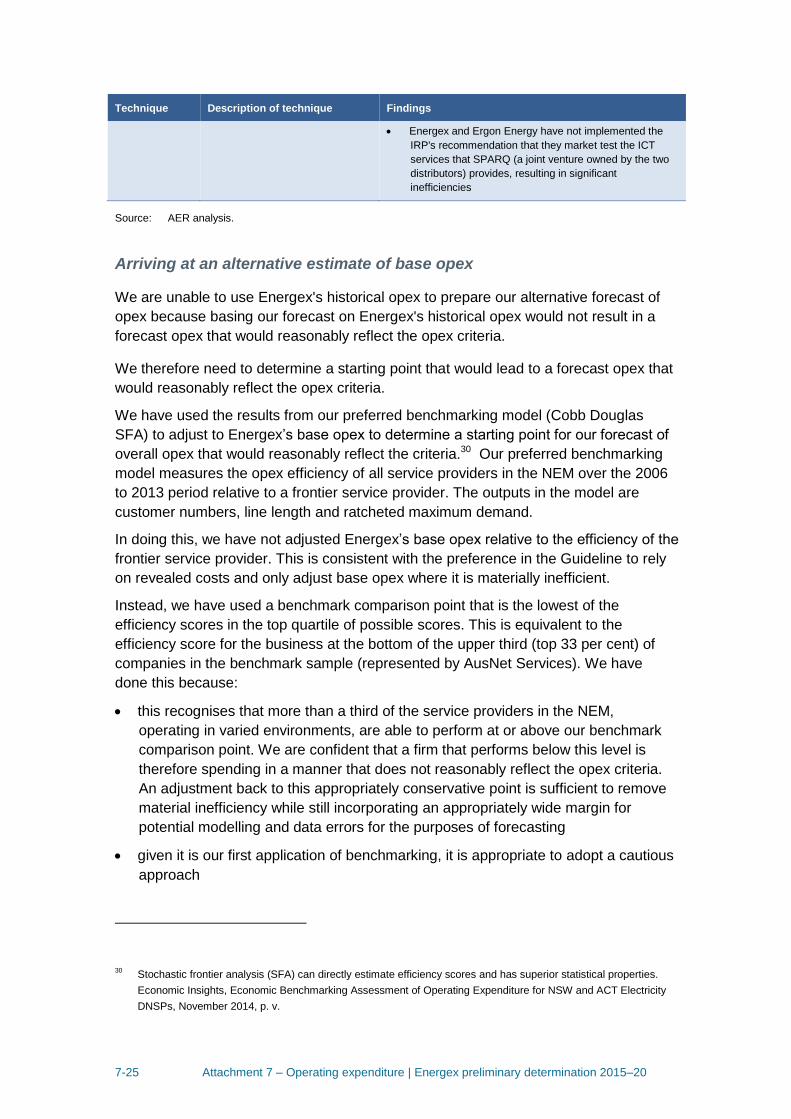
Technique Description of technique Findings
Energex and Ergon Energy have not implemented the
IRP's recommendation that they market test the ICT
services that SPARQ (a joint venture owned by the two
distributors) provides, resulting in significant
inefficiencies
Source: AER analysis.
Arriving at an alternative estimate of base opex
We are unable to use Energex's historical opex to prepare our alternative forecast of
opex because basing our forecast on Energex's historical opex would not result in a
forecast opex that would reasonably reflect the opex criteria.
We therefore need to determine a starting point that would lead to a forecast opex that
would reasonably reflect the opex criteria.
We have used the results from our preferred benchmarking model (Cobb Douglas
SFA) to adjust to Energex’s base opex to determine a starting point for our forecast of
overall opex that would reasonably reflect the criteria.30 Our preferred benchmarking
model measures the opex efficiency of all service providers in the NEM over the 2006
to 2013 period relative to a frontier service provider. The outputs in the model are
customer numbers, line length and ratcheted maximum demand.
In doing this, we have not adjusted Energex’s base opex relative to the efficiency of the
frontier service provider. This is consistent with the preference in the Guideline to rely
on revealed costs and only adjust base opex where it is materially inefficient.
Instead, we have used a benchmark comparison point that is the lowest of the
efficiency scores in the top quartile of possible scores. This is equivalent to the
efficiency score for the business at the bottom of the upper third (top 33 per cent) of
companies in the benchmark sample (represented by AusNet Services). We have
done this because:
this recognises that more than a third of the service providers in the NEM,
operating in varied environments, are able to perform at or above our benchmark
comparison point. We are confident that a firm that performs below this level is
therefore spending in a manner that does not reasonably reflect the opex criteria.
An adjustment back to this appropriately conservative point is sufficient to remove
material inefficiency while still incorporating an appropriately wide margin for
potential modelling and data errors for the purposes of forecasting
given it is our first application of benchmarking, it is appropriate to adopt a cautious
approach
30
Stochastic frontier analysis (SFA) can directly estimate efficiency scores and has superior statistical properties.
Economic Insights, Economic Benchmarking Assessment of Operating Expenditure for NSW and ACT Electricity
DNSPs, November 2014, p. v.
7-26 Attachment 7 – Operating expenditure | Energex preliminary determination 2015–20
we consider this approach achieves the NEO and RPP because it is sufficiently
conservative to avoid the risks associated with undercompensating the service
provider but also promotes efficiency incentives.
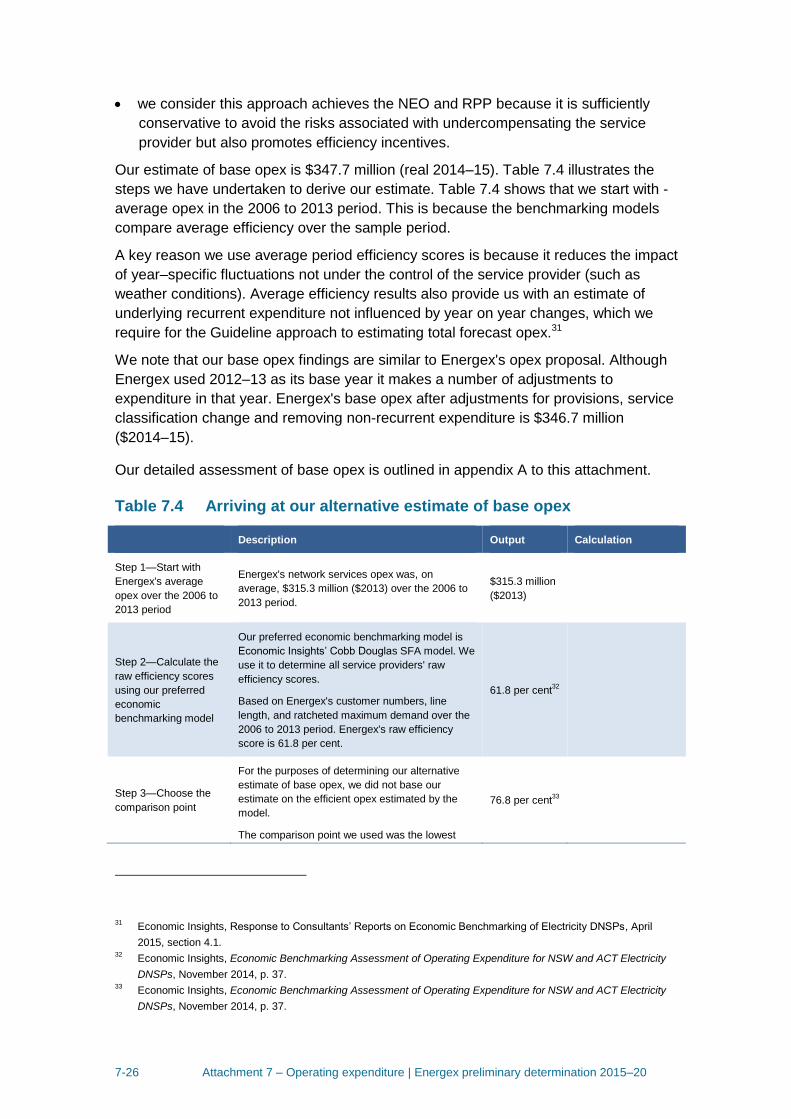
Our estimate of base opex is $347.7 million (real 2014–15). Table 7.4 illustrates the
steps we have undertaken to derive our estimate. Table 7.4 shows that we start with -
average opex in the 2006 to 2013 period. This is because the benchmarking models
compare average efficiency over the sample period.
A key reason we use average period efficiency scores is because it reduces the impact
of year–specific fluctuations not under the control of the service provider (such as
weather conditions). Average efficiency results also provide us with an estimate of
underlying recurrent expenditure not influenced by year on year changes, which we
require for the Guideline approach to estimating total forecast opex.31
We note that our base opex findings are similar to Energex's opex proposal. Although
Energex used 2012–13 as its base year it makes a number of adjustments to
expenditure in that year. Energex's base opex after adjustments for provisions, service
classification change and removing non-recurrent expenditure is $346.7 million
($2014–15).
Our detailed assessment of base opex is outlined in appendix A to this attachment.
Table 7.4 Arriving at our alternative estimate of base opex
Description Output Calculation
Step 1—Start with
Energex's average
opex over the 2006 to
2013 period
Energex's network services opex was, on
average, $315.3 million ($2013) over the 2006 to
2013 period.
$315.3 million
($2013)
Step 2—Calculate the
raw efficiency scores
using our preferred
economic
benchmarking model
Our preferred economic benchmarking model is
Economic Insights’ Cobb Douglas SFA model. We
use it to determine all service providers' raw
efficiency scores.
Based on Energex's customer numbers, line
length, and ratcheted maximum demand over the
2006 to 2013 period. Energex's raw efficiency
score is 61.8 per cent.
61.8 per cent32
Step 3—Choose the
comparison point
For the purposes of determining our alternative
estimate of base opex, we did not base our
estimate on the efficient opex estimated by the
model.
The comparison point we used was the lowest
76.8 per cent33
31
Economic Insights, Response to Consultants’ Reports on Economic Benchmarking of Electricity DNSPs, April
2015, section 4.1. 32
Economic Insights, Economic Benchmarking Assessment of Operating Expenditure for NSW and ACT Electricity
DNSPs, November 2014, p. 37. 33
Economic Insights, Economic Benchmarking Assessment of Operating Expenditure for NSW and ACT Electricity
DNSPs, November 2014, p. 37.
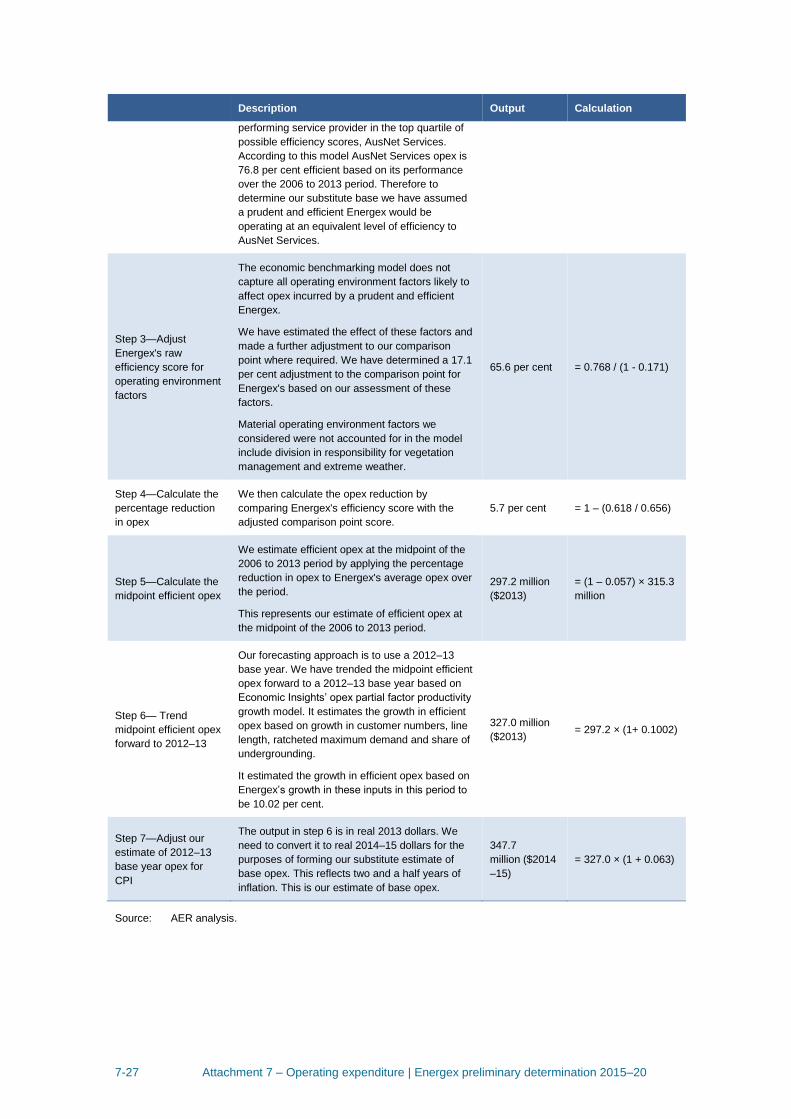
7-27 Attachment 7 – Operating expenditure | Energex preliminary determination 2015–20
Description Output Calculation
performing service provider in the top quartile of
possible efficiency scores, AusNet Services.
According to this model AusNet Services opex is
76.8 per cent efficient based on its performance
over the 2006 to 2013 period. Therefore to
determine our substitute base we have assumed
a prudent and efficient Energex would be
operating at an equivalent level of efficiency to
AusNet Services.
Step 3—Adjust
Energex's raw
efficiency score for
operating environment
factors
The economic benchmarking model does not
capture all operating environment factors likely to
affect opex incurred by a prudent and efficient
Energex.
We have estimated the effect of these factors and
made a further adjustment to our comparison
point where required. We have determined a 17.1
per cent adjustment to the comparison point for
Energex's based on our assessment of these
factors.
Material operating environment factors we
considered were not accounted for in the model
include division in responsibility for vegetation
management and extreme weather.
65.6 per cent = 0.768 / (1 - 0.171)
Step 4—Calculate the
percentage reduction
in opex
We then calculate the opex reduction by
comparing Energex's efficiency score with the
adjusted comparison point score.
5.7 per cent = 1 – (0.618 / 0.656)
Step 5—Calculate the
midpoint efficient opex
We estimate efficient opex at the midpoint of the
2006 to 2013 period by applying the percentage
reduction in opex to Energex's average opex over
the period.
This represents our estimate of efficient opex at
the midpoint of the 2006 to 2013 period.
297.2 million
($2013)
= (1 – 0.057) × 315.3
million
Step 6— Trend
midpoint efficient opex
forward to 2012–13
Our forecasting approach is to use a 2012–13
base year. We have trended the midpoint efficient
opex forward to a 2012–13 base year based on
Economic Insights’ opex partial factor productivity
growth model. It estimates the growth in efficient
opex based on growth in customer numbers, line
length, ratcheted maximum demand and share of
undergrounding.
It estimated the growth in efficient opex based on
Energex’s growth in these inputs in this period to
be 10.02 per cent.
327.0 million
($2013) = 297.2 × (1+ 0.1002)
Step 7—Adjust our
estimate of 2012–13
base year opex for
CPI
The output in step 6 is in real 2013 dollars. We
need to convert it to real 2014–15 dollars for the
purposes of forming our substitute estimate of
base opex. This reflects two and a half years of
inflation. This is our estimate of base opex.
347.7
million ($2014
–15)
= 327.0 × (1 + 0.063)
Source: AER analysis.
7-28 Attachment 7 – Operating expenditure | Energex preliminary determination 2015–20
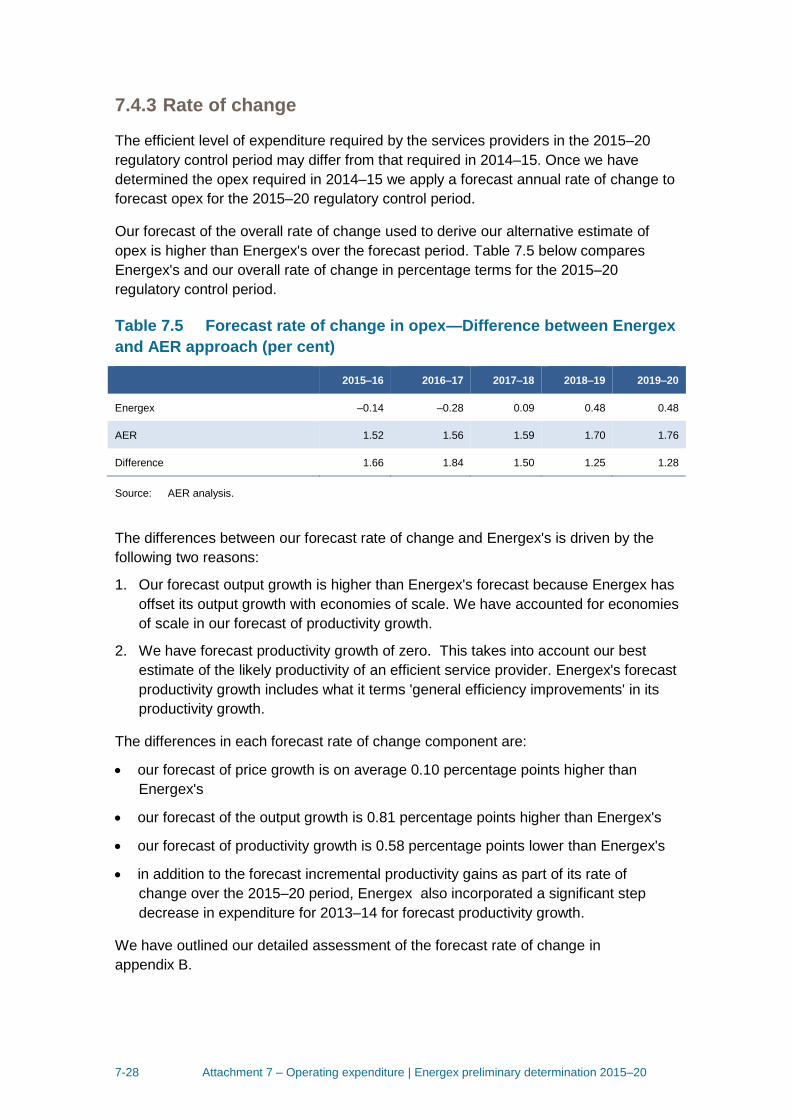
7.4.3 Rate of change
The efficient level of expenditure required by the services providers in the 2015–20
regulatory control period may differ from that required in 2014–15. Once we have
determined the opex required in 2014–15 we apply a forecast annual rate of change to
forecast opex for the 2015–20 regulatory control period.
Our forecast of the overall rate of change used to derive our alternative estimate of
opex is higher than Energex's over the forecast period. Table 7.5 below compares
Energex's and our overall rate of change in percentage terms for the 2015–20
regulatory control period.
Table 7.5 Forecast rate of change in opex—Difference between Energex
and AER approach (per cent)
2015–16 2016–17 2017–18 2018–19 2019–20
Energex –0.14 –0.28 0.09 0.48 0.48
AER 1.52 1.56 1.59 1.70 1.76
Difference 1.66 1.84 1.50 1.25 1.28
Source: AER analysis.
The differences between our forecast rate of change and Energex's is driven by the
following two reasons:
1. Our forecast output growth is higher than Energex's forecast because Energex has
offset its output growth with economies of scale. We have accounted for economies
of scale in our forecast of productivity growth.
2. We have forecast productivity growth of zero. This takes into account our best
estimate of the likely productivity of an efficient service provider. Energex's forecast
productivity growth includes what it terms 'general efficiency improvements' in its
productivity growth.
The differences in each forecast rate of change component are:
our forecast of price growth is on average 0.10 percentage points higher than
Energex's
our forecast of the output growth is 0.81 percentage points higher than Energex's
our forecast of productivity growth is 0.58 percentage points lower than Energex's
in addition to the forecast incremental productivity gains as part of its rate of
change over the 2015–20 period, Energex also incorporated a significant step
decrease in expenditure for 2013–14 for forecast productivity growth.
We have outlined our detailed assessment of the forecast rate of change in
appendix B.
7-29 Attachment 7 – Operating expenditure | Energex preliminary determination 2015–20
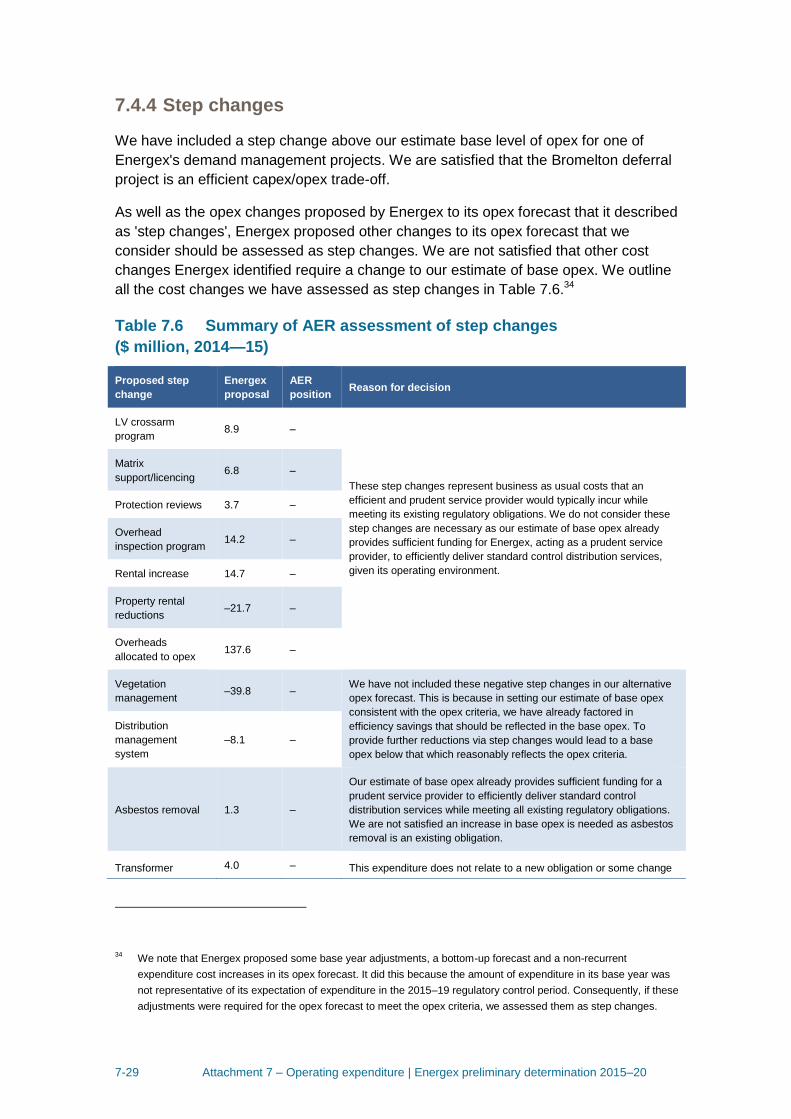
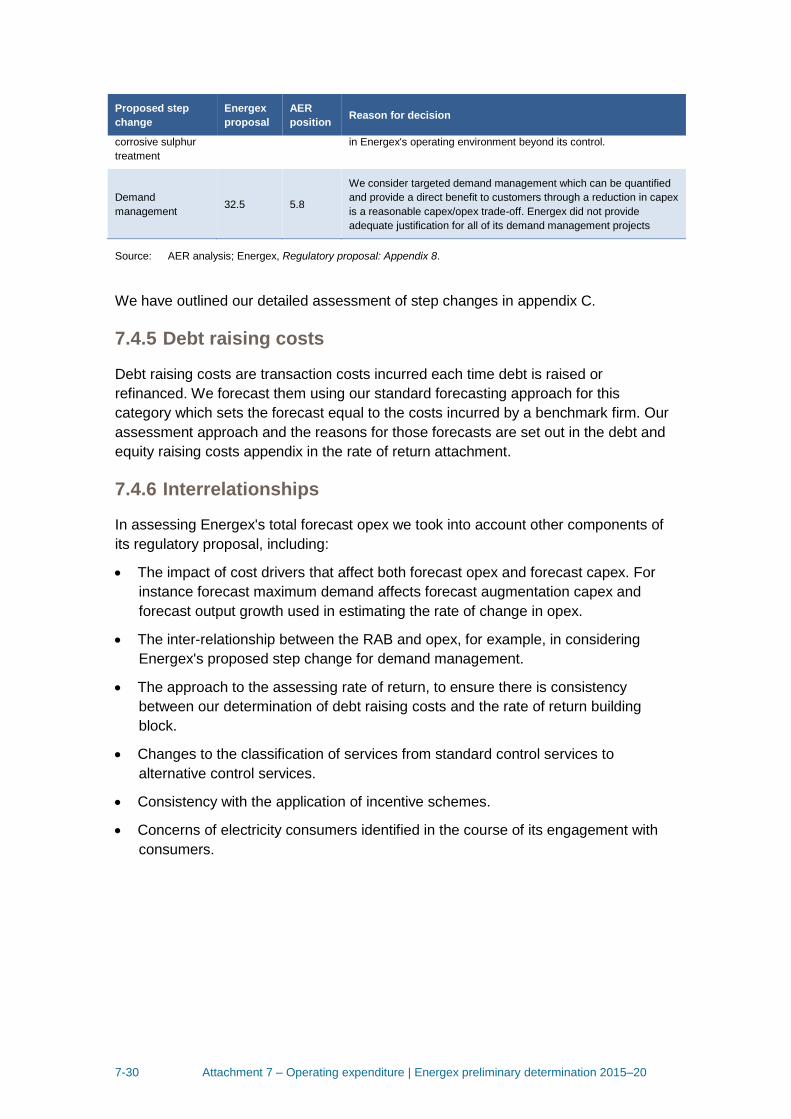
7.4.4 Step changes
We have included a step change above our estimate base level of opex for one of
Energex's demand management projects. We are satisfied that the Bromelton deferral
project is an efficient capex/opex trade-off.
As well as the opex changes proposed by Energex to its opex forecast that it described
as 'step changes', Energex proposed other changes to its opex forecast that we
consider should be assessed as step changes. We are not satisfied that other cost
changes Energex identified require a change to our estimate of base opex. We outline
all the cost changes we have assessed as step changes in Table 7.6.34
Table 7.6 Summary of AER assessment of step changes
($ million, 2014—15)
Proposed step
change
Energex
proposal
AER
position Reason for decision
LV crossarm
program 8.9 –
These step changes represent business as usual costs that an
efficient and prudent service provider would typically incur while
meeting its existing regulatory obligations. We do not consider these
step changes are necessary as our estimate of base opex already
provides sufficient funding for Energex, acting as a prudent service
provider, to efficiently deliver standard control distribution services,
given its operating environment.
Matrix
support/licencing 6.8 –
Protection reviews 3.7 –
Overhead
inspection program 14.2 –
Rental increase 14.7 –
Property rental
reductions –21.7 –
Overheads
allocated to opex 137.6 –
Vegetation
management –39.8 –
We have not included these negative step changes in our alternative
opex forecast. This is because in setting our estimate of base opex
consistent with the opex criteria, we have already factored in
efficiency savings that should be reflected in the base opex. To
provide further reductions via step changes would lead to a base
opex below that which reasonably reflects the opex criteria.
Distribution
management
system
–8.1 –
Asbestos removal 1.3 –
Our estimate of base opex already provides sufficient funding for a
prudent service provider to efficiently deliver standard control
distribution services while meeting all existing regulatory obligations.
We are not satisfied an increase in base opex is needed as asbestos
removal is an existing obligation.
Transformer 4.0 – This expenditure does not relate to a new obligation or some change
34
We note that Energex proposed some base year adjustments, a bottom-up forecast and a non-recurrent
expenditure cost increases in its opex forecast. It did this because the amount of expenditure in its base year was
not representative of its expectation of expenditure in the 2015–19 regulatory control period. Consequently, if these
adjustments were required for the opex forecast to meet the opex criteria, we assessed them as step changes.
7-30 Attachment 7 – Operating expenditure | Energex preliminary determination 2015–20
Proposed step
change
Energex
proposal
AER
position Reason for decision
corrosive sulphur
treatment
in Energex's operating environment beyond its control.
Demand
management 32.5 5.8
We consider targeted demand management which can be quantified
and provide a direct benefit to customers through a reduction in capex
is a reasonable capex/opex trade-off. Energex did not provide
adequate justification for all of its demand management projects
Source: AER analysis; Energex, Regulatory proposal: Appendix 8.
We have outlined our detailed assessment of step changes in appendix C.
7.4.5 Debt raising costs
Debt raising costs are transaction costs incurred each time debt is raised or
refinanced. We forecast them using our standard forecasting approach for this
category which sets the forecast equal to the costs incurred by a benchmark firm. Our
assessment approach and the reasons for those forecasts are set out in the debt and
equity raising costs appendix in the rate of return attachment.
7.4.6 Interrelationships
In assessing Energex's total forecast opex we took into account other components of
its regulatory proposal, including:
The impact of cost drivers that affect both forecast opex and forecast capex. For
instance forecast maximum demand affects forecast augmentation capex and
forecast output growth used in estimating the rate of change in opex.
The inter-relationship between the RAB and opex, for example, in considering
Energex's proposed step change for demand management.
The approach to the assessing rate of return, to ensure there is consistency
between our determination of debt raising costs and the rate of return building
block.
Changes to the classification of services from standard control services to
alternative control services.
Consistency with the application of incentive schemes.
Concerns of electricity consumers identified in the course of its engagement with
consumers.

7-31 Attachment 7 – Operating expenditure | Energex preliminary determination 2015–20
7.4.7 Assessment of opex factors
In deciding whether or not we are satisfied the service provider's forecast reasonably
reflects the opex criteria we have regard to the opex factors.35 Table 7.7 summarises
how we have taken the opex factors into account in making our preliminary decision.
Table 7.7 AER consideration of opex factors
Opex factor Consideration
The most recent annual benchmarking report that has
been published under rule 6.27 and the benchmark
operating expenditure that would be incurred by an
efficient distribution network service provider over the
relevant regulatory control period.
There are two elements to this factor. First, we must have
regard to the most recent annual benchmarking report.
Second, we must have regard to the benchmark operating
expenditure that would be incurred by an efficient
distribution network service provider over the period. The
annual benchmarking report is intended to provide an
annual snapshot of the relative efficiency of each service
provider.
The second element, that is, the benchmark operating
expenditure that would be incurred by an efficient provider
during the forecast period, necessarily provides a different
focus. This is because this second element requires us to
construct the benchmark opex that would be incurred by a
hypothetically efficient provider for that particular network
over the relevant period.
We have used several assessment techniques that
enable us to estimate the benchmark opex that an
efficient service provider would require over the forecast
period. These techniques include economic
benchmarking, opex cost function modelling, category
analysis and a detailed review of Energex's labour and
workforce practices. We have used our judgment based
on the results from all of these techniques to holistically
form a view on the efficiency of Energex's proposed total
forecast opex compared to the benchmark efficient opex
that would be incurred over the relevant regulatory control
period.
The actual and expected operating expenditure of the
Distribution Network Service Provider during any
proceeding regulatory control periods.
Our forecasting approach uses the service provider's
actual opex as the starting point. We have compared
several years of Energex's actual past opex with that of
other service providers to form a view about whether or
not its revealed expenditure is sufficiently efficient to rely
on it as the basis for forecasting required opex in the
forthcoming period.
The extent to which the operating expenditure forecast
includes expenditure to address the concerns of electricity
consumers as identified by the Distribution Network
Service Provider in the course of its engagement with
electricity consumers.
We understand the intention of this particular factor is to
require us to have regard to the extent to which service
providers have engaged with consumers in preparing their
regulatory proposals, such that they factor in the needs of
consumers.36
We have considered the concerns of electricity
consumers as identified by Energex – particularly those
expressed in the consumer-focussed overview provided
35
NER, clause 6.5.6(e). 36
AEMC, Rule Determination, 29 November 2012, pp. 101, 115.
7-32 Attachment 7 – Operating expenditure | Energex preliminary determination 2015–20
Opex factor Consideration
as an attachment to its regulatory proposal. For example,
a clear theme present in this document is that customers
are satisfied with current levels of reliability but only as
long as this does not lead to an increase in prices.37
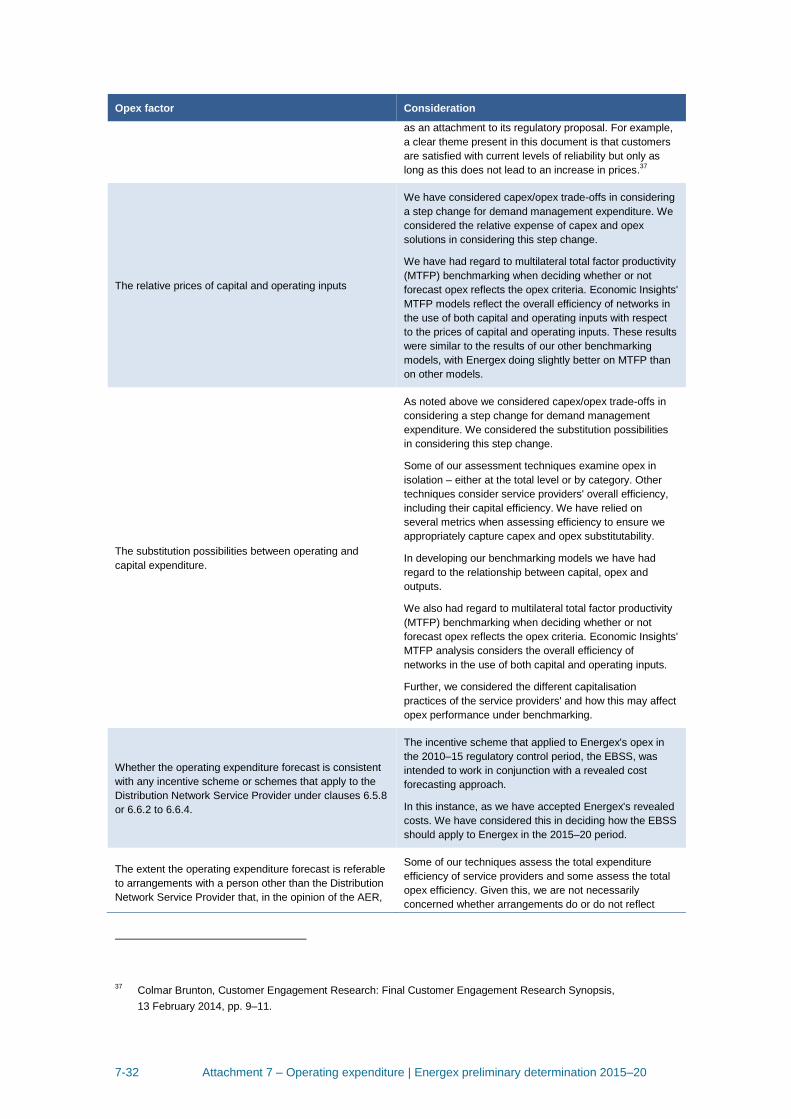
The relative prices of capital and operating inputs
We have considered capex/opex trade-offs in considering
a step change for demand management expenditure. We
considered the relative expense of capex and opex
solutions in considering this step change.
We have had regard to multilateral total factor productivity
(MTFP) benchmarking when deciding whether or not
forecast opex reflects the opex criteria. Economic Insights'
MTFP models reflect the overall efficiency of networks in
the use of both capital and operating inputs with respect
to the prices of capital and operating inputs. These results
were similar to the results of our other benchmarking
models, with Energex doing slightly better on MTFP than
on other models.
The substitution possibilities between operating and
capital expenditure.
As noted above we considered capex/opex trade-offs in
considering a step change for demand management
expenditure. We considered the substitution possibilities
in considering this step change.
Some of our assessment techniques examine opex in
isolation – either at the total level or by category. Other
techniques consider service providers' overall efficiency,
including their capital efficiency. We have relied on
several metrics when assessing efficiency to ensure we
appropriately capture capex and opex substitutability.
In developing our benchmarking models we have had
regard to the relationship between capital, opex and
outputs.
We also had regard to multilateral total factor productivity
(MTFP) benchmarking when deciding whether or not
forecast opex reflects the opex criteria. Economic Insights'
MTFP analysis considers the overall efficiency of
networks in the use of both capital and operating inputs.
Further, we considered the different capitalisation
practices of the service providers' and how this may affect
opex performance under benchmarking.
Whether the operating expenditure forecast is consistent
with any incentive scheme or schemes that apply to the
Distribution Network Service Provider under clauses 6.5.8
or 6.6.2 to 6.6.4.
The incentive scheme that applied to Energex's opex in
the 2010–15 regulatory control period, the EBSS, was
intended to work in conjunction with a revealed cost
forecasting approach.
In this instance, as we have accepted Energex's revealed
costs. We have considered this in deciding how the EBSS
should apply to Energex in the 2015–20 period.
The extent the operating expenditure forecast is referable
to arrangements with a person other than the Distribution
Network Service Provider that, in the opinion of the AER,
Some of our techniques assess the total expenditure
efficiency of service providers and some assess the total
opex efficiency. Given this, we are not necessarily
concerned whether arrangements do or do not reflect
37
Colmar Brunton, Customer Engagement Research: Final Customer Engagement Research Synopsis,
13 February 2014, pp. 9–11.

7-33 Attachment 7 – Operating expenditure | Energex preliminary determination 2015–20
Opex factor Consideration
do not reflect arm's length terms. arm's length terms. A service provider which uses related
party providers could be efficient or it could be inefficient.
Likewise, for a service provider who does not use related
party providers. If a service provider is inefficient, we
adjust their total forecast opex proposal, regardless of
their arrangements with related providers.
Whether the operating expenditure forecast includes an
amount relating to a project that should more
appropriately be included as a contingent project under
clause 6.6A.1(b).
This factor is only relevant in the context of assessing
proposed step changes (which may be explicit projects or
programs). We did not identify any contingent projects in
reaching our preliminary decision.
The extent the Distribution Network Service Provider has
considered, and made provision for, efficient and prudent
non-network alternatives.
We have considered Energex's provision for non-network
alternatives in our assessment of Energex's proposed
step change for demand management.
Source: AER analysis.
The NER require that we notify the service provider in writing of any other factor we
identify as relevant to our assessment, prior to the service provider submitting its
revised regulatory proposal.38 Table 7.8 identifies these factors.
Table 7.8 Other factors we have had regard to
Opex factor Consideration
Our benchmarking data sets, including, but not
necessarily limited to:
data contained in any economic benchmarking RIN,
category analysis RIN, reset RIN or annual reporting
RIN
any relevant data from international sources
data sets that support econometric modelling and
other assessment techniques consistent with the
approach set out in the Guideline
as updated from time to time.
This information may potentially fall within opex factor (4).
However, for absolute clarity, we are using data we gather
from NEM service providers, and data from service
providers in other countries to provide insight into the
benchmark operating expenditure that would be incurred
by an efficient and prudent distribution network service
provider over the relevant regulatory period.
Economic benchmarking techniques for assessing
benchmark efficient expenditure including stochastic
frontier analysis and regressions utilising functional forms
such as Cobb Douglas and Translog.
This information may potentially fall within opex factor (4).
For clarity, and consistent with our approach to
assessment set out in the Guideline, we are have regard
to a range of assessment techniques to provide insight
into the benchmark operating expenditure that an efficient
and prudent service provider would incur over the relevant
regulatory control period.
38
NER, clause 6.5.6(e)(12).
7-34 Attachment 7 – Operating expenditure | Energex preliminary determination 2015–20
A Base year opex
In this appendix, we present our detailed analysis of the Queensland service providers'
base year opex. Base year opex is the starting point for our approach to developing an
estimate of the total forecast opex we consider meets the requirements of the NER.39
We use this approach to assess each of the service providers' total forecast opex
proposals. If we are not satisfied the service providers' opex proposals reasonably
reflect the opex criteria, our estimates form the basis of any adjustments we will
make.40 This approach is set out in the Guideline and is in accordance with principles
that have been endorsed by the AEMC.41
To ensure our estimates of total forecast opex reasonably reflect the opex criteria, we
must be satisfied the starting point is an appropriate reflection of the ongoing efficient
costs a prudent operator would require in the forecast period. If we use the service
provider's revealed expenditure that includes, for example, inherent inefficiencies as
the basis for a forecast, the forecast will also contain these inefficiencies. Therefore, if
we find that the base year expenditure is inefficient or in some other way
unrepresentative of the expenditure needed to achieve the opex objectives in the
forecast period, we adjust it.
The structure of this appendix is:
Section A.1 sets out a summary of our findings and base year adjustments
Section A.2 provides an exposition of ex ante incentive regulation and the role of
benchmarking
Section A.3 outlines our approach to assessing base opex
Section A.4 presents the results of our benchmarking
Section A.5 presents the results of our category analysis and qualitative review
Section A.6 contains our assessment of operating environment factors
Section A.7 explains our conclusions on base opex and whether we propose to
make any adjustments to base year opex for the purposes of our constructing an
alternative total opex forecast.
Section A.8 outlines our assessment of the base year adjustments proposed by
Energex.
39
As we explain in the opex attachment, this is the efficient total forecast opex we consider a prudent service
provider would require to achieve the opex objectives in the forthcoming period. 40
NER, clauses 6.5.6(c) and (d) and 6.12.1(4). 41
AER, Expenditure forecast assessment guideline, November 2013, p 7; AEMC, Final Rule Determination: National
Electricity Amendment (Economic Regulation of Network Service Providers) Rule 2012, 29 November 2012, p.
112.
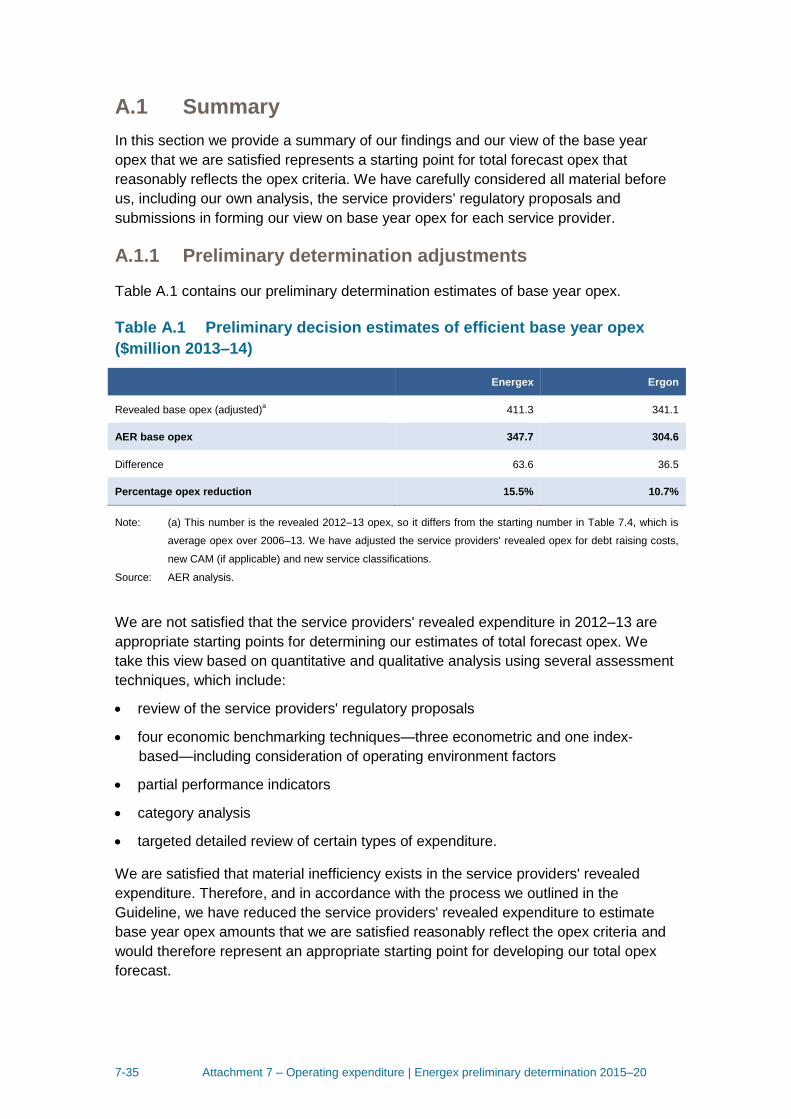
7-35 Attachment 7 – Operating expenditure | Energex preliminary determination 2015–20
A.1 Summary
In this section we provide a summary of our findings and our view of the base year
opex that we are satisfied represents a starting point for total forecast opex that
reasonably reflects the opex criteria. We have carefully considered all material before
us, including our own analysis, the service providers' regulatory proposals and
submissions in forming our view on base year opex for each service provider.
A.1.1 Preliminary determination adjustments
Table A.1 contains our preliminary determination estimates of base year opex.
Table A.1 Preliminary decision estimates of efficient base year opex
($million 2013–14)
Energex Ergon
Revealed base opex (adjusted)a 411.3 341.1
AER base opex 347.7 304.6
Difference 63.6 36.5
Percentage opex reduction 15.5% 10.7%
Note: (a) This number is the revealed 2012–13 opex, so it differs from the starting number in Table 7.4, which is
average opex over 2006–13. We have adjusted the service providers' revealed opex for debt raising costs,
new CAM (if applicable) and new service classifications.
Source: AER analysis.
We are not satisfied that the service providers' revealed expenditure in 2012–13 are
appropriate starting points for determining our estimates of total forecast opex. We
take this view based on quantitative and qualitative analysis using several assessment
techniques, which include:
review of the service providers' regulatory proposals
four economic benchmarking techniques—three econometric and one index-
based—including consideration of operating environment factors
partial performance indicators
category analysis
targeted detailed review of certain types of expenditure.
We are satisfied that material inefficiency exists in the service providers' revealed
expenditure. Therefore, and in accordance with the process we outlined in the
Guideline, we have reduced the service providers' revealed expenditure to estimate
base year opex amounts that we are satisfied reasonably reflect the opex criteria and
would therefore represent an appropriate starting point for developing our total opex
forecast.
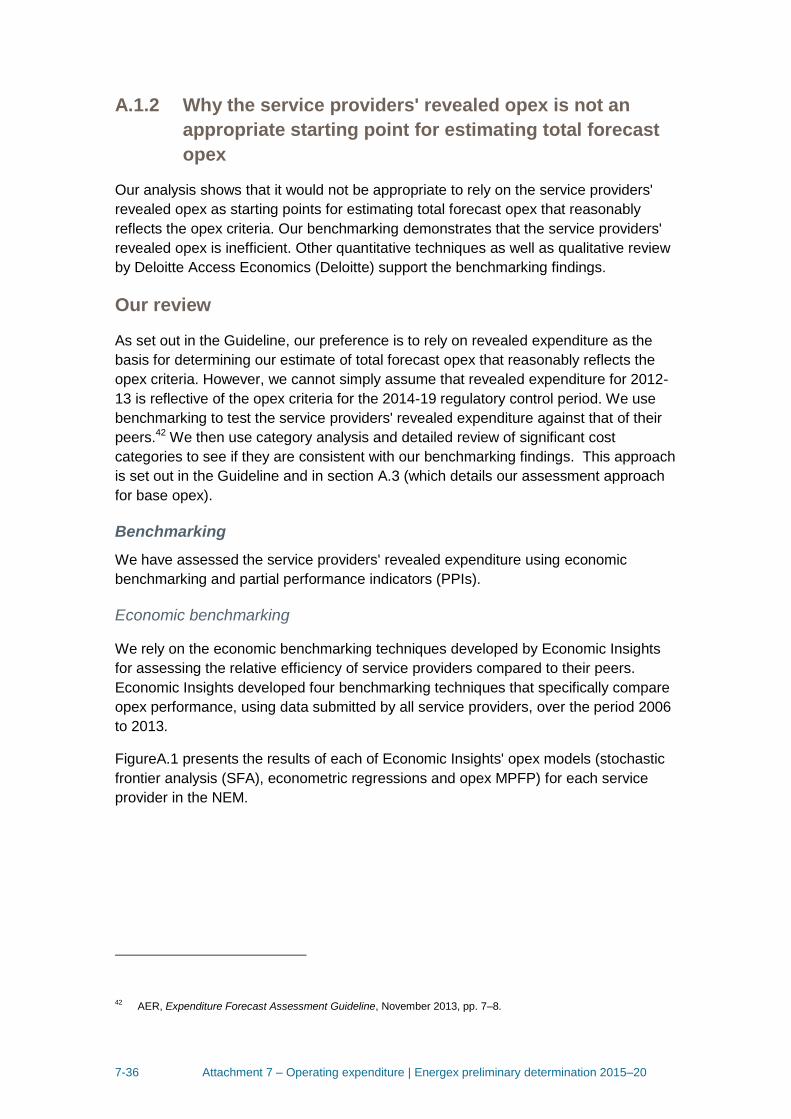
7-36 Attachment 7 – Operating expenditure | Energex preliminary determination 2015–20
A.1.2 Why the service providers' revealed opex is not an
appropriate starting point for estimating total forecast
opex
Our analysis shows that it would not be appropriate to rely on the service providers'
revealed opex as starting points for estimating total forecast opex that reasonably
reflects the opex criteria. Our benchmarking demonstrates that the service providers'
revealed opex is inefficient. Other quantitative techniques as well as qualitative review
by Deloitte Access Economics (Deloitte) support the benchmarking findings.
Our review
As set out in the Guideline, our preference is to rely on revealed expenditure as the
basis for determining our estimate of total forecast opex that reasonably reflects the
opex criteria. However, we cannot simply assume that revealed expenditure for 2012-
13 is reflective of the opex criteria for the 2014-19 regulatory control period. We use
benchmarking to test the service providers' revealed expenditure against that of their
peers.42 We then use category analysis and detailed review of significant cost
categories to see if they are consistent with our benchmarking findings. This approach
is set out in the Guideline and in section A.3 (which details our assessment approach
for base opex).
Benchmarking
We have assessed the service providers' revealed expenditure using economic
benchmarking and partial performance indicators (PPIs).
Economic benchmarking
We rely on the economic benchmarking techniques developed by Economic Insights
for assessing the relative efficiency of service providers compared to their peers.
Economic Insights developed four benchmarking techniques that specifically compare
opex performance, using data submitted by all service providers, over the period 2006
to 2013.
FigureA.1 presents the results of each of Economic Insights' opex models (stochastic
frontier analysis (SFA), econometric regressions and opex MPFP) for each service
provider in the NEM.
42
AER, Expenditure Forecast Assessment Guideline, November 2013, pp. 7–8.
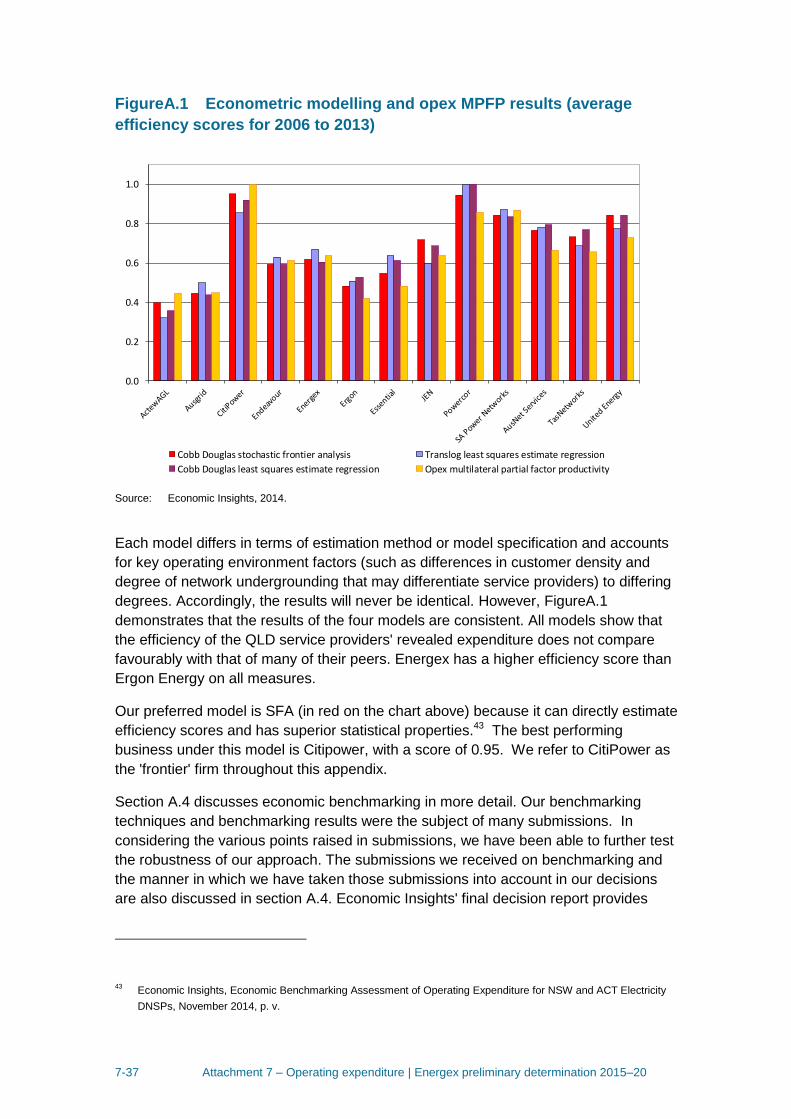
7-37 Attachment 7 – Operating expenditure | Energex preliminary determination 2015–20
FigureA.1 Econometric modelling and opex MPFP results (average
efficiency scores for 2006 to 2013)
Source: Economic Insights, 2014.
Each model differs in terms of estimation method or model specification and accounts
for key operating environment factors (such as differences in customer density and
degree of network undergrounding that may differentiate service providers) to differing
degrees. Accordingly, the results will never be identical. However, FigureA.1
demonstrates that the results of the four models are consistent. All models show that
the efficiency of the QLD service providers' revealed expenditure does not compare
favourably with that of many of their peers. Energex has a higher efficiency score than
Ergon Energy on all measures.
Our preferred model is SFA (in red on the chart above) because it can directly estimate
efficiency scores and has superior statistical properties.43 The best performing
business under this model is Citipower, with a score of 0.95. We refer to CitiPower as
the 'frontier' firm throughout this appendix.
Section A.4 discusses economic benchmarking in more detail. Our benchmarking
techniques and benchmarking results were the subject of many submissions. In
considering the various points raised in submissions, we have been able to further test
the robustness of our approach. The submissions we received on benchmarking and
the manner in which we have taken those submissions into account in our decisions
are also discussed in section A.4. Economic Insights' final decision report provides
43
Economic Insights, Economic Benchmarking Assessment of Operating Expenditure for NSW and ACT Electricity
DNSPs, November 2014, p. v.
0.0
0.2
0.4
0.6
0.8
1.0
Cobb Douglas stochastic frontier analysis Translog least squares estimate regression
Cobb Douglas least squares estimate regression Opex multilateral partial factor productivity
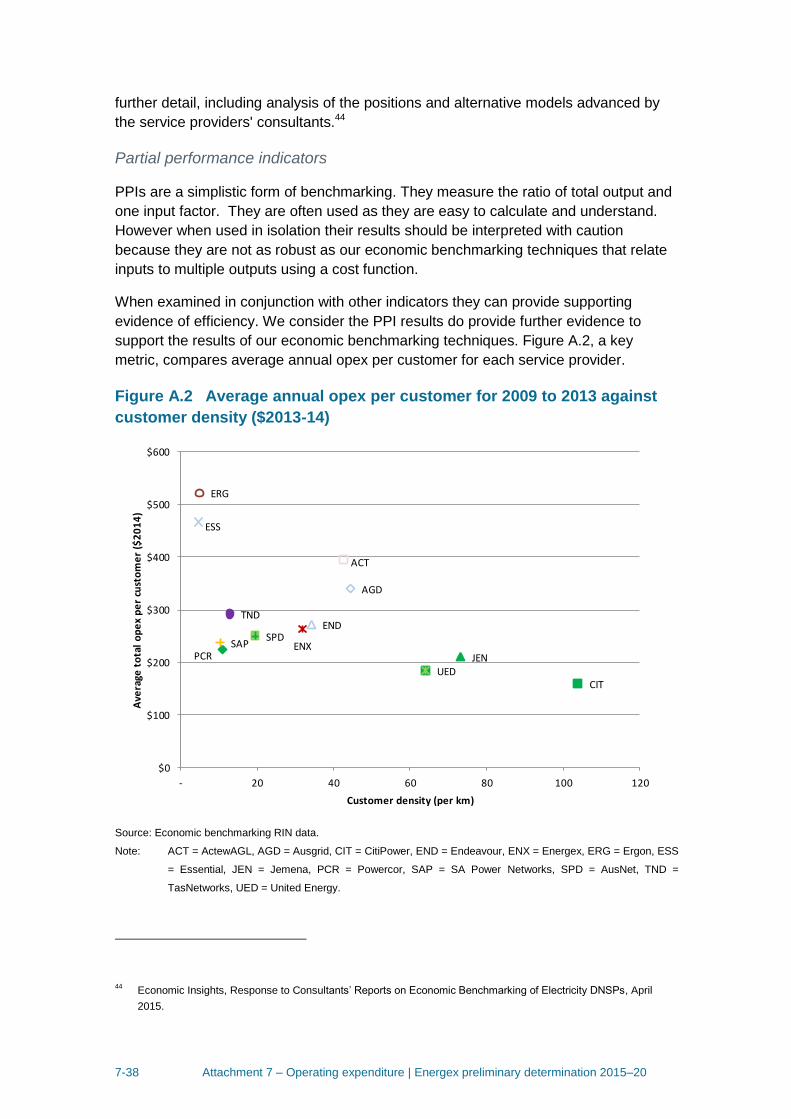
7-38 Attachment 7 – Operating expenditure | Energex preliminary determination 2015–20
further detail, including analysis of the positions and alternative models advanced by
the service providers' consultants.44
Partial performance indicators
PPIs are a simplistic form of benchmarking. They measure the ratio of total output and
one input factor. They are often used as they are easy to calculate and understand.
However when used in isolation their results should be interpreted with caution
because they are not as robust as our economic benchmarking techniques that relate
inputs to multiple outputs using a cost function.
When examined in conjunction with other indicators they can provide supporting
evidence of efficiency. We consider the PPI results do provide further evidence to
support the results of our economic benchmarking techniques. Figure A.2, a key
metric, compares average annual opex per customer for each service provider.
Figure A.2 Average annual opex per customer for 2009 to 2013 against
customer density ($2013-14)
Source: Economic benchmarking RIN data.
Note: ACT = ActewAGL, AGD = Ausgrid, CIT = CitiPower, END = Endeavour, ENX = Energex, ERG = Ergon, ESS
= Essential, JEN = Jemena, PCR = Powercor, SAP = SA Power Networks, SPD = AusNet, TND =
TasNetworks, UED = United Energy.
44
Economic Insights, Response to Consultants’ Reports on Economic Benchmarking of Electricity DNSPs, April
2015.
ACT
AGD
CIT
END
ENX
ERG
ESS
JENPCRSAP
SPD
TND
UED
$0
$100
$200
$300
$400
$500
$600
- 20 40 60 80 100 120
Ave
rage
to
tal
op
ex
pe
r cu
sto
me
r ($
20
14
)
Customer density (per km)
7-39 Attachment 7 – Operating expenditure | Energex preliminary determination 2015–20
PPIs are a simplistic form of benchmarking. They measure the ratio of total output and
one input factor. They are often used as they are easy to calculate and understand.
However when used in isolation their results should be interpreted with caution
because they are not as robust as our economic benchmarking techniques that relate
inputs to multiple outputs using a cost function.
When examined in conjunction with other indicators they can provide supporting
evidence of efficiency. We consider the PPI results do provide further evidence to
support the results of our economic benchmarking techniques. Figure A.2, a key
metric, compares average annual opex per customer for each service provider.
Figure A.2 demonstrates a clear demarcation between Ergon Energy and all other
distributers except Essential Energy. Energex incurs a lower average opex per
customer, similar to that incurred by AusNet Services and Endeavour Energy. This is
consistent with the economic benchmarking results which indicate that Energex
performs better than Ergon Energy.
'Per customer' PPIs tend to be less favourable towards rural service providers who
typically operate more assets per customer. We must bear this in mind when we
consider the results in PPIs are a simplistic form of benchmarking. They measure the
ratio of total output and one input factor. They are often used as they are easy to
calculate and understand. However when used in isolation their results should be
interpreted with caution because they are not as robust as our economic benchmarking
techniques that relate inputs to multiple outputs using a cost function.
When examined in conjunction with other indicators they can provide supporting
evidence of efficiency. We consider the PPI results do provide further evidence to
support the results of our economic benchmarking techniques. Figure A.2, a key
metric, compares average annual opex per customer for each service provider.
Figure A.2. In particular, Ergon Energy has a low density network so it will appear to
perform worse on PPIs than it does on the economic benchmarking models –
particularly compared to frontier performers CitiPower and Powercor.
PPIs do not explicitly account for operating environment differences and examine only
one output. However, bearing these limitations in mind, our PPI metrics (opex per
customer and total user cost per customer) support the economic benchmarking
results. We consider these PPIs remain useful tools of comparison if their limitations
are understood. Further, our first annual benchmarking report contains additional PPIs
that examine different outputs. These PPIs similarly show the NSW service providers
generally perform poorly compared to their peers.45 PPIs were the subject of some
submissions from stakeholders. We consider PPIs in further detail in section A.4.
45
AER, Electricity distribution network service providers–annual benchmarking report, November 2014, Appendix A.
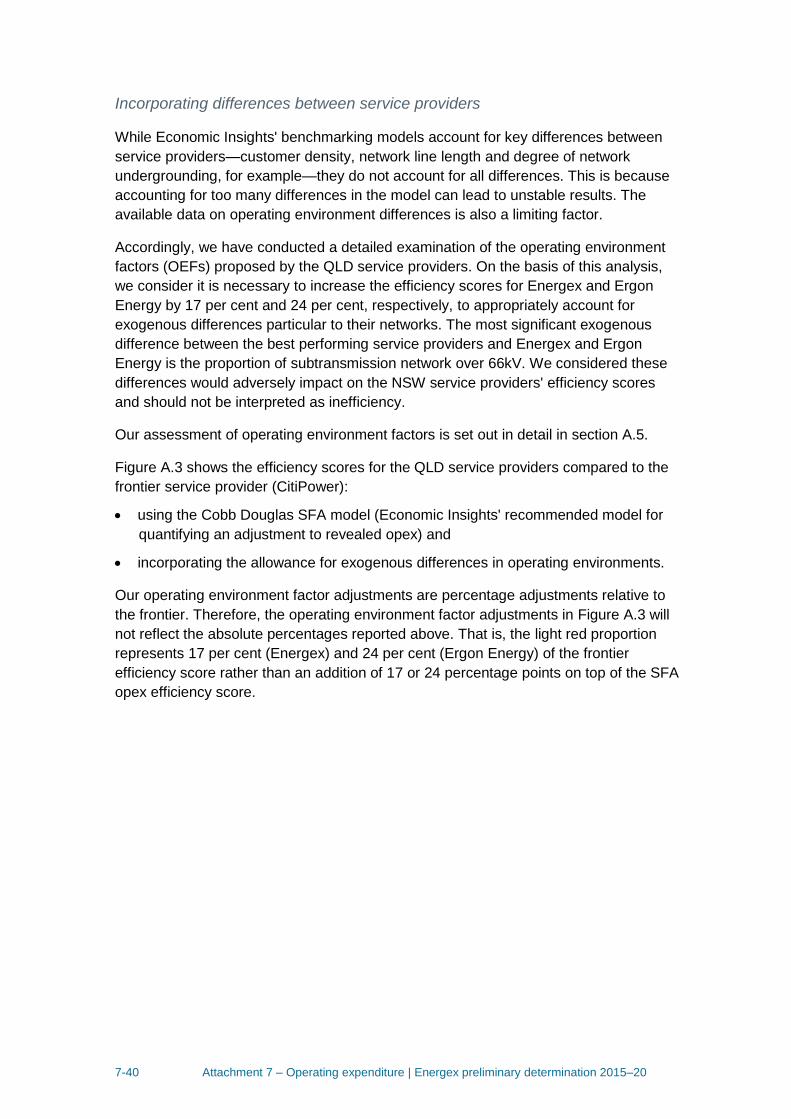
7-40 Attachment 7 – Operating expenditure | Energex preliminary determination 2015–20
Incorporating differences between service providers
While Economic Insights' benchmarking models account for key differences between
service providers—customer density, network line length and degree of network
undergrounding, for example—they do not account for all differences. This is because
accounting for too many differences in the model can lead to unstable results. The
available data on operating environment differences is also a limiting factor.
Accordingly, we have conducted a detailed examination of the operating environment
factors (OEFs) proposed by the QLD service providers. On the basis of this analysis,
we consider it is necessary to increase the efficiency scores for Energex and Ergon
Energy by 17 per cent and 24 per cent, respectively, to appropriately account for
exogenous differences particular to their networks. The most significant exogenous
difference between the best performing service providers and Energex and Ergon
Energy is the proportion of subtransmission network over 66kV. We considered these
differences would adversely impact on the NSW service providers' efficiency scores
and should not be interpreted as inefficiency.
Our assessment of operating environment factors is set out in detail in section A.5.
Figure A.3 shows the efficiency scores for the QLD service providers compared to the
frontier service provider (CitiPower):
using the Cobb Douglas SFA model (Economic Insights' recommended model for
quantifying an adjustment to revealed opex) and
incorporating the allowance for exogenous differences in operating environments.
Our operating environment factor adjustments are percentage adjustments relative to
the frontier. Therefore, the operating environment factor adjustments in Figure A.3 will
not reflect the absolute percentages reported above. That is, the light red proportion
represents 17 per cent (Energex) and 24 per cent (Ergon Energy) of the frontier
efficiency score rather than an addition of 17 or 24 percentage points on top of the SFA
opex efficiency score.
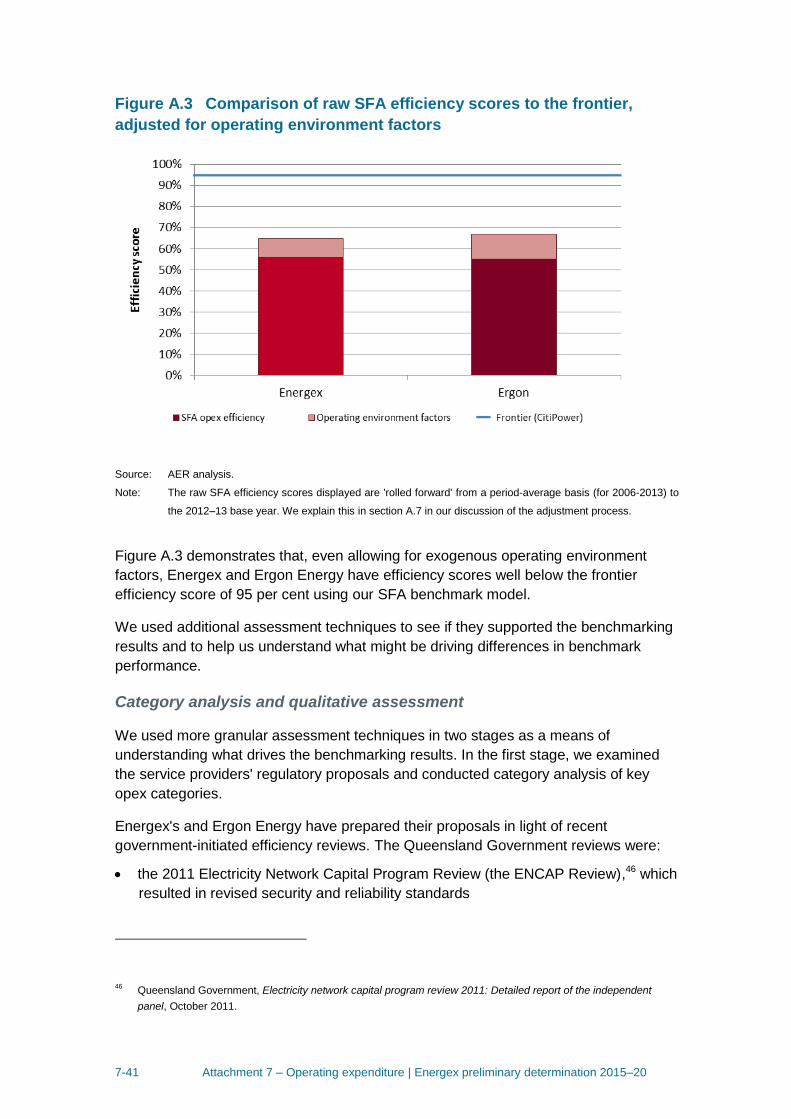
7-41 Attachment 7 – Operating expenditure | Energex preliminary determination 2015–20
Figure A.3 Comparison of raw SFA efficiency scores to the frontier,
adjusted for operating environment factors
Source: AER analysis.
Note: The raw SFA efficiency scores displayed are 'rolled forward' from a period-average basis (for 2006-2013) to
the 2012–13 base year. We explain this in section A.7 in our discussion of the adjustment process.
Figure A.3 demonstrates that, even allowing for exogenous operating environment
factors, Energex and Ergon Energy have efficiency scores well below the frontier
efficiency score of 95 per cent using our SFA benchmark model.
We used additional assessment techniques to see if they supported the benchmarking
results and to help us understand what might be driving differences in benchmark
performance.
Category analysis and qualitative assessment
We used more granular assessment techniques in two stages as a means of
understanding what drives the benchmarking results. In the first stage, we examined
the service providers' regulatory proposals and conducted category analysis of key
opex categories.
Energex's and Ergon Energy have prepared their proposals in light of recent
government-initiated efficiency reviews. The Queensland Government reviews were:
the 2011 Electricity Network Capital Program Review (the ENCAP Review),46 which
resulted in revised security and reliability standards
46
Queensland Government, Electricity network capital program review 2011: Detailed report of the independent
panel, October 2011.
7-42 Attachment 7 – Operating expenditure | Energex preliminary determination 2015–20
the 2012 Independent Review Panel (IRP) investigation47 into areas of
inefficiencies in the Queensland service providers. The task of the IRP was to
develop options to:
o improve the efficiency of capital and operating expenditure
o deliver savings in corporate and overhead costs including ICT48 costs.
In May 2013, the IRP found that through a series of reforms, Energex and Ergon could
together achieve an estimated $1.4 billion reduction in operational costs over the 2015-
20 regulatory control period. The IRP made 45 recommendations, including 18 which
focused on overhead expenses and operational efficiencies.49
Energex's and Ergon Energy's regulatory proposals include a series of efficiency
adjustments to base opex and in the forecast period as a result of these reviews,
including FTE reductions.50 This suggests labour costs could be one of the drivers of
their benchmarking performance.
Further, category analysis showed the QLD service providers had 'high' or 'very high'
costs on labour and overheads metrics compared to most of their peers.
Due to the overlap between the IRP review and our category analysis results (and
because labour costs account for approximately 75 per cent of opex for Ergon Energy
and 95 per cent for Energex51) for the second stage, we engaged Deloitte to review the
reasons for the service providers' benchmarking performance, including the extent they
had implemented the recommendations of the recent review by the Independent
Review Panel (IRP).
Deloitte's detailed review findings
Deloitte found that while Energex and Ergon Energy have both achieved significant
efficiency gains since the IRP’s review (particularly reflected in FTE reductions), much
of these benefits were realised after the 2012–13 base year. Deloitte also observed
that the service providers have identified they can further reduce their costs. Further,
47
Commissioned by the Interdepartmental Committee on Electricity Sector Reform (IDC), initiated by the Queensland
Government. 48
Information and communications technology 49
Independent Review Panel on Network Costs, Electricity Network Costs Review, 2013. The IRP's
recommendations were for the most part accepted by the Queensland Government. However, some of the reforms
also related to structural change, including a recommendation that Energex, Ergon and Powerlink either be
structurally combined into a single entity, or transferred under the umbrella of a holding company similar to
Networks NSW. The QLD Government accepted these reforms in principle only. They are beyond the scope of our
review. See Queensland Government response to the Interdepartmental Committee on Electricity Sector Reform
2013. 50
For example, Energex, Energex regulatory proposal appendix 8: Application of base–step–trend (BST) model,
October 2014, pp. 18, 33–55, 65; Ergon Energy, Supporting Documentation - Our Journey to the Best Possible
Price (Attachment 0A.01.02 to Ergon Energy's Regulatory Proposal), pp. 13–16. 51
Energex, Response to information request AER Energex 002, received 19 December 2014; Ergon Energy,
Response to information request AER Ergon 021, received 31 January 2015.
7-43 Attachment 7 – Operating expenditure | Energex preliminary determination 2015–20
the service providers have not yet addressed a number of IRP recommendations.
Deloitte conclude that Ergon Energy's and Energex’s opex prior to and in 2012–13 was
higher than necessary to achieve efficient operations.52
Deloitte's key findings include:53
both service providers (but Ergon Energy in particular) have high total labour costs
compared to more efficient peers, which is a result of having too many employees
rather than the cost per employee
Ergon Energy's EBA prohibits certain activities (such as switching) from being
conducted by a single person; in other states these activities can be performed by
a single person
certain EBA provisions, while not necessarily unique to Energex and Ergon Energy,
limit their ability to quickly adjust their workforces flexibly and utilise them
productively. This is amplified by the large proportion of employees engaged under
EBAs. Examples include:
o no forced redundancies
o contractors are unable to perform certain tasks, such as switching (unique to
QLD)
o minimum apprentice numbers
o restrictions on outsourcing
both service providers (but Energex in particular) incurred significant overtime in
expenditure in the base year
Energex and Ergon Energy have not implemented the IRP's recommendation that
they market test the ICT services that SPARQ (a joint venture owned by the two
service providers) provides, resulting in inefficiency in base opex for both service
providers
Ergon Energy has not yet implemented a LSA model for its regional depots, despite
the IRP's recommendation (based on Powercor's success with this model) to do so.
Deloitte considers Ergon Energy could realise efficiencies if it implemented an LSA
model.
We explain Deloitte's findings in further detail in section A.5.3.
Adjustments to revealed opex
We consider the evidence shows that there is a gap between the revealed costs in the
base year and the benchmark opex that an efficient provider would incur. In these
circumstances we may need to make an adjustment to the revealed base opex.
Making an adjustment involves consideration of the appropriate technique, the
52
Deloitte, Queensland distribution network service providers - opex performance analysis, April 2015, pp. v–xx. 53
Deloitte, Queensland distribution network service providers - opex performance analysis, April 2015, pp. v–xx.

7-44 Attachment 7 – Operating expenditure | Energex preliminary determination 2015–20
appropriate benchmark comparison point and the appropriate manner in which to make
the adjustment. Our approach of using benchmarking as a basis for making
adjustments to opex is consistent with Ofgem's approach.54
The best technique for the adjustment
We have adopted Economic Insights' recommendation to rely on the Cobb Douglas
SFA model as the preferred technique upon which we base an adjustment to revealed
opex. This technique directly estimates efficiency scores and has superior statistical
properties.55
The benchmark comparison point
For the reasons we outline in detail in section A.7, we have decided that, on balance,
the appropriate benchmark comparison point is the efficiency score for the business at
the upper third (top 33 per cent) of companies in the benchmark sample (represented
by AusNet Services). This reduces the benchmark comparison point from 0.95 (the
frontier) to 0.77. We have done this because:
this recognises that more than a third of the service providers in the NEM,
operating in varied environments, are able to perform at or above our benchmark
comparison point. We are confident that a firm that performs below this level is
therefore spending in a manner that does not reasonably reflect the opex criteria.
An adjustment back to this appropriately conservative point is sufficient to remove
the material over-expenditure in the revealed costs while still incorporating an
appropriately wide margin for potential modelling and data errors for the purposes
of forecasting
it is consistent with the preference in the Guideline to rely on revealed costs and
only adjust base opex where it is materially inefficient
given it is our first application of benchmarking, it is appropriate to adopt a cautious
approach, allowing a margin for potential data and modelling issues and other
uncertainties
we consider this approach achieves the NEO and RPP because it is sufficiently
conservative to avoid the risks associated with undercompensating the service
provider but also promotes efficiency incentives.
Figure A.41 shows the efficiency scores using our SFA model for the QLD service
providers compared to our benchmark comparison point, represented by the red line
(AusNet Services). The blue line represents the frontier (CitiPower).
54
Noting that Ofgem now assesses total expenditure rather than capex and opex separately. See, for example,
Ofgem, RIIO-ED1–Final determinations for the slow-track electricity distribution companies-Overview, 28
November 2014, Chapter 4. 55
Economic Insights, Economic Benchmarking Assessment of Operating Expenditure for NSW and ACT Electricity
DNSPs, November 2014, p. v.
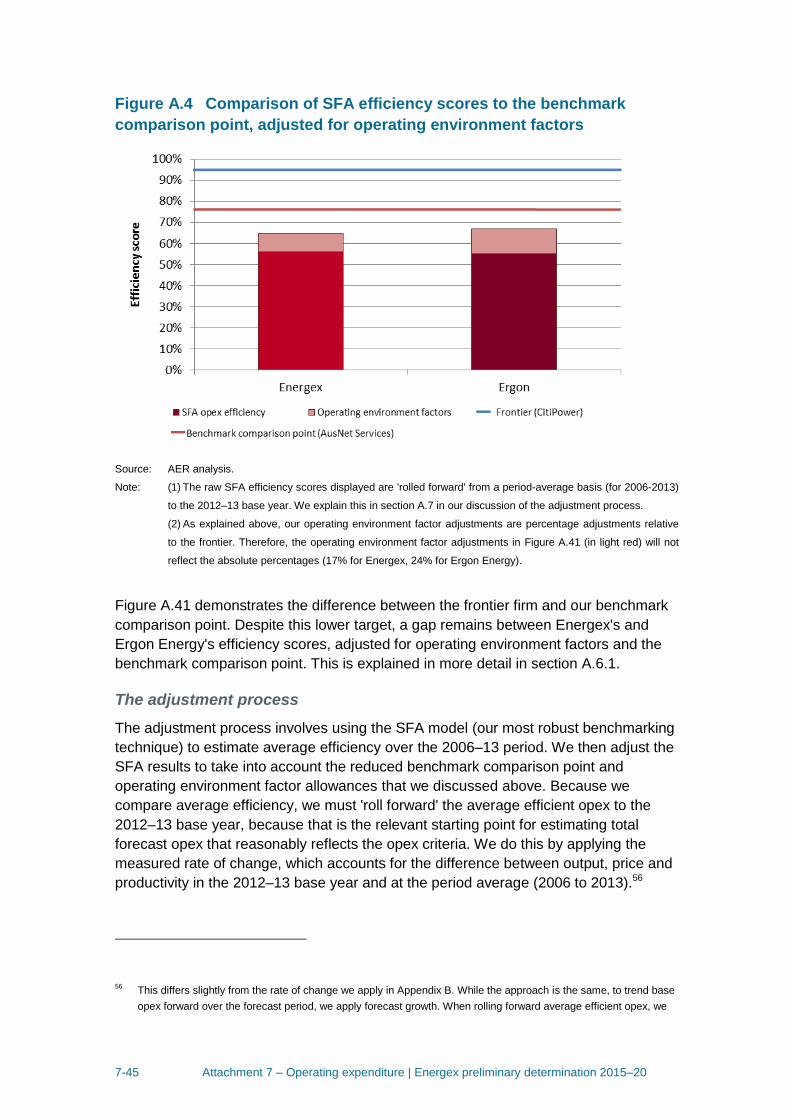
7-45 Attachment 7 – Operating expenditure | Energex preliminary determination 2015–20
Figure A.4 Comparison of SFA efficiency scores to the benchmark
comparison point, adjusted for operating environment factors
Source: AER analysis.
Note: (1) The raw SFA efficiency scores displayed are 'rolled forward' from a period-average basis (for 2006-2013)
to the 2012–13 base year. We explain this in section A.7 in our discussion of the adjustment process.
(2) As explained above, our operating environment factor adjustments are percentage adjustments relative
to the frontier. Therefore, the operating environment factor adjustments in Figure A.41 (in light red) will not
reflect the absolute percentages (17% for Energex, 24% for Ergon Energy).
Figure A.41 demonstrates the difference between the frontier firm and our benchmark
comparison point. Despite this lower target, a gap remains between Energex's and
Ergon Energy's efficiency scores, adjusted for operating environment factors and the
benchmark comparison point. This is explained in more detail in section A.6.1.
The adjustment process
The adjustment process involves using the SFA model (our most robust benchmarking
technique) to estimate average efficiency over the 2006–13 period. We then adjust the
SFA results to take into account the reduced benchmark comparison point and
operating environment factor allowances that we discussed above. Because we
compare average efficiency, we must 'roll forward' the average efficient opex to the
2012–13 base year, because that is the relevant starting point for estimating total
forecast opex that reasonably reflects the opex criteria. We do this by applying the
measured rate of change, which accounts for the difference between output, price and
productivity in the 2012–13 base year and at the period average (2006 to 2013).56
56
This differs slightly from the rate of change we apply in Appendix B. While the approach is the same, to trend base
opex forward over the forecast period, we apply forecast growth. When rolling forward average efficient opex, we
7-46 Attachment 7 – Operating expenditure | Energex preliminary determination 2015–20
A key reason we use average period efficiency scores is because they reduce the
impact of year–specific fluctuations not under the control of the service provider (such
as weather conditions). Given the sample period is only eight years, Economic Insights
considers the average is sufficiently recent to avoid potential loss of current
relevance.57
Average efficiency results also provide us with an estimate of underlying recurrent
expenditure not influenced by year on year changes, which we require for the
Guideline approach to estimating total forecast opex.
We discuss our adjustment in detail in section A.7.
A.1.3 Summary responses to Ergon Energy's submissions
Ergon Energy provided submissions to the issues paper to the Queensland electricity
distribution regulatory proposals and to the draft decision for the NSW distribution
determinations, commenting on our approach to assessing opex.58 While Ergon
Energy acknowledged the role of benchmarking in our assessment of expenditure, it
considers:
our approach "uses benchmarking, to the near exclusion of every other relevant
consideration"
our benchmarking is "not fit for the purpose to which it has been put" so we should
not rely on it to adjust forecasts of base opex
our approach does not adequately consider service providers' individual
circumstances.
Throughout this appendix, we respond to the submissions put forward by Ergon
Energy and other stakeholders in the course of explaining our approach and findings.
This section provides an overview of our response to the above three key submissions.
Reasonable weight placed on benchmarking
Ergon Energy submits that our approach relies exclusively on benchmarking to both
reject forecast opex and as the basis for substituted opex. In so doing, Ergon Energy
submits, we are effectively disregarding our revealed cost approach and 2010–15
determination.59
apply measured growth because we can observe what has actually changed between the period average and the
base year. 57
Economic Insights, 2015, pp. 43–44. 58
Ergon Energy, Submission on the Queensland Electricity Distribution Regulatory Proposals 2015–16 to 2019–20
Issues Paper, 30 January 2015; Ergon Energy, Submissions on the draft decisions: NSW and ACT distribution
determinations 2014–15 to 2018–19, 13 February 2015. Energex provide a submission to the Issues paper for the
Queensland electricity determination, however it did not raise any concerns on base opex. 59
Ergon Energy, Submissions on the draft decisions: NSW and ACT distribution determinations 2014–15 to 2018–
19, 13 February 2015, pp. 9–10.
7-47 Attachment 7 – Operating expenditure | Energex preliminary determination 2015–20
We do not agree. As outlined in the Guideline, and in this preliminary decision, we
have relied on several assessment techniques, both quantitative and qualitative to
assess the service providers' proposed forecast opex. In doing so, we have used the
same techniques as the basis for determining substitute opex. We have used our
discretion to give benchmarking prominent, but appropriate weight based on its
robustness and utility.
We have assessed the service providers' proposals using the techniques outlined in
the Guideline. We have engaged with the details of the service providers' proposals to
the extent they are relevant to our assessment of base opex. They were the starting
point for our assessment. Ultimately, however, we must form a view on the amount of a
service provider's forecast, not the specific contents of the proposal.60
Further, since our 2010–15 determination, we have developed new techniques that
give us better insight into assessing expenditure and have new information that we are
able to take into account. All stakeholders should expect us to use new techniques and
information when they become available.61 This new information demonstrates that the
service providers' revealed costs are inefficient. However, we have not moved away
from revealed costs—we use them when it is appropriate to do so. Rather, we have
used new techniques to ensure that we are better able to make a decision that
reasonably reflects the opex criteria for the future. Our approach represents a
refinement of our longstanding approach to assessing opex.
We discuss these issues in detail in section A.3.
Benchmarking is robust, reliable and reasonable
Ergon Energy submitted (and used numerous consultants to support its view) that our
benchmarking is fundamentally flawed due to, for example:62
failure to account for differences between service providers
sensitivity to data changes
variance in results
not having regard to forecast changes in costs
data comparability and reliability.
60
AEMC, Final Rule Determination: National Electricity Amendment (Economic Regulation of Network Service
Providers) Rule 2012, 29 November 2012, p. 93. 61
We have indicated in previous decisions and in defending those decisions our preference to use up to date
information where possible. The Tribunal has endorsed this approach and indicated a similar preference: see for
example Application by Ergon Energy Corporation Limited (Labour Cost Escalators) (No 3) [2010] ACompT 11 at
[61] to [62]. 62
Ergon Energy, Submissions on the draft decisions: NSW and ACT distribution determinations 2014–15 to 2018–
19, 13 February 2015, pp. 9–22.
7-48 Attachment 7 – Operating expenditure | Energex preliminary determination 2015–20
Our view is that Economic Insights' benchmarking is robust and reliable. The model
specification and estimation methods are superior to the alternatives proposed by
service providers and their consultants. In addition, the Australian data we are using
are robust because we have gathered, tested and validated it over three years of
consultation with service providers and other interested stakeholders. The international
data Economic Insights has used (to improve the precision of the models) has been
used by the electricity regulators in the respective jurisdictions in recent regulatory
decisions.63
Economic Insights responds to the service providers' submissions in detail in its final
decision report.64 We also discuss this further in section A.4.
Individual circumstances are considered
Ergon Energy submits that by relying on benchmarking as part of our assessment
approach, we have failed to comply with the NER requirements to have regard to their
individual circumstances. In particular, Ergon Energy refers to the need for us to
consider its specific cost inputs. 65
Benchmarking is a tool we use to assess regulatory proposals. We also use it in setting
a substitute forecast if we are not satisfied that a service provider's proposed forecast
reasonably reflects the opex criteria. We have considered the service providers'
proposals in significant detail in conducting our assessments. We have conducted
detailed reviews and analysed the service providers' forecasting approaches. We also
have had regard to the service providers' individual circumstances through our review
of operating environment factors (see section A.6) to the extent required by the NER
and in accordance with the intent of the AEMC.
We disagree with Ergon Energy's view that the NER require us to consider their
endogenous circumstances. The AEMC is clear that while exogenous circumstances
are relevant and should be accounted for, endogenous circumstances should not be
considered. 66
We discuss these issues in detail in section A.3.
63
Economic Insights, Response to Consultants’ Reports on Economic Benchmarking of Electricity DNSPs, April
2015, section 3.2. 64
Economic Insights, Response to Consultants’ Reports on Economic Benchmarking of Electricity DNSPs, April
2015, section 3.10. 65
Ergon Energy, Submission on the Queensland Electricity Distribution Regulatory Proposals 2015–16 to 2019–20
Issues Paper, 30 January 2015, pp. 10–14; Ergon Energy, Submissions on the draft decisions: NSW and ACT
distribution determinations 2014–15 to 2018–19, 13 February 2015, pp. 23–27. 66
AEMC, Final Rule Determination: National Electricity Amendment (Economic Regulation of Network Service
Providers) Rule 2012, 29 November 2012, p. 113. See also pp. viii, 25, 98, 107–108.
7-49 Attachment 7 – Operating expenditure | Energex preliminary determination 2015–20
A.2 Ex ante incentive regulation and the role of benchmarking
This section explains ex ante regulation, and how our approach to benchmarking fits
appropriately within the legal and regulatory framework.
A.2.1 Ex ante incentive regulation
Network services are ‘natural’ monopolies with little scope in any given location for a
competitor to duplicate the network efficiently.67 Monopoly businesses do not have an
incentive to set prices at an efficient level because there is no competitive discipline on
their decisions. They do not need to consider how and whether or not rivals will
respond to their prices. Monopolies' profits depend only on the behaviour of
consumers, their cost functions, and their prices or the amount supplied.68
Without regulation, the resulting market power would lead to high prices and probably
insufficient investment. Accordingly, we must regulate the prices and other aspects of
these services to ensure reliable and affordable electricity.69
Information asymmetries make it difficult for the AER to accurately assess the
efficiency of the network businesses’ proposals. We need to make judgements about
‘efficient’ costs.70
Incentive regulation is used to partially overcome information asymmetries. We apply
incentive-based regulation across all energy networks we regulate—consistent with the
NER.71 This is a fundamental aspect of the regime. As stated by the AEMC:
Set out in Chapter 6 of the NER, the incentive regulation framework is designed
to encourage distribution businesses to spend efficiently and to share the
benefits of efficiency gains with consumers. Specifically, it is designed to
encourage distribution businesses to make efficient decisions on when and
what type of expenditure to incur in order to meet their network reliability,
safety, security and quality requirements.72
67
Productivity Commission, Electricity Network Regulatory Frameworks, inquiry report no. 62, 2013, p. 65. 68
ACCC, Submission to the Productivity Commission’s inquiry into the economic regulation of airport services, March
2011, p. 8. 69
Productivity Commission, Electricity Network Regulatory Frameworks, inquiry report no. 62, 2013, p. 65. 70
Productivity Commission, Electricity Network Regulatory Frameworks, inquiry report no. 62, 2013, p. 190. 71
Clause 6.2.6(a) of the NER states that for standard control services, the control mechanism must be of the
prospective CPI minus X form, or some incentive-based variant of the prospective CPI minus X form, in
accordance with Part C (Building Block Determinations for standard control services). Further, the RPPs state a
regulated network service provider should be provided with effective incentives in order to promote economic
efficiency with respect to direct control network services the operator provides. 72
AEMC, Consultation paper: National Electricity Amendment (Demand Management Incentive Scheme) Rule 2015,
February 2015, p. 3.
7-50 Attachment 7 – Operating expenditure | Energex preliminary determination 2015–20
Broadly speaking, incentive regulation is designed to align the commercial goals of the
business to the goals of society or, in the case of energy regulation, the NEO.73 It relies
on the principle that the network businesses’ objective is to maximise profits.74
Businesses that are able to improve their efficiency are rewarded with higher profits.75
Businesses that allow their efficiency to deteriorate earn lower-than-expected profits.
The actual revenue allowance set by the regulator should not influence the basic
incentive of network businesses to minimise costs and, thereby, maximise profits.
To elaborate, the regime requires the AER to forecast and lock-in opex at the start of
each five-year regulatory period that an efficient and prudent business would require.76
The business is then given financial rewards when it improves its efficiency and
spends less than the forecast during the regulatory period—while maintaining or
improving its service standards. If the business spends less than the forecast it will still
earn revenue to cover the total forecast amount. Hence it can ‘keep the difference’
between the forecast and its actual expenditure until the end of the regulatory control
period. Conversely, if its spending exceeds the forecast, it must carry the difference
itself until the end of the period.
Over time, incentive regulation should in theory allow the regulator to use the
information revealed by businesses to develop better forecasts of efficient
expenditure—consistent with the opex criteria. This will reduce the scope for the
businesses to earn excessive rents and allow the regulator to apply stronger incentives
for further cost reduction.77
However, using a network business’ past information to set future targets can reduce
the incentives of the business to lower costs since the business knows that any cut in
its expenditure will decrease its revenue allowance in the future. Although the current
regulatory approach allows the business to retain the benefit of any reductions in
expenditure for a period of time, setting the appropriate level of incentive is difficult as it
involves judgments about businesses’ reactions to the incentive regime.78 Moreover,
the achievement of best-practice can be costly from the standpoint of managerial
effort.79
73
Productivity Commission, Electricity Network Regulatory Frameworks, inquiry report no. 62, 2013, p. 188. 74
Put simply, it is assumed that shareholders want the business to maximise profits because the greater the profits,
the greater their income. 75
As stated by the AER in its Expenditure Forecast Assessment Guideline explanatory statement, ‘the ex-ante
incentive regime provides an incentive to improve efficiency (that is, by spending less than the AER's forecast)
because network businesses can retain a portion of cost savings made during the regulatory control period.’ (p. 42) 76
This takes into account the realistic expectations of demand forecasts and cost inputs, to meet and manage the
demand for network businesses' services, comply with their regulatory obligations and maintain the safety of the
system. 77
Productivity Commission, Electricity Network Regulatory Frameworks, inquiry report no. 62, 2013, p. 192. 78
Productivity Commission, Electricity Network Regulatory Frameworks, inquiry report no. 62, 2013, p. 190. 79
ACCC & Public Utility Research Centre University of Florida, Infrastructure regulation and market reform:
Principles and practice, May 1998, p. 39.
7-51 Attachment 7 – Operating expenditure | Energex preliminary determination 2015–20
Therefore, the incentives created by the regime can be somewhat mixed.80 But, as a
first principle, energy regulation in Australia is intended to be incentive-based where
possible.81 This can be contrasted with a pure cost of service model.
A.2.2 Contrast with a cost of service regime
Cost of service regulation, as its name implies, compensates businesses for the costs
incurred to provide services. If a business reduces its costs, the benefits of cost
efficiency accrue to consumers in the form of lower prices, not to the business as
profits. On the other hand if costs increase then so do prices.
Cost of service regulation creates an environment that provides greater assurance to
businesses that investments in sunk assets will be recovered. However, a pure cost of
service approach provides low-powered incentives for cost reductions because actual
costs are fully passed through to consumers. Joskow states:
Since the regulator compensates the firm for all of its costs, there is no “rent”
left to the firm as excess profits. This solves the adverse selection problem.
However, this kind of cost of service recovery mechanism does not provide any
incentives for the management to exert optimal (any) effort. If the firm’s
profitability is not sensitive to managerial effort, the managers will exert the
minimum effort that they can get away with. While there are no “excess profits”
left on the table since revenues are equal to the actual costs the firm incurs,
consumers are now paying higher prices than they would have to pay if the firm
were better managed and some rent were left with the firm and its managers. 82
Such low-powered incentives created by a pure cost of service model are typically not
observed in competitive markets. This is an important distinction between incentive
and cost of service regulation.
In our view, the NEO and the supporting incentive-based regime seek to emulate
workably competitive market outcomes. Incentive regulation is designed to impose the
pressures of competition on natural monopolies. The AEMC states:
The role of incentives in regulation can be traced to the fundamental objective
of regulation. That is, to reproduce, to the extent possible, the production and
pricing outcomes that would occur in a workably competitive market in
80
Joskow finds incentive-based regulation applies elements of cost of service regulation in practice: ‘This basic price-
cap regulatory mechanism used to regulate electricity, gas and water distribution and transmission companies in
the UK, is often contrasted with characterizations of cost-of-service or “cost plus” regulation that developed in the
U.S. during the 20th century. However, I believe that there is less difference than may first meet the eye. The UK’s
implementation of a price cap based regulatory framework is best characterized as a combination of cost-of-
service regulation, the application of a high powered incentive scheme for operating costs for a fixed period of
time, followed by a cost-contingent price ratchet to establish a new starting value for prices. (Joskow, Incentive
regulation in theory and practice: electricity distribution and transmission networks, 2005, pp. 70–71.) 81
AER, Overview of the Better Regulation reform package, April 2014, p. 4. 82
Joskow, Incentive regulation in theory and practice: electricity distribution and transmission networks, 2005,
pp. 10–11.
7-52 Attachment 7 – Operating expenditure | Energex preliminary determination 2015–20
circumstances where the development of a competitive market is not
economically feasible.83
Competition generally places downward pressure on prices and can act as an impetus
for cost reductions and quality improvements. In a competitive market, businesses
have a continuous incentive to respond to consumer needs at the lowest cost to
increase demand for their services and, thereby, maximise shareholder returns.84
Businesses that are less efficient are unable to pass their full costs onto consumers
and ultimately pay lower returns to their shareholders.
Consistent with competitive market outcomes, the AEMC considers shareholders, by
seeking a commercial return on investment, create incentives within the business to
encourage efficient outcomes.85 Moreover, the AEMC finds that shareholders should
ultimately bear the risk of business inefficiencies:
… the return on debt estimate should reflect the efficient financing costs of a
benchmark efficient service provider. It should try to create an incentive for
service providers to adopt efficient financing practices and minimise the risk of
creating distortions in the service provider's investment decisions. If a service
provider is run inefficiently then its shareholders, and not its customers, should
bear the financial consequences of inefficient financing practices.86
Although the AEMC is referring to return on debt in the above quote, the same
principle applies to opex. Risk should generally be borne by the party that is best able
to manage it. Consumers of network energy services are not in a position to influence
the network businesses strategy to manage opex, such as staffing decisions. And they
do not have the choice of changing energy suppliers. Shifting the risk of business
inefficiencies away from the managers and shareholders of the networks would create
negative incentives:
It is also in present and future consumers’ interests that the regulatory
framework does not provide excess returns, reward inefficiency or effectively
‘bail out’ a network company that has encountered financial difficulty as a result
of its own actions (or inaction); for example because of an inappropriate
financial structure or poor management. To do so would weaken or even
remove the disciplines that capital markets place on all companies, reducing or
removing the effectiveness of the incentives we place on network companies
under the regulatory regime to the detriment of consumers. The primary
83
AEMC, Rule Determination: National Electricity Amendment (Economic Regulation of Transmission Services) Rule
2006 no. 18, November 2006, p. 93. 84
ACCC, Submission to the Productivity Commission’s inquiry into the economic regulation of airport services, March
2011, pp. 8–9. 85
AEMC, Rule Determination: Economic Regulation of Network Service Providers, November 2012, p. 34. 86
AEMC, Rule Determination: Economic Regulation of Network Service Providers, November 2012, p. 73.
7-53 Attachment 7 – Operating expenditure | Energex preliminary determination 2015–20
responsibility for the financial integrity of a network company lies firmly with that
company’s management and owners.87
A.2.3 How benchmarking helps manage incomplete
information about efficient costs
Incentive regulation relies on effective assessment tools to overcome information
asymmetries. The 'revealed cost approach' and benchmarking are our two main tools.
As outlined in the Guideline, the AER typically uses the ‘base-step-trend’ forecasting
approach to assess most opex categories. That is, we:
assess whether base opex reasonably reflects the opex criteria
assess the prudency and efficiency of forecast cost increases or decreases
associated with new regulatory obligations and capex/opex trade-offs (step
changes)
apply trend analysis to forecast future expenditure levels.88
The revealed cost approach is a way to determine an efficient base. It relies on the
principle that the primary objective of a business is to maximise its profits. The
regulatory framework allows network businesses to keep the benefit of any cost
reductions for a period of time (as discussed above). The AER may apply various
incentive schemes, such as the EBSS in conjunction with the STPIS, to provide the
business with a continuous incentive to improve its efficiency in supplying electricity
services—while maintaining or improving service standards.
The drive to maximise shareholder returns should in theory push the businesses to
become more efficient and productive over time. Actual past expenditure should
therefore be a good indicator of the efficient expenditure the business requires in the
future.
So, where incentive regulation is effective, the revealed cost approach can at least
partially overcome information asymmetries that exist between the business and
relevant stakeholders about the efficient opex base. We prefer to use revealed (past
actual) costs as the starting point for assessing and determining efficient forecasts.89 It
allows us to leave the minutiae of input and output decision-making to the
businesses.90
87
Ofgem, Regulating Energy Networks for the Future: RPI–X@20: Emerging Thinking – Embedding financeability in
a new regulatory framework, Parallel consultation paper, 20 January 2010, p. 4. 88
AER, Expenditure Forecast Assessment Guideline for Electricity Distribution, 2013, pp. 22–24. 89
AER, Expenditure Forecast Assessment Guideline explanatory statement, 2013, p. 42. 90
Productivity Commission, Electricity Network Regulatory Frameworks, inquiry report no. 62, 2013, pp. 27–28.
7-54 Attachment 7 – Operating expenditure | Energex preliminary determination 2015–20
However, we cannot automatically assume the network businesses will respond to the
efficiency incentives.91 The businesses' objectives may not align with the incentives of
the regime.92 We undertake an assessment of whether the base year opex reasonably
reflects the opex criteria to determine if it is appropriate for us to rely on a business’
revealed costs to forecast future expenditure needs.
In recent years, we have expanded our regulatory toolkit to make greater use of
benchmarking, which is a way of determining how well a network business is
performing against its peers and over time, and provides valuable information on what
is ‘best practice’ (see Box 1). Benchmarking:
improves the effectiveness of the regulatory process by enhancing the information
available to us
gives us an alternative source of comparative information about the costs of
operating a business in the national electricity market to test the businesses’
proposals
allows us to gain some insight into whether or not there are material inefficiencies
in a business’ base opex and, therefore, represent a good basis for forecasting
future opex.
We use benchmarking to investigate whether an adjustment to base opex is required—
that is, we look for evidence of 'material inefficiencies' in a network business' base
opex. If the business is materially inefficient compared to its peers, the revealed cost
approach may not be appropriate.93 Reliance on historic costs in these circumstances
could yield an outcome inconsistent with the opex criteria and, more broadly, the NEO
and RPPs which give effect to incentive regulation.
91
The NER require us to be satisfied that a business’ total opex forecast reasonably reflects the expenditure criteria
(NER, cl. 6.5(c)). Further, we must consider the actual and expected expenditure of the service provider during
preceding regulatory control periods, and whether expenditure is consistent with our incentive schemes (NER,
cl. 6.5.6(e)(5) and (8)). 92
ACCC & Public Utility Research Centre University of Florida, Infrastructure regulation and market reform:
Principles and practice, May 1998, p. 39. 93
AER, Expenditure Forecast Assessment Guideline explanatory statement, 2013, p. 93.
7-55 Attachment 7 – Operating expenditure | Energex preliminary determination 2015–20
Box 1: AER benchmarking techniques
Benchmarking is just one way of assessing whether a business’ expenditure proposal is
efficient.94 We use multiple benchmarking techniques to inform our assessment of efficient opex.
This includes ‘economic benchmarking’, partial performance indicators and category-based
techniques. In addition, we undertake detailed reviews to investigate the drivers of, or potential
explanations for, high expenditure indicators.
Specifically, our consultant, Economic Insights used a stochastic frontier analysis (SFA) model
to estimate efficient base year opex and calculate the trend in opex going forward. Economic
Insights used two other econometric models as well as multilateral total factor productivity
(MTFP) and multilateral partial factor productivity (MPFP) indexes to cross-check the findings of
the SFA model. Further, Economic Insights used international data to improve the robustness
and precision of the models, but not to benchmark Australian networks against those operating
overseas.
Stochastic frontier analysis
SFA is an extended econometric method that can be used in cost benchmarking analysis. SFA
enables the estimation of a cost frontier, from which actual costs incurred by businesses can be
compared. SFA is similar to other econometric cost models in that it specifies a cost function
that relates costs to outputs, input prices, and environmental factors.
However, it differs from traditional econometric approaches in two main ways. First, SFA
focuses on estimating the cost frontier representing the minimum costs (‘best practice’) rather
than estimating the cost function representing the ‘average’ business. Second, SFA aims to
separate the presence of random statistical noise from the estimation of inefficiency. SFA also
has the advantage that it allows for economies and diseconomies of scale and can include
environmental factors.
A.2.4 Benchmarking is part of the regulatory framework
The NER has always required us to have regard to benchmark opex that would be
incurred by an efficient network business (cl. 6.5.6(e)(4)). The AEMC’s November 2012
network regulation rule changes promote the AER’s use of benchmarking for
assessing and determining opex forecasts. The new rules stipulate that the AER will
undertake and publish regular benchmarking reports, and that we must have regard to
these reports in assessing whether networks’ proposed opex forecasts reasonably
reflect the opex criteria. Further, the AEMC removed potential constraints in the NER
on the way the AER may use benchmarking.95
Benchmarking promotes the revenue and pricing principles (RPPs), which we are
required to take into account when making our decisions. The principles include that a
service provider should be provided with: (1) a reasonable opportunity to recover at
94
Productivity Commission, Electricity Network Regulatory Frameworks, inquiry report no. 62, 2013, p. 27. 95
AEMC, Rule Determination: Economic Regulation of Network Service Providers, November 2012.
7-56 Attachment 7 – Operating expenditure | Energex preliminary determination 2015–20
least its efficient costs; and (2) effective incentives to promote economic efficiency in
the provision of its direct control services.
First, benchmarking allows us to more accurately assess whether networks’ proposed
opex forecasts are efficient. It gives us an additional source of evidence about the
networks’ performance. Indeed, the AEMC considered that benchmarking is a critical
exercise in assessing the efficient costs of a network business and approving its opex
forecast.96
Our use of benchmarking may mean we forecast a business' future opex requirements
at a lower level compared to its historical costs to reflect the opex criteria. A prudent
operator would not discount the possibility that we could better detect inefficient costs
over time. Each network knows that their revenue allowance may be reduced if it is
shown that other networks are operating more efficiently.
The revenue allowance determined by the AER does not set a business' actual
operating budget. We predict the operating expenditure required for each network
business acting as a prudent operator, incurring efficient costs. The business should
attempt to outperform it. The business is expected to organise itself efficiently to make
the most efficient use of its resources.97 Management should attempt to minimise costs
in an effort to maximise shareholder value.
That is, a prudent operator is expected to respond to the incentives of the regime—
consistent with the NEO and competitive market outcomes.98 The incentive regime is
designed to provide the impetus for the business to deliver safe, reliable and secure
services to its customers.
Second, energy regulation in Australia is intended to be incentive-based where
possible. Benchmarking strengthens incentives for network businesses to minimise
costs—it creates effective incentives to promote: efficient investment, the efficient
provision of services and the efficient use of the distribution system, consistent with the
NEO.
Benchmarking creates a form of competitive pressure on the networks, whereby
information about the relative performance of a business can be an important incentive
for improvement.99 Benchmarking is widely used by private sector firms to identify
opportunities for operational efficiencies and other improvements.
96
AEMC, Rule Determination: Economic Regulation of Network Service Providers, November 2012, p. 112. 97
Productivity Commission, Electricity Network Regulatory Frameworks, inquiry report no. 62, 2013, pp. 170–171. 98
In a competitive market environment, various forces keep managers from deviating from profit-maximising
objectives behaviour. If a competitive business is run inefficiently and unprofitably, it could be driven out of
business or taken over by rivals/new entrants that do maximise profits. Managers who lose their jobs in these
circumstances can find it difficult to obtain new jobs. Incentives such as stock ownership and other performance
bonuses also motivate managers to maximise profits. 99
AER, Expenditure Forecast Assessment Guideline explanatory statement, 2013, p. 42.
7-57 Attachment 7 – Operating expenditure | Energex preliminary determination 2015–20
A.2.5 Benchmarking is a common regulatory tool
The use of benchmarking in economic regulation of energy networks is well-
established. The AER/ACCC undertook two studies in 2012 on how benchmarking is
applied around the world. These studies cover the key methods, relevant literature and
regulatory practices, as well as the major technical and implementation issues in
benchmarking energy networks.100101 The studies carefully list the advantages and
disadvantages of each benchmarking method in the context of energy network
regulation. We also commissioned a thorough analysis of benchmarking approaches in
some European countries.102
The Productivity Commission found utility regulators around the world use static (and
dynamic) benchmarking to encourage regulated businesses to achieve the long-run
efficiency outcomes of decentralised, workably competitive, markets.103 Benchmarking
has been used by:
Australian regulators, including state based electricity regulators and the AER
international regulators such as OFGEM (United Kingdom), CER (Ireland), NZCC
(New Zealand), and OEB (Ontario Canada)
various academics in the Australian, European, American and other contexts.104
Unlike some industries, electricity network distribution businesses are good candidates
for benchmarking opex. All network businesses use a similar set of assets, such as
poles, wires, transformers and cables, to provide network services to customers.
Indeed, Bain & Company states '… in some ways, utilities are one of the most
straightforward industries to benchmark because they perform essentially the same
tasks wherever they are.'105
This commonality means that economic benchmarking of costs can be used to
measure the economic efficiency of a network business by comparing its performance
not only to other businesses, but also to its own past performance.106 Historically,
electricity distribution has exhibited low technology change in comparison to, for
example, communications where the pace of technology change is more dynamic.107
However, it is important to recognise that network businesses do not operate under
exactly the same operating environment conditions. Further, distribution businesses
100
ACCC/AER, Benchmarking Opex and Capex in Energy Networks, ACCC/AER Working Paper no. 6, May 2012. 101
ACCC/AER, Regulatory Practices in Other Countries: Benchmarking Opex and Capex in Energy Networks, May
2012. 102
Schweinsberg, Stronzik, and Wissner, Cost Benchmarking in Energy Regulation in European Countries, Wik
Consult, December 2011. 103
Productivity Commission, Electricity Network Regulatory Frameworks, inquiry report no. 62, 2013, p. 148. 104
Productivity Commission, Electricity Network Regulatory Frameworks, inquiry report no. 62, 2013, p. 148. 105
Bain & Company, Sustained cost reduction for utilities, 2013, p. 2. 106
AER, Expenditure Forecast Assessment Guideline explanatory statement, 2013, p. 132. 107
Coelli, Estache, Perelman, Trujillo, A Primer on Efficiency Measurement for Utilities and Transport Regulators,
2003, p. 11.

7-58 Attachment 7 – Operating expenditure | Energex preliminary determination 2015–20
can vary in the scope of electricity distribution services they provide. Benchmarking
needs to properly account for these differences so that when comparisons are made
across networks, we are comparing ‘like-with-like’ to the greatest extent possible.108 As
stated by the AEMC:
... when undertaking a benchmarking exercise, circumstances exogenous to a
NSP should generally be taken into account, and endogenous circumstances
should generally not be considered. In respect of each NSP, the AER must
exercise its judgement as to the circumstances which should or should not be
included.
…
If there are some exogenous factors that the AER has difficulty taking adequate
account of when undertaking benchmarking, then the use to which it puts the
results and the weight it attaches the results can reflect the confidence it has in
the robustness of its analysis.
Our benchmarking models account for key differences in operating environment factors
(section A.6). This is followed by our review of a large set of operating environment
factors to determine whether it is necessary to provide further allowance for operating
environment differences.
We undertook an extensive research and consultation process to develop the
benchmarking used in the annual benchmarking report and in the determinations. This
has been in conjunction with Economic Insights, which is an internationally recognised
expert consultant on benchmarking. As discussed in section A.3, we released a
significant benchmarking study in 2012 and consulted heavily on both the Guideline
(including through an issues paper, draft guideline and workshops) and regulatory
information notices. We have further developed our benchmarking models through this
determination process.
108
AER, Expenditure Forecast Assessment Guideline explanatory statement, 2013, p. 132.
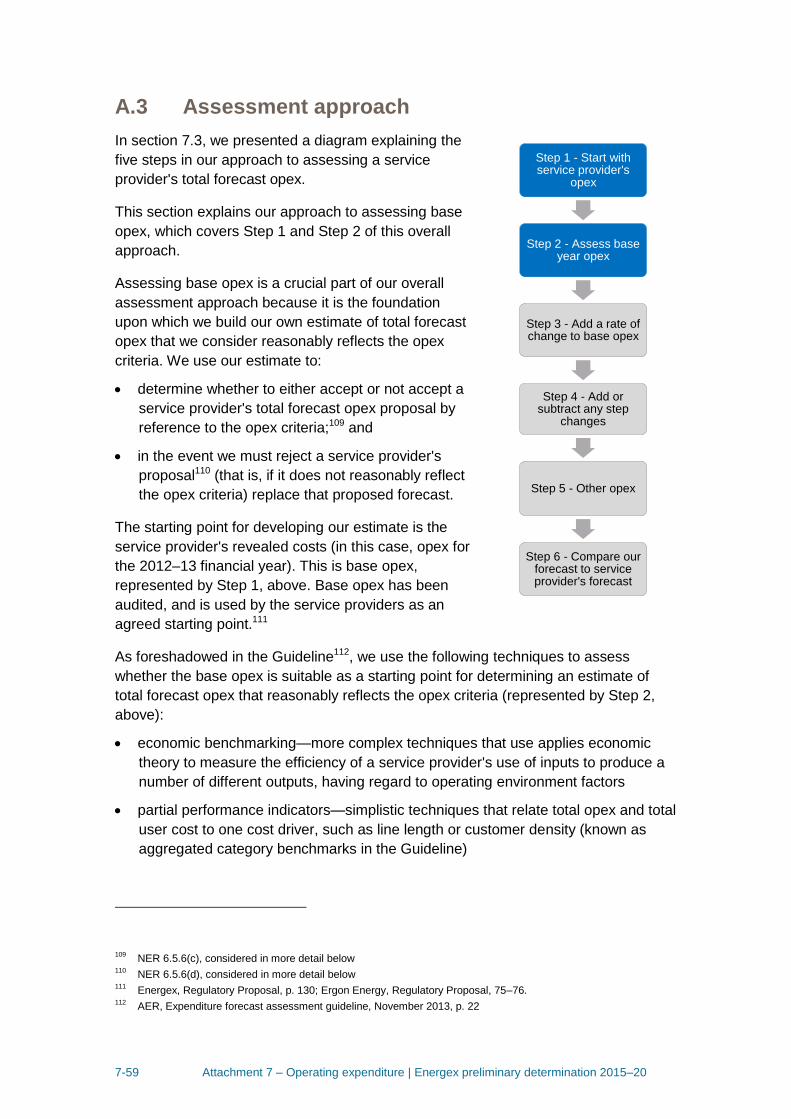
7-59 Attachment 7 – Operating expenditure | Energex preliminary determination 2015–20
A.3 Assessment approach
In section 7.3, we presented a diagram explaining the
five steps in our approach to assessing a service
provider's total forecast opex.
This section explains our approach to assessing base
opex, which covers Step 1 and Step 2 of this overall
approach.
Assessing base opex is a crucial part of our overall
assessment approach because it is the foundation
upon which we build our own estimate of total forecast
opex that we consider reasonably reflects the opex
criteria. We use our estimate to:
determine whether to either accept or not accept a
service provider's total forecast opex proposal by
reference to the opex criteria;109 and
in the event we must reject a service provider's
proposal110 (that is, if it does not reasonably reflect
the opex criteria) replace that proposed forecast.
The starting point for developing our estimate is the
service provider's revealed costs (in this case, opex for
the 2012–13 financial year). This is base opex,
represented by Step 1, above. Base opex has been
audited, and is used by the service providers as an
agreed starting point.111
As foreshadowed in the Guideline112, we use the following techniques to assess
whether the base opex is suitable as a starting point for determining an estimate of
total forecast opex that reasonably reflects the opex criteria (represented by Step 2,
above):
economic benchmarking—more complex techniques that use applies economic
theory to measure the efficiency of a service provider's use of inputs to produce a
number of different outputs, having regard to operating environment factors
partial performance indicators—simplistic techniques that relate total opex and total
user cost to one cost driver, such as line length or customer density (known as
aggregated category benchmarks in the Guideline)
109
NER 6.5.6(c), considered in more detail below 110
NER 6.5.6(d), considered in more detail below 111
Energex, Regulatory Proposal, p. 130; Ergon Energy, Regulatory Proposal, 75–76. 112
AER, Expenditure forecast assessment guideline, November 2013, p. 22
Step 1 - Start with service provider's
opex
Step 2 - Assess base year opex
Step 3 - Add a rate of change to base opex
Step 4 - Add or subtract any step
changes
Step 5 - Other opex
Step 6 - Compare our forecast to service provider's forecast

7-60 Attachment 7 – Operating expenditure | Energex preliminary determination 2015–20
category analysis—that compares, across service providers, the cost of delivering a
particular category of opex (such as maintenance, vegetation management, etc.) to
identify areas for detailed review
detailed review—targeted, qualitative, examination of particular categories of
expenditure, such as labour costs and vegetation management, conducted with the
assistance of industry experts.
Benchmarking is particularly important in Step 2 of our approach because it enables us
to compare the relative efficiency of the total opex of different service providers.113 The
NER give us discretion as to how we use benchmarking in our assessment.114
As part of our application of economic benchmarking, we consider differences in
service providers' operating environments that could account for some differences in
the relative efficiency scores. Based on this review we make appropriate adjustments
to efficiency scores.
We have a preferred benchmarking model, which is Cobb Douglas stochastic frontier
analysis (SFA).115 This model creates an efficiency score for all service providers in the
NEM. In the event we make an adjustment to base opex, we use this model as the
starting point.
If a service provider performs well on our economic benchmarking techniques, we
consider it is unnecessary for us to review base opex in further detail. No adjustment is
required because we consider the service provider's base opex is not materially
inefficient and, therefore, an appropriate starting point for our estimate of total forecast
opex that reasonably reflects the opex criteria. Conversely, if our economic
benchmarking techniques indicate that a service provider's opex is not efficient, we
then review base opex in further detail and consider whether it is necessary to adjust
base opex.
Theoretically, all service providers who rank below the service provider with the highest
efficiency score on our preferred technique could be considered inefficient. If we
decided to apply benchmarking deterministically, we could simply determine the
degree of a service provider's inefficiency against the efficiency score of the most
efficient service provider and adjust their opex accordingly.
However, we are not applying benchmarking deterministically. As we demonstrate in
the diagram below, we have regard to a number of sources of evidence in forming a
view on base opex efficiency, consistent with the approach we outlined in the
Guideline. If it is clear that base opex is inefficient, we depart from revealed costs.
When we do so, we rely on the most robust benchmarking model as the basis for
adjustment.
113
AEMC, Final Rule Determination: National Electricity Amendment (Economic Regulation of Network Service
Providers) Rule 2012, 29 November 2012, p. 97. 114
AEMC, Final Rule Determination, 29 November 2012, pp. 112–113. 115
Economic Insights, 2014, p. iv.
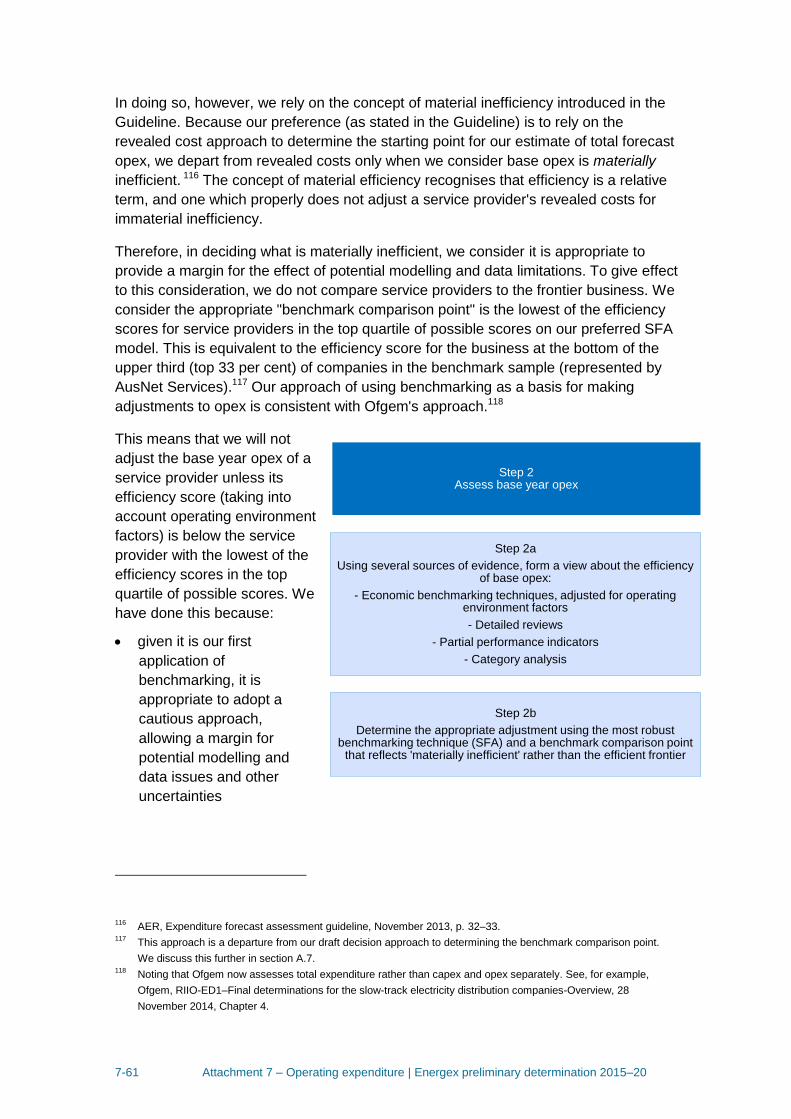
7-61 Attachment 7 – Operating expenditure | Energex preliminary determination 2015–20
In doing so, however, we rely on the concept of material inefficiency introduced in the
Guideline. Because our preference (as stated in the Guideline) is to rely on the
revealed cost approach to determine the starting point for our estimate of total forecast
opex, we depart from revealed costs only when we consider base opex is materially
inefficient. 116 The concept of material efficiency recognises that efficiency is a relative
term, and one which properly does not adjust a service provider's revealed costs for
immaterial inefficiency.
Therefore, in deciding what is materially inefficient, we consider it is appropriate to
provide a margin for the effect of potential modelling and data limitations. To give effect
to this consideration, we do not compare service providers to the frontier business. We
consider the appropriate "benchmark comparison point" is the lowest of the efficiency
scores for service providers in the top quartile of possible scores on our preferred SFA
model. This is equivalent to the efficiency score for the business at the bottom of the
upper third (top 33 per cent) of companies in the benchmark sample (represented by
AusNet Services).117 Our approach of using benchmarking as a basis for making
adjustments to opex is consistent with Ofgem's approach.118
This means that we will not
adjust the base year opex of a
service provider unless its
efficiency score (taking into
account operating environment
factors) is below the service
provider with the lowest of the
efficiency scores in the top
quartile of possible scores. We
have done this because:
given it is our first
application of
benchmarking, it is
appropriate to adopt a
cautious approach,
allowing a margin for
potential modelling and
data issues and other
uncertainties
116
AER, Expenditure forecast assessment guideline, November 2013, p. 32–33. 117
This approach is a departure from our draft decision approach to determining the benchmark comparison point.
We discuss this further in section A.7. 118
Noting that Ofgem now assesses total expenditure rather than capex and opex separately. See, for example,
Ofgem, RIIO-ED1–Final determinations for the slow-track electricity distribution companies-Overview, 28
November 2014, Chapter 4.
Step 2 Assess base year opex
Step 2a
Using several sources of evidence, form a view about the efficiency of base opex:
- Economic benchmarking techniques, adjusted for operating environment factors
- Detailed reviews
- Partial performance indicators
- Category analysis
Step 2b
Determine the appropriate adjustment using the most robust benchmarking technique (SFA) and a benchmark comparison point
that reflects 'materially inefficient' rather than the efficient frontier
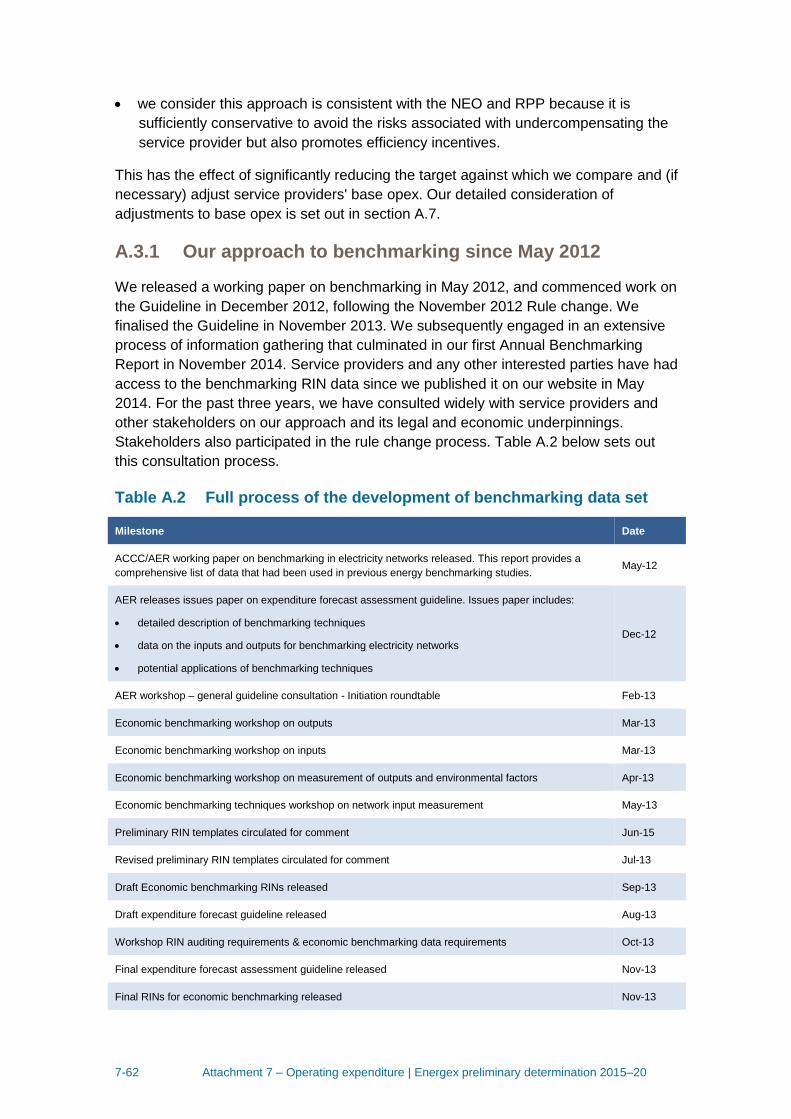
7-62 Attachment 7 – Operating expenditure | Energex preliminary determination 2015–20
we consider this approach is consistent with the NEO and RPP because it is
sufficiently conservative to avoid the risks associated with undercompensating the
service provider but also promotes efficiency incentives.
This has the effect of significantly reducing the target against which we compare and (if
necessary) adjust service providers' base opex. Our detailed consideration of
adjustments to base opex is set out in section A.7.
A.3.1 Our approach to benchmarking since May 2012
We released a working paper on benchmarking in May 2012, and commenced work on
the Guideline in December 2012, following the November 2012 Rule change. We
finalised the Guideline in November 2013. We subsequently engaged in an extensive
process of information gathering that culminated in our first Annual Benchmarking
Report in November 2014. Service providers and any other interested parties have had
access to the benchmarking RIN data since we published it on our website in May
2014. For the past three years, we have consulted widely with service providers and
other stakeholders on our approach and its legal and economic underpinnings.
Stakeholders also participated in the rule change process. Table A.2 below sets out
this consultation process.
Table A.2 Full process of the development of benchmarking data set
Milestone Date
ACCC/AER working paper on benchmarking in electricity networks released. This report provides a
comprehensive list of data that had been used in previous energy benchmarking studies. May-12
AER releases issues paper on expenditure forecast assessment guideline. Issues paper includes:
detailed description of benchmarking techniques
data on the inputs and outputs for benchmarking electricity networks
potential applications of benchmarking techniques
Dec-12
AER workshop – general guideline consultation - Initiation roundtable Feb-13
Economic benchmarking workshop on outputs Mar-13
Economic benchmarking workshop on inputs Mar-13
Economic benchmarking workshop on measurement of outputs and environmental factors Apr-13
Economic benchmarking techniques workshop on network input measurement May-13
Preliminary RIN templates circulated for comment Jun-15
Revised preliminary RIN templates circulated for comment Jul-13
Draft Economic benchmarking RINs released Sep-13
Draft expenditure forecast guideline released Aug-13
Workshop RIN auditing requirements & economic benchmarking data requirements Oct-13
Final expenditure forecast assessment guideline released Nov-13
Final RINs for economic benchmarking released Nov-13
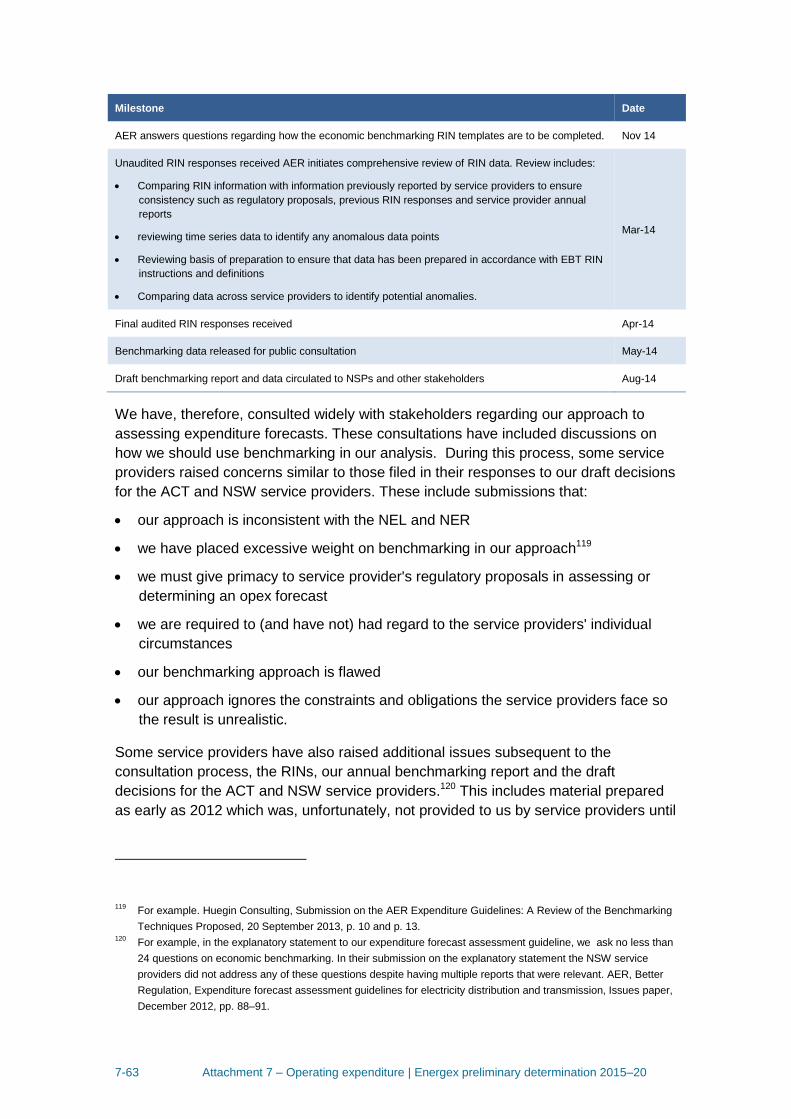
7-63 Attachment 7 – Operating expenditure | Energex preliminary determination 2015–20
Milestone Date
AER answers questions regarding how the economic benchmarking RIN templates are to be completed. Nov 14
Unaudited RIN responses received AER initiates comprehensive review of RIN data. Review includes:
Comparing RIN information with information previously reported by service providers to ensure
consistency such as regulatory proposals, previous RIN responses and service provider annual
reports
reviewing time series data to identify any anomalous data points
Reviewing basis of preparation to ensure that data has been prepared in accordance with EBT RIN
instructions and definitions
Comparing data across service providers to identify potential anomalies.
Mar-14
Final audited RIN responses received Apr-14
Benchmarking data released for public consultation May-14
Draft benchmarking report and data circulated to NSPs and other stakeholders Aug-14
We have, therefore, consulted widely with stakeholders regarding our approach to
assessing expenditure forecasts. These consultations have included discussions on
how we should use benchmarking in our analysis. During this process, some service
providers raised concerns similar to those filed in their responses to our draft decisions
for the ACT and NSW service providers. These include submissions that:
our approach is inconsistent with the NEL and NER
we have placed excessive weight on benchmarking in our approach119
we must give primacy to service provider's regulatory proposals in assessing or
determining an opex forecast
we are required to (and have not) had regard to the service providers' individual
circumstances
our benchmarking approach is flawed
our approach ignores the constraints and obligations the service providers face so
the result is unrealistic.
Some service providers have also raised additional issues subsequent to the
consultation process, the RINs, our annual benchmarking report and the draft
decisions for the ACT and NSW service providers.120 This includes material prepared
as early as 2012 which was, unfortunately, not provided to us by service providers until
119
For example. Huegin Consulting, Submission on the AER Expenditure Guidelines: A Review of the Benchmarking
Techniques Proposed, 20 September 2013, p. 10 and p. 13. 120
For example, in the explanatory statement to our expenditure forecast assessment guideline, we ask no less than
24 questions on economic benchmarking. In their submission on the explanatory statement the NSW service
providers did not address any of these questions despite having multiple reports that were relevant. AER, Better
Regulation, Expenditure forecast assessment guidelines for electricity distribution and transmission, Issues paper,
December 2012, pp. 88–91.

7-64 Attachment 7 – Operating expenditure | Energex preliminary determination 2015–20
after we had published our draft decisions for the ACT and NSW service providers.121
Issues raised in this material include:
the sensitivity of data envelopment analysis to input and output specifications and
sample size
there is additional benchmarking data and variables that should be considered by
us in making our assessments.
We acknowledge that many aspects of our decision making relate to forward looking,
technical and difficult matters, on which reasonable minds can differ. However, it is
important to distinguish different decisions which we potentially could have made in
exercising our discretion from a substantive reason why our decision is or would be
unreasonable or incorrect. As the Tribunal has noted:122
It is axiomatic that there will be no one correct or best figure derived from a forecast that in terms of cl 6.5.6(c) ‘reasonably reflects’ the opex criteria – the very nature of forecasting means that there can be no one absolute or perfect figure. Different forecasting methods are more likely than not to produce different results. Simply because there is a range of forecasts and a distributor’s forecast falls within the range does not mean it must be accepted when, as here, the AER has sound reason for rejecting the forecast.
We have had careful regard to the new submissions and concerns raised by service
providers. We encourage all stakeholders to actively, transparently and cooperatively
participate in our consultation processes as that assists all stakeholders in delivering
the best outcomes in accordance with the legislative framework.
A.3.2 How our approach is consistent with NER requirements
We consider that our assessment approach is consistent with the requirements of the
NER. That is, we consider that our approach to assessing and, if required, substituting
a service provider's proposal is consistent with:
the opex criteria123
the opex objectives
the opex factors
the revenue and pricing principles.
Fundamentally, we consider that our decision is likely to contribute to the achievement
of the NEO by incentivising and funding efficient, prudent and realistic expenditures.
We take this view because our approach:
121
For example: Evans & Peck, Review of factors contributing to variations in operating and capital costs structures
of Australia distributors, Final Report, November 2012; Huegin Consulting , Distribution benchmarking study, 2012 122
Application by Ergon Energy Corporation Limited (Labour Cost Escalators) (No 3) [2010] ACompT 11 at [69] 123
The opex criteria broadly reflect the NEO as noted by the AEMC, Final Rule Determination: National Electricity
Amendment (Economic Regulation of Network Service Providers) Rule 2012, 29 November 2012, p. 113.

7-65 Attachment 7 – Operating expenditure | Energex preliminary determination 2015–20
ensures that the opex forecast reasonably reflects the efficient costs a prudent
service provider requires to safely and reliably provide electricity services; and
encourages service providers to efficiently invest and operate electricity services,
by ensuring that service providers (and not consumers) bear the cost of
expenditure in excess of prudent and efficient .124
Incentives can only be effective if the service providers, rather than consumers, bear
the burden of funding spending that does not reasonably reflect the opex criteria.
Opex criteria
The opex criteria in clause 6.5.6(c) of the NER require the AER to assess a service
provider's proposal to decide whether it reasonably reflects:
the efficient costs of achieving the operating expenditure objectives;
the costs that a prudent operator would require to achieve the operating
expenditure objectives; and
a realistic expectation of the demand forecast and cost inputs required to achieve
the operating expenditure objectives.
We consider that the opex criteria work together as a single overall requirement.125
Prudency and efficiency are complementary.126 The Australian Competition Tribunal
refers to them as a unified concept, and has described them as a single “prudent and
efficient requirement".127
In turn, "prudent and efficient" costs can only be sensibly given meaning by reference
to the demand forecast for the services the service provider provides and the realistic
cost inputs that a prudent and efficient provider would require to achieve its opex
objectives. When we refer to prudent and efficient costs, we mean costs that a prudent
and efficient provider would require, having regard to realistic expectations of cost
inputs and the demand forecast to achieve its objectives.
Importantly, the demand forecast and cost inputs are for those of a prudent and
efficient service provider operating that network. They are not the cost inputs which
125
The Tribunal has applied the term in this fashion in at least the following matters: Application by Ergon Energy
Corporation Limited (Non-system property capital expenditure) (No 4) [2010] ACompT 12; Application by
EnergyAustralia and Others [2009] ACompT 8; Application by Ergon Energy Corporation Limited (Labour Cost
Escalators) (No 3) [2010] ACompT 11; Application by DBNGP (WA) Transmission Pty Ltd (No 3) [2012] ACompT
14; Application by United Energy Distribution Pty Limited [2012] ACompT 1; Re: Application by ElectraNet Pty
Limited (No 3) [2008] ACompT 3 ; Application by DBNGP (WA) Transmission Pty Ltd [2012] ACompT 6 126
AEMC, Draft rule determination: National Electricity Amendment (Economic Regulation of Network Service
Providers) Rule 2012, p. 76. 127
Application by ElectraNet Pty Limited (No 3) [2008] ACompT 3 at 199; Application by EnergyAustralia and Others
[2009] ACompT 8 at 141, citing reports prepared by service providers and the NER from 2008.
7-66 Attachment 7 – Operating expenditure | Energex preliminary determination 2015–20
result from previous inefficient decision making. This does not mean that we do not
take account of circumstances or factors which are beyond the control of a service
provider when making our assessment.
It is inherent in the opex criteria, each criterion being concerned with the costs of
achieving the opex objectives, that we must have regard to an objective prudent and
efficient service provider. However, in doing so, we must also have regard to the
differing exogenous circumstances of the service provider we are assessing when
making our decisions. This includes costs that arise due to the individual
circumstances affecting the manner in which the service provider operates, but over
which it does not have control. Such circumstances include geographic factors,
customer factors, network factors and jurisdictional factors.128
However, the costs that reasonably reflect the opex criteria do not include costs that
result from prior inefficient or imprudent spending. These costs may relate to the
quality of management or financial decisions. Such factors are within a service
provider's control and are inconsistent with costs that a prudent and efficient service
provider would incur. This remains the case where a service provider has used
revenue recovered by consumers in previous regulatory periods, consistent with our
previous decisions, to make such decisions. This view is consistent with the incentive
based aims of the regulatory scheme when read as a whole.
It is also consistent with the rationale provided by the AEMC for removing the phrase
"individual circumstances" from the opex criteria.129 Accordingly, we disagree with an
interpretation of the opex criteria that a forecast which reflects a "realistic expectation
of cost inputs" must take account of past discretionary decisions made by a service
provider that bind the service provider, but do not reflect the efficient costs that an
objectively prudent operator would incur. This is the case even if, as discussed below,
those costs are contractually fixed.
Our approach also satisfies the requirement in the opex criteria that we determine a
total forecast opex.130 We are not required to assess individual projects or components
of a forecast because such an approach would de-incentivise efficient and prudent
discretionary spending and would effectively result in a cost of service regime.131
The total forecast opex is forward looking and directed towards the requirements of an
objectively efficient and prudent operator in the future, which will then be funded by
consumers through the building block revenue model established under the NER.
128
AEMC, Final Rule Determination: National Electricity Amendment (Economic Regulation of Network Service
Providers) Rule 2012, 29 November 2012, p. 113. See also pp. viii, 25, 98, 107–108. 129
AEMC, Final Rule Determination: National Electricity Amendment (Economic Regulation of Network Service
Providers) Rule 2012, 29 November 2012, pp 107, 113. 130
NER, cl. 6.5.6(a). 131
AEMC, National Electricity Amendment (Economic Regulation of Network Service Providers) Rule 2012 No.9 at
93.
7-67 Attachment 7 – Operating expenditure | Energex preliminary determination 2015–20
We must estimate a total forecast which we are satisfied reasonably reflects the opex
criteria. We use this estimate as a comparator for the service provider's proposal and
as a substitute if required. As the AEMC and the Tribunal have identified, the NER
gives us broad discretion in how we perform this task.132
In this context, we take the view that the opex criteria should be understood as
applying an objective test—albeit a test that applies to a particular network and must
therefore incorporate certain individual circumstances of that network. The intention
behind the regulatory regime is to determine an objective forecast for the operating
costs of the network that should be funded by consumers. If a service provider can
better this forecast in its actual spending it is rewarded with the cost savings. If it
overspends the forecast it bears the costs.
We therefore consider that an appropriate application of the opex criteria involves us
making an assessment about what objectively would be:
the efficient costs of achieving the opex objectives, rather than the actual costs a
service provider has spent or intends to spend
the costs that a prudent service provider for that network would require (rather than
the actual costs the actual service provider in question intends or is contractually
obliged to provide given all their circumstances and past decision making)
a realistic expectation of the demand forecast (rather than the service provider's
own demand forecast) and
a realistic expectation of the cost inputs to achieve the objectives (not the actual
cost inputs that the provider might incur, or have committed itself to spend money
on, to achieve the opex objectives).
It follows, as the Tribunal has noted, there is unlikely ever to be one unique "correct"
total forecast. Reasonable minds may differ as to the data and techniques.133 The
AEMC has also recognised this.134 We expect and observe service providers and their
consultants to disagree with aspects of our decision.
Opex objectives
Our assessment approach ascertains the total forecast opex for a prudent and efficient
service provider, informed by a realistic expectation of the demand forecast and cost
inputs, to achieve the opex objectives. One of these objectives is the applicable
'regulatory obligations or requirements' that the service provider must meet that are
associated with the provision of standard control services.135 Service providers are also
132
AEMC, Final Rule Determination: National Electricity Amendment (Economic Regulation of Network Service
Providers) Rule 2012, 29 November 2012, pp. 165. 133
Application by Envestra Limited (No 2) [2012] ACompT 3 at [146] , approved of in Application by APA GasNet
Australia (Operations) Pty Limited (No 2) [2013] ACompT 8 at [232]. 134
AEMC, Economic Regulation of Transmission Services, Rule Determination, 16 November 2006 at 50, 52, 53 135
NER, cl. 6.5.6(1).
7-68 Attachment 7 – Operating expenditure | Energex preliminary determination 2015–20
expected to comply with regulatory obligations under the RPP in the NEL.136 The other
opex objectives relate to safety, demand and, to the extent they are not regulatory
obligations, reliability and security levels.
In acting to fulfil the opex objectives and having regard to the RPP, we therefore have
close regard to the definition of ‘regulatory obligation or requirement’ in the NEL.137
This definition is exhaustive. That is, only matters within the terms of the definition
constitute 'regulatory obligations or requirements'.
To fall within the NEL definition, a regulatory obligation or requirement must be
attributable to one of the following categories:
distribution system safety duties
distribution reliability standards
distribution service standards
obligations under the NEL, NER, NERL and NERR
obligations under legislation in a participating jurisdiction levying tax, regulating the
use of land or protecting the environment
an Act or instrument of a participating jurisdiction that materially affects the
provision of electricity network services.
A participating jurisdiction is defined as a jurisdiction which has, in force, a version of
the NEL.138
Accordingly, it is clear that the definition of 'regulatory obligations or requirements' is
limited in application.139 We have assessed claims by service providers in a manner
consistent with this definition and our draft decision for the ACT and NSW service
providers. Because this definition in the NEL is limited to the matters set out above, we
do not consider that the following constitute 'regulatory obligations or requirements' as
defined in the NEL:140
obligations at common law, tort and contract (such as common law duties of care in
negligence)
obligations to comply with legislation that is not from a participating jurisdiction
obligations to comply with legislation that is from a participating jurisdiction, but
which does not fall into the categories identified in the definition in the NEL.
136
NEL, s. 7A(2)(b). 137
NER chapter 10, definition of 'regulatory obligation or requirement' and NEL, s2D. 138
NEL, s. 5. This means that only jurisdictions which have passed a version of the NEL are participating jurisdictions. 139
See Second reading speech, National Electricity (South Australia) (NEL -Miscellaneous Amendments) Bill 1996,
p. 6. 140
Although these obligations may be informed by other requirements that do meet the definition.
7-69 Attachment 7 – Operating expenditure | Energex preliminary determination 2015–20
For example, all legal persons (including corporations such as service providers) are
required to comply with the requirements of the Australian Consumer Law.141 These
requirements are imposed by participating jurisdictions as well as by the
Commonwealth. However, they do not fall into the NEL definition outlined above.
We therefore disagree with submissions which assert that a variety of requirements are
'regulatory obligations or requirements' under the NEL. For example, 'laws of general
application to corporations and individuals, such as the Competition and Consumer
Act, Corporations Act, Privacy Act, intellectual property legislation or motor traffic
legislation'142 are not 'regulatory obligations or requirements'.
It is unclear whether or not these submissions consider obligations to comply with laws
of general application fall within the categories defined in the NEL. Regardless, for the
reasons set out above, we do not consider that any of these obligations are a
'regulatory obligation or requirement' within the meaning of section 2D (and, by
extension, section 5) of the NEL.
We also disagree with the service providers' submissions that compliance with the
terms of their own EBAs143 is a 'regulatory obligation or requirement'. For example,
service providers have referred to redundancy costs 'required to be paid as a
regulatory obligation'.144
First, of the six possible (and exhaustive) categories of obligations or requirements
mentioned above, EBAs could conceivably only fall with an Act or instrument made or
issued that 'materially affects a service provider's provision of electricity network
services'. This is because the terms of an EBA could plausibly materially affect a
service provider's provision of standard control services. However, that Act or
instrument must be made by a 'participating jurisdiction'. Given a participating
jurisdiction must have passed a version of the NEL, an EBA made under the
Commonwealth's Fair Work Act 2009 appears to be imposed by a law other than of a
participating jurisdiction.145 Further, the terms of an EBA itself are not contained in the
Fair Work Act 2009.
Second, the consequences of breaching the Fair Work Act 2009 are a separate and
narrower subset of the potential consequences of a service provider breaching its EBA.
141
Schedule 2 to the Competition and Consumer Act 2010 (Cth), various equivalents in state legislation identical
terms. 142
ActewAGL Revised proposal at 2, 4. 143
Pursuant to the Fair Work Act 2009 (Cth). 144
Implied by Ergon Energy, Submission on the Draft Decisions: NSW and ACT distribution determinations 2015–16
to 2018–19 , 13 February 2015, pp. 32–34. 145
The Commonwealth has not passed a version of the NEL so it is not a participating jurisdiction for the purposes of
section 5 (and hence, section 2D) of the NEL. Commonwealth laws are 'regulatory obligations or requirements' if
they fall within section 2D(1)(a). These relate to safety duties, reliability and service standards. However,
commonwealth laws that fall within section 2D(1)(b), insofar as it refers to a 'participating jurisdiction', do not.
7-70 Attachment 7 – Operating expenditure | Energex preliminary determination 2015–20
Third, we consider that the interpretation advocated by submissions is contrary to the
requirement in clause 6.5.6(a) for a proposal to include the total forecast opex for a
regulatory control period. It is important to note that when we determine total forecast
opex, we do so within an overall incentive framework that requires the service provider
to decide how to spend its allowed revenue requirement. As we mention above, a
requirement that we consider the terms of EBAs when forming a view on total forecast
opex would be more akin to a cost of service regime than an incentive regime.
Fourth, we note that while contractual or other obligations which do not fall within the
definition are not regulatory obligations or requirements so defined, a service provider
can still direct the revenue it recovers from customers (or from other sources) to
comply with such obligations. The costs of compliance with obligations that are not
within the definition of 'regulatory obligation or requirement' are treated like any other
costs a service provider incurs.
Service providers have broad discretion about the contractual arrangements they enter
into, and often have discretion about the manner in which they carry out their legal
obligations. This discretion often includes whether to enter into particular legal
obligations, such as employment contracts or arrangements with contractors.
We do not seek to interfere in the discretion a service provider has as to how and when
to spend its total opex forecast to run its network. The service provider is free to decide
how to manage its activities in light of the revenue recovered from consumers that we
approve. Equally, the service provider bears the consequence of imprudent or
inefficient decisions, including those relating to cost inputs or its response to demand
forecasts. When a service provider enters into an agreement of any kind, it does so in
the full knowledge that the forecast will apply for five years, without any guarantee that
the same or a similar forecast will be approved for the following five year period.
As the AEMC notes, this underpins the incentive properties of the regulatory regime:146
The level, rather than the specific contents, of the approved expenditure allowances underpin the incentive properties of the regulatory regime in the NEM. That is, once a level of expenditure is set, it is locked in for a period of time, and it is up to the NSP to carry out its functions as it sees fit, subject to any service standards.
Accordingly, where a service provider has entered into an EBA which requires it to
incur expenditure that, objectively, would be viewed as inefficient or imprudent or
involving cost inputs that an objectively prudent provider would not be realistically
expected to incur, it is for the service provider to bear the costs of its decisions.
Once we determine the opex forecast we are satisfied reasonably reflects the opex
criteria, it is for a service provider to manage its business as it sees fit. It is for the
service provider to decide whether or not to fund particular projects, strategies or
146
AEMC, Final Rule Determination: National Electricity Amendment (Economic Regulation of Network Service
Providers) Rule 2012, 29 November 2012, p. 93.
7-71 Attachment 7 – Operating expenditure | Energex preliminary determination 2015–20
commitments to meet the demand for standard control services, comply with regulatory
obligations and maintain safety and reliability. Our role is not to dictate how service
providers spend money to comply with their broader obligations. We fund service
providers so that if they are efficient and prudent, they will have sufficient opex to
achieve the objectives.
Opex factors
We must take the opex factors into account in making our assessment of whether a
service provider's proposed forecast reasonably reflects the opex criteria. In this way,
they function similarly to the revenue and pricing principles. That is, they require us to
have regard to matters, but give us discretion as to the weight we should apply to
each.147
Our approach has regard to each of the opex factors set out below:
the most recent annual benchmarking report that has been published under clause
6.27 and the benchmark operating expenditure that would be incurred by an
efficient distribution network service provider over the relevant regulatory control
period
the actual and expected operating expenditure of the distribution network service
provider during any preceding regulatory control periods
the extent to which the operating expenditure forecast includes expenditure to
address the concerns of electricity consumers as identified by the distribution
network service provider in the course of its engagement with electricity consumers
the relative prices of operating and capital inputs
the substitution possibilities between operating and capital expenditure
whether the operating expenditure forecast is consistent with any incentive scheme
or schemes that apply to the distribution network service provider under clauses
6.5.8 or 6.6.2 to 6.6.4
the extent the operating expenditure forecast is referable to arrangements with a
person other than the distribution network service provider that, in our opinion, do
not reflect arm’s length terms
whether the operating expenditure forecast includes an amount relating to a project
that should more appropriately be included as a contingent project under clause
6.6A.1(b)
the extent to which the distribution network service provider has considered and
made provision for efficient and prudent non-network alternatives
147
AEMC, Final Rule Determination: National Electricity Amendment (Economic Regulation of Network Service
Providers) Rule 2012, 29 November 2012, pp. 101.
7-72 Attachment 7 – Operating expenditure | Energex preliminary determination 2015–20
any relevant final project assessment conclusions report published under
5.17.4(o),(p) or (s)
any other factor we consider relevant and which we have notified the distribution
network service provider in writing, prior to the submission of its revised regulatory
proposal under clause 6.10.3, is an operating expenditure factor.
However, for assessing base opex, we have exercised our discretion to emphasise the
following factors specified in clause 6.5.6(e):
the benchmark opex that would be incurred by an efficient service provider—we
have had regard to the analysis and techniques used in our recent annual
benchmarking report but we have also used other techniques in addition to those
discussed in that document
recent operating expenditure—we use the operating expenditure of the service
provider in previous periods, particularly the most recent as a key input into our
approach
the relative prices of operating and capital inputs—we use input prices to trend
base opex such that the total forecast opex allowances reasonably reflect a
realistic expectation of demand forecast and cost inputs.
We will also have regard to the following opex factors which we consider relevant:148
our benchmarking data sets including, but not necessarily limited to:
(a) data contained in any economic benchmarking RIN, category analysis RIN,
reset RIN or annual reporting RIN
(b) any relevant data from international sources
(c) data sets that support econometric modelling and other assessment techniques
consistent with the approach set out in the Guideline
as updated from time to time.
Economic benchmarking techniques for assessing benchmark efficient expenditure
including stochastic frontier analysis and regressions utilising functional forms such
as Cobb Douglas and Translog.
We identified our preference for using econometric techniques in our explanatory
statement to the Guideline.149
The NER were specifically amended to allow us to take account of additional factors.150
Service providers were on notice of our intention to use benchmarking from the 2012
rule change. We consider that these factors are particularly relevant to our approach
148
Consistent with our decisions for the NSW and ACT service providers. 149
AER, Expenditure Forecast Assessment Guideline–Explanatory Statement, November 2013, p. 131. 150
AEMC, Final Rule Determination: National Electricity Amendment (Economic Regulation of Network Service
Providers) Rule 2012, 29 November 2012, pp. 101.
7-73 Attachment 7 – Operating expenditure | Energex preliminary determination 2015–20
to assessing the service provider's opex forecast and, if necessary, substituting our
own opex forecast.
We have used our discretion to give weight to the opex factors which we consider are
most relevant to our approach. The AEMC has recognised our discretion in this
regard:151
As mandatory considerations, the AER has an obligation to take the capex and opex factors into account, but this does not mean that every factor will be relevant to every aspect of every regulatory determination the AER makes. The AER may decide that certain factors are not relevant in certain cases once it has considered them.
We have received submissions stating that we have placed unreasonable weight on
benchmarking and "almost solely" relied on it as a deterministic or mechanistic tool.152
They consider benchmarking is but one of the opex factors relevant to forming a view
on whether total forecast opex proposals reasonably reflect the opex criteria.
Additionally, they consider the NER seek we undertake a broader examination of a
service provider's proposal.153 Some submissions also state that the purpose of the
benchmarking factor is:154
...for the AER to consider whether available benchmarking information can provide a partial indicator of the efficiency of the forecast expenditure, and if so the investigations and weight that should be ascribed to that data.
We disagree and consider we have had appropriate and reasonable regard to
benchmarking, together with other techniques.
We agree that benchmarking is one of several opex factors that we are required to
'have regard to'. However, as we explain above, we have discretion as to how we have
regard to each opex factor, including how much weight we attach to them. Indeed, the
AEMC has stated that we may decide certain factors are not relevant.155 We explained
this in the explanatory statement to the Guideline.156
We consider it appropriate to give prominent, but not overwhelming weight to
benchmarking base opex based on the robustness of the data and techniques and its
utility in overcoming information asymmetry and in providing comparisons amongst
firms in the NEM. Many stakeholders agree with this approach.157 Our decision to use
151
AEMC, Final Rule Determination: National Electricity Amendment (Economic Regulation of Network Service
Providers) Rule 2012, 29 November 2012, pp. 115. 152
Ergon Energy, Submission on the Draft Decisions: NSW and ACT distribution determinations 2015–16 to 2018–19;
pp. 10, 23; Ausgrid, Revised Regulatory Proposal, January 2015, pp. 15, 134–139. 153
Ausgrid, Revised Regulatory Proposal, January 2015, pp. 15, 134–139. 154
Ausgrid, Revised Proposal, January 2015, p. 126; Endeavour Energy, Revised Regulatory Proposal, January
2015, p. 100; Essential Energy, Revised Regulatory Proposal, January 2015, p. 107. 155
AEMC, Final Rule Determination: National Electricity Amendment (Economic Regulation of Network Service
Providers) Rule 2012, 29 November 2012, p. 115. 156
AER, Expenditure Forecast Assessment Guideline–Explanatory Statement, November 2013, p. 22. 157
For example, Origin Energy, Submission to Queensland Electricity Distributors’ Regulatory Proposals, 30 January
2015, pp. 11–15; AGL, Energex Regulatory Proposal: July 2015 to June 2020 - AGL submission to the Australian
7-74 Attachment 7 – Operating expenditure | Energex preliminary determination 2015–20
benchmarking techniques in our assessment of opex is consistent with the
recommendations of the Productivity Commission,158 the Australian Government's
response to those recommendations159 and the AEMC's intent:160
The Commission considers that benchmarking is a critical exercise in assessing the efficiency of a NSP and approving its capital expenditure and operating expenditure allowances.
Neither the NER nor the AEMC's Final Rule Determination requires us to use
benchmarking only as a means of identifying issues for further investigation, as some
service providers have suggested.161
We also consider that our benchmarking approach is well supported by the available
evidence. We have had regard to the criticisms of this approach, in their proper context
of a proposed model followed by subsequent analysis and critique.
Some submissions consider that our reliance on benchmarking would amount to an
error of law which ought to result in the invalidity of our decision should we maintain
that approach in the final decision.162
We disagree with this view because the NER specifically require that we undertake
benchmarking, not just arising from the benchmarking opex factor, but also from the
opex criteria themselves. As we mention above, the criteria require that we examine
efficient costs that an objectively prudent operator would require to achieve the opex
objectives.163 This invites a comparison of service providers. Additionally, the AEMC
highlighted the importance of benchmarking in its changes to the NER in November
2012:164
The Commission views benchmarking as an important exercise in assessing
the efficiency of a NSP and informing the determination of the appropriate
capex or opex allowance.
By benchmarking a service provider's expenditure we can compare its efficiency over
time, and relative to the efficiency of other service providers.
Energy Regulator, 30 January 2015, pp. 7–9; CCP, Submission on Energex and Ergon Energy Capex and Opex
Proposals, 30 January 2015, pp. 16–26. 158
Productivity Commission, Electricity network regulatory frameworks – inquiry report, Volume 1, 9 April 2013,
pp. 2–3, 187. 159
Australian Government, The Australian Government response to the Productivity Commission inquiry report –
Electricity Network Regulatory Frameworks, June 2013, pp. i–ii, 3–9. 160
AEMC, Final Rule Determination: National Electricity Amendment (Economic Regulation of Network Service
Providers) Rule 2012, 29 November 2012, pp. viii, 107, 113. 161
For example, Frontier Economics, Review of the AER’s econometric benchmarking models and their application in
the draft determinations for Networks NSW, January 2015, p 10 162
e.g. ActewAGL Revised Regulatory Proposal, 2.3.1, when read with section 2.2.4. 163
NER, cl. 6.5.6(c). 164
AEMC, Final Rule Determination: National Electricity Amendment (Economic Regulation of Network Service
Providers) Rule 2012, 29 November 2012, p. 97.

7-75 Attachment 7 – Operating expenditure | Energex preliminary determination 2015–20
In previous regulatory periods, we have applied a revealed cost methodology to
forecast opex. We have previously not been in a position to assess the efficiency of
base opex when applying the revealed cost methodology because we did not have
reliable benchmarking data and techniques to make that assessment.165
In this decision, we also use revealed costs. However, we now have reliable and
robust data that allow us to assess relative efficiency and, where that assessment
demonstrates that revealed costs are materially inefficient, to develop an alternative
forecast. In this decision, we have been able to benchmark service providers' opex
using various benchmark modelling techniques. We have also applied a range of other
quantitative and qualitative techniques to test the validity and consistency of the
results. We have:
used category analysis, which allows us to examine specific key cost drivers
between businesses
conducted detailed reviews of certain historical and proposed opex, such as labour
costs.
These approaches are set out in more detail in section A.5.
We have also decided to change the benchmark comparison point, which takes the
lowest efficiency score of the service providers in the top quartile of possible efficiency
scores rather than the frontier performer (CitiPower). Lowering the benchmark
comparison point is an option suggested in response to our draft decision for the NSW
and ACT service providers.166
We do not agree that adjusting base opex through benchmarking constitutes an unfair
post hoc review or disregards our past decisions.167 Submissions to this effect
misunderstand the purpose of our forecasting approach. The purpose of adjusting
revealed costs for benchmarking is not to take back funding allocated in a previous
regulatory period. It is to properly assess whether the proposed forecast for the
upcoming regulatory control period reasonably reflects the opex criteria. That
adjustment is based on an assessment of actual historic costs we know have been
sufficient to enable service providers to achieve the opex objectives.
Our economic benchmarking models suggest that there has been a longstanding
efficiency gap between the NSW, ACT and Queensland service providers and those in
other parts of the NEM.168
If our benchmarking indicated that the proposed base year opex was relatively
efficient, those revealed costs would remain the starting point for assessing future
165
See AER, Explanatory Statement, Expenditure Forecast Assessment Guideline, p. 11. 166
For example, PEG, Statistical Benchmarking for NSW Power Distributors, 19 January 2015, p 64 167
For example, Ergon Energy, Submission on the Draft Decisions: NSW and ACT distribution determinations
2015–16 to 2018–19, 13 February 2015, pp. 9–10. 168
See, for example, AER, Draft Decision, Attachment 7, section A.3; AER, 2014 Annual Benchmarking Report,
November 2014.
7-76 Attachment 7 – Operating expenditure | Energex preliminary determination 2015–20
expenditure. Where benchmarking reveals that base opex costs are not a good proxy
for future forecasts, we are able to take account of this information and adjust the base
opex accordingly.
Some service providers suggested that our decision to adjust base opex means that
we have not had regard to our previous decisions, or that a step change had occurred
from revealed costs to benchmarking.169
We do not consider that taking account of further information, which we have collected
in compliance with an express requirement in the NER, constitutes a lack of regard to
our past decisions. Nor do we consider it a step change. It is not an unavoidable
change in activity due to an external obligation.170 As set out above, we do not require
service providers to spend revenue they recover from consumers on any particular
activity, nor do we limit or require their spending to this amount.
All stakeholders should expect us to use new techniques and information when they
become available.171 We have not moved away from revealed costs. Rather, we have
used new techniques to ensure that we are better able to make a decision that
reasonably reflects the opex criteria for the future. Our approach represents a
refinement of our longstanding approach to assessing opex.
As set out above, our intention to use benchmarking has been the subject of an AEMC
rule change and extensive consultation. The results of our benchmarking indicate that
previous incentive signals and schemes used to motivate service providers were not
sufficient.
Our approach gives due regard to the service providers'
proposals and individual circumstances
Broadly, service providers have submitted that by relying on benchmarking as part of
our assessment approach, we have:
not started our assessment with their regulatory proposals or examined which
aspects of their proposals involve inefficient expenditure in any level of detail172
failed to comply with the NER requirements to have regard to their individual
circumstances.173
169
ActewAGL, Revised Regulatory Proposal p 50; Ergon Energy Submission on Draft Decision, p. 9. 170
See Application by Ergon Energy Corporation Limited (Labour Cost Escalators) (No 3) [2010] ACompT 11 at
[194](d). 171
We have indicated in previous decisions and in defending those decisions our preference to use up to date
information where possible. The Tribunal has endorsed this approach and indicated a similar preference: see for
example Application by Ergon Energy Corporation Limited (Labour Cost Escalators) (No 3) [2010] ACompT 11 at
[61] to [62]. 172
Ausgrid, Revised Regulatory Proposal, pp. 27, 122, 134–136; Networks NSW, NSW distributors' submission on the
AER's draft determinations, 13 February 2015, pp. 6–9. 173
Ausgrid, Revised Regulatory Proposal, pp. 10, 151–153.
7-77 Attachment 7 – Operating expenditure | Energex preliminary determination 2015–20
The service providers' proposals
We consider that we have had due regard to the service providers' opex proposals. As
outlined by the AEMC174 and in our assessment approach, we start by looking at the
service provider's proposal. Our assessment approach is built around a mechanism to
assess the proposal to determine whether it reasonably reflects the opex criteria.
Where we find the service provider's proposal does not reasonably reflect the opex
criteria, we use that same mechanism to determine an alternative forecast.
As we discussed in the explanatory statement to the Guideline, information asymmetry
and the inherent incentive to inflate expected expenditure needs means that we must
test the service providers' proposals robustly.175 Benchmarking is, in our view, an
appropriate means of doing this and is consistent with the AEMC's intent:176
Importantly, though, [the NSP's proposal] should be only one of a number of inputs. Other stakeholders may also be able to provide relevant information, as will any consultants engaged by the AER. In addition, the AER can conduct its own analysis, including using objective evidence drawn from history, and the performance and experience of comparable NSPs. The techniques the AER may use to conduct this analysis are not limited, and in particular are not confined to the approach taken by the NSP in its proposal.
Further, we have engaged closely with the assumptions and submissions in the
proposal. For example, we have engaged in a detailed assessment of operating
environment factors (see section A.6). We also explicitly examined the service
providers' proposals and undertook a detailed review of reasons for their
benchmarking performance (see section A.5). Finally, a key step in our overall opex
assessment approach is to assess the service provider's proposed forecasting
approaches (see appendix D).
Individual circumstances
Our base opex assessment approach gives extensive regard to the service providers'
circumstances, as required by the NER and in accordance with the intent of the AEMC.
The individual circumstances of a service provider can be exogenous (beyond their
control) such as topography and climate, or endogenous (within their control) such as
their approach to contracting. The AEMC expressed how it envisaged benchmarking
would be applied as follows:177
The final rule gives the AER discretion as to how and when it undertakes benchmarking in its decision-making. However, when undertaking a
174
AEMC, Final Rule Determination: National Electricity Amendment (Economic Regulation of Network Service
Providers) Rule 2012, 29 November 2012, pp. 90, 95, 96, 111, See also: AER, Explanatory Statement,
Expenditure Forecast Assessment Guideline, p. 7. 175
AER, Expenditure Forecast Assessment Guideline–Explanatory Statement, November 2013, pp. 27–28. 176
AEMC, Final Rule Determination: National Electricity Amendment (Economic Regulation of Network Service
Providers) Rule 2012, 29 November 2012, pp. 111–112. 177
AEMC, Final Rule Determination: National Electricity Amendment (Economic Regulation of Network Service
Providers) Rule 2012, 29 November 2012, p. 113. See also pp. viii, 25, 98, 107–108.
7-78 Attachment 7 – Operating expenditure | Energex preliminary determination 2015–20
benchmarking exercise, circumstances exogenous to a NSP should generally be taken into account, and endogenous circumstances should generally not be considered. In respect of each NSP, the AER must exercise its judgement as to the circumstances which should or should not be included.
Individual circumstances are taken into account throughout our approach (including
benchmarking):
First, the benchmarking techniques which we use to compare service providers
take into account many of their individual circumstances, most notably their key
network characteristics178 and their actual operating expenditure.
Second, this process disaggregates those circumstances which we consider reflect
inefficiency from those which are exogenous or uncontrollable factors.
Third, we make appropriate adjustments to the benchmarking results based on
findings from other techniques such as detailed review and analysis of operating
environment factors. This is consistent with our discretion to make appropriate and
transparent decisions on a case by case basis.179
We disagree with those service providers who submit that having regard to their
circumstances preclude us from giving substantial weight to benchmarking. The clear
intention of the AEMC was to remove restrictions on the AER's use of
benchmarking:180
The Commission considers that the removal of the "individual circumstances" phrase will clarify the ability of the AER to undertake benchmarking. It assists the AER to determine if a NSP's proposal reflects the prudent and efficient costs of meeting the objectives.
Our approach gives substantial weight to the individual circumstances of the service
provider that are relevant to our task, whilst allowing us to use benchmarking as part of
our approach.
A.3.3 Our approach is consistent with incentives
Some service providers have submitted that they developed their current business
structure in good faith reliance on our prior determinations on what is efficient opex.
They submit, therefore, that if they are required to align expenditure with a reduced
level of opex determined by a new and substantially different method, then the
reasonable costs incurred in the course of doing so must be considered to be
efficient.181
178
Depending on the technique, we account for line length, customer density, energy density, demand density,
reliability, degree of undergrounding etc. 179
AEMC, Final Rule Determination: National Electricity Amendment (Economic Regulation of Network Service
Providers) Rule 2012, 29 November 2012, pp. 10. 180
AEMC, Final Rule Determination: National Electricity Amendment (Economic Regulation of Network Service
Providers) Rule 2012, 29 November 2012, pp. 107, 113. 181
For example, ActewAGL, letter to Paula Conboy, 4 March 2015, p. 2.
7-79 Attachment 7 – Operating expenditure | Energex preliminary determination 2015–20
In making this statement, these service providers appear to misunderstand the basis of
our forecasting approach. We do not determine that past spending against a previous
forecast is inefficient if it is below the forecast total opex we previously approved.
Rather, we reward this lower actual expenditure through the EBSS.
However, that does not mean that a past level of expenditure is appropriate for making
a forecast of costs against the opex criteria for a future regulatory control period. The
NER is an incentive framework. The opex forecast we approve, together with the
relevant schemes, provide bonuses for improving efficiency while maintaining or
improving service standards, beyond the previous period’s revealed costs. This regime
encourages businesses to be as efficient as is prudent to beat the total opex forecast
and continuously improve their efficiency. In that context, a network business should
not be expecting to receive historical costs whenever a new forecast of total opex is
assessed.
The AER makes decisions on the basis of the relevant evidence it has before it at the
time. In 2010, on the basis of the evidence before us, and also having regard to the
circumstances in which we made our decision, we determined what we considered to
be an appropriate basis for forecasting total opex for the period 2010–15.
We have additional evidence now, through more detailed benchmarking. As we note
above, our benchmarking results indicate that several service providers spend
considerably more on a standardised basis than other businesses in the NEM to
provide services in a manner that achieves the opex objectives. In assessing future
forecasts we need to have regard to this new information.
One of benchmarking's positive attributes is that it increases the incentive to reduce
opex. This is something that HoustonKemp acknowledges.182 We consider that this
increased incentive reflects a decision that is in the long term interests of consumers
and reflects the opex objectives.
Despite this, HoustonKemp considers that our approach is inconsistent with the
NEO.183 We disagree. If benchmarking shows a service provider's revealed opex is
materially inefficient, it is not possible to set an opex forecast based solely on revealed
expenditure that is consistent with the opex criteria. Such an approach would ignore
relevant considerations and techniques which we regard as robust and important. The
AEMC agrees.184 In such circumstances, therefore, benchmarking will deliver an
alternative forecast that achieves the NEO to a greater degree than revealed
expenditure.
182
HoustonKemp, AER Determination for ActewAGL Distribution - Contribution to NEO and preferable NEO decision,
13 February 2015, pp. 26–27. 183
HoustonKemp, AER Determination for ActewAGL Distribution - Contribution to NEO and preferable NEO decision,
13 February 2015, pp. 26–27. 184
AEMC, Final Rule Determination: National Electricity Amendment (Economic Regulation of Network Service
Providers) Rule 2012, 29 November 2012, pp. 107, 113.

7-80 Attachment 7 – Operating expenditure | Energex preliminary determination 2015–20
A.3.4 The benchmarking we rely on in our approach is
robust, reliable and reasonable
Service providers have submitted that our benchmarking is fundamentally flawed
because:185
our analysis is not robust
we have made errors in the application of our models
we should have regard to conceptual limitations of benchmarking, particularly given
the heterogeneity of Australian service providers
the RIN data used in the benchmarking contains problems
there has been a lack of testing and peer review.
Economic Insights responds to these submissions in detail in its report, and we explain
in section A.2 why benchmarking is appropriate in the context of our ex ante regulatory
framework. We also outline why our benchmarking is robust, reliable and reasonable in
section A.4. Further, we demonstrate the alternative approaches proposed by the
service providers are not robust. For example, some of the alternative approaches
proposed by the service providers:186
misunderstand the rationale for using international data and, consequently, the
manner in which Economic Insights has used it
include outputs that reflect secondary cost drivers rather than functional outputs,
which can reward inefficient practices
exclude key functional outputs—CEPA, for example, presents a function with only
one or two outputs, which is not adequate to accurately model service provider cost
characteristics
inappropriately incorporate some operating environment variables without
considering their potential effect on the model—depending on the estimation
method used, the 'capital intensiveness' (or equivalent) variable, for example,
overstates the opex efficiency of the ACT, NSW and QLD service providers simply
because they own assets with a capacity of more than 66kV
suggest the inclusion of many unjustified operating environment variables, which
can undermine the ability of a model to explain the relationship between inputs and
outputs
use estimation methods that are not robust because of the underlying assumptions
they make about the nature of inefficiency.
185
For example, Ergon Energy, Submission on the Draft Decisions: NSW and ACT distribution determinations 2015–
16 to 2018–19, 13 February 2013, pp. 9–22; Ausgrid, Revised Regulatory Proposal, pp. 129–153. 186
Economic Insights, Response to Consultants’ Reports on Economic Benchmarking of Electricity DNSPs, April
2015, section 3.
7-81 Attachment 7 – Operating expenditure | Energex preliminary determination 2015–20
In this section, we set out some general principles regarding the nature of
benchmarking.
This decision is the first time that we have had sufficient information to conduct
rigorous benchmarking analysis. However, we have done so over a long consultation
period, using data provided and cross-checked by the service providers themselves.
We have used benchmarking analysis in a way that acknowledges benchmarking
cannot produce a single "right" answer—but we also rely on benchmarking as an
important technique for assessing base opex.
Frontier Economics agree that no single "right" answer exists. It acknowledges both
the power of benchmarking and the impressive knowledge the AER's expert
(Economic Insights) brings to the subject matter.187 Huegin makes the same point.188
Huegin also notes that "the approach that appears to be most common in regulatory
jurisdictions around the world is to use a combination of results from different
benchmarking techniques to arrive at relative levels of efficiency between
businesses."189
Accordingly, the level of confidence we require to use benchmarking is that which
assists us in being satisfied or dissatisfied that a proposal or comparative estimate
reasonably reflects the opex criteria. We are confident that our approach provides us
with the necessary comfort to use benchmarking in this way. We therefore disagree
with the submission by Frontier Economics that we have placed undue reliance on our
benchmarking approach.190 We do not agree with suggestions by service providers
that:191
Australian data is unreliable
international data is inapplicable, and
our benchmarking results do not accord with sensibility checks.192
The Australian data was supplied by the service providers themselves, in accordance
with our compulsory information gathering powers. We required Australian data
provided by service providers to be audited and certified by statutory declaration by the
187
Frontier Economics: Review of the AER’s econometric benchmarking models and their application in the draft
determinations for Networks NSW (January 2015) p. vii. 188
Huegin, Huegin’s response to Draft Determination on behalf of NNSW and ActewAGL Technical response to the
application of benchmarking by the AER, 16 January 2015, pp. 7, 13. 189
Huegin, Huegin’s response to Draft Determination on behalf of NNSW and ActewAGL Technical response to the
application of benchmarking by the AER, 16 January 2015, p. 11. 190
Frontier Economics: Review of the AER’s econometric benchmarking models and their application in the draft
determinations for Networks NSW (January 2015). 191
Frontier Economics: Review of the AER’s econometric benchmarking models and their application in the draft
determinations for Networks NSW (January 2015) pp. vii, ix. 192
Endeavour, Revised Regulatory Proposal, p. 179. Ausgrid, Revised Regulatory Proposal, pp. 150–153. Essential,
Revised Regulatory Proposal, p. 189.
7-82 Attachment 7 – Operating expenditure | Energex preliminary determination 2015–20
CEOs of the service providers. We obtained international data from comparable
jurisdictions where similar analysis had previously been conducted.193
As we explain in section A.4, we have conducted detailed review of the Australian
data, and the international data has been used by the regulators in the respective
jurisdictions for determinations. Therefore, we consider that the data we have used for
benchmarking is robust for this purpose. Economic Insights also considers that the
data is sufficiently robust for benchmarking .The approach taken by Economic Insights
produced a functional data set which is both consistent across benchmarking
techniques, is dataset insensitive and has undergone significant testing and cross-
checking.194
It is true that as service provides continue to provide audited information, the dataset
will improve still further. However, this does not mean that we are not sufficiently
confident at this stage to use benchmarking to assess base operating expenditure. We
reject the suggestion that the EI approach is unreliable. The results it has produced are
consistent with our other analyses, such as our detailed review of base year opex and
our cross checking of our benchmarking results.
We have also considered our modelling in light of the service providers' operating
environment factors and the potential for data and modelling issues. We have
reviewed the operating environment circumstances that service providers proposed, or
which we independently considered, might explain differences in costs compared to
other jurisdictions. We have also conducted analysis using other techniques to cross-
check the benchmarking results. We disagree, therefore, that we have not conducted
'sensibility checks' of our benchmarking.
Indeed, we have ultimately made cautious adjustments to the SFA benchmarking
results to ensure that any adjustments to base opex:
exclude differences caused by factors other than inefficiency
appropriately account for potential data and modelling issues that could adversely
affect the service providers.
The expert reports prepared for the service providers indicate distinct areas where the
authors disagree with Economic Insights' report. However, benchmarking is something
that reasonable minds will invariably differ on. As identified above, Frontier Economics
and Huegin acknowledge this. Economic Insights' view is that its models are more
robust than those produced by the service providers' consultants.
Therefore, for the reasons set out in section A.4 and Economic Insights' final decision
report, we do not consider that these criticisms do more than identify alternative
possible answers to the benchmarking question. We are not persuaded that Economic
Insights' approach is materially affected by the issues raised by the service providers'
193
Economic Insights, Economic Benchmarking of NSW and ACT distributor Opex, 17 November 2014 at 29. 194
Economic Insights, Economic Benchmarking of NSW and ACT distributor Opex, 17 November 2014 at 32.

7-83 Attachment 7 – Operating expenditure | Energex preliminary determination 2015–20
consultants. We remain satisfied that, despite expected disagreement about outcomes,
our use of benchmarking in our assessment approach is consistent with the NER and
the NEL.
7-84 Attachment 7 – Operating expenditure | Energex preliminary determination 2015–20
A.4 Our benchmarking is robust, reliable and reasonable
In this section we set out our analysis of the benchmarking techniques we have used
to test whether base year opex of the Queensland service providers is efficient. In
particular, we set out why our approach and results are robust, reliable and
reasonable. In doing so, we explain why our approach is preferable to those proposed
by the service providers and their consultants in response to our draft determinations
for the NSW and ACT service providers.
In this section we set out our benchmarking metrics that examine the efficiency of opex
as a whole.195 Category analysis metrics are considered separately in in section A.5.
A.4.1 Preliminary determination
Our decision is to rely on the same benchmarking analysis that we applied in our draft
determinations for the NSW and ACT service providers to test the efficiency of the
Queensland service providers' revealed opex. In coming to this view, we have
considered the submissions of the service providers, their consultants and legal
advisors, consumer representatives and other stakeholders.
We consider our benchmarking—including the data we have used—is robust, reliable
and reasonable. In reviewing the alternatives put forward by the service providers'
consultants we have identified shortcomings. Issues identified with the consultant's
model's include:196
only using the Australian data set which has inadequate variation to support robust
model estimation
including inappropriate operating environment factors (such as a 132kV line
variable) leading to inefficiency gaps being understated
applying models that make inappropriate assumptions about the nature of
inefficiency and hence allocate persistent inefficiency to operating environment
differences
applying models that will misleadingly find service providers to be 'efficient by
default'
We summarise the key concerns and provide our responses in Table A.3. Economic
Insights provides detailed responses in its report.197
195
These include our partial performance indicators, opex MPFP, and Econometric models. 196
Economic Insights, Response to Consultants’ Reports on Economic Benchmarking of Electricity DNSPs, April
2015, p. 53. (Economic Insights, 2015). 197
Economic Insights, 2015.
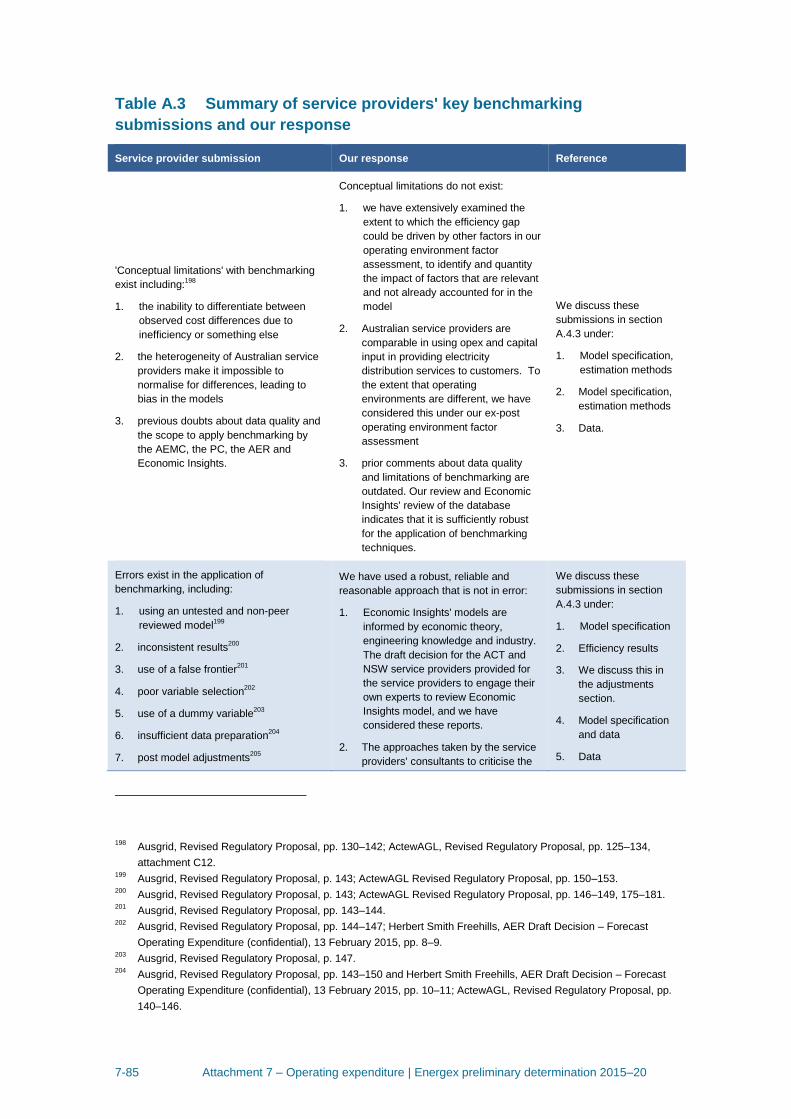
7-85 Attachment 7 – Operating expenditure | Energex preliminary determination 2015–20
Table A.3 Summary of service providers' key benchmarking
submissions and our response
Service provider submission Our response Reference
'Conceptual limitations' with benchmarking
exist including:198
1. the inability to differentiate between
observed cost differences due to
inefficiency or something else
2. the heterogeneity of Australian service
providers make it impossible to
normalise for differences, leading to
bias in the models
3. previous doubts about data quality and
the scope to apply benchmarking by
the AEMC, the PC, the AER and
Economic Insights.
Conceptual limitations do not exist:
1. we have extensively examined the
extent to which the efficiency gap
could be driven by other factors in our
operating environment factor
assessment, to identify and quantity
the impact of factors that are relevant
and not already accounted for in the
model
2. Australian service providers are
comparable in using opex and capital
input in providing electricity
distribution services to customers. To
the extent that operating
environments are different, we have
considered this under our ex-post
operating environment factor
assessment
3. prior comments about data quality
and limitations of benchmarking are
outdated. Our review and Economic
Insights' review of the database
indicates that it is sufficiently robust
for the application of benchmarking
techniques.
We discuss these
submissions in section
A.4.3 under:
1. Model specification,
estimation methods
2. Model specification,
estimation methods
3. Data.
Errors exist in the application of
benchmarking, including:
1. using an untested and non-peer
reviewed model199
2. inconsistent results200
3. use of a false frontier201
4. poor variable selection202
5. use of a dummy variable203
6. insufficient data preparation204
7. post model adjustments205
We have used a robust, reliable and
reasonable approach that is not in error:
1. Economic Insights' models are
informed by economic theory,
engineering knowledge and industry.
The draft decision for the ACT and
NSW service providers provided for
the service providers to engage their
own experts to review Economic
Insights model, and we have
considered these reports.
2. The approaches taken by the service
providers' consultants to criticise the
We discuss these
submissions in section
A.4.3 under:
1. Model specification
2. Efficiency results
3. We discuss this in
the adjustments
section.
4. Model specification
and data
5. Data
198
Ausgrid, Revised Regulatory Proposal, pp. 130–142; ActewAGL, Revised Regulatory Proposal, pp. 125–134,
attachment C12. 199
Ausgrid, Revised Regulatory Proposal, p. 143; ActewAGL Revised Regulatory Proposal, pp. 150–153. 200
Ausgrid, Revised Regulatory Proposal, p. 143; ActewAGL Revised Regulatory Proposal, pp. 146–149, 175–181. 201
Ausgrid, Revised Regulatory Proposal, pp. 143–144. 202
Ausgrid, Revised Regulatory Proposal, pp. 144–147; Herbert Smith Freehills, AER Draft Decision – Forecast
Operating Expenditure (confidential), 13 February 2015, pp. 8–9. 203
Ausgrid, Revised Regulatory Proposal, p. 147. 204
Ausgrid, Revised Regulatory Proposal, pp. 143–150 and Herbert Smith Freehills, AER Draft Decision – Forecast
Operating Expenditure (confidential), 13 February 2015, pp. 10–11; ActewAGL, Revised Regulatory Proposal, pp.
140–146.
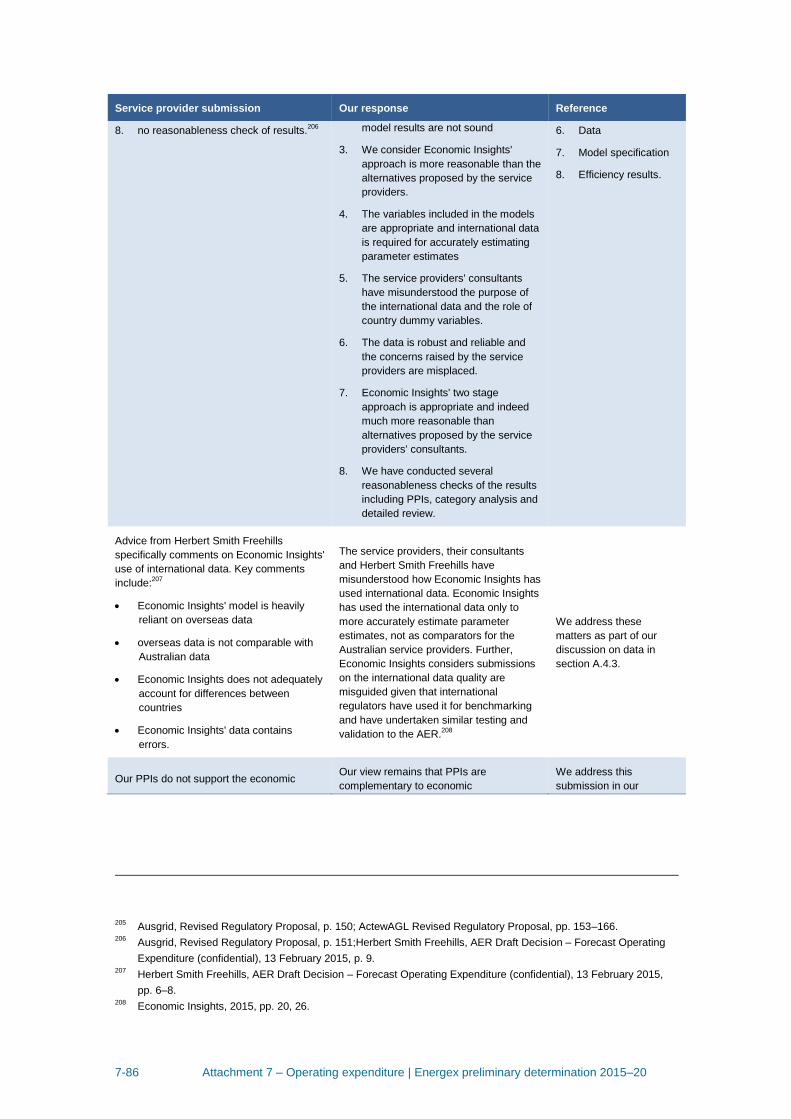
7-86 Attachment 7 – Operating expenditure | Energex preliminary determination 2015–20
Service provider submission Our response Reference
8. no reasonableness check of results.206
model results are not sound
3. We consider Economic Insights'
approach is more reasonable than the
alternatives proposed by the service
providers.
4. The variables included in the models
are appropriate and international data
is required for accurately estimating
parameter estimates
5. The service providers' consultants
have misunderstood the purpose of
the international data and the role of
country dummy variables.
6. The data is robust and reliable and
the concerns raised by the service
providers are misplaced.
7. Economic Insights' two stage
approach is appropriate and indeed
much more reasonable than
alternatives proposed by the service
providers' consultants.
8. We have conducted several
reasonableness checks of the results
including PPIs, category analysis and
detailed review.
6. Data
7. Model specification
8. Efficiency results.
Advice from Herbert Smith Freehills
specifically comments on Economic Insights'
use of international data. Key comments
include:207
Economic Insights' model is heavily
reliant on overseas data
overseas data is not comparable with
Australian data
Economic Insights does not adequately
account for differences between
countries
Economic Insights' data contains
errors.
The service providers, their consultants
and Herbert Smith Freehills have
misunderstood how Economic Insights has
used international data. Economic Insights
has used the international data only to
more accurately estimate parameter
estimates, not as comparators for the
Australian service providers. Further,
Economic Insights considers submissions
on the international data quality are
misguided given that international
regulators have used it for benchmarking
and have undertaken similar testing and
validation to the AER.208
We address these
matters as part of our
discussion on data in
section A.4.3.
Our PPIs do not support the economic Our view remains that PPIs are
complementary to economic
We address this
submission in our
205
Ausgrid, Revised Regulatory Proposal, p. 150; ActewAGL Revised Regulatory Proposal, pp. 153–166. 206
Ausgrid, Revised Regulatory Proposal, p. 151;Herbert Smith Freehills, AER Draft Decision – Forecast Operating
Expenditure (confidential), 13 February 2015, p. 9. 207
Herbert Smith Freehills, AER Draft Decision – Forecast Operating Expenditure (confidential), 13 February 2015,
pp. 6–8. 208
Economic Insights, 2015, pp. 20, 26.
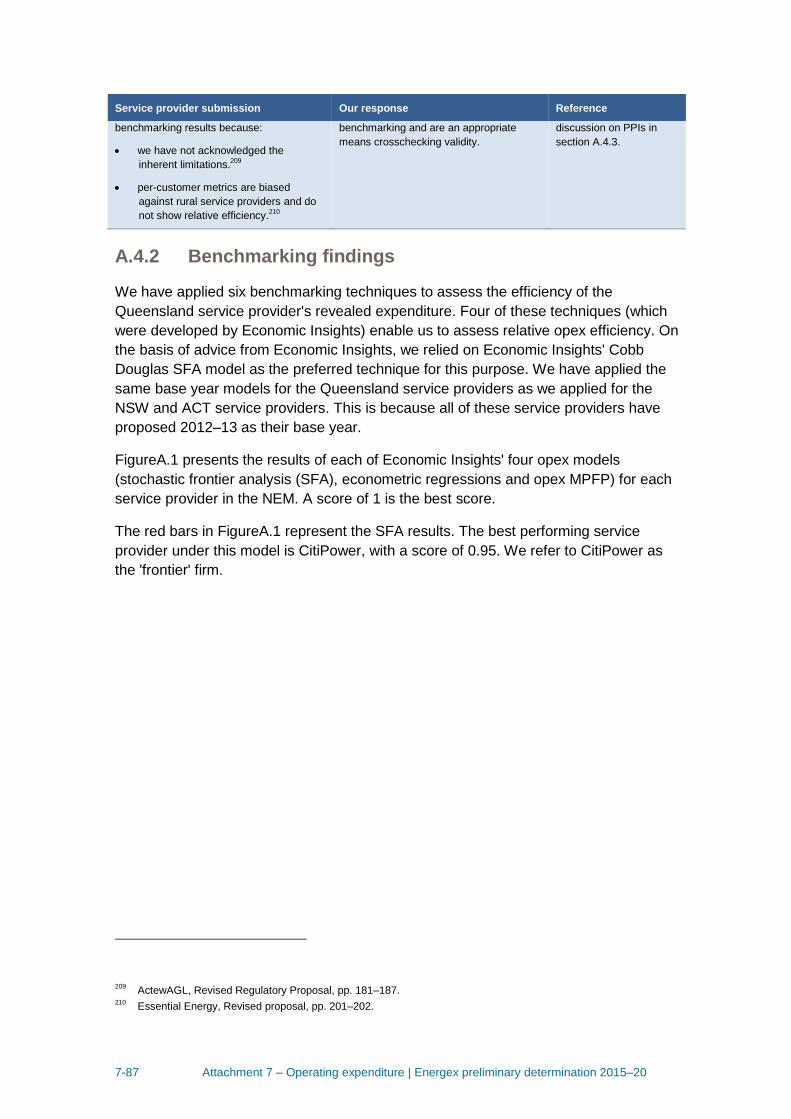
7-87 Attachment 7 – Operating expenditure | Energex preliminary determination 2015–20
Service provider submission Our response Reference
benchmarking results because:
we have not acknowledged the
inherent limitations.209
per-customer metrics are biased
against rural service providers and do
not show relative efficiency.210
benchmarking and are an appropriate
means crosschecking validity.
discussion on PPIs in
section A.4.3.
A.4.2 Benchmarking findings
We have applied six benchmarking techniques to assess the efficiency of the
Queensland service provider's revealed expenditure. Four of these techniques (which
were developed by Economic Insights) enable us to assess relative opex efficiency. On
the basis of advice from Economic Insights, we relied on Economic Insights' Cobb
Douglas SFA model as the preferred technique for this purpose. We have applied the
same base year models for the Queensland service providers as we applied for the
NSW and ACT service providers. This is because all of these service providers have
proposed 2012–13 as their base year.
FigureA.1 presents the results of each of Economic Insights' four opex models
(stochastic frontier analysis (SFA), econometric regressions and opex MPFP) for each
service provider in the NEM. A score of 1 is the best score.
The red bars in FigureA.1 represent the SFA results. The best performing service
provider under this model is CitiPower, with a score of 0.95. We refer to CitiPower as
the 'frontier' firm.
209
ActewAGL, Revised Regulatory Proposal, pp. 181–187. 210
Essential Energy, Revised proposal, pp. 201–202.
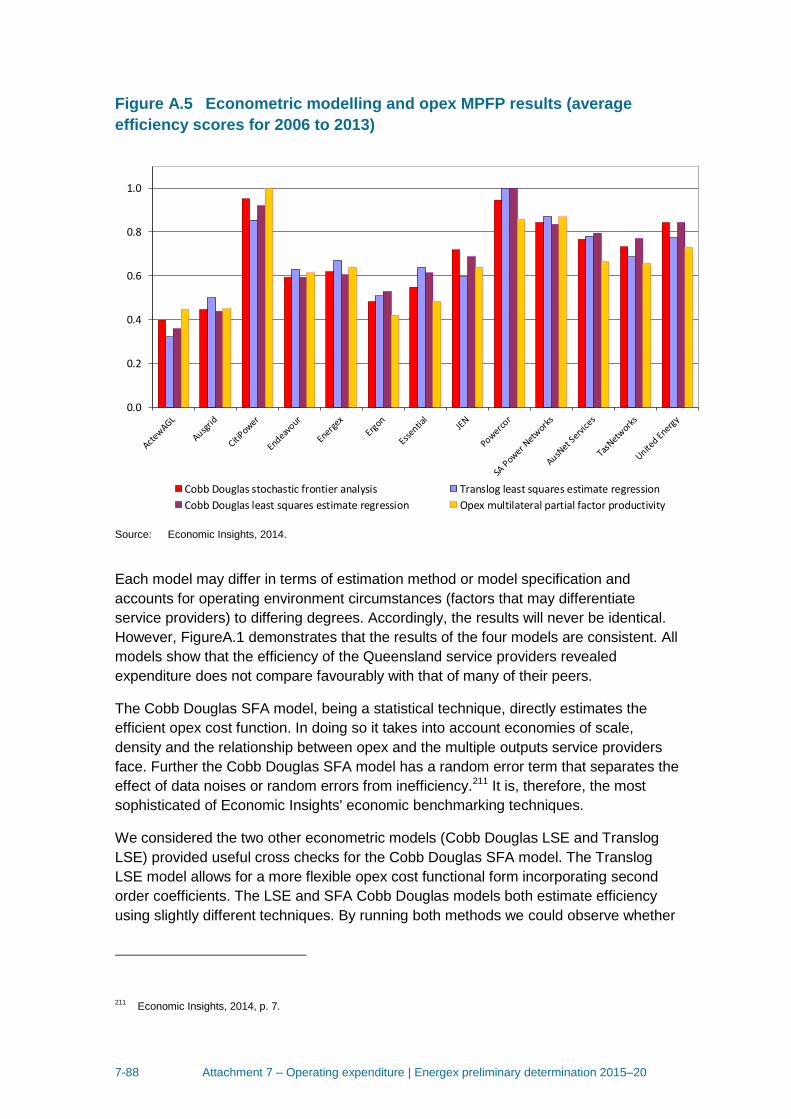
7-88 Attachment 7 – Operating expenditure | Energex preliminary determination 2015–20
Figure A.5 Econometric modelling and opex MPFP results (average
efficiency scores for 2006 to 2013)
Source: Economic Insights, 2014.
Each model may differ in terms of estimation method or model specification and
accounts for operating environment circumstances (factors that may differentiate
service providers) to differing degrees. Accordingly, the results will never be identical.
However, FigureA.1 demonstrates that the results of the four models are consistent. All
models show that the efficiency of the Queensland service providers revealed
expenditure does not compare favourably with that of many of their peers.
The Cobb Douglas SFA model, being a statistical technique, directly estimates the
efficient opex cost function. In doing so it takes into account economies of scale,
density and the relationship between opex and the multiple outputs service providers
face. Further the Cobb Douglas SFA model has a random error term that separates the
effect of data noises or random errors from inefficiency.211 It is, therefore, the most
sophisticated of Economic Insights' economic benchmarking techniques.
We considered the two other econometric models (Cobb Douglas LSE and Translog
LSE) provided useful cross checks for the Cobb Douglas SFA model. The Translog
LSE model allows for a more flexible opex cost functional form incorporating second
order coefficients. The LSE and SFA Cobb Douglas models both estimate efficiency
using slightly different techniques. By running both methods we could observe whether
211
Economic Insights, 2014, p. 7.
0.0
0.2
0.4
0.6
0.8
1.0
Cobb Douglas stochastic frontier analysis Translog least squares estimate regression
Cobb Douglas least squares estimate regression Opex multilateral partial factor productivity
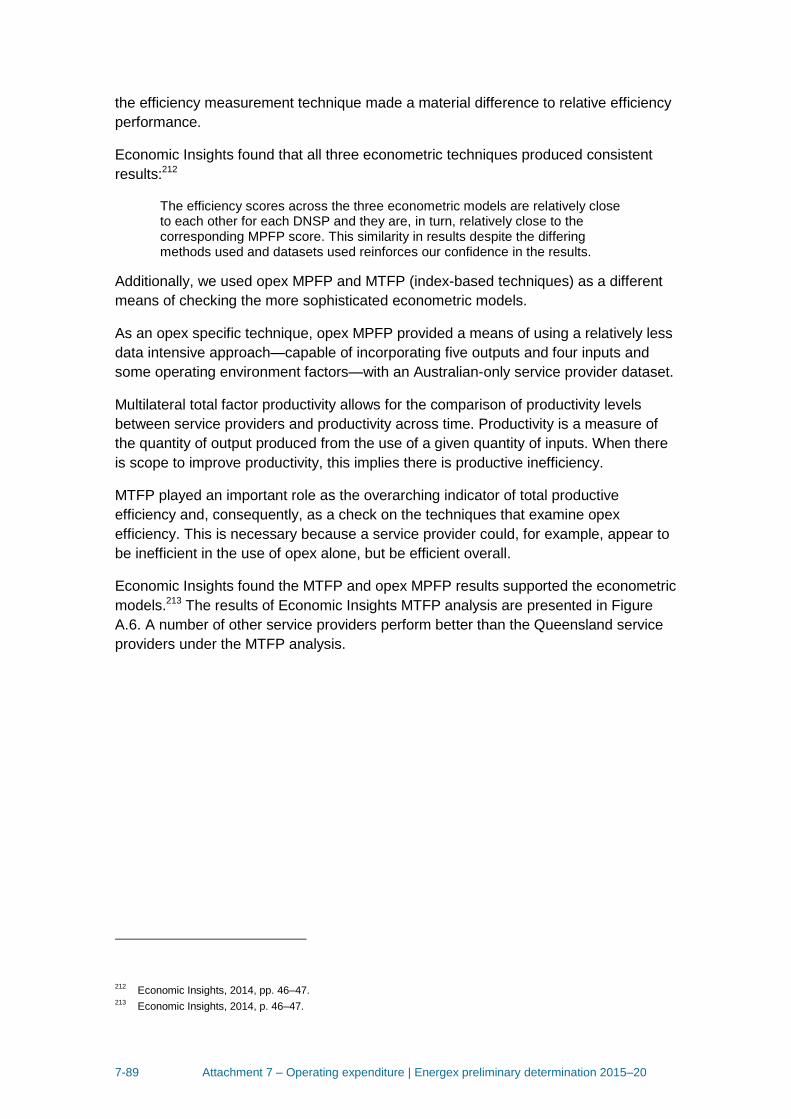
7-89 Attachment 7 – Operating expenditure | Energex preliminary determination 2015–20
the efficiency measurement technique made a material difference to relative efficiency
performance.
Economic Insights found that all three econometric techniques produced consistent
results:212
The efficiency scores across the three econometric models are relatively close to each other for each DNSP and they are, in turn, relatively close to the corresponding MPFP score. This similarity in results despite the differing methods used and datasets used reinforces our confidence in the results.
Additionally, we used opex MPFP and MTFP (index-based techniques) as a different
means of checking the more sophisticated econometric models.
As an opex specific technique, opex MPFP provided a means of using a relatively less
data intensive approach—capable of incorporating five outputs and four inputs and
some operating environment factors—with an Australian-only service provider dataset.
Multilateral total factor productivity allows for the comparison of productivity levels
between service providers and productivity across time. Productivity is a measure of
the quantity of output produced from the use of a given quantity of inputs. When there
is scope to improve productivity, this implies there is productive inefficiency.
MTFP played an important role as the overarching indicator of total productive
efficiency and, consequently, as a check on the techniques that examine opex
efficiency. This is necessary because a service provider could, for example, appear to
be inefficient in the use of opex alone, but be efficient overall.
Economic Insights found the MTFP and opex MPFP results supported the econometric
models.213 The results of Economic Insights MTFP analysis are presented in Figure
A.6. A number of other service providers perform better than the Queensland service
providers under the MTFP analysis.
212
Economic Insights, 2014, pp. 46–47. 213
Economic Insights, 2014, p. 46–47.
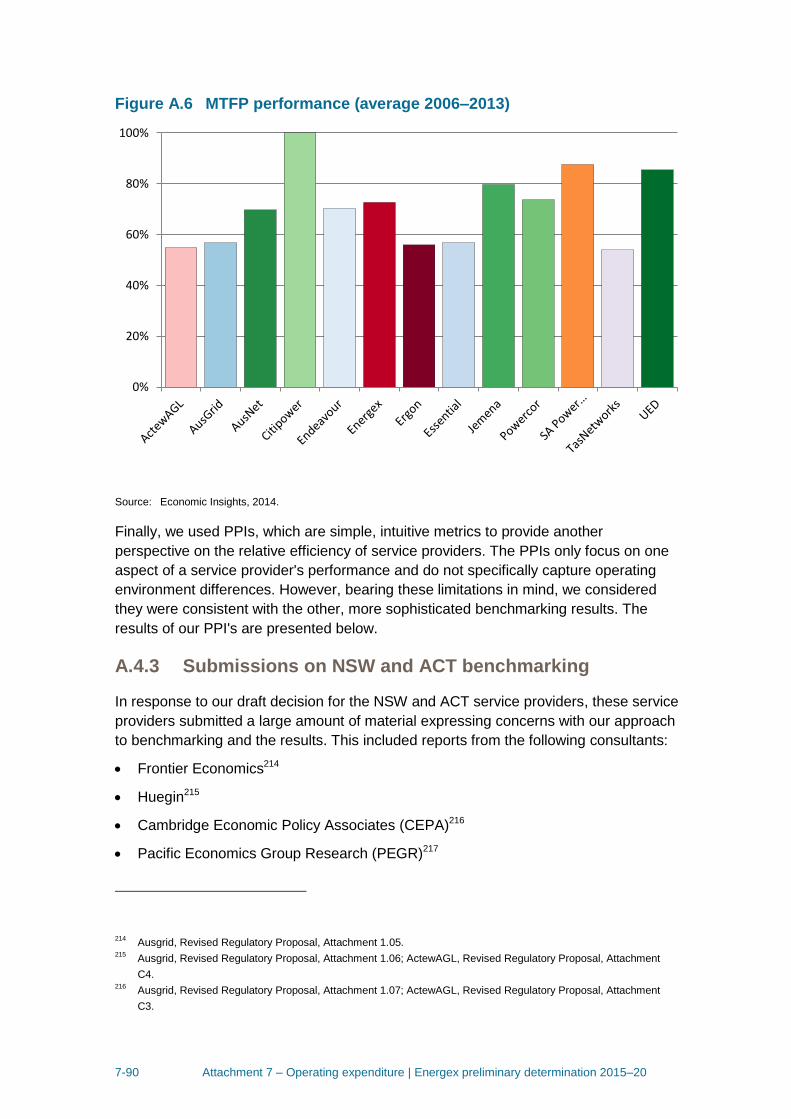
7-90 Attachment 7 – Operating expenditure | Energex preliminary determination 2015–20
Figure A.6 MTFP performance (average 2006–2013)
Source: Economic Insights, 2014.
Finally, we used PPIs, which are simple, intuitive metrics to provide another
perspective on the relative efficiency of service providers. The PPIs only focus on one
aspect of a service provider's performance and do not specifically capture operating
environment differences. However, bearing these limitations in mind, we considered
they were consistent with the other, more sophisticated benchmarking results. The
results of our PPI's are presented below.
A.4.3 Submissions on NSW and ACT benchmarking
In response to our draft decision for the NSW and ACT service providers, these service
providers submitted a large amount of material expressing concerns with our approach
to benchmarking and the results. This included reports from the following consultants:
Frontier Economics214
Huegin215
Cambridge Economic Policy Associates (CEPA)216
Pacific Economics Group Research (PEGR)217
214
Ausgrid, Revised Regulatory Proposal, Attachment 1.05. 215
Ausgrid, Revised Regulatory Proposal, Attachment 1.06; ActewAGL, Revised Regulatory Proposal, Attachment
C4. 216
Ausgrid, Revised Regulatory Proposal, Attachment 1.07; ActewAGL, Revised Regulatory Proposal, Attachment
C3.
0%
20%
40%
60%
80%
100%

7-91 Attachment 7 – Operating expenditure | Energex preliminary determination 2015–20
Advisian (formerly Evans and Peck)218
PricewaterhouseCoopers (PwC).219
In addition to submissions from other stakeholders, on 13 February 2015 we received
from service providers further legal opinion and consultant reports on benchmarking
from:
Herbert Smith Freehills (submitted by the NSW service providers)
Young and McClelland (submitted by ActewAGL)
Huegin (two reports, submitted by Ergon Energy)
Synergies (two reports, submitted by Ergon Energy)
Frontier Economics (submitted by Ergon Energy)
Ernst & Young (EY) (submitted by Ergon Energy).
Economic Insights addresses this material in the report it has prepared for this final
decision. In this section, we have grouped the key benchmarking issues raised by the
service providers and their consultants into:
model specification
data
estimation methods
efficiency results.
We discuss each topic below. Consistent with our approach in the draft decisions for
the NSW and ACT service providers, we have adopted Economic Insights' approach
and recommendations on the basis of its expertise in economic benchmarking,
including the application of economic benchmarking in the regulatory context.
Accordingly, to the extent we refer to 'our approach' or 'our model', this should be
interpreted as the approach and models recommended by Economic Insights' and
applied in its analysis. Economic Insights' final decision report contains detailed
analysis and explanation of its approach and results in light of the information
submitted by the service providers and their consultants.
Model specification
Model specification relates to the specification of the outputs, inputs and operating
environment variables that Economic Insights has used in its benchmarking model.
217
Ausgrid, Revised Regulatory Proposal, Attachment 1.08. 218
Ausgrid, Revised Regulatory Proposal, Attachment 1.09; ActewAGL, Revised Regulatory Proposal, Attachment
C2. 219
Ausgrid, Revised Regulatory Proposal, Attachment 1.10.
7-92 Attachment 7 – Operating expenditure | Energex preliminary determination 2015–20
In this sub-section, we compare Economic Insights' model specification to the
alternatives proposed by the service providers' consultants. First, we reiterate why
Economic Insights' modelling approach is robust and reliable. Second, we restate why
the inputs, outputs and operating environment factors Economic Insights has chosen
are appropriate. Finally, we explain why the alternative models proposed are not robust
or reliable.
Our approach is robust and reliable
Economic Insights' model specification has been developed using a logical, structured
and consultative approach. We set out this approach below.
The first step we took in developing our benchmarking data base was to consult criteria
for selecting input, output and operating environment factors. We set out our initial
selection criteria in our issues paper we released for the Guideline.220 Our final
selection criteria are set out in the explanatory statement to the Guideline.221
We also developed a broad data set for benchmarking. In developing this data set we
considered the model specifications applied in other service provider benchmarking
studies.222
As part of the Better Regulation reform program we hosted open workshops which
were chaperoned by Economic Insights. In these workshops we consulted on
engineering, accounting and economic aspects of the model specification with service
providers and other interested stakeholders. We published numerous papers on the
inputs, outputs and operating environment circumstances of service providers and how
these should be measured.
In light of the selection criteria and workshops Economic Insights developed a
preliminary model specification which we stated we would test once we collected
data.223 Once we received data Economic Insights ran a number of different model
specifications including the preliminary model specification.224 Economic Insights
identified a preferred MPFP model specification on the basis that this specification was
not biased towards a particular type of service provider unlike the other model
specifications they ran.225 We circulated the results of the preferred model
specification and other specifications that were run by Economic Insights in
consultation on our draft annual benchmarking report. Economic Insights modified the
MPFP model specification in light of comments received from stakeholders and
220
AER, Issues paper, expenditure forecast assessment guideline, December 2012, pp. 82–136. 221
AER, Explanatory statement, expenditure forecast assessment guideline, 2013, November 2013, pp. 145–146. 222
AER, Issues paper, expenditure forecast assessment guideline, December 2012, p. 77. 223
AER, Explanatory statement, expenditure forecast assessment guideline, 2013, November 2013, pp. 141–142. 224
Economic Insights, Memorandum - DNSP MTFP Results, 2014. 225
Economic Insights, Memorandum - DNSP MTFP Results, 2014.
7-93 Attachment 7 – Operating expenditure | Energex preliminary determination 2015–20
produced a report based on these considerations which we had regard to in making
our draft determination for the ACT and NSW service providers.226
We released the benchmarking model and underlying data for consultation with our
draft determination for the ACT and NSW service providers. We have considered
submissions on the model specification, including alternative models that have been
developed, and consider that Economic Insights' model specification is the most
appropriate. Their model specification has been developed through extensive
consultation, drawing on industry knowledge and expertise, economic theory and their
econometric experience. The reasons for not adopting alternative model specifications
proposed in submissions below.
Outputs, Inputs and operating environment factors
Model specification comprises the input, outputs and operating environment variables
relevant to the networks operated by the service providers. In this section we
separately outline why their inputs, outputs and operating environment factors are
appropriate. Economic Insights sets out its reasoning for its model specification in
section 2 of its report.227
Outputs
The outputs that we applied in our Cobb Douglas SFA model are:
Ratcheted maximum demand
Customer numbers
Circuit line length
Economic Insights considers that this output specification captures the key elements of
service providers' functional outputs that are valued by customers. Also, the ratcheted
maximum demand variable introduces an important demand side element to the
measurement of system capacity outputs required.228 PEGR applied these variables,
as well as energy delivered, in its economic benchmarking analysis undertaken for the
Ontario Energy Board.229
This specification has the advantage of incorporating all of a service provider's main
outputs. A service provider needs to provide the capacity necessary to meet demand.
This capacity output is better captured by the ratcheted maximum demand variable.230
226
AER, Electricity distribution network service providers Annual benchmarking report, November 2014, p. 47. 227
Economic Insights, 2015, pp. 2–19. 228
Economic Insights, 2015, p. 3. 229
Pacific Economics Group Research, Empirical Research in Support of Incentive Rate Setting in Ontario: Report to
the Ontario Energy Board, Report prepared for the Ontario Energy Board, Madison, 2013. 230
An alternative measure to ratcheted maximum demand could be substation capacity. In consultation on the output
specification there was some debate as to whether substation capacity or maximum demand should be used. It
was noted that, substation capacity would capture the effect of investment in capacity in excess of requirements.
We consider that the use of ratcheted peak demand reaches a balance between these two perspectives.
7-94 Attachment 7 – Operating expenditure | Energex preliminary determination 2015–20
Fixed components of distribution output (such as providing access for each customer)
are captured by the customer numbers output. The distance over which service
providers have to distribute electricity, and the number of assets required to do so, is
likely to be captured by the circuit line length variable.
Inputs
Our benchmarking model only includes one input, which is opex. This is appropriate as
the purpose of the model is to consider the efficiency of the service providers in using
opex to deliver their outputs.
Operating environment factors
Our opex modelling directly accounts for a number of operating environment factor
differences. Economic Insights' model specification directly accounts for the main
density factors such as customer density and demand density. This is because, as
noted by Economic Insights, customer numbers, line length and ratcheted maximum
demand are included as outputs.231
The model specification also accounts for the effect of underground lines by including
an operating environment variable for the proportion of underground lines.
Underground lines will require less maintenance and no vegetation management.
Further, underground lines are less exposed to exogenous factors that may cause
network interruptions.
To capture the effect of cross country operating environment differences Economic
Insights also includes dummy variables for Ontario and New Zealand service
providers.232
We separately estimated the effect of operating environment factors that could not be
directly incorporated into Economic Insights' Cobb Douglas SFA model. Our analysis
of these adjustments is detailed in section A.6.
Some of service providers' consultants submit that we should have made adjustments
to the data prior to undertaking the modelling for operating environment factors.233 We
consider that making ex-post adjustments for operating environment factors, as
advised by Economic Insights, is an effective, reasoned and practical approach.
To adjust for operating environment factors prior to modelling we would need to adjust
each data point in the sample for the presumed effect of each operating environment
factor. This is impractical with the numerous operating environment factors we have
Ratcheted maximum demand is the highest level of demand observed over the benchmarking period. As such, it is
reflective of the capacity that was required to meet demand over the period. 231
Economic Insights, 2015, pp. 10–11. 232
Economic Insights, 2015, p. 14 (section 2.2.4) 233
Frontier, Taking account of heterogeneity between networks when conducting economic benchmarking analysis,
February 2015, p. xii. CEPA, Expert Report, Benchmarking and setting efficiency targets, 2015a, pp. 17–18.
7-95 Attachment 7 – Operating expenditure | Energex preliminary determination 2015–20
considered. To do this would involve considerable judgement regarding the effect of
operating environment factors to the 68 service providers in the sample.
Other consultants have argued that we need to directly incorporate more operating
environment factors into the model.234 We consider this approach is inappropriate as:
only a limited number of variables can be included in economic benchmarking
analysis235
Economic Insights has captured a number of important operating environment
factors directly in its model236
The availability of data on operating environment factors is a constraint on the
number of operating environment factors that can be directly incorporated into the
model237
Given these points we consider that accounting for operating environment factors not
directly incorporated in the modelling through post-model adjustments is a preferable
approach. Economic Insights supports this conclusion.238
Proposed alternative approaches are not appropriate
We prefer our benchmarking model specification to alternatives proposed by the
service providers. The model specification that Economic Insights has applied is an
appropriate approach to measuring outputs and inputs for Australian distributors in the
current context. This specification was developed the model through a rigorous
consultation process, and has been informed by industry knowledge, economic theory
and econometric expertise. As noted above, the model specification incorporates key
service provider functional output variables valued by customers.
A number of submissions have proposed alternative approaches to incorporating
outputs, inputs and operating environment factors into our benchmarking modelling.
We consider the alternative specifications proposed by consultants in the sections
below.
The inclusion of a variable for lines with a voltage of 132 kV and above
CEPA, PEG and Frontier all include a variable for lines above 66kV in their model. 239
As noted by Economic Insights, in the benchmarking data set, only service providers in
NSW, Queensland and the ACT have significant lengths of lines above this voltage.240
234
PEG, 2015, pp.52, 54. Huegin, 2015a, p.47. 235
Economic Insights, 2015, p. 12. 236
Economic Insights, 2015, p. 12. 237
Economic Insights, 2015, p. 18. 238
Economic Insights, 2015, p. 18. 239
CEPA, 2015a, p. 20. PEG, 2014, pp. 22–23. 240
Economic Insights, 2015, p. 48.
7-96 Attachment 7 – Operating expenditure | Energex preliminary determination 2015–20
There is therefore a risk that this variable may pick up other characteristics that are
shared by distributors in these states relative to distributors in the other states. This
appears to be the case.241
A useful comparison point is the costs that Ausgrid actually allocates to these assets in
its regulatory accounts which we have used to develop our operating environment
factor adjustment for these assets. Ausgrid reports its costs for 66kV and above assets
separately (as they are predominantly classified as dual function assets). In its
category analysis RIN Ausgrid allocated 7.5 per cent of its opex to 132 kV lines.
However:
CEPA's modelling implies that 31 per cent of Ausgrid's opex would be allocated to
these assets
PEG's model implies that 44 per cent of Ausgrid's opex would be allocated to these
assets
Frontier's model implies 34 per cent of Ausgrid's opex would be allocated to these
assets 242
Incorrect output specification
We consider that a number of the alternative models have an incomplete output
specification. For instance, CEPA develops a benchmarking model with only one
primary output.243 We consider that it is necessary to incorporate several output
variables to adequately represent the functional outputs of service providers, and
Economic Insights agrees.244
Huegin run a number of models using the outdated output specifications proposed by
the AER and Economic Insights when consulting on the development of benchmarking
models.245 However, Huegin did not address the issues identified by Economic Insights
when Economic Insights ran these specifications (like the multiplicative nature of the
lines and transformer capacity variable).246 These concerns were set out in the
memorandum Economic Insights developed on its MTFP benchmarking.247 We
consider that these alternative output specifications have been superseded and
Economic Insights agrees.248
PEG uses a sample of Australian and US data to model the efficiency of the US service providers. This data set is
different to that applied by Economic Insights which used service providers from New Zealand and Ontario.
However as none of the US service providers have 132 kV line lengths this variable has a similar effect to including
the 66kV plus variable in the Australian, Ontario and New Zealand benchmarking models. 241
Economic Insights, 2015, pp. 48–49. 242
Economic Insights, 2015, p. 50. 243
Economic Insights, 2015, pp. 7, 51. 244
Economic Insights, 2015, pp. 7, 51. 245
Huegin, 2015a, pp. 35–36. 246
Economic Insights, Memorandum – DNSP MTFP results, 2014. 247
Economic Insights, Memorandum – DNSP MTFP results, 2014. 248
Economic Insights, 2015, p. 51.
7-97 Attachment 7 – Operating expenditure | Energex preliminary determination 2015–20
Incorrect input specification
In a number of instances we have identified issues with the approach taken to
incorporate inputs into alternative benchmarking models. We detail these below.
Synergies applies a DEA model with three inputs: opex, MVA of transformer capacity
and the user cost of capital of distribution lines (the value used to weight capital inputs
under Economic Insights' benchmarking model).249 We consider that the addition of the
user cost of capital of distribution lines means that the modelling cannot be used to
draw conclusions in regards to opex efficiency.250
McKell's model only models a subset of opex, composed of maintenance, repair,
inspection, vegetation management and similar 'upkeep' costs.251 The upkeep costs
exclude overhead costs.252 These are a significant proportion of service provider costs.
Because costs are excluded from McKell's model it does not measure the efficiency
total opex (which also includes overhead costs and service provider operating costs).
We prefer Economic Insights' benchmarking modelling because it estimates total
opex.253 We note that the Energy Supply Association of Australia also notes this
limitation of McKell's analysis.254
PEG submits that it is necessary to levelise opex prices across service providers.255 By
‘levelising’ prices, PEG means that we should not use a common opex price index.
Instead, PEG submits that we should make allowance for possible different price levels
across service providers.256
Economic Insights explains that assuming a common annual opex price level and
growth rate across service providers provides a more accurate and unbiased
approach. This is because the mining boom in Australia has led to a high demand for
field staff of the type employed by service providers right across Australia over the last
several years. This has had the effect of greatly reducing any pre–existing labour price
differences for field staff across the country. 257
Economic Insights also observes that there is inadequate information to levelise
Australian service provider opex prices and that PEG’s attempts to introduce
differences in opex price levels and price growth rates across distributors is likely to
create errors.258
249
Synergies, 2015, p. 42. 250
Economic Insights, 2015, p. 51. 251
The McKell Institute, Nothing to gain, plenty to lose: why the government, households and businesses could end
up paying a high price for electricity privatisation, 2014, p. 34. 252
ESAA, Lies, damn lies and statistics - comparing networks, 2015. 253
Economic Insights, 2015, p. 53. 254
ESAA, Lies, damn lies and statistics - comparing networks, 2015. 255
PEGR, 2015, pp. 52, 55. 256
Economic Insights, 2015, pp. 8–9. 257
Economic Insights, 2015, pp. 8–9. 258
Economic Insights, 2015, pp. 8–9.
7-98 Attachment 7 – Operating expenditure | Energex preliminary determination 2015–20
Data
In this sub-section we explain, in response to the service providers' criticisms, why our
data is robust, reliable and used appropriately. First, we explain why we have used
international data and our approach to incorporating it. In doing so, we address the
approaches proposed by the service providers. Second, we emphasise the
comparability of the data we have used. Third, we respond to the service providers'
submissions on the quality of the data. Finally, we explain why our approach to
conducting post-modelling adjustments is preferable to alternatives put forward by the
service providers.
International data
We explained in our draft decision for the ACT and NSW service providers that
Economic Insights included international data in the econometric models. Specifically,
Economic Insights used databases of service providers from New Zealand and
Ontario.259 Economic Insights also investigated including data from the US but decided
against doing so. This was due to the US data not being of consistent quality,
incorporating data from vertically integrated monopolies (which introduces cost
allocation issues) and lacking consistent data on variables such as line length and
maximum demand.260
In response to our draft decision for the ACT and NSW service providers, the service
providers and their consultants raised several concerns with Economic Insights'
inclusion of international data including:
the model is heavily reliant on overseas data
overseas data is not comparable with Australian data
Economic Insights does not adequately account for differences between countries
Economic Insights' data contains errors.
The first three issues appear to be based on a misunderstanding of how Economic
Insights has used the international data. The concerns with data quality are also
misplaced. Economic Insights discusses international data in detail in its report in
section 3.1. We highlight the key responses below.
Rationale for including international data
As set out in the draft decision for the ACT and NSW service providers, the rationale
for Economic Insights incorporating international data into its econometric modelling is
not to undertake international benchmarking.261 Rather, by including these extra data in
259
Economic Insights, 2015, p. 26. 260
Economic Insights, 2015, pp. 25–26. 261
Economic Insights, 2015, p. 20.

7-99 Attachment 7 – Operating expenditure | Energex preliminary determination 2015–20
the sample, Economic Insights can improve the precision of the results for the
Australian service providers.
It is necessary to include international data because while the Australian database is
robust and reliable for economic benchmarking, it is small. In particular, it shows little
time-series variability—a common situation in utilities benchmarking.262 Unlike index-
based techniques such as MTFP and MPFP, econometric cost functions require a
large number of observations to produce robust results.263
Consequently, as Economic Insights explained in its report, econometric analysis using
the Australian-only data set did not produce sufficiently stable results:264
After a careful analysis of the economic benchmarking RIN data we concluded that there was insufficient variation in the data set to allow us to reliably estimate even a simple version of an opex cost function model…the time series pattern of the data is quite similar across the 13 DNSPs. Hence, in this case, there is little additional data variation supplied by moving from a cross–sectional data set of 13 observations to a panel data set of 104 observations. As a consequence we are essentially trying to use a data set with 13 observations to estimate a complex econometric model. The ‘implicit’ degrees of freedom are near zero or even negative in some cases, producing model estimates that are relatively unstable and unreliable.
The lack of time-series variation in the Australian dataset has also affected some
models developed by the service providers' consultants. CEPA, for example,
acknowledge that it was unable to accurately estimate SFA models robustly and
consistently using the Australian only data.265
Therefore, to robustly estimate the relationship between opex and outputs using an
econometric opex cost function, additional cross-sectional data—that is, more service
providers—provides a means of increasing the number of observations. This is an
approach PEG agrees with and has indeed undertaken.266 Economic Insights
concluded:267
…to obtain robust and reliable results from an econometric opex cost function analysis we needed to look to add additional cross sectional observations which meant drawing on overseas data, provided largely comparable DNSP data were available.
By including the NZ and Ontario data, Economic Insights produced econometric results
with significantly more accurate parameter estimates. Accurate parameter estimates
are essential because they enable more robust opex efficiency comparisons among
the Australian distributors.268 Further, they are important given the results are applied
262
Economic Insights, 2015, pp. 20–21. 263
Economic Insights, 2015, pp. 20–21. 264
Economic Insights (2014), pp. 28–29. 265
CEPA, 2015, p. 19. 266
PEG, 2014, pp. 53–57. 267
Economic Insights (2014), pp. 28–29. 268
Economic Insights (2014), p. 31.
7-100 Attachment 7 – Operating expenditure | Energex preliminary determination 2015–20
to our trending to forecast output changes and productivity changes. Parameter
estimates must be accurate to account for the effect of forecast output change on
opex. More precise parameter estimates allow more accurate accounting for output
change in forecasts of future opex productivity.269
Importantly, the efficiency rankings produced by the SFA model with Australian-only
data are consistent with the rankings produced by the three-country database. This
demonstrates that rather than influencing the results, the international data simply
(albeit significantly) increases our confidence in the results.270
The similarity in Australian service provider rankings using both approaches is evident
from Figure A.1, which we discuss below in 'Efficiency results'. It is, therefore,
misleading for the service providers to contend that the model is heavily reliant on
overseas data.
Approach to incorporating international data
The approach Economic Insights has taken to incorporate international data is to:
select purpose-built economic benchmarking databases used in recent regulatory
decisions which have comparable and consistent data
explicitly account for jurisdictional differences where possible.
As we explain above, the purpose of this approach is to strengthen the confidence in
the results rather than compare Australian service providers to international service
providers. For this reason, many of the concerns raised by the service providers'
consultants are misplaced.
Purpose-built databases
Economic Insights has only used databases with a long history of productivity
measurement and which the regulators of the respective jurisdictions have recently
used in their determinations. Further, Economic Insights ensured the databases
contain similar variable coverage.271
The New Zealand database, for example, is similar in construction to the Australian
database and includes consistent data from 1996 to 2013. The NZCC has used
productivity studies for regulatory determinations since 2003 with the most recent
(2014) using a similar output and input specification to that used by Economic Insights
for this determination.272
269
Economic Insights, 2015, p. 20. 270
Economic Insights, 2015, p. 25. 271
Economic Insights (2014), pp. 29–31; 272
Economic Insights (2014), pp. 29–31;

7-101 Attachment 7 – Operating expenditure | Energex preliminary determination 2015–20
Similarly, the Ontario database contains most of the same outputs as the Australian
database and includes consistent data from 2002 to 2013. The OEB used this dataset
in its most recent determination in 2013, following a study conducted by PEGR.273
Economic Insights was, therefore, satisfied that these two databases were appropriate
candidates for inclusion. In contrast, upon examination of the US database prepared
by PEG, Economic Insights was not satisfied that (among other things) it included
enough of the key quantity variables that are fundamental to productivity
measurement. Accordingly, Economic Insights did not use this database.274
Economic Insights observes that the NZCC and OEB undertook testing and validation
of the international databases such that they were comfortable with relying on them for
benchmarking in their regulatory determinations. The views of Huegin and Frontier
Economics that the data contains errors or that Economic Insights has failed to apply
due diligence to the data275 are, therefore, not convincing.
Accounting for differences
Economic Insights was explicit in identifying differences between the New Zealand and
Ontario databases and the Australian database. In particular, Economic Insights made
adjustments for:276
differences in the composition of the international databases by choosing a dataset
that balanced the number of small service providers with the number of possible
observations
possible cross-country differences and inconsistencies in accounting definitions,
price measures, regulatory and physical operating environments (such as the
impact of harsher winter conditions in Ontario) by using country dummy variables.
Limitations in the Ontario database meant Economic Insights included one operating
environment variable and no capital input variable. However, Economic Insights was
satisfied that these omissions would unlikely significantly influence the results.277
Subsequent testing of significance levels and monotonicity properties by Economic
Insights revealed this to be the case in the three models used in our decision.278
Despite this approach, one of the key concerns raised by the service providers'
consultants is that Economic Insights does not appropriately account for differences
between countries. In particular, they do not agree that the dummy variables are
adequate.279
273
Economic Insights (2014), pp. 29–31; 274
Economic Insights (2014), pp. 29–31; 275
Frontier Economics, (NSW/ACT), 2015, p. vii. Huegin, (NSW), 2015, p.15. 276
Economic Insights (2014), pp. 29–32; 277
Economic Insights (2014), p. 32; 278
Economic Insights was not satisfied, following this testing, that the SFA Translog model was robust or reliable
enough to be useful. 279
PEG, p. 55; Frontier, pp. 40, 43; CEPA, p. 17.
7-102 Attachment 7 – Operating expenditure | Energex preliminary determination 2015–20
CEPA agrees that the dummy variables control for level differences between
databases but considers they do not account for cost relationship differences.280
Similarly, Frontier Economics and PEG submit that each service provider's costs are
influenced by factors not captured by the explanatory variables in Economic Insights'
model.281
In response to this, Economic Insights considers for such differences to have a
material impact on the model results, significant differences in the technology to
distribute electricity would need to exist. Economic Insights notes the international
service providers deliver the same services using poles, wires and transformers so it
does not agree that such a fundamental difference exists.282 Economic Insights is,
therefore, confident that the dummy variables are robust and reasonable:283
Because our objective was not to undertake international benchmarking as such but, rather, to improve the precision of parameter estimates to facilitate opex efficiency measurement across the Australian DNSPs only, there is no need for the coverage of opex in each jurisdiction to be identical nor for operating environment conditions to be identical…
It is hence invalid to interpret the country dummy coefficients as differences in efficiency levels as FE has done or reflections of cost disadvantages as Synergies has done.
A detailed discussion of Economic Insights' approach to incorporating international
data is in section 3 of the report attached to this decision.
Inappropriate alternatives to Economic Insights' use of international data
proposed by the service providers
Some of the service providers' consultants have proposed alternative approaches to
using international data in the manner Economic Insights has. For example, PEG
advocates using US data284 and others, including Frontier Economics285 and CEPA286
suggest discarding the international data and relying only on Australian data.
As we explain above and Economic Insights addresses in its report, the US database
is unusable because the lack of sufficient data fundamental to productivity
measurement makes it inconsistent with the Australian database. The alternative of
relying only on Australian data is also not feasible due to the lack of time-series
variation that may lead to unstable results, which PEG and CEPA recognise.287
280
CEPA, p. 17. 281
Frontier, p. 18; PEG, p. 55. 282
Economic Insights (2014), p. 14. 283
Economic Insights (2014), p. 17. 284
PEG, 2014, pp. 57–63 285
Frontier, pp. xviii–xix, 100–102. 286
CEPA, pp. 16–22. 287
PEG, pp. 53–57; CEPA, p. 19.
7-103 Attachment 7 – Operating expenditure | Energex preliminary determination 2015–20
Frontier Economics' 'strong' recommendation that we completely discard Economic
Insights' model is also not feasible given the NER requirements that we conduct
benchmarking.288 Further, for the reasons outlined in this report, we consider that
Economic Insights' data and modelling is robust.
Comparability of data
Our draft decision for the ACT and NSW service providers view was that the data we
have relied on for economic benchmarking is robust, reliable and comparable.
We collected consistent data from all service providers using the same reporting
requirements, following extensive consultation with the service providers and other
stakeholders. The RIN requirements allowed some reporting flexibility, including the
ability to estimate data if actual data were not available. However, the requirements
and definitions were clear. Further, we required the RIN responses to be independently
audited and also certified by the service providers' CEOs. Therefore, we were satisfied
the data is sufficiently comparable across service providers.
In addition, on the recommendation of Economic Insights, our draft decision
adjustments for the ACT and NSW service providers incorporated an allowance in
favour of the service providers to allow for potential data and modelling issues:289
[I]t is prudent to adopt a conservative approach to choosing an appropriate benchmark for efficiency comparisons. Adopting a conservative approach allows for general limitations of the models with respect to the specification of outputs and inputs, data imperfections and other uncertainties…
Rather than adopt the frontier DNSP as the benchmark for efficiency comparisons, we are of the view that it would be prudent to instead adopt a weighted average of the efficiency scores in the top quartile of the efficiency score range…This is equivalent to allowing an additional margin on the frontier DNSP’s input use of 10 per cent in calculating the benchmark for the NSW/ACT DNSPs (0.95/1.1 = 0.86) and is thus a relatively generous allowance.
The service providers raised a number of concerns about the robustness of the
Australian data and the comparability of service providers. In particular, submissions
considered that:
Australian service providers are among the largest in the benchmarking sample,
especially Essential Energy and Ergon Energy290
many variables in the economic benchmarking RIN were not provided by service
providers on a consistent basis291
288
Frontier, pp. vii–viii. 289
Economic Insights, 2014, pp. 47–48. 290
Frontier Economics, (NSW/ACT) 2015, pp. 25–31. Synergies, (Ergon) 2015, pp. 4–5; Huegin, (NSW), 2015,
pp.58–59. 291
PwC, pp. 24–32.
7-104 Attachment 7 – Operating expenditure | Energex preliminary determination 2015–20
we have not taken into account certain differences between services providers,
including related party arrangements.292
Relative size of service providers
With reference to the appropriateness of international service providers, several
consultant reports consider that the Australian service providers are disadvantaged
because they have some of the longest circuit lengths in the benchmarking sample.
They consider Essential Energy and Ergon Energy are particularly disadvantaged
because they have the longest circuit length and the lowest customer density of all
service providers.293 They also noted that Ausgrid and Energex have a high customer
numbers and ratcheted maximum demand relative to the sample average.
We disagree that the size of the Australian service providers are not a comparative
disadvantage to other providers in the sample.
Rural providers with very low customer density
Economic Insights considers that the long circuit length of Essential Energy and Ergon
Energy does not underestimate their efficiency. Economic Insights states that if
Essential Energy and Ergon Energy were genuine outliers, it would expect the flexible
translog function to given them much higher efficiency scores than the less flexible
Cobb Douglas function. The results, however, are very similar.294
Economic Insights acknowledges that it would be desirable to have more 'large' rural
providers in the sample, but considers these two service providers are unusual with no
service providers in comparable countries with accessible data having the same extent
of lines.295 Economic Insights did not consider there was justification to adjust Essential
Energy's and Ergon Energy's efficiency scores on the basis of their very low customer
density.
While comforted by Economic Insights' reasoning, we also engaged EMCa to consider
whether—from an engineering perspective—the relationship between opex and
customer density changes at the very low densities of Essential Energy and Ergon
Energy. EMCa found it is feasible to compare sparse rural distributors (like Essential
Energy and Ergon) with other rural distributors included in the benchmarking data
set.296 As such, the findings for our benchmarking model are applicable to the sparse
rural service providers.
In any event, the service providers used to derive the benchmark frontier (that we
compared Essential Energy to in the draft decision) contains three rural providers—
292
PwC, pp. 33–37. 293
Frontier Economics, (NSW/ACT) 2015, pp. 25–31. Synergies, (Ergon) 2015, pp. 4–5; Huegin, (NSW), 2015,
pp.58–59. 294
Economic Insights, 2015, p. 30. 295
Economic Insights (2015), p. 30 (section 3.3) 296
EMCA, 2015, p. 1.

7-105 Attachment 7 – Operating expenditure | Energex preliminary determination 2015–20
Powercor, SA Power Networks and AusNet Services. Further, we have changed the
benchmark comparison point to AusNet services, who is at the bottom of the top
quartile of observed scores, which means we have given more weight to (among other
things) the characteristics of these rural providers. In our view, this significantly
mitigates any perceived disadvantage Essential Energy and Ergon Energy face due to
their low customer density.
Customer numbers and demand
While Ausgrid and Energex may have high customer numbers and ratcheted maximum
demand relative to the sample average, we do not consider they are comparatively
disadvantaged. Economic Insights advises that there are sufficient comparably sized
service providers to conclude that Ausgrid and Energex are not significantly distant
from other observations such that they would be considered outliers.297
The consistent results of the benchmarking models, including consistency with the
MPFP model (which does not include the international data) provides comfort that
Ausgrid and Energex are sufficiently comparable to other service providers in the
sample.
Consistency of variables
Some submissions considered that service providers may not have provided several
variables in the economic benchmarking RIN on a consistent basis.298 We do not
consider these concerns are valid, or are sufficiently significant for us to not to conduct
benchmarking. Economic Insights, as an economic benchmarking expert, is well
qualified to form an opinion on the appropriateness of data for economic
benchmarking. As we explained in our draft decision for the ACT and NSW service
providers, Economic Insights considered the Australian database to be robust and
suitable for economic benchmarking:299
Given the extensive process that has been gone through in forming the AER’s economic benchmarking RIN database to ensure maximum consistency and comparability both across DNSPs and over time, the database is fit for the purpose of undertaking economic benchmarking to assess DNSP opex efficiency levels and to estimate models that can be used to forecast future opex partial productivity growth rates.
The econometric models require only six aggregate variables from the service
providers to function effectively (network services opex, energy delivered, customer
numbers, ratcheted maximum demand, circuit length and proportion of underground
cables). Many submissions on data comparability do not actually relate to these
variables. Accordingly, we consider concerns raised about the following matters are
not relevant to our findings:
297
Economic Insights, 2015, p. 30. 298
PwC, pp. 24–32. 299
Economic Insights, 2014, p. 3.
7-106 Attachment 7 – Operating expenditure | Energex preliminary determination 2015–20
RAB values300 – these are not included in the opex modelling
differences in opex category reporting, including treatment of metering costs –
Economic Insights' model's use total network services opex, which excludes
metering
revenue data – our benchmarking models do not rely on revenue
route line length – we have not used route line length in the opex models301
inconsistency in energy density and customer density calculations – these
measures are not central to our analysis but, in any case, we rely on our own
calculations, which are on a consistent basis
system and operating model changes – the aggregate nature of the required
variables and our precise definitions for these variables mitigate the impact of such
changes
weather adjusted maximum demand – we do not use this data
To the extent that PwC and EY submit that circuit length the data is not appropriate for
use in benchmarking because some service providers have estimated it, we
consider:302
As we explain below, neither PwC nor EY demonstrate that the data is not suitable.
we consider that the estimates are reasonable because the service providers are
the best placed to estimate their own asset characteristics and their CEOs have
certified they are the best estimates the service provider can provide
where estimated circuit length may vary from actual circuit length, we would be
concerned if service providers were able only to estimate a value—of core assets
they manage—that deviated from reality to the point where it would result in a
material difference to their benchmarking performance.
300
RAB data is relevant to our MTFP model and opex MPFP model. We use RAB data to weight the volume of inputs
and outputs. However, because MTFP is an index-based benchmarking method, the outcomes of the MTFP model
will be less sensitive to the weighting of inputs than they will be to the amounts of the inputs themselves.
Therefore, any purported comparability concerns with RAB data will have only a very minimal impact on the MTFP
results. Economic Insights, 2015. 301
We have used route line length normalise the results of our PPIs. However, we consider that discrepancies in the
measurement of route line length will not affect the conclusions of this analysis. The large differences in customer
density in these models are not likely to be impacted by slight inaccuracies in the estimates of route line length. In
addition, as part of our testing and validation process, we identified and adjusted for the issue with UED's route line
length identified by PwC. We circulated this data set to all service providers with our draft economic benchmarking
report and published this data set on our website with our draft determination. 302
PWC, 2015, p. 31. EY, Briefing Paper: RIN Data Review Ergon Energy, 13 February 2015, pp. 6–7.
7-107 Attachment 7 – Operating expenditure | Energex preliminary determination 2015–20
Differences between service providers
Some submissions raise comparability matters that are relevant to our opex
modelling.303 However, we have taken these into account in our draft and final
decisions:
differences in capitalisation policies and cost allocation methods – we considered
these as part of our operating environment factor assessment and made an
adjustment if we considered one was warranted304
differences in vegetation management clearance requirements between states –
we considered this as part of our operating environment factor assessment and
made an adjustment if we considered one was warranted305
differences in network age, service quality and reliability standards – we considered
these as part of our operating environment factor assessment and made an
adjustment if we considered one was warranted306
related party arrangements – considered as part of our examination of opex factors.
We considered ownership arrangements are not a key concern for total opex
assessment because benchmarking enables us to compare the relative efficiency
of each service provider's opex regardless of the arrangements they have in place
(which are the service provider's choice)307
provision reporting – service providers must develop their provision accounts in
accordance with consistent Australian accounting standards so they must meet the
same requirements even if they may be named differently. Further, opex reported
on a cash basis and accrual basis to be approximately equal on average. 308 Hence
the use of eight years of panel data to derive an average efficiency score for the
period will reduce the effect that provisions could have on the benchmarking
results.
In our draft decision for the ACT and NSW service providers, we did not explicitly
consider differences in the allocation of responsibility for vegetation management
across states or differences in fuel mix. In this final decision, however, we consider
them as part of our operating environment factor assessment in section A.6.
303
PwC, pp. 33–37. 304
AER, Draft decision – attachment 7, section A.5. 305
AER, Draft decision – attachment 7, section A.5. 306
AER, Draft decision – attachment 7, section A.5. 307
AER, Draft decision – attachment 7, p. 7–24. 308
Economic Insights, 2015, p. 56.
7-108 Attachment 7 – Operating expenditure | Energex preliminary determination 2015–20
Data quality
The service providers and their consultants submitted they had some concerns
regarding the quality of benchmarking data we have used.309 We disagree with their
submissions and maintain our draft decision for the ACT and NSW service providers
view that our dataset is of good quality. As we mentioned above, Economic Insights
considers our dataset is robust:
While no dataset will likely ever be perfect, the AER’s economic benchmarking RIN data provides the most consistent and thoroughly examined DNSP dataset yet assembled in Australia… the AER’s economic benchmarking RIN data are also considerably more detailed, comprehensive and consistent than regulatory data in comparable countries, including the United States. The Australian output and input data used in this study are thus considered to be quite robust and to compare more than favourably with overseas datasets used in previous studies.
PEG also submits that our dataset is "generally of good quality".310 The CCP also
praised the data, noting that it was supplied by the service providers.311 Further,
Jemena Gas Networks, and AusNet Services (Gas) have recently asked us to rely on
their gas data after submitting benchmarking models prepared by Economic Insights.
312 The data they have relied on has not been subject to the same rigorous testing and
validation process that the economic benchmarking RIN data has been subject to.
In this sub-section we briefly reiterate our data collection and validation process before
addressing previous comments regarding data quality and explaining why alternatives
proposed by the service providers are unreasonable.
Data collection and validation process
The development of our benchmarking dataset has come about as the result of a
public consultation process that began May 2012. We presented the full process we
went through to collect, test and validate the data in our approach section. This
process included several open workshops to discuss data requirements and four
explicit opportunities for service providers to comment on the data prior to submitting
unaudited RIN responses.313
309
Essential Energy, Revised revenue proposal, 2015, p. 189; Endeavour Energy, Revised regulatory proposal,
2015, p. 169; Ausgrid, Revised regulatory proposal, 2015, p. 130; ActewAGL, Revised regulatory proposal, 2015,
p. 83; CEPA Expert Report, Benchmarking and setting efficiency targets p. 32 310
PEGR, 2014, p. 30. 311
CCP, Responding to NSW draft determinations and revised proposals from electricity distribution networks, 2015,
p. 50. 312
Economic Insights, The Productivity Performance of Jemena Gas Networks’ NSW Gas Distribution System
Jemena Gas Networks (NSW) – Access Arrangement Information – Appendix 6.7, August 2009
Economic Insights, 2013–2017 Gas Access Arrangement Review – Access Arrangement Information Appendix 6B,
2012. 313
We circulated, for comment,(1) preliminary EB RIN templates (2) revised preliminary RIN templates (3) draft RIN
templates (4) draft expenditure forecast assessment guidelines.
7-109 Attachment 7 – Operating expenditure | Energex preliminary determination 2015–20
Following this process, and before requiring audited RIN responses, we initiated a
comprehensive testing and validation process involving:
comparing RIN information with information previously reported by service
providers (such as regulatory proposals, previous RIN responses and distributor
annual reports) to ensure consistency
reviewing time series data to identify any anomalous data points
reviewing bases of preparation to ensure the service providers prepared the data in
accordance with the RIN instructions and definitions
comparing data across service providers to identify potential anomalies.
Where we identified anomalies or inconsistencies we drew these to the attention of the
service providers. Ultimately, to ensure that the data was reliable we required
independent audit of the service providers' RIN responses prior to final submission and
the service providers' CEOs to sign a statutory declaration attesting to the robustness
of the data.
We then published the audited RIN data on our website and called for submissions on
the data.314 In response, only Citipower and Powercor raised specific issues regarding
data quality, which we addressed.315 We subsequently undertook further review of
audited RIN responses and discussed any further data issues directly with the relevant
service providers.
When we consulted on our draft benchmarking reports in August 2014, we again
circulated our benchmarking data set. In this process, Energex raised the only
significant data-related issue, relating to the inclusion of feed-in tariffs. To account for
this submission we excluded the value of feed in tariffs from opex.316
In the course of our testing and validation process, we found that some responses for
certain variables (particularly for several operating environment variables) were not
robust. Accordingly, we decided not to use these variables.
We are not professing that our benchmarking dataset is perfect. However, Economic
Insights considers no dataset is ever likely to be perfect (Frontier Economics
agrees317), and ours is suitable for benchmarking.318 We are satisfied that we have
314
We did not only publish the data, but we also published the basis of preparation of each of the service providers of
the data. The basis of preparation describes how the service providers completed the templates. 315
Citipower and Powercor, Publication Of The Economic Benchmarking RIN, June 2014. Citipower and Powercor
commented on differences in the calculation of MVA capacity of lines across the service providers. They
recommended that "The AER sensitivity test the impact on the benchmarking results by applying standard capacity
values across different DNSPs". In response to this comment we undertook sensitivity tests of the data.
Submissions are on our website at: www.aer.gov.au/node/25078. 316
Energex's submission is on our website at: www.aer.gov.au/node/25078. 317
Frontier, p. 101. 318
Economic Insights, 2014, p. 3.

7-110 Attachment 7 – Operating expenditure | Energex preliminary determination 2015–20
undertaken a very comprehensive and inclusive process to develop a database that is
sufficiently robust and reliable for benchmarking purposes.
Further, the data that we have used in our benchmarking models is aggregate data
that the service providers themselves require for their own purposes. This data
includes historic opex, reliability, demand, customers and the number and size or
capacity of key assets. The customer numbers we use, for example, are the number of
National Metering Identifiers that the service providers must submit to AEMO for
settlement purposes.
Without reliable information on the quantity, location, nature and condition of their
networks and assets, service providers would be unable to effectively (or safely)
operate and maintain their networks. We also note that the data produced in the
economic benchmarking RINs is derived from the same systems the service providers
use to prepare their regulatory proposals, which they use to justify increases in
revenue.
Previous comments on data quality
The service providers point to past comments the AER/ACCC, AEMC, PC and
Economic Insights have made about benchmarking data as a reason why they
consider our current benchmarking data is not robust.319 The submissions highlight:320
the AER's 2008 opinion that it did not have robust, consistent and reliable long term
data suitable for TFP
Economic Insights' 2009 view that the regulatory data available at the time were not
fit for the purpose of a robust TFP analysis of the standard required to base
regulatory pricing and revenue determinations on
the AEMC's decision in 2011 not to adopt TFP for price and revenue
determinations
the PC's conclusion in April 2013 that there was little immediate scope for
benchmarking to play a decisive role in determinations due to its incipiency.
Some service providers raised similar concerns during the development of our
economic benchmarking RIN, in September 2013, also referring to the AEMC's TFP
review. In that process, we explained that the AEMC's comments about data
availability and quality related to data in the public domain or used in previous
regulatory decisions.321
319
ActewAGL, Revised Regulatory Proposal, pp. 125–134, attachment C12; Ausgrid, Revised Regulatory Proposal,
pp. 130–142. 320
ActewAGL, Revised Regulatory Proposal, pp. 125–134, attachment C12; Ausgrid, Revised Regulatory Proposal,
pp. 130–142. 321
AER, Draft RIN for economic benchmarking–explanatory statement, September 2013, pp. 16–17.
7-111 Attachment 7 – Operating expenditure | Energex preliminary determination 2015–20
The same applies here. All of the above statements relate to data existing in the public
domain or used in determinations at the time (that is, prior to April 2013). We collected
the data we are using in this determination at the end of April in 2014.
Given the aforementioned positive comments about our current benchmarking data,
we are not convinced that the service providers' submissions have merit.
Alternative approaches proposed by service providers
On behalf of the service providers, Frontier Economics considers we should spend
more time collecting 'more consistent and reliable data across distributors' and work
collaboratively with the service providers. In doing so, Frontier Economics observes
that Ofgem has undertaken a decade or more of development work in respect of its
data collection.322 CEPA also comments that if we had consistent data across the
Australian service providers we may not need to rely on international data.323
Notwithstanding our view that our data is of good quality now, this alternative is not
feasible. Econometric benchmarking analysis with Australian service providers can
only be conducted with the international data. This is due to the cross-sectional
variation issue we discuss above. As PEG observes, the number of companies in the
Australian sample will always be limited, even as additional years of data
accumulate.324
As for Frontier Economics' observations of Ofgem, we note the following. According to
CEPA, in its 1999 price review for distribution services Ofgem benchmarked operating
expenditure. It did so with only one year of opex data that required a number of
significant adjustments. Using this data Ofgem developed a simple benchmarking
model with only one dependent variable and determined the UK service providers
could reduce their opex by 16 per cent (on average). The service providers
subsequently were able to reduce their opex by 20 per cent (on average).325
We do not consider that Ofgem's approach was perfect. It does, however, indicate that
Ofgem has in previously implemented opex benchmarking using a less sophisticated
and less rigorously tested database than our own to determine expenditure
requirements.
Adjustments to data
CEPA submits that our approach of adjusting for identified operating environment
factors not explicitly included in the econometric models is ‘not in line with the
322
Frontier, pp. 102–103. 323
C3 - CEPA Expert Report, Benchmarking and setting efficiency targets p. 54–55 324
PEG, p. 65. 325
CEPA, Background to work on assessing efficiency for the 2005 distribution price control review, 2003, pp.43–44,
54.
7-112 Attachment 7 – Operating expenditure | Energex preliminary determination 2015–20
approach used by Ofgem’. CEPA's view is that a better approach is to adjust for
operating environment differences prior to conducting the modelling.326
Economic Insights disagrees that the post-modelling adjustment approach is
inappropriate. Economic Insights considers that given the purpose of the study,
adjustment for operating environment factors can be done either:327
as part of the modelling, if sufficient information is available for all included service
providers across all jurisdictions, or
after the modelling if data for particular variables are not universally and
consistently available across countries, but are available for Australian distributors.
Economic Insights has adopted the latter approach because—given we are comparing
Australian service provider performance to the most efficient Australian providers—the
requisite information is not available for all service providers across all jurisdictions.
Economic Insights also notes that degrees of freedom considerations limit the number
of operating environment variables that can usefully be included directly in economic
benchmarking models. This means that making the use of subsequent adjustment is
the only way of allowing a fuller treatment of operating environment factors. Therefore,
while Economic Insights' approach may be different to that adopted by Ofgem, it is a
valid approach and one that makes optimal use of the information available.328 By
adopting the two step approach our analysis includes allowance for the impact of many
more operating environment factors than have earlier economic benchmarking studies
and the alternative models advanced by the distributors’ consultants.329
We consider specific operating environment factors in detail in section A.6.
Estimation methods
In this sub-section we compare and contrast our estimation methods with the
alternatives proposed by the service providers' consultants. First, we explain what we
have done and why. Second, we explain why we have not used data envelopment
analysis (DEA) and why the DEA analysis used by the service providers' consultants is
inappropriate. Third, we demonstrate why the service providers' estimation methods
are not robust or reliable.
326
CEPA, 2015b, p.18 327
Economic Insights, 2015, p. 18. 328
Economic Insights, 2015, p. 18. 329
Economic Insights, 2015, pp. 18–19.

7-113 Attachment 7 – Operating expenditure | Energex preliminary determination 2015–20
Our estimation methods
We have applied the best available model for estimating efficient opex. Economic
Insights explains that our Cobb Douglas SFA model is statistically superior to other
benchmarking methods for the following reasons:330
it specifies the relationship between opex and outputs and some operating
environment factors in an opex cost function (unlike DEA and MPFP)
it directly estimates an efficient frontier (unlike econometric models and MPFP)
it contains a random error term that separates the effect of data noises or random
errors from inefficiency (unlike econometric models, DEA and MPFP)
the results of the Cobb Douglas SFA model can be verified with statistical testing
(unlike DEA and MPFP).
In addition, Economic Insights undertook tests of the Cobb Douglas SFA model and
have found that:331
all the parameters are of the expected sign
the parameter estimates all have plausible values
estimated coefficients are statistically significant which indicates that they have
been estimated to a high degree of precision
the confidence intervals for the efficiency scores are relatively narrow.
We have further confidence that the Cobb Douglas SFA model is appropriate because
Economic Insights has also been able to corroborate the SFA model by producing
consistent results using:
other sophisticated econometric opex models using the same set of explanatory
variables (Cobb Douglas LSE and translog LSE) that are more appropriate than the
alternatives proposed by the service providers
the opex MPFP model, which applies a different model specification and does not
rely on international data.
In addition, the results of our partial performance indicators and detailed review are
consistent with the economic benchmarking results.
Data envelopment analysis
Some submissions suggested we should use DEA because we foreshadowed we
would use it in our expenditure forecast assessment guideline. However, we have
chosen not to apply DEA because it is an inferior modelling technique to a SFA model.
330
Economic Insights, 2014, pp. 7–8. 331
Economic Insights, 2014, pp. 31–34.
7-114 Attachment 7 – Operating expenditure | Energex preliminary determination 2015–20
As Economic Insights observes, DEA may identify certain service providers as efficient
by default.332 This is because DEA estimates the efficient frontier based upon the
observed input and output combinations of service providers. This problem is
compounded with the inclusion of additional output variables.333 This is a particular
concern when DEA is applied to a small sample of service providers (such as the
Australian only data set).334
In addition, DEA models do not produce confidence intervals for efficiency estimates
and DEA requires a large number of observations to be implemented satisfactorily. 335
Economic Insights considers that SFA is a preferable form of econometric model
because it separates out the inefficiency component from the random noise component
of the error term.336
In our expenditure forecast assessment guideline we indicated that we would use DEA.
However, we also specified that we would take a holistic approach to developing
benchmarking models based upon the availability of data. Once we received
benchmarking data we discovered that we were able to develop a statistically superior
SFA model. As such, we have decided to depart from the approach we set out in the
Guideline.
The service providers' estimation methods are not sufficiently robust or
reliable
A number of consultancy reports submitted have presented alternative benchmarking
models to cross-check opex cost modelling by Economic Insights.337 Depending on
the model specification, these estimation methods differ in how they estimate
inefficiencies, unobserved firm heterogeneity effect, and random errors. The modelling
differences include:
treatment of unobserved firm heterogeneity and its separation from inefficiency
the distributional form applied to modelled inefficiency
The inclusion or exclusion of a random error term and the characteristics of this
random error term.
The results of these models differ to that of Economic Insights. In our view, this is
because the alternative models presented by the service providers' consultants are not
robust. We outline our views on the alternative models below.
332
Economic Insights, 2015, p. 41. 333
Economic Insights, 2015, p. 41. 334
Economic Insights, 2015, p. 41. 335
Economic Insights, 2015, p. 41. 336
Economic Insights, 2015, p. 41. 337
Huegin, 2015(a,b), Frontier, 2015(a,b), Synergies, 2015b.
7-115 Attachment 7 – Operating expenditure | Energex preliminary determination 2015–20
Use of DEA
A number of the service providers' consultants have chosen to develop DEA models.
We have noted the limitations of DEA models above.
For instance, Huegin, Synergies and Frontier apply DEA models using a variety of
inputs and outputs.338 Frontier Economics finds more service providers to be efficient
when additional output variables are added to the model or variable returns-to-scale
technology is imposed. This illustrates the 'efficient by default' problem when using
DEA. Economic Insights notes that Increasing the number of outputs from three to four
increases the number of DNSPs with scores above 0.95 from two to seven, while also
introducing variable returns to scale further increases the number with scores above
0.95 to 10 – simply because the sample is not large enough to support sensible
efficiency analysis using this method.339
True fixed-effects (FE) model and true random-effects (RE) models
Frontier Economics developed FE and RE models. These models assume inefficiency
varies randomly over time.340 Consequently they attribute inefficiency that does not
vary over time to latent heterogeneity.341 This is an incorrect assumption where
inefficiency persists over time as in such a circumstance these models will
systematically underestimate inefficiency. Economic Insights notes that these models
find very large mean efficiency scores which it considers would appear to be
unreasonably high given what is known about the relative performance of firms in this
sample from other sources.342 Economic Insights also noted that, to its knowledge,
these models have not been applied by any regulator in any country due to the
inherent problems with the underlying assumptions in the models.343
Latent class modelling and k-means clustering
Huegin, in their report for the NSW and ACT service providers, use latent class SFA
models to identify heterogeneity in the dataset.344 In this methodology, clustering
methods are used to identify subsets of the sample data so that separate efficiency
frontiers can be estimated for each subset. Huegin's modelling is flawed, however,
because:
Huegin did not include country dummy variables in its modelling to capture cross
country differences.345
338
Huegin, 2015a, Synergies. 339
Economic Insights, 2015, p. 41. 340
Economic Insights, 2015, p. 33. 341
Economic Insights, 2015, p. 34. 342
Economic Insights, 2015, p. 34. 343
Economic Insights, 2015, p. 34. 344
Huegin, (NSW/ACT), 2015, p. 56. 345
Economic Insights, 2015, p. 38.
7-116 Attachment 7 – Operating expenditure | Energex preliminary determination 2015–20
Huegin did not report parameter estimates for the model. When parameter
estimates were later provided on request, some of the estimated coefficients had
the incorrect signs346
Latent class modelling will understate inefficiency because dividing any data set
into subsets the mean efficiency score will almost invariably increase as the sample
size decreases. 347
In their subsequent report for Ergon Energy Huegin apply a different statistical
technique, k–means clustering. This is used to look for clusters (classes) in Economic
Insight's data set.348 This approach has the following problems:349
the Huegin clustering exercise involves a simple comparison of means, which is a
linear analysis. The Economic Insights (2014) models are non–linear economic
cost function models (Cobb–Douglas and translog) which are used to capture the
classic diminishing marginal returns nature of economic cost structures.
Huegin exclude the country–level dummy variables from the analysis, which
introduces misspecification.
The clustering methods identify clusters of service providers that are similar to each
other in terms of closeness of their means. They do not provide evidence that the
service providers in these clusters are significantly different from each other nor
that they belong to separate cost functions.
Efficiency results
In this sub-section we address the robustness and reliability of our approach, in light of
the results of the service providers' alternative models. The service providers, their
consultants and the McKell Institute submit that our benchmarking results are sensitive
to the modelling approach and model specification adopted. They present alternatives
to demonstrate this. They consider the extent of the variation in outcomes indicates the
poor explanatory power of our benchmarking as a proxy for the real operating costs of
the service providers.350
We agree that different modelling techniques and model specifications will produce
different results. However, as we demonstrated above, Economic Insights' modelling is
robust whereas the alternatives developed by the consultants of the service providers
346
Economic Insights, 2015, p. 39. 347
Economic Insights, 2015, p. 39. 348
Huegin, (Ergon), 2015. 349
Economic Insights, 2015, p. 39 350
ActewAGL, Revised regulatory proposal, 2015. p.151 p. 175. Essential Energy, Revised regulatory proposal, 2015,
p. 182. Ausgrid, Revised regulatory proposal, 2015, p. 143. Huegin, (NSW/ACT), 2015, pp. 11–19. ActewAGL,
Revised regulatory proposal, 2015, p.131–132, p. 149; CEPA, 2015a, pp. 23–32; PEG, 2015, pp. 55–56;
Huegin,2015, pp. 35–36; Synergies, 2015. ; Frontier Economics, 2015. ; McKell Institute, 2014.

7-117 Attachment 7 – Operating expenditure | Energex preliminary determination 2015–20
are not. Economic Insights has considered the alternative models proposed by the
service providers' consultants in detail and has identified significant deficiencies.351
Our results are robust and reliable
Our view is that the results of Economic Insights' modelling are robust and reliable
because the model specification, data and estimation methods are superior to
everything proposed by the service providers and their consultants. The CCP agree
that the model is robust and reliable:352
Our assessment is that the work is thorough, and that care has been taken in choosing appropriate models, testing them and defining their limitations including the standard errors of their estimates. We find the consistency of its partial slope coefficients (across models) and the narrowness of its standard errors reassuring. The explanatory factors that the model has chosen are consistent with those we have seen in other modelling exercises…and the ordinary least squares and least square dummy variable approaches are well accepted.
Model specification
As we outline above, Economic Insights' model specification, in combination with a
subsequent adjustment for operating environment factors, is appropriate because:
it is informed by economic theory, engineering knowledge and industry expertise
the inputs to the model reflect the key functions of service providers and the
outputs reflect what is valued by customers
the ex post operating environment factor adjustment involves a thorough
assessment of potential differences between the service provider in question and
the frontier service providers.
In contrast, the alternative model specifications presented by the service providers'
consultants seem to have little regard for the ultimate purpose of the benchmarking
exercise. This is to, as accurately as possible, determine the efficiency of opex by
examining the relationship between inputs and outputs. The service providers'
alternative models either:
Include a variable to capture the cost of lines above 66 kV that picks up other
effects and leads to efficiency gaps being understated 353
do not cover key functional outputs—CEPA, for example, presents a function with
only one or two outputs, which is not adequate to accurately model service provider
cost characteristics354
351
Economic Insights, 2015, p. 53. 352
CCP, p. 51. 353
Economic Insights (2015), pp. v–vi. 354
Economic Insights (2015), pp. 51.
7-118 Attachment 7 – Operating expenditure | Energex preliminary determination 2015–20
inappropriately measure inputs, such as Synergies use of input variables other than
opex and PEGR's levelisation of opex prices.355
Data
As explained above, the data we have used is robust because:
we developed the Australian dataset in consultation with the service providers and
then conducted extensive testing and validation to ensure the variables relevant to
the benchmarking models were reliable and fit for purpose
the international datasets we use to improve the precision of the Australian
efficiency results:
o are used for economic benchmarking purposes by the regulators in the
respective jurisdictions (OEB and NZCC)
o contain sufficiently comparable service provider information for the purpose
of enhancing the precision of the modelling results
o have been in place in the mid–1990s and have been used in economic
benchmarking since the early 2000s.
Conversely, the service providers seek to:
either rely only on the Australian data, which does not produce stable results due to
the lack of cross-sectional variation or
include US data in the sample, which Economic Insights has demonstrated is not fit
for purpose.
Estimation methods
Our use of Economic Insights modelling is appropriate as Economic Insights has
applied the best available model for estimating efficient opex. They have chosen
appropriate estimation methods that produce robust and reliable results for
benchmarking opex. Economic Insights' Cobb Douglas SFA model is statistically
superior to other benchmarking methods because it can (among other things) estimate
the efficient frontier. Further the Cobb Douglas SFA model has a random error term
that separates the effect of data noises or random errors from inefficiency.356 .
Economic Insights has also been able to corroborate the SFA model by producing
consistent results using:
355
Economic Insights (2015), p. 51. 356
Economic Insights, 2014, p. 7.
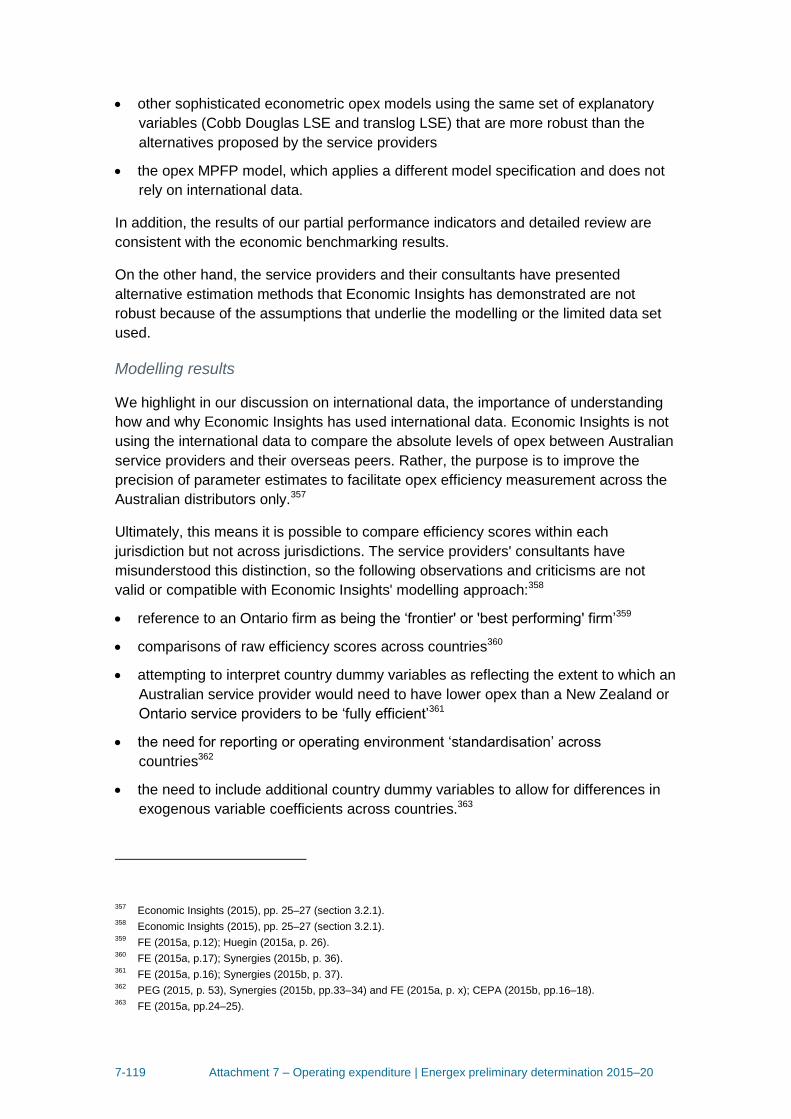
7-119 Attachment 7 – Operating expenditure | Energex preliminary determination 2015–20
other sophisticated econometric opex models using the same set of explanatory
variables (Cobb Douglas LSE and translog LSE) that are more robust than the
alternatives proposed by the service providers
the opex MPFP model, which applies a different model specification and does not
rely on international data.
In addition, the results of our partial performance indicators and detailed review are
consistent with the economic benchmarking results.
On the other hand, the service providers and their consultants have presented
alternative estimation methods that Economic Insights has demonstrated are not
robust because of the assumptions that underlie the modelling or the limited data set
used.
Modelling results
We highlight in our discussion on international data, the importance of understanding
how and why Economic Insights has used international data. Economic Insights is not
using the international data to compare the absolute levels of opex between Australian
service providers and their overseas peers. Rather, the purpose is to improve the
precision of parameter estimates to facilitate opex efficiency measurement across the
Australian distributors only.357
Ultimately, this means it is possible to compare efficiency scores within each
jurisdiction but not across jurisdictions. The service providers' consultants have
misunderstood this distinction, so the following observations and criticisms are not
valid or compatible with Economic Insights' modelling approach:358
reference to an Ontario firm as being the ‘frontier' or 'best performing' firm’359
comparisons of raw efficiency scores across countries360
attempting to interpret country dummy variables as reflecting the extent to which an
Australian service provider would need to have lower opex than a New Zealand or
Ontario service providers to be ‘fully efficient’361
the need for reporting or operating environment ‘standardisation’ across
countries362
the need to include additional country dummy variables to allow for differences in
exogenous variable coefficients across countries.363
357
Economic Insights (2015), pp. 25–27 (section 3.2.1). 358
Economic Insights (2015), pp. 25–27 (section 3.2.1). 359
FE (2015a, p.12); Huegin (2015a, p. 26). 360
FE (2015a, p.17); Synergies (2015b, p. 36). 361
FE (2015a, p.16); Synergies (2015b, p. 37). 362
PEG (2015, p. 53), Synergies (2015b, pp.33–34) and FE (2015a, p. x); CEPA (2015b, pp.16–18). 363
FE (2015a, pp.24–25).
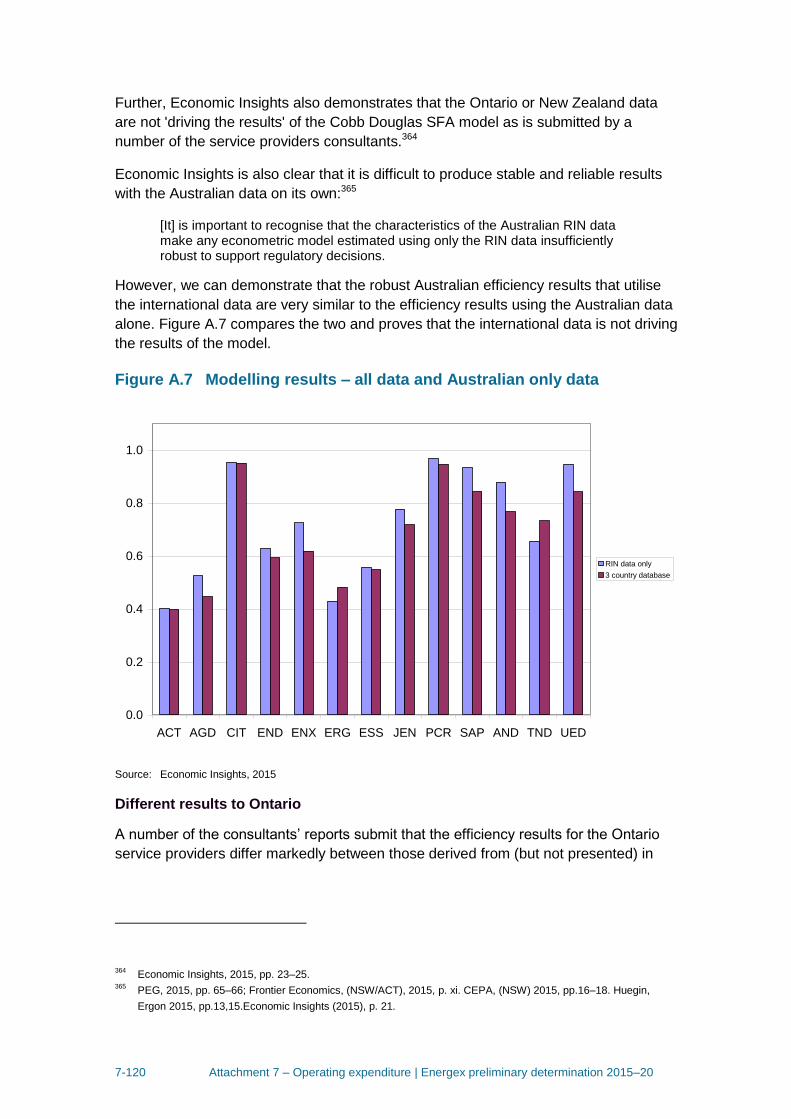
7-120 Attachment 7 – Operating expenditure | Energex preliminary determination 2015–20
Further, Economic Insights also demonstrates that the Ontario or New Zealand data
are not 'driving the results' of the Cobb Douglas SFA model as is submitted by a
number of the service providers consultants.364
Economic Insights is also clear that it is difficult to produce stable and reliable results
with the Australian data on its own:365
[It] is important to recognise that the characteristics of the Australian RIN data make any econometric model estimated using only the RIN data insufficiently robust to support regulatory decisions.
However, we can demonstrate that the robust Australian efficiency results that utilise
the international data are very similar to the efficiency results using the Australian data
alone. Figure A.7 compares the two and proves that the international data is not driving
the results of the model.
Figure A.7 Modelling results – all data and Australian only data
Source: Economic Insights, 2015
Different results to Ontario
A number of the consultants’ reports submit that the efficiency results for the Ontario
service providers differ markedly between those derived from (but not presented) in
364
Economic Insights, 2015, pp. 23–25. 365
PEG, 2015, pp. 65–66; Frontier Economics, (NSW/ACT), 2015, p. xi. CEPA, (NSW) 2015, pp.16–18. Huegin,
Ergon 2015, pp.13,15.Economic Insights (2015), p. 21.
0.0
0.2
0.4
0.6
0.8
1.0
ACT AGD CIT END ENX ERG ESS JEN PCR SAP AND TND UED
RIN data only
3 country database
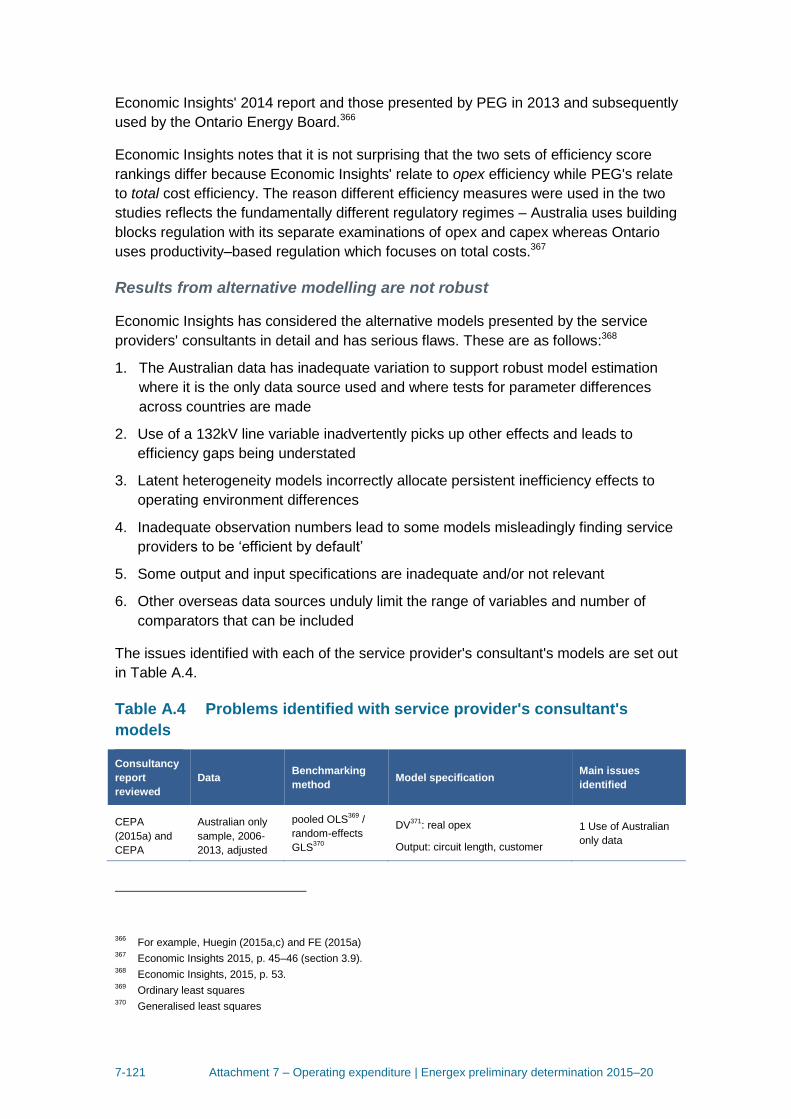
7-121 Attachment 7 – Operating expenditure | Energex preliminary determination 2015–20
Economic Insights' 2014 report and those presented by PEG in 2013 and subsequently
used by the Ontario Energy Board.366
Economic Insights notes that it is not surprising that the two sets of efficiency score
rankings differ because Economic Insights' relate to opex efficiency while PEG's relate
to total cost efficiency. The reason different efficiency measures were used in the two
studies reflects the fundamentally different regulatory regimes – Australia uses building
blocks regulation with its separate examinations of opex and capex whereas Ontario
uses productivity–based regulation which focuses on total costs.367
Results from alternative modelling are not robust
Economic Insights has considered the alternative models presented by the service
providers' consultants in detail and has serious flaws. These are as follows:368
1. The Australian data has inadequate variation to support robust model estimation
where it is the only data source used and where tests for parameter differences
across countries are made
2. Use of a 132kV line variable inadvertently picks up other effects and leads to
efficiency gaps being understated
3. Latent heterogeneity models incorrectly allocate persistent inefficiency effects to
operating environment differences
4. Inadequate observation numbers lead to some models misleadingly finding service
providers to be ‘efficient by default’
5. Some output and input specifications are inadequate and/or not relevant
6. Other overseas data sources unduly limit the range of variables and number of
comparators that can be included
The issues identified with each of the service provider's consultant's models are set out
in Table A.4.
Table A.4 Problems identified with service provider's consultant's
models
Consultancy
report
reviewed
Data Benchmarking
method Model specification
Main issues
identified
CEPA
(2015a) and
CEPA
Australian only
sample, 2006-
2013, adjusted
pooled OLS369
/
random-effects
GLS370
DV371
: real opex
Output: circuit length, customer
1 Use of Australian
only data
366
For example, Huegin (2015a,c) and FE (2015a) 367
Economic Insights 2015, p. 45–46 (section 3.9). 368
Economic Insights, 2015, p. 53. 369
Ordinary least squares 370
Generalised least squares
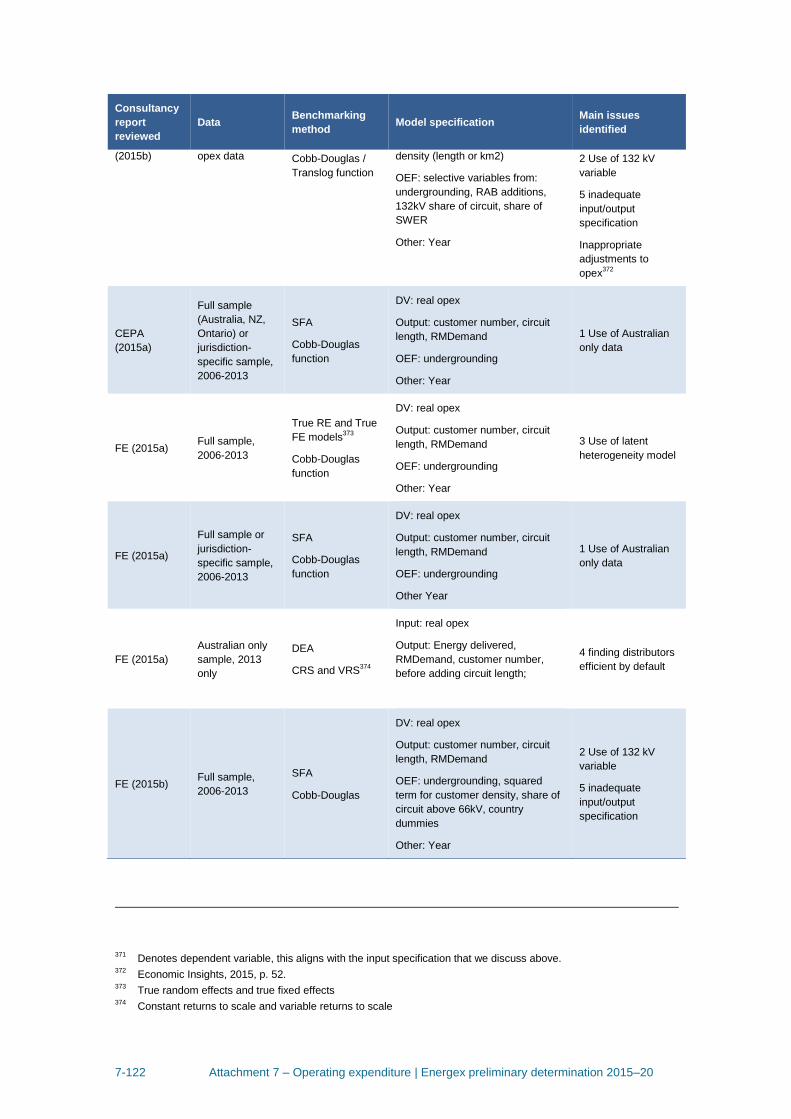
7-122 Attachment 7 – Operating expenditure | Energex preliminary determination 2015–20
Consultancy
report
reviewed
Data Benchmarking
method Model specification
Main issues
identified
(2015b) opex data Cobb-Douglas /
Translog function
density (length or km2)
OEF: selective variables from:
undergrounding, RAB additions,
132kV share of circuit, share of
SWER
Other: Year
2 Use of 132 kV
variable
5 inadequate
input/output
specification
Inappropriate
adjustments to
opex372
CEPA
(2015a)
Full sample
(Australia, NZ,
Ontario) or
jurisdiction-
specific sample,
2006-2013
SFA
Cobb-Douglas
function
DV: real opex
Output: customer number, circuit
length, RMDemand
OEF: undergrounding
Other: Year
1 Use of Australian
only data
FE (2015a) Full sample,
2006-2013
True RE and True
FE models373
Cobb-Douglas
function
DV: real opex
Output: customer number, circuit
length, RMDemand
OEF: undergrounding
Other: Year
3 Use of latent
heterogeneity model
FE (2015a)
Full sample or
jurisdiction-
specific sample,
2006-2013
SFA
Cobb-Douglas
function
DV: real opex
Output: customer number, circuit
length, RMDemand
OEF: undergrounding
Other Year
1 Use of Australian
only data
FE (2015a)
Australian only
sample, 2013
only
DEA
CRS and VRS374
Input: real opex
Output: Energy delivered,
RMDemand, customer number,
before adding circuit length;
4 finding distributors
efficient by default
FE (2015b) Full sample,
2006-2013
SFA
Cobb-Douglas
DV: real opex
Output: customer number, circuit
length, RMDemand
OEF: undergrounding, squared
term for customer density, share of
circuit above 66kV, country
dummies
Other: Year
2 Use of 132 kV
variable
5 inadequate
input/output
specification
371
Denotes dependent variable, this aligns with the input specification that we discuss above. 372
Economic Insights, 2015, p. 52. 373
True random effects and true fixed effects 374
Constant returns to scale and variable returns to scale
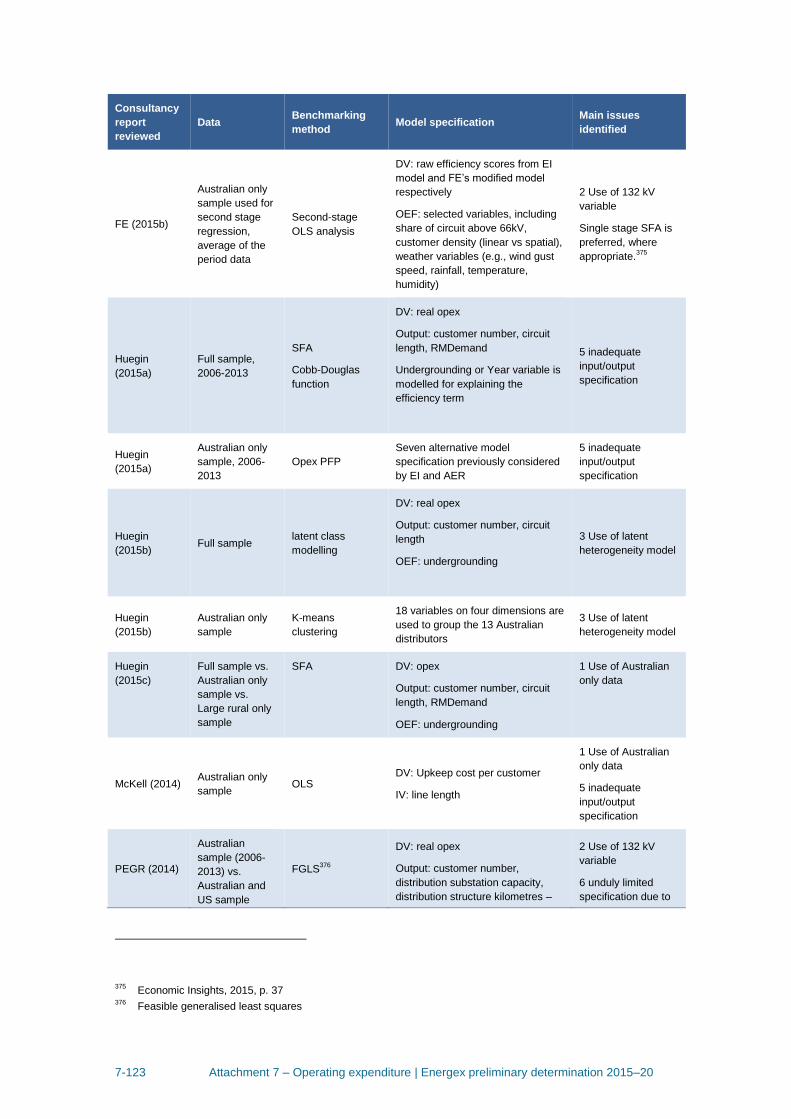
7-123 Attachment 7 – Operating expenditure | Energex preliminary determination 2015–20
Consultancy
report
reviewed
Data Benchmarking
method Model specification
Main issues
identified
FE (2015b)
Australian only
sample used for
second stage
regression,
average of the
period data
Second-stage
OLS analysis
DV: raw efficiency scores from EI
model and FE’s modified model
respectively
OEF: selected variables, including
share of circuit above 66kV,
customer density (linear vs spatial),
weather variables (e.g., wind gust
speed, rainfall, temperature,
humidity)
2 Use of 132 kV
variable
Single stage SFA is
preferred, where
appropriate.375
Huegin
(2015a)
Full sample,
2006-2013
SFA
Cobb-Douglas
function
DV: real opex
Output: customer number, circuit
length, RMDemand
Undergrounding or Year variable is
modelled for explaining the
efficiency term
5 inadequate
input/output
specification
Huegin
(2015a)
Australian only
sample, 2006-
2013
Opex PFP
Seven alternative model
specification previously considered
by EI and AER
5 inadequate
input/output
specification
Huegin
(2015b) Full sample
latent class
modelling
DV: real opex
Output: customer number, circuit
length
OEF: undergrounding
3 Use of latent
heterogeneity model
Huegin
(2015b)
Australian only
sample
K-means
clustering
18 variables on four dimensions are
used to group the 13 Australian
distributors
3 Use of latent
heterogeneity model
Huegin
(2015c)
Full sample vs.
Australian only
sample vs.
Large rural only
sample
SFA DV: opex
Output: customer number, circuit
length, RMDemand
OEF: undergrounding
1 Use of Australian
only data
McKell (2014) Australian only
sample OLS
DV: Upkeep cost per customer
IV: line length
1 Use of Australian
only data
5 inadequate
input/output
specification
PEGR (2014)
Australian
sample (2006-
2013) vs.
Australian and
US sample
FGLS376
DV: real opex
Output: customer number,
distribution substation capacity,
distribution structure kilometres –
2 Use of 132 kV
variable
6 unduly limited
specification due to
375
Economic Insights, 2015, p. 37 376
Feasible generalised least squares
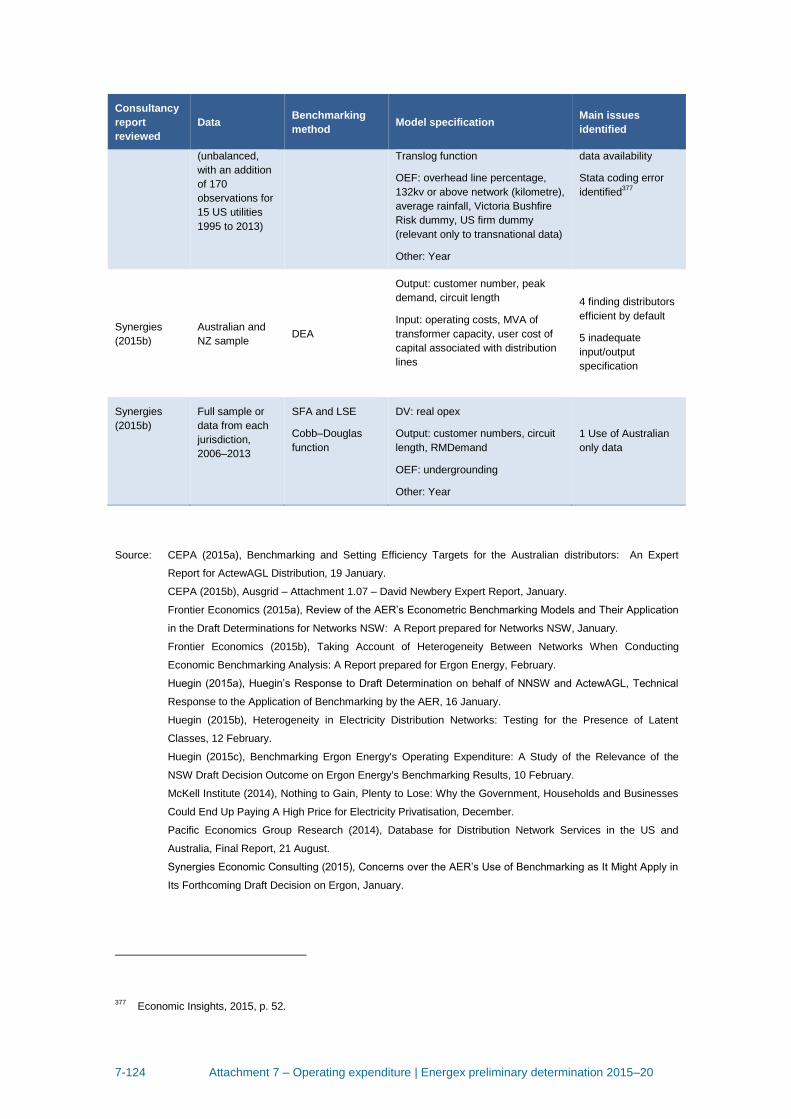
7-124 Attachment 7 – Operating expenditure | Energex preliminary determination 2015–20
Consultancy
report
reviewed
Data Benchmarking
method Model specification
Main issues
identified
(unbalanced,
with an addition
of 170
observations for
15 US utilities
1995 to 2013)
Translog function
OEF: overhead line percentage,
132kv or above network (kilometre),
average rainfall, Victoria Bushfire
Risk dummy, US firm dummy
(relevant only to transnational data)
Other: Year
data availability
Stata coding error
identified377
Synergies
(2015b)
Australian and
NZ sample DEA
Output: customer number, peak
demand, circuit length
Input: operating costs, MVA of
transformer capacity, user cost of
capital associated with distribution
lines
4 finding distributors
efficient by default
5 inadequate
input/output
specification
Synergies
(2015b)
Full sample or
data from each
jurisdiction,
2006–2013
SFA and LSE
Cobb–Douglas
function
DV: real opex
Output: customer numbers, circuit
length, RMDemand
OEF: undergrounding
Other: Year
1 Use of Australian
only data
Source: CEPA (2015a), Benchmarking and Setting Efficiency Targets for the Australian distributors: An Expert
Report for ActewAGL Distribution, 19 January.
CEPA (2015b), Ausgrid – Attachment 1.07 – David Newbery Expert Report, January.
Frontier Economics (2015a), Review of the AER’s Econometric Benchmarking Models and Their Application
in the Draft Determinations for Networks NSW: A Report prepared for Networks NSW, January.
Frontier Economics (2015b), Taking Account of Heterogeneity Between Networks When Conducting
Economic Benchmarking Analysis: A Report prepared for Ergon Energy, February.
Huegin (2015a), Huegin’s Response to Draft Determination on behalf of NNSW and ActewAGL, Technical
Response to the Application of Benchmarking by the AER, 16 January.
Huegin (2015b), Heterogeneity in Electricity Distribution Networks: Testing for the Presence of Latent
Classes, 12 February.
Huegin (2015c), Benchmarking Ergon Energy's Operating Expenditure: A Study of the Relevance of the
NSW Draft Decision Outcome on Ergon Energy's Benchmarking Results, 10 February.
McKell Institute (2014), Nothing to Gain, Plenty to Lose: Why the Government, Households and Businesses
Could End Up Paying A High Price for Electricity Privatisation, December.
Pacific Economics Group Research (2014), Database for Distribution Network Services in the US and
Australia, Final Report, 21 August.
Synergies Economic Consulting (2015), Concerns over the AER’s Use of Benchmarking as It Might Apply in
Its Forthcoming Draft Decision on Ergon, January.
377
Economic Insights, 2015, p. 52.

7-125 Attachment 7 – Operating expenditure | Energex preliminary determination 2015–20
Partial performance indicators
PPIs are complementary to economic benchmarking. We can compare the results from
each method to crosscheck their validity. High costs on a single PPI do not necessarily
indicate an inefficient level of base opex because each PPI examines only one driver
of costs. However, if a service provider has high costs on several PPIs, it is likely that
service provider's base level of opex is inefficient. In this respect, it is useful to
compare PPI results with the economic benchmarking results.
For the purpose of PPI comparisons, we have chosen two 'per customer' metrics and
used them to compare Energex and Ergon Energy to Powercor. This provides an
indication of the magnitude of their costs – using an alternative benchmarking
technique – relative to one of the top performers for economic benchmarking.
We have presented the metrics against customer density, which is the number of
customers per km of route line length. We have done this because less dense (that is,
rural) service providers have more assets per customer so they appear to have high
higher costs on 'per customer' metrics than urban service providers. Presenting metrics
against customer density provides a visualisation of the service providers' relative
densities and makes it easier to distinguish between urban providers, rural providers
and those in between. This then enables more meaningful comparisons.
Powercor's customer density makes it a better point of comparison to Energex and
Ergon Energy than CitiPower (the other top performer) because CitiPower is
significantly denser than all other service providers. Powercor, on the other hand, is
closer in customer density to Ergon Energy and has a lower customer density than
Energex. This means, in theory that Powercor should appear to be at a cost
disadvantage relative Energex (due to Energex’s higher customer density).
Importantly, this is a limitation of PPIs only; it does not apply to our economic
benchmarking techniques because they explicitly take customer density into account.
Operating environment considerations
PPIs do not explicitly account for operating environment factors, so we must bear this
in mind when interpreting the results. However, we have taken measures to minimise
the effects of operating environment factors on PPIs. To account for scale, we have
normalised our PPIs by customer numbers. Customer numbers is an easily
understandable output measure that reflects the relative scale of service providers.
Economic benchmarking also suggests customer numbers is the most significant driver
of costs.
Total customer cost
Total customer cost for network services is a partial performance measure of the costs
incurred by service providers that they pass on to customers. It includes opex, return
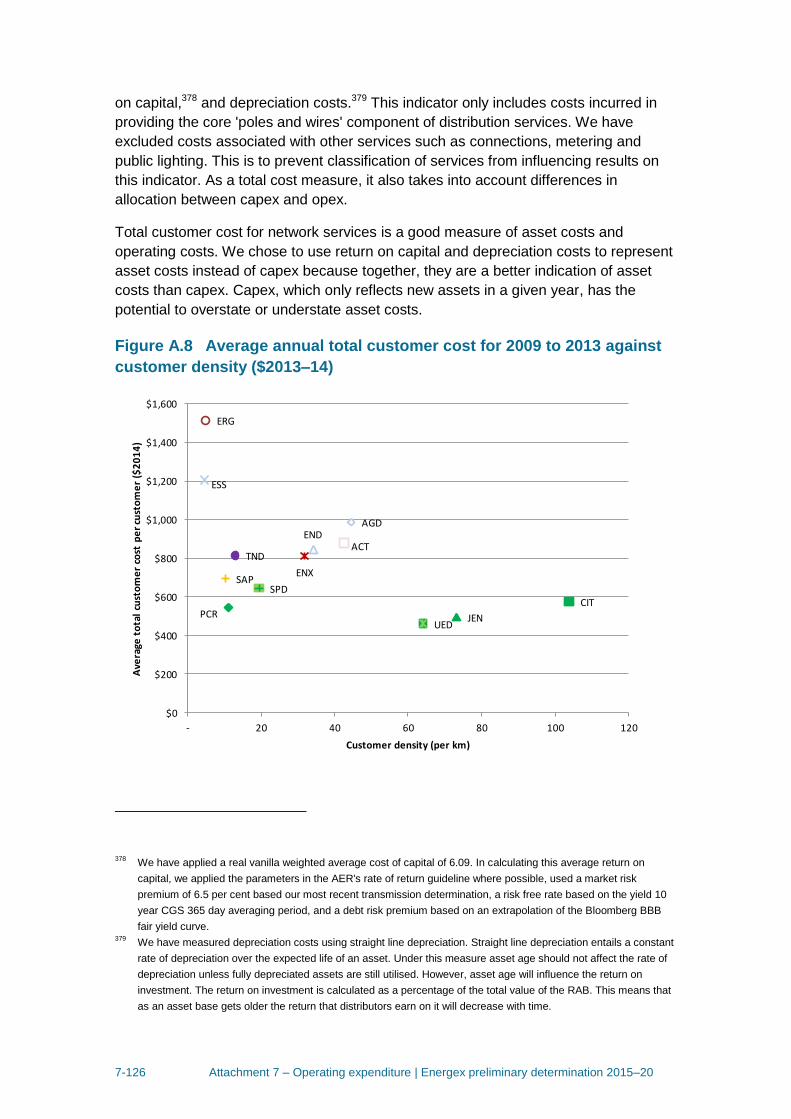
7-126 Attachment 7 – Operating expenditure | Energex preliminary determination 2015–20
on capital,378 and depreciation costs.379 This indicator only includes costs incurred in
providing the core 'poles and wires' component of distribution services. We have
excluded costs associated with other services such as connections, metering and
public lighting. This is to prevent classification of services from influencing results on
this indicator. As a total cost measure, it also takes into account differences in
allocation between capex and opex.
Total customer cost for network services is a good measure of asset costs and
operating costs. We chose to use return on capital and depreciation costs to represent
asset costs instead of capex because together, they are a better indication of asset
costs than capex. Capex, which only reflects new assets in a given year, has the
potential to overstate or understate asset costs.
Figure A.8 Average annual total customer cost for 2009 to 2013 against
customer density ($2013–14)
378
We have applied a real vanilla weighted average cost of capital of 6.09. In calculating this average return on
capital, we applied the parameters in the AER's rate of return guideline where possible, used a market risk
premium of 6.5 per cent based our most recent transmission determination, a risk free rate based on the yield 10
year CGS 365 day averaging period, and a debt risk premium based on an extrapolation of the Bloomberg BBB
fair yield curve. 379
We have measured depreciation costs using straight line depreciation. Straight line depreciation entails a constant
rate of depreciation over the expected life of an asset. Under this measure asset age should not affect the rate of
depreciation unless fully depreciated assets are still utilised. However, asset age will influence the return on
investment. The return on investment is calculated as a percentage of the total value of the RAB. This means that
as an asset base gets older the return that distributors earn on it will decrease with time.
ACT
AGD
CIT
END
ENX
ERG
ESS
JENPCR
SAPSPD
TND
UED
$0
$200
$400
$600
$800
$1,000
$1,200
$1,400
$1,600
- 20 40 60 80 100 120
Ave
rage
to
tal
cust
om
er
cost
pe
r cu
sto
me
r ($
20
14
)
Customer density (per km)
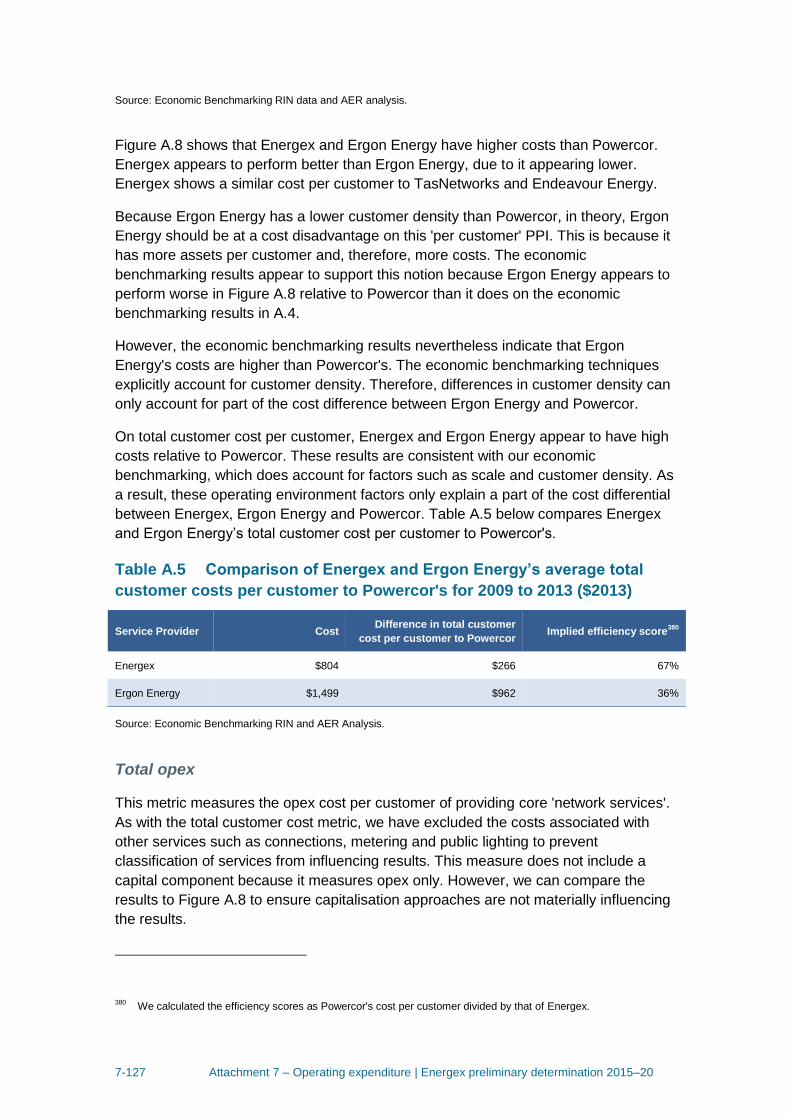
7-127 Attachment 7 – Operating expenditure | Energex preliminary determination 2015–20
Source: Economic Benchmarking RIN data and AER analysis.
Figure A.8 shows that Energex and Ergon Energy have higher costs than Powercor.
Energex appears to perform better than Ergon Energy, due to it appearing lower.
Energex shows a similar cost per customer to TasNetworks and Endeavour Energy.
Because Ergon Energy has a lower customer density than Powercor, in theory, Ergon
Energy should be at a cost disadvantage on this 'per customer' PPI. This is because it
has more assets per customer and, therefore, more costs. The economic
benchmarking results appear to support this notion because Ergon Energy appears to
perform worse in Figure A.8 relative to Powercor than it does on the economic
benchmarking results in A.4.
However, the economic benchmarking results nevertheless indicate that Ergon
Energy's costs are higher than Powercor's. The economic benchmarking techniques
explicitly account for customer density. Therefore, differences in customer density can
only account for part of the cost difference between Ergon Energy and Powercor.
On total customer cost per customer, Energex and Ergon Energy appear to have high
costs relative to Powercor. These results are consistent with our economic
benchmarking, which does account for factors such as scale and customer density. As
a result, these operating environment factors only explain a part of the cost differential
between Energex, Ergon Energy and Powercor. Table A.5 below compares Energex
and Ergon Energy’s total customer cost per customer to Powercor's.
Table A.5 Comparison of Energex and Ergon Energy’s average total
customer costs per customer to Powercor's for 2009 to 2013 ($2013)
Service Provider Cost Difference in total customer
cost per customer to Powercor Implied efficiency score
380
Energex $804 $266 67%
Ergon Energy $1,499 $962 36%
Source: Economic Benchmarking RIN and AER Analysis.
Total opex
This metric measures the opex cost per customer of providing core 'network services'.
As with the total customer cost metric, we have excluded the costs associated with
other services such as connections, metering and public lighting to prevent
classification of services from influencing results. This measure does not include a
capital component because it measures opex only. However, we can compare the
results to Figure A.8 to ensure capitalisation approaches are not materially influencing
the results.
380
We calculated the efficiency scores as Powercor's cost per customer divided by that of Energex.
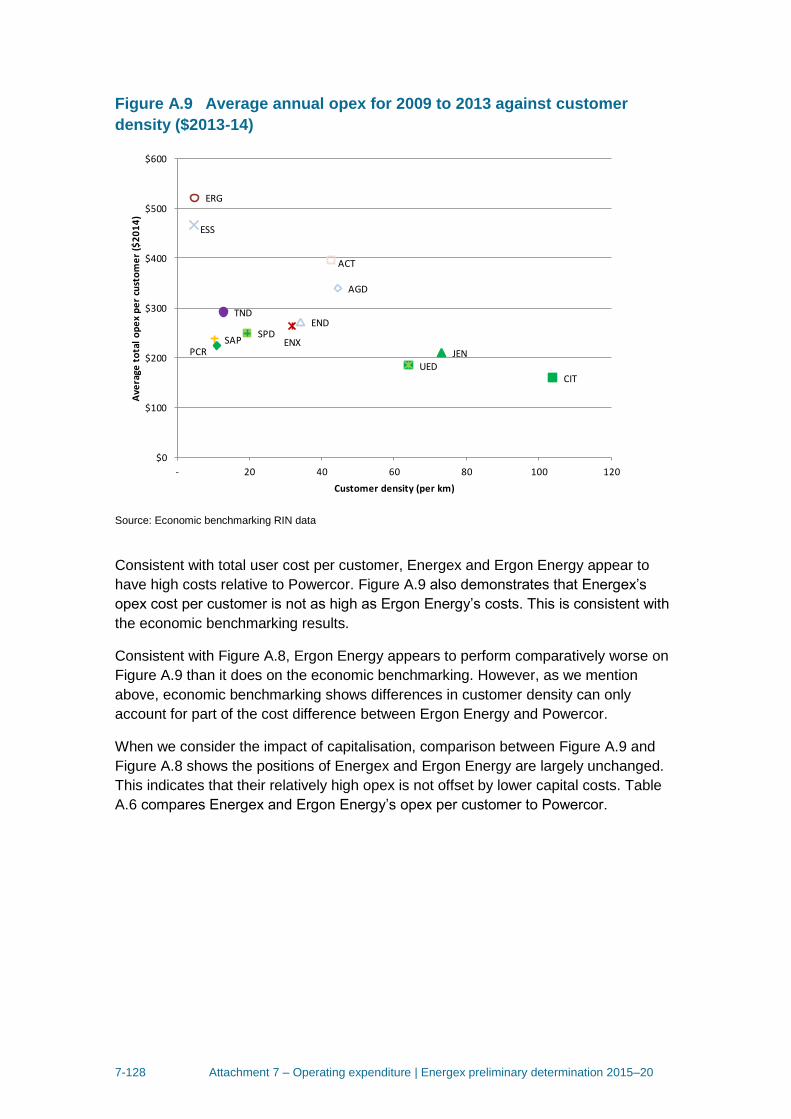
7-128 Attachment 7 – Operating expenditure | Energex preliminary determination 2015–20
Figure A.9 Average annual opex for 2009 to 2013 against customer
density ($2013-14)
Source: Economic benchmarking RIN data
Consistent with total user cost per customer, Energex and Ergon Energy appear to
have high costs relative to Powercor. Figure A.9 also demonstrates that Energex’s
opex cost per customer is not as high as Ergon Energy’s costs. This is consistent with
the economic benchmarking results.
Consistent with Figure A.8, Ergon Energy appears to perform comparatively worse on
Figure A.9 than it does on the economic benchmarking. However, as we mention
above, economic benchmarking shows differences in customer density can only
account for part of the cost difference between Ergon Energy and Powercor.
When we consider the impact of capitalisation, comparison between Figure A.9 and
Figure A.8 shows the positions of Energex and Ergon Energy are largely unchanged.
This indicates that their relatively high opex is not offset by lower capital costs. Table
A.6 compares Energex and Ergon Energy’s opex per customer to Powercor.
ACT
AGD
CIT
END
ENX
ERG
ESS
JENPCRSAP
SPD
TND
UED
$0
$100
$200
$300
$400
$500
$600
- 20 40 60 80 100 120
Ave
rage
to
tal
op
ex
pe
r cu
sto
me
r ($
20
14
)
Customer density (per km)
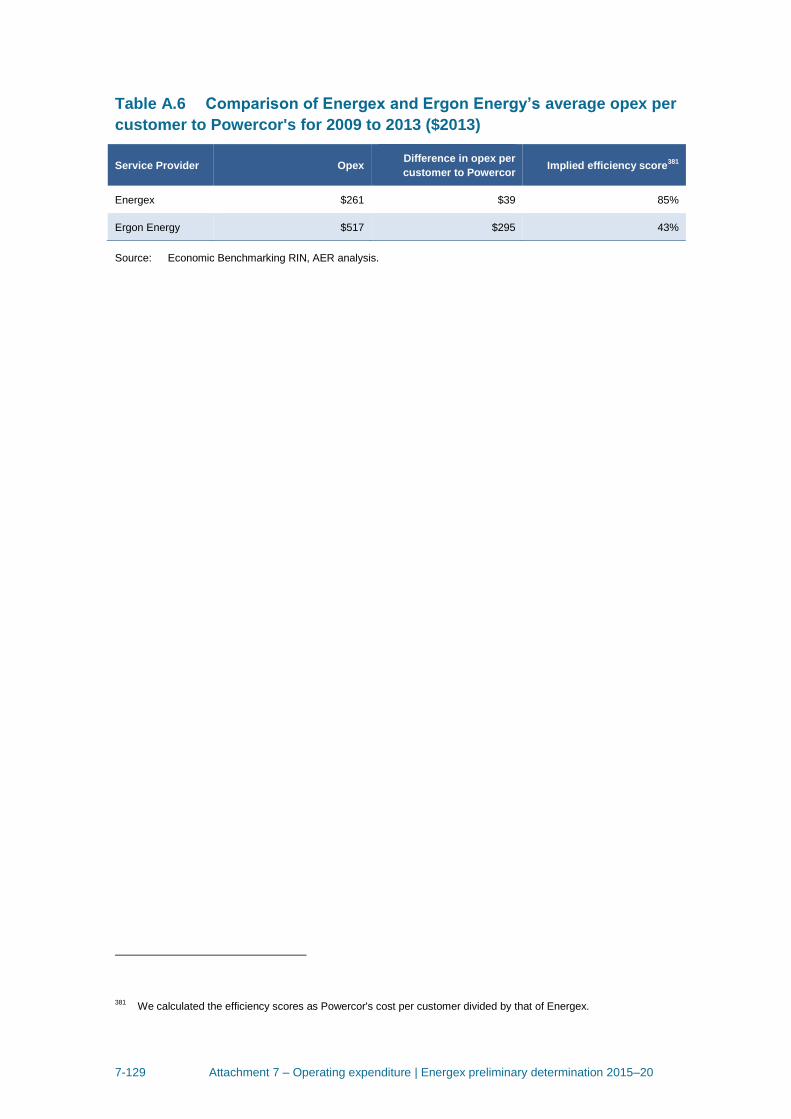
7-129 Attachment 7 – Operating expenditure | Energex preliminary determination 2015–20
Table A.6 Comparison of Energex and Ergon Energy’s average opex per
customer to Powercor's for 2009 to 2013 ($2013)
Service Provider Opex Difference in opex per
customer to Powercor Implied efficiency score
381
Energex $261 $39 85%
Ergon Energy $517 $295 43%
Source: Economic Benchmarking RIN, AER analysis.
381
We calculated the efficiency scores as Powercor's cost per customer divided by that of Energex.
7-130 Attachment 7 – Operating expenditure | Energex preliminary determination 2015–20
A.5 Category analysis and qualitative review
The aim of this section is to investigate the gap in performance that we identified in our
economic benchmarking analysis between Energex, Ergon Energy and the frontier
service providers. This is a two stage process where we first examine the service
providers' proposals and use category analysis to identify potential drivers of the gap in
performance, and then conduct targeted detailed reviews based on our first stage
findings.
We have:
examined the service providers' explanations of opex drivers in their regulatory
proposals and supporting material (stage 1)
conducted category analysis benchmarking for major categories of opex (stage 1)
engaged Deloitte Access Economics (Deloitte) to review the reasons for the service
providers' benchmarking performance, including the extent they had implemented
the recommendations of the recent review by the Independent Review Panel (IRP)
(stage 2).
This analysis can corroborate our economic benchmarking analysis, which looks at the
efficiency of opex overall. It can do so by identifying factors that are contributing to the
service providers' overall efficiency performance, and identifying whether base opex
contains inefficiencies.
Importantly, the NER require us to form a view on total forecast opex.382 In doing so,
we are not required to assess individual projects or components of a forecast. It is,
therefore, appropriate for us to rely on top down techniques such as economic
benchmarking to assess whether a service provider's opex proposal reasonably
reflects the opex criteria. However, while we could have relied solely on our economic
benchmarking techniques to form a view about the efficiency of opex, we have
supplemented that analysis with category analysis and detailed review. This is
consistent with the Guideline, which explains that we would apply a number of different
techniques to form a view about the efficiency of base opex.383
Category analysis and detailed review can assist in identifying whether base opex
contains inefficiencies when they examine large portions of opex.
Therefore, we have used category analysis metrics to identify categories of
expenditure that are high relative to other service providers. However, we consider it is
appropriate to use the IRP review as the basis for our detailed review, because it
examined significant components of expenditure such as overhead and other labour-
382
NER, cl. 6.5.6(c). 383
AER, Better regulation: Expenditure forecast assessment guideline for electricity distribution, November 2013,
pp. 12–15.
7-131 Attachment 7 – Operating expenditure | Energex preliminary determination 2015–20
related matters, and the review overlaps with the results of the category analysis
metrics. While we have not reviewed every category of expenditure, by reviewing
Energex's and Ergon Energy's labour costs (which comprise approximately 75 per cent
of Ergon Energy's and 95 per cent for Energex's opex in 2012–13384) in detail, we are
examining a significant proportion of their opex.
We are not using category analysis and detailed review to either examine all of opex or
produce highly disaggregated findings. The NER do not require us to conduct, and
indeed, the regulatory regime discourages us from conducting, a complete 'line by line'
bottom up review of a service provider’s operations. Category analysis and detailed
review are not designed to reconcile with our overall benchmarks, they are designed to
identify and explain the drivers of efficiency performance.
As set out in Section A.2, in the context of information asymmetry between the
regulator and the service provider, it is neither feasible nor desirable for the regulator to
make findings at a granular level about the manner in which a service provider should
operate. It is for the service provider's management to decide how best to operate its
network with the opex that we determine reasonably reflects the opex criteria. We have
primarily formed a view about efficiency drawing on the results of overall outcomes
(economic benchmarking), which is corroborated by the detailed review.
A.5.1 Findings from the service providers' proposals
We examined Energex's and Ergon Energy's regulatory proposals which both state
that they are in the process of transitioning to more efficient opex levels over time. This
implies that both service providers are capable of meeting the opex criteria while
spending less opex than they currently do. This supports the view that Energex's and
Ergon Energy's proposed base year (2012–13) opex is not appropriate for forecasting
opex over the 2015–20 period in accordance with the NER.
As we explain in Section A.3, we develop our own estimate of total forecast opex to
compare with a service provider's proposal. While we might find that the base opex is
not efficient, it may be that a service provider has proposed forecast opex lower than
current levels, leading to us approving its overall opex forecast.
This section presents some evidence from the service providers' regulatory proposals
(and subsequent submissions) to support the findings that their revealed opex is not an
appropriate starting point for developing a forecast to compare with the service
providers' forecast opex.
Background
The Queensland Government engaged an expert panel in 2011 to review the
operations of Energex and Ergon Energy in what was termed the Electricity Network
384
Energex, Response to information request AER Energex 002, received 19 December 2014; Ergon Energy,
Response to information request AER Ergon 021, received 31 January 2015.
7-132 Attachment 7 – Operating expenditure | Energex preliminary determination 2015–20
Capital Program Review (the ENCAP Review).385 The ENCAP Review resulted in
revised security and reliability standards, which gave rise to a significant reduction in
the program of work for the current and forthcoming regulatory control period.386
In May 2012, the Queensland Government initiated the Interdepartmental Committee
on Electricity Sector Reform (IDC) to undertake a broad assessment of the electricity
industry. The IDC appointed a network-specific Independent Review Panel (IRP) to
provide recommendations regarding the optimal structure and efficiency of distribution
businesses. The IRP provided recommendations to the IDC in May 2013.387 The
Queensland Government accepted 44 of the 45 recommendations the IRP made to the
IDC.388
In response to the IRP and the ENCAP Review, both Energex and Ergon undertook a
series of efficiency programs aimed at addressing recommendations and criticisms
presented in the ENCAP Review, and addressing issues that were investigated as part
of the IRP report.389
Energex
Energex's regulatory proposal states that it identified additional efficiencies it can
achieve in the forthcoming regulatory period. As a result, Energex has proposed a
series of adjustments to its base year opex, recognising that it is not an appropriate
starting point for forecasting opex. Changes to Energex's base year opex include the
removal of:390
emergency response and corrective repair expenditure above the historical
average
costs resulting from cancelled projects
redundancy costs.
Further, Energex has identified additional efficiencies it can achieve in the forthcoming
regulatory period, of $67.2 million ($2014–15), these include:391
385
Queensland Government, Electricity network capital program review 2011: Detailed report of the independent
panel, October 2011. 386
Energex, Energex 2015–20 regulatory proposal, October 2014, p. 34. 387
Interdepartmental committee on electricity sector reform, Report to government, May 2013. 388
Energex, Energex 2015–20 regulatory proposal, October 2014, p. 24. 389
Energex, Energex 2015–20 regulatory proposal, October 2014, pp. 23–24; Ergon Energy, Supporting
Documentation - Our Journey to the Best Possible Price (Attachment 0A.01.02 to Ergon Energy's Regulatory
Proposal), pp. 10–11. 390
Energex, Energex regulatory proposal appendix 8: Application of base-step-trend (BST) model, October 2014,
pp. 33–55. 391
Energex, Energex 2015–20 regulatory proposal, October 2014, p. 132; Energex, Energex regulatory proposal
appendix 8: Application of base-step-trend (BST) model, October 2014, p. 18.
7-133 Attachment 7 – Operating expenditure | Energex preliminary determination 2015–20
lower vegetation management costs after changing its operating model with
suppliers, allowing the suppliers to more efficiently manage the utilisation of their
resources.
the ongoing development and implementation of a fully integrated Distribution
Management System (DMS) will deliver further efficiencies in control centre
activities through automated and semi-automated features and tools.
the continuation of its Business Efficiency Program (BEP) to deliver significant
efficiencies in its overhead expenditure categories. Energex adopted the IRP
recommendations regarding its target level of FTE reductions, and is currently
targeting a reduction in FTEs from 3,433 in 2012–13 to 2,990 FTEs in 2014–15.392
Energex's efficiency adjustments for vegetation management and its DMS have
been proposed as negative step changes, which we consider in appendix C.
We consider the extent of Energex's forecast efficiency gains may indicate that its
revealed base opex is not an appropriate starting point for forecasting opex over the
2015–20 period.
Ergon Energy
We reviewed Ergon Energy's regulatory proposal which states that it identified
additional efficiencies it can achieve in the forthcoming regulatory period. Ergon
Energy commenced an initial wave of cost reduction measures in September 2011
(prior to the initiation of the IRP review), concluding in June 2013.393 In its supporting
documentation titled 'Our Journey to the Best Possible Price,' Ergon Energy outlines
further efficiencies to be realised over the 2015–20 regulatory period.394
For example, Ergon Energy identifies further efficiency gains to be realised as lower
overhead costs, with an estimated reduction in costs of 15 percent or $260 million
($2014–15) over the forecast regulatory period.395 While it is unclear exactly what
proportion of this reduction applies to opex overheads, it provides evidence that
overhead cost allocated to opex in the 2012–13 base year were too high. In addition,
Ergon Energy has outlined a number of initiatives it is undertaking to realise efficiency
gains. Ergon Energy:396
392
Energex, Energex regulatory proposal appendix 8: Application of base-step-trend (BST) model, October 2014,
pp. 62–66. 393
Ergon Energy, Supporting Documentation - Our Journey to the Best Possible Price (Attachment 0A.01.02 to Ergon
Energy's Regulatory Proposal), p. 11. 394
Ergon Energy, Supporting Documentation - Our Journey to the Best Possible Price (Attachment 0A.01.02 to Ergon
Energy's Regulatory Proposal). 395
The 15 percent overhead cost reduction excludes reductions to fleet, ICT and IT asset charges. Ergon Energy also
propose a further 1 percent annual productivity improvement in its overhead forecast, consistent with industry
practice. Ergon Energy, Supporting Documentation - Our Journey to the Best Possible Price (Attachment 0A.01.02
to Ergon Energy's Regulatory Proposal), pp. 13, 16. 396
Ergon Energy, Supporting Documentation - Our Journey to the Best Possible Price (Attachment 0A.01.02 to Ergon
Energy's Regulatory Proposal), pp. 13–15.
7-134 Attachment 7 – Operating expenditure | Energex preliminary determination 2015–20
has proposed changes in its enterprise agreement aimed at seeking a simplified
and flexible agreement
will continue to implement its DMS, which automates many of the manual
processes in operating the network
will implement its Field Force Automation project, which is expected to improve
operational performance and service levels by standardising dispatch and
automating field operations
has a project (ROAMES Sustainable Integration Design) underway, which will
integrate the ROAMES products and data into its processes to improve decision-
making and operational effectiveness.
We consider the extent of Ergon Energy's forecast efficiency gains may indicate that its
revealed base opex is not an appropriate starting point for forecasting opex over the
2015–20 regulatory control period.
Extent of efficiency gains
We find that although Energex and Ergon Energy have proposed efficiency gains in the
forecast period, they are also increasing the proportion of their total overheads that are
allocated to opex, rather than capex. They also reclassify some historical standard
control opex as alternative control. These changes, taken together, may to some
extent offset the opex efficiencies they are forecasting.
In total Energex and Ergon Energy forecast that they will deliver cost savings of $327.2
million ($2014–15) over the 2015–20 regulatory control period. However, as noted
above, it is unclear exactly what proportion of Ergon Energy's proposed reduction in
overheads applies to standard control services opex.397 Therefore, Ergon Energy's
actual reduction to standard control services opex may be overstated.
We recognise both Energex and Ergon Energy have realised some efficiency gains in
the current regulatory period, but their identification of gains after the base year
indicate their proposed 2012–13 base year opex does not represent efficient opex. We
also received a number of submissions from stakeholders who considered that
Energex's and Ergon Energy's base opex does not reflect that of a prudent and
efficient service provider.398 Deloitte considers the extent of base year efficiency, which
we discuss below in section A.5.3.
397
Energex, Energex regulatory proposal appendix 8: Application of base-step-trend (BST) model, October 2014,
pp. 33–55; Ergon Energy, Supporting Documentation - Our Journey to the Best Possible Price (Attachment
0A.01.02 to Ergon Energy's Regulatory Proposal), p. 13. 398
See for example: AGL, Energex Regulatory Proposal: July 2015 to June 2020 - AGL submission to the Australian
Energy Regulator, 30 January 2015, pp. 7–9; Cally Wilson, Energex: A Sustainable Future?, pp. 2–3; Origin
Energy, Submission to Queensland Electricity Distributors’ Regulatory Proposals, 30 January 2015, pp. 11–15;
EUAA, Submission to Energex Revenue Proposal (2015/16 to 2019/20), 30 January 2015, pp, 22–29; EUAA,
Submission to Ergon Energy (Ergon) Revenue Proposal (2015/16 to 2019/20), 30 January 2015, pp, 22–29;
7-135 Attachment 7 – Operating expenditure | Energex preliminary determination 2015–20
We are also aware that both Energex and Ergon Energy have forecast a significant
increase in opex overheads over the 2015–20 regulatory control period. This is driven
by an increase in the opex share of total expenditure due to a reduction in forecast
capex. We estimate the share of overheads Energex allocated to opex increases from
38 per cent in 2012–13 (after the proposed base year adjustments) to 45 per cent in
2019–20. This is driving a $139 million increase in opex over the 2015–20 regulatory
control period. We estimate the change in overhead allocation has increased
Ergon Energy's opex forecast by $32 million. This reallocation of overheads reduces
the impact of any proposed efficiency gains to forecast opex.
In addition, Energex and Ergon Energy reallocated certain expenditures from standard
control services to alternative control services to comply with our reclassification of
metering services.399 When we consider the impact of the reclassification, it becomes
apparent that proposed total forecast opex levels are close to (in the case of Energex)
or higher than (in the case of Ergon Energy) actual expenditure at the end of the
2010–15 period (see Figure A.10 and Figure A.11). This demonstrates that not all
proposed reductions in opex are necessarily due to efficiency gains.
In accordance with the NER we have made our preliminary decision on the total
forecast opex required by Energex and Ergon Energy.400 We discuss the service
providers' forecasting method in appendix D.
Alliance of Electricity Consumers, Submission on Ergon Energy’s Regulatory Proposal 2015–2020, 30 January
2015, pp. 19–23. 399
Energex, Energex regulatory proposal appendix 8: Application of base-step-trend (BST) model, October 2014, pp.
47–48; Ergon Energy, Regulatory proposal 2015–20, October 2014, p. 22. 400
NER, clause 6.12.1(4).
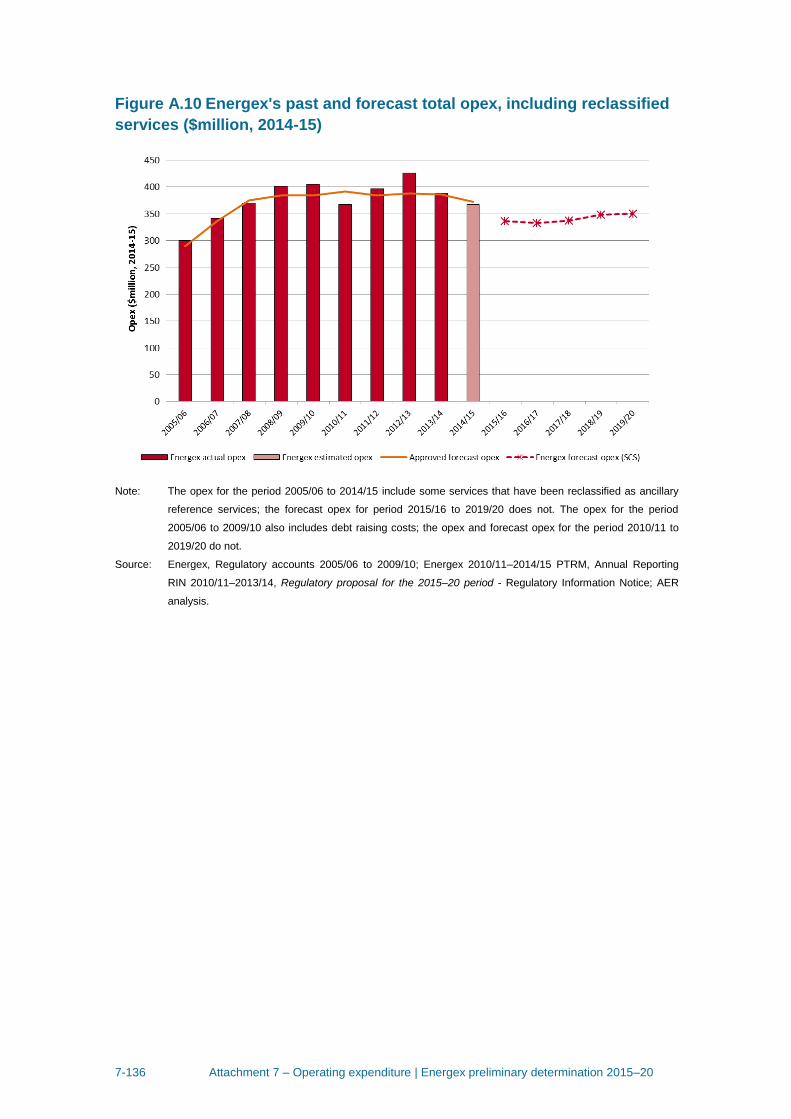
7-136 Attachment 7 – Operating expenditure | Energex preliminary determination 2015–20
Figure A.10 Energex's past and forecast total opex, including reclassified
services ($million, 2014-15)
Note: The opex for the period 2005/06 to 2014/15 include some services that have been reclassified as ancillary
reference services; the forecast opex for period 2015/16 to 2019/20 does not. The opex for the period
2005/06 to 2009/10 also includes debt raising costs; the opex and forecast opex for the period 2010/11 to
2019/20 do not.
Source: Energex, Regulatory accounts 2005/06 to 2009/10; Energex 2010/11–2014/15 PTRM, Annual Reporting
RIN 2010/11–2013/14, Regulatory proposal for the 2015–20 period - Regulatory Information Notice; AER
analysis.
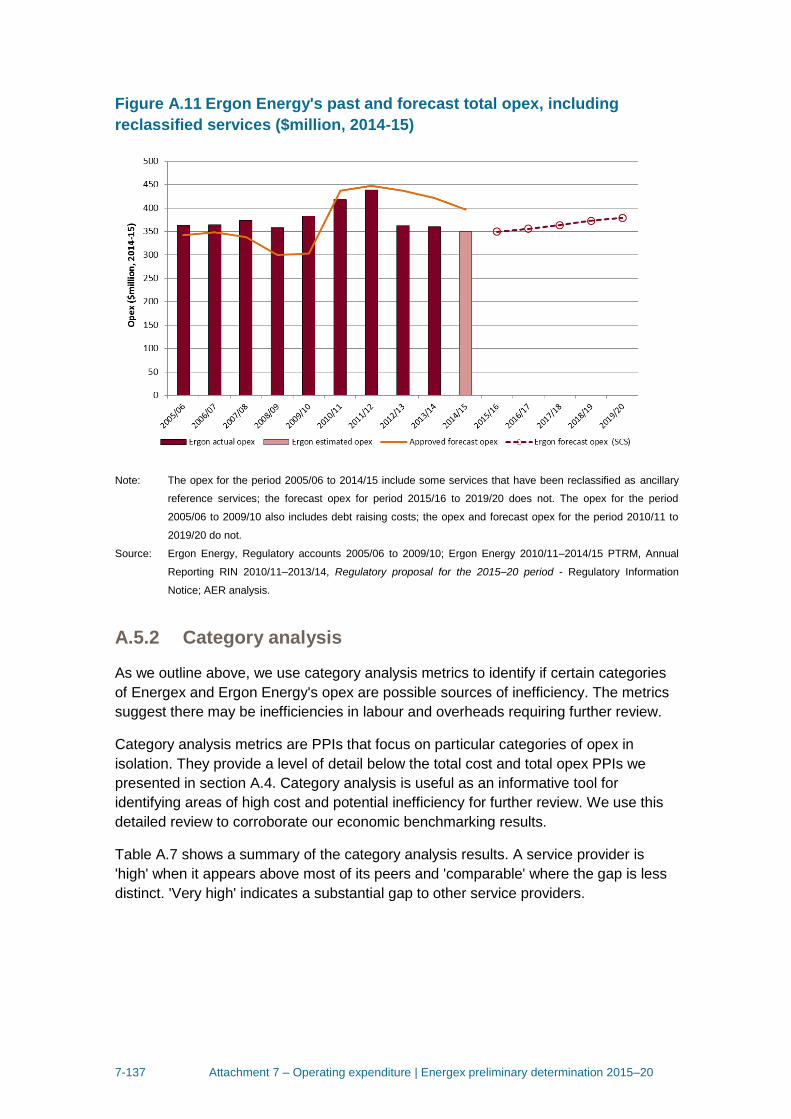
7-137 Attachment 7 – Operating expenditure | Energex preliminary determination 2015–20
Figure A.11 Ergon Energy's past and forecast total opex, including
reclassified services ($million, 2014-15)
Note: The opex for the period 2005/06 to 2014/15 include some services that have been reclassified as ancillary
reference services; the forecast opex for period 2015/16 to 2019/20 does not. The opex for the period
2005/06 to 2009/10 also includes debt raising costs; the opex and forecast opex for the period 2010/11 to
2019/20 do not.
Source: Ergon Energy, Regulatory accounts 2005/06 to 2009/10; Ergon Energy 2010/11–2014/15 PTRM, Annual
Reporting RIN 2010/11–2013/14, Regulatory proposal for the 2015–20 period - Regulatory Information
Notice; AER analysis.
A.5.2 Category analysis
As we outline above, we use category analysis metrics to identify if certain categories
of Energex and Ergon Energy's opex are possible sources of inefficiency. The metrics
suggest there may be inefficiencies in labour and overheads requiring further review.
Category analysis metrics are PPIs that focus on particular categories of opex in
isolation. They provide a level of detail below the total cost and total opex PPIs we
presented in section A.4. Category analysis is useful as an informative tool for
identifying areas of high cost and potential inefficiency for further review. We use this
detailed review to corroborate our economic benchmarking results.
Table A.7 shows a summary of the category analysis results. A service provider is
'high' when it appears above most of its peers and 'comparable' where the gap is less
distinct. 'Very high' indicates a substantial gap to other service providers.
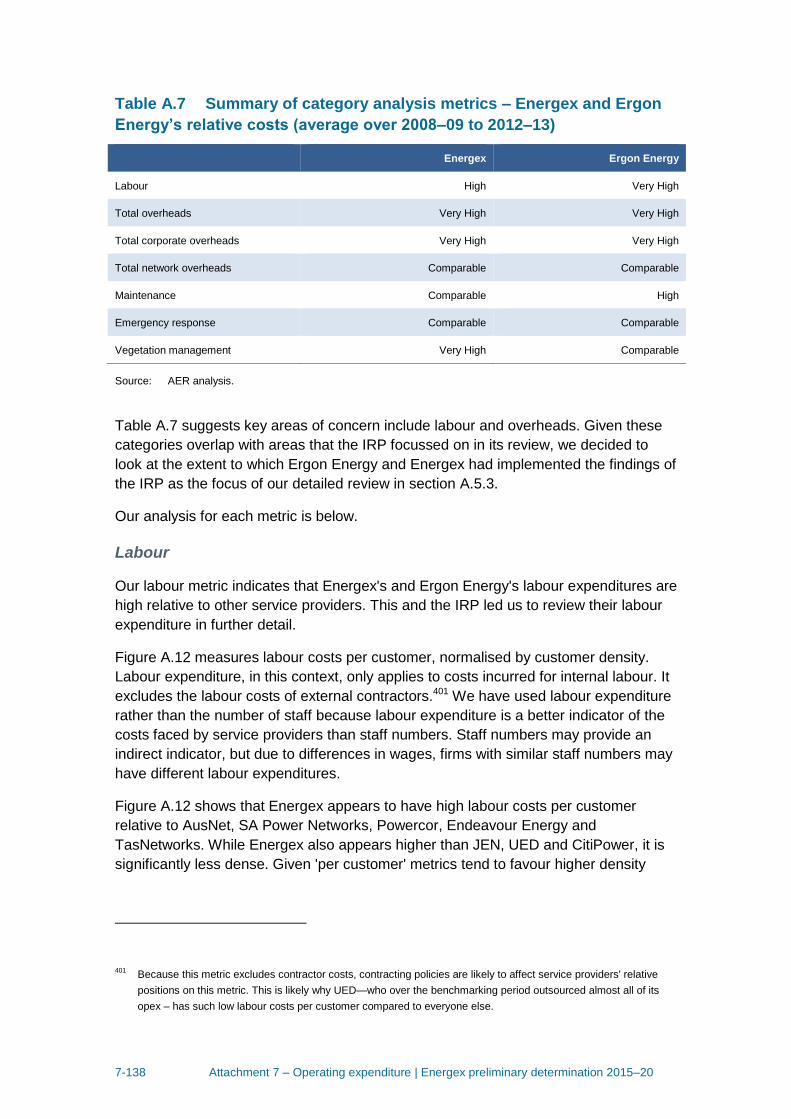
7-138 Attachment 7 – Operating expenditure | Energex preliminary determination 2015–20
Table A.7 Summary of category analysis metrics – Energex and Ergon
Energy’s relative costs (average over 2008–09 to 2012–13)
Energex Ergon Energy
Labour High Very High
Total overheads Very High Very High
Total corporate overheads Very High Very High
Total network overheads Comparable Comparable
Maintenance Comparable High
Emergency response Comparable Comparable
Vegetation management Very High Comparable
Source: AER analysis.
Table A.7 suggests key areas of concern include labour and overheads. Given these
categories overlap with areas that the IRP focussed on in its review, we decided to
look at the extent to which Ergon Energy and Energex had implemented the findings of
the IRP as the focus of our detailed review in section A.5.3.
Our analysis for each metric is below.
Labour
Our labour metric indicates that Energex's and Ergon Energy's labour expenditures are
high relative to other service providers. This and the IRP led us to review their labour
expenditure in further detail.
Figure A.12 measures labour costs per customer, normalised by customer density.
Labour expenditure, in this context, only applies to costs incurred for internal labour. It
excludes the labour costs of external contractors.401 We have used labour expenditure
rather than the number of staff because labour expenditure is a better indicator of the
costs faced by service providers than staff numbers. Staff numbers may provide an
indirect indicator, but due to differences in wages, firms with similar staff numbers may
have different labour expenditures.
Figure A.12 shows that Energex appears to have high labour costs per customer
relative to AusNet, SA Power Networks, Powercor, Endeavour Energy and
TasNetworks. While Energex also appears higher than JEN, UED and CitiPower, it is
significantly less dense. Given 'per customer' metrics tend to favour higher density
401
Because this metric excludes contractor costs, contracting policies are likely to affect service providers' relative
positions on this metric. This is likely why UED—who over the benchmarking period outsourced almost all of its
opex – has such low labour costs per customer compared to everyone else.
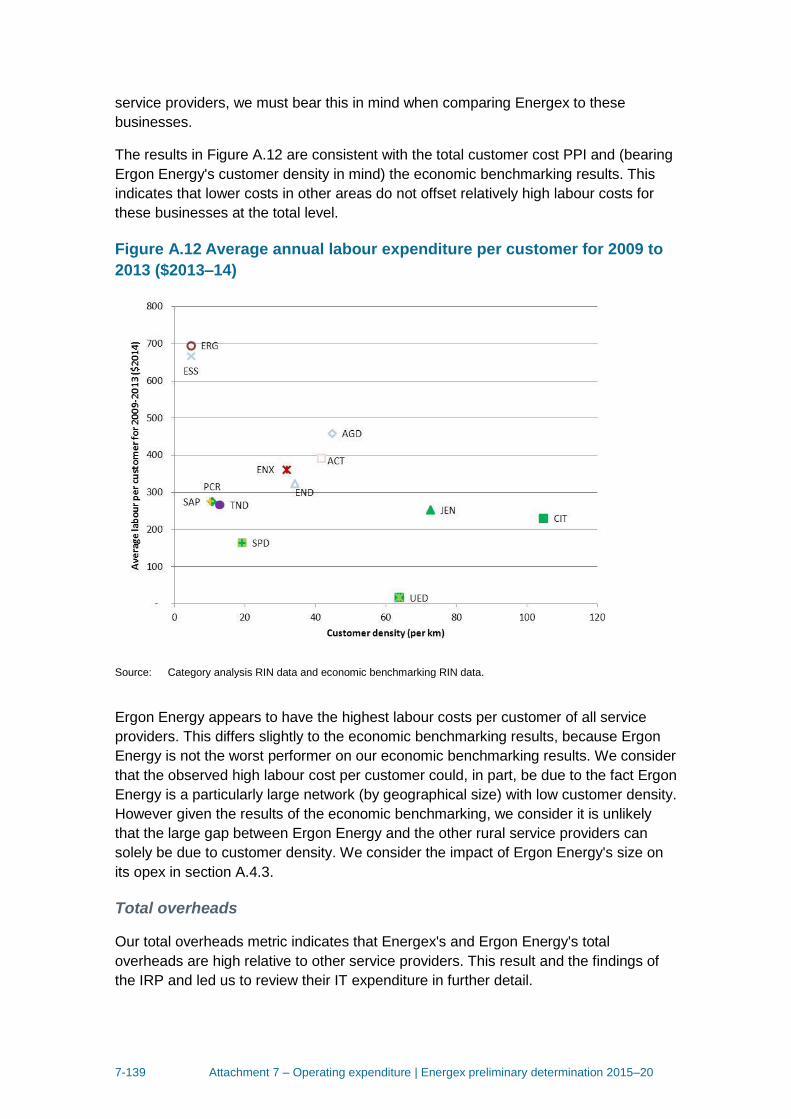
7-139 Attachment 7 – Operating expenditure | Energex preliminary determination 2015–20
service providers, we must bear this in mind when comparing Energex to these
businesses.
The results in Figure A.12 are consistent with the total customer cost PPI and (bearing
Ergon Energy's customer density in mind) the economic benchmarking results. This
indicates that lower costs in other areas do not offset relatively high labour costs for
these businesses at the total level.
Figure A.12 Average annual labour expenditure per customer for 2009 to
2013 ($2013–14)
Source: Category analysis RIN data and economic benchmarking RIN data.
Ergon Energy appears to have the highest labour costs per customer of all service
providers. This differs slightly to the economic benchmarking results, because Ergon
Energy is not the worst performer on our economic benchmarking results. We consider
that the observed high labour cost per customer could, in part, be due to the fact Ergon
Energy is a particularly large network (by geographical size) with low customer density.
However given the results of the economic benchmarking, we consider it is unlikely
that the large gap between Ergon Energy and the other rural service providers can
solely be due to customer density. We consider the impact of Ergon Energy's size on
its opex in section A.4.3.
Total overheads
Our total overheads metric indicates that Energex's and Ergon Energy's total
overheads are high relative to other service providers. This result and the findings of
the IRP and led us to review their IT expenditure in further detail.
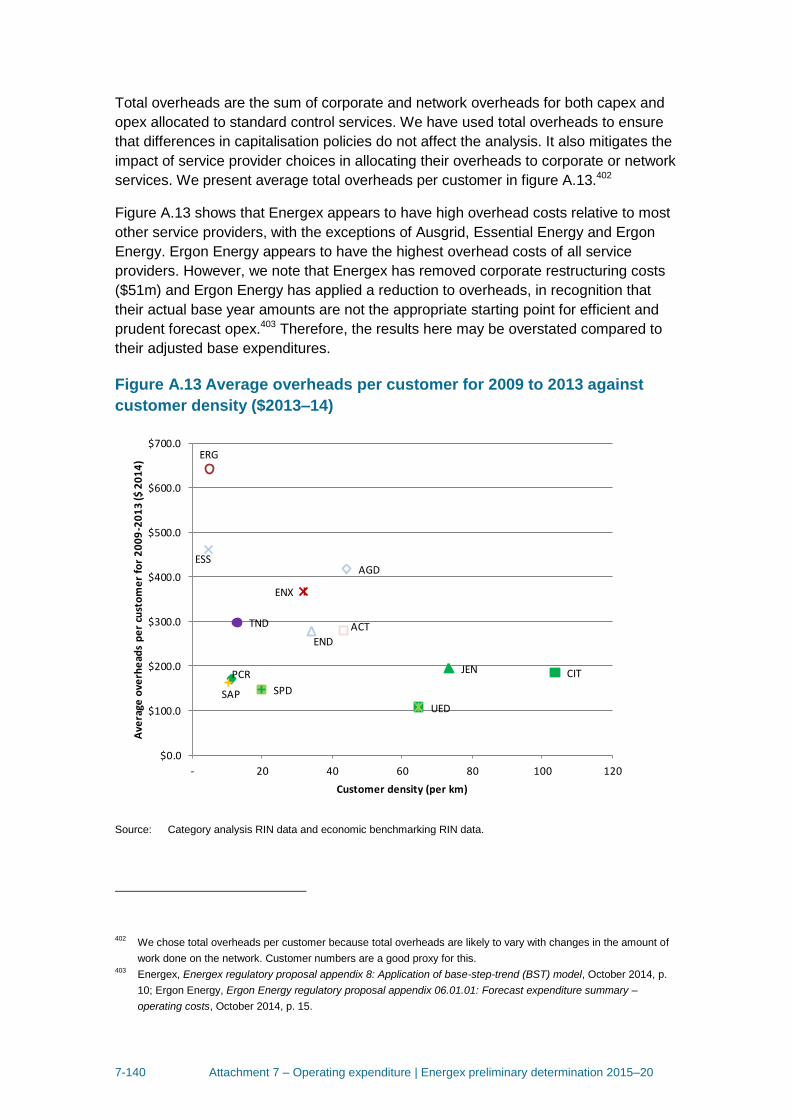
7-140 Attachment 7 – Operating expenditure | Energex preliminary determination 2015–20
Total overheads are the sum of corporate and network overheads for both capex and
opex allocated to standard control services. We have used total overheads to ensure
that differences in capitalisation policies do not affect the analysis. It also mitigates the
impact of service provider choices in allocating their overheads to corporate or network
services. We present average total overheads per customer in figure A.13.402
Figure A.13 shows that Energex appears to have high overhead costs relative to most
other service providers, with the exceptions of Ausgrid, Essential Energy and Ergon
Energy. Ergon Energy appears to have the highest overhead costs of all service
providers. However, we note that Energex has removed corporate restructuring costs
($51m) and Ergon Energy has applied a reduction to overheads, in recognition that
their actual base year amounts are not the appropriate starting point for efficient and
prudent forecast opex.403 Therefore, the results here may be overstated compared to
their adjusted base expenditures.
Figure A.13 Average overheads per customer for 2009 to 2013 against
customer density ($2013–14)
Source: Category analysis RIN data and economic benchmarking RIN data.
402
We chose total overheads per customer because total overheads are likely to vary with changes in the amount of
work done on the network. Customer numbers are a good proxy for this. 403
Energex, Energex regulatory proposal appendix 8: Application of base-step-trend (BST) model, October 2014, p.
10; Ergon Energy, Ergon Energy regulatory proposal appendix 06.01.01: Forecast expenditure summary –
operating costs, October 2014, p. 15.
ACT
AGD
CIT
END
ENX
ERG
ESS
JENPCR
SAP SPD
TND
UED
$0.0
$100.0
$200.0
$300.0
$400.0
$500.0
$600.0
$700.0
- 20 40 60 80 100 120
Ave
rage
ove
rhe
ads
pe
r cu
sto
me
r fo
r 2
00
9-2
01
3 ($
20
14
)
Customer density (per km)
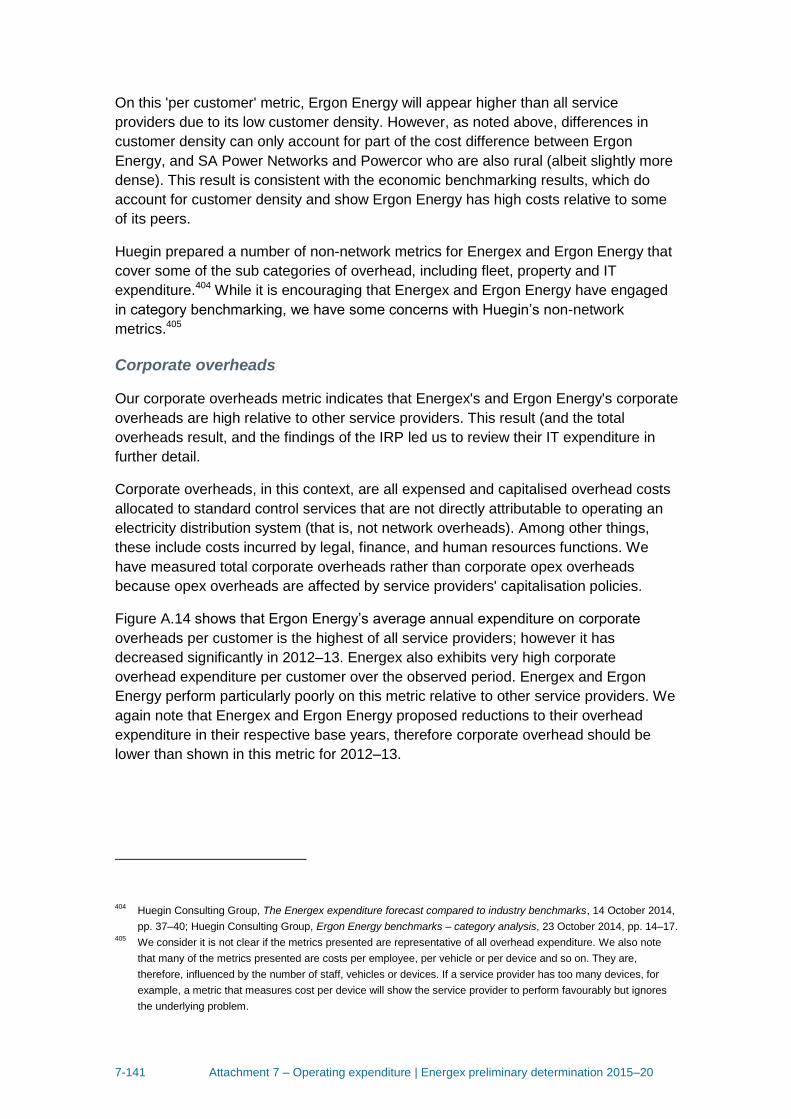
7-141 Attachment 7 – Operating expenditure | Energex preliminary determination 2015–20
On this 'per customer' metric, Ergon Energy will appear higher than all service
providers due to its low customer density. However, as noted above, differences in
customer density can only account for part of the cost difference between Ergon
Energy, and SA Power Networks and Powercor who are also rural (albeit slightly more
dense). This result is consistent with the economic benchmarking results, which do
account for customer density and show Ergon Energy has high costs relative to some
of its peers.
Huegin prepared a number of non-network metrics for Energex and Ergon Energy that
cover some of the sub categories of overhead, including fleet, property and IT
expenditure.404 While it is encouraging that Energex and Ergon Energy have engaged
in category benchmarking, we have some concerns with Huegin’s non-network
metrics.405
Corporate overheads
Our corporate overheads metric indicates that Energex's and Ergon Energy's corporate
overheads are high relative to other service providers. This result (and the total
overheads result, and the findings of the IRP led us to review their IT expenditure in
further detail.
Corporate overheads, in this context, are all expensed and capitalised overhead costs
allocated to standard control services that are not directly attributable to operating an
electricity distribution system (that is, not network overheads). Among other things,
these include costs incurred by legal, finance, and human resources functions. We
have measured total corporate overheads rather than corporate opex overheads
because opex overheads are affected by service providers' capitalisation policies.
Figure A.14 shows that Ergon Energy’s average annual expenditure on corporate
overheads per customer is the highest of all service providers; however it has
decreased significantly in 2012–13. Energex also exhibits very high corporate
overhead expenditure per customer over the observed period. Energex and Ergon
Energy perform particularly poorly on this metric relative to other service providers. We
again note that Energex and Ergon Energy proposed reductions to their overhead
expenditure in their respective base years, therefore corporate overhead should be
lower than shown in this metric for 2012–13.
404
Huegin Consulting Group, The Energex expenditure forecast compared to industry benchmarks, 14 October 2014,
pp. 37–40; Huegin Consulting Group, Ergon Energy benchmarks – category analysis, 23 October 2014, pp. 14–17. 405
We consider it is not clear if the metrics presented are representative of all overhead expenditure. We also note
that many of the metrics presented are costs per employee, per vehicle or per device and so on. They are,
therefore, influenced by the number of staff, vehicles or devices. If a service provider has too many devices, for
example, a metric that measures cost per device will show the service provider to perform favourably but ignores
the underlying problem.
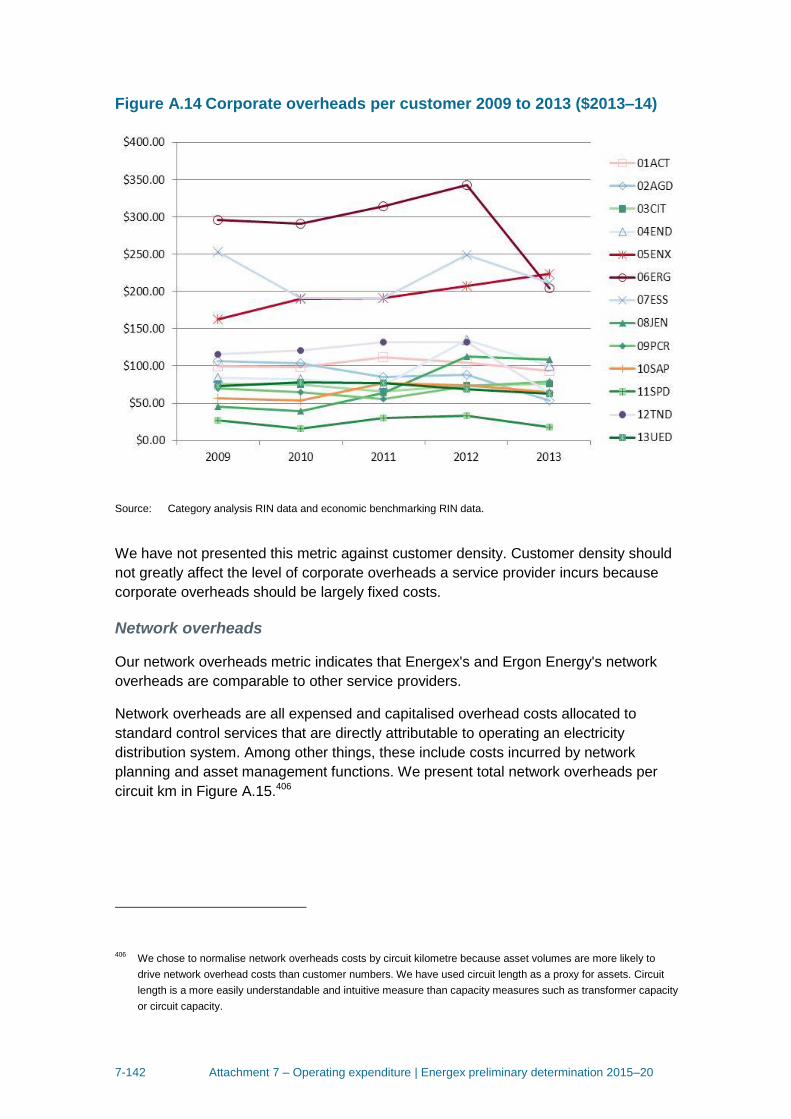
7-142 Attachment 7 – Operating expenditure | Energex preliminary determination 2015–20
Figure A.14 Corporate overheads per customer 2009 to 2013 ($2013–14)
Source: Category analysis RIN data and economic benchmarking RIN data.
We have not presented this metric against customer density. Customer density should
not greatly affect the level of corporate overheads a service provider incurs because
corporate overheads should be largely fixed costs.
Network overheads
Our network overheads metric indicates that Energex's and Ergon Energy's network
overheads are comparable to other service providers.
Network overheads are all expensed and capitalised overhead costs allocated to
standard control services that are directly attributable to operating an electricity
distribution system. Among other things, these include costs incurred by network
planning and asset management functions. We present total network overheads per
circuit km in Figure A.15.406
406
We chose to normalise network overheads costs by circuit kilometre because asset volumes are more likely to
drive network overhead costs than customer numbers. We have used circuit length as a proxy for assets. Circuit
length is a more easily understandable and intuitive measure than capacity measures such as transformer capacity
or circuit capacity.
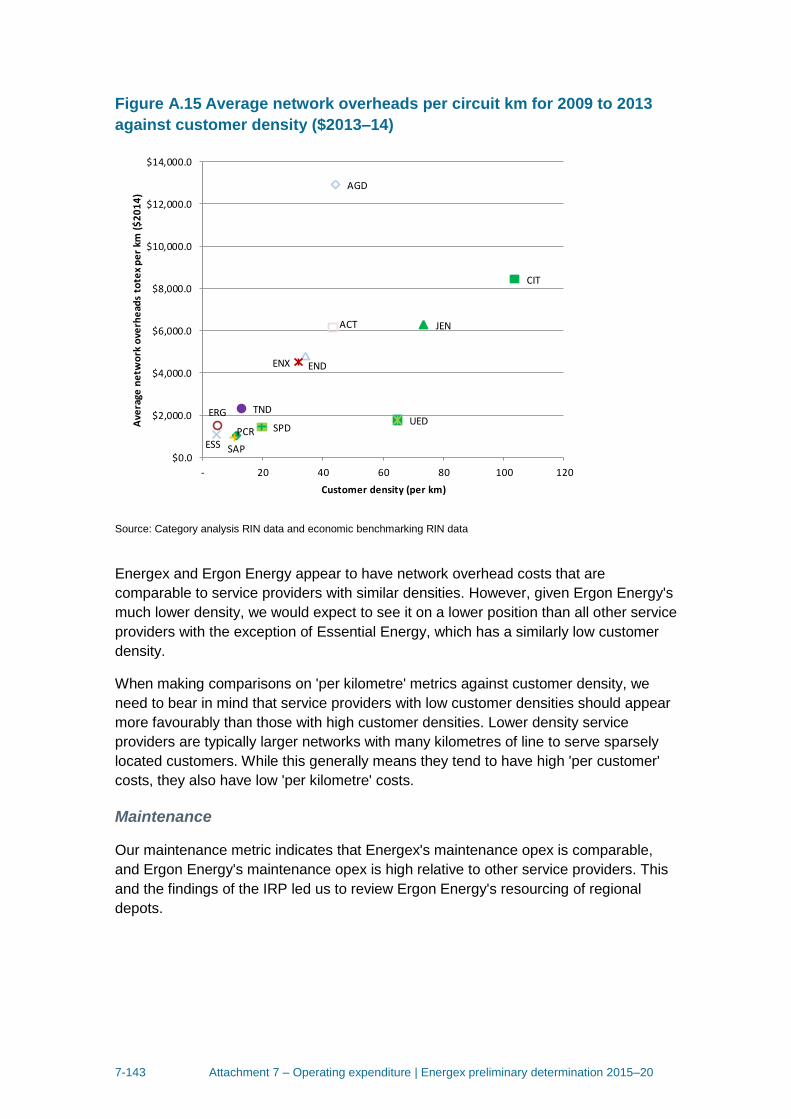
7-143 Attachment 7 – Operating expenditure | Energex preliminary determination 2015–20
Figure A.15 Average network overheads per circuit km for 2009 to 2013
against customer density ($2013–14)
Source: Category analysis RIN data and economic benchmarking RIN data
Energex and Ergon Energy appear to have network overhead costs that are
comparable to service providers with similar densities. However, given Ergon Energy's
much lower density, we would expect to see it on a lower position than all other service
providers with the exception of Essential Energy, which has a similarly low customer
density.
When making comparisons on 'per kilometre' metrics against customer density, we
need to bear in mind that service providers with low customer densities should appear
more favourably than those with high customer densities. Lower density service
providers are typically larger networks with many kilometres of line to serve sparsely
located customers. While this generally means they tend to have high 'per customer'
costs, they also have low 'per kilometre' costs.
Maintenance
Our maintenance metric indicates that Energex's maintenance opex is comparable,
and Ergon Energy's maintenance opex is high relative to other service providers. This
and the findings of the IRP led us to review Ergon Energy's resourcing of regional
depots.
ACT
AGD
CIT
ENDENX
ERG
ESS
JEN
PCR
SAP
SPD
TNDUED
$0.0
$2,000.0
$4,000.0
$6,000.0
$8,000.0
$10,000.0
$12,000.0
$14,000.0
- 20 40 60 80 100 120
Ave
rage
ne
two
rk o
verh
ead
s to
tex
pe
r km
($
20
14
)
Customer density (per km)
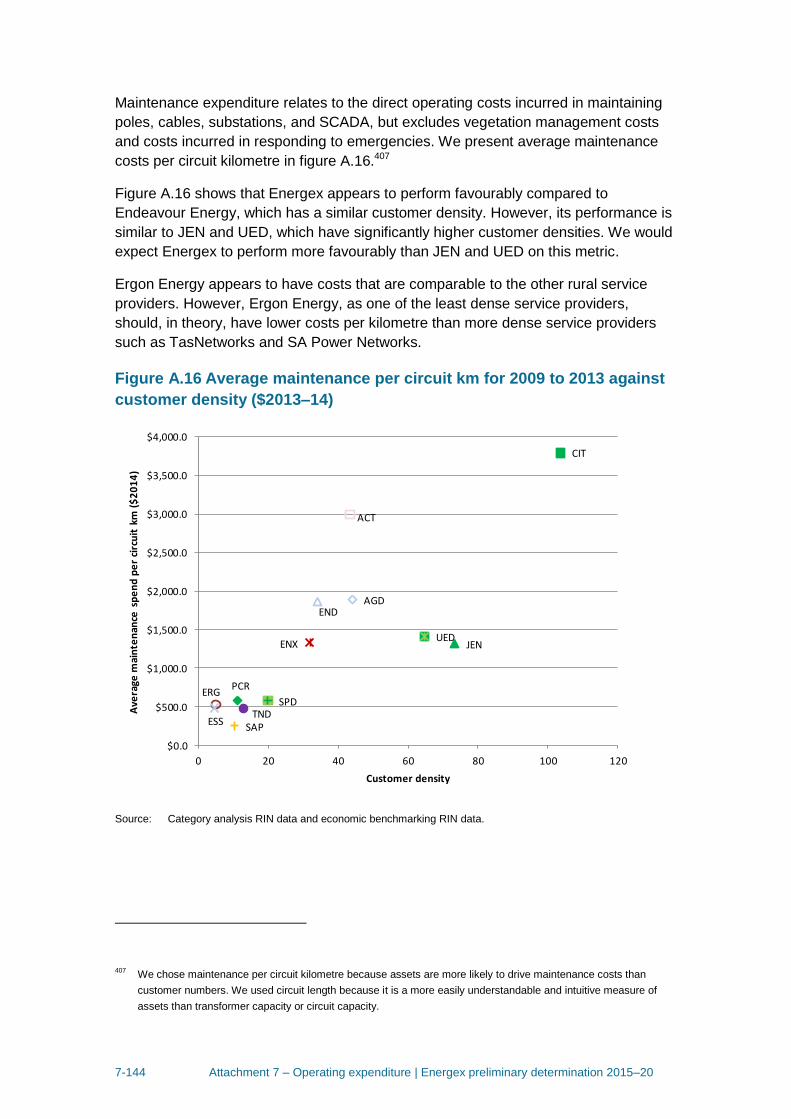
7-144 Attachment 7 – Operating expenditure | Energex preliminary determination 2015–20
Maintenance expenditure relates to the direct operating costs incurred in maintaining
poles, cables, substations, and SCADA, but excludes vegetation management costs
and costs incurred in responding to emergencies. We present average maintenance
costs per circuit kilometre in figure A.16.407
Figure A.16 shows that Energex appears to perform favourably compared to
Endeavour Energy, which has a similar customer density. However, its performance is
similar to JEN and UED, which have significantly higher customer densities. We would
expect Energex to perform more favourably than JEN and UED on this metric.
Ergon Energy appears to have costs that are comparable to the other rural service
providers. However, Ergon Energy, as one of the least dense service providers,
should, in theory, have lower costs per kilometre than more dense service providers
such as TasNetworks and SA Power Networks.
Figure A.16 Average maintenance per circuit km for 2009 to 2013 against
customer density ($2013–14)
Source: Category analysis RIN data and economic benchmarking RIN data.
407
We chose maintenance per circuit kilometre because assets are more likely to drive maintenance costs than
customer numbers. We used circuit length because it is a more easily understandable and intuitive measure of
assets than transformer capacity or circuit capacity.
ACT
AGD
CIT
END
ENX
ERG
ESS
JEN
PCR
SAP
SPDTND
UED
$0.0
$500.0
$1,000.0
$1,500.0
$2,000.0
$2,500.0
$3,000.0
$3,500.0
$4,000.0
0 20 40 60 80 100 120
Ave
rage
mai
nte
nan
ce s
pe
nd
pe
r ci
rcu
it k
m (
$2
01
4)
Customer density
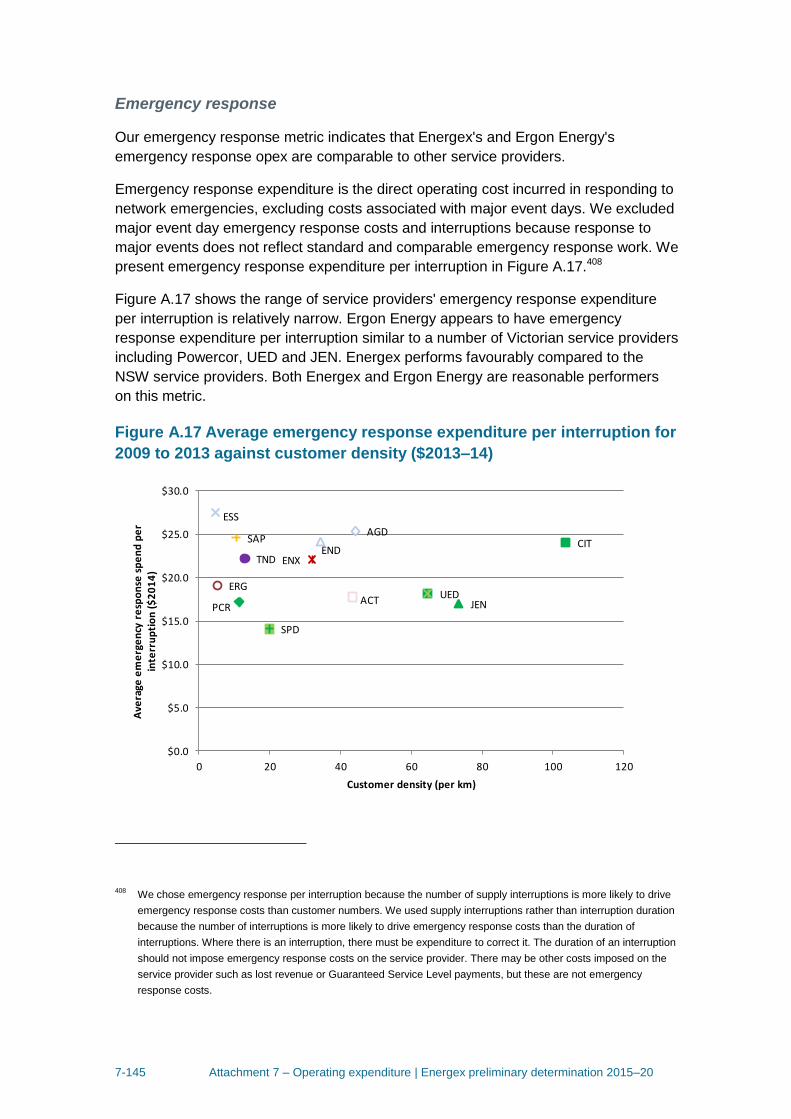
7-145 Attachment 7 – Operating expenditure | Energex preliminary determination 2015–20
Emergency response
Our emergency response metric indicates that Energex's and Ergon Energy's
emergency response opex are comparable to other service providers.
Emergency response expenditure is the direct operating cost incurred in responding to
network emergencies, excluding costs associated with major event days. We excluded
major event day emergency response costs and interruptions because response to
major events does not reflect standard and comparable emergency response work. We
present emergency response expenditure per interruption in Figure A.17.408
Figure A.17 shows the range of service providers' emergency response expenditure
per interruption is relatively narrow. Ergon Energy appears to have emergency
response expenditure per interruption similar to a number of Victorian service providers
including Powercor, UED and JEN. Energex performs favourably compared to the
NSW service providers. Both Energex and Ergon Energy are reasonable performers
on this metric.
Figure A.17 Average emergency response expenditure per interruption for
2009 to 2013 against customer density ($2013–14)
408
We chose emergency response per interruption because the number of supply interruptions is more likely to drive
emergency response costs than customer numbers. We used supply interruptions rather than interruption duration
because the number of interruptions is more likely to drive emergency response costs than the duration of
interruptions. Where there is an interruption, there must be expenditure to correct it. The duration of an interruption
should not impose emergency response costs on the service provider. There may be other costs imposed on the
service provider such as lost revenue or Guaranteed Service Level payments, but these are not emergency
response costs.
ACT
AGDCIT
ENDENX
ERG
ESS
JENPCR
SAP
SPD
TND
UED
$0.0
$5.0
$10.0
$15.0
$20.0
$25.0
$30.0
0 20 40 60 80 100 120
Ave
rage
em
erg
en
cy r
esp
on
se s
pe
nd
pe
r in
terr
up
tio
n (
$2
01
4)
Customer density (per km)
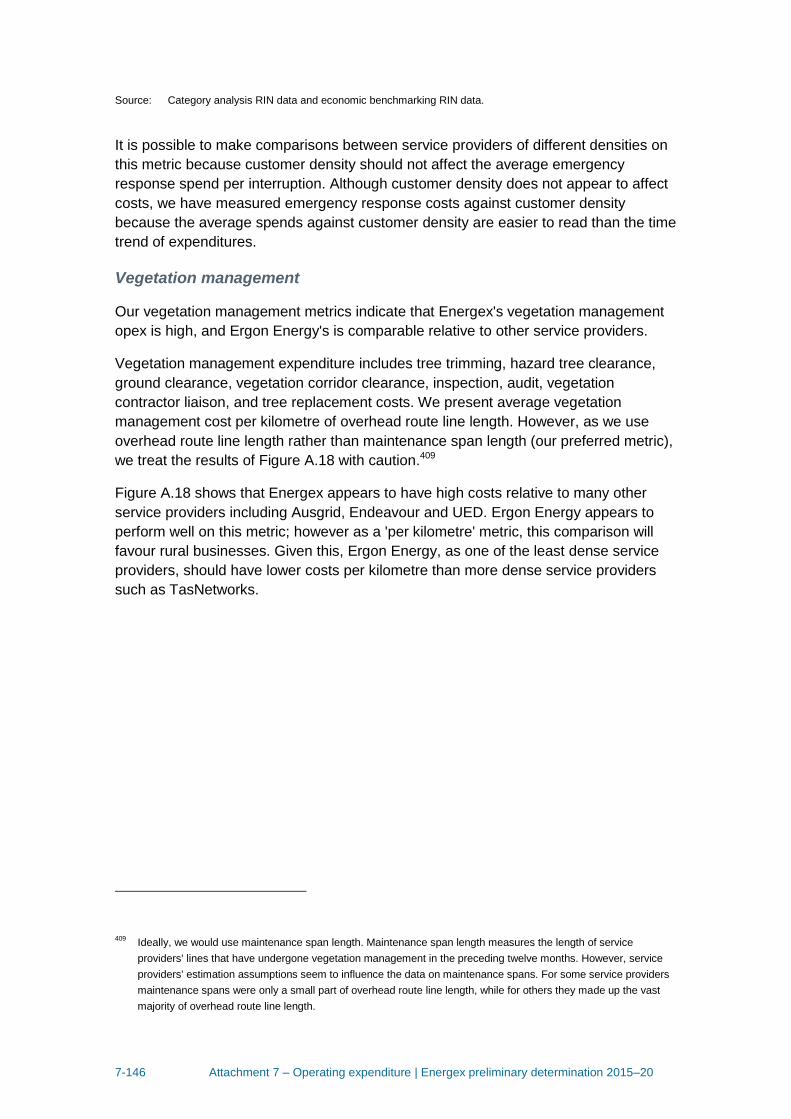
7-146 Attachment 7 – Operating expenditure | Energex preliminary determination 2015–20
Source: Category analysis RIN data and economic benchmarking RIN data.
It is possible to make comparisons between service providers of different densities on
this metric because customer density should not affect the average emergency
response spend per interruption. Although customer density does not appear to affect
costs, we have measured emergency response costs against customer density
because the average spends against customer density are easier to read than the time
trend of expenditures.
Vegetation management
Our vegetation management metrics indicate that Energex's vegetation management
opex is high, and Ergon Energy's is comparable relative to other service providers.
Vegetation management expenditure includes tree trimming, hazard tree clearance,
ground clearance, vegetation corridor clearance, inspection, audit, vegetation
contractor liaison, and tree replacement costs. We present average vegetation
management cost per kilometre of overhead route line length. However, as we use
overhead route line length rather than maintenance span length (our preferred metric),
we treat the results of Figure A.18 with caution.409
Figure A.18 shows that Energex appears to have high costs relative to many other
service providers including Ausgrid, Endeavour and UED. Ergon Energy appears to
perform well on this metric; however as a 'per kilometre' metric, this comparison will
favour rural businesses. Given this, Ergon Energy, as one of the least dense service
providers, should have lower costs per kilometre than more dense service providers
such as TasNetworks.
409
Ideally, we would use maintenance span length. Maintenance span length measures the length of service
providers' lines that have undergone vegetation management in the preceding twelve months. However, service
providers' estimation assumptions seem to influence the data on maintenance spans. For some service providers
maintenance spans were only a small part of overhead route line length, while for others they made up the vast
majority of overhead route line length.
7-147 Attachment 7 – Operating expenditure | Energex preliminary determination 2015–20
Figure A.18 Average vegetation management costs per kilometre of
overhead line length for 2009 to 2013 against customer density ($2014)
Source: Category analysis RIN and Economic benchmarking RIN
Figure A.19 shows the trend in total vegetation management costs. Figure A.19 is not
normalised by an output so service providers are not directly comparable. We note
that, Ergon Energy, which has a similarly sized rural network to Essential Energy, has
had relatively stable vegetation management expenditure over the period but has
significantly reduced its expenditure in the base year. Energex’s vegetation
management costs again appear high relative to other large networks such as Ausgrid;
however, Energex has proposed a negative step change for vegetation management
costs in the forecast period.410 We discuss this step change in appendix C.
410
Energex, Energex regulatory proposal appendix 8: Application of base-step-trend (BST) model, October 2014, pp.
18–19.
ACT
AGD
CIT
END
ENX
ERG
ESS PCR
TND
UED
JEN, SAPN, SPD
$0
$500
$1,000
$1,500
$2,000
$2,500
$3,000
0 20 40 60 80 100 120
Ve
geta
tio
n m
anag
em
en
t sp
en
d p
er
km o
f o
verh
ead
ro
ute
lin
e l
en
gth
($
20
14
)
Customer density (per km)
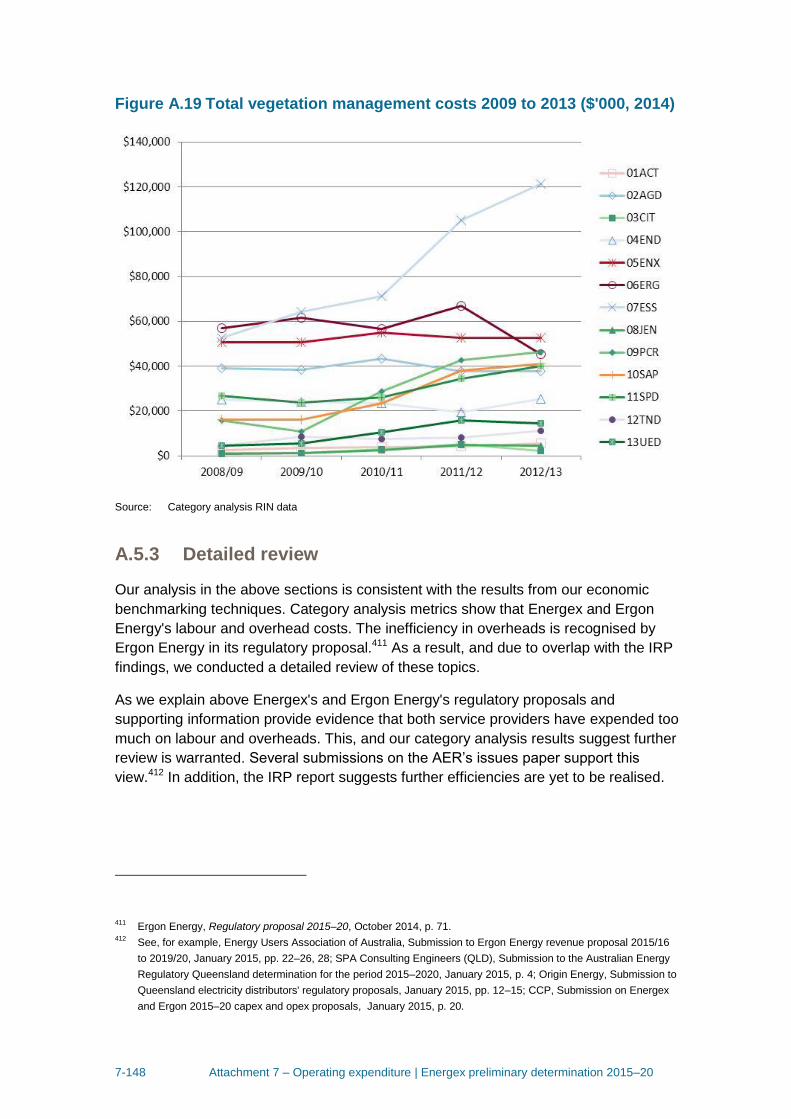
7-148 Attachment 7 – Operating expenditure | Energex preliminary determination 2015–20
Figure A.19 Total vegetation management costs 2009 to 2013 ($'000, 2014)
Source: Category analysis RIN data
A.5.3 Detailed review
Our analysis in the above sections is consistent with the results from our economic
benchmarking techniques. Category analysis metrics show that Energex and Ergon
Energy's labour and overhead costs. The inefficiency in overheads is recognised by
Ergon Energy in its regulatory proposal.411 As a result, and due to overlap with the IRP
findings, we conducted a detailed review of these topics.
As we explain above Energex's and Ergon Energy's regulatory proposals and
supporting information provide evidence that both service providers have expended too
much on labour and overheads. This, and our category analysis results suggest further
review is warranted. Several submissions on the AER’s issues paper support this
view.412 In addition, the IRP report suggests further efficiencies are yet to be realised.
411
Ergon Energy, Regulatory proposal 2015–20, October 2014, p. 71. 412
See, for example, Energy Users Association of Australia, Submission to Ergon Energy revenue proposal 2015/16
to 2019/20, January 2015, pp. 22–26, 28; SPA Consulting Engineers (QLD), Submission to the Australian Energy
Regulatory Queensland determination for the period 2015–2020, January 2015, p. 4; Origin Energy, Submission to
Queensland electricity distributors' regulatory proposals, January 2015, pp. 12–15; CCP, Submission on Energex
and Ergon 2015–20 capex and opex proposals, January 2015, p. 20.

7-149 Attachment 7 – Operating expenditure | Energex preliminary determination 2015–20
In order to better understand the expenditure drivers, we engaged Deloitte to assist us
with our detailed review. Our scope of work for Deloitte primarily focussed on three
questions:413
What are the key factors driving the gap in opex performance (demonstrated by the
benchmarking results) for Energex and Ergon Energy in comparison to their peers
in 2012–13 and 2013–14?
To what extent have Energex and Ergon Energy fully implemented any of the
recommendations from the independent review?
Are there reasons for Energex’s opex productivity deteriorating between 2011–12
and 2012–13 other than inefficiency?
The answers to these questions are important to help us understand the factors that
are contributing to Energex's and Ergon Energy's overall efficiency performance, and
identifying whether their 2012–13 base opex contains inefficiencies.
Deloitte conducted a comprehensive and independent review, which involved:
reviewing documents provided by Energex and Ergon Energy in response to
requests for further information;
holding in-depth discussions with Energex and Ergon Energy via video conference;
and
reviewing past and current regulatory proposals, supporting information and
legislative requirements.
Deloitte's findings are:414
key factors driving the efficiency gap include:
o labour costs
o workforce scheduling
o workforce flexibility
o overtime
o SPARQ costs
o regional depots (for Ergon Energy)
o outsourcing
while Energex and Ergon have progressed implementing some IRP
recommendations, they have not yet implemented all of them
413
Deloitte Access Economics, Queensland distribution network service providers - opex performance analysis, April
2015, p. v, 414
Deloitte Access Economics, Queensland distribution network service providers - opex performance analysis, April
2015, pp. viii–xv.
7-150 Attachment 7 – Operating expenditure | Energex preliminary determination 2015–20
while significant efficiency gains have been achieved since the IRP’s
recommendations were finalised much of these benefits were realised after the
2012-13 base year. Energex and Ergon Energy have also both forecast further
efficiency gains. The result is the base year opex for both service providers would
not have been efficient.
much of the fall in Energex's productivity appears to be explained by significant
increases in ICT capex and one-off costs.
We consider Deloitte's findings support our conclusion that the base year opex
proposed by both Energex and Ergon Energy contains inefficiencies and is
inappropriate for forecasting opex in accordance with the NER.
Key factors driving the efficiency gap
Labour inefficiencies
Deloitte found evidence of inefficiency in Energex's and Ergon Energy's labour costs
and practices. This is consistent with a number of submissions raising concerns about
Energex's and Ergon Energy's labour expenses.415 Deloitte found that both service
providers (but Ergon Energy in particular) have high total labour costs compared to
more efficient peers. Deloitte found this is a result of having too many employees
rather than the cost per employee.416
The inference is therefore that Ergon’s and Energex’s workforces are less productive
than their peers. There are a number of possible reasons for this, including workforce
culture, management and operational decisions. Another factor is the restrictions
included in Enterprise Bargaining Agreements (EBAs), as well as the relatively high
percentage of employees subject to those EBAs.
Deloitte noted that more than 75 per cent of Energex and Ergon employees are
employed under EBAs, which is significantly more than the Victorian distributors. This
amplifies the effect of the EBA inflexibilities described below, relative to the Victorian
distributors.417
415
AGL, Energex Regulatory Proposal: July 2015 to June 2020 - AGL submission to the Australian Energy Regulator,
30 January 2015, p. 7; Cally Wilson, Energex: A Sustainable Future?, p. 2; CCIQ, Submission on Energex’s
regulatory proposal 2015–20, 30 January 2015, pp. 12–13; CCIQ, Submission on Ergon Energy’s regulatory
proposal 2015–20, 30 January 2015, p. 15; SPA Consulting Engineers (QLD), Submission to the Australian Energy
Regulator - Queensland Distribution Determination for the period 2015 – 2020, 30 January 2015, pp. 4–5;
Australians in Retirement, A Submission to the Australian Energy Regulator From the Cairns and District Branch of
Australians in Retirement, 28 January 2015, p. 3; Cummings Economics, Submission to Australian Energy
Regulator on behalf of a Network of Electricity Users in Far North Queensland, 30 January 2015, p. 30. 416
Deloitte Access Economics, Queensland distribution network service providers - opex performance analysis, April
2015, pp. viii–ix. 417
Deloitte Access Economics, Queensland distribution network service providers - opex performance analysis, April
2015, p. ix.
7-151 Attachment 7 – Operating expenditure | Energex preliminary determination 2015–20
Workforce scheduling
The IRP found that ‘the lack of a single, well-structured system for scheduling depot
activities is contributing to under-utilisation of labour within the distributors.’ The IRP
recommended that Energex and Ergon implement an effective scheduling tool to
improve efficiency and productivity of the workforce. It also made recommendations to
improve the flexibility of the workforce and enhance workforce planning.418
Deloitte found that Energex and Ergon Energy have taken steps to improve their
workforce scheduling processes and systems. However, for both service providers, the
changes that have occurred to date were made after the 2012–13 base year.
Deloitte also observed some EBA limitations that would impact on efficient scheduling.
Ergon Energy’s Single Person Operation Guidelines and Queensland industry
procedures require switching activities to be undertaken by a switching operator and
switching assistant. In other states these tasks can be carried out by a single person.
Ergon’s EBA requires ‘mutual agreement’ with unions for the introduction of new tasks
to the Single Person Operation Guidelines. Deloitte considers these limitations
adversely affect idle time and overall labour productivity.419
Workforce flexibility
Deloitte considered that certain EBA provisions, while not necessarily unique to
Energex and Ergon Energy, limit their ability to quickly adjust their workforces and
utilise them productively. These include restrictions on:420
involuntary redundancy—such restrictions impede management’s ability to reduce
the operational workforce
when contractors may be used for core work—they must consult with unions before
certain work can be outsourced. Consultation requirements are common among
service provider EBAs, suggesting that the existence of these requirements alone
does not drive the differences in outsourcing and workforce flexibility outcomes,
rather how the requirements operate in practice
the wages and conditions able to be offered to contractors— external contractors
be employed under conditions that are equivalent to their own workforce. Such
requirements are not unique to the QLD service providers but the impact of these
requirements appears to be amplified in Queensland where a higher proportion of
employees are covered by the EBAs.
the ability for contractors to perform certain tasks such as switching—the
Queensland service providers’ EBAs state that they must ‘restrict authorisation and
418
Independent Review Panel on Network Costs, Electricity Network Costs Review, 2013, p. 60. 419
Deloitte Access Economics, Queensland distribution network service providers - opex performance analysis, April
2015, pp. ix–x. 420
Deloitte Access Economics, Queensland distribution network service providers - opex performance analysis, April
2015, pp. x–xi.
7-152 Attachment 7 – Operating expenditure | Energex preliminary determination 2015–20
access for external service providers’ to certain tasks. These requirements increase
the non-productive time of contractors, who must wait for an employee to attend a
site at the beginning and conclusion of works, leading to inefficiency.
minimum apprentice numbers—both Energex and Ergon Energy must employ a
minimum number of apprentices, which restricts flexibility on changing the
workforce size.
Deloitte found that it is likely these constraints, along with the high proportion of
workforces employed on EBAs, have together delivered significantly less outsourcing
of opex activities in recent years than the Victorian distributors. Deloitte considered that
these constraints on workforce flexibility are likely to have delivered higher than
efficient base year opex. Any changes to these requirements during the 2015-20
regulatory period will likely improve the Queensland service providers' opex
efficiency.421
Overtime
One of the IRP's findings was that it observed a large amount of Energex's and Ergon
Energy's employees had very high gross to base (salary) ratios (GBR) of 1.5 and
above. GBR measure the number of employees earning overtime compared to their
base salary. An employee with a GBR of 1.5, for example, earns 50 per cent of its
base salary in overtime (on top of his or her base salary).422 The IRP considered this
would likely to result in lower levels of productivity.423
Deloitte found that both Energex and Ergon Energy have taken steps to reduce
overtime. However, Energex in particular incurred significant overtime in expenditure in
the 2012–13 base year.
SPARQ (ICT) costs
The IRP made a number of observations and recommendations specifically targeted at
Energex's and Ergon Energy's IT costs, which are incurred via charges paid to
SPARQ. SPARQ is a joint venture company owned by Energex and Ergon Energy.
SPARQ’s fees are fully accounted for in Energex's and Ergon Energy's opex.424
The most important IRP recommendations were associated with the need to place
competitive pressure on SPARQ, through market testing the services it provides to
Energex and Ergon, as well as the need to change the relationships between the
service providers and SPARQ. The IRP recommended that Energex and Ergon Energy
421
Deloitte Access Economics, Queensland distribution network service providers - opex performance analysis, April
2015, p. xi. 422
Gross to Base (salary) Ratios, which is a measure of the number of employees earning compared to their base
salary. An employee with a GBR of 1.5, for example, earns 50 per cent of its base salary in overtime. 423
Independent Review Panel on Network Costs, Electricity Network Costs Review, 2013, p. 62. 424
Deloitte Access Economics, Queensland distribution network service providers - opex performance analysis, April
2015, pp. xii–xiii.
7-153 Attachment 7 – Operating expenditure | Energex preliminary determination 2015–20
test alternative service delivery models for IT services by issuing market tenders for
capital projects and relevant operational IT services.425 Some submissions also raised
concerns about Energex's and Ergon Energy's procurement of IT services through
SPARQ.426
Deloitte found that some changes were implemented since the IRP’s final report,
including the development of an IT Panel which SPARQ manages. However, reforms
to date do not fully reflect the IRP recommendations and, importantly, have not yet
significantly improved competitive pressures on SPARQ.427
Deloitte also found that the Energex's and Ergon Energy's IT costs have increased
significantly over the 2010–15 period, particularly in the base year, due to large
increases in SPARQ's operational costs and asset management/service fees.428
Deloitte considered it is apparent that IT costs are a material source of inefficiency
within Energex’s and Ergon Energy’s opex, and although some changes have been
implemented following the IRP’s final report, these are not reflected in the 2012–13
base year.
Regional depots and the Local Service Agent model
The IRP recommended that Ergon Energy move to a Local Service Agent (LSA) model
to outsource work in regional areas, rather than running its own regional depots.
Deloitte noted that Ergon Energy has not implemented the IRP's recommendation.429
Deloitte observed that, unlike Energex which has always existed as one entity, Ergon
formed after the amalgamation of a number of smaller electricity distributors. This has
resulted in Ergon facing a number of legacy issues including a high number of service
depots.
Deloitte undertook research into the LSA model, which Powercor implemented
following privatisation. Deloitte found it had significantly increased the operational
efficiency of Powercor’s regional network areas. These efficiency outcomes are
associated with:430
reductions in the absolute number of depots and sites
425
Deloitte Access Economics, Queensland distribution network service providers - opex performance analysis, April
2015, p. xiii. 426
Origin Energy, Submission to Queensland Electricity Distributors’ Regulatory Proposals, 30 January 2015,
pp. 14–15 427
Deloitte Access Economics, Queensland distribution network service providers - opex performance analysis, April
2015, p. xiii. 428
Deloitte Access Economics, Queensland distribution network service providers - opex performance analysis, April
2015, p. xiii. 429
Deloitte Access Economics, Queensland distribution network service providers - opex performance analysis, April
2015, pp. 58–59. 430
Deloitte Access Economics, Queensland distribution network service providers - opex performance analysis, April
2015, p. 61.
7-154 Attachment 7 – Operating expenditure | Energex preliminary determination 2015–20
reductions in staff per depot, with more flexibility in rostering
cultural change, driven by the small business incentives to reduce costs. Once the
LSA model was established, significant efficiencies were identified and achieved in
a range of existing processes, driven by a more cost-conscious approach and the
need to reduce overtime.
Deloitte observed that while effort has been made to consolidate Ergon’s legacy
property assets and the depot network, there is likely to be scope for additional
consolidation under a local service agent model. Therefore, Deloitte considered that
applying an LSA model, combined with reform of the EBA restrictions around
contractor switching, could deliver significant workforce cost efficiencies within Ergon
Energy.431
Outsourcing
Deloitte observed that, with the exception of the constraints on contractor switching,
which appears to be unique to Queensland service providers, all service provider EBAs
nationally contain various limitations on the use of outsourcing (although the nature
and extent of constraints vary). However, in practice, the level of outsourcing carried
out by Energex and Ergon over the 2010-15 regulatory control period (between 30 and
40 per cent of labour opex) is materially lower compared to the Victorian distributors
(between 50 and 90 per cent of opex, including related party outsourcing).
Overall, it appears that the Queensland service providers’ EBA provisions, while not
preventing outsourcing, may have imposed limits on their ability to engage contractors
quickly and efficiently. It is likely that these constraints, along with the high proportion
of their workforces employed on EBAs, have together delivered lower levels of
outsourced opex over the period 2009-14.
Progress on IRP recommendations
Deloitte found that Energex has made significant progress in addressing the IRP
recommendations. Of the 11 IRP recommendations relevant to Energex, it has fully
implemented eight.
Ergon has also made progress in addressing the IRP recommendations. Of the 17 IRP
recommendations relevant to Ergon, it has implemented nine, while progress on a
further four recommendations is unclear. Another four recommendations have not yet
been implemented.
Deloitte notes that significant efficiency gains have been achieved since the IRP’s
recommendations were finalised (particularly reflected in FTE reductions) as a result of
Energex’s Business Efficiency Program (BEP) and Ergon’s Effectiveness and
431
Deloitte Access Economics, Queensland distribution network service providers - opex performance analysis, April
2015, pp. 58–63.
7-155 Attachment 7 – Operating expenditure | Energex preliminary determination 2015–20
Efficiency Program (EEP) and implementation of the IRP’s recommendations.
However, much of these benefits were realised after the 2012-13 base year.
In addition to savings made in 2013-14, both businesses are expecting to make further
efficiency gains in the 2015–20 regulatory period, particularly through further reducing
their staffing levels. As a result, Deloitte found that there are material opex savings not
incorporated into base year opex and, therefore, base year opex for neither service
provider is efficient.432
This supports our conclusion that the base year opex proposed by both Energex and
Ergon Energy contains inefficiencies and is inappropriate for forecasting opex in
accordance with the NER.
Energex's declining productivity
Although our benchmarking shows Energex as more productive than Ergon, its
productivity declined significantly in 2012–13 and 2013–14 (the final two years of the
benchmarking period).
Deloitte found that much of the fall in productivity in these years appears to be
explained by significant increases in ICT capex (in SPARQ’s Asset Management Fee,
which is reflected in opex), redundancy costs associated with reducing its workforce
and one-off opex associated with both addressing a manufacturing defect in its service
lines and the aftermath of Tropical Cyclone Oswald.433
432
Deloitte Access Economics, Queensland distribution network service providers - opex performance analysis, April
2015, pp. xiv–xx. 433
Deloitte Access Economics, Queensland distribution network service providers - opex performance analysis, April
2015, pp. xiv–xv.
7-156 Attachment 7 – Operating expenditure | Energex preliminary determination 2015–20
A.6 The net impact of operating environment adjustments
When undertaking a benchmarking exercise, circumstances exogenous to a service
provider should generally be taken into account. By taking into account exogenous
circumstances, one can determine the extent to which cost differences are exogenous
or due to inefficiency.434 The purpose of our assessment of operating environment
factors (OEFs) is to account for these exogenous circumstances.
In its Final Rule Determination on the Economic Regulation of Network Service
Providers the AEMC stated:
The final rule gives the AER discretion as to how and when it undertakes
benchmarking in its decision-making. However, when undertaking a
benchmarking exercise, circumstances exogenous to a NSP should generally
be taken into account, and endogenous circumstances should generally not be
considered. In respect of each NSP, the AER must exercise its judgement as to
the circumstances which should or should not be included.435
The AEMC also noted that:
The intention of a benchmarking assessment is not to normalise for every
possible difference in networks. Rather, benchmarking provides a high level
overview taking into account certain exogenous factors. It is then used as a
comparative tool to inform assessments about the relative overall efficiency of
proposed expenditure. 436
In the course of the current ACT, NSW, Queensland and SA regulatory determinations,
we have considered more than 60 OEFs that we, service providers and other
stakeholders have referred to. We considered each factor using our three OEF criteria
of exogeneity, materiality, and duplication. We do not provide an adjustment for non-
exogenous or duplicative factors. For material, exogenous and non-duplicative factors,
we make an adjustment to the level of that materiality. If such a factor is immaterial, we
take a different approach that nonetheless recognises that such factors may have an
impact on a service provider, albeit a small one.
We also consider that our approach to OEFs appropriately allows service providers to
recoup at least efficient costs. In addition to adjusting for the material OEFs identified,
we have provided an adjustment for the collective effect of immaterial OEFs that are
exogenous and not accounted for elsewhere. Service providers receive positive
0.5 per cent adjustments for OEFs identified as immaterial that may disadvantage
434
Oakley Greenwood, Review of NSW DBs Regulatory Submissions, 5 August 2014, p. 16. 435
AEMC, Rule Determination, National Electricity Amendment (Economic Regulation of Network Service Providers)
Rule 2012, November 2012, p. 113. 436
AEMC, Rule Determination, National Electricity Amendment (Economic Regulation of Network Service Providers)
Rule 2012, November 2012, pp 107–108.
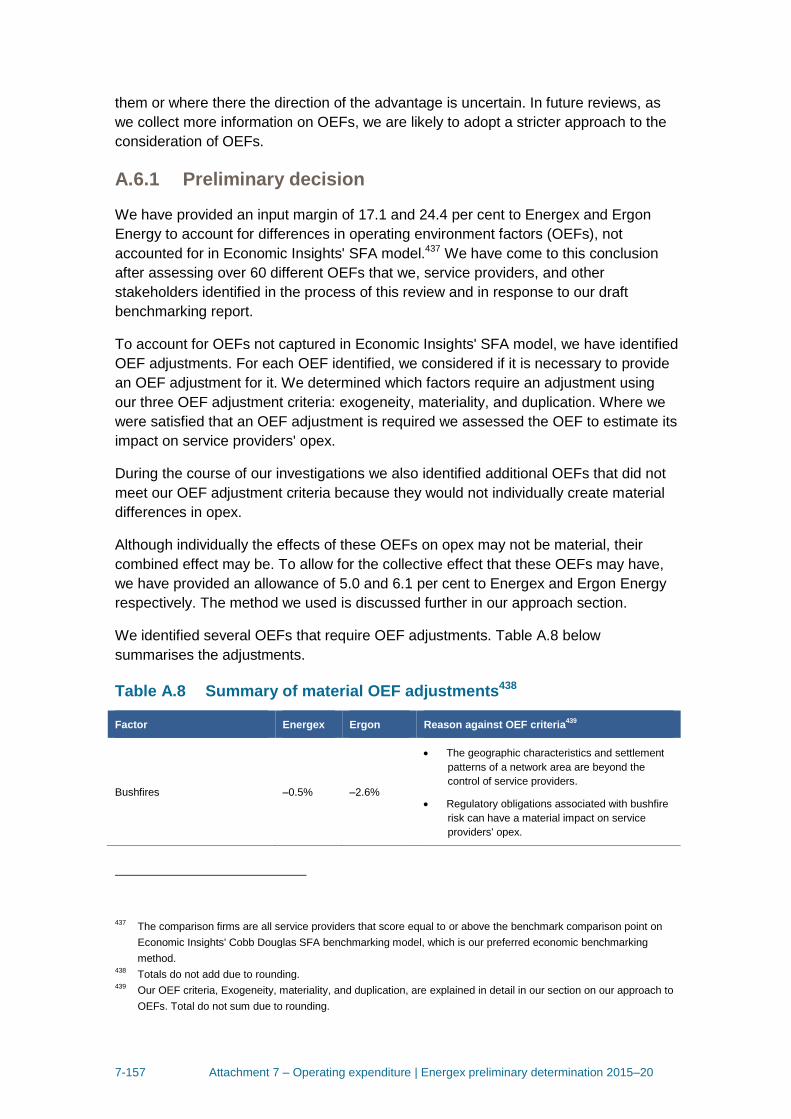
7-157 Attachment 7 – Operating expenditure | Energex preliminary determination 2015–20
them or where there the direction of the advantage is uncertain. In future reviews, as
we collect more information on OEFs, we are likely to adopt a stricter approach to the
consideration of OEFs.
A.6.1 Preliminary decision
We have provided an input margin of 17.1 and 24.4 per cent to Energex and Ergon
Energy to account for differences in operating environment factors (OEFs), not
accounted for in Economic Insights' SFA model.437 We have come to this conclusion
after assessing over 60 different OEFs that we, service providers, and other
stakeholders identified in the process of this review and in response to our draft
benchmarking report.
To account for OEFs not captured in Economic Insights' SFA model, we have identified
OEF adjustments. For each OEF identified, we considered if it is necessary to provide
an OEF adjustment for it. We determined which factors require an adjustment using
our three OEF adjustment criteria: exogeneity, materiality, and duplication. Where we
were satisfied that an OEF adjustment is required we assessed the OEF to estimate its
impact on service providers' opex.
During the course of our investigations we also identified additional OEFs that did not
meet our OEF adjustment criteria because they would not individually create material
differences in opex.
Although individually the effects of these OEFs on opex may not be material, their
combined effect may be. To allow for the collective effect that these OEFs may have,
we have provided an allowance of 5.0 and 6.1 per cent to Energex and Ergon Energy
respectively. The method we used is discussed further in our approach section.
We identified several OEFs that require OEF adjustments. Table A.8 below
summarises the adjustments.
Table A.8 Summary of material OEF adjustments438
Factor Energex Ergon Reason against OEF criteria439
Bushfires –0.5% –2.6%
The geographic characteristics and settlement
patterns of a network area are beyond the
control of service providers.
Regulatory obligations associated with bushfire
risk can have a material impact on service
providers' opex.
437
The comparison firms are all service providers that score equal to or above the benchmark comparison point on
Economic Insights' Cobb Douglas SFA benchmarking model, which is our preferred economic benchmarking
method. 438
Totals do not add due to rounding. 439
Our OEF criteria, Exogeneity, materiality, and duplication, are explained in detail in our section on our approach to
OEFs. Total do not sum due to rounding.
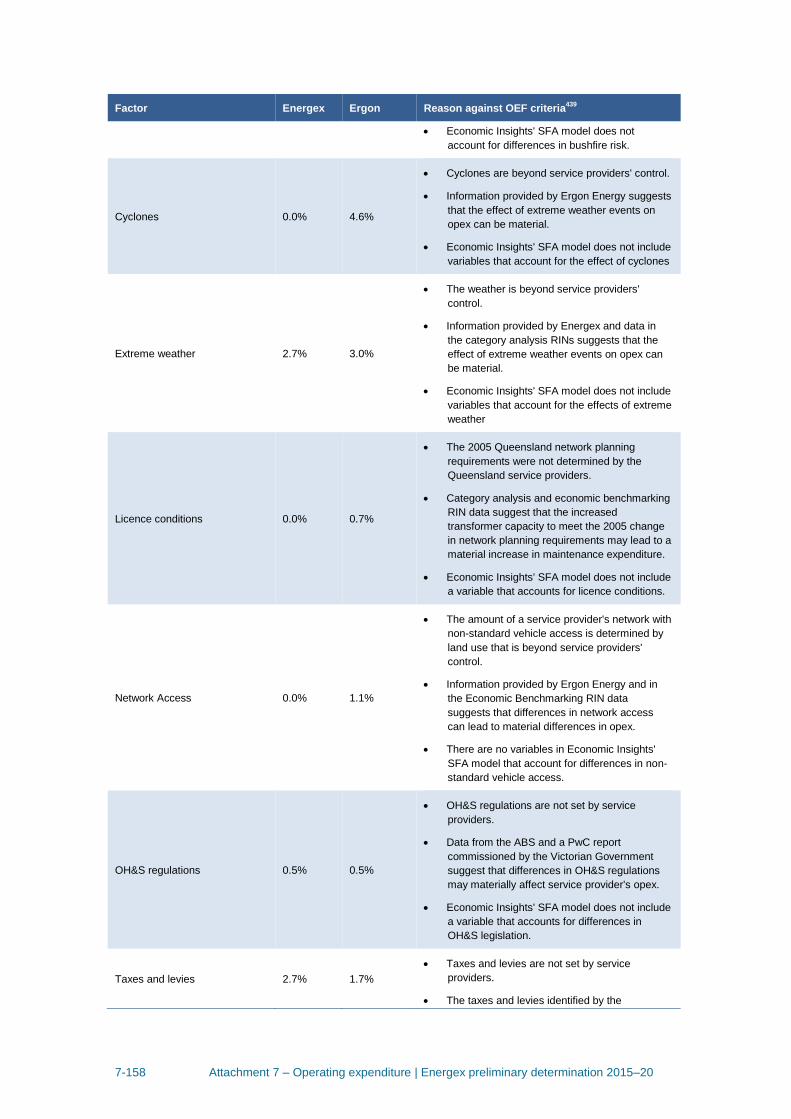
7-158 Attachment 7 – Operating expenditure | Energex preliminary determination 2015–20
Factor Energex Ergon Reason against OEF criteria439
Economic Insights' SFA model does not
account for differences in bushfire risk.
Cyclones 0.0% 4.6%
Cyclones are beyond service providers' control.
Information provided by Ergon Energy suggests
that the effect of extreme weather events on
opex can be material.
Economic Insights' SFA model does not include
variables that account for the effect of cyclones
Extreme weather 2.7% 3.0%
The weather is beyond service providers'
control.
Information provided by Energex and data in
the category analysis RINs suggests that the
effect of extreme weather events on opex can
be material.
Economic Insights' SFA model does not include
variables that account for the effects of extreme
weather
Licence conditions 0.0% 0.7%
The 2005 Queensland network planning
requirements were not determined by the
Queensland service providers.
Category analysis and economic benchmarking
RIN data suggest that the increased
transformer capacity to meet the 2005 change
in network planning requirements may lead to a
material increase in maintenance expenditure.
Economic Insights' SFA model does not include
a variable that accounts for licence conditions.
Network Access 0.0% 1.1%
The amount of a service provider's network with
non-standard vehicle access is determined by
land use that is beyond service providers'
control.
Information provided by Ergon Energy and in
the Economic Benchmarking RIN data
suggests that differences in network access
can lead to material differences in opex.
There are no variables in Economic Insights'
SFA model that account for differences in non-
standard vehicle access.
OH&S regulations 0.5% 0.5%
OH&S regulations are not set by service
providers.
Data from the ABS and a PwC report
commissioned by the Victorian Government
suggest that differences in OH&S regulations
may materially affect service provider's opex.
Economic Insights' SFA model does not include
a variable that accounts for differences in
OH&S legislation.
Taxes and levies 2.7% 1.7%
Taxes and levies are not set by service
providers.
The taxes and levies identified by the
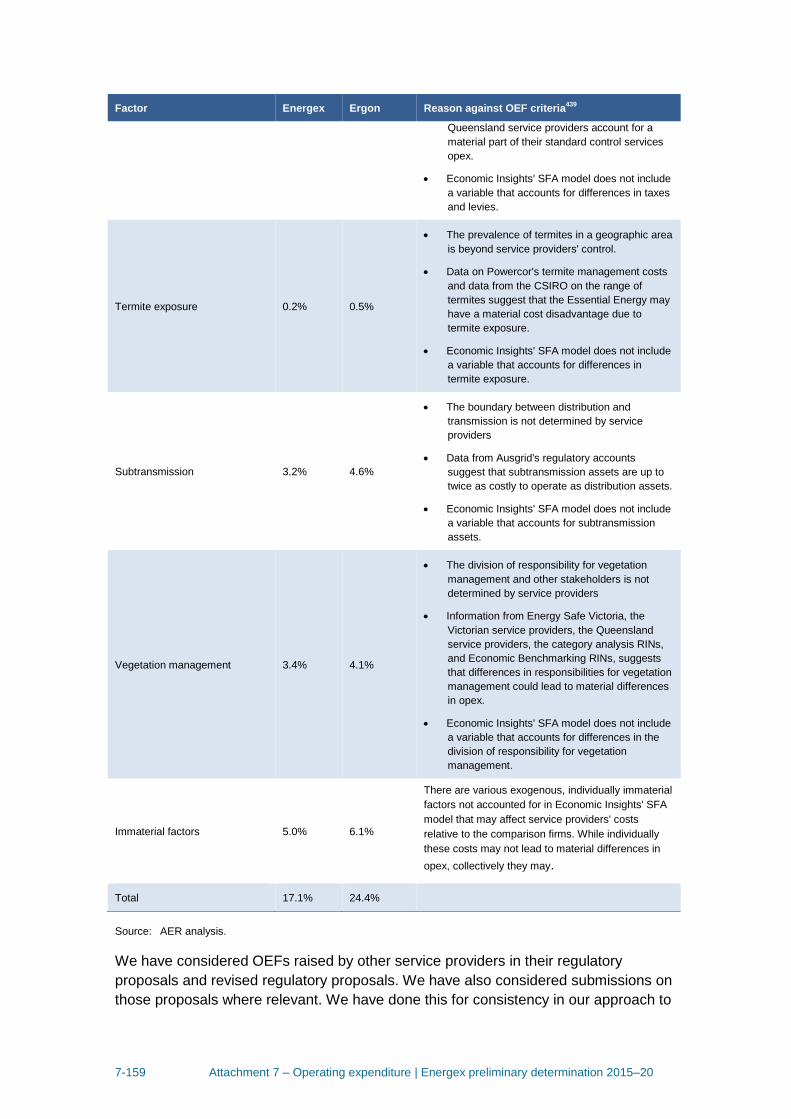
7-159 Attachment 7 – Operating expenditure | Energex preliminary determination 2015–20
Factor Energex Ergon Reason against OEF criteria439
Queensland service providers account for a
material part of their standard control services
opex.
Economic Insights' SFA model does not include
a variable that accounts for differences in taxes
and levies.
Termite exposure 0.2% 0.5%
The prevalence of termites in a geographic area
is beyond service providers' control.
Data on Powercor's termite management costs
and data from the CSIRO on the range of
termites suggest that the Essential Energy may
have a material cost disadvantage due to
termite exposure.
Economic Insights' SFA model does not include
a variable that accounts for differences in
termite exposure.
Subtransmission 3.2% 4.6%
The boundary between distribution and
transmission is not determined by service
providers
Data from Ausgrid's regulatory accounts
suggest that subtransmission assets are up to
twice as costly to operate as distribution assets.
Economic Insights' SFA model does not include
a variable that accounts for subtransmission
assets.
Vegetation management 3.4% 4.1%
The division of responsibility for vegetation
management and other stakeholders is not
determined by service providers
Information from Energy Safe Victoria, the
Victorian service providers, the Queensland
service providers, the category analysis RINs,
and Economic Benchmarking RINs, suggests
that differences in responsibilities for vegetation
management could lead to material differences
in opex.
Economic Insights' SFA model does not include
a variable that accounts for differences in the
division of responsibility for vegetation
management.
Immaterial factors 5.0% 6.1%
There are various exogenous, individually immaterial
factors not accounted for in Economic Insights' SFA
model that may affect service providers' costs
relative to the comparison firms. While individually
these costs may not lead to material differences in
opex, collectively they may.
Total 17.1% 24.4%
Source: AER analysis.
We have considered OEFs raised by other service providers in their regulatory
proposals and revised regulatory proposals. We have also considered submissions on
those proposals where relevant. We have done this for consistency in our approach to
7-160 Attachment 7 – Operating expenditure | Energex preliminary determination 2015–20
OEFs and to capture the effect of relevant OEFs on the Queensland service providers'
opex.
We have considered all of the submissions made to us on OEFs, but not all service
providers have had the same opportunities to provide information on the OEFs that
affect their costs yet. We have sought information on some of the OEFs raised by the
ACT, NSW and Queensland service providers from the Victorian service providers, but
our review has focused on the OEFs in the context of the current decisions. The
Victorian service providers have not yet had the same opportunity to present us their
cost disadvantages. In future reviews we expect that the Victorian service providers
and other stakeholders will provide further information on the effect of OEFs. These
submissions may reveal cost advantages that the Queensland service providers have
relative to the Victorian service providers. Cost advantages have the effect of
decreasing the total adjustment made to a service provider's opex for OEFs. Therefore
our current approach may favour the ACT, NSW, and Queensland service providers to
the extent that not all of their cost advantages have been revealed.
In line with the AEMC,440 we have separated the analysed factors into five groups
which are considered separately below:
customer factors
endogenous factors
geographic factors
jurisdictional factors
network factors.
A.6.2 Approach to operating environment factors
It is important to recognise that service providers do not operate under exactly the
same operating environment factors (OEFs). OEFs may have a significant impact on
measured efficiency through their impact on a service provider's opex. It is desirable to
adjust for material OEF differences to ensure that when comparisons are made across
service providers, we are comparing like with like to the greatest extent possible. By
identifying the effect of OEFs on costs one can determine the extent to which cost
differences are exogenous or due to inefficiency.441
Some key OEFs are directly accounted for in Economic Insights' SFA model. Where
this has not been possible, we have considered the quantum of the impact of the OEF
on the Queensland service providers' opex relative to the comparison firms. We have
then adjusted the SFA efficiency scores based on our findings on the effects of OEFs.
440
AEMC, Rule determination: National Electricity Amendment (Economic Regulation of Network Service Providers),
November 2012, p. 113. 441
Oakley Greenwood, Review of NSW DBs Regulatory Submissions, 5 August 2014, p. 16.
7-161 Attachment 7 – Operating expenditure | Energex preliminary determination 2015–20
We have accounted for OEFs using a two-step process. In the first step we have
assessed whether an adjustment for an OEF would meet our OEF criteria: exogeneity,
materiality, and duplication. In the second step, we assessed OEFs that met the
exogeneity and duplication criteria to estimate the collective effect that they may have
on service providers' opex. The purpose of the second step is to account for the effect
of OEFs that do not meet the materiality criterion individually, but which do meet the
criterion when considered collectively.
OEF assessment: Step one
Where an OEF meets all three of our OEF adjustment criteria we have provided an
OEF adjustment. Our three OEF criteria are as follows:
1. Exogeneity: The first criterion is that an OEF should be outside the control of
service providers' management. Where the effect of an OEF is within the control of
service provider's management we would not generally provide an adjustment for
the OEF.442 Adjusting for that OEF may mask inefficient investment or expenditure.
2. Materiality: The second criterion is that an OEF should create material differences
in service providers' opex. Where the effect of an OEF is not material, we would
generally not provide an adjustment for the factor. We do note, however, that we
have provided a collective adjustment for individually immaterial factors.443 444
3. Duplication: The third criterion is that the OEF should not have been accounted
for elsewhere. Where the effect of an OEF is accounted for elsewhere, we have not
provided an adjustment for that factor. To do so would be to double count the effect
of the OEF. 445 446
Given the nature of OEFs, as circumstances that differ between service providers, we
have had to rely on a wide array of different information sources. For each OEF we
have considered the evidence before us in making our conclusions. In some cases this
442
AEMC, Rule determination: National Electricity Amendment (Economic Regulation of Network Service Providers),
November 2012, p. 113. 443
We have treated any OEF that will increase a service provider's opex by 0.5 per cent or more, relative to other
service providers, as material. We chose 0.5 per cent as the materiality threshold because this is the materiality
threshold we used in the Economic Benchmarking RIN. The materiality threshold relates to differences between
the previous cost allocation method (CAM) and the current CAM. If service providers' current CAMs lead to
material differences in reported opex compared to their past CAM, they are required to backcast their costs using
their current CAM. The comparable threshold for preparing financial statements, in AASB 1031: Materiality, is
between 10 and 5 per cent. 444
We also note that irrelevant OEFs will also be captured by the materiality criterion. Where an OEF is not relevant,
for example it does not affect the comparison firms or the service provider being benchmarked, it will not lead to a
difference in opex. 445
For example, Economic Insights' SFA model captures the effect of line length on opex by using circuit length as an
output variable. In this context, an OEF adjustment for circuit length would double count the effect of route line
length on opex. Another example is that we exclude metering services from our economic benchmarking data. In
this case, an OEF adjustment would remove the metering services from services providers' benchmarked opex
twice. 446
We also note that the SFA model uses dummy variables that account for all systematic differences in operating
environments between the Australian and overseas service providers.
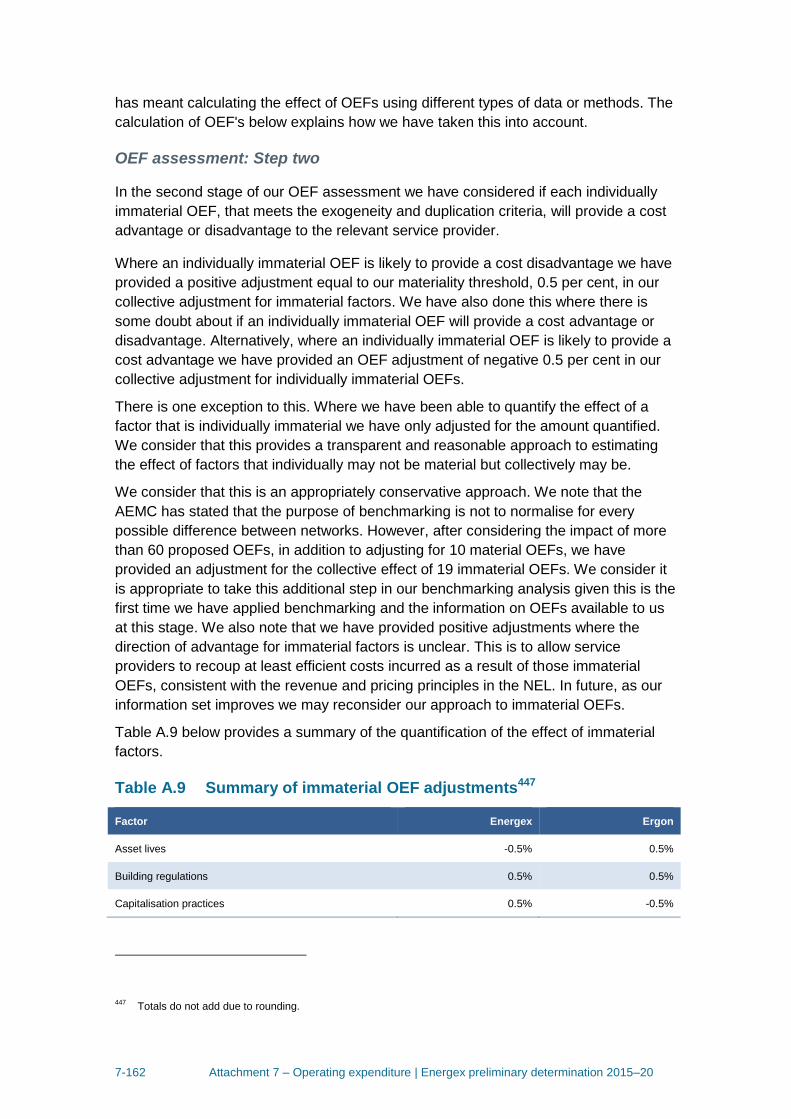
7-162 Attachment 7 – Operating expenditure | Energex preliminary determination 2015–20
has meant calculating the effect of OEFs using different types of data or methods. The
calculation of OEF's below explains how we have taken this into account.
OEF assessment: Step two
In the second stage of our OEF assessment we have considered if each individually
immaterial OEF, that meets the exogeneity and duplication criteria, will provide a cost
advantage or disadvantage to the relevant service provider.
Where an individually immaterial OEF is likely to provide a cost disadvantage we have
provided a positive adjustment equal to our materiality threshold, 0.5 per cent, in our
collective adjustment for immaterial factors. We have also done this where there is
some doubt about if an individually immaterial OEF will provide a cost advantage or
disadvantage. Alternatively, where an individually immaterial OEF is likely to provide a
cost advantage we have provided an OEF adjustment of negative 0.5 per cent in our
collective adjustment for individually immaterial OEFs.
There is one exception to this. Where we have been able to quantify the effect of a
factor that is individually immaterial we have only adjusted for the amount quantified.
We consider that this provides a transparent and reasonable approach to estimating
the effect of factors that individually may not be material but collectively may be.
We consider that this is an appropriately conservative approach. We note that the
AEMC has stated that the purpose of benchmarking is not to normalise for every
possible difference between networks. However, after considering the impact of more
than 60 proposed OEFs, in addition to adjusting for 10 material OEFs, we have
provided an adjustment for the collective effect of 19 immaterial OEFs. We consider it
is appropriate to take this additional step in our benchmarking analysis given this is the
first time we have applied benchmarking and the information on OEFs available to us
at this stage. We also note that we have provided positive adjustments where the
direction of advantage for immaterial factors is unclear. This is to allow service
providers to recoup at least efficient costs incurred as a result of those immaterial
OEFs, consistent with the revenue and pricing principles in the NEL. In future, as our
information set improves we may reconsider our approach to immaterial OEFs.
Table A.9 below provides a summary of the quantification of the effect of immaterial
factors.
Table A.9 Summary of immaterial OEF adjustments447
Factor Energex Ergon
Asset lives -0.5% 0.5%
Building regulations 0.5% 0.5%
Capitalisation practices 0.5% -0.5%
447
Totals do not add due to rounding.
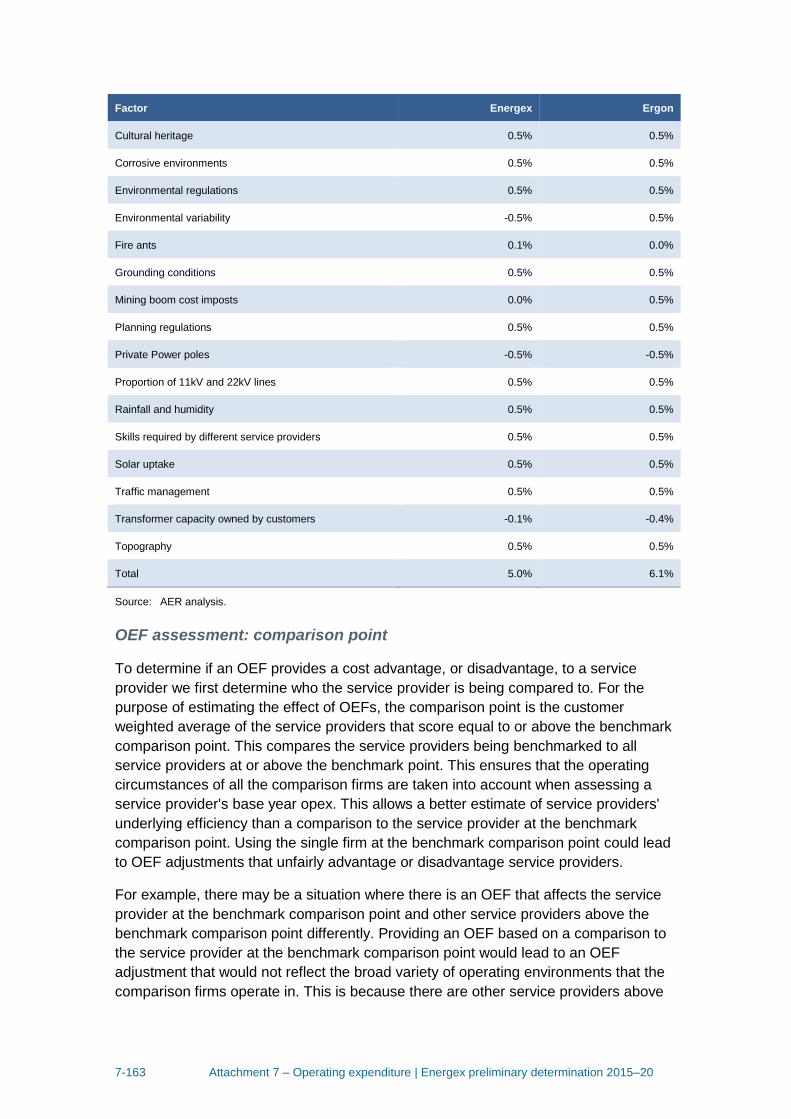
7-163 Attachment 7 – Operating expenditure | Energex preliminary determination 2015–20
Factor Energex Ergon
Cultural heritage 0.5% 0.5%
Corrosive environments 0.5% 0.5%
Environmental regulations 0.5% 0.5%
Environmental variability -0.5% 0.5%
Fire ants 0.1% 0.0%
Grounding conditions 0.5% 0.5%
Mining boom cost imposts 0.0% 0.5%
Planning regulations 0.5% 0.5%
Private Power poles -0.5% -0.5%
Proportion of 11kV and 22kV lines 0.5% 0.5%
Rainfall and humidity 0.5% 0.5%
Skills required by different service providers 0.5% 0.5%
Solar uptake 0.5% 0.5%
Traffic management 0.5% 0.5%
Transformer capacity owned by customers -0.1% -0.4%
Topography 0.5% 0.5%
Total 5.0% 6.1%
Source: AER analysis.
OEF assessment: comparison point
To determine if an OEF provides a cost advantage, or disadvantage, to a service
provider we first determine who the service provider is being compared to. For the
purpose of estimating the effect of OEFs, the comparison point is the customer
weighted average of the service providers that score equal to or above the benchmark
comparison point. This compares the service providers being benchmarked to all
service providers at or above the benchmark point. This ensures that the operating
circumstances of all the comparison firms are taken into account when assessing a
service provider's base year opex. This allows a better estimate of service providers'
underlying efficiency than a comparison to the service provider at the benchmark
comparison point. Using the single firm at the benchmark comparison point could lead
to OEF adjustments that unfairly advantage or disadvantage service providers.
For example, there may be a situation where there is an OEF that affects the service
provider at the benchmark comparison point and other service providers above the
benchmark comparison point differently. Providing an OEF based on a comparison to
the service provider at the benchmark comparison point would lead to an OEF
adjustment that would not reflect the broad variety of operating environments that the
comparison firms operate in. This is because there are other service providers above
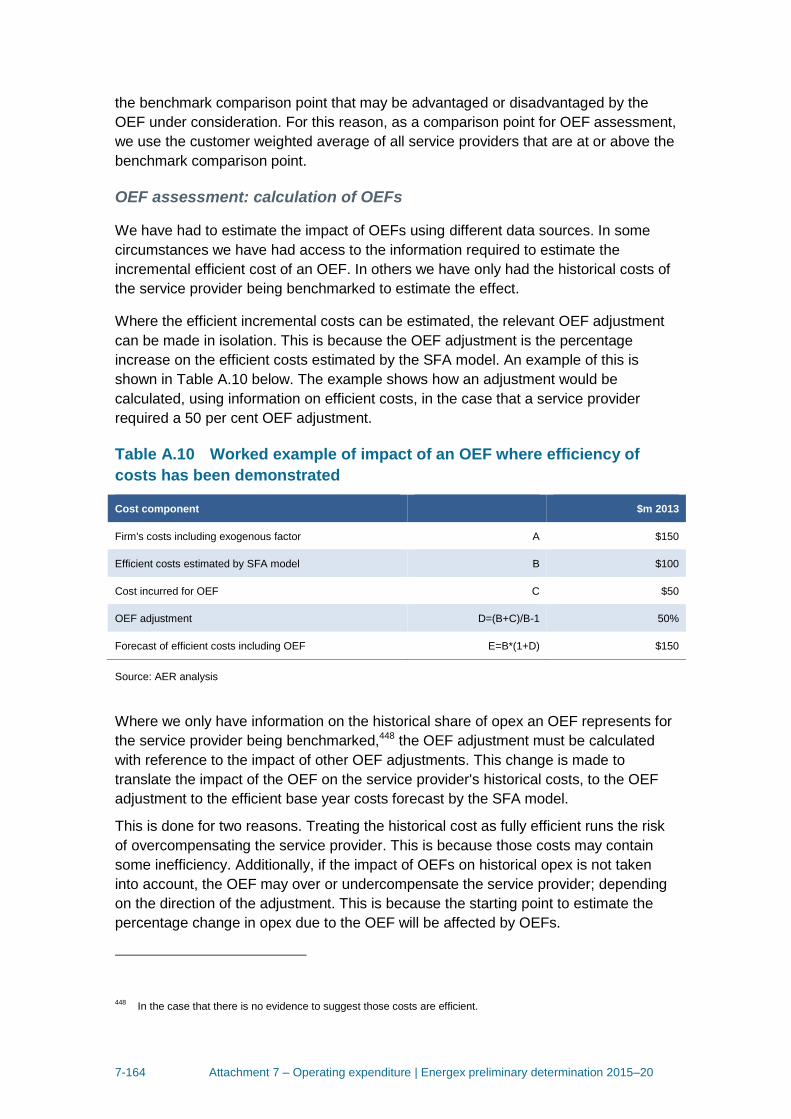
7-164 Attachment 7 – Operating expenditure | Energex preliminary determination 2015–20
the benchmark comparison point that may be advantaged or disadvantaged by the
OEF under consideration. For this reason, as a comparison point for OEF assessment,
we use the customer weighted average of all service providers that are at or above the
benchmark comparison point.
OEF assessment: calculation of OEFs
We have had to estimate the impact of OEFs using different data sources. In some
circumstances we have had access to the information required to estimate the
incremental efficient cost of an OEF. In others we have only had the historical costs of
the service provider being benchmarked to estimate the effect.
Where the efficient incremental costs can be estimated, the relevant OEF adjustment
can be made in isolation. This is because the OEF adjustment is the percentage
increase on the efficient costs estimated by the SFA model. An example of this is
shown in Table A.10 below. The example shows how an adjustment would be
calculated, using information on efficient costs, in the case that a service provider
required a 50 per cent OEF adjustment.
Table A.10 Worked example of impact of an OEF where efficiency of
costs has been demonstrated
Cost component $m 2013
Firm's costs including exogenous factor A $150
Efficient costs estimated by SFA model B $100
Cost incurred for OEF C $50
OEF adjustment D=(B+C)/B-1 50%
Forecast of efficient costs including OEF E=B*(1+D) $150
Source: AER analysis
Where we only have information on the historical share of opex an OEF represents for
the service provider being benchmarked,448 the OEF adjustment must be calculated
with reference to the impact of other OEF adjustments. This change is made to
translate the impact of the OEF on the service provider's historical costs, to the OEF
adjustment to the efficient base year costs forecast by the SFA model.
This is done for two reasons. Treating the historical cost as fully efficient runs the risk
of overcompensating the service provider. This is because those costs may contain
some inefficiency. Additionally, if the impact of OEFs on historical opex is not taken
into account, the OEF may over or undercompensate the service provider; depending
on the direction of the adjustment. This is because the starting point to estimate the
percentage change in opex due to the OEF will be affected by OEFs.
448
In the case that there is no evidence to suggest those costs are efficient.
7-165 Attachment 7 – Operating expenditure | Energex preliminary determination 2015–20
The Queensland service providers are affected by five OEFs where information on the
efficient costs is not available: cyclones, extreme weather, licence conditions, customer
owned distribution transformers, and the division in responsibility for vegetation
management. The calculation of the adjustment to these factors can be found in the
OEF summary spreadsheet attached to this decision.
OEF assessment: Non-recurrent costs
We are not satisfied that an OEF adjustment should be made for non-recurrent costs.
Providing an OEF for non-recurrent costs would treat those costs as if they were
recurrent. Economic Insights' benchmarking results are used as the basis for our
forecast of opex. If we adjust the benchmarking results with an OEF adjustment for
non-recurrent costs, it has the effect of including those non-recurrent costs in our opex
forecast.
Additionally, an OEF adjustment for a non-recurrent cost would not meet the
duplication OEF criterion. Economic Insights' SFA model takes non-recurrent costs into
account. The SFA efficiency scores are based on the average performance of service
providers over the period. Therefore the effects of transitory increases or decreases in
relative opex efficiency are reduced. Also SFA modelling accounts for transitory
variations in data using a compound stochastic variance term. This statistical technique
accounts for random shocks in opex.449
In the following sections we consider the OEFs raised by service providers and other
stakeholders.
A.6.3 Customer factors
Customer Density
We are not satisfied that it is necessary to provide an OEF adjustment for customer
density. An adjustment for customer density does not satisfy the duplication OEF
adjustment criterion. On the basis of second stage regression analysis of the opex
MPFP results, we are not satisfied that output variables in Economic insights' SFA
model do not sufficiently accounts for the effects of customer density.
Customer density is a useful proxy for identifying the distance between customers. As
each service provider has an obligation to serve existing customers, we assume that
this is therefore an exogenous factor. Customer density, in and of itself, does not drive
costs. Factors correlated with customer density are the underlying cost drivers. These
include:
Asset exposure - A shorter line will have be less exposed to degradation from the
elements and damage from third parties.
449
Aigner, D.J., C.A.K. Lovell and P. Schmidt, Formulation and estimation of stochastic frontier production function
models, Journal of Econometrics 6, 21–37, 1977, p. 25.
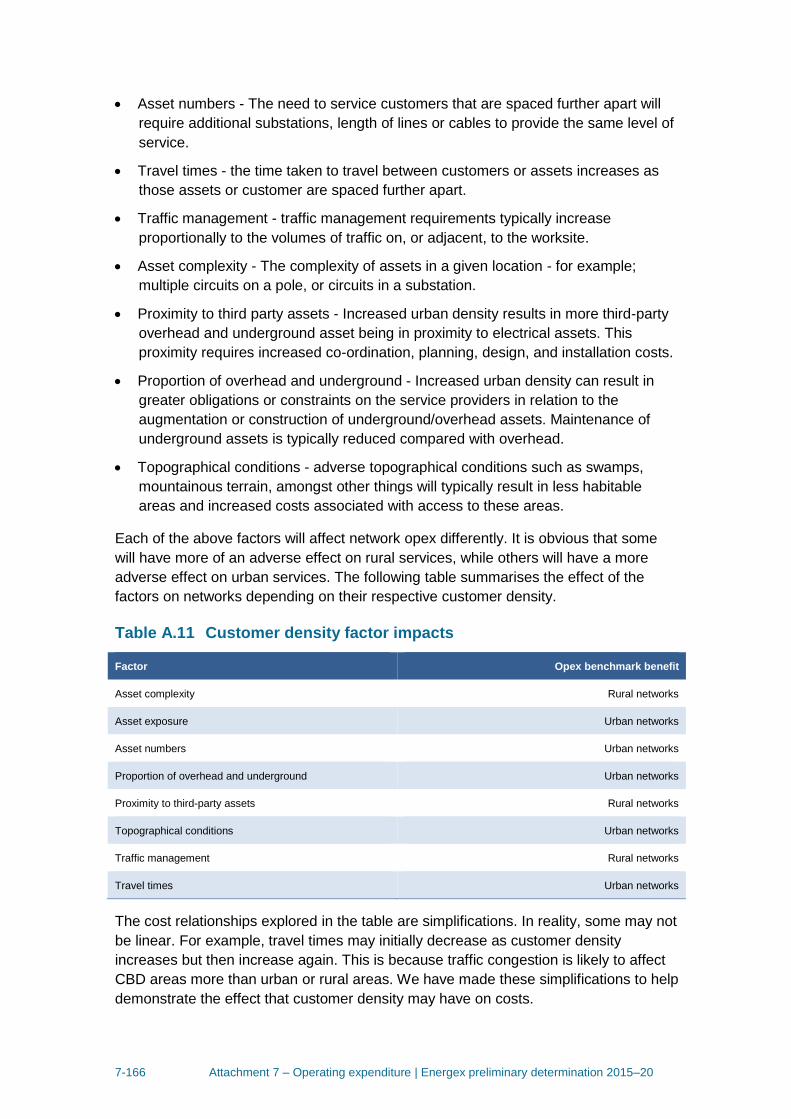
7-166 Attachment 7 – Operating expenditure | Energex preliminary determination 2015–20
Asset numbers - The need to service customers that are spaced further apart will
require additional substations, length of lines or cables to provide the same level of
service.
Travel times - the time taken to travel between customers or assets increases as
those assets or customer are spaced further apart.
Traffic management - traffic management requirements typically increase
proportionally to the volumes of traffic on, or adjacent, to the worksite.
Asset complexity - The complexity of assets in a given location - for example;
multiple circuits on a pole, or circuits in a substation.
Proximity to third party assets - Increased urban density results in more third-party
overhead and underground asset being in proximity to electrical assets. This
proximity requires increased co-ordination, planning, design, and installation costs.
Proportion of overhead and underground - Increased urban density can result in
greater obligations or constraints on the service providers in relation to the
augmentation or construction of underground/overhead assets. Maintenance of
underground assets is typically reduced compared with overhead.
Topographical conditions - adverse topographical conditions such as swamps,
mountainous terrain, amongst other things will typically result in less habitable
areas and increased costs associated with access to these areas.
Each of the above factors will affect network opex differently. It is obvious that some
will have more of an adverse effect on rural services, while others will have a more
adverse effect on urban services. The following table summarises the effect of the
factors on networks depending on their respective customer density.
Table A.11 Customer density factor impacts
Factor Opex benchmark benefit
Asset complexity Rural networks
Asset exposure Urban networks
Asset numbers Urban networks
Proportion of overhead and underground Urban networks
Proximity to third-party assets Rural networks
Topographical conditions Urban networks
Traffic management Rural networks
Travel times Urban networks
The cost relationships explored in the table are simplifications. In reality, some may not
be linear. For example, travel times may initially decrease as customer density
increases but then increase again. This is because traffic congestion is likely to affect
CBD areas more than urban or rural areas. We have made these simplifications to help
demonstrate the effect that customer density may have on costs.
7-167 Attachment 7 – Operating expenditure | Energex preliminary determination 2015–20
The fact that it is a simplification aside, the table demonstrates that it is not evident
what the overall impact of customer density is on service providers' opex. Given the
complexity of the above factors, it is clear that it is important to consider the impacts of
customer density in any benchmarks that are undertaken.
We have considered a number of measures for aggregating the impacts from the
above factors. Historically, industry benchmarks have used a number of representative
measures including:
Customer density measured as customers per (circuit) km of line (cust/km)
Energy density measured as energy delivered per (circuit) km of line (kWh/km)
Demand density measured as demand per (circuit) km of line (MVA/km)
Customer density measured as customers per square kilometre of service territory
The use of service territory as a density measure has proven problematic. This is due
to the difficulty in accurately measuring service territory items such as lakes, national
parks, and unpopulated areas. As networks do not incur costs for areas that are un-
serviced, customers per square kilometre of service area is not a useful measure for
opex or service comparisons.
We are not satisfied that linear density is insufficient to capture the effects of customer
density. This is because opex will be driven by the length of line that must be
maintained rather than the area that the service provider nominally covers. Using a
measure of spatial density may cover nominally servicing areas in which a service
provider has no assets or customers. An example of this, provided by Economic
Insights, is the Northern Territory distributor: Power and Water Corporation. 450
Nominally, Power and Water Corporation's service area is all of the Northern
Territory.451 In reality, Power and Water Corporations electricity distribution network
covers Darwin and Katherine (with a transmission line between the two) on its main
network with smaller networks around the Territory serviced mostly by isolated, diesel
generator–based systems.452 Therefore measuring customer density using Power and
Water Corporations nominal service area would provide a misleading picture of the
customer density of Power and Water Corporation's network.
This also applies to the consideration of Ergon Energy, Essential Energy, and SA
Power Networks. Although Ergon Energy is nominally responsible for electricity
distribution across all of Queensland (except South East Queensland), there are large
parts of western Queensland where it has no assets. Similarly, there are parts of
western NSW and the great dividing ranges that are nominally part of Essential's
450
Economic Insights, April 2015, pp. 14–15. 451
Power and Water Corporation, About Power and Water, available at:
www.powerwater.com.au/about_power_and_water [last accessed 9 March 2015]. 452
Power and Water Corporation, Electricity Map, available at:
www.powerwater.com.au/community_and_education/student_resources/maps/electricity_map [last accessed 9
March 2015].
7-168 Attachment 7 – Operating expenditure | Energex preliminary determination 2015–20
service area, but to which Essential provides no services. There are also large parts of
northern South Australia where SA Power Networks has no assets.
Customer requirements
We are not satisfied an OEF adjustment for customer requirements would meet the
duplication OEF adjustment criterion. Special customer requirements are accounted for
elsewhere. This is because our economic benchmarking data only capture information
on network services.
All service providers have customers with high security of supply requirements.
Examples of these include hospitals, state parliaments, military installations, banks,
stock exchanges, and telecommunications facilities. Many manufacturing industries
also have very high requirements for supply security due to the costs of lost production
and equipment damage.
We are not satisfied that an adjustment for customer requirements would be
appropriate. This is because connection services are excluded from our economic
benchmarking data. Connection services are not included in network services.
Because connection services are excluded from network services, connection services
cannot affect benchmarking that uses network services data. Connection services
include the opex and capex incurred for new connections or the modification of
connections. These services can include the addition of feeders to a customer's
premises for increased redundancy or upstream augmentation. Therefore, the services
required to provide additional security of supply to customers with special requirements
are connection services. We acknowledge that the modifications required by special
customers may lead to service providers incurring additional opex to service the new
assets. However, the additional inputs are also reflected in outputs, such as line length
and ratcheted peak demand, in Economic Insights' benchmarking models.
Mix of demand to non-demand customers
We are not satisfied that an OEF adjustment for differences in the ratio of demand to
non-demand customers would meet the duplication OEF adjustment criterion. To the
extent that the ratio of demand to non-demand customers does have an impact on
costs, Economic Insights' SFA benchmarking model accounts for it.
Demand customers are customers that are billed predominantly on the basis of their
peak capacity requirements. These in general are large commercial and industrial
customers. Non-demand customers are customers that are billed predominantly on the
energy throughput delivered to them.
An adjustment for the ratio of demand to non-demand customers is not necessary
because to the extent that the ratio of demand to non-demand customers has an effect
on costs, Economic Insights' SFA model accounts for that effect. The model takes into
account peak demand and customer numbers, which should capture the effect of
differences in the ratio of demand to non-demand customers. The data used also
exclude metering and connection costs. Therefore, Economic Insights' SFA model
7-169 Attachment 7 – Operating expenditure | Energex preliminary determination 2015–20
account for the main factors through which demand customers may impose higher
costs on service providers than non-demand customers.
Population growth
We are not satisfied that an OEF adjustment for population growth would meet the
duplication OEF adjustment criterion. Economic Insights' SFA model accounts for
population growth through customer numbers and peak demand.
Population growth (or decline) affect all service providers. Some service providers will
experience higher growth than others and some areas of their networks will experience
more growth than others.
We are not satisfied that it is necessary to provide an OEF adjustment for population
growth. Economic Insights' SFA model accounts for population growth. Customer
numbers and peak demand are output variables in Economic Insights' SFA model.
We are also satisfied that it is not necessary to provide an OEF adjustment for
differences in population growth in greenfields and brownfields developments because
connection costs are not included in our economic benchmarking data. Brownfields
developments may have higher connection costs than greenfields developments.
However Economic Insights' SFA model uses network services data. Network services
exclude connection services. Because network services do not include connection
services, connection services cannot affect benchmarking that uses network services
data.
Load growth
We are not satisfied that an OEF adjustment to account for differences in load growth
would meet the duplication OEF adjustment criterion. Economic Insights' SFA model
accounts for load growth.
In support of Ausgrid's 2014 regulatory proposal Advisian (formerly known as Evans
and Peck) raised load growth as a possible OEF that may impede like for like
comparison between service providers.453
An adjustment for load growth is not necessary because to the extent that load growth
has an effect on costs, Economic Insights' SFA model accounts for that effect.
Economic Insights' SFA model accounts for changes in network capacity by including
ratcheted peak demand as an output variable.
453
Evans and Peck, Review of factors contributing to variations in operating and capital costs structures of Australian
service providers, November 2012, pp. 28–29.
7-170 Attachment 7 – Operating expenditure | Energex preliminary determination 2015–20
Load factor
We are not satisfied that an OEF adjustment for differences in load factor would meet
the materiality or duplication OEF adjustment criteria. Load factor will not to lead to
material differences in opex between services providers. The relevant cost driver is
peak demand, which is accounted for in Economic Insights' SFA model.
Load factor is a network's average demand divided by its peak demand. Service
providers design electricity networks to taking into account the expected peak demand
for electricity services. While the actual energy usage on a network is important from a
billing perspective, energy is not the driver for capital expenditure, and as a result, it is
not the driver for opex either. The higher peak demand, the more assets will be
required to accommodate those peaks.
We are not satisfied that an adjustment for load factor is necessary because load
factor does not drive costs. The relevant cost driver is peak demand. As mentioned
above service providers design electricity networks accounting for the expected peak
demand. While the "peakiness" of the load may alter the timing of some demand driven
projects, the magnitude of the peak will be the primary driver for this form of
expenditure.
Further, we are also not satisfied that an adjustment for load factor is required because
Economic Insights' SFA model accounts for differences in peak demand. Ratcheted
peak demand is an output in Economic Insights' SFA model. As mentioned above it is
peak demand that determines the capacity required by a network, not load factor.
Network length
We are not satisfied that an OEF adjustment to account for differences in network
length meets the duplication OEF adjustment criterion. Economic Insights' SFA model
accounts for differences in network length.
Network length is the length of a service provider's network. It can be measured using
route line length or circuit line length. Route line length is distance between service
providers' poles. Circuit line length is the length of lines in service, where a double
circuit line counts as twice the length. All else equal, the longer a service provider's
network length is the more costs it will incur.
An adjustment for network length is not necessary because to the extent that network
length has an effect on costs, Economic Insights' SFA model accounts for that effect.
The SFA model account for changes in network line length. Circuit length is included
as an output in all of these models.
Economies of scale
We are not satisfied that an OEF adjustment for economies of scale would meet the
duplication OEF adjustment criterion. The benchmarking model that we are using as
the basis of our forecast of base opex, the Cobb Douglas SFA opex cost function,
accounts for economies of scale.
7-171 Attachment 7 – Operating expenditure | Energex preliminary determination 2015–20
We are not satisfied that an adjustment for economies of scale is necessary because
the Cobb Douglas functional form, which is used in Economic Insights' SFA model,
accounts for economies of scale. This is because it permits the estimation of the cost
elasticities of the output variables. That is, the estimated coefficients of the output
variables.
A.6.4 Endogenous factors
Activity scheduling
We are not satisfied that an OEF adjustment for differences in activity scheduling
would meet the exogeneity OEF adjustment criterion. How a service provider chooses
to schedule its business processes is a management decision.
Activity scheduling is the scheduling of routine network inspection and maintenance
activities.
Ergon Energy's consultant Huegin, submitted that activity scheduling will lead to cost
differences across service providers.454 Huegin stated that a high degree of
maintenance costs for service providers are preventative activities such as inspections.
The scheduling of inspections will determine the workload, and therefore costs of those
preventative activities.
How frequently a service provider chooses to inspect its assets is a management
decision. We note that some environmental conditions may lead to more frequent
asset inspections or maintenance. We have considered these environmental
conditions as they have been raised by stakeholders. Examples of these include asset
age and humidity.
Capitalisation practices
We are not satisfied that an OEF adjustment for differences in capitalisation practices
would not satisfy the materiality OEF adjustment criterion. Differences in capitalisation
practices will not lead to material differences in opex between the Queensland service
providers and the comparison firms.
For clarification, capitalisation practices include both service providers decision on the
relative quantity of capital and operating costs and also the policies service providers
use to classify costs as assets or expenses. Using different mixes of assets and
expenses to provide will affect the operating expenditure a service provider incurs.
Differences in the policies service providers use to classify costs as assets or
expenses will affect the opex service providers record. Both of these have the potential
to affect service providers' efficiency scores in Economic Insights SFA model.
However, choices on capital inputs and accounting policies are management decisions
so would not satisfy the exogeneity OEF criterion. Nonetheless, because these
454
Huegin, Ergon Energy Expenditure Benchmarking, 17 October 2014, p. 14.
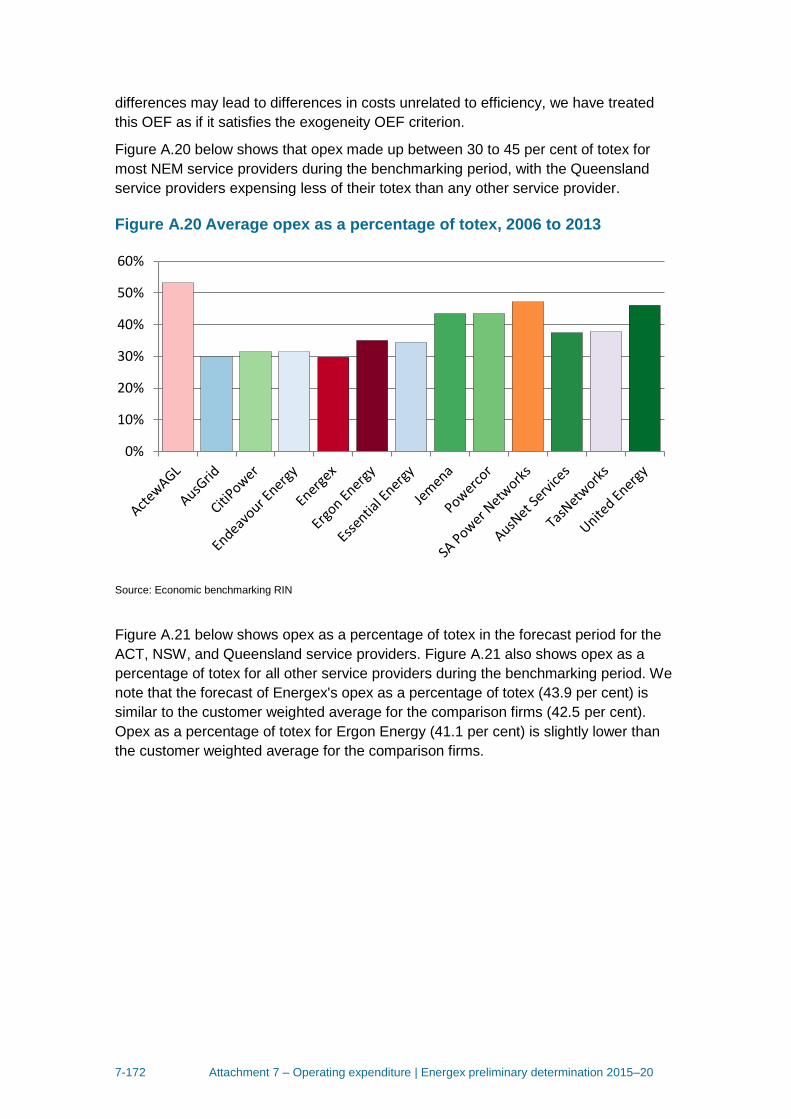
7-172 Attachment 7 – Operating expenditure | Energex preliminary determination 2015–20
differences may lead to differences in costs unrelated to efficiency, we have treated
this OEF as if it satisfies the exogeneity OEF criterion.
Figure A.20 below shows that opex made up between 30 to 45 per cent of totex for
most NEM service providers during the benchmarking period, with the Queensland
service providers expensing less of their totex than any other service provider.
Figure A.20 Average opex as a percentage of totex, 2006 to 2013
Source: Economic benchmarking RIN
Figure A.21 below shows opex as a percentage of totex in the forecast period for the
ACT, NSW, and Queensland service providers. Figure A.21 also shows opex as a
percentage of totex for all other service providers during the benchmarking period. We
note that the forecast of Energex's opex as a percentage of totex (43.9 per cent) is
similar to the customer weighted average for the comparison firms (42.5 per cent).
Opex as a percentage of totex for Ergon Energy (41.1 per cent) is slightly lower than
the customer weighted average for the comparison firms.
0%
10%
20%
30%
40%
50%
60%
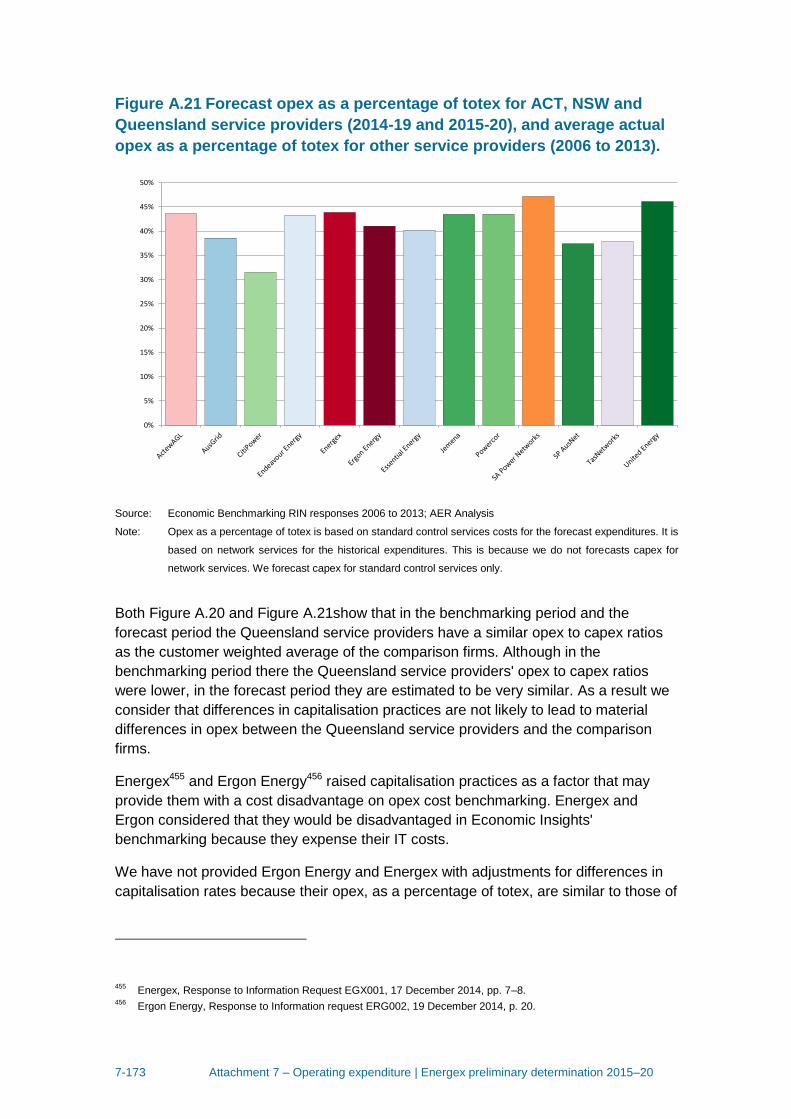
7-173 Attachment 7 – Operating expenditure | Energex preliminary determination 2015–20
Figure A.21 Forecast opex as a percentage of totex for ACT, NSW and
Queensland service providers (2014-19 and 2015-20), and average actual
opex as a percentage of totex for other service providers (2006 to 2013).
Source: Economic Benchmarking RIN responses 2006 to 2013; AER Analysis
Note: Opex as a percentage of totex is based on standard control services costs for the forecast expenditures. It is
based on network services for the historical expenditures. This is because we do not forecasts capex for
network services. We forecast capex for standard control services only.
Both Figure A.20 and Figure A.21show that in the benchmarking period and the
forecast period the Queensland service providers have a similar opex to capex ratios
as the customer weighted average of the comparison firms. Although in the
benchmarking period there the Queensland service providers' opex to capex ratios
were lower, in the forecast period they are estimated to be very similar. As a result we
consider that differences in capitalisation practices are not likely to lead to material
differences in opex between the Queensland service providers and the comparison
firms.
Energex455 and Ergon Energy456 raised capitalisation practices as a factor that may
provide them with a cost disadvantage on opex cost benchmarking. Energex and
Ergon considered that they would be disadvantaged in Economic Insights'
benchmarking because they expense their IT costs.
We have not provided Ergon Energy and Energex with adjustments for differences in
capitalisation rates because their opex, as a percentage of totex, are similar to those of
455
Energex, Response to Information Request EGX001, 17 December 2014, pp. 7–8. 456
Ergon Energy, Response to Information request ERG002, 19 December 2014, p. 20.
0%
5%
10%
15%
20%
25%
30%
35%
40%
45%
50%
7-174 Attachment 7 – Operating expenditure | Energex preliminary determination 2015–20
the comparison firms. This suggests that while they may expense more IT related
costs than other service providers that these policies are offset by capitalising a higher
percentage of costs in other areas.
Although we consider that differences in capitalisation practices will not to lead to
material differences in opex between the Queensland service providers and the
comparison firms, we have included it in our adjustment for immaterial factors.
Economic Insights' SFA model does not include a variable that directly accounts for
differences capitalisation practices. Also as discussed above, differences in
capitalisation practices may lead to differences in opex that are not related to efficiency
and are not accounted for in Economic Insights' SFA model.
Ergon Energy is likely to have a cost advantage as it tends to expense fewer costs
than the comparison firms. This is because in Figure A.20 and Figure A.21 above they
appear to capitalise more of their costs than the comparison firms, which may indicate
it has a preference for capital solutions over operating expenditure relative to the
comparison firms. As a result, capitalisation practices contribute negative 0.5 per cent
to the adjustment for immaterial OEFs for Ergon Energy. Conversely, we have
provided a positive 0.5 per cent adjustment for Energex. This is because although
Figure A.20 shows that in the past it expensed less of its costs than the comparison
firms, Figure A.21 shows that in the future it will expense slightly more of its costs. As a
result we consider that Energex's capitalisation practices may provide it a slight cost
disadvantage on opex benchmarking.
Communication networks
We are not satisfied that an OEF for the availability of commercially available
communication networks would meet our materiality or duplication OEF adjustment
criteria. To the extent that service providers in low customer density areas may have to
use alternative solutions where there is no mobile telephone coverage, this will be
correlated with customer density. Also, three of the five comparison firms also face
similar challenges in providing network services.
In support of Essential Energy's revised proposal, Essential Energy's COO, Mr.
Humphreys, submitted that Essential Energy is unique in terms of the need to provide
a two way radio network across 95 per cent of NSW.457 Mr Humphreys also submitted
that there is no commercial service available that provides state wide coverage with
required reliability at an economic cost.
The need for two way communication in areas where there are limited commercial
alternatives will be correlated with customer density. This is because the fewer
customers there are in a service area, the less likely it is to be covered by a
commercial communications network. As Economic Insights' SFA model accounts for
457
Gary Humphreys, Statement of Gary Humphries Chief Operating Officer Essential Energy, 19 January 2015, pp.
12 to 13.
7-175 Attachment 7 – Operating expenditure | Energex preliminary determination 2015–20
customer density, as discussed above, we are not satisfied that it does not
appropriately account for the availability of commercial communications networks.
Also an adjustment for differences in communication networks is not likely to meet the
materiality OEF adjustment criterion. The necessity to provide an extensive two way
communication system between control room and field staff, where there are limited
commercial options, is not unique to Essential Energy. Other rural service providers,
including the comparison firms AusNet Services, Powercor, and SA Power Networks
face similar challenges providing a reliable communication system. There are areas in
all three of those service providers' network areas that do not have mobile telephone
coverage.458
Contaminated land management
We are not satisfied that an OEF adjustment for contaminated land management
would meet the exogeneity or materiality OEF criteria. To the extent that electricity
distribution assets have the potential to contaminate land, all service providers must
manage this risk. The cost consequences of not managing this risk prudently in the
past should not be visited on consumers.
In response to questions about its OEFs, Ergon Energy informed us that it considered
that it has inherited sites that have soil contamination.
"Ergon Energy was formed from six separate regional Electricity Boards in
1999. Those boards we similarly amalgamated by other more multitudinous
organisations. Environmental obligations were less stringent in times past.
Ergon Energy has “inherited” sites from these various legacy organisations,
typically old generation sites that contain contaminated soil.
In addition, past practices included use of creosote and other termiticides about
the bases of poles. This has resulted in impacts upon livestock and incurs
clean-up and management costs."459
Ergon Energy considers it is at a cost disadvantage as it must incur opex to remediate
these sites.
We are not satisfied that an OEF adjustment for contaminated land management
would meet the materiality OEF adjustment criterion. All NEM service providers have
obligations to prevent land contamination due to the operations of their networks.460
Where environmental regulations were not as stringent in the past due to a lack of
knowledge industry wide, this is a problem that would have affected all service
458
Telstra, Our Coverage, available at: www.telstra.com.au/mobile-phones/coverage-networks/our-coverage [last
accessed: 10 April 2015]. 459
Ergon Energy, Response to AER Information Request AER ERG002, 17 December 2014, p. 22. 460
For example part seven of the Environmental Protection Act 1970 sets out the responsibilities of the Victorian
service providers with regard to land contamination.
7-176 Attachment 7 – Operating expenditure | Energex preliminary determination 2015–20
providers. Therefore if this were the case, all service providers would face similar
problems with contaminated land.
In addition, we consider that an OEF adjustment for contaminated land management
would not satisfy the exogeneity OEF criterion. A prudent service provider would take
appropriate action to minimise the risk of land contamination associated with its
activities.
In some circumstances land contamination regulations are different across
jurisdictions. In this case a prudent service provider operating under the less stringent
regulations would have a duty of care to appropriately manage its environmental risk
being mindful of obligations in other jurisdictions. If a service provider did not undertake
sufficient risk mitigation, where best industry practice is to manage that risk, this is a
reflection of the quality of that service provider's management. The costs of such
mismanagement should not be visited on consumers.
In the case that a service provider acquired assets with land contamination from
another service provider, in a competitive market, the cost of that remediation will be
factored into the price of the acquisition. That is the firm responsible for the
contamination will have paid for the future remediation costs by receiving a lower
payment for the contaminated assets. As a result end users would not need to pay for
contaminated land remediation.
Outsourcing
We are not satisfied that an OEF adjustment for differences outsourcing practices
would meet the exogeneity OEF adjustment criterion. Service providers choose to what
extent they outsource.
In response to our 2014 draft decision for ActewAGL, Advisian raised opportunities for
outsourcing as an OEF that might lead to material differences in opex.461 Advisian
noted that the small size of the ACT and the small number of network service providers
in its area prevents ActewAGL from utilising contractors in a similar manner to the
comparison firms. Advisian considered that the smaller amount of available work
prevents contractors from achieving efficiencies that are available in denser areas
serviced by a greater number of service providers.
We consider that the scale of the Queensland service providers would allow them to
support a mature and efficient contracting market. Energex has more customers than
any of the comparison firms. Ergon Energy has a similar amount of customers to
Powercor and more than AusNet Services, CitiPower and United Energy. As a result
we consider that the Queensland service providers have the opportunity to outsource.
The extent to which they do or do not is a management decision.
461
Advisian, Opex Cost Drivers: ActewAGL Distribution Electricity (ACT), 16 January 2015, pp. 95–98.
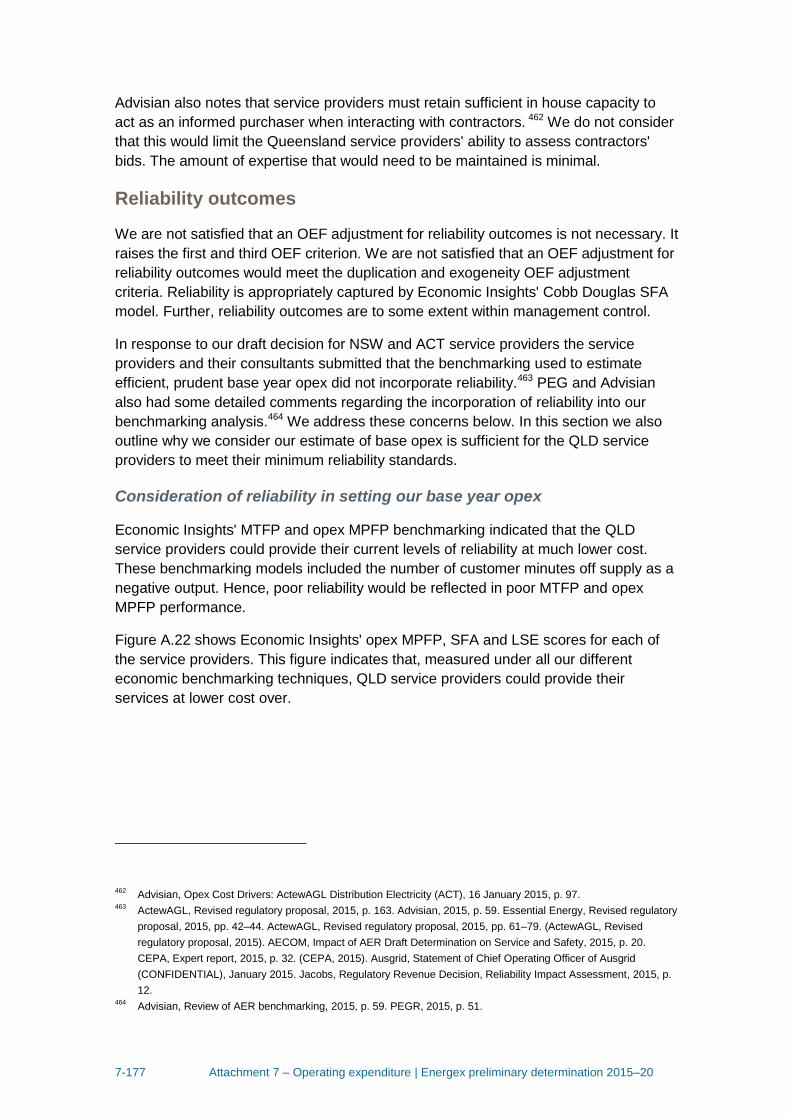
7-177 Attachment 7 – Operating expenditure | Energex preliminary determination 2015–20
Advisian also notes that service providers must retain sufficient in house capacity to
act as an informed purchaser when interacting with contractors. 462 We do not consider
that this would limit the Queensland service providers' ability to assess contractors'
bids. The amount of expertise that would need to be maintained is minimal.
Reliability outcomes
We are not satisfied that an OEF adjustment for reliability outcomes is not necessary. It
raises the first and third OEF criterion. We are not satisfied that an OEF adjustment for
reliability outcomes would meet the duplication and exogeneity OEF adjustment
criteria. Reliability is appropriately captured by Economic Insights' Cobb Douglas SFA
model. Further, reliability outcomes are to some extent within management control.
In response to our draft decision for NSW and ACT service providers the service
providers and their consultants submitted that the benchmarking used to estimate
efficient, prudent base year opex did not incorporate reliability.463 PEG and Advisian
also had some detailed comments regarding the incorporation of reliability into our
benchmarking analysis.464 We address these concerns below. In this section we also
outline why we consider our estimate of base opex is sufficient for the QLD service
providers to meet their minimum reliability standards.
Consideration of reliability in setting our base year opex
Economic Insights' MTFP and opex MPFP benchmarking indicated that the QLD
service providers could provide their current levels of reliability at much lower cost.
These benchmarking models included the number of customer minutes off supply as a
negative output. Hence, poor reliability would be reflected in poor MTFP and opex
MPFP performance.
Figure A.22 shows Economic Insights' opex MPFP, SFA and LSE scores for each of
the service providers. This figure indicates that, measured under all our different
economic benchmarking techniques, QLD service providers could provide their
services at lower cost over.
462
Advisian, Opex Cost Drivers: ActewAGL Distribution Electricity (ACT), 16 January 2015, p. 97. 463
ActewAGL, Revised regulatory proposal, 2015, p. 163. Advisian, 2015, p. 59. Essential Energy, Revised regulatory
proposal, 2015, pp. 42–44. ActewAGL, Revised regulatory proposal, 2015, pp. 61–79. (ActewAGL, Revised
regulatory proposal, 2015). AECOM, Impact of AER Draft Determination on Service and Safety, 2015, p. 20.
CEPA, Expert report, 2015, p. 32. (CEPA, 2015). Ausgrid, Statement of Chief Operating Officer of Ausgrid
(CONFIDENTIAL), January 2015. Jacobs, Regulatory Revenue Decision, Reliability Impact Assessment, 2015, p.
12. 464
Advisian, Review of AER benchmarking, 2015, p. 59. PEGR, 2015, p. 51.
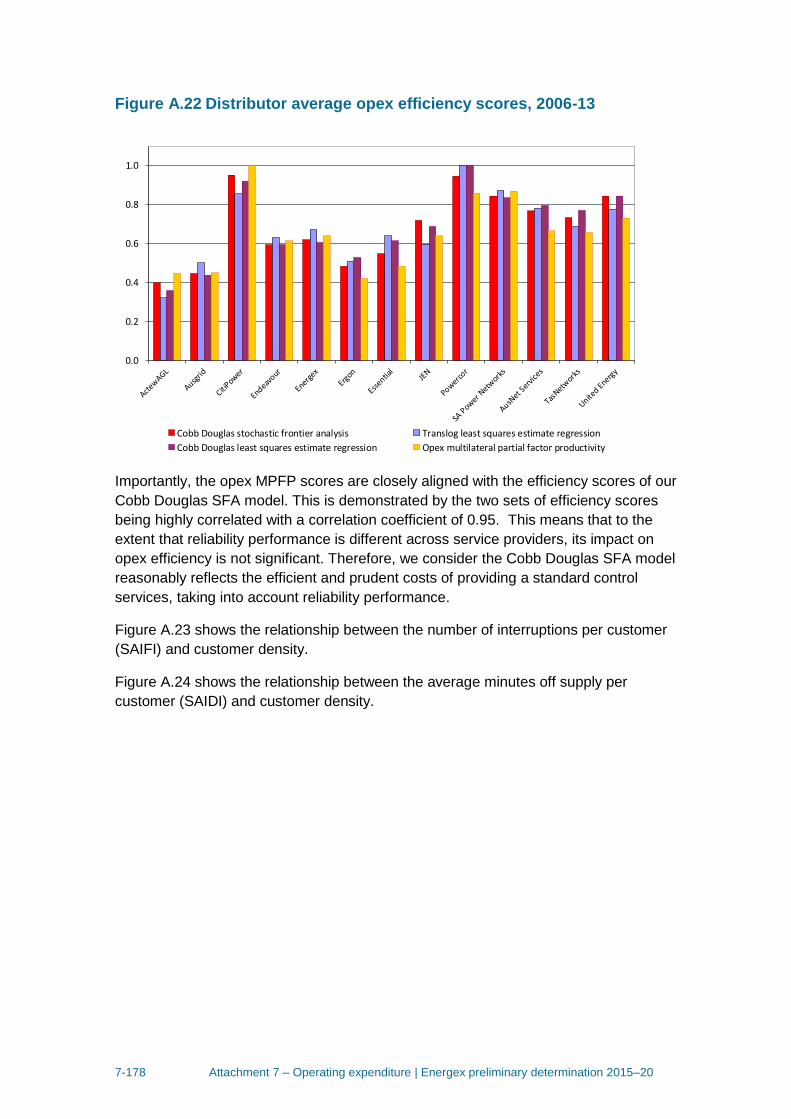
7-178 Attachment 7 – Operating expenditure | Energex preliminary determination 2015–20
Figure A.22 Distributor average opex efficiency scores, 2006-13
Importantly, the opex MPFP scores are closely aligned with the efficiency scores of our
Cobb Douglas SFA model. This is demonstrated by the two sets of efficiency scores
being highly correlated with a correlation coefficient of 0.95. This means that to the
extent that reliability performance is different across service providers, its impact on
opex efficiency is not significant. Therefore, we consider the Cobb Douglas SFA model
reasonably reflects the efficient and prudent costs of providing a standard control
services, taking into account reliability performance.
Figure A.23 shows the relationship between the number of interruptions per customer
(SAIFI) and customer density.
Figure A.24 shows the relationship between the average minutes off supply per
customer (SAIDI) and customer density.
0.0
0.2
0.4
0.6
0.8
1.0
Cobb Douglas stochastic frontier analysis Translog least squares estimate regression
Cobb Douglas least squares estimate regression Opex multilateral partial factor productivity
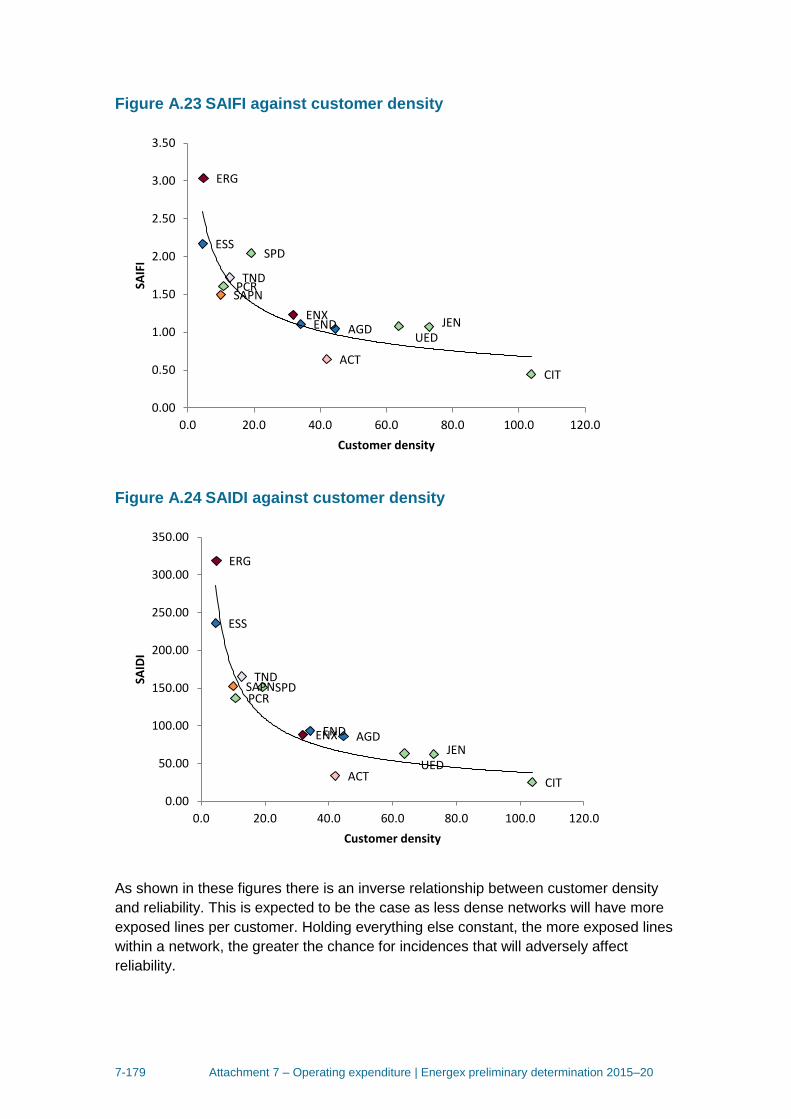
7-179 Attachment 7 – Operating expenditure | Energex preliminary determination 2015–20
Figure A.23 SAIFI against customer density
Figure A.24 SAIDI against customer density
As shown in these figures there is an inverse relationship between customer density
and reliability. This is expected to be the case as less dense networks will have more
exposed lines per customer. Holding everything else constant, the more exposed lines
within a network, the greater the chance for incidences that will adversely affect
reliability.
ACT
AGD
CIT
ENDENX
ERG
ESS
JEN
PCRSAPN
SPD
TND
UED
0.00
0.50
1.00
1.50
2.00
2.50
3.00
3.50
0.0 20.0 40.0 60.0 80.0 100.0 120.0
SAIF
I
Customer density
ACT
AGD
CIT
ENDENX
ERG
ESS
JEN
PCRSAPNSPD
TND
UED
0.00
50.00
100.00
150.00
200.00
250.00
300.00
350.00
0.0 20.0 40.0 60.0 80.0 100.0 120.0
SAID
I
Customer density
7-180 Attachment 7 – Operating expenditure | Energex preliminary determination 2015–20
Most networks have a level of reliability that is close to their expected level given their
customer density, as reflected by the reliability scores being close to the trend line.
This indicates that the reliability performance of the benchmark service providers is not
materially different from that of the QLD service providers.
Detailed criticisms
In response to our draft determination for the ACT and NSW service providers the
consultants of the NSW and ACT service providers, Advisian and PEG raised some
detailed concerns regarding the incorporation of reliability into our benchmarking
analysis. We address these concerns below.
Advisian
On the issue of reliability, Advisian submitted:
1) "The “ceteris paribus” assumption of constant reliability implicit in the
benchmark model does not hold, and some adjustment is necessary to reflect
changes in reliability, an issue not dealt with at all in the preferred SFA model.
2) Economic Insights' reliance on analysis period averages for its
benchmarking models means that the effect of declining reliability performance
on opex over the analysis period is not captured in its models (which by
implication assumes that opex is driven by absolute SAIDI). In practice the
relationship between opex and reliability is driven by a combination of the
absolute level that has historically been achieved, the specific network
environment and the change in SAIDI over the analysis period.
3) The trade-off between SAIFI and CAIDI to achieve a SAIDI target highlights
that reliability can be achieved by a combination of Opex and Capex programs.
No attempt has been made in the AER’s benchmarking to “normalise” the
approaches taken by distributors in this regard. This gives rise to the potential
for what otherwise may be a sensible and efficient Opex / Capex trade off being
judged as an Opex efficiency / inefficiency."465
We address these points below.
Advisian submitted that the frontier networks have exhibited decreasing reliability
performance. As such it considered that the assumption of constant reliability in the
AER's modelling does not hold and that the AER's benchmarking should be adjusted to
reflect this.
We do not consider that the frontier networks have exhibited decreasing reliability
performance. On both SAIDI and SAIFI measures the performance of the frontier
networks has improved. Figure A.25 shows the weighted average SAIDI of the frontier
465
Advisian, Review of AER benchmarking, 2015, p. 59.
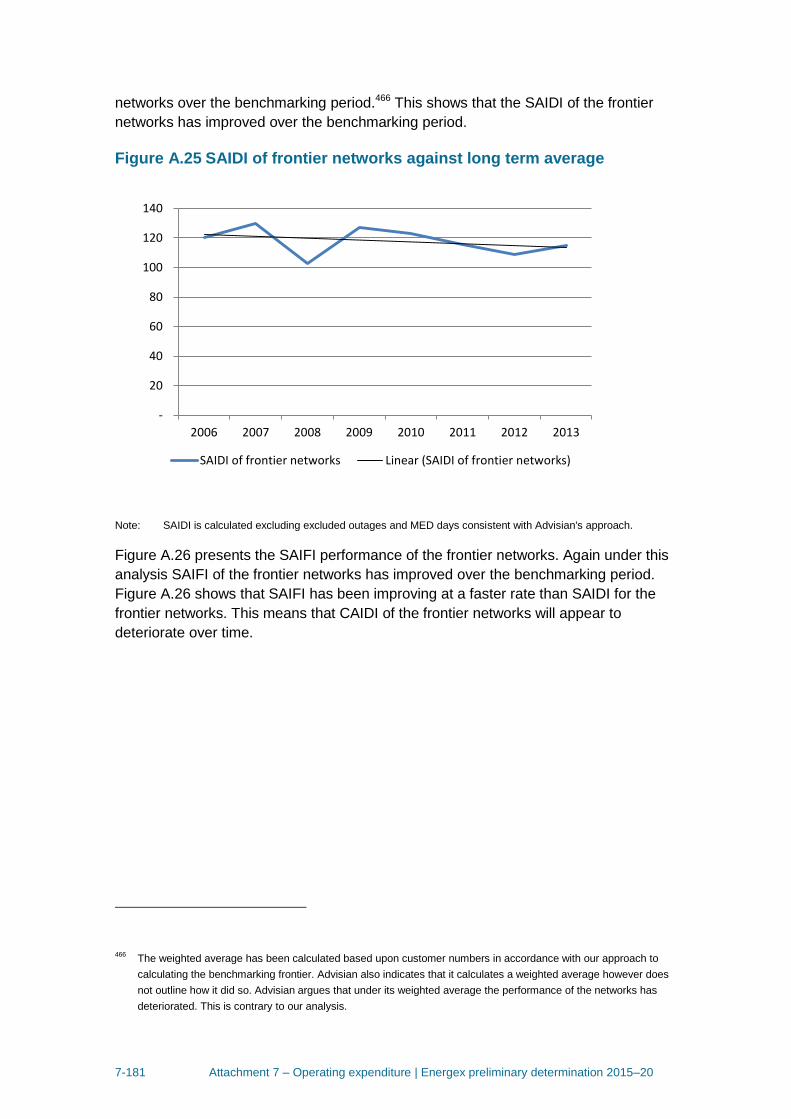
7-181 Attachment 7 – Operating expenditure | Energex preliminary determination 2015–20
networks over the benchmarking period.466 This shows that the SAIDI of the frontier
networks has improved over the benchmarking period.
Figure A.25 SAIDI of frontier networks against long term average
Note: SAIDI is calculated excluding excluded outages and MED days consistent with Advisian's approach.
Figure A.26 presents the SAIFI performance of the frontier networks. Again under this
analysis SAIFI of the frontier networks has improved over the benchmarking period.
Figure A.26 shows that SAIFI has been improving at a faster rate than SAIDI for the
frontier networks. This means that CAIDI of the frontier networks will appear to
deteriorate over time.
466
The weighted average has been calculated based upon customer numbers in accordance with our approach to
calculating the benchmarking frontier. Advisian also indicates that it calculates a weighted average however does
not outline how it did so. Advisian argues that under its weighted average the performance of the networks has
deteriorated. This is contrary to our analysis.
-
20
40
60
80
100
120
140
2006 2007 2008 2009 2010 2011 2012 2013
SAIDI of frontier networks Linear (SAIDI of frontier networks)
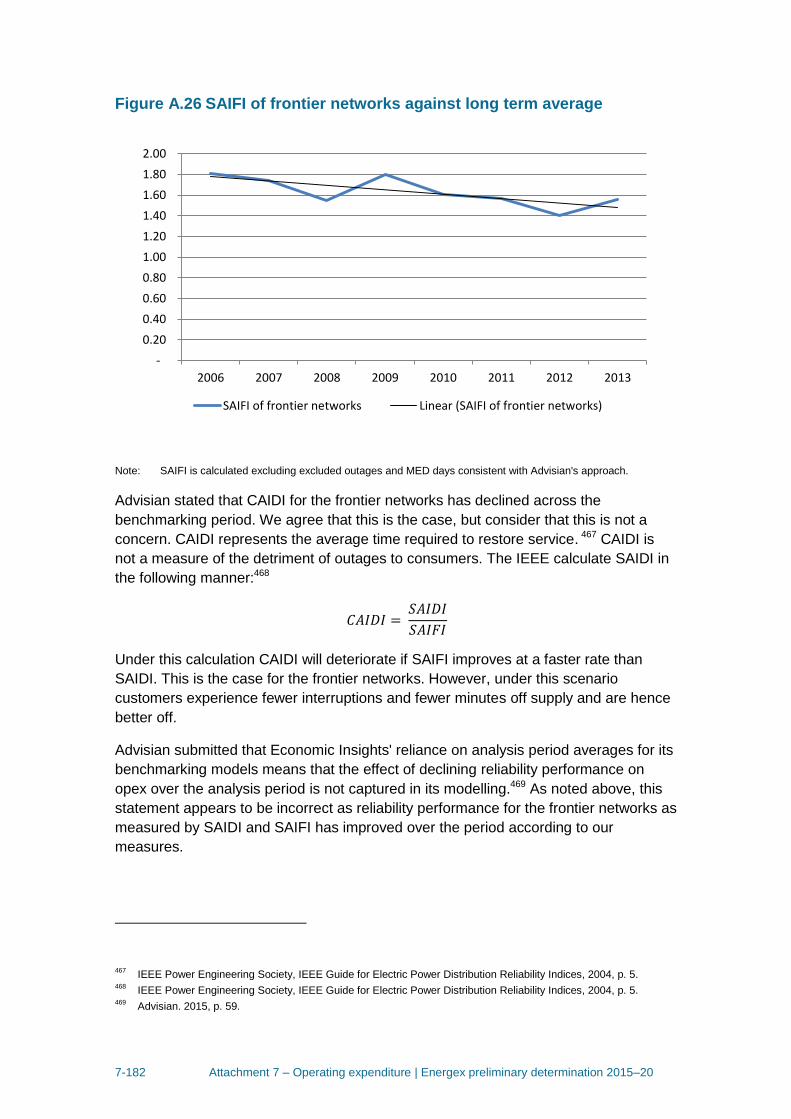
7-182 Attachment 7 – Operating expenditure | Energex preliminary determination 2015–20
Figure A.26 SAIFI of frontier networks against long term average
Note: SAIFI is calculated excluding excluded outages and MED days consistent with Advisian's approach.
Advisian stated that CAIDI for the frontier networks has declined across the
benchmarking period. We agree that this is the case, but consider that this is not a
concern. CAIDI represents the average time required to restore service. 467 CAIDI is
not a measure of the detriment of outages to consumers. The IEEE calculate SAIDI in
the following manner:468
Under this calculation CAIDI will deteriorate if SAIFI improves at a faster rate than
SAIDI. This is the case for the frontier networks. However, under this scenario
customers experience fewer interruptions and fewer minutes off supply and are hence
better off.
Advisian submitted that Economic Insights' reliance on analysis period averages for its
benchmarking models means that the effect of declining reliability performance on
opex over the analysis period is not captured in its modelling.469 As noted above, this
statement appears to be incorrect as reliability performance for the frontier networks as
measured by SAIDI and SAIFI has improved over the period according to our
measures.
467
IEEE Power Engineering Society, IEEE Guide for Electric Power Distribution Reliability Indices, 2004, p. 5. 468
IEEE Power Engineering Society, IEEE Guide for Electric Power Distribution Reliability Indices, 2004, p. 5. 469
Advisian. 2015, p. 59.
-
0.20
0.40
0.60
0.80
1.00
1.20
1.40
1.60
1.80
2.00
2006 2007 2008 2009 2010 2011 2012 2013
SAIFI of frontier networks Linear (SAIFI of frontier networks)
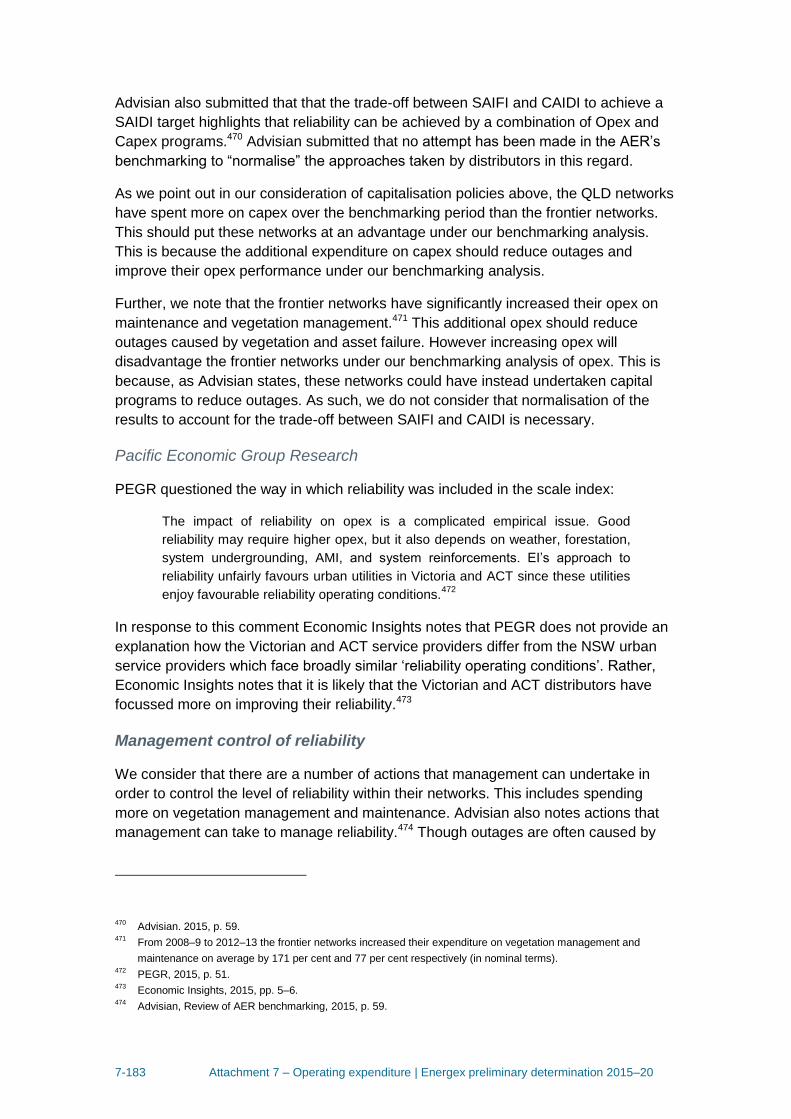
7-183 Attachment 7 – Operating expenditure | Energex preliminary determination 2015–20
Advisian also submitted that that the trade-off between SAIFI and CAIDI to achieve a
SAIDI target highlights that reliability can be achieved by a combination of Opex and
Capex programs.470 Advisian submitted that no attempt has been made in the AER’s
benchmarking to “normalise” the approaches taken by distributors in this regard.
As we point out in our consideration of capitalisation policies above, the QLD networks
have spent more on capex over the benchmarking period than the frontier networks.
This should put these networks at an advantage under our benchmarking analysis.
This is because the additional expenditure on capex should reduce outages and
improve their opex performance under our benchmarking analysis.
Further, we note that the frontier networks have significantly increased their opex on
maintenance and vegetation management.471 This additional opex should reduce
outages caused by vegetation and asset failure. However increasing opex will
disadvantage the frontier networks under our benchmarking analysis of opex. This is
because, as Advisian states, these networks could have instead undertaken capital
programs to reduce outages. As such, we do not consider that normalisation of the
results to account for the trade-off between SAIFI and CAIDI is necessary.
Pacific Economic Group Research
PEGR questioned the way in which reliability was included in the scale index:
The impact of reliability on opex is a complicated empirical issue. Good
reliability may require higher opex, but it also depends on weather, forestation,
system undergrounding, AMI, and system reinforcements. EI’s approach to
reliability unfairly favours urban utilities in Victoria and ACT since these utilities
enjoy favourable reliability operating conditions.472
In response to this comment Economic Insights notes that PEGR does not provide an
explanation how the Victorian and ACT service providers differ from the NSW urban
service providers which face broadly similar ‘reliability operating conditions’. Rather,
Economic Insights notes that it is likely that the Victorian and ACT distributors have
focussed more on improving their reliability.473
Management control of reliability
We consider that there are a number of actions that management can undertake in
order to control the level of reliability within their networks. This includes spending
more on vegetation management and maintenance. Advisian also notes actions that
management can take to manage reliability.474 Though outages are often caused by
470
Advisian. 2015, p. 59. 471
From 2008–9 to 2012–13 the frontier networks increased their expenditure on vegetation management and
maintenance on average by 171 per cent and 77 per cent respectively (in nominal terms). 472
PEGR, 2015, p. 51. 473
Economic Insights, 2015, pp. 5–6. 474
Advisian, Review of AER benchmarking, 2015, p. 59.
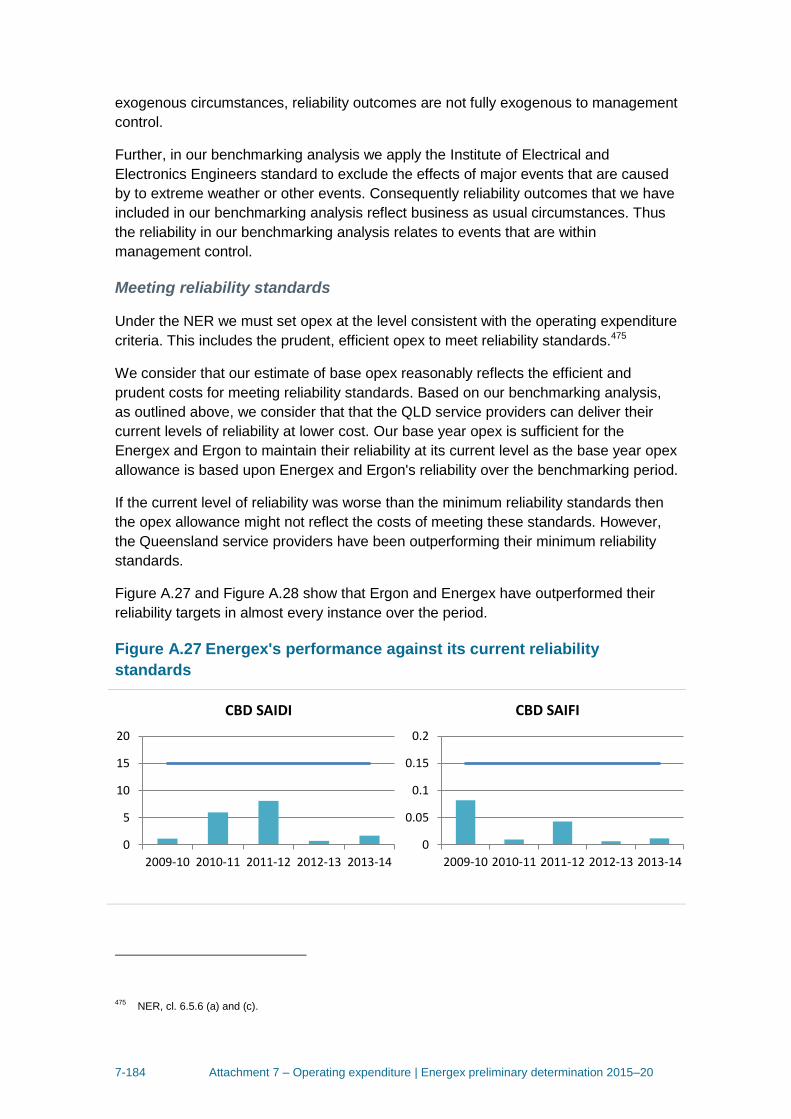
7-184 Attachment 7 – Operating expenditure | Energex preliminary determination 2015–20
exogenous circumstances, reliability outcomes are not fully exogenous to management
control.
Further, in our benchmarking analysis we apply the Institute of Electrical and
Electronics Engineers standard to exclude the effects of major events that are caused
by to extreme weather or other events. Consequently reliability outcomes that we have
included in our benchmarking analysis reflect business as usual circumstances. Thus
the reliability in our benchmarking analysis relates to events that are within
management control.
Meeting reliability standards
Under the NER we must set opex at the level consistent with the operating expenditure
criteria. This includes the prudent, efficient opex to meet reliability standards.475
We consider that our estimate of base opex reasonably reflects the efficient and
prudent costs for meeting reliability standards. Based on our benchmarking analysis,
as outlined above, we consider that that the QLD service providers can deliver their
current levels of reliability at lower cost. Our base year opex is sufficient for the
Energex and Ergon to maintain their reliability at its current level as the base year opex
allowance is based upon Energex and Ergon's reliability over the benchmarking period.
If the current level of reliability was worse than the minimum reliability standards then
the opex allowance might not reflect the costs of meeting these standards. However,
the Queensland service providers have been outperforming their minimum reliability
standards.
Figure A.27 and Figure A.28 show that Ergon and Energex have outperformed their
reliability targets in almost every instance over the period.
Figure A.27 Energex's performance against its current reliability
standards
475
NER, cl. 6.5.6 (a) and (c).
0
5
10
15
20
2009-10 2010-11 2011-12 2012-13 2013-14
CBD SAIDI
0
0.05
0.1
0.15
0.2
2009-10 2010-11 2011-12 2012-13 2013-14
CBD SAIFI
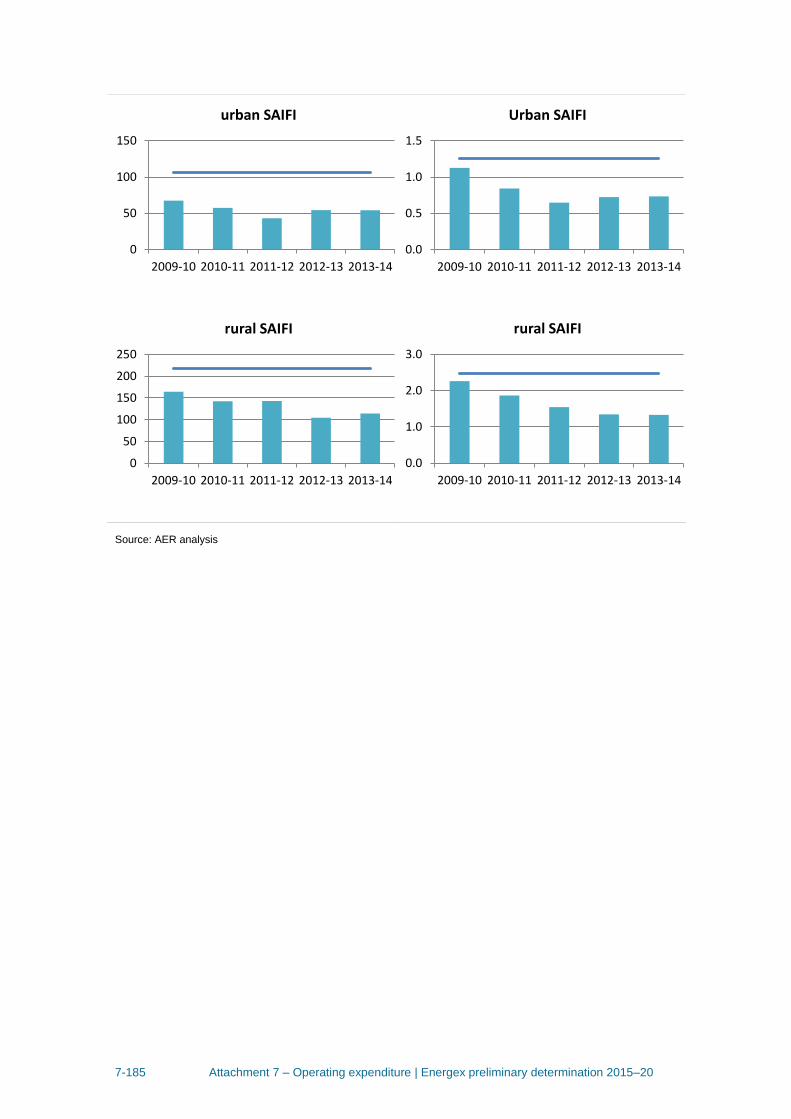
7-185 Attachment 7 – Operating expenditure | Energex preliminary determination 2015–20
Source: AER analysis
0
50
100
150
2009-10 2010-11 2011-12 2012-13 2013-14
urban SAIFI
0.0
0.5
1.0
1.5
2009-10 2010-11 2011-12 2012-13 2013-14
Urban SAIFI
0
50
100
150
200
250
2009-10 2010-11 2011-12 2012-13 2013-14
rural SAIFI
0.0
1.0
2.0
3.0
2009-10 2010-11 2011-12 2012-13 2013-14
rural SAIFI
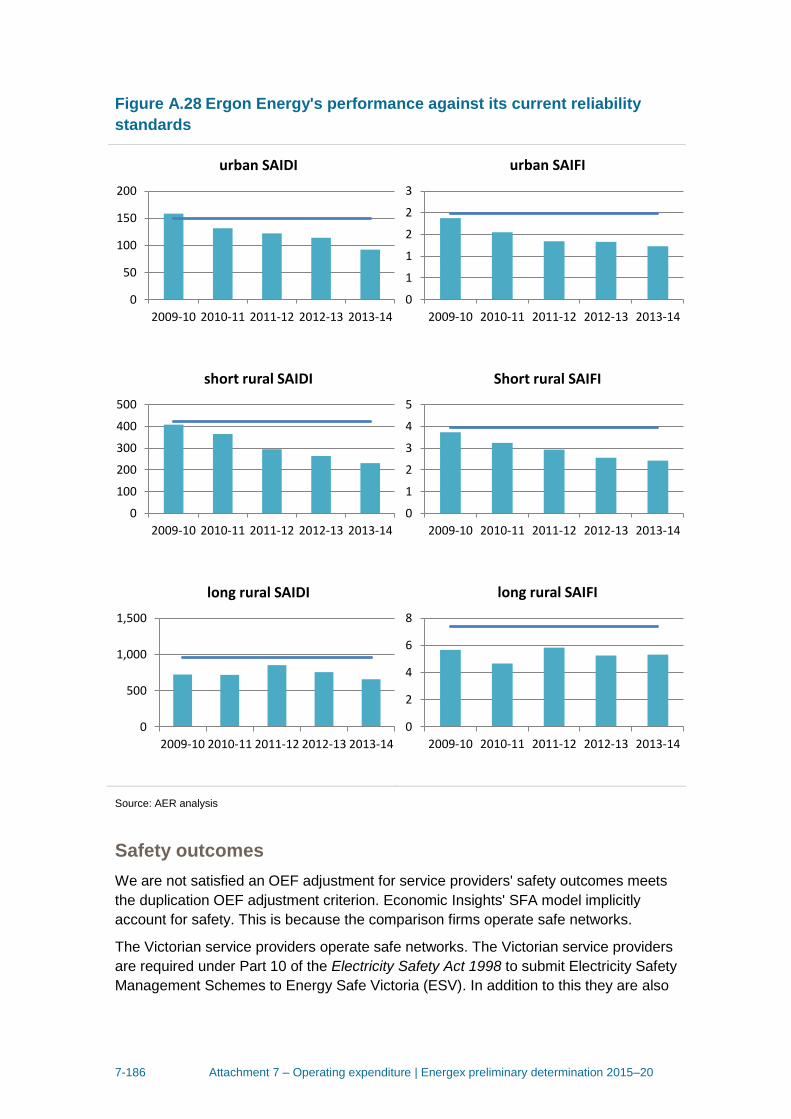
7-186 Attachment 7 – Operating expenditure | Energex preliminary determination 2015–20
Figure A.28 Ergon Energy's performance against its current reliability
standards
Source: AER analysis
Safety outcomes
We are not satisfied an OEF adjustment for service providers' safety outcomes meets
the duplication OEF adjustment criterion. Economic Insights' SFA model implicitly
account for safety. This is because the comparison firms operate safe networks.
The Victorian service providers operate safe networks. The Victorian service providers
are required under Part 10 of the Electricity Safety Act 1998 to submit Electricity Safety
Management Schemes to Energy Safe Victoria (ESV). In addition to this they are also
0
50
100
150
200
2009-10 2010-11 2011-12 2012-13 2013-14
urban SAIDI
0
1
1
2
2
3
2009-10 2010-11 2011-12 2012-13 2013-14
urban SAIFI
0
100
200
300
400
500
2009-10 2010-11 2011-12 2012-13 2013-14
short rural SAIDI
0
1
2
3
4
5
2009-10 2010-11 2011-12 2012-13 2013-14
Short rural SAIFI
0
500
1,000
1,500
2009-10 2010-11 2011-12 2012-13 2013-14
long rural SAIDI
0
2
4
6
8
2009-10 2010-11 2011-12 2012-13 2013-14
long rural SAIFI
7-187 Attachment 7 – Operating expenditure | Energex preliminary determination 2015–20
required to submit Bushfire Mitigation Plans and Electric Line Clearance Management
Plans.476
ESV noted that in 2012 overall management of the Victorian Networks was good.477
ESV noted that in 2011 the performance of the Victorian Networks, with regard to asset
failure, was consistent with the performance of networks elsewhere in Australia and
that in other areas they performed adequately.478 ESV found in 2010 that overall there
was a good standard of inspection and timely repair by the industry although some
service providers performed better than others.479 More recently, in 2014, ESV noted:
The Victorian service providers have comprehensive Electricity Safety
Management Systems, many supplemented by other management systems and
certification such as PAS 55, ISO 9001, ISO 14001, AS4801 and OHSAS 18001480
Asset maintenance in Victoria, in accordance with bushfire mitigation plans, was
adequate for the 2013-2014 bushfire season, with no areas of non-compliance
observed 481
In general, the Victorian service providers' Electric Line Clearance Management
Plans were clear, well presented and that there was a strong connection between
safety plans and activities in the field482
Despite the extensive effort put into condition assessment and asset replacement,
failure rates in Victoria had increased. While some service providers, notably
United Energy, were behind schedule in their asset replacement programs all
would be able to complete their five year programs by 2015483
The number of fire starts in Victoria was above the F factor set by the AER, partly
due the increasing age of assets and partly due to adverse weather conditions.484
All of the Victorian service providers were on schedule to meet the electric line
clearance requirements as agreed upon with ESV. Although CitiPower and
Powercor were granted 12 months extensions from the original timeframes.485
The Victorian service providers go to considerable lengths to prevent unauthorised
access and ensure that assets are secure486
The underlying trend for serious injuries from electrical causes to the public and
Victorian service providers workers was similar to previous years487
476
ESV, Safety performance report on Victorian Electricity Networks 2013, June 2014, p. 5. 477
ESV, Safety performance report on Victorian Electricity Networks 2012, June 2013, p.7. 478
ESV, Safety performance report on Victorian Electricity Networks 2011,August 2012, p. i. 479
ESV, Safety performance report on Victorian Electricity Networks 2010, 2011, p. i. 480
ESV, Safety performance report on Victorian Electricity Networks 2013, June 2014, p. 24. 481
ESV, Safety performance report on Victorian Electricity Networks 2013, June 2014, p. 26. 482
ESV, Safety performance report on Victorian Electricity Networks 2013, June 2014, pp. 29–30. 483
ESV, Safety performance report on Victorian Electricity Networks 2013, June 2014, pp. 31–50 and 61–78. 484
ESV, Safety performance report on Victorian Electricity Networks 2013, June 2014, pp. 61–78. 485
ESV, Safety performance report on Victorian Electricity Networks 2013, June 2014, pp. 50–60. 486
ESV, Safety performance report on Victorian Electricity Networks 2013, June 2014, p. 78. 487
ESV, Safety performance report on Victorian Electricity Networks 2013, June 2014, p. 82.
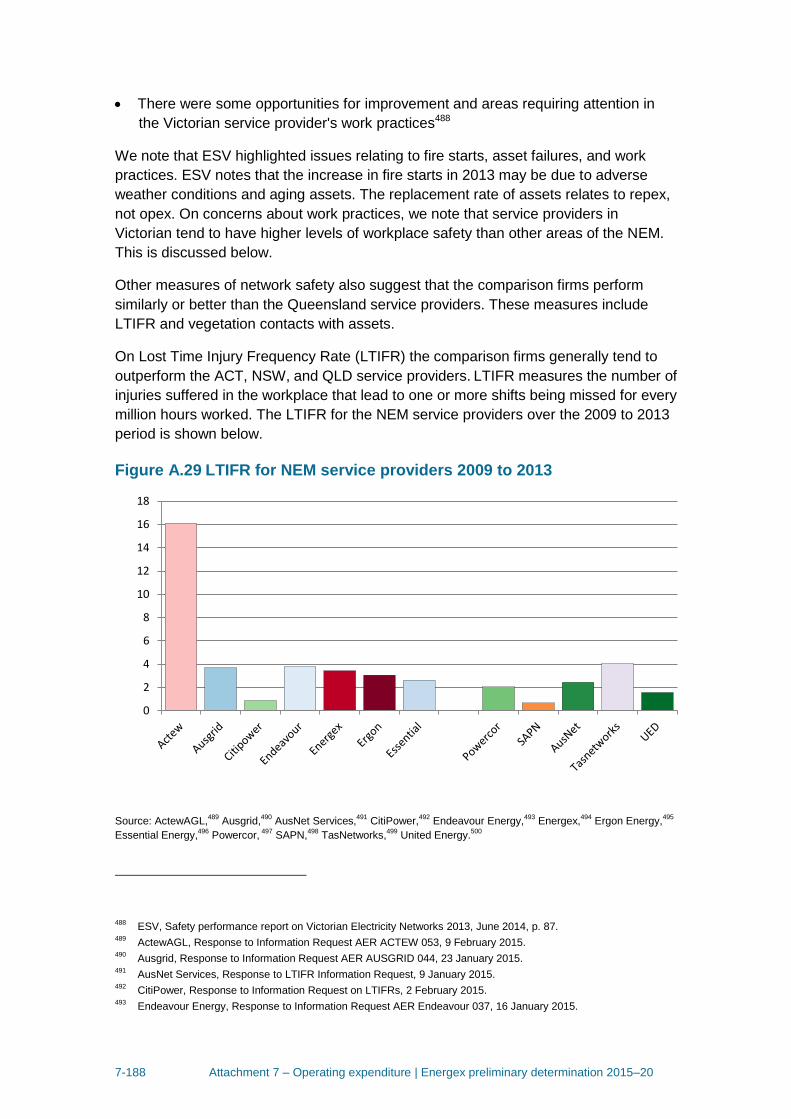
7-188 Attachment 7 – Operating expenditure | Energex preliminary determination 2015–20
There were some opportunities for improvement and areas requiring attention in
the Victorian service provider's work practices488
We note that ESV highlighted issues relating to fire starts, asset failures, and work
practices. ESV notes that the increase in fire starts in 2013 may be due to adverse
weather conditions and aging assets. The replacement rate of assets relates to repex,
not opex. On concerns about work practices, we note that service providers in
Victorian tend to have higher levels of workplace safety than other areas of the NEM.
This is discussed below.
Other measures of network safety also suggest that the comparison firms perform
similarly or better than the Queensland service providers. These measures include
LTIFR and vegetation contacts with assets.
On Lost Time Injury Frequency Rate (LTIFR) the comparison firms generally tend to
outperform the ACT, NSW, and QLD service providers. LTIFR measures the number of
injuries suffered in the workplace that lead to one or more shifts being missed for every
million hours worked. The LTIFR for the NEM service providers over the 2009 to 2013
period is shown below.
Figure A.29 LTIFR for NEM service providers 2009 to 2013
Source: ActewAGL,489
Ausgrid,490
AusNet Services,491
CitiPower,492
Endeavour Energy,493
Energex,494
Ergon Energy,495
Essential Energy,496
Powercor, 497
SAPN,498
TasNetworks,499
United Energy.500
488
ESV, Safety performance report on Victorian Electricity Networks 2013, June 2014, p. 87. 489
ActewAGL, Response to Information Request AER ACTEW 053, 9 February 2015. 490
Ausgrid, Response to Information Request AER AUSGRID 044, 23 January 2015. 491
AusNet Services, Response to LTIFR Information Request, 9 January 2015. 492
CitiPower, Response to Information Request on LTIFRs, 2 February 2015. 493
Endeavour Energy, Response to Information Request AER Endeavour 037, 16 January 2015.
0
2
4
6
8
10
12
14
16
18
7-189 Attachment 7 – Operating expenditure | Energex preliminary determination 2015–20
Note501
On vegetation contacts causing fires per 1000km of overhead route line length, the
comparison firms tended to have similar performance to the NSW and Queensland
Distributors, with ActewAGL having a higher number of defects. 502 503 504
Based on the above evidence, we consider that the comparison firms operate safe
networks at lower levels of opex such that no OEF adjustment is necessary to account
for safety.
Risk appetite
We are not satisfied that an OEF adjustment for differences in the risk appetites of
service providers' network owning corporations would meet the exogeneity OEF
adjustment criterion. Service providers choose their risk appetite.
Part of the role of a corporation's management is to select the level of risk that they are
willing to bear.505 The quality of a firm's management is an endogenous factor that
does not require an adjustment.506
Unregulated Services
We are not satisfied that an OEF adjustment for differences in the unregulated services
that service providers engage in would meet the exogeneity OEF adjustment criterion.
The extent to which a service provider engages in unregulated activities is under
management's control.
In response to our 2014 draft decision for ActewAGL, Advisian submitted that
ActewAGL will have a cost disadvantage relative to the comparison firms because of
differences in the provision of unregulated activities.507 Advisian submitted that the
494
Energex, Response to Information Request AER Energex, 23 January 2015. 495
Ergon Energy, Response to Information Request AER Ergon008, 7 January 2015. 496
Essential Energy, Response to Information Request AER Essential 033, 23 January 2015. 497
CitiPower, Response to Information Request on LTIFRs, 2 February 2015. 498
SA Power Networks, Response to Information Request AER SAPN 012, 20 January 2015. 499
TasNetworks, Response to LTIFR information request, 21 January 2015. 500
United Energy, Response to LTIFR Information Request, 27 January 2015. 501
ActewAGL changed its reporting systems in 2011 therefore its datum only covers the period July 2011 to
December 2013. TasNetwork's datum does not include contractors prior to 2012. Endeavour, Essential and SAPN
data do not included contractors. AusNet's Datum relates to its gas, distribution and transmission business
segments. Jemena is not displayed because it claimed confidentiality over its datum. 502
Category Analysis RIN Responses to template 2.7 and Economic Benchmarking RIN Responses to templates 6
and 8. 503
Ausgrid, Response to Information Request Ausgrid 052, 17 February 2015. 504
Endeavour, Response to Information Request Endeavour 044, 16 February 2015. 505
Nocco, B. W. and Schultz, R. M. 2006, 'Enterprise Risk Management: Theory and Practice', Journal of Applied
Corporate Finance, vol. 18, no. 4, p. 11. 506
AEMC, Rule determination: National Electricity Amendment (Economic Regulation of Network Service Providers),
November 2012, p. 113. 507
Advisian, Opex Cost Drivers: ActewAGL Distribution Electricity (ACT), 16 January 2015, p. 98.

7-190 Attachment 7 – Operating expenditure | Energex preliminary determination 2015–20
volume or appetite for pursing unregulated revenue is fundamentally an internal matter
for service providers', and therefore an OEF adjustment for the scale of unregulated
activities is inappropriate. 508 However, Advisian submitted that ActewAGL is prevented
from providing unregulated services because of its geographically isolated position.
We are not satisfied that the Queensland service providers do not have opportunities
to provide unregulated services. This is because they have large markets available to
them. Energex has more customers than any of the comparison firms. Ergon Energy
has a similar amount of customers to Powercor and more than AusNet Services,
CitiPower and United Energy. Additionally the Queensland service providers do
provide unregulated services. For example, Ergon owns Nexium. Nexium is a
communications company fully owned by Ergon Energy that provides broadband
across regional and remote Queensland.509
Work and operating procedures
We are not satisfied that an adjustment for work and operating procedures would meet
the exogeneity OEF adjustment criterion. Work and operating procedures are under
the direct control of service providers' management.
It is the role of service providers' management to seek and implement ways to improve
the effectiveness and efficiency of the service provider's work and operating
procedures. Because the effectiveness and efficiency of a service providers' work and
operating procedures are a result of the quality of a service providers management,
they are endogenous to the business and we do not consider it appropriate to account
for them when benchmarking.510
Work conditions
We are not satisfied that an OEF adjustment for differences in work conditions would
meet the exogeneity OEF adjustment criterion. Service providers' managements are
able to negotiate the agreements that they make with their workers.
The service providers in the NEM all have enterprise agreements.511 A service
provider's management has discretion in reaching an agreement that it strikes with its
workforce. The deal that it makes represents a trade-off. The agreement might provide
for lower wage rates in return for higher non-salary conditions. Alternatively, it might
provide higher wage rates in exchange for productivity improvements. This is a
508
Advisian, Opex Cost Drivers: ActewAGL Distribution Electricity (ACT), 16 January 2015, p. 86. 509
Nexium, Products & Services, available at: https://www.nexium.net.au/products-and-services [last accessed 26
March 2015]. 510
AEMC, Rule determination: National Electricity Amendment (Economic Regulation of Network Service Providers),
November 2012, p. 113. 511
Fair Work commission, Find an agreement, available at: https://www.fwc.gov.au/awards-and-agreements/agreements/find-agreement. [last accessed 20 August 2014].
7-191 Attachment 7 – Operating expenditure | Energex preliminary determination 2015–20
simplification of reality but it illustrates the trade-off. Depending on the service
provider's goals, it may be efficient to negotiate various entitlements with employees.
The two service providers with the highest efficiency scores on our Cobb Douglas SFA
opex cost function, Powercor and CitiPower, have on average the highest and second
highest labour cost per average staffing level in the NEM.512 Both of these service
providers are Victorian, but economy wide Victorian wage rates are on average lower
than those in the ACT, NSW, and Queensland.513 Although their average wage is
higher than the other service providers their opex, which is mostly comprised of labour
costs, per customer is lower than firms in the ACT, NSW, and Queensland.
We therefore do not consider it appropriate to make an adjustment for work conditions.
A.6.5 Geographic factors
Bushfire risk
We are satisfied that bushfire risk provides a cost advantage to the Queensland
service providers. An OEF adjustment for differences in bushfire risk between the
Queensland service providers and the comparison firms satisfies the exogeneity and
duplication OEF adjustment criteria. While service providers can take action to manage
their bushfire risk, the natural environment and regulations with which they must
comply are beyond their control. Also, bushfire risk is not explicitly accounted for in
Economic Insights' SFA model. However, while differences in bushfire risk seem to
lead to material differences in opex between Ergon Energy and the comparison firms,
vegetation density in Energex's service area may offset this advantage.
Based on the evidence available to us, it seems that the Queensland service providers
do not face the same level of bushfire risk as the comparison firms. The information
available suggests bushfire risk is higher in parts of Victoria and South Australia, where
the comparison firms operate, than in Queensland. Information on the impact of
bushfires and the regulations relating to bushfires that apply in Victoria and
Queensland also suggest that bushfire risk is higher in Victoria. The value of step
changes and pass through applications after the Black Saturday bushfires provide an
indication of the cost disadvantage that the Victorian service providers may face due to
relatively higher bushfire risk.
Although some of our comparison firms are not likely to face high bushfire risks, such
as CitiPower, we have weighted the Queensland service provider's efficiency target
according to the number of customers that the comparison firms have. This means that
the efficiency target is weighted towards predominantly rural service providers with
higher bushfire risk.
512
Category Analysis RIN responses. Template 2.11: Labour. 513
ABS, 6302.0 - Average Weekly Earnings, Australia, May 2014.
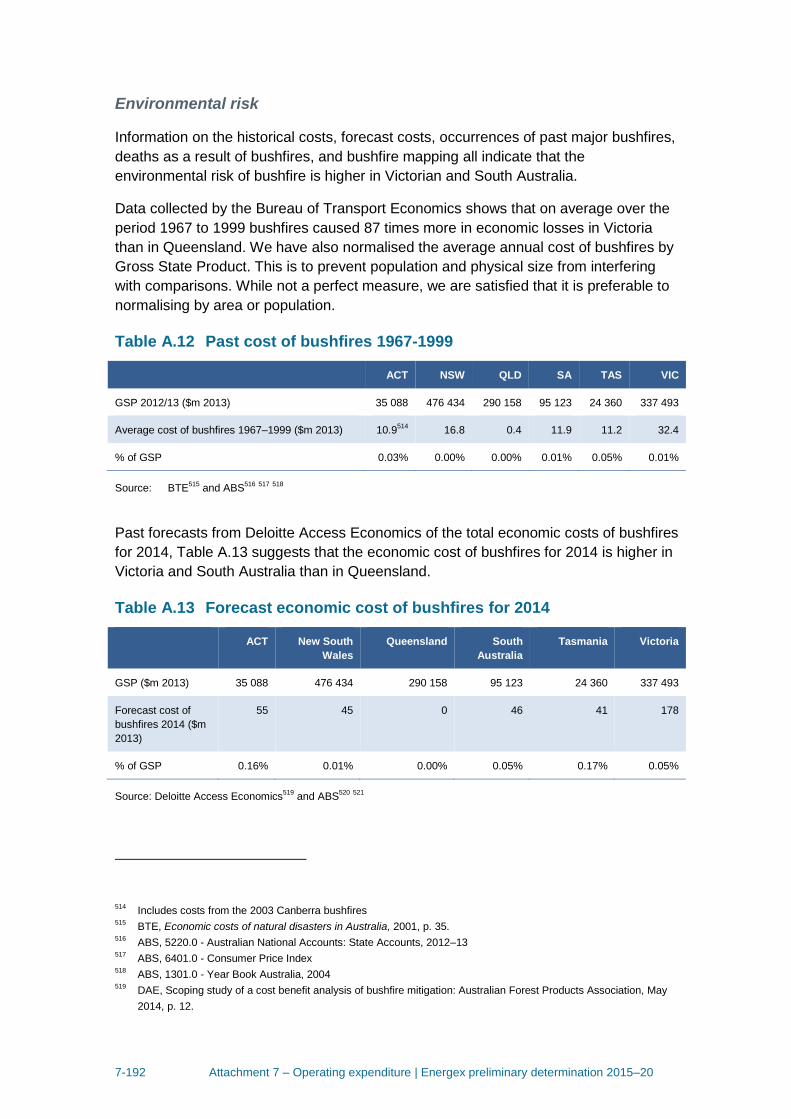
7-192 Attachment 7 – Operating expenditure | Energex preliminary determination 2015–20
Environmental risk
Information on the historical costs, forecast costs, occurrences of past major bushfires,
deaths as a result of bushfires, and bushfire mapping all indicate that the
environmental risk of bushfire is higher in Victorian and South Australia.
Data collected by the Bureau of Transport Economics shows that on average over the
period 1967 to 1999 bushfires caused 87 times more in economic losses in Victoria
than in Queensland. We have also normalised the average annual cost of bushfires by
Gross State Product. This is to prevent population and physical size from interfering
with comparisons. While not a perfect measure, we are satisfied that it is preferable to
normalising by area or population.
Table A.12 Past cost of bushfires 1967-1999
ACT NSW QLD SA TAS VIC
GSP 2012/13 ($m 2013) 35 088 476 434 290 158 95 123 24 360 337 493
Average cost of bushfires 1967–1999 ($m 2013) 10.9514
16.8 0.4 11.9 11.2 32.4
% of GSP 0.03% 0.00% 0.00% 0.01% 0.05% 0.01%
Source: BTE515
and ABS516
517
518
Past forecasts from Deloitte Access Economics of the total economic costs of bushfires
for 2014, Table A.13 suggests that the economic cost of bushfires for 2014 is higher in
Victoria and South Australia than in Queensland.
Table A.13 Forecast economic cost of bushfires for 2014
ACT New South
Wales
Queensland South
Australia
Tasmania Victoria
GSP ($m 2013) 35 088 476 434 290 158 95 123 24 360 337 493
Forecast cost of
bushfires 2014 ($m
2013)
55 45 0 46 41 178
% of GSP 0.16% 0.01% 0.00% 0.05% 0.17% 0.05%
Source: Deloitte Access Economics519
and ABS520
521
514
Includes costs from the 2003 Canberra bushfires 515
BTE, Economic costs of natural disasters in Australia, 2001, p. 35. 516
ABS, 5220.0 - Australian National Accounts: State Accounts, 2012–13 517
ABS, 6401.0 - Consumer Price Index 518
ABS, 1301.0 - Year Book Australia, 2004 519
DAE, Scoping study of a cost benefit analysis of bushfire mitigation: Australian Forest Products Association, May
2014, p. 12.
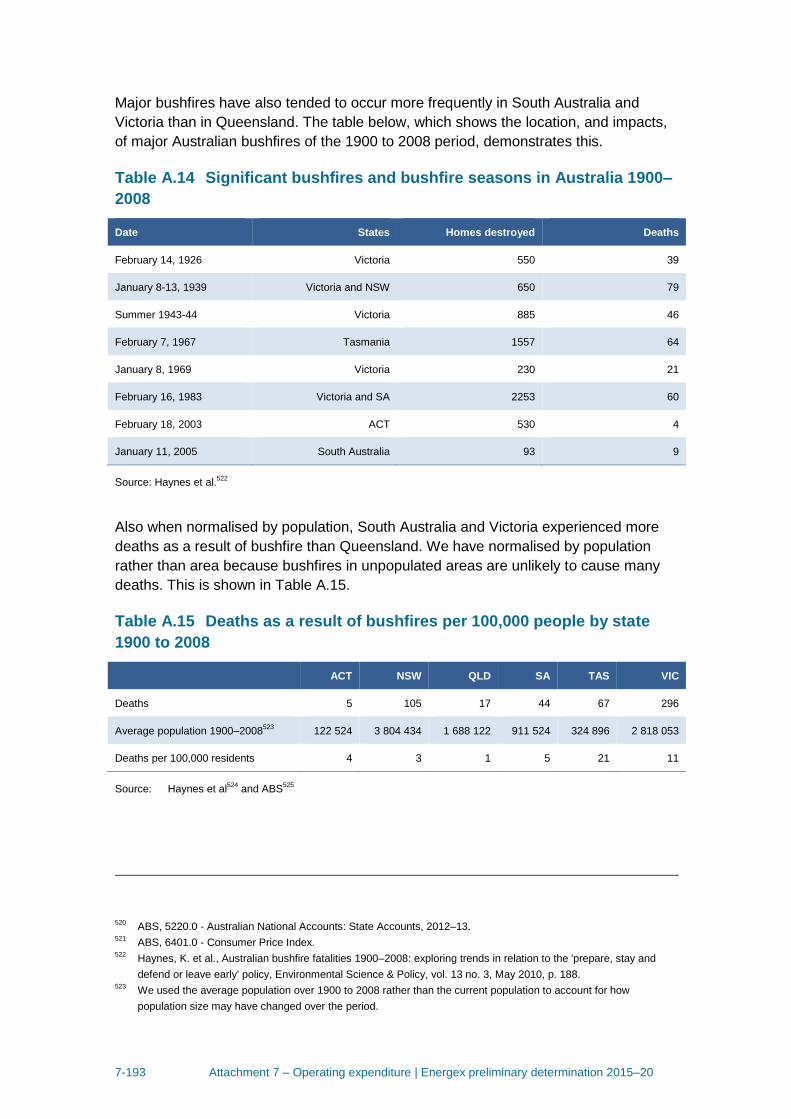
7-193 Attachment 7 – Operating expenditure | Energex preliminary determination 2015–20
Major bushfires have also tended to occur more frequently in South Australia and
Victoria than in Queensland. The table below, which shows the location, and impacts,
of major Australian bushfires of the 1900 to 2008 period, demonstrates this.
Table A.14 Significant bushfires and bushfire seasons in Australia 1900–
2008
Date States Homes destroyed Deaths
February 14, 1926 Victoria 550 39
January 8-13, 1939 Victoria and NSW 650 79
Summer 1943-44 Victoria 885 46
February 7, 1967 Tasmania 1557 64
January 8, 1969 Victoria 230 21
February 16, 1983 Victoria and SA 2253 60
February 18, 2003 ACT 530 4
January 11, 2005 South Australia 93 9
Source: Haynes et al.522
Also when normalised by population, South Australia and Victoria experienced more
deaths as a result of bushfire than Queensland. We have normalised by population
rather than area because bushfires in unpopulated areas are unlikely to cause many
deaths. This is shown in Table A.15.
Table A.15 Deaths as a result of bushfires per 100,000 people by state
1900 to 2008
ACT NSW QLD SA TAS VIC
Deaths 5 105 17 44 67 296
Average population 1900–2008523
122 524 3 804 434 1 688 122 911 524 324 896 2 818 053
Deaths per 100,000 residents 4 3 1 5 21 11
Source: Haynes et al524
and ABS525
520
ABS, 5220.0 - Australian National Accounts: State Accounts, 2012–13. 521
ABS, 6401.0 - Consumer Price Index. 522
Haynes, K. et al., Australian bushfire fatalities 1900–2008: exploring trends in relation to the 'prepare, stay and
defend or leave early' policy, Environmental Science & Policy, vol. 13 no. 3, May 2010, p. 188. 523
We used the average population over 1900 to 2008 rather than the current population to account for how
population size may have changed over the period.
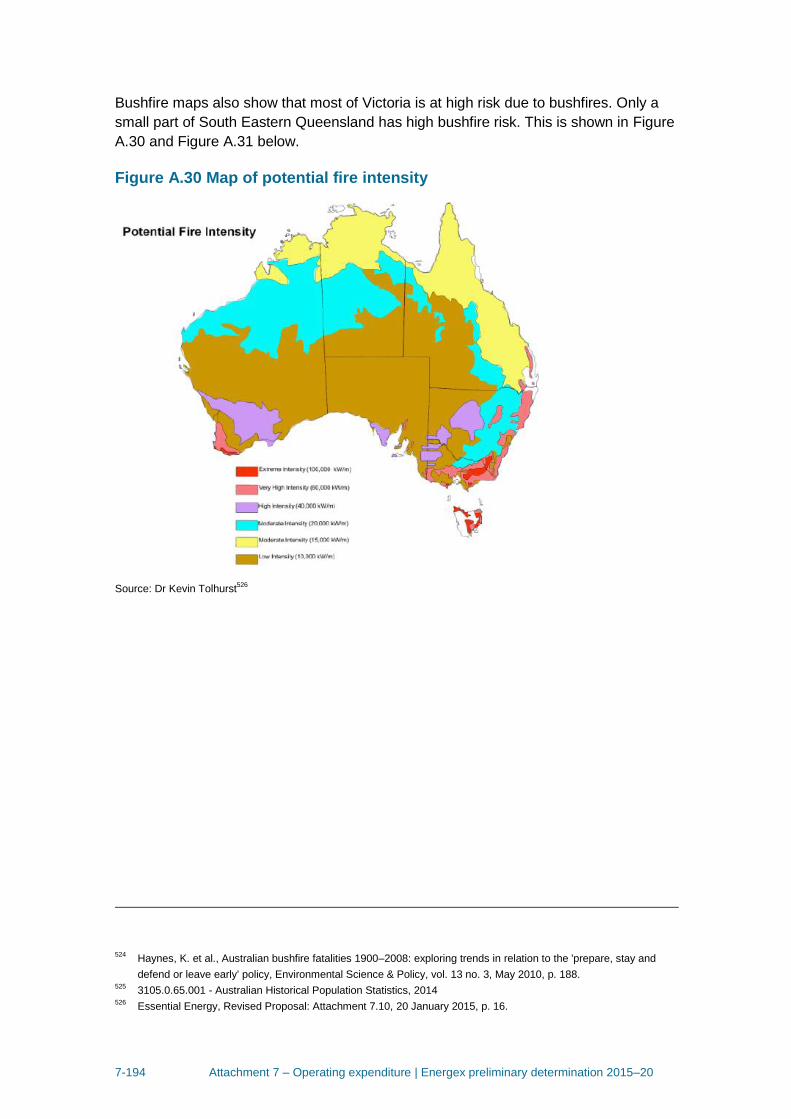
7-194 Attachment 7 – Operating expenditure | Energex preliminary determination 2015–20
Bushfire maps also show that most of Victoria is at high risk due to bushfires. Only a
small part of South Eastern Queensland has high bushfire risk. This is shown in Figure
A.30 and Figure A.31 below.
Figure A.30 Map of potential fire intensity
Source: Dr Kevin Tolhurst526
524
Haynes, K. et al., Australian bushfire fatalities 1900–2008: exploring trends in relation to the 'prepare, stay and
defend or leave early' policy, Environmental Science & Policy, vol. 13 no. 3, May 2010, p. 188. 525
3105.0.65.001 - Australian Historical Population Statistics, 2014 526
Essential Energy, Revised Proposal: Attachment 7.10, 20 January 2015, p. 16.
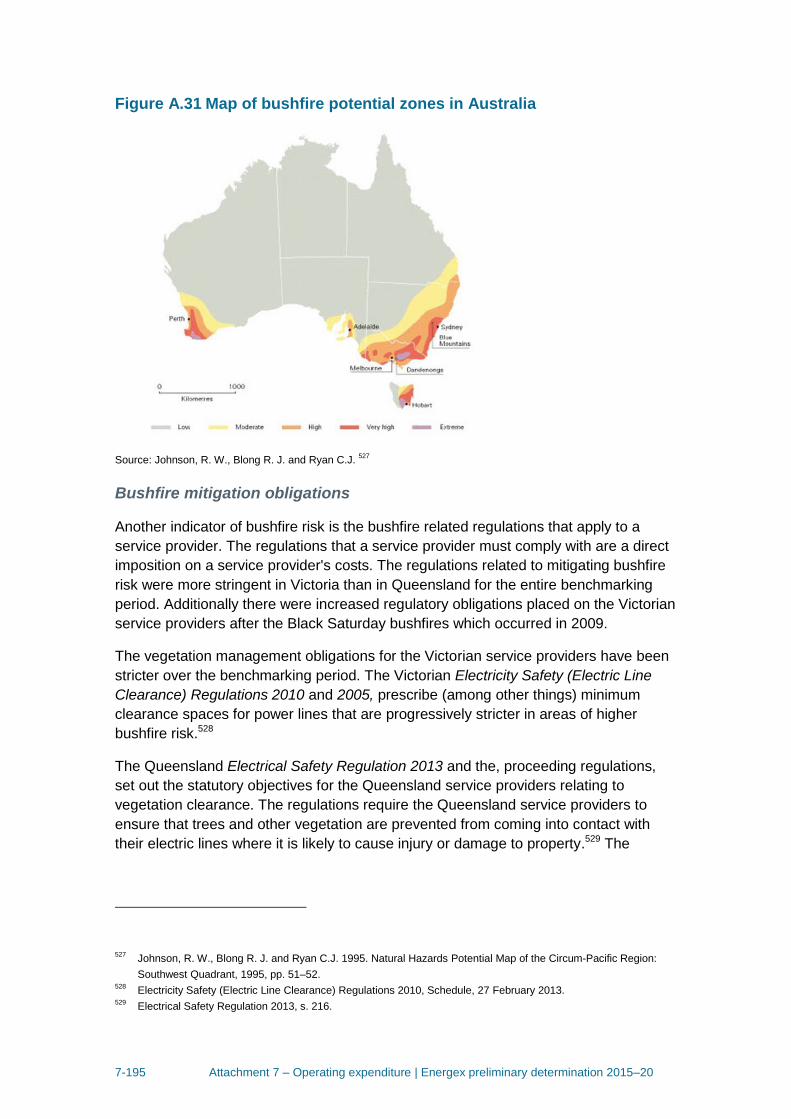
7-195 Attachment 7 – Operating expenditure | Energex preliminary determination 2015–20
Figure A.31 Map of bushfire potential zones in Australia
Source: Johnson, R. W., Blong R. J. and Ryan C.J. 527
Bushfire mitigation obligations
Another indicator of bushfire risk is the bushfire related regulations that apply to a
service provider. The regulations that a service provider must comply with are a direct
imposition on a service provider's costs. The regulations related to mitigating bushfire
risk were more stringent in Victoria than in Queensland for the entire benchmarking
period. Additionally there were increased regulatory obligations placed on the Victorian
service providers after the Black Saturday bushfires which occurred in 2009.
The vegetation management obligations for the Victorian service providers have been
stricter over the benchmarking period. The Victorian Electricity Safety (Electric Line
Clearance) Regulations 2010 and 2005, prescribe (among other things) minimum
clearance spaces for power lines that are progressively stricter in areas of higher
bushfire risk.528
The Queensland Electrical Safety Regulation 2013 and the, proceeding regulations,
set out the statutory objectives for the Queensland service providers relating to
vegetation clearance. The regulations require the Queensland service providers to
ensure that trees and other vegetation are prevented from coming into contact with
their electric lines where it is likely to cause injury or damage to property.529 The
527
Johnson, R. W., Blong R. J. and Ryan C.J. 1995. Natural Hazards Potential Map of the Circum-Pacific Region:
Southwest Quadrant, 1995, pp. 51–52. 528
Electricity Safety (Electric Line Clearance) Regulations 2010, Schedule, 27 February 2013. 529
Electrical Safety Regulation 2013, s. 216.

7-196 Attachment 7 – Operating expenditure | Energex preliminary determination 2015–20
Queensland regulations however do not mandate minimum vegetation clearance
distances.530 531
In the aftermath of the Black Saturday bushfires many changes were recommended to
the operation and management of the Victorian distribution systems. These obligations
do not exist in Queensland and include:
Changes to the Electric Line Clearance Regulations leading to a forecast step
change in opex of $205 million ($2010) over the 2011 to 2015 period532 533
Audit programs for line spreaders534
Audit programs for vibration dampeners535
Increased asset inspection frequencies,536
Audits of asset inspectors,537
Duty of care
While bushfire mitigation regulations are more stringent in Victoria than in Queensland,
we acknowledge that the Queensland service providers may adopt some Victorian
practices in exercising their duty of care. However, on the evidence before us, Victoria
has greater bushfire risk than Queensland. Therefore, one would expect that less
expenditure would be required to mitigate those risks in Queensland.
Additionally, although the Queensland service providers must take notice of events in
other jurisdictions in exercising their duty of care, any changes to their practices would
be in response to their individual risks. This continual evolution of the duty of care is
something all service providers will face. For example, even before the Black Saturday
bushfires Powercor began trialling LiDAR technology.538
On balance we are satisfied that in discharging their duty of care, the Queensland
service providers would adopt some of the bushfire mitigation practices of the Victorian
530
Energex, Response to AER information request AER EGX 021, 12 February 2015, p. 6. 531
Ergon Energy, Response to AER information request AER Ergon 026, 13 February 2015, p. 6. 532
AER, Victorian electricity distribution network service providers: Distribution determination 2011–2015 – Final
Decision appendices, September 2012, p. 301. 533
AER, Final Decision: CitiPower Ltd and Powercor Australia Ltd vegetation management forecast operating
expenditure step change, 2011–2015, August 2012, p. 2. 534
Victorian Government, Implementing the Government’s Response to the 2009 Victorian Bushfires Royal
Commission, May 2011, p. 61. 535
Victorian Government, Implementing the Government’s Response to the 2009 Victorian Bushfires Royal
Commission, May 2011, p. 61. 536
Victorian Government, Implementing the Government’s Response to the 2009 Victorian Bushfires Royal
Commission, May 2011, p. 59. 537
Energy Safe Victoria, Regulatory Impact Statement: Electricity Safety (Bushfire Mitigation) Regulations 2013,
25 February 2013, p. 3. 538
IJM Consulting, Bushfire Mitigation Powercor Australia: Final Audit Report 2008, Audit Report, p. 4.
7-197 Attachment 7 – Operating expenditure | Energex preliminary determination 2015–20
providers. However, a prudent and efficient service provider would only do this to the
extent that the risks it faces warrant it.
Impact of differences on opex
Differences in bushfire risk and related regulations between the comparison firms and
each of the Queensland service providers will provide the Queensland service
providers with a cost advantage.
Differences in bushfire risk have the potential to create material differences in the opex
required to operate the comparison firms' opex relative to the both of the Queensland
service providers. In Victoria for the 2011–2015 period, the increase in regulatory
obligations related to bushfires was forecast to account for 9.0 per cent of total opex.539 540 541 542 543 544 545 546 547 Although a prudent service provider would take into
consideration changes in practices in other states, it would only adopt those practices
to the extent that they are appropriate given their circumstances. On the evidence in
front of us, in general, Victoria faces higher risk of bushfires than Queensland.
Additionally, our examination of vegetation management regulations, the most costly
part of electricity service providers' bushfire mitigation practices, show the
requirements in Victoria are stricter.
Although we consider it is likely that the Victorian service providers will have a cost
disadvantage relative to the Queensland service providers due to differences in
bushfire risk and related regulatory obligations, we consider there will be some
mitigating factors. The change in regulations only came about after the Black Saturday
bushfires. All service providers have a duty of care. Also, other factors will affect
bushfire mitigation costs such as vegetation density, urbanity, undergrounding, and
divisions in responsibility for vegetation management. We note that urbanity (customer
density) and undergrounding are accounted for in Economic Insights' SFA model so
we have focussed on the effect of the timing of the change, duty of care, and
vegetation density.
Although the increase in opex associated with the new bushfire risk mitigation
obligations for the Victorian service providers was quite large, it only affected the end
539
AER, Final decision: CitiPower Ltd and Powercor Australia Ltd vegetation management forecast operating
expenditure step change, August 2012, p. 2. 540
AER, CitiPower Pty Distribution determination 2011–15, September 2012, p. 17. 541
AER, Powercor Australia Ltd Distribution determination 2011–15, October 2012, p. 26. 542
AER, Final decision: Powercor cost pass through application of 13 December 2011 for costs arising from the
Victorian Bushfire Royal Commission, May 2011, p. 96 543
AER, Final decision - appendices: Victorian electricity distribution network service providers - Distribution
determination 2011–2015, October 2011, p. 301–304. 544
AER, Final Decision: SP AusNet cost pass through application of 31 July 2012 for costs arising from the Victorian
Bushfire Royal Commission, 19 October 2012, p. 3. 545
AER, SPI Electricity Pty Ltd Distribution determination 2011–2015, August 2013, p. 20. 546
AER, Jemena Electricity Network (Victoria) Ltd: Distribution determination 2011–2015, September 2012, p. 22. 547
AER, United Energy Distribution: Distribution determination 2011–2015, September 2012, p. 19
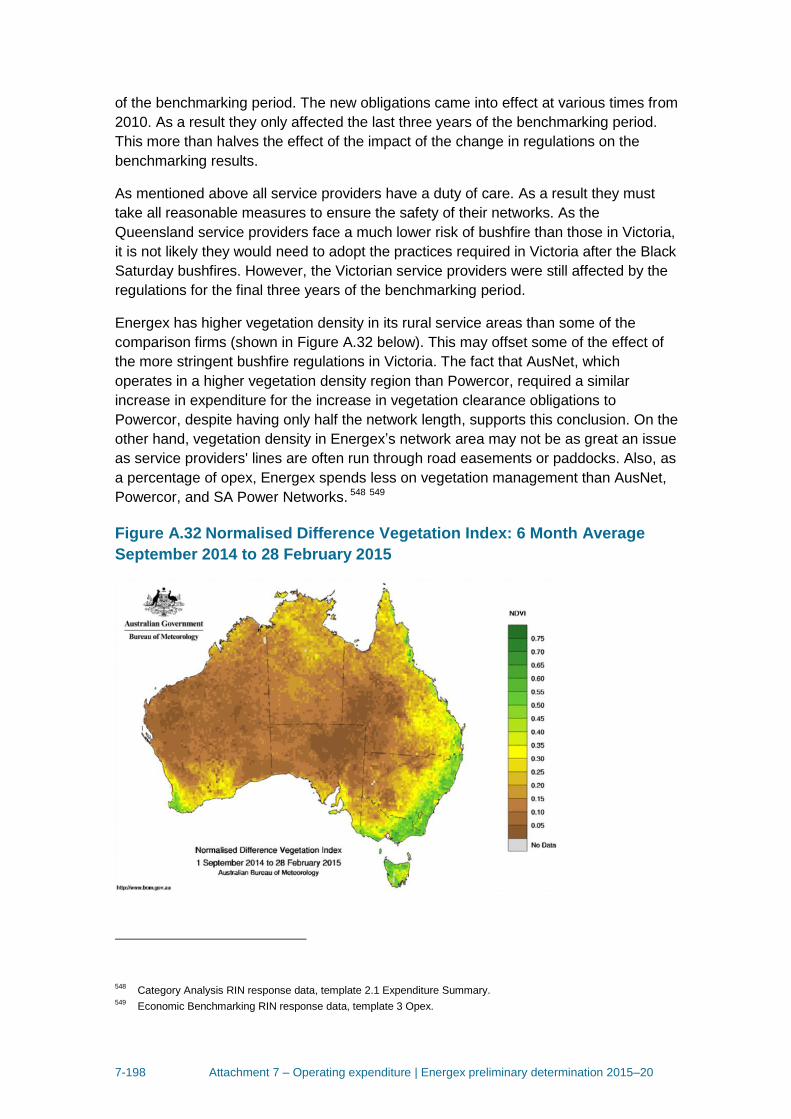
7-198 Attachment 7 – Operating expenditure | Energex preliminary determination 2015–20
of the benchmarking period. The new obligations came into effect at various times from
2010. As a result they only affected the last three years of the benchmarking period.
This more than halves the effect of the impact of the change in regulations on the
benchmarking results.
As mentioned above all service providers have a duty of care. As a result they must
take all reasonable measures to ensure the safety of their networks. As the
Queensland service providers face a much lower risk of bushfire than those in Victoria,
it is not likely they would need to adopt the practices required in Victoria after the Black
Saturday bushfires. However, the Victorian service providers were still affected by the
regulations for the final three years of the benchmarking period.
Energex has higher vegetation density in its rural service areas than some of the
comparison firms (shown in Figure A.32 below). This may offset some of the effect of
the more stringent bushfire regulations in Victoria. The fact that AusNet, which
operates in a higher vegetation density region than Powercor, required a similar
increase in expenditure for the increase in vegetation clearance obligations to
Powercor, despite having only half the network length, supports this conclusion. On the
other hand, vegetation density in Energex’s network area may not be as great an issue
as service providers' lines are often run through road easements or paddocks. Also, as
a percentage of opex, Energex spends less on vegetation management than AusNet,
Powercor, and SA Power Networks. 548 549
Figure A.32 Normalised Difference Vegetation Index: 6 Month Average
September 2014 to 28 February 2015
548
Category Analysis RIN response data, template 2.1 Expenditure Summary. 549
Economic Benchmarking RIN response data, template 3 Opex.

7-199 Attachment 7 – Operating expenditure | Energex preliminary determination 2015–20
Source: Bureau of Meteorology550
We are satisfied that the more stringent vegetation management obligations and
bushfire risks in Victoria are likely to outweigh the higher vegetation density in
Energex's service area. The forecast percentage increases in opex due to the change
in bushfire regulations for Powercor and AusNet were 11.5 and 11.3 per cent
respectively. These are almost as large as the average percentage of opex that
Energex spent on vegetation management during the 2009 to 2013 period;
15 per cent. 551 552
On balance we are satisfied that the Victorian service providers will face a cost
disadvantage relative to the Queensland service providers due to differences in
bushfire risk and related regulations. However, the vegetation density in Energex's
Network means it is uncertain if those differences will lead to a material cost advantage
for Energex. As a result we have decided to treat bushfire risk as an immaterial OEF
for Energex. An adjustment for bushfire risk satisfies the exogeneity OEF criteria. The
geographic characteristics and settlement patterns of a network area are beyond the
control of service providers. An adjustment for bushfire risk would also satisfy the
duplication OEF criteria, Economic Insights' SFA model does not account for
differences in bushfire risk. Therefore, in accordance with our treatment of immaterial
OEFs for we have provided a negative 0.5 per cent adjustment to Energex's
benchmarking results to account for differences in bushfire risk.
However, Ergon Energy does not appear to have any material offsetting factors. Figure
A.32 above shows that overall Ergon has vegetation density comparable to western
Victoria. Ergon spends a similar percentage of opex, 15 per cent, on vegetation
management as SA Power Networks, and less than Powercor (18 per cent) and
AusNet (22 per cent). 553 As a result we are satisfied that the step changes in Victoria
to address changes in bushfire related regulations represent a cost disadvantage for
the Victorian service providers relative to Ergon Energy.
With regard to the quantum of the OEF adjustment for Ergon, we consider that it
should take into account that we base efficiency rankings on average performance
over the 2005–06 to 2012–13 period and that not all comparison firms are Victorian.
Therefore, we should base the OEF adjustment on the average effect of the OEF on
the comparison firms over the benchmarking period. The new regulatory obligations
only came into force in Victoria in 2010/11 so the Victorian service providers only had
this cost disadvantage in the final three years of the benchmarking period. SA Power
Networks did not have this disadvantage. We have therefore weighted the bushfire risk
OEF adjustment by the customer numbers of the comparison firms and the length of
the benchmarking period affected.
550
Bureau of Meteorology, Six-monthly NDVI Average for Australia, available at
http://www.bom.gov.au/jsp/awap/ndvi/index.jsp [last accessed 1 March 2015]. 551
Category Analysis RIN response data, template 2.1 Expenditure Summary. 552
Economic Benchmarking RIN response data, template 3 Opex. 553
Category Analysis RIN data, template 2.1 Expenditure Summary.
7-200 Attachment 7 – Operating expenditure | Energex preliminary determination 2015–20
We are satisfied that it is necessary to provide a negative 2.6 per cent OEF adjustment
for differences in bushfire regulations between the Ergon Energy and the comparison
firms. The first step is to calculate the customer weighted percentage impact of the
forecast increase in opex due to the changes in bushfire mitigation obligations on opex
for the comparison firms (6.85%). As these changes were only in place for the last
three years of the eight year benchmarking period, we then multiplied the weighted
percentage impact by three and then divided by eight. In this manner we have taken
into the fact that these obligations do not apply to SA Power Networks, and that they
were only in place for part of the benchmarking period.
Corrosive environments
We are not satisfied that an OEF adjustment for corrosive environments meets the
materiality OEF adjustment criterion. All service providers have assets that corrosive
elements affect.
In support of Ausgrid's 2014 regulatory proposal, Evans and Peck raised the issue of
corrosion as an OEF. They consider that the presence of corrosive atmospheres
containing things such as salts (in coastal environments) and acid sulphates (in soils)
affect maintenance costs. 554
While salts affect assets in coastal areas, dusts affect assets in inland areas. While all
service providers will be affected to some extent, the differences in the corrosive
elements in each area will lead to differences in design and operational considerations
that may affect opex. Sufficient evidence was not provided to show that these
differences would be material.
However, in accordance with our treatment of immaterial OEFs we have provided a
positive 0.5 per cent adjustment for differences in exposure to corrosive elements.
Although an OEF adjustment for differences in exposure to corrosive elements is not
likely to lead to material differences in opex, the differences they do cause would meet
the exogeneity and duplication OEF criteria. The prevalence of corrosive compounds in
a network area is beyond service providers' control and Economic Insights' SFA model
does not have a variable to account for it. We have provided a positive 0.5 per cent
adjustment because it is unclear if differences in exposure to corrosive elements will
lead to a cost advantage or disadvantage for the Queensland service providers relative
to the comparison firms.
Cyclones
We are satisfied that an OEF adjustment is necessary for the increased network
switching and emergency response operations resulting from cyclones. It satisfies all
OEF criteria. Cyclones are beyond service providers' control. Cyclones can lead to
554
Evans and Peck, Review of factors contributing to variations in operating and capital costs structures of Australia
DNSPs, November 2012, p. 38.
7-201 Attachment 7 – Operating expenditure | Energex preliminary determination 2015–20
material differences in opex between service providers. Cyclones are not accounted for
elsewhere in Economic Insights' SFA model.
Ergon Energy stated that cyclones present a unique problem for it. It noted that
cyclones impact Queensland's coastal areas at a rate of around one to two events per
year. Cyclones increase the likelihood of outages and lead to increased network
switching and emergency response operations.555
We are satisfied that cyclones impose costs on Ergon Energy that other service
providers in our benchmarking dataset do not face.
Ergon Energy provided the expenditure it incurred as a result of each of the major
cyclones that impacted its region during the benchmarking period.556 The opex
associated with the events was $84 million (2014–15). This represents 3.4 per cent of
Ergon Energy's network services opex over the same period. As this represents an
increase of increase on ActewAGL's historical opex, it must be adjusted to the increase
in efficient opex as discussed in the calculation of OEFs section above. After
adjustment, the cyclones OEF represents an increase in efficient opex of 4.6 per cent.
Environmental Variability
We are not satisfied that an OEF adjustment for environmental variability would meet
the materiality OEF adjustment criterion. Intra-network environmental variability will not
lead to material differences in opex.
In its regulatory proposal Ergon Energy raised intra-network environmental variability
as an issue that would lead to material differences in opex between it and the
comparison firms.557 Ergon Energy submitted metrics on the variability of temperature,
rainfall, and humidity to support this claim. These metrics showed that Ergon has the
highest level of intra-network variability in humidity, rainfall, and temperature. Ergon
considers this variability of environment within its network presents Ergon Energy with
a significant challenge in the development of optimal maintenance schedules and
resource allocation. Ergon did not quantify the effect of these scheduling and logistic
issues on its opex. Further, Ergon Energy did not adequately explain the link between
environmental variability and increased maintenance scheduling costs or resource
allocation costs.
We are not satisfied that differences in environmental variability will lead to material
differences in opex. In developing maintenance schedules and managing inventories,
all service providers must manage a large range of assets. The major driver of this
heterogeneity is technological change. As the technology of electricity distribution
advances over time, service providers install different types of assets. However, the
older assets, based on a different technology remain. Managing this complexity is one
of the core competencies of an asset manager. Ergon has provided no information that
demonstrates that the incremental complexity involved in managing the potential
555
Ergon Energy, Response to information request AER Ergon 02, 18 December 2014, pp. 9–10. 556
Ergon Energy, Regulatory proposal: Attachment 06.02.03, 22 October 2014, p. 15. 557
Ergon Energy, Regulatory Proposal: Attachment 0A.01.01, 31 October 2014, pp. 12–13.
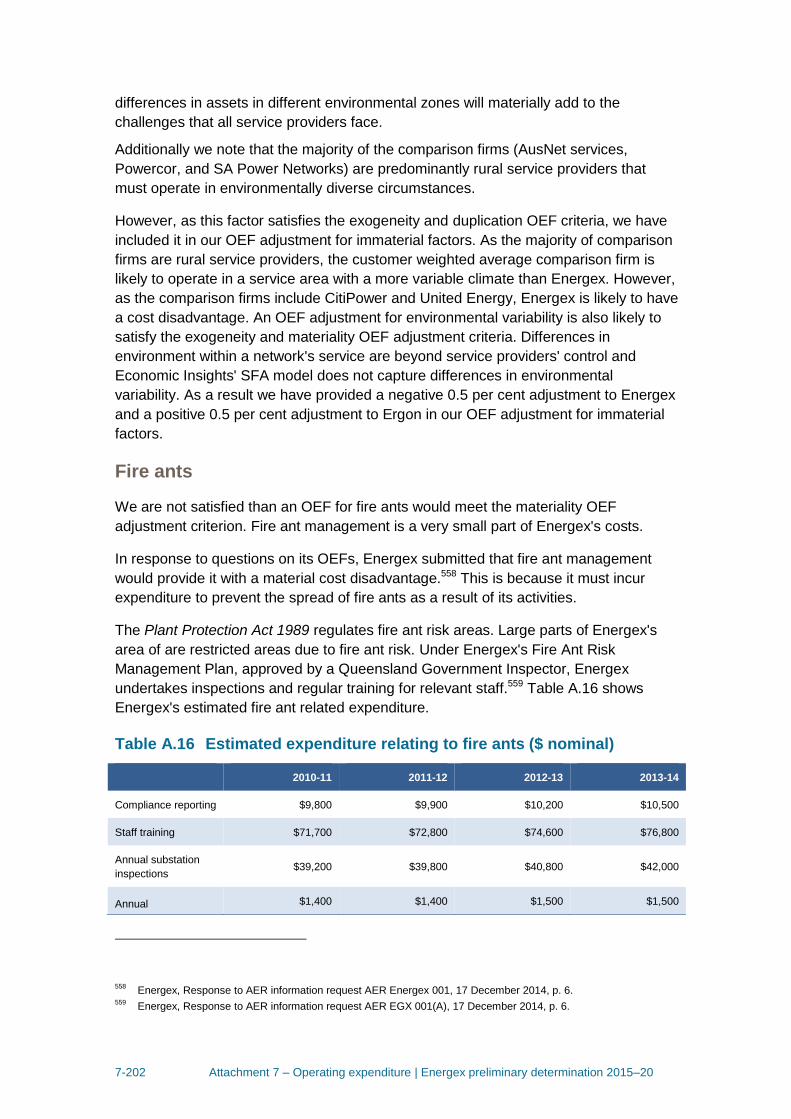
7-202 Attachment 7 – Operating expenditure | Energex preliminary determination 2015–20
differences in assets in different environmental zones will materially add to the
challenges that all service providers face.
Additionally we note that the majority of the comparison firms (AusNet services,
Powercor, and SA Power Networks) are predominantly rural service providers that
must operate in environmentally diverse circumstances.
However, as this factor satisfies the exogeneity and duplication OEF criteria, we have
included it in our OEF adjustment for immaterial factors. As the majority of comparison
firms are rural service providers, the customer weighted average comparison firm is
likely to operate in a service area with a more variable climate than Energex. However,
as the comparison firms include CitiPower and United Energy, Energex is likely to have
a cost disadvantage. An OEF adjustment for environmental variability is also likely to
satisfy the exogeneity and materiality OEF adjustment criteria. Differences in
environment within a network's service are beyond service providers' control and
Economic Insights' SFA model does not capture differences in environmental
variability. As a result we have provided a negative 0.5 per cent adjustment to Energex
and a positive 0.5 per cent adjustment to Ergon in our OEF adjustment for immaterial
factors.
Fire ants
We are not satisfied than an OEF for fire ants would meet the materiality OEF
adjustment criterion. Fire ant management is a very small part of Energex's costs.
In response to questions on its OEFs, Energex submitted that fire ant management
would provide it with a material cost disadvantage.558 This is because it must incur
expenditure to prevent the spread of fire ants as a result of its activities.
The Plant Protection Act 1989 regulates fire ant risk areas. Large parts of Energex's
area of are restricted areas due to fire ant risk. Under Energex's Fire Ant Risk
Management Plan, approved by a Queensland Government Inspector, Energex
undertakes inspections and regular training for relevant staff.559 Table A.16 shows
Energex's estimated fire ant related expenditure.
Table A.16 Estimated expenditure relating to fire ants ($ nominal)
2010-11 2011-12 2012-13 2013-14
Compliance reporting $9,800 $9,900 $10,200 $10,500
Staff training $71,700 $72,800 $74,600 $76,800
Annual substation
inspections $39,200 $39,800 $40,800 $42,000
Annual $1,400 $1,400 $1,500 $1,500
558
Energex, Response to AER information request AER Energex 001, 17 December 2014, p. 6. 559
Energex, Response to AER information request AER EGX 001(A), 17 December 2014, p. 6.
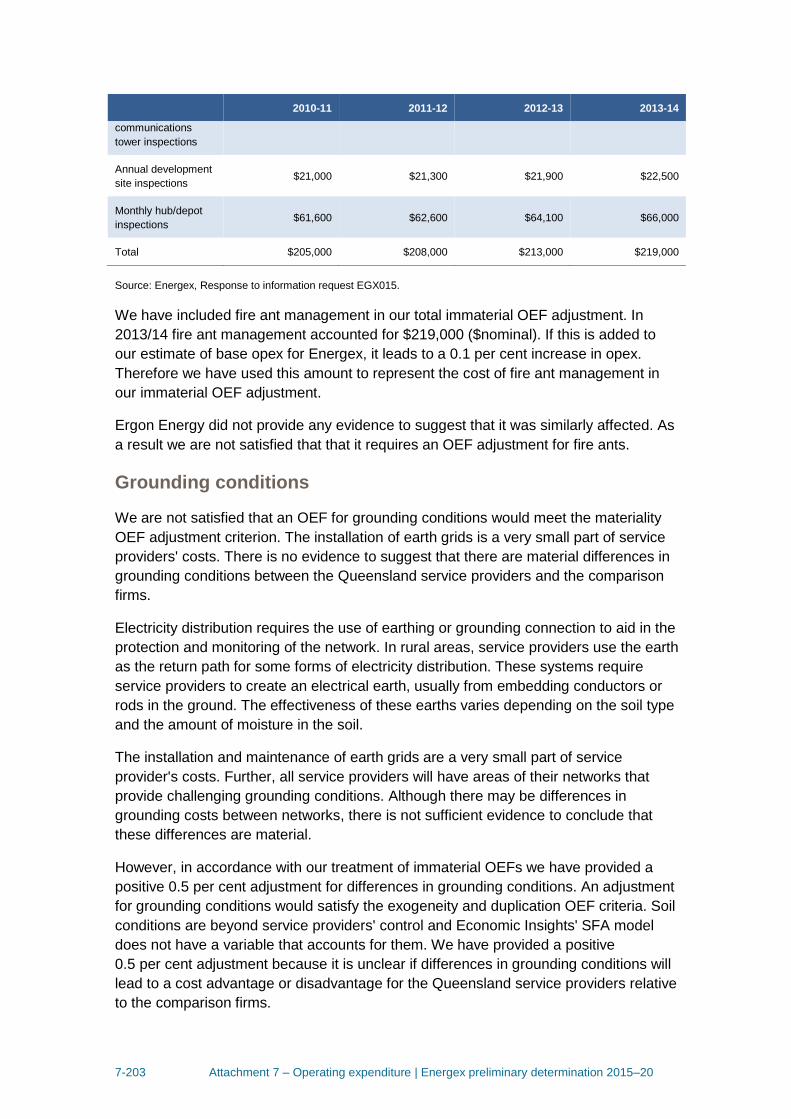
7-203 Attachment 7 – Operating expenditure | Energex preliminary determination 2015–20
2010-11 2011-12 2012-13 2013-14
communications
tower inspections
Annual development
site inspections $21,000 $21,300 $21,900 $22,500
Monthly hub/depot
inspections $61,600 $62,600 $64,100 $66,000
Total $205,000 $208,000 $213,000 $219,000
Source: Energex, Response to information request EGX015.
We have included fire ant management in our total immaterial OEF adjustment. In
2013/14 fire ant management accounted for $219,000 ($nominal). If this is added to
our estimate of base opex for Energex, it leads to a 0.1 per cent increase in opex.
Therefore we have used this amount to represent the cost of fire ant management in
our immaterial OEF adjustment.
Ergon Energy did not provide any evidence to suggest that it was similarly affected. As
a result we are not satisfied that that it requires an OEF adjustment for fire ants.
Grounding conditions
We are not satisfied that an OEF for grounding conditions would meet the materiality
OEF adjustment criterion. The installation of earth grids is a very small part of service
providers' costs. There is no evidence to suggest that there are material differences in
grounding conditions between the Queensland service providers and the comparison
firms.
Electricity distribution requires the use of earthing or grounding connection to aid in the
protection and monitoring of the network. In rural areas, service providers use the earth
as the return path for some forms of electricity distribution. These systems require
service providers to create an electrical earth, usually from embedding conductors or
rods in the ground. The effectiveness of these earths varies depending on the soil type
and the amount of moisture in the soil.
The installation and maintenance of earth grids are a very small part of service
provider's costs. Further, all service providers will have areas of their networks that
provide challenging grounding conditions. Although there may be differences in
grounding costs between networks, there is not sufficient evidence to conclude that
these differences are material.
However, in accordance with our treatment of immaterial OEFs we have provided a
positive 0.5 per cent adjustment for differences in grounding conditions. An adjustment
for grounding conditions would satisfy the exogeneity and duplication OEF criteria. Soil
conditions are beyond service providers' control and Economic Insights' SFA model
does not have a variable that accounts for them. We have provided a positive
0.5 per cent adjustment because it is unclear if differences in grounding conditions will
lead to a cost advantage or disadvantage for the Queensland service providers relative
to the comparison firms.

7-204 Attachment 7 – Operating expenditure | Energex preliminary determination 2015–20
Humidity and rainfall
We are not satisfied that an OEF for differences in humidity and rainfall would meet the
materiality OEF adjustment criterion. Differences in humidity are will have a greater
impact on asset replacement than maintenance costs.
In response to questions from the AER about the effect of rainfall and humidity on
poles, cross arms, transformers and assets using SF6 as an insulator, Ergon Energy
submitted that high rainfall and humidity increases the degradation of timber assets.560
It also submitted that asset failures in high rainfall areas make up 40 per cent of asset
failures although they only make up five per cent of the area of Queensland.561 Ergon
Energy also stated that it has a special inspection program for pole top structures in
areas that have rainfall of above 1500mm per annum. This leads to inspection costs
being higher for poles in its higher rainfall areas.
When we asked Ergon Energy about the impact rainfall and humidity on poles, cross
arms, transformers and assets using SF6 as an insulator, Ergon Energy only provided
evidence to suggest that costs were higher for cross arm maintenance. Ergon Energy
provided a comparison of the number of asset failures in high rainfall areas and low
rainfall areas. However Ergon Energy did not indicate what percentage of its assets
were in high rainfall areas. The only evidence that higher rainfall and humidity lead to
increased opex that Ergon Energy provided relates to cross arm maintenance. Ergon
Energy stated that it carries out more expensive cross arm inspections in high rainfall
areas. However, Ergon Energy provided no evidence to indicate that the benefit of
these inspections outweighs the additional costs relative to the aerial inspections used
by other service providers to inspect cross arm health. Further only small parts of
Energex and Ergon Energy's service areas are subject to average rainfalls in excess of
1500mm a year. See Figure A.33 below.
560
Ergon Energy, Response to information request ERG002(3), 18 December 2014, pp. 12–14. 561
Ergon Energy, Response to information request ERG018(3), 30 January 2015, p. 5.
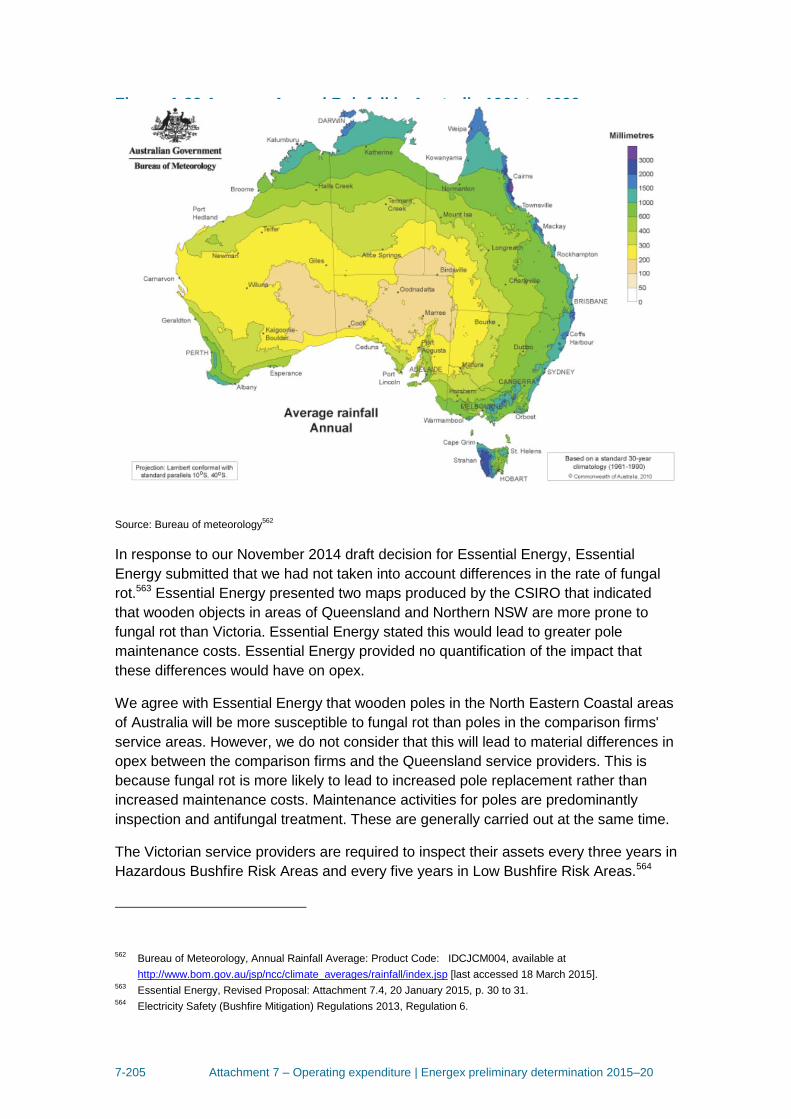
7-205 Attachment 7 – Operating expenditure | Energex preliminary determination 2015–20
Figure A.33 Average Annual Rainfall in Australia 1961 to 1990
Source: Bureau of meteorology562
In response to our November 2014 draft decision for Essential Energy, Essential
Energy submitted that we had not taken into account differences in the rate of fungal
rot.563 Essential Energy presented two maps produced by the CSIRO that indicated
that wooden objects in areas of Queensland and Northern NSW are more prone to
fungal rot than Victoria. Essential Energy stated this would lead to greater pole
maintenance costs. Essential Energy provided no quantification of the impact that
these differences would have on opex.
We agree with Essential Energy that wooden poles in the North Eastern Coastal areas
of Australia will be more susceptible to fungal rot than poles in the comparison firms'
service areas. However, we do not consider that this will lead to material differences in
opex between the comparison firms and the Queensland service providers. This is
because fungal rot is more likely to lead to increased pole replacement rather than
increased maintenance costs. Maintenance activities for poles are predominantly
inspection and antifungal treatment. These are generally carried out at the same time.
The Victorian service providers are required to inspect their assets every three years in
Hazardous Bushfire Risk Areas and every five years in Low Bushfire Risk Areas.564
562
Bureau of Meteorology, Annual Rainfall Average: Product Code: IDCJCM004, available at
http://www.bom.gov.au/jsp/ncc/climate_averages/rainfall/index.jsp [last accessed 18 March 2015]. 563
Essential Energy, Revised Proposal: Attachment 7.4, 20 January 2015, p. 30 to 31. 564
Electricity Safety (Bushfire Mitigation) Regulations 2013, Regulation 6.
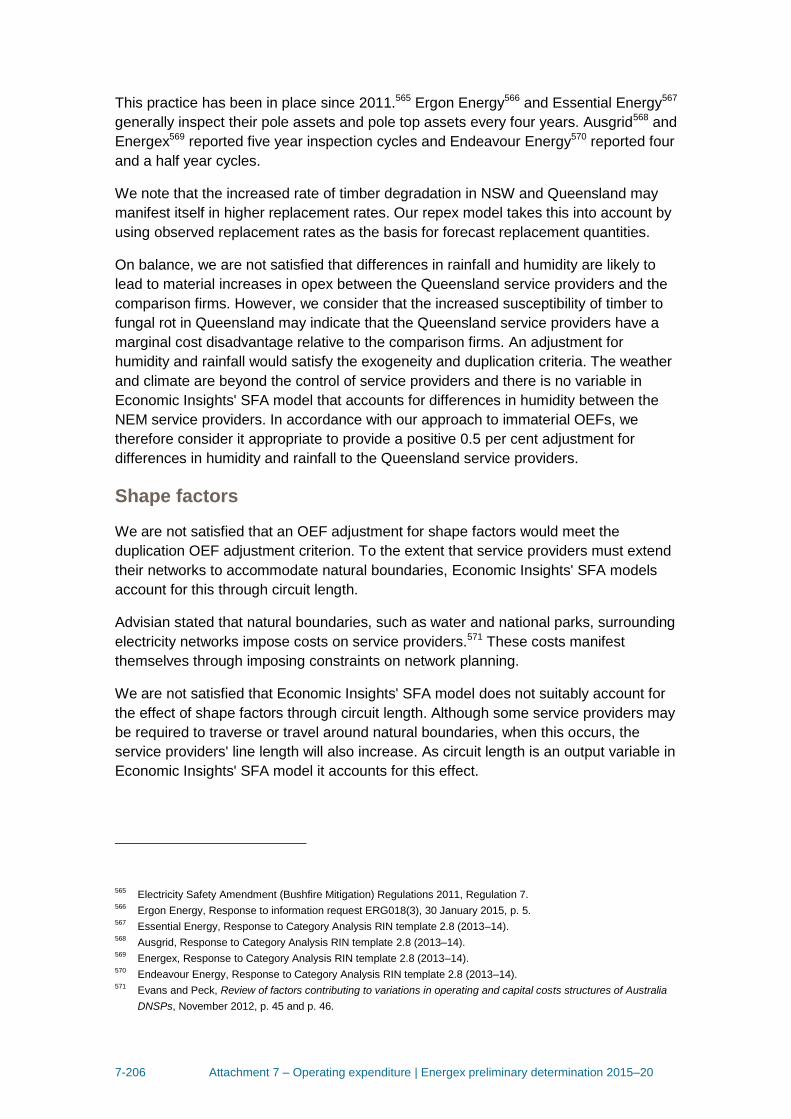
7-206 Attachment 7 – Operating expenditure | Energex preliminary determination 2015–20
This practice has been in place since 2011.565 Ergon Energy566 and Essential Energy567
generally inspect their pole assets and pole top assets every four years. Ausgrid568 and
Energex569 reported five year inspection cycles and Endeavour Energy570 reported four
and a half year cycles.
We note that the increased rate of timber degradation in NSW and Queensland may
manifest itself in higher replacement rates. Our repex model takes this into account by
using observed replacement rates as the basis for forecast replacement quantities.
On balance, we are not satisfied that differences in rainfall and humidity are likely to
lead to material increases in opex between the Queensland service providers and the
comparison firms. However, we consider that the increased susceptibility of timber to
fungal rot in Queensland may indicate that the Queensland service providers have a
marginal cost disadvantage relative to the comparison firms. An adjustment for
humidity and rainfall would satisfy the exogeneity and duplication criteria. The weather
and climate are beyond the control of service providers and there is no variable in
Economic Insights' SFA model that accounts for differences in humidity between the
NEM service providers. In accordance with our approach to immaterial OEFs, we
therefore consider it appropriate to provide a positive 0.5 per cent adjustment for
differences in humidity and rainfall to the Queensland service providers.
Shape factors
We are not satisfied that an OEF adjustment for shape factors would meet the
duplication OEF adjustment criterion. To the extent that service providers must extend
their networks to accommodate natural boundaries, Economic Insights' SFA models
account for this through circuit length.
Advisian stated that natural boundaries, such as water and national parks, surrounding
electricity networks impose costs on service providers.571 These costs manifest
themselves through imposing constraints on network planning.
We are not satisfied that Economic Insights' SFA model does not suitably account for
the effect of shape factors through circuit length. Although some service providers may
be required to traverse or travel around natural boundaries, when this occurs, the
service providers' line length will also increase. As circuit length is an output variable in
Economic Insights' SFA model it accounts for this effect.
565
Electricity Safety Amendment (Bushfire Mitigation) Regulations 2011, Regulation 7. 566
Ergon Energy, Response to information request ERG018(3), 30 January 2015, p. 5. 567
Essential Energy, Response to Category Analysis RIN template 2.8 (2013–14). 568
Ausgrid, Response to Category Analysis RIN template 2.8 (2013–14). 569
Energex, Response to Category Analysis RIN template 2.8 (2013–14). 570
Endeavour Energy, Response to Category Analysis RIN template 2.8 (2013–14). 571
Evans and Peck, Review of factors contributing to variations in operating and capital costs structures of Australia
DNSPs, November 2012, p. 45 and p. 46.
7-207 Attachment 7 – Operating expenditure | Energex preliminary determination 2015–20
Skills required by service providers
We are not satisfied that an OEF adjustment for differences in skills required by service
providers would meet the materiality OEF adjustment criterion. Differences in the skills
required by service providers are not likely to lead to material differences in costs. All
service providers require broadly the same skills.
As service providers operate in different environments, they may require different skills.
For example, rural networks may hire pilots to carry out asset inspections and transport
staff and equipment. However, overall, service providers require employees with
similar qualifications and skills. We note that we are benchmarking the same core
services provided by all networks.
We have included this factor as part of the allowance for immaterial OEFs. This is
because although differences in the skills required by service providers are unlikely to
lead to material differences in opex, it is logical that there will be some differences. An
adjustment for differences in skills required would satisfy the exogeneity OEF
adjustment criterion. Different environmental conditions may require specialised
expertise not required by other NEM service providers. Also differences in the skills
required are not accounted for in Economic Insights' SFA model. As there is
uncertainty as to which service providers will have cost advantages on this OEF we
have provided a positive 0.5 per cent OEF for differences in skills required by service
providers.
Extreme weather events
We are satisfied that an OEF adjustment for differences in exposure to extreme
weather events satisfies all our OEF adjustment criteria. The weather is beyond
service providers' control. Given service providers operate in geographically different
areas, they will be subject to differing amounts of extreme weather. Extreme weather
has the potential to materially affect service providers' opex. Systematic exposure to
extreme weather not accounted for in Economic Insights' SFA model.
In support of its 2014 regulatory proposal, Ausgrid submitted a report by Advisian
(formerly known as Evan's and Peck) that identified major weather events as an OEF
that may affect benchmarking results.572 Advisian present analysis from the Bureau of
Transport Economics (BTE) that estimate the magnitude of the costs imposed by
disasters in Australia. These costs include the estimated costs of bushfires, cyclones,
earthquakes, floods, landslides, and severe storms in Australia over the period 1967-
1999.573
We are satisfied that differences in exposure to extreme weather events are likely to
create material differences in opex between the Queensland service providers and the
572
Evans and Peck, Review of factors contributing to variations in operating and capital costs structures of Australian
service providers, November 2012, pp. 66–7. 573
Evans and Peck, Review of factors contributing to variations in operating and capital costs structures of Australian
service providers, November 2012, p. 66.
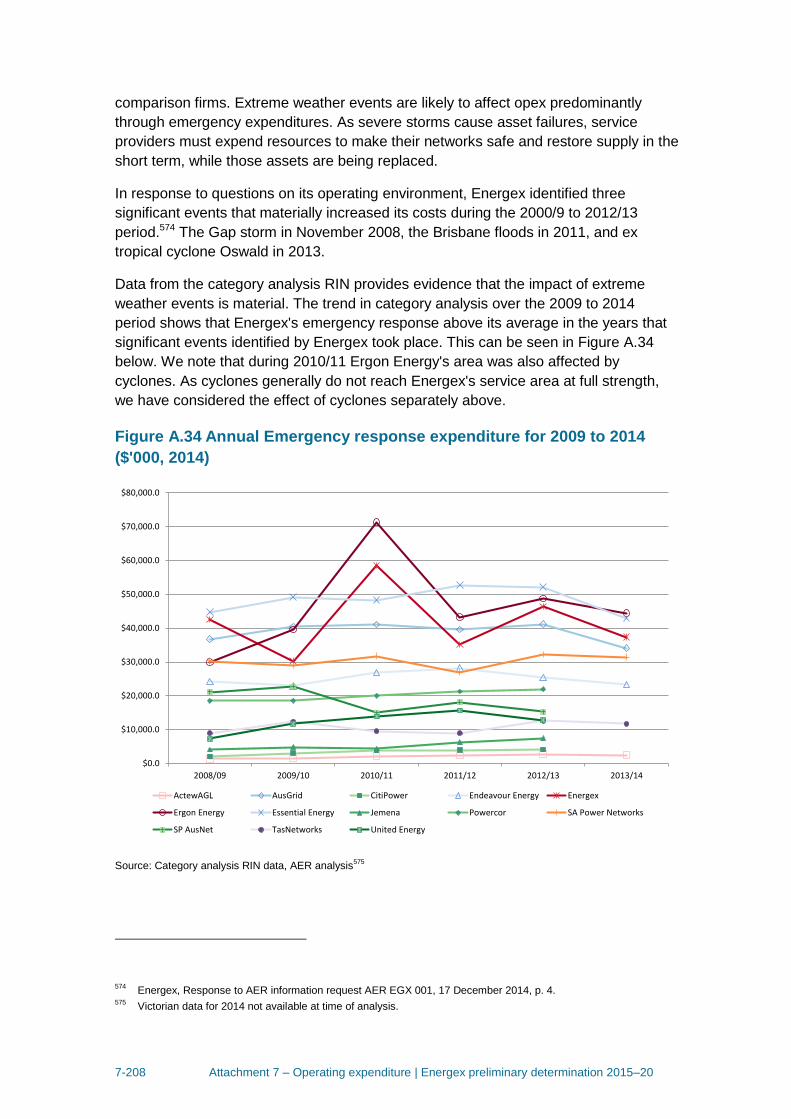
7-208 Attachment 7 – Operating expenditure | Energex preliminary determination 2015–20
comparison firms. Extreme weather events are likely to affect opex predominantly
through emergency expenditures. As severe storms cause asset failures, service
providers must expend resources to make their networks safe and restore supply in the
short term, while those assets are being replaced.
In response to questions on its operating environment, Energex identified three
significant events that materially increased its costs during the 2000/9 to 2012/13
period.574 The Gap storm in November 2008, the Brisbane floods in 2011, and ex
tropical cyclone Oswald in 2013.
Data from the category analysis RIN provides evidence that the impact of extreme
weather events is material. The trend in category analysis over the 2009 to 2014
period shows that Energex's emergency response above its average in the years that
significant events identified by Energex took place. This can be seen in Figure A.34
below. We note that during 2010/11 Ergon Energy's area was also affected by
cyclones. As cyclones generally do not reach Energex's service area at full strength,
we have considered the effect of cyclones separately above.
Figure A.34 Annual Emergency response expenditure for 2009 to 2014
($'000, 2014)
Source: Category analysis RIN data, AER analysis575
574
Energex, Response to AER information request AER EGX 001, 17 December 2014, p. 4. 575
Victorian data for 2014 not available at time of analysis.
$0.0
$10,000.0
$20,000.0
$30,000.0
$40,000.0
$50,000.0
$60,000.0
$70,000.0
$80,000.0
2008/09 2009/10 2010/11 2011/12 2012/13 2013/14
ActewAGL AusGrid CitiPower Endeavour Energy Energex
Ergon Energy Essential Energy Jemena Powercor SA Power Networks
SP AusNet TasNetworks United Energy
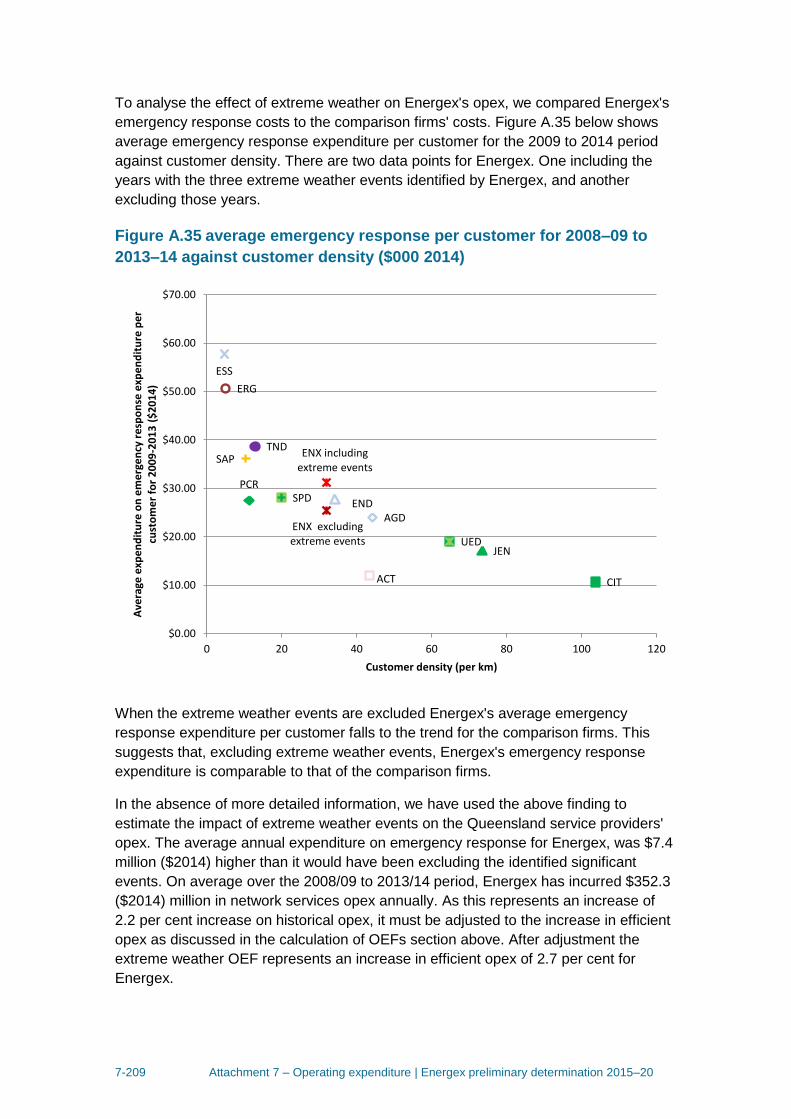
7-209 Attachment 7 – Operating expenditure | Energex preliminary determination 2015–20
To analyse the effect of extreme weather on Energex's opex, we compared Energex's
emergency response costs to the comparison firms' costs. Figure A.35 below shows
average emergency response expenditure per customer for the 2009 to 2014 period
against customer density. There are two data points for Energex. One including the
years with the three extreme weather events identified by Energex, and another
excluding those years.
Figure A.35 average emergency response per customer for 2008–09 to
2013–14 against customer density ($000 2014)
When the extreme weather events are excluded Energex's average emergency
response expenditure per customer falls to the trend for the comparison firms. This
suggests that, excluding extreme weather events, Energex's emergency response
expenditure is comparable to that of the comparison firms.
In the absence of more detailed information, we have used the above finding to
estimate the impact of extreme weather events on the Queensland service providers'
opex. The average annual expenditure on emergency response for Energex, was $7.4
million ($2014) higher than it would have been excluding the identified significant
events. On average over the 2008/09 to 2013/14 period, Energex has incurred $352.3
($2014) million in network services opex annually. As this represents an increase of
2.2 per cent increase on historical opex, it must be adjusted to the increase in efficient
opex as discussed in the calculation of OEFs section above. After adjustment the
extreme weather OEF represents an increase in efficient opex of 2.7 per cent for
Energex.
ACT
AGD
CIT
END
ENX excluding extreme events
ERG
ESS
JEN
PCR
SAP
SPD
TND
UED
ENX including extreme events
$0.00
$10.00
$20.00
$30.00
$40.00
$50.00
$60.00
$70.00
0 20 40 60 80 100 120
Ave
rage
exp
en
dit
ure
on
em
erg
en
cy r
esp
on
se e
xpe
nd
itu
re p
er
cust
om
er
for
20
09
-20
13
($
20
14
)
Customer density (per km)
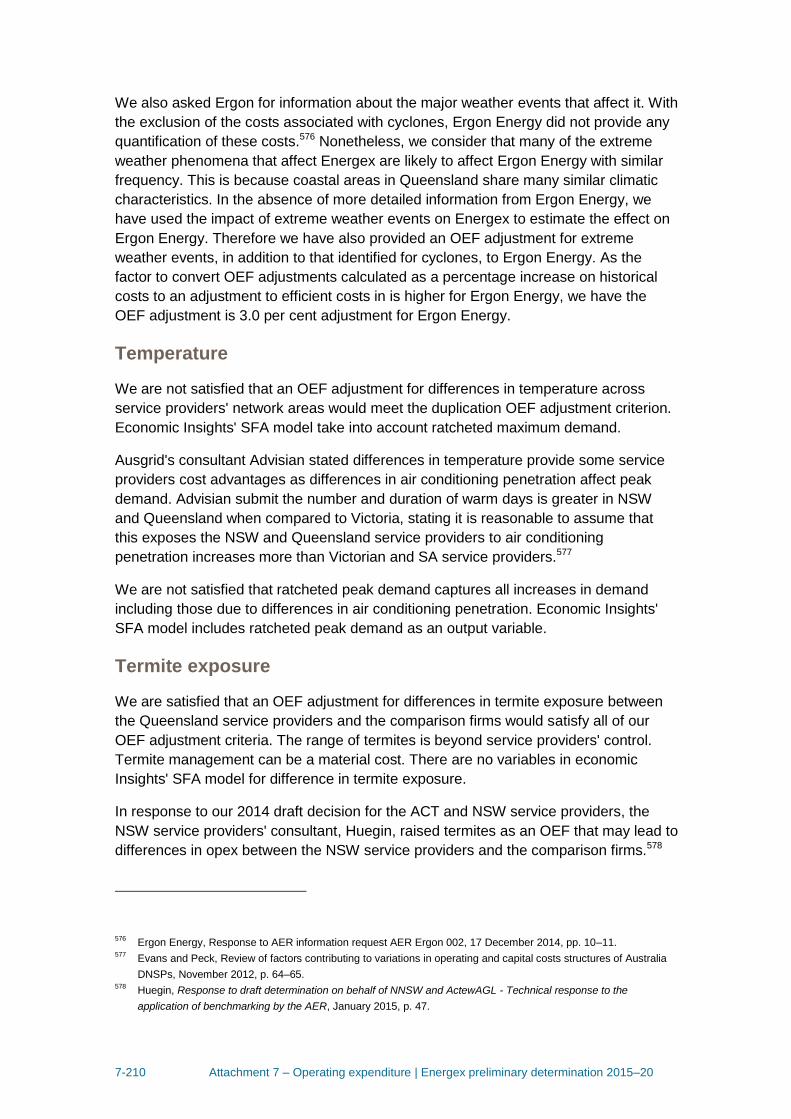
7-210 Attachment 7 – Operating expenditure | Energex preliminary determination 2015–20
We also asked Ergon for information about the major weather events that affect it. With
the exclusion of the costs associated with cyclones, Ergon Energy did not provide any
quantification of these costs.576 Nonetheless, we consider that many of the extreme
weather phenomena that affect Energex are likely to affect Ergon Energy with similar
frequency. This is because coastal areas in Queensland share many similar climatic
characteristics. In the absence of more detailed information from Ergon Energy, we
have used the impact of extreme weather events on Energex to estimate the effect on
Ergon Energy. Therefore we have also provided an OEF adjustment for extreme
weather events, in addition to that identified for cyclones, to Ergon Energy. As the
factor to convert OEF adjustments calculated as a percentage increase on historical
costs to an adjustment to efficient costs in is higher for Ergon Energy, we have the
OEF adjustment is 3.0 per cent adjustment for Ergon Energy.
Temperature
We are not satisfied that an OEF adjustment for differences in temperature across
service providers' network areas would meet the duplication OEF adjustment criterion.
Economic Insights' SFA model take into account ratcheted maximum demand.
Ausgrid's consultant Advisian stated differences in temperature provide some service
providers cost advantages as differences in air conditioning penetration affect peak
demand. Advisian submit the number and duration of warm days is greater in NSW
and Queensland when compared to Victoria, stating it is reasonable to assume that
this exposes the NSW and Queensland service providers to air conditioning
penetration increases more than Victorian and SA service providers.577
We are not satisfied that ratcheted peak demand captures all increases in demand
including those due to differences in air conditioning penetration. Economic Insights'
SFA model includes ratcheted peak demand as an output variable.
Termite exposure
We are satisfied that an OEF adjustment for differences in termite exposure between
the Queensland service providers and the comparison firms would satisfy all of our
OEF adjustment criteria. The range of termites is beyond service providers' control.
Termite management can be a material cost. There are no variables in economic
Insights' SFA model for difference in termite exposure.
In response to our 2014 draft decision for the ACT and NSW service providers, the
NSW service providers' consultant, Huegin, raised termites as an OEF that may lead to
differences in opex between the NSW service providers and the comparison firms.578
576
Ergon Energy, Response to AER information request AER Ergon 002, 17 December 2014, pp. 10–11. 577
Evans and Peck, Review of factors contributing to variations in operating and capital costs structures of Australia
DNSPs, November 2012, p. 64–65. 578
Huegin, Response to draft determination on behalf of NNSW and ActewAGL - Technical response to the
application of benchmarking by the AER, January 2015, p. 47.
7-211 Attachment 7 – Operating expenditure | Energex preliminary determination 2015–20
Ergon Energy also raised this point in its regulatory proposal.579 Both Huegin and
Ergon Energy submitted different maps to substantiate their claims. Both broadly show
that Southern and Eastern Victoria are low risk, North Western Victoria and NSW are
moderate risk, and coastal Queensland is high risk. It is not clear what the source of
the data behind these maps is.
The CSIRO has published a similar map,580 based on surveys of the incidence of
termites and termite infestations of dwellings across Australia. It is shown below in
Figure A.36.
Figure A.36 CSIRO Termite Hazard Map of Australia
In its 2011 regulatory proposal, Powercor requested a step change for increased
expenditure on treating termite infested poles. Powercor forecast that over the 2011 to
2015 period its average annual expenditure on termite management would be $0.3
million ($2010) per year.581 Using this figure in conjunction with data from Powercor's
response to the Category Analysis RIN, this indicates that the average cost of termite
579
Ergon Energy, Regulatory Proposal: Attachment 0A.01.01, pp. 15–16. 580
Cookson, L.J. and Trajstman, A.C., Termite Survey and Hazard Mapping, June 2002, p. 34. 581
AECOM, Climate change impact assessment on Powercor Australia for 2011–2015 EDPR, 30 September 2009,
pp. 70–75.

7-212 Attachment 7 – Operating expenditure | Energex preliminary determination 2015–20
treatment per wooden pole for Powercor is around $1 per annum ($2014/15). Ergon
Energy also provided some information that showed the average opex for responding
to asset failures caused by termites was 22.7 per cent of the cost of treating infested
poles for the 2011/12 to 2013/14 period.582 Therefore we estimate that the average
total cost of treating infested poles and responding to termite induced asset failures is
$1.23 ($2014/15) per wooden pole for Powercor.583
We estimated termite management costs per pole for the Queensland service
providers and the comparison firms. We multiplied the unit cost of treatment for
Powercor by different rates, depending on the location of the relevant firm and
infestation rates from the CSIRO.584 585 This was to account for differences in
infestation rates across service areas.
We estimate that Energex and Ergon Energy would spend $1.7 ($2014/15) more per
pole than the customer weighted average of the comparison firms for termite
management. Multiplying the marginal termite management cost per wooden pole by
the number of wooden poles for each service provider,586 provides an estimate of the
value of the cost disadvantage. The annual disadvantage is $0.7 million and $1.6
million ($2014/15) for Energex and Ergon respectively. Adding these figure to the
efficient opex, determined by the SFA model, suggests a 0.2 per cent, and 0.5 per cent
cost disadvantage for Energex and Ergon Energy respectively.
Although the effect of termites on Energex's opex is immaterial, in accordance with our
approach to quantifying immaterial OEFs, we will provide an OEF adjustment that
reflects the quantified impact.
As a result we consider that OEF adjustments of 0.2 per cent and 0.5 per cent for
Energex and Ergon respectively are appropriate.
Topographical conditions
We are not satisfied that an OEF adjustment for topographical conditions would meet
the materiality OEF adjustment criterion. All service providers are likely to have areas
where topography adversely affects costs.
Advisian, in a report commissioned by Ausgrid in support of its 2014 regulatory
proposal, stated that service providers in NSW and Victoria have a natural cost
advantage due to the topography of those regions.587 They do not explain why they
582
Ergon Energy, Response to AER Information Request AER ERG 018(4), 6 February 2015, p. 2. 583
1.23=1*1.227 584
Cookson, L. J. and Trajstman, A. C., Termite Survey and Hazard Mapping, June 2002, pp. 6 and 29. 585
We assumed the Queensland service providers, AusNet, CitiPower, and UED were respectively 204 per cent,
93 per cent, 42 per cent, and 52 per cent as likely to be affected by termites as Powercor. These are based on
incidence rates from Cookson and Trajstman's termite survey. 586
The number of wooden poles for each service provider was taken from the category analysis RIN responses. 587
Evans and Peck, Review of factors contributing to variations in operating and capital costs structures of Australia
DNSPs, November 2012, p. 41.
7-213 Attachment 7 – Operating expenditure | Energex preliminary determination 2015–20
consider this is the case for NSW, but they do mention that the major population
centres of Victoria are flat with little vegetation. Advisian provided three maps that use
different scales to support this. The AEMC also raised topography as an exogenous
factor that may affect benchmarking. 588
Adverse topographical conditions may affect some NEM service providers. For
example, the Great Dividing Range runs through some distribution network areas.
Operating in mountainous regions may lead to higher costs in some operating areas
such as maintenance, emergency response, and vegetation management due to
access issues, even if this is not likely to be a material cost. We note that AusNet
Services, the comparison service provider at the benchmark comparison point, has a
more mountainous operating environment than the Queensland service providers.
However, most of the comparison service providers operate in a relatively flat area
compared to Queensland service providers. Therefore, the Queensland service
providers may have a cost disadvantage relative to the comparison service providers
due to topography.
We are not satisfied that an adjustment for topographical conditions meets the
materiality OEF adjustment criterion. Many service providers are likely to be affected
by topography to some extent. Further, no service provider has provided any evidence
of the quantum of the cost advantage that operating in relatively flat terrain may afford.
However, in accordance with our treatment of immaterial OEFs we have provided a
positive 0.5 per cent adjustment for differences in topography. An adjustment for
topography would satisfy the exogeneity and duplication OEF criteria. The landforms in
service providers' network areas are beyond their control and there is no variable in
Economic Insights' SFA model to account for differences in topography. We have
provided a positive 0.5 per cent adjustment because it is unclear if differences in
topography will lead to a cost disadvantage for the Queensland service providers
relative to the comparison firms.
A.6.6 Jurisdictional factors
Building regulations
We are not satisfied an OEF adjustment for differences in building regulations across
jurisdictions would meet the materiality OEF adjustment criterion. The Building Code of
Australia (BCA) provides a set of nationally consistent, minimum necessary standards
of relevant safety (including structural safety and safety from fire), health, amenity and
sustainability objectives for buildings and construction.589
588
AEMC, Rule determination: National Electricity Amendment (Economic Regulation of Network Service Providers),
November 2012, p. 113. 589
ABCB, The Building Code of Australia, available at; www.abcb.gov.au/about-the-australian-building-codes-board .
[last accessed 4 September 2014].
7-214 Attachment 7 – Operating expenditure | Energex preliminary determination 2015–20
In support of Ausgrid's 2014 Regulatory Proposal, Advisian identified differences in
building regulations as an OEF that may affect benchmarking results.590 Advisian do
not provide any explanation as to how this may impede like for like comparisons.
The Australian Building Codes Board (ABCB) is a Council of Australian Government
standards writing body that is responsible for the National Construction Code (NCC)
that comprises the BCA and the Plumbing Code of Australia (PCA). It is a joint initiative
of all three levels of government in Australia and was established by an
intergovernment agreement (IGA) signed by the Commonwealth, States and Territories
on 1 March 1994. Ministers signed a new IGA, with effect from 30 April 2012.591 The
BCA contains technical provisions for the design and construction of buildings and
other structures, covering such matters as structure, fire resistance, access and
egress, services and equipment, and energy efficiency as well as certain aspects of
health and amenity.592
We are not satisfied that an OEF adjustment for differences in building regulations is
necessary because there will not be material differences in opex between service
providers in different jurisdictions due to consistent building regulations. However as
there may be some slight differences in the application and enforcement of the
regulations across jurisdictions.
Therefore in accordance with our treatment of immaterial OEFs we have provided a
positive 0.5 per cent adjustment for differences in building regulations. Although
immaterial, an adjustment for differences in building regulations would satisfy the
exogeneity and duplication OEF adjustment criteria. Building regulations are not
determined by service providers and there are no variables in Economic Insights' SFA
model that account for differences in them.
Capital contributions
We are not satisfied that an OEF adjustment for differences in capital contribution
policies meets the duplication OEF adjustment criterion. Economic Insights' SFA model
uses network services data, which exclude services for which capital contributions are
payable.
In support of Ausgrid's regulatory proposal, Advisian stated differences in capital
contribution policies may affect benchmarking of service providers.593 Advisian stated
that differences in capital contributions policies make it difficult to draw any conclusions
on the effect of capital contributions on different service providers.
590
Evans and Peck, Review of factors contributing to variations in operating and capital costs structures of Australian
service providers, November 2012, p. 5. 591
ABCB, About the Australian Building Codes Board, available at; www.abcb.gov.au/about-the-australian-building-
codes-board . [last accessed 4 September 2014]. 592
ABCB, The Building Code of Australia, available at; http://www.abcb.gov.au/about-the-australian-building-codes-
board, [last accessed 22 March 2015]. 593
Evans and Peck, Review of factors contributing to variations in operating and capital costs structures of Australia
DNSPs, November 2012, p. 31–32.
7-215 Attachment 7 – Operating expenditure | Energex preliminary determination 2015–20
We are not satisfied that differences in capital contribution policies affect the data used
in Economic Insights' SFA model. Therefore, an adjustment for differences in capital
contribution policies does not meet the duplication OEF adjustment criterion. Users will
make a capital contribution when they connect to the network, depending on the type
of connection, or require a change to their connection. New connections and changes
to connections are connection services for the purpose of our economic benchmarking
RIN.594 Network services do not include connection services in our economic
benchmarking RIN.595 Because the data that is used in Economic Insights' SFA model
exclude connection services, capital contributions cannot affect the results of the
benchmarking.
Contestable services
We are not satisfied that an OEF adjustment for differences in contestable services
across jurisdictions would meet the duplication OEF adjustment criterion. Economic
Insights' SFA model only uses costs incurred in providing network services. Network
services do not include contestable services.
In their 2014 regulatory proposals Ausgrid, Endeavour, and Essential all raised
contestability of services as an OEF that will affect benchmarking results.596 597 598
Beyond saying that they 'play a major part in explaining differentials in cost structures'
none of the NSW service providers gave any explanation of how differences in markets
for contestable services would affect benchmarking.
Economic Insights' SFA model only includes costs incurred in providing network
services. Contestable services are not included in network services. Because we have
excluded contestable services from network services data, contestable services cannot
affect benchmarking that uses network services data.
Cultural heritage
We are not satisfied that an OEF adjustment for differences in cultural heritage
management across jurisdictions would meet the materiality OEF adjustment criterion.
We do not see evidence to suggest that differences in cultural heritage management
requirements would lead to material differences in opex.
In response to questions from the AER on the OEFs that materially affect its costs,
Ergon Energy submitted that cultural heritage obligations impose additional
594
AER, Economic Benchmarking RIN for distribution service providers: Instructions and Definitions, November 2013,
p. 44. 595
AER, Economic Benchmarking RIN for distribution service providers: Instructions and Definitions, November 2013,
p. 44. 596
Ausgrid, Attachment 5.33 to Revenue proposal, p. 3. 597
Endeavour, Attachment 0.12 to Revenue proposal, p. 3. 598
Essential Attachment 5.4 to Revenue proposal, p. 5.
7-216 Attachment 7 – Operating expenditure | Energex preliminary determination 2015–20
management and operational costs on it.599 Specifically Ergon Energy identified staff
training and awareness, special alert and management processes and additional
operational precautions for native title cultural heritage. Ergon Energy provided a map
showing areas where native title has been found to exist and where claims have been
made. Ergon Energy did not quantify the costs it incurs for its native title or other
cultural heritage programs.
Many service providers have cultural heritage obligations. For example, the Victorian
service providers most comply with the Planning and Environment Act 1987, the
Heritage Act 1995, and the Aboriginal Heritage Act 2006 in providing services. The
Queensland service providers have not provided evidence to suggest the costs they
incur to meet their obligations will be materially different to comparison firms.
Therefore we are not satisfied that differences in cultural heritage obligations will lead
to material differences in opex between the Queensland service providers and the
comparison firms. However, there is likely to be some differences in obligations that
will lead to immaterial differences in opex. An adjustment for differences in cultural
heritage obligations would also satisfy the exogeneity and duplication OEF adjustment
criteria. Cultural heritage obligations are not determined by service providers and there
are no variables in Economic Insights' SFA model that account for differences in them.
As the direction of cost advantage is unclear, we have included an adjustment of
positive 0.5 per cent for differences in cultural heritage obligations in our adjustment for
immaterial factors.
Division of vegetation management responsibility
We are satisfied that it is necessary to provide an OEF adjustment for the division of
responsibility for vegetation management. An OEF for the division of responsibility
between the Queensland service providers and the comparison firms satisfies all three
of our OEF adjustment criteria. The division of responsibility for vegetation
management is determined by state governments. It is likely to lead to a material
difference in costs between the Queensland service providers and the comparison
firms. Also, Economic Insights' models do not have any variables that account for
differences in the division of vegetation management responsibility.
ActewAGL,600 Ausgrid,601 Endeavour Energy,602 Ergon Energy,603 604and Essential
Energy,605 have all raised the division of responsibility for vegetation management as a
factor that may affect benchmarking results. For example in Queensland, service
599
Ergon Energy, Response to AER information request Ergon 002, 17 December 2014, p. 7–9 600
ActewAGL, Revised Proposal, 20 January 2015, p. 199. 601
Ausgrid, Revised Proposal, 20 January 2015, p. 149. 602
Endeavour Energy Revised Proposal, 20 January 2015, p. 176. 603
Ergon Energy, Response to information request Ergon 002, 19 12 2014, p. 21. 604
Ergon Energy, Submissions on the Draft Decisions: NSW and ACT distributions 2015–16 to 2018–19, 13 February
2015, p. 19. 605
Essential Energy, Revised Proposal, 20 January 2015, p. 189.
7-217 Attachment 7 – Operating expenditure | Energex preliminary determination 2015–20
providers are responsible for vegetation clearance from all network assets.606 607 In
others states other parties, notably councils and roads authorities, are responsible for
some vegetation clearance. As a result some service providers must undertake
additional vegetation management in the provision of network services.
Overall, we are satisfied that differences in the division of responsibility for vegetation
management are likely to lead to material differences in opex between the Queensland
service providers and the comparison firms. Service providers in Victoria and South
Australia share responsibility for vegetation management of their networks with other
parties, while the Queensland service providers do not.
Section 216 of the Electricity Safety Regulation 2013 requires the Queensland service
providers to keep vegetation from all overhead lines that form part of their networks.
In Victoria, Sections 84A to 84D of the Electricity Safety Act 1998 set out the division of
responsibility for vegetation management between service providers and other
parties.608 609 610 Landholders are responsible for vegetation management of any lines
that exclusively service their property. Councils are responsible for vegetation
management of any trees on public land in a declared area.611 Service providers are
responsible for vegetation management of all other trees that encroach on their
network.
In South Australia, Part 5 of the Electricity Act 1996 (SA) and the Electricity (Principles
of Vegetation Clearance) Regulations 2010 set out the division of responsibility for
vegetation management between service providers and other parties.612 Under this
legislation SA Power Networks is responsible for clearance of all lines with three
exceptions. SA Power Networks is not responsible where it has entered into a
vegetation clearance scheme with a council under section 55(1a) of the Electricity Act
1996 (SA). There are no such agreements with councils currently in place.613 SA
Power Networks is not responsible for clearance of cultivated vegetation from private
powerlines. 614 SA Power Networks is also not responsible for clearing trees
encroaching on powerlines where the tree was planted in contravention of the
(Principles of Vegetation Clearance) Regulations 2010 schedule 2.615
606
Ergon Energy, Response to information request AER Ergon 026(1), 13 February 2015, p. 4. 607
Energex, Response to information request AER Energex 021, 13 February, p. 3. 608
CitiPower and Powercor, Response to information request on vegetation management responsibility, 17 February
2015, p. 2. 609
Jemena, Response to information request on vegetation management responsibility, 13 February 2015, p. 1. 610
AusNet Services, Response to information request on vegetation management responsibility, 16 February 2015,
p. 1. 611
Declared areas are urban areas where the local council has responsibility for vegetation management as declared
under section 81 of the Electricity Safety Act 1998 by the Governor in Council. 612
SA Power Networks, Response to information request AER SAPN 021, 13 February 2015, p. 1. 613
SA Power Networks, Response to information request AER SAPN 021, 13 February 2015, p. 1. 614
SA Power Networks, Response to information request AER SAPN 021, 13 February 2015, p. 1. 615
Electricity Act 1996 (SA), subsection 55(3).
7-218 Attachment 7 – Operating expenditure | Energex preliminary determination 2015–20
We are satisfied that differences in the division of responsibility for vegetation
management in Victoria, South Australia and Queensland will lead to material
differences in opex between the Queensland service providers and comparison firms.
The comparison firms all share responsibility for vegetation management with other
parties. The Queensland service providers do not.
To quantify the effect that differences in the division of vegetation management may
have, we have used two sources of information. We used the 2014 Electric Line
Clearance regulatory impact statement and information gathered from the comparison
firms, and the Queensland service providers RIN data.
The 2014 Electric Line Clearance regulatory impact statement provides some
information on the division of vegetation management costs between service providers
and councils in Victoria.616 Information from the regulatory impact statement suggests
that the Councils are responsible for 24 per cent of electricity distribution and
transmission vegetation management costs in Victoria. We asked the Victorian service
providers to provide information on what percentage of their networks councils and
other parties have responsibility for vegetation management. Of the comparison firms,
only AusNet services provided an estimate of the length of its network that councils
have responsibility for vegetation management.617 618 619 The reason for this is that
often service providers and councils will be responsible for vegetation management of
different trees on the same span. This made it difficult for some Victorian comparison
firms to estimate what percentage of their network other parties are responsible for.
However, AusNet services indicated that it shared responsibility for vegetation
management with councils for 12 per cent of its overhead route line length.
On this information, councils would appear to be responsible for somewhere between
24 per cent and 12 per cent of vegetation management in Victoria. For the purpose of
estimating the opex impact created by differences in the division of responsibility for
vegetation management, we have assumed that councils are responsible for
18 per cent of vegetation management in Victoria. We have taken the midpoint of the
two figures available to us. We consider that it is likely that councils will have higher
vegetation management costs than network service providers. Councils will have
different vegetation management objectives to service providers. In general, councils
will be more concerned with maintaining the visual amenity of trees and less
concerned with minimising costs than service providers. This is likely to increase the
costs of their vegetation management programs relative to the comparison firms.
616
Energy Safe Victoria, Regulatory Impact Statement: Electricity Safety (Electric Line Clearance) Regulations 2015,
September 2014, p. 51. 617
AusNet Services, Response to AER information request on division of responsibility for vegetation management in
Victoria, 16 February 2015, pp. 2–3. 618
United Energy, Response to AER information request on division of responsibility for vegetation management in
Victoria, 20 February 2015. 619
CitiPower/Powercor, Response to AER information request on division of responsibility for vegetation management
in Victoria, 17 February 2015.
7-219 Attachment 7 – Operating expenditure | Energex preliminary determination 2015–20
We have assumed that councils in SA are responsible for a similar amount of
vegetation management as their Victorian Counterparts. This is because other parties
should be responsible for some vegetation management under Part 5 of the Electricity
Act 1996.
As a result we consider that an OEF adjustment of 3.4 per cent and 4.1 per cent is
appropriate for Energex and Ergon Energy respectively. This is because the
percentage of network services opex that vegetation management accounts for is 15
and 16 per cent for Energex and Ergon Energy respectively. If roughly 18 per cent of
the Queensland service providers' vegetation management was undertaken by
councils, Energex and Ergon's opex would be 2.8 and 3 per cent lower than they are
currently. As these figures are increases on historical opex, as described in the
calculation of OEFs section above, they must be adjusted before they can be used as
OEF adjustments to the efficient base year opex forecast by the SFA model. After
adjustment, the division of responsibility for vegetation management OEF represents
an increase on the efficient level of base opex of 3.4 per cent and 4.1 per cent
respectively for Energex and Ergon Energy.
Environmental regulations
We are not satisfied that an OEF adjustment for differences in environmental
regulations across jurisdictions would meet the materiality OEF adjustment criterion.
Environmental regulations are not likely to create material differences in costs between
the Queensland service providers and the comparison firms.
Ergon Energy and Energex submitted that differences in environmental regulations
would lead to material differences in opex.620 621
We investigated how environmental regulations may lead to material differences for the
opex that service providers require, but were unable to find any reliable evidence that
such differences exist. The way various jurisdictions administer environmental
regulation varies considerably.622 While the Commonwealth has some involvement,
most environmental planning functions are carried out by state or local governments.
We consider it is likely that differences in environmental regulations faced by service
providers will lead to differences in costs, but we do not have any evidence to suggest
that these differences are material.
While we are not satisfied that an adjustment for environmental regulation would not
lead to material differences in opex, we have included this factor as part of the
allowance for immaterial OEFs. An OEF adjustment for environmental obligations
would satisfy the exogeneity and duplication OEF criteria. Environmental obligations
are not determined by service providers and Economic Insights' SFA model does not
620
Ergon Energy, Response to AER information request AER Ergon 002, 17 December 2015, pp. 7 – 9. 621
Energex, Response to AER information request AER Energex 001, 17 December 2014, pp. 2–4. 622
Productivity Commission, Performance Benchmarking of Australian Business Regulation: Local Government as
Regulator, July 2012, p. 386–390.

7-220 Attachment 7 – Operating expenditure | Energex preliminary determination 2015–20
include any variables that account for differences in them. We have provided a positive
0.5 per cent OEF in our collective adjustment for immaterial OEFs because it is unclear
if environmental obligations will lead to a cost advantage or disadvantage to Ergon
Energy and Energex.
Occupational Health and Safety regulations
We are satisfied that it is necessary to provide the Queensland service providers with a
positive 0.5 per cent OEF adjustment for differences in Occupational Health and Safety
Regulations (OH&S). This is because an OEF adjustment for OH&S regulations
satisfies all three OEF criteria. OH&S regulations are outside of the control of service
providers. Differences in OH&S regulation are likely to create material differences in
opex between the Queensland service providers and the comparison firms. Economic
Insights' SFA model does not account for differences in OH&S regulations.
In support of Ausgrid's 2104 Regulatory Proposal, Evans and Peck identified
differences in OH&S regulations as an OEF that may affect benchmarking results.623
Evans and Peck did not provide any explanation as to how this may impede like for like
comparisons
In the NEM, all jurisdictions, except Victoria, have enacted the Work Health and Safety
Act and Work Health and Safety Regulations.624 While enforcement activities may vary
slightly across jurisdictions the main cost driver of OH&S costs will be the regulations
and law with which businesses must comply. In this respect, we are satisfied that there
will not be material cost differences between jurisdictions that have enacted the model
laws. However, there is likely to be a cost differential between service providers in
Victoria and those in other jurisdictions. Because the comparison firms are
predominantly Victorian, this is likely to likely to lead to cost differentials between the
comparison firms and the Queensland service providers.
We are satisfied that a positive 0.5 per cent OEF adjustment for the Queensland
service providers is appropriate. The Victorian state government employed
PricewaterhouseCoopers (PwC) to estimate the costs of implementing the new OH&S
laws would impose on commerce in Victoria. According to PwC, the annual impost of
the implementing the laws would be up to $796 million ($2011–12).625 The Gross State
Product for Victoria in FY 2012 was $328 595 million ($2011–12).626
This would mean that the impact of complying with the new OH&S laws on the
Victorian economy would be equivalent to 0.24 per cent of Gross State Product.
623
Evans and Peck, Review of factors contributing to variations in operating and capital costs structures of Australian
service providers, November 2012, p. 38. 624
Safework Australia, Jurisdictional progress on the model work health and safety laws, available at:
thehttp://www.safeworkaustralia.gov.au/sites/swa/model-whs-laws/pages/jurisdictional-progress-whs-laws. [last
accessed 4 September 2014] 625
PricewaterhouseCoopers, Impact of the Proposed National Model Health Work and Safety Laws in Victoria, April
2012, p.7. 626
ABS, 5220.0 - Australian National Accounts: State Accounts, 2011-12, November 2012.

7-221 Attachment 7 – Operating expenditure | Energex preliminary determination 2015–20
Electricity distribution work environments may present more danger than the average
work environment across the economy. With this in mind, a 0.24 per cent adjustment
may underrepresent the potential cost advantage for Victorian Electricity distribution
businesses. The PwC report suggests that the annualised ongoing costs for power
generators would be almost two and a half times greater than for the majority of other
businesses.627
Therefore, we have assumed that an electricity service provider would face two and a
half as many costs due to a change in OH&S laws compared to the average of the
Victorian economy. This suggests that relative to a Victorian service provider, service
providers in other NEM jurisdictions require 0.6 per cent more opex. When this is
weighted by the proportion of customers Victorian service providers have of the
comparison firms, this leads to a 0.5 per cent adjustment.628
Ergon Energy's consultant, PwC, made a submission on our OEF adjustment for
differences in jurisdictional OH&S differences.629 PwC made four observations on our
application of its findings to estimate an OEF adjustment for differences in OH&S
obligations. PwC stated its report on the impact of the WHS laws only considered the
potential costs borne by Victorian businesses. It stated that the total cost of complying
with the new WHS laws was not considered. It stated that its findings do not directly
reflect costs facing network service providers. It also considered normalising the
annualised cost by Victoria's Gross State Product (GSP) could be misleading. We
address each of these comments below.
The OEF adjustment for OH&S obligations is designed to quantify the effect of the cost
advantage that the Victorian service providers have over other service providers. As
the report estimates the cost of transitioning to the WHS laws for Victoria, it provides
an estimate of the cost avoided by Victorian businesses by not having to comply with
the WHS laws. We also note that PwC has provided no evidence that the costs of
complying with the WHS laws would be different in Queensland than Victoria.
It is not appropriate to consider the total cost of complying with and implementing the
WHS laws for the purpose of an OEF adjustment. OEF adjustments are not required
for non-recurrent costs. Providing an OEF for non-recurrent costs treats those costs as
if they were recurrent. Economic Insights' benchmarking results are used as the basis
for our forecast of opex. If we adjust the benchmarking results with an OEF adjustment
for non-recurrent costs, it has the effect of including those non-recurrent costs in our
forecast of opex. Essentially, providing an OEF adjustment for non-recurrent costs
627
PricewaterhouseCoopers, Impact of the Proposed National Model Health Work and Safety Laws in Victoria, April
2012, p. 9. 628
We note that we have not provided a step change to Transgrid for the change in Work Health and Safety
legislation. We note that although the change from the NSW laws to the model laws may not be material it appears
that the change from the Victorian laws to the model laws may be. 629
PricewaterhouseCoopers, Review of AER's methodology of adjusting for differences in occupational health and
safety obligations, 12 February 2015.
7-222 Attachment 7 – Operating expenditure | Energex preliminary determination 2015–20
leads to those costs being treated as recurrent costs. This is not appropriate because it
would provide an allowance for costs that will not be incurred.
The challenges in safely operating high voltage assets that network service providers
must take into account will be similar to those that power generators face. Although
PwC's report's findings show that the costs of adopting the laws are not uniformly
distributed across Victorian businesses we have taken steps to account for this. We
adjusted the average impact across the Victorian economy to reflect the observed
differences between most firms surveyed and the business type that most resembled
the network service providers: power generators. We note that network service
providers are likely to incur higher costs for OH&S obligations than power generators
due to their scale. This is why we adopted a percentage adjustment, calculated using
the average cost to the Victorian economy, 630 rather than the average annualised cost
per power generator, which was only $5,210 ($2011-12). PwC did not propose an
alternative method to account for differences between the stage average and network
service providers.
Using Victorian Gross State Product (GSP) to estimate the materiality of regulatory
changes within Victoria is appropriate. Volatility in growth rates across states will not
affect this. We estimated the percentage of goods and services produced in Victoria
that the annualised increase in OH&S costs would have accounted for if they were
incurred in 2012. The estimate of GSP used was from 2012. The estimates of
compliance costs which formed the basis for PwC's report were also from financial
year 2012. Because we are comparing two figures that relate to the same state,
variability between states will not affect the comparison.
Licence conditions
We are satisfied that it is necessary to provide an OEF adjustment for differences in
licence conditions across jurisdictions for Ergon Energy. The adjustment is positive
0.7 per cent. An OEF adjustment for differences in licence conditions meets all of our
OEF adjustment criteria. Past licence conditions are likely to materially affect opex,
because they mandated that the Queensland service providers install significant
redundant capacity they may not have in the absence of those conditions. Economic
Insight's SFA model will only account for feeders installed to meet those standards, not
substation capacity. On the basis of the Economic Benchmarking RIN and Category
Analysis RIN data the effect on opex of the past licence conditions is greater than
0.5 per cent of opex for Ergon Energy, but not for Energex.
630
The annual costs forecast by PwC for the implementation of the new OH&S laws were equivalent to 0.24 per cent
of the Gross State Product of Victoria in financial year 2012. Because electricity distribution work environments
may present more danger than the average work environment across the economy we multiplied this amount by
2.5. The PwC report suggests that the annualised ongoing costs for power generators would be almost two and a
half times greater than for the majority of other businesses. This suggests that the Victorian service providers have
a 0.6 per cent cost advantage relative to the other NEM service providers. However, as SA Power Networks
accounts for 21 per cent of the comparison firm's customers, the customer weighted average cost advantage the
comparison firms have is 0.5 per cent.
7-223 Attachment 7 – Operating expenditure | Energex preliminary determination 2015–20
In response to our November 2014 draft decisions for the ACT and NSW service
providers, ActewAGL and the NSW service providers' consultant Advisian noted that
the number of assets that a service provider uses to operate its network will drive its
operating costs.631 632 In particular, Advisian raised the effect of assets installed for the
purpose of compliance with planning standards in schedule 1 of the 2005 and 2007
NSW licence conditions.
We note that from financial year 2005633 to financial year 2012634 635 the Queensland
service providers were required to meet N-1 reliability standards on bulk supply
substations and zone substations. Energex was also required to have N-1 redundancy
on sub-transmission feeders.
We consider capital investment to meet jurisdictional planning requirements may
warrant an OEF adjustment. This is because the planning requirements are
determined by parties beyond service providers' control. Therefore it satisfies the
exogeneity OEF. It is also not accounted for in the ratcheted demand variable in
Economic Insights' SFA model. This is because it required the Queensland service
providers to install transformer capacity that was not required to meet peak demand.
We also consider that an OEF adjustment for capex to meet planning requirements is
not sufficiently captured by the variables in the SFA model. While expenditure on
feeder redundancy will be captured by the circuit length variable, not all expenditure in
transformer capacity redundancy is captured by the ratcheted maximum demand
variable. Circuit length captures the effect of investment in new feeders because each
new feeder installed will increase the circuit length variable. This in turn will increase
the opex forecast by Economic Insights SFA model. However, increases in transformer
capacity do not increase the ratcheted demand variable. As a result, the SFA model
will forecast no change in required opex where there is an increase in transformer
capacity that is not made in response to an increase in demand.
We have estimated the impact of the increased transformer capacity required to meet
the 2004/05 planning requirements using the Economic Benchmarking and Category
Analysis RIN responses. The Economic Benchmarking RIN responses provide data on
the amount of transformer capacity at the subtransmission and zone substation level.
The Category Analysis RIN provides some indication of the amount of expenditure that
is related to maintaining those assets. Both the RINs provide information at the zone
substation level. We have estimated the share of opex attributable to subtransmission
substation maintenance using data from Ausgrid's category analysis RIN responses.
631
Advisian, Review of AER benchmarking: Networks NSW, 16 January 2015, pp. 41 –46. 632
Advisian, Opex Cost Drivers: ActewAGL Distribution Electricity (ACT), 16 January 2015, p. 50. 633
Blanch, S. Camp, J. and Sommerville, D., Electricity Network Capital Program Review 2011: Detailed report of the
independent panel, 2011, p. 28. 634
Direction Notice issued to Energex by the Queensland Government under section 115 of the Government Owned
Corporations Act 1993 (Qld), February 2012. 635
Direction Notice issued to Ergon Energy by the Queensland Government under section 115 of the Government
Owned Corporations Act 1993 (Qld). February 2012.
7-224 Attachment 7 – Operating expenditure | Energex preliminary determination 2015–20
This is because Ausgrid provides data on the costs associated with its dual function
assets and its single function assets separately. Neither Ergon Energy nor Energex
have any assets classified as dual function.
To estimate the increase in transformer capacity due to the planning standards for
each service provider, we have used the percentage increase in transformer capacity
less the percentage increase in ratcheted maximum demand over the 2006 to 2013
period. The Economic Benchmarking RIN data indicate that after accounting for
increases in demand, Energex and Ergon Energy's subtransmission and zone
substation transformer capacities increased by -4 per cent and 15 per cent
respectively. We note that this indicates that Energex was able to use previously
existing capacity to absorb some of the increase in demand its network experienced
over the benchmarking period.
To estimate the percentage of opex the Queensland service providers expend on zone
substation transformer maintenance, we used data from the Category Analysis RIN.
Specifically, we used the amounts the Queensland service providers allocated to zone
substation maintenance in response to template 2.7 of the Category Analysis RINs. In
financial year 2014 Energex and Ergon Energy reported that zone substation
maintenance made up 2.4, and 3.8 per cent of opex respectively. To estimate the
impact of subtransmission maintenance, we found what percentage zone substation
maintenance was of total maintenance (29 per cent) for Ausgrid and applied this
percentage to Ausgrid's dual function asset maintenance opex. This results in an
estimate of 0.3 per cent of opex being attributable to subtransmission substation
maintenance.
This suggests that the amount of opex required to maintain the mandated transformer
capacity is -0.1 per cent ([1-{1/0.96}] x 2.7), 0.5 per cent ([1-{1/1.15}]x4.1) of historical
opex for Energex and Ergon Energy respectively. These percentages represent
increases on historical costs. As described in our section on the calculation of OEFs,
these percentages must be adjusted before they can be used as an OEF adjustment to
the efficient base year costs forecast by the SFA model. When adjusted these figures
imply a -0.1 and 0.7 per cent adjustment to the efficient base level of opex for Energex
and Ergon Energy respectively. Therefore an OEF adjustment for transformer capacity
installed to meet the 2004/05 planning standards satisfies the materiality OEF
adjustment criterion for Ergon Energy. We note that the calculated adjustment for
Energex is negative because demand rose faster than Energex's zone substation
transformer capacity. As the n-1 requirements would not have decreased Energex's
opex, we have assumed that the adjustment for Energex should be zero rather than
negative 0.1 per cent.
Mining boom cost impacts
We are not satisfied that an OEF adjustment for differences in in the impact of the
mining boom between service providers meets the materiality OEF adjustment
criterion. Localised shocks to accommodation costs are not likely to be material at the
total opex level.
7-225 Attachment 7 – Operating expenditure | Energex preliminary determination 2015–20
Ergon Energy stated that it considers that the mining boom has increased its labour
costs and accommodation costs in remote areas near mines.636 Ergon Energy did not
quantify the effect of the mining boom on its labour or accommodation costs. We have
considered differences in work conditions in the endogenous factors section above.
We are not satisfied that increased accommodation costs in remote communities
situated near mines will lead to material increases in opex. This is because the areas
affected are likely to only represent a small part of Ergon Energy's network. We also
note that this disadvantage is likely to decrease during the forecast period as the
mining boom enters its second phase. Nonetheless, Ergon Energy is likely to have
some cost disadvantage due to the impact of the mining boom on remote communities.
An adjustment for the effects of the mining boom would satisfy the exogeneity and
duplication OEF adjustment criteria. The mining boom was caused by global economic
forces beyond the control of service providers' control and there is no variable in
Economic Insights' SFA model that accounts for differences in the effects of the mining
boom. As a result the effect of the mining boom on accommodation costs in remote
communities contributes 0.5 percentage points to the OEF adjustment for immaterial
factors for Ergon Energy.
Planning regulations
We are not satisfied that an OEF adjustment for differences in planning regulations
across jurisdictions would meet the materiality OEF adjustment criterion. Differences in
planning regulations are not likely to create material differences in opex across
jurisdictions.
In support of Ausgrid's 2014 regulatory proposal, Evans and Peck identified differences
in planning regulations as an OEF that may affect benchmarking results.637 Ergon
Energy also raised this point with respect to mining leases. Ergon Energy stated that
Queensland legislation imposed special requirements when working on mining
leases.638 Ergon Energy provided no quantification of what impact these requirements
would have on opex.
The Productivity Commission carried out a review of planning regulations in April
2011.639 The finding of this review was that given the extent of differences, it is a
challenge to compare the planning systems of the states and territories: individual
indicators are often heavily qualified and thus so are comparisons between
jurisdictions. 640 As a result, the Productivity Commission did not attempt to construct
636
Ergon Energy, Response to AER Information Request AER ERG002, 17 December 2014, p. 23. 637
Evans and Peck, Review of factors contributing to variations in operating and capital costs structures of Australian
service providers, November 2012, p. 6. 638
Ergon Energy, Response to AER Information Request AER ERG002, 17 December 2014, p. 21. 639
Productivity Commission, Performance Benchmarking of Australian Regulation: Review of Planning Regulations,
April 2011. 640
Productivity Commission, review of planning regulations, April 2011, Volume 1, p. XXVIII.
7-226 Attachment 7 – Operating expenditure | Energex preliminary determination 2015–20
an overall ‘league table’ of state and territory performance.641 This suggests that
although planning regulations differ across jurisdictions, and are therefore likely to
create some differences in costs, that differences in planning regulations are not likely
to lead to material differences in costs.
We are not satisfied that the Queensland service providers have identified planning
regulations that would materially increase their opex relative to the comparison firms.
However, we have included a positive 0.5 per cent adjustment for the Queensland
service providers in our adjustment for immaterial factors. It is likely that there will be
some difference between service providers due to differences in planning regulations,
and there is uncertainty of the direction of the cost advantage. Also, an OEF
adjustment for difference in planning regulations would meet the exogeneity and
duplication OEF adjustment criteria. Planning regulations are not determined by
service providers and Economic Insights' SFA model does not include variables to
account for differences in planning regulations.
Private power poles
We are not satisfied that an OEF adjustment for private power poles satisfies the
materiality OEF criterion.
Ergon Energy stated that many of its customers own power poles. It is required to
perform a brief inspection of first-in poles (at the connection boundary point) to help
ensure the pole is serviceable. We note the service providers in Victoria are required to
inspect private electric lines up to the point at which the line connects to a building or
other structure (not including a pole).642
Consequently, the requirement for the Queensland service providers to inspect only
first-in poles will reduce their inspection costs relative to Victorian service providers, all
else equal. However, there is not sufficient evidence to conclude that these differences
will lead to material differences in opex. As it is likely to provide the comparison firms
with a cost disadvantage we have included a negative 0.5 per cent OEF adjustment for
this factor in our adjustment for immaterial factors. It is also appropriate to include this
OEF in our collective adjustment for individually immaterial OEFs because it satisfies
the exogeneity and duplication OEF adjustment criteria. Regulations on the inspection
of private power poles are set by state governments and there are no variables that
account for those factors in Economic Insights' SFA model.
Taxes and levies
We are satisfied that it is necessary to provide the Queensland service providers an
OEF adjustment to account for jurisdictional differences in taxes and levies. This is
because it satisfies all three of our OEF criteria. Taxes and levies are beyond the
control of service providers. The effect of Queensland specific taxes and levies is
641
Productivity Commission, review of planning regulations, April 2011, Volume 1, p. XXXI. 642
Electricity Safety Act 1998, s. 113(F)(1); Electricity Safety (Bushfire Mitigation) Regulations 2013, r. 8.
7-227 Attachment 7 – Operating expenditure | Energex preliminary determination 2015–20
greater than our materiality threshold for OEFs. Also, there is no variable in Economic
Insight's SFA model for taxes and levies. Therefore, we are satisfied that positive
2.7 per cent and 1.7 per cent OEF adjustments for differences in jurisdictional taxes
and levies are appropriate for Energex and Ergon Energy respectively.
Ergon Energy and Energex have both stated that their benchmarking results will be
affected by state specific levies.643 644 Both identified the Energy Safety Office (ESO)
levy and Queensland Competition Authority (QCA) Levies as Queensland specific
taxes that do not exist in other jurisdictions.
Energex forecast the cost of these levies would be on average $8.7 million
($2014/15)645 over the forecast period. If this is added to our forecast base year opex
this leads to a 2.7 per cent increase in Energex's opex.
Ergon Energy did not provide a forecast of the cost of the ESO and QCA levies.
However, Ergon Energy did provide historical costs for the ESO and QCA levies. 646
The ESO and QCA levies combined came to $4.7 million ($2014/15) in 2013/14. We
have used Ergon Energy's 2013/14 ESO and QCA levy costs to estimate the impact of
levies on to our forecast base year opex. This is because the forecast ESO and QCA
levies for Energex were similar to the costs in 2013/14. If $4.7 million ($2014/15) is
added to our forecast base year opex for Ergon Energy this leads to a 1.7 per cent
increase in its opex.
Service classification
We are not satisfied that it is necessary to provide an OEF adjustment for differences
in service classification between the Queensland service providers and the comparison
firms. This is because it would not satisfy the materiality or duplication OEF adjustment
criteria. The Queensland service providers reported they incurred no opex for standard
control services connections or metering services. Economic insights benchmarking
results are not affected by service classification because they only compares network
services costs.
An adjustment for service classification would not satisfy the duplication OEF
adjustment criterion. Our economic benchmarking RIN data takes into account
differences in service classifications across jurisdictions by using data on network
services. Network services only include the provision of the core 'poles and wires'
component of distribution services. They exclude other services that service providers
provide including metering and public lighting. Because the benchmarking data only
include information on network services, the results will only reflect differences in
network services. Therefore, differences in the classification of standard control and
alternative control services will not affect Economic Insights' SFA model.
643
Ergon Energy, Response to AER information request AER Ergon 002, 17 December 2014, pp. 6 – 7. 644
Energex, Response to AER information request AER Energex 001, 17 December 2014, p. 9. 645
Energex, Regulatory Proposal, 31 October 2014, p. 138. 646
Ergon Energy, Response to AER information request AER Ergon 002, 17 December 2014, pp. 6 – 7.
7-228 Attachment 7 – Operating expenditure | Energex preliminary determination 2015–20
However, while service classification will not affect the SFA model, service
classification must be considered when applying the results to produce our opex
forecast. This is because if we do not provide an OEF adjustment for service
classification, some service providers that provide standard control services that are
not network services, such as connection services and metering services,647 will be
penalised. In the forecast period Energex and Ergon classify some of the costs they
incur for connection services and metering services as standard control services.
Our opex forecast, based on the Cobb Douglas SFA opex cost function, is for network
services so it excludes connection services and metering services. Therefore, in order
to make sure our network services forecast is comparable to Energex and Ergon
Energy standard control services opex forecasts it is necessary to account for standard
connection services and metering services. For the forecast period the only connection
services and metering services that Energex and Ergon will classify as standard
control services are: pre-connection services, small customer connection services, and
type 7 metering services.648 Neither Energex nor Ergon Energy reported any opex on
standard control services connection services over the period 2005/06 to 2013/2014.649 650 Additionally neither service provider reported any expenditure on type 7 metering
over the 2010−15 period.651 As Ergon Energex and Energex have stated they incurred
no opex for the connection and metering services that will be classified as standard
control services in the forecast period, over the period 2010−15, there is no need to
provide an OEF adjustment.
Traffic management requirements
We are not satisfied that an OEF adjustment for traffic management would meet the
materiality or duplication OEF adjustment criteria. Traffic management requirements
across Australia are based on a nationally consistent standard. Differences in traffic
management costs related to density will be captured by Economic Insights' SFA
model.
Traffic management is the direction of motorist and pedestrian movements around
worksites using temporary traffic signage and traffic controllers.
Evans and Peck stated that traffic management regulations may affect comparison of
opex across networks. They do not explain, how or whom they would affect.652
647
For more detail please refer to our Economic Benchmarking RIN instructions. 648
AER, Final Framework and Approach for Energex and Ergon Energy: Regulatory control period commencing
1 July 2015, April 2014, p. 51. 649
Responses to Economic Benchmarking Regulatory Information Notices for 2006 to 2013, Template 3. Opex, Table
3.2, Opex consistency. 650
Responses to Economic Benchmarking Regulatory Information Notices for 2014, Template 3.2 Opex, Table 3.2.2,
Opex consistency. 651
Responses to Category Analysis Regulatory Information Notices for 2014, Template 4.2 Metering, Table 4.2.2,
Cost metrics. 652
Evans and Peck, Review of factors contributing to variations in operating and capital costs structures of Australia
DNSPs, November 2012, p. 38.
7-229 Attachment 7 – Operating expenditure | Energex preliminary determination 2015–20
As noted in the customer density section above, traffic management costs generally
correlate with the volume of traffic near the worksite. We consider that traffic
management will have a greater overall impact on expenditure in higher density areas
than in lower density areas. However, Economic Insights' SFA model accounts for this.
We recognise that each Australian state and territory has different standards for the
development and implementation of traffic control plans at roadwork sites. This
includes issues such as signage, speed zones, etc. Each of the states and territories
has different levels of training requirements including:
traffic management planners (approvers and designers),
worksite supervision and control.
However, State and territory road authorities generally base their traffic control at
roadwork sites requirements on AS1742 Part 3: Guide to traffic control devices for
works on roads653.
Traffic management costs generally correlate with the volume of traffic near the
worksite. We consider that traffic management will have a greater overall impact on
expenditure in higher density areas than in lower density areas. Economic insights'
SFA model accounts for differences in customer density. For more detail see our
consideration of customer density above and in our draft decisions for the NSW service
providers.
We have included jurisdictional differences in traffic management in our adjustment for
immaterial factors. Although the density related differences in traffic management are
captured in Economic Insights' SFA model, the jurisdictional differences in
requirements are not. That is differences in cost due to traffic volumes are related to
customer density, while differences stemming from differences in council requirements
are not. These jurisdictional differences are likely to lead to some difference in cost and
are not determined by service providers. As a result an OEF adjustment for traffic
management would satisfy the exogeneity OEF adjustment criterion. Also, because
Economic Insight's SFA model does not account for differences in traffic management
regulations it would satisfy the duplication OEF adjustment criterion. This is why we
have provided included a 0.5 per cent adjustment for the Queensland service providers
in our consideration of immaterial factors.
A.6.7 Network factors
Advanced metering infrastructure
We are not satisfied that an OEF adjustment for differences in Advanced Metering
Infrastructure (AMI) deployments would satisfy the OEF adjustment criteria. The ability
to share overheads between network services and other services is a business
decision on service diversification. Pursuing the ability to share overheads between
653
National Approach to Traffic Control at Work Sites, Publication no: AP-R337/09, Austroads 2009, p. 1.
7-230 Attachment 7 – Operating expenditure | Energex preliminary determination 2015–20
network services and metering services are not likely to lead to material differences in
network services opex. AMI costs are excluded from network services opex, which is
the measure of opex used in Economic Insights SFA model.
In response to our 2014 draft decisions for the NSW service providers Advisian,
suggested the point that the Victorian service providers can share their fixed overhead
costs with their AMI programs.654 Huegin also noted that Ofgem excludes costs related
to smart meter deployments.655
Advanced metering infrastructure is another term for smart meters. Smart meters are
electricity usage meters that communicate meter readings directly to electricity service
providers, eliminating the need for staff to read meters in person.
Advisian considers that this gives the Victorian service providers a cost advantage
relative to other service providers. Other service providers also provide metering
services, but are not making a major change in their metering fleet in the way the
Victorian service providers are. Overhead costs are often shared on the basis of costs
incurred by functional areas. Therefore, Advisian considers the large costs involved in
the AMI deployment will allow the Victorian service providers to allocate more of their
overhead costs to metering than other service providers.
There are two issues with Advisian's analysis. The first is that the extent to which a
service provider can share overheads across its services is the result of management
decisions. The second is that differences in AMI deployments will not materially affect
network services opex.
As discussed in the unregulated services section above the extent to which service
providers can share overheads across services is the result of business decisions on
service diversification. Therefore an OEF adjustment for differences in AMI programs
would not satisfy the exogeneity OEF adjustment criterion.
Additionally, fixed overheads are only a part of total overheads. As service providers
increase in scale and scope they will incur more overheads. As a result, although the
Victorian service providers are able to share fixed costs between network services and
its AMI programs, the AMI programs also add to the pool of shared overheads.
As a result we are not satisfied that an OEF adjustment for differences in AMI
programs would meet the materiality OEF adjustment criterion.
We also note that Advisian's analysis relates to the Victorian service providers rather
than the comparison firms. SA Power Networks, is also one of the comparison firms.
We note that although SA Power Networks did not have the ability to share its fixed
overheads between network services and an AMI program, it is one of the efficient
service providers under all of Economic Insights' benchmarking models.
654
Advisian, Opex Cost Drivers: ActewAGL Distribution Electricity (ACT), 16 January 2015, pp. 83–86. 655
Huegin, Response to draft determination on behalf of NNSW and ActewAGL - Technical response to the
application of benchmarking by the AER, January 2015, p. 23.

7-231 Attachment 7 – Operating expenditure | Energex preliminary determination 2015–20
We are also satisfied that an adjustment for AMI deployments would not satisfy the
duplication OEF criterion. Network services opex, which has been used in Economic
Insights' SFA model excludes metering services costs. As metering services costs are
not included in the network services costs, the efficiency scores from Economic
Insights' SFA model will not be affected by metering services costs.
Asset age
We are not satisfied that an OEF adjustment for differences in asset age between the
Queensland service providers and the comparison firms would meet the materiality
OEF adjustment criterion. Asset age will only affect some opex costs. Also, the age
profiles of the Queensland service providers and the comparison firms are similar, and
therefore should not lead to material differences in their opex.
Not all opex categories are affected by asset age. The opex categories that will
generally be affected by differences in asset age are emergency response and routine
preventative maintenance on high value assets.
The amount of maintenance opex does not increase with age for all assets. Asset age
will not greatly affect maintenance opex for most assets. Low value assets, such as
distribution lines and transformers make up the bulk of service providers' assets. Low
value assets like these are inspected on a regular basis but they will generally not incur
routine maintenance interventions in the way higher voltage assets do.656 Asset age
will more often affect routine maintenance intervals for high value, strategically
important, assets such as subtransmission lines and zone substations. However,
maintenance on zone substations and assets operating above subtransmission lines
generally only accounts for a small part of service providers' opex.
While a network with an older asset base will tend to experience more asset failures,
asset failures only account for a part of emergency response costs. As assets age,
they, in general, will become more likely to fail. Therefore a service provider with older
assets would be more likely to incur emergency response costs for asset failure.
However emergency response opex is also incurred for other occurrences including:
weather, 3rd party damage to the network, vegetation, and animal contact. 657
Additionally, any differences in opex caused by differences in asset age is unlikely to
be material because the weighted average remaining life (WARL) of the Queensland
service providers and the comparison firms' assets seem to be similar. The WARL
represents the average remaining life of a service provider's assets weighted by the
value of those assets. We have two measures of WARL. One uses benchmark unit
rates and asset lives based on the unit rates and replacement rates observed across
the NEM (benchmark WARL) the other uses service providers' own unit rates and
656
Energy Market Consulting Associates, Relationship between Opex and Customer density for Sparse Rural
Networks, 2.3.2 Routine and Non Routine Maintenance., April 2015. 657
Energy Market Consulting Associates, Relationship between Opex and Customer density for Sparse Rural
Networks, 2.3.4 Emergency Response., April 2015.
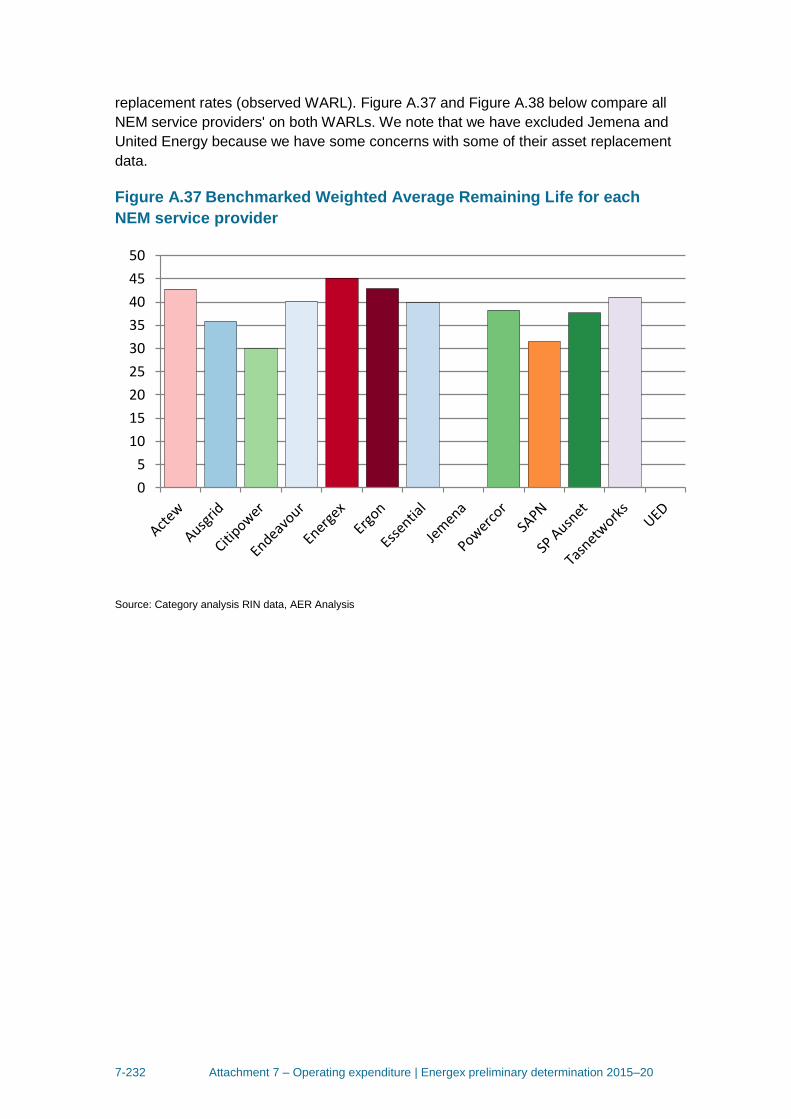
7-232 Attachment 7 – Operating expenditure | Energex preliminary determination 2015–20
replacement rates (observed WARL). Figure A.37 and Figure A.38 below compare all
NEM service providers' on both WARLs. We note that we have excluded Jemena and
United Energy because we have some concerns with some of their asset replacement
data.
Figure A.37 Benchmarked Weighted Average Remaining Life for each
NEM service provider
Source: Category analysis RIN data, AER Analysis
0
5
10
15
20
25
30
35
40
45
50
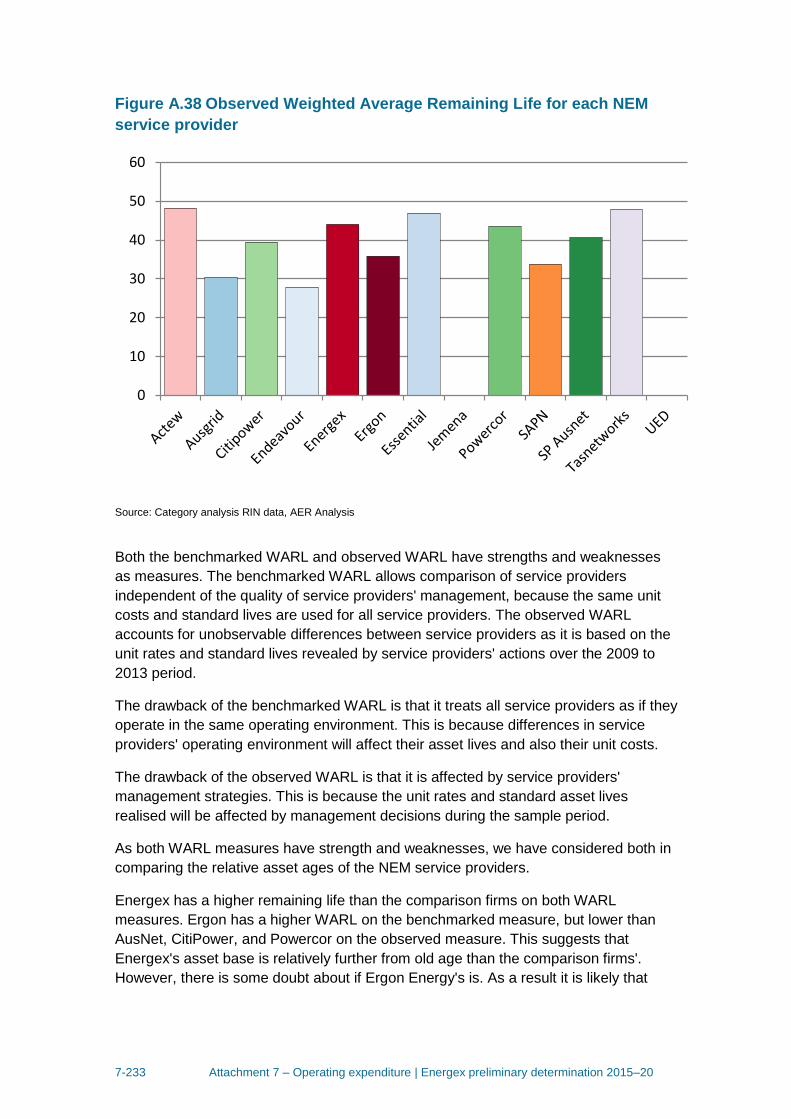
7-233 Attachment 7 – Operating expenditure | Energex preliminary determination 2015–20
Figure A.38 Observed Weighted Average Remaining Life for each NEM
service provider
Source: Category analysis RIN data, AER Analysis
Both the benchmarked WARL and observed WARL have strengths and weaknesses
as measures. The benchmarked WARL allows comparison of service providers
independent of the quality of service providers' management, because the same unit
costs and standard lives are used for all service providers. The observed WARL
accounts for unobservable differences between service providers as it is based on the
unit rates and standard lives revealed by service providers' actions over the 2009 to
2013 period.
The drawback of the benchmarked WARL is that it treats all service providers as if they
operate in the same operating environment. This is because differences in service
providers' operating environment will affect their asset lives and also their unit costs.
The drawback of the observed WARL is that it is affected by service providers'
management strategies. This is because the unit rates and standard asset lives
realised will be affected by management decisions during the sample period.
As both WARL measures have strength and weaknesses, we have considered both in
comparing the relative asset ages of the NEM service providers.
Energex has a higher remaining life than the comparison firms on both WARL
measures. Ergon has a higher WARL on the benchmarked measure, but lower than
AusNet, CitiPower, and Powercor on the observed measure. This suggests that
Energex's asset base is relatively further from old age than the comparison firms'.
However, there is some doubt about if Ergon Energy's is. As a result it is likely that
0
10
20
30
40
50
60
7-234 Attachment 7 – Operating expenditure | Energex preliminary determination 2015–20
Energex has a cost advantage relative to the comparison firms due to asset age while
it is unclear for Ergon Energy.
Although it will not lead to material differences in opex, asset age is likely to lead to
some difference in opex between the comparison firms and the Queensland service
providers. An OEF adjustment for asset age would also meet the exogeneity and
duplication OEF adjustment criteria. The date a network was established is beyond
service providers' control and there are no variables in Economic Insights' SFA model
that account for it. Therefore we have included an adjustment for asset age in our
adjustment for immaterial factors for both Energex and Ergon Energy. As Energex
appears to have a cost advantage we have provided a negative 0.5 per cent
adjustment. As there is some uncertainty of the direction of the advantage for Ergon
Energy we have provided a positive 0.5 per cent adjustment.
Asset volumes
We are not satisfied that an OEF adjustment for the volume of assets used to provide
services over its network would meet the exogeneity or duplication OEF adjustment
criteria. Network service providers have direct control over the assets that they choose
to install and Economic Insights SFA model accounts for the drivers of asset
installation.
In response to our 2014 draft decisions for the ACT and NSW service providers,
ActewAGL, Advisian, the NSW Chief Operating Officers, and ActewAGL's General
Manager of Asset Management submitted that the number of assets that a service
provider uses to operate its network will drive its operating costs.658659 660 661 662 663
Advisian submitted that it considers that the variables in Economic Insights' SFA model
ignore the cost of maintaining a larger number of assets. In particular, Advisian raised
these points with regard to line length and transformer capacity. We address line
length above in our consideration of customer factors.
In general, we consider that demand side variables should be used to determine the
benchmark opex required. This is because it is a good measure of the capacity that a
service provider must maintain to provide distribution services. Using measures driven
by the value of assets664 or volume of assets installed runs the risk of rewarding
service providers for inefficiently overinvesting. As a result, such expenditure would not
meet the exogeneity OEF criterion. This is because the extent of investment in assets
to meet the realised customer demand is at the discretion of the service provider.
658
Advisian, Review of AER benchmarking: Networks NSW, 16 January 2015, pp. 41–54. 659
Advisian, Opex Cost Drivers: ActewAGL Distribution Electricity (ACT), 16 January 2015, pp. 45 –59. 660
Trevor Armstrong, Statement of Trevor Armstrong Chief Operating Officer Ausgrid, 19 January 2015, pp. 31. 661
Gary Humphreys, Statement of Gary Humphries Chief Operating Officer Essential Energy, 19 January 2015, p. 4 662
Stephen Devlin, Witness Statement, 13 February 2015, p. 8. 663
Stephen Devlin, Witness Statement, 13 February 2015, p.8. 664
CEPA, Benchmarking and Setting Efficiency Targets for the Australian DNSPs, 19 January 2015, p. iv–5.
7-235 Attachment 7 – Operating expenditure | Energex preliminary determination 2015–20
Advisian submitted that the amount of transformer capacity installed by service
providers is likely to affect Economic Insights' SFA results. 665 666 Advisian considers
that the ratcheted peak demand variable will not take into account the spatial element
of demand or additional capacity installed for system security.
The ratcheted peak demand variable in Economic Insights' SFA model accounts for
the spatial element of demand. This is because it uses non-coincident system demand.
As a result service providers that have separated commercial and residential areas will
not be disadvantaged in the SFA model.
Advisian also submitted that service providers should be compensated for transformer
capacity installed. This is because it must be installed to meet forecast demand. 667
Therefore having excess capacity is not necessarily inefficient.
This dilemma faces all service providers. All service providers must install transformer
capacity to meet forecast demand. Therefore to the extent that a service provider must
invest in excess capacity, this will be captured in ratcheted maximum demand. As a
result, if a service provider systematically overinvests in excess capacity transformer
capacity, this is evidence that service provider's management performs relatively
worse in responding to changes in demand conditions. Therefore, benchmarking on
the basis of installed capacity rather than ratcheted peak demand has the potential to
reward inefficient investment.
Critical National Infrastructure
We are not satisfied that an OEF for Critical National Infrastructure (CNI) meets the
exogeneity OEF adjustment criteria. To the extent that a service provider decides to
invest in physical security to a greater extent than other service providers, that is a
management decision for the service provider.
In response to our 2014 draft decisions for the NSW and ACT service providers,
Huegin raised CNI as an OEF that may lead to differences in opex.668 Huegin noted
that Ofgem excludes costs associated with CNI from its totex benchmarking. CNI are
electricity distribution sites designated by the UK Department of Energy and Climate
Change (DECC).669 All sites confirmed by DECC as Category 3 CNI or above are
eligible for ex ante funding in accordance with the "Physical Security Upgrade
Programme".670 We note that Huegin has provided no explanation of how this relates
to the Australian context.
665
Advisian, Review of AER benchmarking: Networks NSW, 16 January 2015, p. 44. 666
Advisian, Opex Cost Drivers: ActewAGL Distribution Electricity (ACT), 16 January 2015, pp. 51 –57. 667
Advisian, Opex Cost Drivers: ActewAGL Distribution Electricity (ACT), 16 January 2015, pp. 51 –57. 668
Huegin, Response to draft determination on behalf of NNSW and ActewAGL - Technical response to the
application of benchmarking by the AER, January 2015, p. 23. 669
Ofgem, RIIO-ED1: Glossary of terms, 2014, p. 6. 670
Ofgem, RIIO-ED1: Final determinations for the slow-track electricity distribution companies: Business plan
expenditure assessment, 28 November, 2014, p. 99–100.
7-236 Attachment 7 – Operating expenditure | Energex preliminary determination 2015–20
Ofgem provides an allowance for CNI programs in the UK following guidance from a
government agency called The Centre for the Protection of National Infrastructure
(CPNI)671. In Australia CNI projects are undertaken at the discretion of service
providers following industry wide guidelines.672
Based on the evidence before us we are not satisfied that the Queensland service
providers' regulatory responsibilities for CNI are greater than other service providers'.
As a result, providing an OEF adjustment for CNI does not meet the exogeneity OEF
adjustment criterion. To the extent that the Queensland service providers choose to
invest more in physical security than other service providers is a decision for their
management.
Customer owned distribution transformers
We are not satisfied that an OEF adjustment to account for differences in the amount
of transformer capacity owned by customers would meet the materiality OEF criterion.
The amount of distribution capacity owned by customers is relatively small, and the
distribution transformer maintenance as a percentage of opex is also small. As a result,
the maintenance avoided by service providers with customers who own their
substations is not considered material.
In some cases, customers take electricity from service providers at higher voltages. In
these cases the customer will own and operate transformer equipment to deliver
electricity to the voltages they require for their uses. By not having to maintain
distribution transformer equipment to service those customers, service providers gain a
cost saving when compared against energy and demand throughput.
We estimate that differences in distribution transformer capacity owned by customers
will lead to a cost advantage of 0.1 per cent and 0.3 per cent for Energex and Ergon
Energy respectively.
Distribution substation maintenance only accounts for on average 1.5 and 1.9 per cent
of Energex and Ergon Energy's network services opex respectively.673 Energex and
Ergon Energy own 86.7 and 82.5 per cent of distribution transformer capacity
connected to their networks.674 The Frontier firms on average, weighted by customer
numbers, own 93.9 per cent of distribution transformer capacity. 675 On this basis
Energex and Ergon Energy's distribution substation maintenance opex may be 7.7 and
12.1 per cent lower than they would be if their customers owned a similar percentage
of distribution transformers as the frontier service providers' customers. This is
equivalent to a 0.1 and 0.3 per cent cost advantage at the total network services opex
level for Energex and Ergon Energy respectively. As these figures represent decreases
in the Queensland service providers' historical opex, they must be adjusted to the
671
Seconomics, National Grid Requirements, 31 January 2013, p. 40. 672
ActewAGL, Regulatory Proposal, June 2008, p. 64. 673
Category Analysis RIN responses, template 2.8. 674
Economic Benchmarking RIN response, template 6. Physical assets. 675
Economic Benchmarking RIN responses, template 6. Physical assets.

7-237 Attachment 7 – Operating expenditure | Energex preliminary determination 2015–20
decrease in efficient opex as described in our section on the calculation of OEFs
section above. After adjustment the customer owned distribution transformer OEF
adjustment represents a decrease in efficient opex of 0.1 and 0.4 per cent for Energex
and Ergon Energy respectively.
Following our approach to accounting for immaterial factors we have included
differences in the amount of customer owned distribution transformer capacity in our
adjustment for immaterial OEFs. An OEF adjustment for differences in customer
owned distribution transformer capacity would meet the exogeneity and duplication
OEF adjustment criteria. The number of customers that take electricity at high
distribution voltages is not determined by service providers and there are no variables
in Economic Insights' SFA model to account for it. Given that we are able to estimate
the potential cost impact of differences in ownership of distribution transformer
capacity, we have used these figures for the relevant contribution to the immaterial
factors OEF adjustments.
Demand management
We are not satisfied that an OEF adjustment for differences in the demand
management in service providers' would meet the duplication OEF adjustment
criterion. Demand management is a capex opex trade-off. We have considered the
impact of capex opex trade-offs under the capitalisation practice OEF.
Energex identified demand management costs as a factor that may increase its opex
relative to the comparison firms.676 Energex noted that the AER forecast $158 million
for demand management in our 2010–15 distribution determination.
Demand management is the use of various strategies to change customers' electricity
use. By changing energy use, service providers can avoid the need for large
investments in network upgrades to meet a peak demand that only occurs for a small
part of the year. In this way service providers can reduce their capex by using opex.
The decision to undertake demand management is a capex opex trade-off. Service
providers face many of these trade-offs. Other examples include the choice to rent or
buy depots, to run lines over or underground, to replace or maintain. We consider that
where a capex opex trade-off exists, the decision on whether to provide an OEF
adjustment should be considered in the broader context of service providers' capex to
opex ratio. This is because a service provider may utilise a solution that is opex
intensive in one area, but overall may have a preference for capital intensive solutions.
In this situation providing a positive OEF adjustment for an opex intensive solution
would overcompensate the service provider. This is because focusing only on opex
capex trade-off OEFs that disadvantage the Queensland service providers will
upwardly bias the total OEF adjustment.
676
Energex, Response to AER information request AER EGX 001(A), 17 December 2014, p. 8.
7-238 Attachment 7 – Operating expenditure | Energex preliminary determination 2015–20
In our capitalisation practices section we compare the capex opex ratios for the NEM
service providers. Figure A.20 and Figure A.21 show that the Queensland service
providers capitalise a similar amount of their costs to the comparison firms.
Therefore, we are not satisfied that differences in opex due to demand management in
service provider's networks are not accounted in our consideration of capitalisation
practices.
We have also considered increases in demand management in our step change
appendix.
Line sag
We are not satisfied that an OEF adjustment for line sag would meet the exogeneity
OEF criterion. A prudent service provider would design its network to take into account
the demand it services and the environment it operates in. Specifically, network
businesses design and construct overhead lines so that they are compliant with the
statutory obligations under all standard operating conditions.
Overhead electrical lines expand when heated and this results in the “sag” of the line
increasing. Line heating is caused by environmental factors and by the delivery of
energy through the line.
Ergon Energy raised the point that high loads and temperatures lead to significant
conductor sag. As Ergon Energy is obliged to maintain regulatory clearances of all
conductors, its opex includes a system of measuring and actively repairing line sag to
ensure regulatory compliance.677
All NEM service providers use similar line design criteria to account for sag which take
into account, among other things, ambient temperature, solar radiation, and wind
speed. The extent to which a service provider finds that it has a systemic issue with
regard to line sag is a reflection of the quality of its management in applying the line
design criteria. As a result an OEF adjustment for line sag would not satisfy the
exogeneity OEF adjustment criterion.
Network Accessibility
We are not satisfied that an OEF adjustment for differences in network accessibility
satisfies all of our OEF adjustment criteria. The most cost effective route for a line may
not always be in areas that are easily accessible. The opex of access route
maintenance for Ergon Energy is a material part of Ergon Energy's network services
opex. There is no variable in Economic Insights SFA model for differences in network
access.
677
Ergon Energy, AER information request AER Ergon 002, 17 December 2014, p. 14.
7-239 Attachment 7 – Operating expenditure | Energex preliminary determination 2015–20
In response to AER questions, Ergon Energy indicated that it considered differences in
network accessibility as an OEF that materially affects its costs.678 Vegetation
management, line maintenance and asset inspections require access to assets. Ergon
Energy considers that high rainfall results in significant damage to access tracks due to
washouts, vegetation growth and subsidence. When asked, Ergon Energy did not
provide evidence of differences in costs in access track maintenance between high
and low rainfall areas of its network.679 Nonetheless, economic benchmarking RIN data
indicates that Ergon Energy has a greater percentage of its network that does not have
standard vehicle access than the comparison firms. In 2013/14, 36 per cent of Ergon
Energy's network did not have standard vehicle access. In comparison, the weighted
average for the comparison firms was only 5 per cent.680 As a result we consider that
Ergon Energy is likely to have a cost disadvantage relative to the comparison firms on
access track maintenance.
Ergon Energy indicated that over the 2010 to 2014 period, on average it incurred $4.9
million ($2014/15) per annum for access track maintenance at a cost of $97 per
kilometre of network route with non-standard vehicle access. 681 682 This represented
1.23 per cent of Ergon Energy's network services opex over the same period.
Using the unit rate for Ergon Energy's access track maintenance, and route line
lengths without standard vehicle access, we estimated the percentage of network
services opex that the comparison firms expend on access track maintenance. Using
these figures we estimate that in 2014, the percentage increase in the comparison
firms' network services opex, weighted by customer numbers, due to access track
maintenance was 0.15 per cent. Assuming all else equal, this indicates that differences
in access track maintenance lead to a 1.1 per cent increase in opex for Ergon Energy
relative to the comparison firms.683
Using the same method for Energex, we estimate that access track maintenance
accounts for an increase of 0.05 per cent in Energex's network services opex. This
implies that, relative to the comparison firms, Energex has a 0.1 per cent cost
advantage on access track maintenance costs.
Network control centres (Ergon Energy)
We are not satisfied that an OEF adjustment for network control centres meets the
materiality OEF adjustment criterion. Operating two network control centres instead of
one is not likely to lead to material differences in opex.
Ergon Energy stated that it operates two geographically separate and fully functional
network operations control centres. It staffs both control centres at all times. It
678
Ergon Energy, Response to information request AER Ergon 02, 17 December 2014, p. 13. 679
Ergon Energy, Response to information request AER Ergon 018(3), 30 January 2015, p. 7. 680
Benchmarking RIN responses, 2013 and 2014, Template 8. Operating Environment. 681
Ergon Energy, Response to information request AER Ergon 018(3), 30 January 2015, p. 7. 682
Ergon Energy, Economic Benchmarking RIN responses, 2013 and 2014, Template 8. Operating Environment. 683
1.1 = ((101.2/100.1)–1)x100

7-240 Attachment 7 – Operating expenditure | Energex preliminary determination 2015–20
considered the duplication was necessary to reduce the risk of control centre failure
during natural disaster situations, most notably during cyclones. It considered there
was no practical location within its geographic footprint that was immune to these risks.
In the event one of the control centres needs to be shut down its operations can be
transferred to the other control centre. To cater for such scenarios, Ergon Energy has
established staffing levels and capability sufficient for each network operations control
centre to manage various critical functions across the entire state in the short term.
Ergon Energy can transfer its workforce from the closed control centre to the operating
control centre for long term management abilities.
However, Ergon Energy is not required to operate its network control centres from
within its geographic footprint. For example, when Ergon Energy last formally reviewed
the costs and benefits of having two geographically separate network control centres in
2003 it considered the option of operating a 'cold site' outside of its geographic
footprint. Further, other service providers operate are have operated shared network
control centres, such as CitiPower and Powercor and Jemena and United Energy
Distribution.684
When Ergon Energy last formally reviewed the costs and benefits of different control
centre options, it considered the option of operating two control centres in the one city.
The second 'cold' site would provide redundancy for the main 'hot site'. We note that, in
Ergon Energy's review this option had the same opex as operating two hot sites in
different cities. Given this, there is not sufficient evidence to conclude that the
operation of two control centres will lead to a material difference in opex.
As Ergon Energy stated that the opex for running a hot and a cold network control
centre is equivalent to running two hot sites we consider no OEF adjustment required.
Past ownership
We are not satisfied that an OEF adjustment for past ownership would meet the
exogeneity or material OEF adjustment criteria. The AEMC stated that the nature of
ownership should not be taken into account as it is endogenous. Managing a fleet of
various asset types installed in response to different management, environmental,
demand, and technological circumstances is a core business function of electricity
network service providers.
In response to our 2014 draft decision for Essential Energy, Essential Energy raised
intra-network variability as an issue that would lead to material differences in opex
between it and the comparison service providers.685 It stated that the legacy of being
an amalgamation of different service providers with different practices and standards
would lead to it having a cost disadvantage relative to the Victorian service providers.
Essential Energy provided no practical examples of how these differences would lead
to it having a cost disadvantage. It is not clear how Essential considers this will affect
684
Advisian, Opex Cost Drivers: ActewAGL Distribution Electricity (ACT), 16 January 2015. p. 90. 685
Essential Energy, Revised Proposal: Attachment 7.4, p. 25.

7-241 Attachment 7 – Operating expenditure | Energex preliminary determination 2015–20
costs, but one interpretation is that Essential's precursor organisations may have
adopted different technologies, potentially leading to increased complexity in asset
management. We note that the other NSW service providers are also the
amalgamation of various service providers.686 Ausgrid and Endeavour did not raise this
as an issue that would materially affect their costs. Energex and Ergon Energy also did
not raise this issue.
The Victorian service providers did not inherit a highly homogenous network derived
from one legacy network. Up until privatisation there were 12 municipal service
providers,687 known as Municipal Electricity Undertakings, operating across the
Melbourne area in addition to the State Electricity Commission of Victoria. CitiPower,
Jemena, Powercor and United Energy all own assets that were previously owned by
one or more of these Municipal service providers.
Additionally, all of the NEM Electricity service providers must manage a variety of
different assets installed in response to different circumstances. The optimal choice of
asset will depend on the technology available at the time, the demand the asset must
serve, and the environment in which the asset is being installed. All service providers
will have a variety of different assets installed at different times.
Further Essential Energy has not demonstrated that if its asset base is more
heterogeneous, that any such difference in heterogeneity will lead to a material
increase in costs.
Therefore we are not satisfied that differences in past ownership between the
Queensland service providers and the Victorian service providers will lead to material
differences in opex.
We are also not satisfied that an adjustment for differences in past ownership would
satisfy the exogeneity OEF adjustment criterion. The nature of ownership of service
providers is an endogenous factor.
Proportion of 22kV and 11kV lines
We are not satisfied an OEF adjustment for the proportions of 22kV and 11kV lines in
the network would meet the materiality OEF adjustment criterion. Operating a network
using a 22 kV high-voltage distribution system rather than an 11kV high-voltage
distribution system is unlikely to create material differences in opex between service
providers.
Evans and Peck stated that because Victoria operates a 22 kV high-voltage distribution
system they have a cost advantage over service providers that operate 11kV
686
Stewart Smith, Electricity and Privatisation, NSW Parliamentary library research service,1997, p. 3. 687
Victorian Government, Victorian Government Gazette, No 54 1961, 3 July 1961.

7-242 Attachment 7 – Operating expenditure | Energex preliminary determination 2015–20
distribution systems.688 They stated that this \cost advantage will manifest itself in lower
operation and maintenance costs. 689
Each of the Queensland service providers operates a high-voltage distribution network
that is predominantly 11kV although 22kV forms a significant proportion of Ergon's
network. The comparison firms operate both 11kV and 22kV high voltage distribution
networks. The Victorian service providers have mostly changed their high-voltage
networks to a 22kV model with the notable exception of CitiPower. CitiPower maintains
a predominantly 11kV high-voltage distribution network. SA Power Networks also has
a predominantly 11kV high-voltage distribution network.
Figure A.39 Line voltages by length (Average 2006 to 2013)
Source: Economic Benchmarking RIN, AER analysis
688
Evans and Peck, Review of factors contributing to variations in operating and capital costs structures of Australia
DNSPs, November 2012, p. 17. 689
Evans and Peck, Review of factors contributing to variations in operating and capital costs structures of Australia
DNSPs, November 2012, p. 5.
7-243 Attachment 7 – Operating expenditure | Energex preliminary determination 2015–20
The high-voltage distribution networks are the key means for the distribution of
electricity over middle distances such as between suburbs and across small regional
areas.
Simplistically, a doubling of the voltage will provide a doubling of the capacity of the
line. In the case of high-voltage lines, a 22kV line will potentially have twice the
capacity of an 11kV line. The 22kV line can also cover a greater distance than an 11kV
line serving the same electrical load.
In practice, this will result in an 11kV network design that has more 11kV feeders to
service the same customer loads and a larger number of lower capacity zone
substations to service these feeders. On the other hand, a 22kV network design will
have fewer feeders and a smaller number of higher capacity zone substations. We
note that while there will be more feeders in an 11kV system, the total length of feeders
will be roughly the same.
Additionally, the comparison firms include service providers with both 22kV and 11kV
network configurations. Powercor and AusNet, and CitiPower and SAPN, represent the
two extremes in terms of 11kV and 22kV networks - Powercor and AusNet are
predominantly 22kV systems while CitiPower and SAPN have predominantly 11kV
systems.
In conjunction these two points indicate that this the proportion of 11kV and 22kV lines
in a service providers' network is not material to overall performance.
In accordance with our approach to estimating the combined effect of OEFs that do not
meet the materiality OEF adjustment criterion, we have accounted for differences in
high voltage distribution systems in our immaterial OEF adjustment. Although it does
not satisfy the materiality criterion, an adjustment for the proportions of 22kV and 11kV
lines would satisfy the exogeneity and duplication criteria. The technology that was
available at the time a network was established is beyond service providers' control.
Economic Insights' SFA model dos not include any variables that account for the
proportion of 11kV and 22kV lines. The Queensland service providers operate 11kV
high voltage distribution networks. The comparison firms mostly operate 22kV high
voltage distribution networks. In theory operating a 22kV network would provide a
small reduction in opex costs. Therefore differences in high voltage distribution
systems contributes 0.5 per cent to the immaterial factor adjustments for the
Queensland service providers.
Proportion of wooden poles
We are not satisfied that an OEF adjustment for differences in the proportion of
wooden poles in service providers' networks would not meet the duplication OEF
criterion. The decision on whether to use wooden, concrete, steel, or fiberglass poles is
a trade-off between capex, opex and service levels. We have considered the impact of
capex opex trade-offs under the capitalisation practices OEF and service levels under
reliability outcomes.
In response to our 2014 draft decision for the NSW service providers, Essential Energy
raised the proportion of wooden poles in its network as a factor that may increase its
7-244 Attachment 7 – Operating expenditure | Energex preliminary determination 2015–20
opex relative to the comparison firms.690 It submitted that because wooden poles make
up a greater part of its network than the comparison firms it is more exposed to the
effects of timber decay than other service providers. Essential Energy did not provide
any quantification of the effect that this may have on its costs.
In its regulatory proposal Ergon Energy submitted that it operated in the area with the
worst conditions for pole degradation in Australia.691 Ergon Energy stated that analysis
of climatic factors across its networks supported this position. We asked Ergon Energy
to provide this modelling. Ergon Energy submitted it was not able to provide this
analysis because Ergon Energy does not have access to the model itself. The analysis
belongs to Huegin Pty Ltd. and all rights are vested with Huegin and therefore Ergon
Energy legally cannot provide this model to the AER.692
The decision on whether to use wooden, concrete, steel, or fiberglass poles is a capex
opex trade-off. This is because higher capital cost poles are generally less opex
intensive. For example concrete poles do not require the inspection drillings and anti-
fungal treatments that wooden poles do. However concrete poles are more costly to
install.
Service providers face many of these capex opex trade-offs. Other examples include
the choice to rent or lease depots, to run lines over or underground, to replace or
maintain. We consider that where a capex opex trade-off exists the decision on
whether to provide an OEF adjustment should be considered in the broader context of
service providers' capex to opex ratio. This is because a service provider may utilise a
solution that is opex intensive in one area, but overall may have a preference for
capital intensive solutions. In this situation providing a positive OEF adjustment for an
opex intensive solution would overcompensate the service provider. This is because
there will be other areas of their operations where it utilises capital intensive solutions
but will not receive negative OEF adjustments.
In our capitalisation practices section we compare the capex opex ratios for the NEM
service providers. Figure A.20 and Figure A.21 show that the Queensland service
providers capitalise a similar amount of their opex to the comparison firms. We have
included an adjustment for differences in capitalisation practices in our collective
adjustment for individually immaterial factors.
Therefore, we are not satisfied that differences in opex due to the proportion of wooden
poles in service provider's networks are accounted in our consideration of
capitalisation practices.
690
Essential Energy, Revised Proposal: Attachment 7.4, 20 January 2015, p. 32. 691
Ergon Energy, Regulatory Proposal: Attachment 0A.01.01, pp. 14. 692
Ergon Energy, Response to AER Information request Ergon 018(6), 6 February 2015, p. 1.
7-245 Attachment 7 – Operating expenditure | Energex preliminary determination 2015–20
Rising lateral mains
We are not satisfied that an OEF adjustment for rising lateral mains would meet the
materiality OEF adjustment criterion. Service providers in the NEM are generally not
responsible for maintaining mains within apartment complexes.
Rising and lateral mains are three phase mains, or busbars, that run through
apartment buildings to which multiple service lines are connected.693
In response to our draft decisions for the NSW service providers, Huegin raised rising
and lateral mains as an OEF that may lead to differences in opex.694 Huegin noted that
Ofgem excludes costs associated with rising and lateral mains from its totex
benchmarking. In the UK some service providers have a significant amount of mains
running throughout apartment complexes.695 Ofgem adjusts its totex benchmarking to
remove costs associated with those assets.696 Huegin did not provide any indication of
why this may be an issue in the NEM.
We are not satisfied that it is necessary to provide an OEF adjustment for rising and
lateral mains. While some service providers in the UK have substantial rising and
lateral mains fleets, in general NEM service providers do not run electricity distribution
mains through apartment complexes. In NEM jurisdictions, usually the demarcation
between the service providers' assets and customers' assets is either at the boundary
of the customer's property or on the outside of the customer's building. In some
situations, service providers do own mains that run through a customer's premises that
supply a substation. However, all NEM service providers have some substations
located on customers' premises and there is no indication that this provides a cost
disadvantage where it occurs. Aside from mains that supply substations, it is
exceedingly unusual for a service provider to own distribution mains within an
apartment building.
We are not satisfied that an adjustment for rising and lateral mains satisfies the
materiality OEF criterion. In general NEM service providers do not own, and are not
responsible for maintaining rising and lateral mains. As a result we estimate that rising
lateral mains maintenance will lead to no differences in the opex incurred by NEM
service providers.
693
Ofgem, RIIO-ED1: Glossary of terms, 2014, p. 23. 694
Huegin, Response to draft determination on behalf of NNSW and ActewAGL - Technical response to the
application of benchmarking by the AER, January 2015, p. 23. 695
SP Energy Networks, SP Energy Networks 2015-2023 Business Plan: Annex Rising Mains and Laterals Strategy,
March 2014, pp. 3–4. 696
Huegin, Response to draft determination on behalf of NNSW and ActewAGL - Technical response to the
application of benchmarking by the AER, January 2015, p. 23.
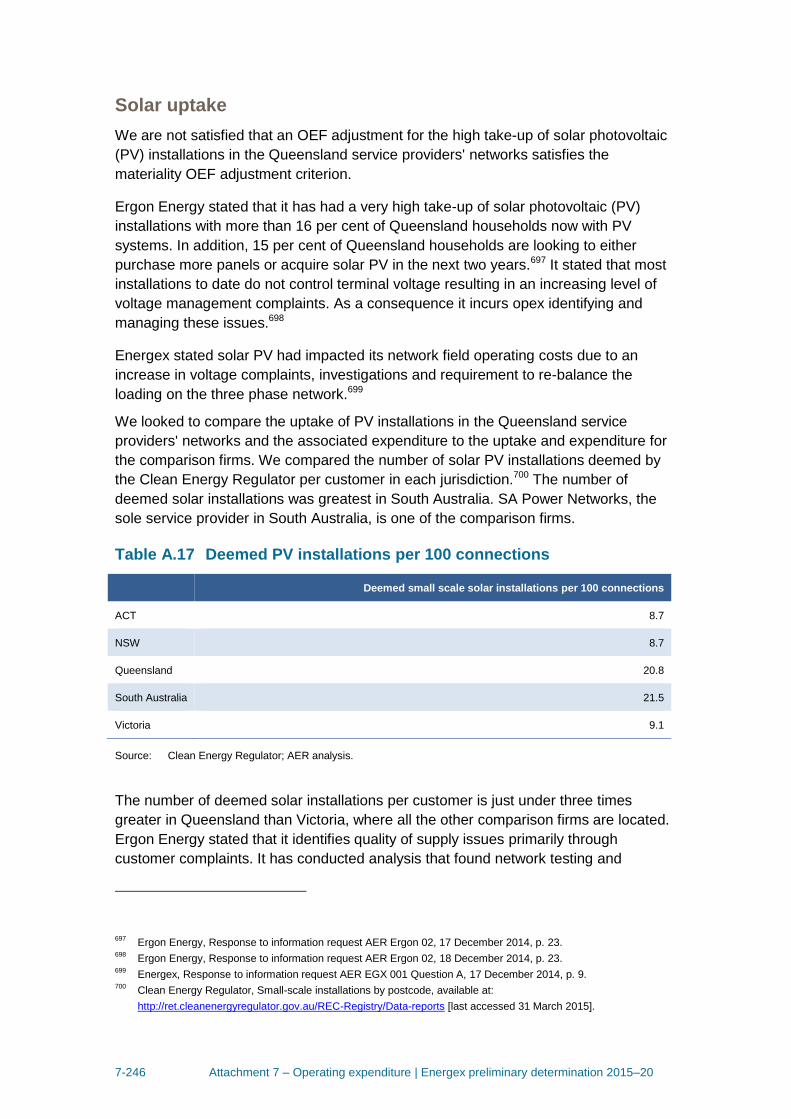
7-246 Attachment 7 – Operating expenditure | Energex preliminary determination 2015–20
Solar uptake
We are not satisfied that an OEF adjustment for the high take-up of solar photovoltaic
(PV) installations in the Queensland service providers' networks satisfies the
materiality OEF adjustment criterion.
Ergon Energy stated that it has had a very high take-up of solar photovoltaic (PV)
installations with more than 16 per cent of Queensland households now with PV
systems. In addition, 15 per cent of Queensland households are looking to either
purchase more panels or acquire solar PV in the next two years.697 It stated that most
installations to date do not control terminal voltage resulting in an increasing level of
voltage management complaints. As a consequence it incurs opex identifying and
managing these issues.698
Energex stated solar PV had impacted its network field operating costs due to an
increase in voltage complaints, investigations and requirement to re-balance the
loading on the three phase network.699
We looked to compare the uptake of PV installations in the Queensland service
providers' networks and the associated expenditure to the uptake and expenditure for
the comparison firms. We compared the number of solar PV installations deemed by
the Clean Energy Regulator per customer in each jurisdiction.700 The number of
deemed solar installations was greatest in South Australia. SA Power Networks, the
sole service provider in South Australia, is one of the comparison firms.
Table A.17 Deemed PV installations per 100 connections
Deemed small scale solar installations per 100 connections
ACT 8.7
NSW 8.7
Queensland 20.8
South Australia 21.5
Victoria 9.1
Source: Clean Energy Regulator; AER analysis.
The number of deemed solar installations per customer is just under three times
greater in Queensland than Victoria, where all the other comparison firms are located.
Ergon Energy stated that it identifies quality of supply issues primarily through
customer complaints. It has conducted analysis that found network testing and
697
Ergon Energy, Response to information request AER Ergon 02, 17 December 2014, p. 23. 698
Ergon Energy, Response to information request AER Ergon 02, 18 December 2014, p. 23. 699
Energex, Response to information request AER EGX 001 Question A, 17 December 2014, p. 9. 700
Clean Energy Regulator, Small-scale installations by postcode, available at:
http://ret.cleanenergyregulator.gov.au/REC-Registry/Data-reports [last accessed 31 March 2015].
7-247 Attachment 7 – Operating expenditure | Energex preliminary determination 2015–20
customer complaints under reported actual voltage management issues by a factor of
up to ten times that of the actual network issues.701 By contrast, the Victorian
comparison firms can use advanced metering infrastructure (AMI) data to identify the
presence of steady state voltage violations.702 Consequently we consider that the
Victorian service providers may identify more steady state voltage violations resulting
from PV installations than do the Queensland service providers.
Given this, there is not sufficient evidence to conclude that the high rate of PV
installations in Queensland will lead to a material difference in opex due to higher
quality of supply rectification expenditure.
We also looked at the costs associated with the administration of solar PV
connections. We found that, on a per customer basis, Energex's costs for the
administration of solar PV connections, were a little lower than those for
SA Power Networks. The difference was consistent with the slightly higher uptake of
PV in South Australia. Ergon Energy, however, did not provided detailed information on
its PV connection administration costs. It only provided an estimate provided by
Synergies Economic Consulting of the total cost over the period 2010–11 to 2014–15.
We note this period had not finished at the time Ergon Energy provided this estimate.
The estimate suggested that, on a per customer basis, Ergon Energy's PV connection
administration costs were approximately four times those of Energex and
SA Power Networks. Ergon Energy provided no reason for why its costs should be
significantly greater than Energex or SA Power Networks'.
We would expect, however, that Energex and Ergon Energy's PV connection
administration costs would be higher, than those of the Victorian comparison firms due
to the higher PV uptake in Queensland. However, there is not sufficient evidence to
conclude that the high rate of PV installations in Queensland will lead to a material
difference in opex due to higher PV connection administration costs. An adjustment for
differences in PV penetration would meet the exogeneity and materiality OEF
adjustment criteria. The decision to install PV is a customer's choice and there are no
variables to account for differences in PV penetration rates in Economic Insights' SFA
model. As a result we have included differences in opex due to solar PV installations
as a 0.5 percentage point increase in our immaterial OEF adjustments for Energex and
Ergon Energy.
Subtransmission
We are satisfied that it is necessary to provide an OEF adjustment for differences in
subtransmission network configuration between the Queensland service providers and
the comparison firms. An adjustment for differences in subtransmission network
configuration raises all of our three OEF adjustment criteria. The boundary between
transmission and distribution networks is the result of historical decisions made by
701
Ergon Energy, Response to information request AER Ergon 018(2)(a), 6 February 2015, p. 7. 702
AER, Victorian electricity distribution network service providers distribution determination: Final decision -
appendices, October 2010, pp. 333–340.
7-248 Attachment 7 – Operating expenditure | Energex preliminary determination 2015–20
state governments when dividing electricity networks. Differences in subtransmission
configuration are likely to lead to material differences in the cost of providing network
services. Differences in subtransmission configurations are not accounted for
elsewhere in Economic Insights' SFA model.
In support of Ausgrid's 2014 regulatory proposal, Ausgrid’s consultant Advisian
(formerly known as Evans and Peck) stated that Victoria and Tasmania have a natural
cost advantage because they have simpler subtransmission networks. The factors it
cites include shorter total length of installed subtransmission cables,703 less
subtransmission transformer capacity installed704 and fewer transformation steps.705
Advisian conclude the greater size and complexity of subtransmission networks in
NSW and Queensland are likely to manifest themselves in larger asset bases and that
this will flow through to higher opex.
The transition point between transmission and distribution varies across jurisdictions
and within service providers. All service providers take supply from transmission Grid
Exit Points (GXPs) across a range of voltages. We agree with the above observations
that the NSW service providers own and operate a proportionally larger group of
assets at the higher voltages. Queensland GXPs are also typically at the higher
voltage levels than those of other states. Tasmania has the lowest GXP voltages of all
the NEM service providers on average. We also note the dual sub-transmission
transformation step that accompanies the higher sub-transmission voltages. NSW,
Queensland, and South Australia have all reported dual transformation assets.706
We are satisfied that an OEF adjustment is appropriate because the divisions between
transmission and distribution service providers represent boundaries that are outside
the control of service providers. In addition, the information available to us indicates
that subtransmission assets may be up to twice as costly to operate as other
distribution assets.
Further, Economic Insights' SFA model does not include a variable to account for the
proportion of undergrounding. Therefore part of the differences in service providers'
costs observed in Economic Insights' economic benchmarking will be due to
differences in subtransmission configuration.
To assess the potential impact of the differences in subtransmission networks we
investigated a number of approaches including:
comparison of RAB values707
703
Evans and Peck, Review of factors contributing to variations in operating and capital costs structures of Australia
DNSPs, November 2012, p. 14. 704
Evans and Peck, Review of factors contributing to variations in operating and capital costs structures of Australia
DNSPs, November 2012, p. 18. 705
Evans and Peck, Review of factors contributing to variations in operating and capital costs structures of Australia
DNSPs, November 2012, p. 21. 706
Economic Benchmarking RIN data. 707
Economic Benchmarking RIN data.
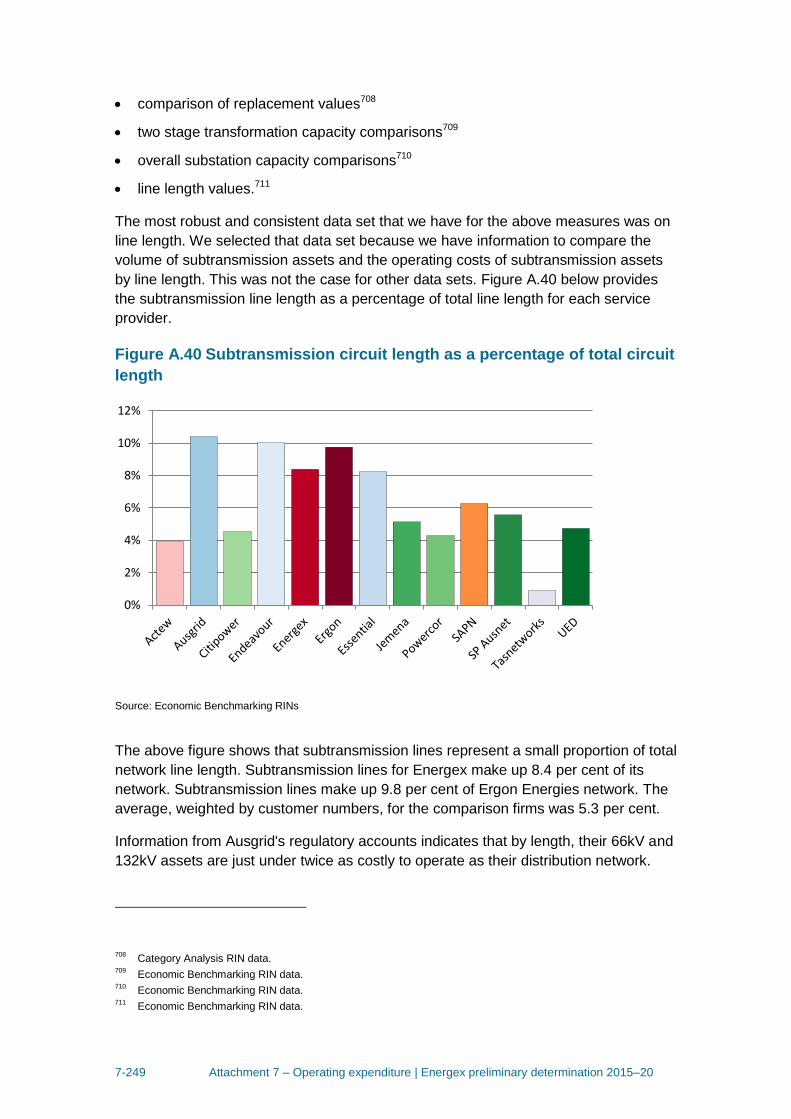
7-249 Attachment 7 – Operating expenditure | Energex preliminary determination 2015–20
comparison of replacement values708
two stage transformation capacity comparisons709
overall substation capacity comparisons710
line length values.711
The most robust and consistent data set that we have for the above measures was on
line length. We selected that data set because we have information to compare the
volume of subtransmission assets and the operating costs of subtransmission assets
by line length. This was not the case for other data sets. Figure A.40 below provides
the subtransmission line length as a percentage of total line length for each service
provider.
Figure A.40 Subtransmission circuit length as a percentage of total circuit
length
Source: Economic Benchmarking RINs
The above figure shows that subtransmission lines represent a small proportion of total
network line length. Subtransmission lines for Energex make up 8.4 per cent of its
network. Subtransmission lines make up 9.8 per cent of Ergon Energies network. The
average, weighted by customer numbers, for the comparison firms was 5.3 per cent.
Information from Ausgrid's regulatory accounts indicates that by length, their 66kV and
132kV assets are just under twice as costly to operate as their distribution network.
708
Category Analysis RIN data. 709
Economic Benchmarking RIN data. 710
Economic Benchmarking RIN data. 711
Economic Benchmarking RIN data.
0%
2%
4%
6%
8%
10%
12%
7-250 Attachment 7 – Operating expenditure | Energex preliminary determination 2015–20
Ausgrid's regulatory accounts provide the opex of operating the 66kV and 132kV part
of their network and separately the opex for the rest of their network. These figures
suggest that per kilometre, Ausgrid's 66kV and 132kV assets are twice as expensive to
operate as their other assets.
To calculate the OEF adjustment for each service provider, we have subtracted the
percentage that subtransmission lines represent of total lines operated by the weighted
average of the comparison firms from that for the relevant service provider.
We note that 132kV and 66kV lines are likely to be more expensive to operate than
33kV lines. As a result we consider that this adjustment is likely to slightly favour
service providers with more 33kV subtransmission assets.
Using the methodology described above, the recommended adjustment to the opex
comparisons for this factor are therefore:
Energex: 3.2 per cent712
Ergon Energy: 4.6 per cent.713
SWER
We are not satisfied that an OEF adjustment for the proportion of Single-wire earth-
return (SWER) included in a network would meet the exogeneity or duplication OEF
adjustment criteria. The proportion of SWER included in a network is a result of past
management decisions and it will be correlated with customer density, which is
captured in Economic Insights' SFA model.
In response to our draft decisions for the ACT and NSW service providers,
Advisian,714715CEPA,716 and Synergies717 raised the point that the cost of operating
SWER lines is different to other lines. Advisian and CEPA submitted that SWER is
cheaper to operate than other lines. Synergies on the other hand submitted that it is
more expensive to operate because it is less reliable, which results in greater network
restoration costs.
SWER is a mature technology that has been available to network service providers for
decades. SWER systems are low capital and maintenance cost distribution systems,
which have been installed and operated in many rural parts of the world. The high cost
of network extension to rural areas, which are often characterized by scattered
communities with low load densities, requires the use of low cost options to ensure
712
8.5 – 5.3 = 3.2. 713
9.9 – 5.3 = 4.6. 714
Advisian, Opex Cost Drivers: ActewAGL Distribution Electricity (ACT), 16 January 2015, pp. 57–59. 715
Advisian, Review of AER benchmarking: Networks NSW, 16 January 2015, pp. 50–52. 716
CEPA, Benchmarking and Setting Efficiency Targets for the Australian DNSPs, 19 January 2015, pp. 26, 30, and
68. 717
Synergies, Concerns over the AER's use of benchmarking as it might apply in its forthcoming draft decision on
Ergon, January 2015, p. 26.
7-251 Attachment 7 – Operating expenditure | Energex preliminary determination 2015–20
economic viability. In SWER power distribution networks, the earth itself forms the
current return path of the single phase system leading to significant cost savings on
conductors, poles and pole top hardware compared to conventional systems. However,
challenges exist in SWER with regard to voltage management, reliability, earthing and
safety as well as the dependence on earth conductivity to supply consumer loads.
A 2009 study by PB Associates identified SWER as the most cost effective option for
the connection of remote customers.718 This study showed that SWER supplies were
less than half the cost of other overhead solutions. This is supported by a World Bank
review of SWER undertaken in 2006.719
An OEF adjustment for SWER does not meet the exogeneity OEF adjustment criterion.
Service providers have had the ability to use SWER in low demand low density areas
of their networks. SWER has been available for use in Australia since the first half of
the 20th century. To the extent that SWER is a cheaper method to distribute electricity,
its use or absence, is a reflection of past managerial efficiency or inefficiency.
To the extent that SWER can be used in low density low demand environments, the
effect of SWER on opex will be correlated with customer density. As Economic Insights
SFA model accounts for customer density, it will also account for the proportion of
SWER used by a service provider. As mentioned in our draft decisions for the ACT and
NSW service providers, in our consideration of customer density, asset complexity will
be correlated with customer density. In this case, SWER is a less complex asset
designed to serve low loads through a single wire instead of multiple circuits.
Transmission connection point charges
We are not satisfied that an OEF adjustment for transmission connection point charges
would meet the duplication OEF adjustment criterion. Transmission connection point
charges have been excluded from network services opex: the opex data used in
Economic Insights' SFA model.
Transmission connection point charges are charges for electricity transmission
services.
In response to our draft decisions for the ACT and NSW service providers, Huegin
raised transmission connection point charges as an OEF that may lead to differences
in opex. 720 Huegin noted that Ofgem excludes transmission connection point charges
from its totex benchmarking.
718
Parsons Brinckerhoff, Indicative costs for replacing SWER lines, 28 August 2009, p. iv. 719
The World Bank, Sub-Saharan Africa: Introducing Low-cost Methods in Electricity Distribution Networks, October
2006, p. xvi. 720
Huegin, Response to draft determination on behalf of NNSW and ActewAGL - Technical response to the
application of benchmarking by the AER, January 2015, p. 23.
7-252 Attachment 7 – Operating expenditure | Energex preliminary determination 2015–20
A.7 The benchmark comparison point and adjustments to base opex
The purpose of any adjustment to base opex is to develop an appropriate starting point
from which to build our alternative estimate of forecast opex that we are satisfied will
reasonably reflect the opex criteria. We do this using a range of techniques, including
benchmarking. If we make an adjustment to base opex, it is not the end of our
assessment, merely one stage of it. However, the effect of removing spending from
base opex that does not reflect the opex criteria can be significant because service
providers rely heavily on total actual opex incurred in the base year in their revised
proposals to develop their proposed forecast.
If our analysis indicates that a service provider's base opex is materially inefficient for
the purposes of forecasting opex in the coming regulatory control period even after its
individual circumstances (such as exogenous factors) are accounted for, it would not
be appropriate to use the base opex for the purpose of constructing a forecast that is
intended to reflect the opex criteria. If we relied upon unadjusted revealed costs to
build a forecast, it would include spending that does not reflect the opex criteria for
each year of the new regulatory period.
Accordingly, making an appropriate adjustment to base opex is an important part of our
assessment approach in circumstances where we find evidence for material
inefficiency in the base year costs. This issue has been the subject of a range of
submissions and responses from stakeholders.
This part of our decision is, essentially, about how much of the actual opex of a service
provider in the base year does not reasonably reflect the opex criteria when reviewed
using the approach we are applying for the 2014–19 regulatory period.
A.7.1 Preliminary position
Having considered all the relevant evidence we consider there is material inefficiency
in Energex's and Ergon Energy's base year opex. To rely on their revealed expenditure
in the base year when developing our alternative forecast would result in an estimate
of total forecast opex that would not reasonably reflect the opex criteria. For the
purposes of constructing an alternative opex forecast that we think will reasonably
reflect the opex criteria, we have adjusted their base opex amounts downwards by an
appropriate margin having regard to the RPPs, the opex factors and the NEO.
We disagree with submissions made by Ergon Energy to the NSW and ACT draft
decisions that advocate we should abandon our benchmarking techniques and the
extent to which we rely upon our benchmarking results.721 Therefore, we continue to
721
Ergon Energy, Submission on the Draft Decisions: NSW and ACT distribution determinations 2015–16 to 2018–19,
13 February 2015, pp. 9–22.
7-253 Attachment 7 – Operating expenditure | Energex preliminary determination 2015–20
place significant weight on the results of Economic Insights' preferred model (Cobb
Douglas SFA) in estimating necessary reductions in base opex.
However, in light of submissions from service providers, we have reconsidered our
approach to determining the most appropriate way to make an adjustment.722 As we
explain in the Guideline, our preference is to rely on revealed expenditure as an
appropriate basis for forecasting efficient, prudent and realistic opex when service
providers are appropriately responding to the incentive framework. Therefore, rather
than adjusting all service providers below the most efficient performer (the frontier) the
Guideline approach is to adjust revealed opex when our analysis demonstrates it is
materially inefficient. 723
We have looked to international regulators' application of benchmarking for guidance
on benchmark comparison points. However, while many regulators apply
benchmarking, the application differs across regulatory regimes. Rather, when
determining the appropriate point at which to make an adjustment to expenditure, they
do so having regard to their regulatory framework and the task before them. Similarly,
we have decided on the benchmark comparison point (the threshold at which we make
an adjustment to base opex) having regard to our regulatory framework and the task
before us.
We have decided, on balance, for this decision the appropriate benchmark comparison
point is the lowest of the efficiency scores in the top quartile of possible scores rather
than the average approach we used in our draft decisions for the ACT and NSW
service providers. This is equivalent to the efficiency score for the business at the
bottom of the upper third (top 33 per cent) of companies in the benchmark sample
(represented by AusNet Services). Our approach of using benchmarking as a basis for
making adjustments to opex is consistent with Ofgem's approach.724
This reduces the benchmark comparison point we previously applied from 0.86 to 0.77.
In making this change to our approach, we have carefully considered the submissions
we have received, the requirements in the NEL and NER, the Guideline approach and
the advice of Economic Insights. The purpose of assessing base opex under the
Guideline approach is to identify material inefficiency. We must ensure, therefore, that
our comparison point appropriately reflects our satisfaction that a service provider's
revealed opex is materially inefficient before we reduce it.
This change reduces our estimate of the necessary adjustments to base year opex
significantly. However, given this is our first application of economic benchmarking, our
view is this application is appropriate for this preliminary determination. That is, we
722
Ergon Energy, Submission on the Draft Decisions: NSW and ACT distribution determinations 2015–16 to 2018–19,
13 February 2015, pp. 9–22. 723
AER, Expenditure Forecast Assessment Guideline, November 2013, p. 22. 724
Noting that Ofgem now assesses total expenditure rather than capex and opex separately. See, for example,
Ofgem, RIIO-ED1–Final determinations for the slow-track electricity distribution companies-Overview, 28
November 2014, Chapter 4.
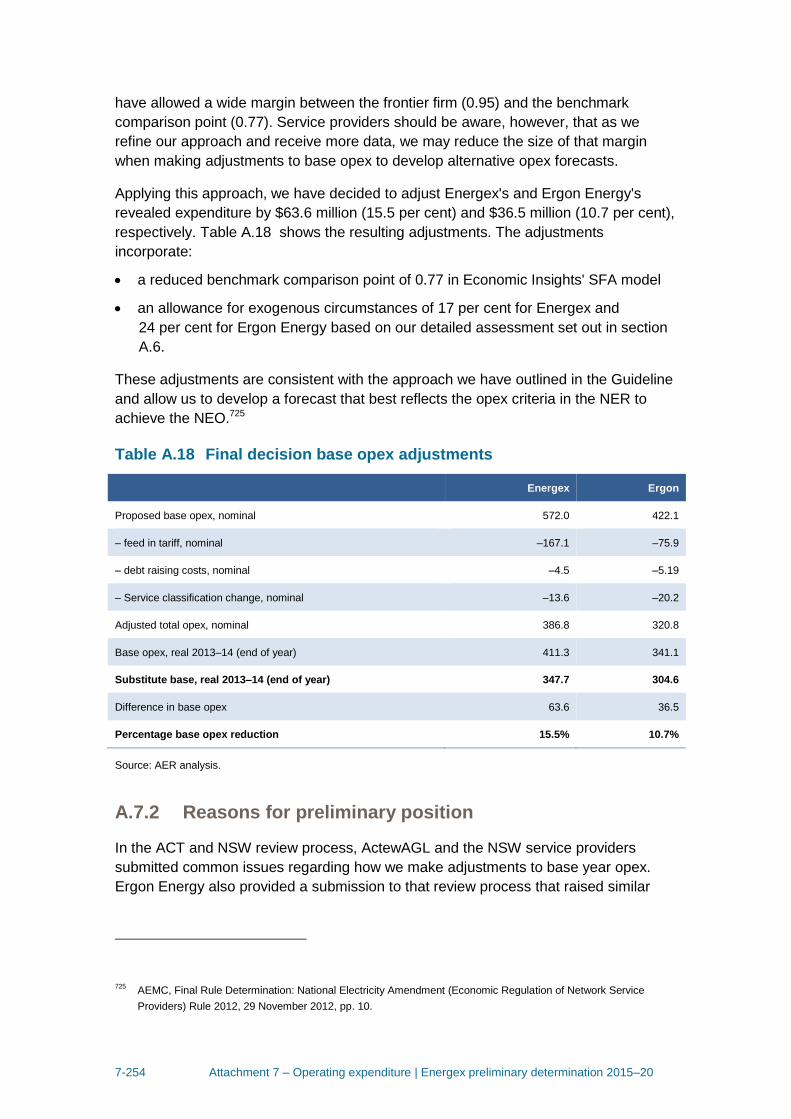
7-254 Attachment 7 – Operating expenditure | Energex preliminary determination 2015–20
have allowed a wide margin between the frontier firm (0.95) and the benchmark
comparison point (0.77). Service providers should be aware, however, that as we
refine our approach and receive more data, we may reduce the size of that margin
when making adjustments to base opex to develop alternative opex forecasts.
Applying this approach, we have decided to adjust Energex's and Ergon Energy's
revealed expenditure by $63.6 million (15.5 per cent) and $36.5 million (10.7 per cent),
respectively. Table A.18 shows the resulting adjustments. The adjustments
incorporate:
a reduced benchmark comparison point of 0.77 in Economic Insights' SFA model
an allowance for exogenous circumstances of 17 per cent for Energex and
24 per cent for Ergon Energy based on our detailed assessment set out in section
A.6.
These adjustments are consistent with the approach we have outlined in the Guideline
and allow us to develop a forecast that best reflects the opex criteria in the NER to
achieve the NEO.725
Table A.18 Final decision base opex adjustments
Energex Ergon
Proposed base opex, nominal 572.0 422.1
– feed in tariff, nominal –167.1 –75.9
– debt raising costs, nominal –4.5 –5.19
– Service classification change, nominal –13.6 –20.2
Adjusted total opex, nominal 386.8 320.8
Base opex, real 2013–14 (end of year) 411.3 341.1
Substitute base, real 2013–14 (end of year) 347.7 304.6
Difference in base opex 63.6 36.5
Percentage base opex reduction 15.5% 10.7%
Source: AER analysis.
A.7.2 Reasons for preliminary position
In the ACT and NSW review process, ActewAGL and the NSW service providers
submitted common issues regarding how we make adjustments to base year opex.
Ergon Energy also provided a submission to that review process that raised similar
725
AEMC, Final Rule Determination: National Electricity Amendment (Economic Regulation of Network Service
Providers) Rule 2012, 29 November 2012, pp. 10.

7-255 Attachment 7 – Operating expenditure | Energex preliminary determination 2015–20
issues.726 We have carefully considered these submissions as part of our decision on
the appropriate benchmark comparison point and the adjustment process.
The appropriate benchmark comparison point
Service providers have submitted that our approach to adjustments is different to that
of other regulators.727 ActewAGL contends, for example, that we have erred by placing
reliance on a single benchmarking model as different benchmarking approaches imply
differing base year opex adjustments.728 Ergon Energy and its consultants also submit
that:729
our efficiency gap is large and inconsistent with international precedent
our application of benchmarking results is inconsistent with international practice
and literature
our target is not appropriately cautious when compared to Economic Insights'
previous views as expressed in publications.
The service providers have also submitted that, by using average efficiency scores as
the basis for our adjustment, we have used a 'false frontier'730 and, additionally, that
our roll forward approach has been applied incorrectly.731
In light of submissions, we have reconsidered our approach to making an adjustment
and we have modified it appropriately for this final decision. This involves consideration
of the appropriate technique, the benchmark comparison point and the appropriate
application of our technique.
The best technique for the adjustment
Consistent with our approach in the NSW and ACT draft decisions, we continue to
adopt Economic Insights' recommendation to rely on the Cobb Douglas SFA model as
the preferred technique upon which we base an adjustment to revealed opex. Our
rationale for this is SFA is the most statistically superior method because it directly
estimates efficiency, separate from the error term.732 We provide more detail on
Economic Insights' preference to use SFA in section A.4.
726
Ergon Energy, Submission on the Draft Decisions: NSW and ACT distribution determinations 2015–16 to 2018–19,
13 February 2015, pp. 9–22. 727
ActewAGL, Revised Regulatory Proposal, 2015, pp. 117, 126, p. 127–129, Ausgrid, Revised regulatory proposal,
2015, pp. 139–140. 728
ActewAGL, Revised Regulatory Proposal, 2015, p. 118. 729
Ergon Energy, Submission on the Draft Decisions: NSW and ACT distribution determinations 2015–16 to 2018–19,
13 February 2015, pp. 9–22.; Frontier Economics (Ergon), 2015. 730
Ausgrid, Revised Regulatory Proposal, pp. 143–144; ActewAGL Revised Regulatory Proposal, pp. 166–175. 731
ActewAGL Revised Regulatory Proposal, p. 166; Frontier Economics, (NSW), 2015, p.97, PEGR, 2015, p.64.
CEPA, (NSW) 2015, p. 35. 732
Economic Insights (2014), section 5.

7-256 Attachment 7 – Operating expenditure | Energex preliminary determination 2015–20
The benchmark comparison point
We have reconsidered the appropriate benchmark comparison point following
submissions on our approach. In doing so, two questions are relevant:
should the benchmark comparison point be the best performing business?
if not, what is the appropriate point at which we are satisfied there is evidence of
material inefficiency in the base opex?
Should we use the best performing business as our comparison point?
We explain in the Guideline that our preference is to rely on revealed expenditure as
an appropriate basis for forecasting efficient, prudent and realistic opex when service
providers are appropriately responding to the incentive framework. Therefore, we
created a threshold in the Guideline—we would adjust revealed opex when our
analysis demonstrates it is materially inefficient.733
The first opex criterion (efficient costs) suggests that the most appropriate benchmark
comparison point may be the top performing business because economic theory would
not consider a lower point to be efficient. The theoretical comparison point is therefore
0.95. However, the NER also contain the qualifier 'reasonably reflects'.734 This provides
us with discretion to determine how far from the frontier a service provider must be
before we are satisfied, in accordance with the Guideline approach, that it is 'materially
inefficient'.
In determining what is 'materially inefficient', we recognise that there should be an
appropriate margin for forecasting error, data error and modelling issues. Our view is,
therefore, that using this discretion it is appropriate to choose a lower comparison point
than the frontier firm.
In the NSW and ACT draft decisions, we adopted this approach. On Economic
Insights' recommendation, we used the weighted average efficiency scores of all
service providers with efficiency scores greater than 0.75 as the benchmark
comparison point.735 This enabled us to incorporate a margin for potential data and
modelling issues, and resulted in a comparison point of 0.86. However, submissions by
the service providers and their consultants consider our draft decision approach for the
ACT and NSW service providers was inconsistent with approaches taken by other
733
AER, Expenditure Forecast Assessment Guideline, November 2013, p. 22. 734
NER, clause 6.5.6(c) states:
The AER must accept the forecast of required operating expenditure of a Distribution Network Service Provider
that is included in a building block proposal if the AER is satisfied that the total of the forecast operating
expenditure for the regulatory control period reasonably reflects each of the following (the operating expenditure
criteria):
(1) the efficient costs of achieving the operating expenditure objectives… 735
Economic Insights (2014), section 7.
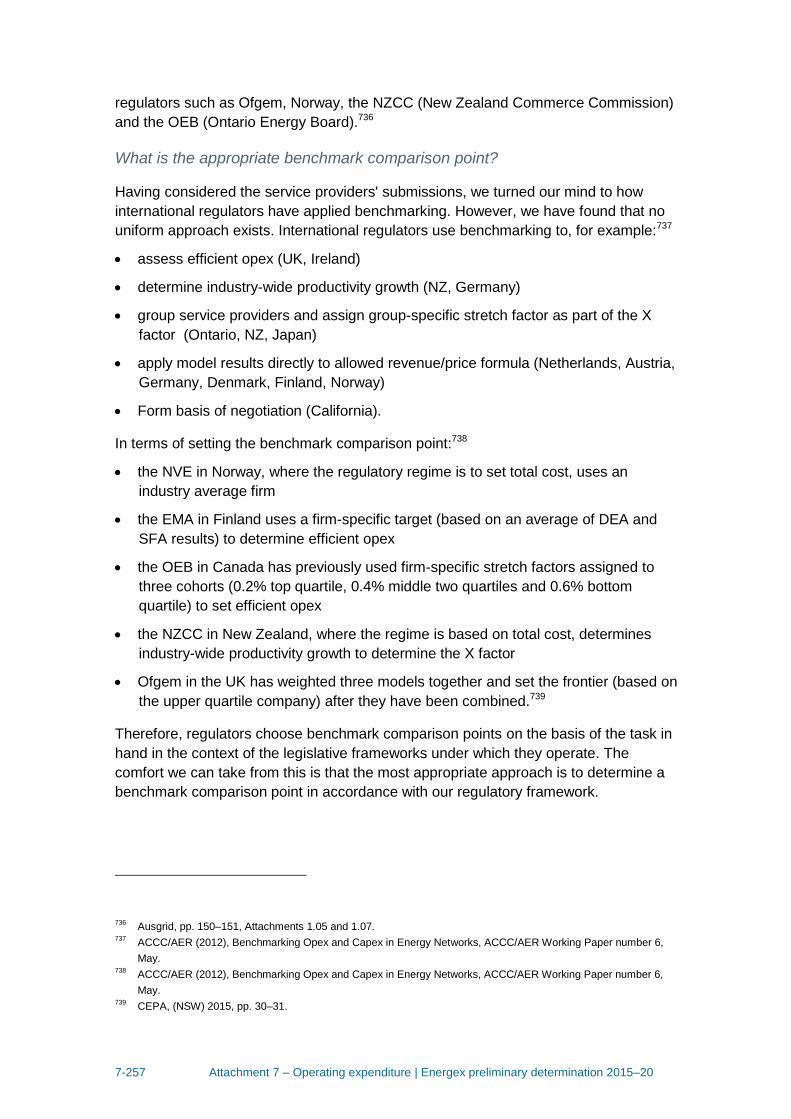
7-257 Attachment 7 – Operating expenditure | Energex preliminary determination 2015–20
regulators such as Ofgem, Norway, the NZCC (New Zealand Commerce Commission)
and the OEB (Ontario Energy Board).736
What is the appropriate benchmark comparison point?
Having considered the service providers' submissions, we turned our mind to how
international regulators have applied benchmarking. However, we have found that no
uniform approach exists. International regulators use benchmarking to, for example:737
assess efficient opex (UK, Ireland)
determine industry-wide productivity growth (NZ, Germany)
group service providers and assign group-specific stretch factor as part of the X
factor (Ontario, NZ, Japan)
apply model results directly to allowed revenue/price formula (Netherlands, Austria,
Germany, Denmark, Finland, Norway)
Form basis of negotiation (California).
In terms of setting the benchmark comparison point:738
the NVE in Norway, where the regulatory regime is to set total cost, uses an
industry average firm
the EMA in Finland uses a firm-specific target (based on an average of DEA and
SFA results) to determine efficient opex
the OEB in Canada has previously used firm-specific stretch factors assigned to
three cohorts (0.2% top quartile, 0.4% middle two quartiles and 0.6% bottom
quartile) to set efficient opex
the NZCC in New Zealand, where the regime is based on total cost, determines
industry-wide productivity growth to determine the X factor
Ofgem in the UK has weighted three models together and set the frontier (based on
the upper quartile company) after they have been combined.739
Therefore, regulators choose benchmark comparison points on the basis of the task in
hand in the context of the legislative frameworks under which they operate. The
comfort we can take from this is that the most appropriate approach is to determine a
benchmark comparison point in accordance with our regulatory framework.
736
Ausgrid, pp. 150–151, Attachments 1.05 and 1.07. 737
ACCC/AER (2012), Benchmarking Opex and Capex in Energy Networks, ACCC/AER Working Paper number 6,
May. 738
ACCC/AER (2012), Benchmarking Opex and Capex in Energy Networks, ACCC/AER Working Paper number 6,
May. 739
CEPA, (NSW) 2015, pp. 30–31.

7-258 Attachment 7 – Operating expenditure | Energex preliminary determination 2015–20
We have decided, on balance, for this decision the appropriate benchmark comparison
point is the lowest of the efficiency scores in the top quartile of possible scores rather
than the average approach we used in our draft decisions for the ACT and NSW
service providers. This is equivalent to the efficiency score for the business at the
bottom of the upper third (top 33 per cent) of companies in the benchmark sample
(represented by AusNet Services). Our revised comparison point is appropriate for the
following reasons.
First, our previous averaging approach produced an unusual result for service
providers ranked in the top quartile of efficiency scores, but below the average of that
top quartile. These service providers would require an efficiency adjustment to reach
the average benchmark comparison point (because their scores are below the
average) despite being efficient enough to be ranked in the top quartile and, hence,
included in the average.
Second, given it is our first application of benchmarking, it is appropriate to adopt a
cautious approach. We have decided to increase the margin for error for modelling and
data issues provided for in the draft decisions for the ACT and NSW service providers
(which reduced the benchmark comparison point from 0.95 to 0.86).
Third, we consider this approach better achieves with the NEO and RPPs. In particular
we have considered:740
the principle that we should provide service providers with an opportunity to recover
at least their efficient costs
we wish to create a high-powered efficiency incentive (which supports making an
adjustment when it is clear there is material inefficiency in revealed costs) but we
are mindful of providing sufficient stability to promote efficient investment
our decision should allow a return that is commensurate with both regulatory and
commercial risks.
A number of service providers, representing more than a third of the NEM, and
operating in varied environments, are able to perform at or above our benchmark
comparison point. We are confident that a firm that performs below this level is,
therefore, spending in a manner that does not reasonably reflect the opex criteria. An
adjustment back to an appropriate threshold is sufficient to remove the material over-
expenditure in the revealed costs while still incorporating an appropriately wide margin
for potential modelling and data errors and other uncertainties. Economic Insights
agrees that this approach is appropriate.741
740
NEL, section 7A. 741
Economic Insights (2015), section 5.1.
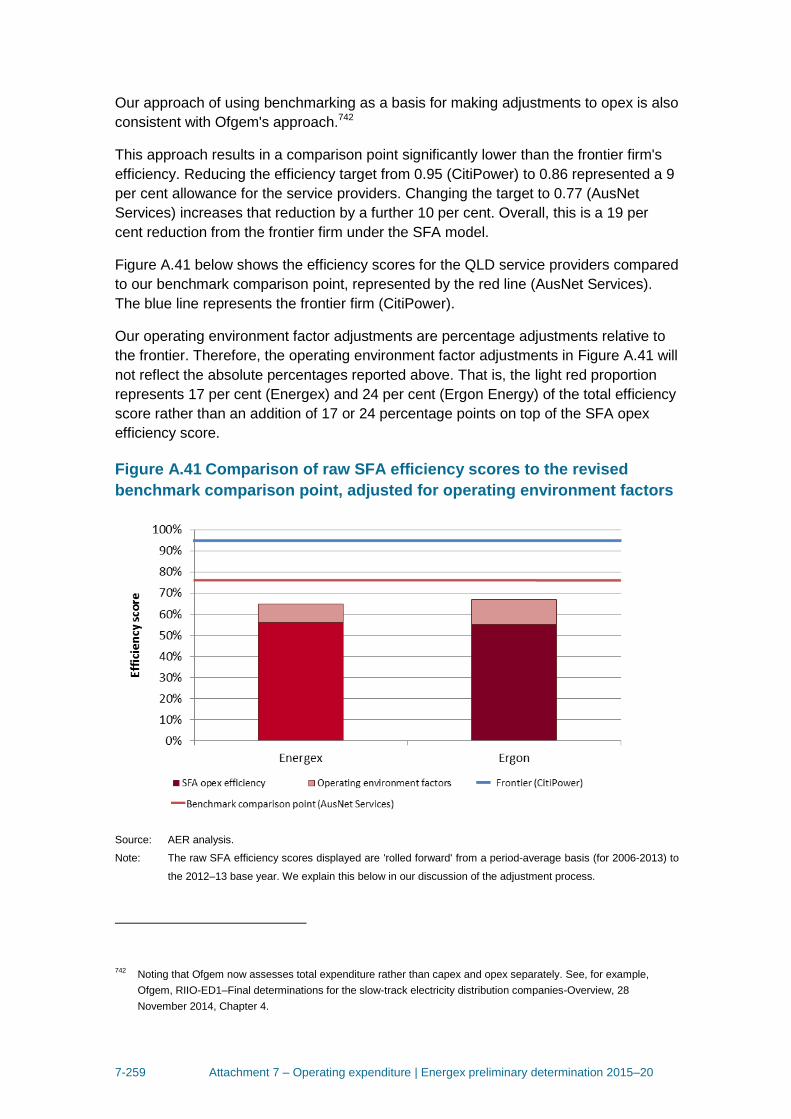
7-259 Attachment 7 – Operating expenditure | Energex preliminary determination 2015–20
Our approach of using benchmarking as a basis for making adjustments to opex is also
consistent with Ofgem's approach.742
This approach results in a comparison point significantly lower than the frontier firm's
efficiency. Reducing the efficiency target from 0.95 (CitiPower) to 0.86 represented a 9
per cent allowance for the service providers. Changing the target to 0.77 (AusNet
Services) increases that reduction by a further 10 per cent. Overall, this is a 19 per
cent reduction from the frontier firm under the SFA model.
Figure A.41 below shows the efficiency scores for the QLD service providers compared
to our benchmark comparison point, represented by the red line (AusNet Services).
The blue line represents the frontier firm (CitiPower).
Our operating environment factor adjustments are percentage adjustments relative to
the frontier. Therefore, the operating environment factor adjustments in Figure A.41 will
not reflect the absolute percentages reported above. That is, the light red proportion
represents 17 per cent (Energex) and 24 per cent (Ergon Energy) of the total efficiency
score rather than an addition of 17 or 24 percentage points on top of the SFA opex
efficiency score.
Figure A.41 Comparison of raw SFA efficiency scores to the revised
benchmark comparison point, adjusted for operating environment factors
Source: AER analysis.
Note: The raw SFA efficiency scores displayed are 'rolled forward' from a period-average basis (for 2006-2013) to
the 2012–13 base year. We explain this below in our discussion of the adjustment process.
742
Noting that Ofgem now assesses total expenditure rather than capex and opex separately. See, for example,
Ofgem, RIIO-ED1–Final determinations for the slow-track electricity distribution companies-Overview, 28
November 2014, Chapter 4.
7-260 Attachment 7 – Operating expenditure | Energex preliminary determination 2015–20
Figure A.41 demonstrates an appropriately conservative difference between the
frontier firm and our benchmark comparison point. As we refine our approach and
continue to receive more data—all service providers must submit data each year— we
may revise our benchmark comparison point when making adjustments to base opex
to develop alternative opex forecasts.
The adjustment process
The mechanics of determining the adjustment include several steps. In essence, it
involves using the SFA model to estimate average period efficiency, which we adjust to
take into account the reduced the benchmark comparison point and operating
environment factor allowances. We then roll this average period efficient opex forward
to the 2012–13 base year to compare efficient base opex to the service provider's
reported base opex.
Some service providers submit that both using an average approach and rolling it
forward are inappropriate.743 Here, we clarify why we consider our approach is
appropriate.
Average period efficiency scores
A key reason we use average period efficiency scores is because they moderate the
impact of year-specific fluctuations not under the control of the service provider (such
as weather conditions) while also reducing the scope for the service provider to
strategically reduce its reported opex in a single, nominated benchmark year. 744
Average efficiency results also provide us with a better estimate of underlying recurrent
expenditure not influenced by year on year changes, which we require for the
Guideline approach to estimating total forecast opex.
In addition, because the sample period is the eight years from 2006 to 2013, Economic
Insights considers the average is sufficiently recent to avoid the potential loss of
current relevance.745 Economic Insights also considers the performance gap has not
narrowed for the following reasons:746
the Victorian service providers experienced a negative rate of technical change
(which leads to a negative rate of opex partial productivity growth) due to allowed
step changes following the implementation of Victorian Bushfires Royal
Commission recommendations
the SFA and LSE models calculate average efficiency levels over the period and
these averages incorporate the influence of the situation at the end of the period.
743
Ausgrid, Revised Regulatory Proposal, pp. 143–144; ActewAGL Revised Regulatory Proposal, pp. 166–175;
Frontier Economics, (NSW), 2015, p.97, PEGR, 2015, p.64. CEPA, (NSW) 2015, p.35. 744
Economic Insights (2015), section 4.1. 745
Economic Insights (2015), section 4.1. 746
Economic Insights (2015), section 4.3.
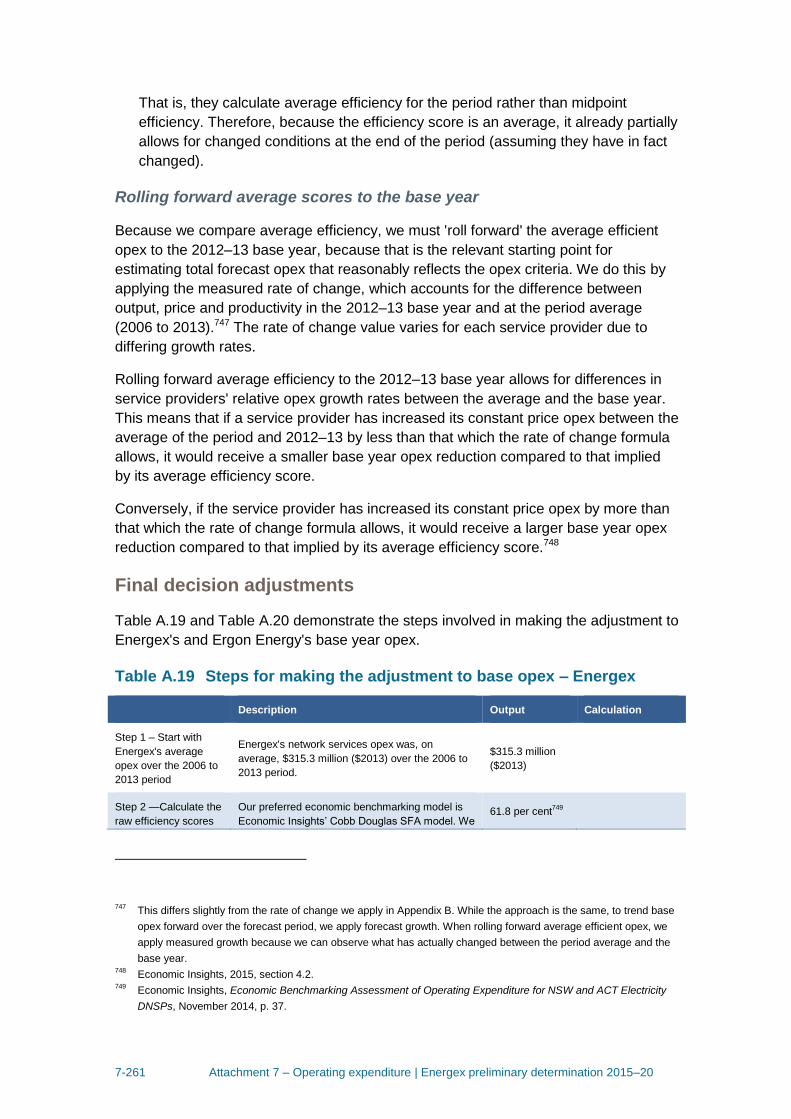
7-261 Attachment 7 – Operating expenditure | Energex preliminary determination 2015–20
That is, they calculate average efficiency for the period rather than midpoint
efficiency. Therefore, because the efficiency score is an average, it already partially
allows for changed conditions at the end of the period (assuming they have in fact
changed).
Rolling forward average scores to the base year
Because we compare average efficiency, we must 'roll forward' the average efficient
opex to the 2012–13 base year, because that is the relevant starting point for
estimating total forecast opex that reasonably reflects the opex criteria. We do this by
applying the measured rate of change, which accounts for the difference between
output, price and productivity in the 2012–13 base year and at the period average
(2006 to 2013).747 The rate of change value varies for each service provider due to
differing growth rates.
Rolling forward average efficiency to the 2012–13 base year allows for differences in
service providers' relative opex growth rates between the average and the base year.
This means that if a service provider has increased its constant price opex between the
average of the period and 2012–13 by less than that which the rate of change formula
allows, it would receive a smaller base year opex reduction compared to that implied
by its average efficiency score.
Conversely, if the service provider has increased its constant price opex by more than
that which the rate of change formula allows, it would receive a larger base year opex
reduction compared to that implied by its average efficiency score.748
Final decision adjustments
Table A.19 and Table A.20 demonstrate the steps involved in making the adjustment to
Energex's and Ergon Energy's base year opex.
Table A.19 Steps for making the adjustment to base opex – Energex
Description Output Calculation
Step 1 – Start with
Energex's average
opex over the 2006 to
2013 period
Energex's network services opex was, on
average, $315.3 million ($2013) over the 2006 to
2013 period.
$315.3 million
($2013)
Step 2 —Calculate the
raw efficiency scores
Our preferred economic benchmarking model is
Economic Insights’ Cobb Douglas SFA model. We 61.8 per cent
749
747
This differs slightly from the rate of change we apply in Appendix B. While the approach is the same, to trend base
opex forward over the forecast period, we apply forecast growth. When rolling forward average efficient opex, we
apply measured growth because we can observe what has actually changed between the period average and the
base year. 748
Economic Insights, 2015, section 4.2. 749
Economic Insights, Economic Benchmarking Assessment of Operating Expenditure for NSW and ACT Electricity
DNSPs, November 2014, p. 37.
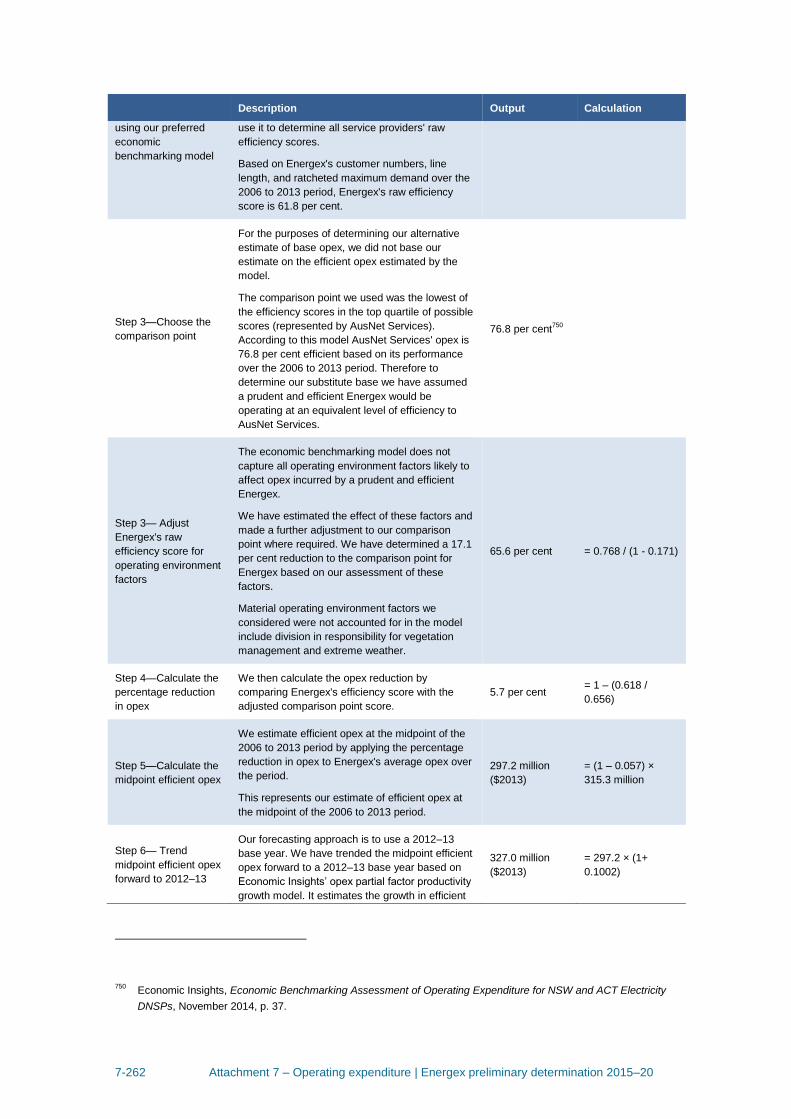
7-262 Attachment 7 – Operating expenditure | Energex preliminary determination 2015–20
Description Output Calculation
using our preferred
economic
benchmarking model
use it to determine all service providers' raw
efficiency scores.
Based on Energex's customer numbers, line
length, and ratcheted maximum demand over the
2006 to 2013 period, Energex's raw efficiency
score is 61.8 per cent.
Step 3—Choose the
comparison point
For the purposes of determining our alternative
estimate of base opex, we did not base our
estimate on the efficient opex estimated by the
model.
The comparison point we used was the lowest of
the efficiency scores in the top quartile of possible
scores (represented by AusNet Services).
According to this model AusNet Services' opex is
76.8 per cent efficient based on its performance
over the 2006 to 2013 period. Therefore to
determine our substitute base we have assumed
a prudent and efficient Energex would be
operating at an equivalent level of efficiency to
AusNet Services.
76.8 per cent750
Step 3— Adjust
Energex's raw
efficiency score for
operating environment
factors
The economic benchmarking model does not
capture all operating environment factors likely to
affect opex incurred by a prudent and efficient
Energex.
We have estimated the effect of these factors and
made a further adjustment to our comparison
point where required. We have determined a 17.1
per cent reduction to the comparison point for
Energex based on our assessment of these
factors.
Material operating environment factors we
considered were not accounted for in the model
include division in responsibility for vegetation
management and extreme weather.
65.6 per cent = 0.768 / (1 - 0.171)
Step 4—Calculate the
percentage reduction
in opex
We then calculate the opex reduction by
comparing Energex's efficiency score with the
adjusted comparison point score.
5.7 per cent = 1 – (0.618 /
0.656)
Step 5—Calculate the
midpoint efficient opex
We estimate efficient opex at the midpoint of the
2006 to 2013 period by applying the percentage
reduction in opex to Energex's average opex over
the period.
This represents our estimate of efficient opex at
the midpoint of the 2006 to 2013 period.
297.2 million
($2013)
= (1 – 0.057) ×
315.3 million
Step 6— Trend
midpoint efficient opex
forward to 2012–13
Our forecasting approach is to use a 2012–13
base year. We have trended the midpoint efficient
opex forward to a 2012–13 base year based on
Economic Insights’ opex partial factor productivity
growth model. It estimates the growth in efficient
327.0 million
($2013)
= 297.2 × (1+
0.1002)
750
Economic Insights, Economic Benchmarking Assessment of Operating Expenditure for NSW and ACT Electricity
DNSPs, November 2014, p. 37.

7-263 Attachment 7 – Operating expenditure | Energex preliminary determination 2015–20
Description Output Calculation
opex based on growth in customer numbers, line
length, ratcheted maximum demand and share of
undergrounding.
It estimated the growth in efficient opex based on
Energex’s growth in these inputs in this period to
be 10.02 per cent.
Step 7—Adjust our
estimate of 2012–13
base year opex for
CPI
The output in step 6 is in real 2013 dollars. We
need to convert it to real 2014–15 dollars for the
purposes of forming our substitute estimate of
base opex. This reflects two and a half years of
inflation. This is our estimate of base opex.
347.7
million ($2014–
15)
= 327.0 × (1 +
0.063)
Source: AER analysis
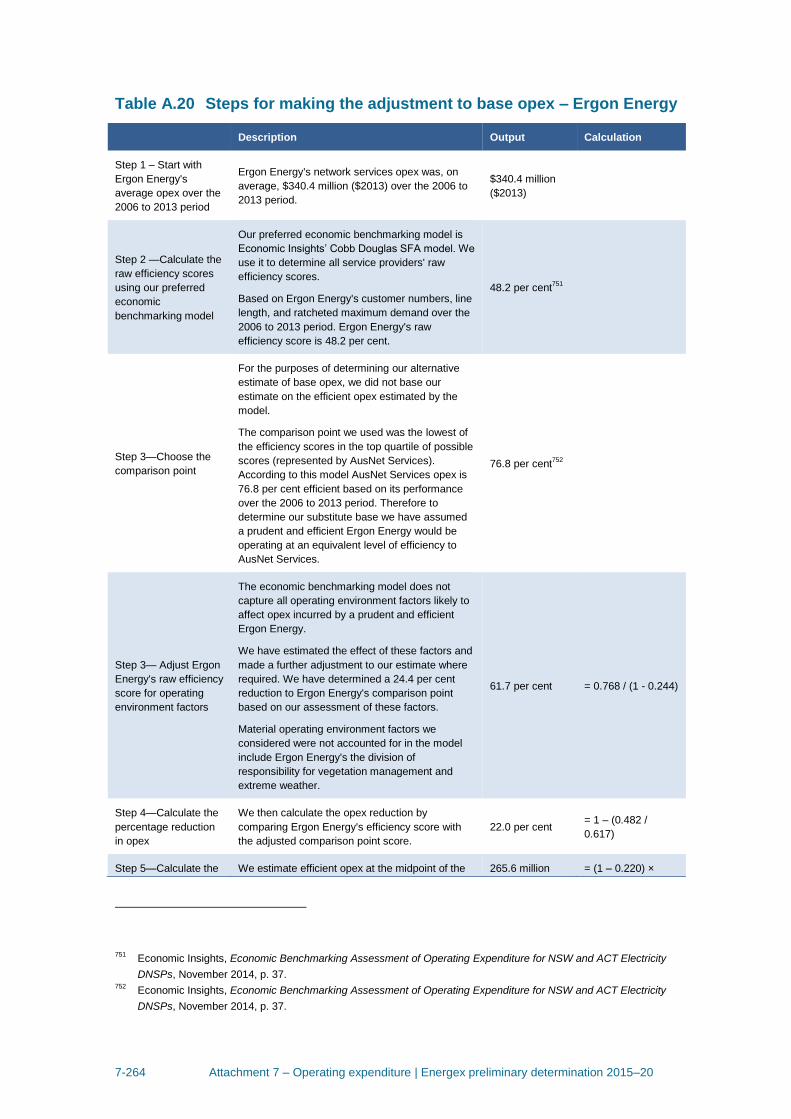
7-264 Attachment 7 – Operating expenditure | Energex preliminary determination 2015–20
Table A.20 Steps for making the adjustment to base opex – Ergon Energy
Description Output Calculation
Step 1 – Start with
Ergon Energy's
average opex over the
2006 to 2013 period
Ergon Energy's network services opex was, on
average, $340.4 million ($2013) over the 2006 to
2013 period.
$340.4 million
($2013)
Step 2 —Calculate the
raw efficiency scores
using our preferred
economic
benchmarking model
Our preferred economic benchmarking model is
Economic Insights’ Cobb Douglas SFA model. We
use it to determine all service providers' raw
efficiency scores.
Based on Ergon Energy's customer numbers, line
length, and ratcheted maximum demand over the
2006 to 2013 period. Ergon Energy's raw
efficiency score is 48.2 per cent.
48.2 per cent751
Step 3—Choose the
comparison point
For the purposes of determining our alternative
estimate of base opex, we did not base our
estimate on the efficient opex estimated by the
model.
The comparison point we used was the lowest of
the efficiency scores in the top quartile of possible
scores (represented by AusNet Services).
According to this model AusNet Services opex is
76.8 per cent efficient based on its performance
over the 2006 to 2013 period. Therefore to
determine our substitute base we have assumed
a prudent and efficient Ergon Energy would be
operating at an equivalent level of efficiency to
AusNet Services.
76.8 per cent752
Step 3— Adjust Ergon
Energy's raw efficiency
score for operating
environment factors
The economic benchmarking model does not
capture all operating environment factors likely to
affect opex incurred by a prudent and efficient
Ergon Energy.
We have estimated the effect of these factors and
made a further adjustment to our estimate where
required. We have determined a 24.4 per cent
reduction to Ergon Energy's comparison point
based on our assessment of these factors.
Material operating environment factors we
considered were not accounted for in the model
include Ergon Energy's the division of
responsibility for vegetation management and
extreme weather.
61.7 per cent = 0.768 / (1 - 0.244)
Step 4—Calculate the
percentage reduction
in opex
We then calculate the opex reduction by
comparing Ergon Energy's efficiency score with
the adjusted comparison point score.
22.0 per cent = 1 – (0.482 /
0.617)
Step 5—Calculate the We estimate efficient opex at the midpoint of the 265.6 million = (1 – 0.220) ×
751
Economic Insights, Economic Benchmarking Assessment of Operating Expenditure for NSW and ACT Electricity
DNSPs, November 2014, p. 37. 752
Economic Insights, Economic Benchmarking Assessment of Operating Expenditure for NSW and ACT Electricity
DNSPs, November 2014, p. 37.
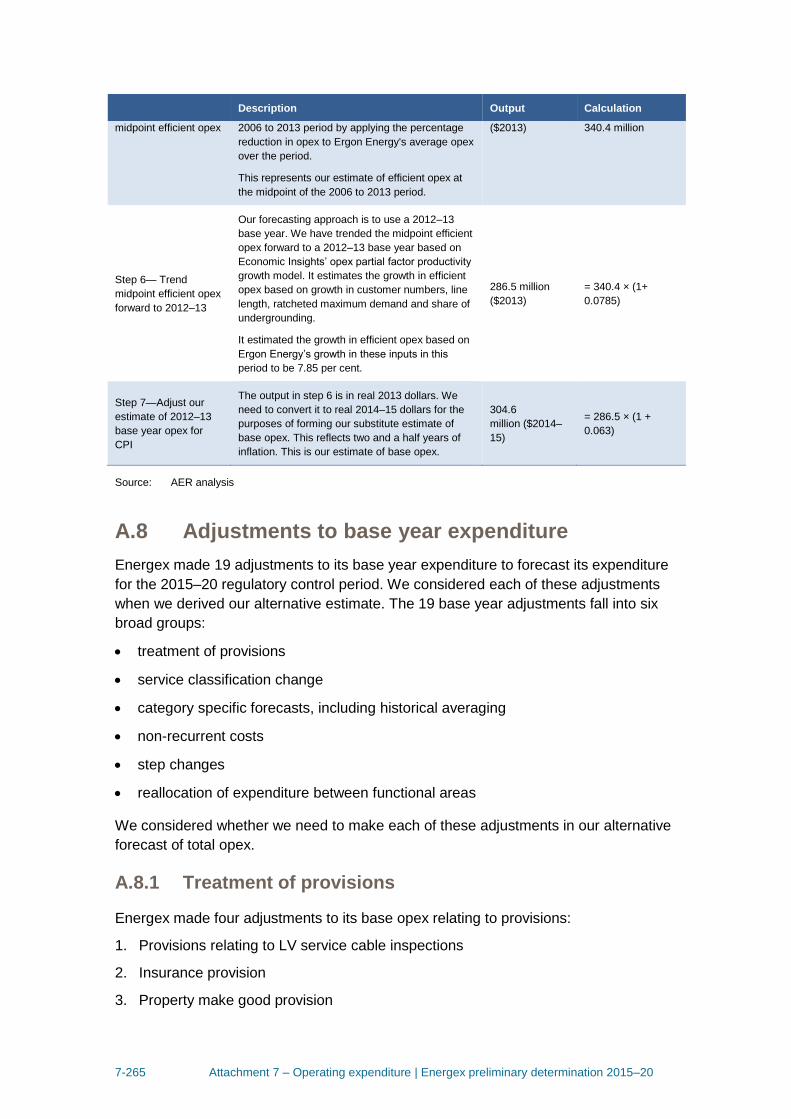
7-265 Attachment 7 – Operating expenditure | Energex preliminary determination 2015–20
Description Output Calculation
midpoint efficient opex 2006 to 2013 period by applying the percentage
reduction in opex to Ergon Energy's average opex
over the period.
This represents our estimate of efficient opex at
the midpoint of the 2006 to 2013 period.
($2013) 340.4 million
Step 6— Trend
midpoint efficient opex
forward to 2012–13
Our forecasting approach is to use a 2012–13
base year. We have trended the midpoint efficient
opex forward to a 2012–13 base year based on
Economic Insights’ opex partial factor productivity
growth model. It estimates the growth in efficient
opex based on growth in customer numbers, line
length, ratcheted maximum demand and share of
undergrounding.
It estimated the growth in efficient opex based on
Ergon Energy’s growth in these inputs in this
period to be 7.85 per cent.
286.5 million
($2013)
= 340.4 × (1+
0.0785)
Step 7—Adjust our
estimate of 2012–13
base year opex for
CPI
The output in step 6 is in real 2013 dollars. We
need to convert it to real 2014–15 dollars for the
purposes of forming our substitute estimate of
base opex. This reflects two and a half years of
inflation. This is our estimate of base opex.
304.6
million ($2014–
15)
= 286.5 × (1 +
0.063)
Source: AER analysis
A.8 Adjustments to base year expenditure
Energex made 19 adjustments to its base year expenditure to forecast its expenditure
for the 2015–20 regulatory control period. We considered each of these adjustments
when we derived our alternative estimate. The 19 base year adjustments fall into six
broad groups:
treatment of provisions
service classification change
category specific forecasts, including historical averaging
non-recurrent costs
step changes
reallocation of expenditure between functional areas
We considered whether we need to make each of these adjustments in our alternative
forecast of total opex.
A.8.1 Treatment of provisions
Energex made four adjustments to its base opex relating to provisions:
1. Provisions relating to LV service cable inspections
2. Insurance provision
3. Property make good provision
7-266 Attachment 7 – Operating expenditure | Energex preliminary determination 2015–20
4. EWP Repairs—Fleet
We stated in our Expenditure forecast assessment guideline that we would likely
assess base year expenditure exclusive of any movements in provisions that occurred
in that year.753 The value of provisions is estimated using value and timing
assumptions regarding liability that have yet to be paid out. These assumptions are
sometimes changed, altering the value of provisions. This will change not only the
value of the liabilities accrued in the year in question, but also liabilities accrued in prior
years that have not yet been paid out. This is one reason why we consider movement
in provision may not reflect the expenditure incurred in a given year.
However, we have not explicitly removed movements in provisions from Energex's
base year opex because we have applied an efficiency adjustment. This efficiency
adjustment implicitly removes movements in provisions by setting base opex equal to a
benchmark amount. We derived this benchmark amount from multiple data points from
multiple service providers across multiple years, effectively removing movements in
provisions.
A.8.2 Service classification change
Energex's base year expenditure included $14.3 million ($2014–15) for services that
will not be classified as standard control services for the 2015–20 period.754 We have
removed this expenditure from Energex's base year expenditure to develop our
alternative opex forecast. Energex made the following adjustments to base opex for
changes to service classification:
streetlight inspection expenditure
reclassification of metering services to alternative control services (direct
maintenance costs)
reclassification of metering services to alternative control services (indirect costs)
A.8.3 Category specific forecasts
Energex proposed the following base year adjustments for the following costs, for
which it has adopted category specific forecasts:
corrective repair historical average
emergency response historical average
corporate Program.
We consider Energex's use of category specific forecasts in our assessment of
Energex's forecasting method in appendix A.
753
AER, Expenditure Forecast Assessment Guideline for Electricity Distribution, November 2013, p. 22. 754
Ergon Energy, 06.02.06 Base Step Trend Database, December 2014.
7-267 Attachment 7 – Operating expenditure | Energex preliminary determination 2015–20
A.8.4 Non-recurrent expenditure
Energex expenditure from its base year expenditure because it considered them to be
non-recurrent and that they would not be incurred in the forecast period:
cancelled projects
redundancy costs
fleet—fuel tax credit.
We have not explicitly removed these costs from Energex's base year opex because
we have applied an efficiency adjustment. This efficiency adjustment implicitly removes
non-recurrent costs by setting base opex equal to a benchmark amount.
Where we do not apply an efficiency adjustment to base opex we would also not
remove non-recurrent expenditure from the base year. This is because the EBSS
would offset the increase in base opex and share the non-recurrent expenditure
increase between the service provider and its network users.
A.8.5 Step changes
Energex proposed the following base year adjustments that we have assessed as step
changes:
LV crossarm planned replacement program
additional matrix support/licencing costs
protection reviews
overhead service inspections
property rent.
We state in our Expenditure forecast assessment guideline that we may add (or
subtract) step changes for any costs not captured in base opex or the rate of change
that are required for forecast opex to meet the opex criteria.755 Energex proposed
these base year adjustment because the amount of expenditure in the base year was
not representative of its expectation of expenditure in the 2015–20 regulatory control
period. Consequently, if these adjustments are required for the opex forecast to meet
the opex criteria, we would add (or subtract) them as step changes in our alternative
forecast.
A.8.6 Reallocation of expenditure between functional areas
Energex uses its opex model to forecast expenditure for each opex category or
'functional area'. It stated that within its model it had reallocated some expenditure from
one opex category to a different category for the forecast period. These adjustments
755
AER, Expenditure forecast assessment guideline for electricity distribution, November 2013, p. 24.
7-268 Attachment 7 – Operating expenditure | Energex preliminary determination 2015–20
had no net impact on total opex. We, however, forecast total opex, rather than opex at
the category level. Consequently we did not make the same adjustments.
A.9 Estimate of final year expenditure
To derive our alternative opex estimate we used the adjusted base year expenditure to
estimate final year expenditure.
Our Guideline states we estimate final year expenditure to be equal to:
( )
where:
is the best estimate of actual opex for the final year of the preceding regulatory
control period
is the determined opex allowance for the final year of the preceding regulatory
control period
is the determined opex allowance for the base year
is the amount of actual opex in the base year
is the non recurrent efficiency gain in the base year.
To ensure Energex shares efficiency gains made in 2014–15 with its network users as
intended by the EBSS this estimate should be consistent in both our opex forecast and
the EBSS. Version one of the EBSS for distribution businesses does not allow for the
non-recurrent efficiency gain adjustment to base year expenditure (version two, which
will apply in the 2015–20 regulatory control period does). We are required to have
regard to whether the opex forecast is consistent with the EBSS when deciding
whether we are satisfied that the proposed opex forecast reasonably reflects the opex
criteria.756 Consequently we have not adjusted base year expenditure for any
non-recurrent efficiency gains.
We applied this equation to derive an estimated opex of $429.7 million (real 2014–15)
for 2014–15. We then applied our forecast rate of change, and added step changes, to
derive our alternative estimate of opex for the 2015–20 regulatory control period.
756
NER, cl. 6.5.6(e)(8).
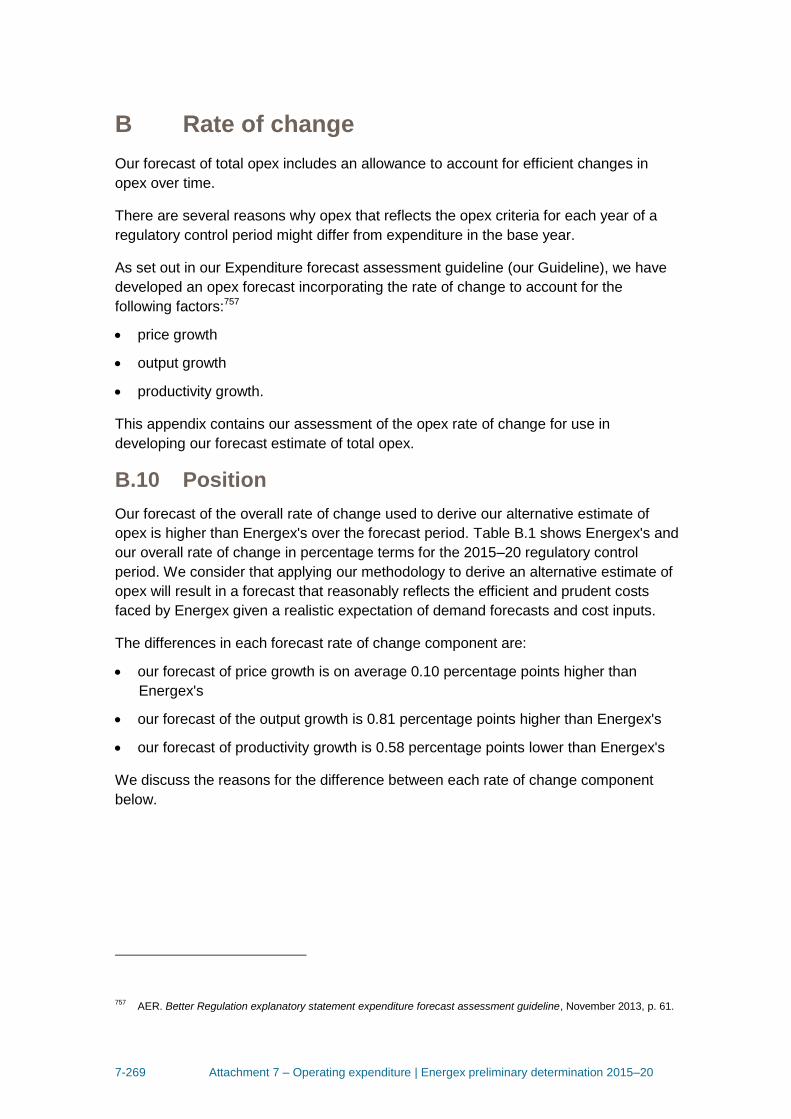
7-269 Attachment 7 – Operating expenditure | Energex preliminary determination 2015–20
B Rate of change
Our forecast of total opex includes an allowance to account for efficient changes in
opex over time.
There are several reasons why opex that reflects the opex criteria for each year of a
regulatory control period might differ from expenditure in the base year.
As set out in our Expenditure forecast assessment guideline (our Guideline), we have
developed an opex forecast incorporating the rate of change to account for the
following factors:757
price growth
output growth
productivity growth.
This appendix contains our assessment of the opex rate of change for use in
developing our forecast estimate of total opex.
B.10 Position
Our forecast of the overall rate of change used to derive our alternative estimate of
opex is higher than Energex's over the forecast period. Table B.1 shows Energex's and
our overall rate of change in percentage terms for the 2015–20 regulatory control
period. We consider that applying our methodology to derive an alternative estimate of
opex will result in a forecast that reasonably reflects the efficient and prudent costs
faced by Energex given a realistic expectation of demand forecasts and cost inputs.
The differences in each forecast rate of change component are:
our forecast of price growth is on average 0.10 percentage points higher than
Energex's
our forecast of the output growth is 0.81 percentage points higher than Energex's
our forecast of productivity growth is 0.58 percentage points lower than Energex's
We discuss the reasons for the difference between each rate of change component
below.
757
AER. Better Regulation explanatory statement expenditure forecast assessment guideline, November 2013, p. 61.
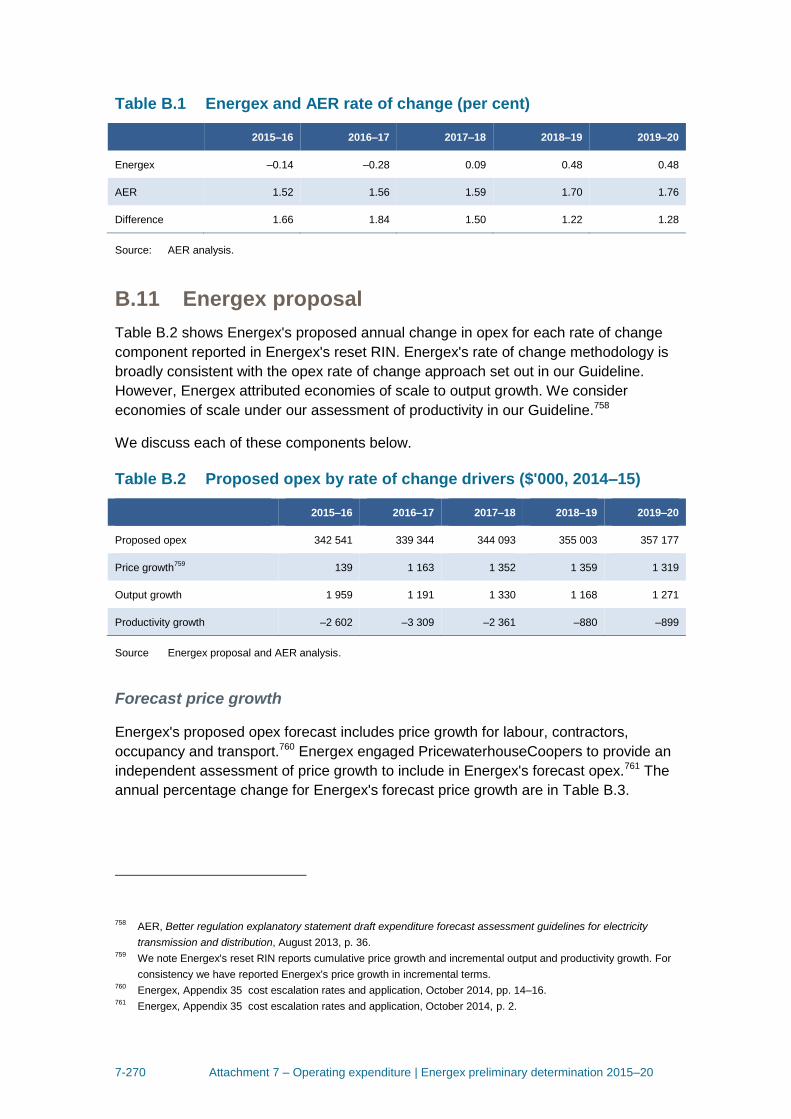
7-270 Attachment 7 – Operating expenditure | Energex preliminary determination 2015–20
Table B.1 Energex and AER rate of change (per cent)
2015–16 2016–17 2017–18 2018–19 2019–20
Energex –0.14 –0.28 0.09 0.48 0.48
AER 1.52 1.56 1.59 1.70 1.76
Difference 1.66 1.84 1.50 1.22 1.28
Source: AER analysis.
B.11 Energex proposal
Table B.2 shows Energex's proposed annual change in opex for each rate of change
component reported in Energex's reset RIN. Energex's rate of change methodology is
broadly consistent with the opex rate of change approach set out in our Guideline.
However, Energex attributed economies of scale to output growth. We consider
economies of scale under our assessment of productivity in our Guideline.758
We discuss each of these components below.
Table B.2 Proposed opex by rate of change drivers ($'000, 2014–15)
2015–16 2016–17 2017–18 2018–19 2019–20
Proposed opex 342 541 339 344 344 093 355 003 357 177
Price growth759
139 1 163 1 352 1 359 1 319
Output growth 1 959 1 191 1 330 1 168 1 271
Productivity growth –2 602 –3 309 –2 361 –880 –899
Source Energex proposal and AER analysis.
Forecast price growth
Energex's proposed opex forecast includes price growth for labour, contractors,
occupancy and transport.760 Energex engaged PricewaterhouseCoopers to provide an
independent assessment of price growth to include in Energex's forecast opex.761 The
annual percentage change for Energex's forecast price growth are in Table B.3.
758
AER, Better regulation explanatory statement draft expenditure forecast assessment guidelines for electricity
transmission and distribution, August 2013, p. 36. 759
We note Energex's reset RIN reports cumulative price growth and incremental output and productivity growth. For
consistency we have reported Energex's price growth in incremental terms. 760
Energex, Appendix 35 cost escalation rates and application, October 2014, pp. 14–16. 761
Energex, Appendix 35 cost escalation rates and application, October 2014, p. 2.
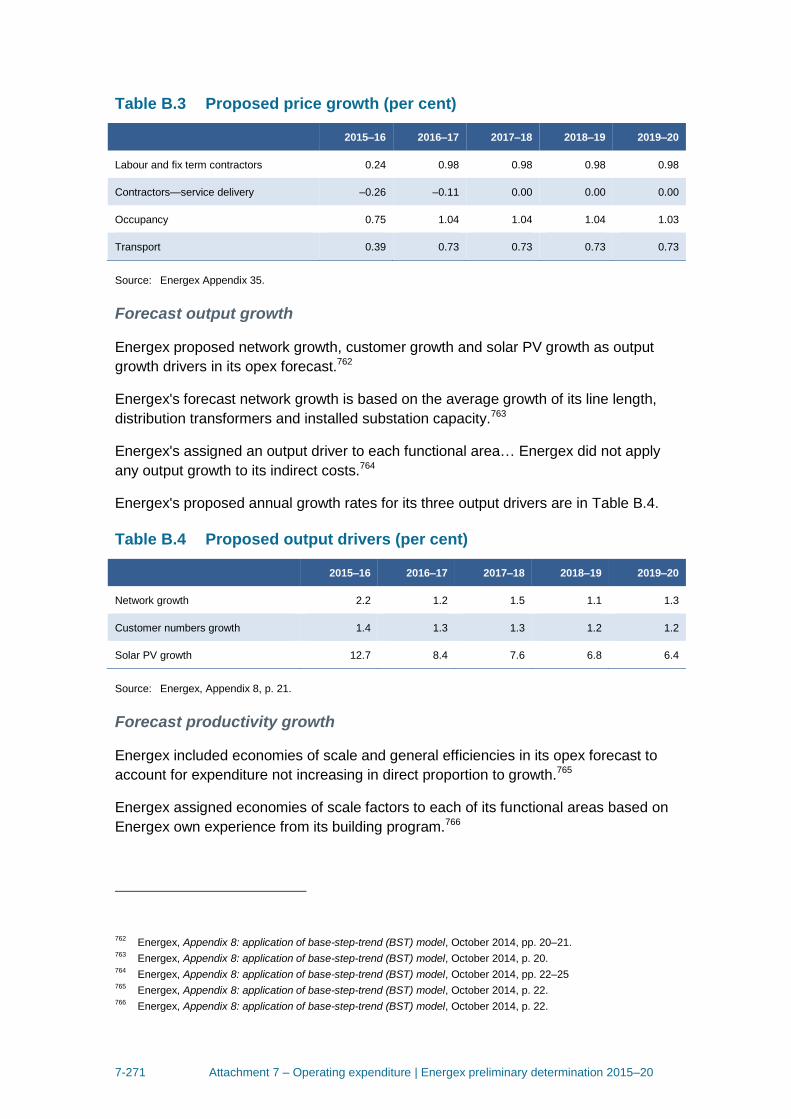
7-271 Attachment 7 – Operating expenditure | Energex preliminary determination 2015–20
Table B.3 Proposed price growth (per cent)
2015–16 2016–17 2017–18 2018–19 2019–20
Labour and fix term contractors 0.24 0.98 0.98 0.98 0.98
Contractors—service delivery –0.26 –0.11 0.00 0.00 0.00
Occupancy 0.75 1.04 1.04 1.04 1.03
Transport 0.39 0.73 0.73 0.73 0.73
Source: Energex Appendix 35.
Forecast output growth
Energex proposed network growth, customer growth and solar PV growth as output
growth drivers in its opex forecast.762
Energex's forecast network growth is based on the average growth of its line length,
distribution transformers and installed substation capacity.763
Energex's assigned an output driver to each functional area… Energex did not apply
any output growth to its indirect costs.764
Energex's proposed annual growth rates for its three output drivers are in Table B.4.
Table B.4 Proposed output drivers (per cent)
2015–16 2016–17 2017–18 2018–19 2019–20
Network growth 2.2 1.2 1.5 1.1 1.3
Customer numbers growth 1.4 1.3 1.3 1.2 1.2
Solar PV growth 12.7 8.4 7.6 6.8 6.4
Source: Energex, Appendix 8, p. 21.
Forecast productivity growth
Energex included economies of scale and general efficiencies in its opex forecast to
account for expenditure not increasing in direct proportion to growth.765
Energex assigned economies of scale factors to each of its functional areas based on
Energex own experience from its building program.766
762
Energex, Appendix 8: application of base-step-trend (BST) model, October 2014, pp. 20–21. 763
Energex, Appendix 8: application of base-step-trend (BST) model, October 2014, p. 20. 764
Energex, Appendix 8: application of base-step-trend (BST) model, October 2014, pp. 22–25 765
Energex, Appendix 8: application of base-step-trend (BST) model, October 2014, p. 22. 766
Energex, Appendix 8: application of base-step-trend (BST) model, October 2014, p. 22.
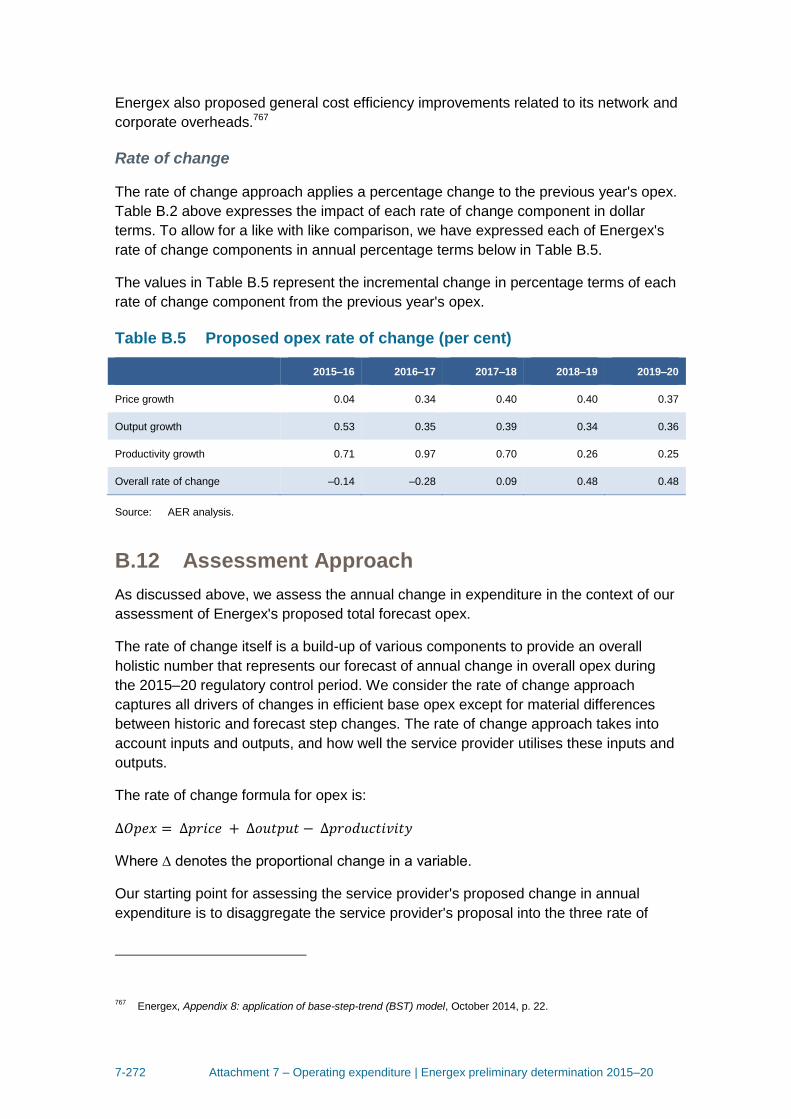
7-272 Attachment 7 – Operating expenditure | Energex preliminary determination 2015–20
Energex also proposed general cost efficiency improvements related to its network and
corporate overheads.767
Rate of change
The rate of change approach applies a percentage change to the previous year's opex.
Table B.2 above expresses the impact of each rate of change component in dollar
terms. To allow for a like with like comparison, we have expressed each of Energex's
rate of change components in annual percentage terms below in Table B.5.
The values in Table B.5 represent the incremental change in percentage terms of each
rate of change component from the previous year's opex.
Table B.5 Proposed opex rate of change (per cent)
2015–16 2016–17 2017–18 2018–19 2019–20
Price growth 0.04 0.34 0.40 0.40 0.37
Output growth 0.53 0.35 0.39 0.34 0.36
Productivity growth 0.71 0.97 0.70 0.26 0.25
Overall rate of change –0.14 –0.28 0.09 0.48 0.48
Source: AER analysis.
B.12 Assessment Approach
As discussed above, we assess the annual change in expenditure in the context of our
assessment of Energex's proposed total forecast opex.
The rate of change itself is a build-up of various components to provide an overall
holistic number that represents our forecast of annual change in overall opex during
the 2015–20 regulatory control period. We consider the rate of change approach
captures all drivers of changes in efficient base opex except for material differences
between historic and forecast step changes. The rate of change approach takes into
account inputs and outputs, and how well the service provider utilises these inputs and
outputs.
The rate of change formula for opex is:
Where ∆ denotes the proportional change in a variable.
Our starting point for assessing the service provider's proposed change in annual
expenditure is to disaggregate the service provider's proposal into the three rate of
767
Energex, Appendix 8: application of base-step-trend (BST) model, October 2014, p. 22.
7-273 Attachment 7 – Operating expenditure | Energex preliminary determination 2015–20
change components. This enables us to identify where there are differences in our
estimate and the service provider's estimate of the components of the rate of change.
While individual components in the service provider's proposed annual change in
expenditure may differ from our rate of change component forecasts, we will form a
view on the overall rate of change in deciding what to apply to derive our alternative
opex forecast.
We also take into account whether the differences in the rate of change components
are a result of differences in allocation or methodology. For example, a service
provider may allocate economies of scale to the output growth component of the rate
of change, whereas we consider this to be productivity growth. Irrespective of how a
service provider has built up or categorised the components of its forecast rate of
change, our assessment approach considers all the relevant drivers of the opex rate of
change.
Since our rate of change approach is a holistic approach we cannot make adjustments
to one component without considering the interactions with other rate of change
components. For example, if we were to the adjust output to take into account
economies of scale, we must ensure that economies of scale have not already been
accounted for in our productivity growth forecast. Otherwise, this will double count the
effect of economies of scale.
Price growth
Under our rate of change approach we escalate opex by the forecast change in prices.
Price growth is made up of labour price growth and non-labour (which includes
materials) price growth. The change in prices accounts for the price of key inputs that
do not move in line with the CPI and form a material proportion of Energex's
expenditure.
To determine the appropriate forecast change in labour prices we assessed forecasts
from PricewaterhouseCoopers and Deloitte Access Economics. These forecasts are
based on the consultants’ view of general macroeconomics trends for the utilities
industry and the overall Australian economy. We discuss our consideration of the
choice of labour price forecast in section B.13.2.
Output growth
'Output growth' captures the change in expenditure due to changes in the level of
outputs delivered, such as increases in the size of the network and the customers
serviced by that network. An increase in the quantity of outputs is likely to increase the
efficient opex required to service the outputs.
Under our rate of change approach, a proportional change in output results in the
same proportional change in expenditure. For example, if the only output measure is
maximum demand, a 10 per cent increase in maximum demand results in a 10 per
cent increase in expenditure. We consider any subsequent adjustment for economies
of scale as a part of our assessment of productivity.
7-274 Attachment 7 – Operating expenditure | Energex preliminary determination 2015–20
To measure output growth, we select a set of output measures and apply a weighting
to these measures. We have chosen the same output growth measures and
weightings as used in Economic Insight's economic benchmarking report.768 This
ensures we measure output growth consistently through time and across service
providers.
We obtained the historical output growth for Energex from our Economic
Benchmarking RIN. The Economic Benchmarking RIN provides a consistent basis to
benchmark the inputs and outputs of each service provider. This allows us to
consistently compare the change in output overtime and across service providers.
We calculated forecast output growth based on forecasts obtained from the reset RIN
which was prepared on the same basis as the Economic Benchmarking RIN.
We have assessed each of Energex's output growth drivers and compared its forecast
output growth with ours at the overall level.
More information on how we have estimated output growth is discussed in section
B.13.3.
Productivity
Our based our change in productivity measure on our expectations of the productivity
an efficient service provider in the distribution industry can achieve. We based forecast
productivity on analysis from Economic Insights' economic benchmarking analysis.769
However, we have also assessed whether the historical productivity from 2006–13
reflects a reasonable expectation of the benchmark productivity that can be achieved
for the forecast period.
If inputs increase at a greater rate than outputs then a service provider's productivity is
decreasing. Changes in productivity can have different sources. For example, changes
in productivity may be due to the realisation of economies of scale or technical change,
such as the adoption of new technologies. We expect efficient service providers to
pursue productivity improvements over time.
In the explanatory statement to our Guideline we noted that we would apply a rate of
change to estimate final year opex (taking into account an efficiency adjustment, if
required), to account for the shift in the productivity frontier.770
Since forecast opex must reflect the efficient costs of a prudent firm, it must reflect the
productivity improvements it is reasonable to expect a prudent service provider can
achieve. All else equal, a price taker in a competitive market will maintain constant
768
Economic Insights, Economic benchmarking assessment of operating expenditure for NSW and ACT electricity
DNSPs, 20 October 2014, pp. 40–41. 769
Economic Insights, Economic benchmarking assessment of operating expenditure for NSW and ACT electricity
DNSPs, 20 October 2014, p. 38. 770
AER, Better regulation explanatory statement expenditure forecast assessment guideline, November 2013, p. 65.

7-275 Attachment 7 – Operating expenditure | Energex preliminary determination 2015–20
profits if it matches the industry average productivity improvements reflected in the
market price. If it is able to make further productivity improvements, it will be able to
increase its profits until the rest of the industry catches up, and this is reflected in the
market price. Similarly, if a service provider is able to improve productivity beyond that
forecast, it is able to retain those efficiency gains for a period.771
Since both outputs and inputs are taken into account, our productivity measure
accounts for labour productivity and economies of scale. The effect of industry wide
technical change is also included.
More information on how we have estimated productivity growth is discussed in section
B.13.4.
Other considerations
Interaction with our base opex and step changes
As noted above, we use the rate of change approach in conjunction with our
assessment of base opex and step changes to determine total opex. We cannot make
adjustments to base opex and step changes without also considering its effect on the
opex rate of change, and, in particular, productivity.
For example, if we adjust an inefficient service provider's base we must also set
forecast productivity growth to reflect an efficient service provider's productivity growth.
This interrelationship is also important for our step change assessment. Historical data
influences our forecast rate of change. Our measured productivity will include the effect
of past step changes which typically increase a service provider's inputs. This will
lower our measured productivity. If we include an allowance for step changes in
forecast opex and we don't take this into account in our productivity forecast, there is a
risk that a service provider will be overcompensated for step changes.772
Comparison with our previous cost escalation approach
Under our previous approach to setting the trend in opex, we assessed real cost
escalations (this is similar to price growth) and output growth separately. We assessed
any productivity growth based on labour productivity for real cost escalations and
economies of scale for output growth.
This approach was less robust than our opex rate of change approach because
accounting for both labour productivity and economies of scale separately could result
in double counting productivity effects.
771
AER, Better regulation explanatory statement expenditure forecast assessment guideline, November 2013, p. 66. 772
Economic Insights, Economic benchmarking assessment of operating expenditure for NSW and ACT electricity
DNSPs, 20 October 2014, p. 42.
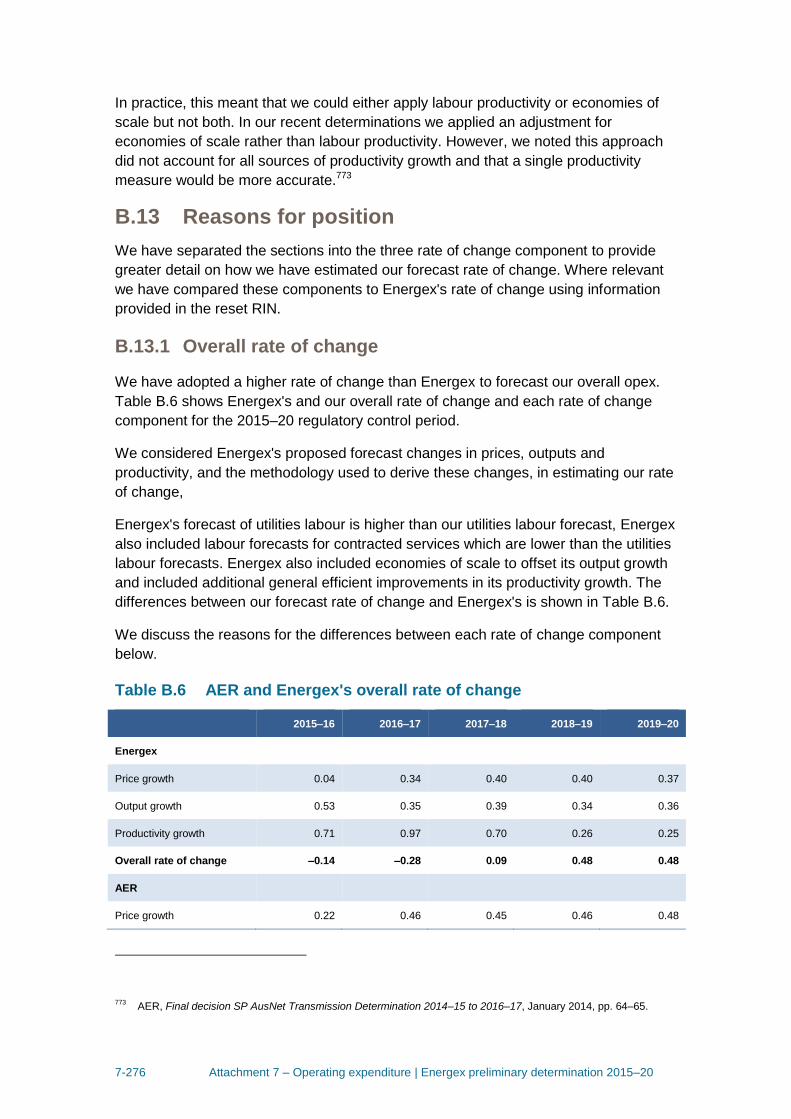
7-276 Attachment 7 – Operating expenditure | Energex preliminary determination 2015–20
In practice, this meant that we could either apply labour productivity or economies of
scale but not both. In our recent determinations we applied an adjustment for
economies of scale rather than labour productivity. However, we noted this approach
did not account for all sources of productivity growth and that a single productivity
measure would be more accurate.773
B.13 Reasons for position
We have separated the sections into the three rate of change component to provide
greater detail on how we have estimated our forecast rate of change. Where relevant
we have compared these components to Energex's rate of change using information
provided in the reset RIN.
B.13.1 Overall rate of change
We have adopted a higher rate of change than Energex to forecast our overall opex.
Table B.6 shows Energex's and our overall rate of change and each rate of change
component for the 2015–20 regulatory control period.
We considered Energex's proposed forecast changes in prices, outputs and
productivity, and the methodology used to derive these changes, in estimating our rate
of change,
Energex's forecast of utilities labour is higher than our utilities labour forecast, Energex
also included labour forecasts for contracted services which are lower than the utilities
labour forecasts. Energex also included economies of scale to offset its output growth
and included additional general efficient improvements in its productivity growth. The
differences between our forecast rate of change and Energex's is shown in Table B.6.
We discuss the reasons for the differences between each rate of change component
below.
Table B.6 AER and Energex's overall rate of change
2015–16 2016–17 2017–18 2018–19 2019–20
Energex
Price growth 0.04 0.34 0.40 0.40 0.37
Output growth 0.53 0.35 0.39 0.34 0.36
Productivity growth 0.71 0.97 0.70 0.26 0.25
Overall rate of change –0.14 –0.28 0.09 0.48 0.48
AER
Price growth 0.22 0.46 0.45 0.46 0.48
773
AER, Final decision SP AusNet Transmission Determination 2014–15 to 2016–17, January 2014, pp. 64–65.
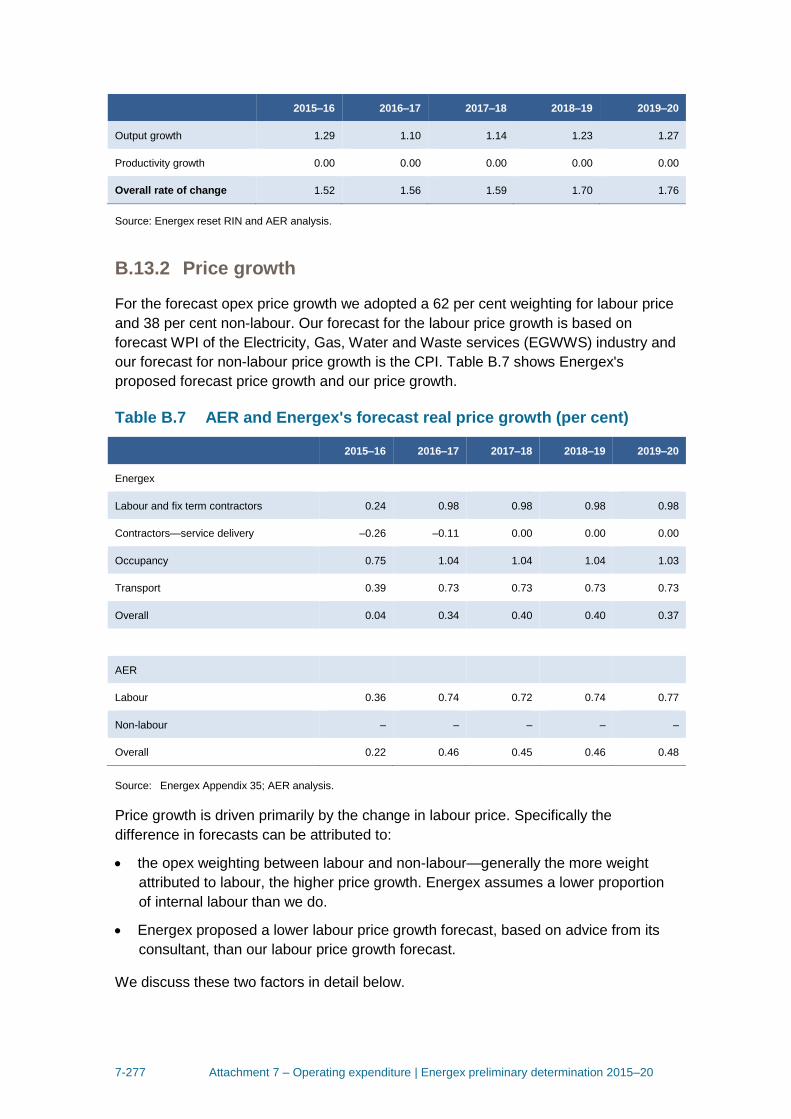
7-277 Attachment 7 – Operating expenditure | Energex preliminary determination 2015–20
2015–16 2016–17 2017–18 2018–19 2019–20
Output growth 1.29 1.10 1.14 1.23 1.27
Productivity growth 0.00 0.00 0.00 0.00 0.00
Overall rate of change 1.52 1.56 1.59 1.70 1.76
Source: Energex reset RIN and AER analysis.
B.13.2 Price growth
For the forecast opex price growth we adopted a 62 per cent weighting for labour price
and 38 per cent non-labour. Our forecast for the labour price growth is based on
forecast WPI of the Electricity, Gas, Water and Waste services (EGWWS) industry and
our forecast for non-labour price growth is the CPI. Table B.7 shows Energex's
proposed forecast price growth and our price growth.
Table B.7 AER and Energex's forecast real price growth (per cent)
2015–16 2016–17 2017–18 2018–19 2019–20
Energex
Labour and fix term contractors 0.24 0.98 0.98 0.98 0.98
Contractors—service delivery –0.26 –0.11 0.00 0.00 0.00
Occupancy 0.75 1.04 1.04 1.04 1.03
Transport 0.39 0.73 0.73 0.73 0.73
Overall 0.04 0.34 0.40 0.40 0.37
AER
Labour 0.36 0.74 0.72 0.74 0.77
Non-labour – – – – –
Overall 0.22 0.46 0.45 0.46 0.48
Source: Energex Appendix 35; AER analysis.
Price growth is driven primarily by the change in labour price. Specifically the
difference in forecasts can be attributed to:
the opex weighting between labour and non-labour—generally the more weight
attributed to labour, the higher price growth. Energex assumes a lower proportion
of internal labour than we do.
Energex proposed a lower labour price growth forecast, based on advice from its
consultant, than our labour price growth forecast.
We discuss these two factors in detail below.

7-278 Attachment 7 – Operating expenditure | Energex preliminary determination 2015–20
Energex's forecast price growth for occupancy and transport do not have a material
impact on its overall forecast price growth.
Opex price weightings
We weight the forecast price growth to account for the proportion of opex that is labour
and non-labour.
We have adopted a 62 per cent weighting for labour and 38 per cent for non-labour.
We forecast the labour component based on the Electricity, Gas, Water and Waste
Services (EGWWS) industry and the non-labour component is based on the consumer
price index (CPI).
We have based these weightings on Economic Insight's benchmarking analysis which
applied weight of 62 per cent EGWWS wage price index (WPI) for labour and
38 per cent for five producer price indexes (PPIs) for non-labour. The five PPI's cover
business, computing, secretarial, legal and accounting, and public relations services.774
These opex weightings are based on Pacific Economic Group's (PEG) analysis of
Victorian electricity distribution service providers' regulatory accounts data.775
We consider the weightings from PEG's analysis represent reasonable benchmark
weightings for efficient frontier.
Energex did not include the opex weightings for each of its price growth in its proposal.
However, the price growth component of Energex's forecast opex by driver, reported in
its reset RIN, implies a lower proportion of EGWWS labour than we have adopted. For
example, Energex's proposed a real escalation of 0.98 per cent for its 2017–18 labour.
However Energex's price growth for 2017–18 is 0.40 per cent.776 It appears the
difference in Energex's weightings and our weightings are a driver of the difference
between our rate of change forecasts.
Our weightings, which we used in our economic benchmarking, represent a benchmark
weighting between labour and non-labour. Based on the evidence available we
consider these benchmark weightings are the best. We also adopted these output
weights in our recent determinations for NSW and ACT distribution determinations.777
We consider these weightings represent the weightings for a prudent firm because it
774
Economic Insights, Measurement of Inputs for Economic Benchmarking of Electricity Network Service Providers,
22 April 2013, p. 4. 775
Pacific Economics Group, TFP research for Victoria's Power Distribution Industry, Report prepared for the
Essential Services Commission, 2004. 776
The 0.40 per cent price growth value has been calculated based on the incremental change in the price growth
component relative to the previous year's proposed opex. 777
AER, Ausgrid draft decision attachment 7: operating expenditure, November 2014, p. 221, AER, Endeavour
Energy draft decision attachment 7: operating expenditure, November 2014, p. 220, AER, Essential Energy draft
decision attachment 7: operating expenditure, November 2014, p. 219, AER, ActewAGL draft decision attachment
7: operating expenditure, November 2014, p. 202.
7-279 Attachment 7 – Operating expenditure | Energex preliminary determination 2015–20
has been used in previous economic benchmarking analysis by Pacific Economic
Group Research and Economic Insights. 778
Forecast of producer price indices and CPI
For the purposes of forecasting we have applied the forecast CPI rather than the PPI's
used by Economic Insights in its economic benchmarking of past opex. We recognise
that the use of PPI's for historical purposes and CPI for forecasts may be inconsistent.
However, sensitivity analysis from Economic Insights showed there to be no material
difference between using the CPI or PPI in the economic benchmarking results. This is
because the change in PPI's follows a similar trend to the change in CPI.779
We adopt the Reserve Bank of Australia's (RBA's) CPI forecasts in the Statement of
Monetary Policy. For the years beyond those forecast by the RBA we apply the
mid-point of their target band. We consider forecasts of the CPI to be more robust than
forecasts of the PPI's because the CPI is a more aggregated measure and forecasts of
the CPI are more readily available. Further the CPI is subject to the RBA's inflation
target band which provides a more robust basis for economists to produce their
forecasts. For this reason we have used forecast CPI, rather than PPI's, to forecast
the non-labour component of price growth. Economic Insights noted that while the use
of these PPIs is likely to be more accurate for historic analysis, it is unlikely to be
practical for applications requiring forecasts of the opex price index such as the rate of
change. This is because it is very difficult to obtain price forecasts at a finely
disaggregated level other than by simple extrapolation of past trends.780
If the forecasts of the five PPI's can be forecast with similar accuracy to the CPI, then
we would consider the five PPI's to also be an appropriate opex price deflator.
However, at this stage we do not consider robust forecasts of the five PPI's are
available.
Contractors
We consider only EGWWS labour should be applied for the labour component of price
growth.
Energex commissioned labour forecasts for both its in-house labour and contractors for
service delivery.781 Energex's consultant PricewaterhouseCoopers noted that Energex
outsources elements of its operations to third-party contracts on a contract basis,
778
Economic Insights, Measurement of Inputs for Economic Benchmarking of Electricity Network Service Providers,
22 April 2013, p. 4. 779
Economic Insights, Economic benchmarking assessment of operating expenditure for NSW and ACT electricity
DNSPs, 20 October 2014, p. 13. 780
Economic Insights, Economic benchmarking assessment of operating expenditure for NSW and ACT electricity
DNSPs, 20 October 2014, p. 13. 781
Energex, Appendix 35: cost escalation rates and application, October 2014, p. 7.

7-280 Attachment 7 – Operating expenditure | Energex preliminary determination 2015–20
including installation and maintenance of overhead service lines, vegetation
management, streetlight services and distribution works.782
We note these third party contracts relates to services that are EGWWS in nature and
it is at the discretion of Energex to determine the level in which it chooses to outsource.
We also note that the Energex's price growth for its in-house labour is based on the
WPI for EGWWS industry. It represents the price Energex pays for a unit of labour and
is not productivity adjusted. However, Energex's contractor price growth reflects the
price it pays after productivity growth and is effectively productivity adjusted. This is
because the contract is for the provision of a service at a set price rather than for the
provision of a unit of labour.
For example, Energex does not pay the third-party providers' workers for the
maintenance of overhead service lines. Rather it pays the third-party provider for the
maintenance based on a price set out in its contract. This price set out in the contract
would include the productivity of the third-party.
We also note that PwC's forecast of contractor costs that is close to CPI for the
forecast period is consistent with our overall view that labour price growth adjusted for
productivity is equal to the change in the CPI over the long term.
Occupancy and fleet
Energex included price growth specific to its occupancy and fleet. As noted in our
forecast methodology assessment appendix (appendix D), using category specific
forecasting methods may produce better forecasts of expenditure for those categories,
but may not produce a better forecast of total opex.
We recognise that Energex's prices for occupancy and fleet may change at a different
rate to CPI. However, this is true of many other opex cost items. It we were to
separately forecast materials and land costs because they are expected to change in
price at a different rate to CPI, then we must also separately forecast price growth for
other categories that increase in price less rapidly to avoid forecasting bias. Not doing
so will systematically exceed the forecast opex required to meet the opex criteria.
Labour price growth
Our choice of the labour price measure seeks to reflect the efficient labour price for a
service provider on the opex frontier. To determine the efficient labour price we require
a forecast of the benchmark labour price. We consider forecasts of the EGWWS
industry, produced by expert forecasters, to be an appropriate benchmark for
Energex's labour price. This is because the EGWWS classification includes labour in
the electricity industry and provides a benchmark labour price for comparable staff
782
PricewaterhouseCoopers, Forecast cost escalation rates, 4 March 2014, p. 17.
7-281 Attachment 7 – Operating expenditure | Energex preliminary determination 2015–20
within the utilities industry. Since Energex's labour is classified within the EGWWS
industry, this provides a reasonable comparison.
Choice of labour forecast
To forecast labour we have adopted the average of Deloitte Access Economics and
PricewaterhouseCoopers wage price index (WPI) forecasts for the EGWWS sector.
We consider an averaging approach that takes into account the consultant's
forecasting history, if available, to be the best methodology for forecasting labour price
growth.
This is based on our previous analysis in relation to SP AusNet's gas distribution
network which was corroborated by Professor Borland.783 When considering
appropriate labour price growth forecasts for the SP AusNet gas distribution network
we adopted an average of the forecasts prepared by Deloitte Access Economics (DAE)
and BIS Shrapnel. We took this approach because DAE typically forecasts lower than
actual WPI and BIS Shrapnel typically forecast higher than actual WPI for the
Australian EGWWS sector.
Previous analysis by DAE and the AER showed that DAE under forecasted price
growth at the national level. In contrast BIS Shrapnel over forecasted price growth and
by a greater margin.784
We also averaged DAE and Independent Economics forecasts for the NSW and ACT
electricity distribution networks.785
PwC's forecast of the Queensland EGWWS sector is based on the Queensland
Treasury and Trade (QTT) forecasts as part of its annual budgeting processes. The
QTT forecasts from 2014–15 to 2016–17 and PwC considered that QTT's forecast of
3.5 per for 2016–17 is likely to reflect the broader market trends to 2019–20.786
The QTT's methodology for forecasting the wage price index is not discussed in detail
in its Budget Strategy and Outlook papers. However, we see no reason to discount the
QTT's forecast since they broadly reflect the current market conditions.
783
AER, Access arrangement final decision SPI Networks (Gas) Pty Ltd 2013–17, Part 3: Appendices, March 2013,
p. 7. 784
AER, Powerlink Final decision, p. 54, April 2012. 785
AER, Ausgrid draft decision attachment 7: operating expenditure, November 2014; AER, Endeavour Energy draft
decision attachment 7: operating expenditure, November 2014; AER, Essential Energy draft decision attachment
7: operating expenditure, November 2014; AER, ActewAGL draft decision attachment 7: operating expenditure,
November 2014. 786
PricewaterhouseCoopers, Forecast cost escalation rates, 4 March 2014, p. 15.

7-282 Attachment 7 – Operating expenditure | Energex preliminary determination 2015–20
However, DAE forecasts Queensland WPI to be higher than the WPI for the
Queensland utilities sector.787 This indicates that using a forecast of Queensland WPI
to forecast Queensland utilities may result in an upwardly biased forecast.
We note our consultant DAE's has previously under forecast the EGWWS WPI at the
national level. 788 We consider an average of PwC's and DAE's forecast would offset
this bias and produce the best forecast available of the Queensland EGWWS WPI.
The Queensland Council of Social Service (QCOSS) noted that Ergon Energy's
proposed labour price growth are too high based on the current economic climate and
expect wage growth to be at or below inflation.789
The Consumer Challenge Panel (CCP) noted that the electricity industry is in
contraction due to declining demand for its services and consider labour price
increases in excess of CPI is likely to have placed too heavy a reliance on the use of
historical trends to predict future trends.790
The CCP further noted that Queensland Government Independent Review Panel on
Network Costs found that Queensland NSPs' labour costs are significantly higher than
they should be, and must ensure that EBA outcomes are not treated as a "pass
through."
We note that the labour price growth we have applied use current economic data to
forecast and they reflect current market conditions. We note that neither Energex nor
our proposed labour price growth directly uses Energex's EBA outcomes.
Labour productivity
Our preferred approach to productivity is to adopt an overall electricity distribution
specific productivity adjustment rather than adjusting the forecast EGWWS labour price
growth for EGWWS labour productivity.
We note that the ABS does not publish a labour adjusted EGWWS figures and the
Productivity Commission has raised concerns about the measurement of productivity in
the EGWWS sector.791
Independent Economics supported the use of electricity distribution specific
productivity rather than EGWWS wide productivity:792
787
Deloitte Access Economics, Forecast growth in labour costs in NEM regions of Australia, 23 February 2015,
pp. 9, 11. 788
AER, Access arrangement final decision SPI Networks (Gas) Pty Ltd 2013–17, Part 3: Appendices, March 2013,
p. 7. 789
Queensland Council of Social Service, Understanding the long term interests of electricity customers, 30 January
2015, p. 67. 790
CCP, submission on Energex and Ergon Energy capex and opex proposals, 30 January 2015, p. 24. 791
Productivity Commission, Productivity in electricity, gas and water: measurement and interpretation, March 2012,
p. 122. 792
Independent Economics, Labour cost escalators for NSW, the ACT and Tasmania, 18 February 2014, p. 6.
7-283 Attachment 7 – Operating expenditure | Energex preliminary determination 2015–20
There are significant difficulties in measuring productivity in the utilities sector
generally and the electricity distribution sector in particular. Hence, it is
suggested adjusting for productivity is better undertaken on the basis of a
detailed assessment of specific sources of productivity gains within the industry
rather than attempting to infer productivity gains using the broader data
published by the ABS.
Since the data for a distribution industry specific productivity measure is available from
our economic benchmarking analysis, and this is preferred over an EGWWS labour
productivity adjustment, we have applied a distribution industry specific measure.
Further discussion on how we have accounted for productivity is discussed in section
B.13.4.
B.13.3 Output growth
Energex proposed a different methodology than our own to forecast output growth.
However, once economies of scale are excluded there is not a material difference
between Energex's forecast output growth and our own.
We have adopted the following output measures and their respective weightings:
customer numbers (67.6 per cent)
circuit length (10.7 per cent)
ratcheted maximum demand (21.7 per cent).
These output measures are consistent with the output variables used in our opex cost
function analysis to measure productivity. This approach is consistent with our
Forecast Expenditure Assessment Guidelines.793
The outputs measures chosen by Economic Insights were based on three selection
criteria.
First, the output aligns with the NEL and NER objectives. The NER expenditure
objectives for both opex and capex are to:
meet or manage the expected demand for standard control services over that
period
comply with all applicable regulatory obligations or requirements associated with
the provisions of standard control services
to the extent that there is no applicable regulatory obligation or requirement in
relation to:
i. the quality, reliability or security of supply of standard control services
793
AER, Better Regulation Expenditure Forecast Assessment Guideline for Electricity Distribution, November 2013, p.
23.
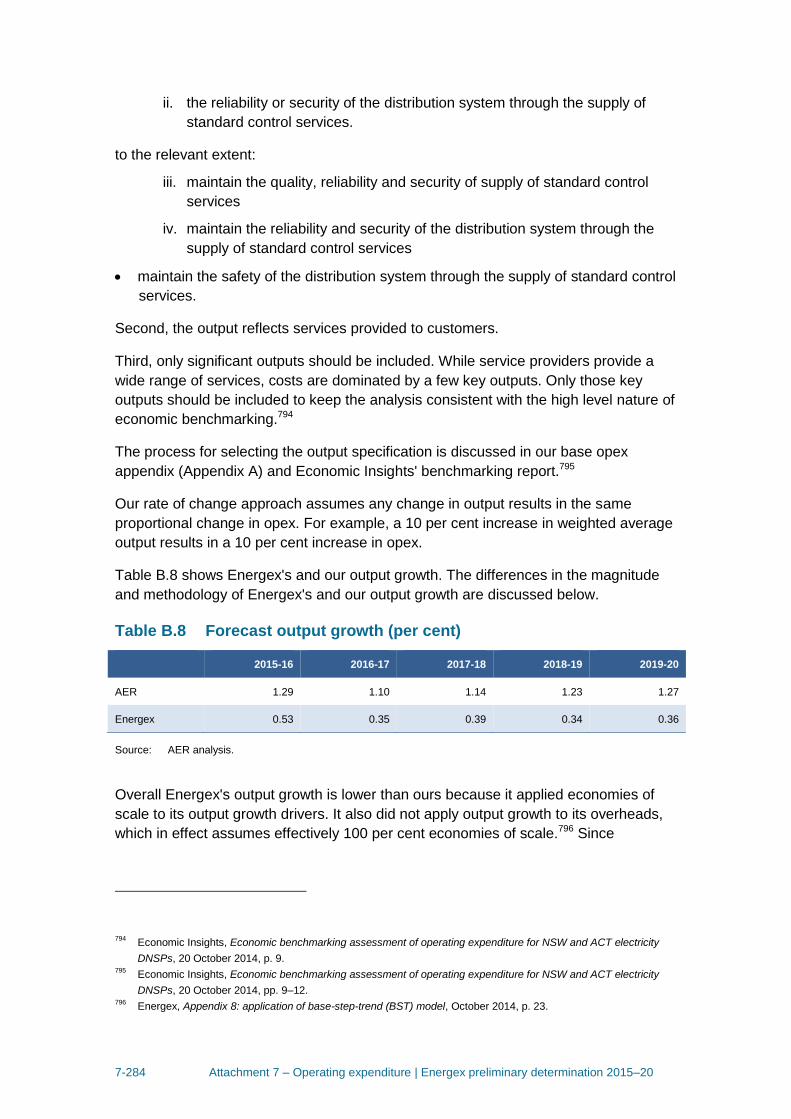
7-284 Attachment 7 – Operating expenditure | Energex preliminary determination 2015–20
ii. the reliability or security of the distribution system through the supply of
standard control services.
to the relevant extent:
iii. maintain the quality, reliability and security of supply of standard control
services
iv. maintain the reliability and security of the distribution system through the
supply of standard control services
maintain the safety of the distribution system through the supply of standard control
services.
Second, the output reflects services provided to customers.
Third, only significant outputs should be included. While service providers provide a
wide range of services, costs are dominated by a few key outputs. Only those key
outputs should be included to keep the analysis consistent with the high level nature of
economic benchmarking.794
The process for selecting the output specification is discussed in our base opex
appendix (Appendix A) and Economic Insights' benchmarking report.795
Our rate of change approach assumes any change in output results in the same
proportional change in opex. For example, a 10 per cent increase in weighted average
output results in a 10 per cent increase in opex.
Table B.8 shows Energex's and our output growth. The differences in the magnitude
and methodology of Energex's and our output growth are discussed below.
Table B.8 Forecast output growth (per cent)
2015-16 2016-17 2017-18 2018-19 2019-20
AER 1.29 1.10 1.14 1.23 1.27
Energex 0.53 0.35 0.39 0.34 0.36
Source: AER analysis.
Overall Energex's output growth is lower than ours because it applied economies of
scale to its output growth drivers. It also did not apply output growth to its overheads,
which in effect assumes effectively 100 per cent economies of scale.796 Since
794
Economic Insights, Economic benchmarking assessment of operating expenditure for NSW and ACT electricity
DNSPs, 20 October 2014, p. 9. 795
Economic Insights, Economic benchmarking assessment of operating expenditure for NSW and ACT electricity
DNSPs, 20 October 2014, pp. 9–12. 796
Energex, Appendix 8: application of base-step-trend (BST) model, October 2014, p. 23.
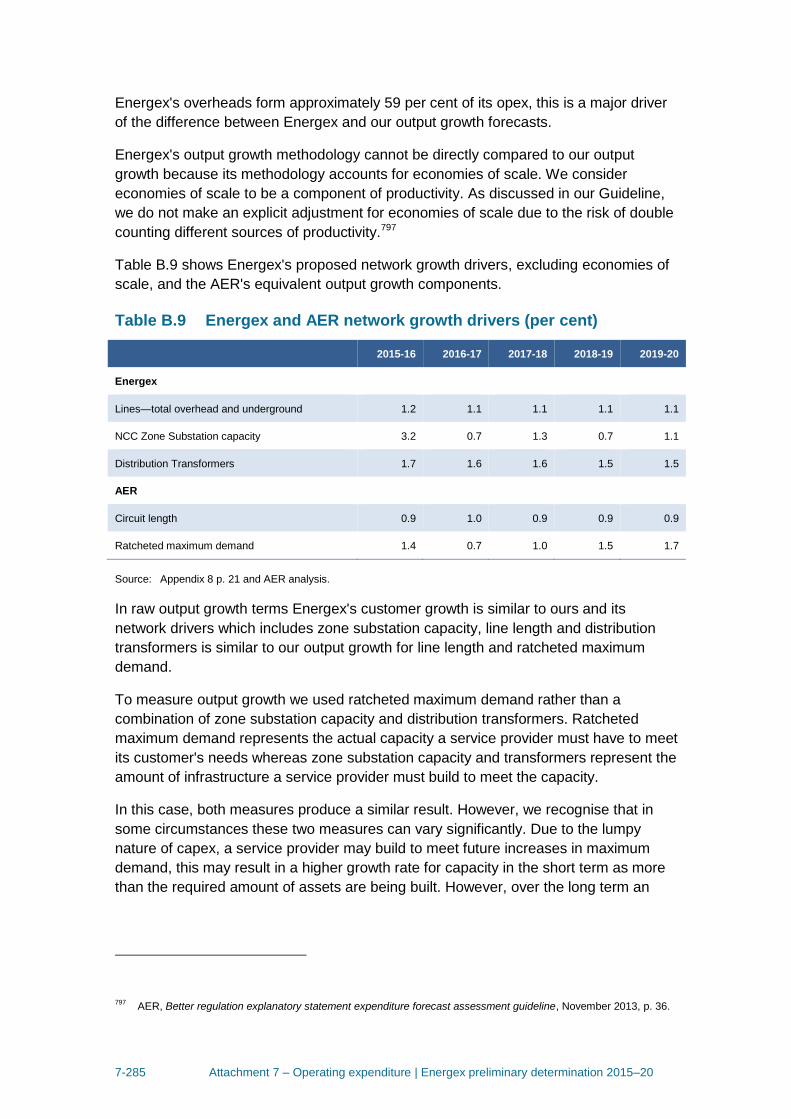
7-285 Attachment 7 – Operating expenditure | Energex preliminary determination 2015–20
Energex's overheads form approximately 59 per cent of its opex, this is a major driver
of the difference between Energex and our output growth forecasts.
Energex's output growth methodology cannot be directly compared to our output
growth because its methodology accounts for economies of scale. We consider
economies of scale to be a component of productivity. As discussed in our Guideline,
we do not make an explicit adjustment for economies of scale due to the risk of double
counting different sources of productivity.797
Table B.9 shows Energex's proposed network growth drivers, excluding economies of
scale, and the AER's equivalent output growth components.
Table B.9 Energex and AER network growth drivers (per cent)
2015-16 2016-17 2017-18 2018-19 2019-20
Energex
Lines—total overhead and underground 1.2 1.1 1.1 1.1 1.1
NCC Zone Substation capacity 3.2 0.7 1.3 0.7 1.1
Distribution Transformers 1.7 1.6 1.6 1.5 1.5
AER
Circuit length 0.9 1.0 0.9 0.9 0.9
Ratcheted maximum demand 1.4 0.7 1.0 1.5 1.7
Source: Appendix 8 p. 21 and AER analysis.
In raw output growth terms Energex's customer growth is similar to ours and its
network drivers which includes zone substation capacity, line length and distribution
transformers is similar to our output growth for line length and ratcheted maximum
demand.
To measure output growth we used ratcheted maximum demand rather than a
combination of zone substation capacity and distribution transformers. Ratcheted
maximum demand represents the actual capacity a service provider must have to meet
its customer's needs whereas zone substation capacity and transformers represent the
amount of infrastructure a service provider must build to meet the capacity.
In this case, both measures produce a similar result. However, we recognise that in
some circumstances these two measures can vary significantly. Due to the lumpy
nature of capex, a service provider may build to meet future increases in maximum
demand, this may result in a higher growth rate for capacity in the short term as more
than the required amount of assets are being built. However, over the long term an
797
AER, Better regulation explanatory statement expenditure forecast assessment guideline, November 2013, p. 36.
7-286 Attachment 7 – Operating expenditure | Energex preliminary determination 2015–20
efficient service provider will construct the necessary amount of assets in line with
changes in ratcheted maximum demand.
Energex also included solar PV as an output driver. We have considered the extent of
solar PV in our operating environment factors analysis in appendix A. We do not
consider solar PV to be a material portion of Energex's base and it does not have a
significant impact on the output growth. As noted above in our third selection criteria,
we have only included outputs that are significant consistent with the high level nature
of economic benchmarking.
We also consider applying benchmark weights for the output growth to be more
representative of benchmark output growth than Energex's methodology of attributing
specific growth drivers to each functional opex area. This is because Energex may not
necessarily have the same break down in its functional areas as the benchmark
service provider. However, in these circumstances it does not significantly contribute to
the difference between Energex and our output growth.
CCP does not accept that a proportional increase in the weighted average output
growth would result in the same increase in opex. The CCP also strongly disagrees
with the proposed installed capacity factors. It noted that newer assets should result in
lower maintenance costs. The CCP considers output growth factors should be
determined on a consistent basis across all distributors.798
We note that we use the proportional increase for the weighted average output growth
as a starting point and productivity is accounted for as a separate rate of change
component. We also note that our output growth methodology uses the same output
specification for all distributors. We then use the actual weighted average output
growth using the distributor's reset RIN forecasts and the output weights from the opex
cost function.
B.13.4 Productivity growth
We have applied a zero per cent productivity growth in estimating our overall rate of
change. We base this on Economic Insights' recommendation to apply zero forecast
productivity growth for the distribution network service providers and our assessment
of overall productivity trends for the forecast period.799
Energex proposed a higher productivity growth than ours. As noted above, Energex
included economies of scale in its output growth forecast and it also proposed general
cost efficiency improvements in its overheads. 800
798
CCP, Submission on Energex and Ergon Energy capex and opex proposals, 30 January 2015, p. 25. 799
Economic Insights, Economic Benchmarking Assessment of Operating Expenditure for NSW and ACT Electricity
DNSPs, 8 September 2014, p. 52 and Economic Insights, Response to consultants' reports on economic
benchmarking of electricity DNSPs, 13 April 2015, p. 74. 800
Energex, Appendix 8: application of base-step-trend (BST) model, October 2014, p. 22.
7-287 Attachment 7 – Operating expenditure | Energex preliminary determination 2015–20
Our Guidelines state that we will incorporate forecast productivity in the rate of change
we apply to base opex when assessing opex. Forecast productivity growth will be the
best estimate of the shift in the productivity frontier. 801
We consider past performance to be a good indicator of future performance under a
business as usual situation. We have applied forecast productivity based on historical
data for the electricity transmission and gas distribution industries where we consider
historical data to be representative of the forecast period.
To reach our best estimate of forecast productivity we took into account all available
information. This includes Economic Insights' economic benchmarking, Energex's
proposal, our expectations of the distribution industry in the short to medium term, and
observed productivity outcomes from electricity transmission and gas distribution
industries.
We have applied a zero productivity forecast for Energex for the following reasons:
While data from 2006–13 period indicates negative productivity for distribution
network service providers on the efficient frontier, we do not consider this is
representative of the underlying productivity trend and our expectations of forecast
productivity in the medium term. The increase in the service provider's inputs,
which is a significant factor contributing to negative productivity, is unlikely to
continue for the forecast period.
Measured productivity for electricity transmission and gas distribution industries are
positive for the 2006–13 period and are forecast to be positive.
We discuss each of these reasons in detail in the sections below.
Forecast outlook and historical productivity
As noted above, the forecast productivity is our best estimate of the shift in the frontier
for an efficient service provider. Typically we consider the best forecast of this shift
would be based on recent data. However, this requires a business as usual situation
where the historical data is representative of what is likely to occur in the forecast
period. 802
Analysis from Economic Insights using MTFP and opex cost function models showed
that from 2006 to 2013, the distribution industry experienced negative productivity
growth.803 This means that for the distribution industry inputs specified under the
models increased at a greater rate than the measured outputs.
801
AER, Better regulation explanatory statement expenditure forecast assessment guideline, November 2013, p. 65. 802
Economic Insights, Economic benchmarking assessment of operating expenditure for NSW and ACT electricity
DNSPs, 20 October 2014, p. 41. 803
Economic Insights, Economic benchmarking assessment of operating expenditure for NSW and ACT electricity
DNSPs, 20 October 2014, p. 20, p. 40.
7-288 Attachment 7 – Operating expenditure | Energex preliminary determination 2015–20
According to Economic Insights' modelling, the average annual output growth from
2010 to 2013 for the distribution industry was 0.6 per cent. During this period, the
output measures of customer numbers and circuit length grew by 1.2 per cent and 0.5
per cent respectively. Maximum demand decreased by 4.1 per cent from its peak in
2009.804
However, total input quantity increased by 2.8 per cent per annum from 2010 to
2013.805 This has been driven by substantial increases in both opex and capital inputs.
We note past step changes will also decrease measured productivity. Since a step
change will increase a service provider's opex without necessarily increasing its
outputs. For example, a change in a regulatory obligation may increase a service
provider's compliance costs without increasing its ratcheted maximum demand, line
length or customer numbers.
We note that in Victoria for the 2011–2015 period, the increase in regulatory
obligations related to bushfires was forecast to be 9.0 per cent of total opex.806
We consider the increase in bushfire safety requirements to be a one off step increase
in the cost of compliance. We do not expect there to be a similar increase in the cost of
bushfire safety requirements in the forecast period.
We also approved a $35.5 million ($2009–10) step change for SA Power Network's
vegetation clearance pass through as a result of changing weather conditions.807
If we used historical productivity to set forecast productivity, this would incorporate the
effect of past step changes which as shown above have negatively impacted on
measured opex productivity. We do not consider past step changes should affect
forecast productivity. We assess any new step changes in our step change
assessment.
804
Economic Insights, Economic benchmarking assessment of operating expenditure for NSW and ACT electricity
DNSPs, 20 October 2014, pp. 44–45. 805
Economic Insights, Economic benchmarking assessment of operating expenditure for NSW and ACT electricity
DNSPs, 20 October 2014, p. 45. 806
AER, Final decision: CitiPower Ltd and Powercor Australia Ltd vegetation management forecast operating
expenditure step change, August 2012, p. 2. AER, CitiPower Pty Distribution determination 2011–15, September
2012, p. 17. AER, Powercor Australia Ltd Distribution determination 2011–15, October 2012, p. 26. AER, Final
decision: Powercor cost pass through application of 13 December 2011 for costs arising from the Victorian
Bushfire Royal Commission, May 2011, p. 96, AER, Final decision - appendices: Victorian electricity distribution
network service providers - Distribution determination 2011–2015, October 2011, p. 301–304. AER, Final
Decision: SP AusNet cost pass through application of 31 July 2012 for costs arising from the Victorian Bushfire
Royal Commission, 19 October 2012, p. 3. AER, SPI Electricity Pty Ltd Distribution determination 2011–2015,
August 2013, p. 20. AER, Jemena Electricity Network (Victoria) Ltd: Distribution determination 2011–2015,
September 2012, p. 22. AER, United Energy Distribution: Distribution determination 2011–2015, September 2012,
p. 19 807
AER, SA Power Networks cost pass through application for vegetation management costs arising from an
unexpected increase in vegetation growth rates, July 2013, p. 6
7-289 Attachment 7 – Operating expenditure | Energex preliminary determination 2015–20
Other industries and proposed productivity
In estimating forecast productivity for the distribution industry we have also had regard
to the electricity transmission and gas distribution industry, and distribution network
service provider's productivity forecasts.808
Measured declines in productivity in the electricity distribution sector are unlikely to
reflect longer term trends. Economic Insights notes:
We also note that a situation of declining opex partial productivity is very much
an abnormal situation as we normally expect to see a situation of positive
technical progress rather than technical regress over time. While we
acknowledge the distinction between the underlying state of technological
knowledge in the electricity distribution industry and the impact of cyclical
factors that may lead to periods of negative measured productivity growth, the
latter would be expected to be very much the exception, step change issues
aside.
Further both the electricity transmission and gas distribution industries experienced
positive opex productivity growth during the 2006–13 period.809 For electricity
transmission network service providers average industry productivity was 0.85 per cent
and for gas distribution Jemena Gas Networks proposed an average opex productivity
of 0.95 per cent of which 0.83 per cent was attributed to the shift in the frontier.810
Cyclical factors and regulatory obligations for the distribution sector may be the reason
for the lower measured productivity in the distribution industry compared to the
transmission and gas distribution industries. Over the medium to long term, however,
we expect the distribution network service providers to have productivity growth rates
comparable to the electricity transmission and gas distribution industries.
Energex proposed $36 million in productivity savings811 in addition to its economies of
scale.
We also note Ergon Energy, SA Power Networks, ActewAGL and the NSW electricity
distribution service providers forecast zero or positive productivity for the forecast
period. Further, several forecasts indicated that increases in output will be offset by
efficiency improvements. For example, ActewAGL forecast economies of scale will
offset most of their output growth.812
808
This includes productivity forecasts from Endeavour Energy, Essential Energy, ActewAGL, Ausgrid, Ergon Energy,
Energex and SA Power Networks. 809
AER, Trans Grid transmission determination – draft decision, Attachment 7, Appendix A, November 2014; AER,
JGN gas distribution determination – draft decision, Attachment 7, Appendix A, November 2014. 810
AER, JGN gas distribution determination – draft decision, Attachment 7, Appendix A, November 2014. 811
Energex, 2015–20 Reset RIN table 2.16.1. To calculate the total, we have summed all the annual incremental
productivity values. 812
ActewAGL, Regulatory proposal 2015–19 Subsequent regulatory control period, 10 July 2014, p. 233.

7-290 Attachment 7 – Operating expenditure | Energex preliminary determination 2015–20
Ergon Energy proposed $17 million in productivity savings.813
SA Power Networks and Essential Energy proposed zero per cent productivity
growth.814 Ausgrid proposed productivity savings of $47 million815 for its standard
control services.
The CCP noted that the distributors' past poor productivity performance which the CCP
considers to be due to inefficient labour practices must not be used to justify poor
productivity outcomes in future years. The CCP noted that many other asset intensive
industry sectors experienced positive opex productivity growth during 2006–13 period.
The CCP does not consider there is any justification for the electricity distribution
sector to have lower productivity expectations than those sectors.816
We consider if there is robust evidence provided to us to support positive productivity
in industries that are comparable to the electricity distribution industry. We will take this
evidence into our consideration in assessing forecast productivity.
813
Ergon Energy, 2015–20 Reset RIN table 2.16.1. To calculate the total, we have summed all the annual incremental
productivity values. 814
Essential Energy, 2014–19 Reset RIN table 2.16.1 and SA Power Networks, 2015–20 Reset RIN table 2.16.1. 815
Ausgrid, 2014–19 Reset RIN table 2.16.1. 816
CCP, Submission on Energex and Ergon Energy capex and opex proposals, 30 January 2015, p. 25.
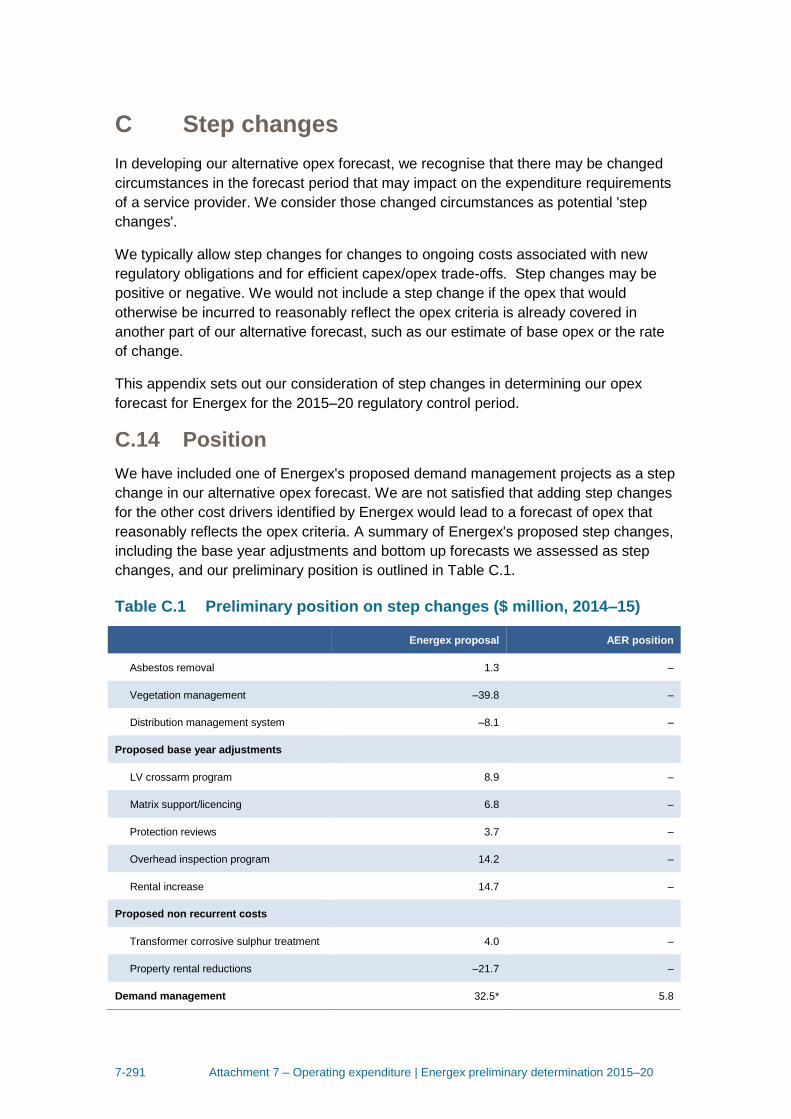
7-291 Attachment 7 – Operating expenditure | Energex preliminary determination 2015–20
C Step changes
In developing our alternative opex forecast, we recognise that there may be changed
circumstances in the forecast period that may impact on the expenditure requirements
of a service provider. We consider those changed circumstances as potential 'step
changes'.
We typically allow step changes for changes to ongoing costs associated with new
regulatory obligations and for efficient capex/opex trade-offs. Step changes may be
positive or negative. We would not include a step change if the opex that would
otherwise be incurred to reasonably reflect the opex criteria is already covered in
another part of our alternative forecast, such as our estimate of base opex or the rate
of change.
This appendix sets out our consideration of step changes in determining our opex
forecast for Energex for the 2015–20 regulatory control period.
C.14 Position
We have included one of Energex's proposed demand management projects as a step
change in our alternative opex forecast. We are not satisfied that adding step changes
for the other cost drivers identified by Energex would lead to a forecast of opex that
reasonably reflects the opex criteria. A summary of Energex's proposed step changes,
including the base year adjustments and bottom up forecasts we assessed as step
changes, and our preliminary position is outlined in Table C.1.
Table C.1 Preliminary position on step changes ($ million, 2014–15)
Energex proposal AER position
Asbestos removal 1.3 –
Vegetation management –39.8 –
Distribution management system –8.1 –
Proposed base year adjustments
LV crossarm program 8.9 –
Matrix support/licencing 6.8 –
Protection reviews 3.7 –
Overhead inspection program 14.2 –
Rental increase 14.7 –
Proposed non recurrent costs
Transformer corrosive sulphur treatment 4.0 –
Property rental reductions –21.7 –
Demand management 32.5* 5.8
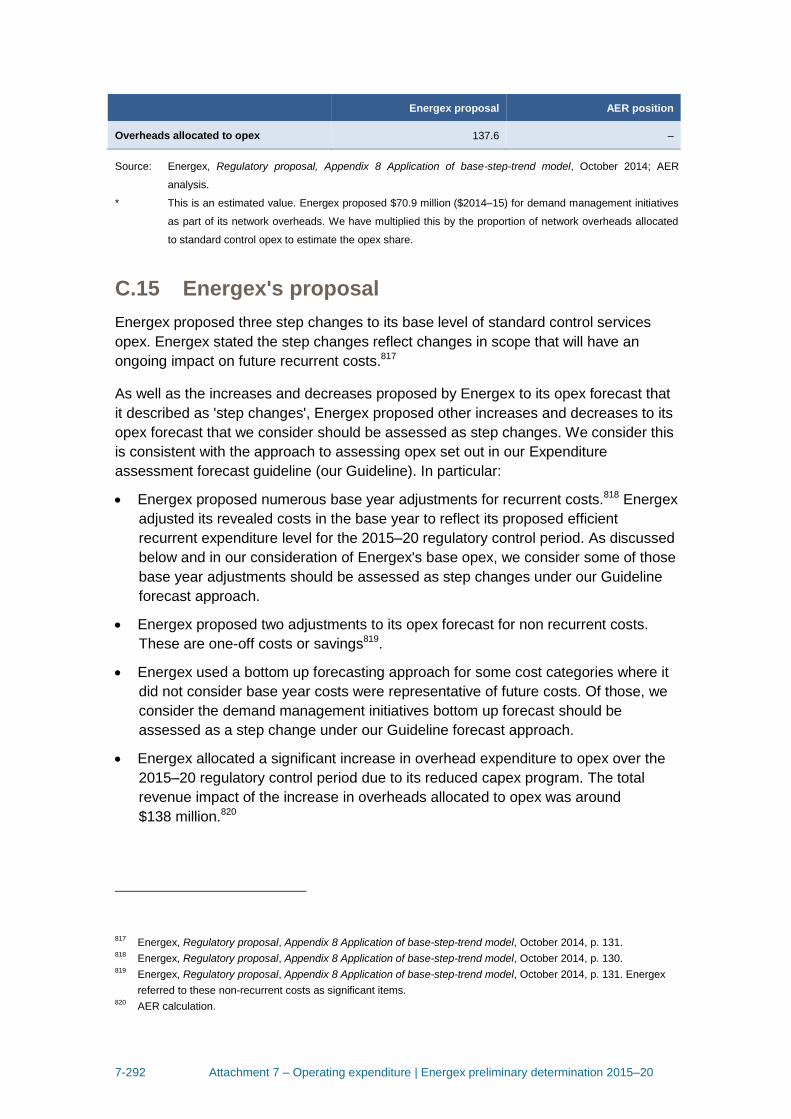
7-292 Attachment 7 – Operating expenditure | Energex preliminary determination 2015–20
Energex proposal AER position
Overheads allocated to opex 137.6 –
Source: Energex, Regulatory proposal, Appendix 8 Application of base-step-trend model, October 2014; AER
analysis.
* This is an estimated value. Energex proposed $70.9 million ($2014–15) for demand management initiatives
as part of its network overheads. We have multiplied this by the proportion of network overheads allocated
to standard control opex to estimate the opex share.
C.15 Energex's proposal
Energex proposed three step changes to its base level of standard control services
opex. Energex stated the step changes reflect changes in scope that will have an
ongoing impact on future recurrent costs.817
As well as the increases and decreases proposed by Energex to its opex forecast that
it described as 'step changes', Energex proposed other increases and decreases to its
opex forecast that we consider should be assessed as step changes. We consider this
is consistent with the approach to assessing opex set out in our Expenditure
assessment forecast guideline (our Guideline). In particular:
Energex proposed numerous base year adjustments for recurrent costs.818 Energex
adjusted its revealed costs in the base year to reflect its proposed efficient
recurrent expenditure level for the 2015–20 regulatory control period. As discussed
below and in our consideration of Energex's base opex, we consider some of those
base year adjustments should be assessed as step changes under our Guideline
forecast approach.
Energex proposed two adjustments to its opex forecast for non recurrent costs.
These are one-off costs or savings819.
Energex used a bottom up forecasting approach for some cost categories where it
did not consider base year costs were representative of future costs. Of those, we
consider the demand management initiatives bottom up forecast should be
assessed as a step change under our Guideline forecast approach.
Energex allocated a significant increase in overhead expenditure to opex over the
2015–20 regulatory control period due to its reduced capex program. The total
revenue impact of the increase in overheads allocated to opex was around
$138 million.820
817
Energex, Regulatory proposal, Appendix 8 Application of base-step-trend model, October 2014, p. 131. 818
Energex, Regulatory proposal, Appendix 8 Application of base-step-trend model, October 2014, p. 130. 819
Energex, Regulatory proposal, Appendix 8 Application of base-step-trend model, October 2014, p. 131. Energex
referred to these non-recurrent costs as significant items. 820
AER calculation.
7-293 Attachment 7 – Operating expenditure | Energex preliminary determination 2015–20
Table C.1 summarises the revenue impact of each of Energex's proposed step
changes, base year adjustments and bottom up forecasts we have assessed as step
changes.
C.16 Assessment approach
When assessing a service provider's proposed step changes, we consider whether
they are needed for the total opex forecast to reasonably reflect the opex criteria.821 Our
assessment approach is consistent with the approach specified in our Expenditure
forecast assessment guideline (our Guideline).822 As a starting point in our
assessment, we consider whether the proposed step changes in opex are already
compensated through other elements of our opex forecast, such as the base opex or
the 'rate of change' component. Step changes should not double count costs included
in other elements of the opex forecast.
We generally consider a base level of opex consistent with the opex criteria is sufficient
for a prudent and efficient service provider to meet all existing regulatory obligations.
This is the same regardless of whether we forecast base level of opex based on the
service provider's own costs or the benchmark operating expenditure that would be
incurred by an efficient and prudent service provider, given the specific operating
environment. We only include a step change in our opex forecast if we are satisfied a
prudent and efficient service provider would need an increase in its opex.
In our base opex appendix A, we concluded that Energex's revealed base year costs
were not consistent with the opex criteria. Therefore we have estimated an alternative
base opex, consistent with the opex criteria, for the purpose of formulating our
alternative total opex forecast for the 2015–20 regulatory control period. We refer to
this as our estimate of base opex.
We forecast opex by applying an annual 'rate of change' to our estimate of base opex
for each year of the forecast regulatory control period. The annual rate of change
accounts for efficient changes in opex over time. It incorporates adjustments for
forecast changes in output, price and productivity. Therefore, when we assess the
proposed step changes we need to ensure that the cost of the step change is not
already accounted for in any of those three elements included in the annual rate of
change. The following explains this principle in more detail.
For example, a step change should not double count the costs of increased volume or
scale compensated through the forecast change in output. We account for output
growth by applying a forecast output growth factor to our estimate of base opex. If the
output growth measure used captures all changes in output then step changes that
relate to forecast changes in output will not be required. For example, a step change is
not required for the maintenance costs of new office space required due to the service
821
NER, cl. 6.5.6(c). 822
AER, Expenditure assessment forecast guideline, November 2013, p.11, 24.
7-294 Attachment 7 – Operating expenditure | Energex preliminary determination 2015–20
provider's expanding network. The opex forecast has already been increased (from the
base year) to account for forecast network growth.823
By applying the rate of change to our estimate of base opex, we also adjust our opex
forecast to account for real price increases. A step change should not double count
price increases already compensated through this adjustment. Applying a step change
for costs that are forecast to increase faster than CPI is likely to yield a biased forecast
if we do not also apply a negative step change for costs that are increasing by less
than CPI. A good example is insurance premiums. A step change is not required if
insurance premiums are forecast to increase faster than CPI because within total opex
there will be other categories whose price is forecast to increase by less than CPI. If
we add a step change to account for higher insurance premiums we might provide a
more accurate forecast for the insurance category in isolation; however, our forecast
for total opex as a whole will be too high.
Further to assessing whether step changes are captured in other elements of our opex
forecast, we will assess the reasons for, and the efficient level of, the incremental costs
(relative to that funded by base opex and the rate of change) that the service provider
has proposed. In particular we have regard to:824
whether there is a change in circumstances that affects the service provider's
efficient forecast expenditure
what options were considered to respond to the change in circumstances
whether the option selected was the most efficient option––that is, whether the
service provider took appropriate steps to minimise its expected cost of compliance
the efficient costs associated with making the step change and whether the
proposal appropriately quantified all costs savings and benefits
when this change event occurs and when it is efficient to incur expenditure,
including whether it can be completed over the regulatory control period
whether the costs can be met from existing regulatory allowances or from other
elements of the expenditure forecasts.
One important consideration is whether each proposed step change is driven by an
external obligation (such as new legislation or regulations) or an internal management
decision (such as a decision to increase maintenance opex). Step changes should
generally relate to a new obligation or some change in the service provider's operating
environment beyond its control. It is not enough to simply demonstrate an efficient cost
will be incurred for an activity that was not previously undertaken. As noted above, the
opex forecasting approach may capture these costs elsewhere.
823
AER, AER, Expenditure assessment forecast guideline - Explanatory Statement, November 2013, p.73. See, for
example, our decision in the Powerlink determination; AER, Final decision: Powerlink transmission determination
2012–17, April 2012, pp, 164–165. 824
AER, Expenditure assessment forecast guideline, November 2013, p. 11.
7-295 Attachment 7 – Operating expenditure | Energex preliminary determination 2015–20
Usually increases in costs are not required for discretionary changes in inputs.825
Efficient discretionary changes in inputs (not required to increase output) should
normally have a net negative impact on expenditure. For example, a service provider
may choose to invest capex and opex in a new IT solution. The service provider should
not be provided with an increase in its total opex to finance the new IT since the outlay
should be at least offset by a reduction in other costs over time if it is efficient. This
means we will not allow step changes or change factors for any short-term cost to a
service provider of implementing efficiency improvements. We expect the service
provider to bear such costs and thereby make efficient trade-offs between bearing
these costs and achieving future efficiencies.
One situation where a step change to total opex may be required is when a service
provider chooses an operating solution to replace a capital one.826 For example, it may
choose to lease vehicles when it previously purchased them. For these capex/opex
trade-off step changes, we will assess whether it is prudent and efficient to substitute
capex for opex or vice versa. In doing so we will assess whether the forecast opex
over the life of the alternative capital solution is less than the capex in NPV terms.
As noted above, Energex classified some changes in costs as base year adjustments,
as a bottom-up forecast or as non recurrent expenditure rather than as step changes. It
also allocated additional overheads to opex.
We state in our Expenditure forecast assessment guideline that we may add (or
subtract) step changes for any costs not captured in our estimate of base opex or the
rate of change that are required for forecast opex to meet the opex criteria.827 Energex
proposed these base year adjustments, bottom-up forecast and non-recurrent
expenditure because the amount of expenditure in its base year was not representative
of its expectation of expenditure in the 2015–19 regulatory control period.
Consequently, if these adjustments are required for the opex forecast to meet the opex
criteria, we would add (or subtract) them as step changes in our alternative forecast.828
As outlined above, we will have regard to a number of factors in assessing these
proposed increments to our estimate of base opex including the driver for the proposed
expenditure, the efficient and prudent costs of the proposed expenditure and whether
the costs can be met from other elements of the expenditure forecast.
C.17 Reasons for position
We have not included most of the step changes Energex proposed in our alternative
opex forecast. We are not satisfied that adding all of the step changes listed in Table
825
AER, Expenditure assessment forecast guideline, November 2013, p. 24. 826
AER, Expenditure assessment forecast guideline, November 2013, p. 24; AER, Explanatory guide: Expenditure
assessment forecast guideline, November 2013, pp. 51–52. 827
AER, Expenditure forecast assessment guideline for electricity distribution, November 2013, p. 24. 828
We would adjust our estimate of base opex rather than add a step change where we don't think the reported opex
reflects the actual standard control service expenditure as classified in the forecast period. For example we would
not assess a change in service classification as a step change.
7-296 Attachment 7 – Operating expenditure | Energex preliminary determination 2015–20
C.1 would lead to a forecast of opex that reasonably reflects the opex criteria. We
outline our reasons for this position below. Our assessment of each step change is
grouped according to whether Energex proposed it as:
a step change
a base year adjustment
non recurrent expenditure
demand management
increased overheads allocated to opex.
C.17.1 Proposed step changes
Energex proposed three step changes: one for an increase in opex for asbestos
management and two for decreases in opex as a result of anticipated costs savings.
Asbestos removal
We have not included a step change in our alternative opex forecast for asbestos
removal. We consider our estimate of base opex already provides sufficient funding for
a prudent service provider to efficiently deliver standard control distribution services
while meeting all existing regulatory obligations. We are not satisfied an increase in
base opex is needed to account for additional opex relating to asbestos removal.
Energex stated that the release of the National strategic plan for asbestos awareness
and management in July 2013 will result in additional costs of $1.3 million.829 The aim
of the National strategic plan includes an aspirational target that all government
occupied and controlled buildings are to be free of asbestos containing materials by
2030. Energex stated they have undertaken a number of steps to align with these
aspirational goals.
The National strategic plan prescribes a national approach to asbestos eradication,
handling and awareness in Australia. It is a high level document that establishes a
framework within which jurisdictions work both cooperatively and independently to
achieve set objectives. However, state and territory governments continue to carry
primary responsibility for the regulation of asbestos within their respective jurisdictions.
In Queensland, asbestos in the workplace is regulated by the Work Health and Safety
Act 2011 (Qld). Chapter 8 of the Workplace Health and Safety Regulation 2011 (Qld)
also regulates workplace asbestos practices. This chapter was approved in November
2011.
We recognise the importance of asbestos management and the objectives under the
National strategic plan for asbestos awareness and management. However we
consider that asbestos management is an existing regulatory obligation for Energex.
829
Energex, Regulatory proposal - Appendix 8 Application of base-step-trend model, October 2014, p. 60.
7-297 Attachment 7 – Operating expenditure | Energex preliminary determination 2015–20
We do not consider the establishment of the National strategic plan has increased this
regulatory obligation.
As outlined in this opex attachment and in the forecasting approach appendix D, we
have estimated the total opex a prudent and efficient service provider is likely to need
given the outputs we estimate Energex will deliver and its specific operating
environment. Under this approach, our estimate of total opex provides a sufficient
allowance for a prudent service provider to efficiently deliver standard control
distribution services, while meeting all existing regulatory obligations. Therefore, we
consider that base opex provides adequate funding for Energex to undertake asbestos
management in compliance with its relevant regulatory obligations. We are not
satisfied that a further increase in opex is required for this cost driver.
Vegetation management and distribution management system savings
We have not included negative step changes in our alternative opex forecast for
Energex's proposed cost savings relating to:
reduced vegetation management contract costs from 2014–15 onwards
(–$39.8 million)830
the development and implementation of a fully integrated distribution management
system (–$8.1 million).831
The majority of expenditure in the vegetation management category relates to third
party contracts. Energex allowed contractors to develop their own vegetation
management plan which resulted in savings.
The savings in the distribution network management costs reflect efficiencies
Energex expects to achieve by implementing a fully integrated Distribution
Management System.832
Energex stated these savings help it move towards an efficient level of opex. However,
we have not included the negative step changes in our alternative opex forecast. This
is because in setting our estimate of base opex consistent with the opex criteria, we
have already factored in efficiency savings that should be reflected in the base opex.
To provide further reductions via step changes would lead to a base opex below that
which reasonably reflects the opex criteria.
The Consumer Challenge Panel submitted that the step changes proposed by Energex
will be accounted for in our determination of efficient base year opex and expect us to
decline them.833
830
Energex, Regulatory proposal - Appendix 8 Application of base-step-trend model, October 2014, p. 62. 831
Energex, Regulatory proposal - Appendix 8 Application of base-step-trend model, October 2014, p. 63. 832
The demand management system is used in preparing, checking, authorising, controlling and executing planned
switching for capex and opex work, control of restoration activities for unplanned network events, network
engineering studies and development of network contingency plans. 833
CCP, Submission on Energex and Ergon Energy Capex and Opex proposals, 30 January 2015, p. 26.
7-298 Attachment 7 – Operating expenditure | Energex preliminary determination 2015–20
C.17.2 Proposed base year adjustments
We have not included a step change in our alternative opex forecast for any of the
base year adjustments listed in Table C.1.
Energex made several adjustments to its revealed costs in the base year. We state in
our Expenditure forecast assessment guideline that we may add (or subtract) step
changes for any costs not captured in our estimate of base opex or the rate of change
that are required for forecast opex to meet the opex criteria.834 Energex proposed
these base year adjustments because the amount of expenditure in the base year was
not representative of its expectation of expenditure in the 2015–20 regulatory control
period. The base year adjustments we consider should be assessed as step changes
under our Guideline forecast approach are for:835
the LV crossarm replacement program
additional matrix support and licensing costs
protection review
overhead service inspections
property rent.
Energex sought the following adjustments:
An increase in its base year to include the cost of inspecting and replacing LV
crossarms. The revenue impact of the adjustment is $8.9 million ($2014–15).
Energex proposed a new program to inspect and replace LV crossarms to ensure
system safety and reliability factors are maintained, including as necessary to
comply with legislation failure rates. This program is a new initiative to inspect LV
crossarms using an elevated work platform (EWP) to view them from above and
additional aerial inspections. Energex stated the proposed change is required to
comply with existing regulatory obligations and to ensure the safety of the system.
An increase in its base year for ICT matrix support and licencing costs. Energex
stated additional expenditure is required to support the operation of
communications equipment due to advances in technology.836 The revenue impact
of the adjustment is $6.8 million ($2014–15). The introduction of the new
technology requires periodic software/firmware upgrades and license costs
previously not incurred.
An increase in its base year for a new program to review 11kV feeder protection
schemes and settings to improve network fault detection and clearing time. The
834
AER, Expenditure forecast assessment guideline for electricity distribution, November 2013, p. 24. 835
We did not assess all of the base year adjustments Ergon proposed, as step changes. We discuss the base year
adjustments we did not assess as step changes in the base year appendix. Those adjustments were for, among
other things, classification changes, a forecast based on a historic average and provisions. 836
Energex, Regulatory proposal, Appendix 8 Application of base-step-trend model, October 2014, p. 41.
7-299 Attachment 7 – Operating expenditure | Energex preliminary determination 2015–20
revenue impact of the adjustment is $3.7 million ($2014–15). Because these
feeders are in low growth areas they were not reviewed in the current period.
An increase of $14.2 million ($2014–15) to implement a routine overhead
inspection program to inspect PVC/twisted services on an ongoing basis.837
Energex stated this program is required to comply with existing regulatory
obligations under the Electricity Safety Regulations.
An increase to its base year to reflect rental costs. As part of consolidating its
accommodation, Energex vacated one premise and took occupancy of another
building in February 2013. Energex stated the 2012–13 base year does not
represent a full year of rent.838 Therefore, it is seeking an adjustment to the base
year to reflect a full year of rent. The revenue impact of the adjustment is
$14.7 million ($2014–15).
We consider that inspection and replacement programs, information communication
technology (ICT) opex, protection review and accommodation expenditure are
business as usual costs that an efficient and prudent service provider would typically
incur while meeting its existing regulatory obligations. We do not consider these step
changes are necessary as our estimate of base opex already provides sufficient
funding for Energex, acting as a prudent service provider, to efficiently deliver standard
control distribution services, given its operating environment.
As described above we need to assess whether step changes are required to provide
a total opex forecast that reasonably reflects the opex criteria. Total opex is relatively
recurrent between years. In contrast, opex related to one off projects and programs
may fluctuate from year to year. Given this factor, forecasting at the program level may
provide a biased total opex forecast. For example, while cable inspection costs may
have been low in the base year, to take this into consideration without identifying all the
programs where expenditure might have been higher than average in the base year,
would lead to a total opex forecast above a level that reasonably reflects the opex
criteria. This is discussed in the forecasting method appendix D.
We recognise a service provider may at different times need to spend relatively less or
more opex to meet some existing regulatory obligations. However, a prudent and
efficient service provider will be able to manage compliance with all of its existing
regulatory obligations within our estimate of base opex. We consider a prudent service
provider can generally do this by adjusting its discretionary opex spending from year to
year to most effectively manage those responsibilities.
As noted above, we consider ICT opex, such as for matrix support and licenses, is a
business as usual cost. In addition to this, increases in opex are not usually required if
a service provider chooses to invest in a new IT solution. This is because if the IT
837
Energex, Regulatory proposal, Appendix 8 Application of base-step-trend model, October 2014, p. 45. 838
Energex, Regulatory proposal, Appendix 8 Application of base-step-trend model, October 2014, p. 52. Energex
consolidated its accommodation. Overall it has reduced its total accommodation cost and was able to propose
one-off savings.

7-300 Attachment 7 – Operating expenditure | Energex preliminary determination 2015–20
expenditure is efficient, the outlay should be at least offset by a reduction in other costs
over time. In its submission, Origin Energy had specific concerns about the total level
of ICT costs and considered it may be a key driver of inefficiency.839
For each of these reasons, we have not included a step change in our alternative opex
forecast for any of the base year adjustments assessed above. We are not satisfied
that adding step changes for any of these base year adjustments sought by Energex
would lead to a forecast of opex that reasonably reflects the opex criteria.
C.17.3 Proposed non recurrent expenditure
Energex identified several non-recurrent costs and savings it expects it will incur during
the 2015–20 regulatory control period. For the reasons outlined above, we have
assessed them as step changes.
Power transformer corrosive sulphur treatment
We have not included a step change in our alternative opex forecast for power
transformer corrosive sulphur treatment.
Energex stated that corrective work is required to address the emerging problem of
corrosive sulphur content in mineral oil on affected power transformers. Energex plans
to add a metal passivator to transformers that test positive for corrosive sulphur and
clean the selector switches of high-risk transformers at a total cost of $4.0 million over
five years.840
We consider that corrective maintenance opex relating to faults and emergencies, is a
business as usual cost that an efficient and prudent service provider would incur. We
do not consider a step change is necessary as our estimate of base opex already
provides sufficient funding for Energex, acting as a prudent service provider, to
efficiently deliver standard control distribution services, given its operating
environment. This expenditure does not relate to a new obligation or some change in
Energex's operating environment beyond its control.
Property rental reductions
We have not included a negative step change in our alternative opex forecast for
property rental reductions.
Energex proposed it would save $21.7 million as a result of property rental savings
achieved by reducing the square meters of floor space it occupies.841
839
Origin Energy, Submission to Queensland Electricity distributors' regulatory proposals, 30 January, pp. 11, 14–15. 840
Energex, Regulatory proposal - Appendix 8 Application of base-step-trend model, October 2014, pp. 56–57. 841
Energex, Regulatory proposal - Appendix 8 Application of base-step-trend model, October 2014, pp. 58–59.
7-301 Attachment 7 – Operating expenditure | Energex preliminary determination 2015–20
We have not included this negative step change in our alternative opex forecast
because our estimate of base opex already accounts for efficient accommodation costs
that an efficient and prudent service provider would incur.
C.17.4 Demand management
We have assessed Energex's proposed demand management as a step change
because demand management represents a capex/opex trade-off.
We have not included all of Energex's proposed demand management opex in our
alternative opex forecast. However, we have included a $5.8 million ($2014–15) for
Energex's Bromelton deferral project step change.
Energex considered demand management expenditure is non-recurrent so it adopted a
bottom up approach to forecasting its demand management opex.842
Energex forecast $95.3 million ($2014–15) in opex for its 2015–20 demand
management programs.843
To give effect to its demand management programs, Energex proposed to undertake
the following types of demand management:
Targeted area demand management: Energex runs programs to embed demand
management into specific targeted areas where it is financially justified. This
includes projects related to its business demand management and small to medium
enterprises demand management.
Broad based demand management (BBDM): These programs address major
drivers of residential maximum demand such as hot water systems, air conditioners
and pool pumps using BBDM. This includes projects related to residential demand
management and small to medium enterprises demand management.
Power factor correction for customers on demand (kVA) tariffs and management
and optimising existing load control. These relate to Energex's load control system
and further development of demand management strategies.844
In addition to these programs, Energex also has the demand management innovation
allowance (DMIA) to investigate options to manage demand and tariff reform to support
the network and to provide options for customers to manage their electricity costs.845
We consider targeted demand management which can be quantified and provide a
direct benefit to customers through a reduction in capex is a reasonable capex/opex
trade-off. We consider Energex's Bromelton project which provides an annual deferral
842
Energex, Regulatory proposal, October 2014, p. 133. 843
Energex, Regulatory proposal, Appendix 17 Demand management program, October 2014, p.6. 844
Energex, Regulatory proposal, October 2014, p. 133; Energex, Regulatory proposal, Appendix 17 Demand
management program, October 2014, pp. 4–5. 845
Energex, Regulatory proposal, Appendix 17 Demand management program, October 2014, pp. 4–5.
7-302 Attachment 7 – Operating expenditure | Energex preliminary determination 2015–20
benefit of $2.7 million per annum at a cost of $5.8 million ($2013–14) over the 2015–20
regulatory control period is an efficient capex/opex trade-off.846
However, we have the following concerns with other elements of Energex's proposed
programs.
We note that Energex was unable to specify which projects it deferred as a result of its
2010–15 demand management program.847 Specifically Energex noted it was difficult
to specify with any precision which projects were deferred as a result of its 144 MVA
reduction in maximum demand. Since Energex was unable to identify the precise
capex projects that were deferred for its existing demand management it would not be
reasonable for us to incorporate opex for demand management when the capex
reductions are not clear.
Energex did not provide any details to justify its load management, demand
management strategy, compliance and reporting costs. Although Energex notes a NPV
of $33.4 million for its load control project it is not clear how these benefits have been
derived and what capex this project defers. For this reason we have not included this
expenditure in our alternative opex forecast.
We consider the assumed augex deferral benefits of Energex's BBDM are optimistic.
Specifically Energex assumes a high correlation between the time that BBDM
controlled devices (such as air conditioners and pool pumps) will be running and when
there is a constraint that would be relieved by BBDM. In addition the non-targeted
nature of BBDM means that the locations of BBDM devices and the locations of
network constraints need to be accounted for. Energex did not include this in its
analysis.
We note that Energex has recognised the issues in determining the benefits of BBDM.
Energex noted that due to the 'lumpy' nature of growth related investment in the
network, only a portion of new load under control derived through BBDM will have a
benefit, in terms of deferring growth driven augmentation at any particular point in
time.848 We consider Energex has not discounted its NPV analysis to reflect this lack of
spatial alignment between BBDM and the location of network constraints requiring
augex.
Energex also proposed other targeted demand management projects over the
"medium to long term" beyond this regulatory period. There is less certainty about the
exact timing of these projects and the associated demand management benefits.849We
note delivery of targeted demand management from the non-network solution
providers should flow automatically from the obligations for complying with RIT-D's and
distribution annual planning reports (D-APR's). Since any benefits for medium to long
846
Energex, Response to AER information request EGX 010, p. 12. 847
Energex, Response to AER information request EGX 010, p. 12. 848
Energex, Regulatory proposal, Appendix 17 Demand management program, October 2014, p. 28. 849
Energex, Regulatory proposal, Appendix 17 Demand management program, October 2014, pp. 40–41.
7-303 Attachment 7 – Operating expenditure | Energex preliminary determination 2015–20
term projects only present themselves beyond the forthcoming regulatory period we
consider the direct opex/capex trade-off is not clear so we have not included opex for
these projects in our alternative opex forecast.
We note Energex's proposed direct customer incentive payments comprise the
majority of Energex's total demand management program. We consider Energex has
understated the ability of mandated tariff reform to deliver benefits. Energex has
assumed that incentives are required over and above tariff reform. However Energex
has not quantified the benefits of tariff reform and may have attributed the benefits of
tariff reform to its incentive payments program.850 We do not consider these incentive
payments are necessary as the nature of tariff reform, which is similar to incentive
payments, will yield the same result in reducing customer demand and the need for
augmentation expenditure.
For the above reasons, we have not included all of Energex's proposed demand
management opex in our alternative opex forecast.
C.17.5 Increased overheads allocated to opex
We have not included Energex's forecast increase in opex overheads in our alternative
opex forecast. We do not consider adding these costs to our alternative opex forecast
would lead to a forecast of opex that reasonably reflects the opex criteria.
Energex's opex forecast incorporates a significant increase in opex overhead
expenditure over the 2015–20 regulatory control period. Energex allocates its
overheads between opex and capex based on their respective share of total
expenditure. Because Energex proposed a reduced capex work program, the opex
share of total expenditure, and hence the overheads allocated to opex, are forecast to
increase.
We estimate that, under Energex's proposal, the share of overheads Energex has
allocated to opex will increase from 38 per cent in 2012–13 (after the proposed base
year adjustments) to 45 per cent in 2019–20. This is driving a $138 million increase in
opex over the 2015–20 regulatory control period. As this increase is not in our estimate
of base opex or our rate of change, we need to consider if we should add it as an opex
step change to our estimate of base opex.
We do not consider including a step change for increased overheads would lead to a
forecast of opex that reasonably reflects the opex criteria. This is because we consider
our estimate of base opex already provides sufficient funding for Energex to efficiently
deliver standard control distribution services, given its operating environment.
Overheads are a business as usual cost that would be incurred by an efficient and
prudent service provider delivering standard control distribution services. We also note
that any change in overheads as a result of a change in outputs, for example for
850
Energex, Regulatory proposal, Appendix 17 Demand management program, October 2014, p. 1 and p. 26.

7-304 Attachment 7 – Operating expenditure | Energex preliminary determination 2015–20
growth in Energex's customer base, will be compensated through our opex rate of
change.
We recognise a service provider's opex may be affected by how much of its
expenditure is expensed and how much of it is capitalised. We have had regard to
Energex's capitalisation policy when we assessed its operating environment factors in
estimating our forecast of base opex consistent with the opex criteria (see appendix A).
Therefore, our estimate of base opex already incorporates the effect of capitalisation
policy differences.
Two submissions had specific concerns about the total level of overhead costs. Origin
considered it may be a key driver of inefficiency and the Energy Users Association of
Australia (EUAA) noted they were increasing as a proportion of total expenditure over
the regulatory control period.851
851
Origin Energy, Submission to Queensland Electricity distributors' regulatory proposals, 30 January, pp. 11–14;
EUAA, Submission to Energex revenue proposal 2015–16 to 2019–20, pp. 28–29.
7-305 Attachment 7 – Operating expenditure | Energex preliminary determination 2015–20
D Forecasting method assessment
This appendix sets out our consideration of Energex’s forecasting methodology in
determining our alternative opex forecast for Energex for the 2015–20 period.
Our alternative estimate of total opex is unlikely to exactly match Energex's forecast
(see our assessment approach at the beginning of this opex attachment). Broadly,
differences between the two forecasts can be explained by differences in the
forecasting methods adopted and the inputs and assumptions used to apply the
method. We have reviewed Energex's forecast method to identify if and where
Energex's forecasting method departed from the method set out in the Expenditure
forecast assessment guideline (the guideline forecasting method). Where Energex's
forecasting method did depart from the guideline forecasting method we considered
whether this departure explained the difference between Energex's forecast of total
opex and our own. We also considered whether adopting Energex's approach was
required to produce an opex forecast that reasonably reflects the opex criteria, having
regard to the opex factors.
D.18 Position
We are satisfied that the guideline forecasting method produces an opex forecast that
reasonably reflects the opex criteria. We have not used category specific forecasting
methods to separately forecast any of Energex's opex categories other than debt
raising costs in our alternative total opex forecast. We formed our alternative forecast
total opex using the guideline forecasting method with all opex categories other than
debt raising costs included in base opex.
D.19 Energex's proposal
Energex described its opex forecasting method in its regulatory proposal.852 Energex
stated it used a 'base-step-trend' method to forecast opex where it considered it
appropriate to do so. For some categories it used alternative methods where it
considered it appropriate. It also forecast overhead costs using the base-step-trend
approach with the exception of the ICT usage and service fees. It then allocated these
costs to capex, opex, alternative control service or unregulated services consistent with
its cost allocation method.853
D.20 Assessment approach
The first part of our assessment involved identifying any differences between
Energex's forecasting method and our own method as outlined in our guideline
forecasting method. This involved reviewing:
852
Energex, Regulatory Proposal July 2015 to June 2020, 31 October 2014, pp. 121–140. 853
Energex, Regulatory Proposal July 2015 to June 2020, 31 October 2014, p. 121.
7-306 Attachment 7 – Operating expenditure | Energex preliminary determination 2015–20
the description of Energex's opex forecasting method in its regulatory proposal854
the description of Energex's opex forecasting method in appendix 8 to its regulatory
proposal.855
We then examined the impact of the differences we identified. This provided an
indication of the impacts of the various forecasting methods applied by Energex.
Where we identified differences with significant impacts we considered whether we
needed to amend our forecasting approach to ensure our alternative estimate of opex
reasonably reflects of opex criteria, having regard to the opex factors.
D.21 Reasons for position
In assessing Energex's forecasting method we sought to identify if and where
Energex's forecasting method departed from the guideline forecasting method. Where
Energex's forecasting method did depart from the guideline forecasting method we
considered whether this departure explains the difference between Energex's forecast
of total opex and our own.
Under the guideline forecasting method we start with the actual expenditure in a base
year. If actual expenditure in the base year reasonably reflects the opex criteria we set
base opex equal to actual expenditure. If not we apply an efficiency adjustment to
ensure base opex reflects the opex criteria. We then apply a forecast rate of change to
capture forecasting growth in prices, output and productivity. We then add or subtract
any step changes to account for any other expenditure consistent with the opex criteria
not captured in base opex or the rate of change.856
Energex's opex forecasting method differs from the guideline forecasting approach in
that it disaggregated total opex into 'functional areas' and applied different forecasting
methods to different functional areas.857 Energex applied what it called a base step
trend method to the majority of its expenditure categories. This method is broadly
similar to the guideline forecasting method. However, it used category specific
forecasting methods for some expenditure categories.858
Using category specific forecasting methods for some opex categories may produce
better forecasts of expenditure for those categories but this may not produce a better
forecast of total opex. Generally it is best to use the same forecasting method for all
cost categories of opex because hybrid forecasting methods (that is, combining
revealed cost and category specific methods) can produce biased opex forecasts
inconsistent with the opex criteria. This view is consistent with a view expressed by
Frontier Economics in a previous determination process, which stated:859
854
Energex, Regulatory Proposal July 2015 to June 2020, 31 October 2014, pp. 121–140. 855
Energex, Appendix 8: Application of Base-Step-Trend (BST) Model, October 2014. 856
AER, Expenditure forecast assessment guideline for electricity distribution, November 2013, pp. 22–24. 857
Energex, Appendix 8: Application of Base-Step-Trend (BST) Model, October 2014, pp. 5–7. 858
Energex, Appendix 8: Application of Base-Step-Trend (BST) Model, October 2014, p. 7. 859
Frontier Economics, Opex forecasting and EBSS advice for the SP AusNet final decision, January 2014, p. iii.

7-307 Attachment 7 – Operating expenditure | Energex preliminary determination 2015–20
We consider that it would be inappropriate for the AER to review each
component of controllable opex individually to see whether it conformed to the
same pattern as overall controllable opex. Such ‘cherry-picking’ would likely
result in aggregate controllable opex being systematically and inefficiently
over-forecast.
This is because, once an efficient base level of opex is determined, forecast total opex
can systematically exceed the efficient level of opex if a category specific forecasting
method is used to forecast opex categories:
with low expenditure in the base year, or
with a greater rate of change than total opex.
Within total opex we would expect to see some variation in the composition of
expenditure from year to year. If we use a category specific forecasting method to
forecast those categories where base year opex was low, but not for those where base
opex was high, our forecast of total opex will systematically exceed the efficient level of
opex.
We would also expect to see some variation in total opex from year to year. An
example of this is Energex's higher opex in 2012–13, due in part to ex-tropical cyclone
Oswald increasing emergency response expenditure. Energex used an historic
average to forecast emergency response expenditure as well as corrective repair
expenditure, which it stated was also impacted by factors beyond its control. Using an
historic average rather than the revealed base year expenditure to forecast these two
expenditure categories reduced Energex's opex forecast by $49 million (real 2014–15).
It is important to consider whether the opex forecast is consistent with EBSS when
considering these non-recurrent increases (or decreases) in total opex.860 By relying on
the revealed expenditure in the base year, and applying the EBSS carryover, any one-
off opex increase (or decrease) in the base year is share between the service provider
and its customers as intended by the EBSS. Alternatively, if benchmarking shows opex
to be inefficient and we adjust base opex according, this will remove the impact of any
non-recurrent increases in expenditure.861 In either case it is not necessary to adjust
individual opex categories to remove (or add back) non-recurrent increases (or
decreases) in opex in the base year.
Similarly, if we exclude opex categories where expenditure is rising faster than total
opex then the remaining categories will be rising at a slower rate than total opex or
declining. If we apply the total opex rate of change to those remaining categories then
the total opex forecast will systematically exceed the efficient level of opex. Frontier
Economics made this point when it reviewed the forecasting method adopted by
SP AusNet to forecast its electricity transmission opex:862
860
NER cl. 6.5.6(e)(8). 861
The benchmark efficient level of opex is a function of the reported opex from multiple service providers across
eight years of data. This 'averages out' the impact of one-off increases or decreases in reported opex. 862
Frontier Economics, Opex forecasting and EBSS advice for the SP AusNet final decision, January 2014, p 17.

7-308 Attachment 7 – Operating expenditure | Energex preliminary determination 2015–20
In our view, such ‘cherry-picking’ would likely result in aggregate controllable
opex being systematically and inefficiently over-forecast. This is because with
overall controllable opex fairly stable over time, the exclusion of components
forecast to rise from the single base year forecasting approach would imply that
the remaining components of controllable opex—those subject to the single
base year approach—would exhibit a falling trend. However, as a premise of
the single base year approach is that future expenditure should mimic past
expenditure, using such an approach to forecast expenditure components
known to be in a falling trend would tend to result in the forecasts for these
components being too high. Therefore, combining a bottom-up approach for
rising trend components of opex with a single base year approach for falling
trend components of opex would tend to result in an overall controllable opex
forecast that systematically exceeded the efficient level of expenditure.
If we separately forecast an individual category of opex because it is expected to
increase more rapidly than the total opex basket, then we must also separately
forecast those categories that increase less rapidly to avoid forecasting bias. Not doing
so will systematically exceed the forecast opex required to meet the opex criteria.
Moreover, the NER requires us to form a view on forecast total opex, rather than on
subcomponents.
Energex did separately forecast a number of different expenditure categories including:
levies
corporate programs
ICT expenditure
self-insurance
debt raising costs.
It also used category specific forecasting techniques to forecast some network
overheads and corporate overheads. However, the impact of this was to reduce opex
by around $8 million (real 2014–15) compared to applying a forecast rate of change to
revealed expenditure.
For the above reasons we have not used category specific forecasting methods to
separately forecast any of Energex's opex categories in our substitute total opex
forecast. We formed our substitute forecast total opex using the guideline forecasting
approach with all opex categories other than debt raising costs included in base opex.