Predictors of Response to Physical Therapy Intervention in Patients With Primary Hip Osteoarthritis
15
Predictors of Response to Physical Therapy Intervention in Patients With Primary Hip Osteoarthritis Alexis A. Wright, Chad E. Cook, Timothy W. Flynn, G. David Baxter, J. Haxby Abbott Background. Few studies have investigated or identified common clinical tests and measures as being associated with progression of hip osteoarthritis (OA); fewer still are longitudinal studies exploring prognostic variables associated with long-term outcome following physical therapy treatment. Objective. The purpose of this study was to determine a set of prognostic factors that maximize the accuracy of identifying patients with hip osteoarthritis (OA) likely to demonstrate a favorable response to physical therapy intervention. Design. This was a prognostic study. Methods. Ninety-one patients with a clinical diagnosis of hip OA were analyzed to determine which clinical measures, when clustered together, were most predic- tive of a favorable response to physical therapy intervention. Responders were determined based on OMERACT-OARSI response criteria, which included percent and absolute changes in pain, function, and global rating of change over 1 year. These data served as the reference standard for determining the predictive validity of baseline clinical examination variables. Using multivariate regression analyses and calculations for sensitivity, specificity, and positive and negative likelihood ratios, a cluster was identified. Results. Five baseline variables (unilateral hip pain, age of 58 years, pain of 6/10 on a numeric pain rating scale, 40-m self-paced walk test time of 25.9 seconds, and duration of symptoms of 1 year) were retained in the final model. Failure to exhibit a condition of 1 of the 5 predictor variables decreased the posttest probability of responding favorably to physical therapy intervention from 32% to 1% (negative likelihood ratio0.00, 95% confidence interval0.00 – 0.70). Having at least 2 out of 5 predictor variables at baseline increased the posttest probability of success with physical therapy intervention from 32% to 65% (positive likelihood ratio3.99, 95% confidence interval2.66 – 4.48), and having 3 or more of 5 predic- tor variables increased the posttest probability of success to 99% or higher. A comparison with a control group that did not receive physical therapy further substantiated the cluster. Limitations. The small sample size and the number of variables entered into the logistic regression model may have resulted in spurious findings. This study must be validated in replication studies before it can be considered for use in clinical practice. Conclusions. This study completed the first step in the development of a pre- liminary cluster of baseline variables that identify patients with hip OA as positive responders to physical therapy intervention. A.A. Wright, PT, PhD, DPT, is Vis- iting Specialist in Physical Ther- apy, University of Illinois at Chi- cago Medical Center, Chicago, IL 60612 (USA). Address all corre- spondence to Dr Wright at: [email protected]. C.E. Cook, PT, PhD, MBA, OCS, FAAOMPT, is Chair and Professor, Division of Physical Therapy, Walsh University, North Canton, Ohio. T.W. Flynn, PT, PhD, OCS, FAAOMPT, is Distinguished Pro- fessor, Rocky Mountain University of Health Professions, Provo, Utah. G.D. Baxter, DPhil, BScPT, MBA, is Dean, School of Physiotherapy, University of Otago, Dunedin, New Zealand. J.H. Abbott, PhD, MScPT, DipGrad, FNZCP, is Senior Research Fellow, Department of Orthopaedic Sur- gery, Medical and Surgical Sci- ences, School of Medicine, Univer- sity of Otago. [Wright AA, Cook CE, Flynn TW, et al. Predictors of response to physical therapy intervention in patients with primary hip osteo- arthritis. Phys Ther. 2011; 91:510 –524.] © 2011 American Physical Therapy Association Research Report Post a Rapid Response to this article at: ptjournal.apta.org 510 f Physical Therapy Volume 91 Number 4 April 2011
-
Upload
independent -
Category
Documents
-
view
2 -
download
0
Transcript of Predictors of Response to Physical Therapy Intervention in Patients With Primary Hip Osteoarthritis

Predictors of Response to PhysicalTherapy Intervention in Patients WithPrimary Hip OsteoarthritisAlexis A. Wright, Chad E. Cook, Timothy W. Flynn, G. David Baxter,J. Haxby Abbott
Background. Few studies have investigated or identified common clinical testsand measures as being associated with progression of hip osteoarthritis (OA); fewerstill are longitudinal studies exploring prognostic variables associated with long-termoutcome following physical therapy treatment.
Objective. The purpose of this study was to determine a set of prognostic factorsthat maximize the accuracy of identifying patients with hip osteoarthritis (OA) likelyto demonstrate a favorable response to physical therapy intervention.
Design. This was a prognostic study.
Methods. Ninety-one patients with a clinical diagnosis of hip OA were analyzedto determine which clinical measures, when clustered together, were most predic-tive of a favorable response to physical therapy intervention. Responders weredetermined based on OMERACT-OARSI response criteria, which included percentand absolute changes in pain, function, and global rating of change over 1 year. Thesedata served as the reference standard for determining the predictive validity ofbaseline clinical examination variables. Using multivariate regression analyses andcalculations for sensitivity, specificity, and positive and negative likelihood ratios, acluster was identified.
Results. Five baseline variables (unilateral hip pain, age of �58 years, pain of�6/10 on a numeric pain rating scale, 40-m self-paced walk test time of �25.9seconds, and duration of symptoms of �1 year) were retained in the final model.Failure to exhibit a condition of 1 of the 5 predictor variables decreased the posttestprobability of responding favorably to physical therapy intervention from 32% to�1% (negative likelihood ratio�0.00, 95% confidence interval�0.00–0.70). Havingat least 2 out of 5 predictor variables at baseline increased the posttest probability ofsuccess with physical therapy intervention from 32% to 65% (positive likelihoodratio�3.99, 95% confidence interval�2.66–4.48), and having 3 or more of 5 predic-tor variables increased the posttest probability of success to 99% or higher. Acomparison with a control group that did not receive physical therapy furthersubstantiated the cluster.
Limitations. The small sample size and the number of variables entered into thelogistic regression model may have resulted in spurious findings. This study must bevalidated in replication studies before it can be considered for use in clinical practice.
Conclusions. This study completed the first step in the development of a pre-liminary cluster of baseline variables that identify patients with hip OA as positiveresponders to physical therapy intervention.
A.A. Wright, PT, PhD, DPT, is Vis-iting Specialist in Physical Ther-apy, University of Illinois at Chi-cago Medical Center, Chicago, IL60612 (USA). Address all corre-spondence to Dr Wright at:[email protected].
C.E. Cook, PT, PhD, MBA, OCS,FAAOMPT, is Chair and Professor,Division of Physical Therapy,Walsh University, North Canton,Ohio.
T.W. Flynn, PT, PhD, OCS,FAAOMPT, is Distinguished Pro-fessor, Rocky Mountain Universityof Health Professions, Provo, Utah.
G.D. Baxter, DPhil, BScPT, MBA, isDean, School of Physiotherapy,University of Otago, Dunedin,New Zealand.
J.H. Abbott, PhD, MScPT, DipGrad,FNZCP, is Senior Research Fellow,Department of Orthopaedic Sur-gery, Medical and Surgical Sci-ences, School of Medicine, Univer-sity of Otago.
[Wright AA, Cook CE, Flynn TW,et al. Predictors of response tophysical therapy intervention inpatients with primary hip osteo-arthritis. Phys Ther. 2011;91:510–524.]
© 2011 American Physical TherapyAssociation
Research Report
Post a Rapid Response tothis article at:ptjournal.apta.org
510 f Physical Therapy Volume 91 Number 4 April 2011
Osteoarthritis (OA) is the mostcommon form of arthritis andremains one of the few
chronic diseases of aging for whichthere is little effective treatment.1,2 Ithas been estimated that the agingpopulation will give rise to higherprevalence of disabling OA, as glob-ally the number of people aged over60 years is expected to increase by20% to 33% by 2030.3 Osteoarthritisis a major worldwide cause of eco-nomic loss.4 An aging population,along with escalations in obesity andphysical inactivity,5,6 would increasethe economic burden to society ofdisablement due to OA.
The ability to prevent the onset ofvarious types of arthritis is quite lim-ited; therefore, attenuating the grow-ing economic impact will requirecost-effective efforts to decreasemean medical expenditures. Thisaim may be achieved with greateruse of currently underutilized physi-cal therapy treatment strategies,such as manual therapy and exercisetherapy, both of which have beenshown to reduce pain and disabilityassociated with hip OA,6–8 and bytargeting intervention to those indi-viduals with a higher likelihood ofsuccess. In order for patients, healthcare providers, and third-party pay-ers to determine appropriate treat-ment options, identification of prog-nostic variables associated withreduced pain and improved functionfollowing physical therapy treatmentis needed.
A prognosis is a judgment made by aclinician, informed by clinical infor-mation, regarding a patient’s futurehealth status.9 It provides both thepatient and the practitioner withinformation regarding a patient’slikely response and duration of treat-ment.9 Clinical judgments often arebased on clinical experience aloneand are subject to bias.9 Accuracyregarding prognostic judgments canbe improved by incorporating rele-
vant research findings and has beenhighlighted as a research priority,thus the recent surge in the area ofprognostic studies.10
The literature regarding the ability todifferentiate between patients with amore favorable prognosis and thosewith a poor prognosis has focusedon demographic and radiologicalfindings.11–20 Few studies have inves-tigated or identified common clinicaltests and measures associated with theprogression of hip OA11,12,14–16,18–22;fewer still are longitudinal studiesexploring prognostic variables asso-ciated with long-term outcome fol-lowing physical therapy treatment.23
Given that radiographic imaging isnot always readily available to phys-ical therapists evaluating patientswith hip OA, identification of clin-ical examination variables associatedwith prognosis would allow clini-cians to identify clinical patternswithin the examination and guideprognostic decision making, as wellas determine appropriate treatmentmanagement strategies to promoterestoration of function.
This study explored clinical out-comes (pain, function, patient’sglobal assessment) of hip OA follow-ing conservative treatment strategies(manual therapy and exercise ther-apy), investigating the associationbetween key clinical examinationfindings and likelihood of a betteroutcome. Understanding likelihoodof response to treatment based onclinical examination findings wouldassist the clinician in expediting theevaluation process, distinguishingbetween patients who are at highrisk for worsening pain and disabilityand those likely to experience amore favorable clinical course tophysical therapy treatment strate-gies, and in making appropriate andtimely referrals to specialty provid-ers when physical therapy is likelynot to result in a satisfactoryoutcome.
The primary aim of this study was todetermine a set of prognostic factorsthat maximize the accuracy of iden-tifying patients with hip OA likely todemonstrate long-term reductions inpain and improvements in functionand global assessment at 1 year fol-lowing 9 physical therapy treatmentsessions consisting of manual ther-apy and exercise therapy. A second-ary aim was to investigate whetherthe derived set of prognostic factorswas associated with “response totreatment,” rather than simply “out-come,” by applying the clusteredfindings to a control group thatreceived no physical therapy. Wehypothesized that a distinct set ofprognostic variables are routinelycollected by physical therapists thatdictate an improved outcome with aphysical therapy treatment approachemphasizing manual therapy and exer-cise and are unique to the prognosis ofa control group of patients who didnot receive physical therapy.
MethodParticipantsThe study sample consisted ofpatients who were part of a largerrandomized controlled trial designedto investigate the long-term effective-ness of 3 different physical therapyprograms against that of usual careprovided to a group of patients withOA of the hip or knee.24 The presentstudy focused only on those patientswith OA of the hip (n�93). The sam-ple represented consecutive patientsfulfilling the eligibility criteria fromMarch 2008 to March 2009. All
Available WithThis Article atptjournal.apta.org
• The Bottom Line Podcast
• Audio Abstracts Podcast
This article was published ahead ofprint on February 10, 2011, atptjournal.apta.org.
Predictors of Response to Physical Therapy in Patients With Primary Hip Osteoarthritis
April 2011 Volume 91 Number 4 Physical Therapy f 511
patients agreed to be enrolled in thestudy and provided their signedinformed consent.
Details of recruitment and selec-tion of patients are described else-where.24 Briefly, participants wererecruited from primary and second-ary care sources: patients of familypractice physicians and patientsreferred to the Department of Ortho-paedic Surgery, Outpatient Clinic,Dunedin Hospital, Dunedin, NewZealand, for an orthopedic consulta-tion for consideration of hip jointreplacement surgery.24 Participantswere eligible for inclusion in thestudy if they met the American Col-lege of Rheumatology (ACR) clinicalcriteria for diagnosis of OA of thehip.24,25 Exclusion criteria were:
• previous knee or hip joint replace-ment surgery of the affected joint;
• any other surgical procedure ofthe lower limbs in the previous 6months;
• scheduled surgical operationwithin 3 months;
• rheumatoid arthritis;• initiation of opioid analgesia or cor-
ticosteroid or analgesic injectionintervention for hip or knee painwithin the previous 30 days;
• uncontrolled hypertension or mod-erate to high risk for cardiac com-plications during exercise;
• physical impairments unrelated tothe hip or knee preventing safe par-ticipation in exercise, manual ther-apy, walking, or stationary cycling,including: vision problems thataffect mobility, body weight of�155 kg, neurogenic disorder, pri-mary or significantly limiting backpain, advanced osteoporosis, orinability to walk 10 m without anassistive device;
• inability to comprehend and com-plete study assessments or adhereto study instructions; and
• stated inability to attend or com-plete the proposed course of inter-vention and follow-up schedule.
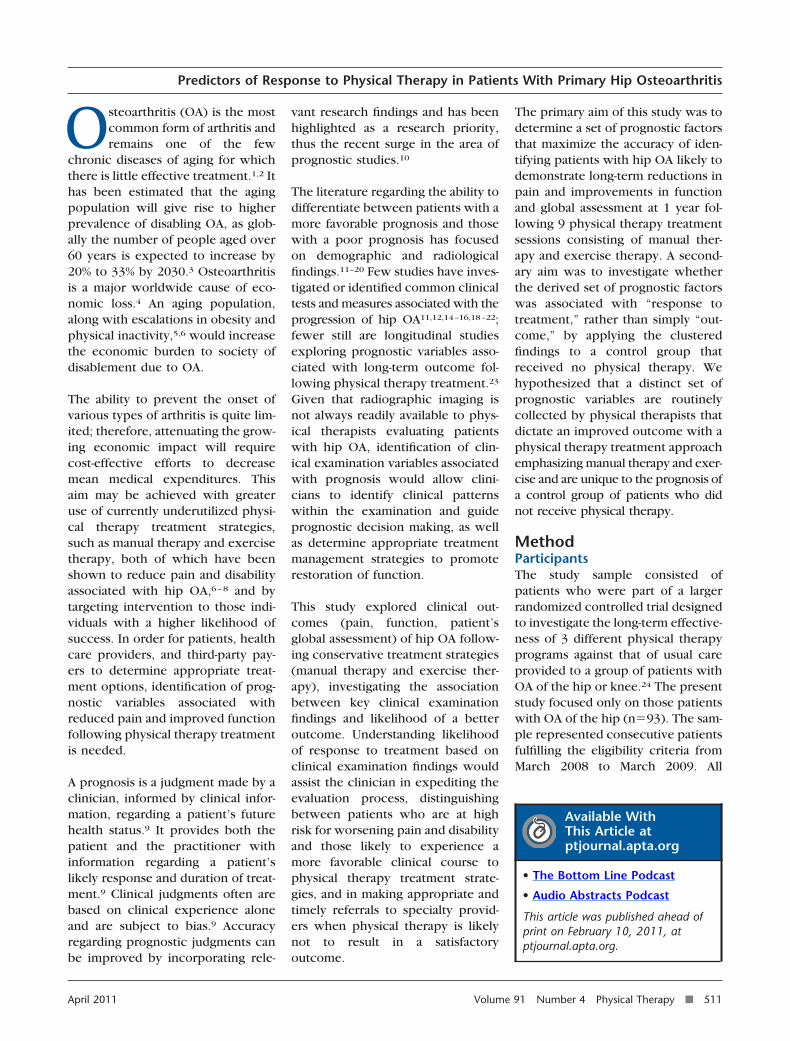
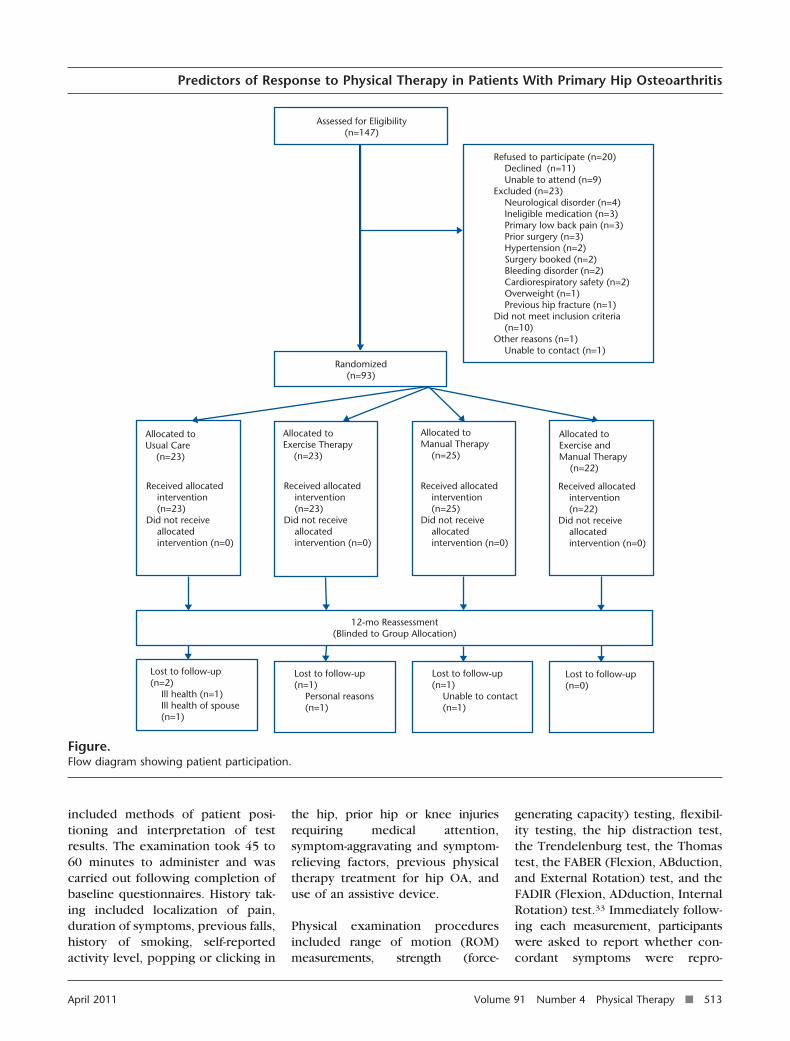
Fifty-four potential participants wereexcluded from the study based onthese criteria (Figure). The majorityof these individuals were excludedbecause they did not meet the ACRcriteria previously mentioned.
Study DesignEligible patients were randomly allo-cated to receive manual therapy,exercise therapy, or manual therapyplus exercise therapy or to a controlgroup that received usual care (nophysical therapy).
Examination ProceduresData were collected at baseline andat 1-year assessment visits at theCentre for Physiotherapy Research,School of Physiotherapy, Universityof Otago, Dunedin, New Zealand.After the participants signed aninformed consent document, theycompleted a baseline questionnaire,answered various medical historyquestions, and underwent the phys-ical examination.
The baseline questionnaire includeddemographic information and anumeric pain rating scale (NPRS)using an 11-point scale.26,27 TheWestern Ontario and McMaster Uni-versities Osteoarthritis Index(WOMAC 3.1)28,29 was used to assessdisability related to OA. The PainBelief Screening Instrument (PBSI)was used to assess pain intensity, dis-ability, self-efficacy, fear avoidance,and catastrophizing.30,31 Depressionwas screened with a 2-question casefinding instrument developed toidentify depression in people receiv-ing primary care.32
Each participant received a standard-ized history and physical examina-tion administered by the primaryauthor (A.A.W.). Prior to performingany tests and measures, a complete“guide to examination” was devel-oped including operational defini-tions of each test and is availablefrom the primary author. This guide
The Bottom Line
What do we already know about this topic?
Literature regarding the ability to differentiate between patients with amore favorable prognosis and those with a poor prognosis has focused ondemographic and radiological findings. Only a few studies have investi-gated common clinical tests and measures associated with the progressionof hip osteoarthritis (OA).
What new information does this study offer?
This is the first study to identify variables associated with a favorableresponse to physical therapy treatment in patients with hip OA.
If you’re a patient, what might these findings meanfor you?
Given that the strongest single predictor of success with physical therapywas symptom duration of less than 1 year, patients are encouraged to seekphysical therapy treatment early in the disease process rather than waitinguntil it has reached more advanced stages, when the disease may be lessresponsive to conservative treatments.
Predictors of Response to Physical Therapy in Patients With Primary Hip Osteoarthritis
512 f Physical Therapy Volume 91 Number 4 April 2011
included methods of patient posi-tioning and interpretation of testresults. The examination took 45 to60 minutes to administer and wascarried out following completion ofbaseline questionnaires. History tak-ing included localization of pain,duration of symptoms, previous falls,history of smoking, self-reportedactivity level, popping or clicking in
the hip, prior hip or knee injuriesrequiring medical attention,symptom-aggravating and symptom-relieving factors, previous physicaltherapy treatment for hip OA, anduse of an assistive device.
Physical examination proceduresincluded range of motion (ROM)measurements, strength (force-
generating capacity) testing, flexibil-ity testing, the hip distraction test,the Trendelenburg test, the Thomastest, the FABER (Flexion, ABduction,and External Rotation) test, and theFADIR (Flexion, ADduction, InternalRotation) test.33 Immediately follow-ing each measurement, participantswere asked to report whether con-cordant symptoms were repro-
Lost to follow-up(n=0)
Lost to follow-up(n=1) Unable to contact (n=1)
Lost to follow-up(n=1) Personal reasons (n=1)
Lost to follow-up(n=2) Ill health (n=1) Ill health of spouse (n=1)
12-mo Reassessment(Blinded to Group Allocation)
Allocated toManual Therapy (n=25)
Allocated toExercise andManual Therapy (n=22)
Allocated toExercise Therapy (n=23)
Allocated toUsual Care (n=23)
Received allocated intervention (n=25)Did not receive allocated intervention (n=0)
Received allocated intervention (n=23)Did not receive allocated intervention (n=0)
Received allocated intervention (n=23)Did not receive allocated intervention (n=0)
Received allocated intervention (n=22)Did not receive allocated intervention (n=0)
Randomized(n=93)
Assessed for Eligibility(n=147)
Refused to participate (n=20) Declined (n=11) Unable to attend (n=9)Excluded (n=23) Neurological disorder (n=4) Ineligible medication (n=3) Primary low back pain (n=3) Prior surgery (n=3) Hypertension (n=2) Surgery booked (n=2) Bleeding disorder (n=2) Cardiorespiratory safety (n=2) Overweight (n=1) Previous hip fracture (n=1)Did not meet inclusion criteria (n=10)Other reasons (n=1) Unable to contact (n=1)
Figure.Flow diagram showing patient participation.
Predictors of Response to Physical Therapy in Patients With Primary Hip Osteoarthritis
April 2011 Volume 91 Number 4 Physical Therapy f 513
duced. A concordant symptom wasdefined as a familiar sign of pain,functional loss, or movement that isverified by the patient as being thecomplaint that prompted them toseek care.33 Physical performancemeasures, including the Timed “Up& Go” Test,34,35 a 40-m self-pacedwalk (40-m SPWT),34 a 30-secondchair stand,36,37 the Sock test,38 and a20-cm step test,39,40 also were per-formed. In addition, the longitudinalarch angle of the foot wasrecorded.41
Measurements of strength wereobtained using the Nicholas hand-held dynamometer,* which has dem-onstrated excellent interday andintraday reliability.42 The ROM mea-surements for hip flexion and exten-sion, hip abduction and adduction,and the Thomas test were obtainedusing a universal goniometer, whichhas been demonstrated to be a suffi-ciently reliable tool for measuringhip and knee ROM.23,43 All other hipand spine ROM measurements wereobtained using a gravity inclinome-ter, which has been used in previousstudies to measure hip and spinemotion.23,44,45
Interrater reliability of selected clin-ical tests and measures was assessedin a subsample of patients with adiagnosis of hip or knee OA whowere participants in the larger clini-cal trial. Specific tests and measuresfor the current reliability study werechosen based on the lack of availableevidence regarding their reliability inthe OA patient population. If reliabil-ity was reported in several studiesor in at least 1 high-quality study ofthe hip or knee OA population, fur-ther testing was not performed. Mea-sures not meeting this criterion weretested in our reliability study. Tworaters, both trained physical thera-pists who were not involved in the
intervention and were blinded togroup allocation, performed the test-ing. These raters were considered tobe representative of the populationof practicing physical therapists.Based on each participant beingmeasured twice, once by each rater,it was estimated that 33 participantswere required for the reliabilityassessment. Given that the desiredlevel of reliability was .7, a one-sidedtest at a significance level of .05 withthis sample size would have 80%power to show a level of reliability ofat least .4; according to the classifi-cation of Landis and Koch,46 a levelof reliability of .4 represents fair reli-ability and a level of reliability of .7represents substantial reliability.
The 2 raters also underwent trainingsessions to standardize their perfor-mance prior to the study. On the dayof their entry into the clinical trial,the first rater performed the baselineexamination for each participant.Participants were scheduled a sec-ond appointment within 7 days,prior to the their being scheduledany treatment, and the measureswere assessed by a second rater,who was blinded to the findings ofthe first rater. The second raterrepeated the physical examination inthe same order as the first rater. Datafrom these 2 assessments contrib-uted to the reliability analysis. Inorder to avoid bias due to a treat-ment effect, it was important thatthe participants were retested beforethey received any intervention. Eachindividual was examined in the sameenvironment with the same equip-ment on both visits to reduce mea-surement error associated withexternal factors.
Outcome MeasuresWOMAC 3.1. The WOMAC 3.1 isa condition-specific instrument andhas been shown to have validity andresponsiveness for OA condi-tions.28,29,47,48 The WOMAC 3.1 con-sists of 24 questions (5 about pain, 2
about stiffness, and 17 about physi-cal function). We used the numericrating scale version,49 rated on an11-point scale (0–10). Total scorescan range from 0 to 240, with higherscores reflecting more pain and stiff-ness and poorer physical function.
Global Rating of Change Scale.The Global Rating of Change Scale(GRCS)50 is a measure of patient per-ception that asks people to rate thechange in their symptoms at a12-month follow-up compared with12 months earlier (ie, at baseline).The question reads, “Please imaginehow you would have described yourOVERALL health status 1 year ago.How do you feel in general today ascompared to 1 year earlier as far asyour osteoarthritis of the left/righthip is concerned?” The GRCS has 15possible answers, ranging from �7(“a very great deal better”) to �7 (“avery great deal worse”).
OMERACT-OARSI responder cri-teria. Participants were dichoto-mized according to success or non-success with respect to treatmentbased on OMERACT-OARSI respondercriteria27 determined a priori: (1) anincrease of �50% and absolutechange of �20 in pain or function, asdefined by the WOMAC subscales, or(2) improvement in at least 2 of thefollowing: an increase of �20% andabsolute change of �10 in pain(WOMAC pain subscale), an increaseof �20% and absolute change of�10 in function (WOMAC functionsubscale), and an improvement of�20% and absolute change of �10,as defined by the GRCS.27 The valid-ity of the OMERACT-OARSI responsecriteria has been demonstrated pre-viously in patients with OA treatedwith manual therapy and exercisetherapy.51
InterventionStandardized interventions were pro-vided at the School of Physiotherapy,University of Otago, under the super-
* Lafayette Instrument Co, PO Box 5729,Lafayette, IN 47903.
Predictors of Response to Physical Therapy in Patients With Primary Hip Osteoarthritis
514 f Physical Therapy Volume 91 Number 4 April 2011
vision of licensed practicing physicaltherapists (n�5). A 2-day trainingsession was conducted with these5 participating therapists to stan-dardize the intervention protocols.Participants were randomly allo-cated to receive: (1) manual therapy,(2) exercise therapy, (3) both man-ual therapy and exercise therapy, or(4) usual care. All participants under-went a 9-session physical therapyprogram, which comprised 7 one-on-one supervised sessions of 1-hourduration within the first 9 weeksfollowed by 2 additional sessions atweeks 16 and 17. Manual therapyprimarily comprised a standardizedprotocol of therapist-applied proce-dures intended to modify the ROMand quality of motion of the hip jointand secondarily included additionalprocedures intended to addressimpairments of neighboring lower-quarter joints and soft tissues. Exer-cise therapy comprised a multimodal,supervised program of: stationarycycling for warm-up and aerobicconditioning; muscle strengthening;muscle stretching; and neuromus-cular control exercises, includingbalance and challenging gait drills.Further details of the interventionprotocols are reported elsewhere.24
Combined manual therapy plus exer-cise comprised approximately 30minutes devoted to each protocol.All participants were additionallyinstructed in a home exercise pro-gram to complement the mode oftheir allocated protocol, comprisingat least 3 but not more than 6procedures.
BlindingConcealed allocation was ensured byusing a remote randomization ser-vice, TENALEA (Trans-European Net-work for Clinical Trials Service,Amsterdam, the Netherlands). Out-come assessors, orthopedic sur-geons, and general medicine practi-tioners were blinded to groupallocation and were not involved inproviding the trial interventions.
Physical therapists delivering theintervention could not be blinded togroup allocation.
Data AnalysisData were analyzed using Stata ver-sion 10.0.† Participants were dichot-omized according to success or non-success with respect to treatmentbased on the OMERACT-OARSIresponder criteria mentioned above.Response to physical therapy treat-ment (success or nonsuccess) at 1year was used as the reference stan-dard “responder.” The WOMAC painand function subscales were stan-dardized to a 100-point scale todetermine percent and absolutechanges, as defined by OMERACT-OARSI response criteria. TheWOMAC pain subscale scores weremultiplied by a coefficient of 2, andthe WOMAC function subscalescores were multiplied by a coeffi-cient of 0.59. Using a 15-point GRCS,a score of �3 was defined as a suc-cessful response to physical therapy,which closely resembles theOMERACT-OARSI response criterionof 20%. The primary analysis of thedata was undertaken using the prin-ciple of intention to treat (ITT). OurITT analysis included all participants,including those who underwentjoint replacement surgery prior tothe 1-year follow-up examination;data for these patients were basedon the last recorded outcome valueprior to surgery. Descriptive statis-tics were computed, and partici-pants were dispersed into groups ofindividuals with and without a suc-cessful response to physical therapy.A P value of �.05 was consideredsignificant.
Interrater reliability coefficients wereassessed for each potential predictorvariable. Variables were tested fornormal distribution prior to perform-ing any data analysis. Intraclass cor-
relation coefficients (ICC [2,1]) wereused with continuous and ordinalvariables, with corresponding stan-dard errors of measurement (SEMs),according to the following equation52:
SEM � SD � ��1 � ICC�.
The SEM quantifies the measurementerror in the same units as the originalmeasurement, providing a clinicallymeaningful value to be interpretedby the clinician.53 In order to deter-mine the minimal value needed tobe 95% confident a real change hadoccurred on an individual patientlevel, the smallest reliable differenceat 95% confidence level (SRD95)was calculated using the followingformula54:
SRD95 � 1.96 � SEM � �2.
Coefficients of variation of methoderror (CVME) also were computed toassess test-retest variation of scores.The Cohen kappa coefficient (toaccount for chance agreement) andpercentage of agreement were usedwith nonordinal categorical data.55,56
The kappa coefficient indicates theproportion of agreement beyondchance.55 Ninety-five percent confi-dence intervals (CIs) were calculatedfor all reliability coefficients.
In the group of participants ran-domly allocated to receive physicaltherapy, a maximum of 10 predictorvariables (Tab. 1) were tested fortheir univariate association with thereference standard in order to avoidoverfitting the model. Continuousvariables were dichotomized usingreceiver operating characteristiccurves to determine cutoff values.57
Contingency tables (2 � 2) wereused to calculate sensitivity, specific-ity, and likelihood ratios (positivelikelihood ratio [LR�], negative like-lihood ratio [LR�]), with 95% CIs,for each predictor variable. The LR�ratio was calculated as sensitivity/1� specificity, and the LR� ratio was
† StataCorp LP, 4905 Lakeway Dr, College Sta-tion, TX 77845.
Predictors of Response to Physical Therapy in Patients With Primary Hip Osteoarthritis
April 2011 Volume 91 Number 4 Physical Therapy f 515
calculated as 1 � sensitivity/specific-ity.58 The LR� is used to modify theposttest probability and indicates theincrease in the probability of successgiven a positive finding.58 The LR�also is used to modify the posttestprobability and indicates thedecrease in the probability of suc-cess in the absence of a variable (ie,a negative finding). According to Jae-schke et al,59 LR� values between1.0 and 2.0 and LR� values between0.5 and 1.0 generate minimal shiftsin posttest probability, LR� valuesbetween 2.0 and 5.0 and LR� valuesbetween 0.2 and 0.5 generate smallshifts, LR� values between 5.0 and10.0 and LR� values between 0.1and 0.2 generate moderate shifts,and LR� values of �10 and LR�values of �0.1 generate significantand almost conclusive shifts in post-test probability.58 Baseline WOMACpain and function scores were notincluded in the analysis with thedependent variable “50% or 20%improvement in pain or function”because the response definition wasderived from the relative change thatadjusts for the expected high corre-lation between absolute change andinitial scores.
Conditionally independent variables(in essence, 2 variables that do not
affect one another) from the individ-ual 2 � 2 analyses that resulted inLR� values of �1.5 or LR� values of�0.5 were retained as potential pre-dictor variables and entered into abackward stepwise binary logisticregression model to determine themost accurate set of variables for pre-diction of success following physicaltherapy. All variables were screenedfor collinearity by calculating bivari-ate Spearman correlation coeffi-cients. Variables with a correlationcoefficient higher than .40 were notused together in the regressionmodel. Significance levels of .15 and.10 were used to exit and enter themodel, respectively, to minimize thelikelihood of excluding potentiallyhelpful variables. The Hosmer-Lemeshow summary goodness-of-fitstatistic was used to assess the fit ofthe model to the data and tested thehypothesis that the model fit thedata. Variables retained in the regres-sion model were used to formulatea multivariate predictor variablemodel and were input into 2 � 2contingency tables that involved theconditions of 1 of 5, 2 of 5, 3 of 5, 4of 5, and 5 of 5 positive findings. Foreach condition, sensitivity, specific-ity, and LR values were calculated tomeasure the ability of the modelsto discriminate between responders
and nonresponders. The percentageof participants meeting each predic-tion variable was calculated. In addi-tion, in each condition, posttestprobability values were calculatedfrom the pretest probability (theprevalence of responders in this sam-ple) and LR values.
To determine whether the derivedpredictor variables could be consid-ered sound predictors of responseto physical therapy treatment orwhether they were simply variablesof prognosis regardless of treatment,we investigated their sensitivity,specificity, and LR values in the usualcare group.
Ten to fifteen participants per pre-dictor has been suggested as anappropriate boundary level per vari-able to meet statistical assumptionswith regard to regression analy-ses.60,61 This finding suggests that100 to 150 participants would pro-vide adequate values for the regres-sion analysis, whereas larger num-bers may be necessary to furthernarrow the CIs for the prognosticstatistics. Our study was poweredusing the regression values and 10predictor variables.
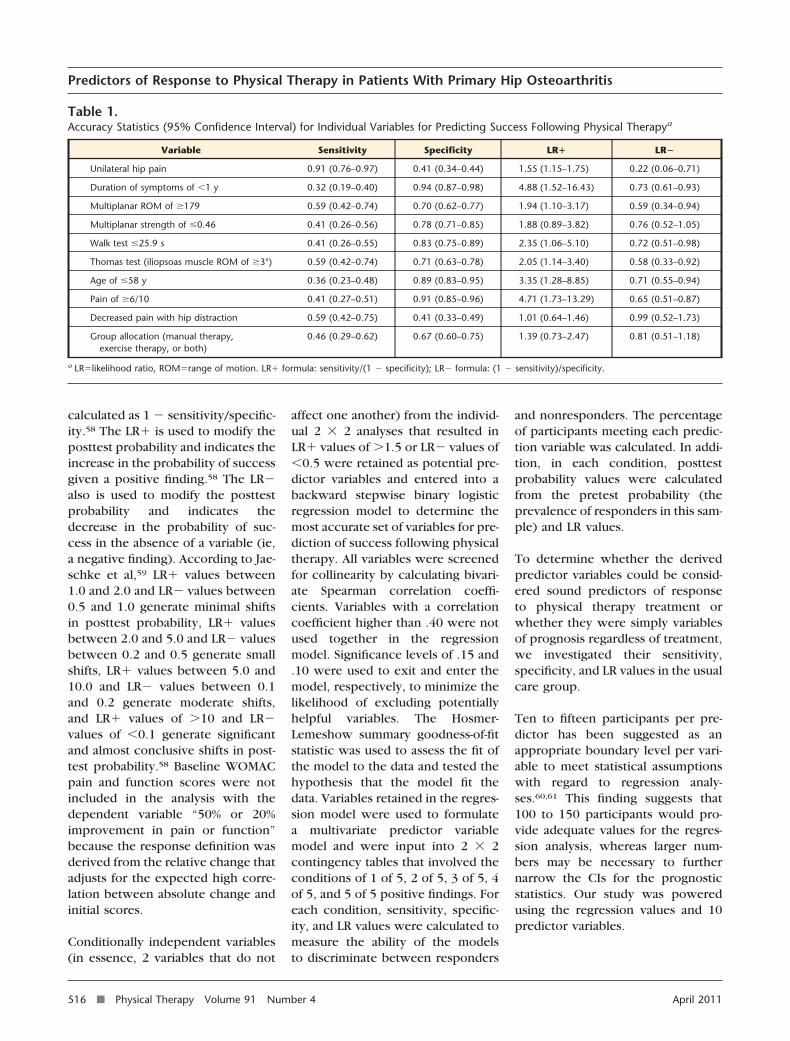
Table 1.Accuracy Statistics (95% Confidence Interval) for Individual Variables for Predicting Success Following Physical Therapya
Variable Sensitivity Specificity LR� LR�
Unilateral hip pain 0.91 (0.76–0.97) 0.41 (0.34–0.44) 1.55 (1.15–1.75) 0.22 (0.06–0.71)
Duration of symptoms of �1 y 0.32 (0.19–0.40) 0.94 (0.87–0.98) 4.88 (1.52–16.43) 0.73 (0.61–0.93)
Multiplanar ROM of �179 0.59 (0.42–0.74) 0.70 (0.62–0.77) 1.94 (1.10–3.17) 0.59 (0.34–0.94)
Multiplanar strength of �0.46 0.41 (0.26–0.56) 0.78 (0.71–0.85) 1.88 (0.89–3.82) 0.76 (0.52–1.05)
Walk test �25.9 s 0.41 (0.26–0.55) 0.83 (0.75–0.89) 2.35 (1.06–5.10) 0.72 (0.51–0.98)
Thomas test (iliopsoas muscle ROM of �3°) 0.59 (0.42–0.74) 0.71 (0.63–0.78) 2.05 (1.14–3.40) 0.58 (0.33–0.92)
Age of �58 y 0.36 (0.23–0.48) 0.89 (0.83–0.95) 3.35 (1.28–8.85) 0.71 (0.55–0.94)
Pain of �6/10 0.41 (0.27–0.51) 0.91 (0.85–0.96) 4.71 (1.73–13.29) 0.65 (0.51–0.87)
Decreased pain with hip distraction 0.59 (0.42–0.75) 0.41 (0.33–0.49) 1.01 (0.64–1.46) 0.99 (0.52–1.73)
Group allocation (manual therapy,exercise therapy, or both)
0.46 (0.29–0.62) 0.67 (0.60–0.75) 1.39 (0.73–2.47) 0.81 (0.51–1.18)
a LR�likelihood ratio, ROM�range of motion. LR� formula: sensitivity/(1 � specificity); LR� formula: (1 � sensitivity)/specificity.
Predictors of Response to Physical Therapy in Patients With Primary Hip Osteoarthritis
516 f Physical Therapy Volume 91 Number 4 April 2011
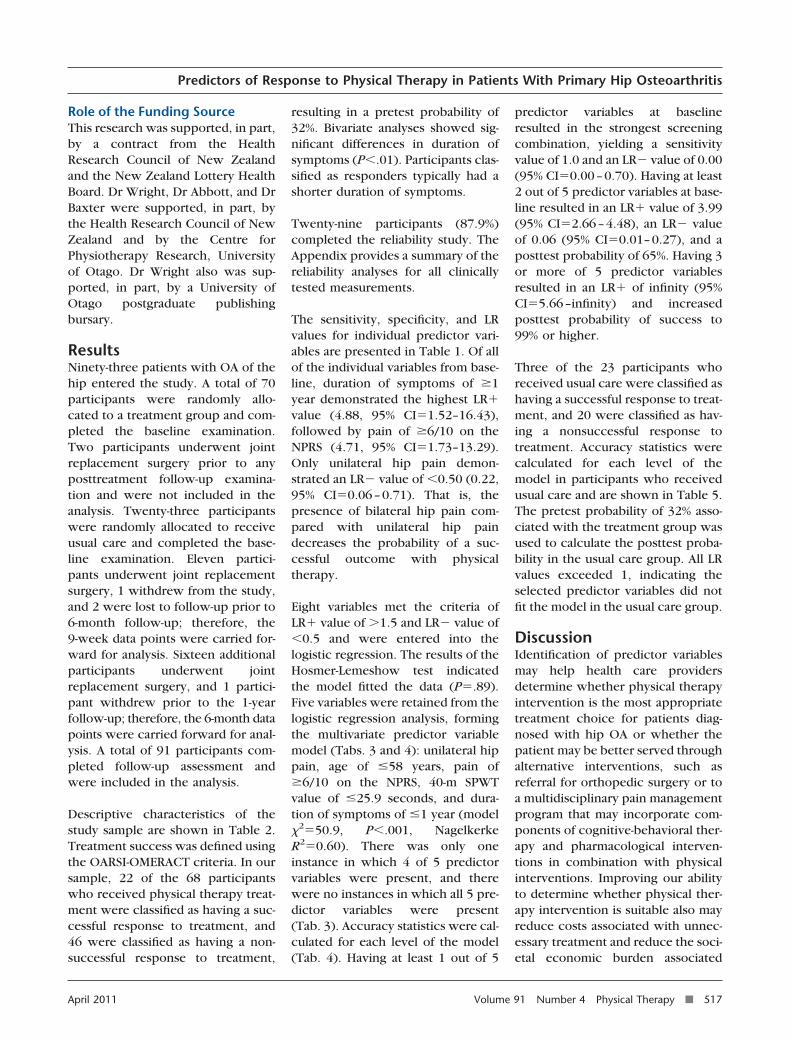
Role of the Funding SourceThis research was supported, in part,by a contract from the HealthResearch Council of New Zealandand the New Zealand Lottery HealthBoard. Dr Wright, Dr Abbott, and DrBaxter were supported, in part, bythe Health Research Council of NewZealand and by the Centre forPhysiotherapy Research, Universityof Otago. Dr Wright also was sup-ported, in part, by a University ofOtago postgraduate publishingbursary.
ResultsNinety-three patients with OA of thehip entered the study. A total of 70participants were randomly allo-cated to a treatment group and com-pleted the baseline examination.Two participants underwent jointreplacement surgery prior to anyposttreatment follow-up examina-tion and were not included in theanalysis. Twenty-three participantswere randomly allocated to receiveusual care and completed the base-line examination. Eleven partici-pants underwent joint replacementsurgery, 1 withdrew from the study,and 2 were lost to follow-up prior to6-month follow-up; therefore, the9-week data points were carried for-ward for analysis. Sixteen additionalparticipants underwent jointreplacement surgery, and 1 partici-pant withdrew prior to the 1-yearfollow-up; therefore, the 6-month datapoints were carried forward for anal-ysis. A total of 91 participants com-pleted follow-up assessment andwere included in the analysis.
Descriptive characteristics of thestudy sample are shown in Table 2.Treatment success was defined usingthe OARSI-OMERACT criteria. In oursample, 22 of the 68 participantswho received physical therapy treat-ment were classified as having a suc-cessful response to treatment, and46 were classified as having a non-successful response to treatment,
resulting in a pretest probability of32%. Bivariate analyses showed sig-nificant differences in duration ofsymptoms (P�.01). Participants clas-sified as responders typically had ashorter duration of symptoms.
Twenty-nine participants (87.9%)completed the reliability study. TheAppendix provides a summary of thereliability analyses for all clinicallytested measurements.
The sensitivity, specificity, and LRvalues for individual predictor vari-ables are presented in Table 1. Of allof the individual variables from base-line, duration of symptoms of �1year demonstrated the highest LR�value (4.88, 95% CI�1.52–16.43),followed by pain of �6/10 on theNPRS (4.71, 95% CI�1.73–13.29).Only unilateral hip pain demon-strated an LR� value of �0.50 (0.22,95% CI�0.06–0.71). That is, thepresence of bilateral hip pain com-pared with unilateral hip paindecreases the probability of a suc-cessful outcome with physicaltherapy.
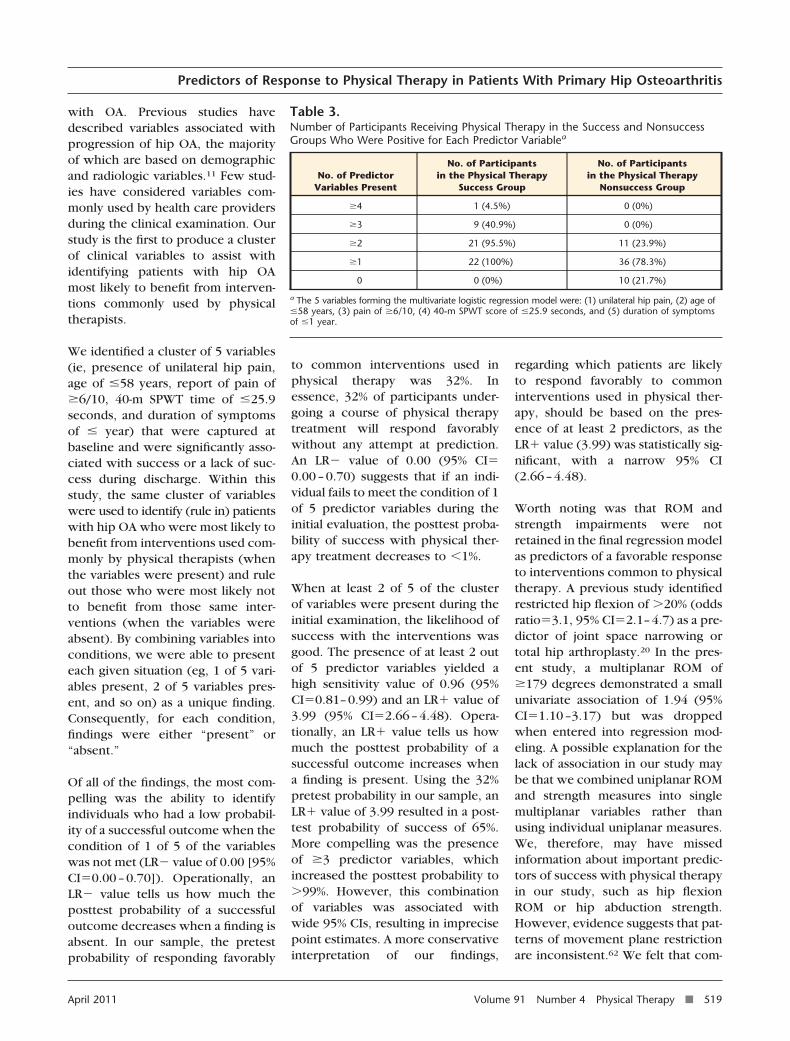
Eight variables met the criteria ofLR� value of �1.5 and LR� value of�0.5 and were entered into thelogistic regression. The results of theHosmer-Lemeshow test indicatedthe model fitted the data (P�.89).Five variables were retained from thelogistic regression analysis, formingthe multivariate predictor variablemodel (Tabs. 3 and 4): unilateral hippain, age of �58 years, pain of�6/10 on the NPRS, 40-m SPWTvalue of �25.9 seconds, and dura-tion of symptoms of �1 year (model�2�50.9, P�.001, NagelkerkeR2�0.60). There was only oneinstance in which 4 of 5 predictorvariables were present, and therewere no instances in which all 5 pre-dictor variables were present(Tab. 3). Accuracy statistics were cal-culated for each level of the model(Tab. 4). Having at least 1 out of 5
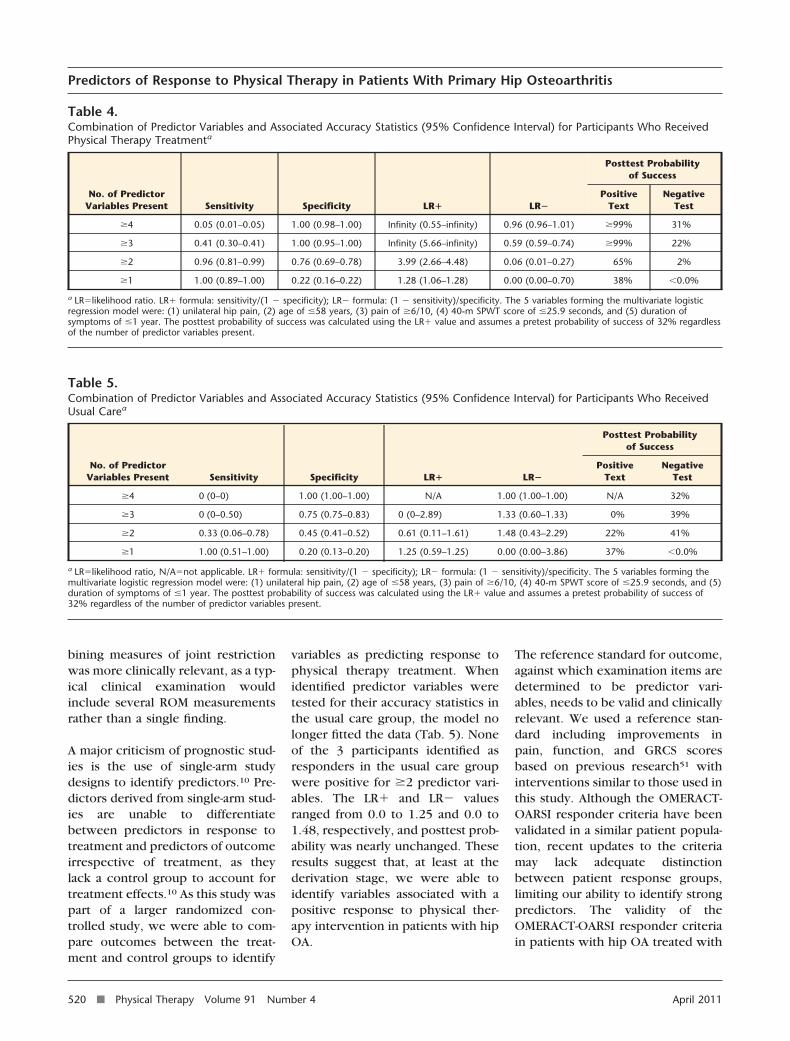
predictor variables at baselineresulted in the strongest screeningcombination, yielding a sensitivityvalue of 1.0 and an LR� value of 0.00(95% CI�0.00–0.70). Having at least2 out of 5 predictor variables at base-line resulted in an LR� value of 3.99(95% CI�2.66–4.48), an LR� valueof 0.06 (95% CI�0.01–0.27), and aposttest probability of 65%. Having 3or more of 5 predictor variablesresulted in an LR� of infinity (95%CI�5.66–infinity) and increasedposttest probability of success to99% or higher.
Three of the 23 participants whoreceived usual care were classified ashaving a successful response to treat-ment, and 20 were classified as hav-ing a nonsuccessful response totreatment. Accuracy statistics werecalculated for each level of themodel in participants who receivedusual care and are shown in Table 5.The pretest probability of 32% asso-ciated with the treatment group wasused to calculate the posttest proba-bility in the usual care group. All LRvalues exceeded 1, indicating theselected predictor variables did notfit the model in the usual care group.
DiscussionIdentification of predictor variablesmay help health care providersdetermine whether physical therapyintervention is the most appropriatetreatment choice for patients diag-nosed with hip OA or whether thepatient may be better served throughalternative interventions, such asreferral for orthopedic surgery or toa multidisciplinary pain managementprogram that may incorporate com-ponents of cognitive-behavioral ther-apy and pharmacological interven-tions in combination with physicalinterventions. Improving our abilityto determine whether physical ther-apy intervention is suitable also mayreduce costs associated with unnec-essary treatment and reduce the soci-etal economic burden associated
Predictors of Response to Physical Therapy in Patients With Primary Hip Osteoarthritis
April 2011 Volume 91 Number 4 Physical Therapy f 517
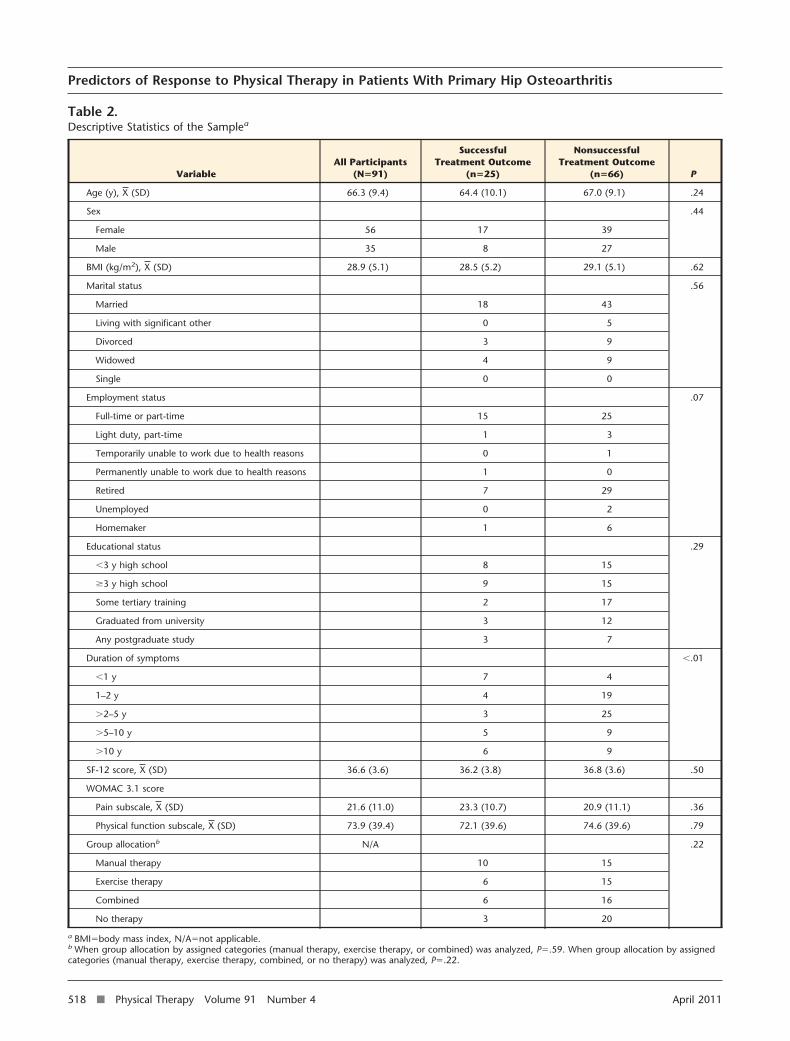
Table 2.Descriptive Statistics of the Samplea
VariableAll Participants
(N�91)
SuccessfulTreatment Outcome
(n�25)
NonsuccessfulTreatment Outcome
(n�66) P
Age (y), X (SD) 66.3 (9.4) 64.4 (10.1) 67.0 (9.1) .24
Sex .44
Female 56 17 39
Male 35 8 27
BMI (kg/m2), X (SD) 28.9 (5.1) 28.5 (5.2) 29.1 (5.1) .62
Marital status .56
Married 18 43
Living with significant other 0 5
Divorced 3 9
Widowed 4 9
Single 0 0
Employment status .07
Full-time or part-time 15 25
Light duty, part-time 1 3
Temporarily unable to work due to health reasons 0 1
Permanently unable to work due to health reasons 1 0
Retired 7 29
Unemployed 0 2
Homemaker 1 6
Educational status .29
�3 y high school 8 15
�3 y high school 9 15
Some tertiary training 2 17
Graduated from university 3 12
Any postgraduate study 3 7
Duration of symptoms �.01
�1 y 7 4
1–2 y 4 19
�2–5 y 3 25
�5–10 y 5 9
�10 y 6 9
SF-12 score, X (SD) 36.6 (3.6) 36.2 (3.8) 36.8 (3.6) .50
WOMAC 3.1 score
Pain subscale, X (SD) 21.6 (11.0) 23.3 (10.7) 20.9 (11.1) .36
Physical function subscale, X (SD) 73.9 (39.4) 72.1 (39.6) 74.6 (39.6) .79
Group allocationb N/A .22
Manual therapy 10 15
Exercise therapy 6 15
Combined 6 16
No therapy 3 20
a BMI�body mass index, N/A�not applicable.b When group allocation by assigned categories (manual therapy, exercise therapy, or combined) was analyzed, P�.59. When group allocation by assignedcategories (manual therapy, exercise therapy, combined, or no therapy) was analyzed, P�.22.
Predictors of Response to Physical Therapy in Patients With Primary Hip Osteoarthritis
518 f Physical Therapy Volume 91 Number 4 April 2011
with OA. Previous studies havedescribed variables associated withprogression of hip OA, the majorityof which are based on demographicand radiologic variables.11 Few stud-ies have considered variables com-monly used by health care providersduring the clinical examination. Ourstudy is the first to produce a clusterof clinical variables to assist withidentifying patients with hip OAmost likely to benefit from interven-tions commonly used by physicaltherapists.
We identified a cluster of 5 variables(ie, presence of unilateral hip pain,age of �58 years, report of pain of�6/10, 40-m SPWT time of �25.9seconds, and duration of symptomsof � year) that were captured atbaseline and were significantly asso-ciated with success or a lack of suc-cess during discharge. Within thisstudy, the same cluster of variableswere used to identify (rule in) patientswith hip OA who were most likely tobenefit from interventions used com-monly by physical therapists (whenthe variables were present) and ruleout those who were most likely notto benefit from those same inter-ventions (when the variables wereabsent). By combining variables intoconditions, we were able to presenteach given situation (eg, 1 of 5 vari-ables present, 2 of 5 variables pres-ent, and so on) as a unique finding.Consequently, for each condition,findings were either “present” or“absent.”
Of all of the findings, the most com-pelling was the ability to identifyindividuals who had a low probabil-ity of a successful outcome when thecondition of 1 of 5 of the variableswas not met (LR� value of 0.00 [95%CI�0.00–0.70]). Operationally, anLR� value tells us how much theposttest probability of a successfuloutcome decreases when a finding isabsent. In our sample, the pretestprobability of responding favorably
to common interventions used inphysical therapy was 32%. Inessence, 32% of participants under-going a course of physical therapytreatment will respond favorablywithout any attempt at prediction.An LR� value of 0.00 (95% CI�0.00–0.70) suggests that if an indi-vidual fails to meet the condition of 1of 5 predictor variables during theinitial evaluation, the posttest proba-bility of success with physical ther-apy treatment decreases to �1%.
When at least 2 of 5 of the clusterof variables were present during theinitial examination, the likelihood ofsuccess with the interventions wasgood. The presence of at least 2 outof 5 predictor variables yielded ahigh sensitivity value of 0.96 (95%CI�0.81–0.99) and an LR� value of3.99 (95% CI�2.66–4.48). Opera-tionally, an LR� value tells us howmuch the posttest probability of asuccessful outcome increases whena finding is present. Using the 32%pretest probability in our sample, anLR� value of 3.99 resulted in a post-test probability of success of 65%.More compelling was the presenceof �3 predictor variables, whichincreased the posttest probability to�99%. However, this combinationof variables was associated withwide 95% CIs, resulting in imprecisepoint estimates. A more conservativeinterpretation of our findings,
regarding which patients are likelyto respond favorably to commoninterventions used in physical ther-apy, should be based on the pres-ence of at least 2 predictors, as theLR� value (3.99) was statistically sig-nificant, with a narrow 95% CI(2.66–4.48).
Worth noting was that ROM andstrength impairments were notretained in the final regression modelas predictors of a favorable responseto interventions common to physicaltherapy. A previous study identifiedrestricted hip flexion of �20% (oddsratio�3.1, 95% CI�2.1–4.7) as a pre-dictor of joint space narrowing ortotal hip arthroplasty.20 In the pres-ent study, a multiplanar ROM of�179 degrees demonstrated a smallunivariate association of 1.94 (95%CI�1.10–3.17) but was droppedwhen entered into regression mod-eling. A possible explanation for thelack of association in our study maybe that we combined uniplanar ROMand strength measures into singlemultiplanar variables rather thanusing individual uniplanar measures.We, therefore, may have missedinformation about important predic-tors of success with physical therapyin our study, such as hip flexionROM or hip abduction strength.However, evidence suggests that pat-terns of movement plane restrictionare inconsistent.62 We felt that com-
Table 3.Number of Participants Receiving Physical Therapy in the Success and NonsuccessGroups Who Were Positive for Each Predictor Variablea
No. of PredictorVariables Present
No. of Participantsin the Physical Therapy
Success Group
No. of Participantsin the Physical Therapy
Nonsuccess Group
�4 1 (4.5%) 0 (0%)
�3 9 (40.9%) 0 (0%)
�2 21 (95.5%) 11 (23.9%)
�1 22 (100%) 36 (78.3%)
0 0 (0%) 10 (21.7%)
a The 5 variables forming the multivariate logistic regression model were: (1) unilateral hip pain, (2) age of�58 years, (3) pain of �6/10, (4) 40-m SPWT score of �25.9 seconds, and (5) duration of symptomsof �1 year.
Predictors of Response to Physical Therapy in Patients With Primary Hip Osteoarthritis
April 2011 Volume 91 Number 4 Physical Therapy f 519
bining measures of joint restrictionwas more clinically relevant, as a typ-ical clinical examination wouldinclude several ROM measurementsrather than a single finding.
A major criticism of prognostic stud-ies is the use of single-arm studydesigns to identify predictors.10 Pre-dictors derived from single-arm stud-ies are unable to differentiatebetween predictors in response totreatment and predictors of outcomeirrespective of treatment, as theylack a control group to account fortreatment effects.10 As this study waspart of a larger randomized con-trolled study, we were able to com-pare outcomes between the treat-ment and control groups to identify
variables as predicting response tophysical therapy treatment. Whenidentified predictor variables weretested for their accuracy statistics inthe usual care group, the model nolonger fitted the data (Tab. 5). Noneof the 3 participants identified asresponders in the usual care groupwere positive for �2 predictor vari-ables. The LR� and LR� valuesranged from 0.0 to 1.25 and 0.0 to1.48, respectively, and posttest prob-ability was nearly unchanged. Theseresults suggest that, at least at thederivation stage, we were able toidentify variables associated with apositive response to physical ther-apy intervention in patients with hipOA.
The reference standard for outcome,against which examination items aredetermined to be predictor vari-ables, needs to be valid and clinicallyrelevant. We used a reference stan-dard including improvements inpain, function, and GRCS scoresbased on previous research51 withinterventions similar to those used inthis study. Although the OMERACT-OARSI responder criteria have beenvalidated in a similar patient popula-tion, recent updates to the criteriamay lack adequate distinctionbetween patient response groups,limiting our ability to identify strongpredictors. The validity of theOMERACT-OARSI responder criteriain patients with hip OA treated with
Table 4.Combination of Predictor Variables and Associated Accuracy Statistics (95% Confidence Interval) for Participants Who ReceivedPhysical Therapy Treatmenta
No. of PredictorVariables Present Sensitivity Specificity LR� LR�
Posttest Probabilityof Success
PositiveText
NegativeTest
�4 0.05 (0.01–0.05) 1.00 (0.98–1.00) Infinity (0.55–infinity) 0.96 (0.96–1.01) �99% 31%
�3 0.41 (0.30–0.41) 1.00 (0.95–1.00) Infinity (5.66–infinity) 0.59 (0.59–0.74) �99% 22%
�2 0.96 (0.81–0.99) 0.76 (0.69–0.78) 3.99 (2.66–4.48) 0.06 (0.01–0.27) 65% 2%
�1 1.00 (0.89–1.00) 0.22 (0.16–0.22) 1.28 (1.06–1.28) 0.00 (0.00–0.70) 38% �0.0%
a LR�likelihood ratio. LR� formula: sensitivity/(1 � specificity); LR� formula: (1 � sensitivity)/specificity. The 5 variables forming the multivariate logisticregression model were: (1) unilateral hip pain, (2) age of �58 years, (3) pain of �6/10, (4) 40-m SPWT score of �25.9 seconds, and (5) duration ofsymptoms of �1 year. The posttest probability of success was calculated using the LR� value and assumes a pretest probability of success of 32% regardlessof the number of predictor variables present.
Table 5.Combination of Predictor Variables and Associated Accuracy Statistics (95% Confidence Interval) for Participants Who ReceivedUsual Carea
No. of PredictorVariables Present Sensitivity Specificity LR� LR�
Posttest Probabilityof Success
PositiveText
NegativeTest
�4 0 (0–0) 1.00 (1.00–1.00) N/A 1.00 (1.00–1.00) N/A 32%
�3 0 (0–0.50) 0.75 (0.75–0.83) 0 (0–2.89) 1.33 (0.60–1.33) 0% 39%
�2 0.33 (0.06–0.78) 0.45 (0.41–0.52) 0.61 (0.11–1.61) 1.48 (0.43–2.29) 22% 41%
�1 1.00 (0.51–1.00) 0.20 (0.13–0.20) 1.25 (0.59–1.25) 0.00 (0.00–3.86) 37% �0.0%
a LR�likelihood ratio, N/A�not applicable. LR� formula: sensitivity/(1 � specificity); LR� formula: (1 � sensitivity)/specificity. The 5 variables forming themultivariate logistic regression model were: (1) unilateral hip pain, (2) age of �58 years, (3) pain of �6/10, (4) 40-m SPWT score of �25.9 seconds, and (5)duration of symptoms of �1 year. The posttest probability of success was calculated using the LR� value and assumes a pretest probability of success of32% regardless of the number of predictor variables present.
Predictors of Response to Physical Therapy in Patients With Primary Hip Osteoarthritis
520 f Physical Therapy Volume 91 Number 4 April 2011
a nonpharmacological interventionwarrants further study.
LimitationsOur target sample size of 33 partici-pants for the reliability study was notmet, which potentially threatens thestatistical significance of our results.A review of our data showed that ourparticipants demonstrated a gooddegree of heterogeneity in terms ofage, severity of symptoms, and siteof condition. We felt our preselectedlevels of agreement (P0�.40, P1�.70)were robust and, therefore, are con-fident in our interpretation of theresults.
This study identified predictors inresponse to a course of physical ther-apy intervention; however, interven-tions varied among the 3 treatmentgroups. Current guidelines now sug-gest manual therapy as an adjunctintervention to exercise in the man-agement of hip OA.63 Only one thirdof patients received this treatment;therefore, the number of patientsclassified as “responders” may beless than what we could expect hadeveryone received manual therapyplus exercise. However, groupingof individuals was performed giventhe lack of strong evidence in sup-port of one treatment over another,particularly in patients with hip OA.Future studies with larger samplesizes are needed to perform sub-group analyses and—potentially—toidentify variables associated withresponse to specific treatmentapproaches.
A larger sample size for the purposesof the multivariate analysis may haveidentified weaker predictors of suc-cess not identified in the currentanalysis. Although 8 variables wereentered into the logistic regressionanalysis, only 22 participants exhib-ited a positive response to those vari-ables. The small number of partici-pants with positive findings and thenumber of variables entered into the
logistic regression model may haveresulted in overfitting the model.Therefore, our results should be con-sidered preliminary. Furthermore,the presence of wide CIs associatedwith LR� and LR� values may beexplained by the small sample size.The same is true regarding LR� andLR� values exceeding 1 in the sec-ondary analysis (usual care group).However, given that LR� estimatesin the presence of �2 predictor vari-ables differed greatly, at 3.99 in thetreatment group versus 0.61 in theusual care group, we are encouragedthat the identified predictors of asuccessful response were due tophysical therapy treatment versusnatural history alone.
A validation study using a larger sam-ple size is needed to confirm thesepreliminary findings and increase theprecision of 95% CIs. Future valida-tion studies are needed prior to usein the clinic to further define therelationship between a positiveresponse to physical therapy and thepredictor variables of the clusteredfindings developed in this study. Inour effort to avoid overfitting theregression model, potential predic-tor variables may have been omittedfrom consideration. Therefore, infuture studies, researchers mightwant to consider clinically importantvariables not identified in our study.The eventual value of clustered find-ings may be able to help cliniciansdetermine when physical therapymay be of some benefit or when toinitiate referral for secondary care.
Another possible limitation of ourstudy may be that we used a transi-tion scale for global assessmentrather than a visual analog scale asdescribed in the OMERACT-OARSIresponder criteria. A cutpoint of�20% and absolute change of �10 asdefined by the GRCS are defined asresponders by the OMERACT-OARSIresponder criteria. We used a15-point scale ranging from “a very
great deal worse” to “a very greatdeal better.” An improvement of �3is equivalent to a 20% change and“somewhat better”; therefore, weused this as a cutpoint for the GRCS.
ConclusionsWe have completed the first step inthe development of a preliminarycluster of baseline variables thatidentify patients with hip OA as pos-itive responders to physical therapyinterventions. This study showedthat selected combinations of unilat-eral hip pain, age of �58 years, painof �6/10 on the NPRS, a 40-m SPWTvalue of �25.9 seconds, and a dura-tion of symptoms of �1 year wereassociated with a favorable responseto physical therapy treatment inpatients with hip OA. We believethat further progress in this line ofresearch may assist clinicians intreatment management strategies, aswell as making referrals to specialtyproviders for patients with this rela-tively common condition. Futurestudies to replicate and validate ourfindings are needed before these pre-dictor variables can be recom-mended for use in clinical practice.Current findings are in the infantstage and can be advocated only asan early decision-making aid towardexpected prognosis.
All authors provided concept/idea/researchdesign and writing. Dr Wright provided datacollection. Dr Wright and Dr Cook provideddata analysis. Dr Baxter and Dr Abbott pro-vided fund procurement and institutionalliaisons. Dr Wright, Dr Cook, Dr Flynn, andDr Baxter provided consultation (includingreview of manuscript before submission).The authors thank the Management ofArthritis (MOA) trial team for providingtreatment protocols.
The study was granted ethical approval bythe Lower South Regional Ethics Committeeof the New Zealand Ministry of Health.
The results of this study were presented atthe Combined Sections Meeting of theAmerican Physical Therapy Association; Feb-ruary 9–12, 2011; New Orleans, Louisiana.
Predictors of Response to Physical Therapy in Patients With Primary Hip Osteoarthritis
April 2011 Volume 91 Number 4 Physical Therapy f 521
This research was supported, in part, by acontract from the Health Research Council ofNew Zealand and the New Zealand LotteryHealth Board. Dr Wright, Dr Abbott, and DrBaxter were supported, in part, by theHealth Research Council of New Zealandand by the Centre for PhysiotherapyResearch, University of Otago. Dr Wrightalso was supported, in part, by a Universityof Otago postgraduate publishing bursary.
Data used for the purposes of this study werepart of a larger randomized controlled trial(Australian New Zealand Clinical Trials Reg-istry: ACTRN12608000130369).
This article was submitted May 16, 2010, andwas accepted November 22, 2010.
DOI: 10.2522/ptj.20100171
References1 Lane NE. Clinical practice: osteoarthritis
of the hip. N Engl J Med. 2007;357:1413–1421.
2 Felson DT. Developments in the clinicalunderstanding of osteoarthritis. ArthritisRes Ther. 2009;11:203.
3 Croft P. The epidemiology of osteoarthri-tis: Manchester and beyond. Rheumatol-ogy (Oxford). 2005;44(suppl 4):iv27–iv32.
4 Buckwalter JA, Saltzman C, Brown T. Theimpact of osteoarthritis: implications forresearch. Clin Orthop Relat Res. 2004;(427 suppl):S6–S15.
5 Felson DT, Lawrence RC, Dieppe PA, et al.Osteoarthritis, new insights, part 1: thedisease and its risk factors. Ann InternMed. 2000;133:635–646.
6 Yelin E, Murphy L, Cisternas MG, et al.Medical care expenditures and earningslosses among persons with arthritis andother rheumatic conditions in 2003, andcomparisons with 1997. Arthritis Rheum.2007;56:1397–1407.
7 Hernandez-Molina G, Reichenbach S,Zhang B, et al. Effect of therapeutic exer-cise for hip osteoarthritis pain: results ofa meta-analysis. Arthritis Rheum. 2008;59:1221–1228.
8 Hoeksma HL, Dekker J, Ronday HK, et al.Comparison of manual therapy and exer-cise therapy in osteoarthritis of the hip: arandomized clinical trial. Arthritis Rheum.2004;51:722–729.
9 Beattie PF, Nelson RM. Evaluating researchstudies that address prognosis for patientsreceiving physical therapy care: a clinicalupdate. Phys Ther. 2007;87:1527–1535.
10 Stanton TR, Hancock MJ, Maher CG, KoesBW. Critical appraisal of clinical predic-tion rules that aim to optimize treatmentselection for musculoskeletal conditions.Phys Ther. 2010 April 22 [Epub ahead ofprint].
11 Wright AA, Cook C, Abbott JH. Variablesassociated with the progression of hiposteoarthritis: a systematic review. Arthri-tis Rheum. 2009;61:925–936.
12 Lane NE, Nevitt MC, Hochberg MC, et al.Progression of radiographic hip osteoar-thritis over eight years in a communitysample of elderly white women. ArthritisRheum. 2004;50:1477–1486.
13 Dougados M, Gueguen A, Nguyen M, et al.Natural history of coxarthrosis: Epidemio-logical data from the ECHODIAH study[in French]. Rev Prat. 1997;47(17 suppl):S6–S10.
14 Hochberg MC. Do risk factors for incidenthip osteoarthritis (OA) differ from thosefor progression of hip OA? J RheumatolSuppl. 2004;70:6–9.
15 Dougados M, Gueguen A, Nguyen M, et al.Requirement for total hip arthroplasty: anoutcome measure of hip osteoarthritis?J Rheumatol. 1999;26:855–861.
16 Dougados M, Gueguen A, Nguyen M, et al.Radiological progression of hip osteoar-thritis: definition, risk factors and correla-tions with clinical status. Ann Rheum Dis.1996;55:356–362.
17 Maillefert JF, Gueguen A, Monreal M, et al.Sex differences in hip osteoarthritis:results of a longitudinal study in 508patients. Ann Rheum Dis. 2003;62:931–934.
18 Mazieres B, Garnero P, Gueguen A, et al.Molecular markers of cartilage breakdownand synovitis at baseline as predictors ofstructural progression of hip osteoarthri-tis: the ECHODIAH cohort. Ann RheumDis. 2006;65:354–359.
19 Ledingham J, Dawson S, Preston B, et al.Radiographic progression of hospitalreferred osteoarthritis of the hip. AnnRheum Dis. 1993;52:263–267.
20 Reijman M, Hazes JM, Pols HA, et al. Roleof radiography in predicting progressionof osteoarthritis of the hip: prospectivecohort study. BMJ. 2005;330(7501):1183.
21 Lane NE, Nevitt M, Williams E, HochbergMC. Progression of symptomatic andasymptomatic hip OA in a communitysample of elderly white women. ArthritisRheum. 2000;43 (suppl):S172.
22 Gossec L, Tubach F, Baron G, et al. Predic-tive factors of total hip replacement dueto primary osteoarthritis: a prospective 2year study of 505 patients. Ann RheumDis. 2005;64:1028–1032.
23 Currier LL, Froehlich PJ, Carow SD, et al.Development of a clinical prediction ruleto identify patients with knee pain andclinical evidence of knee osteoarthritiswho demonstrate a favorable short-termresponse to hip mobilization. Phys Ther.2007;87:1106–1119.
24 Abbott JH, Robertson MC, McKenzie JE,et al. Exercise therapy, manual therapy,or both, for osteoarthritis of the hip orknee: a factorial randomised controlledtrial protocol. Trials. 2009;10:11. Avail-able at: http://www.trialsjournal.com/content/10/11/11. Last accessed March24, 2009.
25 Altman R, Alarcon G, Appelrouth D, et al.The American College of Rheumatologycriteria for the classification and report-ing of osteoarthritis of the hip. ArthritisRheum. 1991;34:505–514.
26 Bellamy N, Kirwan J, Boers M, et al. Rec-ommendations for a core set of outcomemeasures for future phase III clinical trialsin knee, hip, and hand osteoarthritis: con-sensus development at OMERACT III.J Rheumatol. 1997;24:799–802.
27 Pham T, van der Heijde D, Altman RD,et al. OMERACT-OARSI initiative: Osteoar-thritis Research Society International setof responder criteria for osteoarthritis clin-ical trials revisited. Osteoarthritis Carti-lage. 2004;12:389–399.
28 Angst F, Aeschlimann A, Stucki G. Smallestdetectable and minimal clinically impor-tant differences of rehabilitation interven-tion with their implications for requiredsample sizes using WOMAC and SF-36quality of life measurement instruments inpatients with osteoarthritis of the lowerextremities. Arthritis Rheum. 2001;45:384–391.
29 Angst F, Ewert T, Lehmann S, et al. Thefactor subdimensions of the WesternOntario and McMaster Universities Osteo-arthritis Index (WOMAC) help to specifyhip and knee osteoarthritis: a prospectiveevaluation and validation study. J Rheu-matol. 2005;32:1324–1330.
30 Sandborgh M, Lindberg P, Denison E. ThePain Belief Screening Instrument (PBSI):Predictive validity for disability status inpersistent musculoskeletal pain. DisabilRehabil. 2007;1–8.
31 Sandborgh M, Lindberg P, Denison E. Painbelief screening instrument: developmentand preliminary validation of a screen-ing instrument for disabling persistentpain. J Rehabil Med. 2007;39:461–466.
32 Whooley MA, Avins AL, Miranda J,Browner WS. Case-finding instrumentsfor depression: two questions are as goodas many. J Gen Intern Med. 1997;12:439–445.
33 Cook CE. Orthopedic Manual Therapy:An Evidence-Based Approach. Upper Sad-dle River, NJ: Pearson Prentice Hall; 2007.
34 Kennedy DM, Stratford PW, Wessel J, et al.Assessing stability and change of four per-formance measures: a longitudinal studyevaluating outcome following total hipand knee arthroplasty. BMC Musculosk-elet Disord. 2005;6:3.
35 Podsiadlo D, Richardson S. The timed “Up& Go”: a test of basic functional mobilityfor frail elderly persons. J Am Geriatr Soc.1991;39:142–148.
36 Jones CJ, Rikli RE, Beam WC. A 30-s chair-stand test as a measure of lower bodystrength in community-residing older adults.Res Q Exerc Sport. 1999;70:113–119.
37 Rikli RE, Jones CJ. Development and vali-dation of a functional fitness test forcommunity-residing older adults. J AgingPhys Act. 1999;7:129–161.
38 Strand LI, Wie SL. The sock test for evalu-ating activity limitation in patients withmusculoskeletal pain. Phys Ther. 1999;79:136–145.
39 Ljungquist T, Harms-Ringdahl K, NygrenA, Jensen I. Intra- and inter-rater reliabilityof an 11-test package for assessing dys-function due to back or neck pain. Phys-iother Res Int. 1999;4:214–232.
Predictors of Response to Physical Therapy in Patients With Primary Hip Osteoarthritis
522 f Physical Therapy Volume 91 Number 4 April 2011
40 Ljungquist T, Jensen IB, Nygren A, Harms-Ringdahl K. Physical performance tests forpeople with long-term spinal pain: aspectsof construct validity. J Rehabil Med. 2003;35:69–75.
41 McPoil TG, Cornwall MW. Use of the lon-gitudinal arch angle to predict dynamicfoot posture in walking. Am Podiatr MedAssoc. 2005;95:114–120.
42 Magnusson SP, Gleim GW, Nicholas JA.Subject variability of shoulder abductionstrength testing. Am J Sports Med. 1990;18:349–353.
43 Mayerson NH, Milano RA. Goniometricmeasurement reliability in physical medi-cine. Arch Phys Med Rehabil. 1984;65:92–94.
44 Flynn T, Fritz JM, Whitman J, et al. A clin-ical prediction rule for classifying patientswith low back pain who demonstrateshort-term improvement with spinalmanipulation. Spine (Phila Pa 1976).2002;27:2835–2843.
45 Fritz JM, Piva SR, Childs JD. Accuracy ofthe clinical examination to predict radio-graphic instability of the lumbar spine.Eur Spine J. 2005;14:743–750.
46 Landis JR, Koch GG. The measurement ofobserver agreement for categorical data.Biometrics. 1977;33:159–174.
47 Bellamy N, Buchanan WW, Goldsmith CH,et al. Validation study of WOMAC: a healthstatus instrument for measuring clinicallyimportant patient relevant outcomes toantirheumatic drug therapy in patientswith osteoarthritis of the hip or knee.J Rheumatol. 1988;15:1833–1840.
48 Cibulka MT, White DM, Woehrle J, et al.Hip pain and mobility deficits—hip osteo-arthritis: clinical practice guidelines linkedto the International Classification ofFunctioning, Disability and Health fromthe Othopaedic Section of the AmericanPhysical Therapy Association. J OrthopSports Phys Ther. 2009;39:A1–A25.
49 Bellamy N. WOMAC Osteoarthritis Index:User Guide VIII; 2007.
50 Jaeschke R, Singer J, Guyatt GH. Measure-ment of health status: ascertaining theminimal clinically important difference.Control Clin Trials. 1989;10:407–415.
51 Hoeksma HL, van den Ende CH, BreedveldFC, et al. A comparison of the OARSIresponse criteria with patient’s globalassessment in patients with osteoarthritisof the hip treated with a non-pharmacological intervention. Osteoar-thritis Cartilage. 2006;14:77–81.
52 Portney LG, Watkins MP. Foundations ofClinical Research: Applications to Prac-tice. 2nd ed. Upper Saddle River, NJ:Prentice-Hall Inc; 2000.
53 Stratford PW, Goldsmith CH. Use of thestandard error as a reliability index ofinterest: an applied example using elbowflexor strength data. Phys Ther. 1997;77:745–750.
54 Flansbjer UB, Holmback AM, Downham D,Lexell J. What change in isokinetic kneemuscle strength can be detected in menand women with hemiparesis after stroke?Clin Rehabil. 2005;19:514–522.
55 Sim J, Wright CC. The kappa statistic inreliability studies: use, interpretation, andsample size requirements. Phys Ther.2005;85:257–268.
56 Tooth LR, Ottenbacher KJ. The kappa sta-tistic in rehabilitation research: an exami-nation. Arch Phys Med Rehabil. 2004;85:1371–1376.
57 Hanley JA, McNeil BJ. The meaning anduse of the area under a receiver operatingcharacteristic (ROC) curve. Radiology.1982;143:29–36.
58 Cook CE, Hegedus EJ. Orthopedic Physi-cal Examination Tests: An Evidence-Based Approach. Upper Saddle River, NJ:Pearson Education Inc; 2008.
59 Jaeschke R, Guyatt GH, Sackett DL. Users’guides to the medical literature, III: how touse an article about a diagnostic test, B:What are the results and will they help mein caring for my patients? JAMA. 1994;271:703–707.
60 Concato J, Feinstein AR, Holford TR.The risk of determining risk with multi-variable models. Ann Intern Med. 1993;118:201–210.
61 Childs JD, Cleland JA. Development andapplication of clinical prediction rulesto improve decision making in physicaltherapist practice. Phys Ther. 2006;86:122–131.
62 Klassbo M, Harms-Ringdahl K, Larsson G.Examination of passive ROM and capsularpatterns in the hip. Physiother Res Int.2003;8:1–12.
63 National Institute for Health and ClinicalExcellence (NICE). Osteoarthritis: TheCare and Management of Osteoarthritisin Adults. London, United Kingdom:National Institute for Health and ClinicalExcellence; 2008.
Predictors of Response to Physical Therapy in Patients With Primary Hip Osteoarthritis
April 2011 Volume 91 Number 4 Physical Therapy f 523
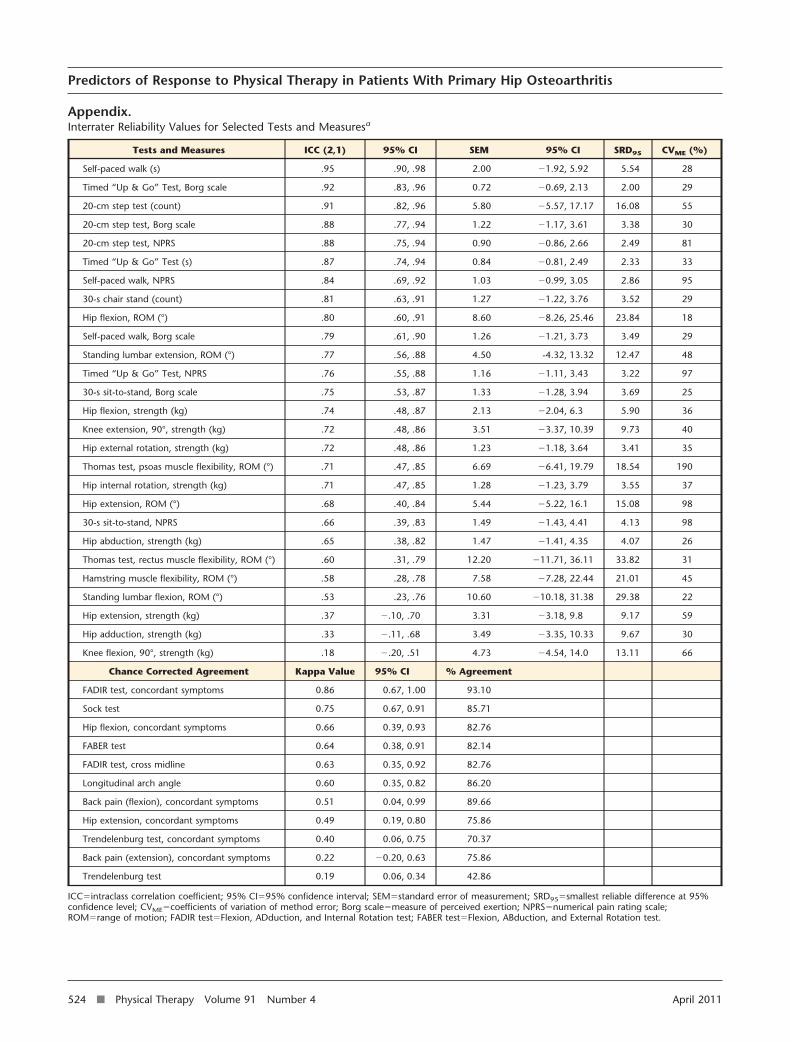
Appendix.Interrater Reliability Values for Selected Tests and Measuresa
Tests and Measures ICC (2,1) 95% CI SEM 95% CI SRD95 CVME (%)
Self-paced walk (s) .95 .90, .98 2.00 �1.92, 5.92 5.54 28
Timed “Up & Go” Test, Borg scale .92 .83, .96 0.72 �0.69, 2.13 2.00 29
20-cm step test (count) .91 .82, .96 5.80 �5.57, 17.17 16.08 55
20-cm step test, Borg scale .88 .77, .94 1.22 �1.17, 3.61 3.38 30
20-cm step test, NPRS .88 .75, .94 0.90 �0.86, 2.66 2.49 81
Timed “Up & Go” Test (s) .87 .74, .94 0.84 �0.81, 2.49 2.33 33
Self-paced walk, NPRS .84 .69, .92 1.03 �0.99, 3.05 2.86 95
30-s chair stand (count) .81 .63, .91 1.27 �1.22, 3.76 3.52 29
Hip flexion, ROM (°) .80 .60, .91 8.60 �8.26, 25.46 23.84 18
Self-paced walk, Borg scale .79 .61, .90 1.26 �1.21, 3.73 3.49 29
Standing lumbar extension, ROM (°) .77 .56, .88 4.50 -4.32, 13.32 12.47 48
Timed “Up & Go” Test, NPRS .76 .55, .88 1.16 �1.11, 3.43 3.22 97
30-s sit-to-stand, Borg scale .75 .53, .87 1.33 �1.28, 3.94 3.69 25
Hip flexion, strength (kg) .74 .48, .87 2.13 �2.04, 6.3 5.90 36
Knee extension, 90°, strength (kg) .72 .48, .86 3.51 �3.37, 10.39 9.73 40
Hip external rotation, strength (kg) .72 .48, .86 1.23 �1.18, 3.64 3.41 35
Thomas test, psoas muscle flexibility, ROM (°) .71 .47, .85 6.69 �6.41, 19.79 18.54 190
Hip internal rotation, strength (kg) .71 .47, .85 1.28 �1.23, 3.79 3.55 37
Hip extension, ROM (°) .68 .40, .84 5.44 �5.22, 16.1 15.08 98
30-s sit-to-stand, NPRS .66 .39, .83 1.49 �1.43, 4.41 4.13 98
Hip abduction, strength (kg) .65 .38, .82 1.47 �1.41, 4.35 4.07 26
Thomas test, rectus muscle flexibility, ROM (°) .60 .31, .79 12.20 �11.71, 36.11 33.82 31
Hamstring muscle flexibility, ROM (°) .58 .28, .78 7.58 �7.28, 22.44 21.01 45
Standing lumbar flexion, ROM (°) .53 .23, .76 10.60 �10.18, 31.38 29.38 22
Hip extension, strength (kg) .37 �.10, .70 3.31 �3.18, 9.8 9.17 59
Hip adduction, strength (kg) .33 �.11, .68 3.49 �3.35, 10.33 9.67 30
Knee flexion, 90°, strength (kg) .18 �.20, .51 4.73 �4.54, 14.0 13.11 66
Chance Corrected Agreement Kappa Value 95% CI % Agreement
FADIR test, concordant symptoms 0.86 0.67, 1.00 93.10
Sock test 0.75 0.67, 0.91 85.71
Hip flexion, concordant symptoms 0.66 0.39, 0.93 82.76
FABER test 0.64 0.38, 0.91 82.14
FADIR test, cross midline 0.63 0.35, 0.92 82.76
Longitudinal arch angle 0.60 0.35, 0.82 86.20
Back pain (flexion), concordant symptoms 0.51 0.04, 0.99 89.66
Hip extension, concordant symptoms 0.49 0.19, 0.80 75.86
Trendelenburg test, concordant symptoms 0.40 0.06, 0.75 70.37
Back pain (extension), concordant symptoms 0.22 �0.20, 0.63 75.86
Trendelenburg test 0.19 0.06, 0.34 42.86
ICC�intraclass correlation coefficient; 95% CI�95% confidence interval; SEM�standard error of measurement; SRD95�smallest reliable difference at 95%confidence level; CVME�coefficients of variation of method error; Borg scale�measure of perceived exertion; NPRS�numerical pain rating scale;ROM�range of motion; FADIR test�Flexion, ADduction, and Internal Rotation test; FABER test�Flexion, ABduction, and External Rotation test.
Predictors of Response to Physical Therapy in Patients With Primary Hip Osteoarthritis
524 f Physical Therapy Volume 91 Number 4 April 2011