An experimentally induced osteoarthritis model in horses ...
23
HAL Id: hal-02935223 https://hal-normandie-univ.archives-ouvertes.fr/hal-02935223 Submitted on 2 Apr 2021 HAL is a multi-disciplinary open access archive for the deposit and dissemination of sci- entific research documents, whether they are pub- lished or not. The documents may come from teaching and research institutions in France or abroad, or from public or private research centers. L’archive ouverte pluridisciplinaire HAL, est destinée au dépôt et à la diffusion de documents scientifiques de niveau recherche, publiés ou non, émanant des établissements d’enseignement et de recherche français ou étrangers, des laboratoires publics ou privés. Distributed under a Creative Commons Attribution| 4.0 International License An experimentally induced osteoarthritis model in horses performed on both metacarpophalangeal and metatarsophalangeal joints: Technical, clinical, imaging, biochemical, macroscopic and microscopic characterization Lélia Bertoni, Sandrine Jacquet, Thomas Branly, Florence Legendre, Mélanie Desancé, Céline Mespoulhès-Rivière, Martine Melin, Daniel-Jean Hartmann, Amandine Schmutz, Jean-Marie Denoix, et al. To cite this version: Lélia Bertoni, Sandrine Jacquet, Thomas Branly, Florence Legendre, Mélanie Desancé, et al.. An experimentally induced osteoarthritis model in horses performed on both metacarpophalangeal and metatarsophalangeal joints: Technical, clinical, imaging, biochemical, macroscopic and microscopic characterization. PLoS ONE, Public Library of Science, 2020, 15 (6), pp.e0235251. 10.1371/jour- nal.pone.0235251. hal-02935223
-
Upload
khangminh22 -
Category
Documents
-
view
3 -
download
0
Transcript of An experimentally induced osteoarthritis model in horses ...

HAL Id: hal-02935223https://hal-normandie-univ.archives-ouvertes.fr/hal-02935223
Submitted on 2 Apr 2021
HAL is a multi-disciplinary open accessarchive for the deposit and dissemination of sci-entific research documents, whether they are pub-lished or not. The documents may come fromteaching and research institutions in France orabroad, or from public or private research centers.
L’archive ouverte pluridisciplinaire HAL, estdestinée au dépôt et à la diffusion de documentsscientifiques de niveau recherche, publiés ou non,émanant des établissements d’enseignement et derecherche français ou étrangers, des laboratoirespublics ou privés.
Distributed under a Creative Commons Attribution| 4.0 International License
An experimentally induced osteoarthritis model inhorses performed on both metacarpophalangeal and
metatarsophalangeal joints: Technical, clinical, imaging,biochemical, macroscopic and microscopic
characterizationLélia Bertoni, Sandrine Jacquet, Thomas Branly, Florence Legendre, MélanieDesancé, Céline Mespoulhès-Rivière, Martine Melin, Daniel-Jean Hartmann,
Amandine Schmutz, Jean-Marie Denoix, et al.
To cite this version:Lélia Bertoni, Sandrine Jacquet, Thomas Branly, Florence Legendre, Mélanie Desancé, et al.. Anexperimentally induced osteoarthritis model in horses performed on both metacarpophalangeal andmetatarsophalangeal joints: Technical, clinical, imaging, biochemical, macroscopic and microscopiccharacterization. PLoS ONE, Public Library of Science, 2020, 15 (6), pp.e0235251. �10.1371/jour-nal.pone.0235251�. �hal-02935223�

RESEARCH ARTICLE
An experimentally induced osteoarthritis
model in horses performed on both
metacarpophalangeal and
metatarsophalangeal joints: Technical, clinical,
imaging, biochemical, macroscopic and
microscopic characterization
Lelia BertoniID1*, Sandrine Jacquet-Guibon1, Thomas Branly2, Florence Legendre2,
Melanie Desance2, Celine Mespoulhes3, Martine Melin4, Daniel-Jean Hartmann4,
Amandine Schmutz5, Jean-Marie Denoix1, Philippe Galera2, Magali Demoor2,
Fabrice Audigie1
1 CIRALE, USC 957, BPLC, INRA, Ecole Nationale Veterinaire d’Alfort, Maisons-Alfort, France,
2 NORMANDIE UNIV, UNICAEN, BIOTARGEN, Caen, France, 3 Clinique Equine, Ecole Nationale
Veterinaire d’Alfort, UPEC, Maisons-Alfort, France, 4 NOVOTEC, ZAC du Chêne, Europarc, Bron, France,
5 CWD-VetLab, USC 957, BPLC, INRA, Ecole Nationale Veterinaire d’Alfort, Maisons-Alfort, France
Abstract
Osteoarthritis is a common cause of pain and economic loss in both humans and horses.
The horse is recognized as a suitable model for human osteoarthritis, because the thick-
ness, structure, and mechanical properties of equine articular cartilage are highly compara-
ble to those of humans. Although a number of equine experimental osteoarthritis models
have been described in the literature, these cases generally involve the induction of osteoar-
thritis in just one joint of each animal. This approach necessitates the involvement of large
numbers of horses to obtain reliable data and thus limits the use of this animal model, for
both economic and ethical reasons. This study adapts an established equine model of post-
traumatic osteoarthritis to induce osteoarthritis-associated lesions in all 4 fetlock joints of the
same horse in order to reduce the number of animals involved and avoid individual variabil-
ity, thus obtaining a more reliable method to evaluate treatment efficacy in future studies.
The objectives are to assess the feasibility of the procedure, evaluate variability of the
lesions according to interindividual and operated-limb position and describe the spontane-
ous evolution of osteoarthritis-associated pathological changes over a twelve-week period.
The procedure was well tolerated by all 8 experimental horses and successfully induced
mild osteoarthritis-associated changes in the four fetlock joints of each horse. Observations
were carried out using clinical, radiographic, ultrasonographic, and magnetic resonance
imaging methods as well as biochemical analyses of synovial fluid and postmortem micro-
scopic and macroscopic evaluations of the joints. No significant differences were found in
the progression of osteoarthritis-associated changes between horses or between the differ-
ent limbs, with the exception of higher synovial effusion in hind fetlocks compared to front
PLOS ONE
PLOS ONE | https://doi.org/10.1371/journal.pone.0235251 June 25, 2020 1 / 22
a1111111111
a1111111111
a1111111111
a1111111111
a1111111111
OPEN ACCESS
Citation: Bertoni L, Jacquet-Guibon S, Branly T,
Legendre F, Desance M, Mespoulhes C, et al.
(2020) An experimentally induced osteoarthritis
model in horses performed on both
metacarpophalangeal and metatarsophalangeal
joints: Technical, clinical, imaging, biochemical,
macroscopic and microscopic characterization.
PLoS ONE 15(6): e0235251. https://doi.org/
10.1371/journal.pone.0235251
Editor: Lisa M Katz, University College Dublin,
School of Veterinary Medicine, IRELAND
Received: April 2, 2019
Accepted: June 12, 2020
Published: June 25, 2020
Copyright: © 2020 Bertoni et al. This is an open
access article distributed under the terms of the
Creative Commons Attribution License, which
permits unrestricted use, distribution, and
reproduction in any medium, provided the original
author and source are credited.
Data Availability Statement: All relevant data are
within the manuscript and its Supporting
Information files.
Funding: This research was funded by ERDF
(European Regional Development Funds) grants to
SJ, FA, PG and M. Demoor (HIPPOCART 1 no.
2897/33535, 917RB148; HIPPOCART 917CB174),
by a Normandy County Council program to SJ, FA,
fetlocks and higher radiographic scores for left fetlocks compared to the right. This model
thus appears to be a reliable means to evaluate the efficacy of new treatments in horses,
and may be of interest for translational studies in human medicine.
Introduction
Osteoarthritis (OA) is a painful joint disease that is clinically characterized by heat, pain, swell-
ing and a decreased range of motion in affected joints. This pathology is defined as a disease of
diarthrodial joints with variable degrees of articular cartilage destruction, subchondral bone
sclerosis and marginal osteophyte formation [1]. Articular injuries of all types can lead to the
development of OA. It is one of the most prevalent and debilitating diseases affecting both
humans and horses, and has an extremely negative economic impact [2–4]. A U.S Department
of Agriculture survey performed in horses indicates that up to 60% of lameness is related to
OA [2]. The fetlock is the most commonly reported joint affected by traumatic and degenera-
tive lesions in equine athletes [5]. Metacarpophalangeal joint disease has been reported as a
major cause of lameness, lost training days and lost income in the thoroughbred racehorse
industry. Another study showed that one third of 2- and 3-year-old thoroughbred horses had
metacarpophalangeal cartilage lesions and OA [6].
Several of the experimental animal models described in the literature replicate symptoms
of OA in order to develop early diagnosis methods or to study newly developed therapeutic
strategies. Similarities between humans and horses in the pathogenesis, clinical presentation
and pathological changes of OA are driving the development of translational studies in the
horse [7,8]. Equine models provide many advantages including anatomical and histological
similarities to human joints. Specifically, the horse has articular cartilage thickness, cellular
structure, biochemical composition and mechanical properties that are highly comparable to
those of humans. It is also easy to perform follow-up tests such as synovial fluid collection
and imaging and obtain tissue samples from large animals. Nevertheless, the use of the horse
as a model is limited in experimental studies due to the high management and housing costs
and the greater ethical considerations compared to smaller animal models. Animal welfare
would therefore be improved by reducing the number of animals involved in experimental
OA studies. Most published experimental equine OA models [9–15] induce OA in just one
joint of each animal, thus increasing the number of animals involved in these studies. In
addition to the high costs and ethical concerns involved, this type of experimental design
does not take individual variation of healing capacities into consideration. Indeed, we have
frequently observed in our clinical practice that whilst some horses develop marked signs of
OA, other horses are unlikely to do so. Similarly, some horses seem to have a better healing
capacity than others.
Experimental osteochondral fragmentation models closely resemble the spontaneous OA
process [16,17] and induce secondary signs of OA [11,12]. A previous 16-week study demon-
strated that osteochondral fragmentation of the proximal phalanx alone provided clinical,
imaging and histological signs of metacarpophalangeal joint OA and could be used to monitor
the response to therapy [12]. Progressive lameness occurred when a similar procedure was
combined with the creation of a full-thickness cartilage lesion on the dorsal aspect of the
medial part of the metacarpal condyle, with local histological evidence of OA-associated
changes that were not observed in an 11-week period study of sham-operated controlateral fet-
lock joints [18].
PLOS ONE Four fetlock joints equine osteoarthritis model
PLOS ONE | https://doi.org/10.1371/journal.pone.0235251 June 25, 2020 2 / 22
PG and M. Demoor (HIPPOCART N˚ 2013-AGRI-
236/13P07492, 917CB166), by Fonds Eperon to
SJ, FA, PG and M. Demoor (EQUISTEM, N80-
2014, 917CB194), by the GIS CENTAUREequine
research (EQUISTEM-G program to PG,
014CJ061), by the French National Research
Agency (ANR) and by Normandy County Council
through the ANR TecSan PROMOCART program to
PG (917RB020 and 917RB072 respectively), by the
French Ministry of Research and Technology to
PG, by CENTAURE European project co-founded
by Normandy County Council, European Union in
the framework of the ERDFESF operational
programe 2014-2020. M. Desance was the
recipient of a PhD fellowship from the Normandy
County Council. TB was supported by a PhD
scholarship from the French Ministry of Research
and Technology. The funders had no role in study
design, data collection and analysis, decision to
publish, or preparation of the manuscript. They
provided support in the form of salaries
(technicians, PhD students), operating costs and
materials.
Competing interests: The company NOVOTEC,
specialized in tissue analysis services, was involved
in the microscopic evaluation of the osteochondral
sections. Two of their specialists (DJH and MM)
were involved in the microscopic evaluation of the
osteochondral sections. This does not alter our
adherence to PLOS ONE policies on sharing data
and materials.
The present study was aimed to modify the model previously described [12] to develop an
experimental design where OA is induced in the 4 fetlock joints of the same animal. Two main
advantages were expected. The first was to overcome individual variability, using each horse as
his own control instead of comparing a treated group with a control group. The second was to
reduce the number of animals involved in tests in order to meet 3R ethical standards and to
reduce the financial cost of equine studies. The objectives were 1) to assess the feasibility of
performing osteochondral fragmentation of the proximal phalanx on all 4 fetlock joints of a
horse; 2) to use clinical, imaging, biochemical and postmortem gross and histological parame-
ters to evaluate the variability of the progression of induced lesions in terms of interindividual
variability, left/right operated limb variability, and front/hind limb variability; 3) to describe
the spontaneous evolution of OA-associated pathological changes over a 12-week period. We
hypothesized that this experimental design would be well tolerated and that there would be no
significant differences in the progression of induced lesions between horses or between oper-
ated limbs (front vs hind and left vs right). We also hypothesized that there would be an
increase in monitored OA-associated changes during the 12-week study period in all OA-
induced fetlock joints. This model was designed to provide a more reliable evaluation of treat-
ment efficacy.
Materials and methods
Animals and study design
Eight clinically sound French Standardbred horses owned by the Center of Imaging and
Research on the Equine Locomotor Affections (CIRALE) were included in the study. There
were 4 geldings and 4 mares, median age was 3 years (ranging from 3 to 4) and median weight
was 440.5 kg (ranging from 402 to 483 kg). All horses had been trained for racing before being
retired due to a failure to trot at racing speeds. All were conditioned on treadmills before the
beginning of the study.
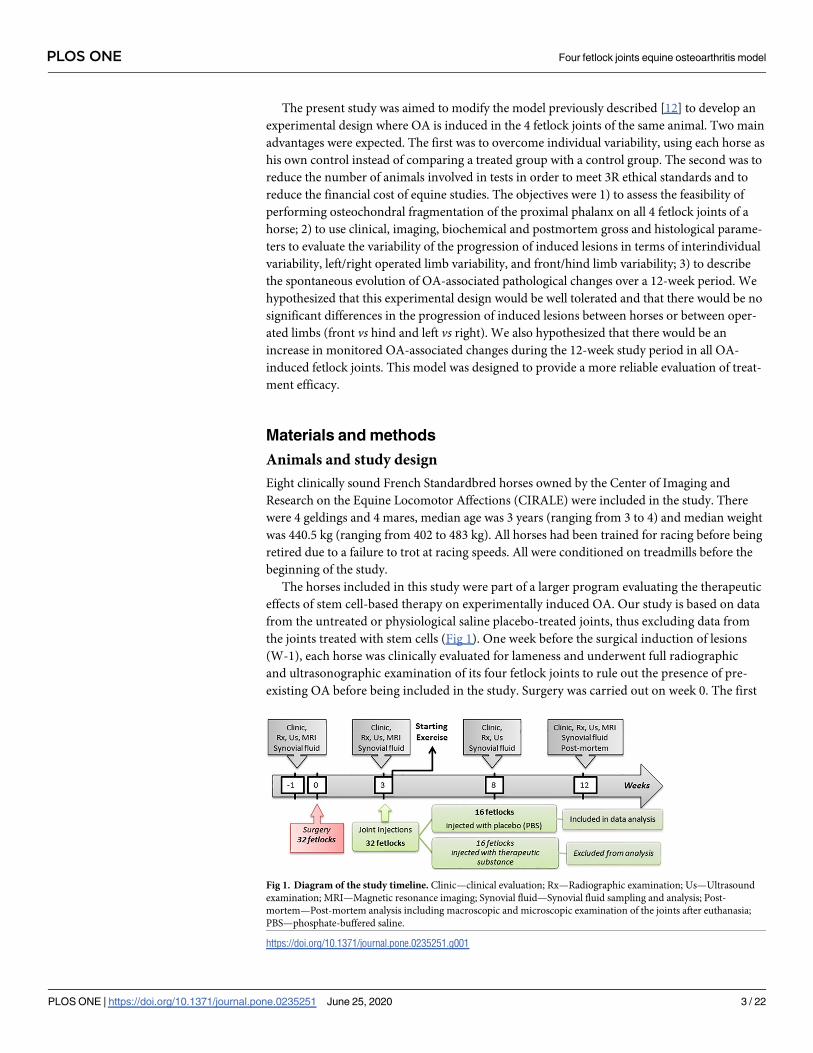
The horses included in this study were part of a larger program evaluating the therapeutic
effects of stem cell-based therapy on experimentally induced OA. Our study is based on data
from the untreated or physiological saline placebo-treated joints, thus excluding data from
the joints treated with stem cells (Fig 1). One week before the surgical induction of lesions
(W-1), each horse was clinically evaluated for lameness and underwent full radiographic
and ultrasonographic examination of its four fetlock joints to rule out the presence of pre-
existing OA before being included in the study. Surgery was carried out on week 0. The first
Fig 1. Diagram of the study timeline. Clinic—clinical evaluation; Rx—Radiographic examination; Us—Ultrasound
examination; MRI—Magnetic resonance imaging; Synovial fluid—Synovial fluid sampling and analysis; Post-
mortem—Post-mortem analysis including macroscopic and microscopic examination of the joints after euthanasia;
PBS—phosphate-buffered saline.
https://doi.org/10.1371/journal.pone.0235251.g001
PLOS ONE Four fetlock joints equine osteoarthritis model
PLOS ONE | https://doi.org/10.1371/journal.pone.0235251 June 25, 2020 3 / 22

post-surgical follow-up examination was performed on week 3 (W3). After W3 follow-up
examinations and samplings, one front fetlock and one hind fetlock of each horse were ran-
domly selected by drawing lots to ensure a fair distribution of the number of right and left fet-
locks, then injected with stem cell-based therapy. From this time onwards, the fetlocks
injected with the stem cells were excluded from the current study, thus decreasing the num-
ber of monitored fetlocks to 16 for the last 2 examinations, performed on week 8 (W8) and
week 12 (W12) (Fig 1). All 16 remaining fetlocks received a 2 mL intra-articular injection of
phosphate-buffered saline (PBS) on W3. To avoid any joint flare reaction after intra-articular
injections of the stem cells, all horses received one concomitant intravenous injection of non-
steroidal anti-inflammatory drugs with 1.1 mg/kg flunixin meglumine on W3. This protocol
was approved by the ComEth Anses/ ENVA/ UPEC Ethical Committee (Permit number: 10/
03/15-12). Surgery was performed under general anesthesia and every effort was made to
minimize suffering and stress.
Surgical technique
The procedure was performed by a board certified equine surgeon (CM), previously trained
on cadaveric limbs, using an adaption of the protocol published by Boyce et al. (2013) [12].
This technique consisted of creating an osteochondral chip fragment in both metacarpopha-
langeal joints and both metatarsophalangeal joints of each horse (S1 Fig). Surgeries were per-
formed on week 0 (W0) under isoflurane general anesthesia in dorsal recumbency with the 4
fetlocks aseptically prepared. An arthroscope was inserted through a dorsolateral portal. Before
induction of the lesion, the dorsal aspect of each joint was assessed by arthroscopy for the pres-
ence of any pre-existing lesions. A proximo-medial instrument portal was then created. This
portal allowed an 8 mm curved osteotome to be directed perpendicular to the articular surface
of the proximal phalanx. The osteotome was struck with a mallet, creating a 2 mm thick osteo-
chondral fragment of the proximo-dorso-medial border of the proximal phalanx. Contrary to
the technique developed by Boyce et al. (2013), the resulting fragment was not repositioned in
the fractured bed but the subchondral bone was exposed and then debrided using a straight
curette to form a 15 mm-wide defect bed, as described for the carpal osteochondral fragmenta-
tion model [11] and the combined fragment-groove fetlock model [18]. The dorsal edge of the
fragment remained attached to the joint capsule but was freed from the proximal phalanx.
Debris from this procedure was not actively flushed in order to maximize joint inflammation,
as previously reported [18]. Operated joints were then routinely closed and bandaged.
Postoperative care and exercise program
All horses were confined to 3X4 m stalls for 3 weeks after surgery and heart rate, respiratory
rate, body temperature and appetite were monitored twice daily to identify any signs of dis-
comfort. Treatment was initiated prior to induction of anaesthesia, as follows: intramuscular
procaine penicillin G injections for three days (22,000 IU/kg BID) and a six-day administra-
tion of phenylbutazone (2.2 mg/kg, intravenous every 12h for 2 days, then 2.2 mg/kg per os
every 12h for 1 day and 1.1 mg/kg per os every 12h for 3 days). Bandages were changed every 2
days until suture removal fourteen days after surgery. Horses were turned out into small pad-
docks (10X10 m) on dry lots from the day after stem cell injection onwards.
Exercise was initiated progressively on W3 and consisted of working on a high speed tread-
mill for a 2-minute trot (5 m/s), 2-minute high speed trot (9 m/s) and 2-minute trot (5 m/s) 3
days a week, following conventional methods [11,12]. These days of treadmill exercise were
alternated with 2 consecutive days of lunged trotting for 25 minutes, with equal amounts of
right and left circles.
PLOS ONE Four fetlock joints equine osteoarthritis model
PLOS ONE | https://doi.org/10.1371/journal.pone.0235251 June 25, 2020 4 / 22

Clinical assessment of the joint and investigation via imaging techniques
Clinical, radiographic, ultrasonographic and magnetic resonance imaging (MRI) evaluation of
each fetlock were performed during W-1, W3, W8 and W12, although MRI was not performed
on W8 (Fig 1). Clinical evaluations were performed by two equine locomotor pathology spe-
cialists (SJ and LB) and blind assessment of radiography, ultrasonography and MRI images
was retrospectively carried out by two board-associated veterinary imaging specialists (FA and
JMD). Scores were fixed by consensus agreement, during which parameters with different
scores assigned by the observers were reviewed and discussed. A final score was then assigned
by consensus of both observers.
Clinical evaluations were composed of the measurement of fetlock joint circumference and
the evaluation of sensitivity to static digital flexion tests and joint effusion using a five-point
scale ranging from normal to severe (0-normal, 1-mild, 2-moderate, 3-substantial, 4-severe),
as previously described [19] (Table 1). As the study design did not permit the evaluation of
bilateral lameness, follow-up lameness evaluations were only performed one day, three days
and seven days after the injection of the stem cells (W3) to rule out the presence of an adverse
event (i.e. a� 3/5 lameness grade) causing a change in the weight bearing of the limbs and
thus affecting the results of the present study. Degree of lameness was then graded on a scale of
0 to 5 in accordance with the lameness scale of the American Association of Equine Practition-
ers [20].
Radiographic examination was composed of lateromedial, dorsopalmar (20˚ proximodis-
tal), dorsolateral-palmaromedial 35˚ oblique and dorsomedial-palmarolateral 35˚ oblique
views of the 4 fetlock joints using digital radiography (Sound Eklin, Carlsbad, CA, United
States). Osteophyte formation on the dorsal, lateral and medial aspects of the joint was scored
according to osteophyte size (0 = none, 1 = small, 2 = medium, 3 = large), as described in the
literature [21,22]. A maximum cumulative score of 9 could be obtained.
Table 1. Grading systems used for the clinical evaluation of sensitivity to digital flexion tests and fetlock joint
effusion.
Score Sensitivity to digital flexion tests Fetlock joint effusion
0 Normal No reaction of the horse to the flexion of the
fetlock joint when moderate strength is used
(3kg).
Concave appearance of the proximo-palmar
recess of the metacarpo(tarso)phalangeal joint.
No lateral swelling when medial pressure is
applied to the recess.
1 Mild The horse reacts to the flexion of the fetlock
joint (withdrawal of the limb) when moderate
strength is used (3kg).
Flat appearance of the proximo-palmar recess of
the metacarpo(tarso)phalangeal joint. Mild lateral
swelling when medial pressure is applied to the
recess.
2 Moderate The horse reacts to the flexion of the fetlock
joint (withdrawal of the limb) when light
strength is used (1kg).
Convex appearance of the proximo-palmar recess
of the metacarpo(tarso)phalangeal joint. Lateral
swelling easily obtained when medial pressure is
applied to the recess.
3 Substantial The horse reacts to the flexion of the fetlock
joint (withdrawal of the limb) before strength is
used.
Convex appearance of the proximo-palmar recess
of the metacarpo(tarso)phalangeal joint beyond
the suspensory ligament branches (third
interosseous muscle). Soft consistency of the
recess on palpation.
4 Severe Violent withdrawal of the limb when flexion is
applied to the fetlock joint without strength
Convex appearance of the proximo-palmar recess
of the metacarpo(tarso)phalangeal joint beyond
the suspensory ligament branches (third
interosseous muscle) with a hard consistency of
the recess on palpation, indicating synovial
pressure. Synovial distension of the dorsal recess
of the joint.
https://doi.org/10.1371/journal.pone.0235251.t001
PLOS ONE Four fetlock joints equine osteoarthritis model
PLOS ONE | https://doi.org/10.1371/journal.pone.0235251 June 25, 2020 5 / 22

A 6 MHz linear transducer (Hitachi Medical Systems, Saint-Priest, France) was used to
carry out transverse and longitudinal ultrasound scans on the dorsal and collateral aspects of
each fetlock, following the scanning technique previously described [23]. Osteophyte forma-
tion on the dorsal, lateral and medial aspects of the joint was graded following the same criteria
used for radiographic evaluation. Synovial fluid effusion was also graded in ultrasound images
of the palmaro/plantaro-proximal recess of the joint using a similar 5-point scale to that used
for the clinical evaluation (Table 2).
MRI was performed with horses standing under sedation. Low field strength 0.27 Tesla
Magnet and a fetlock receive coil (Hallmarq Veterinary Imaging, Guildford, Surrey, UK) were
used. Images were acquired in transverse, dorsal and sagittal planes using T1-weighted gradi-
ent echo, T2-weighted fast spin echo (FSE), and Short Tau Inversion Recovery (STIR) FSE
sequences with motion correction software (MI) for FSE sequences (S1 Table). The images
obtained were then graded using a previously described semi-quantitative scoring system [24]
adapted for use in standing equine fetlock joint MRI. Both proximal phalanx and metacarpal/
tarsal condyle were assessed for the presence of oedema-like bone marrow lesions (0–3), sub-
chondral bone sclerosis (0–3) and osteophyte formation (0–3). Soft tissue structures associated
to the metacarpo/tarsophalangeal joints were also graded for synovial fluid effusion (0–3),
synovial membrane thickening (0–3), joint capsule oedema (0–3) and joint capsule thickening
(0–3). A maximum cumulative score of 27 could be obtained.
Synovial fluid analysis
Synovial fluid (1 mL) was sampled from each joint on W-1, W3, W8 and W12 (Fig 1). Sam-
pling was performed under sedation (intravenous administration of a combination of detomi-
dine 0.01 mg/kg and butorphanol 0.01 mg/kg) after aseptic preparation of the skin. Using a
lateral approach on the flexed limb, a 20-gauge needle was inserted between the metacarpal/
metatarsal condyle and the lateral proximal sesamoid bone. Approximately 0.3 mL of fluid was
placed in an EDTA tube and the total nucleated cell count was directly measured using an
automatic analysis system (Sysmex XN10, Sysmex Corporation, Japan) (cells/μL). The remain-
ing fluid was placed in a dry tube for centrifugation at 2500 × g for 10 minutes. After aqueous
phase recovery, 20 μL of the sample was placed on a refractometer (Zuzi series 300, Auxilab
SL, Spain) to determine the total protein concentration. The remainder was then stored at
-80˚ C for ELISA analysis. Synovial fluid concentration of prostaglandin E2 (PGE2) and C-ter-
minal telopeptide of type II collagen (CTX-II) were estimated as markers of inflammation and
cartilage turnover, respectively, through the use of commercially available high-sensitivity
Table 2. Grading system used for ultrasound evaluation of synovial fluid effusion of the fetlock joints.
Score Synovial fluid effusion
0 Normal Small amount of fluid in the proximo-palmar recess of the metacapo (tarso) phalangeal joint.
Concave appearance of the skin. No motion of the fluid when the recess is pressed.
1 Mild Small amount of fluid in the proximo-palmar recess of the metacapo (tarso) phalangeal joint.
Concave to flat appearance of the skin. Motion of the fluid when the recess is pressed.
2 Moderate Moderate amount of fluid in the proximo-palmar recess of the metacapo (tarso) phalangeal joint.
Convex appearance of the skin. Motion of the fluid when the recess is pressed.
3 Substantial Substantial amount of fluid in the proximo-palmar recess of the metacapo(tarso)phalangeal joint
and small amount of fluid in the dorsal recess of the joint. Convex appearance of the skin.
4 Severe Large amount of fluid in the proximo-palmar recess of the metacapo(tarso)phalangeal joint and
substantial amount of fluid on the dorsal recess of the joint with synovial pressure. Convex
appearance of the skin.
https://doi.org/10.1371/journal.pone.0235251.t002
PLOS ONE Four fetlock joints equine osteoarthritis model
PLOS ONE | https://doi.org/10.1371/journal.pone.0235251 June 25, 2020 6 / 22

enzyme immunoassay kits (Prostaglandin E2 Parameter Assay Kit, R&D systems, USA; Serum
Pre-Clinical CartiLaps1 (CTX-II) EIA, Immunodiagnostic Systems Holdings PLC, UK)
[25,26].
Postmortem examination
Twelve weeks after surgery (W12), all horses were euthanized with an intravenous injection of
a mixture of 1g embutramide, 2.5g mebezonium and 250mg tetracaine. Both metacarpopha-
langeal and both metatarsophalangeal joints of each horse were opened dorsally to expose the
articular surfaces. Articular surfaces were photographed and changes in metacarpal/tarsal con-
dyles were blindly scored according to the Osteoarthritis Research Society International
(OARSI) Guidelines [27] by two investigators (LB and SJ) for wear-lines, erosions and osteo-
chondral lesions using a 4-point scale ranging from 0 to 3. A maximum cumulative score of 9
could be obtained.
Osteochondral sections were harvested from the medial part of the distal aspect of the meta-
carpal/tarsal condyle and processed for histological and immunohistological analysis (S2 Fig).
Samples were fixed with neutral buffered formalin (Carlo Erba Reagents) and embedded in
paraffin. After fixation, 5 mm latero-medial slices were cut and mounted on coated glass slides.
The paraffin was removed and the antigenic sites were unmasked by treatment with 0.5% hyal-
uronidase. Sections were incubated overnight at 4˚C with rabbit anti-human type I collagen
primary antibody (Novotec, 20111) or rabbit anti-human type II collagen (Novotec, 20211).
After inhibition of the endogenous peroxidases by hydrogen peroxide, the sections were incu-
bated in a peroxidase-conjugated secondary antibody (Dako, Envision rabbit, ref. K4002). The
reaction with diaminobenzidine substrate (Dako, K3468) reveals the antigen-antibody com-
plexes through the appearance of brown staining. The sections were counter-stained with
Mayer hematoxylin then mounted between the slide and coverslip in an aqueous medium.
The primary antibody was replaced by 3% PBS—diaminobenzidine as a negative control.
Slides were observed with an optical microscope (Leica DM2000) connected to a digital
camera (Leica DFC420C) driven by image acquisition software (LAS V4.2). The images
obtained were retained and selected for the production of photo plates using image processing
software (Adobe, Photoshop CC2015.5). Lesions were blindly scored according to the OARSI
histopathology evaluation system [28] by two independent investigators (DJH and MM). This
evaluation system took into account the severity of cartilage and bone lesions (grade 0–6), the
proportion of affected area in relation to the total area (grade 0–4), and the lesion depth (grade
0–4), allowing a more precise differentiation of the lesions. The total histological score of the
lesions was the multiplication of these 3 parameters, with a maximum possible score of 96.
Statistical analysis
Statistical analysis was performed after the data had been visually assessed for normality. The
variables were first presented descriptively: the mean and standard deviation of the normally
distributed continuous outcome (fetlock joint circumference) and the median and quartiles of
the other continuous outcomes were calculated at each time point for each fetlock group,
while the number of observations contained within each grade and the median were calculated
for categorical outcomes, Fetlocks injected on W3 with the stem cell-based therapy were
excluded from further statistical analyses, leaving a total of 16 fetlocks for statistical analysis.
The comparison of interindividual variability and operated limb variability (left vs right
and front vs hind) was carried out by analyzing the values resulting from the differences
between W12 and W-1 scores, excluding the post-mortem scores. The differences between
W12 and W-1 values of synovial fluid biomarkers were normally distributed and had equal
PLOS ONE Four fetlock joints equine osteoarthritis model
PLOS ONE | https://doi.org/10.1371/journal.pone.0235251 June 25, 2020 7 / 22

variance, as revealed by the Levene test. Other differences were not normally distributed. Inter-
individual variability was evaluated by a one-way analysis of variance for normally distributed
outcomes and by a Kruskal-Wallis test for all other outcomes. Similarly, Student’s t-test or the
nonparametric Mann-Whitney procedure were used to test for differences between fore- and
hind-fetlocks and between left and right fetlocks.
The comparison between W-1 values as the pre-osteoarthritis baseline, and between W12
values as the post-osteoarthritis state was also analyzed with 2 different tests depending on the
variables studied. The non-parametric Wilcoxon signed-rank test was performed when the
outcome was not normally distributed, while paired Student’s t-tests were used when the out-
come was normally distributed. The paired W-1 and W12 values of each fetlock were then
compared with these tests.
All statistical analyses were performed using R software (version 3.4.3; R Foundation for
Statistical Computing, Vienna, Austria, 2017) or Excel 2016 for Windows (Microsoft, Red-
mond, DC, USA). A p-value of 0.05 was considered to be significant.
Results
Surgical induction of the lesions and postoperative follow-up
Osteochondral fragmentation was successfully performed on all 32 fetlocks. The median dura-
tion of surgery was 1 hour and 5 minutes (1:00–1:12), with 2 hours and 9 minutes of anaesthe-
sia (2:00–2:40). An average of 1 hour (0:48–1:06) was needed for the horses to stand up
following anaesthesia.
Body temperature, heart rate, respiratory rate and appetite remained normal throughout
the study period for all individuals except for one, which showed elevation of its heart and
respiratory rates 12 hours after surgery, associated with signs of colic (pawing at the ground).
The intravenous administration of 25 mg/kg dypirone resolved these clinical signs within 4
hours. No horse showed evidence of heat, pain or swelling of the metacarpophalangeal and
metatarsophalangeal joints when bandages were changed. Horses moved comfortably in their
box and paddocks and no behavioural evidence of pain was noted. No adverse events were
observed after the injection of stem cell-based therapy in W3 (S1 Dataset).
Variability in lesion evolution
Horses were homogeneous in terms of age, breed, weight and activity. Interindividual statisti-
cal analyses did not reveal any significant difference between horses when considering the dif-
ferences between W12 and W-1 scores of clinical and imaging parameters and the differences
between W12 and W-1 values of synovial fluid parameters. Similarly, no significant interindi-
vidual differences were observed in the distribution of macroscopic and microscopic scores by
the end of the study (S2 Dataset and S2 Table).
In addition, statistical analyses did not reveal any significant differences between left and
right fetlocks, with the exception of a radiographic score with higher values for left fetlocks
than for right fetlocks (Fig 2 and S3 Table). Although fore and hind fetlocks were not signifi-
cantly different for most of the parameters, hind fetlocks produced significantly more synovial
effusion after surgery than front fetlocks (Fig 2 and S3 Table).
Clinical follow-up
None of the 8 horses showed sensitivity to digital flexion tests throughout the study period (S2
Dataset). Ninety-four percent (30/32) of the fetlocks showed an increased joint effusion score
on W3 compared to baseline (S2 Dataset and Fig 2). The joint effusion score and the fetlock
PLOS ONE Four fetlock joints equine osteoarthritis model
PLOS ONE | https://doi.org/10.1371/journal.pone.0235251 June 25, 2020 8 / 22

joint circumference were significantly higher in W12 than in W-1 when comparing the paired
values of each fetlock (Figs 2 and 3).
Follow-up with imaging techniques
At the end of the study (W12), imaging signs of OA were mild to moderate. Indeed, whatever
the imaging parameter, the scores reached on W12 were below 50% of the maximal attainable
grading score for 11/16 fetlocks (69%). None of the fetlocks had high MRI severity scores
Fig 2. The evolution of the median scores and of the number of fetlocks per score category and per position (T, F, H, L, R) over the study period
(W, weeks) for 32 fetlocks on W-1 and W3 and for 16 fetlocks on W8 and W12. Post-mortem scores were measured on W12. T—Total fetlocks, i.e.all fetlocks pooled together; F—Fore fetlocks, i.e. all fore fetlocks pooled together; H–Hind fetlocks i.e. all hind fetlocks pooled together; L–Left fetlocks,
i.e. all left fetlocks pooled together; R—Right fetlocks, i.e. all right fetlocks pooled together. # Significant difference between the two fetlocks positions
considering the difference between W12 and W-1 values with p<0.05. � Significant difference between paired values of the same fetlocks for that time
point compared to W-1 with p<0.05.
https://doi.org/10.1371/journal.pone.0235251.g002
PLOS ONE Four fetlock joints equine osteoarthritis model
PLOS ONE | https://doi.org/10.1371/journal.pone.0235251 June 25, 2020 9 / 22

(score� 18/27), and only 4/16 fetlocks (25%) had high radiographic and ultrasonographic
severity scores (score� 6/9) (S2 Dataset and Fig 2).
The effusion score measured by ultrasound reflected the results of the clinical follow-up,
with a significantly higher score recorded in W12 than in W-1 (Figs 2 and 4). In addition,
there was a progressive increase in osteophyte formation scores (for both radiographic and
ultrasonographic evaluation) throughout the study period (Figs 2, 5 and 6, S3 Table and S2
Dataset), with a significant increase in scores on W12 compared to those of W-1 (Fig 2). The
total MRI score was also significantly higher on W12 compared to W-1 (Fig 2). Not all MRI-
measured parameters evolved in the same way along the study period (Table 3), in particular
bone marrow edema-like lesions seemed to be mostly detected on the proximal phalanx on
W3 (Table 3) and particularly around the osteochondral fragment (Fig 7), while little evolution
occurred for subchondral bone sclerosis over the study period (Fig 7 and Table 3).
Evolution of synovial fluid parameters
A significant increase for total protein concentration, total nucleated cell counts and CTX-II
concentration was observed between W-1 and W12 when comparing the paired values of each
fetlock at that time points (Fig 8). Total protein concentration and total nucleated cell counts
seemed to be at their highest on W3 and W8 (Fig 8, S3 Table and S2 Dataset) but no statistical
comparisons were made at these stages. PGE2 variation was not significant.
Post-mortem evaluation
All fetlocks showed macroscopic lesion scores below 55% of maximum values (� 5/9), with
a majority (12/16 fetlocks) of low to moderate severity scores (� 3/9) (S2 Dataset). Most of
Fig 3. Evolution of the mean (standard deviation) fetlock joint circumference over the study period measured in 32 fetlocks on weeks -1
(W-1) and 3 (W3) and in 16 fetlocks on weeks 8 (W8) and 12 (W12) and displayed per fetlock position. T—Total fetlocks; F—Fore fetlocks;
H—Hind fetlocks; L—Left fetlocks; R–Right fetlocks. � Significant difference between paired values of the same fetlocks for that time point
compared to W-1 with p<0.05.
https://doi.org/10.1371/journal.pone.0235251.g003
PLOS ONE Four fetlock joints equine osteoarthritis model
PLOS ONE | https://doi.org/10.1371/journal.pone.0235251 June 25, 2020 10 / 22

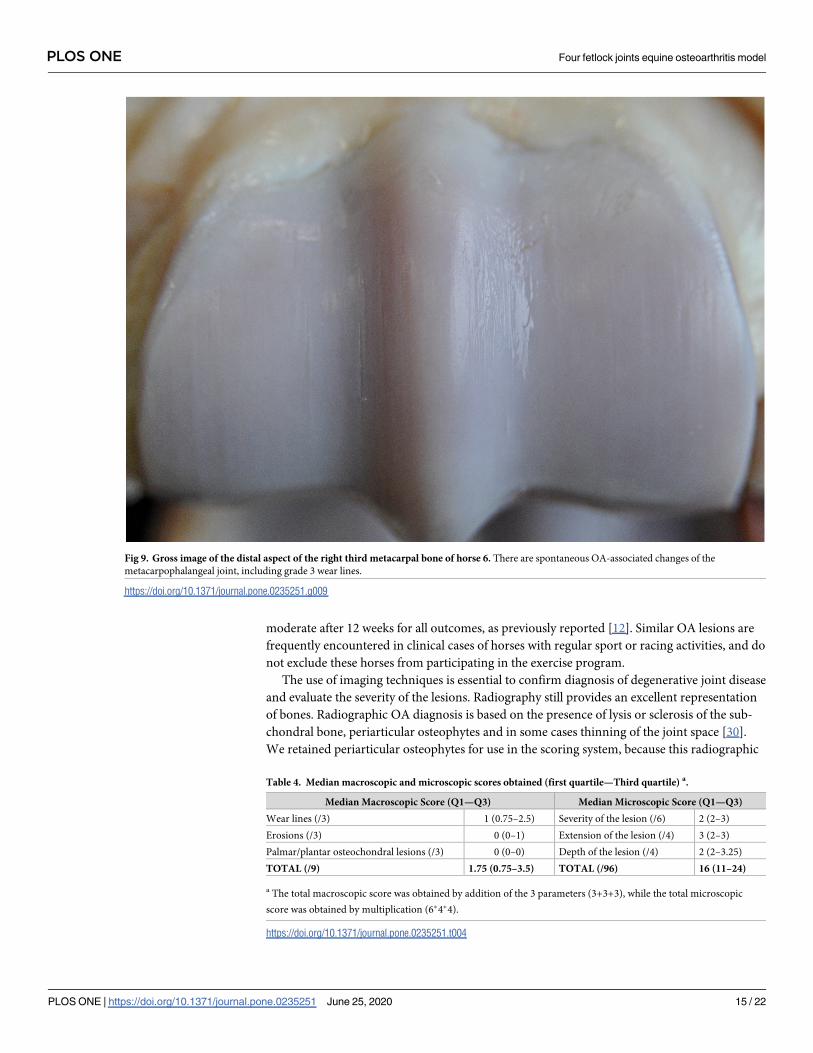
the lesions observed were wear lines (Fig 9 and Table 4). On histological evaluation, all sam-
ples had values below 50% of the maximum lesion score (� 48/96), with a majority showing
a low severity score of between 8 and 18 (11/16 samples) (S2 Dataset). No sample had a
score < 8 and only one sample showed more severe lesions (a score of 48). The last 4 samples
had an intermediate score of between 24 and 32 (Table 4 and Fig 2). Most of the samples
were characterized by varying degrees of erosion of the superficial zone of cartilage and by
the presence of a peripheral fibrocellular tissue (Fig 10) which had replaced the superficial
and intermediate zones, or even the deep zone in some samples. Immunohistological analy-
ses of this fibrocellular tissue revealed that these changes were associated with the presence
of type I collagen matrix, with or without type II collagen, whilst healthy cartilage is charac-
terized by type II collagen extracellular matrix. In addition, cytoplasmic collagen labeling
corresponding to chondrocyte cellular activity was sometimes observed in the lesions.
Changes in chondrocyte organization were also observed, with the presence of small clusters
(Fig 10). When changes in cartilage structure were significant, small bone marrow vacuoles
were noted near the mineralized cartilage. In addition, the tidemark became less visible or
absent.
Fig 4. Inclusion and follow-up ultrasound sections of the left metacarpophalangeal joint of horse 7. A longitudinal
section of the dorsal aspect (DORSAL) and a transverse section of the lateral aspect (LATERAL) of the joint show the
different grades of synovial effusion measured on ultrasound. Note the evolution of the skin appearance (arrow head)
from concave to convex and the increase in the amount of fluid (arrow) from moderate to substantial.
https://doi.org/10.1371/journal.pone.0235251.g004
PLOS ONE Four fetlock joints equine osteoarthritis model
PLOS ONE | https://doi.org/10.1371/journal.pone.0235251 June 25, 2020 11 / 22

Discussion
Surgical fragmentation performed on the proximal phalanx on both metacarpophalangeal and
both metatarsophalangeal joints was well tolerated and successfully created mild OA-associ-
ated changes. These changes were significant for most of the measured parameters, indicating
Fig 5. Inclusion and follow-up radiographic views of the left metacarpophalangeal joint of horse 7. There is a
development of grade 2 (white arrows) and grade 3 (white triangle) osteophytes. LM—latero-medial views; DP—
dorso-palmar views, DLO—dorsolateral-palmaromedial 35˚ oblique views; DMO—dorsomedial-palmarolateral 35˚
oblique views.
https://doi.org/10.1371/journal.pone.0235251.g005
Fig 6. Inclusion and follow-up longitudinal ultrasound sections of the left metacarpophalangeal joint of horse 7.
Sections of the dorsal aspect (DORSAL), dorso-lateral aspect (LATERAL) and dorso-medial aspect (MEDIAL) of the
joint reveal a development of grade 1 (white arrows) to grade 3 (white arrow head) osteophytes.
https://doi.org/10.1371/journal.pone.0235251.g006
PLOS ONE Four fetlock joints equine osteoarthritis model
PLOS ONE | https://doi.org/10.1371/journal.pone.0235251 June 25, 2020 12 / 22

that mild changes should be sufficient to reliably evaluate the efficacy of a treatment. No signif-
icant difference was observed in the evolution of changes between horses or between fetlock
positions (left, right, front or hind) for most of the outcome variables. The significant differ-
ences observed for certain outcomes do not preclude the use of this model in future studies.
The antero-posterior difference found for synovial fluid effusion can be easily handled in effi-
cacy studies by comparing each fetlock to its contralateral. The left to right difference found
for the evolution of the radiographic score, i.e. a stronger progression in left fetlocks, was unex-
pected and may be explained by the small sample size. Horses had identical exercise lunging
on the left and right rein or on a straight line on the treadmill. Compared to previously
reported models of OA [9–12,15,18], the procedure described here thus has the advantage of
Table 3. MRI grading system and median scores obtained (first quartile- third quartile).
MRI criteria W-1 W3 W12
Synovial fluid effusion (/3) 0 (0–1) 1 (1–1) 2.5 (1.75–3)
Synovial membrane thickening (/3) 0 (0–0) 0 (0–0) 0 (0–1)
Joint capsule oedema (/3) 0 (0–0) 1 (1–2) 1 (0–1)
Joint capsule thickening (/3) 0 (0–0) 1 (0–1) 1 (1–1)
Metacarpal/tarsal subchondral bone sclerosis (/3) 1 (0–1) 1 (0–1) 1 (0–1.75)
Proximal phalanx subchondral bone sclerosis (/3) 0 (0–1) 0 (0–1) 0,5 (0–1)
Metacarpal/tarsal oedema-like lesions (/3) 0 (0–0) 0,5 (0–1) 0 (0–1)
Proximal phalanx oedema-like lesions (/3) 0 (0–0) 2 (1–2.75) 1 (0–1)
Osteophyte formation (/3) 0 (0–1) 0 (0–1) 0,5 (0–2)
TOTAL MRI SCORE (/27) 3 (1–4) 8 (6–9.75) 9 (7–10)
https://doi.org/10.1371/journal.pone.0235251.t003
Fig 7. MRI images of the left metatarso-phalangeal joint of horse 5 (sagittal and transverse images) and of the left
metacarpo-phalangeal joint of horse 7 (dorsal images) obtained successively at weeks -1 (inclusion), 3 (post-
fragmentation) and 12 (end of the study), showing the temporal progression of the OA-associated structural
changes. There is evidence of grade 3 bone marrow oedema-like lesions (arrow heads) and grade 1 bone sclerosis
(white triangle) on the proximal phalanx of the left metatarsophalangeal joint of horse 5 near the fragmentation site.
Also note the grade 3 periarticular osteophytes (white arrows) on the left metacarpophalangeal joint of horse 7. T1W
GRE—T1 weighted ultra-fast gradient echo sequences; STIR-FSE—short tau inversion recovery fast spin echo
sequences.
https://doi.org/10.1371/journal.pone.0235251.g007
PLOS ONE Four fetlock joints equine osteoarthritis model
PLOS ONE | https://doi.org/10.1371/journal.pone.0235251 June 25, 2020 13 / 22

reducing the number of horses involved in OA studies, as required by 3R ethical guidelines, by
maximizing the number of joints that could be studied and compared per animal. This model
is also advantageous for use in efficacy studies of therapeutic substances as it provides the
opportunity to compare the evolution of OA-associated changes within the same individual.
The protocol used was more traumatic than the non-terminal protocol used in a previously
published study [12]. First, modifications were made to the historical surgical technique, with
two major changes: (1) the fragment in the fractured bed was not placed back in position, and
the osteochondral lesion was burred back; (2) tissue debris was not flushed from the joint in
order to maximize joint inflammation. These changes in the surgical technique were similar to
those adopted in a recently published model study [18]. Second, the exercise program was a lit-
tle different to that described in previous publications as it included lunge activity along with
high-speed treadmill exercise. Additional lunging was chosen to enhance the development of
OA-associated changes. Indeed, asymmetric bearing and misalignment between the hoof and
the limb during curved motion induces collateromotion and axial rotation. Considering that
the shapes of the distal joints are designed to undergo primarily flexion/extension movement,
these asymmetrical movements contribute to joint surface damage [29]. Finally, the study
duration was of 12 weeks here rather than the 16-week period reported in other studies.
Although more obvious signs of OA would have been observed over a 16-week study, the
results of this study confirm that a 12-week period is sufficient to develop progressive signs of
OA.
All horses showed a mild response to the surgical procedure but the protocol described in
this study was well tolerated, as confirmed by the follow-up of clinical parameters. Articular
lesions induced by the combination of surgical procedure and exercise were always mild to
Fig 8. Evolution over the study period of the median values (1st quartile- 3rd quartile) of synovial fluid parameters measured in 32 fetlocks on
weeks -1 (W-1) and 3 (W3) and in 16 fetlocks on weeks 8 (W8) and 12 (W12), also displayed by fetlock position. T—Total fetlocks; F—Fore
fetlocks; H—Hind fetlocks; L—Left fetlocks; R—Right fetlocks. � Significant difference between paired values of the same fetlocks for that time point
compared to W-1 with p<0.05.
https://doi.org/10.1371/journal.pone.0235251.g008
PLOS ONE Four fetlock joints equine osteoarthritis model
PLOS ONE | https://doi.org/10.1371/journal.pone.0235251 June 25, 2020 14 / 22
moderate after 12 weeks for all outcomes, as previously reported [12]. Similar OA lesions are
frequently encountered in clinical cases of horses with regular sport or racing activities, and do
not exclude these horses from participating in the exercise program.
The use of imaging techniques is essential to confirm diagnosis of degenerative joint disease
and evaluate the severity of the lesions. Radiography still provides an excellent representation
of bones. Radiographic OA diagnosis is based on the presence of lysis or sclerosis of the sub-
chondral bone, periarticular osteophytes and in some cases thinning of the joint space [30].
We retained periarticular osteophytes for use in the scoring system, because this radiographic
Fig 9. Gross image of the distal aspect of the right third metacarpal bone of horse 6. There are spontaneous OA-associated changes of the
metacarpophalangeal joint, including grade 3 wear lines.
https://doi.org/10.1371/journal.pone.0235251.g009
Table 4. Median macroscopic and microscopic scores obtained (first quartile—Third quartile) a.
Median Macroscopic Score (Q1—Q3) Median Microscopic Score (Q1—Q3)
Wear lines (/3) 1 (0.75–2.5) Severity of the lesion (/6) 2 (2–3)
Erosions (/3) 0 (0–1) Extension of the lesion (/4) 3 (2–3)
Palmar/plantar osteochondral lesions (/3) 0 (0–0) Depth of the lesion (/4) 2 (2–3.25)
TOTAL (/9) 1.75 (0.75–3.5) TOTAL (/96) 16 (11–24)
a The total macroscopic score was obtained by addition of the 3 parameters (3+3+3), while the total microscopic
score was obtained by multiplication (6�4�4).
https://doi.org/10.1371/journal.pone.0235251.t004
PLOS ONE Four fetlock joints equine osteoarthritis model
PLOS ONE | https://doi.org/10.1371/journal.pone.0235251 June 25, 2020 15 / 22

sign was considered to be the least prone to measurement errors that could have occurred due
to subtle changes in the radiographic contrast or potential differences in the magnification
effect between successive examinations. Ultrasonography was used as a complementary tool.
This technique has been reported to be more sensitive than radiography for the detection of
periarticular irregularities, remodelling or osteophytes [31]. As ultrasonography has also been
proven to be a very useful technique for the identification and description of dorsal and abaxial
soft tissues of the fetlock in the horse [23], it was also used after the physical examination to
document the presence of synovitis, which is another sign of OA. To our knowledge, this is the
first study to monitor experimental lesions of OA using ultrasound in the horse. This tech-
nique played an interesting role in the follow-up of the joints, with scores increasing during
the study for all fetlocks. The use of this technique can therefore be considered for future
studies.
Nevertheless, radiography and ultrasonography do have limitations. Both lack the ability to
precisely evaluate articular cartilage and subchondral bone. Computed tomography and MRI
are imaging techniques that could overcome these limitations to provide a cross-sectional and
Fig 10. Representative light micrographs of osteochondral sections from the medial part of the distal aspect of the right metatarsal condyle
of horse 8. Micrographs obtained on Week 12 illustrating a grade 16 histological score and revealing type I (A,B) and type II (C,D) collagen
labelling (brown marking). Note the presence of a fibrocellular tissue (open arrow heads) that is partly positive for type I collagen and type II
collagen. The superficial and intermediate zones of the articular cartilage are eroded, with fibrillations observed across the sample. Clusters of
chondrocytes are observed near the fibrocellular tissue (arrows). The tidemark is visible (star).
https://doi.org/10.1371/journal.pone.0235251.g010
PLOS ONE Four fetlock joints equine osteoarthritis model
PLOS ONE | https://doi.org/10.1371/journal.pone.0235251 June 25, 2020 16 / 22

three-dimensional evaluation [32]. High-field MRI performed under general anesthesia has
already been proven to be useful in the temporal assessment of OA-associated changes occur-
ring in the osteochondral fragmentation model of the equine middle carpal joint [33]. To our
knowledge, this is the first temporal assessment of experimental lesions of OA through the
MRI examination of standing horses. A combination of the most commonly clinically used
sequences on the standing horse was chosen to perform this study in transverse, dorsal and
sagittal planes. MRI was particularly useful for the identification of bone lesions with
T2-weighted and fat saturation sequences highlighting the high fluid signal that is consistent
with bone marrow oedema-like lesions, an important feature of articular injuries. Bone mar-
row oedema-like lesions were more frequent and severe on the images obtained during W3
(Table 3) and particularly around the osteochondral fragment (Fig 7), as previously reported
[33]. These lesions, observed during W3, are more likely to reflect the presence of vascular
(hemorrhagic) changes linked to the surgical injury [34]. Such injuries to the subchondral
bone are suspected to predispose joints to the development of OA [35]. In addition, MRI is
sensitive to changes in bone density and thus permits the diagnosis of subchondral bone scle-
rosis, another feature of OA. The study duration may have been too short to evaluate the devel-
opment of subchondral bone sclerosis, because little evolution of scores was observed except
for the area adjacent to the osteochondral fragmentation on the proximal phalanx (Fig 7). This
result is similar to the changes reported in the previous study [33], where low-signal bone
lesions developed in areas of previous high signal bone lesions. Finally, MRI provides detailed
information about the alteration of bone surfaces for the detection of periarticular osteophytes
[30]. However, the motion-corrected standing MRI used in this study provides less informa-
tion than high-field systems and there is a substantial risk of missing small lesions or underes-
timating pathology [36]. Despite this, dispensing of the need for general anaesthesia facilitates
follow-up examinations and alleviates the costs of the study. This technique provides reliable
additional information on both bone components and soft tissues. Cartilage thickness was not
assessed in this study due to partial volume artefacts and low image resolution, and a semi-
quantitative system was chosen to evaluate the bones and soft tissue lesions.
The comparison of W-1 and W12 revealed a significant increase in synovial fluid total pro-
tein, total nucleated cell counts and CTX-II concentration in joints. In the light of published
values encountered for severe inflammation [37] or variations observed in other models of ani-
mal OA [38,39], the degree of increase was low, as observed for other OA-associated changes
in this study. High values of total protein concentration and total nucleated cell count encoun-
tered on W3 and W8 (Fig 8), might be linked to the surgical injury and progressive develop-
ment of OA, as reported in the post-traumatic middle carpal joint OA model [38]. In the
carpal joint model, another biomarker of cartilage degradation was used and revealed a similar
pattern to that of CTX-II in this study. CTX-II has already been proven to be a sensitive and
specific biomarker for early cartilage changes in an established canine model of experimental
OA [39]. Finally, similarly to another published model of fetlock joint OA [15], no significant
increase was observed in PGE2 concentration during the study period. This unexpected find-
ing is not consistent with the results of the carpal osteochondral fragment model study and the
fetlock osteochondral fragment-groove model [18], where a significant increase in PGE2 con-
centration in OA-affected joints was found compared to exercise-alone joints 10 or 11 weeks
after surgery [14,38]. This could be attributed to the differences in time measurements or to
the insufficient severity of lesions in this method. Nevertheless, postmortem evaluations
revealed similar findings to those reported in the two previously cited models [18,38]. Indeed,
macroscopic changes mostly included the presence of wear lines, while histological evaluation
of osteochondral sections mainly revealed the presence of cartilage erosions, fibrocellular tis-
sue and the formation of chondrocyte clusters. These findings support the relevance of the
PLOS ONE Four fetlock joints equine osteoarthritis model
PLOS ONE | https://doi.org/10.1371/journal.pone.0235251 June 25, 2020 17 / 22

procedure presented in this study to induce OA-associated changes and underline the reliabil-
ity of this protocol for use in the evaluation of new OA treatments in horses. Regarding post-
mortem parameters, it should be acknowledged that the methods used for macroscopic and
microscopic evaluation of the joints may have artificially lowered the total severity scores.
Indeed, although the scoring system chosen for macroscopic lesions included 3 types of
lesions, only 2 of these were present on the fetlocks observed in the study, as no palmar/plantar
osteochondral disease was observed (Table 4). A single site was sampled for the microscopic
evaluation of the joints, which might not be representative of all the structural changes
throughout the joint. Post-mortem scores do not therefore provide an accurate representation
of the true disease severity.
There are three main limitations of this study design that uses both front and both hind
limbs. The first is the absence of a placebo control joint to compare the OA-induced lesions to
a controlateral sham-operated joint. The second is that an objective evaluation of the degree of
lameness of each limb was not possible, meaning that this parameter could not be considered
in analysis, yet this pain-indicator symptom is important when evaluating OA and disease
modifying therapies. The third main limitation of this study design is that all horses received
intra-articular injections of stem cells on W3. The stem cells injected were from the same cell
lines as those previously used in a safety study [19] and were not considered to have any rele-
vant systemic effects in the analysis. The immunomodulatory properties of stem cells have
been widely reported but their mechanisms of action have not been described in detail,
research published to date has only focused on the general administration of stem cells. No
studies have described potential systemic effects of stem cells after intra-articular administra-
tion, but such effects seem unlikely, given a reported reduction in trafficking of stem cells due
to their size, which promotes passive cell entrapment [40]. The joint appears to be particularly
prone to reducing cell trafficking due to the synovial membrane, which constitutes a real
blood-joint barrier that limits the exchange of the synovial fluid and its content between the
joint cavity and the bloodstream [41]. In addition, no adverse event occurred following stem
cell injection that could have impaired the results of the study by shifting weight to another
limb. A further limitation is that this study used a consensus agreement to limit the subjectivity
of the semi-quantitative scores attributed. Although it is true that no repeatability tests were
performed, the examiners rarely disagreed and in these cases, the images were reviewed and
discussed carefully until consensus was reached. Finally, even if the number of horses used in
the present study is comparable to similar studies performed in the field [12,15,18], the results
of the statistical analyses should be considered with caution given the small sample size, but
also given the lack of correction for multiple testing.
To conclude, surgical fragmentation of the proximal phalanx performed on both metacar-
pophalangeal and both metatarsophalangeal joints of experimental horses is a repeatable and
well tolerated procedure that successfully induces mild OA-associated changes reflected by
clinical, radiographic, ultrasonographic, MRI, biochemical, macroscopic and microscopic
parameters. The few significant differences that were observed between fetlock positions (left,
right, front or hind) would not preclude the use of such a model to evaluate the therapeutic
effects of treatments. This model can be considered for use in efficacy studies in order to
reduce the number of animals used and reduce individual variability of the evolution of OA-
associated changes using each horse as its own control.
Supporting information
S1 Dataset. Lameness scores graded within 32 limbs on the day of stem-cell injection
(before injection) on W3, the following day (D1), 3 days after injection (D3) and 7 days
PLOS ONE Four fetlock joints equine osteoarthritis model
PLOS ONE | https://doi.org/10.1371/journal.pone.0235251 June 25, 2020 18 / 22

after injection (D7).
(PDF)
S2 Dataset. Scores and values of clinical, imaging, post-mortem and synovial fluid parame-
ters within 32 fetlocks on weeks -1 and 3 and within 16 fetlocks on weeks 8 and 12.
(PDF)
S1 Fig. Arthroscopic images of the osteochondral fragmentation of the proximal phalanx.
(a) Inspection of the dorsal aspect of the metacarpophalangeal joint. (b) Use of an 8 mm
curved osteotome to create an osteochondral fragment of the dorso-proximo-medial border of
the proximal phalanx. (c) Resulting fragment (arrow) attached to the joint capsule and defect
bed (�). P1 –Proximal phalanx; Mc3 –Metacarpal condyle.
(PDF)
S2 Fig. Open metacarpophalangeal joint of the right front fetlock of one horse showing
locations of the surgically induced bone fragment and the osteochondral sample harvested
for histological and immunohistological analysis performed on the medial part of the dis-
tal aspect of the metacarpal/tarsal condyle.
(PDF)
S1 Table. Magnetic resonance imaging parameters.
(PDF)
S2 Table. Results from the statistical analyzes (p values) comparing differences between
W12 and W-1 values from the 16 fetlocks injected with placebo to evaluate variability in
lesion evolution.
(PDF)
S3 Table. Mean (standard deviation) or median scores (1st quartile- 3rd quartile) for val-
ues measured in 32 fetlocks on weeks -1 and 3 and in 16 fetlocks on weeks 8 and 12.
(PDF)
Author Contributions
Conceptualization: Sandrine Jacquet-Guibon, Jean-Marie Denoix, Philippe Galera, Magali
Demoor, Fabrice Audigie.
Data curation: Lelia Bertoni, Sandrine Jacquet-Guibon, Thomas Branly, Florence Legendre,
Melanie Desance, Martine Melin.
Formal analysis: Lelia Bertoni, Thomas Branly, Florence Legendre, Melanie Desance, Martine
Melin, Daniel-Jean Hartmann, Amandine Schmutz, Jean-Marie Denoix, Magali Demoor,
Fabrice Audigie.
Funding acquisition: Sandrine Jacquet-Guibon, Philippe Galera, Magali Demoor, Fabrice
Audigie.
Investigation: Lelia Bertoni, Sandrine Jacquet-Guibon, Thomas Branly, Florence Legendre,
Melanie Desance, Celine Mespoulhes, Martine Melin, Daniel-Jean Hartmann, Fabrice
Audigie.
Methodology: Lelia Bertoni, Sandrine Jacquet-Guibon, Thomas Branly, Florence Legendre,
Melanie Desance, Celine Mespoulhes, Martine Melin, Daniel-Jean Hartmann, Fabrice
Audigie.
PLOS ONE Four fetlock joints equine osteoarthritis model
PLOS ONE | https://doi.org/10.1371/journal.pone.0235251 June 25, 2020 19 / 22

Project administration: Sandrine Jacquet-Guibon, Florence Legendre, Jean-Marie Denoix,
Philippe Galera, Magali Demoor, Fabrice Audigie.
Resources: Philippe Galera.
Supervision: Daniel-Jean Hartmann, Jean-Marie Denoix, Philippe Galera, Magali Demoor,
Fabrice Audigie.
Validation: Sandrine Jacquet-Guibon, Martine Melin, Philippe Galera, Magali Demoor, Fab-
rice Audigie.
Visualization: Sandrine Jacquet-Guibon, Daniel-Jean Hartmann, Magali Demoor.
Writing – original draft: Lelia Bertoni.
Writing – review & editing: Sandrine Jacquet-Guibon, Philippe Galera, Magali Demoor, Fab-
rice Audigie.
References1. McIlwraith CW. Current concepts in equine degenerative joint disease. J Am Vet Med Assoc. 1982;
180: 239–250. PMID: 7035425
2. United States Department of Agriculture UAVSNHM. National economic cost of equine lameness, colic,
and equine protozoal myeloencephalitis in the United States. USDA APHIS Veterinary Services
National Health Monitoring System Fort Collins, Colorado; 2001.
3. Oke SL, McIlwraith CW. Review of the Economic Impact of Osteoarthritis and Oral Joint-Health Supple-
ments in Horses. Proc Am Assoc Equine Pract. 2010; 56: 12–16.
4. Lawrence RC, Helmick CG, Arnett FC, Deyo RA, Felson DT, Giannini EH, et al. Estimates of the preva-
lence of arthritis and selected musculoskeletal disorders in the United States. Arthritis Rheum Off J Am
Coll Rheumatol. 1998; 41: 778–799.
5. Kawcak CE, McIlwraith CW, Norrdin RW, Park RD, Steyn PS. Clinical effects of exercise on subchon-
dral bone of carpal and metacarpophalangeal joints in horses. Am J Vet Res. 2000; 61: 1252–1258.
https://doi.org/10.2460/ajvr.2000.61.1252 PMID: 11039557
6. Neundorf RH, Lowerison MB, Cruz AM, Thomason JJ, McEwen BJ, Hurtig MB. Determination of the
prevalence and severity of metacarpophalangeal joint osteoarthritis in Thoroughbred racehorses via
quantitative macroscopic evaluation. Am J Vet Res. 2010; 71: 1284–1293. https://doi.org/10.2460/ajvr.
71.11.1284 PMID: 21034319
7. McIlwraith CW, Frisbie DD, Kawcak CE. The horse as a model of naturally occurring osteoarthritis.
Bone Jt Res. 2012; 1: 297–309.
8. Gregory MH, Capito N, Kuroki K, Stoker AM, Cook JL, Sherman SL. A review of translational animal
models for knee osteoarthritis. Arthritis. 2012; 2012: 764621. https://doi.org/10.1155/2012/764621
PMID: 23326663
9. Rickey EJ, Cruz AM, Trout DR, McEwen BJ, Hurtig MB. Evaluation of experimental impact injury for
inducing post-traumatic osteoarthritis in the metacarpophalangeal joints of horses. Am J Vet Res. 2012;
73: 1540–1552. https://doi.org/10.2460/ajvr.73.10.1540 PMID: 23013179
10. Richardson DW, Clark CC. Effects of short-term cast immobilization on equine articular cartilage. Am J
Vet Res. 1993; 54: 449–453. PMID: 8498752
11. Foland JW, McIlwraith CW, Trotter GW, Powers BE, Lamar CH. Effect of betamethasone and exercise
on equine carpal joints with osteochondral fragments. Vet Surg. 1994; 23: 369–376. https://doi.org/10.
1111/j.1532-950x.1994.tb00497.x PMID: 7839595
12. Boyce MK, Trumble TN, Carlson CS, Groschen DM, Merritt KA, Brown MP. Non-terminal animal model
of post-traumatic osteoarthritis induced by acute joint injury. Osteoarthritis Cartilage. 2013; 21: 746–
755. https://doi.org/10.1016/j.joca.2013.02.653 PMID: 23467035
13. Marijnissen ACA, van Roermund PM, TeKoppele JM, Bijlsma JWJ, Lafeber FPJG. The canine ‘groove’
model, compared with the ACLT model of osteoarthritis. Osteoarthritis Cartilage. 2002; 10: 145–155.
https://doi.org/10.1053/joca.2001.0491 PMID: 11869074
14. Kawcak CE, Frisbie DD, Werpy NM, Park RD, McIlwraith CW. Effects of exercise vs experimental oste-
oarthritis on imaging outcomes. Osteoarthritis Cartilage. 2008; 16: 1519–1525. https://doi.org/10.1016/
j.joca.2008.04.015 PMID: 18504148
PLOS ONE Four fetlock joints equine osteoarthritis model
PLOS ONE | https://doi.org/10.1371/journal.pone.0235251 June 25, 2020 20 / 22

15. Maninchedda U, Lepage OM, Gangl M, Hilairet S, Remandet B, Meot F, et al. Development of an
Equine Groove Model to Induce Metacarpophalangeal Osteoarthritis: A Pilot Study on 6 Horses. Kerkis
I, editor. PLOS ONE. 2015; 10: e0115089. https://doi.org/10.1371/journal.pone.0115089 PMID:
25680102
16. Kawcak CE, McIlwraith CW. Proximodorsal first phalanx osteochondral chip fragmentation in 336
horses. Equine Vet J. 1994; 26: 392–396. https://doi.org/10.1111/j.2042-3306.1994.tb04409.x PMID:
7988543
17. Yovich JV, McIlwraith CW. Arthroscopic surgery for osteochondral fractures of the proximal phalanx of
the metacarpophalangeal and metatarsophalangeal (fetlock) joints in horses. J Am Vet Med Assoc.
1986; 188: 273–279. PMID: 2869018
18. Broeckx SY, Pille F, Buntinx S, Van Brantegem L, Duchateau L, Oosterlinck M, et al. Evaluation of an
osteochondral fragment–groove procedure for induction of metacarpophalangeal joint osteoarthritis in
horses. Am J Vet Res. 2019; 80: 246–258. https://doi.org/10.2460/ajvr.80.3.246 PMID: 30801207
19. Bertoni L, Branly Thomas, Jacquet S, Desance M, Desquilbet L, Rivory P, et al. Intra-articular injection
of 2 different dosages of autologous and allogeneic bone marrow and umbilical cord-derived mesenchy-
mal stem cells triggers a variable inflammatory response of the fetlock joint on 12 sound experimental
horses. Stem Cell Int. 2019; 2019: 17 pages. https://doi.org/10.1155/2019/9431894
20. American Association of Equine Practitioners AA of EP. Guide for veterinary service and judging of
equestrian events. Lexington: AAEP; 1991. p. 19.
21. Olive J, D’Anjou M-A, Alexander K, Laverty S, Theoret C. Comparison of magnetic resonance imaging,
computed tomography and radiography for assessment of noncartilagnious changes in equine metacar-
pophalangeal osteoarthritis. Vet Radiol Ultrasound. 2010; 51: 267–279. https://doi.org/10.1111/j.1740-
8261.2009.01653.x PMID: 20469548
22. Trumble TN, Brown MP, Merritt KA, Billinghurst RC. Joint dependent concentrations of bone alkaline
phosphatase in serum and synovial fluids of horses with osteochondral injury: an analytical and clinical
validation. Osteoarthritis Cartilage. 2008; 16: 779–786. https://doi.org/10.1016/j.joca.2007.11.008
PMID: 18162418
23. Denoix JM, Jacot S, Bousseau B, Perrot P. Ultrasonographic anatomy of the dorsal and abaxial aspects
of the equine fetlock. Equine Vet J. 1996; 28: 54–62. https://doi.org/10.1111/j.2042-3306.1996.
tb01590.x PMID: 8565955
24. Smith AD, Morton A, Colahan P, Winter M, Ghivizzani S, Brown M, et al. Magnetic resonance imaging
scoring of an experimental model of osteoarthritis in the equine carpus. Osteoarthritis Cartilage. 2014;
22: S285.
25. Christgau S, Garnero P, Fledelius C, Moniz C, Ensig M, Gineyts E, et al. Collagen type II C-telopeptide
fragments as an index of cartilage degradation. Bone. 2001; 29: 209–215. https://doi.org/10.1016/
s8756-3282(01)00504-x PMID: 11557363
26. Bertone AL, Palmer JL, Jones J. Synovial fluid cytokines and eicosanoids as markers of joint disease in
horses. Vet Surg. 2001; 30: 528–538. https://doi.org/10.1053/jvet.2001.28430 PMID: 11704948
27. McIlwraith CW, Frisbie DD, Kawcak CE, Fuller CJ, Hurtig M, Cruz A. The OARSI histopathology initia-
tive—recommendations for histological assessments of osteoarthritis in the horse. Osteoarthritis Carti-
lage. 2010; 18: S93–S105. https://doi.org/10.1016/j.joca.2010.05.031 PMID: 20864027
28. Pritzker KPH, Gay S, Jimenez SA, Ostergaard K, Pelletier J-P, Revell PA, et al. Osteoarthritis cartilage
histopathology: grading and staging. Osteoarthritis Cartilage. 2006; 14: 13–29. https://doi.org/10.1016/
j.joca.2005.07.014 PMID: 16242352
29. Chateau H, Degueurce C, Jerbi H, Crevier-Denoix N, Pourcelot P, Audigie F, et al. Three-dimensional
kinematics of the equine interphalangeal joints: articular impact of asymmetric bearing. Vet Res. 2002;
33: 371–382. https://doi.org/10.1051/vetres:2002023 PMID: 12199364
30. Denoix J-M, Audigie F. Imaging of the musculoskeletal system in horses. Equine sports medicine and
surgery. Elsevier; 2004. pp. 161–187.
31. Denoix J-M. Ultrasound examination of joints and miscellaneous tendons. Rantanen NW, McKinnon
AO. Equine Diagnostic Ultrasonography. Rantanen NW, McKinnon AO. Baltimore: Williams and Wil-
kins; 1998. pp. 475–514.
32. Nelson BB, Kawcak CE, Barrett MF, McIlwraith CW, Grinstaff MW, Goodrich LR. Recent advances in
articular cartilage evaluation using computed tomography and magnetic resonance imaging. Equine
Vet J. 2018; 50: 564–579. https://doi.org/10.1111/evj.12808 PMID: 29344988
33. Smith AD, Morton AJ, Winter MD, Colahan PT, Ghivizzani S, Brown MP, et al. Magnetic resonance
imaging scoring of an experimental model of post-traumatic osteoarthritis in the equine carpus. Vet
Radiol Ultrasound. 2016; 57: 502–514. https://doi.org/10.1111/vru.12369 PMID: 27198611
PLOS ONE Four fetlock joints equine osteoarthritis model
PLOS ONE | https://doi.org/10.1371/journal.pone.0235251 June 25, 2020 21 / 22

34. Blum A, Roch D, Loeuille D, Louis M, Batch T, Lecocq S, et al. Bone marrow edema: definition, diagnos-
tic value and prognostic value. J Radiol. 2009; 90: 1789–1811.
35. Cruz AM, Hurtig MB. Multiple Pathways to Osteoarthritis and Articular Fractures: Is Subchondral Bone
the Culprit? Vet Clin North Am Equine Pract. 2008; 24: 101–116. https://doi.org/10.1016/j.cveq.2007.
12.001 PMID: 18314038
36. Powell SE. Low-field standing magnetic resonance imaging findings of the metacarpo/metatarsopha-
langeal joint of racing Thoroughbreds with lameness localised to the region: A retrospective study of
131 horses: Equine Vet J. 2012; 44: 169–177. https://doi.org/10.1111/j.2042-3306.2011.00389.x PMID:
21696431
37. Steel CM. Equine synovial fluid analysis. Vet Clin Equine Pract. 2008; 24: 437–454.
38. Frisbie DD, Al-Sobayil F, Billinghurst RC, Kawcak CE, McIlwraith CW. Changes in synovial fluid and
serum biomarkers with exercise and early osteoarthritis in horses. Osteoarthritis Cartilage. 2008; 16:
1196–1204. https://doi.org/10.1016/j.joca.2008.03.008 PMID: 18442931
39. Matyas JR, Atley L, Ionescu M, Eyre DR, Poole AR. Analysis of cartilage biomarkers in the early phases
of canine experimental osteoarthritis. Arthritis Rheum. 2004; 50: 543–552. https://doi.org/10.1002/art.
20027 PMID: 14872497
40. Karp JM, Teo GSL. Mesenchymal stem cell homing: the devil is in the details. Cell Stem Cell. 2009; 4:
206–216. https://doi.org/10.1016/j.stem.2009.02.001 PMID: 19265660
41. Nishijima T. The fine structure of the synovial membrane of the knee joint in rats with special reference
to regional differences. Nihon Seikeigeka Gakkai Zasshi. 1981; 55: 601–613. PMID: 7310206
PLOS ONE Four fetlock joints equine osteoarthritis model
PLOS ONE | https://doi.org/10.1371/journal.pone.0235251 June 25, 2020 22 / 22