Edwin Mansfield 1995- research underlying industrial innovations
Upload
independentCategory
view
5download
0
Predictive Toxicogenomics Approaches RevealUnderlying Molecular Mechanisms ofNongenotoxic Carcinogenicity
Alex Y. Nie,1* Michael McMillian,1 J. Brandon Parker,1 Angelique Leone,1 Stewart Bryant,1 Lynn Yieh,2
Anton Bittner,2 Jay Nelson,2 Andrew Carmen,2 Jackson Wan,2 and Peter G. Lord1
1Johnson & Johnson Pharmaceutical Research & Development, LLC, Raritan, New Jersey2Johnson & Johnson Pharmaceutical Research & Development, LLC, La Jolla, California
Toxicogenomics technology defines toxicity gene expression signatures for early predictions and hypothesesgeneration for mechanistic studies, which are important approaches for evaluating toxicity of drug candidatecompounds. A large gene expression database built using cDNA microarrays and liver samples treated with over one
hundred paradigm compounds was mined to determine gene expression signatures for nongenotoxic carcinogens(NGTCs). Data were obtained from male rats treated for 24 h. Training/testing sets of 24 NGTCs and 28 non-carcinogens were used to select genes. A semiexhaustive, nonredundant gene selection algorithm yielded six genes
(nuclear transport factor 2, NUTF2; progesterone receptor membrane component 1, Pgrmc1; liver uridine diphosphateglucuronyltransferase, phenobarbital-inducible form, UDPGTr2; metallothionein 1A, MT1A; suppressor of lin-12homolog, Sel1h; and methionine adenosyltransferase 1, alpha, Mat1a), which identified NGTCs with 88.5% pre-
diction accuracy estimated by cross-validation. This six genes signature set also predicted NGTCs with 84% accuracywhen samples were hybridized to commercially available CodeLink oligo-based microarrays. To unveil molecularmechanisms of nongenotoxic carcinogenesis, 125 differentially expressed genes (P< 0.01) were selected by Student’st-test. These genes appear biologically relevant, of 71 well-annotated genes from these 125 genes, 62 were over-
represented in five biochemical pathway networks (most linked to cancer), and all of these networks were linked byone gene, c-myc. Gene expression profiling at early time points accurately predicts NGTC potential of compounds, andthe same data can be mined effectively for other toxicity signatures. Predictive genes confirm prior work and suggest
pathways critical for early stages of carcinogenesis. � 2006 Wiley-Liss, Inc.
INTRODUCTION
Drug-induced carcinogenesis is an issue withregulatory as well as scientific implications. Regula-tory carcinogenicity studies are performed late in thedrugdevelopmentprocess, andowing to a somewhatvariable rate of tumor formation inuntreatedcontrolrodents, results of these long-term studies are oftendifficult to interpret. For compounds or their meta-boliteswith directDNAdamaging properties,mostlyreactive electrophiles, a number of assays have beendeveloped to predict results in the long-term rodentstudies. These include bacterial mutagenicity assays[1], bioengineered rodents such as the Big BlueMouse and Rat [2,3], the micronucleus assay [4],and variations on the comet assay [5,6] for detectingdirect DNA damage. Generally, a robust positiveresponse in any of these genotoxicity assays isenough to stop development of a potential thera-peutic, unless its benefit exceeds its risk for a partic-ular prognosis. While these assays are predictive forDNA damage-induced carcinogenicity in rodents,over half of all chemical-induced carcinogenesis inrodents appears to be nongenotoxic in origin, andnongenotoxic carcinogens (NGTCs) have proven
more difficult to predict accurately in short-termassays.The term, nongenotoxic refers to a lack of direct
chemical effect on DNA, for carcinogens in theinitiation of tumors. There are many types of NGTC.Many have abrupt dose response effects (possiblyacting as anticancer agents at low doses) and conti-nued administration of a NGTC is often required fortumor development (these tumors are compounddependent). NGTCshave beenpostulated to act via anumber of mechanisms: increased mitogenesis,decreased apoptosis, interference with gap junctionintercellular communication, and interference withtubulin polymerization [7]. Some of these effects are
MOLECULAR CARCINOGENESIS 45:914–933 (2006)
� 2006 WILEY-LISS, INC.
Abbreviations: NGTC, nongenotoxic carcinogen; NC, noncarcino-gen; MA, macrophage activator; PP, peroxisome proliferator; SAM,S-adenosyl-L-methionine; TSH, thyroid stimulatory hormone; PCA,principal component analysis.
*Correspondence to: Johnson & Johnson PharmaceuticalResearch & Development, LLC, Raritan, NJ.
Received 9 August 2005; Revised 30 November 2005; Accepted17 January 2006
DOI 10.1002/mc.20205
Published online 18 August 2006 in Wiley InterScience(www.interscience.wiley.com)
not so different from those observedwithdirectDNAdamaging agents. For example, if a compound is amitogen, cytotoxic, or an irritant, there is prolifera-tion and/or compensatory regeneration of tissue,and this proliferating tissue accrues mutations at ahigher rate than the normal, quiescent tissue,especially if apoptosis is blocked, thus increasingrisk for tumor development [8]. Proliferation is anindicative risk factor for carcinogenesis, and mon-itoring early proliferative responses (within the 1stwk)byBrdUorPCNA labelingofnucleihasbeenusedto predict formation of tumors in response to drugsand chemicals [9–11]. Decreased apoptosis blocksthenormal removalofdamaged, sometimesmutatedcells and again the risk for cancerous growth isincreased [12]. The role of gap junction communica-tion in inhibiting carcinogenesis is less clear, butisolation of affected cells from control by surround-ing normal cells appears to be a common effect withmany NGTCs [13]. Inhibitors of tubulin polymeriza-tion disrupt chromosomal movements and separa-tions duringmitosis, and represent a specialized typeof carcinogen [7]. Rodents are typically used forregulatory carcinogenicity studies due to their shortlifetimes for compound administration. About halfof compounds tested in rodents are carcinogenic [8]and most of these are NGTCs [14,15]. Rat liverappears unusually sensitive to NGTCs, and hasbeen extensively studied to understand potentialmechanisms involved.Many recent publications have used microarrays
and expression profiling to study NGTCs in liver.Most investigators have characterized early hepaticresponses to a single NGTC or class, or a few NGTCswithin a very small set of compounds [16–19].Comparisons of peroxisome proliferators (PPs) withanother NGTC led to the conclusion that, despitepronounced effects on gene regulation, there are fewgene expression changes in common and that eachclass of nongenomic carcinogen exerts its effects bydifferent mechanisms [20–23]. NGTCs can becleanly distinguished from genotoxic carcinogensin vitro in HepG2 cells, a model which provides anearly screen but may involve different mechanismsfrom carcinogenesis in vivo [24].We have previously used cDNA microarray tech-
nology to characterize two classes of hepatotoxicNGTC: macrophage activators (MAs) and peroxi-some proliferators [25,26]. Compounds that activatemacrophages (Kupffer cells in the liver) mimicinflammation, and share characteristics with hepa-titis viruses. Generally these compounds produceacute liver damage and regeneration. Continuedadministration of MAs leads to fibrosis and even-tually to hepatic tumors [27,28]. MAs have a veryrobust, distinct gene expression signature responsein rat liver, and frequently cluster together evenwhen other types of hepatotoxicities are the foci ofexamination by microarray [25,26]. Similarly, PPs
have pronounced, distinct effects on genes, such asthose involved in b-hydroxylation of fatty acids,such that their gene expression signature responsesoverwhelm any similarities to other NGTCs. Peroxi-someproliferation is a direct result of PPARa receptoractivation in rat liver, and the resultant tumorsreflect, at least in part, the effects of increasedhydrogen peroxide levels derived from peroxisomes.In the present study, we have examined toxicoge-
nomic effects at 24hof a largenumberof compoundspreviously categorized as NGTCs or noncarcinogens(NCs) in the rat. Although we have focused onrat liver, we have also included NGTCs that onlyaffect other tissues, to see how well we can modelnongenotoxic carcinogenicity in general, at a single,early timepoint. Gene expression results from thesame set of liver RNA samples are associated with anumber of hepatotoxic endpoints, and these data arebeing extensivelymined for other gene signatures inaddition to that for NGTCs.
MATERIALS AND METHODS
Compounds
Compounds were obtained from Sigma-Aldrich(St. Louis, MO), except for troglitazone andWY14643, which were from Biomol (PlymouthMeeting, PA).
In Vivo Studies
A detailed description of in life studies was givenpreviously [26]. Single, high doses of chosen com-pounds were administered to male, 7-wk oldSprague–Dawley rats (Charles River Laboratories,Inc.), and rats were killed and livers removed 24 hlater. Each treatment was administered to three rats.High toxic doseswere selected typically as 30%–50%of the published LD50s for compounds, and anyadverse effects noted at necropsy were recorded(Appendix A in [26]). Compounds that producedminimal gene changes in liver and no obvious toxiceffects were given at a higher dose. In all instances,the animals were humanely handled in accordancewith IACUC guidelines.
RNA Isolation
A strip of liver from the medial lobe (approxi-mately 200 mg) was snap-frozen in liquid nitrogen.Liver samples were stored at �708C until RNAextraction. Total RNA was extracted using QiagenRNEasyMidi kits as per kit instructions. The amountof RNA in samples was determined spectrophotome-trically by absorbance at 260 nm. The quality of RNAsamples was assessed using rRNA peaks determinedby an Agilent 2100 Bioanalyzer.
cDNA Microarrays
RNA and probe preparation for microarray analy-sis—One round of T7 polymerase-based linear RNA
NONGENOTOXIC CARCINOGEN GENE SIGNATURE 915
Molecular Carcinogenesis DOI 10.1002/mc
amplificationwasperformedby reverse transcriptionof RNA with a T7 promoter oligo(dT) primer.Cy3-dCTP labeled fluorescent cDNA probe wassynthesized from the amplified RNA as described[29]. Probes were then purified with a PCR purifica-tion kit (Qiagen, Inc., Valencia, CA), vacuum-dried,and resuspended in 55 mL of hybridization buffer(Version 2 hybridization buffer (Amersham Pharma-cia Biotech, Piscataway, NJ) with 50% formamide)containing rat Cot1 DNA (Applied Genetics Labora-tories, Melbourne, FL).cDNA microarrays were prepared as described
previously [26] but with a different collection ofgenes. The 1471 genes on the current microarraywere selected from the last version based on theirperformance or directly picked from literature. Eachslide contained four identical panels of 1471 genesplus various types of control probes. The list of geneson the cDNA microarray used for these analyses isavailable at: http://mimicell.com/toxicogenomics/.Clones for genes of interest were obtained fromResearch Genetics (IMAGE consortium), sequenceverified, PCRamplified, purified, and spotted inquad-ruplicate on aminosilane-coated slides (Corning)using a contact pin microarrayer (Generation IIIArray Spotter, Molecular Dynamics).The sample cDNA probes were hybridized to
the microarrays and washed as described previously[26]. After drying, the microarrays were scannedwith a confocal laser scanner (Array Scanner,Molecular Dynamics). Intensity values for each spotof the array were obtained using Autogene software(BioDiscovery).
CodeLink Oligo Microarrays
One round of T7 polymerase-based linear RNAamplificationwasperformedby reverse transcriptionof RNA with a T7 promoter oligo(dT) primer,followed by in vitro transcription using the Ribo-Beast 1-Round Aminoallyl-aRNA Amplification Kit(Epicentre, Madison, WI). This protocol was per-formed as specified in the manufacturer’s protocolwith the following modifications: SuperscriptII(Invitrogen, Carslbad, CA) was used as the reversetranscriptase, and the Rneasy96 block was used forpurification (Qiagen, Valencia, CA). Following pur-ification, the cRNA was conjugated with biotin-ester(Biotium, Hayward, CA), purified again with theQiagen96 block, and concentrated by Speed-Vac(Thermosavant, Waltham, MA). Biotin-labeledcRNA was fragmented at 948C for 20 min and addedto Codelink hybridization buffer A and B (GEHealthcare, Chandler, AZ).EachcRNAsamplewas applied to twoCodelinkRat
Whole Genome microarrays (GE Healthcare) usingthemanufacturer’s protocol, and hybridized at 378Covernight. Slides were washed using the manufac-turer’s protocol and stained with an Alexa555-streptavidin conjugate (Invitrogen), and then
scanned at 532 nm with an Agilent G2565BAMicroarray Scanner (AgilentTechnologies, PaloAlto,CA). Fluorescence intensity for each feature of thearray was obtained by using Codelink EXPv4.1software (GE Healthcare).
Microarray Data Normalization
Data were normalized, day-to-day hybridizationdifferences corrected, and outlier data removed asdescribed in detail previously [26]. In short, geneexpression responses were measured with twoslides composed of two (CodeLink) or eight (cDNAmicroarrays) identical panels; data were Splinenormalized, the average was taken among allpanels, and the geometric mean of controls wasused to correct for day-to-day variability and togenerate ratios. The average was then takenamong three replicate rats to generate the averageratio for each individual treatment, which was thenused in the following cross validation and geneselection.
Gene Selection
Two different methods were used to select genes,one of which aimed at finding differentiallyexpressed genes between NGTC and NC treatments.Genes selected with this method were used tohelp understand the mechanisms of nongenotoxiccarcinogenicity. The other method was designed toselect the gene expression signature with the mini-mum number of genes and the highest predictingpower.
Selection of Differentially Expressed Genes
Student’s t-test was used to evaluate each gene forits expression difference between the NGTC- andNC-treated samples. Each of the genes, with itsP-value, average log ratio among all NGTC treat-ments, and average log ratio among all NC treat-ments was then loaded into Ingenuity’s networktools (Ingenuity1 Systems, www.ingenuity.com).Each gene identifier was mapped to its correspond-ing gene object in the Ingenuity Pathways Knowl-edge Base. A P<0.01 cutoff value was set to identifygenes whose expression was significantly differen-tially regulated. Significant genes that had directinteractionswith other genes in the database, the so-called Focus Genes, were overlaid onto a globalmolecular network contained in the Ingenuity Path-ways Knowledge Base. Networks of the Focus Geneswere then algorithmically generated based on theirconnectivity using the Ingenuity tools as describedin [30]. Briefly, the specificity of connections for eachfocus gene was calculated by the percentage of itsconnections to other significant genes, and thepathways grew from the genes with the highestspecificity until it reached 35 genes. Significantpathways were then integrated to form a compositenetwork useful for biological interpretation.
916 NIE ET AL.
Molecular Carcinogenesis DOI 10.1002/mc
Selection of NGTC Gene Signature
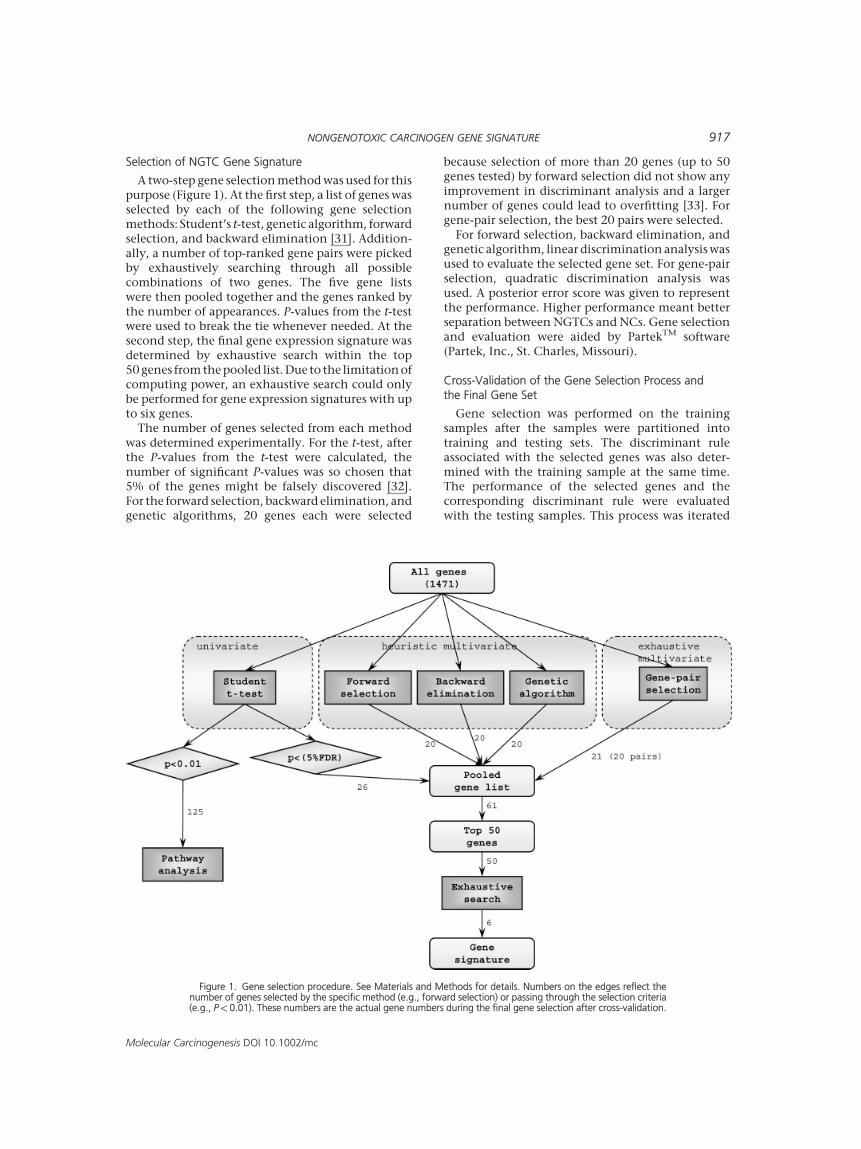
A two-step gene selectionmethodwas used for thispurpose (Figure 1). At the first step, a list of genes wasselected by each of the following gene selectionmethods: Student’s t-test, genetic algorithm, forwardselection, and backward elimination [31]. Addition-ally, a number of top-ranked gene pairs were pickedby exhaustively searching through all possiblecombinations of two genes. The five gene listswere then pooled together and the genes ranked bythe number of appearances. P-values from the t-testwere used to break the tie whenever needed. At thesecond step, the final gene expression signature wasdetermined by exhaustive search within the top50genes fromthepooled list.Due to the limitationofcomputing power, an exhaustive search could onlybe performed for gene expression signatures with upto six genes.The number of genes selected from each method
was determined experimentally. For the t-test, afterthe P-values from the t-test were calculated, thenumber of significant P-values was so chosen that5% of the genes might be falsely discovered [32].For the forward selection, backward elimination, andgenetic algorithms, 20 genes each were selected
because selection of more than 20 genes (up to 50genes tested) by forward selection did not show anyimprovement in discriminant analysis and a largernumber of genes could lead to overfitting [33]. Forgene-pair selection, the best 20 pairs were selected.For forward selection, backward elimination, and
genetic algorithm, linear discriminationanalysiswasused to evaluate the selected gene set. For gene-pairselection, quadratic discrimination analysis wasused. A posterior error score was given to representthe performance. Higher performance meant betterseparation between NGTCs and NCs. Gene selectionand evaluation were aided by PartekTM software(Partek, Inc., St. Charles, Missouri).
Cross-Validation of the Gene Selection Process andthe Final Gene Set
Gene selection was performed on the trainingsamples after the samples were partitioned intotraining and testing sets. The discriminant ruleassociated with the selected genes was also deter-mined with the training sample at the same time.The performance of the selected genes and thecorresponding discriminant rule were evaluatedwith the testing samples. This process was iterated
Figure 1. Gene selection procedure. See Materials and Methods for details. Numbers on the edges reflect thenumber of genes selected by the specific method (e.g., forward selection) or passing through the selection criteria(e.g., P< 0.01). These numbers are the actual gene numbers during the final gene selection after cross-validation.
NONGENOTOXIC CARCINOGEN GENE SIGNATURE 917
Molecular Carcinogenesis DOI 10.1002/mc
when the samples were repartitioned. Ten-fold crossvalidation was used in the present study, that is, ateach iteration, 10% of the samples were used fortesting and the testing samples did not repeat so thatevery sample had a chance to be tested. Theestimated error rate was calculated as the numberof misclassified testing samples divided by the totalnumber of samples.After cross-validation, the final gene set and
discriminant rule were decided with all the samples,and the estimated error rate was the one determinedin the cross-validation.The final gene set and discriminant function were
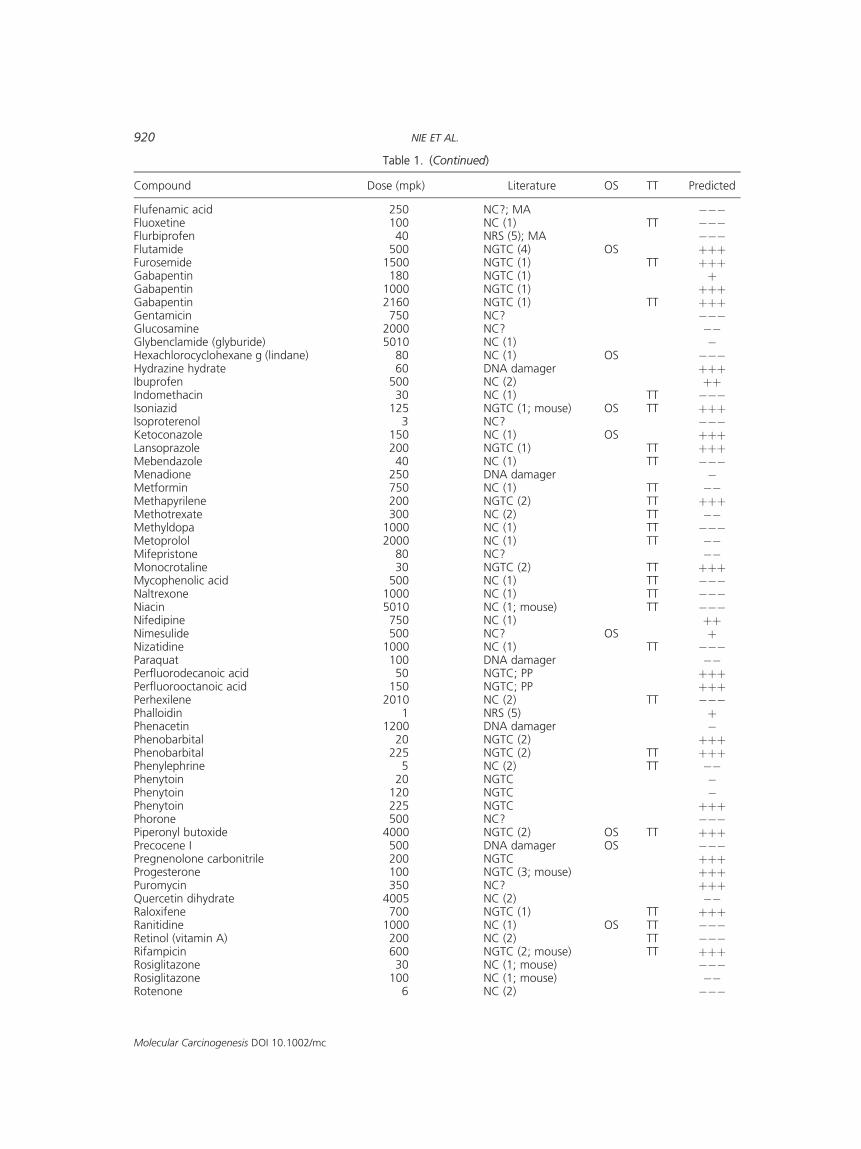
also used to predict the treatments in the databasethat were not included in the training/testingexercise. For each treatment, a posterior probabilityscore was calculated for each class: p(NGTC) andp(NC), where p(NGTC)þp(NC)¼1. If p(NGTC)>p(NC), then the compoundwaspredicted as aNGTC.For the purpose of simple representation (Table 1),we used aþ/� system:þþþ for p(NGTC)�0.99;þþ,0.99>p(NGTC) �0.95; þ, 0.95>p(NGTC) >0.5; �,0.95>p(NC)between�0.5;��, 0.99>p(NC)�0.95;and ���, p(NC) �0.99.
RESULTS
Selection of NGTC and NC Compounds
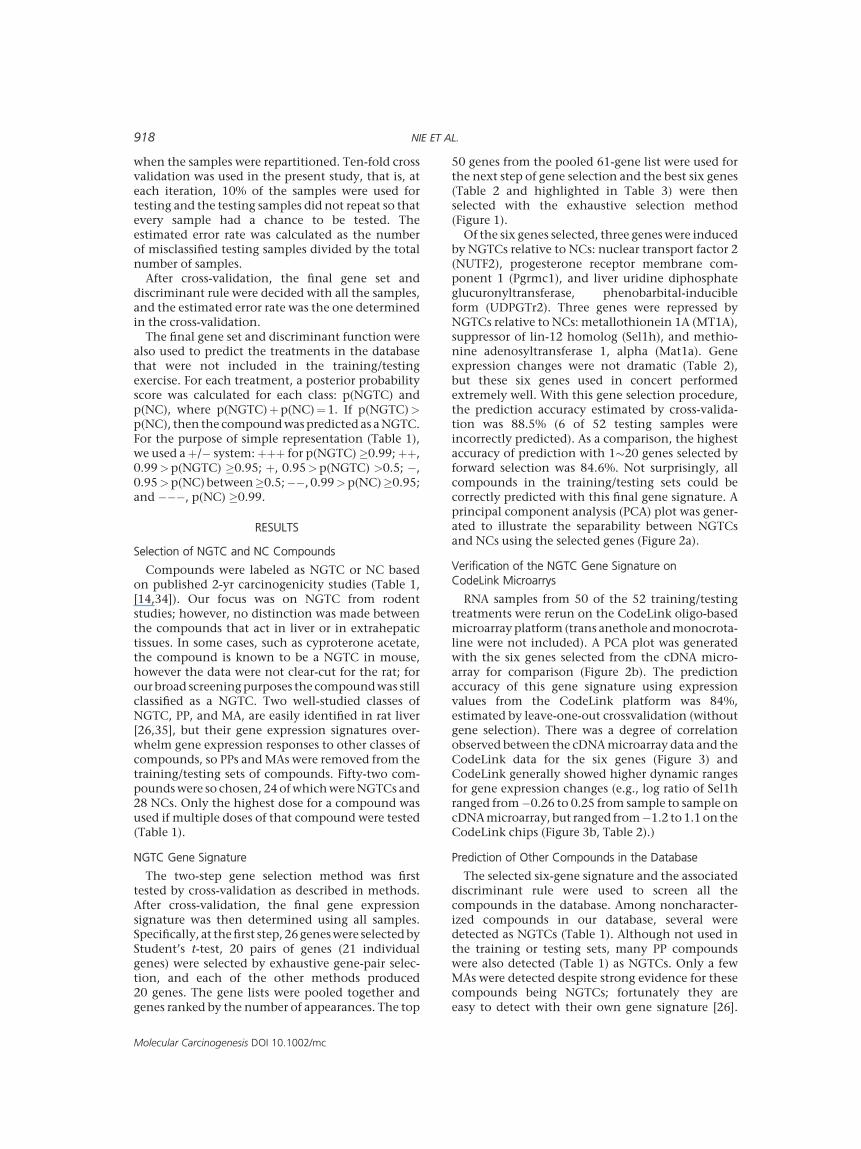
Compounds were labeled as NGTC or NC basedon published 2-yr carcinogenicity studies (Table 1,[14,34]). Our focus was on NGTC from rodentstudies; however, no distinction was made betweenthe compounds that act in liver or in extrahepatictissues. In some cases, such as cyproterone acetate,the compound is known to be a NGTC in mouse,however the data were not clear-cut for the rat; forour broad screeningpurposes the compoundwas stillclassified as a NGTC. Two well-studied classes ofNGTC, PP, and MA, are easily identified in rat liver[26,35], but their gene expression signatures over-whelm gene expression responses to other classes ofcompounds, so PPs andMAs were removed from thetraining/testing sets of compounds. Fifty-two com-poundswere so chosen, 24ofwhichwereNGTCs and28 NCs. Only the highest dose for a compound wasused if multiple doses of that compound were tested(Table 1).
NGTC Gene Signature
The two-step gene selection method was firsttested by cross-validation as described in methods.After cross-validation, the final gene expressionsignature was then determined using all samples.Specifically, at thefirst step, 26geneswere selectedbyStudent’s t-test, 20 pairs of genes (21 individualgenes) were selected by exhaustive gene-pair selec-tion, and each of the other methods produced20 genes. The gene lists were pooled together andgenes ranked by the number of appearances. The top
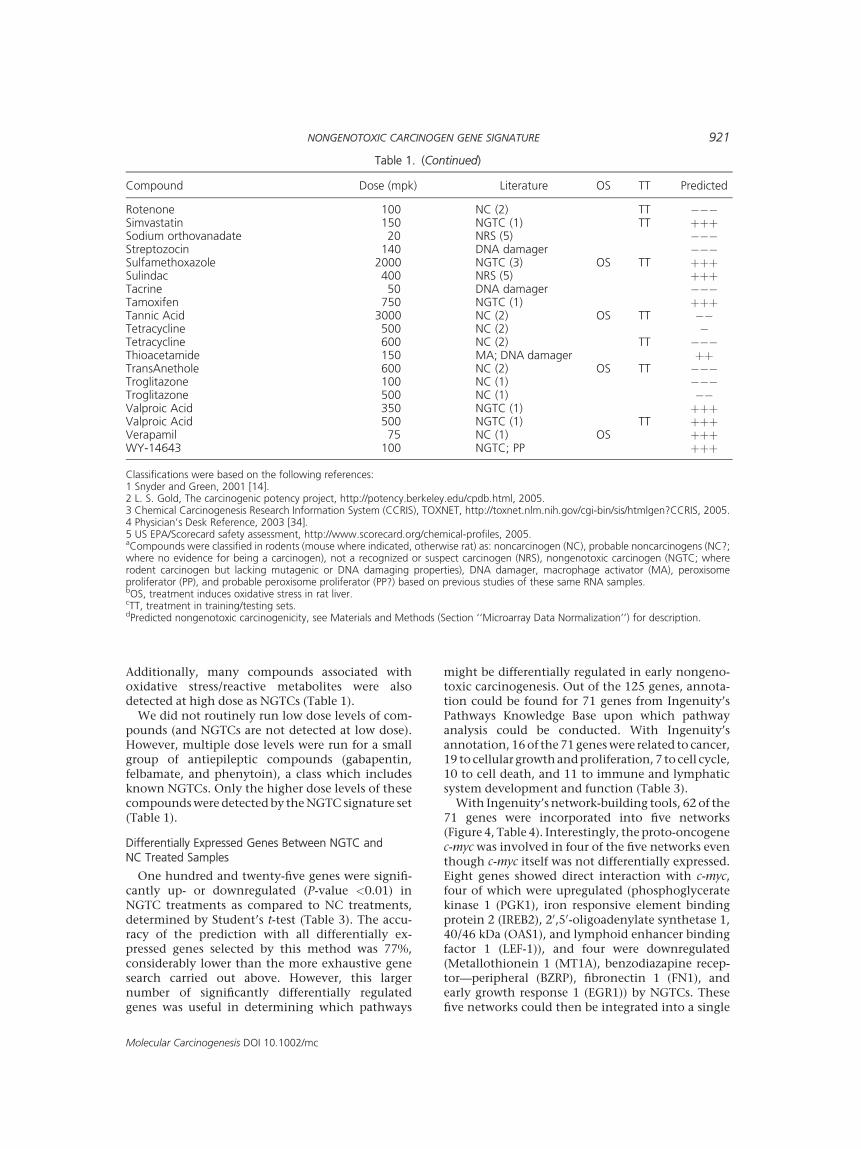
50 genes from the pooled 61-gene list were used forthe next step of gene selection and the best six genes(Table 2 and highlighted in Table 3) were thenselected with the exhaustive selection method(Figure 1).Of the six genes selected, three geneswere induced
by NGTCs relative to NCs: nuclear transport factor 2(NUTF2), progesterone receptor membrane com-ponent 1 (Pgrmc1), and liver uridine diphosphateglucuronyltransferase, phenobarbital-inducibleform (UDPGTr2). Three genes were repressed byNGTCs relative to NCs: metallothionein 1A (MT1A),suppressor of lin-12 homolog (Sel1h), and methio-nine adenosyltransferase 1, alpha (Mat1a). Geneexpression changes were not dramatic (Table 2),but these six genes used in concert performedextremely well. With this gene selection procedure,the prediction accuracy estimated by cross-valida-tion was 88.5% (6 of 52 testing samples wereincorrectly predicted). As a comparison, the highestaccuracy of prediction with 1�20 genes selected byforward selection was 84.6%. Not surprisingly, allcompounds in the training/testing sets could becorrectly predicted with this final gene signature. Aprincipal component analysis (PCA) plot was gener-ated to illustrate the separability between NGTCsand NCs using the selected genes (Figure 2a).
Verification of the NGTC Gene Signature onCodeLink Microarrys
RNA samples from 50 of the 52 training/testingtreatments were rerun on the CodeLink oligo-basedmicroarray platform (trans anethole andmonocrota-line were not included). A PCA plot was generatedwith the six genes selected from the cDNA micro-array for comparison (Figure 2b). The predictionaccuracy of this gene signature using expressionvalues from the CodeLink platform was 84%,estimated by leave-one-out crossvalidation (withoutgene selection). There was a degree of correlationobserved between the cDNAmicroarray data and theCodeLink data for the six genes (Figure 3) andCodeLink generally showed higher dynamic rangesfor gene expression changes (e.g., log ratio of Sel1hranged from�0.26 to 0.25 from sample to sample oncDNAmicroarray, but ranged from�1.2 to1.1 on theCodeLink chips (Figure 3b, Table 2).)
Prediction of Other Compounds in the Database
The selected six-gene signature and the associateddiscriminant rule were used to screen all thecompounds in the database. Among noncharacter-ized compounds in our database, several weredetected as NGTCs (Table 1). Although not used inthe training or testing sets, many PP compoundswere also detected (Table 1) as NGTCs. Only a fewMAs were detected despite strong evidence for thesecompounds being NGTCs; fortunately they areeasy to detect with their own gene signature [26].
918 NIE ET AL.
Molecular Carcinogenesis DOI 10.1002/mc
Table 1. Compounds Used in This Study
Compound Dose (mpk) Literaturea OSb TTc Predictedd
1-naphthyl-isothiocyanate 200 NRS (5) ���2-acetamidofluorene 200 DNA damager OS þþþ3-acetamidophenol 350 NC? OS �3-methylcholanthrene 125 DNA damager þ4,40-methylenedianiline 100 DNA damager þ4-methylthiazole 120 NRS (5) OS �Amiodarone 1000 NGTC (1); NRS (5) ���Amsacrine 20 DNA damager ���Aniline 200 NGTC (2) OS TT þþþAntimycin A3 2 NRS (5) ���Aspirin 600 NC (2) TT ��Atenolol 1500 NGTC (1) TT þþþBenzafibrate 500 NGTC; PP þþþBenzbromarone 200 NGTC; PP þþþBromobenzene 900 NRS (5) OS �Bromocryptine 200 NGTC (1) TT þþþBuspirone 100 NC (1) TT �Busulfan 100 DNA damager ���Butylated hydroxytoluene 1000 NGTC (2; mouse) OS TT þþþCadmium chloride 75 DNA damager ���Captopril 5000 NC (1) TT ���Carbamazepine 20 NGTC (1) þþCarbamazepine 120 NGTC (1) þþþCarbamazepine 225 NGTC (1) TT þþþCarmustine 30 DNA damager þCerium Chloride 50 NRS (5) �Chlorambucil 25 DNA damager ���Chlorpromazine 150 NGTC (4) OS TT þþþCisplatin 15 DNA damager þClofibrate 600 NGTC; PP þþþClozapine 150 NC (1) TT ��Cyclophosphamide 40 DNA damager ��Cyproterone acetate 200 NGTC (2; mouse) TT þþþDacarbazine 200 DNA damager ���Dantrolene 500 NGTC (1) TT þþDapsone 50 NGTC (1) TT þþþDexamethasone 75 NC (2) TT �D-Galactosamine 3000 MA þþþDichloroacetate 1500 NGTC; PP þþþDiclofenac 75 NC (1); MA TT ���Dieldrin 45 NGTC (2; mouse) OS TT þþþDiethylphthalate 1000 NGTC; PP þþþDiflunisal 750 PP?; NC (1) þþþDigoxin 15 NRS (5) ��Dimethylmaleate 400 NC? þþDipyridamole 5000 NC (1) TT ���Disulfiram 2010 NC (2) OS TT ���Doxorubicin 20 DNA damager ���Enalapril 1800 NC (4) ���Erythromycin estolate 1500 NC (2) ���Ethynylestradiol 500 NGTC (2) OS þþþEtoposide 60 DNA damager ���Etoposide 120 DNA damager ���Etoposide 150 DNA damager; MA þþþFamotidine 500 NC (1) TT ���Felbamate 180 NGTC (1) ��Felbamate 1000 NGTC (1) OS þþþFelbamate 2100 NGTC (1) OS TT þþþFenbufen 250 PP?; NC? þþþ
(Continued)
NONGENOTOXIC CARCINOGEN GENE SIGNATURE 919
Molecular Carcinogenesis DOI 10.1002/mc
Flufenamic acid 250 NC?; MA ���Fluoxetine 100 NC (1) TT ���Flurbiprofen 40 NRS (5); MA ���Flutamide 500 NGTC (4) OS þþþFurosemide 1500 NGTC (1) TT þþþGabapentin 180 NGTC (1) þGabapentin 1000 NGTC (1) þþþGabapentin 2160 NGTC (1) TT þþþGentamicin 750 NC? ���Glucosamine 2000 NC? ��Glybenclamide (glyburide) 5010 NC (1) �Hexachlorocyclohexane g (lindane) 80 NC (1) OS ���Hydrazine hydrate 60 DNA damager þþþIbuprofen 500 NC (2) þþIndomethacin 30 NC (1) TT ���Isoniazid 125 NGTC (1; mouse) OS TT þþþIsoproterenol 3 NC? ���Ketoconazole 150 NC (1) OS þþþLansoprazole 200 NGTC (1) TT þþþMebendazole 40 NC (1) TT ���Menadione 250 DNA damager �Metformin 750 NC (1) TT ��Methapyrilene 200 NGTC (2) TT þþþMethotrexate 300 NC (2) TT ��Methyldopa 1000 NC (1) TT ���Metoprolol 2000 NC (1) TT ��Mifepristone 80 NC? ��Monocrotaline 30 NGTC (2) TT þþþMycophenolic acid 500 NC (1) TT ���Naltrexone 1000 NC (1) TT ���Niacin 5010 NC (1; mouse) TT ���Nifedipine 750 NC (1) þþNimesulide 500 NC? OS þNizatidine 1000 NC (1) TT ���Paraquat 100 DNA damager ��Perfluorodecanoic acid 50 NGTC; PP þþþPerfluorooctanoic acid 150 NGTC; PP þþþPerhexilene 2010 NC (2) TT ���Phalloidin 1 NRS (5) þPhenacetin 1200 DNA damager �Phenobarbital 20 NGTC (2) þþþPhenobarbital 225 NGTC (2) TT þþþPhenylephrine 5 NC (2) TT ��Phenytoin 20 NGTC �Phenytoin 120 NGTC �Phenytoin 225 NGTC þþþPhorone 500 NC? ���Piperonyl butoxide 4000 NGTC (2) OS TT þþþPrecocene I 500 DNA damager OS ���Pregnenolone carbonitrile 200 NGTC þþþProgesterone 100 NGTC (3; mouse) þþþPuromycin 350 NC? þþþQuercetin dihydrate 4005 NC (2) ��Raloxifene 700 NGTC (1) TT þþþRanitidine 1000 NC (1) OS TT ���Retinol (vitamin A) 200 NC (2) TT ���Rifampicin 600 NGTC (2; mouse) TT þþþRosiglitazone 30 NC (1; mouse) ���Rosiglitazone 100 NC (1; mouse) ��Rotenone 6 NC (2) ���
Table 1. (Continued)
Compound Dose (mpk) Literature OS TT Predicted
920 NIE ET AL.
Molecular Carcinogenesis DOI 10.1002/mc
Additionally, many compounds associated withoxidative stress/reactive metabolites were alsodetected at high dose as NGTCs (Table 1).We did not routinely run low dose levels of com-
pounds (and NGTCs are not detected at low dose).However, multiple dose levels were run for a smallgroup of antiepileptic compounds (gabapentin,felbamate, and phenytoin), a class which includesknown NGTCs. Only the higher dose levels of thesecompoundswere detected by theNGTC signature set(Table 1).
Differentially Expressed Genes Between NGTC andNC Treated Samples
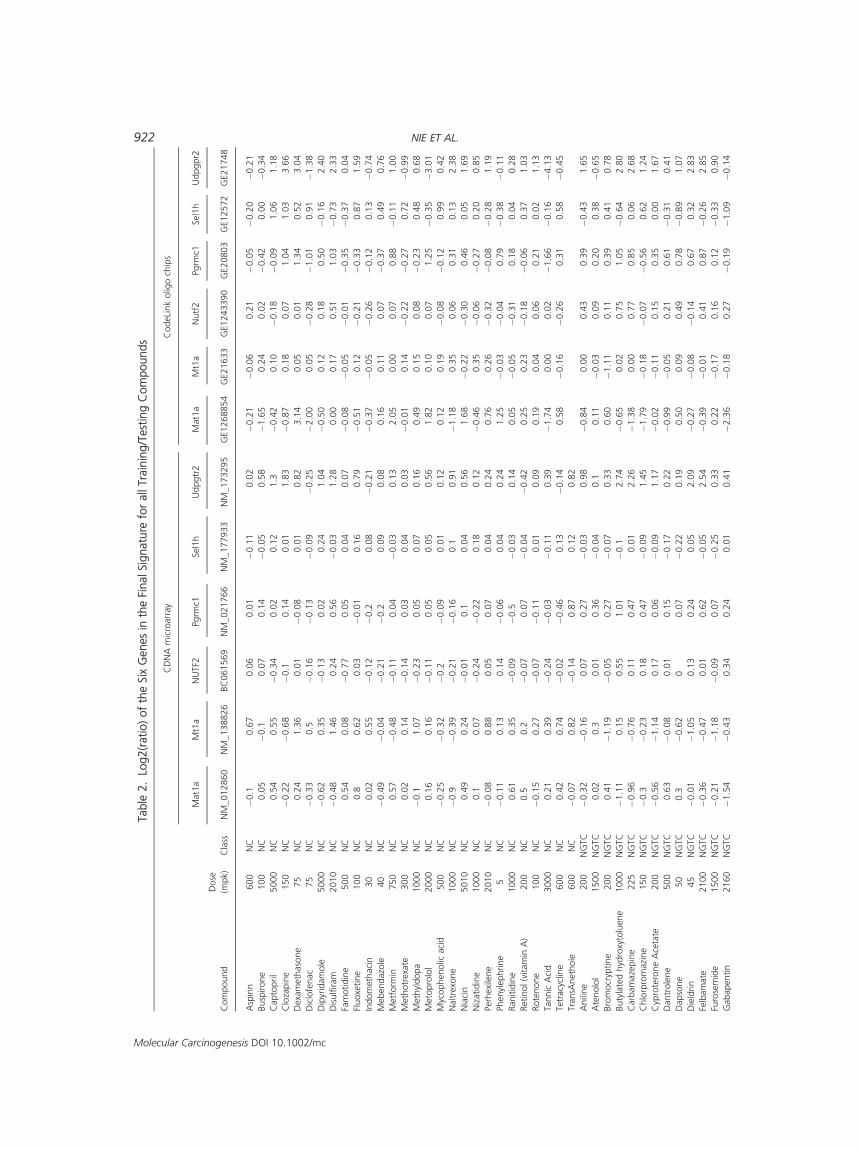
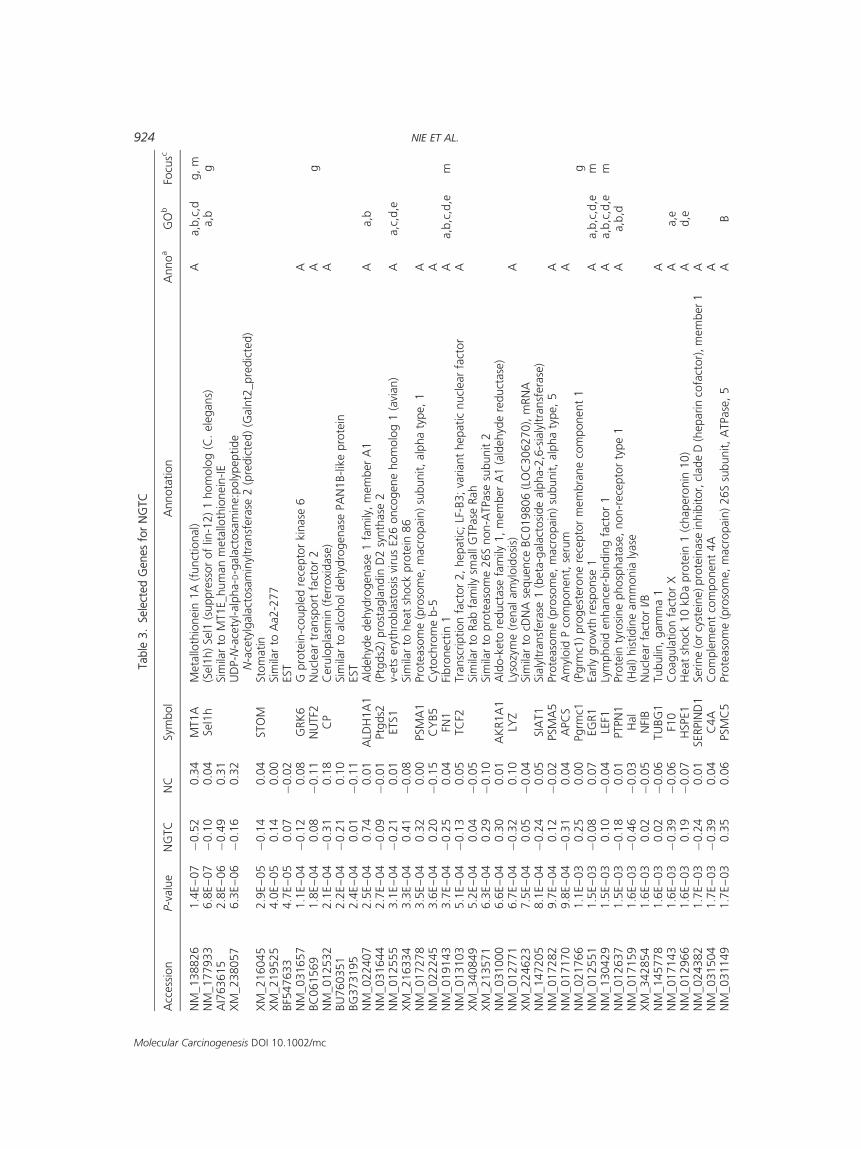
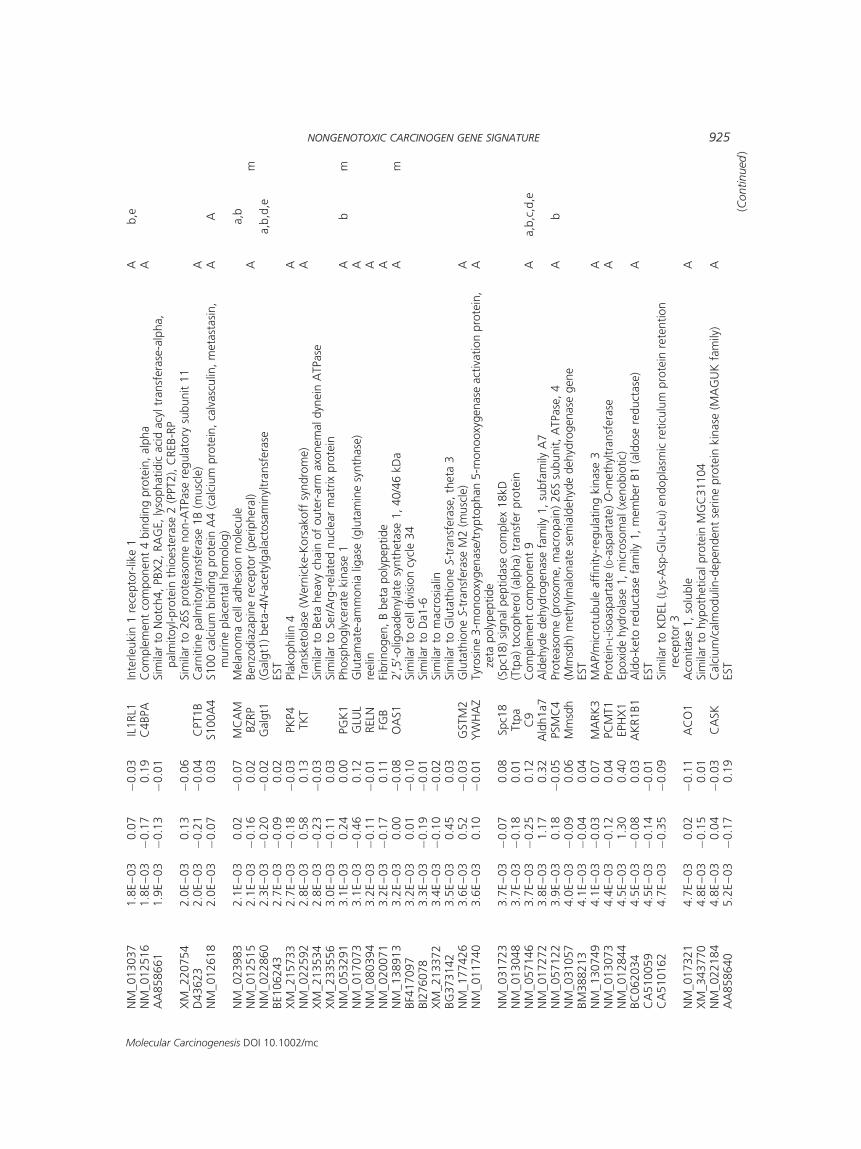
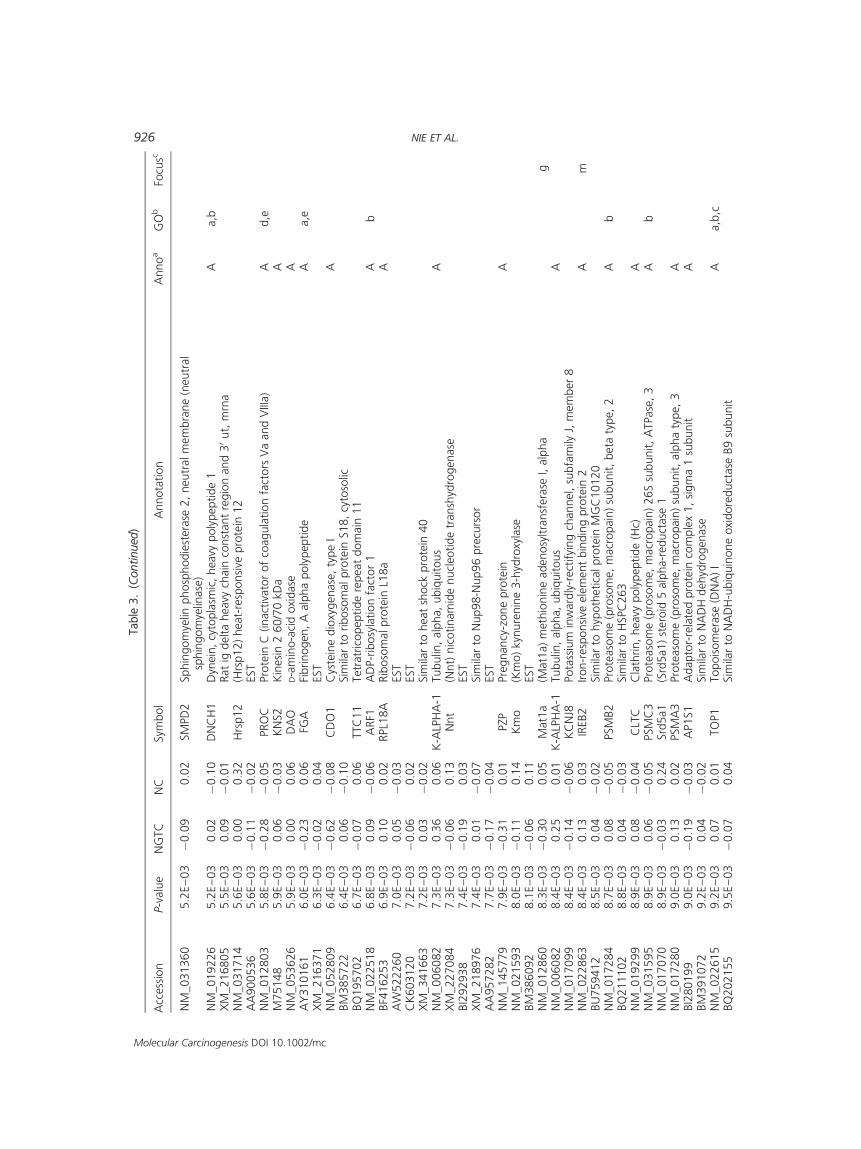
One hundred and twenty-five genes were signifi-cantly up- or downregulated (P-value <0.01) inNGTC treatments as compared to NC treatments,determined by Student’s t-test (Table 3). The accu-racy of the prediction with all differentially ex-pressed genes selected by this method was 77%,considerably lower than the more exhaustive genesearch carried out above. However, this largernumber of significantly differentially regulatedgenes was useful in determining which pathways
might be differentially regulated in early nongeno-toxic carcinogenesis. Out of the 125 genes, annota-tion could be found for 71 genes from Ingenuity’sPathways Knowledge Base upon which pathwayanalysis could be conducted. With Ingenuity’sannotation, 16of the 71geneswere related to cancer,19 tocellular growthandproliferation, 7 to cell cycle,10 to cell death, and 11 to immune and lymphaticsystem development and function (Table 3).With Ingenuity’s network-building tools, 62 of the
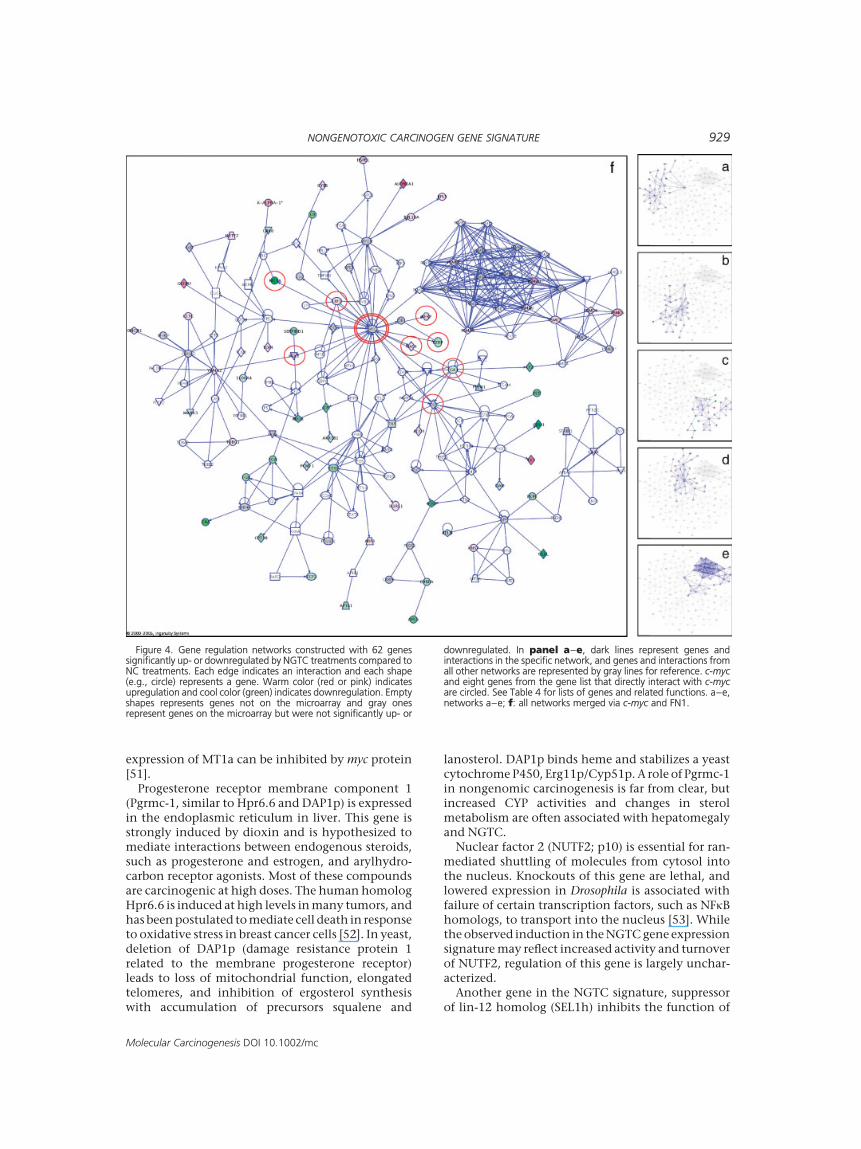
71 genes were incorporated into five networks(Figure 4, Table 4). Interestingly, theproto-oncogenec-myc was involved in four of the five networks eventhough c-myc itself was not differentially expressed.Eight genes showed direct interaction with c-myc,four of which were upregulated (phosphoglyceratekinase 1 (PGK1), iron responsive element bindingprotein 2 (IREB2), 20,50-oligoadenylate synthetase 1,40/46 kDa (OAS1), and lymphoid enhancer bindingfactor 1 (LEF-1)), and four were downregulated(Metallothionein 1 (MT1A), benzodiazapine recep-tor—peripheral (BZRP), fibronectin 1 (FN1), andearly growth response 1 (EGR1)) by NGTCs. Thesefive networks could then be integrated into a single
Rotenone 100 NC (2) TT ���Simvastatin 150 NGTC (1) TT þþþSodium orthovanadate 20 NRS (5) ���Streptozocin 140 DNA damager ���Sulfamethoxazole 2000 NGTC (3) OS TT þþþSulindac 400 NRS (5) þþþTacrine 50 DNA damager ���Tamoxifen 750 NGTC (1) þþþTannic Acid 3000 NC (2) OS TT ��Tetracycline 500 NC (2) �Tetracycline 600 NC (2) TT ���Thioacetamide 150 MA; DNA damager þþTransAnethole 600 NC (2) OS TT ���Troglitazone 100 NC (1) ���Troglitazone 500 NC (1) ��Valproic Acid 350 NGTC (1) þþþValproic Acid 500 NGTC (1) TT þþþVerapamil 75 NC (1) OS þþþWY-14643 100 NGTC; PP þþþ
Classifications were based on the following references:1 Snyder and Green, 2001 [14].2 L. S. Gold, The carcinogenic potency project, http://potency.berkeley.edu/cpdb.html, 2005.3 Chemical Carcinogenesis Research Information System (CCRIS), TOXNET, http://toxnet.nlm.nih.gov/cgi-bin/sis/htmlgen?CCRIS, 2005.4 Physician’s Desk Reference, 2003 [34].5 US EPA/Scorecard safety assessment, http://www.scorecard.org/chemical-profiles, 2005.aCompounds were classified in rodents (mouse where indicated, otherwise rat) as: noncarcinogen (NC), probable noncarcinogens (NC?;where no evidence for being a carcinogen), not a recognized or suspect carcinogen (NRS), nongenotoxic carcinogen (NGTC; whererodent carcinogen but lacking mutagenic or DNA damaging properties), DNA damager, macrophage activator (MA), peroxisomeproliferator (PP), and probable peroxisome proliferator (PP?) based on previous studies of these same RNA samples.bOS, treatment induces oxidative stress in rat liver.cTT, treatment in training/testing sets.dPredicted nongenotoxic carcinogenicity, see Materials and Methods (Section ‘‘Microarray Data Normalization’’) for description.
Table 1. (Continued)
Compound Dose (mpk) Literature OS TT Predicted
NONGENOTOXIC CARCINOGEN GENE SIGNATURE 921
Molecular Carcinogenesis DOI 10.1002/mc
Table
2.
Log2(r
atio)
of
the
Six
Genes
inth
eFi
nalSig
natu
refo
rall
Tra
inin
g/T
est
ing
Com
pounds
Com
pound
Dose
(mpk)
Cla
ss
CD
NA
mic
roarr
ay
CodeLi
nk
olig
och
ips
Mat1
aM
t1a
NU
TF2
Pgrm
c1Sel1
hU
dpgtr
2M
at1
aM
t1a
Nutf
2Pgrm
c1Sel1
hU
dpgpr2
NM
_012860
NM
_138826
BC
061569
NM
_021766
NM
_177933
NM
_173295
GE1268854
GE21633
GE1243390
GE20803
GE12572
GE21748
Asp
irin
600
NC
�0.1
0.6
70.0
60.0
1�
0.1
10.0
2�
0.2
1�
0.0
60.2
1�
0.0
5�
0.2
0�
0.2
1
Busp
irone
100
NC
0.0
5�
0.1
0.0
70.1
4�
0.0
50.5
8�
1.6
50.2
40.0
2�
0.4
20.0
0�
0.3
4
Capto
pril
5000
NC
0.5
40.5
5�
0.3
40.0
20.1
21.3
�0.4
20.1
0�
0.1
8�
0.0
91.0
61.1
8
Clo
zapin
e150
NC
�0.2
2�
0.6
8�
0.1
0.1
40.0
11.8
3�
0.8
70.1
80.0
71.0
41.0
33.6
6
Dexa
meth
aso
ne
75
NC
0.2
41.3
60.0
1�
0.0
80.0
10.8
23.1
40.0
50.0
11.3
40.5
23.0
4
Dic
lofe
nac
75
NC
�0.3
30.5
�0.1
6�
0.1
3�
0.0
9�
0.2
5�
2.0
00.0
5�
0.2
8�
1.0
10.9
1�
1.3
8
Dip
yrid
am
ole
5000
NC
�0.6
20.3
5�
0.1
30.0
20.2
41.0
4�
0.5
00.1
20.1
80.5
0�
0.1
62.4
0
Dis
ulfi
ram
2010
NC
�0.4
81.4
60.2
40.5
6�
0.0
31.2
80.0
00.1
70.5
11.0
3�
0.7
32.3
3
Fam
otidin
e500
NC
0.5
40.0
8�
0.7
70.0
50.0
40.0
7�
0.0
8�
0.0
5�
0.0
1�
0.3
5�
0.3
70.0
4
Fluoxe
tine
100
NC
0.8
0.6
20.0
3�
0.0
10.1
60.7
9�
0.5
10.1
2�
0.2
1�
0.3
30.8
71.5
9
Indom
eth
aci
n30
NC
0.0
20.5
5�
0.1
2�
0.2
0.0
8�
0.2
1�
0.3
7�
0.0
5�
0.2
6�
0.1
20.1
3�
0.7
4
Mebendazo
le40
NC
�0.4
9�
0.0
4�
0.2
1�
0.2
0.0
90.0
80.1
60.1
10.0
7�
0.3
70.4
90.7
6
Metf
orm
in750
NC
0.5
7�
0.4
8�
0.1
10.0
4�
0.0
30.1
32.0
50.0
00.0
70.8
8�
0.1
11.0
0
Meth
otr
exa
te300
NC
0.0
20.1
4�
0.1
40.0
30.0
40.0
3�
0.0
10.1
4�
0.2
2�
0.2
70.7
2�
0.9
9
Meth
yldopa
1000
NC
�0.1
1.0
7�
0.2
30.0
50.0
70.1
60.4
90.1
50.0
8�
0.2
30.4
80.6
8
Meto
pro
lol
2000
NC
0.1
60.1
6�
0.1
10.0
50.0
50.5
61.8
20.1
00.0
71.2
5�
0.3
5�
3.0
1
Myc
ophenolic
aci
d500
NC
�0.2
5�
0.3
2�
0.2
�0.0
90.0
10.1
20.1
20.1
9�
0.0
8�
0.1
20.9
90.4
2
Naltre
xone
1000
NC
�0.9
�0.3
9�
0.2
1�
0.1
60.1
0.9
1�
1.1
80.3
50.0
60.3
10.1
32.3
8
Nia
cin
5010
NC
0.4
90.2
4�
0.0
10.1
0.0
40.5
61.6
8�
0.2
2�
0.3
00.4
60.0
51.6
9
Niz
atidin
e1000
NC
0.1
0.0
7�
0.2
4�
0.2
20.1
80.1
2�
0.4
60.3
5�
0.0
6�
0.2
70.2
00.8
5
Perh
exi
lene
2010
NC
�0.0
80.8
80.0
50.0
70.0
40.2
40.7
60.2
6�
0.3
2�
0.0
8�
0.2
81.1
9
Phenyl
ephrine
5N
C�
0.1
10.1
30.1
4�
0.0
60.0
40.2
41.2
5�
0.0
3�
0.0
40.7
9�
0.3
8�
0.1
1
Ranitid
ine
1000
NC
0.6
10.3
5�
0.0
9�
0.5
�0.0
30.1
40.0
5�
0.0
5�
0.3
10.1
80.0
40.2
8
Retinol(v
itam
inA
)200
NC
0.5
0.2
�0.0
70.0
7�
0.0
4�
0.4
20.2
50.2
3�
0.1
8�
0.0
60.3
71.0
3
Rote
none
100
NC
�0.1
50.2
7�
0.0
7�
0.1
10.0
10.0
90.1
90.0
40.0
60.2
10.0
21.1
3
Tannic
Aci
d3000
NC
0.2
10.3
9�
0.2
4�
0.0
3�
0.1
10.3
9�
1.7
40.0
00.0
2�
1.6
6�
0.1
6�
4.1
3
Tetr
acy
clin
e600
NC
0.4
20.7
4�
0.0
2�
0.4
60.1
3�
0.1
40.5
8�
0.1
6�
0.2
60.3
10.5
8�
0.4
5
Tra
nsA
neth
ole
600
NC
�0.0
70.8
2�
0.1
40.8
70.1
20.8
2
Anili
ne
200
NG
TC
�0.3
2�
0.1
60.0
70.2
7�
0.0
30.9
8�
0.8
40.0
00.4
30.3
9�
0.4
31.6
5
Ate
nolo
l1500
NG
TC
0.0
20.3
0.0
10.3
6�
0.0
40.1
0.1
1�
0.0
30.0
90.2
00.3
8�
0.6
5
Bro
mocr
yptine
200
NG
TC
0.4
1�
1.1
9�
0.0
50.2
7�
0.0
70.3
30.6
0�
1.1
10.1
10.3
90.4
10.7
8
Buty
late
dhyd
roxy
tolu
ene
1000
NG
TC
�1.1
10.1
50.5
51.0
1�
0.1
2.7
4�
0.6
50.0
20.7
51.0
5�
0.6
42.8
0
Carb
am
aze
pin
e225
NG
TC
�0.9
6�
0.7
60.1
10.4
70.0
12.2
6�
1.3
80.0
00.7
70.8
50.0
62.6
8
Chlo
rpro
mazi
ne
150
NG
TC
�0.3
�0.2
30.1
80.4
7�
0.0
91.4
5�
1.7
9�
0.1
8�
0.0
7�
0.5
60.6
21.2
4
Cyp
rote
rone
Ace
tate
200
NG
TC
�0.5
6�
1.1
40.1
70.0
6�
0.0
91.1
7�
0.0
2�
0.1
10.1
50.3
50.0
01.6
7
Dantr
ole
ne
500
NG
TC
0.6
3�
0.0
80.0
10.1
5�
0.1
70.2
2�
0.9
9�
0.0
50.2
10.6
1�
0.3
10.4
1
Dapso
ne
50
NG
TC
0.3
�0.6
20
0.0
7�
0.2
20.1
90.5
00.0
90.4
90.7
8�
0.8
91.0
7
Die
ldrin
45
NG
TC
�0.0
1�
1.0
50.1
30.2
40.0
52.0
9�
0.2
7�
0.0
8�
0.1
40.6
70.3
22.8
3
Felb
am
ate
2100
NG
TC
�0.3
6�
0.4
70.0
10.6
2�
0.0
52.5
4�
0.3
9�
0.0
10.4
10.8
7�
0.2
62.8
5
Furo
sem
ide
1500
NG
TC
�0.2
1�
1.1
8�
0.0
90.0
7�
0.2
50.3
30.2
2�
0.1
70.1
60.1
2�
0.3
30.9
0
Gabapentin
2160
NG
TC
�1.5
4�
0.4
30.3
40.2
40.0
10.4
1�
2.3
6�
0.1
80.2
7�
0.1
9�
1.0
9�
0.1
4
922 NIE ET AL.
Molecular Carcinogenesis DOI 10.1002/mc
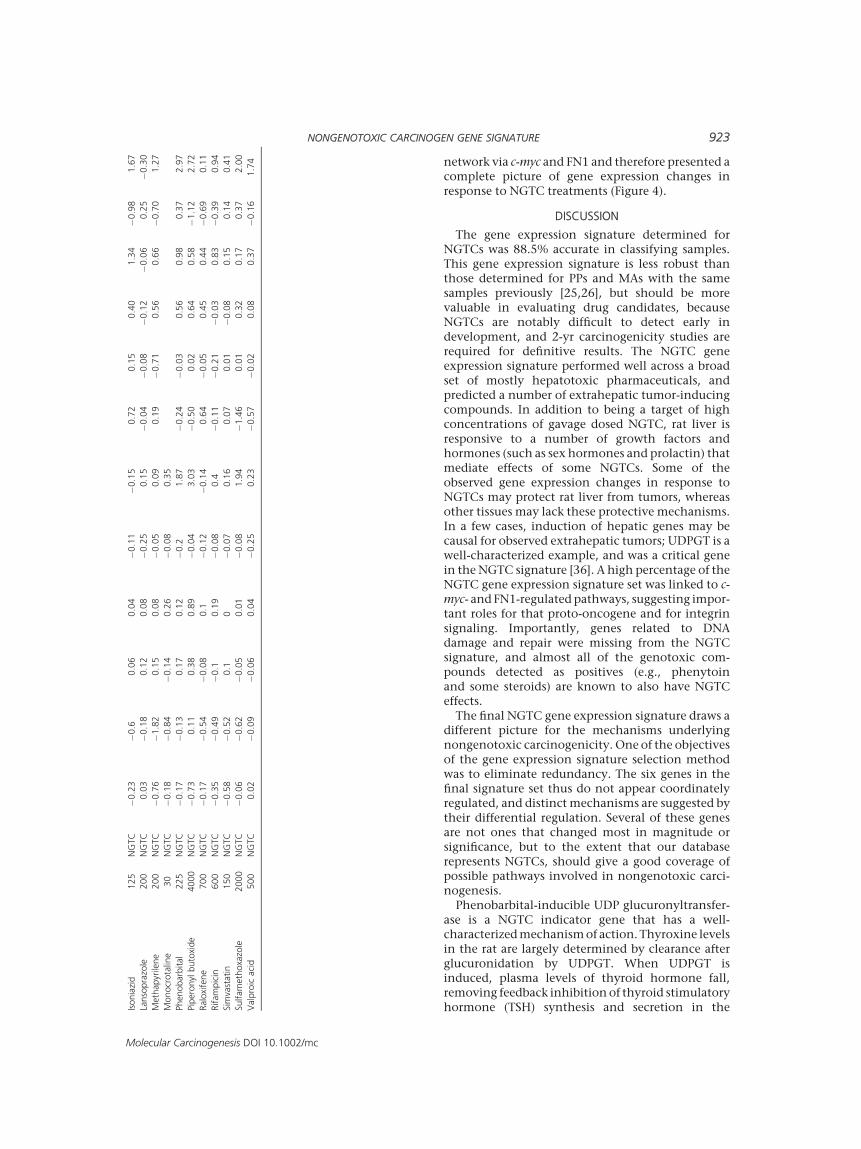
network via c-myc and FN1 and therefore presented acomplete picture of gene expression changes inresponse to NGTC treatments (Figure 4).
DISCUSSION
The gene expression signature determined forNGTCs was 88.5% accurate in classifying samples.This gene expression signature is less robust thanthose determined for PPs and MAs with the samesamples previously [25,26], but should be morevaluable in evaluating drug candidates, becauseNGTCs are notably difficult to detect early indevelopment, and 2-yr carcinogenicity studies arerequired for definitive results. The NGTC geneexpression signature performed well across a broadset of mostly hepatotoxic pharmaceuticals, andpredicted a number of extrahepatic tumor-inducingcompounds. In addition to being a target of highconcentrations of gavage dosed NGTC, rat liver isresponsive to a number of growth factors andhormones (such as sex hormones and prolactin) thatmediate effects of some NGTCs. Some of theobserved gene expression changes in response toNGTCs may protect rat liver from tumors, whereasother tissues may lack these protective mechanisms.In a few cases, induction of hepatic genes may becausal for observed extrahepatic tumors; UDPGT is awell-characterized example, and was a critical genein theNGTC signature [36]. A high percentage of theNGTC gene expression signature set was linked to c-myc- andFN1-regulatedpathways, suggesting impor-tant roles for that proto-oncogene and for integrinsignaling. Importantly, genes related to DNAdamage and repair were missing from the NGTCsignature, and almost all of the genotoxic com-pounds detected as positives (e.g., phenytoinand some steroids) are known to also have NGTCeffects.The final NGTC gene expression signature draws a
different picture for the mechanisms underlyingnongenotoxic carcinogenicity. One of the objectivesof the gene expression signature selection methodwas to eliminate redundancy. The six genes in thefinal signature set thus do not appear coordinatelyregulated, and distinct mechanisms are suggested bytheir differential regulation. Several of these genesare not ones that changed most in magnitude orsignificance, but to the extent that our databaserepresents NGTCs, should give a good coverage ofpossible pathways involved in nongenotoxic carci-nogenesis.Phenobarbital-inducible UDP glucuronyltransfer-
ase is a NGTC indicator gene that has a well-characterizedmechanismof action.Thyroxine levelsin the rat are largely determined by clearance afterglucuronidation by UDPGT. When UDPGT isinduced, plasma levels of thyroid hormone fall,removing feedback inhibition of thyroid stimulatoryhormone (TSH) synthesis and secretion in theIs
onia
zid
125
NG
TC
�0.2
3�
0.6
0.0
60.0
4�
0.1
1�
0.1
50.7
20.1
50.4
01.3
4�
0.9
81.6
7
Lanso
pra
zole
200
NG
TC
0.0
3�
0.1
80.1
20.0
8�
0.2
50.1
5�
0.0
4�
0.0
8�
0.1
2�
0.0
60.2
5�
0.3
0
Meth
apyr
ilene
200
NG
TC
�0.7
6�
1.8
20.1
50.0
8�
0.0
50.0
90.1
9�
0.7
10.5
60.6
6�
0.7
01.2
7
Monocr
ota
line
30
NG
TC
�0.1
8�
0.8
4�
0.1
40.2
6�
0.0
80.3
5
Phenobarb
ital
225
NG
TC
�0.1
7�
0.1
30.1
70.1
2�
0.2
1.8
7�
0.2
4�
0.0
30.5
60.9
80.3
72.9
7
Pip
ero
nyl
buto
xide
4000
NG
TC
�0.7
30.1
10.3
80.8
9�
0.0
43.0
3�
0.5
00.0
20.6
40.5
8�
1.1
22.7
2
Ralo
xife
ne
700
NG
TC
�0.1
7�
0.5
4�
0.0
80.1
�0.1
2�
0.1
40.6
4�
0.0
50.4
50.4
4�
0.6
90.1
1
Rifam
pic
in600
NG
TC
�0.3
5�
0.4
9�
0.1
0.1
9�
0.0
80.4
�0.1
1�
0.2
1�
0.0
30.8
3�
0.3
90.9
4
Sim
vast
atin
150
NG
TC
�0.5
8�
0.5
20.1
0�
0.0
70.1
60.0
70.0
1�
0.0
80.1
50.1
40.4
1
Sulfam
eth
oxa
zole
2000
NG
TC
�0.0
6�
0.6
2�
0.0
50.0
1�
0.0
81.9
4�
1.4
60.0
10.3
20.1
70.3
72.0
0
Valp
roic
aci
d500
NG
TC
0.0
2�
0.0
9�
0.0
60.0
4�
0.2
50.2
3�
0.5
7�
0.0
20.0
80.3
7�
0.1
61.7
4
NONGENOTOXIC CARCINOGEN GENE SIGNATURE 923
Molecular Carcinogenesis DOI 10.1002/mc
Table
3.
Sele
cted
Genes
for
NG
TC
Acc
ess
ion
P-v
alu
eN
GTC
NC
Sym
bol
Annota
tion
Anno
aG
Ob
Focu
sc
NM
_138826
1.4
E–
07
�0.5
20.3
4M
T1A
Meta
lloth
ionein
1A
(funct
ional)
Aa,b
,c,d
g,
mN
M_177933
6.8
E–
07
�0.1
00.0
4Sel1
h(S
el1
h)
Sel1
(suppre
ssor
of
lin-1
2)
1hom
olo
g(C
.ele
gans)
a,b
gA
I763615
2.8
E–
06
�0.4
90.3
1Sim
ilar
toM
T1E_hum
an
meta
lloth
ionein
-IE
XM
_238057
6.3
E–
06
�0.1
60.3
2U
DP-N
-ace
tyl-alp
ha- D
-gala
ctosa
min
e:p
oly
peptide
N-a
cety
lgala
ctosa
min
yltr
ansf
era
se2
(pre
dic
ted)
(Galn
t2_pre
dic
ted)
XM
_216045
2.9
E–
05
�0.1
40.0
4STO
MSto
matin
XM
_219525
4.0
E–
05
0.1
40.0
0Sim
ilar
toA
a2-2
77
BF5
47633
4.7
E–
05
0.0
7�
0.0
2EST
NM
_031657
1.1
E–
04
�0.1
20.0
8G
RK
6G
pro
tein
-couple
dre
cepto
rkin
ase
6A
BC
061569
1.8
E–
04
0.0
8�
0.1
1N
UTF2
Nucl
ear
transp
ort
fact
or
2A
gN
M_012532
2.1
E–
04
�0.3
10.1
8C
PC
eru
lopla
smin
(ferr
oxi
dase
)A
BU
760351
2.2
E–
04
�0.2
10.1
0Sim
ilar
toalc
oholdehyd
rogenase
PA
N1B-lik
epro
tein
BG
373195
2.4
E–
04
0.0
1�
0.1
1EST
NM
_022407
2.5
E–
04
0.7
40.0
1A
LDH
1A
1A
ldehyd
edehyd
rogenase
1fa
mily
,m
em
ber
A1
Aa,b
NM
_031644
2.7
E–
04
�0.0
9�
0.0
1Ptg
ds2
(Ptg
ds2
)pro
stagla
ndin
D2
synth
ase
2N
M_012555
3.1
E–
04
�0.2
10.0
1ETS1
v-ets
ery
thro
bla
stosi
svi
rus
E26
onco
gene
hom
olo
g1
(avi
an)
Aa,c
,d,e
XM
_216334
3.3
E–
04
0.4
1�
0.0
8Sim
ilar
toheat
shock
pro
tein
86
NM
_017278
3.5
E–
04
0.3
20.0
0PSM
A1
Pro
teaso
me
(pro
som
e,
macr
opain
)su
bunit,
alp
ha
type,
1A
NM
_022245
3.6
E–
04
0.2
0�
0.1
5C
YB5
Cyt
och
rom
eb-5
AN
M_019143
3.7
E–
04
�0.2
50.0
4FN
1Fi
bro
nect
in1
Aa,b
,c,d
,em
NM
_013103
5.1
E–
04
�0.1
30.0
5TC
F2Tra
nsc
ription
fact
or
2,
hepatic;
LF-B
3;
variant
hepatic
nucl
ear
fact
or
AX
M_340849
5.2
E–
04
0.0
4�
0.0
5Sim
ilar
toRab
fam
ilysm
all
GTPase
Rah
XM
_213571
6.3
E–
04
0.2
9�
0.1
0Sim
ilar
topro
teaso
me
26S
non-A
TPase
subunit
2N
M_031000
6.6
E–
04
0.3
00.0
1A
KR1A
1A
ldo-k
eto
reduct
ase
fam
ily1,
mem
ber
A1
(ald
ehyd
ere
duct
ase
)N
M_012771
6.7
E–
04
�0.3
20.1
0LY
ZLy
sozy
me
(renalam
yloid
osi
s)A
XM
_224623
7.5
E–
04
0.0
5�
0.0
4Sim
ilar
tocD
NA
sequence
BC
019806
(LO
C306270),
mRN
AN
M_147205
8.1
E–
04
�0.2
40.0
5SIA
T1
Sia
lyltra
nsf
era
se1
(beta
-gala
ctosi
de
alp
ha-2
,6-s
ialy
ltra
nsf
era
se)
NM
_017282
9.7
E–
04
0.1
2�
0.0
2PSM
A5
Pro
teaso
me
(pro
som
e,
macr
opain
)su
bunit,
alp
ha
type,
5A
NM
_017170
9.8
E–
04
�0.3
10.0
4A
PC
SA
myl
oid
Pco
mponent,
seru
mA
NM
_021766
1.1
E–
03
0.2
50.0
0Pgrm
c1(P
grm
c1)
pro
gest
ero
ne
rece
pto
rm
em
bra
ne
com
ponent
1g
NM
_012551
1.5
E–
03
�0.0
80.0
7EG
R1
Early
gro
wth
resp
onse
1A
a,b
,c,d
,em
NM
_130429
1.5
E–
03
0.1
0�
0.0
4LE
F1Ly
mphoid
enhance
r-bin
din
gfa
ctor
1A
a,b
,c,d
,em
NM
_012637
1.5
E–
03
�0.1
80.0
1PTPN
1Pro
tein
tyro
sine
phosp
hata
se,
non-r
ece
pto
rty
pe
1A
a,b
,dN
M_017159
1.6
E–
03
�0.4
6�
0.0
3H
al
(Hal)
his
tidin
eam
monia
lyase
XM
_342854
1.6
E–
03
0.0
2�
0.0
5N
FIB
Nucl
ear
fact
or
I/B
NM
_145778
1.6
E–
03
0.0
2�
0.0
6TU
BG
1Tubulin
,gam
ma
1A
NM
_017143
1.6
E–
03
�0.3
9�
0.0
6F1
0C
oagula
tion
fact
or
XA
a,e
NM
_012966
1.6
E–
03
0.1
9�
0.0
7H
SPE1
Heat
shock
10
kD
apro
tein
1(c
hapero
nin
10)
Ad,e
NM
_024382
1.7
E–
03
�0.2
40.0
1SERPIN
D1
Serine
(or
cyst
ein
e)pro
tein
ase
inhib
itor,
clade
D(h
eparin
cofa
ctor)
,m
em
ber
1A
NM
_031504
1.7
E–
03
�0.3
90.0
4C
4A
Com
ple
ment
com
ponent
4A
AN
M_031149
1.7
E–
03
0.3
50.0
6PSM
C5
Pro
teaso
me
(pro
som
e,
macr
opain
)26S
subunit,
ATPase
,5
AB
924 NIE ET AL.
Molecular Carcinogenesis DOI 10.1002/mc
NM
_013037
1.8
E–
03
0.0
7�
0.0
3IL
1RL1
Inte
rleukin
1re
cepto
r-lik
e1
Ab,e
NM
_012516
1.8
E–
03
�0.1
70.1
9C
4BPA
Com
ple
ment
com
ponent
4bin
din
gpro
tein
,alp
ha
AA
A858661
1.9
E–
03
�0.1
3�
0.0
1Sim
ilar
toN
otc
h4,
PBX
2,
RA
GE,
lyso
phatidic
aci
dacy
ltr
ansf
era
se-a
lpha,
palm
itoyl
-pro
tein
thio
est
era
se2
(PPT2),
CREB-R
PX
M_220754
2.0
E–
03
0.1
3�
0.0
6Sim
ilar
to26S
pro
teaso
me
non-A
TPase
regula
tory
subunit
11
D43623
2.0
E–
03
�0.2
1�
0.0
4C
PT1B
Carn
itin
epalm
itoyl
transf
era
se1B
(musc
le)
AN
M_012618
2.0
E–
03
�0.0
70.0
3S100A
4S100
calc
ium
bin
din
gpro
tein
A4
(calc
ium
pro
tein
,ca
lvasc
ulin
,m
eta
stasi
n,
murine
pla
centa
lhom
olo
g)
AA
NM
_023983
2.1
E–
03
0.0
2�
0.0
7M
CA
MM
ela
nom
ace
lladhesi
on
mole
cule
a,b
NM
_012515
2.1
E–
03
�0.1
60.0
2BZRP
Benzo
dia
zapin
ere
cepto
r(p
eriphera
l)A
mN
M_022860
2.3
E–
03
�0.2
0�
0.0
2G
alg
t1(G
alg
t1)
beta
-4N
-ace
tylg
ala
ctosa
min
yltr
ansf
era
sea,b
,d,e
BE106243
2.7
E–
03
�0.0
90.0
2EST
XM
_215733
2.7
E–
03
�0.1
8�
0.0
3PK
P4
Pla
kophili
n4
AN
M_022592
2.8
E–
03
0.5
80.1
3TK
TTra
nsk
eto
lase
(Wern
icke-K
ors
akoff
syndro
me)
AX
M_213534
2.8
E–
03
�0.2
3�
0.0
3Sim
ilar
toBeta
heavy
chain
of
oute
r-arm
axo
nem
aldyn
ein
ATPase
XM
_233556
3.0
E–
03
�0.1
10.0
3Sim
ilar
toSer/
Arg
-rela
ted
nucl
ear
matr
ixpro
tein
NM
_053291
3.1
E–
03
0.2
40.0
0PG
K1
Phosp
hogly
cera
tekin
ase
1A
bm
NM
_017073
3.1
E–
03
�0.4
60.1
2G
LUL
Glu
tam
ate
-am
monia
ligase
(glu
tam
ine
synth
ase
)A
NM
_080394
3.2
E–
03
�0.1
1�
0.0
1RELN
reelin
AN
M_020071
3.2
E–
03
�0.1
70.1
1FG
BFi
brinogen,
Bbeta
poly
peptide
AN
M_138913
3.2
E–
03
0.0
0�
0.0
8O
AS1
20 ,50 -
olig
oadenyl
ate
synth
eta
se1,
40/4
6kD
aA
mBF4
17097
3.2
E–
03
0.0
1�
0.1
0Sim
ilar
toce
lldiv
isio
ncy
cle
34
BI2
76078
3.3
E–
03
�0.1
9�
0.0
1Sim
ilar
toD
a1-6
XM
_213372
3.4
E–
03
�0.1
0�
0.0
2Sim
ilar
tom
acr
osi
alin
BG
373142
3.5
E–
03
0.4
50.0
3Sim
ilar
toG
luta
thio
neS-t
ransf
era
se,
theta
3N
M_177426
3.6
E–
03
0.5
2�
0.0
3G
STM
2G
luta
thio
neS-t
ransf
era
seM
2(m
usc
le)
AN
M_011740
3.6
E–
03
0.1
0�
0.0
1Y
WH
AZ
Tyr
osi
ne
3-m
onooxy
genase
/try
pto
phan
5-m
onooxy
genase
act
ivation
pro
tein
,ze
tapoly
peptide
A
NM
_031723
3.7
E–
03
�0.0
70.0
8Spc1
8(S
pc1
8)
signalpeptidase
com
ple
x18kD
NM
_013048
3.7
E–
03
�0.1
80.0
1Ttp
a(T
tpa)
toco
phero
l(a
lpha)
transf
er
pro
tein
NM
_057146
3.7
E–
03
�0.2
50.1
2C
9C
om
ple
ment
com
ponent
9A
a,b
,c,d
,eN
M_017272
3.8
E–
03
1.1
70.3
2A
ldh1a7
Ald
ehyd
edehyd
rogenase
fam
ily1,
subfa
mily
A7
NM
_057122
3.9
E–
03
0.1
8�
0.0
5PSM
C4
Pro
teaso
me
(pro
som
e,
macr
opain
)26S
subunit,
ATPase
,4
Ab
NM
_031057
4.0
E–
03
�0.0
90.0
6M
msd
h(M
msd
h)
meth
ylm
alo
nate
sem
iald
ehyd
edehyd
rogenase
gene
BM
388213
4.1
E–
03
�0.0
40.0
4EST
NM
_130749
4.1
E–
03
�0.0
30.0
7M
ARK
3M
AP/m
icro
tubule
affi
nity-
regula
ting
kin
ase
3A
NM
_013073
4.4
E–
03
�0.1
20.0
4PC
MT1
Pro
tein
- L-iso
asp
art
ate
(D-a
spart
ate
)O
-meth
yltr
ansf
era
seA
NM
_012844
4.5
E–
03
1.3
00.4
0EPH
X1
Epoxi
de
hyd
rola
se1,
mic
roso
mal(x
enobio
tic)
BC
062034
4.5
E–
03
�0.0
80.0
3A
KR1B1
Ald
o-k
eto
reduct
ase
fam
ily1,
mem
ber
B1
(ald
ose
reduct
ase
)A
CA
510059
4.5
E–
03
�0.1
4�
0.0
1EST
CA
510162
4.7
E–
03
�0.3
5�
0.0
9Sim
ilar
toK
DEL
(Lys
-Asp
-Glu
-Leu)
endopla
smic
reticu
lum
pro
tein
rete
ntion
rece
pto
r3
NM
_017321
4.7
E–
03
0.0
2�
0.1
1A
CO
1A
conitase
1,
solu
ble
AX
M_343770
4.8
E–
03
�0.1
50.0
1Sim
ilar
tohyp
oth
etica
lpro
tein
MG
C31104
NM
_022184
4.8
E–
03
0.0
4�
0.0
3C
ASK
Calc
ium
/calm
odulin
-dependent
serine
pro
tein
kin
ase
(MA
GU
Kfa
mily
)A
AA
858640
5.2
E–
03
�0.1
70.1
9EST
(Continued
)
NONGENOTOXIC CARCINOGEN GENE SIGNATURE 925
Molecular Carcinogenesis DOI 10.1002/mc
NM
_031360
5.2
E–
03
�0.0
90.0
2SM
PD
2Sphin
gom
yelin
phosp
hodie
stera
se2,
neutr
alm
em
bra
ne
(neutr
al
sphin
gom
yelin
ase
)N
M_019226
5.2
E–
03
0.0
2�
0.1
0D
NC
H1
Dyn
ein
,cy
topla
smic
,heavy
poly
peptide
1A
a,b
XM
_216805
5.5
E–
03
0.0
9�
0.0
1Rat
igdelta
heavy
chain
const
ant
regio
nand
30ut,
mrn
aN
M_031714
5.6
E–
03
0.0
00.3
2H
rsp12
(Hrs
p12)
heat-
resp
onsi
vepro
tein
12
AA
900536
5.6
E–
03
�0.1
1�
0.0
2EST
NM
_012803
5.8
E–
03
�0.2
8�
0.0
5PRO
CPro
tein
C(inact
ivato
rof
coagula
tion
fact
ors
Va
and
VIII
a)
Ad,e
M75148
5.9
E–
03
0.0
6�
0.0
3K
NS2
Kin
esi
n2
60/7
0kD
aA
NM
_053626
5.9
E–
03
0.0
00.0
6D
AO
D-a
min
o-a
cid
oxi
dase
AA
Y310161
6.0
E–
03
�0.2
30.0
6FG
AFi
brinogen,
Aalp
ha
poly
peptide
Aa,e
XM
_216371
6.3
E–
03
�0.0
20.0
4EST
NM
_052809
6.4
E–
03
�0.6
2�
0.0
8C
DO
1C
yste
ine
dio
xygenase
,ty
pe
IA
BM
385722
6.4
E–
03
0.0
6�
0.1
0Sim
ilar
toriboso
malpro
tein
S18,
cyto
solic
BQ
195702
6.7
E–
03
�0.0
70.0
6TTC
11
Tetr
atr
icopeptide
repeat
dom
ain
11
NM
_022518
6.8
E–
03
0.0
9�
0.0
6A
RF1
AD
P-r
ibosy
lation
fact
or
1A
bBF4
16253
6.9
E–
03
0.1
00.0
2RPL1
8A
Rib
oso
malpro
tein
L18a
AA
W522260
7.0
E–
03
0.0
5�
0.0
3EST
CK
603120
7.2
E–
03
�0.0
60.0
2EST
XM
_341663
7.2
E–
03
0.0
3�
0.0
2Sim
ilar
toheat
shock
pro
tein
40
NM
_006082
7.3
E–
03
0.3
60.0
6K
-ALP
HA
-1Tubulin
,alp
ha,
ubiq
uitous
AX
M_227084
7.3
E–
03
�0.0
60.1
3N
nt
(Nnt)
nic
otinam
ide
nucl
eotide
transh
ydro
genase
BI2
92938
7.4
E–
03
�0.1
90.0
3EST
XM
_218976
7.4
E–
03
0.0
1�
0.0
7Sim
ilar
toN
up98-N
up96
pre
curs
or
AA
957282
7.7
E–
03
�0.1
7�
0.0
4EST
NM
_145779
7.9
E–
03
�0.3
10.0
1PZP
Pre
gnancy
-zone
pro
tein
AN
M_021593
8.0
E–
03
�0.1
10.1
4K
mo
(Km
o)
kyn
ure
nin
e3-h
ydro
xyla
seBM
386092
8.1
E–
03
�0.0
60.1
1EST
NM
_012860
8.3
E–
03
�0.3
00.0
5M
at1
a(M
at1
a)
meth
ionin
eadenosy
ltra
nsf
era
seI,
alp
ha
gN
M_006082
8.4
E–
03
0.2
50.0
1K
-ALP
HA
-1Tubulin
,alp
ha,
ubiq
uitous
AN
M_017099
8.4
E–
03
�0.1
4�
0.0
6K
CN
J8Pota
ssiu
min
ward
ly-r
ect
ifyi
ng
channel,
subfa
mily
J,m
em
ber
8N
M_022863
8.4
E–
03
0.1
30.0
3IR
EB2
Iron-r
esp
onsi
veele
ment
bin
din
gpro
tein
2A
mBU
759412
8.5
E–
03
0.0
4�
0.0
2Sim
ilar
tohyp
oth
etica
lpro
tein
MG
C10120
NM
_017284
8.7
E–
03
0.0
8�
0.0
5PSM
B2
Pro
teaso
me
(pro
som
e,
macr
opain
)su
bunit,
beta
type,
2A
bBQ
211102
8.8
E–
03
0.0
4�
0.0
3Sim
ilar
toH
SPC
263
NM
_019299
8.9
E–
03
0.0
8�
0.0
4C
LTC
Cla
thrin,
heavy
poly
peptide
(Hc)
AN
M_031595
8.9
E–
03
0.0
6�
0.0
5PSM
C3
Pro
teaso
me
(pro
som
e,
macr
opain
)26S
subunit,
ATPase
,3
Ab
NM
_017070
8.9
E–
03
�0.0
30.2
4Srd
5a1
(Srd
5a1)
stero
id5
alp
ha-r
educt
ase
1N
M_017280
9.0
E–
03
0.1
30.0
2PSM
A3
Pro
teaso
me
(pro
som
e,
macr
opain
)su
bunit,
alp
ha
type,
3A
BI2
80199
9.0
E–
03
�0.1
9�
0.0
3A
P1S1
Adapto
r-re
late
dpro
tein
com
ple
x1,
sigm
a1
subunit
ABM
391072
9.2
E–
03
0.0
4�
0.0
2Sim
ilar
toN
AD
Hdehyd
rogenase
NM
_022615
9.2
E–
03
0.0
70.0
1TO
P1
Topois
om
era
se(D
NA
)I
Aa,b
,cBQ
202155
9.5
E–
03
�0.0
70.0
4Sim
ilar
toN
AD
H-u
biq
uin
one
oxi
dore
duct
ase
B9
subunit
Table
3.
(Continued)
Acc
ess
ion
P-v
alu
eN
GTC
NC
Sym
bol
Annota
tion
Anno
aG
Ob
Focu
sc
926 NIE ET AL.
Molecular Carcinogenesis DOI 10.1002/mc
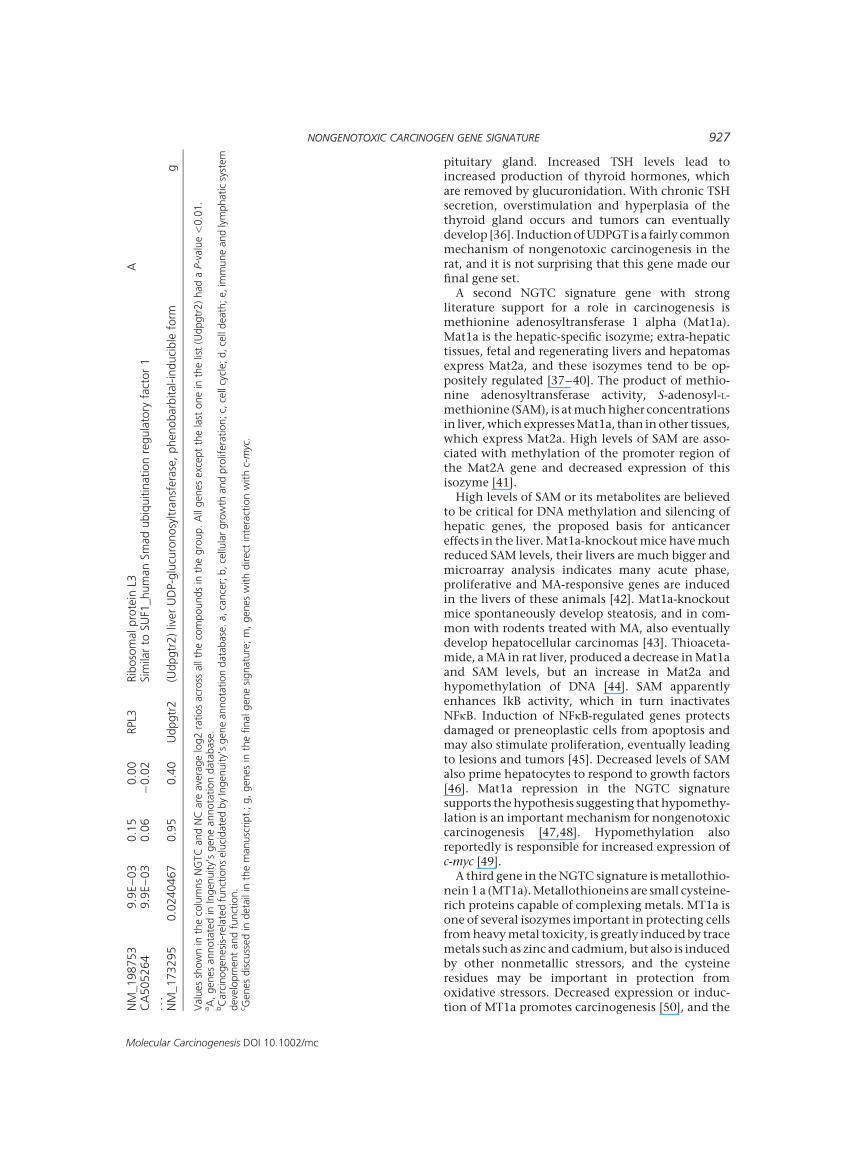
pituitary gland. Increased TSH levels lead toincreased production of thyroid hormones, whichare removed by glucuronidation. With chronic TSHsecretion, overstimulation and hyperplasia of thethyroid gland occurs and tumors can eventuallydevelop [36]. InductionofUDPGT is a fairly commonmechanism of nongenotoxic carcinogenesis in therat, and it is not surprising that this gene made ourfinal gene set.A second NGTC signature gene with strong
literature support for a role in carcinogenesis ismethionine adenosyltransferase 1 alpha (Mat1a).Mat1a is the hepatic-specific isozyme; extra-hepatictissues, fetal and regenerating livers and hepatomasexpress Mat2a, and these isozymes tend to be op-positely regulated [37–40]. The product of methio-nine adenosyltransferase activity, S-adenosyl-L-methionine (SAM), is atmuchhigher concentrationsin liver,which expressesMat1a, than inother tissues,which express Mat2a. High levels of SAM are asso-ciated with methylation of the promoter region ofthe Mat2A gene and decreased expression of thisisozyme [41].High levels of SAM or its metabolites are believed
to be critical for DNA methylation and silencing ofhepatic genes, the proposed basis for anticancereffects in the liver.Mat1a-knockoutmice havemuchreduced SAM levels, their livers are much bigger andmicroarray analysis indicates many acute phase,proliferative and MA-responsive genes are inducedin the livers of these animals [42]. Mat1a-knockoutmice spontaneously develop steatosis, and in com-mon with rodents treated with MA, also eventuallydevelop hepatocellular carcinomas [43]. Thioaceta-mide, aMA in rat liver, produced a decrease inMat1aand SAM levels, but an increase in Mat2a andhypomethylation of DNA [44]. SAM apparentlyenhances IkB activity, which in turn inactivatesNFkB. Induction of NFkB-regulated genes protectsdamaged or preneoplastic cells from apoptosis andmay also stimulate proliferation, eventually leadingto lesions and tumors [45]. Decreased levels of SAMalso prime hepatocytes to respond to growth factors[46]. Mat1a repression in the NGTC signaturesupports thehypothesis suggesting that hypomethy-lation is an important mechanism for nongenotoxiccarcinogenesis [47,48]. Hypomethylation alsoreportedly is responsible for increased expression ofc-myc [49].A third gene in theNGTC signature ismetallothio-
nein1 a (MT1a).Metallothioneins are small cysteine-rich proteins capable of complexing metals. MT1a isone of several isozymes important in protecting cellsfromheavymetal toxicity, is greatly induced by tracemetals such as zinc and cadmium, but also is inducedby other nonmetallic stressors, and the cysteineresidues may be important in protection fromoxidative stressors. Decreased expression or induc-tion of MT1a promotes carcinogenesis [50], and theN
M_198753
9.9
E–
03
0.1
50.0
0RPL3
Rib
oso
malpro
tein
L3A
CA
505264
9.9
E–
03
0.0
6�
0.0
2Sim
ilar
toSU
F1_hum
an
Sm
ad
ubiq
uitin
ation
regula
tory
fact
or
1...
NM
_173295
0.0
240467
0.9
50.4
0U
dpgtr
2(U
dpgtr
2)
liver
UD
P-g
lucu
ronosy
ltra
nsf
era
se,
phenobarb
ital-in
duci
ble
form
g
Valu
es
show
nin
the
colu
mns
NG
TC
and
NC
are
ave
rage
log2
ratios
acr
oss
all
the
com
pounds
inth
egro
up.
All
genes
exc
ept
the
last
one
inth
elis
t(U
dpgtr
2)
had
aP-v
alu
e<
0.0
1.
aA
,genes
annota
ted
inIn
genuity’
sgene
annota
tion
data
base
.bC
arc
inogenesi
s-re
late
dfu
nct
ions
elu
cidate
dby
Ingenuity’
sgene
annota
tion
data
base
.a,ca
nce
r;b,ce
llula
rgro
wth
and
pro
lifera
tion;c,
cell
cycl
e;d,ce
lldeath
;e,im
mune
and
lym
phatic
syst
em
deve
lopm
ent
and
funct
ion.
cG
enes
dis
cuss
ed
indeta
ilin
the
manusc
ript.
;g,
genes
inth
efinalgene
signatu
re;
m,
genes
with
direct
inte
ract
ion
withc-myc
.
NONGENOTOXIC CARCINOGEN GENE SIGNATURE 927
Molecular Carcinogenesis DOI 10.1002/mc
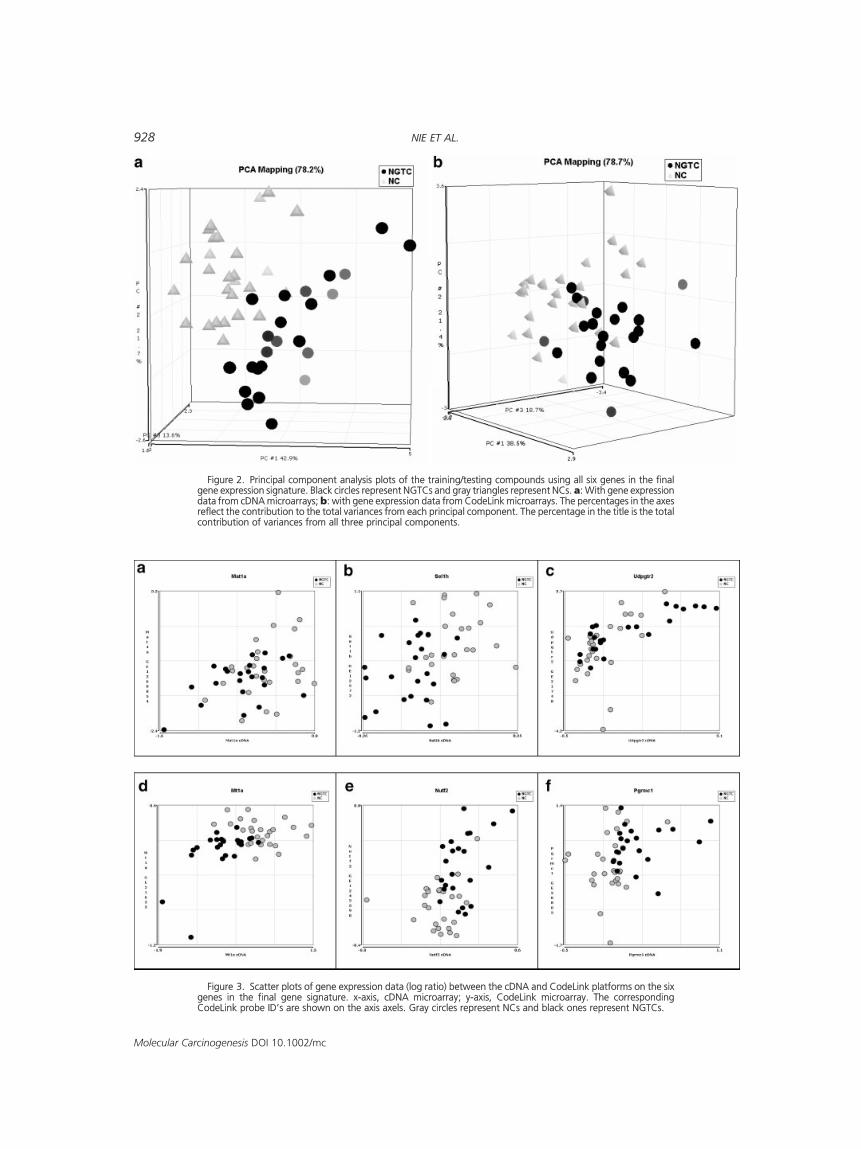
Figure 2. Principal component analysis plots of the training/testing compounds using all six genes in the finalgene expression signature. Black circles represent NGTCs and gray triangles represent NCs. a: With gene expressiondata from cDNA microarrays; b: with gene expression data from CodeLink microarrays. The percentages in the axesreflect the contribution to the total variances from each principal component. The percentage in the title is the totalcontribution of variances from all three principal components.
Figure 3. Scatter plots of gene expression data (log ratio) between the cDNA and CodeLink platforms on the sixgenes in the final gene signature. x-axis, cDNA microarray; y-axis, CodeLink microarray. The correspondingCodeLink probe ID’s are shown on the axis axels. Gray circles represent NCs and black ones represent NGTCs.
928 NIE ET AL.
Molecular Carcinogenesis DOI 10.1002/mc
expression of MT1a can be inhibited by myc protein[51].Progesterone receptor membrane component 1
(Pgrmc-1, similar to Hpr6.6 and DAP1p) is expressedin the endoplasmic reticulum in liver. This gene isstrongly induced by dioxin and is hypothesized tomediate interactions between endogenous steroids,such as progesterone and estrogen, and arylhydro-carbon receptor agonists. Most of these compoundsare carcinogenic at high doses. The human homologHpr6.6 is induced at high levels inmany tumors, andhas beenpostulated tomediate cell death in responseto oxidative stress in breast cancer cells [52]. In yeast,deletion of DAP1p (damage resistance protein 1related to the membrane progesterone receptor)leads to loss of mitochondrial function, elongatedtelomeres, and inhibition of ergosterol synthesiswith accumulation of precursors squalene and
lanosterol. DAP1p binds heme and stabilizes a yeastcytochromeP450, Erg11p/Cyp51p. A role of Pgrmc-1in nongenomic carcinogenesis is far from clear, butincreased CYP activities and changes in sterolmetabolism are often associated with hepatomegalyand NGTC.Nuclear factor 2 (NUTF2; p10) is essential for ran-
mediated shuttling of molecules from cytosol intothe nucleus. Knockouts of this gene are lethal, andlowered expression in Drosophila is associated withfailure of certain transcription factors, such as NFkBhomologs, to transport into the nucleus [53]. Whilethe observed induction in theNGTCgene expressionsignaturemay reflect increased activity and turnoverof NUTF2, regulation of this gene is largely unchar-acterized.Another gene in the NGTC signature, suppressor
of lin-12 homolog (SEL1h) inhibits the function of
Figure 4. Gene regulation networks constructed with 62 genessignificantly up- or downregulated by NGTC treatments compared toNC treatments. Each edge indicates an interaction and each shape(e.g., circle) represents a gene. Warm color (red or pink) indicatesupregulation and cool color (green) indicates downregulation. Emptyshapes represents genes not on the microarray and gray onesrepresent genes on the microarray but were not significantly up- or
downregulated. In panel a–e, dark lines represent genes andinteractions in the specific network, and genes and interactions fromall other networks are represented by gray lines for reference. c-mycand eight genes from the gene list that directly interact with c-mycare circled. See Table 4 for lists of genes and related functions. a–e,networks a–e; f: all networks merged via c-myc and FN1.
NONGENOTOXIC CARCINOGEN GENE SIGNATURE 929
Molecular Carcinogenesis DOI 10.1002/mc
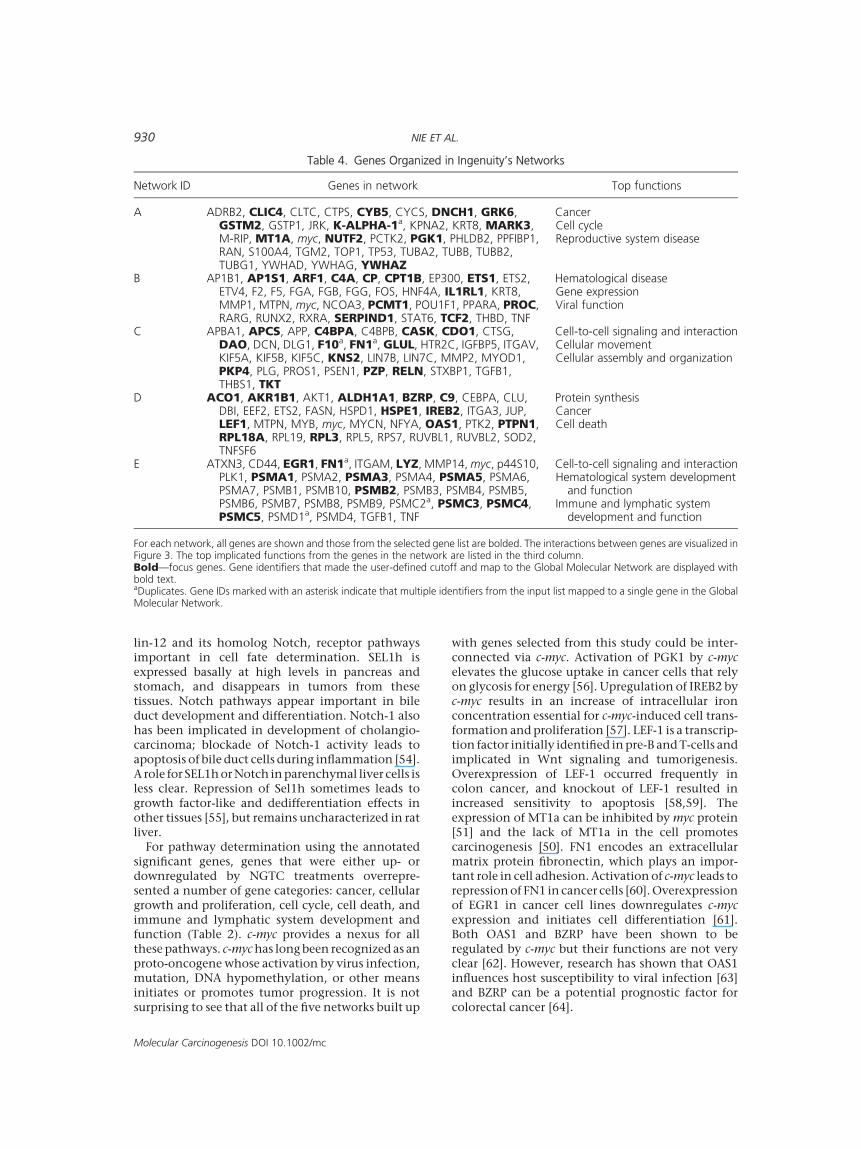
lin-12 and its homolog Notch, receptor pathwaysimportant in cell fate determination. SEL1h isexpressed basally at high levels in pancreas andstomach, and disappears in tumors from thesetissues. Notch pathways appear important in bileduct development and differentiation. Notch-1 alsohas been implicated in development of cholangio-carcinoma; blockade of Notch-1 activity leads toapoptosis of bile duct cells during inflammation [54].A role for SEL1horNotch inparenchymal liver cells isless clear. Repression of Sel1h sometimes leads togrowth factor-like and dedifferentiation effects inother tissues [55], but remains uncharacterized in ratliver.For pathway determination using the annotated
significant genes, genes that were either up- ordownregulated by NGTC treatments overrepre-sented a number of gene categories: cancer, cellulargrowth and proliferation, cell cycle, cell death, andimmune and lymphatic system development andfunction (Table 2). c-myc provides a nexus for allthese pathways. c-mychas longbeen recognized as anproto-oncogene whose activation by virus infection,mutation, DNA hypomethylation, or other meansinitiates or promotes tumor progression. It is notsurprising to see that all of the five networks built up
with genes selected from this study could be inter-connected via c-myc. Activation of PGK1 by c-mycelevates the glucose uptake in cancer cells that relyon glycosis for energy [56]. Upregulation of IREB2 byc-myc results in an increase of intracellular ironconcentration essential for c-myc-induced cell trans-formation andproliferation [57]. LEF-1 is a transcrip-tion factor initially identified inpre-B andT-cells andimplicated in Wnt signaling and tumorigenesis.Overexpression of LEF-1 occurred frequently incolon cancer, and knockout of LEF-1 resulted inincreased sensitivity to apoptosis [58,59]. Theexpression of MT1a can be inhibited by myc protein[51] and the lack of MT1a in the cell promotescarcinogenesis [50]. FN1 encodes an extracellularmatrix protein fibronectin, which plays an impor-tant role in cell adhesion. Activation of c-myc leads torepressionof FN1 in cancer cells [60].Overexpressionof EGR1 in cancer cell lines downregulates c-mycexpression and initiates cell differentiation [61].Both OAS1 and BZRP have been shown to beregulated by c-myc but their functions are not veryclear [62]. However, research has shown that OAS1influences host susceptibility to viral infection [63]and BZRP can be a potential prognostic factor forcolorectal cancer [64].
Table 4. Genes Organized in Ingenuity’s Networks
Network ID Genes in network Top functions
A ADRB2, CLIC4, CLTC, CTPS, CYB5, CYCS, DNCH1, GRK6,GSTM2, GSTP1, JRK, K-ALPHA-1a, KPNA2, KRT8, MARK3,M-RIP, MT1A, myc, NUTF2, PCTK2, PGK1, PHLDB2, PPFIBP1,RAN, S100A4, TGM2, TOP1, TP53, TUBA2, TUBB, TUBB2,TUBG1, YWHAD, YWHAG, YWHAZ
CancerCell cycleReproductive system disease
B AP1B1, AP1S1, ARF1, C4A, CP, CPT1B, EP300, ETS1, ETS2,ETV4, F2, F5, FGA, FGB, FGG, FOS, HNF4A, IL1RL1, KRT8,MMP1, MTPN, myc, NCOA3, PCMT1, POU1F1, PPARA, PROC,RARG, RUNX2, RXRA, SERPIND1, STAT6, TCF2, THBD, TNF
Hematological diseaseGene expressionViral function
C APBA1, APCS, APP, C4BPA, C4BPB, CASK, CDO1, CTSG,DAO, DCN, DLG1, F10a, FN1a, GLUL, HTR2C, IGFBP5, ITGAV,KIF5A, KIF5B, KIF5C, KNS2, LIN7B, LIN7C, MMP2, MYOD1,PKP4, PLG, PROS1, PSEN1, PZP, RELN, STXBP1, TGFB1,THBS1, TKT
Cell-to-cell signaling and interactionCellular movementCellular assembly and organization
D ACO1, AKR1B1, AKT1, ALDH1A1, BZRP, C9, CEBPA, CLU,DBI, EEF2, ETS2, FASN, HSPD1, HSPE1, IREB2, ITGA3, JUP,LEF1, MTPN, MYB, myc, MYCN, NFYA, OAS1, PTK2, PTPN1,RPL18A, RPL19, RPL3, RPL5, RPS7, RUVBL1, RUVBL2, SOD2,TNFSF6
Protein synthesisCancerCell death
E ATXN3, CD44, EGR1, FN1a, ITGAM, LYZ, MMP14, myc, p44S10,PLK1, PSMA1, PSMA2, PSMA3, PSMA4, PSMA5, PSMA6,PSMA7, PSMB1, PSMB10, PSMB2, PSMB3, PSMB4, PSMB5,PSMB6, PSMB7, PSMB8, PSMB9, PSMC2a, PSMC3, PSMC4,PSMC5, PSMD1a, PSMD4, TGFB1, TNF
Cell-to-cell signaling and interactionHematological system development
and functionImmune and lymphatic system
development and function
For each network, all genes are shown and those from the selected gene list are bolded. The interactions between genes are visualized inFigure 3. The top implicated functions from the genes in the network are listed in the third column.Bold—focus genes. Gene identifiers that made the user-defined cutoff and map to the Global Molecular Network are displayed withbold text.aDuplicates. Gene IDs marked with an asterisk indicate that multiple identifiers from the input list mapped to a single gene in the GlobalMolecular Network.
930 NIE ET AL.
Molecular Carcinogenesis DOI 10.1002/mc
The NGTC signature gene set defined in this studyperforms well with the pharmaceuticals studied, butmay need revision if very different types of com-pounds (e.g., herbicides and insecticides) are exam-ined. Only relatively few of these compounds weretested (rotenone, dieldrin, and lindane). This wouldbe an interesting area to explore further and possiblyexpand or modify the NGTC gene expression signa-ture. Similarly incomplete is our gene list on themicroarray. Mat2a was missing, and the expectedreciprocal regulation with Mat1A could not beexamined. At least one well-characterized mechan-ism of NGTC action was missed because of a geneabsent from our microarray: the alpha 2u globulingene is induced in male rat liver by a number oftoxicants (such as limonene and tertiary butylalcohol) and causes kidney tumors [65]. It was alsosurprising that PPs were generally detected by ourNGTC gene expression signature set, despite pro-nounced gene expression differences from mostcompounds, whereas MAs were largely missed(�30% of MAs were detected as NGTCs) by theNGTC gene expression signature.Compounds incorrectly classified by the NGTC
included strong false-positives ketoconazole, diflu-nisal, and verapamil, all classified as NC from rodentcarcinogen studies [14]. At the high dose (150mg/kgvs. 80 mg/kg/day in the rat carcinogenicity study)administered in the present study, ketoconazole isa strong suppressor of androgen biosynthesis, andapparently produces the same hepatic gene res-ponses as two other antagonists of androgen actions,flutamide and lansoprazole, both of which inducetesticular tumors in rats ([34], P3033, p3205).Diflunisal at high dose (750 mg/kg vs. 40 mg/kg/day in the rat carcinogenicity study) triggers thesame hepatic gene expression changes as PP [25],which are generally detected by theNGTC signature.Verapamil (75 mg/kg vs. 120 mg/kg/day in the ratcarcinogenicity study) appears to be a true falsepositive (cannot be explained by a lower dose inthe carcinogenicity study). A second NC calciumchannel blocker nifedipine also was detected as aweak false positive by the NGTC gene signature,suggesting commoneffects of this class of compoundon liver at high dose. Generally the doses used in thepresent short-term study were higher and bettertolerated than doses for carcinogenicity studies. Forseveral antiepileptics (including felbamate, pheny-toin, gabapentin, and carbamazepine), known carci-nogens in the rat, low doses were detected asnegatives or weak positives by the NGTC gene ex-pression signature, although high doses were alldetected as strong positives.The cDNAmicroarray used in this manuscript had
a small number of genes (1471). It was expected thata whole genome microarray would enable us to findmore and better genes to predict NGTC. In an effortto regenerate the toxicogenomic database on the
commercially available CodeLink Rat Whole Gen-omemicroarray, the validity of the final NGTC genesignature was verified. These genes showed higherdynamic changes in expression on the CodeLinkmicroarray and the prediction accuracy was 84%(Table 2).The microarray approach probably overestimates
the NGTC potential for the compounds examined,because higher doses are used in the present studythan in carcinogenicity studies. NGTCs often pro-duce tumors only at high doses, and some NGTCsmay even be anticancer agents at low doses [66]. Inaddition to providing a highly accurate predictivescreen for early detection of NGTCs among drugcandidates, the gene expression signatures in thisstudy provide starting points for further investiga-tion of pathways and mechanisms involved in earlystages of carcinogenesis.
ACKNOWLEDGMENTS
The support of Drs. Mark Johnson, Alfred Tonelli,WilliamPowers, andMichael Jackson for this projectis gratefully acknowledged.
REFERENCES
1. Josephy PD, Gruz P, Nohmi T. Recent advances in theconstruction of bacterial genotoxicity assays. Mutat Res1997;386:1–23.
2. Sills RC, French JE, Cunningham ML. New models forassessing carcinogenesis: An ongoing process. Toxicol Lett2001;120:187–198.
3. Dean SW, Brooks TM, Burlinson B, et al. Transgenic mousemutation assay systems can play an important role inregulatory mutagenicity testing in vivo for the detection ofsite-of-contact mutagens. Mutagenesis 1999;14:141–151.
4. Parry EM, Parry JM, Corso C, et al. Detection and char-acterization of mechanisms of action of aneugenic chemi-cals. Mutagenesis 2002;17:509–521.
5. Moller P. Genotoxicity of environmental agents assessed bythe alkaline comet assay. Basic Clin Pharmacol Toxicol 2005;96:1–42.
6. Collins AR. The comet assay for DNA damage and repair:Principles, applications, and limitations. Mol Biotechnol2004;26:249–261.
7. Combes RD. The use of structure-activity relationships andmarkers of cell toxicity to detect non-genotoxic carcinogens.Toxicol In Vitro 2000;14:387–399.
8. Ames BN, Gold LS. Chemical carcinogenesis: Too manyrodent carcinogens. Proc Natl Acad Sci U S A 1990;87:7772–7776.
9. Kinoshita A, Wanibuchi H, Imaoka S, et al. Formation of 8-hydroxydeoxyguanosine and cell-cycle arrest in the rat livervia generation of oxidative stress by phenobarbital: Associa-tion with expression profiles of p21(WAF1/Cip1), cyclin D1and Ogg1. Carcinogenesis 2002;23:341–349.
10. Ge R, Wang W, Kramer PM, Yang S, Tao L, Pereira MA. Wy-14,643-induced hypomethylation of the c-myc gene inmouse liver. Toxicol Sci 2001;62:28–35.
11. Ohtsuka M, Fukuda K, Yano H, Kojiro M. Immunohisto-chemical measurement of cell proliferation as replicativeDNA synthesis in the liver of male Fischer 344 rats following asingle exposure to nongenotoxic hepatocarcinogens andnoncarcinogens. Exp Toxicol Pathol 1998;50:13–17.
12. Gill JH, Brickell P, Dive C, Roberts RA. The rodent non-genotoxic hepatocarcinogen nafenopin suppresses apopto-sis preferentially in non-cycling hepatocytes but also elevates
NONGENOTOXIC CARCINOGEN GENE SIGNATURE 931
Molecular Carcinogenesis DOI 10.1002/mc
CDK4, a cell cycle progression factor. Carcinogenesis 1998;19:1743–1747.
13. Chipman JK, Mally A, Edwards GO. Disruption of gapjunctions in toxicity and carcinogenicity. Toxicol Sci 2003;71:146–153.
14. Snyder RD, Green JW. A review of the genotoxicity ofmarketed pharmaceuticals. Mutat Res 2001;488:151–169.
15. Ashby J, Tennant RW. Definitive relationships amongchemical structure, carcinogenicity and mutagenicity for301 chemicals tested by the U.S. NTP. Mutat Res 1991;257:229–306.
16. Huang Q, Jin X, Gaillard ET, et al. Gene expression profilingreveals multiple toxicity endpoints induced by hepatotox-icants. Mutat Res 2004;549:147–167.
17. Roberts RA, Michel C, Coyle B, Freathy C, Cain K, Boitier E.Regulation of apoptosis by peroxisome proliferators. ToxicolLett 2004;149:37–41.
18. Waring JF, Jolly RA, Ciurlionis R, et al. Clustering of hepa-totoxins based on mechanism of toxicity using gene ex-pression profiles. Toxicol Appl Pharmacol 2001;175:28–42.
19. Steiner G, Suter L, Boess F, et al. Discriminating differentclasses of toxicants by transcript profiling. Environ HealthPerspect 2004;112:1236–1248.
20. Hamadeh HK, Bushel PR, Jayadev S, et al. Gene expressionanalysis reveals chemical-specific profiles. Toxicol Sci 2002;67:219–231.
21. Iida M, Anna CH, Hartis J, et al. Changes in global gene andprotein expression during early mouse liver carcinogenesisinduced by non-genotoxic model carcinogensoxazepam andWyeth-14,643. Carcinogenesis 2003;24:757–770.
22. Iida M, Anna CH, Holliday WM, et al. Unique patternsof geneexpression changes in liver after treatment of mice for 2weeks with different known carcinogens and non-carcino-gens. Carcinogenesis 2005;26:689–699.
23. Jung JW, Park JS, Hwang JW, et al. Gene expression analysisof peroxisome proliferators- and phenytoin-induced hepa-totoxicity using cDNA microarray. J Vet Med Sci 2004;66:1329–1333.
24. van Delft JH, van Agen E, van Breda SG, Herwijnen MH,Staal YC, Kleinjans JC. Discrimination of genotoxic fromnon-genotoxic carcinogens by gene expression profiling.Carcinogenesis 2004;25:1265–1276.
25. McMillian M, Nie AY, Parker JB, et al. A gene expressionsignature for oxidant stress/reactive metabolites in rat liver.Biochem Pharmacol 2004;68:2249–2261.
26. McMillian M, Nie AY, Parker JB, et al. Inverse gene expressionpatterns for macrophage activating hepatotoxicants andperoxisome proliferators in rat liver. Biochem Pharmacol2004;67:2141–2165.
27. Friedman SL. Mac the knife? Macrophages- the double-edged sword of hepatic fibrosis. J Clin Invest 2005;115:29–32.
28. Bartsch H, Nair J. Oxidative stress and lipid peroxidation-derived DNA-lesions in inflammation driven carcinogenesis.Cancer Detect Prev 2004;28:385–391.
29. Luo L, Salunga RC, Guo H, et al. Gene expression profiles oflaser-captured adjacent neuronal subtypes. Nat Med 1999;5:117–122.
30. Calvano SE, Xiao W, Richards DR, et al. A network-basedanalysis of systemic inflammation in humans. Nature 2005;437:1032–1037.
31. Dash M, Liu H. Feature Selection for Classfication. IntelligentData Analysis 1997;1:131–156.
32. Reiner A, Yekutieli D, Benjamini Y. Identifying differentiallyexpressed genes using false discovery rate controllingprocedures. Bioinformatics 2003;19:368–375.
33. Ambroise C, McLachlan GJ. Selection bias in gene extractionon the basis of microarray gene-expression data. Proc NatlAcad Sci U S A 2002;99:6562–6566.
34. Staff ME. Physicians’ desk reference 2003. Montvale, NJ,USA: Thomson Healthcare; 2002. 3000p.
35. McMillian M, Nie AY, Parker JB, et al. Drug-induced oxidativestress in rat liver from a toxicogenomics perspective. ToxicolAppl Pharmacol 2005;207:S171–S178.
36. Wilson AG, Thake DC, Heydens WE, Brewster DW, Hotz KJ.Mode of action of thyroid tumor formation in the male long-evans rat administered high doses of alachlor. Fundam ApplToxicol 1996;33:16–23.
37. Mato JM, Corrales FJ, Lu SC, Avila MA. S-Adenosylmethio-nine: A control switch that regulates liver function. FASEB J2002;16:15–26.
38. Frago LM, Gimenez A, Rodriguez EN, Varela-Nieto I. Patternof methionine adenosyltransferase isoenzyme expressionduring rat liver regeneration after partial hepatectomy. FEBSLett 1998;426:305–308.
39. Paneda C, Gorospe I, Herrera B, Nakamura T, Fabregat I,Varela-Nieto I. Liver cell proliferation requires methionineadenosyltransferase 2A mRNA up-regulation. Hepatology2002;35:1381–1391.
40. Yang H, Sadda MR, Yu V, et al. Induction of humanmethionine adenosyltransferase 2A expression by tumornecrosis factor alpha. Role of NF-kappa B and AP-1. J BiolChem 2003;278:50887–50896.
41. Yang H, Huang ZZ, Zeng Z, Chen C, Selby RR, Lu SC. Role ofpromoter methylation in increased methionine adenosyl-transferase 2A expression in human liver cancer. Am J PhysiolGastrointest Liver Physiol 2001;280:G184–190.
42. Lu SC, Alvarez L, Huang ZZ, et al. Methionine adenosyl-transferase 1A knockout mice are predisposed to liver injuryand exhibit increased expression of genes involved inproliferation. Proc Natl Acad Sci U S A 2001;98:5560–5565.
43. Martinez-Chantar ML, Corrales FJ, Martinez-Cruz LA, et al.Spontaneous oxidative stress and liver tumors in mice lackingmethionine adenosyltransferase 1A. FASEB J 2002;16:1292–1294.
44. Huang ZZ, Mato JM, Kanel G, Lu SC. Differential effect ofthioacetamide on hepatic methionine adenosyltransferaseexpression in the rat. Hepatology 1999;29:1471–1478.
45. Simile MM, Pagnan G, Pastorino F, et al. ChemopreventiveN-(4-hydroxyphenyl)retinamide (fenretinide) targets deregu-lated NF-{kappa}B and Mat1A genes in the early stages of ratliver carcinogenesis. Carcinogenesis 2005;26:417–427.
46. Garcia-Trevijano ER, Martinez-Chantar ML, Latasa MU, MatoJM, Avila MA. NO sensitizes rat hepatocytes to proliferationby modifying S-adenosylmethionine levels. Gastroenterol-ogy 2002;122:1355–1363.
47. Counts JL, Sarmiento JI, Harbison ML, Downing JC, McClainRM, Goodman JL. Cell proliferation and global methylationstatus changes in mouse liver after phenobarbital and/orcholine-devoid, methionine-deficient diet administration.Carcinogenesis 1996;17:1251–1257.
48. Pereira MA, Wang W, Kramer PM, Tao L. DNA hypomethyla-tion induced by non-genotoxic carcinogens in mouse and ratcolon. Cancer Lett 2004;212:145–151.
49. Pereira MA, Kramer PM, Conran PB, Tao L. Effect ofchloroform on dichloroacetic acid and trichloroacetic acid-induced hypomethylation and expression of the c-myc geneand on their promotion of liver and kidney tumors in mice.Carcinogenesis 2001;22:1511–1519.
50. Waalkes MP, Liu J, Goyer RA, Diwan BA. Metallothionein-I/IIdouble knockout mice are hypersensitive to lead-inducedkidney carcinogenesis: Role of inclusion body formation.Cancer Res 2004;64:7766–7772.
51. Oster SK, Ho CS, Soucie EL, Penn LZ. The myc oncogene:Marvelously Complex. Adv Cancer Res 2002;84:81–154.
52. Hand RA, Craven RJ. Hpr6.6 protein mediates cell death fromoxidative damage in MCF-7 human breast cancer cells. J CellBiochem 2003;90:534–547.
53. Bhattacharya A, Steward R. The Drosophila homolog of NTF-2, the nuclear transport factor-2, is essential for immuneresponse. EMBO Rep 2002;3:378–383.
932 NIE ET AL.
Molecular Carcinogenesis DOI 10.1002/mc
54. Ishimura N, Bronk SF, Gores GJ. Inducible nitric oxidesynthase up-regulates Notch-1 in mouse cholangiocytes:Implications for carcinogenesis. Gastroenterology 2005;128:1354–1368.
55. Orlandi R, Cattaneo M, Troglio F, et al. SEL1L expressiondecreases breast tumor cell aggressiveness in vivo andin vitro. Cancer Res 2002;62:567–574.
56. Osthus RC, Shim H, Kim S, et al. Deregulation of glucosetransporter 1 and glycolytic gene expression by c-myc. J BiolChem 2000;275:21797–21800.
57. Wu KJ, Polack A, Dalla-Favera R. Coordinated regulation ofiron-controlling genes, H-ferritin and IRP2, by c-myc. Science1999;283:676–679.
58. Sasaki T, Suzuki H, Yagi K, et al. Lymphoid enhancer factor 1makes cells resistant to transforming growth factor beta-induced repression of c-myc. Cancer Res 2003;63:801–806.
59. Reya T, O’Riordan M, Okamura R, et al. Wnt signalingregulates B lymphocyte proliferation through a LEF-1dependent mechanism. Immunity 2000;13:15–24.
60. Coller HA, Grandori C, Tamayo P, et al. Expression analysiswith oligonucleotide microarrays reveals that myc regulatesgenes involved in growth, cell cycle, signaling, and adhesion.Proc Natl Acad Sci U S A 2000;97:3260–3265.
61. Krishnaraju K, Hoffman B, Liebermann DA. The zinc fingertranscription factor Egr-1 activates macrophage differentia-tion in M1 myeloblastic leukemia cells. Blood 1998;92:1957–1966.
62. Guo QM, Malek RL, Kim S, et al. Identification of c-mycresponsive genes using rat cDNA microarray. Cancer Res2000;60:5922–5928.
63. Bonnevie-Nielsen V, Field LL, Lu S, et al. Variation in antiviral20,50-oligoadenylate synthetase (2050AS) enzyme activity iscontrolled by a single-nucleotide polymorphism at a splice-acceptor site in the OAS1 gene. Am J Hum Genet 2005;76:623–633.
64. Maaser K, Grabowski P, Sutter AP, et al. Overexpression ofthe peripheral benzodiazepine receptor is a relevant prog-nostic factor in stage III colorectal cancer. Clin Cancer Res2002;8:3205–3209.
65. Dietrich DR, Swenberg JA. The presence of alpha 2u-globulinis necessary for d-limonene promotion of male rat kidneytumors. Cancer Res 1991;51:3512–3521.
66. Teeguarden JG, Dragan Y, Pitot HC. Hazard assessment ofchemical carcinogens: The impact of hormesis. J Appl Toxicol2000;20:113–120.
NONGENOTOXIC CARCINOGEN GENE SIGNATURE 933
Molecular Carcinogenesis DOI 10.1002/mc
Copyright © 2022 FDOKUMEN