Microarray and Pathway Analysis Reveal Distinct Mechanisms Underlying Cannabinoid-Mediated...
17
Microarray and Pathway Analysis Reveal Distinct Mechanisms Underlying Cannabinoid-Mediated Modulation of LPS-Induced Activation of BV-2 Microglial Cells Ana Juknat 1 , Maciej Pietr 2{ , Ewa Kozela 1,2 , Neta Rimmerman 1,2 , Rivka Levy 2 , Fuying Gao 3 , Giovanni Coppola 3 , Daniel Geschwind 3 , Zvi Vogel 1 * 1 The Dr. Miriam and Sheldon G. Adelson Center for the Biology of Addictive Diseases, Sackler Faculty of Medicine, Physiology and Pharmacology Department, Tel Aviv University, Tel Aviv, Israel, 2 Neurobiology Department, Weizmann Institute of Science, Rehovot, Israel, 3 Program in Neurogenetics, Department of Neurology, University of California Los Angeles, Los Angeles, California, United States of America Abstract Cannabinoids are known to exert immunosuppressive activities. However, the mechanisms which contribute to these effects are unknown. Using lipopolysaccharide (LPS) to activate BV-2 microglial cells, we examined how D 9 - tetrahydrocannabinol (THC), the major psychoactive component of marijuana, and cannabidiol (CBD) the non-psychoactive component, modulate the inflammatory response. Microarray analysis of genome-wide mRNA levels was performed using Illumina platform and the resulting expression patterns analyzed using the Ingenuity Pathway Analysis to identify functional subsets of genes, and the Ingenuity System Database to denote the gene networks regulated by CBD and THC. From the 5338 transcripts that were differentially expressed across treatments, 400 transcripts were found to be upregulated by LPS, 502 by CBD+LPS and 424 by THC+LPS, while 145 were downregulated by LPS, 297 by CBD+LPS and 149 by THC+LPS, by 2- fold or more (p#0.005). Results clearly link the effects of CBD and THC to inflammatory signaling pathways and identify new cannabinoid targets in the MAPK pathway (Dusp1, Dusp8, Dusp2), cell cycle related (Cdkn2b, Gadd45a) as well as JAK/STAT regulatory molecules (Socs3, Cish, Stat1). The impact of CBD on LPS-stimulated gene expression was greater than that of THC. We attribute this difference to the fact that CBD highly upregulated several genes encoding negative regulators of both NFkB and AP-1 transcriptional activities, such as Trib3 and Dusp1 known to be modulated through Nrf2 activation. The CBD-specific expression profile reflected changes associated with oxidative stress and glutathione depletion via Trib3 and expression of ATF4 target genes. Furthermore, the CBD affected genes were shown to be controlled by nuclear factors usually involved in regulation of stress response and inflammation, mainly via Nrf2/Hmox1 axis and the Nrf2/ATF4-Trib3 pathway. These observations indicate that CBD, and less so THC, induce a cellular stress response and that this response underlies their high immunosuppressant activities. Citation: Juknat A, Pietr M, Kozela E, Rimmerman N, Levy R, et al. (2013) Microarray and Pathway Analysis Reveal Distinct Mechanisms Underlying Cannabinoid- Mediated Modulation of LPS-Induced Activation of BV-2 Microglial Cells. PLoS ONE 8(4): e61462. doi:10.1371/journal.pone.0061462 Editor: Xun Ai, Loyola University Chicago, United States of America Received November 14, 2012; Accepted March 10, 2013; Published April 24, 2013 Copyright: ß 2013 Juknat et al. This is an open-access article distributed under the terms of the Creative Commons Attribution License, which permits unrestricted use, distribution, and reproduction in any medium, provided the original author and source are credited. Funding: This work was supported by the Dr. Miriam and Sheldon G. Adelson Medical Research Foundation and by the Dr. Miriam and Sheldon G. Adelson Center for the Biology of Addictive Diseases. AJ is supported by the Israeli Ministry for Absorption in Science. The funders had no role in study design, data collection and analysis, decision to publish or preparation of the manuscript. Competing Interests: The authors have declared that no competing interest exist. * E-mail: [email protected] { Deceased. Introduction Cannabis sativa extracts (marijuana and hashish) have been used for centuries both as therapeutic agents and recreational drugs, primarily due to their ability to regulate neurobehavioral processes including memory, mood and appetite [1,2]. The spectra of possible therapeutic uses of marijuana and its active constituents, the cannabinoids, range from handling nausea, vomiting and cachexia (in cancer chemotherapy and AIDS patients) to treatment of chronic pain, glaucoma, epileptic seizures, Parkinso- nian tremor as well as multiple sclerosis [1,2-6]. Amongst the 60 different cannabinoids identified from Cannabis preparations, D 9 - tetrahydrocannabinol (THC), the major psychoactive Cannabis constituent, and the non-psychoactive cannabidiol (CBD) are the most abundant and important. Many of the beneficial effects of cannabinoids have been attributed to their potent immunosuppressive and anti-inflamma- tory properties [7–14]. Additionally, cannabinoids are known to possess pro-apoptotic, neuroprotective and anti-tumor properties [15–17]. To date, two cannabinoid receptors have been charac- terized: the CB 1 and the CB 2 receptors. The CB 1 receptor is highly expressed in neural cells and mediates the psychoactive and addictive activities of cannabinoids, while the CB 2 receptor is abundantly present in the periphery including the immune system and is involved in cannabinoid immunomodulation [18–20]. THC binds to both of these receptors with similar efficiency [21] and has PLOS ONE | www.plosone.org 1 April 2013 | Volume 8 | Issue 4 | e61462
Transcript of Microarray and Pathway Analysis Reveal Distinct Mechanisms Underlying Cannabinoid-Mediated...

Microarray and Pathway Analysis Reveal DistinctMechanisms Underlying Cannabinoid-MediatedModulation of LPS-Induced Activation of BV-2 MicroglialCellsAna Juknat1, Maciej Pietr 2{, Ewa Kozela1,2, Neta Rimmerman1,2, Rivka Levy2, Fuying Gao3,
Giovanni Coppola3, Daniel Geschwind3, Zvi Vogel1*
1 The Dr. Miriam and Sheldon G. Adelson Center for the Biology of Addictive Diseases, Sackler Faculty of Medicine, Physiology and Pharmacology Department, Tel Aviv
University, Tel Aviv, Israel, 2 Neurobiology Department, Weizmann Institute of Science, Rehovot, Israel, 3 Program in Neurogenetics, Department of Neurology, University
of California Los Angeles, Los Angeles, California, United States of America
Abstract
Cannabinoids are known to exert immunosuppressive activities. However, the mechanisms which contribute to theseeffects are unknown. Using lipopolysaccharide (LPS) to activate BV-2 microglial cells, we examined how D9-tetrahydrocannabinol (THC), the major psychoactive component of marijuana, and cannabidiol (CBD) the non-psychoactivecomponent, modulate the inflammatory response. Microarray analysis of genome-wide mRNA levels was performed usingIllumina platform and the resulting expression patterns analyzed using the Ingenuity Pathway Analysis to identify functionalsubsets of genes, and the Ingenuity System Database to denote the gene networks regulated by CBD and THC. From the5338 transcripts that were differentially expressed across treatments, 400 transcripts were found to be upregulated by LPS,502 by CBD+LPS and 424 by THC+LPS, while 145 were downregulated by LPS, 297 by CBD+LPS and 149 by THC+LPS, by 2-fold or more (p#0.005). Results clearly link the effects of CBD and THC to inflammatory signaling pathways and identify newcannabinoid targets in the MAPK pathway (Dusp1, Dusp8, Dusp2), cell cycle related (Cdkn2b, Gadd45a) as well as JAK/STATregulatory molecules (Socs3, Cish, Stat1). The impact of CBD on LPS-stimulated gene expression was greater than that ofTHC. We attribute this difference to the fact that CBD highly upregulated several genes encoding negative regulators ofboth NFkB and AP-1 transcriptional activities, such as Trib3 and Dusp1 known to be modulated through Nrf2 activation. TheCBD-specific expression profile reflected changes associated with oxidative stress and glutathione depletion via Trib3 andexpression of ATF4 target genes. Furthermore, the CBD affected genes were shown to be controlled by nuclear factorsusually involved in regulation of stress response and inflammation, mainly via Nrf2/Hmox1 axis and the Nrf2/ATF4-Trib3pathway. These observations indicate that CBD, and less so THC, induce a cellular stress response and that this responseunderlies their high immunosuppressant activities.
Citation: Juknat A, Pietr M, Kozela E, Rimmerman N, Levy R, et al. (2013) Microarray and Pathway Analysis Reveal Distinct Mechanisms Underlying Cannabinoid-Mediated Modulation of LPS-Induced Activation of BV-2 Microglial Cells. PLoS ONE 8(4): e61462. doi:10.1371/journal.pone.0061462
Editor: Xun Ai, Loyola University Chicago, United States of America
Received November 14, 2012; Accepted March 10, 2013; Published April 24, 2013
Copyright: � 2013 Juknat et al. This is an open-access article distributed under the terms of the Creative Commons Attribution License, which permitsunrestricted use, distribution, and reproduction in any medium, provided the original author and source are credited.
Funding: This work was supported by the Dr. Miriam and Sheldon G. Adelson Medical Research Foundation and by the Dr. Miriam and Sheldon G. AdelsonCenter for the Biology of Addictive Diseases. AJ is supported by the Israeli Ministry for Absorption in Science. The funders had no role in study design, datacollection and analysis, decision to publish or preparation of the manuscript.
Competing Interests: The authors have declared that no competing interest exist.
* E-mail: [email protected]
{ Deceased.
Introduction
Cannabis sativa extracts (marijuana and hashish) have been used
for centuries both as therapeutic agents and recreational drugs,
primarily due to their ability to regulate neurobehavioral processes
including memory, mood and appetite [1,2]. The spectra of
possible therapeutic uses of marijuana and its active constituents,
the cannabinoids, range from handling nausea, vomiting and
cachexia (in cancer chemotherapy and AIDS patients) to
treatment of chronic pain, glaucoma, epileptic seizures, Parkinso-
nian tremor as well as multiple sclerosis [1,2-6]. Amongst the 60
different cannabinoids identified from Cannabis preparations, D9-
tetrahydrocannabinol (THC), the major psychoactive Cannabis
constituent, and the non-psychoactive cannabidiol (CBD) are the
most abundant and important.
Many of the beneficial effects of cannabinoids have been
attributed to their potent immunosuppressive and anti-inflamma-
tory properties [7–14]. Additionally, cannabinoids are known to
possess pro-apoptotic, neuroprotective and anti-tumor properties
[15–17]. To date, two cannabinoid receptors have been charac-
terized: the CB1 and the CB2 receptors. The CB1 receptor is
highly expressed in neural cells and mediates the psychoactive and
addictive activities of cannabinoids, while the CB2 receptor is
abundantly present in the periphery including the immune system
and is involved in cannabinoid immunomodulation [18–20]. THC
binds to both of these receptors with similar efficiency [21] and has
PLOS ONE | www.plosone.org 1 April 2013 | Volume 8 | Issue 4 | e61462
been reported to have effects on both the nervous and the immune
systems [7,11,18,22].
In the last years, attention has been turned to several other
phytocannabinoids, most notably to CBD. CBD displays a
diversity of actions, including anticonvulsive, sedative, hypnotic,
antipsychotic, anti-inflammatory and neuroprotective properties
[11–14,23–28]. CBD, unlike THC, is not an efficient ligand of
either CB1 or CB2 and therefore, is devoid of the unwanted
psychotropic effects (mediated via CB1) characteristic of marijuana
or THC. Thus, the effects of CBD are probably mediated through
other receptors/targets, as described below and elsewhere
[23,29,30].
Phytocannabinoids were reported to affect various populations
of immune cells [7,11–14,31]. Both THC and CBD have been
shown to decrease cytokine production in human immune cell
lines [32] and to suppress T cell proliferation and their effector
functions [12,33,34]. In response to stimulation with the bacterial
endotoxin lipopolysaccharide (LPS), both monocytes and microg-
lial cultures treated with either THC or CBD produce lower levels
of cytokines such as tumor necrosis factor a (TNFa), interleukin-1a(IL-1a), IL-1b and IL-6 [11,35]. However, the molecular
mechanisms involved in these cannabinoid-mediated effects are
not yet fully characterized. Eljaschewitsch et al., [36] showed that
activation of CB1 and/or CB2 receptors in the murine microglial
BV-2 cell line leads to rapid induction of mitogen-activated
protein kinase phosphatase-1 (MKP-1) and that this event switches
off MAPK signal transduction which was activated by LPS
stimulation. Altered adenosine signaling (through inhibition of its
uptake) has been reported as a potential non-cannabinoid receptor
mechanism by which CBD, but less so THC, can decrease
inflammation [37]. Other studies identified the nuclear receptor
peroxisome proliferator-activated receptor c (PPARc) as a novel
intracellular target, which mediates the cannabinoid-associated
immunosuppression in a manner that is independent of the known
cannabinoid receptors CB1 and CB2 [38,39]. Other targets
including the G-protein-coupled receptors GPR55 and GPR18
as well as the transient receptor potential (TRP) channels were also
suggested [19,20,30,40].
Microglial cells are the resident macrophage-like cells of the
CNS. They are highly ramified cells and their processes are very
dynamic under non-pathological conditions, actively scanning
their environment. These cells have important roles in brain’s
innate immunity and neuronal homeostasis as well as in
neuroinflammatory pathologies [41]. Microglia can be activated
by infection, injury or by endogenously released neurotoxic factors
and their activation is associated with the production and secretion
of a variety of compounds such as cytokines, reactive oxygen
species (ROS), reactive nitrogen species, matrix metalloproteinases
and prostaglandins. Although microglial activation is considered a
protective mechanism involved in the clearance of pathogen
infection and in regulating tissue repair and recovery, excessive or
chronic activation can lead to harmful effects [42]. Interestingly,
the mechanisms that give rise to either the protective or the
damaging microglial phenotypes are not fully elucidated. Enhanc-
ing the microglial-mediated innate immunity in the CNS and/or
preventing the harmful effects associated with their chronic
activation may offer new therapeutic approaches for the treatment
of brain injury and neurodegenerative diseases [43].
One of the most potent stimuli for microglia activation is the
bacterial endotoxin LPS, that mimics infection by Gram-negative
bacteria. LPS activates intracellular signaling pathways in a
complex way leading to secretion of cytokines and to overexpres-
sion of several markers of the immune response. Previous studies
reported that LPS stimulation induces gene expression of TNFa,
IL-1b, IL-6, iNOS and COX-2 as well as the production of NO and
PGE2 in primary and BV-2 microglial cell cultures [11,44,45]. We
reported that CBD reduces the activity of the NF-kB pathway and
upregulates the activation of STAT3 transcription factor in LPS-
stimulated BV-2 cells, and that both CBD and THC decrease the
activation of the LPS-induced STAT1 transcription factor, a key
player in IFNb-dependent pro-inflammatory processes [11].
Moreover, performing comparative microarray analysis of ge-
nome-wide mRNA levels in the BV-2 cells, we reported that CBD,
but less so THC, shows a specific gene expression profile
associated with oxidative stress and glutathione depletion involving
the GCN2/eIF2a/p8/ATF4/Chop-Trib3 pathway [13]. Further-
more, the CBD-stimulated genes were shown to be controlled by
nuclear factors known to be involved in regulation of stress
response and inflammation, mainly via the (EpRE/ARE)-Nrf2/
Atf4 system and the Nrf2/Hmox axis. We reported that CBD, but
less so THC, affects the expression of genes involved in zinc
homeostasis, suggesting that the regulation of zinc levels could
have an important role through which CBD may exert its
antioxidant and anti-inflammatory effects [14].
Although the inhibitory functions of cannabinoids on LPS-
activated NF-kB and IFN-b/STAT proinflammatory pathways
and on the secretion of selected cytokines in BV-2 microglial cells
has been studied [11], a genome-wide search for cannabinoid
molecular targets in LPS-activated BV-2 cells has not yet been
performed. We have, therefore, performed gene array studies and
comparative gene profiling analysis of BV-2 cells treated with LPS,
CBD+LPS or THC+LPS. This approach allowed us to analyze
the changes induced by CBD and THC on gene expression
patterns in LPS-treated BV-2 cells and to explore the genome-
wide interaction network affected by these treatments. In this
regard, a structured network knowledge-based approach to
analyze genome-wide transcriptional responses in the context of
known functional interactions among proteins, small molecules
and phenotypes has been established [46]. We applied this analysis
to show the interactions and signaling networks elicited by the
cannabinoids in LPS-stimulated BV-2 cells. Our results show that
CBD is a potent modulator of microglial activation. Identification
of the CBD- and THC-regulated genes and related networks
provides a molecular basis for understanding the effects of these
cannabinoids on LPS-activated microglia.
Materials and Methods
MaterialsLPS from Escherichia coli (serotype 055:B5) was purchased from
Sigma (St. Louis, MO, USA). THC and CBD were obtained from
the National Institute on Drug Abuse (NIDA; Baltimore, MD,
USA). Stock solutions of cannabinoids were prepared in ethanol
and diluted into culture medium before experiments. Final ethanol
concentration in the medium did not exceed 0.1%.
Microglial cell cultureThe immortalized murine BV-2 microglial cell line was kindly
provided by Prof. E.J. Choi from the Korea University (Seoul,
Korea). Cells were grown in Dulbecco’s modified Eagle’s medium
(DMEM; Gibco-BRL, Gaithersburg, MD, USA) containing 4.5 g/
L glucose, supplemented with 5% fetal calf serum, penicillin
(100 U/ml) and streptomycin (100 mg/ml) (Biological Industries
Ltd., Kibbutz Beit Haemek, Israel), under a humidified 5% CO2
atmosphere at 37uC. Cells were pretreated for 2 h with either
THC or CBD (both at 10 mM) followed by addition of LPS
(100 ng/ml) for another 4 h.
Cannabinoid Anti-Inflammatory Networks
PLOS ONE | www.plosone.org 2 April 2013 | Volume 8 | Issue 4 | e61462
Total RNA extractionExtraction, quantification and quality of extracted RNA were
performed and analyzed as described previously [13].
Microarray transcript analysisComparative microarray analysis was performed using the
Illumina MouseRef-8 BeadChip platform, as described previously
[13]. Four replicates of each experiment were carried out,
resulting in four independent microarrays for each individual
treatment and controls (24 total arrays). Gene products that were
affected by 2-fold or more were further analyzed as described in
the Result section. Differentially expressed genes were classified
according to their gene ontology (GO; http://www.geneontology.
org/; [47]), using DAVID Bioinformatics online tools (Database
for Annotation, Visualization and Integrated Discovery; http://
david.abcc.ncifcrf.gov/; [48]). Cellular pathway association was
analyzed according to the Kyoto Encyclopedia of Genes and
Genomes (KEGG) database (http://www.genome.jp/kegg/) and
pathway maps according to BioCarta (http://www.biocarta.
com/genes/index.asp).
Ingenuity pathway analysisPathway and global functional analyses were performed using
Ingenuity Pathway Analysis 6.0 (IPA; IngenuityH Systems, www.
ingenuity.com). A data set containing gene identifiers and
corresponding expression values was uploaded into the applica-
tion, and each gene identifier was mapped using the Ingenuity
Pathways Knowledge Base (IPKB). The IPKB analyses identify
the biological functions as well as the pathways from the IPA
library that are most significant to the data set. Genes from the
data sets associated with biological functions or with a canonical
pathway in the IPKB, that met the p-value cutoff of 0.005 were
used to build the interactome as described below. Fisher’s exact
test was used to calculate a p-value determining the probability
that each biological function and/or canonical pathway assigned
to this data set was not due to chance alone.
Interactome/network analysis of differentially expressedgenes
The accession number and the ratio (CBD+LPS versus LPS and
THC+LPS versus LPS) for each gene whose expression was
changed by at least 2-fold by one of the treatments (focused genes),
were uploaded into the IPA system. This IPA application was used
to query databases for interactions between sets of differentially
expressed genes and all other genes stored in the knowledge base
to generate a set of interactive networks taking into consideration
canonical pathways, relevant biological interactions as well as
cellular and disease processes. The IPA system computes a score
for each network according to the fit of the set of the supplied
‘‘focus genes’’. The p value scores for such a set indicate the
likelihood of focused genes to belong to a network versus those
obtained by chance.
Microarray data validation by quantitative real time PCRMany of the gene products that were found to be affected using
the microarray gene analysis were validated by quantitative real
time reverse transcription polymerase chain reaction (qPCR).
Primer sets for qPCR were designed using Primer Quest, an online
tool provided by Integrated DNA Technologies (http://eu.idtdna.
com/Scitools/Applications/Primerquest/) (Table S1). Wherever
possible, designs with at least one of the primer sequences located
on an intron–exon boundary were chosen, thus avoiding co-
amplification of minor contaminating amounts of genomic DNA
that could be present in the RNA samples. All primers were
analyzed using the nucleotide program BLAST to ensure primer
specificity for the gene of interest (http://blast.ncbi.nlm.nih.gov/
Blast.cgi). cDNA was generated by using the QuantiTect Reverse
Transcription kit containg ‘‘genomic DNA wipe out’’ (to eliminate
contamination with genomic DNA), according to the manufac-
turer’s instructions (Qiagen, AG, Basel, Switzerland). qPCR was
carried out as detailed by Juknat et al., [13] using the Rotor-Gene
3000 instrument (Corbett Research, Sydney, Australia). Expres-
sion levels of genes of interest were normalized to the reference
gene, b2-microglobulin (B2m), whose expression was found not to be
affected by the various treatments, and are expressed as fold
change using the calculation method described previously [13].
The qPCR experiments were repeated 3 to 4 times using different
mRNA batches from independent experiments and reactions were
performed in duplicates for each cDNA sample.
StatisticsqPCR data were plotted as the mean6SEM of 3-4 independent
experiments. Statistical significance was assessed using a one-way
or two-way ANOVA, followed by Bonferroni post hoc multiple
comparison test as implemented with the Statistics Toolbox
Software MATLAB, Version 6.1 (R2007b), MathWorks (http://
www.mathworks.com/help/toolbox/stats/rn/brasjn_.html). A p
value ,0.05 was defined as statistically significant.
Results
Effect of cannabinoids on LPS-stimulated geneexpression in BV-2 microglial cells
BV-2 microglial cells were pretreated for 2 h with either THC
or CBD (both at 10 mM) followed by the addition of LPS (100 ng/
ml) to the incubation medium for another 4 h. The control
treatment with cannabinoids alone lasted for 6 h and with LPS
alone for 4 h. The choice of these time points for transcriptional
profiling was guided by our previous studies [11,13] as well as by
other reports [44,45] which investigated the general temporal
pattern of microglial activation by LPS. Moreover, according to
our previous results, neither THC nor CBD treatments (both at
10 mM) significantly affected the viability of the BV-2 microglial
cells during this 6 h period [11].
The RNA prepared from these samples (in sextuplicates) was
analyzed for changes in transcriptional levels using the MouseRef-
8 v1.1 Expression BeadChip Illumina Arrays. Each of these arrays
has .24,000 mouse targets based on the NCBI mouse Reference
Sequence Database, including 16,287 constitutive exons/islands
based on the splice variants in the mouse transcriptome (Molecular
Signature Database; MouSDB3) and NCBI LocusLink databases.
The results of the analyses of the arrays showed that 32% of the
transcripts were consistently ‘‘present’’ in the BV-2 RNA samples
across all arrays. Moreover, clustering based on inter-array
Pearson correlation coefficient indicated no batch effects. Micro-
array analysis based on a threshold of p# 0.005, revealed that a
total of 22% (5338 out of 24,000 transcripts) of the Illumina gene
set was differentially regulated across treatments. Of these, 1319
gene probe sets were upregulated and 1829 transcripts were
downregulated by the LPS treatment (Figure 1A); and from these
numbers of genes, 400 transcripts were found to be upregulated
and 145 downregulated by LPS by 2-fold or more. When the fold
change was set on $3-fold (p# 0.005), we found that 226 gene
products were upregulated and 33 were downregulated by LPS
(Figure 1A). The vast majority of the LPS-affected transcripts
(89% or 1181 gene probe sets of the upregulated genes, p# 0.005
and 90% or 1641 gene probes of the downregulated transcripts,
Cannabinoid Anti-Inflammatory Networks
PLOS ONE | www.plosone.org 3 April 2013 | Volume 8 | Issue 4 | e61462

p# 0.005) represented genes that were exclusively responsive to
LPS stimulation, and not to treatment with CBD alone or THC
alone (Figure 1B).
the CBD+LPS treatment was analyzed, 1381 gene probe sets
(25.8%) were upregulated and 1666 transcripts (31.2%) were
downregulated by CBD+LPS (Figure 1A). From these numbers
of genes, 379 gene products were found to be upregulated and 489
downregulated exclusively as a response to the combination of
CBD+LPS and not affected by LPS or CBD alone (Figure 1B).
When the fold change was set on $2-fold, 502 transcripts were
upregulated and 297 gene probe sets were downregulated by the
CBD+LPS treatment (Figure 1A).
When LPS was applied in the presence of THC, 1216 gene
probe sets (22.8%) were upregulated and 1638 transcripts (30.7%)
were downregulated; and from these, 424 transcripts were found
to be upregulated and 149 downregulated by 2-fold or more
(Figure 1A). From the 1216 upregulated genes, 157 transcripts
were exclusively responsive to THC+LPS treatment alone and
from the 1638 downregulated transcripts, 285 gene probes were
affected only when THC and LPS were together (Figure 1B).
When the fold change was set on $3-fold, we found that 230 gene
products were upregulated by CBD+LPS and 236 transcripts by
THC+LPS whereas 51 gene products were downregulated by
CBD+LPS and 31 transcripts by THC+LPS (Figure 1A).
Our results also reveal that from the 5338 transcripts found to
be differentially regulated by the various treatments (p # 0.005),
680 gene probe sets were found to be upregulated by CBD alone
and 58 gene products by THC alone. CBD had also a much larger
effect compared to THC on the number of downregulated genes,
524 gene products were downregulated by CBD and 36 by THC
(Figure 1A).
The groups of LPS-upregulated and downregulated genes that
showed a change in expression of $2-fold (p#0.005) in either
direction were subjected to gene ontology (GO) analysis allowing
functional annotation using the DAVID Bioinformatics Resources
and the KEGG pathways (Figure S1). All major Biological
Processes, Cellular Components and Molecular Functions within
GO for the LPS-upregulated transcripts, were for the most part,
genes associated with the immune and defense responses as well as
apoptosis and cell death. KEGG database analysis included genes
related to Toll-like receptor pathways and antigen processing as
well as to the MAPK pathways. IPA global functional analysis of
the LPS-upregulated and downregulated genes ($2-fold; p#
0.005) confirmed the DAVID representation of genes within IPA-
specific GO categories (Figure S2). IPA global functional analysis
of the LPS-upregulated transcripts show gene products mainly
implicated in cell-to-cell signaling, cellular movements, growth and
proliferation, as well as cell death, immune response and signaling,
including genes involved in the NF-kB pathway and in the
activation of the liver X receptor/retinoic X receptor (LXR/
RXR). The largest subsets of downregulated transcripts included
genes known to be involved in the regulation of macromolecules
and nucleotide metabolism, differentiation and development as
well as regulation of gene expression and transcription (FiguresS1 and S2).
A list of 183 LPS-upregulated genes (stimulated by 2-fold or
more; p# 0.005) are presented in Table S2. This list includes
LPS-upregulated genes that were (in most cases) significantly
affected by CBD+LPS or by THC+LPS. They appear in the
Table according to their categories and specific annotations based
on their GO and IPA. The highly upregulated transcripts were
related to inflammation, host defense and adaptive response.
Inflammatory cytokines and chemokines together with their
cognate receptors comprised a large group of more than 20 genes.
Interferon related transcripts formed a significant population
comprised of 12 genes. Based on GO and relevant literature
references, genes were also classified into other functional
categories including metabolic enzymes, membrane transport
and secretion, kinases, phosphatases as well as transmembrane G-
protein coupled receptors. The remainder of the LPS-upregulated
genes was grouped according to their involvement in several other
cellular processes such as apoptosis, proliferation and cell cycle
progression, transcriptional and translational control as well as
stress response. Additionally, we have identified a cluster of genes
associated with regulation of extracellular matrix that are known
to be involved in molecular recognition between cells, cell
Figure 1. Gene array analysis of the mRNA of BV-2 cellsfollowing treatment with LPS and cannabinoids. mRNA wasprepared from BV-2 cells treated with LPS and cannabinoids andsubjected to array analysis as described in Methods. (A) Number ofdifferentially expressed genes that were either significantly upregulated(red) or downregulated (green) across the different treatmentconditions versus control untreated cells (p #0.005). The differentshades of color represent the indicated fold of change (.1, $2 and$3). (B) Venn diagrams representing the numbers of BV-2 microglialtranscripts that were either upregulated or downregulated at asignificance of p#0.005 following treatments with LPS, CBD and THC,or with a combination of LPS and one of the cannabinoids.doi:10.1371/journal.pone.0061462.g001
Cannabinoid Anti-Inflammatory Networks
PLOS ONE | www.plosone.org 4 April 2013 | Volume 8 | Issue 4 | e61462
adhesion and migration. Genes implicated in cytoskeleton
remodeling and control of cell motility and morphogenesis form
a separate category.
The gene transcripts upregulated by LPS to the highest extent
consist of interleukin 1b (Il1b; 135-fold), colony stimulating factor 3 (Csf3;
118-fold), chemokine (C-X-C motif) ligand 2 (Cxcl2; also known as
MIP-2a; 109-fold), chemokine (C-X-C motif) ligand 10 (Cxcl10; 44-
fold), serum amyloid A3 (Saa3; 38-fold), chemokine (C-C motif) receptor-
like 2 (Ccrl2; 33-fold) and CD69 antigen (Cd69; 30-fold); (Table S2).
Analysis of expression levels for the various transcripts affected
by LPS showed that a much higher number of LPS-induced genes
were significantly affected by pretreatment with CBD as compared
to THC. From the 183 LPS-upregulated genes (by 2-fold or more;
p#0.005), 73 transcripts were inhibited by 30% or more, and 13
genes were repressed by more than 60% by CBD. These later
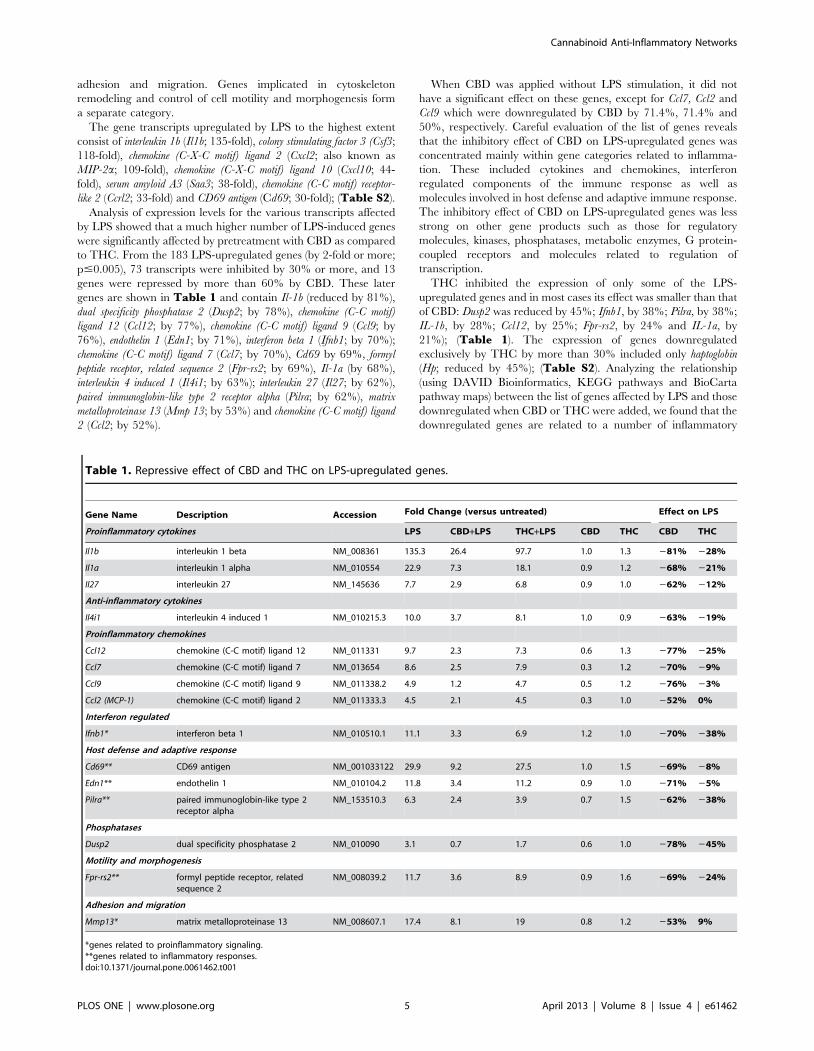
genes are shown in Table 1 and contain Il-1b (reduced by 81%),
dual specificity phosphatase 2 (Dusp2; by 78%), chemokine (C-C motif)
ligand 12 (Ccl12; by 77%), chemokine (C-C motif) ligand 9 (Ccl9; by
76%), endothelin 1 (Edn1; by 71%), interferon beta 1 (Ifnb1; by 70%);
chemokine (C-C motif) ligand 7 (Ccl7; by 70%), Cd69 by 69%, formyl
peptide receptor, related sequence 2 (Fpr-rs2; by 69%), Il-1a (by 68%),
interleukin 4 induced 1 (Il4i1; by 63%); interleukin 27 (Il27; by 62%),
paired immunoglobin-like type 2 receptor alpha (Pilra; by 62%), matrix
metalloproteinase 13 (Mmp 13; by 53%) and chemokine (C-C motif) ligand
2 (Ccl2; by 52%).
When CBD was applied without LPS stimulation, it did not
have a significant effect on these genes, except for Ccl7, Ccl2 and
Ccl9 which were downregulated by CBD by 71.4%, 71.4% and
50%, respectively. Careful evaluation of the list of genes reveals
that the inhibitory effect of CBD on LPS-upregulated genes was
concentrated mainly within gene categories related to inflamma-
tion. These included cytokines and chemokines, interferon
regulated components of the immune response as well as
molecules involved in host defense and adaptive immune response.
The inhibitory effect of CBD on LPS-upregulated genes was less
strong on other gene products such as those for regulatory
molecules, kinases, phosphatases, metabolic enzymes, G protein-
coupled receptors and molecules related to regulation of
transcription.
THC inhibited the expression of only some of the LPS-
upregulated genes and in most cases its effect was smaller than that
of CBD: Dusp2 was reduced by 45%; Ifnb1, by 38%; Pilra, by 38%;
IL-1b, by 28%; Ccl12, by 25%; Fpr-rs2, by 24% and IL-1a, by
21%); (Table 1). The expression of genes downregulated
exclusively by THC by more than 30% included only haptoglobin
(Hp; reduced by 45%); (Table S2). Analyzing the relationship
(using DAVID Bioinformatics, KEGG pathways and BioCarta
pathway maps) between the list of genes affected by LPS and those
downregulated when CBD or THC were added, we found that the
downregulated genes are related to a number of inflammatory
Table 1. Repressive effect of CBD and THC on LPS-upregulated genes.
Gene Name Description Accession Fold Change (versus untreated) Effect on LPS
Proinflammatory cytokines LPS CBD+LPS THC+LPS CBD THC CBD THC
Il1b interleukin 1 beta NM_008361 135.3 26.4 97.7 1.0 1.3 281% 228%
Il1a interleukin 1 alpha NM_010554 22.9 7.3 18.1 0.9 1.2 268% 221%
Il27 interleukin 27 NM_145636 7.7 2.9 6.8 0.9 1.0 262% 212%
Anti-inflammatory cytokines
Il4i1 interleukin 4 induced 1 NM_010215.3 10.0 3.7 8.1 1.0 0.9 263% 219%
Proinflammatory chemokines
Ccl12 chemokine (C-C motif) ligand 12 NM_011331 9.7 2.3 7.3 0.6 1.3 277% 225%
Ccl7 chemokine (C-C motif) ligand 7 NM_013654 8.6 2.5 7.9 0.3 1.2 270% 29%
Ccl9 chemokine (C-C motif) ligand 9 NM_011338.2 4.9 1.2 4.7 0.5 1.2 276% 23%
Ccl2 (MCP-1) chemokine (C-C motif) ligand 2 NM_011333.3 4.5 2.1 4.5 0.3 1.0 252% 0%
Interferon regulated
Ifnb1* interferon beta 1 NM_010510.1 11.1 3.3 6.9 1.2 1.0 270% 238%
Host defense and adaptive response
Cd69** CD69 antigen NM_001033122 29.9 9.2 27.5 1.0 1.5 269% 28%
Edn1** endothelin 1 NM_010104.2 11.8 3.4 11.2 0.9 1.0 271% 25%
Pilra** paired immunoglobin-like type 2receptor alpha
NM_153510.3 6.3 2.4 3.9 0.7 1.5 262% 238%
Phosphatases
Dusp2 dual specificity phosphatase 2 NM_010090 3.1 0.7 1.7 0.6 1.0 278% 245%
Motility and morphogenesis
Fpr-rs2** formyl peptide receptor, relatedsequence 2
NM_008039.2 11.7 3.6 8.9 0.9 1.6 269% 224%
Adhesion and migration
Mmp13* matrix metalloproteinase 13 NM_008607.1 17.4 8.1 19 0.8 1.2 253% 9%
*genes related to proinflammatory signaling.**genes related to inflammatory responses.doi:10.1371/journal.pone.0061462.t001
Cannabinoid Anti-Inflammatory Networks
PLOS ONE | www.plosone.org 5 April 2013 | Volume 8 | Issue 4 | e61462

pathways including Toll-like receptor, Jak/STAT, IL-10 or IFNbsignaling pathways.
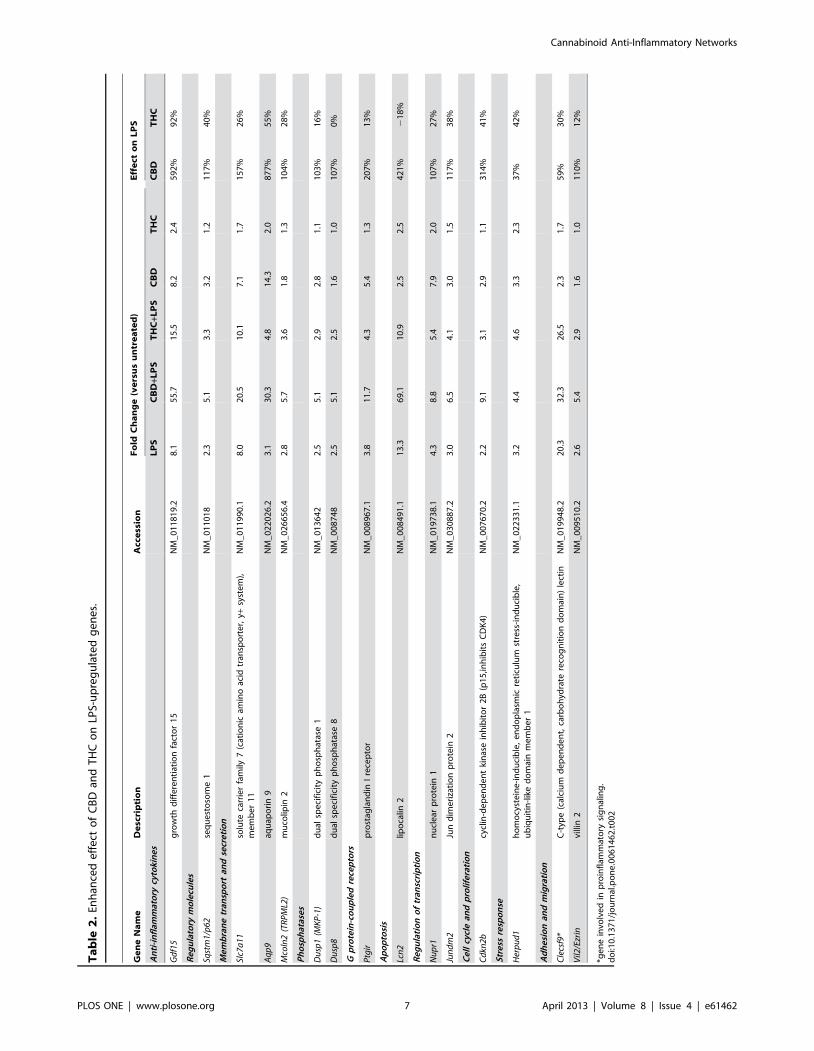
Interestingly, we found a significant number of LPS-upregulated
genes whose expression was increased by CBD pretreatment. CBD
enhanced the expression of 165 genes from the list of the $2-fold
LPS-upregulated genes (Table S2). The expression of 28 of these
genes was enhanced by more than 30%. These genes were present
mainly within the categories of regulation of transcription, cell
cycle and proliferation, apoptosis, membrane transport and
secretion, phosphatases, cell adhesion as well as of host defense
and adaptive responses. Among them, we would like to mention
(Table 2) 15 genes whose expression was largely enhanced by
CBD. These included aquaporin 9 (Aqp9; upregulated by 877%),
growth differentiation factor 15 (Gdf15; also known as macrophage
inhibitory cytokine 1, MIC-1; by 592%), lipocalin 2 (Lcn2; by 421%),
Cdkn2b/p15 (by 314%), prostaglandin 1 receptor (Ptgir; by 207%), solute
carrier family 7 member 11 (Slc7a11; by 157%), sequestosome 1/p62
(Sqstm1/p62; by 117%), Jun dimerization protein 2 (Jundm2; by 117%);
villin 2 (Vil2; by 110%), dual specificity phosphatase 8 (Dusp8; by 107%),
nuclear protein 1/p8 (Nupr1/p8; by 107%), mucolipin 2 (Mcoln2/
TRPML2; by 104%), Dusp1 (by 103%), C-type (calcium dependent,
carbohydrate recognition domain) lectin (Clecsf9; by 59%) and homocysteine-
inducible, endoplasmic reticulum stress-inducible, ubiquitin-like domain
member 1 (Herpud1; 37%). It is important to note that synergistic-
like effect between CBD and LPS was observed regarding the
expression of Aqp9, Gdf15, Lcn2, Cdkn2b, Ptgir, Slc7a11 and Clecsf9.
In contrast to CBD, a smaller number of LPS-upregulated genes
showed increased expression as a result of treatment with
THC+LPS (Table 2). These included Gdf15 (enhanced by
92%), Aqp9 (by 55%), interleukin 15 (Il15; by 47%), Herpud1 (by
42%), Cdkn2b (by 41%), Sqstm1/p62 (by 40%), Jundm2 (by38%) and
Clecsf9 (by 30%). From these transcripts, only two gene products,
Gdf15 and Clecsf9, were induced synergistically by the combination
of THC+LPS. As for the remainder of THC sensitive genes, only
in two cases we have seen enhancement of the LPS-upregulated
mRNA expression levels by THC and not by CBD. These
included guanylate nucleotide binding protein 5 (Gbp5; 36%) and
myxovirus resistance 1 (Mx1; 33%); (Table S2).
As for the 145 transcripts that were downregulated by $2-fold
(i.e., by 50% or more; p# 0.005) after LPS treatment, Table S3shows 82 gene products that were affected by CBD+LPS or by
THC+LPS. The largest subsets of LPS-downregulated transcripts
include genes known to be involved in cell cycle and proliferation,
as well as in regulation of gene expression and transcription.
Among the 33 genes that were downregulated by LPS treatment
by $3-fold (i.e., by 75% or more; p#0.005), the most affected
genes included Epstein-Barr virus induced gene 2/G protein-coupled
receptor 183 (Ebi2/Gpr183; reduced by 89%), kelch-like 6 (Klhl6; by
87.5%), lymphoblastomic leukemia (Lyl1; by 81.5%), pleckstrin homology,
sec7 and coiled-coil domains, binding protein (Pscdbp; by 80.8%), beta
galactoside alpha 2,6 sialyltransferase 1 (St6gal1; by 78.7%), sestrin 1
(Sesn1; by 77.3%), ubiquitin specific protease 2, transcript variant 2 (Usp2;
by 76.7%), CD28 antigen (Cd28; by 75.6%) and c-mer proto-oncogene
tyrosine kinase (Mertk; by 75%); (Table S3).
From the 82 LPS-downregulated genes presented in Table S3,
CBD pretreatment counteracted the reduction in mRNA levels of
16 genes (by 30% or more) and 2 were affected by more than 60%.
These genes almost exclusively belong to the functional categories
of cell adhesion and migration, motility and morphogenesis,
regulation of transcription as well as of membrane transport and
secretion. These genes (Table 3) include neurophilin 1(Nrp1; whose
reduction was completely abolished), neural precursor cell expressed
developmentally down-regulated gene 9 (Nedd9; reversed by 69%), basic
helix-loop-helix domain containing class B2 (Bhlhb2; by 56%), unc-5
homolog B (Unc5b; by 53%), Cd28 (by 49%), SRY-box containing gene 4
(Sox4; by 42%) and potassium channel, subfamily K, member 13 (Kcnk13;
by 42%). Treatment with THC resulted in a much weaker
attenuation of the LPS-induced downregulation of gene expression
and only in the case of Nrp1 exceeded 30%. DAVID Bioinfor-
matics Resources and KEGG pathway analyses identify Nrp1 and
Unc5b as genes related to axon guidance and Nedd9 as a gene
related to adherens junction dynamics.
In several cases, we have observed that treatment with CBD
further potentiated the LPS-downregulation of some genes. These
genes were spotted across almost all identified gene categories;
however they were particularly concentrated within those related
to cell cycle and proliferation, stress response, metabolic processes
and phosphatases. Thus, CBD significantly enhanced the LPS-
downregulation of a number of important genes including cyclin D1
(Ccnd1; by additional 155%), Pscdbp (by 111%), myocyte enhancer factor
2c (Mef2c, by 95%), Cxcl14 (by 93%), paladin (Pald; by 88%), Ebi2/
Gpr183 (by 82%), Klhl6 (by 72%) and RAS guanyl releasing protein 3
(Rasgrp3, by 66%), heat shock 70 kDa protein 5 binding protein 1
(Hspa5bp1, by 64%); zinc finger protein 36, C3H type-like 1 (Zfp 36l1,
by 61%), carbohydrate sulfotransferase 10 (Chst10, by 59%) and SH3-
binding kinase (Sbk, by 51%); (Table 4). As for THC, from the 75
genes that were downregulated when both THC and LPS were
present, only two transcripts were markedly downregulated due to
the THC treatment. These included Pscdbp reduced by 40% and
Chst10 by 38% compared with the levels obtained with LPS alone.
Validation of microarray resultsA large number of genes that were identified by microarray
analysis as differentially regulated were subjected to validation by
qPCR using B2m as a reference gene. Many of them were selected
to be validated according to the distinct effects of cannabinoids on
the LPS affected genes. The qPCR assays were repeated several
times using at least 3 mRNA preparations from independent
experiments. The results are expressed as fold change relative to
control levels. We found that in almost all cases, there has been a
very good agreement between the microarray and the qPCR data
in terms of direction of change as well as of its magnitude
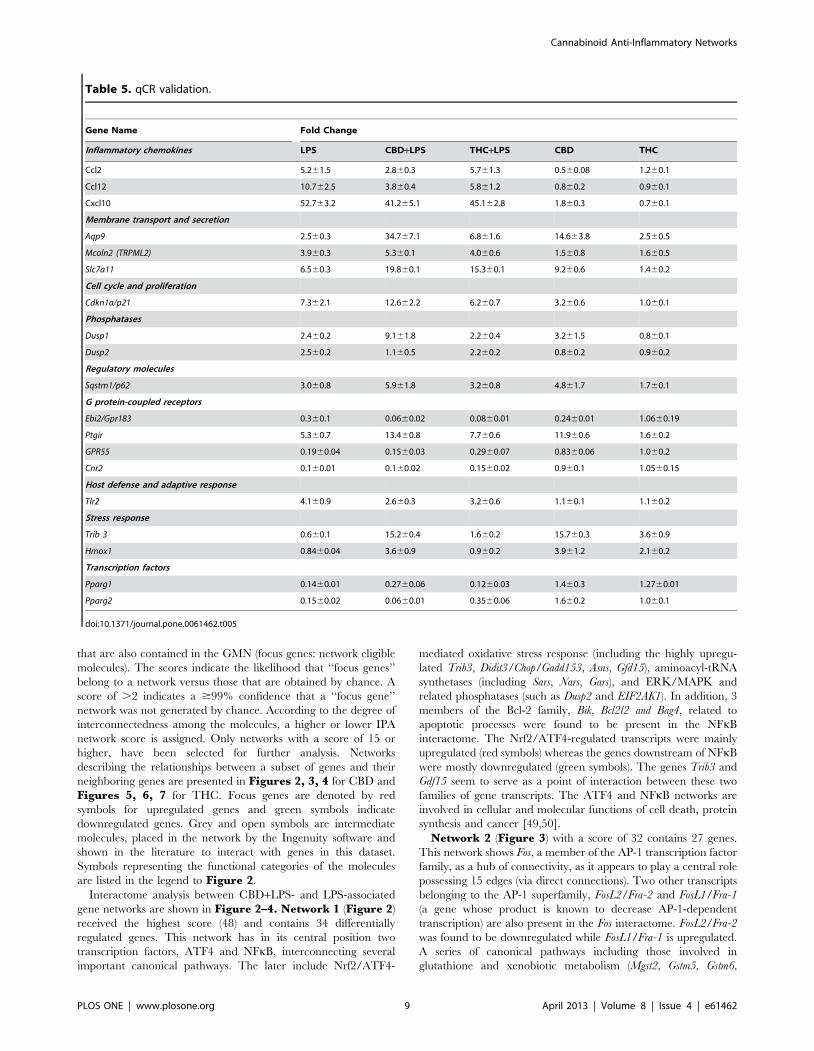
(Table 5). For example, the qPCR data show that LPS
upregulates the expression of the inflammatory chemokines Ccl2,
Ccl12 and Cxcl10, the transporters and channels Aqp9, Mcoln2
(TRPML2) and Slc7a11, the kinase inhibitor Cdkn1a, the phospha-
tases Dusp1 and Dusp2, the regulatory molecule Sqstm1/p62, the G
protein-coupled receptor Ptgir and the receptor Tlr2. The qPCR
data also show that LPS downregulates the expression of the G
protein-coupled receptors Ebi2/Gpr183, Cnr2 and Gpr55, and the
transcription factors Pparg1 and Pparg2. In addition, in agreement
with the microarray data, the stress response genes Trib3 and
Hmox1 are upregulated by CBD+LPS but not by LPS alone or by
THC+LPS.
Network analysis and signaling pathways – Functionalassociations between the effects of cannabinoids andLPS
The differential mRNA expression patterns as revealed by the
arrays of BV-2 cells treated with LPS alone or in combination with
either CBD or THC, were analyzed using the Ingenuity System
Database, software that includes the Ingenuity Knowledge Base
(IKB) and the Global Molecular Network (GMN). These
databases integrate published findings on biologically meaningful
genetic or molecular gene/gene product interactions and identify
functionally related gene networks.
Cannabinoid Anti-Inflammatory Networks
PLOS ONE | www.plosone.org 6 April 2013 | Volume 8 | Issue 4 | e61462
Ta
ble
2.
Enh
ance
de
ffe
cto
fC
BD
and
TH
Co
nLP
S-u
pre
gu
late
dg
en
es.
Ge
ne
Na
me
De
scri
pti
on
Acc
ess
ion
Fo
ldC
ha
ng
e(v
ers
us
un
tre
ate
d)
Eff
ect
on
LP
S
An
ti-i
nfl
amm
ato
rycy
toki
ne
sL
PS
CB
D+L
PS
TH
C+L
PS
CB
DT
HC
CB
DT
HC
Gd
f15
gro
wth
dif
fere
nti
atio
nfa
cto
r1
5N
M_
01
18
19
.28
.15
5.7
15
.58
.22
.45
92
%9
2%
Re
gu
lato
rym
ole
cule
s
Sqst
m1/
p62
seq
ue
sto
som
e1
NM
_0
11
01
82
.35
.13
.33
.21
.21
17
%4
0%
Me
mb
ran
etr
ansp
ort
and
secr
eti
on
Slc7
a11
solu
teca
rrie
rfa
mily
7(c
atio
nic
amin
oac
idtr
ansp
ort
er,
y+sy
ste
m),
me
mb
er
11
NM
_0
11
99
0.1
8.0
20
.51
0.1
7.1
1.7
15
7%
26
%
Aq
p9
aqu
apo
rin
9N
M_
02
20
26
.23
.13
0.3
4.8
14
.32
.08
77
%5
5%
Mco
ln2
(TR
PM
L2)
mu
colip
in2
NM
_0
26
65
6.4
2.8
5.7
3.6
1.8
1.3
10
4%
28
%
Ph
osp
hat
ase
s
Du
sp1
(MK
P-1
)d
ual
spe
cifi
city
ph
osp
hat
ase
1N
M_
01
36
42
2.5
5.1
2.9
2.8
1.1
10
3%
16
%
Du
sp8
du
alsp
eci
fici
typ
ho
sph
atas
e8
NM
_0
08
74
82
.55
.12
.51
.61
.01
07
%0
%
Gp
rote
in-c
ou
ple
dre
cep
tors
Ptg
irp
rost
agla
nd
inI
rece
pto
rN
M_
00
89
67
.13
.81
1.7
4.3
5.4
1.3
20
7%
13
%
Ap
op
tosi
s
Lcn
2lip
oca
lin2
NM
_0
08
49
1.1
13
.36
9.1
10
.92
.52
.54
21
%2
18
%
Re
gu
lati
on
of
tran
scri
pti
on
Nu
pr1
nu
cle
arp
rote
in1
NM
_0
19
73
8.1
4.3
8.8
5.4
7.9
2.0
10
7%
27
%
Jun
dm
2Ju
nd
ime
riza
tio
np
rote
in2
NM
_0
30
88
7.2
3.0
6.5
4.1
3.0
1.5
11
7%
38
%
Ce
llcy
cle
and
pro
life
rati
on
Cd
kn2b
cycl
in-d
ep
en
de
nt
kin
ase
inh
ibit
or
2B
(p1
5,in
hib
its
CD
K4
)N
M_
00
76
70
.22
.29
.13
.12
.91
.13
14
%4
1%
Str
ess
resp
on
se
Her
pu
d1
ho
mo
cyst
ein
e-i
nd
uci
ble
,e
nd
op
lasm
icre
ticu
lum
stre
ss-i
nd
uci
ble
,u
biq
uit
in-l
ike
do
mai
nm
em
be
r1
NM
_0
22
33
1.1
3.2
4.4
4.6
3.3
2.3
37
%4
2%
Ad
he
sio
nan
dm
igra
tio
n
Cle
csf9
*C
-typ
e(c
alci
um
de
pe
nd
en
t,ca
rbo
hyd
rate
reco
gn
itio
nd
om
ain
)le
ctin
NM
_0
19
94
8.2
20
.33
2.3
26
.52
.31
.75
9%
30
%
Vil2
/Ezr
invi
llin
2N
M_
00
95
10
.22
.65
.42
.91
.61
.01
10
%1
2%
*ge
ne
invo
lve
din
pro
infl
amm
ato
rysi
gn
alin
g.
do
i:10
.13
71
/jo
urn
al.p
on
e.0
06
14
62
.t0
02
Cannabinoid Anti-Inflammatory Networks
PLOS ONE | www.plosone.org 7 April 2013 | Volume 8 | Issue 4 | e61462

The differential gene expression values (e.g.; CBD+LPS versus
LPS treatment or THC+LPS versus LPS) were entered into IPA to
determine the most highly regulated networks of gene interactions
and to highlight the biological processes that are relevant to each
of the treatments. The IPA computation gives a score for each
network according to the fit of the set of supplied affected genes
Table 3. Opposing effects of CBD and THC on LPS-downregulated genes.
Gene Name Description Accession Fold Change (versus untreated) Effect on LPS
Adhesion and migration LPS CBD+LPS THC+LPS CBD THC CBD THC
Cd28* CD28 antigen NM_007642.2 24.1 22.1 23.3 1.3 21.2 249% 220%
Nrp1 neuropilin 1 NM_008737.1 23.4 0.0 22.2 1.6 21.1 2100% 233%
Unc5b unc-5 homolog B (C. elegans) NM_029770.1 22.9 1.4 22.4 1.7 21.4 253% 215%
Motility and morphogenesis
Nedd9 neural precursor cell expressed,developmentally down-regulated gene 9
NM_017464.2 22.8 20.9 22.3 21.0 21.4 269% 220%
Membrane transport and secretion
Kcnk13 potassium channel, subfamily K,member 13
NM_146037.1 22.2 21.3 21.6 20.9 20.9 242% 227%
Regulation of transcription
Sox4 SRY-box containing gene 4 NM_009238.1 23.1 21.8 22.8 2.1 0.9 242% 210%
Bhlhb2 basic helix-loop-helix domaincontaining, class B2
NM_011498.4 22.5 21.1 21.9 1.0 1.0 256% 224%
*gene related to inflammatory responses.doi:10.1371/journal.pone.0061462.t003
Table 4. Potentiated effect of CBD and THC on LPS-downregulated genes.
Gene Name Description Accession Fold Change (versus untreated) Effect on LPS
Stress response LPS CBD+LPS THC+LPS CBD THC CBD THC
Sesn1 sestrin 1 NM_001013370.2 24.4 26.3 24.2 21.7 21.1 43% 23%
Hspa5bp1 heat shock 70 kDa protein 5 bindingprotein 1
NM_133804.1 23.6 25.8 24.1 21.0 21.5 64% 14%
Proinflammatory chemokines
Cxcl14 chemokine (C-X-C motif) ligand 14 NM_019568.2 21.1 22.1 21.2 22.6 21.4 93% 11%
Metabolic enzymes
Chst10 carbohydrate sulfotransferase 10 NM_145142.1 23.2 25.0 24.3 22.2 21.8 59% 38%
Cell cycle and proliferation
Klhl6 kelch-like 6 (Drosophila) NM_183390.1 28.0 213.7 29.1 21.9 21.4 72% 13%
Rasgrp3 RAS guanyl releasing protein 3 NM_207246.2 22.7 24.5 22.4 21.4 21.1 66% 213%
Ccnd1 cyclin D1 NM_007631.2 22.4 26.0 22.8 22.9 21.2 155% 20%
Zfp36l1 zinc finger protein 36, C3H type-like 1 NM_007564.2 22.0 23.2 22.2 21.1 21.0 61% 9%
Motility and morphogenesis
Pscdbp* pleckstrin homology, Sec7 and coiled-coildomains, binding protein
NM_139200.4 25.2 211.0 27.3 22.1 21.7 111% 40%
Phosphatases
Pald paladin NM_013753.1 23.0 25.7 23.3 22.0 21.2 88% 9%
Kinases
Sbk SH3-binding kinase NM_145587.1 22.2 23.2 22.3 21.2 21.2 51% 8%
G protein-coupled receptors
Ebi2 Epstein-Barr virus induced gene2/GprPR183
NM_183031.2 29.1 216.6 210.6 22.4 21.3 82% 16%
Regulation of transcription
Mef2c myocyte enhancer factor 2C NM_025282.1 22.1 24.1 22.3 22.1 21.2 95% 11%
*gene related to inflammatory responses.doi:10.1371/journal.pone.0061462.t004
Cannabinoid Anti-Inflammatory Networks
PLOS ONE | www.plosone.org 8 April 2013 | Volume 8 | Issue 4 | e61462
that are also contained in the GMN (focus genes: network eligible
molecules). The scores indicate the likelihood that ‘‘focus genes’’
belong to a network versus those that are obtained by chance. A
score of .2 indicates a $99% confidence that a ‘‘focus gene’’
network was not generated by chance. According to the degree of
interconnectedness among the molecules, a higher or lower IPA
network score is assigned. Only networks with a score of 15 or
higher, have been selected for further analysis. Networks
describing the relationships between a subset of genes and their
neighboring genes are presented in Figures 2, 3, 4 for CBD and
Figures 5, 6, 7 for THC. Focus genes are denoted by red
symbols for upregulated genes and green symbols indicate
downregulated genes. Grey and open symbols are intermediate
molecules, placed in the network by the Ingenuity software and
shown in the literature to interact with genes in this dataset.
Symbols representing the functional categories of the molecules
are listed in the legend to Figure 2.
Interactome analysis between CBD+LPS- and LPS-associated
gene networks are shown in Figure 2–4. Network 1 (Figure 2)
received the highest score (48) and contains 34 differentially
regulated genes. This network has in its central position two
transcription factors, ATF4 and NFkB, interconnecting several
important canonical pathways. The later include Nrf2/ATF4-
mediated oxidative stress response (including the highly upregu-
lated Trib3, Didit3/Chop/Gadd153, Asns, Gfd15), aminoacyl-tRNA
synthetases (including Sars, Nars, Gars), and ERK/MAPK and
related phosphatases (such as Dusp2 and EIF2AK1). In addition, 3
members of the Bcl-2 family, Bik, Bcl2l2 and Bag4, related to
apoptotic processes were found to be present in the NFkB
interactome. The Nrf2/ATF4-regulated transcripts were mainly
upregulated (red symbols) whereas the genes downstream of NFkB
were mostly downregulated (green symbols). The genes Trib3 and
Gdf15 seem to serve as a point of interaction between these two
families of gene transcripts. The ATF4 and NFkB networks are
involved in cellular and molecular functions of cell death, protein
synthesis and cancer [49,50].
Network 2 (Figure 3) with a score of 32 contains 27 genes.
This network shows Fos, a member of the AP-1 transcription factor
family, as a hub of connectivity, as it appears to play a central role
possessing 15 edges (via direct connections). Two other transcripts
belonging to the AP-1 superfamily, FosL2/Fra-2 and FosL1/Fra-1
(a gene whose product is known to decrease AP-1-dependent
transcription) are also present in the Fos interactome. FosL2/Fra-2
was found to be downregulated while FosL1/Fra-1 is upregulated.
A series of canonical pathways including those involved in
glutathione and xenobiotic metabolism (Mgst2, Gstm5, Gstm6,
Table 5. qCR validation.
Gene Name Fold Change
Inflammatory chemokines LPS CBD+LPS THC+LPS CBD THC
Ccl2 5.261.5 2.860.3 5.761.3 0.560.08 1.260.1
Ccl12 10.762.5 3.860.4 5.861.2 0.860.2 0.960.1
Cxcl10 52.763.2 41.265.1 45.162.8 1.860.3 0.760.1
Membrane transport and secretion
Aqp9 2.560.3 34.767.1 6.861.6 14.663.8 2.560.5
Mcoln2 (TRPML2) 3.960.3 5.360.1 4.060.6 1.560.8 1.660.5
Slc7a11 6.560.3 19.860.1 15.360.1 9.260.6 1.460.2
Cell cycle and proliferation
Cdkn1a/p21 7.362.1 12.662.2 6.260.7 3.260.6 1.060.1
Phosphatases
Dusp1 2.460.2 9.161.8 2.260.4 3.261.5 0.860.1
Dusp2 2.560.2 1.160.5 2.260.2 0.860.2 0.960.2
Regulatory molecules
Sqstm1/p62 3.060.8 5.961.8 3.260.8 4.861.7 1.760.1
G protein-coupled receptors
Ebi2/Gpr183 0.360.1 0.0660.02 0.0860.01 0.2460.01 1.0660.19
Ptgir 5.360.7 13.460.8 7.760.6 11.960.6 1.660.2
GPR55 0.1960.04 0.1560.03 0.2960.07 0.8360.06 1.060.2
Cnr2 0.160.01 0.160.02 0.1560.02 0.960.1 1.0560.15
Host defense and adaptive response
Tlr2 4.160.9 2.660.3 3.260.6 1.160.1 1.160.2
Stress response
Trib 3 0.660.1 15.260.4 1.660.2 15.760.3 3.660.9
Hmox1 0.8460.04 3.660.9 0.960.2 3.961.2 2.160.2
Transcription factors
Pparg1 0.1460.01 0.2760.06 0.1260.03 1.460.3 1.2760.01
Pparg2 0.1560.02 0.0660.01 0.3560.06 1.660.2 1.060.1
doi:10.1371/journal.pone.0061462.t005
Cannabinoid Anti-Inflammatory Networks
PLOS ONE | www.plosone.org 9 April 2013 | Volume 8 | Issue 4 | e61462

Gsto2, Gstm4, Gsta5, zinc metallothionein 2a (Mt2a), Znf467, folate
transporter Slc19a1/Rfc1, Pdk1, Ube1c/Uba3) as well as those
involved in LPS/IL-1 mediated inhibition of either RXR or the
peroxisome proliferator activated receptor (PPAR) signaling (Rar,
Rdh5, Ncoa5, Ap1, Fos, Ets) were found to participate in this
network. Fos directly interacts with Gsta5 (from the glutathione-S-
transferase family), known to belong together with cytochrome
P450 enzymes, NAD(P) H:quinone oxido-reductase 1 (Nqo1) and
aldehyde dehydrogenase 3 to a group of genes encoding phase 1
and phase 2 xenobiotic metabolizing enzymes [51]. Altogether,
Network 2 is in correlation with a set of cellular and molecular
functions which include amino acid-, vitamin- and mineral-
metabolism and transport as well as cell signaling.
Network 3 (Figure 4) with a score of 28, includes 25 genes. This
network presents p38MAPK in a central position and overlaps
with canonical pathways for calcium signaling (Nfat5, Itpr1, Pka,
ATP2A2, Ank2, Ogt, Mef2b), FGF pathway (Fgf21, ERK1/2), B cell
signaling (Mef2c, Itpr1, ERK1/2, Sh3bp2, Creb) and p38MAPK
signaling (Dusp8, Mef2c, Creb, Nfat5, Esrra). The IPA interactome
analysis has linked the CBD-stimulated expression of Dusp8 (via
the negative modulation of p38MAPK) to the attenuation of LPS-
mediated induction of Nfat5, a member of the inflammatory
transcription family. In addition, 3 members of the complement
component 1q (C1qa, C1qb and C1qc) that recognize antibody-
bound pathogens and trigger the complement classical pathway,
were found to be present in the p38MAPK interactome. This
network seems to be related to functions of cell signaling, tissue
morphology and neurological diseases.
The levels of changes in gene expression induced by combined
treatment of LPS and THC (versus that induced by LPS alone) are
smaller than those observed for the combined treatment of LPS
with CBD (versus LPS alone). These LPS+THC affected genes
encompassed three networks of specific molecular interactions.
Network 4 (Figure 5) with a score of 32 contains 16
differentially regulated focus molecules and presents the transcrip-
tion factors AP-1, Akt and NFkB in its central positions. The gene
products within the displayed network were found to be part of a
number of canonical pathways. For example, the genes X-box
binding protein 1 (Xbp1) and Tgfbr2/3 are related to the glucocor-
ticoid receptor signaling. The progressive multifocal leukoencephalopathy
(Pml) is related to retinoic acid receptor (RAR) activation and
PPAR signaling, and the neuraminidase 3 (Neu3) to ceramide
pathway and to p38MAPK. The gene Trem1 is involved in
immune response and Vegfa and Thbs1 are related to the
angiogenesis pathway. Altogether, this network shows that THC
affects several biological processes including immune and
lymphatic system development and function as well as tissue
morphology.
THC also led to changes in the LPS effects on several other
groups of genes. Network 5 received a score of 23 and is
populated with 12 genes, with retinoic acid as a transcription
regulator positioned at its center (Figure 6). A number of
canonical pathways related to axonal guidance (Sema3a, Rock2,
Dpysl2/Crmp2, Dpysl5/Cram, Spg3a/Atl1, Foxd3), synaptic plasticity
(Raver1), cell adhesion (Adam2), actin cytoskeleton (Rock2, Foxd3) as
well as gene products involved in the activation of the nuclear
receptor family of transcription factors LXR/RXR (Es1,
Rnf113a1), were found to participate in this network. Cell to cell
interaction as well as tissue development are the major biological
processes related to this network.
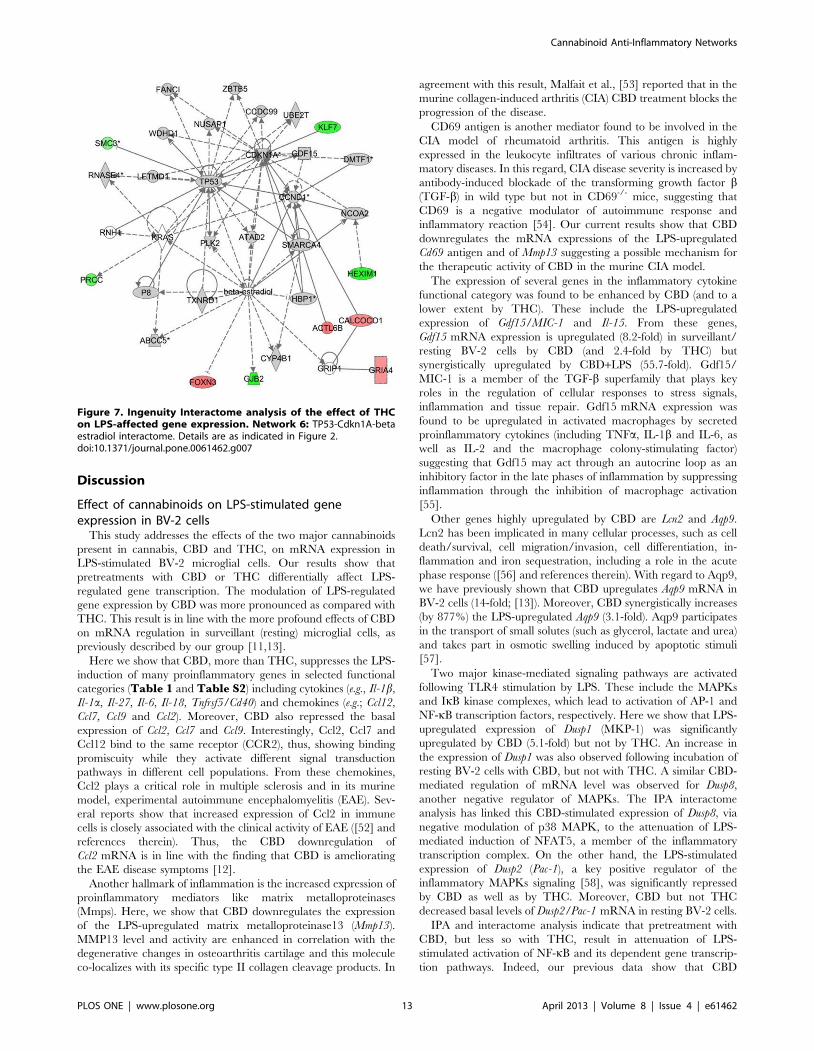
Finally, Network 6 with a score of 16 and 9 genes shows Tp53,
Cdkn1A and beta-estradiol at the central nodes of the interactome
(Figure 7). This network overlaps with the aryl hydrocarbon and
Figure 2. Ingenuity Interactome analysis of the effect of CBD on LPS-affected gene expression. Network analysis of the genes whoseexpression was affected by LPS+CBD vs LPS was performed using the Ingenuity software. Each network displays the genes/gene products as nodes(different shapes representing the functional classes of gene products) and the biological relationships between the nodes as lines. The length ofeach line reflects the amount of literature evidence supporting this node-to-node relationship. The color intensity of each node indicates the degreeof upregulation (red) or downregulation (green) of the respective gene transcript. Genes in gray have been shown (in the literature) to interact withthe colored gene products that appear in this scheme. Network 1: The NFkB-ATF4 interactome – Interaction between the CBD-upregulated Trib3and the attenuation of the NF-kB transcription factor (responsible for the transcription of many proinflammatory genes) shows the connection of thisnetwork to anti-inflammatory responses.doi:10.1371/journal.pone.0061462.g002
Cannabinoid Anti-Inflammatory Networks
PLOS ONE | www.plosone.org 10 April 2013 | Volume 8 | Issue 4 | e61462
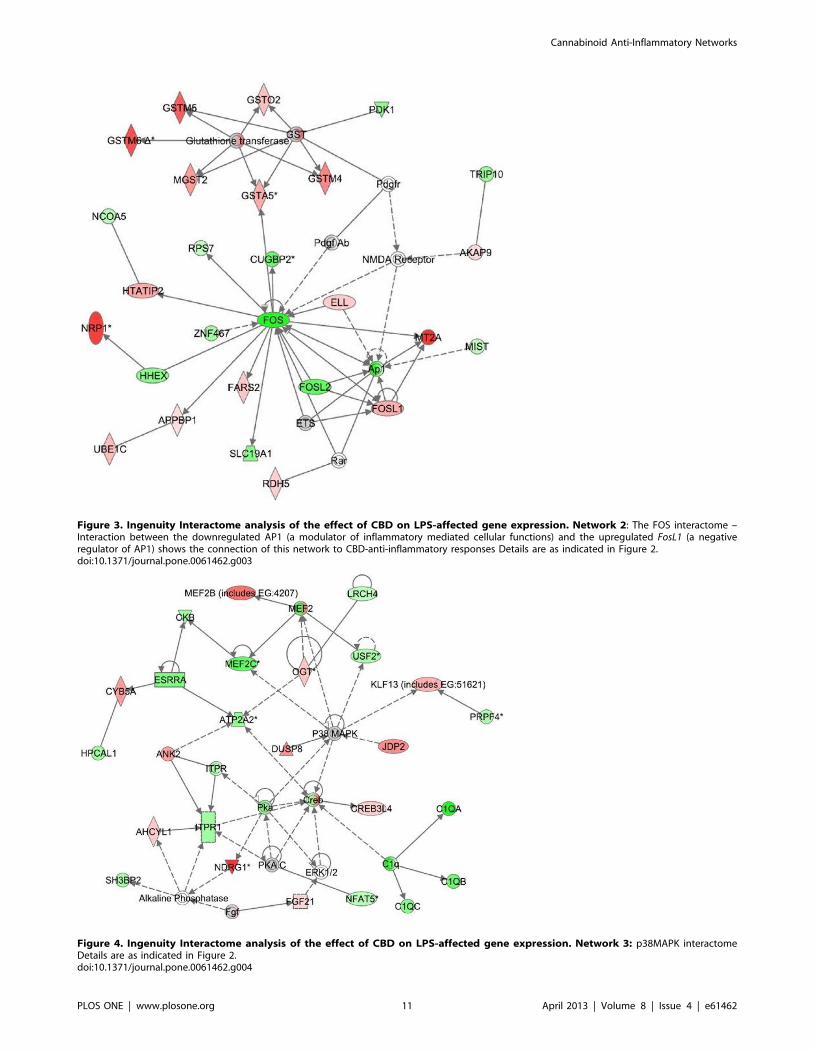
Figure 3. Ingenuity Interactome analysis of the effect of CBD on LPS-affected gene expression. Network 2: The FOS interactome –Interaction between the downregulated AP1 (a modulator of inflammatory mediated cellular functions) and the upregulated FosL1 (a negativeregulator of AP1) shows the connection of this network to CBD-anti-inflammatory responses Details are as indicated in Figure 2.doi:10.1371/journal.pone.0061462.g003
Figure 4. Ingenuity Interactome analysis of the effect of CBD on LPS-affected gene expression. Network 3: p38MAPK interactomeDetails are as indicated in Figure 2.doi:10.1371/journal.pone.0061462.g004
Cannabinoid Anti-Inflammatory Networks
PLOS ONE | www.plosone.org 11 April 2013 | Volume 8 | Issue 4 | e61462

glucocorticoid receptor signaling. Phosphatidylinositol 3-kinase
(PI3K)/Akt (Tp53/Trp53, Cdkn1A, Ccnd1), p53 (Tp53/Trp53, Prcc,
Cdkn1A, Gdf15, Ccnd1, Smc3), beta estradiol (Foxn3, Gjb2, Hexim1,
Gria4, Calcoco1) as well as JAK/Stat (Cdkn1A, Klf7) signaling are
affected. This network is correlated with functions of cell cycle
control, reproductive malfunctions and cancer.
Figure 5. Ingenuity Interactome analysis of the effect of THC on LPS-affected gene expression. Network 4: The AP1-Akt-NFkBinteractome Network analysis of the genes whose expression was affected by LPS+THC vs LPS was performed using the Ingenuity software. Detailsare as indicated in Figure 2.doi:10.1371/journal.pone.0061462.g005
Figure 6. Ingenuity Interactome analysis of the effect of THC on LPS-affected gene expression. Network 5: The retinoic acidinteractome Details are as indicated in Figure 2.doi:10.1371/journal.pone.0061462.g006
Cannabinoid Anti-Inflammatory Networks
PLOS ONE | www.plosone.org 12 April 2013 | Volume 8 | Issue 4 | e61462
Discussion
Effect of cannabinoids on LPS-stimulated geneexpression in BV-2 cells
This study addresses the effects of the two major cannabinoids
present in cannabis, CBD and THC, on mRNA expression in
LPS-stimulated BV-2 microglial cells. Our results show that
pretreatments with CBD or THC differentially affect LPS-
regulated gene transcription. The modulation of LPS-regulated
gene expression by CBD was more pronounced as compared with
THC. This result is in line with the more profound effects of CBD
on mRNA regulation in surveillant (resting) microglial cells, as
previously described by our group [11,13].
Here we show that CBD, more than THC, suppresses the LPS-
induction of many proinflammatory genes in selected functional
categories (Table 1 and Table S2) including cytokines (e.g., Il-1b,
Il-1a, Il-27, Il-6, Il-18, Tnfrsf5/Cd40) and chemokines (e.g.; Ccl12,
Ccl7, Ccl9 and Ccl2). Moreover, CBD also repressed the basal
expression of Ccl2, Ccl7 and Ccl9. Interestingly, Ccl2, Ccl7 and
Ccl12 bind to the same receptor (CCR2), thus, showing binding
promiscuity while they activate different signal transduction
pathways in different cell populations. From these chemokines,
Ccl2 plays a critical role in multiple sclerosis and in its murine
model, experimental autoimmune encephalomyelitis (EAE). Sev-
eral reports show that increased expression of Ccl2 in immune
cells is closely associated with the clinical activity of EAE ([52] and
references therein). Thus, the CBD downregulation of
Ccl2 mRNA is in line with the finding that CBD is ameliorating
the EAE disease symptoms [12].
Another hallmark of inflammation is the increased expression of
proinflammatory mediators like matrix metalloproteinases
(Mmps). Here, we show that CBD downregulates the expression
of the LPS-upregulated matrix metalloproteinase13 (Mmp13).
MMP13 level and activity are enhanced in correlation with the
degenerative changes in osteoarthritis cartilage and this molecule
co-localizes with its specific type II collagen cleavage products. In
agreement with this result, Malfait et al., [53] reported that in the
murine collagen-induced arthritis (CIA) CBD treatment blocks the
progression of the disease.
CD69 antigen is another mediator found to be involved in the
CIA model of rheumatoid arthritis. This antigen is highly
expressed in the leukocyte infiltrates of various chronic inflam-
matory diseases. In this regard, CIA disease severity is increased by
antibody-induced blockade of the transforming growth factor b(TGF-b) in wild type but not in CD69-/- mice, suggesting that
CD69 is a negative modulator of autoimmune response and
inflammatory reaction [54]. Our current results show that CBD
downregulates the mRNA expressions of the LPS-upregulated
Cd69 antigen and of Mmp13 suggesting a possible mechanism for
the therapeutic activity of CBD in the murine CIA model.
The expression of several genes in the inflammatory cytokine
functional category was found to be enhanced by CBD (and to a
lower extent by THC). These include the LPS-upregulated
expression of Gdf15/MIC-1 and Il-15. From these genes,
Gdf15 mRNA expression is upregulated (8.2-fold) in surveillant/
resting BV-2 cells by CBD (and 2.4-fold by THC) but
synergistically upregulated by CBD+LPS (55.7-fold). Gdf15/
MIC-1 is a member of the TGF-b superfamily that plays key
roles in the regulation of cellular responses to stress signals,
inflammation and tissue repair. Gdf15 mRNA expression was
found to be upregulated in activated macrophages by secreted
proinflammatory cytokines (including TNFa, IL-1b and IL-6, as
well as IL-2 and the macrophage colony-stimulating factor)
suggesting that Gdf15 may act through an autocrine loop as an
inhibitory factor in the late phases of inflammation by suppressing
inflammation through the inhibition of macrophage activation
[55].
Other genes highly upregulated by CBD are Lcn2 and Aqp9.
Lcn2 has been implicated in many cellular processes, such as cell
death/survival, cell migration/invasion, cell differentiation, in-
flammation and iron sequestration, including a role in the acute
phase response ([56] and references therein). With regard to Aqp9,
we have previously shown that CBD upregulates Aqp9 mRNA in
BV-2 cells (14-fold; [13]). Moreover, CBD synergistically increases
(by 877%) the LPS-upregulated Aqp9 (3.1-fold). Aqp9 participates
in the transport of small solutes (such as glycerol, lactate and urea)
and takes part in osmotic swelling induced by apoptotic stimuli
[57].
Two major kinase-mediated signaling pathways are activated
following TLR4 stimulation by LPS. These include the MAPKs
and IkB kinase complexes, which lead to activation of AP-1 and
NF-kB transcription factors, respectively. Here we show that LPS-
upregulated expression of Dusp1 (MKP-1) was significantly
upregulated by CBD (5.1-fold) but not by THC. An increase in
the expression of Dusp1 was also observed following incubation of
resting BV-2 cells with CBD, but not with THC. A similar CBD-
mediated regulation of mRNA level was observed for Dusp8,
another negative regulator of MAPKs. The IPA interactome
analysis has linked this CBD-stimulated expression of Dusp8, via
negative modulation of p38 MAPK, to the attenuation of LPS-
mediated induction of NFAT5, a member of the inflammatory
transcription complex. On the other hand, the LPS-stimulated
expression of Dusp2 (Pac-1), a key positive regulator of the
inflammatory MAPKs signaling [58], was significantly repressed
by CBD as well as by THC. Moreover, CBD but not THC
decreased basal levels of Dusp2/Pac-1 mRNA in resting BV-2 cells.
IPA and interactome analysis indicate that pretreatment with
CBD, but less so with THC, result in attenuation of LPS-
stimulated activation of NF-kB and its dependent gene transcrip-
tion pathways. Indeed, our previous data show that CBD
Figure 7. Ingenuity Interactome analysis of the effect of THCon LPS-affected gene expression. Network 6: TP53-Cdkn1A-betaestradiol interactome. Details are as indicated in Figure 2.doi:10.1371/journal.pone.0061462.g007
Cannabinoid Anti-Inflammatory Networks
PLOS ONE | www.plosone.org 13 April 2013 | Volume 8 | Issue 4 | e61462
decreases the activity of the NFkB signaling pathway in BV-2
microglial cells via the partial reversal of the LPS-induced
degradation of IRAK-1 intermediate kinase, thus reversing IkB
degradation and reducing NF-kB p65 subunit phosphorylation.
This effect of CBD in decreasing NF-kB signaling activity is in line
with the CBD-induced diminished transcription of NF-kB-
dependent genes, e.g., IL-1b and IL-6 [11].
We and others previously reported that BV-2 cells express CB1,
CB2, GPR55, GPR18 and TRPV2, G protein-coupled receptors
and a channel that are known to interact with cannabinoids
[20,30,31,59–61]. Using gene array analysis [13,31], we have
observed that the relative levels of CB1, CB2, GPR18 and TRPV2 as
well as of the fatty acid amide hydrolase (FAAH; known to cleave
the endocannabinoid anandamide) gene transcripts were not
significantly affected by the cannabinoid treatments and their
levels did not exceed the 2-fold induction or 50% reduction by
either CBD or THC treatment. On the other hand, we show here
that LPS markedly downregulates CB2 and GPR55 and that this
downregulation is not affected by either CBD or THC pretreat-
ment. This result is in agreement with our previous report showing
that LPS markedly downregulates CB2 and GPR55 mRNAs in BV-
2 microglial cells and in microglial primary cultures [59].
Network analysis and signaling pathwaysA relationship between CBD-mediated oxidative stress response
and glutathione depletion was previously reported ([13] and
references therein). More recently, we showed that CBD-specific
gene expression profile in BV-2 cells displays changes normally
occurring under either nutrient limiting conditions or proteasome
inhibition, and that are attributed to activation of GCN2/eIF2a/
p8/ATF4/CHOP-Trib3 pathway leading to autophagy as well as
to apoptotic cell death [13]. The Trib3 gene product seem to be of
high importance to the CBD effect due to its ability to serve as a
master regulator of an array of pathways including AP-1 [62], ER
stress [63], Akt/PKB [64] and NF-kB [65]. Trib3 expression is
significantly upregulated by CBD (16-fold) as well as by THC (3.4-
fold) [13] and as observed here, remains upregulated after LPS
treatment (CBD + LPS, 14-fold; THC + LPS, 2.3-fold). According
to these gene array studies and the qPCR results, LPS by itself
does not significantly affect the expression of Trib3 mRNA. IPA
interactome analysis of the microarrays data reveals an interaction
between the CBD-upregulated Trib3 and the NF-kB transcription
factor pathway (as shown in Figure 2). This interaction seems to
be responsible for the attenuation by CBD of the transcription of
many proinflammatory genes. There are several indications
suggesting interaction between these two pathways. First, a direct
interaction between p65/RelA and Trib3 protein which induces
inhibition of PKA dependent p65 phosphorylation, was described
[65]. Second, Trib3 protein can negatively regulate the serine-
threonine kinase Akt/PKB [64], a downstream effector of PI3K
that has been implicated in the potentiation of NF-kB-induced
transcription of proinflammatory mediators [66]. This negative
regulation of Akt activity by the highly induced Trib3 gene product
could point to the mechanism for the CBD-mediated regulation of
LPS-stimulated gene expression. Indeed, the effect of CBD
treatment on a number of LPS-stimulated genes as reported here
is reminiscent of the effects described for the PI3K inhibitor
(LY294002) and for the NFkB inhibitor (BAY 11-7082) in the
murine macrophage cell line RAW264.7 activated with LPS [67].
Both PI3K and NFkB signaling pathways exert important roles in
gene expression in response to LPS, but they are not overlapping.
Specifically, treatment with CBD repressed a number of typical
proinflammatory genes (e.g.; CD40/Tnfrsf5, Tlr2 and Ccl2/Mcp-1)
stimulated by LPS, which are known to be NFkB dependent and
of other genes including Csf3, Il-1b, Il-1a and Cox2/Ptgs2, which
are under the control of both PI3K and NFkB pathways.
Finally, Trib3 was documented to interfere with the inflamma-
tory MAPK signaling via direct interaction with MEK-1 and
MKK7 leading to attenuation of AP-1 mediated transcriptional
activity in cancer HeLa cells [62]. AP-1 is a transcription factor
involved in the regulation of inflammation-mediated cellular
functions and has been shown to be inhibited by Nrf2-activating
agents [68]. Indeed, our IPA network analysis indicates that the
observed decrease in mRNA levels for a number of genes is
probably related to a reduction in AP-1 dependent transcription.
Additionally, according to these IPA results, this repression is
reinforced by combined treatments of CBD and LPS as observed
by the induction of FosL1 gene product, another negative regulator
of AP-1 (see Figure 3).
Trib3 has been shown to downregulate PPARc transcription
and serve as a potent negative regulator of adipocyte differenti-
ation [69] and PPARc is a molecular target for CBD that could be
involved in mediating transcriptional effects in BV-2 microglial
cells. Indeed, CBD has been shown to bind to PPARc in vitro as
well as to activate its transcriptional activity in 3T3L1 fibroblast
and in HEK293 transfected cells [70]. In addition, Necela et al.,
[71] described a regulatory feedback loop in which PPARcrepresses NF-kB-mediated inflammatory signaling in unstimulated
macrophages. Moreover, they show that upon activation of TLR4
in LPS-stimulated macrophages, NF-kB drives down PPARcexpression. These results are in agreement with our results
showing that LPS highly downregulates the expression of Pparg1
and Pparg2 (Table 5) in BV-2 cells.
The profiles of CBD-induced gene expression with either resting
or LPS-activated BV-2 cells, show that CBD stimulates the
transcription of several anabolic genes encoding amino acid
biosynthetic enzymes, amino acid transporters and aminoacyl-
tRNA synthetases known to be activated by ATF4, a basic leucine
zipper transcription factor, that is increased when cultured cells
are deprived of amino acids or subjected to endoplasmic reticulum
(ER) stress ([13] and references therein). The divergent types of
stress (nutrient deficiency, ER stress, hypoxia and oxidative stress)
converge on a single event—phosphorylation of the translation
initiation factor eIF2a, resulting in a general translational pause
followed by selective increase in ATF4 mRNA translation and
subsequent stimulation of expression of ATF4 target genes [72].
Many of the CBD-affected transcripts (e.g., Herpud1, Hmox1, Nqo1,
Gclm, Gstmu1, Gstmu6 upregulated by CBD and by CBD+LPS
treatments) are indeed classified as Nrf2-mediated oxidative stress
response genes, including enzymes involved in the biosynthesis of
glutathione [13]. Thus, the observed CBD-mediated induction of
ATF4-dependent anabolic genes may serve to replenish the amino
acids reduced during the elevated turnover of GSH (cysteine,
glutamate and glycine). The mechanism underlying CBD action
presumably engages generation of ROS which in turn depletes
intracellular GSH. Perturbations in redox tone and GSH levels
activate the ‘‘phase 2 response’’, a mechanism used by cells to
mitigate oxidative stress [73]. As we have previously shown, many
of the ‘‘phase 2’’ gene products are significantly upregulated by
CBD [13].
Our present results show that CBD, and less so THC, have
immunosuppressive and protective activities that are reminiscent
of other clinically applied drugs such as glucocorticoids (GCs;
[74]), rexinoids and synthetic triterpenoids [75]. GCs are
immunomodulatory agents known to act as suppressive and
protective mediators against inflammation. GCs are known to
clear antigens by stimulating cell trafficking as well as scavenger
systems and matrix metalloproteinases while they stop cellular
Cannabinoid Anti-Inflammatory Networks
PLOS ONE | www.plosone.org 14 April 2013 | Volume 8 | Issue 4 | e61462
immune responses by inhibiting antigen presentation and T cell
activation [74]. Synthetic oleanane triterpenoids (SO) were shown
to be highly effective (much more than the natural triterpenoids) in
many in vivo models in the prevention and treatment of cancer and
other diseases with an inflammatory component. Molecular targets
of SO include KEAP1 (the inhibitor of the transcription factor
Nrf2), PPARc, IkB kinase, TGF-b signaling and STAT signaling
[75]. SO are among the most potent known inducers of the phase
2 response both in vivo and in vitro and affect the expression of
several key cell cycle proteins (e.g., cyclin D1, Cdkn1a/p21 and
caveolin 1). In some cancer cells, SO signal through PPARc to
inhibit proliferation. The rexinoids bind almost exclusively to the
RXRs and are involved in regulation of development, cell
proliferation, differentiation and apoptosis [76]. Because RXRs
heterodimerize with other receptors (such as RARs, vitamin D
receptor, thyroid hormone receptor, PPARa, PPARc and LXRs),
rexinoids modulate the actions of many steroid-like molecules that
control metabolism and cellular energetics. In view of these results,
triterpenoids and rexinoids are defined as multifunctional drugs.
Their targets are either regulatory proteins that control the activity
of transcription factors (triterpenoids) or transcription factors
themselves (rexinoids). These complex modulatory activities
exerted by GCs, rexinoids and SO display a panorama of effects
that closely resembles the complex actions of CBD.
Conclusions
We found that CBD induces robust responses related to
oxidative stress and inflammation and that CBD, and to a lesser
extent THC, have immunosuppressive and protective activities.
The anti-inflammatory effects are mediated by mainly downreg-
ulating the expression of proinflammatory genes but also by
upregulating anti-inflammatory mediators. The impact of pre-
treatment with CBD on LPS-stimulated gene expression was much
greater than that of THC.
We show here, that CBD highly upregulates genes encoding
negative regulators of NF-kB and AP-1 transcriptional activities
(e.g.; Trib3, Dusp1). CBD response to oxidative stress and
inflammation is controlled by Nrf2 and ATF4 transcription factors
and seem to involve the Nrf2-Hmox1 and the Nrf2/ATF4
systems. The central role of phase 2-response genes and the ATF4-
dependent Trib3 induction offer an explanatory mechanism by
which CBD (but less so THC) lowers the LPS-induced activation
of microglial cells and leads to attenuation of transcription of many
proinflammatory genes.
CBD and THC effects are also found to be linked to new
targets, notably the MAPK pathway (Dusp1/Mkp-1, Dusp8 and
Dusp2/Pac-1), the JAK/STAT regulatory molecules (Socs3, Cish,
Stat1) and the cell cycle related genes (Cdkn2b/p15, Gadd45a,
Cdkn1a/p21).
All together, our results show that CBD and to a lesser extent
THC, are potent modulators of microglial activation and affect
several signaling pathways and related networks including
induction of cellular stress responses that underlies their high
immunosuppressant activity.
Supporting Information
Figure S1 Functional and pathway annotations accord-ing to DAVID Bioinformatics Resources of affected geneproducts following LPS treatment. Gene Ontology (GO)
analysis was performed separately for upregulated (red) and
downregulated (green) genes, to identify functional categories and
cluster of genes significantly affected by LPS treatment. The GO
terms were arbitrarily chosen at various levels within the ontology
to avoid redundant allocation. Categories shown are significantly
represented at p#0.05. The bottom pie charts represent the
cellular pathways according to KEGG database.
(TIF)
Figure S2 Distribution of differentially expressed genesby global functional annotation and pathway associationaccording to IPA analysis. IPA global functional and pathway
analysis was used to examine the enriched functional classes of
upregulated (warm colors) and downregulated (cold colors) gene
transcripts among the LPS-stimulated genes. The y axis shows the
top 8 most representative high-level functions and canonical
pathways associated with genes regulated in LPS-treated BV-2
cells. The x axis displays the mean p-value for each associated
high-level function and canonical pathway in a -log scale.
Increasing value of 2log (significance) indicates increased
confidence for each category. The vertical gray line in each plot
indicates p = 0.05.
(TIF)
Table S1 Primer sequences for qPCR. a Amplicon length
in base pairs; b Genbank accession number of cDNA and
corresponding gene, available at http://www.ncbi.nlm.nih.gov/
http://www.ncbi.nlm.nih.gov/; c FW, forward primer; RV,
reverse primer
(DOC)
Table S2 Effect of CBD and THC on LPS-upregulatedgenes. Some genes were validated by qPCR, using b2-
microglobulin mRNA as a reference gene.
(XLS)
Table S3 Effect of CBD and THC on LPS-downregulatedgenes. Some genes were validated by qPCR, using b2-
microglobulin mRNA as a reference gene.
(XLS)
Acknowledgments
This work is dedicated to the memory of Maciej Pietr.
Author Contributions
Conceived and designed the experiments: AJ MP ZV. Performed the
experiments: AJ MP RL GC. Analyzed the data: AJ MP EK NR FG ZV.
Contributed reagents/materials/analysis tools: FG GC DG. Wrote the
paper: AJ EK NR ZV.
References
1. Kogan NM, Mechoulam R (2007) Cannabinoids in health and disease.
Dialogues Clin Neurosci 9: 413–430.
2. Hill AJ, Williams CM, Whalley BJ, Stephens GJ (2012) Phytocannabinoids as
novel therapeutic agents in CNS disorders. Pharmacology & Therapeutics 133:
79–97.
3. Pertwee RG (2002) Cannabinoids and multiple sclerosis. Pharmacol Ther 95:
165–174.
4. Guzman M (2003) Cannabinoids: potential anticancer agents. Nat Rev Cancer
3: 745–755.
5. Di Marzo V, De Petrocellis L (2006) Plant, synthetic and endogenous
cannabinoids in medicine. Ann Rev Med 57: 553–574.
6. Gowran A, Noonan J, Campbell VA (2011) The multiplicity of action of
cannabinoids: Implications for treating neurodegeneration. CNS Neuroscience
& Therapeutics 17: 637–644.
7. Cabral GA, Staab A (2005) Effects on the immune system. Handb Exp
Pharmacol 168: 385–423.
8. Klein TW, Cabral GA (2006) Cannabinoid-induced immune suppression and
modulation of antigen-presenting cells. J Neuroimmune Pharmacol 1: 50–64.
Cannabinoid Anti-Inflammatory Networks
PLOS ONE | www.plosone.org 15 April 2013 | Volume 8 | Issue 4 | e61462
9. Ashton JC (2007) Cannabinoids for the treatment of inflammation. Curr OpinInvestig Drugs 8: 373–384.
10. Rieder SA, Chauhan A, Singh U, Nagarkatti M, Nagarkatti P (2010)
Cannabinoid-induced apoptosis in immune cells as a pathway to immunosup-pression. Immunobiology 215: 598–605.
11. Kozela E, Pietr M, Juknat A, Rimmerman N, Levy R, et al. (2010)
Cannabinoids D9 -tetrahydrocannabinol and cannabidiol differentially inhibitthe LPS-activated NF-kB and IFNb/STAT proinflammatory pathways in BV-2
microglial cells. J Biol Chem 285: 1616–1625.
12. Kozela E, Lev N, Kaushansky N, Eilam R, Rimmerman N, et al. (2011)Cannabidiol inhibits pathogenic T-cells, decreases spinal microglial activation
and ameliorates multiple sclerosis-like disease in mice. Brit J Pharmacol 163:1507–1519.
13. Juknat A, Pietr M, Kozela E, Rimmerman N, Levy R, et al. (2012) Differential
transcriptional profiles mediated by exposure to the cannabinoids cannabidioland D9-tetrahydrocannabinol in BV-2 microglial cells. Brit J Pharmacol 165:
2512–2528.
14. Juknat A, Rimmerman N, Levy R, Vogel Z, Kozela E (2012) Cannabidiol affectsthe expression of genes involved in zinc homeostasis in BV-2 microglial cells.
Neurochem Int 61: 923–930.
15. van der Stelt M, Di Marzo V (2005) Cannabinoid receptors and their role inneuroprotection. Neuromolecular Med 7: 37–50.
16. Velasco G, Sanchez C, Guzman M (2012) Towards the use of cannabinoids as
antitumor agents. Nature Rev Cancer 12: 436–444.
17. Wu HY, Goble K, Mecha M, Wang CC, Huang CH, et al. (2012) Cannabidiol-
induced apoptosis in murine microglial cells through lipid raft. Glia 60: 1182–
1190.
18. Cabral GA, Raborn ES, Griffin L, Dennis J, Marciano-Cabral F (2008) CB2
receptors in the brain: role in central immune function. Brit J Pharmacol 153:
240–251.
19. Pertwee RG, Howlett AC, Abood ME, Alexander SPH, Di Marzo V, et al.
(2010) International Union of Basic and Clinical Pharmacology. LXXIX.Cannabinoid Receptors and Their Ligands: Beyond CB1 and CB2. Pharmacol
Rev 62: 588–631.
20. Stella N (2010) Cannabinoid and cannabinoid-like receptors in microglia,astrocytes and astrocytomas. Glia 58: 1017–1030.
21. Rhee MH, Vogel Z, Barg J, Bayewitch M, Levy R, et al. (1997) Cannabinol
derivatives: binding to cannabinoid receptors and inhibition of adenylylcyclase.J Med Chem 40: 3228–3233.
22. Cabral GA, Griffin-Thomas L (2009) Emerging role of the cannabinoid receptor
CB2 in immune regulation: therapeutic prospects for neuroinflammation.Expert Rev Mol Med 11: e3.
23. Mechoulam R, Peters M, Murillo-Rodriguez E, Hanus LO (2007) Cannabidiol-
recent advances. Chem Biodivers 4: 1678–1692.
24. Scuderi C, De Filippis D, Iuvone T, Blasio A, Steardo A, et al. (2009)
Cannabidiol in Medicine: a review of its therapeutic potential in CNS disorders.
Phytother Res 23: 597–602.
25. Booz GW (2011) Cannabidiol as an emergent therapeutic strategy for lessening
the impact of inflammation on oxidative stress. Free Radical Biology & Medicine
51: 1054–1061.
26. Fernandez-Ruiz J, Sagredo O, Pazos MR, Garcia C, Pertwee R, et al. (2013)
Cannabidiol for neurodegenerative disorders: Important new clinical applica-tions for this phytocannabinoid? Brit J Clin Pharmacol 75: 323–333.
27. Mecha M, Torrao AS, Mestre L, Carrillo-Salinas FJ, Mechoulam R, et al. (2012)
Cannabidiol protects oligodendrocyte progenitor cells from inflammation-induced apoptosis by attenuating endoplasmic reticulum stress. Cell Death
and Disease 3: e331.
28. Pazos MR, Cinquina V, Gomez A, Layunta R, Santos M, et al. (2012)Cannabidiol administration after hypoxia-ischemia to newborn rats reduces
long-term brain injury and restores neurobehavioral function. Neuropharma-
cology 63: 776–783.
29. Izzo AA, Borrelli F, Capasso R, Di Marzo V, Mechoulam R (2009) Non-
psychotropic plant cannabinoids: new therapeutic opportunities from an ancientherb. Trends Pharmacol Sci 30: 515–527.
30. Rimmerman N, Kozela E, Levy R, Vogel Z, Juknat A (2013) Cannabinoid
signaling through non CB1/non CB2 GPCR targets in microglia. In: AboodME, Sorensen RG, Stella N, editors.endoCANNABINOIDS.Actions at non-
CB1/CB2 cannabinoid receptors.Series: The Receptors, Vol. 24, pp.143–171
.Springer Verlag, New York.
31. Rimmerman N, Juknat A, Kozela E, Levy R, Bradshaw HB, et al. (2011) The
non-psychoactive plant cannabinoid, cannabidiol affects cholesterol metabolism-
related genes in microglial cells. Cell Mol Neurobiol 31: 921–930.
32. Srivastava MD, Srivastava BI, Brouhard B (1998) Delta9 tetrahydrocannabinol
and cannabidiol alter cytokine production by human immune cells. Immuno-
pharmacology 40: 179–185.
33. Cabral GA, Dove Pettit DA (1998) Drugs and immunity: cannabinoids and their
role in decreased resistance to infectious disease. J Neuroimmunol 83: 116–123.
34. Klein TW, Newton C, Larsen K, Chou J, Perkins I, et al. (2004) Cannabinoidreceptors and T helper cells. J Neuroimmunol 147: 91–94.
35. Puffenbarger RA, Boothe AC, Cabral GA (2000) Cannabinoids inhibit LPS-
inducible cytokine mRNA expression in rat microglial cells. Glia 29: 58–69.
36. Eljaschewitsch E, Witting A, Mawrin C, Lee T, Schmidt PM, et al. (2006) The
endocannabinoid anandamide protects neurons during CNS inflammation by
induction of MKP-1 in microglial cells. Neuron 49: 67–79.
37. Carrier EJ, Auchampach JA, Hillard CJ (2006) Inhibition of an equilibrativenucleoside transporter by cannabidiol: a mechanism of cannabinoid immuno-
suppression. Proc Natl Acad Sci USA 103: 7895–7900.
38. O9Sullivan SE (2007) Cannabinoids go nuclear: evidence for activation of
peroxisome proliferator-activated receptors. Br J Pharmacol 152: 576–582.
39. Esposito G, Scuderi C, Valenza M, Togna GI, Latina V, et al. (2011)
Cannabidiol reduces Ab-induced neuroinflammation and promotes hippocam-
pal neurogenesis through PPARc involvement. PLOS One 6: e28668.
40. De Petrocellis L, Di Marzo V (2010) Non-CB1, non-CB2 receptors for
endocannabinoids, plant cannabinoids and synthetic cannabimimetics: focuson G-protein coupled receptors and transient receptor potential channels.
J Neuroimmune Pharmacol 5: 103–121.
41. Graeber MB, Streit WJ (2010) Microglia: biology and pathology. Acta
Neuropathol 119: 89–105.
42. Saijo K, Glass CK (2011) Microglial cell origin and phenotypes in health and
disease. Nature Rev Immunol 11: 775–787.
43. Schwartz M, Shechter R (2010) Systemic inflammatory cells fight off
neurodegenerative disease. Nat Rev Neurol 6: 405–410.
44. Lund S, Christensen KV, Hedtjarn M, Mortensen AL, Hagberg H, et al. (2006)
The dynamics of the LPS triggered inflammatory response of murine microgliaunder different culture and in vivo conditions. J Neuroimmunol 180: 71–87.
45. Thomas DM, Francescutti-Verbeem DM, Kuhn DM (2006) Gene expression
profile of activated microglia under conditions associated with dopamineneuronal damage. Faseb J 20: 515–517.
46. Calvano SE, Xiao W, Richards DR, Felciano RM, Baker HV, et al. (2005) Anetwork-based analysis of systemic inflammation in humans. Nature 437: 1032–
1037.
47. Ashburner M, Ball CA, Blake JA, Botstein D, Butler H, et al. (2000) Gene
ontology: tool for the unification of biology. Nat Genet. 25: 25–29.
48. Huang DW, Sherman BT, Lempicki RA (2009) Systematic and integrative
analysis of large gene lists using DAVID Bioinformatics Resources. NatureProtoc 4: 44–57.
49. Baird TD, Wek RC (2012) Eukaryotic initiation factor 2 phosphorylation andtranslational control in metabolism. Adv Nutr 3: 307–321.
50. Ben-Neriah Y, Karin M (2011) Inflammation meets cancer, with NF-kB as thematchmaker. Nature Immunol 12: 715–723.
51. Dietrich C, Kaina B (2010) The aryl hydrocarbon receptor (AhR) in the
regulation of cell-cell contact and tumor growth. Carcinogenesis 31: 1319–1328.
52. Banisor I, Leist TP, Kalman B (2005) Involvement of b-chemokines in the
development of inflammatory demyelination. J Neuroinflammation 2: 7.
53. Malfait AM, Gallily R, Sumariwalla PF, Malik AS, Andreakos E, et al. (2000)
The nonpsychoactive cannabis constituent cannabidiol is an oral anti-arthritictherapeutic in murine collagen-induced arthritis. PNAS 97: 9561–9566.
54. Sancho D, Gomez M, Viedma F, Esplugues E, Gordon-Alonso M, et al. (2003)CD69 downregulates autoimmune reactivity through active transforming
growth factor-b production in collagen-induced arthritis. J Clin Invest 112:872–882.
55. Bootcov MR, Bauskin AR, Valenzuela SM, Moore AG, Bansal M, et al. (1997)MIC-1, a novel macrophage inhibitory cytokine, is a divergent member of the
TGF-beta superfamily. Proc Natl Acad Sci USA 94: 11514–11519.
56. Lee S, Lee S, Kim JH, Kim JH, Seo JW, et al. (2011) Lipocalin-2 Is a chemokine
inducer in the central nervous system. Role of chemokine ligand 10 (CXCL10)
in lipocalin-2-induced cell migration. J Biol Chem 286: 43855–43870.
57. Lee W-K, Thevenod F (2006) A role for mitochondrial aquaporins in cellular
life-and-death decisions? Am J Physiol Cell Physiol 291: C195– C202.
58. Jeffrey KL, Brummer T, Rolph MS, Liu SM, Callejas NA, et al. (2006) Positive
regulation of immune cell function and inflammatory responses by phosphatasePAC-1. Nat Immunol 7: 274–283.
59. Pietr M, Kozela E, Levy R, Rimmerman N, Lin YH, et al. (2009) Differentialchanges in GPR55 during microglial activation. FEBS Letters 583: 2071–2076.
60. McHugh D, Hu SS, Rimmerman N, Juknat A, Vogel Z, et al. (2010) N-arachidonoyl glycine, an abundant endogenous lipid, potently drives directed
cellular migration through GPR18, the putative abnormal cannabidiol receptor.
BMC Neurosci 11: 44.
61. Rimmerman N, Bradshaw HB, Kozela E, Levy R, Juknat A, et al. (2012)
Compartmentalization of endocannabinoids into lipid rafts devoid of caveolin-1in a microglial cell line. Brit J Pharmacol 165: 2436–2449.
62. Kiss-Toth E, Bagstaff SM, Sung HY, Jozsa V, Dempsey C, et al. (2004) Humantribbles, a protein family controlling mitogen-activated protein kinase cascades.
J Biol Chem 279: 42703–42708.
63. Ohoka N, Yoshii S, Hattori T, Onozaki K, Hayashi H (2005) TRB3, a novel ER
stress-inducible gene, is induced via ATF4-CHOP pathway and is involved incell death. EMBO J 24: 1243–1255.
64. Du K, Herzig S, Kulkarni RN, Montminy M (2003) TRB3: a tribbles homologthat inhibits Akt/PKB activation by insulin in liver. Science 300: 1574–1577.
65. Wu M, Xu LG, Zhai Z, Shu HB (2003) SINK is a p65-interacting negative
regulator of NF-kappaB-dependent transcription. J Biol Chem 278: 27072–27079.
66. Sizemore N, Leung S, Stark GR (1999) Activation of phosphatidylinositol 3-kinase in response to interleukin-1 leads to phosphorylation and activation of the
NF-kappaB p65/RelA subunit. Mol Cell Biol 19: 4798–4805.
67. Dos Santos S, Delattre AI, De Longueville F, Bult H, Raes M (2007) Gene
expression profiling of LPS-stimulated murine macrophages and role of the NF-kappaB and PI3K/mTOR signaling pathways. Ann N Y Acad Sci 1096: 70–77.
Cannabinoid Anti-Inflammatory Networks
PLOS ONE | www.plosone.org 16 April 2013 | Volume 8 | Issue 4 | e61462

68. Kim J, Cha Y-N, Surh Y-J (2010) A protective role of nuclear factor-erythroid 2-
related factor-2 (Nrf2) in inflammatory disorders. Mutat Res 690: 12–23.69. Takahashi Y, Ohoka N, Hayashi H, Sato R (2008) Trb3 suppresses adipocyte
differentiation by negatively regulating PPARc transcriptional activity. J Lipid
Res 49: 880–892.70. O9Sullivan SE, Sun Y, Bennett AJ, Randall MD, Kendall DA (2009) Time-
dependent vascular actions of cannabidiol in the rat aorta. Eur J Pharmacol 612:61–68.
71. Necela BM, Su W, Thompson EA (2008) Toll-like receptor 4 mediates cross-talk
between peroxisome proliferator-activated receptor c and nuclear factor-kB inmacrophages. Immunology 125: 344–358.
72. Nguyen T, Sherratt PJ, Nioi P, Yang CS, Pickett CB (2005) Nrf2 controlsconstitutive and inducible expression of ARE-driven genes through a dynamic
pathway involving nucleocytoplasmic shuttling by Keap1. J Biol Chem 280:
32485–32492.73. Talalay P, Dinkova-Kostova AT, Holtzclaw WD (2003) Importance of phase 2
gene regulation in protection against electrophile and reactive oxygen toxicity
and carcinogenesis. Adv Enzyme Regul 43: 121–134.74. Galon J, Franchimont D, Hiroi N, Frey G, Boettner A, et al. (2002) Gene
profiling reveals unknown enhancing and suppressive actions of glucocorticoidson immune cells. Faseb J 16: 61–71
75. Liby KT, Yore MM, Sporn MB (2007) Triterpenoids and rexinoids as
multifunctional agents for the prevention and treatment of cancer. Nat RevCancer 7: 357–369.
76. Tanaka T, De Luca LM (2009) Therapeutic potential of rexinoids in cancerprevention and treatment. Cancer Res 69: 4945–4947.
Cannabinoid Anti-Inflammatory Networks
PLOS ONE | www.plosone.org 17 April 2013 | Volume 8 | Issue 4 | e61462