Geometric mechanics, Lagrangian reduction, and nonholonomic systems
Upload
independentCategory
view
0download
0
2818 Biophysical Journal Volume 85 November 2003 2818–2829
Prediction of Reduction Potential Changes in Rubredoxin:A Molecular Mechanics Approach
Can E. Ergenekan,* Dustin Thomas,* Justin T. Fischer,* Ming-Liang Tan,* Marly K. Eidsness,y
ChulHee Kang,* and Toshiko Ichiye**School of Molecular Biosciences, Washington State University, Pullman, Washington; and yDepartment of Chemistry andCenter for Metalloenzyme Studies, University of Georgia, Athens, Georgia
ABSTRACT Predicting the effects of mutation on the reduction potential of proteins is crucial in understanding how reductionpotentials are modulated by the protein environment. Previously, we proposed that an alanine vs. a valine at residue 44 leads toa 50-mV difference in reduction potential found in homologous rubredoxins because of a shift in the polar backbone relative tothe iron site due to the different side-chain sizes. Here, the aim is to determine the effects of mutations to glycine, isoleucine,and leucine at residue 44 on the structure and reduction potential of rubredoxin, and if the effects are proportional to side-chainsize. Crystal structure analysis, molecular mechanics simulations, and experimental reduction potentials of wild-type andmutant Clostridium pasteurianum rubredoxin, along with sequence analysis of homologous rubredoxins, indicate that thebackbone position relative to the redox site as well as solvent penetration near the redox site are both structural determinants ofthe reduction potential, although not proportionally to side-chain size. Thus, protein interactions are too complex to be predictedby simple relationships, indicating the utility of molecular mechanics methods in understanding them.
INTRODUCTION
Electron transfer proteins function as electron carriers in both
primary and secondary cellular processes. The driving force
of the electron transfer is determined by the reduction
potentials of the different proteins involved in the reaction.
Interestingly, reduction potentials of homologous proteins
with the same prosthetic group can vary by hundreds of
millivolts even though the redox sites themselves are highly
similar (Moura et al., 1979; Lovenberg and Sobel, 1965;
Meyer et al., 1983), suggesting that the protein environment
is partly responsible for determining its reduction potential.
Thus, determining the effects of the protein environment on
the reduction potential is important in understanding the
function of electron transfer proteins.
The ability to predict the effects of sequence on the
reduction potential of a protein is crucial in understanding
how the protein environment influences the reduction poten-
tial. However, the results of many site-specific mutational
studies have run contrary to simple physicochemical argu-
ments (Gleason, 1992; Shen et al., 1994; Zeng et al., 1996),
because mutations can cause a multitude of changes at
amolecular level. Here, a sequence determinant of a reduction
potential is a residue whose identity can cause a change
in reduction potential and a structural determinant is the
underlying physical basis for the change in reduction
potential. Our combination of electrostatic calculations of
crystal structures and sequence analysis (Ichiye, 2001) is a
bioinformatic-type approach to predict differences in poten-
tials as small as 50 mV. We find that structural determinants
are not always straightforward to deduce from the physico-
chemical properties of the amino acids found at a sequence
determinant.
Our early studies of rubredoxin, a small iron-sulfur protein
(Fig. 1), predicted that a change from alanine to valine at
residue 44 would lower its reduction potential by 50 mV and
vice versa based on comparisons of homologous rubredoxins
with different reduction potentials (Swartz et al., 1996). This
is counterintuitive, inasmuch as a small nonpolar residue
mutated to another small nonpolar residue would generally
be considered a silent mutation for an electrostatic property
such as the reduction potential. However, our electrostatic
calculations of crystal structures of four homologous rub-
redoxins indicated that the difference is due at least partly
to a small 0.4 A shift in the backbone due to the larger side
chain of valine relative to alanine, which changes the elec-
trostatic potential at the redox site. In addition, sequence
analysis and reduction potential measurements of nine
homologous wild-type (WT) rubredoxins indicated that the
rubredoxins may be separated into a low potential class with
a valine 44 and a 50-mV higher potential class with an
alanine 44. Also, chimeras composed of Clostridiumpasteurianum (Cp) and Pyrococcus furiosus (Pf ) rubredox-ins, which are from each of the two reduction potential
classes, follow the same trend (Eidsness et al., 1997).
Recently, the reduction potential shift has been confirmed by
site-directed mutagenesis (reduction potentials of Val44Alavs. WT Cp are 31 vs. �55 6 5 mV vs. standard hydrogen
electrode (SHE), respectively, and WT vs. Ala44Val Pf are31 vs.�586 5 mV vs. SHE, respectively) and the backbone
shift has been confirmed in crystal structures (Fe���44Ndistances of Val44Ala vs. WT Cp are 4.906 0.15 vs. 5.24 A,
respectively) (Eidsness et al., 1999). Of course, these studies
indicate only that residue 44 is a sequence determinant of the
reduction potential and that the backbone shift is a structural
Submitted April 4, 2003, and accepted for publication June 20, 2003.
Address reprint requests to Toshiko Ichiye, School of Molecular
Biosciences, Washington State University, Pullman, WA 99164-4660.
Tel.: 509-335-7600; Fax: 509-335-9688; E-mail: [email protected].
� 2003 by the Biophysical Society
0006-3495/03/11/2818/12 $2.00
determinant for this change. Specifically, solvent accessibility
has not been ruled out as an additional structural determinant.
The effects of valine vs. alanine at residue 44 on the
reduction potential tempts the prediction of a general size
relationship between the amino acid at residue 44 and the
reduction potential for rubredoxin: the larger the side chain
of residue 44, the bigger the shift in the backbone away from
the redox site and the lower the reduction potential.
However, recent studies of Cp rubredoxin in which the
WT Val44 was mutated to other nonpolar amino acids
indicate that this relationship is too simplistic. In one study,
the reduction potentials of Val44Gly, Val44Ala, and WT (in
order of increasing side-chain size) were 26, 31, and �55 6
5 mV vs. SHE, respectively (Eidsness et al., 1997; Smith,
private correspondence), while in a second study, the
reduction potentials of Val44Gly, Val44Ala, WT, Val44Ile,and Val44Leu were 0,�24,�77,�53, and�876 4 mV vs.
SHE, respectively (Xiao et al., 2000). The 22-mV difference
in the WT values may be the result of slight differences in
pH, buffer, and electrode promoter or modifier; however, the
relative shifts in the reduction potential observed for the
mutants by one group should be comparable. The mutants do
not really follow the relationship since there is little or no
decrease between Val44Gly and Val44Ala, an increase ratherthan a decrease between WT and Val44Ile, and only a slight
decrease between WT and Val44Leu.The work presented here uses crystal structure analysis,
energy minimization, molecular dynamics simulation, and
sequence analysis to study shifts in the reduction potential
caused by nonpolar mutations at residue 44 of Cp rubredoxin.
The effects of glycine, alanine, isoleucine, and leucine
mutations at residue 44, which is valine in WT, are studied.
Specifically, the aims are to examine if the side-chain size
relation with the reduction potential observed for valine vs.
alanine holds for other nonpolar amino acids and to elucidate
the structural determinants if it does not hold. Energy
minimization and molecular dynamics simulations are used
to predict mutant structures, whereas crystal structures of
several of these mutants are used to test and refine these
predictions. Electrostatic potential and other calculations of
both crystal and simulated mutant structures are used to study
the structural determinants. Sequence analysis is used to
check for consistency with other homologous rubredoxins.
METHODS
Crystal structures
The crystal structures of oxidized wild-type (WT) Cp rubredoxin at 5RXN,
1.2 A resolution (Watenpaugh et al., 1980) and 1IRO, 1.1 A (Dauter et al.,
1996); Val44Ala Cp rubredoxin at 1C09, 1.6 A (Eidsness et al., 1999); Pf
rubredoxin at 1BRF, 0.95 A (Bau et al., 1998); Desulfovibrio gigas
rubredoxin at 1RDG, 1.4 A (Frey, 1993); and Desulfovibrio vulgaris
rubredoxin at 1RB9, 0.92 A (Dauter et al., unpublished results), along with
crystal waters, were obtained from the Brookhaven Protein Databank. The
root mean-square deviation (RMSD) between 1IRO and 5RXN is 0.16 A.
The crystal structure of Cp Val44Gly along with crystal waters was also used
(Min et al., unpublished results). The hydrogen positions were built for all
polar hydrogens using the HBUILD facility of CHARMM 25 (Brooks et al.,
1983). If more than one structure exists due to multiple proteins in the
asymmetric unit or two alternate conformations, the average and standard
deviation are reported for calculated properties. The naming convention for
Cg1 and Cg2 of valine is inconsistent with that for isoleucine, so here the Cg1
and Cg2 of valine will be referred to as Cg29 and Cg19, respectively, and x19 is
defined by N-Ca-Cb-Cg19.
Energy minimizations and moleculardynamics simulations
The energy minimizations and molecular dynamics simulations were
performed with the molecular mechanics and dynamics program CHARMM
25 (Brooks et al., 1983). Energy minimizations used the steepest descent
method so that only very gentle perturbations are made, because exhaustive
minimization with robust methods can lead to structures that are highly
perturbed from crystal structures (Shenoy and Ichiye, 1993). Molecular
dynamics simulations used the Verlet algorithm with a time step of 0.001 ps
in the microcanonical ensemble at a temperature of ;300 K. For all
calculations, truncated rectangular-octahedral periodic boundary conditions
were used. The potential energy function used the parameters of CHARMM
19 (Brooks et al., 1983) plus additional parameters for the ions and the iron-
sulfur site (Yelle et al., 1995), in which nonpolar hydrogens were treated by
the extended atom method. All bonds containing hydrogens were con-
strained to their equilibrium bond lengths using the SHAKE algorithm
(Rychaert et al., 1977). Long-range forces were switched smoothly to zero
using an atom-based force-switch method (Steinbach and Brooks, 1994)
between 10 A and 14 A. The nonbonded and image atom lists were updated
heuristically using a cutoff distance of 15 A.
The initial system ofWT oxidized rubredoxin, which was the same for the
energy minimizations and molecular dynamics simulations, was generated
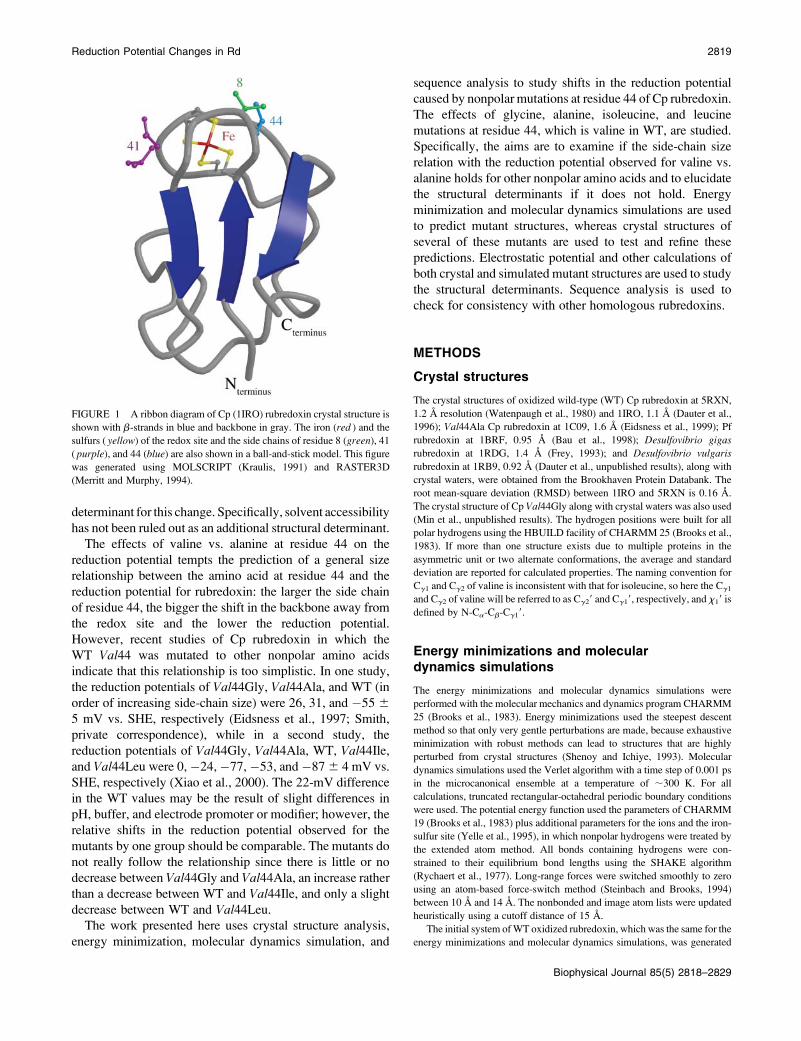
FIGURE 1 A ribbon diagram of Cp (1IRO) rubredoxin crystal structure is
shown with b-strands in blue and backbone in gray. The iron (red ) and the
sulfurs ( yellow) of the redox site and the side chains of residue 8 (green), 41
( purple), and 44 (blue) are also shown in a ball-and-stick model. This figure
was generated using MOLSCRIPT (Kraulis, 1991) and RASTER3D
(Merritt and Murphy, 1994).
Reduction Potential Changes in Rd 2819
Biophysical Journal 85(5) 2818–2829
as follows. First, the crystal structure of Cp and crystal waters (5RXN) was
minimized for 50 steps. Next, more solvent was added by placing the protein
into a pre-equilibrated 543 513 47 A truncated rectangular-octahedral box
of 2192 TIP3P (Jorgensen et al., 1983) water molecules, and then deleting
any water within 2.5 A of any protein or crystal water atom. This system was
then relaxed slightly with 2 ps of dynamics while assigning velocities every
0.2 ps in which only the water was allowed to move while the protein was
fixed. Following this, counterions were added by replacing a water mole-
cule with an ion near each charged group in the protein to make the system
net neutral (a sodium ion for each negatively charged side chain and the
C-terminus, and the oxidized redox site and a chloride ion for each posi-
tively charged side chain and the N-terminus). Finally, the solvent environ-
ment was equilibrated by 10 ps of dynamics while scaling velocities, if
outside a temperature window of 65 K every 0.2 ps, followed by 60 ps
without perturbation in which the water and counterions were allowed to
move while the protein was fixed. The system consists of 501 protein atoms,
1835 water molecules, 15 sodium ions, and five chlorine ions.
The initial systems for the mutant oxidized rubredoxins, which were also
the same for the energy minimizations and molecular dynamics simulations,
were generated as follows. First, structures for the mutations to glycine,
alanine, isoleucine, and leucine at residue 44 in Cp rubredoxin were
generated using the molecular graphics program QUANTA98 (MSI, 1986-
193). The coordinates from the initial WT system were used for all
equivalent atoms and then three dihedral conformations were generated for
atoms beyond Cb of residue 44. Thus, there are nine structures each for
Val44Ile and Val44Leu and one structure for Val44Gly and Val44Ala. Inaddition, structures for the two other dihedral conformations of the WT
valine were generated. If the mutation had a larger side chain, 50 steps of
energy minimization were performed on all residues with any atoms within
a 10 A sphere centered on the Ca of residue 44 while constraining all other
residues and solvent molecules to their initial WT position.
Energy minimizations (EM) were carried out starting from the initial WT
and mutant systems of rubredoxin, solvent, and counterions. In these
calculations only, the nonbonded neighbor list was updated every 10 steps.
The system was minimized for at least 5000 steps or until the total energy of
the system no longer fell below the lowest energy point for 100 steps. When
more than one initial conformation was used, the energies of the final
conformations were evaluated via Ep, the total potential energy of all atoms
of the protein excluding the water and counterions using the same conditions
as in the energy minimization and molecular dynamics. Even though solvent
can play a role in stabilizing conformations, the solvent energy was excluded
because it is subject to large fluctuations and the energy of the EM
configuration is not necessarily representative of the average energy.
Molecular dynamics (MD) simulations were carried out starting from the
initial WT and mutant systems of rubredoxin, solvent, and counterions. In
addition, MD simulations for the Val44Gly and Val44Ala were carried out
starting from the EM structures (reported here) because the other simulations
had indications of instability. The systems were equilibrated by scaling the
velocities if outside a temperature window of 65 K every 0.2 ps until 10 ps
after the last scale for a total of 15–25 ps, followed by 160 ps unperturbed.
After equilibration, each system was propagated for 0.5 ns with analysis
utilizing coordinates at 0.01-ps intervals. The MD quantities were the
average over the entire simulation, with the standard deviations calculated
from the average values of the quantity for successive 50-ps intervals of the
simulation (i.e., 10 intervals).
Electrostatic calculations
The contributions of protein residues to the electrostatic potential at the
redox site were calculated for the crystal, EM, and MD structures. The
electrostatic potential may be related to the reduction potential as follows
(Ichiye, 2001). The free energy change upon reduction, DG, is related to the
reduction potential, E8, by
�nIE8 ¼ DG ¼ DE1DPV � TDS; (1)
where I is Faraday’s constant, n is the number of electrons transferred, E is
energy, PV is pressure and volume, T is absolute temperature, and S is
entropy. Based on previous work (Swartz et al., 1996; Beck et al., 2001),
E28� E18 � f2 � f1; (2)
where Ei8 and fi refer to the reduction potential and the electrostatic
potential at the redox site, respectively, of protein i in the oxidized state.
Although the protein will relax upon reduction, the degree of relaxation for
a set of nonpolar residues will be small in magnitude and similar to each
other. Thus, the contribution of relaxation to a difference in reduction
potential will be small (Beck et al., 2001).
Because the change in charge upon reduction is delocalized over several
atoms, a delocalized f can be defined as
nf ¼ n +k¼protein
fðkÞ; (3)
nIfðkÞ ¼ +j¼residue
+i¼redox site
Dqiqj
rij; (4)
where f(k) is the electrostatic potential of residue k, Dqi is the change in
charge of atom i upon reduction, qj is the charge of atom j, and rij is thedistance from atom i to atom j. The summation over i is over all atoms of the
redox site (i.e., those atoms that change charge upon reduction: the iron and
the Cb and Sg of the four cysteinyl ligands), the summation over j is over all
atoms of a given residue, and the summation over k is over all residues of theprotein. The partial charges are the same as for the energy minimization and
molecular dynamics simulations.
Solvent accessibility
The solvent accessibility of the redox site was calculated as the solvent
contact surface area (SCSA) of the nine atoms of the redox site (Fe plus Cb
and Sg of residues 6, 9, 39, and 42). In practice, the only atoms of the redox
site with nonzero values of SCSA are the Cb of residue 9 and residue 42,
which are the cysteinyl ligands of the iron site. The Lee and Richard’s
algorithm was used with a probe radius of 1.6 A (Lee and Richards, 1971).
Sequence alignment
Sequences of 40 known and probable rubredoxin sequences were found
and aligned using the online version of BLAST (Schaffer et al., 2000) and
the SwissProt database. The sequence of Cp rubredoxin was used as the
search criteria, which resulted in 48 hits, 44 of which were rubredoxin
sequences whereas the other four were flavorubredoxins. Of these, 40
were chosen because they had BLAST scores[37 and Expect-values (E)
of \0.01.
RESULTS
Crystal, EM, and MD structures of wild-type and mutant Cp
rubredoxins are analyzed to determine the effects of point
mutations on the protein structure and electrostatic potential
of the redox site. No global changes to the structure due to
the molecular mechanics were indicated by the RMSD of all
backbone atoms. The EM relative to crystal structures for
WT (5RXN), Val44Ala, and Val44Gly have small backbone
RMSDs of 0.25, 0.47, and 0.45 A, respectively. Also, the
WT MD relative to the WT (5RXN) crystal structure has
a small backbone RMSD of 1.89 A and an all-atom RMSD
of 2.15 A, which is typical for such simulations (McCammon
and Harvey, 1987). The global changes upon mutation were
2820 Ergenekan et al.
Biophysical Journal 85(5) 2818–2829

also small. For the crystal structures, the backbone RMSD of
the Val44Ala and Val44Gly relative to WT (1IRO) were 0.42
6 0.04 A and 0.47 6 0.04 A, respectively. For the EM and
MD structures, the backbone RMSD of the mutant relative to
WT were ;0.1 and 1.0 A, respectively.
The local changes near residue 44 are discussed in-
dividually below. Local structural changes are monitored by
the torsion angles of residue 44 (u44 and c44) and by the
distance between the redox site iron and the residue 44
backbone nitrogen (rFe���44N). Since residue 44 is only one
residue away from the fourth cysteinyl ligand (residue 42) of
the redox site, which does not change its structure upon
mutation of residue 44, the backbone distance rFe���44N and
torsion angle u44 are simple indicators of the distance and
orientation, respectively, of the peptide dipoles of residues
43 and 44 with respect to the redox site. The solvent
accessibility of the redox site is monitored by the solvent
contact surface area (SCSA) of the redox site for the static
structures and by the average number of waters (Nw) in the
MD simulations that are 3.8 A from Sg9 or Sg42. Possible
effects on the reduction potential are monitored by the
change in electrostatic potential at the redox site due to
residues 43 and 44 relative to WT (Df43,44, where f43,44 ¼f (43) 1 f (44)), since previous work indicates the change
is mainly in these two residues (Swartz et al., 1996). The
major dipolar contributions to Df43,44 come from the NH of
residue 44 and the CO of residue 43 while the smaller
contributions of the NH of residue 43 and the CO of residue
44 tend to cancel each other in the given backbone con-
formation. Thus, Df43,44 is determined mainly by the
peptide dipole between residues 43 and 44, hence giving rise
to the correlation with DrFe���44N and u44. Finally, sequence
effects are monitored by the sequence analysis of 40
homologous rubredoxins.
Wild-type
Crystal structures
The WT crystal structure (Fig. 1) has several features that are
important in the analysis of the mutants. First, Leu41 has twoconformations (Dauter et al., 1996): an open conformation
(occupancy 0.76), which exposes the redox site with a SCSA
of 12 A2, and a closed conformation (occupancy 0.24),
which covers it with a SCSA of 8 A2 (Fig. 2). The water
gates Leu41 and Val8 (Yelle et al., 1995; Swartz et al., 1996;Min et al., 2001) cover Sg9 and Sg42, respectively. Second,
Val44 has x19 ¼ 718, where the Cg19 points into the protein
whereas the Cg29 points into solution (Fig. 3). Finally, the
two Cg of Val44 and Val8 interlock, which hinders the
backbone from moving closer to the redox site (Fig. 3).
Energy minimizations
Since minimizations were used to predict mutant structures,
the WT protein was minimized from three different initial
conformations of Val44 ( x19 ¼ 718, 1808, and �608) with
the Leu41 in the open conformation, which resulted in three
unique final conformations of Val44 ( x19 ¼ 688, �1478, and
�568) compared to the WT crystal structure ( x19 ¼ 718).
After minimization, the WT conformation has the lowest
potential energy of the protein Ep (Table 1). For the WT EM
structure, the local region shows little change due to
minimization since the backbone torsions (Table 2), rFe���44N(Table 3), and solvent accessibility (Table 4) remain very
close to the crystal structure values.
Molecular dynamics
Most of the local features of the MD structure are fairly close
to the crystal and EM structures. The side chain maintains
a conformation ( x19 ¼ 62 6 18) close to the WT crystal
structure ( x19 ¼ 718). Also, the backbone torsions (Table 2)
and the rFe���44N (Table 3) are very close to the WT crystal
values. The simulation also shows a small degree of water
penetration (Table 4) mainly near Sg42.
Sequence analysis
The Val44 in Cp is fairly typical of the rubredoxins since thesequence analysis of 40 rubredoxins has 16 with a Val44(Table 6). Of these, all but four have amino acids with
branched Cb at residue 8, so that the interlocking of Val44and residue 8 is likely to be common to these rubredoxins. Of
the exceptions, the Pseudomonas oleovorans 2 sequence is
from a protein with two rubredoxin-like domains, one with
a Val44 (Po2a) and the other with an Ala44 (Po2b). On the
other hand, there is considerable variability at residue 41,
FIGURE 2 A licoricemodel of the side chain of leucine 41 in both the open
( purple) and closed conformation (translucent purple) reported in the crystalstructure; the iron (red ) and the sulfurs ( yellow) of the redox site and the
backbone of the protein (gray) are also shown. This figure was generated
using MOLSCRIPT (Kraulis, 1991) and RASTER3D (Merritt and Murphy,
1994).
Reduction Potential Changes in Rd 2821
Biophysical Journal 85(5) 2818–2829
indicating that the interactions controlled by Leu41 may not
depend on the amino-acid type.
Mutations to smaller side chains
Crystal structures
The Val44Ala and Val44Gly crystal structures have small
but significant changes relative to the WT near residue 44.
The backbone torsion angles change by Du44 � 1158 and
Dc44��158 relative toWT (Table 2). Also, the backbone in
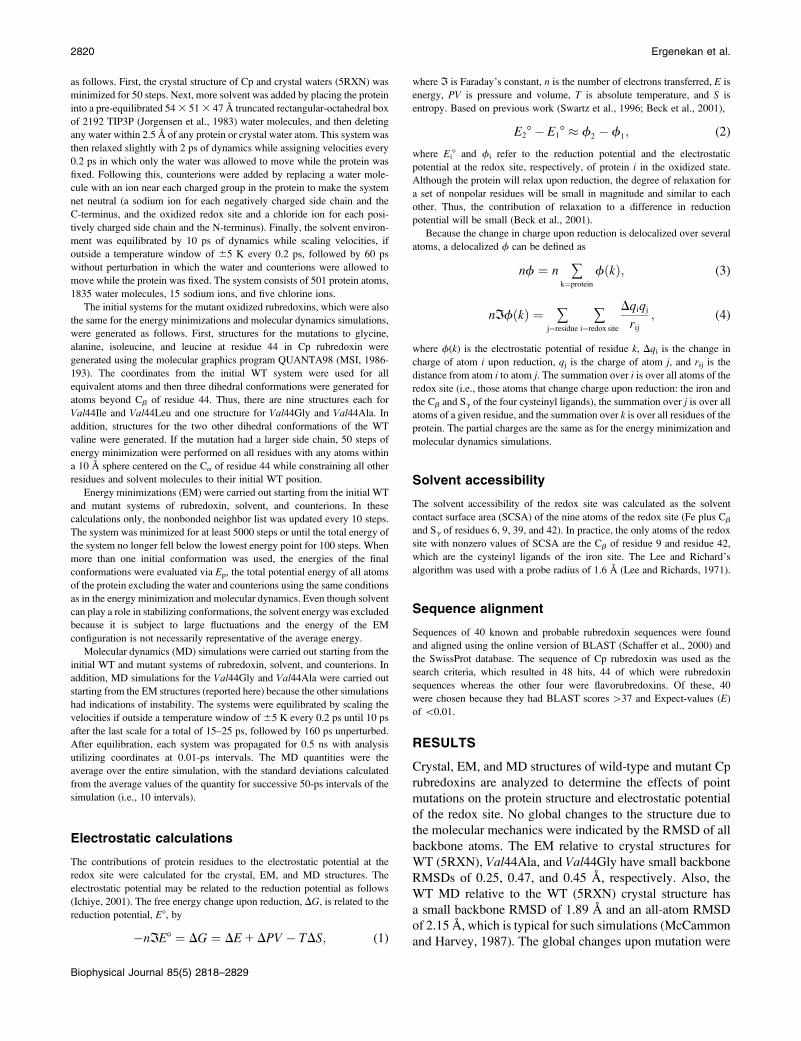
Val44Ala and Val44Gly shifts closer to the redox site relativeto WT (Fig. 3) so that DrFe���44N � �0.4 A (Table 3). The
values u44 ¼ �668, c44 ¼ 1418, and rFe���44N ¼ 4.89 6 0.01
A for Val44Ala are also consistent with the average values
u44 ¼ �65 6 38, c44 ¼ 149 6 68, and rFe���44N ¼ 4.87 6
0.06 A, respectively, for the three homologous rubredoxin
crystal structures with alanine at residue 44 (see Methods).
Val44Ala lacks the two Cg of the WT valine so that the Cb
touches the two Cg of Val8, which allows the Val44Alabackbone to move closer to the redox site than the WT (Fig.
3). However, although Val44Gly lacks both the two Cg and
the Cb of the WT valine, the Val44Gly backbone does not
move any closer to the redox site than the Val44Ala,apparently because of the backbone connectivity. The
Val44Ala and Val44Gly crystal structures have only the
open conformation for Leu41 and both have slightly smaller
SCSA of the redox site than the WT crystal structure with the
open conformation for Leu41 (Table 4). The Df43,44 � 30
mV for Val44Ala and Val44Gly is smaller than the
experimental DE8 � 50–85 mV (Table 5). However, it is
FIGURE 3 A licorice model of the side-chain interac-
tion of residue 44 and residue 8 for the WT (gray),Val44Ala ( purple), and Val44Gly (magenta) and the iron
(red ) and the sulfurs ( yellow) of the redox site in the crystal
structures with the polar hydrogen atoms built in, and the
van der Waals surfaces of WT represented with transparent
spheres. The orientation of the peptide dipole of the WT
protein is indicated by the red (�) to blue (1) arrow. This
figure was generated using MOLSCRIPT (Kraulis, 1991)
and RASTER3D (Merritt and Murphy, 1994).
TABLE 1 Side-chain torsions of v1 and v2
Protein x1 x2 Ep rFe���44N
Val44 67.5 NA �1838.05 5.24
Val44 �146.5 NA �1837.58 5.16
Val44 �56 NA �1836.22 5.38
Val44Ile �49 �53.5 �1836.77 5.42
Val44Ile �57 �179 �1834.07 5.41
Val44Ile �98 62.5 �1835.46 5.29
Val44Ile �105 �65 �1836.00 5.06
Val44Ile �149 161 �1835.27 5.24
Val44Ile �144 74 �1838.46 5.07
Val44Ile 91 �55 �1830.67 5.71
Val44Ile 65 174 �1832.31 5.50
Val44Ile 55 74 �1835.87 5.37
Val44Leu �89 �72 �1838.54 5.06
Val44Leu �51 �161 �1834.86 5.39
Val44Leu �81 69 �1837.39 5.30
Val44Leu 167 �82 �1830.69 5.46
Val44Leu �105 155 �1834.03 5.26
Val44Leu �174 65 �1832.13 5.36
Val44Leu 44 �83 �1829.09 5.80
Val44Leu 152.5 144 �1828.96 5.54
Val44Leu 48.5 66 �1830.89 5.66
Shown in degrees ( x1 using Cg2 instead of Cg1 to correspond to the Cg1 of
Ile), energy of the protein Ep in kcal/mol, and the iron-to-nitrogen distance
of residue 44 rFe���44N in A for EM structures of different mutants. In order,
the starting conformations were x1 ¼ 60, 180, �608 and x2 ¼ 60, 180,
�608, incrementing over the latter first when applicable.
TABLE 2 Backbone torsion angles of residue 44
u44 c44
Mutant x-tal EM MD x-tal EM MD
Val44Gly �71 �66 �136 6 30 146 144 162 6 11
Val44Ala –66 –68 –88 6 16 141 149 153 6 3
Val44 (WT) �82 �75 �90 6 3 160 162 164 6 2
Val44Ile NA �75 �104 6 8 NA 158 161 6 3
Val44Leu NA �73 �86 6 2 NA 153 160 6 1
Shown in degrees for crystal (x-tal; see Methods for references) and energy-
minimized (EM) structures and molecular dynamics (MD) dynamical
average for C. pasteurianum rubredoxin.
2822 Ergenekan et al.
Biophysical Journal 85(5) 2818–2829

consistent with the average value for valine vs. alanine of 60
6 8 mV calculated here from the homologous rubredoxin
crystal structures and the original value of ;40 mV, which
used a slightly different definition of Df43,44 and older
crystal structures (Swartz et al., 1996).
Energy minimizations
The changes in the backbone torsions (Table 2), rFe���44N(Table 3), and the redox site SCSA (Table 4) for the
Val44Ala and Val44Gly relative to WT EM were similar to
the crystal structure results. Remarkably, the Df43,44 of the
Val44Ala and Val44Gly EM structures are within\10 mV
(�0.2 kcal/mol/e) of the Df43,44 calculated from the crystal
structures (Table 5).
Molecular dynamics
The Val44Gly and Val44Ala simulations exhibited two
different backbone conformations: one with u44 � �758,
which resembles the crystal and EM structures, and the other
with u44��1608, which has the loop opening outward (Fig.
4). This was reflected in the root-mean-square fluctuations
of the backbone angles of residue 44 (hDu442i1/2 ¼ 458,
hDc442i1/2 ¼ 238 and hDu44
2i1/2 ¼ 278, hDc442i1/2 ¼ 128,
respectively), which were much higher than WT (hDu442i1/2
¼ 188, hDc442i1/2 ¼ 118). In the u44 � �758 conformation,
the NH dipole points toward the redox site as in the crystal
structures of WT and mutants, whereas in the u44 � �1608
conformation, the NH dipole tilts away from the redox site
by ;408 and hydrogen-bonds to the carbonyl group of
residue 42. In addition, in Val44Gly, c44 tends to a larger
value when u44 � �1608. There are ;6 transitions during
the Val44Gly simulation and ;3 transitions during the
Val44Ala, where a transition is defined as when the new
conformation lasts for longer than;20 ps. Using a fit to two
Gaussian distributions, the relative population of the u44 ��758 conformation was 40% for Val44Gly and 85% for
Val44Ala.The increased backbone flexibility of Val44Ala and
Val44Gly relative to WT may be partly due to the small
side chains of alanine and glycine being unable to interlock
with Val8, unlike the two Cg of the WT valine. Thus, the u44
� �758 conformation of Val44Ala may be stabilized more
than for Val44Gly by the contact of the Val44Ala Cb with
Val8. In addition, the even larger backbone flexibility of
Val44Gly relative to WT may be due to the two glycines that
flank residue 44 in Cp rubredoxin resulting in three
consecutive glycines. Interestingly, a 0.5-ns MD simulation
under the same conditions of WT Pf rubredoxin (Gly43-Ala44-Pro45) has backbone torsions (u44 ¼ �77 6 38 and
c44 ¼ 1386 18) with smaller fluctuations (hDu442i1/2 ¼ 178
and hDc442i1/2 ¼ 98) than for Val44Ala (Gly43-Ala44-
Gly45). The relative population of the u44 � �758
conformation was 95% and rFe���44N ¼ 4.90 6 0.06 A.
Overall, the Val44Ala results for the backbone torsions
(Table 2), rFe���44N (Table 3), and Df43,44 (Table 5) are fairly
consistent with the crystal and EM structures of Val44Ala,whereas the Val44Gly results are not, due to the large
population of the u44 � �1608 conformation. The Val44Alaand Val44Gly MD simulations show an increased amount of
water penetration near the site of mutation relative to WT
(Table 4) near Sg42. In both simulations, the u44 � �1608
conformation occurs when a water molecule comes close to
Sg42 whereas the u44 � �758 conformation has water
penetration similar to WT. Interestingly, the WT Pf and the
TABLE 5 Reduction potential vs. SHE
DE8 Df43,44
Mutant A B x-tal EM MD
Val44Gly 81 77 28 32 �160 6 75
Val44Ala 86 53 32 25 1 6 65
Val44 (WT) 0 0 0 0 0 6 22
Val44Ile NA 24 NA 42 �3 6 16
Val44Leu NA �10 NA 8 �9 6 3
Shown relative to WT DE8 in mV (values in A are with respect to E8 ¼ �55
mV, see Eidsness et al. (1999) and Smith (private correspondence); and
values in B are with respect to E8 ¼ �77 mV, see Xiao et al. (2000) and
electrostatic potential at the redox site due to residues 43 and 44 relative to
WT Df43,44 in mV (x-tal are with respect to f43,44 ¼ 210 mV; EM are with
respect to f43,44 ¼ 232 mV; and MD are with respect to f43,44 ¼ 240 mV)
for crystal (x-tal; see Methods for references) and energy-minimized (EM)
structures and for the molecular dynamics (MD) dynamical average of C.
pasteurianum rubredoxin.
TABLE 4 Solvent contact surface area (SCSA) of the redox site
SCSA (A2) Nw
Mutant x-tal EM MD
Val44Gly 11.2 6 0.8 10.9 0.91
Val44Ala 10.9 6 0.5 11.1 0.60
Val44 (WT) 12 (8.3) 11.1 0.34
Val44Ile NA 11.9 0.35
Val44Leu NA 10.1 0.23
Shown for crystal (x-tal; see Methods for references) and energy-minimized
(EM) structures and molecular dynamics (MD) dynamical average number
of waters (Nw, i.e., the average number of waters that are 3.8 A from Sg9and Sg42) near redox site of C. pasteurianum rubredoxin. For WT, value for
leucine 41 in open (closed) conformation.
TABLE 3 Iron-to-nitrogen distance of residue 44 rFe���44N
rFe���44N
Mutant x-tal EM MD
Val44Gly 4.85 6 0.14 4.85 5.35 6 0.25
Val44Ala 4.89 6 0.02 4.92 5.01 6 0.11
Val44 (WT) 5.24 6 0.00 5.24 5.30 6 0.05
Val44Ile 5.25 6 0.10 5.07 5.27 6 0.04
Val44Leu NA 5.06 5.23 6 0.06
Shown in A for crystal (x-tal; see Methods for references) and energy-
minimized (EM) structures and molecular dynamics (MD) dynamical
average of C. pasteurianum rubredoxin.
Reduction Potential Changes in Rd 2823
Biophysical Journal 85(5) 2818–2829

Val44Ala Cp rubredoxin simulations both have a high
degree of water penetration (0.80 and. 0.60, respectively) so
that the u44��1608 conformation is not necessary for water
penetration but perhaps is a consequence of it. A single water
molecule near Sg42 is estimated to contribute roughly 50 mV
to the electrostatic potential at the redox site; however, the
contribution to the reduction potential will be proportionate
to the population of water and will presumably be reduced
due to the entropic contribution, since the solvation free
energy of a linearly responding solvent is half of the
solvation energy (Hyun and Ichiye, 1998).
Sequence analysis
The sequence analysis of 40 rubredoxins has 17 sequences
with Ala44 and four sequences with Gly44, indicating that
TABLE 6 Sequence alignment of 40 known and probable rubredoxin sequences found using BLAST and the SwissProt database
1 10 20 30 40 50
Rd #aa fl fl fl fl fl fl
Ach 72 ���AVLECKICWHRYDPAVGDEVWQILAGTPFAALPAHWRCPQCDGDREQFMVVDDAv 72 ���AVLECKICWQRYDPAEGDPVWQIPPGTPFAALPAHWRCPRCDGDREQFMVVDGMj1 80 ���RKYKCKVCGWVYDPLKGDPSQNIPPKTPFEELPDTWICPVCRGKVGKESFEPLD���Reu 78 ���ARLECKICWWEYDPEVGDPVWQIAPGTSFSALPAHWRCPNCDGEAEQFMVLGPQAAva 111 ���DRFECRSCGYVYEPEKGDSKHDIAPETPFAELPINWRCPVCTAAKKAAFSNIGPA���Bj 69 ���TRLECGICWTVYDPADGDDVAQIAPGTPFAALPEEWHCPNCDAAPKSKFMAIESCt2 52 MEQWKCNICGYIYNPETGDPEGDIPAGTSFESLPDSWMCPVCGAAGKEEFTKI
Dg 52 MDIYVCTVCGYEYDPAKGDPDSGIKPGTKFEDLPDDWACPVCGAASKDAFEKQ
DvH 52 MKKYVCTVCGYEYDPAEGDPDNGVKPGTSFDDLPADWVCPVCGAAPKSEFEAA
DvM 52 MKKYVCTVCGYEYDPAEGDPDNGVKPGTAFEDVPADWVCPICGAAPKSEFEPA
Me 52 MDKYECSICGYIYDEAEGD-DGNVAAGTKFADLPADWVCPTCGAADKDAFVKMD
Mts1 63 ���KRYKCRVCGYIYDPEKGEPRTDTPPGTPFEDLPETWRCPSCGAAKKKMFKPLDNs 111 ���DRFECRSCGYVYEPEKGDNKHDIAPETPFAELPINWRCPVCTAAKKAAFTNIGPA���Pab 53 MAKWRCKICGYIYDEDEGDPDNGISPGTKFEDLPDDWVCPLCGAAPKSEFERIE
Pas 53 MQKFECTLCGYIYDPALVGPDTPDQDGA-FEDVSENWVCPLCGAAGKEDFEVYED
Pf 53 AKWVCKICGYIYDEDAGDPDNGISPGTKFEELPDDWVCPICGAAPKSEFEKLED
Po2b 173 ���LKWICITCGHIYDEALGDEAEGFTPGTRFEDIPDDWCCPDCGAATKEDYVLYEEKRc 278 ���AIMECKICWTPYDPASGDEFRQVLPGTPFTALPEDWHCPNCDAAPKAQFIVQSDP���Re4 60 ���KLYQCAQCGFEYDEAVGWPEDGIEPGTRWDDIPEDWSCPDCGAAAKSDFFMVEVERRRl 70 ���DRMECGICWHVYDPAEGDPVWQIPPGTPFSNLTEDWRCPNCDAALQSKFMRLGDGRSs 115 ���PNHECRACGYVYIPSQGDQKTSVSPGTPFEALPLNWKCPVCGAAPRNYFISTGET���Aca 54 MKKYQCIVCGWIYDEAEGWPQDGIAPGTKWEDIPDDWTCPDCGVSKVDFEMIEV
Bm 53 MQKYVCDICGYVYDPAVGDPDNGVAPGTAFADLPEDWVCPECGVSKDEFSPEA
Cl 53 MQKYVCSVCGYVYDPADGEPDDPIDPGTGFEDLPEDWVCPVCGVDKDLFEPES
Ca 54 MKKYVCVVCGYIYDPAEGDPDNGVNPGTSFEDIPDDWVCPLCGVGKDQFEPSEE
Cp 54 MKKYTCTVCGYIYNPEDGDPDNGVNPGTDFKDIPDDWVCPLCGVGKDQFEEVEE
Cpe2 53 MKKFICDVCGYIYDPAVGDPDNGVEPGTEFKDIPDDWVCPLCGVDKSQFSETEE
Cs 53 MTKYVCTVCGYVYDPEVGDPDNNINPGTSFQDIPEDWVCPLCGVGKDQFEEEA
Ct3 53 MQKWVCVPCGYEYDPADGDPENGIEPGTAFEDLPEDWVCPVCGVDKSFFEPVS
Dd 45 MQKYVCNVCGYEYDPAEHD-------NVPFDQLPDDWCCPVCGVSKDQF
Hm 52 MKKYGCLVCGYVYDPAKGDPDHGIAPGTAFEDLPADWVCPLCGVSKDEFEPL
Mts2 177 MKICRICGYQI------------PEGEFNLLEDGWVCPRCGVGKEELQDSAEP���Po1 132 MSRYQCPDCQYIYDENKGEPHEGFHPNTSWNDIPKDWACPDCAVRDKVDFIFLAD���Po2a 173 MASYKCPDCNYVYDESAGNVHEGFSPGTPWHLIPEDWCCPDCAVRDKLDFMLIESG���Re3 61 MSSYRCPVCEYVYDESKGAPREGFPAGTPWDAVPDDWCCPDCGVREKLDFEPMPATA���Tp 52 MGTYMCDLCGWGYNPEVGDADGGIPAGTAFENLPDHWECPLCGVDKTSFVKV
Tt 52 MEKWQCTVCGYIYDPEVGDPTQNIPPGTKFEDLPDDWVCPDCGVGKDQFEKI
Mj2 55 ���ARYQC-MCGWVYDEDKGEPSQNIPPGTKFEDLPDTFRCPQCGLGKNAFRKIDCpe1 53 MEKFVCDVCGYIYDPVVGDPDNGVAPGTKFKDIPDTWVCPLCKLDKTHFSKVE
Ct1 69 ���ASWMCAECGYIYDPAEGNLETNIRPGMPFDKLPDDWSCPVCNHPKNQFTKFISQL
Azotobacter chroococcum strain mcd 1 (Ach), Azotobacter vinelandii (Av), Methanococcus jannaschii 1 (Mj1), Ralstonia eutropha (Reu), Anabaena
variabilis (Ava), Bradyrhizobium japonicum (Bj), Chlorobium tepidum 2 (Ct2), Desulfovibrio gigas (Dg), Desulfovibrio vulgaris strain Hildenborough
(DvH), Desulfovibrio vulgaris strain Miyazaki (DvM), Megasphaera elsdenii (Me),Methanothermobacter thermautotrophicus (Mts1), Nostoc sp. PCC 7120
(Ns), Pyrococcus abyssi (Pab), Peptoniphilus asaccharolyticus (Pas), Pyrococcus furiosus (Pf ), Pseudomonas oleovorans 2 subunit b (Po2b), Rhodobacter
capsulatus (Rc), Rhodococcus erythropolis 4 (Re4), Rhizobium leguminosarum (Rl), Synechocystis sp. PCC 6803 (Ss), Acinetobacter calcoaceticus (Aca),
Butyribacterium methylotrophicum (Bm), Chlorobium limicola (Cl), Clostriduim acetobutylicum (Ca), Clostridium pasteurianum (Cp), Clostridiumperfringens 2 (Cpe2), Clostridium sticklandii (Cs), Chlorobium tepidum 3 (Ct3), Desulfovibrio desulfuricans (Dd), Heliobacillus mobilis (Hm),
Methanothermobacter thermautotrophicus (Mts2), Pseudomonas oleovorans 1 (Po1), Pseudomonas oleovorans 2 subunit a (Po2a), Rhodococcus
erythropolis 3 (Re3), Ralstonia eutropha (Reu), Treponema pallidum (Tp), Thermoanaerobacterium thermosaccharolyticum (Tt),Methanococcus jannaschii
2 (Mj2), Clostridium perfringens 1 (Cpe1), Chlorobium tepidum 1 (Ct1).
2824 Ergenekan et al.
Biophysical Journal 85(5) 2818–2829

both can be accommodated at residue 44 (Table 6).
However, although Cp has the sequence Gly43-Val44-Gly45, Gly45 are rare whereas Gly43 are common.
Moreover, of rubredoxins with Ala44,[40% have a Pro45,which might restrict the backbone, and only one has Gly43-Ala44-Gly45, indicating it may be disfavored. Furthermore,
none of the four sequences with Gly44 has Gly43-Gly44-Gly45. In addition, of the 21 with either an Ala44 or Gly44,all but five have amino acids with branched Cb at residue 8,
even though neither the alanine nor the glycine would be
able to interlock with residue 8. As in the sequences with
Val44, there is considerable variability at residue 41,
indicating that the interactions controlled by Leu41 may
not depend on the amino-acid type.
Mutations to larger side chains
Crystal structures
No crystal structures of Val44Ile or Val44Leu were availableto us for analysis, although features of a Val44Ile have beendescribed (Xiao et al., 2000).
Energy minimization
The minimizations of Val44Ile and Val44Leu had nine initialconformations each ( x1 ¼ 608 and x2 ¼ 608, 1808, �608;
x1 ¼ 1808 and x2 ¼ 608, 1808, �608; x1 ¼ �608; and x2 ¼608, 1808, �608), which each resulted in a unique final
conformation. The x1 ¼ �1448, x2 ¼ 748conformation of
Val44Ile has the lowest Ep by 1.7 kcal/mol. The EM structure
appears visually similar to the Val44Ile crystal structure,
except that the backbone of residue 44 is closer by;0.2 A to
the iron site (Xiao et al., 2000) (Table 3). The x1¼�898 and
x2 ¼�728 conformation of Val44Leu has the lowest Ep by 1
kcal/mol. However, other conformations for both Val44Ileand Val44Leu were close in energy to those with the lowest
Ep and could become energetically favored by fluctuations.
Apparently, the protein is able to relax enough to accommo-
date many different conformations of these side chains.
Comparing the Val44Ile and Val44Leu lowest Ep EM
structures (henceforth referred to as the EM structures) with
theWT EM structure, the backbone torsion angles show little
change (Table 2), whereas the backbones are shifted closer to
the iron site DrFe���44N � �0.2 A (Table 3), even though
isoleucine and leucine are larger than valine. Unlike WT, the
two Cg1 of Val44Ile are in the wrong orientation to interlock
with Val8. Since the Val44Ile Cg2 and Cg1 point in the
direction of the WT Cg19 and Hb, respectively, the backbone
can move closer to the redox site (Fig. 5). In addition, the
Val44Leu side chain does not interlock with the two Cg of
Val8 since the single Cg points into solution in the direction
of the WT Cg29, so the backbone can also move closer to the
redox site (Fig. 5). The SCSA of the redox site for the mutant
EM structures was similar to the WT EM structure (Table 4).
The Df43,44 of the Val44Ile and Val44Leu EM structures are
within ;20 mV (�0.4 kcal/mol/e) of the experimental DE8(Table 5). The Df43,44 of the Val44Ile EM structure is
somewhat larger than might be expected from DrFe���44Nsince the backbone has moved such that the CO of residue 44
now makes a large positive contribution. Although other
side-chain conformations give rise to very different back-
bone shifts, the Boltzmann weighted averages (using Ep)
over all conformations of Val44Ile are rFe���44N ¼ 5.09 6
0.02 A and Df43,44 ¼ 366 5 mV, respectively; of Val44Leuare rFe���44N ¼ 5.09 6 0.01 A and Df43,44 ¼ 5 6 2 mV,
respectively; and of Val44 are rFe���44N ¼ 5.22 6 0.04 A and
FIGURE 4 A licorice model depicting the backbone
conformations for the WT crystal structure (gray) and twosnapshots from the MD simulation of the Val44Gly mutant
in the f � �758 conformation (magenta) and the f ��1608 conformation ( pink); the iron (red ) and the sulfurs
( yellow) of the redox site are also shown. The change in
the peptide dipole orientation between the two conforma-
tions is shown with a double-headed arrow pointing
toward the respective H44. This figure was generated using
MOLSCRIPT (Kraulis, 1991) and RASTER3D (Merritt
and Murphy, 1994).
Reduction Potential Changes in Rd 2825
Biophysical Journal 85(5) 2818–2829

Df43,44 ¼ 0 6 7 mV, respectively (where Df43,44 is relative
to 232 mV, the value for the WT conformation).
Molecular dynamics
Three simulations for Val44Ile and five for Val44Leu were
performed, which indicated that transitions between side-
chain conformations are quite easy. For Val44Ile, the initialconfiguration x1 ¼ 1808, x2 ¼ 608, which had the lowest Ep
of the EM structures, has average torsions x1 ¼ 136 6 848,
x2 ¼ 124 6 378 because it reorients about halfway through
the simulation from x1 ¼ �1508, x2 ¼ 608 to x1 ¼ 608, and
x2 ¼ 1808 so that the Val44Ile Cg are in similar positions to
the Val44 Cg in WT (Figs. 3 and 5). Moreover, the initial
configuration x1 ¼ 1808, x2 ¼ 1808 rotates during
equilibration so that the average torsions are x1 ¼ �147 6
98, x2 ¼ 82 6 108, with two transitions back to x2 ¼ 1808.
Finally, the initial configuration x1 ¼ 608, x2 ¼ 608 has
average torsions x1 ¼ 546 48, x2 ¼ 1306 318, with twelve
major transitions from x2 ¼ 608 to x2 ¼ 1808. For Val44Leu,the initial configuration x1 ¼ �608, x2 ¼ �608, which had
the lowest Ep, and the initial configuration x1 ¼ �608, x2 ¼1808 have average x1 ¼ �82 6 108, x2 ¼ �63 6 18 and x1¼ �68 6 28, x2 ¼ 162 6 118, respectively, and show no
transitions. On the other hand, the initial configuration x1 ¼�608, x2 ¼ 608 with average x1 ¼ �73 6 78, x2 ¼ �1266
688 rotates to x2 ¼ �608 during the equilibration and then
rotates again to x2 � 1708 halfway through the simulation.
Also, the initial configurations x1 ¼ 1808, x2 ¼ �608 and x1¼ 608, x2 ¼ �608 have average torsions x1 ¼ �120 6 418,
x2 ¼ �106 6 498 and x1 ¼ �166 6 28, x2 ¼ 80 6 228,
respectively, showing transitions.
The MD simulations with structures closest to the lowest
Ep structures for EM will henceforth be referred to as the MD
structures. The MD structures had average side-chain
conformations of x1 ¼ �147 6 98, x2 ¼ 82 6 108 for
Val44Ile, and x1 ¼ �82 6 108, x2 ¼ �63 6 18 for
Val44Leu. Root-mean-square fluctuations of the backbone
angles of residue 44 for Val44Ile and Val44Leu (hDu442i1/2
¼ 268, hDc442i1/2 ¼ 108 and hDu44
2i1/2 ¼ 138, hDc442i1/2 ¼
118, respectively) were similar to those for WT (hDu442i1/2¼
188, hDc442i1/2 ¼ 118). The backbone torsions are similar to
WT and to the EM results (Table 2), although the MD results
have larger values of u44. Both mutants show only a small
inward shift of the backbone relative to WT (Table 3) and
essentially no change in the amount of water penetration and
Df43,44 relative to WT (Tables 4 and 5).
Sequence analysis
The sequence analysis of 40 rubredoxins has only two se-
quences with Leu44 and none with Ile44, which indicates thatboth may be unfavored (Table 6). Of these two, the sequence
from Methanococcus jannaschii has a methionine instead of
a valine at residue 8 and an unusual deletion at residue 7
between the two cysteine ligands at residues 6 and 9.
DISCUSSION
The computational methods used here provided comple-
mentary information for understanding the modulation of
reduction potentials in the rubredoxins. Although longer MD
simulations could be performed to obtain better statistics,
inaccuracies of the potential energy functions, complexities
of the real protein environments, and the very small energies
involved (DE8 � 50 mV � 1 kcal/mol/e) imply that the
combination of EM, MD, and sequence analysis with ex-
perimental mutational studies is a better strategy.
The EM calculations are useful for predicting reasonable
structures for calculating electrostatic potentials. The EM
FIGURE 5 A licorice model depicting the side-chain
interaction of residue 44 and residue 8 for the WT (gray),
Val44Ile (blue), Val44Leu (green), and the iron (red ) and
the sulfurs ( yellow) of the redox site in the EM structures
with the van der Waals surfaces of WT represented with
transparent spheres. The orientation of the peptide dipole
of the WT protein is indicated by the red (�) to blue (1)
arrow. This figure was generated using MOLSCRIPT
(Kraulis, 1991) and RASTER3D (Merritt and Murphy,
1994).
2826 Ergenekan et al.
Biophysical Journal 85(5) 2818–2829
structures here compare well with existing experimental data
and the differences in the electrostatic potential at the redox
site of residues 43 and 44 relative to WT (Df43,44) calculated
from the EM structures are remarkably consistent with the
changes in the experimental reduction potential relative to
WT (DE8) (Table 5). Many energetically close side-chain
conformations may indicate that more than one conformation
is present in solution and that different conformation(s) may
be stable in another rubredoxin.
On the other hand, the MD simulations are useful for
exploring dynamical behavior such as conformational
changes. When such conformational changes are present
such as in the V44G and V44A mutants, the MD simulations
may not be as useful in predicting the actual changes to
the electrostatics of the redox site upon mutation since the
transition frequencies may be sensitive to details such as the
potential energy function and treatment of the environment.
Overall, the electrostatic potential is very sensitive to
fluctuations and so the electrostatic potentials of individual
low energy conformations from the EM minimizations are
more useful. However, the simulations are useful in
identifying multiple conformations that may exist in the real
proteins so that alternative or secondary mutations can be
proposed. The MD simulations are also useful in identifying
differences in water penetration since the SCSA of the redox
site for the crystal and EM structures does not seem to
correlate with the water penetration observed in the
simulation. Since the SCSA of the redox site for even the
average MD structures (Val44Gly 8.3 A2, Val44Ala 14.0 A2,
WT 11.0 A2, Val44Ile 11.6 A2, and Val44Leu 9.9 A2) are
only somewhat correlated with Nw in the MD simulations
(Table 4) whereas the torsions, rFe���44N, and Df43,44 of the
average MD structure are close to the averages of these
quantities over the simulation (within 28, 0.02 A, and 30 mV,
respectively), the water penetration is not reflected well by
the SCSA.
Finally, the greatest utility of the sequence analysis is in
indicating mutations that are likely to be successful. An
amino acid that occurs frequently in a sequence determinant
is likely to be robust in terms of its structure and effects.
Also, neighboring residues that are frequently paired with an
amino-acid type at a sequence determinant may be necessary
for the success of that mutation. The sequence analyses here
are consistent with the observations from the molecular
mechanics calculations.
Two major questions for the rubredoxins are whether the
size and reduction potential relationship observed for valine
vs. alanine at residue 44 in rubredoxin holds for other
nonpolar residues and what are the underlying structural
determinants of the observed reduction potential shifts.
Experimental measurements of the reduction potential of
WT and mutant Cp rubredoxins indicate that increasing the
side-chain size of residue 44 correlates only somewhat with
a decrease in reduction potential, which is explained by the
work here.
For the mutations to smaller nonpolar residues, experi-
mental measurements show an increase in reduction
potential with respect to WT, in agreement with the
extrapolation. The analysis of both the crystal and EM
structures of Val44Ala and Val44Gly shows that the
backbone shifts toward the redox site, giving rise to an
increase in the electrostatic potential. However, there is
a small or no increase in reduction potential between
Val44Ala to Val44Gly than between WT and Val44Ala.The analysis of both the crystal and EM structures indicates
that the backbone in Val44Gly cannot move any closer to the
redox site than the backbone in Val44Ala. In addition, the
increased backbone flexibility in the Val44Ala and Val44GlyMD simulations indicates that the crystal and EM structures
may not give the full picture for the protein in solution.
Evidence of this flexibility has now been seen in crystal
structures of WT, Val44Ala, and Val44Gly, where the
standard deviations between the three molecules in the
asymmetric unit are largest for Val44Gly. This implies that
the discrepancies in the experimental E8 of Val44Gly,Val44Ala, and even WT (Table 5) might be due to differing
stabilization of the two conformations by differences in the
environmental conditions. More importantly, the greater
number of waters near the redox site in Val44Ala and
Val44Gly may contribute to the large shift in potential
between these mutants and WT. Finally, the relative lack of
glycines at residues 44 and 45 in the rubredoxin sequences
may be due to an evolutionary selection against backbone
flexibility near residue 44.
For the mutations to larger nonpolar residues than WT,
experimental measurements show relatively small changes in
reduction potential with respect to WT, contrary to the
extrapolation. The reduction potential of Val44Ile increases
compared to WT while extrapolation would predict it to
decrease. SinceVal8 is in van derWaals contact withVal44 inthe WT crystal structure and Val8 is not in contact with Ile44in the Val44Ile crystal structure, water might enter through
the separation and thus increase the potential (Xiao et al.,
2000). However, no evidence for greater water penetration
relative to WT is seen in the MD simulations. Instead, the
Val44Ile EM structure indicates that the separation closes up
so that the backbone moves closer to the redox site even
though the isoleucine side chain is bigger than the WT valine
side chain, leading to the increased potential. In the other
case, the reduction potential of Val44Leu is similar to WT
while extrapolation would predict it to decrease. The
Val44Leu EM structure also indicates that the leucine side
chain adopts a conformation that allows the backbone to
move closer to the redox site leading to the increased
potential. In addition, the multiple side-chain conformations
of Val44Ile and Val44Leu, which are relatively close in
energy for the EM structures and are accessible via transitions
in the MD, indicate that the reduction potential changes may
differ for different homologous rubredoxins or even under
different environmental conditions since the different con-
Reduction Potential Changes in Rd 2827
Biophysical Journal 85(5) 2818–2829

formations have different backbone shifts. Finally, the lack of
isoleucines and leucines at residue 44 in the rubredoxin
sequences may be due to an evolutionary selection against
side chains with multiple conformations.
CONCLUSIONS
Sequence determinants of reduction potentials can be
understood by a combination of energetic analysis, sequence
analysis, and molecular mechanics, even though no tech-
nique by itself is predictive. First, sequence determinants are
identified using energetic and sequence analyses of homolog-
ous proteins. Trends in the electrostatics of experimental
structures and in the sequences are found that correlate
with changes in the reduction potential. Previously, alanine
vs. valine at residue 44 of rubredoxin was identified by this
method as the sequence determinant and the side-chain size
causing a backbone shift as the underlying structural deter-
minant for a 50-mV change in reduction potential (Swartz
et al., 1996). However, prediction of new sequence determi-
nants by extrapolations based on physicochemical properties
of the side chains is unreliable even in the simple case of
extrapolating the side-chain size vs. reduction potential trend
in the rubredoxins. Second, the feasibility of mutations
based on these sequence determinants is examined using
molecular mechanics calculations and sequence analyses.
EM calculations are useful in identifying changes in the pro-
tein structure due to the mutation. On the other hand, MD
simulations appear most useful in detecting conformational
variability and solvent penetration. In addition, sequence
analyses are useful in identifying mutations that may not be
successful because they rarely appear in the sequences.
Overall, the combined analysis indicates that differences
in the backbone position and the water penetration rather
than the side-chain size are two structural determinants of
the differences in reduction potentials of the Cp mutants,
although other factors such as differences in the electrostatic
potential beyond residues 43 and 44, differences in structural
relaxation, and differences in entropic factors are not
excluded. Thus, in Val44Ala and Val44Gly, larger backboneshifts and greater water penetration than WT lead to
reduction potential increases whereas in Val44Ile and
Val44Leu, small shifts and similar water penetration as
WT lead to small changes in reduction potential, regardless
of the side-chain size. Since WT Pf and Val44Ala Cp
rubredoxins show similar water penetration in simulations
and experimental reduction potentials, experimental studies
of Val44Ala-Gly45Pro and Val44Gly-Gly45Pro Cp mutants
would show if the reduction potential shift is affected by the
backbone flexibility.
Finally, two important findings about mutations to shift
reduction potentials in other rubredoxins based on the
combined analyses are as follows. First, mutations of residue
44 to alanine, and especially glycine, may require a second-
ary mutation when residue 45 is a glycine, to reduce
backbone flexibility. Second, mutations of residue 44 to
isoleucine or leucine may cause inconsistent changes in
reduction potential in different rubredoxins because the exact
sequence may lead to different environments for residue 44
that stabilize different side-chain conformations. Overall,
computational methods can be useful in designing mutations
for altering properties of proteins because of the complexity
of protein structure and function.
We thank Eugene T. Smith for providing us with data. T.I. also thanks
Bernard R. Brooks at the National Institutes of Health’s National Heart,
Lung and Blood Institute, for his hospitality during the completion of this
work.
This work was supported by a grant from the National Institutes of Health
(R01-GM45303). We also thank the National Science Foundation’s
National Partnership for Advanced Computational Infrastructure
(MCB990010) for computational resources.
REFERENCES
Bau, R., D. C. Rees, J. Kurtz, M. Donald, R. A. Scott, H. Huang, M. W. W.Adams, and M. K. Eidsness. 1998. Crystal structure of rubredoxin fromPyrococcus furiosus at 0.95 A resolution, and the structures ofN-terminal methionine and formylmethionine variants of Pf Rd. Con-tributions of N-terminal interactions to thermostability. J. Biol. Inorg.Chem. 3:484–493.
Beck, B. W., Q. Xie, and T. Ichiye. 2001. Sequence determination ofreduction potential by cysteinyl hydrogen bonds and peptide dipoles in[4Fe-4S] Ferredoxin. Biophys. J. 81:601–613.
Brooks, B. R., R. E. Bruccoleri, B. D. Olafson, D. J. States, S.Swaminathan, and M. Karplus. 1983. CHARMM: a program formacromolecular energy, minimization, and dynamics calculations.J. Comp. Chem. 4:187–217.
Dauter, Z., K. S. Wilson, L. C. Sieker, J. M. Moulis, and J. Meyer. 1996.Zinc- and iron-rubredoxins from Clostridium pasteurianum at atomicresolution: a high-precision model of a ZnS4 coordination unit ina protein. Proc. Natl. Acad. Sci. USA. 93:8836–8840.
Eidsness, M. K., A. E. Burden, K. A. Richie, D. M. J. Kurtz, R. A. Scott,E. T. Smith, T. Ichiye, B. Beard, T. Min, and C. Kang. 1999. Modulationof the redox potential of the Fe(SCys)4 site in rubredoxin by the orienta-tion of a peptide dipole. Biochemistry. 38:14803–14809.
Eidsness, M. K., K. A. Richie, A. E. Burden, and D. M. Kurtz, Jr. 1997.Dissecting contributions to the thermostability of Pyrococcus furiosusrubredoxin: b-sheet chimeras. Biochemistry. 36:10406–10413.
Frey, M. 1993. Water structure of crystallized proteins: high-resolutionstudies. In Water and Biological Macromolecules. E. Westhof, editor.CRC Press, Boca Raton. 98–147.
Gleason, F. K. 1992. Mutation of conserved residues in Escherichia colithioredoxin: effects on stability and function. Prot. Sci. 1:609–616.
Hyun, J.-K., and T. Ichiye. 1998. Non-linear response in ionic solvation:a theoretical investigation. J. Chem. Phys. 109:1074–1083.
Ichiye, T. 2001. Simulations of electron transfer proteins. In ComputationalBiochemistry andBiophysics.O.M.Becker,A.D.MacKerell Jr., B. Roux,andM.Watanabe, editors. Marcel Dekker, Inc., NewYork, NY. 393–415.
Jorgensen, W. L., J. Chandrasekhar, J. D. Madura, R. W. Impey, and M. L.Klein. 1983. Comparison of simple potential functions for simulatingliquid water. J. Chem. Phys. 79:926–935.
Kraulis, P. J. 1991. MOLSCRIPT: a program to produce both detailed andschematic plots of protein structures. J. Appl. Crystallogr. 24:946–950.
Lee, B., and F. M. Richards. 1971. The interpretation of protein structures:estimation of static accessibility. J. Mol. Biol. 55:379–400.
2828 Ergenekan et al.
Biophysical Journal 85(5) 2818–2829

Lovenberg, W., and B. Sobel. 1965. Rubredoxin: a new electron transferprotein from Clostridium pasteurianum. Proc. Natl. Acad. Sci. USA.54:193–199.
McCammon, J. A., and S. C. Harvey. 1987. Dynamics of Proteins andNucleic Acids. Cambridge University Press, New York.
Merritt, E. A., and M. E. P. Murphy. 1994. RASTER3D version 2.0:a program for photorealistic molecular graphics. Acta Crystallogr.D50:869–873.
Meyer, T. E., J. A. Prezysiecki, J. A. Watkins, A. Bhattacharyya, R. P.Simondsen, M. A. Cusanovich, and G. Tollin. 1983. Correlation betweenrate constant for reduction and redox potential as a basis for systematicinvestigation of reaction mechanisms of electron transfer proteins. Proc.Natl. Acad. Sci. USA. 80:6740–6744.
Min, T., C. E. Ergenekan, M. K. Eidsness, T. Ichiye, and C. Kang. 2001.Water gates and other structural modulators in the reduction ofClostridium pasteurianum rubredoxin. Prot. Sci. 10:613–621.
Moura, I., J. G. Moura, M. H. Santos, A. V. Xavier, and J. LeGall. 1979.Redox studies on rubredoxin from sulphate and sulphur reducingbacteria. FEBS Lett. 107:419–421.
Rychaert, J. P., G. Ciccotti, and H. J. C. Berendsen. 1977. Numericalintegration of the Cartesian equation of motion of a system withconstraints:molecular dynamics of n-alkanes. J. Comp. Phys. 23:327–341.
Schaffer, A. A., L. Aravind, T. L. Madden, S. Shavin, J. L. Spouge, Y. I.Wolf, E. V. Koonin, and S. F. Altschul. 2000. Improving the accuracy ofPSI-BLAST protein database searches with composition-based statisticsand other refinements. Nucleic Acids Res. 29:2994–3005.
Shen, B., D. R. Jollie, C. D. Stout, T. C. Diller, F. A. Armstrong, C. M.Gorst, G. N. La Mar, P. J. Stephens, and B. K. Burgess. 1994.
Azotobacter vinelandii ferredoxin I: alteration of individual surfacecharges and the [4Fe-4S]21/1 cluster reduction potential. J. Biol. Chem.269:8564–8575.
Shenoy, V. S., and T. Ichiye. 1993. Influence of protein flexibility on theredox potential of rubredoxin: energy minimization studies. Proteins.17:152–160.
Steinbach, P. J., and B. R. Brooks. 1994. New spherical-cutoff methods forlong-range forces in macromolecular simulation. J. Comp. Chem. 15:667–683.
Swartz, P. D., B. W. Beck, and T. Ichiye. 1996. Structural origins of redoxpotential in iron-sulfur proteins: electrostatic potentials of crystalstructures. Biophys. J. 71:2958–2969.
Watenpaugh, K., L. C. Sieker, and L. H. Jensen. 1980. Crystallographicrefinement of rubredoxin at 1.2 A resolution. J. Mol. Biol. 138:615–633.
Yelle, R. B., N.-S. Park, and T. Ichiye. 1995. Molecular dynamicssimulations of rubredoxin from Clostridium pasteurianum: changes instructure and electrostatic potential during redox reactions. Proteins.22:154–167.
Xiao, Z., M. J. Maher, M. Cross, C. S. Bond, J. M. Guss, and A. G.Wedd. 2000. Mutation of the surface valine residues 8 and 44 in therubredoxin from Clostridium pasteurianum: solvent access versusstructural changes as determinants of reversible potential. J. Biol.Inorg. Chem. 5:75–84.
Zeng, Q., E. T. Smith, D. M. Kurtz, and R. A. Scott. 1996. Proteindeterminants of metal site reduction potentials. Site directed mutagenesisstudies of Clostridium pasteurianum rubredoxin. Inorg. Chim. Acta.242:245–251.
Reduction Potential Changes in Rd 2829
Biophysical Journal 85(5) 2818–2829
Copyright © 2022 FDOKUMEN