
Prediction of Photoperiodic Regulators from Quantitative Gene Circuit Models
45
Theory Prediction of Photoperiodic Regulators from Quantitative Gene Circuit Models Jose ´ Domingo Salazar, 1,2,3,7 Treenut Saithong, 5 Paul E. Brown, 3,5 Julia Foreman, 5 James C.W. Locke, 1,3,4,8 Karen J. Halliday, 5 Isabelle A. Carre ´, 1 David A. Rand, 2,3 and Andrew J. Millar 5,6, * 1 Department of Biological Sciences 2 Mathematics Institute 3 Interdisciplinary Programme for Cellular Regulation and Warwick Systems Biology Centre 4 Department of Physics University of Warwick, Coventry CV4 7AL, UK 5 School of Biological Sciences, Edinburgh University, Mayfield Road, Edinburgh EH9 3JH, UK 6 Centre for Systems Biology at Edinburgh, C.H.Waddington Building, King’s Buildings, Edinburgh EH9 3JR, UK 7 Present address: Human Safety, Syngenta, Jealott’s Hill International Research Centre, Bracknell, Berkshire RG42 6EY, UK 8 Present address: Division of Biology, California Institute of Technology, 1200 E. California Blvd., Pasadena, CA 91125, USA *Correspondence: [email protected] DOI 10.1016/j.cell.2009.11.029 SUMMARY Photoperiod sensors allow physiological adaptation to the changing seasons. The prevalent hypothesis is that day length perception is mediated through coupling of an endogenous rhythm with an external light signal. Sufficient molecular data are available to test this quantitatively in plants, though not yet in mammals. In Arabidopsis, the clock-regulated genes CONSTANS (CO) and FLAVIN, KELCH, F-BOX (FKF1) and their light-sensitive proteins are thought to form an external coincidence sensor. Here, we model the integration of light and timing information by CO, its target gene FLOWERING LOCUS T (FT), and the circadian clock. Among other predictions, our models show that FKF1 activates FT. We demon- strate experimentally that this effect is independent of the known activation of CO by FKF1, thus we locate a major, novel controller of photoperiodism. External coincidence is part of a complex photope- riod sensor: modeling makes this complexity explicit and may thus contribute to crop improvement. INTRODUCTION Many eukaryotes measure changes in day length (photoperiod), in order to synchronize their life strategies with seasonal rhythms. The photoperiod sensor in vertebrates is thought to be located in the pars tuberalis of the pituitary gland, though its molecular mechanisms are unclear (reviewed in Hazlerigg and Loudon, 2008). Day-length perception in plants occurs in leaves, giving rise to a long-range signal. In Arabidopsis thaliana, a signal induced by long photoperiods controls the transition to flowering at the apical meristem. Other plant species initiate over- wintering adaptations, such as bud dormancy and tuber forma- tion, in response to short photoperiods (Thomas and Vince-Prue, 1997). Photoperiod measurement depends upon an interaction between photoreceptors and the 24 hr circadian clock. In Arabi- dopsis, the clock-controlled transcription of the B-box factor CONSTANS (CO) leads to a CO mRNA profile that peaks late in the day. High CO mRNA levels coincide largely with the light interval under long-day conditions (such as 16L:8D, a cycle of 16 hr of light and 8 hr of darkness), but are restricted to the dark phase under short days (8L:16D) (Suarez-Lopez et al., 2001). The major target of CO, the gene FLOWERING LOCUS T (FT), is expressed after the CO peak, but only when CO expres- sion coincides with light (Yanovsky and Kay, 2002). This led to the hypothesis that CO may activate FT transcription in a light- dependent manner (reviewed in Carre ´ et al., 2006; Imaizumi and Kay, 2006). More recently, the CO protein was shown to be unstable in darkness, partly due to interaction with COP1 (Jang et al., 2008), but to accumulate under constant white or blue light (Valverde et al., 2004). Thus, stabilization of the CO protein in the light may account for the light-dependency of CO effects on FT. This regulation occurs in the phloem companion cells (An et al., 2004), allowing rapid transport of the FT protein product to the apical meristem (reviewed in Kobayashi and Weigel, 2007; Turck et al., 2008). There, interac- tion with the meristem-specific transcription factor FD activates the homeotic genes that lead to floral development (reviewed in Kobayashi and Weigel, 2007; Turck et al., 2008). This molecular mechanism is consistent with the long- standing hypothesis that day-length perception is mediated through coincidence of an endogenous rhythm with an external light signal (Bu ¨ nning, 1936). Expressing this hypothesis in equa- tions shows that the rhythmic component could be a generic, clock-controlled gene with expression levels that rise toward the end of a long photoperiod (Oosterom et al., 2004). This contrasts with the ‘‘internal coincidence model’’ that may apply in vertebrates (Hazlerigg and Loudon, 2008) in which photope- riod acts to bring two circadian rhythms into a particular phase relationship (Pittendrigh, 1960). Recent evidence suggests that the mechanism of day-length perception in plants may be more complex than either conceptual model. For example, expression of the CO mRNA at the end of long-day photoperiods is mediated in part through the action of a rhythmically 1170 Cell 139, 1170–1179, December 11, 2009 ª2009 Elsevier Inc.
-
Upload
independent -
Category
Documents
-
view
0 -
download
0
Transcript of Prediction of Photoperiodic Regulators from Quantitative Gene Circuit Models

Theory
Prediction of Photoperiodic Regulatorsfrom Quantitative Gene Circuit ModelsJose Domingo Salazar,1,2,3,7 Treenut Saithong,5 Paul E. Brown,3,5 Julia Foreman,5 James C.W. Locke,1,3,4,8
Karen J. Halliday,5 Isabelle A. Carre,1 David A. Rand,2,3 and Andrew J. Millar5,6,*1Department of Biological Sciences2Mathematics Institute3Interdisciplinary Programme for Cellular Regulation and Warwick Systems Biology Centre4Department of Physics
University of Warwick, Coventry CV4 7AL, UK5School of Biological Sciences, Edinburgh University, Mayfield Road, Edinburgh EH9 3JH, UK6Centre for Systems Biology at Edinburgh, C.H.Waddington Building, King’s Buildings, Edinburgh EH9 3JR, UK7Present address: Human Safety, Syngenta, Jealott’s Hill International Research Centre, Bracknell, Berkshire RG42 6EY, UK8Present address: Division of Biology, California Institute of Technology, 1200 E. California Blvd., Pasadena, CA 91125, USA
*Correspondence: [email protected] 10.1016/j.cell.2009.11.029
SUMMARY
Photoperiod sensors allow physiological adaptationto the changing seasons. The prevalent hypothesisis that day length perception is mediated throughcoupling of an endogenous rhythm with an externallight signal. Sufficient molecular data are availableto test this quantitatively in plants, though not yet inmammals. In Arabidopsis, the clock-regulated genesCONSTANS (CO) and FLAVIN, KELCH, F-BOX (FKF1)and their light-sensitive proteins are thought to forman external coincidence sensor. Here, we model theintegration of light and timing information by CO,its target gene FLOWERING LOCUS T (FT), and thecircadian clock. Among other predictions, ourmodels show that FKF1 activates FT. We demon-strate experimentally that this effect is independentof the known activation of CO by FKF1, thus welocate a major, novel controller of photoperiodism.External coincidence is part of a complex photope-riod sensor: modeling makes this complexity explicitand may thus contribute to crop improvement.
INTRODUCTION
Many eukaryotes measure changes in day length (photoperiod),
in order to synchronize their life strategies with seasonal
rhythms. The photoperiod sensor in vertebrates is thought to
be located in the pars tuberalis of the pituitary gland, though its
molecular mechanisms are unclear (reviewed in Hazlerigg and
Loudon, 2008). Day-length perception in plants occurs in leaves,
giving rise to a long-range signal. In Arabidopsis thaliana, a signal
induced by long photoperiods controls the transition to flowering
at the apical meristem. Other plant species initiate over-
wintering adaptations, such as bud dormancy and tuber forma-
tion, in response to short photoperiods (Thomas and Vince-Prue,
1997). Photoperiod measurement depends upon an interaction
1170 Cell 139, 1170–1179, December 11, 2009 ª2009 Elsevier Inc.
between photoreceptors and the 24 hr circadian clock. In Arabi-
dopsis, the clock-controlled transcription of the B-box factor
CONSTANS (CO) leads to a CO mRNA profile that peaks late
in the day. High CO mRNA levels coincide largely with the light
interval under long-day conditions (such as 16L:8D, a cycle of
16 hr of light and 8 hr of darkness), but are restricted to the
dark phase under short days (8L:16D) (Suarez-Lopez et al.,
2001). The major target of CO, the gene FLOWERING LOCUS
T (FT), is expressed after the CO peak, but only when CO expres-
sion coincides with light (Yanovsky and Kay, 2002). This led to
the hypothesis that CO may activate FT transcription in a light-
dependent manner (reviewed in Carre et al., 2006; Imaizumi
and Kay, 2006). More recently, the CO protein was shown to
be unstable in darkness, partly due to interaction with COP1
(Jang et al., 2008), but to accumulate under constant white or
blue light (Valverde et al., 2004). Thus, stabilization of the CO
protein in the light may account for the light-dependency of
CO effects on FT. This regulation occurs in the phloem
companion cells (An et al., 2004), allowing rapid transport of
the FT protein product to the apical meristem (reviewed in
Kobayashi and Weigel, 2007; Turck et al., 2008). There, interac-
tion with the meristem-specific transcription factor FD activates
the homeotic genes that lead to floral development (reviewed in
Kobayashi and Weigel, 2007; Turck et al., 2008).
This molecular mechanism is consistent with the long-
standing hypothesis that day-length perception is mediated
through coincidence of an endogenous rhythm with an external
light signal (Bunning, 1936). Expressing this hypothesis in equa-
tions shows that the rhythmic component could be a generic,
clock-controlled gene with expression levels that rise toward
the end of a long photoperiod (Oosterom et al., 2004). This
contrasts with the ‘‘internal coincidence model’’ that may apply
in vertebrates (Hazlerigg and Loudon, 2008) in which photope-
riod acts to bring two circadian rhythms into a particular phase
relationship (Pittendrigh, 1960). Recent evidence suggests that
the mechanism of day-length perception in plants may be
more complex than either conceptual model. For example,
expression of the CO mRNA at the end of long-day photoperiods
is mediated in part through the action of a rhythmically

expressed, light-activated F-box-Kelch protein known as FKF1
(reviewed in Imaizumi and Kay, 2006). High FKF1 protein levels
coincide with the light interval at the end of a long day, when
FKF1-mediated degradation of transcriptional repressors in the
CYCLING DOF FACTOR family promote transcription of CO
(Fornara et al., 2009; Imaizumi et al., 2005; Sawa et al., 2007).
Under short day conditions, FKF1 is expressed in the dark and
appears inactive. This external coincidence between light and
the FKF1 expression rhythm affects the CO expression rhythm:
the level of CO protein may therefore integrate the output of
two external coincidence sensors.
Here, we model the photoperiod sensor of Arabidopsis in
detail, based upon molecular timeseries data. We aim to test
whether the expression patterns of the known flowering-time
genes are quantitatively consistent with their proposed regula-
tory functions, and whether these functions are sufficient to
explain the observed behavior of the plant. Analysis of the
models confirms our understanding of flowering time regulation
in some areas. Specific failures of the models in other areas
predict new regulatory interactions or components that can be
tested by molecular experimentation.
RESULTS
Model Construction and Data SelectionThe regulatory network was represented in ordinary differential
equations, where the form of the equations reflected the known
FT
Veg Flowering
CO
Clo
ck
Mod
el 2
TOC1 ≈ CO
a) Simple Clock b) 2-loop Clock
TOC1
LHY
Y
TOC1
LHY
X
FT
CO
PCO
FT
CO
b) CO degr.a) FT activ.
Mod
el 1
Mod
el 4 FT
Veg Flowering
CO
Clo
ck
Mod
el 2
TOC1 ≈ CO
a) Simple Clock b) 2-loop Clock
TOC1
LHY
Y
TOC1
LHY
X
TOC1 ≈ CO
a) Simple Clock b) 2-loop Clock
TOC1
LHY
TOC1
LHY
Y
TOC1
LHY
X
FT
CO
PCO
FT
CO
b) CO degr.a) FT activ.
Mod
el 1
Mod
el 4
Figure 1. Overview of Modeling Stages
Model 1 uses CO mRNA data and light/dark cycles as inputs and simulates FT
mRNA accumulation. In model 1a, light and CO mRNA activate FT transcription
whereas in model 1b light inhibits the degradation of CO protein, which acti-
vates FT. Model 2 takes a light/dark cycle as input and simulates the rhythmic
expression of CO mRNA. Model 2a is based on a single-loop model for the
circadian clock (Locke et al., 2005a) while model 2b uses the interlocking-
loop model (Locke et al., 2005b). Models 1 and 2 are combined in model 3,
which simulates FT mRNA profiles for a given light/dark cycle. Speculative
models including FKF1 are presented in Figures 4, S4, S5, and S8. Model 4
uses model 3 to predict flowering responses based on FT mRNA accumulation.
molecular interactions. Model construction proceeded in stages
(Figure 1). Alternative models were compared at each stage. The
maximal transcription rates, mRNA degradation rates and other
biochemical parameters were estimated by fitting the models to
quantitative, molecular timeseries data (see the Supplemental
Data, available online), as none of these parameter values have
been measured experimentally. The consistency of the available
data sets enabled this approach. There was little data for key
proteins in wild-type plants, so our initial models were based
on quantitative mRNA expression patterns, with indirect
information on CO protein levels and their regulation by light.
Twenty-four sets of timeseries data (Table S1) were selected to
construct and validate the models (see Supplemental Data).
Model 1: Activation of FT by CO and LightModel 1 aimed to simulate the accumulation of FT mRNA, start-
ing from CO mRNA expression data. The detailed mechanism of
FT activation by CO protein remains to be determined, so several
models were tested (Figure S1, Supplemental Data). In the
simplest model (1a), we assumed that the CO protein was
produced rapidly and was highly unstable, so that accumulation
of the CO protein mirrored CO mRNA. Furthermore we supposed
that the CO protein was only active in the light. Thus the rate of FT
transcription was determined by the level of CO mRNA when
light was present and FT was not transcribed in darkness.
Parameter values for this model were estimated using data on
CO and FT mRNA levels in wild-type plants grown under long
and short photoperiods (sets 1, 3, 8, and 9, see Table S1), quan-
tified from two publications of the Kay laboratory (Imaizumi et al.,
2003; Yanovsky and Kay, 2002). We term these the training data
(Figure 2). As expected, a limited number of parameter values
allowed accurate simulation of the observed pattern of FT
mR
NA
con
cent
ratio
n
A
C
B
D
Time (hours)
Figure 2. External Coincidence of CO and Light Predicts FT mRNA
Expression
FT mRNA expression patterns were simulated using model 1a, based on the
training data sets (A and B) (Yanovsky and Kay, 2002) and (C and D) (Imaizumi
et al., 2003), under short-day (A and C) and long-day (B and D) conditions. The
maximal CO mRNA level under short days is set to 1 for each set of data and
simulations. Open circles, CO mRNA data; closed circles, FT mRNA data; solid
line, simulated FT mRNA levels. Filled bar on time axis, dark interval; open bar,
light interval.
Cell 139, 1170–1179, December 11, 2009 ª2009 Elsevier Inc. 1171

mRNA accumulation (see Supplemental Data). Using the optimal
parameter sets, the fit of simulated FT mRNA levels to either
training data set was better than the fit of the experimental
data sets to each other, indicating that no better match to the
training data was possible.
A more complex model (1b) explicitly included an unstable CO
protein that was stabilized during the light interval but rapidly
degraded in darkness. Light-driven accumulation of this protein
promoted FT transcription. Model 1b also fitted well to the
training data, with no significant improvement over model 1a
(unpublished data). More complex models, involving for example
an additional effect of light on the ability of the CO protein to acti-
vate FT transcription, failed to improve the fit (see Supplemental
Data). Models 1a and 1b were validated using further sets of CO
and FT mRNA data from a variety of photoperiodic conditions.
The parameters developed for the training data also fitted the
validation data well (Figure S1C; Supplemental Data), indicating
that the simple mechanisms of submodels 1a and 1b recapitu-
lated the overall activation of FT by CO. As model 1b explicitly
includes regulation of the CO protein, we anticipate that this
will be more useful for comparison to future molecular data.
Modification of FT ActivationThe quantitative models allowed us to test whether FT activation
was altered in mutant backgrounds. The toc1 mutation, for
example, shortens the period of the circadian clock from 24 hr
to 21 hr. toc1 mutant plants are induced to flower rapidly under
8L:16D, but this defect in photoperiodism can be rescued by
growing the mutants under 21 hr light-dark cycles. It was there-
fore proposed that the altered circadian clock function is the only
photoperiod-response defect in the toc1 mutant (Yanovsky and
Kay, 2002). From the CO mRNA levels observed in toc1 mutants,
models 1a and 1b simulated levels of FT mRNA that only slightly
underestimated the levels observed in toc1 mutants (Figures
S2a–S2d and unpublished data). The best match was obtained
by increasing the FT activation parameter by 40% (Figures
S2e–S2h).
Using model 1a, simulations of FT transcription under long
days consistently predicted an aberrant peak of FT mRNA in
the early morning that was absent from the training data (Figures
2B and 2D). The aberrant peak was also predicted using model
1b but was delayed by the time required for CO protein to
accumulate (unpublished data, similar to Figure 3D). This defect
suggested that our models overlooked an additional aspect of
FT regulation. The effect of CO on FT transcription may be
‘‘gated,’’ such that accumulation of CO mRNA in the morning
results in less transcription of FT than an equal amount of
CO mRNA in the afternoon. We estimated the effect of the
hypothetical ‘‘morning gate’’ in model 1a and found that it was
photoperiod-dependent but modest (�60% reduction in FT acti-
vation; see Supplemental Data, Figure S3). However, the RNA
data available have insufficient time resolution to constrain the
effect accurately, and including the morning gate made only
a small contribution to the overall fit under standard long- and
short-day conditions. For these pragmatic reasons and con-
sidering additional experimental evidence (see Discussion), no
separate ‘‘morning gate’’ mechanism was included in subse-
quent models.
1172 Cell 139, 1170–1179, December 11, 2009 ª2009 Elsevier Inc.
Model 2: Circadian Regulation of CO TranscriptionThe waveform of CO mRNA accumulation is thought to be
a crucial component of the photoperiod sensor. To include
rhythmic CO regulation in model 2, we assumed that CO was
similar to the clock component TOC1, which is expressed at
the same phase (Locke et al., 2006; Locke et al., 2005b). We
therefore simulated CO expression based on the TOC1 compo-
nent of existing models for the circadian clock. Two clock
models were tested. The simplest, in Model 2a, comprised
a single transcriptional feedback loop and a single mechanism
of light input at dawn (Figure 1) (Locke et al., 2005a). The en-
trained phase of this clock model is locked to dawn and the
remainder of the photoperiod has no effect (Locke et al., 2006).
This model fitted CO RNA data poorly, because it could not
accommodate the observed change in the CO waveform
between short and long photoperiods (Figure 2). In contrast,
the circadian clock in Model 2b comprised two interlocking
feedback loops and was entrained through light inputs to two
genes (Figure 1) (Locke et al., 2005b). The interlocking-loop
clock model is capable of adjusting its phase relative to dawn
in response to varying photoperiods (Locke et al., 2006), result-
ing in a better fit to CO mRNA expression (Figures 3A and 3B).
Model 2b failed to predict the shoulder of CO mRNA accumu-
lation that is observed at the end of the light interval under long
photoperiod cycles in wild-type plants (Figure 3B, arrow). The
simulated CO waveforms were closer to data from fkf1 mutant
plants. Since FKF1 is known to affect CO mRNA accumulation
at the end of a long day (Imaizumi et al., 2005, 2003; Sawa
et al., 2007), the absence of FKF1 in our model might account
for this discrepancy. Under short days, where there is little differ-
ence between CO waveforms in wild-type and fkf1 mutants, the
model fitted both well. A preliminary model 3F1 was developed
mR
NA
con
cent
ratio
n
Time (hours)
A
C D
B
Figure 3. Model 3 Recapitulates CO mRNA Profiles of fkf1 Mutant
Plants but Predicts FT mRNA Close to Wild-Type
Expression patterns of CO mRNA (A and B) and FT mRNA (C and D) were simu-
lated using model 3 (solid lines), under short-day (A and C) and long-day (B and
D) conditions. The arrow in (B) marks the FKF1-dependent shoulder in CO
expression, which is absent in the model. Expression level data (sets 8 and 9,
Table S1, Imaizumi et al., 2003) are shown, as in Figure 2. Open symbols, CO
mRNA data; filled symbols, FT mRNA data; circles, data from wild-type;
squares, data from fkf1 mutant. Filled bar on time axis, dark interval; open
bar, light interval.

to simulate the effect of FKF1 on CO transcription, using data on
the FKF1 protein profile to control additional synthesis of CO
mRNA in a light-dependent manner (see Supplemental Data,
Figure S4). The model fitted one to two time points in the
shoulder of CO mRNA data, which had a limited effect on FT
mRNA accumulation. Simulating an fkf1 mutation in preliminary
model 3F1 caused only a 35% reduction in FT transcription
rate at the end of a long photoperiod. Activation of CO transcrip-
tion by FKF1 in our model represents the double-negative mech-
anism, in which the CYCLING DOF FACTOR (CDF) repressor
proteins are degraded by FKF1, but allows a much simpler math-
ematical formulation. When further quantified data become
available, it should be possible to model recently-discovered
details of the molecular mechanisms involved (Fornara et al.,
2009; Sawa et al., 2007).
Model 3: Photoperiodic Regulation of FT
In order to simulate the regulation of FT under the control of light
and the circadian clock, submodel 1b was combined with sub-
model 2b to form model 3 (Figure 1; see Supplemental Data).
This model replaced the experimental CO mRNA data used in
Figure 2 with the simulated CO mRNA waveforms shown in
Figures 3A and 3B. Importantly, the model parameters were
not altered, because each submodel had already been con-
strained to the relevant data.
The FT expression patterns predicted by model 3 remained
consistent with the FT data from the training and validation
data sets (Figures 3C, 3D, and S1d). The CO mRNA profile simu-
lated by model 2b lacked the FKF1-dependent shoulder at the
end of the long photoperiod (Figure 3B), whereas model 1b
had matched the FT mRNA based on data that included this
shoulder. We therefore expected that using the simulated CO
mRNA profile in model 3 would yield lower levels of simulated
FT mRNA, compared to model 1b. A CO mRNA profile similar
to an fkf1 mutant might simply have yielded the low levels of
FT mRNA that had been observed in fkf1 mutant plants. The
peak level of simulated FT mRNA in model 3 was indeed lower
than observed in wild-type plants but, surprisingly, the reduction
was only 40% (Figure 3D), which was an overestimate of an
order of magnitude compared to the FT RNA levels observed
in the fkf1 mutant. Thus model 3 simulated a CO mRNA profile
similar to the fkf1 mutant but greatly overestimated the FT
mRNA level. Removing FKF1 in the mutant plant caused
a much more severe reduction of FT mRNA levels than could
be predicted from the effect of the fkf1 mutation on CO mRNA
levels alone. Consistent with this, adding the FKF1-dependent
shoulder to the CO mRNA profile in preliminary model 3F1 had
predicted only a modest increase in FT mRNA levels (Figure S4).
Together, these results indicated that a major effect of FKF1 may
be to activate FT expression downstream or independently of
CO mRNA.
To estimate the importance of FKF1-dependent activation for
FT transcription, we constructed a speculative model (model
3F2), in which the observed FKF1 protein profile and the simu-
lated CO protein together promoted FT transcription (see
supplementary text). The model was matched to the training
data sets (8 and 9; see Table S1) that allowed direct comparison
of wild-type and fkf1 mutant results (Figure 4). The new CO
mRNA profiles were matched to the data for wild-type and fkf1
mutant plants under long photoperiods, including the FKF1-
dependent shoulder in the wild-type (Figures 4C and 4E). The
model predicted a smaller effect of FKF1 on CO RNA under short
photoperiods, consistent with the data (Figure 4B). Simulated
FT mRNA levels showed an improved profile in wild-type
(Figure 4E). The aberrant morning peak of earlier models (Figures
2B and 2D) was removed, because FKF1 levels are low at dawn
(Figure S4a). Simulations with model 3F2 showed that 90% of
wild-type FT transcription at the end of a long photoperiod was
FKF1-dependent.
The photoperiod-dependence of this effect was similar to the
effect of FKF1 on CO transcription. This raised the possibility that
CO and FKF1 cooperate to regulate both CO and FT transcrip-
tion by a single mechanism, which would include a positive
feedback of CO protein upon CO mRNA abundance (Figure 4J).
To test this hypothesis, the FKF1-dependent shoulder of CO
mRNA under long photoperiods was measured in wild-type
plants and in seven mutant lines carrying co alleles that severely
affect flowering time (Figure S7). Control fkf1 mutant plants
showed low CO mRNA levels 13h after dawn (about 25% of
wild-type levels), consistent with Figure 4. CO mRNA was unde-
tectable in one insertional mutant co allele. The other six alleles
had CO mRNA levels very close to wild-type, showing that CO
protein function was not required for the FKF1-dependent
shoulder in CO transcription. These data favor the model de-
picted in Figure 4A, in which FKF1 has two distinct effects: its
known regulation of CO mRNA levels, which does not require
CO protein, and a previously-undescribed effect on FT expres-
sion, which depends on CO.
We next explored the qualitative patterns of FT regulation in
response to a range of different light-dark cycles. As the FKF1
protein profiles required for model 3F2 were available for only
two conditions, these simulations used model 3. FT mRNA levels
increased in a non-linear fashion when the system was stably
entrained to 24 hr light-dark cycles with longer photoperiods
(Figure 5A). Treating a short-day-entrained system with one
longer photoperiod had a more graded effect (Figure S5), indi-
cating that circadian entrainment significantly affected the
photoperiod response (see Discussion). Data to inform the
component models were only available for a limited range of
conditions, so it was not unexpected that the clock model did
not entrain stably to some exotic light-dark cycles. The model
remained strongly rhythmic in these conditions but phase
variations between successive cycles indicated that it was not
following a stable, entrained limit cycle, which was the condition
imposed for our analysis (see Supplemental Data). Nonetheless,
two patterns of FT regulation appeared physiologically relevant
(Figure 5A). First, light-dark cycles of longer or shorter duration
than 24 hr partially activated FT under all photoperiods and,
second, the steepest increase of FT expression with photope-
riod occurred under 24 hr cycles. Thus the model predicts that
there will be an optimal cycle duration to obtain the strongest
photoperiodic switch, likely in a 24 hr environment.
Model 4: Prediction of Flowering TimePublished flowering time data differ widely among Arabidopsis
accessions and across laboratories, reflecting the many
Cell 139, 1170–1179, December 11, 2009 ª2009 Elsevier Inc. 1173

FT
Veg Flowering
CO
Clo
ck
FT
Veg Flowering
CO
Clo
ck
FKF1
FT
Veg Flowering
CO
Clo
ck
FT
Veg Flowering
CO
Clo
ck
FKF1
A
8L:16D 16L:8D
Time (h)Time (h)
mR
NA
con
cent
ratio
n
B C
D Em
RN
A c
once
ntra
tion
F G
H I
J
Figure 4. FKF1 Affects FT Activation
Speculative model 3F2 (A) includes light-dependent activation of both CO and FT by FKF1. Simulations (solid lines) can closely match the expression patterns
(Imaizumi et al., 2003) of CO (B, C, F, and G) and FT (D, E, H, and I) mRNA in both the wild-type (B–E) and fkf1 mutant (F–I) under short-day (B, D, F, and H) and long-
day (C, E, G, and I) conditions. An alternative, more parsimonious hypothesis is shown in (J): FKF1 has a single effect on CO protein activity, which both controls
FT transcription and feeds back positively to regulate CO transcription (see Figure S7). Open symbols, CO mRNA data; filled symbols, FT mRNA data; circles,
data from wild-type; squares, data from fkf1 mutant. Filled bar on time axis, dark interval; open bar, light interval.
environmental inputs that control absolute flowering time (Boss
et al., 2004). Most molecular studies, moreover, have focused
on one standard long and short photoperiod condition, so the
non-linear relationship between the FT mRNA profile and flower-
ing time could not be estimated from the data available (see
supplementary text). We therefore compared flowering time
data to the FT expression profiles predicted by model 3, where
we could perform simulations for any photoperiod. Simple math-
ematical functions fitted well to flowering data for plants of the
Columbia accession (Corbesier et al., 1996), with clear differ-
ences in the functions required for different experimental proto-
cols (seeSupplemental Data, and Figure S6). A sigmoid function
matched data sets from three laboratories that used similar
experimental protocols: data on days to flowering in plants of
the Columbia accession (Figure S6a, Corbesier et al., 1996)
and data on total leaf numbers for plants of the Landsberg(er-
ecta) accession (Figure 5B, Wilczek et al., 2009) and the Wassi-
lewskija accession (Figure 5C, Pouteau et al., 2008). The critical
photoperiod that elicited the half-maximal flowering response
was almost identical in Figures 5B and 5C, despite the differ-
ences in absolute leaf numbers (see supplementary information).
Mutation of CO prevents FT expression in the models, so co
1174 Cell 139, 1170–1179, December 11, 2009 ª2009 Elsevier Inc.
mutant plants are predicted to flower under all photoperiods
with the same, high leaf number as wild-type plants under very
short photoperiods, as confirmed in the recent data (Wilczek
et al., 2009). The flowering function offers a standard approach
to reveal robust behavior of the photoperiod response system.
DISCUSSION
The external coincidence model can clearly provide a workable
photoperiod sensor (Carre et al., 2006). We aimed for a more
detailed, quantitative explanation of the observed molecular
regulation that could be linked to the whole-organism response.
Our approach will be validated if the resulting models accurately
predict the molecular data yet remain comprehensible, if the
models direct future experimentation to address gaps in current
data, and if the models give insight into comparable processes in
other contexts. The data required need not present technical
challenges. Consistent data sets for CO and FT mRNA levels
and flowering times would already be valuable to explore a wider
range of environmental conditions and genotypes with the full
range of FT profiles, from ft mutants to FT-overexpressing lines.
These data would test the simple functions assumed here for CO

protein synthesis and for the effectiveness of FT as a floral
inducer. Current data were sufficient to make eight specific, test-
able predictions (Table S2), which are discussed below, together
with their functional implications for photoperiod responses.
Suppressed Induction of FT in the MorningA good overall fit after parameter optimization shows that
a model is consistent with the molecular data. The simplest
models of FT activation by light and CO were largely sufficient
to recapitulate the molecular data. Simulating data from the
toc1 mutant confirmed that this mutation in the circadian clock
affected FT regulation largely by altering rhythmic CO mRNA
expression (Niwa et al., 2007; Yanovsky and Kay, 2002), though
a small (�40%) increase in FT activation by another mechanism
remains possible (prediction 2, Table S2). A specific failure of the
model can be more informative. For example, the overestimation
of FT levels at the start of a long photoperiod (Figure 2) sug-
gested that another level of regulation reduces the effectiveness
of CO at this time (prediction 1 in Supplemental Data). A similar,
morning-specific suppression has been identified in experi-
Inte
grat
ed F
T m
RN
A
Photoperiod (hours)
A
B C
Leaf
num
ber
FT Area
1212
Figure 5. A Photoperiod Sensor for 24 hr Days, Regulating Flowering
(A) FT expression was simulated under light-dark cycles comprising 6–16 hr
photoperiod in a total cycle duration of 16 hr (diamonds) to 32 hr (open circles),
using model 3. 24 hr cycles show the largest ratio of integrated FT mRNA
between long and short photoperiods. Absent results are due to unstable
circadian entrainment in some conditions. (B and C) The integrated FT
mRNA area simulated by model 3 under different photoperiods (diamonds)
is related to flowering time data for the same photoperiods by a simple function
(line), with specific parameter values (see Supplemental Data) for data sets
from Landsberg(erecta) (B, Wilczek et al., 2009) and Wassilewskija (C, Pouteau
et al., 2008). Flowering time data covered photoperiods from 6L:18D to 16L:8D
in (B) and (C), with an additional data point for constant light in (C). The data
point for 12L:12D is labeled (12).
mental studies of CO-overexpressing plants (Valverde et al.,
2004) and linked to phyB in cop1 mutant plants (Jang et al.,
2008). Our models show that this mechanism operates in wild-
type plants, quantify its effects, show that the effect is greater
in long than in short photoperiods (Figure S3), and suggest
a molecular mechanism (Figure 4; see below). The quantitative
effect of the suppression was modest (�60% reduction in FT
activation in Figure S3) and its parameters were not well
constrained, because it only affected one to two data points in
the FT profile. Moreover, morning expression of FT can some-
times be observed experimentally (Corbesier et al., 2007),
and flowering can be accelerated under exotic light cycles that
drive high CO expression in the morning (Roden et al., 2002).
Thus the morning suppression mechanism is not always effec-
tive at the level of FT expression and is not always relevant
at the level of flowering time, though it is apparent in most of
the molecular data sets considered here. Regulation by FKF1
provides a parsimonious mechanism for the suppressive effect,
as detailed below.
Regulation of CO by a Photoperiod-Responsive ClockThe circadian peak of CO RNA accumulation moves to a later
phase under long photoperiods (Figure 2). The interlocking,
dual feed-back loop model of the clock was required to match
this phase delay (Figure 3, prediction 3 in supplemental table),
because the phase of this clock model responds strongly to
light at dusk (Locke et al., 2006). A more complex, three-loop
clock model (Locke et al., 2006) matches better to data for
circadian-regulated genes other than CO, where peak phase is
much less delayed under long photoperiods (unpublished data;
Millar and Kay, 1996). The CO entrainment profile is consistent
with the two-loop model and therefore might reflect a distinct
circadian clock mechanism that is restricted to specific cell
types, for example in the vasculature (An et al., 2004). Circadian
clocks with distinct entrainment patterns have also been
proposed in the photoperiod sensor of the short-day plant,
Ipomoea nil (Hayama et al., 2007). The unknown mechanism
that regulates some aspects of the CO waveform independently
of the GI rhythm (Fornara et al., 2009) might also be consistent
with the unusual photoperiod-sensitivity of the timing of peak
CO RNA.
The dusk-sensitive entrainment of CO makes the system more
responsive to lengthening photoperiods, particularly to delays in
lights-off, than it is to stable, long photoperiods. The sensitivity to
photoperiod change arises because the first lengthened photo-
period simply allows a longer duration of light to coincide with
a CO mRNA rhythm that is set to the early phase characteristic
of a short day, as proposed by Bunning’s external coincidence
mechanism (Bunning, 1936). Under stable, long photoperiods,
however, the observed phase of the CO rhythm is delayed,
moving more of the CO mRNA peak into the dark interval. After
entrainment to 8 hr photoperiods, for example, model 3 pre-
dicted a significantly greater FT area on the first 10 hr or 12 hr
photoperiod than it did when stably entrained to 10 hr or 12 hr
photoperiods (Figure S5). The circadian entrainment of CO is
consistent with observed flowering responses to changes in
the time of sunset, which have evolved exquisite sensitivity in
tropical trees (Borchert et al., 2005).
Cell 139, 1170–1179, December 11, 2009 ª2009 Elsevier Inc. 1175

Regulation of CO and FT by FKF1 and PhotoperiodWhereas circadian entrainment delays CO expression under
longer photoperiods, FKF1 promotes earlier CO mRNA accumu-
lation (reviewed in Imaizumi and Kay, 2006). The FKF1-depen-
dent shoulder in CO RNA accumulation was readily simulated
by adding a second source of CO RNA to supplement the wave-
form driven only by the clock model (Figures 3, 4, and S4). This
source could be either an arbitrary square waveform (data not
shown) or the observed FKF1 protein profile, which also has
a sharp onset and decline (Imaizumi et al., 2003). In either
case, the sharp change in the additional CO was important to
match the dip in CO RNA profile that is often observed at the
end of a long photoperiod (prediction 5).
Our models (Figures 3 and 4) highlighted a dramatic and
previously unsuspected effect of FKF1, to promote FT expres-
sion independently of its effect on CO RNA accumulation
(prediction 6). For an intuitive illustration, consider that the levels
of CO mRNA in the light are comparable or higher in fkf1
mutants under long photoperiods compared to the wild-type
under short photoperiods (compare Figure 3B with 3A), yet the
cognate FT mRNA levels are much lower in the mutants (Figures
3C and 3D). Direct interaction of FKF1 with CO protein might
enhance CO function (Fukamatsu et al., 2005), providing a
mechanism based on known components. Light-stabilized
CO protein would then activate FT transcription in an FKF1-
dependent manner. This was achieved in a revised model by
using the FKF1 protein profile to drive the transcription of FT
in addition to its effect on CO (model 3F2, see Supplemental
Data). This speculative model matched wild-type FT mRNA
waveforms well and lacked the morning-specific peak of FT
expression observed with earlier models (Figure 4). As FKF1 is
not expressed in the morning, simulated FT mRNA expression
remains low at this time even if CO RNA is present. Thus the
postulated function of FKF1 provides a parsimonious molecular
mechanism for the morning ‘‘gate’’ (prediction 1). Constitutive
expression of FKF1 and GI was insufficient to activate FT
expression immediately after dawn (Sawa et al., 2007), however,
indicating that further analysis of the morning ‘‘gate’’ is war-
ranted. FKF1 was estimated to increase FT transcription
10-fold in our model compared to the fkf1 mutant, highlighting
the importance of FKF1 as a photoperiodic regulator (Imaizumi
and Kay, 2006). FKF1 increased CO transcription by only 35%,
suggesting that FKF1-independent factors are also important
in regulating CO mRNA levels (Fornara et al., 2009; Imaizumi
et al., 2005).
The relationship between the two effects of FKF1, on CO and
FT, is unclear. A possible extension to model 3F2 was to propose
that FKF1 functioned together with CO protein, and that this
mechanism activated both FT and CO transcription (prediction
7). This parsimonious hypothesis predicted that CO protein
would be required for the FKF1-dependent shoulder of CO
mRNA under long photoperiods. New experimental data for
the CO mRNA levels of seven co mutant alleles failed to support
this notion (Figure S7). Our results therefore predict that FKF1
functions differently to regulate CO and FT, indicating that a novel
regulatory mechanism is involved in the control of FT. It is
possible that this function is GI-dependent, as GI regulates flow-
ering via the circadian expression of CO (as in our models) but
1176 Cell 139, 1170–1179, December 11, 2009 ª2009 Elsevier Inc.
also by a genetically-separable mechanism (Gould et al., 2006;
Mizoguchi et al., 2005).
Tuning the Mechanisms of Day-Length PerceptionThe circadian clock models entrained stably to a limited range of
exotic light-dark cycles with total durations that varied from 24 hr
(Figure 5). The models were developed using data from only
constant conditions and 12L:12D cycles (Locke et al., 2005a;
Locke et al., 2005b), so more flexible models might be con-
structed based upon new data on the clock components under
other conditions. The mathematical theory of coupled oscillators
(Guckenheimer and Holmes, 1983) shows that stable entrain-
ment occurs when the system parameters are within an area of
parameter space described as the Arnold tongue. Changing
the period of the entraining cycle significantly away from
the period of the oscillator moves the system outside the
Arnold tongue. Consistent with theory, the clock model then
becomes quasi-periodic, as also reported for circadian rhythms
in many species.
Using model simulations, we predicted that discrimination
between long and short light intervals will be greatest when the
total duration of the entraining cycle is 24 hr (Figure 5; prediction
8). This qualitative prediction is reminiscent of the classic exper-
iments on soybean (Hamner and Takimoto, 1964) and matches
more detailed data from the hamster, where photoperiodic regu-
lation of the reproductive system also showed the greatest
amplitude under 24 hr cycles (Elliott, 1974). This effect also can
be related to the theory of coupled oscillators (Guckenheimer
and Holmes, 1983). Altering the duration of the entraining cycle
by a moderate amount relative to the period of the oscillator
moves the system within the Arnold tongue, and alters the
phases of the clock components. The circadian clock is
presumed to be adapted to the 24 hr entraining cycles in which
it has evolved: the clock components (and outputs such as CO)
will be regulated with peak phases that are physiologically
optimal (Pittendrigh and Daan, 1976). Changing the duration of
the entraining cycle will alter their phases and lead to a subop-
timal response, either slowing growth (Dodd et al., 2005), or in
this case weakening the photoperiodic sensor.
Our models illustrate how the external coincidence mecha-
nism has evolved in Arabidopsis to a more elaborate form than
Bunning’s original hypothesis. CO protein was the first molecular
correlate of photoperiod to be identified and its dual regulation
by the clock (transcriptionally) and by light (post-translationally)
forms an external coincidence detector. The photoperiod-sensi-
tive entrainment of the CO mRNA rhythm extends beyond the
simplest external coincidence hypothesis and has potential
functional significance in detecting photoperiod change, but
may require specialized circadian timing, as discussed above.
FKF1 forms a second external coincidence detector that regu-
lates CO mRNA (Imaizumi et al., 2003) and we show that it is
crucial in activating FT (prediction 6). As CO and FKF1 function
together to regulate FT at the end of the photoperiod, separating
their expression in time might in principle be sufficient to prevent
flower induction under short photoperiods, as proposed by
the internal coincidence hypothesis (Pittendrigh, 1960). It will
be interesting to determine whether the entrainment of their
circadian rhythms (and the rhythms of other clock-controlled

regulators) responds differently to photoperiods, as this would
be required to introduce an aspect of internal coincidence (as
implied in Imaizumi and Kay, 2006). In contrast, another photo-
periodic mechanism appears to control the degradation rate of
cry2 protein at the start of the day (El-Din El-Assal et al., 2001).
The effect of cry2 degradation on photoperiodism is unclear,
and our current models match FT mRNA profiles without this
modulation of light input.
The existence of multiple photoperiod sensors has important
consequences for understanding plant physiology. First, it
greatly increases the potential for specialized photoperiodic
sensors to control different physiological responses within
a single species, including responses of vegetative organs.
Second, it is unclear which (or how many) of the molecular
mechanisms will be conserved across species with similar
photoperiodic responses. Finally, it increases the possibility
that species with different photoperiodic responses might differ
radically in their molecular mechanisms. It is therefore all the
more striking that homologs of CO and FT have been implicated
in the short-day photoperiodic response of the dicots Ipomoea
nil (Hayama et al., 2007) and poplar (Bohlenius et al., 2006)
and of the monocot rice (the genes Hd1 and Hd3a, respectively,
reviewed in Hayama and Coupland, 2004; Izawa, 2007). The
profile of Hd1 RNA strongly resembles that of CO (Figure S8a),
such that Hayama et al. (Hayama et al., 2003) proposed that
a single change of sign, equivalent to making CO a negative
regulator of FT, would be sufficient to convert the long-day
response of Arabidopsis to the short-day response of rice. Using
RNA profiles of Hd1 and Hd3a under long and short photope-
riods, we constructed the simplest model of the rice photope-
riod sensor based upon our Arabidopsis models (see supple-
mental data). The proposed repressive function of Hd1 could
fully account for the photoperiodic regulation of the mean level
of Hd3a, because the coincidence of light with Hd1 RNA in the
evening changes significantly between long and short photope-
riods. There is, however, little or no difference in Hd3a expres-
sion in the evening, so coincidence does not directly explain
the temporal profile. Peak Hd3a expression occurs in the
morning (Figure S8b), and matching this timing required a sepa-
rate (and unknown) clock-regulated factor distinct from the
Hd1 repressor. It will be interesting to determine how the
morning-specific photoperiodic regulator of Hd3a relates to
the well-described, evening-specific regulators in Arabidopsis.
There are now several possible candidates in rice (reviewed in
Hayama and Coupland, 2004; Izawa, 2007). Recent data give
this added relevance for Arabidopsis, because FT can also be
expressed in the morning in some conditions (Corbesier et al.,
2007), suggesting that the rice regulatory mechanism might
also be present in Arabidopsis.
The photoperiodic switch is part of a broader network of devel-
opmental pathways and environmental responses that control
the flowering of Arabidopsis (Boss et al., 2004). Models of this
broad network (Welch et al., 2003) have the exciting potential
to link our detailed molecular mechanisms to larger-scale
phenological models. These already have widespread applica-
tions in crop scheduling and crop improvement (Adams et al.,
2001; Hammer et al., 2006) and have been successfully applied
to Arabidopsis development (Wilczek et al., 2009).
EXPERIMENTAL PROCEDURES
Plant Growth and RNA Assays
Seeds of fkf1, the co alleles and cognate wild-types were generously supplied
by G. Coupland (Koeln) or by the Nottingham Arabidopsis Stock Centre. Plants
were grown as described (Locke et al., 2005b) under 16L:8D for 10 days at
22�C. Samples were harvested 13h after lights-on; RNA was extracted and
analyzed by qRT-PCR as described (Locke et al., 2005b).
Computational Methods
Quantitative expression profiles for CO and FT mRNA under various conditions
were digitized from charts or graphs in the literature or kindly provided by the
original authors (see Supplemental Data). Timeseries data were numbered
(see Table S1), normalized and checked for consistency (see Supplemental
Data). Twenty-eight timeseries from wild-type plants were used for most
model training and validation, with ten further timeseries from toc1 and fkf1
mutants. Models were constructed as ordinary differential equations in Matlab
(Mathworks, Cambridge UK); SBML versions will be available from the Biomo-
dels repository upon publication (Le Novere et al., 2006), and in versions
compatible with the Circadian Modeling simulation interface (available at
www.amillar.org/Downloads.htm). Model equations and parameters are
presented in the supplemental data. Parameters were estimated by fitting to
the relevant data (for the wild-type, to the training data sets 1, 3, 8, and 9;
see Table S1), using a boundary value solver to ensure that the model
produced stable, limit cycle solutions (see supplemental data). Models 3F1
and 3F2 including FKF1 function are described as speculative, because there
is much less quantitative timeseries data available for FKF1 in the literature
than for CO and FT. We test these models only in 8L:16D and 16L:8D condi-
tions, where FKF1 data are available.
SUPPLEMENTAL DATA
Supplemental Data include Supplemental Experimental Procedures, Supple-
mental References, two tables, and eight figures and can be found with this
article online at http://www.cell.com/supplemental/S0092-8674(09)01487-1.
ACKNOWLEDGMENTS
A.J.M. gratefully acknowledges discussions with Carl Johnson, Steve Welch,
and Peter Crawford; seed stocks provided by George Coupland; and the
hospitality of Luis Serrano and the Centre de Regulacio Genomica, Barcelona
during revision of the manuscript. J.D.S. and T.S. performed modeling studies;
J.F. performed experimental work; P.E.B. and J.C.W.L. provided modeling
tools; J.D.S., T.S., I.A.C., D.A.R. and A.J.M. designed modeling studies;
K.J.H. and A.J.M. designed experimental work; A.J.M. wrote the paper with
comments from all authors. This work was supported by BBSRC award
BEP17427 to A.J.M., D.A.R. and I.A.C., and by BBSRC/EPSRC SABR award
F0052371 to K.J.H., A.J.M., D.A.R. and others. J.C.W.L. was supported by
a Sainsbury Postgraduate Scholarship from the Gatsby Charitable Trust.
T.S. was supported by a Postgraduate Scholarship from the Royal Thai
Government. D.A.R. holds an EPSRC Senior Fellowship and is supported by
EU BioSim Network Contract 005137. The Centre for Systems Biology at
Edinburgh is a Centre for Integrative Systems Biology supported by BBSRC
and EPSRC award D019621.
Received: February 7, 2009
Revised: July 13, 2009
Accepted: November 17, 2009
Published: December 10, 2009
REFERENCES
Adams, S.R., Pearson, S., and Hadley, P. (2001). Improving quantitative flow-
ering models through a better understanding of the phases of photoperiod
sensitivity. J. Exp. Bot. 52, 655–662.
Cell 139, 1170–1179, December 11, 2009 ª2009 Elsevier Inc. 1177

An, H., Roussot, C., Suarez-Lopez, P., Corbesier, L., Vincent, C., Pineiro, M.,
Hepworth, S., Mouradov, A., Justin, S., Turnbull, C., and Coupland, G. (2004).
CONSTANS acts in the phloem to regulate a systemic signal that induces
photoperiodic flowering of Arabidopsis. Development 131, 3615–3626.
Bohlenius, H., Huang, T., Charbonnel-Campaa, L., Brunner, A.M., Jansson, S.,
Strauss, S.H., and Nilsson, O. (2006). CO/FT regulatory module controls timing
of flowering and seasonal growth cessation in trees. Science 312, 1040–1043.
Borchert, R., Renner, S.S., Calle, Z., Navarrete, D., Tye, A., Gautier, L.,
Spichiger, R., and von Hildebrand, P. (2005). Photoperiodic induction of
synchronous flowering near the Equator. Nature 433, 627–629.
Boss, P.K., Bastow, R.M., Mylne, J.S., and Dean, C. (2004). Multiple pathways
in the decision to flower: enabling, promoting, and resetting. Plant Cell 16
(Suppl), S18–S31.
Bunning, E. (1936). Die Endogene Tagesrhythmik als Grundlage der Photoper-
iodischen Reaktion. Ber. Dtsch. Bot. Ges. 54, 590–607.
Carre, I.A., Coupland, G., and Putterill, J. (2006). Photoperiodic responses and
the regulation of flowering. In Endogenous Plant Rhythms, A. Hall and H.G.
McWatters, eds., pp. 167–190.
Corbesier, L., Gadisseur, I., Silvestre, G., Jacqmard, A., and Bernier, G. (1996).
Design in Arabidopsis thaliana of a synchronous system of floral induction by
one long day. Plant J. 9, 947–952.
Corbesier, L., Vincent, C., Jang, S., Fornara, F., Fan, Q., Searle, I., Giakountis,
A., Farrona, S., Gissot, L., Turnbull, C., and Coupland, G. (2007). FT protein
movement contributes to long-distance signaling in floral induction of Arabi-
dopsis. Science 316, 1030–1033.
Dodd, A.N., Salathia, N., Hall, A., Kevei, E., Toth, R., Nagy, F., Hibberd, J.M.,
Millar, A.J., and Webb, A.A. (2005). Plant circadian clocks increase photosyn-
thesis, growth, survival, and competitive advantage. Science 309, 630–633.
El-Din El-Assal, S., Alonso-Blanco, C., Peeters, A.J., Raz, V., and Koornneef,
M. (2001). A QTL for flowering time in Arabidopsis reveals a novel allele of
CRY2. Nat. Genet. 29, 435–440.
Elliott, J.A. (1974). Photoperiodic regulation of testis function in the golden
hamster: Relation to the Circadian System (Austin, TX: University of Texas).
Fornara, F., Panigrahi, K.C., Gissot, L., Sauerbrunn, N., Ruhl, M., Jarillo, J.A.,
and Coupland, G. (2009). Arabidopsis DOF transcription factors act redun-
dantly to reduce CONSTANS expression and are essential for a photoperiodic
flowering response. Dev. Cell 17, 75–86.
Fukamatsu, Y., Mitsui, S., Yasuhara, M., Tokioka, Y., Ihara, N., Fujita, S., and
Kiyosue, T. (2005). Identification of LOV KELCH PROTEIN2 (LKP2)-Interacting
Factors that Can Recruit LKP2 to Nuclear Bodies. Plant Cell Physiol. 46, 1340–
1349.
Gould, P.D., Locke, J.C., Larue, C., Southern, M.M., Davis, S.J., Hanano, S.,
Moyle, R., Milich, R., Putterill, J., Millar, A.J., and Hall, A. (2006). The molecular
basis of temperature compensation in the Arabidopsis circadian clock. Plant
Cell 18, 1177–1187.
Guckenheimer, J., and Holmes, P. (1983). Nonlinear Oscillations, Dynamical
Systems and Bifurcations of Vector Fields (New York: Springer Verlag).
Hammer, G., Cooper, M., Tardieu, F., Welch, S., Walsh, B., van Eeuwijk, F.,
Chapman, S., and Podlich, D. (2006). Models for navigating biological
complexity in breeding improved crop plants. Trends Plant Sci. 11, 587–593.
Hamner, K.C., and Takimoto, A. (1964). Circadian Rhythms and Plant Photo-
periodism. Am. Nat. 98, 295–322.
Hayama, R., Agashe, B., Luley, E., King, R., and Coupland, G. (2007). A circa-
dian rhythm set by dusk determines the expression of FT homologs and
the short-day photoperiodic flowering response in Pharbitis. Plant Cell 19,
2988–3000.
Hayama, R., and Coupland, G. (2004). The molecular basis of diversity in the
photoperiodic flowering responses of Arabidopsis and rice. Plant Physiol.
135, 677–684.
Hayama, R., Yokoi, S., Tamaki, S., Yano, M., and Shimamoto, K. (2003). Adap-
tation of photoperiodic control pathways produces short-day flowering in rice.
Nature 422, 719–722.
1178 Cell 139, 1170–1179, December 11, 2009 ª2009 Elsevier Inc.
Hazlerigg, D., and Loudon, A. (2008). New insights into ancient seasonal life
timers. Curr. Biol. 18, R795–R804.
Imaizumi, T., and Kay, S.A. (2006). Photoperiodic control of flowering: not only
by coincidence. Trends Plant Sci. 11, 550–558.
Imaizumi, T., Schultz, T.F., Harmon, F.G., Ho, L.A., and Kay, S.A. (2005). FKF1
F-box protein mediates cyclic degradation of a repressor of CONSTANS in
Arabidopsis. Science 309, 293–297.
Imaizumi, T., Tran, H.G., Swartz, T.E., Briggs, W.R., and Kay, S.A. (2003). FKF1
is essential for photoperiodic-specific light signalling in Arabidopsis. Nature
426, 302–306.
Izawa, T. (2007). Daylength measurements by rice plants in photoperiodic
short-day flowering. Int. Rev. Cytol. 256, 191–222.
Jang, S., Marchal, V., Panigrahi, K.C., Wenkel, S., Soppe, W., Deng, X.W.,
Valverde, F., and Coupland, G. (2008). Arabidopsis COP1 shapes the temporal
pattern of CO accumulation conferring a photoperiodic flowering response.
EMBO J. 27, 1277–1288.
Kobayashi, Y., and Weigel, D. (2007). Move on up, it’s time for change–mobile
signals controlling photoperiod-dependent flowering. Genes Dev. 21, 2371–
2384.
Le Novere, N., Bornstein, B., Broicher, A., Courtot, M., Donizelli, M., Dharuri,
H., Li, L., Sauro, H., Schilstra, M., Shapiro, B., et al. (2006). BioModels Data-
base: a free, centralized database of curated, published, quantitative kinetic
models of biochemical and cellular systems. Nucleic Acids Res. 34, D689–
D691.
Locke, J.C., Kozma-Bognar, L., Gould, P.D., Feher, B., Kevei, E., Nagy, F.,
Turner, M.S., Hall, A., and Millar, A.J. (2006). Experimental validation of a pre-
dicted feedback loop in the multi-oscillator clock of Arabidopsis thaliana. Mol.
Syst. Biol. 2, 59.
Locke, J.C., Millar, A.J., and Turner, M.S. (2005a). Modelling genetic networks
with noisy and varied experimental data: the circadian clock in Arabidopsis
thaliana. J. Theor. Biol. 234, 383–393.
Locke, J.C., Southern, M.M., Kozma-Bognar, L., Hibberd, V., Brown, P.E.,
Turner, M.S., and Millar, A.J. (2005b). Extension of a genetic network
model by iterative experimentation and mathematical analysis. Mol. Syst.
Biol. 1, 13.
Millar, A.J., and Kay, S.A. (1996). Integration of circadian and phototransduc-
tion pathways in the network controlling CAB gene transcription in Arabidop-
sis. Proc. Natl. Acad. Sci. USA 93, 15491–15496.
Mizoguchi, T., Wright, L., Fujiwara, S., Cremer, F., Lee, K., Onouchi, H., Mour-
adov, A., Fowler, S., Kamada, H., Putterill, J., and Coupland, G. (2005). Distinct
roles of GIGANTEA in promoting flowering and regulating circadian rhythms in
Arabidopsis. Plant Cell 17, 2255–2270.
Niwa, Y., Ito, S., Nakamichi, N., Mizoguchi, T., Niinuma, K., Yamashino, T., and
Mizuno, T. (2007). Genetic linkages of the circadian clock-associated genes,
TOC1, CCA1 and LHY, in the photoperiodic control of flowering time in Arabi-
dopsis thaliana. Plant Cell Physiol. 48, 925–937.
Oosterom, E. Hammer, G., and Chapman, S. (2004). Can transition to flowering
be modelled dynamically from the gene level? In 4th International Crop
Science Congress (Brisbane, Australia).
Pittendrigh, C.S. (1960). Circadian rhythms and the circadian organisation of
living systems. Cold Spring Harb. Symp. Quant. Biol. 25, 159–184.
Pittendrigh, C.S., and Daan, S. (1976). A functional analysis of circadian pace-
makers in nocturnal rodents. V. A clock for all seasons. J. Comp. Physiol. [A]
106, 333–355.
Pouteau, S., Carre, I., Gaudin, V., Ferret, V., Lefebvre, D., and Wilson, M.
(2008). Diversification of photoperiodic response patterns in a collection of
early-flowering mutants of Arabidopsis. Plant Physiol. 148, 1465–1473.
Roden, L.C., Song, H.R., Jackson, S., Morris, K., and Carre, I.A. (2002). Floral
responses to photoperiod are correlated with the timing of rhythmic expres-
sion relative to dawn and dusk in Arabidopsis. Proc. Natl. Acad. Sci. USA
99, 13313–13318.

Sawa, M., Nusinow, D.A., Kay, S.A., and Imaizumi, T. (2007). FKF1 and
GIGANTEA complex formation is required for day-length measurement in
Arabidopsis. Science 318, 261–265.
Suarez-Lopez, P., Wheatley, K., Robson, F., Onouchi, H., Valverde, F., and
Coupland, G. (2001). CONSTANS mediates between the circadian clock and
the control of flowering in Arabidopsis. Nature 410, 1116–1120.
Thomas, B., and Vince-Prue, D. (1997). Photoperiodism in plants (San Diego,
CA: Academic Press).
Turck, F., Fornara, F., and Coupland, G. (2008). Regulation and Identity of
Florigen: FLOWERING LOCUS T Moves Center Stage. Annu. Rev. Plant Biol.
59, 573–594.
Valverde, F., Mouradov, A., Soppe, W., Ravenscroft, D., Samach, A., and
Coupland, G. (2004). Photoreceptor regulation of CONSTANS protein in
photoperiodic flowering. Science 303, 1003–1006.
Welch, S.M., Roe, J.L., and Dong, Z.S. (2003). A genetic neural network model
of flowering time control in Arabidopsis thaliana. Agron. J. 95, 71–81.
Wilczek, A.M., Roe, J.L., Knapp, M.C., Cooper, M.D., Lopez-Gallego, C.,
Martin, L.J., Muir, C.D., Sim, S., Walker, A., Anderson, J., et al. (2009). Effects
of genetic perturbation on seasonal life history plasticity. Science 323, 930–934.
Yanovsky, M.J., and Kay, S.A. (2002). Molecular basis of seasonal time
measurement in Arabidopsis. Nature 419, 308–312.
Cell 139, 1170–1179, December 11, 2009 ª2009 Elsevier Inc. 1179

1
Cell, Volume 139
Supplemental Data
Prediction of Photoperiodic Regulators
from Quantitative Gene Circuit Models José Domingo Salazar, Treenut Saithong, Paul E. Brown, Julia Foreman, James C.W. Locke, Karen J. Halliday, Isabelle A. Carré, David A. Rand, and Andrew J. Millar Figure S1
A
C
B
Hours of light per cycle Hours of light per cycle
Hours of light per cycle
D

2
Figure S2
0 3 6 9 12 15 18 210
0.5
1
7L:14D
CO
and
FT
Con
cent
ratio
ns
mFTmco2toc1mft2toc1
0 4 8 12 16 20 240
0.5
1
8L:16D
CO
and
FT
Con
cent
ratio
ns
mFTmco1toc1mft1toc1
0 3 6 9 12 15 18 210
0.5
1
7L:14D
CO
and
FT
Con
cent
ratio
ns
mFTmco2toc1mft2toc1
0 4 8 12 16 20 240
0.5
1
8L:16D
CO
and
FT
Con
cent
ratio
ns
mFTmco1toc1mft1toc1
0 3 6 9 12 15 18 210
0.5
1
7L:14D
CO
and
FT
Con
cent
ratio
ns
mFTmco2toc1mft2toc1
0 3 6 9 12 15 18 210
0.5
1
7L:14D
CO
and
FT
Con
cent
ratio
ns
mFTmco2toc1mft2toc1
0 4 8 12 16 20 240
0.5
1
8L:16D
CO
and
FT
Con
cent
ratio
ns
mFTmco1toc1mft1toc1
0 3 6 9 12 15 18 210
0.5
1
7L:14D
CO
and
FT
Con
cent
ratio
ns
mFTmco2toc1mft2toc1
0 4 8 12 16 20 240
0.5
1
8L:16D
CO
and
FT
Con
cent
ratio
ns
mFTmco1toc1mft1toc1
“SD” “LD”
T=21h
T=24h
Subm
odel
1a
T=21h
T=24h
Mod
ified
su
bmod
el 1
a
0 3 6 9 12 15 18 210
0.5
1
14L:7D
CO
and
FT
Con
cent
ratio
ns
mFTmco4toc1mft4toc1
0 4 8 12 16 20 240
0.5
1
16L:8DC
O a
nd F
T C
once
ntra
tions
mFTmco3toc1mft3toc1
0 3 6 9 12 15 18 210
0.5
1
14L:7D
CO
and
FT
Con
cent
ratio
ns
mFTmco4toc1mft4toc1
0 4 8 12 16 20 240
0.5
1
16L:8D
CO
and
FT
Con
cent
ratio
ns
mFTmco3toc1mft3toc1
0 3 6 9 12 15 18 210
0.5
1
14L:7D
CO
and
FT
Con
cent
ratio
ns
mFTmco4toc1mft4toc1
0 4 8 12 16 20 240
0.5
1
16L:8DC
O a
nd F
T C
once
ntra
tions
mFTmco3toc1mft3toc1
0 3 6 9 12 15 18 210
0.5
1
14L:7D
CO
and
FT
Con
cent
ratio
ns
mFTmco4toc1mft4toc1
0 4 8 12 16 20 240
0.5
1
16L:8D
CO
and
FT
Con
cent
ratio
ns
mFTmco3toc1mft3toc1
A B
C D
E F
G H

3
Figure S3
0 4 8 12 16 20 240
0.25
0.5
0.75
1
1st Experiment: 8L:16D
CO
and
FT
Con
cent
ratio
ns
0 4 8 12 16 20 240
0.25
0.5
0.75
1
1st Experiment: 16L:8D
CO
and
FT
Con
cent
ratio
ns
0 4 8 12 16 20 240
0.25
0.5
0.75
1
2nd Experiment: 8L:16D
CO
and
FT
Con
cent
ratio
ns
0 4 8 12 16 20 240
0.25
0.5
0.75
1
2nd Experiment: 16L:8D
CO
and
FT
Con
cent
ratio
ns
mFT
mco1
mft1
mFT
mco3
mft3
mFT
mco9
mft9
mFT
mco8
mft8
A B
C D
Experiment 1 Experiment 2
SD
LD

4
Figure S4
FT
Veg Flowering
CO
Clo
ck
FT
Veg Flowering
CO
Clo
ck
FKF1
E
0 4 8 12 16 20 240
0.5
1
Time (h)FKF1
pro
tein
con
cent
ratio
n
SDLD
B
C D
A
Time (h)Time (h)
Time (h)Time (h)0 4 8 12 16 20 24
0
4
8
CO
tran
scrip
tion
rate
0 4 8 12 16 20 240
0.5
1
Sca
led
CO
Con
cent
ratio
ns
mCOmco8
4 0 4 8 12 16 20 240
0.5
1
Sca
led
FT C
once
ntra
tions
mFTmft8

5
Figure S5

6
Figure S6
0 5 10 15 20 25 30 350
10
20
30
40
50
60
70
80
90
FT area
days
of f
low
erin
g
Experimental data
bFTarea
addtf+
+=1
0
nn
n
FTareabbaddtf
++= *0
Experimental data
bFTarea
addtf+
+=1
0
nn
n
FTareabbaddtf
++= *0
to fl
ower
ing
Model predictionA
B
8
1216 24
8 1012
14
16

7
Figure S7
0
0.25
0.5
0.75
1
1.25
1.5
Col
Col
co-1
fkf1
co-S
AIL Ler
Ler
co-2
co-3
co-4
co-5
co-6
Genotype
CO
mR
NA
/ A
CT2
FT
Veg Flowering
CO
Clo
ck
FT
Veg Flowering
CO
Clo
ck
FKF1
A B
nd

8
Figure S8
A
B
c
CLO
CK
VEGETATIVE
FLOWERING
Hd1 CR3a
Hd3a0 5 10 15 20 24
0
0.5
1
Hd3
Con
cent
ratio
ns
mhd3 SDmHd3 SDmhd3 LDmHd3 LD
0 5 10 15 20 240
0.5
1
Time (h)
Hd1
con
cent
ratio
n
mHd1 SDmHd1 LD
C

9
Supplemental figure legends
Figure S1. Molecular data from several laboratories conform to the external
coincidence hypothesis.
The validation data (see Supplemental Data; Supplemental Table 1) were analysed
to identify the trends across all experiments. (A) The integrated FT mRNA area over
one cycle is strongly correlated with the integrated CO mRNA area during the light
interval. (B) the integrated FT mRNA area over one cycle is more flexibly related to
the hours of light during the cycle. The experimental mRNA levels have been
normalized to the CO mRNA maximum (see Supplemental data). (C) Simulations of
models 1a (blue symbols) and 1b (green symbols) optimized using the training data
were then compared to the validation data of (B). (D) Simulations of model 3 (black
symbols) were compared to the validation data of (B). In each case, solid lines show
a linear fit to the cognate data series, indicating the overall trend of the data or
simulations.
Figure S2. The toc1 mutation has little effect on light activation of FT.
Data redrawn from (Yanovsky and Kay, 2002) depict mRNA levels of CO (open
symbols) and FT (filled symbols) in the toc1-1 mutant under light:dark cycles of 21h
(A, B, E, F, T=21h) or 24h (C, D, G, H, T=24h). In each case, short (A, C, E, G) and
long (B, D, F, H) photoperiod conditions are shown. The simulated FT mRNA levels
(solid line) are shown, from simulations using model 1a with parameters optimised
for the wild type (a-d) or model 1a with parameter Vco altered to match the toc1 data
sets, changing from 26 nmol/h in wild type to 37 (E, F) or to 35 (G, H).
Figure S3. CO activates less FT expression in the early morning.

10
The over-activation of FT mRNA in model 1a (Figure 2) was estimated by reducing
the effectiveness of light in activating FT in the morning. Best-fit parameters for the
duration and extent of this morning gate were estimated by fitting simulations (solid
lines) based on observed CO mRNA levels (blue circles) to observed FT mRNA
levels (red diamonds) from the two training data sets (Imaizumi et al., 2003; Yanovsky
and Kay, 2002), under SD (A, B) and LD (C, D). The effects shown for SD are
duration 2.3 h, effective light intensity 60% of normal; and for LD, duration 5 h,
intensity 40% of normal.
Figure S4. Simulating the effect of FKF1 on CO expression.
(A) Accumulation patterns of FKF1 protein under 8L:16D (‘SD’) and 16L:8D (‘LD’),
redrawn from Imaizumi et al (2003). (B) The additional CO transcription due to FKF1
activation under 16L:8D is plotted alone (dashed line) and superimposed (dotted line)
upon the original rate of CO transcription from model 3 (solid line). The mRNA
expression patterns for CO (C) and FT (D) were simulated by model 3F1 including
the activation of CO by FKF1 protein (solid lines), with the corresponding
experimental data (diamonds). (E) depicts the circuit originally proposed by Imaizumi
et al. (2003).
Figure S5. Entrainment of the circadian clock contributes to the photoperiod switch.
Model 3 was stably entrained to 24h cycles with various photoperiods, as in Figure 1
of Corbesier et al. (1996). The FT mRNA area integrated over 24h of simulation is
shown (open diamonds, with quadratic fit). Alternatively, FT mRNA area was
measured following transfer from 8L:16D short photoperiods to a single test

11
photoperiod of the duration shown (filled circles, with linear fit), as in Figure 3 of
Corbesier et al., (1996).
Figure S6. Effective relationships between the predicted FT area and flowering time
in the Columbia accession.
The FT areas predicted in Supplemental figure 5 are plotted against the flowering
time data of Corbesier et al. (1996), Figure 1 (a) and Figure 3 (b). The relationships
are described by two effective functions (A, see legend), or by a sigmoid function (B).
Parameter values are given in the Supplemental data, equations (11) - (13). Figures
beside each data point show the cognate photoperiod (h).
Figure S7. Functional CO protein is not required to produce the FKF1-dependent
shoulder of CO mRNA in long photoperiods.
(A) Hypothetical circuit, in which the dual effects of FKF1 on CO and FT mRNA are
accomplished by a single molecular function of FKF1 at the level of CO protein. CO
protein is proposed to feed back to regulate the shoulder of CO mRNA. Under this
model, mutation of CO should prevent the FKF1-dependent activation of CO
transcription in long photoperiods.
(B) Seedlings with and without co mutations were grown under 16L:8D for 10 days at
22°C. Samples were harvested 13h after lights-on, and extracted RNA was analysed
by qRT-PCR. The fkf1 mutant strongly reduces CO mRNA expression at this time,
but co mutations have little or no effect. Filled bars, wild types and fkf1 mutant
control. Col, Columbia parent; Ler, Landsberg erecta parent. Open bars, co mutant
alleles. The co-SAIL allele is line SAIL_24_H04 and lacks CO mRNA due to a T-DNA
insertion (nd, not detectable).
12
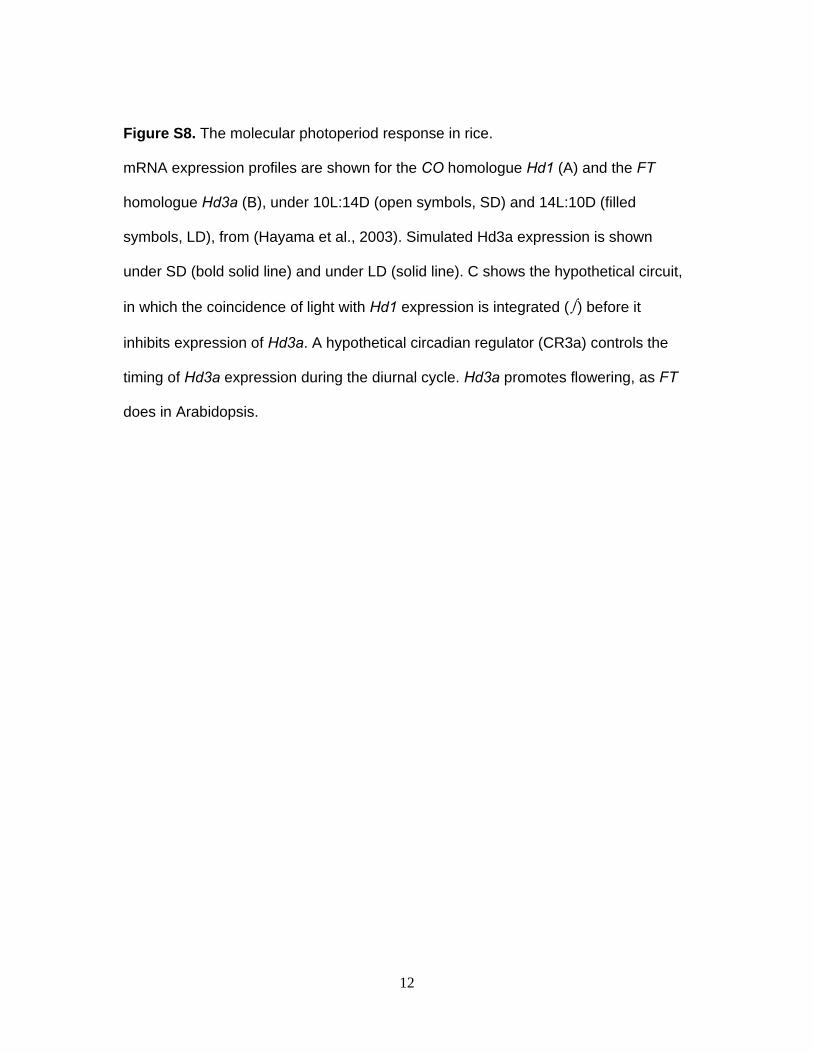
Figure S8. The molecular photoperiod response in rice.
mRNA expression profiles are shown for the CO homologue Hd1 (A) and the FT
homologue Hd3a (B), under 10L:14D (open symbols, SD) and 14L:10D (filled
symbols, LD), from (Hayama et al., 2003). Simulated Hd3a expression is shown
under SD (bold solid line) and under LD (solid line). C shows the hypothetical circuit,
in which the coincidence of light with Hd1 expression is integrated (∫ ) before it
inhibits expression of Hd3a. A hypothetical circadian regulator (CR3a) controls the
timing of Hd3a expression during the diurnal cycle. Hd3a promotes flowering, as FT
does in Arabidopsis.

13
Supplemental Experimental Procedures
Data Collection and Analysis
Numerical values for CO and FT mRNA expression patterns were captured by digitising
published charts or graphs of quantified data, or were kindly provided by the original authors
(Supplemental Table 1). Experiments are numbered; pairs of CO and FT waveforms
collected in the same genotype and experiment are given the same number. The data
include some variation in experimental details but share a similar basic design. In particular,
wild-type plants under short photoperiods (8L:16D) and long photoperiods (16L:8D) were
tested in 3 and 7 experiments, respectively, with more limited representation of exotic, non-
24h cycles. Several Arabidopsis accessions were tested, as well as fkf1 or toc1 mutants and
CO-overexpression lines. RNA levels were measured using RT-PCR in all cases, with
detection either by real-time fluorescence labelling or by hybridisation of radio-labelled
probes. The mRNA used as a constitutive control for inter-sample normalization varied.
Primers that amplify UBIQUITIN (UBQ) transcripts (Blazquez and Weigel, 1999) were used
in experiments 1-12 and similar primers (Cerdan and Chory, 2003) for experiments 13 and
14. Experiment 15 (Somers et al., 2004) used ACTIN2 (ACT2). In one experiment, the ratio
FT/CO was quantified directly (Valverde et al., 2004).
As a preliminary comparison between experiments, the ratio of peak FT to CO levels was
calculated to determine whether these different waveforms were mutually compatible (data
not shown). There is potential for significant variation in some experimental methods, for
example the specific radioactivity of the probes used in the hybridization experiments might
vary as a function of their age. The ratio (peak FT / peak CO) fell in a range 0.13 to 1.3, with
the exception of experiments 11 (ratio = 3.3), where radiolabelling was used, and 15 (ratio =
6.4), possibly related to the ACT2 control. Waveform 12 had by some distance the lowest
ratio (0.15) of any experiment in a long photoperiod. The FT waveform ftcoox1 in the CO-

14
over-expression experiment of (Suarez-Lopez et al., 2001) lacks comparable information on
the CO mRNA. In contrast, the other FT data from CO-over-expression lines, coox2 and
coox3, are normalized to the level of CO mRNA (Valverde et al., 2004). For these reasons,
the data of (Suarez-Lopez et al., 2001) and (Somers et al., 2004) were not considered
further.
Data analysis and normalisation for modelling
The remaining data were tested for comparability. According to the simplest formulation of
the external coincidence hypothesis in Arabidopsis, FT expression should be related to the
integrated area under the curve of CO mRNA accumulation that coincides with light. The set
of selected data was tested against this hypothesis, to confirm that pooling results from
diverse sources did not obscure interpretation of the data. This entails comparisons across
experiments that might use different experimental control transcripts for technical
standardization. The data for all genes and photoperiods within each experiment were
therefore normalized to a common internal standard, the maximum level of CO mRNA in
wild-type plants under short (8L:16D) photoperiods. CO mRNA has a broad, flat-topped
waveform in these conditions, which reduces the variability due to the particular timepoint
chosen for sampling in different experiments. Integrated areas were calculated under the CO
mRNA curve during the light interval only, and under the FT mRNA curve over a full cycle.
The FT area is clearly positively correlated with the CO area that coincides with light, across
all the data sets (supplemental figure 1A). Variation among experiments accounted for less
than a 2-fold range in the FT areas under conditions that gave similar CO areas. As an
additional test, the normalized FT area was plotted against the duration of light in each cycle
(Supplemental figure 1B). The correlation was also positive but this result is weaker,
because the available data are clustered around 8h light and 16h light with very little data at
intermediate photoperiods. Futhermore, the variation in experimental conditions produces
clear outliers, for example from experiment 6 (10L:20D).

15
To take account of some of the variability, two different short day (SD) and long day (LD)
experiments were used in the initial estimation of the model parameters (the training data
sets): experiments 1 and 9 (short photoperiods), 3 and 8 (long photoperiods). These were
produced by the Kay laboratory (Imaizumi et al., 2003; Yanovsky and Kay, 2002), and
allowed direct comparison between these wild-type waveforms used to develop the models
and the toc1 and fkf1 mutant waveforms that were tested in the same experiments.
In order to compare model simulations to the experimental waveforms, the simulations were
normalized to the maximum of CO mRNA under SD. Simulations were normalized by
dividing the CO and FT waveforms in SD and LD by the maximum of the simulated CO
waveform of the wild type in SD, then multiplying them by the maximum of the experimental
CO waveform in SD. In this way, the simulated and experimental CO waveforms in SD
share the same upper limit (Figure 3). This procedure is unnecessary for models 1a and 1b,
which take their normalization directly from the size of the experimental CO waveform
(Figure 2).
Model Testing Procedure
The kinetic parameters required in the model equations have not been directly measured by
experiment. Random parameter sets (usually over 3,000, with each parameter usually
bounded in the range 0 to 100) were therefore evaluated, by testing the fit of the model
solution with that parameter set to the training data, using Matlab version 6 (Mathworks,
Cambridge, UK). The model was solved for 120 hours (five 24-hour days) of entrainment
under the appropriate light-dark cycle, with a final cycle that was used as the seed for a
differential equation boundary value solver (bvp4c, MatLab version 6). The resulting solution
was therefore guaranteed to be a true, attracting limit cycle. After using the scaling described
in the previous paragraph, the fit of the model to the relevant data set(s) was measured using
a weighted mean square method. The weights were chosen to be the maximum of the
experimental CO and FT mRNA waveforms in each photocycle (short or long days) to

16
prevent the fitting procedure being dominated by the largest FT mRNA abundance in long
days.
The 20 parameter sets with lowest cost (best fit) were typically subject to 5 cycles of 20
iterations of the Nelder-Mead unconstrained simplex optimization method (Matlab version 6).
The Nelder-Mead method typically improved the cost values by 20-30%, frequently changing
the cost ranking compared to the starting parameter sets. After optimization, the difference in
cost values of the 20 best solutions tended to be small, although some parameter values
could be widely spread in parameter space.
Models
Our models are based on Michaelis-Menten kinetics. All parameter values are positive, so
terms that model the degradation of the relevant molecular species are given negative sign.
In the equations below, the term L = 1 for light and 0 for darkness. The square waveform of
light:dark cycles in growth chamber experiments was simulated using a hyperbolic tangent
function to produce abrupt light-dark transitions that are numerically continuous. Throughout,
units of time are hours (h); characteristic units for molecular species are nanomoles (nmol);
the relative mRNA profiles were normalized to an internal mRNA standard as noted below.
For a diagrammatic representation of the different models and their relationships, see Figure
1.

17
Level 1 – Regulation of FT by the CO concentration observed in data
Model 1a
FT mRNA synthesis is a function of the experimental CO mRNA amount, which is taken to
approximate the amount of active CO protein. CO activates FT transcription only in the light
(equation 1).
mFTkFTmFTvFT
eCOkCOeCOvCOL
dtdmFT
+−
+⋅⋅= (1)
mFT = simulated FT mRNA, vCO = maximum FT transcription rate = 25.9719 nmol/h, kCO =
Michaelis constant of FT activation by CO = 70.6788 nmol, eCO = experimental CO mRNA
concentration, vFT = max rate of FT mRNA degradation = 12.9543 nmol/h, kFT = Michaelis
constant of FT mRNA degradation = 62.2131 nmol.
Model 1b
The experimental CO mRNA amount is translated into CO protein that is degraded only in
darkness (2). CO protein activates FT transcription equally in all conditions (3).
( )COpkCOp
COpvCOpLeCOvCOmdt
dCOp+
⋅−−⋅= 1 (2)
COp = simulated CO protein, vCOm = rate constant of CO protein production = 3.3243
nmol/h, eCO = CO mRNA concentration in experimental data, vCOp = maximum rate of CO
protein degradation = 10.4291 nmol/h, kCOp = Michaelis constant of CO protein degradation
= 1.4977 nmol.
mFTkFTmFTvFT
COpkCOFTCOpvCOFT
dtdmFT
+−
+= (3)
vCOFT = max FT transcription rate = 0.4561 nmol/h, kCOFT = constant of activation by CO =
9.9181 nmol, vFT = max rate of FT mRNA degradation = 4.9569 nmol/h and kFT = Michaelis
constant of FT mRNA degradation = 12.3926 nmol.

18
Either model 1a or 1b could fit well to the experimental data (Supplemental Figure 1C). As
model 1b explicitly includes regulation of the CO protein, we anticipate that this will be more
useful for comparison to molecular data, and discuss the results from this model in the main
text.
The “morning gate”
To reduce the excess FT mRNA predicted in the morning (Figure 2), we inserted new
parameters into model 1a that reduced the effectiveness of light in activating FT (by
multiplying vCO by a constant value between 0 and 1), for a specified time interval (between
0 and 6 hours) starting at dawn. No single combination of effectiveness and duration
parameters allowed an improved fit to the training data under both long days and short days
(unpublished results). The data could only be matched by allowing the gating parameters to
vary with photoperiod. A good fit was obtained for some parameter sets with no gating at all
under short-day conditions. The best fits resulted from a lower gating effect (and/or for a
shorter interval) under short photoperiods, combined with stronger gating (and/or for a longer
interval) under long photoperiods (Supplemental figure 3 and legend shows one example).
The morning gate improved the fit to only one to two data points in the available FT RNA
timeseries, making a relatively small contribution to the overall fit. By the same token, the
time resolution of the current data provides insufficient constraints to parameterise the effect
accurately. Moreover, several experimental results indicate that the gate is not always
effective at the molecular level, nor functionally relevant for flowering (see Discussion). No
separate morning gate mechanism was included in subsequent models.
Level 2 – Regulation of CO mRNA by the circadian clock
Model 2a
This model is based on the first clock model (Locke et al., 2005a), which consists of two
genes, LHY and TOC1, that form a single negative feedback loop. Light entrains the clock
model only by enhancing LHY transcription, so the phase of the clock is locked to lights-on.

19
The nuclear TOC1 protein concentration from this model peaks at an appropriate phase
under short days, and is therefore used without modification as a proxy for CO mRNA.
Model 2b
This model is based on the interlocking-loop clock model (Locke et al., 2005b). This clock
model consists of four genes LHY, TOC1 and two unknown genes termed X and Y, in which
LHY, TOC1, and X form one loop, while TOC1 interacts with Y to form a second, interlocking
feedback loop. Light activates transcription of LHY and also of Y. Again, the nuclear TOC1
protein concentration is used as a proxy for CO mRNA.
As model 2a clearly failed to fit the phase change relative to lights-on that was observed in
the experimental CO data (Figure 2), only model 2b was used subsequently.
Level 3 – Regulation of FT by simulated CO
Model 3
This model combines CO simulated using model 2b with the activation of FT mRNA
simulated using model 1b (equations 2 and 3). Neither model is modified but nTOC1
replaces eCO in equation (2):
( )COpkCOp
COpvCOpLnTOCvCOmdt
dCOp+
⋅−−⋅= 11 (4)
Parameter values are the same as in (2). nTOC1 = nuclear TOC1 protein.
Modelling FKF1 effects on CO and FT transcription
Preliminary models were constructed to quantify the effects of FKF1 upon CO and FT mRNA
profiles. A simple step function gave a good qualitative fit to the shoulder of CO mRNA at the
end of a long photoperiod (data not shown). As FKF1 protein profiles were quantified by
Imaizumi et al. (2003) (Supplemental figure 4A), we modelled a more detailed molecular
mechanism using these data for 8L:16D and 16L:8D cycles. Our aim here was to fit the CO
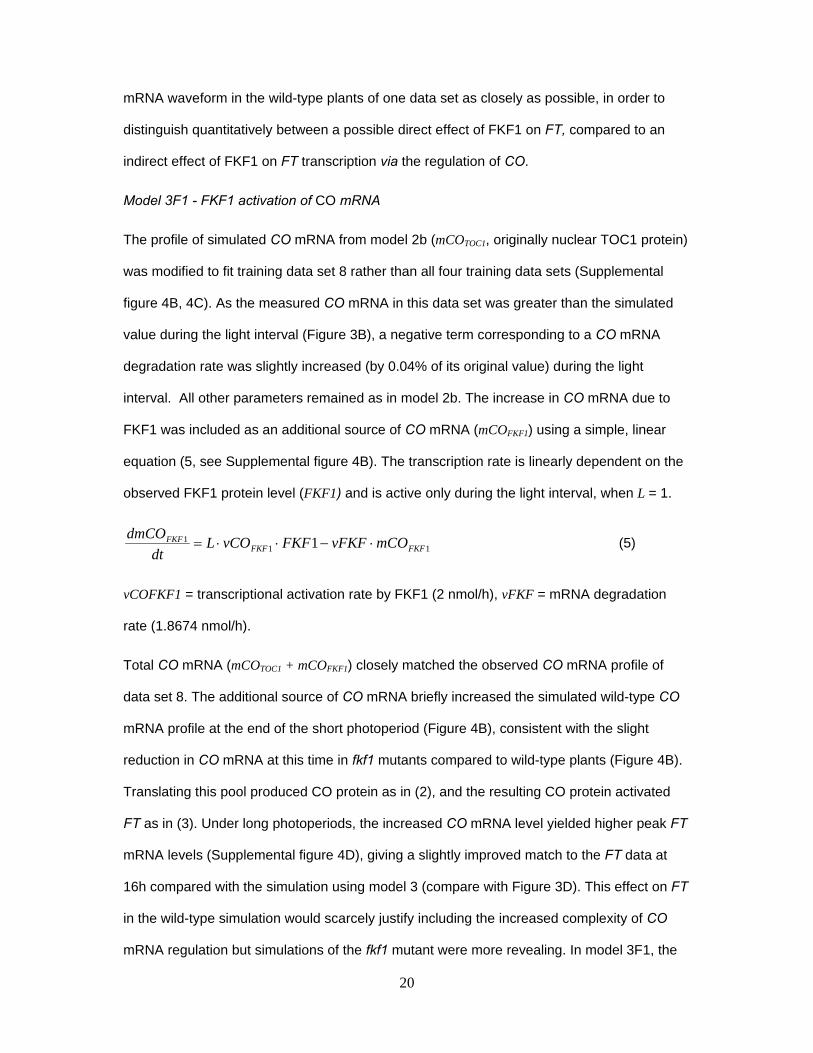
20
mRNA waveform in the wild-type plants of one data set as closely as possible, in order to
distinguish quantitatively between a possible direct effect of FKF1 on FT, compared to an
indirect effect of FKF1 on FT transcription via the regulation of CO.
Model 3F1 - FKF1 activation of CO mRNA
The profile of simulated CO mRNA from model 2b (mCOTOC1, originally nuclear TOC1 protein)
was modified to fit training data set 8 rather than all four training data sets (Supplemental
figure 4B, 4C). As the measured CO mRNA in this data set was greater than the simulated
value during the light interval (Figure 3B), a negative term corresponding to a CO mRNA
degradation rate was slightly increased (by 0.04% of its original value) during the light
interval. All other parameters remained as in model 2b. The increase in CO mRNA due to
FKF1 was included as an additional source of CO mRNA (mCOFKF1) using a simple, linear
equation (5, see Supplemental figure 4B). The transcription rate is linearly dependent on the
observed FKF1 protein level (FKF1) and is active only during the light interval, when L = 1.
111 1 FKFFKF
FKF mCOvFKFFKFvCOLdt
dmCO⋅−⋅⋅= (5)
vCOFKF1 = transcriptional activation rate by FKF1 (2 nmol/h), vFKF = mRNA degradation
rate (1.8674 nmol/h).
Total CO mRNA (mCOTOC1 + mCOFKF1) closely matched the observed CO mRNA profile of
data set 8. The additional source of CO mRNA briefly increased the simulated wild-type CO
mRNA profile at the end of the short photoperiod (Figure 4B), consistent with the slight
reduction in CO mRNA at this time in fkf1 mutants compared to wild-type plants (Figure 4B).
Translating this pool produced CO protein as in (2), and the resulting CO protein activated
FT as in (3). Under long photoperiods, the increased CO mRNA level yielded higher peak FT
mRNA levels (Supplemental figure 4D), giving a slightly improved match to the FT data at
16h compared with the simulation using model 3 (compare with Figure 3D). This effect on FT
in the wild-type simulation would scarcely justify including the increased complexity of CO
mRNA regulation but simulations of the fkf1 mutant were more revealing. In model 3F1, the

21
FT transcription rate at the end of a long photoperiod (16h after dawn) was only 35% lower in
the simulated fkf1 mutant compared to wild type.
Model 3F2 - Speculative model for FKF1 activation of FT mRNA
The level of FT mRNA observed in fkf1 mutant plants (Figure 3D) was far lower than the
prediction from model 3, which lacked FKF1 (Figure 3D), leading us to speculate that FKF1
was also required to activate FT transcription. We modified equation (3) to include the
activation of FT transcription by FKF1 protein in the light, giving equation (6), with results
shown in Figure 4A. FKF1 activation of FT was implemented as a multiplicative term in (6),
because the effect of the fkf1 mutation on FT mRNA levels was much more severe than its
effect on CO mRNA. A large proportion of FT mRNA thus becomes FKF1-dependent. For
parsimony, we assumed FKF1 was equally effective in regulating CO and FT. Parameter
vCOFT was altered compared to (3) to account for the new regulator. New parameters BCO
and BFKF were added in order to estimate CO-independent and FKF1-independent FT
transcription rates, respectively. These were termed ‘basal’ transcription rates to indicate that
their regulation is unknown, not that it is necessarily unregulated.
( )mFTkFT
mFTvFTFKFvCOFKFLBCOpkCOFT
COpvCOFTBdt
dmFTFKFCO +
⋅−⋅⋅+⋅⎟⎟⎠
⎞⎜⎜⎝
⎛+
⋅+= 11
(6)
vCOFT = max CO-dependent FT transcription rate = 0.58 nmol/h, kCOFT = constant of
activation by CO = 9.9181 nmol, BCO = CO-independent transcription rate = 0 nmol/h, BFKF =
FKF1-independent transcription rate = 0.22 nmol/h, vCOFKF1 = coupling constant for
activation by FKF1 = 2 nmol/h, vFT = mRNA degradation rate = 1.8674 nmol/h, kFT =
Michaelis constant of FT mRNA degradation = 5.3925 nmol.
With BCO set to 0, FT transcription remains completely CO-dependent, consistent with
undetectable FT levels in the co mutant (Jang et al., 2008; Suarez-Lopez et al., 2001). The
parameter is included in the model to reflect the possibility that a small proportion of FT

22
expression is CO-independent in wild-type plants. Simulations (data not shown) suggested
that the upper bound on the parameter value consistent with experimentally undetectable FT
mRNA (~5% of wild-type peak level) in the co mutant is about 0.03 (data not shown), 7-fold
less than BFKF and 19-fold less than vCOFT. As the numerical value of this very low
transcription rate was arbitrary, and it had a negligible effect on FT in wild-type simulations
(data not shown), it was set to 0 for parsimony. Future experiments that reliably quantify the
low levels of FT RNA in the co mutant may constrain its value above zero.
In order to simulate the fkf1 mutant, the parameter controlling FKF1’s transcriptional effect
(vCOFKF1) was set to 0 in (5) and (6). The simulated CO mRNA profiles (Figure 4F, 4G)
were very close to the simulations from model 3, as expected. Reduced CO mRNA and
protein remained, allowing us to estimate the basal transcription rate of FT that was required
to produce the small amounts of FT mRNA observed in the experimental data on the fkf1
mutant (Figures 4H, 4I). The net transcription rate at the end of a 16h day was 0.0522 nmol/h
in the mutant, compared to 0.5317 nmol/h in wild type. This result emphasizes the large
effect of the fkf1 mutation on FT expression, which greatly exceeds the effect expected from
the change in CO mRNA alone (illustrated by model 3F1, above).
Level 4 – Regulation of flowering time by FT
In the final stage of modeling, a direct predictor of flowering time was added to the model.
This requires one of the model outputs to be connected to a measure of macroscopic
flowering time that corresponds to experimental data (the percentage of plants flowering on a
given day, the mean time (days) until flowering or the duration of the vegetative phase
(number of leaves) until flowering). There was no suitable data in the literature to define
directly the non-linear relationship between the amount of FT mRNA and the time to
flowering. Such data cannot easily be pooled, as flowering times are highly variable between
laboratories and even between experiments. Rather, both variables must be measured for a
range of photoperiods in a single experiment. Such data are now urgently required.

23
In the interim, photoperiod was used as an intermediate variable between the model outputs
and the experimental measures of flowering. The level 3 models take photoperiod as an
input parameter, so it was possible to predict the relationship between any of the model
components and photoperiod. All the flowering measures in the literature are also reported
as a function of photoperiod. The level 4 model can therefore be used to interpolate the
flowering time for any photoperiod by calibrating the predicted FT against the measured
flowering times.
Mathematically speaking, if fl(ph) is an experimental measure of flowering fl (for example,
leaf number) in a photoperiod ph, and Q refers to a molecular quantity (FT mRNA
concentration, for example), then flowering fl under photoperiod ph is a function of Q under
photoperiod ph. This relationship is defined by function X (in our example, X is relationship of
leaf number to FT mRNA concentration), thus:
fl(ph) = X(Q(ph)). (7)
As fl(ph) is known experimentally and our molecular models will give us an approximation to
Q(ph), which we will call Q*(ph), then we can compute an approximation to X (termed X*)
using measured fl(ph) values from the literature:
fl(ph) = X*(Q*(ph)). (8)
Using X* we can obtain by interpolation an approximation to fl(ph), fl*(ph), for other
photoperiods that have not been measured:
fl*(ph) = X*(Q*(ph)). (9)
We analysed flowering-time data of Corbesier et al. (Corbesier et al., 1996), which offers
several useful data sets, by this method to illustrate the approach. The data include flowering
time (as “days to macroscopic appearance of flower buds”) of non-vernalized Columbia
plants under various photoperiods (in figure 1 of the paper), and flowering time (as
“percentage of [plants showing] flower induction”) of vernalized Columbia plants maintained

24
in SD for 2 months then treated with a single test cycle of various photoperiods (in figure 3a
of the paper).
In order to compute Q*(ph) for the conditions used in Figure 1, model 3b was entrained to
light:dark cycles with various photoperiods and FT mRNA area was calculated (the area
beneath the curve of FT mRNA level integrated over a 24h cycle). Thus the full model
provides Q*(ph) in a complex form. The same relationship between FT area and photoperiod
can be more simply approximated by a quadratic function (see Supplemental figure 5), given
by
FTarea = 0.12ph2 –2.1ph + 12. (10)
The data point for a 24h photoperiod (constant light) also fits the quadratic relationship well.
X*(Q*(ph)) could be computed in several ways, depending on the data. The measured
flowering times in Figure 1 of (Corbesier et al., 1996) exhibit a switching behavior when
plotted against either photoperiod or FT area, which can be approximated by a sigmoid
function. The change in flowering time is greatest between 8h photoperiod (>80 days to
flowering) and 12h photoperiod (~30 days), where predicted FT area is low and changes
relatively little (supplemental figure 6A). The leftmost point is therefore in a region of very
steep gradient, where flowering times change quickly for even a slight change in FT area. It
is unclear where the flowering times will saturate, and in practice growth rates may be
markedly reduced under very short photoperiods owing to metabolic effects. No saturating
sigmoid function was found to match these data as well as a non-saturating function, given
by
Flowering time = d0 + a / (1 - FTarea/b) (11)
where d0 is a minimum flowering time at very high FTarea (estimated at 16.55 days), a is a
multiplier (estimated at -15.29), FTarea is as described above and b is an artificial lower limit
of FT area that prevents flowering completely (estimated value 1.63). Supplemental figure 6A
shows this function plotted together with the most closely-matching Hill function,

25
nn
n
FTareabbadData
++=
1111 (12)
with parameter values a1 = 662.081, b1 = 0.93871, n = 1 and d1 = 16.5 days. In this
function, d1 is again the minimum flowering time, a1 is a multiplier, b1 is the FTarea at the
so-called “critical photoperiod”, and n is the Hill coefficient. The critical photoperiod is
conventionally defined as the photoperiod that causes the half-maximal flowering response,
between the fully-induced and fully-uninduced conditions. Higher Hill coefficients allow a
sharper switch from the uninduced to the induced response, over a narrower range of
FTarea. Because this data set did not include sufficiently short photoperiods to indicate the
maximum flowering time, the limits of the response were unclear: the Hill coefficient was set
to 1 and the value of b1 was also poorly constrained.
Data sets that include a greater range of photoperiods can show that the flowering response
is minimally induced at short photoperiods and is saturated at long photoperiods. The Hill
function (12) is equally applicable to data for flowering time (days to flowering) and for leaf
numbers, as high leaf numbers at flowering reflect late flowering time. Equation (12) can
therefore match the leaf number data of Pouteau et al. for the Ws accession (Pouteau et al.,
2008) and the leaf number data of Wilczek et al. for the La(er) accession (Wilczek et al.,
2009). For Wilczek et al. (Figure 5B), best-fit parameter values are n = 10, d1 = 10, a1 =
30.0669 and b1 = 2.82065. For Pouteau et al. (Figure 5C), best-fit parameter values are n =
6, d1 = 15, a1 = 31.9573 and b1 = 2.88922. In these cases, d1 is the minimum leaf number
observed with fully-induced flowering, which is lower in the La(er) data than in Ws. Note the
high values of n, which confer switching behaviour, and the very similar estimates of b1,
which reflect similar critical photoperiods in both data sets.
Equation (12) can be directly related to the photoperiod submodel in the recent phenological
model for Arabidopsis (Wilczek et al., 2009). Parameter d1 corresponds to the reciprocal of
the developmental rate for photoperiods below the critical short day length. The upper and

26
lower turning points on either side of the critical day length correspond to the FTarea at the
critical long and short day length (Wilczek et al., 2009), respectively.
In order to compute Q*(ph) for the conditions used in Figure 3 of (Corbesier et al., 1996),
model 3b was entrained to SD (8L:16D) cycles and then tested under one longer
photoperiod. Within the single, test photoperiod the model exhibited little change in mCO
waveform compared to the preceding SD conditions (data not shown), because the
entrainment of the clock was hardly affected within the first photoperiod. The mFT waveform
was changed by the longer light intervals, resulting in a steep linear increase in the FT area
(Supplemental figure 5). Note that this contrasts with the quadratic increase observed for the
simulations under continuous cycles of altered photoperiod, where the entrainment of the
clock also varies with the photoperiod (Supplemental figure 5; see Discussion).
X*(Q*(ph)) was fitted with a sigmoid function, assuming that flowering was maximally induced
by a 20L:4D cycle :
( )( )
0)(_
)(1% kSDFTareaareaFTcritP
SDFTareaareaFTkIndunctionFlowering nn
n
+−+
−= (13)
where k0 = 0, the % flowering in the SD control plants, k1 = 100 for full induction, P_crit =
3.97 and the best value for n is probably 9. This represents a very steep switching behavior,
very similar to what is observed in Figure 3(a) of (Corbesier et al., 1996) (Supplemental
figure 6B).
Overall, this analysis supports the use of the FT area as a relevant model output for flowering
prediction. Functions similar to (11), (12) and (13) above can readily be adapted to
accommodate the variations in flowering time due to the growth conditions of specific
laboratories, so that the model-based estimate, X*(FTarea*(ph)), can be used to interpret
molecular data. Multiple data sets with matched FT areas and flowering times are now

27
required to define a measured X(FTarea(ph)) function, in order to validate the model-based
estimate and to assess the variations among laboratories.
Photoperiod responses over multiple cycles and transient changes in photoperiod
In order for the plant to integrate the FT over a full diurnal cycle, as FTarea does in the
model, a moderately stable molecule may be required downstream of the FT mRNA. Levels
of this integrating molecule would then cross a threshold for flowering upon a single long
photoperiod, in the case of the SD-grown plants in Figure 3a of (Corbesier et al., 1996). The
effective stability of the integrator must be limited, however, to ensure that the current or
most recent photoperiods have the greatest effect. Excessive stability would allow long-term
accumulation to induce flowering in plants held under SD conditions for 2 months without an
inductive photoperiod, in contradiction to the data (Corbesier et al., 1996). Where young
seedlings are tested (for example, Corbesier et al., 2007), several LD are required to induce
flowering, indicating that the integrating species is stable enough to accumulate over several
days. FT expression also increases progressively after each LD, and one cycle with high FT
expression is observed after plants are returned from LD to SD (Corbesier et al., 2007). The
latter effects are suggestive of a positive feedback in the photoperiod sensor. As the
mechanism(s) of these effects remain to be determined, they are not included in the models
presented.
Daylength perception in a short-day plant
A dramatic re-tuning of the photoperiod sensor is thought to have occurred in rice, to
promote flowering in SD rather than LD (Hayama and Coupland, 2004). The CO orthologue
of rice, Heading date 1 (Hd1), is expressed in a very similar fashion to Arabidopsis CO under
both LD and SD (Supplemental figure 8A). Rather than activating expression of FT as in
Arabidopsis, genetic evidence indicates that Hd1 suppresses the best-characterised rice
homologue of FT, named Hd3a (Hayama and Coupland). This change of sign has been
proposed to account for the difference in mechanism between short-day plants and long-day

28
plants (Hayama et al., 2003). The published timeseries data for these rice genes are fewer
and more variable than in Arabidopsis. Nonetheless, modeling of the rice data set that is
most similar to Arabidopsis showed that, even for these data, the change of sign does not
account for the dynamic expression pattern of Hd3a (data not shown). The same conclusion
can be reached by inspection of the data (Supplemental figure 8B): light coincides with the
highest Hd1 RNA levels 12h after dawn under LD, but this peak of Hd1 passes in darkness
under SD. If light interacts with Hd1 as it does with CO, this should result in differential
induction of Hd3a in LD versus SD, yet Hd3a RNA levels at this time are almost identical in
both conditions. Furthermore, about 4h after dawn Hd1 expression falls to similar, low levels
under LD and SD, yet this is when Hd3a RNA levels show the greatest photoperiodic
regulation.
We propose that the coincidence of Hd1 with light sets the mean level of Hd3a expression
but that the phase of expression is set by another rhythmic factor, which we term the
Circadian Regulator of Hd3a (CR3a). Activation of Hd3a transcription may for example
require interaction between the Hd1 protein and a rhythmically expressed transcription factor.
CR3a can be equally well approximated using a sine wave (Supplemental figure 8) or the
waveform of Hd1 RNA (unpublished results). CR3a can be modeled as either an activator or
repressor of Hd3a, where activating CR3a peaks shortly after dawn (as in Supplemental
figure 8) or repressive CR3a peaks early in the night (unpublished results).
( ) aCRakCRaCRavCR
amHdakHdamHdavHd
INTkHdkHdvHdB
dtadmHd
3333
3333
11113
+⋅+
+⋅−
++⋅+= (13)
( )⎟⎟⎠
⎞⎜⎜⎝
⎛ ++=
aCR
aCRtaCR3
32cos13τ
φπ (14)
B = basal level of Hd3a transcription (0.05 nmol/h), vHd1 = maximum Hd3a transcription
antagonized by Hd1 inhibition (2.545 nmol/h), kHd1 = Michaelis constant of inhibition by Hd1
(2.3291 nmol), INT = measured integral of Hd1 mRNA area during light interval over one 24h

29
cycle (1.39 nmol under 10L14D, 4.32 nmol under 14L10D), vHd3a = maximum rate of Hd3a
mRNA degradation (1.9861 nmol/h), kHd3a = Michaelis constant of Hd3a degradation
(0.0327 nmol), vCR3a = maximum Hd3a transcription rate from CR3a activation (4.4770
nmol/h), kCR3a = Michaelis constant of activation by CR3a (10.9056 nmol), ΦCR3a = phase of
CR3a transcription (-0.6242 h), τCR3a = period of CR3a transcription (24h).
Moreover, the relevant coincidence of Hd1 with light cannot result in immediate regulation of
Hd3a, nor can the coincidence be integrated uniformly within the day starting from dawn, as
both mechanisms would predict the greatest difference in Hd3a expression at the end of the
day. We therefore propose that the coincidence of Hd1 RNA with light is integrated over
longer time intervals spanning several days, and that this integrated measurement sets the
mean level of Hd3a expression. The rice mechanism is therefore quite distinct from the very
rapid effect in Arabidopsis of the coincidence of CO with light. Supplemental figure 8 shows
that this class of mechanism readily fits the data. A parsimonious molecular mechanism is
that Hd1 protein is much more stable than CO, accumulating over several days. A paralogue
of CO that is rhythmically expressed with a peak near dawn (Kim et al., 2008), like
CONSTANS-LIKE1 in Arabidopsis (Ledger et al., 2001), might function as an activating
CR3a, though Hd1 is also proposed to have activating functions (see references in main
text).
Supplemental References Blazquez, M. A., and Weigel, D. (1999). Independent regulation of flowering by phytochrome B and
gibberellins in Arabidopsis. Plant Physiol 120, 1025-1032.
Cerdan, P. D., and Chory, J. (2003). Regulation of flowering time by light quality. Nature 423, 881-
885.

30
Corbesier, L., Gadisseur, I., Silvestre, G., Jacqmard, A., and Bernier, G. (1996). Design in Arabidopsis
thaliana of a synchronous system of floral induction by one long day. Plant Journal 9, 947-
952.
Corbesier, L., Vincent, C., Jang, S., Fornara, F., Fan, Q., Searle, I., Giakountis, A., Farrona, S., Gissot,
L., Turnbull, C., and Coupland, G. (2007). FT protein movement contributes to long-distance
signaling in floral induction of Arabidopsis. Science 316, 1030-1033.
Hayama, R., and Coupland, G. (2004). The molecular basis of diversity in the photoperiodic flowering
responses of Arabidopsis and rice. Plant Physiol 135, 677-684.
Hayama, R., Yokoi, S., Tamaki, S., Yano, M., and Shimamoto, K. (2003). Adaptation of
photoperiodic control pathways produces short-day flowering in rice. Nature 422, 719-722.
Imaizumi, T., Tran, H. G., Swartz, T. E., Briggs, W. R., and Kay, S. A. (2003). FKF1 is essential for
photoperiodic-specific light signalling in Arabidopsis. Nature 426, 302-306.
Jang, S., Marchal, V., Panigrahi, K. C., Wenkel, S., Soppe, W., Deng, X. W., Valverde, F., and
Coupland, G. (2008). Arabidopsis COP1 shapes the temporal pattern of CO accumulation
conferring a photoperiodic flowering response. EMBO J 27, 1277-1288.
Kim, S. K., Yun, C. H., Lee, J. H., Jang, Y. H., Park, H. Y., and Kim, J. K. (2008). OsCO3, a
CONSTANS-LIKE gene, controls flowering by negatively regulating the expression of FT-
like genes under SD conditions in rice. Planta 228, 355-365.
Ledger, S., Strayer, C., Ashton, F., Kay, S. A., and Putterill, J. (2001). Analysis of the function of two
circadian-regulated CONSTANS-LIKE genes. Plant J 26, 15-22.
Locke, J. C., Millar, A. J., and Turner, M. S. (2005a). Modelling genetic networks with noisy and
varied experimental data: the circadian clock in Arabidopsis thaliana. J Theor Biol 234, 383-
393.
Locke, J. C., Southern, M. M., Kozma-Bognar, L., Hibberd, V., Brown, P. E., Turner, M. S., and
Millar, A. J. (2005b). Extension of a genetic network model by iterative experimentation and
mathematical analysis. Mol Sys Biol 1, 13.
31
Pouteau, S., Carre, I., Gaudin, V., Ferret, V., Lefebvre, D., and Wilson, M. (2008). Diversification of
photoperiodic response patterns in a collection of early-flowering mutants of Arabidopsis.
Plant Physiol 148, 1465-1473.
Somers, D. E., Kim, W. Y., and Geng, R. (2004). The F-box protein ZEITLUPE confers dosage-
dependent control on the circadian clock, photomorphogenesis, and flowering time. Plant Cell
16, 769-782.
Suarez-Lopez, P., Wheatley, K., Robson, F., Onouchi, H., Valverde, F., and Coupland, G. (2001).
CONSTANS mediates between the circadian clock and the control of flowering in
Arabidopsis. Nature 410, 1116-1120.
Valverde, F., Mouradov, A., Soppe, W., Ravenscroft, D., Samach, A., and Coupland, G. (2004).
Photoreceptor regulation of CONSTANS protein in photoperiodic flowering. Science 303,
1003-1006.
Wilczek, A. M., Roe, J. L., Knapp, M. C., Cooper, M. D., Lopez-Gallego, C., Martin, L. J., Muir, C.
D., Sim, S., Walker, A., Anderson, J., et al. (2009). Effects of genetic perturbation on seasonal
life history plasticity. Science 323, 930-934.
Yanovsky, M. J., and Kay, S. A. (2002). Molecular basis of seasonal time measurement in
Arabidopsis. Nature 419, 308-312.

32
Table S1. Data provenance and file names.
Publications that provided the mRNA waveforms are listed below. The numerical values of the cognate data sets are available as supplemental data in the draft CSBE standard format. Each waveform is assigned a name, including the genotype and experiment number. Corresponding CO and FT waveforms share the same experiment number. Levels were measured by RT-PCR, with detection either by real-time fluorescence labelling or by hybridisation of radio-labelled probes. The mRNA used as a constitutive control for inter-sample normalization varies. Primers that amplify UBIQUITIN (UBQ) transcripts (Blazquez and Weigel, 1999) were used in experiments 1-12 and similar primers (Cerdan and Chory, 2003) for experiments 13 and 14. Experiment 15 (Somers et al., 2004) used ACTIN2 (ACT2). In one experiment, the ratio FT/CO was quantified directly (Valverde et al., 2004). Notes: LD – long days; SD – short days; a plus sign indicates wild-type genotype.
Reference Fig. Acce-ssion
Geno-type
Period of
light-dark cycle
Photo-period (L:D)
RNA tested
Waveform Name
Note
Suárez-López et al. (2001) Nature 410:1116-1120
2d
2f
3c
3d
3e
Ler
Col
Ler
Ler
Col
+
+
+
35S::CO
+
24
24
24
24
24
16:8
16:8
16:8
16:8
16:8
CO/UBQ10
CO/UBQ10
FT/UBQ10
FT/UBQ10
FT/UBQ10
co11
co12
ft11
ftcoox1
ft12
LD
LD
LD
LD
LD
Yanovsky & Kay (2002) Nature 419:308-312
1a
1b
1c
1d
2a
2b
2c
2d
3
Ler
Ler
Ler
Ler
Ler
Ler
Ler
Ler
Ler
Ler
Ler
Ler
Ler
Ler
Ler
Ler
Ler
+
toc1-1
+
toc1-1
+
toc1-1
+
toc1-1
+
toc1-1
+
toc1-1
+
+
+
+
+
24
24
21
21
24
24
21
21
24
24
21
21
24
24
21
21
24
8:16
8:16
7:14
7:14
16:8
16:8
14:7
14:7
8:16
8:16
7:14
7:14
16:8
16:8
14:7
14:7
8:16
CO/UBQ10
CO/UBQ10
CO/UBQ10
CO/UBQ10
CO/UBQ10
CO/UBQ10
CO/UBQ10
CO/UBQ10
FT/UBQ10
FT/UBQ10
FT/UBQ10
FT/UBQ10
FT/UBQ10
FT/UBQ10
FT/UBQ10
FT/UBQ10
CO/UBQ10
co1
co1toc1
co2
co2toc1
co3
co3toc1
co4
co4toc1
ft1
ft1toc1
ft2
ft2toc1
ft3
ft3toc1
ft4
ft4toc1
co5
SD
SD
LD
LD
SD
SD
LD
LD
SD

33
3
3
3
4c
4d
Ler
Ler
Ler
Ler
Ler
+
+
+
+
+
30
24
30
24
24
10:20
8:16
10:20
16:8
16:8
CO/UBQ10
FT/UBQ10
FT/UBQ10
FT/UBQ10
CO/UBQ10
co6
ft5
ft6
ft7
co7
SD
LD
LD
Cerdan & Chory (2003). Nature 423:881-885
3b
3b
3d
3d
Col
Col
Col
Col
+
+
+
+
20
20
16
16
16:4
16:4
9:7
9:7
FT/UBQ10
CO/UBQ10
FT/UBQ10
CO/UBQ10
ft13
co13
ft14
co14
Imaizumi et al. (2003). Nature 426:302-306
2c
2c
2d
2e
2e
2e
2f
2f
S6a
S6b
Col-0
Col-0
Col-0
Col-0
Col-0
Col-0
Col-0
Col-0
Ler
Ler
+
fkf1-2
+
fkf1-2
+
fkf1-2
+
fkf1-2
+
+
24
24
24
24
24
24
24
24
24
24
16:8
16:8
8:16
8:16
16:8
16:8
8:16
8:16
16:8
16:8
CO/UBQ
CO/UBQ
CO/UBQ
CO/UBQ
FT/UBQ
FT/UBQ
FT/UBQ
FT/UBQ
CO/UBQ
FT/UBQ
co8
co8fkf1
co9
co9fkf1
ft8
ft8fkf1
ft9
ft9fkf1
co10
ft10
LD
LD
SD
SD
LD
LD
SD
SD
LD
LD
Somers et al. (2004) The Plant Cell 16:769-782
8a
8b
Col C24
Col C24
+
+
24
24
16:8
16:8
CO/ACT2
FT/ACT2
co15
ft15
LD
LD
Valverde et al. (2004). Science
303:1003-1006
S2 Ler
Ler
35S::CO
35S::CO
24
24
8:16
16:8
FT/CO
FT/CO
ftcoox2
ftcoox3
SD
LD

34
Table S2: predictions from the models. Specific predictions, gaps in data and future experiments highlighted by the models are listed. Many additional predictions (the values of the parameters, for example) and gaps in data (quantitative time series of protein accumulation in the wild type, for example) are generic and are not listed here. Prediction
or Gap Model Outcome Possible
experiments 1 Prediction
and Gap 1 Effectiveness of CO mRNA in
activating FT is reduced by ~60% in the first 5h of light in long photoperiods, but less in short photoperiods. This avoids a morning peak of FT expression. The effect of FKF1 (see 6, below) is a possible mechanism.
Identify unknown factor that modifies FT activation in this pattern, e.g. quantify CO protein levels in WT compared to mRNA.
2 Prediction 1 TOC1 has little (40% or less) effect on the light activation of FT transcription; toc1’s main effect on photoperiodism is via the rhythm of CO transcription.
Quantify FT mRNA levels in response to light in toc1 and wild type.
3 Prediction 2 The phase of circadian regulation of the CO mRNA changes significantly under different photoperiods, similar to TOC1 in the interlocking-loop model.
Test CO mRNA phase under a range of photoperiods, compared to other clock genes.
4 Gap 2 Insufficient data on the phases of clock components under different photoperiods.
As for point 3, above.
5 Prediction 2 The waveform of CO mRNA is modified by FKF1, which mediates up to a 45% increase in CO transcription rate over the last 8h of a long photoperiod, with much less effect in SD. The effect on CO mRNA turns on and off sharply. This creates the photoperiod- and FKF1-dependent shoulder in CO expression.
As for point 3, above, with additional tests in fkf1.
6 Prediction and Gap
3, 3F2 FKF1 very strongly promotes FT transcription (~10-fold increase in transcription rate at the end of a long photoperiod).
Test FKF1 association with FT promoter.
7
Prediction 2,3 The FKF1 effect on FT is similar to the effect on CO (see 5), for example in its photoperiod-dependence. Both effects of FKF1 might have similar mechanisms.
Testing CO mRNA under LD in co mutants showed no effect on the FKF1-dependent shoulder

35
One hypothesis was that both were mediated by CO protein.
(sup. figure 8).
8 Prediction 3 Discrimination between long and short photoperiods will be optimal for cycle durations close to 24h; short photoperiods are partially inductive in longer or shorter cycles.
Measure flowering time under a range of different photoperiods, each in a range of cycle durations.
9 Gap 4 Insufficient data to quantify the non-linear response of flowering time to FT.
Measure FT expression profiles and flowering time under a range of photoperiods.
10 Prediction 4 The response measured in 9 will be approximated by equations (10, 11), up to the latest flowering times shown (sup. Figure 6). Later flowering times cannot yet be predicted.
As for point 9, above.