Predicting the Performance of Feedlot .Control Facilities at ...
61
Predicting the Performance o f Feedlot .Control Facilities a t Specific Oregon Location s Water Resources Research Institut e Oregon State University Corvallis, Oregon August 1975
-
Upload
khangminh22 -
Category
Documents
-
view
1 -
download
0
Transcript of Predicting the Performance of Feedlot .Control Facilities at ...
Predicting the Performance ofFeedlot .Control Facilities atSpecific Oregon Locations
Water Resources Research InstituteOregon State University
Corvallis, Oregon
August 1975

Predicting the Performance of Feedlot Coitro l
Facilities at Specific Oregon Locations
by
Robert B . WensinkJ . Ronald Miner
WRRI - 34
August 1975
?ro lect Completion Report
for
A Simulation Model to Evaluate Alternativ e
Means of Feedlot Impoundment and Disposa l
0 .T ' Frojeet .Nb . A-028-O1 E
Project Period : July 1, 1974 to June 30, 1975
The work upon which this publication is based was supporte din part by funds provided by the United States' Departmen tof the Interior, Office of Water Research and ;-Thnlogy ,as•.authorized under the Water Resources Research Act of 1964 ,Public Law .88-379 .

. . .µ
ABSTRACT
In 1972 the United States Congress-enacted the "Federal Water Pol-
lution Control Act - Amendments of 1972" . This Act required the Environ-
mental Protection Agency to promulgate effluent guidelines for discharge s .
from feedlots . These guidelines permit discharge from feedlots only i n
connection with an " unusual rainfall=" event . For 1977, the criterion isthe 10 year-24 hour storm; for 1983, the criterion is the 25 year-24 hou r
storm. These- criteria, however, are performance standards and do not
represent reservoir design .
A mathematical simulation model was developed to size feedlot runof f
retention reservoirs based upon previous climatological records . Two
versionsof the model were programmed . The first, called the return perio d
design technique ; investigated the results of employing EPA's performanc e
standards a& design criteria .. The second model;;-entitled the-sufficient
design method, determined the_minimum reservoir storage volume required
to prevent illegal discharge as defined by - the EPA Effluent Guidelines . .
The two techniques demonstrated that to use design procedures based upo n
a factor times the 10 year-24 hour or the 25 year-24 hour storm led, t o
designs that were either unreasonably expensive or which led to illegal
discharges for which the livestock producer was subject to monetary penalties .
The sufficient design technique was also used to determine pollutio n
control performance with various combinations of pumping rates and stor-
age facility volumes . In some Oregon locations, the use of high capacit y
irrigation equipment allowed reduction of storage volume by over 45 percent ;
in other Oregon locations, due to precipitation patterns, no benefit wa s
obtained from high cspaci.ty pumping equipment .
CN#WITS
INTRODUCTION
page 1
Feedlot DescriptionFederal Water Pollution Control
11
OBJECTIVES AND SCOP E
CONSTRUCTION OF THE MODEL
MODEL INPUTS
MODEL OUTPUT S
INTERPRETATION OF OUTPUT '
CONCLUSIONS
REFERENCES
APPENDICES
Appendix A . 1Appendix A.2
FIGURES
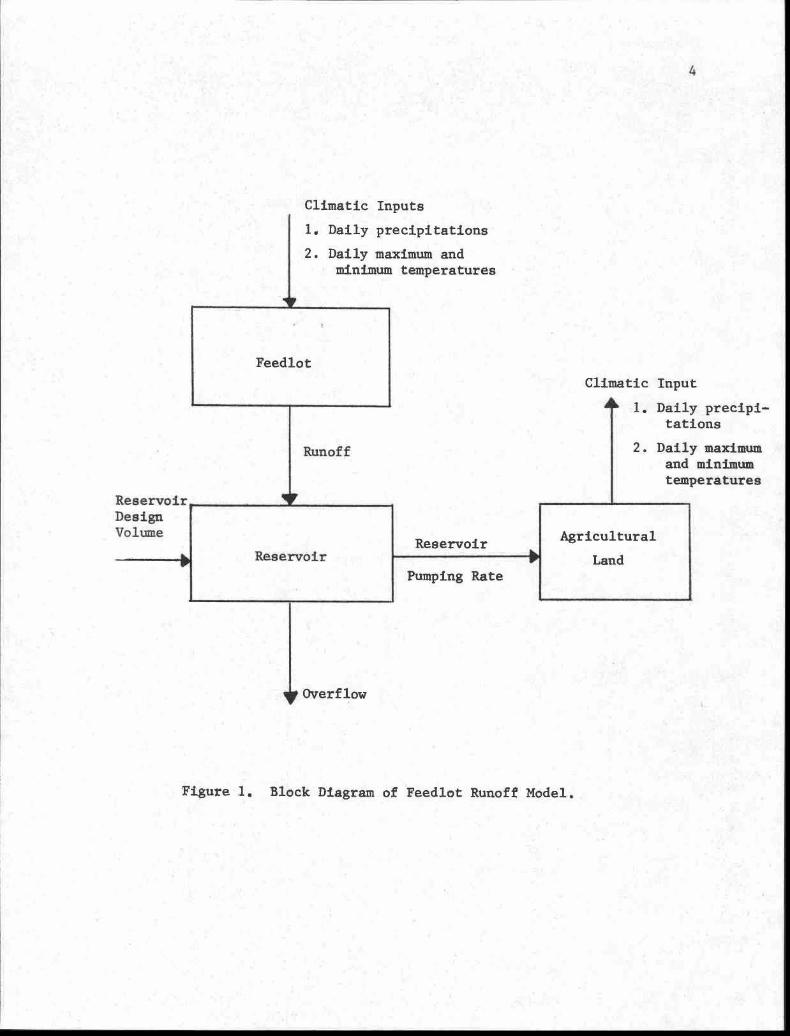
Figure 1 . Block Diagram of Feedlot Runoff Mode l
Figure 2 . Flow Chart of Feedlot Runoff Retentio nReturn Period Design - Model
Figure 3 . Floe Chart of Feedlot Runoff Retentio nSufficient Design Mode l
TABLES
Table 1 . Climatic Attribiites of Selected Orego nFeedlot Location s
Table 2 . Results of Sufficient Modelling Program t oPredict the Retention Pond. Volume Requiredto Prevent All Illegal Discharge from aOne Acre Feedlot at Six Oregon Locations
Table 3 . Average Annual Results of Sufficien tModelling Program
23
27
2'9
3043
Page 4
9
12
1 5
16
II :
TABLES/continued
Table 4 . Feedlot Runoff Return Period Design Model Outputfor Selected Designs at Ontario, Orego n
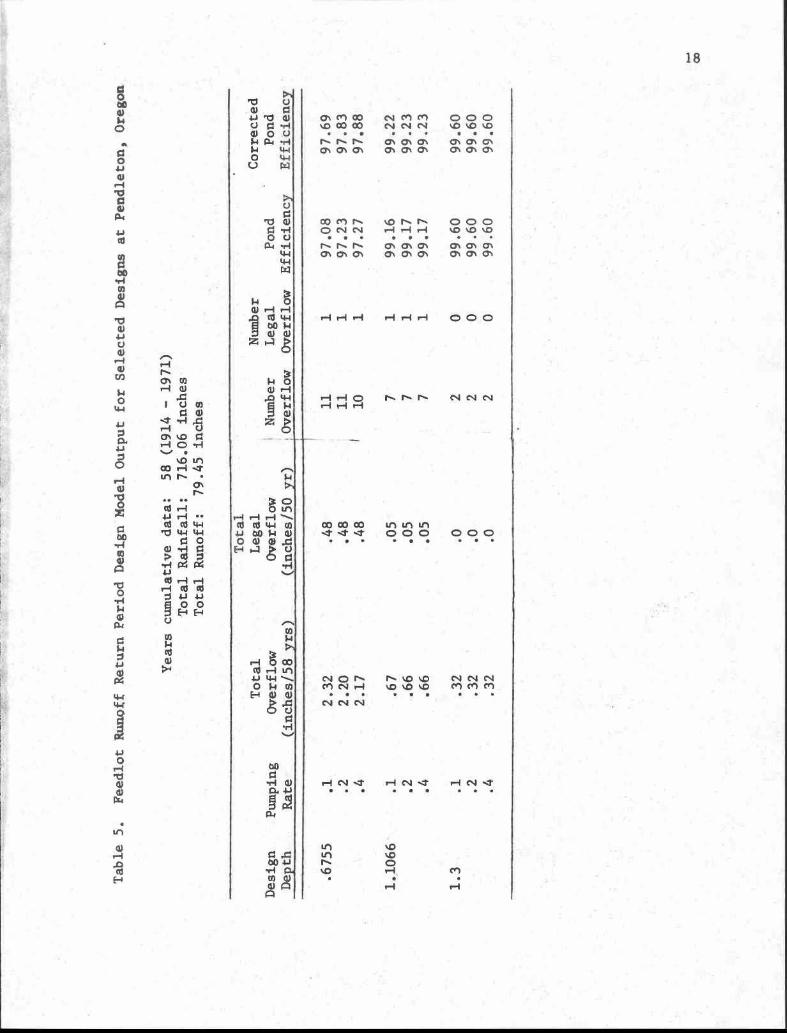
Table 5 . Feedlot Runoff Return Period Design Model Outputfor Selected Designs at Pendleton, Oregon
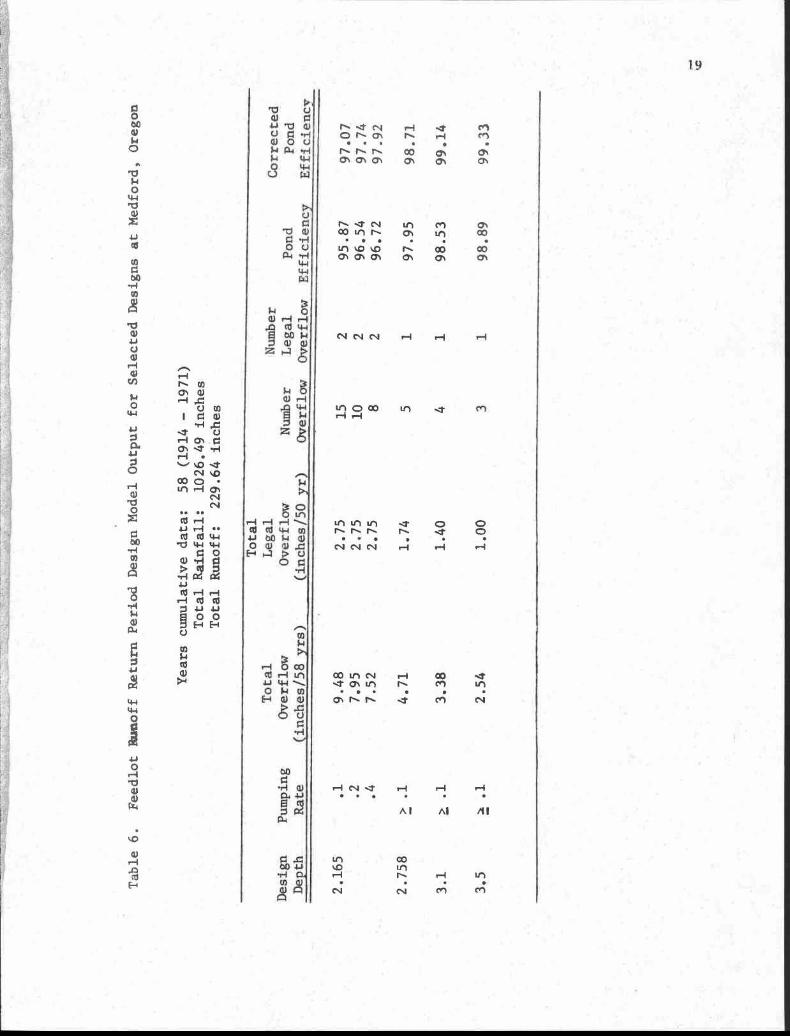
Table 6 . Feedlot Runoff Return Period Design Model Outputfor Selected Designs at Medford, Oregon
Table 7 . Feedlot Runoff Return Period Design Model Outputfor Selected Designs at Corvallis, Orego n
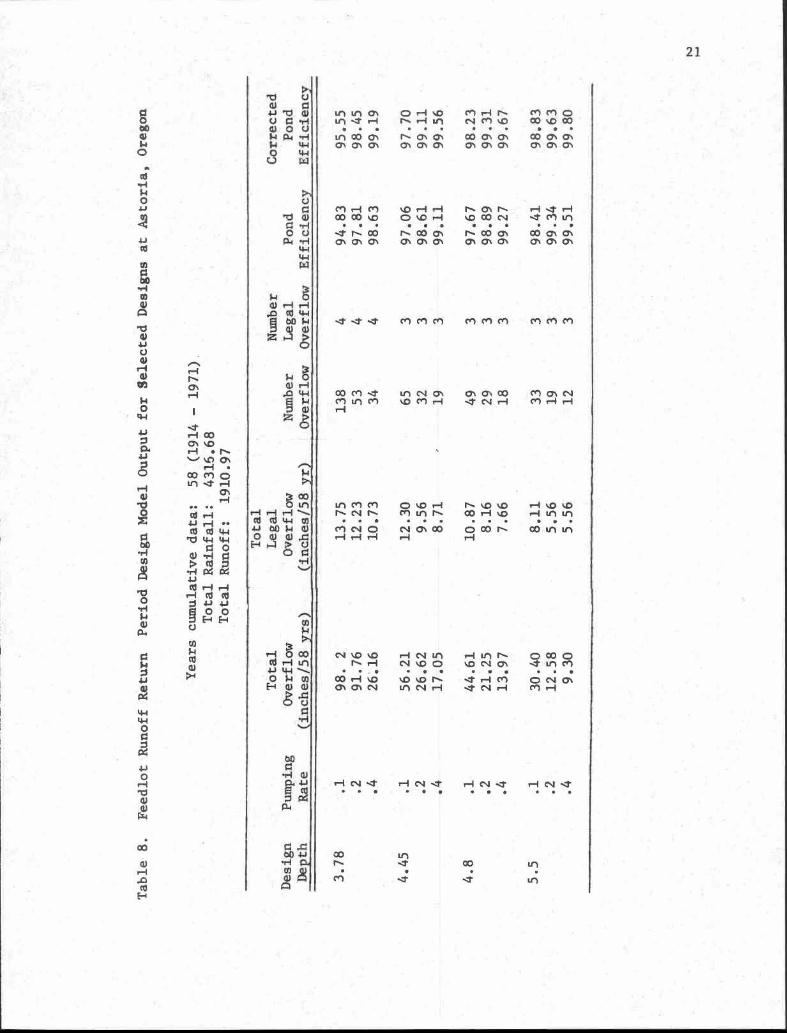
Table 8 . Feedlot Runoff Return Period Design Model Outputfor Selected Designs at Astoria, Orego n
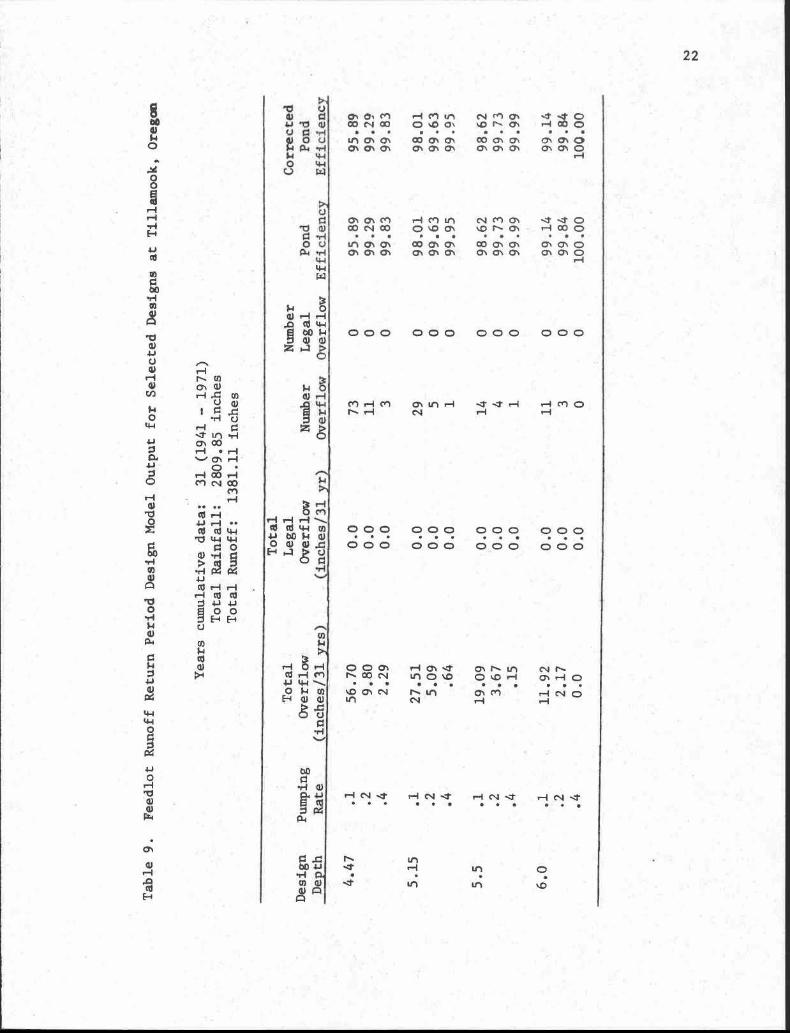
Table 9 . Feedlot Runoff Return Period Design Model Outputfor Selected Designs at Tillamook, Oregon
Table 10 . Statistics on Maximum Precipitation Which Excee d10 Year-24 Hour Recurrence Values at Selecte dOregon Station s
ij
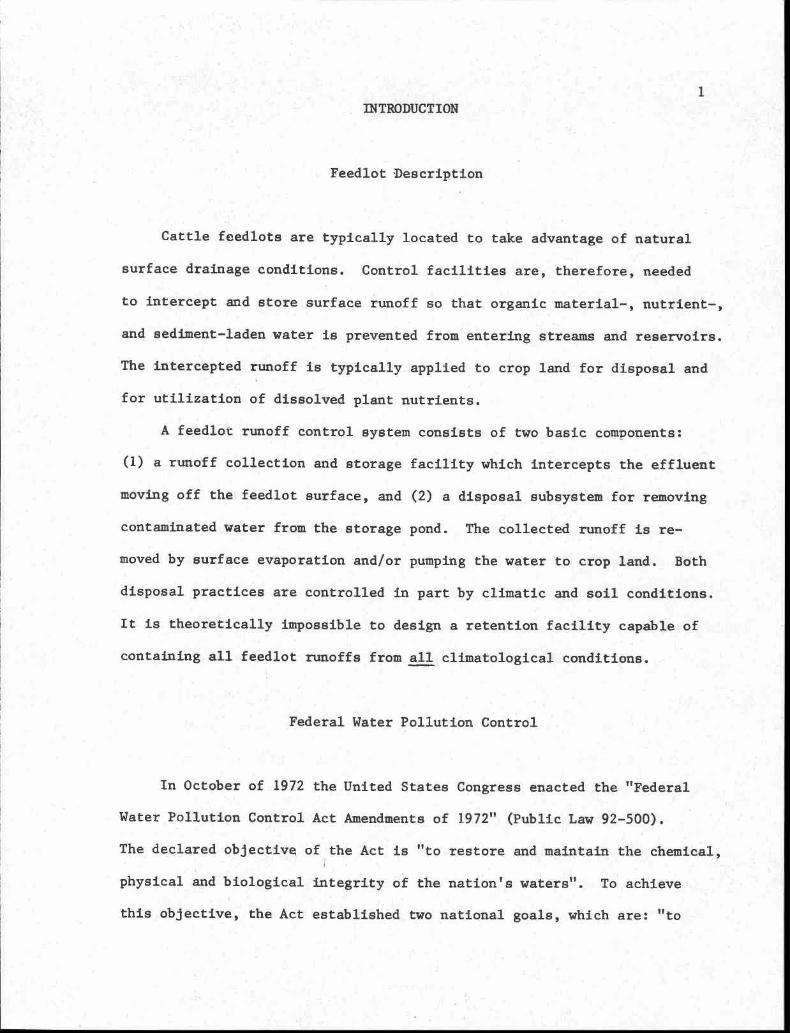
1INTRODUCTION
Feedlot Descriptio n
Cattle feedlots are typically located to take advaftage of natura l
surface drainage conditions . Control facilities are, therefore, neede d
to intercept and store surface runoff so that organic material-, nutrient- ,
and sediment-laden water is prevented from entering streams and reservoirs .
The intercepted runoff is typically applied to crop land-for disposal an d
for utilization of dissolved plant nutrients .
A feedlot runoff control system consists of two basic components :
(1) a runoff collection and storage facility which intercepts the effluent
moving off the feedlot surface, and (2) a disposal subsystem for removin g
contaminated water from the storage pond . The collected runoff is re-
movedby surface evaporation and/or pumping the water to crop land . Both
disposal practices are controlled in part by climatic and soil conditions .
It is theoretically impossible to design a .retention. fay capable of
containing all feedlot runoffs from all 1 climatological_conditions .
Federal Water Pollution Control '
In October of 1972 the United States Congress enacted the "Federa l
Water Pollution Control Act Amendments of 1972" (Public Law 92-500) .
The declared objective of the Act is " td restore and maintain thech,emical ,
physical and biological integrity of the nation's water s" . To achieve
this objective ; the Act established two national goa l 's, which are : "to -
t

1
•-y~=' .
71~
1
.~L . .r, -
I - . i - 1 ~ - ri • .
r
%
. 1
•~
,,A"eliminate , the -discharge of pollutants into navigable waters by 1985" an . ~ I~ ~dt
„ c
Act further prescribes a strategy to encourage research and development J-
+
„L I
.
I
I !
in water. pollution control technology to move the nation toward the 1 ge,
~1 1 , '-
achievement by industries based on the application of effluent limitatiaan.sl
"The best practicable technology currently available by 1977 ahd the bes t
available technology econemically achievable by 1983" .
To perform the inte :im levels of technological achievement through
effluent limitations, the . Act required the Environmental Protection Agenc y
(EPA) to designate specific levels .of effluent, limitations relative to
the best practicable technology and best available technology . As a. re
sult, EPA-prepared effluent guidelines for 27 waste water producing ih-
dustrie-s ; .among the-industries listed was the . feedlot industry .
Because the feedlot industry utilizes large snroofed areas for feed-
ing which are subject to rainfall runoff, special-problems have arisen
in preparing adequate design criteria to meet the overall objectives of
the Act . Since feedlot runoff is a climatically controlled phenomenon ,
EPA has promulgated effluent guidelines which allow discharge from a feed -
lot only in connection with an "unusual rainfall" event . .For 1977, the
criterion is the 10 year-24 hour storm . For 1983, the criterion is th e
25 year-24 . hour storm. This criterion is a . performaijoe. standard and does
not .provide-.e*act design criteria .
"to have water quality that provides for the protection of fisir,'jilkin ; '
fish, and wildlife and for recreation in and on the water by 1983" . The
, .
.5
•Af
. 0
and 4985 goals . This strategy requires interim levels - to-gr!1 -
;

3
OBJECTIVES AND SCOP E
Since the Environmental Protection Agency's effluent guideline s
represent only performance standards, this study was initiated to pursu e
the following objectives :
1. To develop a feedlot runoff reservoir model which compile s
climatic data in a meaningful way so that alternative schemes
of runoff collection and storage can be evaluated as pollution
control measures .
2. To utilize the mode l
a. to evaluate the Environmental Protection Agency's perfor -
mance standards as runoff retention reservoir design cri -
teria in Oregon .
b. to develop minimum design standards for Oregon feedlot run-
off retention reservoirs which satisfy EPA performanc e
standards .
CONSTRUCTION OF THE MODEL
A block diagram of the feedlot runoff model is shown in Figure 1 .
The model simulates a feedlot surface onto which precipitation falls
and runoff results . As the runoff moves off the feedlot surface, it i s
intercepted by a holding pond . The effluent is removed from the reservoir
by pumping to a nearby field for restoration of available storage capacity .
The feedlot runoff model is programmed in standard FORTRAN IV and
models the effects of daily climatological inputs on specific feedlo t
runoff reservoir designs . The model utilizes daily precipitations and
4
Climatic Input s
1. Daily precipitation s
2. Daily maximum andminimum temperatures
ReservoirDesignVolume
Feedlot
Reservoir
Pumping Rate
Climatic Inpu t
1r
1 . Daily precipi -tations
2 . Daily maximumand minlidumtemperature s
Agricultura l
Land
Runoff
Reservoir
.4-
F guru %l . Bl+:scik Diagram . of Feedlot Runoff Model . .
5
average temperatures while operating continuously through the year and
from one year to the next .
The first component of the model determines runoff from the feedlo t
surface . Runoff volumes and holding pond depths are presented on th e
basis of one acre of feedlot surface . The model's output is, therefore ,
not restricted to a specific feedlot size, but directly applicable to
any size feedlot operation by multiplying the output by the feedlot size .
Thus, model output of feedlot reservoir volume (acre-inches) per acres o f
feedlot surface is expressed as a depth (inches) of pond volume per feed -
lot runoff area .
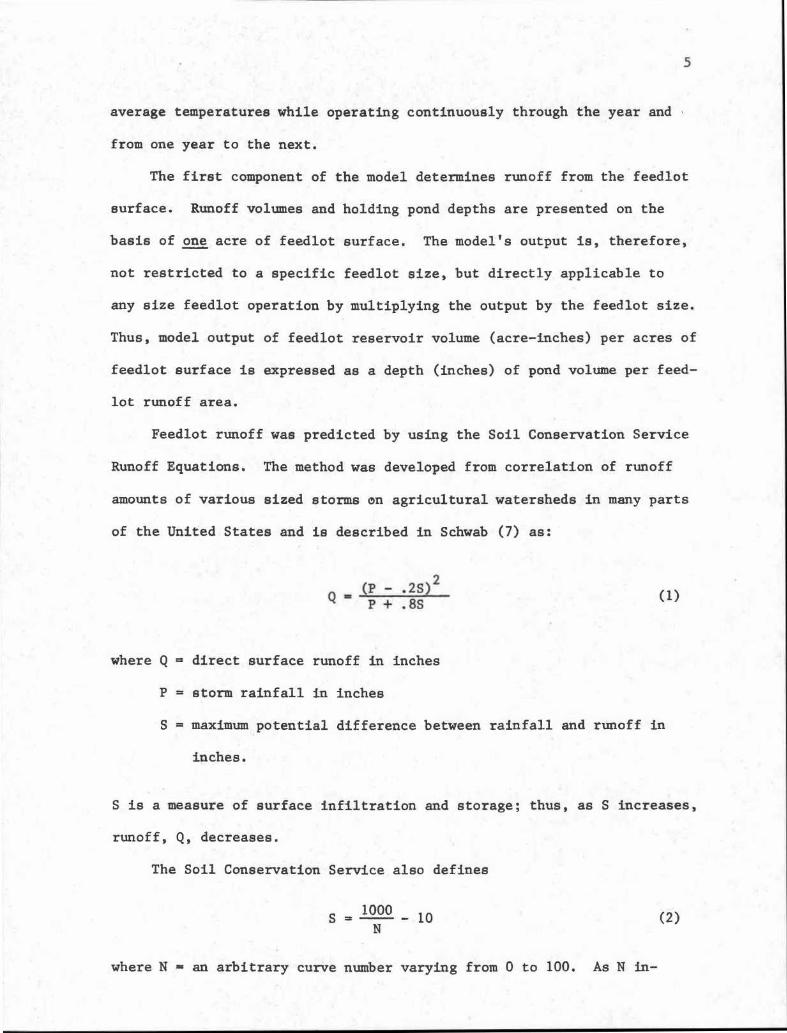
Feedlot runoff was predicted by using the Soil Conservation Service
Runoff Equations . The method was developed from correlation of runof f
amounts of various sized storms on agricultural watersheds in many parts
of the United States and is described in Schwab (7) as :
(P -.2S) 2P + .8S
where Q = direct surface runoff in inche s
P = storm rainfall in inche s
S = maximum potential difference between rainfall and runoff in
inches .
S is a measure of surface infiltration and storage ; thus, as S increases ,
runoff, Q, decreases .
The Soil Conservation Service also define s
S = 1000 - 1 0N
where N = an arbitrary curve number varying from 0 to 100 . As N in-
Q II (1 )
(2)
6
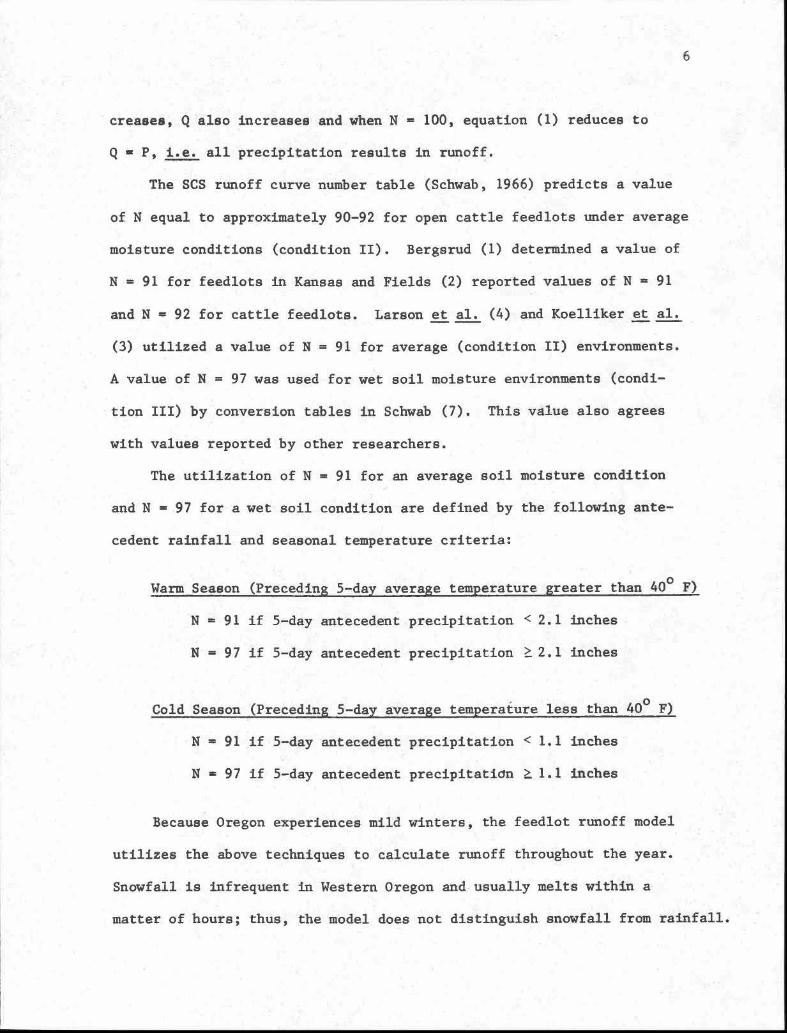
'creases, Q also increases . and when-N"= 100, equation (1) reduces t o
Q - P, i .e . all precipitation results in runoff .
r -The SCS runoff curve number table (Schwab, 1966) predicts a valu e
of N equal to approximately 90-92 for open cattle feedlots under averag e
moisture conditions (condition II) . Bergsrud (1) determined a value o f
N = 91 for feedlots in Kansas and Fields (2) reported values of N = 9 1
and N = 92 for cattle feedlots . Larson et al . (4) and Koelliker et al .
(3) utilized a value of N = 91 for average (condition II) environments .
A value of N,= 97 was used for wet soil moisture environments (condi -
tion III) by conversion tables in Schwab (7) . This value also agrees
with values reported by other researchers .
The utilization of N = 91 for an average soil moisture condition
and N = .97 for a wet soil condition are defined by the :following ante-
cedent rainfall and seasonal temperature criteria :
Warm Season (Preceding 5-day average temperature greater than 40° F)
N = . 91 if 5-day antecedent .precipitation < 2 .1 inches -
N . = 97 if 5-day antecedent precipitation >- 2 .1 inches
Cold Season (Preceding 5-day average temperature less than400 F)
N = 91 if 5-day antecedent precipitation < 1 .1 inches
N = 97 if 5-day antecedent precipitation ? 1 .1 inches
Because Oregon experiences mild winters, the feedlot runoff model
utilizes the above techniques to calculate runoff throughout the year .
Snowfall is infrequent in Western Oregon and-usually melts within a
matter of hours ; thus, the model does not distinguish snowfall from rainfall .
7
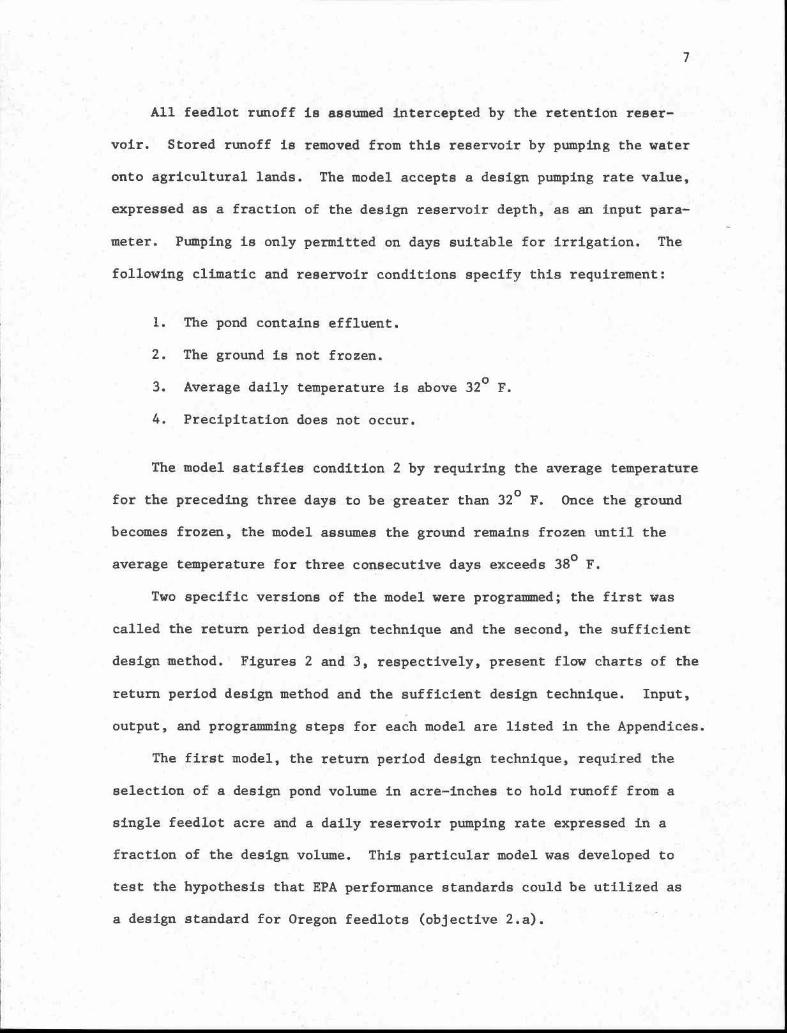
All feedlot runoff is assumed intercepted, by . the retention reser-
voir . Stored runoff is removed from this reservoir by pumping the wate r
onto agricultural lands . The model accepts a design pumping rate value ,
expressed as a fraction of the design reservoir depth , fas an input par a-
meter . Pumping is only permitted on days suitable for .irrigat-ion . The
following climatic and reservoir conditions specify this requirement :
1. The pond contains effluent .
2. The ground is not frozen .
3. Average daily temperature is above 32° F .
4. Precipitation does not occur .
The model satisfies condition 2 by requiring the average temperatur e
for the preceding three days to be greater than 32° F . Once the ground
becomes frozen, the model assumes the ground remains frozen until th e
average temperature for three consecutive days exceeds 38° F .
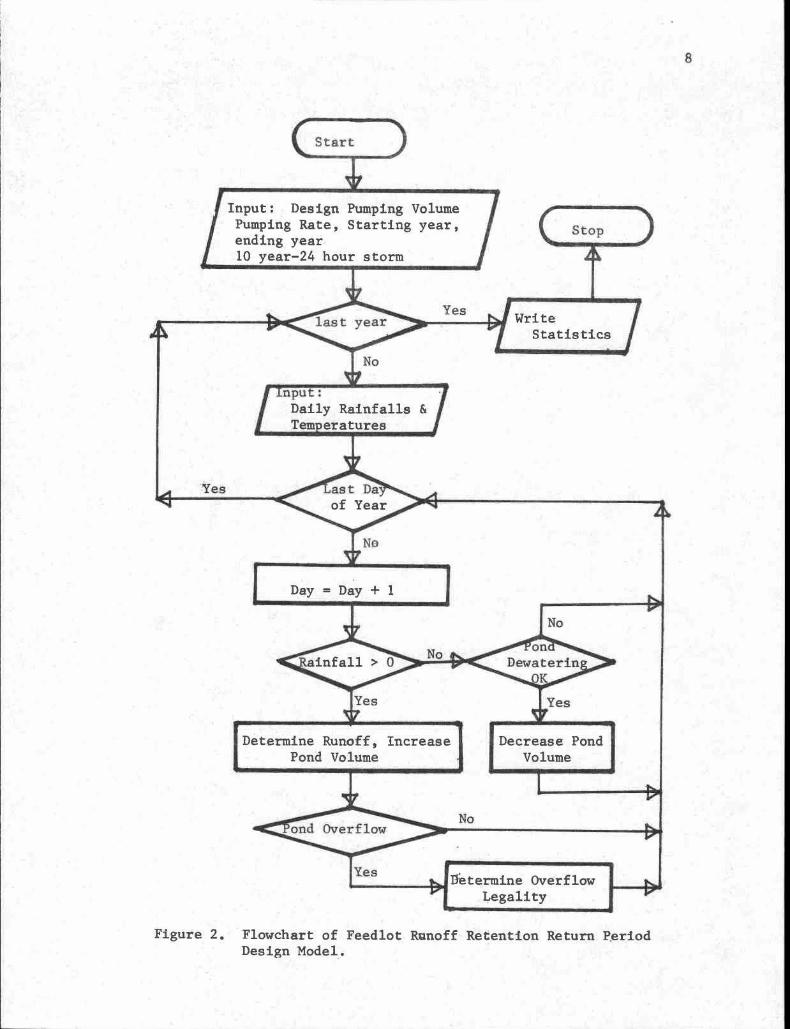
Two specific versions of the model were programmed ; the first wa s
called the return period design technique and the second, the sufficien t
design method . Figures 2 and 3, respectively, present flow charts of th e
return period design method and the sufficient design technique . Input ,
output, and programming steps for each model are listed in the Appendices .
The first model, the return period design technique, required th e
selectibn of a .design pond volume in acre-inches to hold runoff frbm• a
single feedlot acre and a daily reservoir pumping rat e . expressed in a
fraction of the design volume . This particular model was developed to
test the hypothesis that EPA performance standards could be utilized as
a design standard for Oregon feedlots '(objective-2 .a) .
S
Input : Design Pumping VolumePumping Rate, Starting year ,ending year10 year-24 hour storm
WriteStatistics
piguie 2 .• Flowchart of Feedlot,Ranoff Retention Return Perio dDesign Model .
9
Increase Pond Volumeif needed
Figure 3 . Flowchart of Feedlot Runoff Retention Sufficien tDesign Model .
IInput : Design Pumping Rate
Starting Year, Ending year
10 year-24 hour stormStop
L
Write :Pond size
Yes
Determined Overflow

1 0
As the return period model progressed through the daily climati c
data, the selected design reservoir volume would overflow if a chroni c
wet period accumulated more volume than the reservoir capacity or if a
single catastrophic storm exceeded the available reservoir volume . When
a reservoir overflow occurs, the model calculates the following statistics :
1. Amount of overflow
2. Date of overflow
3. Precipitation causing overflow
4. Legality of overflow .
The second and third statistics, when collected for a complete com -
puter run, are used to determine the effects of chronic rainfall condi -
tions on reservoir designs . The fourth statistic, legality of overflow ,
is _determined ' by comparing the precipitation causing overflow to th e
10 year-24 hour rainfall event . The overflow is then recorded as il-
legal if the day's rainfall is less than the 10 year-24 hour value, other -
wise it is declared a legal overflow .
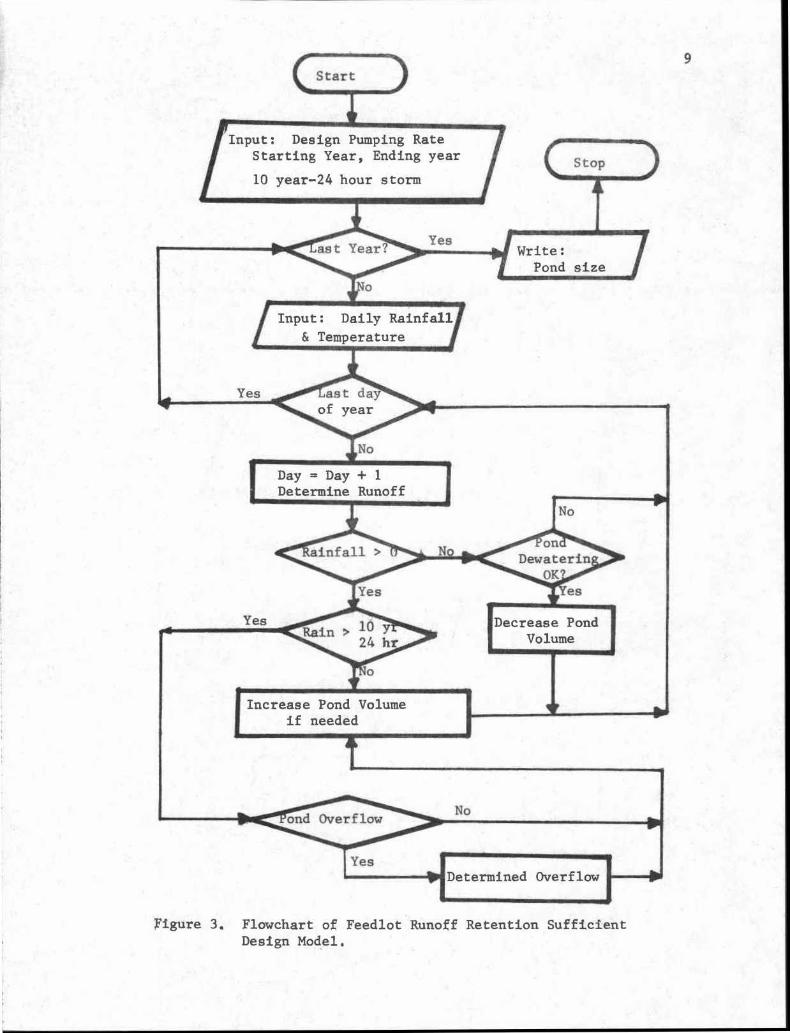
The second model, the sufficient design technique, determined th e
minimum reservoir depth to contain all runoff from precipitation les s
than the 10 year-24 hour storm . This was accomplished by increasing the
minimum depth, whenever the pond was full, to accommodate all runof f
resulting from precipitation less than the 10 year-24 hour storm . Runoff
from precipitation greater than the 10 year-24 hour storm was considere d
legal, overflow . When precipitation exceeding the deSign storm occurred ,
effluent overflow would result only if the reservoir could not contai n
the storm's complete runoff . When overflow occurred, the sufficient
design method:model calculated the following :
1 1
1. Amount of overflow
2. Date of overflow
3. Precipitation causing overflow .
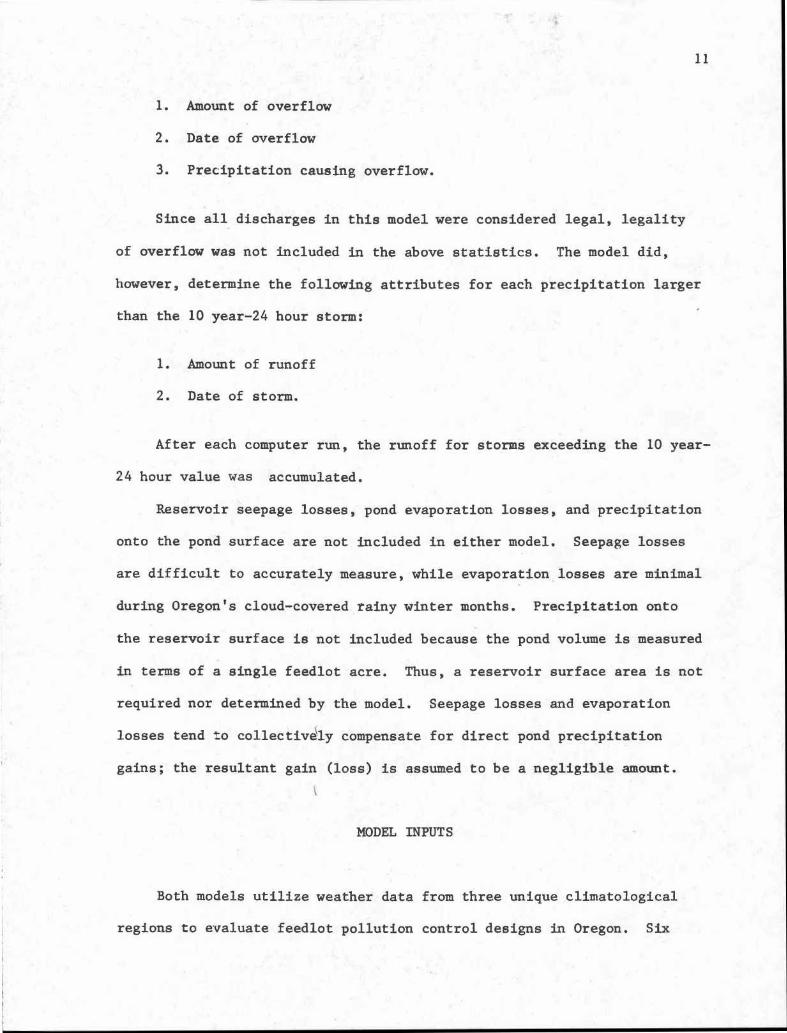
Since all discharges in this model were considered legal, legalit y
of overflow was not included in the above statistics . The model did ,
however, determine the following attributes for each precipitation large r
than the 10 year-24 hour storm :
1. Amount of runof f
2. Date of storm .
After each computer run, the runoff for storms exceeding the 10 year -
24 hour value was accumulated .
Reservoir seepage losses, pond evaporation losses, and precipitatio n
onto the pond surface are not included in either model . Seepage losse s
are difficult to accurately measure, while evaporation losses are minima l
during Oregon's cloud-covered rainy winter months . Precipitation ont o
the reservoir surface is not included because the pond volume is measure d
in terms of a single feedlot acre . Thus, a reservoir surface area is no t
required nor determined by the model . Seepage losses and evaporatio n
losses tend to collective'ly compensate for direct pond precipitatio n
gains ; the resultant gain (loss) is assumed to be a negligible amount .
MODEL INPUT S
Both models utilize weather data from three unique climatologica l
regions to evaluate feedlot pollution control designs in Oregon . Six
12
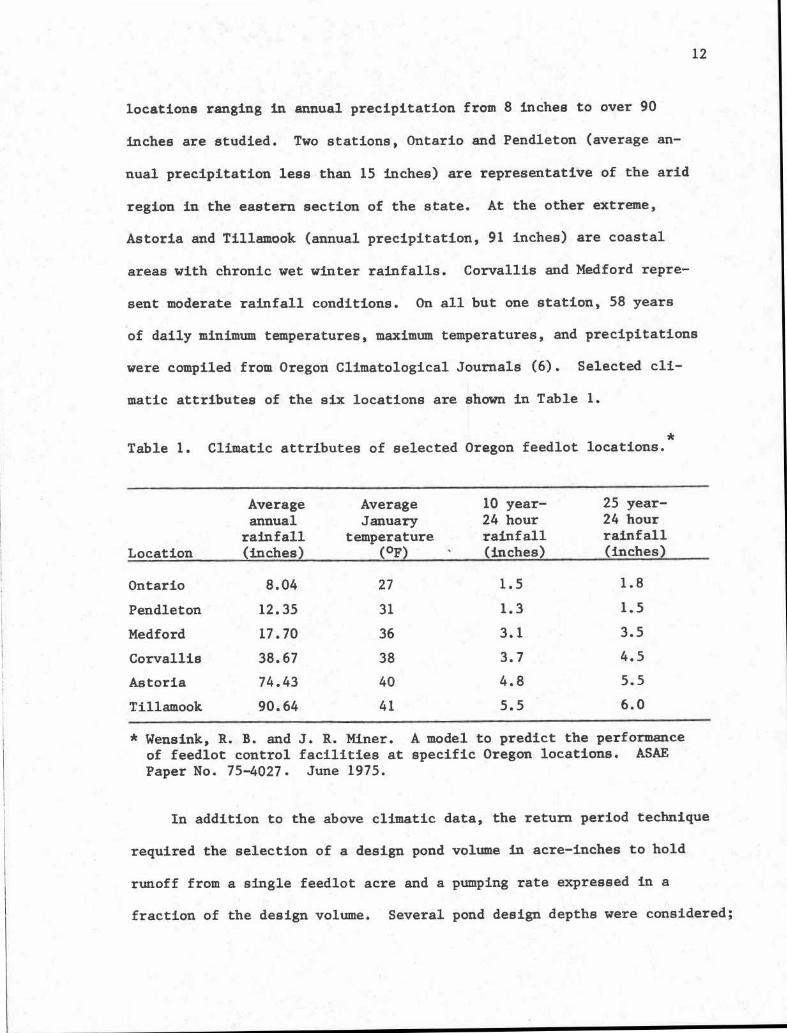
locations ranging in annual precipitation from 8 inches to over 90
inches are studied . Two stations, Ontario and Pendleton (average an-
nual precipitation less than 15 inches) are representative of the arid
region in the eastern section of the state . At the other extreme ,
Astoria and Tillamook (annual precipitation, 91 inches) are coasta l
areas with chronic wet winter rainfalls . Corvallis and Medford repre-
sent moderate rainfall conditions . On all but one station, 58 years
of daily minimum temperatures, maximum temperatures, and precipitation s
were compiled from Oregon Climatological Journals (6) . Selected cli-
matic attributes of the six locations are shown in Table 1 .
i
*.Table 1 . Climatic attributes of selected Oregon feedlot locations .
Location
Averageannual
rainfall(inches)
AverageJanuary
temperature(°F)
10 year-24 hourrainfall(inches)
25 year-24 hourrainfall(inches )
Ontario 8 .04 27 1 .5 1 . 8
Pendleton 12 .35 31 1 .3 1 . 5
Medford 17 .70 36 3 .1 3 . 5
Corvallis 38 .67 38 3 .7 4 . 5
Astoria 74 .43 40 4 .8 5 . 5
Tillamook 90 .64 41 5 .5 6 .0
* Wensink, R . B . and J . R. Miner . A model to predict the performanc eof feedlot control facilities at specific Oregon locations . ASAEPaper No . 75-4027 . June 1975 .
In addition to the above climatic data, the return period technique
required the selection of a design pond volume in acre-inches to hol d
runoff from a single feedlot acre and a pumping rate expressed in a
fraction of the design volume . Several pond design depths were considered ;
{
r
ti
1'3
each depth was associated with some fraction of either the 10 year-24 hou r
storm or the 25 year-24 hour storm . Pumping rates were varied for each
design depth considered . Rates of .1, .2, and .4 of the design reservoir
depth per day were analyzed .
Since the minimum reservoir volume was determined by the sufficien t
design model, the pumping rate could not be directly related to the pon d
depth . Therefore, the 10 year-24 hour recurrence value was utilized a s
a basis for pumping rates . Values of .1, .2, and .4 times the 10 year-
24 hour value were studied at each of the selected locations . '
MODEL OUTPUTS '
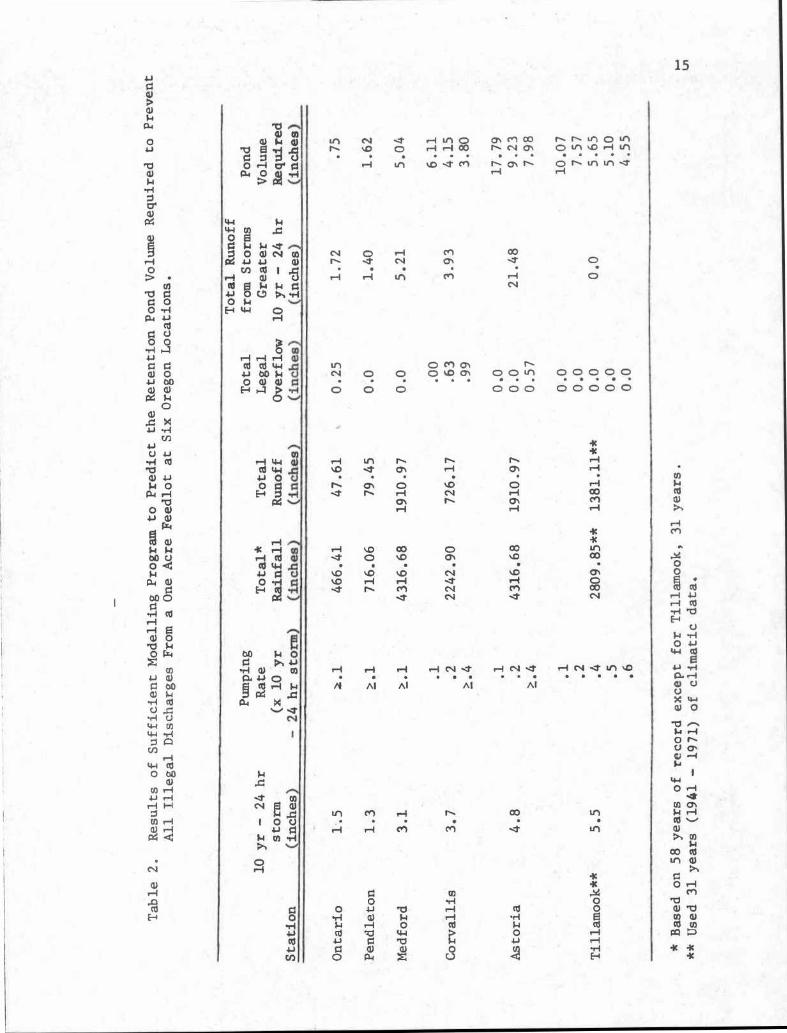
The feedlot runoff sufficient design model was first utilized t o
determine the pond depth required to hold all runoff, except that as-
sociated with storms larger than the 10 year-24 hour value, at each o f
the six locations . In each case, the model progressed through 58 year s
(except Tillamook) of climatic data with pumping rates set at .1, .2, .4 ,
.5, and .6 of the 10 year-24 hour storm . Table 2 shows the followin g
outputs for each of the selected stations : total precipitation, total
runoff, total legal overflow, total runoffs from all storms greater than
the 10 year-24 hour recurrence value, and a pond depth required to contain
•
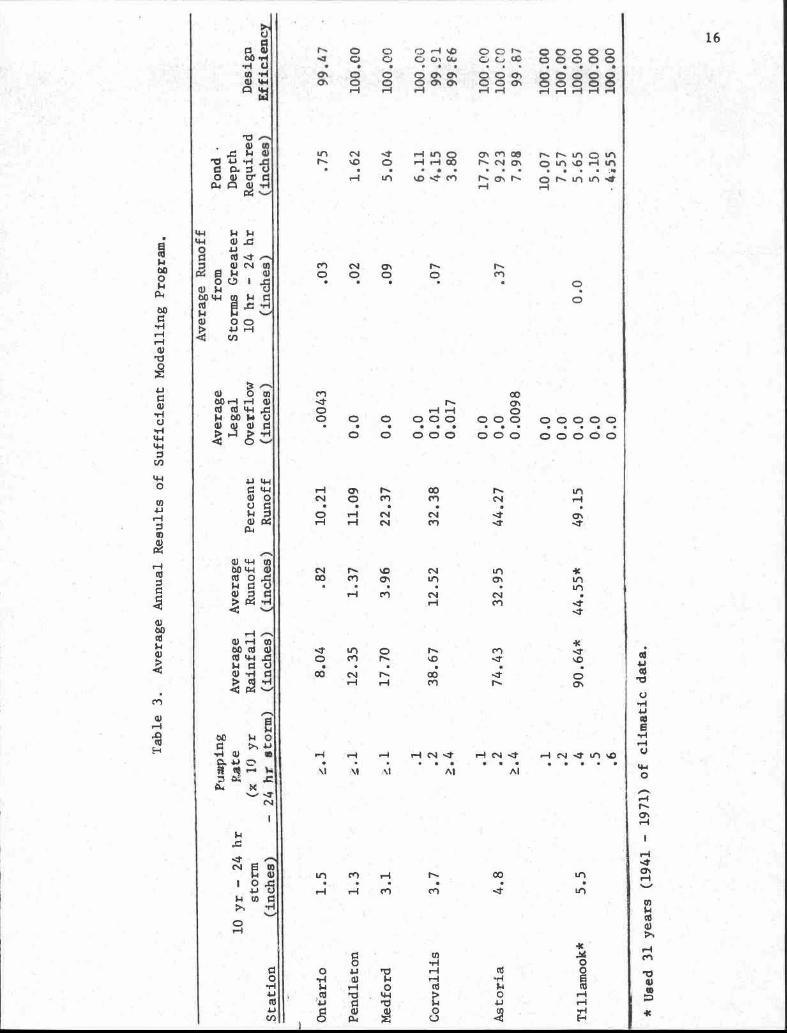
all rainfalls less than the 10 year-24 hour recurrence value . Table 3
is the above model's output expressed in yearly averages .
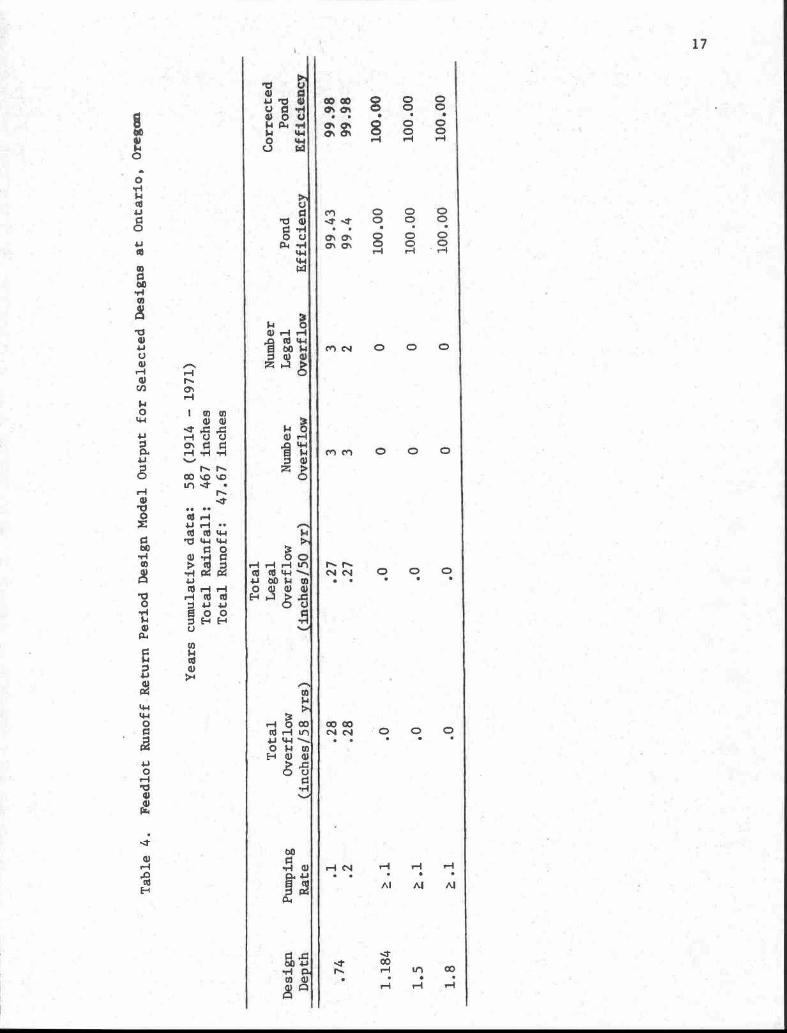
The return period design model was then utilized to evaluate the
specific runoff reservoir designs at each of the six locations . Tables 4
through 9 correspond to Ontario, Pendleton, Medford,_Corva.llis, Astoria,
ti.
.I

14
' L
and Tillamook, respectively . Each table lists the following model out -
put for selected pond designs : total overflow, average annual overflow ,
total legal overflow, average annual legal overflow, number of overflows ,
number of legal overflows, a pond design efficiency, and a corrected pon d
design efficiency . A legal overflow was defined as an overflow resultin g
from precipitation greater than the 10 year-24 hour recurrence storm .
Pond design efficiency was again expressed in the percent of total runof f
contained by the .pond . , The corrected pond &sign efficiency was similarly
determined, ex :ep.t' that all 144l overflow was excluded from the overflow
calculation .
All design volumes considered in this study were associated wit h
either 10 year-24 hour or 25 year-24 hour recurrence interval storm values .
In this manner, the design volumes are directly related to recurrence in-
tervals which are typically utilized for reservoir designs . The follow-
ing four design-volumes expressed in acre-inches per acne were evaluated ..
for each station :
1. A depth equal to the runoff resulting from a 10 yeai=24 hour
storm with N = 91 in the runoff equation .
2. A depth equal to the runoff resulting from .a 10 year-24 hour
storm with N = 97 in the runoff equation .
-
3. A depth equal to the 10 year-24"hour precipitation value .
4. A depth equal to the 25' year=24+' hmur precipitation vague :
Three selected pumping rates of .1, .2, and .4 times the design pond
depth were evaluated fdr each of the above design volumes .
15
0 mri r-I r-I a)td Cd w •044 00 1•+ U0
O g 1
bO
1.4 Oit
D+ 4 . )rI a)
a)4-1Ba 0
'pg04
1<
0H
O•ri4.)cd44rn
n O Inr-i
r-10CO
M CO1\ N 0' r--. r, Ln
UnO to •0 .-1 tor•H --I' C'n na+r'4 0) r, ul ul
N O r4 c~1
r-I
00
H
t~ ~t N O. - Or1 ri rfl M H oN
1-00ul 0000 00 0 0 0 0 O 0 0 0 0 0
O rn H CTi<
Cs- CT 0 0~1 n r-1 N r-I coCT.
1 r-1 r-1
. -I .O 00 0 00i<•ICIn
.t 0 .0 ON .O CO
N rn.0 H r•1 ~t r-1 0~t r\ cr1 N e 00N -7 N
ri r♦ r•1 VV N -t VV N H N .t in .DAl Al Al Al A l
r-I n CO
r-1 c~1 M 7
O O
o 10r b r-I cd4-1H rai O cd 1-r
T1a) a) Uo w
v --tN
.•
k
w cdq bO
a )U) e-4r-ir I I- IU)• HCI) r-l
U)
0
M
$4 Hq Nu rn0) - 4
q•
r 4M
)v
o M orn0 .00-'N
O
0) O W00 r•I r-l Ncd cd 4-114
$4 CJwN WW O
0r-1
N- 0 o r --IvCa oO
®®000 0.7 o o o Q,
•jc 00 e000 0
, o•
o' oair . .
c~ .
,
: -"o~
orn ' 0 10 00\O •%O o0\
o0O g
r~
r-1
r-~1
r--I ri
r-1 ri H r- I H
u1 N .t r•I in p ON M
n N. in 0 InN- %O 0 H r-I 00 N- N O\ 0 tr1 .O r-1 u,r~
▪u1
▪\O - M I- 0 n 0 N. in In -*
r-I '-I
M N O\
N.
1 .0 0 0 0
en 0
0
M
00-
n0
r-l r-I
00 0 0 000 000 0000 0
. .
.
.
.0 0 0 0 0 0 0 0 0 0 0 0 0
ri O\ N.
00
N.
u5
0 M
M
N
1-4
0r-I N
M
.t
ON
N
I- \Q
N
u1
•K00
ON
V1
ON an
u•)
r-I M
N
Nri
M
.t
~t u') 0
N
M
4C0 M00
N I~
CO
-I•
0
ri
rl
M
I-
. ON
i-) N .t
r-1 N d'
.--I N .t u1 VO
\I
AI
AI
u1
M
r-I
1 .
00r--I
r-1
M
M
.1
I
O
•r 1q }J b rl cd$4
rO-I
0
co• a b0 a
0•1-I4-1
uv)
16
1 7
0 0c-o ~r-i r-•~a4P0' ai
co 4a4-) b0 H U)r-I 0
a)
a)
4)4-1 03 Hr7 14-4
El 0 0Ouu)Ha)
H H rl
H
8 0
HW
9
wH
z0
b a
b ual
baa)
U L1 -4al O U14 04 -r-l14 w0 wU
bo
W
U
uU
(14 -r!ww
H Oa) r-I r-I
bO 144
4za (LI
ra ri ri \e0 c0 W ca
J.) 00 14 aloa) wH 0
CO14
ra 3.0 cocd' r-I ►n
4-Io 14 0i
8 4'•r4
4 .i0 b 0
N
NIn. 4-1
12g+
@
u'1
b0 4J-r{
Ea
CDa) a)
A
careJJ -4
'c0 ca.o 4-1
~' au'a r I
r-I asa JO
uH
q a)00
+-1 d O1
•
t. ~t N
r-I
~T
C<101
U iS •r!
O N- a,
N.
r. 1
en~+
4] O U
.
.O
Sr 04 •rl
N. N- r\
00
Oh
a %
w
a, a, a, rn 0%
a,HOW
. b
a1
U`~-+
-
t+"
n- - N
iP)
F
a%co 1.n N
vl
co
N
a 9-1
rnrn%.D
CO•
coo,
~
> a
.LJ N
fr.l
oN N N rI
r-I
a)
Zr7 g
w
al T-1
}.~
r~-I y
O .-i
1 1''W U W O co t/1
M
a
a%-0rio
•~ ,oN ,O
nLf rOi a%
q
NN p•x-'
co r-I
N
o0
+~~ •• 0 GO 9-) m
N-N n
0•
c0 c0 w 4 J GO F-t pS . . .o
11 .0a1 4)
a
H ]
0
N N N r-I
rl
-04
4l
HU
a,
a+
y
+u w-. -rnuNi N-CO
in
q 1-I CO
.
E-~ OS 31
ON N- N- .* N1 Nw8-8W
0ti- Iv
0 tor-1b
4r1 0}
r-1 co.' d'
r-I
r-I
r-Ip,4 )w
a r
Al
Al
n i
C OLf,.H
r-1
n
r♦
N
N F, M

. UU'U g ri N. 0
N-o.,{ Mtn 00tf Maa)) 0 [~ •
I" 03 Q\H at rl 0o ON CTla 44 OT ON Ci a ON O N0 WU W
t)a ■DM ON 0 .0 nas ~O N 0 r-l Cc) V3
Cl rl0 0O4 rl
4 1w
H 0a) I-I r-IA 00 H
v vZ rl 8
w 8a! ~
4aN
za
VD VD VD
.t *4'
CN Ch 0h .Ch 0Eq 00 .t .t .t 000 N NN NN Hr1r♦ rli-1r♦
CO 00 CO
'1 0000 C\ 00 0
C. ON O+ CT 0ON ON ON ON 0
r-1
MMM rI .DON
CO
CO ON
to CO ON
CO OT ON
CO CT ON
CT ONO~ Ch 0' ON 0' ON 01 ON 0' ON 01
ri rl 0-1
r-I r-I ri
04 01 rl
H 0A
q MM 000 .t VD 01 .trl00 N ri M
r i
Clrn
no,aU)a)
a i
c)v
a ,rn
s a04 4
a)
.tJ
8a l
10 0
►+
I
a+
v
H 0t 0. i-I .t r-rn 00 ■D 00 ~D M. .
.
•cn ~D H .t N
CT .t rl ~ rnCh N
NN r-I H H
U)r.+
r♦ CA .1'
HN .t
I-IN .t
0-1 CV:•
•
•
•
•
•
•
~ 1
a .c00 4-f
,•1 cLCl) OS
M M M to 'tn ton N N M M M n n N. to toN NN MMM MMM - .t •
e-N
BUJON Cl)
UI
,•1r-1 0• °•
N00 Nto
20
u-) u-i o,
0 r~ .Otf1 .1 H A
u-t CO
A CT CrNcr,
a. al
MrlA M 0Map
CO <0' 03.
00 ON ON
CO ON ONOL
ON-Ch
N. in
■-•l
1-1
L D 03 h i
M
.
.
.
r-- oo o,
00
oN CT
O~ CT oN
M
'LD r-l r-l r-1M CO OD VD
0 LD r-l
A CO A 03 CYNON ON ON
ON ON Cf.%
-4 .1-
M M M-
M
ON ON CO
C'') CT% CV-4H
M I-Ioo
in csiM' try ol
vo ce) r-I'
r-l
VDCO 1-1 ELI
ri u1 if)Lfl
M
0 LD r-lCNI
IrlM CNI 0 N ON 00
1-1
Hor-
CC)
U-)
I
0 00 0.1-
C'')CNI L D L D HNu1
A I-I
LO 0
Or-ILO LO LD
ON CT CV
u1NrjI
LrlCNI ON
N
-4 MCs) 0-1 cmM r-I
C V - - I -
Cq r-I CNII
esl
(X300
tf1-a-
. ..I
000tv
0
•r4
T
2 2
roa1LJ ',3
O)01CO
0, enN DO
r- M 4 10 6 o
tJ
Ci •r} -00 ON O NON OT ON
11 440
I.s• O'. Ch 01 r-IMU10004 00 0 VO01
4-1u1 o'. cm .0 U 4o. chch
04 •rl ON O'. C'. - Oa ON O\4-1
al 1-i
44W
0'00 000 000 00 0
01 1-1 M
N u'1 r-I
,7 .7-I
'-1M O
n r- I
O O O O O O O O O O O O.0 0 0 0 O O O O O O O 0
04 01 O,•
vt.4O h C0 ' .-4 CO 00CO Ch ON cT O+ 0ON CT
CFN 0
NMO'
.1 0v0 ^0'.
1-400 0
ooo'.rn rnrn 0ON ON ON Ch ON 0
J
r-.to1-4
OOOT r-I c- ON N. u 11, CO . N
u1 0 4:;,
0 .O r-I.
.O ONN
N.L
CT 01u•1
N
r-1
to
NI N 4'
NI CV 4 r-I CV 4
rl N ,.t
.0 Ix)bO iJ
r-I
u1
0a) a) ua)
1
u1
~D
r' .-
c-arn r-I O
•r I a )
a
.^

23
INTERPRETATION OF OUTPU T
The second computer model was called the sufficient design techniqu e
because it calculated the minimum pond volumes required to retain al l
runoff except that attributable to precipitation events in excess of th e
10 year-24 hour storm . Three stations (Pendleton, Medford, and Tillamook )
had design efficiencies of 100 percent (i .e . no overflow) while Ontario
had the lowest average design efficiency of 99 .47 percent . This design
procedure, by its basic premise, satisfied the amended Federal NPDES re-
quirements for 1977 . In addition to holding all runoff from storms les s
than the 10 year-24 hour, the sufficient design technique held 93 .33 per-
cent of runoff from storms greater than the 10 year-24 hour .
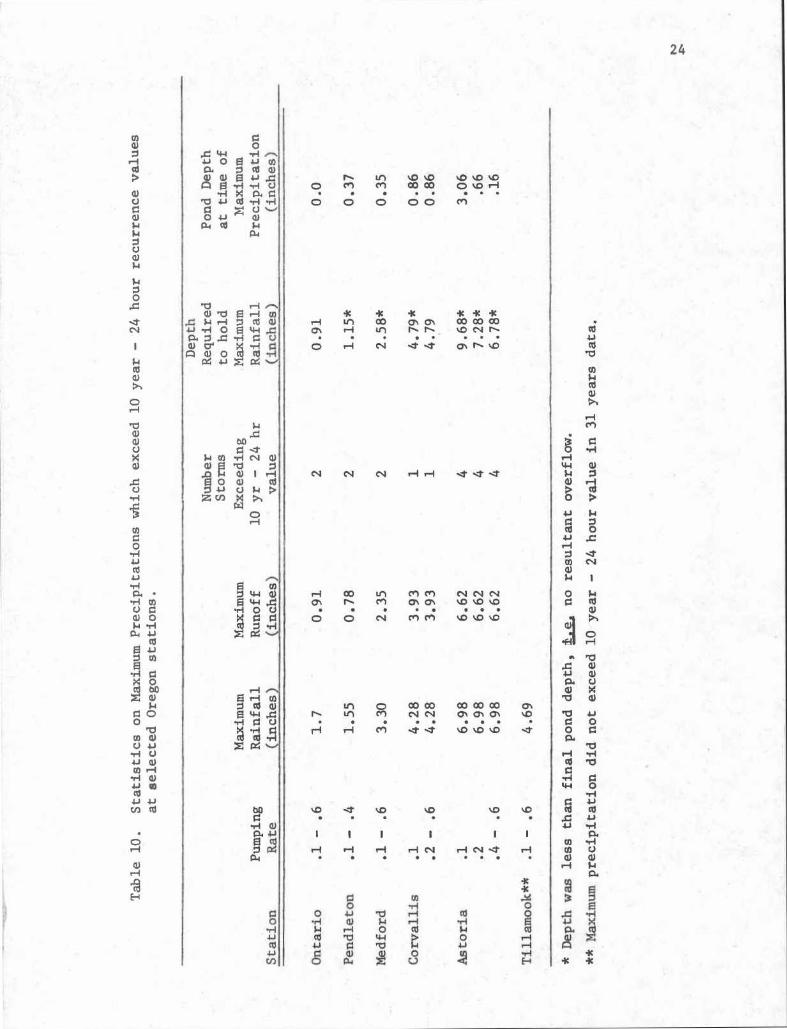
Table 10 shows statistics on the maximum recorded precipitation a t
each station . In all but one case, with pumping rates of .1 times the
10 year-24 hour storm, the depth required to hold the maximum 24 hou r
rainfall's runoff was less than the sufficient design depths in Table 3 .
For example, a depth of 1 .15 inches was required to hold the maximu m
rainfall's runoff at Pendleton, but the sufficient design depth was 1 .6 2
inches . In addition, Astoria needed a depth of 9 .68 inches to hold its
maximum runoff, however, the sufficient depth was 17 .79 inches . These
data indicate that chronic rainfall conditions are the predominant fac-
tors determining acceptable pond designs .
. As pumping rates increased at Corvallis and Astoria, the design ef-
ficiencies decreased . This resulted from smaller required pond depths t o
hold all runoff from storms less than the 10 year-24 hour rainfall ; thus ,
larger leggl overflows occurred .
2 4
~n to .o 'oO c+, m co ao 0 to 4-1
o 0 0 00 ri
is is is is it i sr-I u1 a0 o rn co co coQT ri i11 I- n N r- 01
4J
O 1-1 N -a O, h ..o a)
b
tolacda)
H
M
0•r1
H4-I
a,N N N ri r-{ ~t ■t 1-i
0a,
adO
4a
F+
RI
01 1H0a,
Na,
r-l CO L C*1 f+) N N N 0
ldON N- r1 ON ON \o %o /0 0
cd. . . . .
.
. a,O 0 N M M ~o ~O %O
~n o CO CO1~
lf1
r',
N N
r-1
1-1•
M
- ~t
x+ .3a0
COOT
00 CO■o
b
.dON O~0
C 'O to 0
q -H
C)
•H
-03
1+
r-1
o
sd
> +
u GO 0.4 : 0
0
a,a)u
a)
b
r1 i-,
cu
Era co,.w )-4 ra w to a)
P -H
4-1-1-1 0 u
cu o'
C 4r lA a) o ca
4) Z
0
El r-1 Cl)0 cd a,
rr11 C)U40x y
a
0r 1
ro,J

25
Increasing pumping rates did not influence the sufficient pond dept h
at Ontario, Pendleton, or Medford . These stations, however, have smal l
annual precipitations with minimum chronic influence . When a catastrophi c
storm (above 10 year-24 hour) occurred, the pond was either nearly empty
or pumping was not permitted the previous day so that increasing the pump -
ing rate did not reduce overflow, decrease the sufficient pond depth, o r
improve pond efficiency .
On the other hand, Corvallis, Astoria, and Tillamook did obtain re -
ductions in sufficient pond depths with increased pumping rates . Cor-
vallis and Astoria reached minimum sufficient depths at pumping rates o f
.4 (times the 10 year-24 hour storm) while sufficient depths at Tillamoo k
continued to decrease as the pumping rates were increased . Tillamook ,
with average annual. precipitation of 90 .6 inches, exemplifies the need fo r
appropriate pond volume-pumping rate design . For the sufficient dept h
was reduced from 10 .1 inches to 7 .56 inches to 5 .65 inches with pumping
rates increased from ,1 to .2 to . 4
Tables 4-9 show the first model's results of specific designs a t
the six locations . Cqmparison of the total runoff from all storms in
excess of the 10 year-24 hour storm (column 7 in Table 2) with the total
overflow (column 3) for specific designs in Tables 4-9 produced interest -
ing results . For example, a design of .74 inches depth with a .1 pumping
rate at Ontario (Table 4) had three overflows (two were legal) with a
total overflow of .28 inches . Table 2 shows that the total runoff from
storms greater than the 10 year-24 hour return value was 1 .72 inches .
Thus, even though the total overflow of .28 inches was much less than th e
1 .72 inches, this design was inadequate because an illegal overflow oc-

26
curred . Astoria had 21 .48 inches of runoff from the storms with retur n
periods greater than the 10 year-24 hour return value . A design of 5 . 5
inches depth and .2 pumping rate had only 12 .58 inches of overflow .
However, 16 illegal discharges occurred . In both cases, the total dis-
charge was less than legal, but the designs would be judged inferior by
present Guidelines since illegal pond overflows resulted . These cal-
culations suggest that the present overflow criteria are not optimum
from either an economic or pollution control point of view .
At Ontario, the feedlot model determined a sufficient design depth
of .75 inches to satisfy NPDES Guidelines, while the N = 97 (in runof f
equation) design produced a 58 percent overdesign and the 10 year -
24 hour precipitation design of 1 .5 inches was 100 percent larger than
the sufficient design . At Pendleton, the model determined a sufficien t
design of 1 .62 inches for all pumping rates . The designs based on standar d
storms were again inaccurate, but this time produced insufficient capa-
cities . The N = 97 design had a design depth of 1 .11 inches and the
10 year-24 hour precipitation design depth was 1 .3 inches . The 25 year-
24 hour precipitation design depth of 1 .5 inches was also insufficien t
since this design permitted two illegal discharges .
The sufficient design depth at Corvallis decreased with increasin g
pumping rates . The sufficient design depth decreased from 6 .11 inches
to 4 .15 inches when the pumping rate was increased from .1 to .2 . The
return period design technique was also inconsistent at this station .
For designs of N = 91, N = 97, and the 10 year-24 hour precipitation value ,
all resulted in insufficient design volumes, while the 25 year-24 hou r
'precipitation design was more than adequate .

2 7
At stations where chronic conditions predominate, the return perio d
design method also produced erroneous results . For example, at Astori a
this technique determined insufficient capacities ; the 25 year-24 hour
precipitation design of 5 .5 inches was substantially less than the 9 .2 3
inch sufficiency design with a .2 pumping rate . The 5 .5 design had 1 6
illegal discharges .
In most cases, the 25 year-24 hour storm design value in the return
period technique produced insufficient storage volumes . At one station ,
however, the 25 year-24 hour value provided twice the necessary volume .
Thus, the currently'used return period design technique was inadequate ,
and its design results were unpredictable : On the other hand, the suf -
ficient design technique was much more effective as a design tool . The
sufficient technique minimizes the pond volume required, at a selecte d
pumping rate, to satisfy environmental protection standards .
CONCLUSION S
A computer simulation model has been developed which can be used t o
size feedlot runoff retention basins based upon previous climatologica l
records . The sufficient design method was used to determine the minimum
storage volume required to prevent illegal discharges as defined by the
EPA Effluent Guidelines . This technique demonstrated that to use desig n
procedures based upon a factor times the 10 year-24 hour or the 25 year -
24 hour storm led to designs that were either unreasonably expensive or
which led'to illegal discharges for which ' the livestock producer wa s
subject to monetary penalties .

2 8
The model was used to determine pollution control performance wit h
various combinations of pumping rates and storage facility volumes . In
some locations, the use of high capacity irrigation equipment allowe d
reduction of the storage capacity by over 45 percent when a larger pump-
ing system was specified . In other locations, due to the precipitatio n
pattern, no benefit was obtained by the use of pumping equipment wit h
capacity in excess of 0 .10 (10 year-24 hour storms) .
Utilization of the sufficient design technique requires the compila-
tion of weather data for a unique climatological region under considera-
tion . The model is relatively inexpensive to operate and a complet e
climatological region can be analyzed for less than $20, once the region' s
climatic data are computerized .
r
29
1. Bergsrud, F . G . Annual totals and temporal distribution of cattl efeedlots in Kansas . Unpublished M .S . .Thesis . Kans-as State University- . . ,Manhattan, Kansas . 1968 .
2. Fields, W . J . Hydrplagic and water quality characteristics of bee ffeedlot runoff . Unpublished M .S . Thesis . Kansas State University .Manhattan, Kansas . 1971 .
3. Koelliker, J . K ., H . L . Manges, and R . I . Lipper . Performance o ffeedlot runoff control facilities in Kansas . ASAE Paper No . 74-4012 .June 1974 .
4. Larson, C . L ., L . G . James, P . R. Goodrich, and J . A. Bosch . Per-, formance of feedlot runoff control systems in Minnesota . ASAE Paper
No . 74-4013 . June 1974 .
5. Miner, J . R ., L . R . Fina, J . W . Funk, R. I . Lipper, and G . H . Larson .Storm water runoff from cattle feedlots . pp . 23-27 . In : Managementof farm animal wastes . (Proceedings, National Symposium on AnimalWaste Management) . East Lansing, Michigan . 1966 .
6. Oregon Climatological Data, U . S . Department of Commerce . NationalOceanic and Atmospheric Administration . Environmental Data Service ,1914-1971 .
7. Schwab, G . 0 ., R. K . Frevert, J . W . Edminister, and K . K. Barnes .Soil and water conservation engineering . 2nd Edition . John Wileyand Sons, 1966 .
8. Wensink, R. B . and J . R. Miner . A model to predict the performanc eof feedlot control facilities at specific Oregon locations . ASAEPaper No . 75-4037. .: _Jane 1975 .
t
30
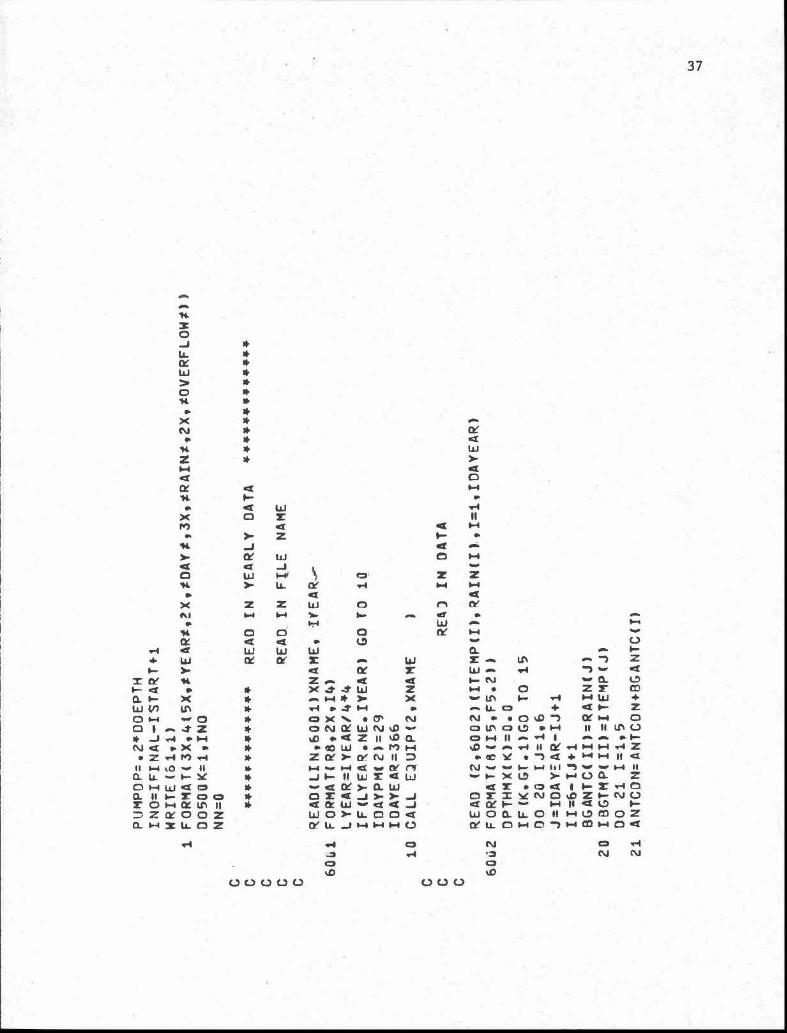
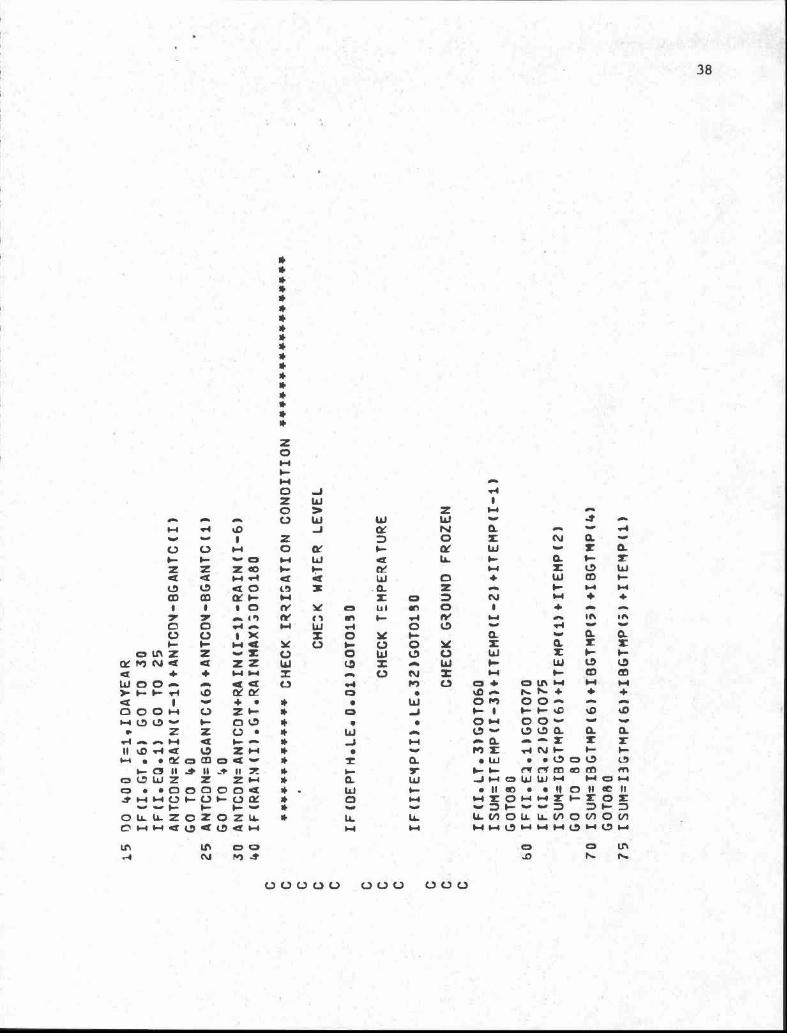
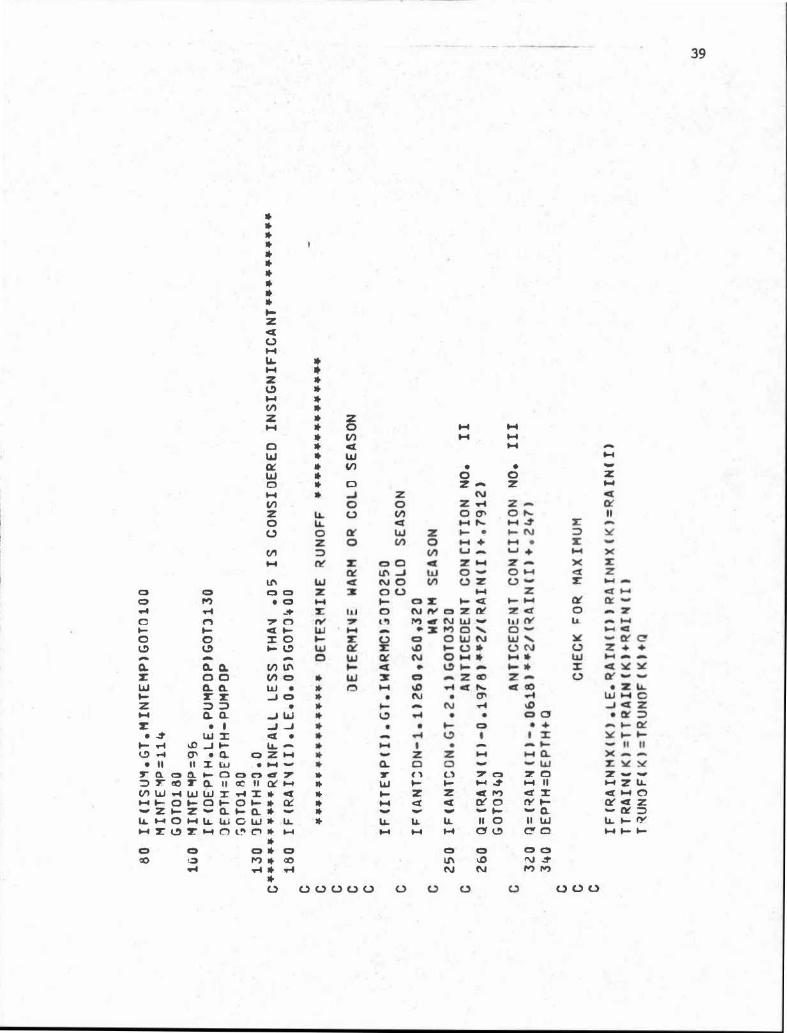
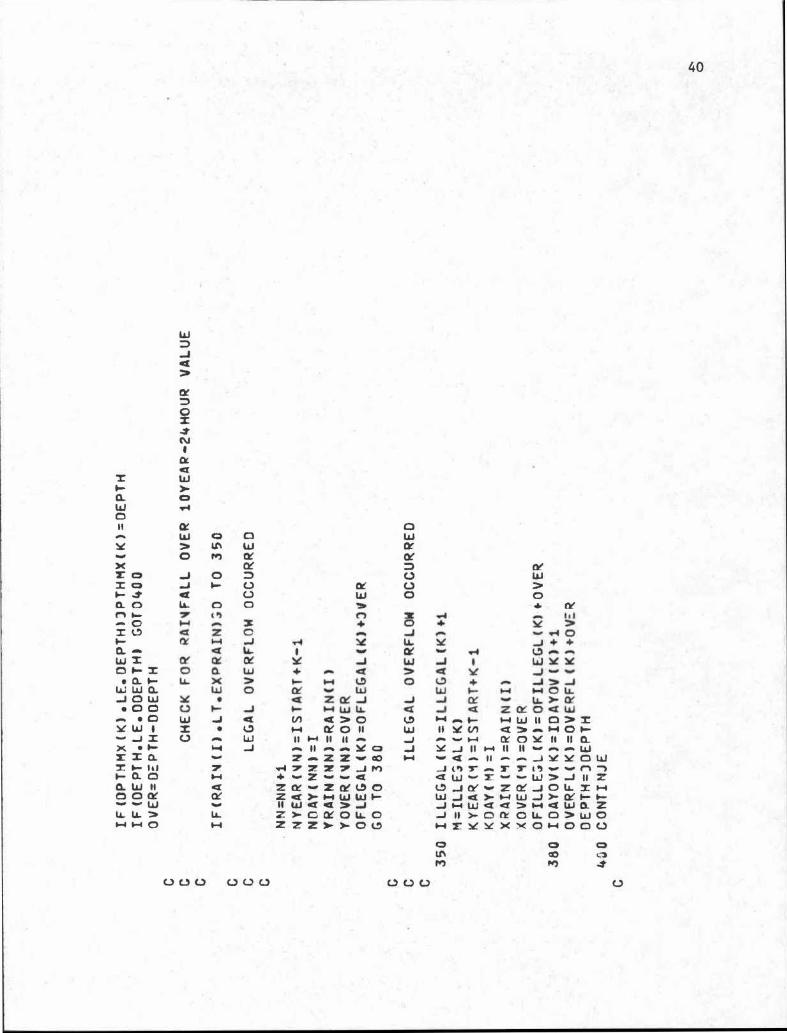
APPENDIX A . 1
Return Period Design Method Simulation
Program Listing and Documentation

wiz 1
: 1 L. -
I- Fir .
•
,, F -
Gnefdl 'Program Inrormatidn
U- 3 1
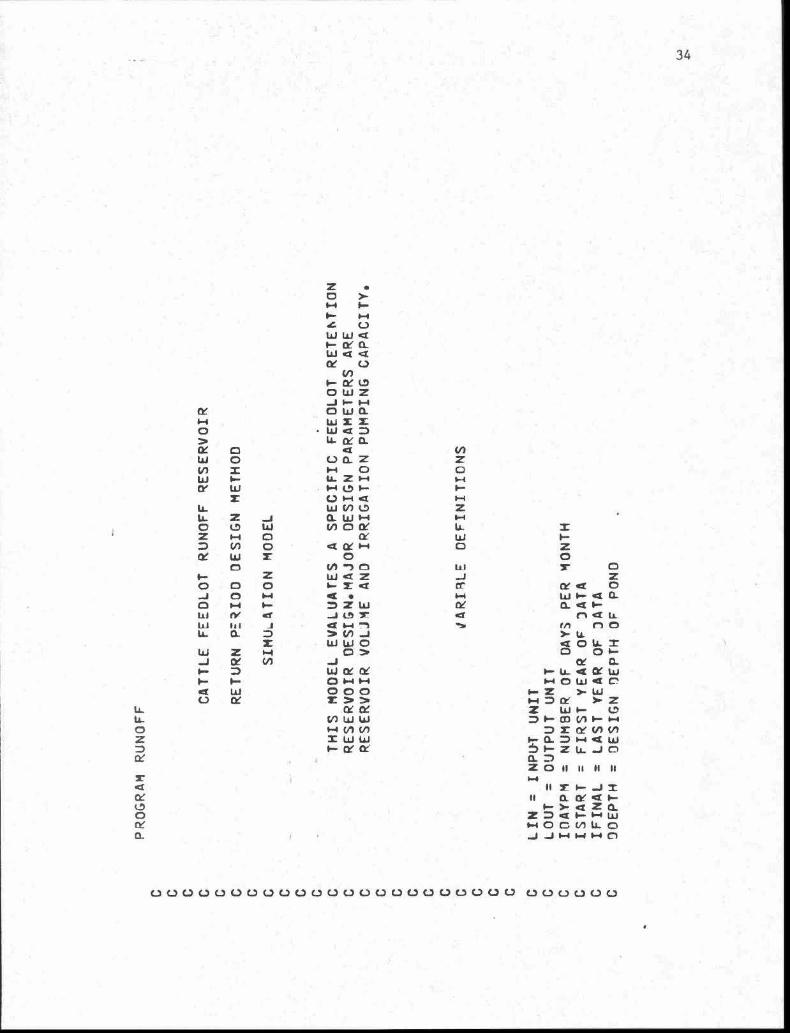
Title : Cattle Feedlot Runoff Reservoir Return Period Design Simulation Model
'Authors : R . B . Wensink and J . R . Miner
Installation : CDC 3300 at Oregon State Universit y
Programming Language : Standard FORTRAN IV
Date Written : Fall 1974
Remarks :
This simulation model operates continuously from one year to th e
next and requires inputs of-daily precipitations and average temperatures .
Major design parameters required . in the model are reservoir volume and
irrigation pumping .capaeiity .
Program' Output :
The output variable 'names are defined in the program .
A . Yearly•Results (for each year simulated)
1. •Total .number of reservoir overflow s
2. Total'numberof Illegal reservoir overflow s
inches legal reservoir overflow
4. Inches-illegal reservci overflow .
5. Inches total reservoir overflo w
6. Maximum reservoir depth
7. Maximum precipitatio n
8. Total rainfal l
9. Total runoff
. _ Ir '
Total run
C
▪ ~[.1 ilr~ M
results
'1
0 .
1. Years simulate d
2. Total rainfal l
'3 . Total reservoir overflow
▪ 4 . Total runof f
5. Average precipitation
6. •Average reservoir overflow
'- 7 . Average runof f
S . Pond efficiency
9 . Correct'I (for legal overflow)
.1
I rr
- .- J
1
▪1 1
,-
pond efficiency
I
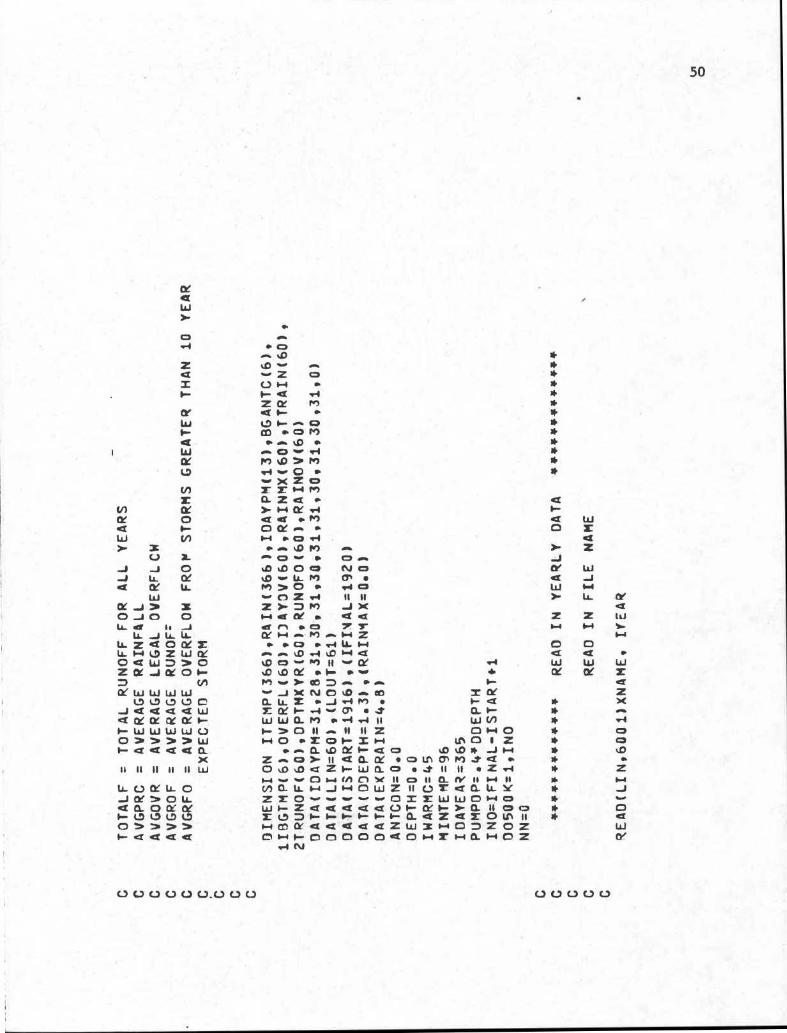
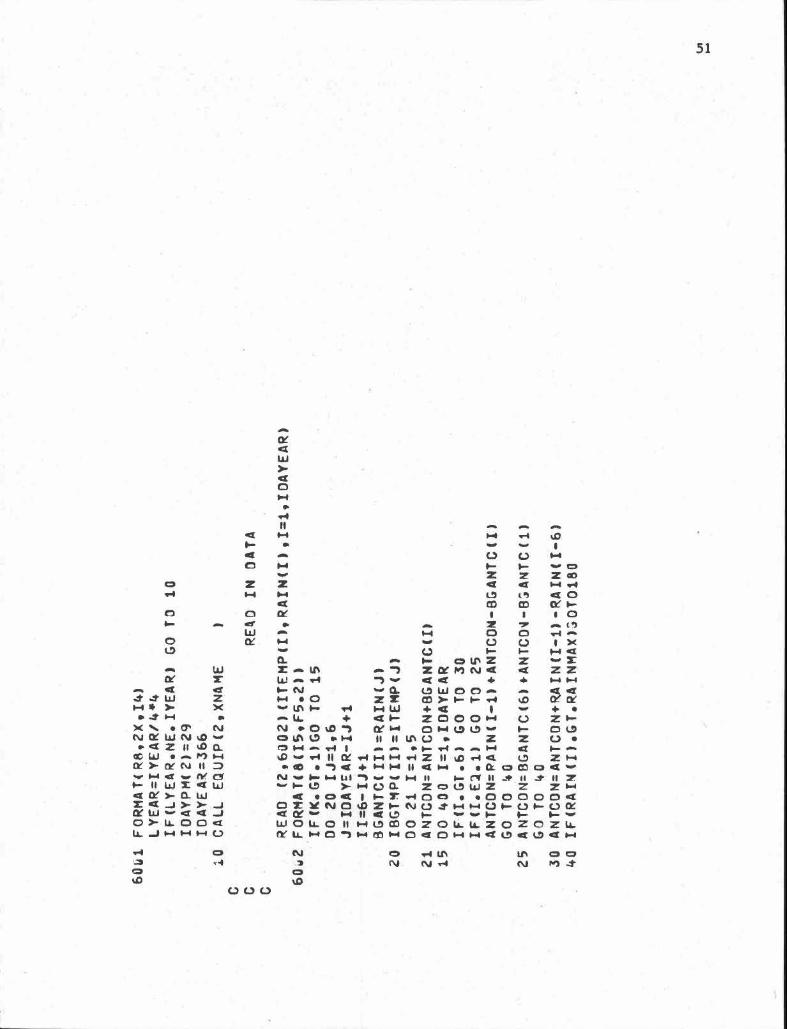
Program Input :
The input variable names are defined in the program . Even though
_
the model was developed and utilized on Oregon State's Time Sharin g
Computer System, the following cards would be required to operate th e
program from a CDC 3300 Batch Processing System .
A . Order of Job Control Language Cards
-
1 .8
JOB CardJ
. 78 FORTRAN, L, R
J
. :
i . A.
7 7.887
- •
8 LOG OFF
1 •
.
▪ r
13
B . ' Preparation of the Data Dec k
r . The data deck consists of file names and years of weathe r
data. Each card contains a file name which. corresponds
to a particular station-year and the corresponding data
year . The format is (R8, 2X, 14) .
In addition, the following DATA statements need to-be de -
fined :
a. ISTART and IFINAL should be set to the first an d
last year, respectively, of the data utilized in a
particular run .
b. LIN and LOUT correspond to computer installatio n
input and output logical unit numbers, respectively .
C . DDEPTH should be set to the design pond volume in
inches (acre-inches/acre) .
d . RAINMAX should be set to 0 .0 unless dewatering is
permitted on . days in which rainfall occurs . If this
condition is desired, set RAINMAX to the maximum leve l
of rainfall at which dewatering is still permitted .
e, EXPRAIN should be set to the stations 10 year-24 hour
recurrence storm .
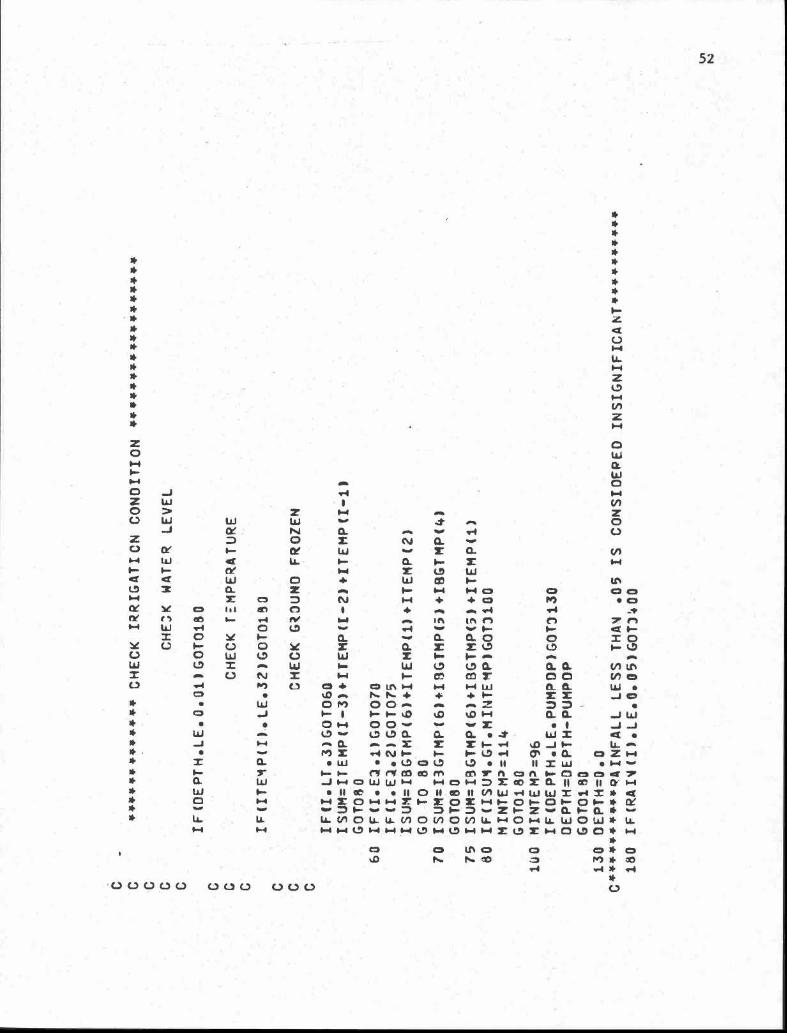
2, The climatic data files must be created prior to running thi s
simulation program . Each file must contain one year of weathe r
data from a particular station . These data consist of rain-
falls and temperatures . Each record contains four consecutive
days of rainfall-temperature data punched in the followin g
format 4(14, F5,2) .
•
I
-
I.
p 1
.I
•' .~
.
f.s .
• r
ZO
- 7
$ 1▪ , I-
, I
I I I
I If
1 1
- 1f .
I
I
I
ti
• 1
. 1
1
W a Q • 1
H
NH Q' V'O W zJ ~- Ho w,IZW S Z w
o w
D> LL cY aW
O0 O a z
F
.I
• LN Z M
oW 1- W ZH HQ~ W H l9 1-- MW
Z C .) H aW
U Z4. .z _l a.W ►-+ HQ •0 w NOW x ti_} z H a W I-a N
Wo a Z
OO z
• OO N")c:$ w O
F- z w
z J z0 0 0 ~-za Z Cl
oJ 0 H 4 • 1-1 aW
aQ a l
n4:1 11Ow
HN
1-••ct
Z W_
J1 -Zd
LLk _e el &-a rn
0U. 0_ > > N .] U.W Z
Z- r-1
W W OO -> .0
01--J lY N J 0.F-d
I -w
Wa Z0 H H0 0 0
1••J0LJa L`z
S•• WU Z Z > H D,
)- ZZ
liJ 1-ac>!W W D I•- 1]]
1- H0 ►-+N O
Z
Nz Z W W
1-Za.Ha W
0Z
Z o o a.' D
11
11
11
I S
4
r
r -1 1
ti
11 F1- J11
0, Z Q1- Y a Z
Z HH000U-J J H $ .4
aw0O
0 0 U 0 0 0 0 0 0 0 D U 0 0 0 0 0 U C] 0 D U U U U U V
wD
wJ‹
O JW 4 4
a
3
WJ
C)
> LYW J
JY J
U. =
S UJ U.
0.'O
0> O= a Z
W S Q WOU. I-1
Wx aZ
0•1
U WW I-1 W Z
N a' a' 4 Oa
C) Z
0 1 4 0 w Ut7C W/-1 O
7Q' Wlr. UZ
UI- H
O4 > W O1-0 2 ZQ I-
4.W
Z Oal-- WJ
>W X01LI-0H 0.0 'O
W >- U-J -OM fY Z C!
I co
LL Z I
0 W
W I-4Iwa'01-0V) UU
W0.
0 W JW> W O IL
D F- Z a a' 9 U. V)0.4 0.'4 U.
D1-- QQW O0a xDO
0
JI-4 II U. W OU
OW Z Q'
a
J0.( I- I- IY J 7 JOZ W W
Q
H
4a'W
0Z 0It00 ►-a d' W
a'
U. Wa
▪ U.0V' a•UI-
» O ZaZ 4W -JWJ W1-O W V) Ax.
N
1-1 W WI-0ILJ QW WO 1.4 H 4►-4Q(
Qi1- )- 7(VJ0 0Z1-O-x0
Z C)I- W
0.1-
W0Li- W0-1-JW7 ZOZQQI
H (V CL? -J -JInd
01.00-10. 00--
W neZ Wt0 OIL. aJ T_ 70.1- 1►10. a a a a W 0. U. 04. 1J (V Z 01 w V) C3 U. w Q 141 11 I C3 V) 0 U. C) UJ N▪ 1 1 1 1 / 1 f) 1 1 1 1 i 1 I•- > Y 11 1 1/) a T) I- 4UaHSO 1-1-140 . a
C-) >sx ZI- J WZ Z WOaOZV)IYO LL.1LI- I a
I-0 Z H >1-1(„ )' I- ?U Z Q'U I.1Q'O a 001- 0JaZ0 0▪ Z . NI-t0U tLa.IL W Z JW m204:W1-4Z 1 1-0. 00ZW ( ' 4000 U. 00ZO U(V (V Z J Z » W~ O Z Z O W Z aZ W SQQLLQI-I(V & Z1- W W>ls Z7 QJ O wOI-1- W OZNW 4.44J
41L(V1-1 0
UJS0. » ' OW 0>-OZ WJW WOOWQ=JI-Q001-13 V) 42 V)W f J
W*MWOK Z[Oa1-1aOHZ ZXWNOO1- V I-10 WCLw0OWZ X>1•-0OI- +a0W~ a WU. ZQ•W JZZI- I- Wa Za0 1-Z a
7 J LAwVf
0a, WI-INV) 1Y ZWZI- I I11
11
O
II 11
2 IL0-4
2>
Z
11 II 0II
11
11
11 O
11 11 I- J II x U 11 Jx
z
11
d N
Z II 11
1-s
1 ') J _Jx0. 1-+Z C_~T4C
II U0. II a>, XJWa ax f a0S7W WO 11 W4 7 00 TUJ0 0ZZ Q' UI- CK > a Zr.ZZI-Z >- = O'JW WHI-1 0Haa ZZ X 0'0. W1. 1el0 1I 4 F- WH .J J0.xZ WI-100ZZ1-QUmV) G M . >, W -JQ' Q' Wa 0-121-10 1-
(W 1-4b.4CY1-4 0000 H
U U U U U U U U U U 0 U U 0 U U U 0 U U 0 0 U 0 0 U
36 '
a
.~
U.►o 0
I-NF-7 3OOON,
_J 3l9U_(D OZ W Z JF-+ W
ILJ
t-0- RJ
Z O Z WH H >
N
ae Jd' 0ac
aa aa a0
( .7 J> WCC W4 N
CY WCe QU>
aY
O JO()Z W Oa
U.JLL WW Z>JZW
1-1 JI-1 U J O>
O 0000_=aa
WZW Z04w°
J
N O N OW
D!S JW0 0 00a
N NW0 LLtY
W WI-U_O! LL ~J 3
W , -J}o 0J 0Jen
and sC3 2 _J 1i. _J
U. c I LL
In
Cl)ZOJ a0 U U.. Ii. >WY WW a a U. U. J U. Z• a' O a C a'I-4 U_ W Z U_ U_• H W Z 0 0U OZOHC'Oa» YW Z W1-+W 1-•I ZaWZMe Oa'
0'0- •0-U- > a C
W d W aU-(,)ac
o WW W Q1-+QF-1W W
J
( .7 l~ (..1 l1J 0 W 0W J a J a a a > W> W
•0
a/- aaceCYW
Z SZ O F- N- 0 I- F- W W W
• Me • Oeq 0 0 0 1- 0 0>>> Z W Z Wa
F- F-
I- H a' c a
H I-- I-+ 0-cc Z a Z
1 1
II II II H II II II II
IY H me Hli
Y yU_ W ZU. ce0U_OCYU-
w
•w0►-10_3_J . JW>0 Wa z a z a a a a o W w wZ (;J
0- 0- 0- LD
> >q 0_ 0-CC'C)00> 0 Oa 0 H1-1•-I-0-ada
-r - wv )[ O pU E 'O •1-Z - rtZ N Ja el a •l7 Ce• W Mww J •w O U. i-..co 0 M•r-1 • w •O pO t0 M-a = l0 w •> $- `~
rla O. Ce w M00 W > •1-1 '
• > 0 rl• w 0 > M
wa O X • • w rl■0 ~p
• w O O P.,D v w O M . o'M
O '.O • O .4O
~D I. .~
II I IZ> ~+ Z M X JNa Z1-4 .
ad P_1 w .H Q l7 T .(Y H w a~ M w Z H
R
~Y •71'31 H( .w a !Li
• r1
1-10 c,
• .► M II OC~O L0 J ^ O • F- v •
a cm %r)
.s-J
WO
roj 0
..t USaU.W~> •J?rl •W W Ja0M • •04 1 1F-
HOZ II a 11 II ZH0 •Y •SO=''-0.I
oi1•w •w O. .0I-Wa OZ wo0+0]- II d' a a' •oUo M0 '.D0Ot7'.Oa Z W I-a o •? 11 1 101 0 1-1 f.'9 t/1 X 11 ca 11 A WVla U_ ` , Wo-4JOHwZ 11 O S aZ 0 (Y .~ •r •. 0= 7 W WW 1- Z W a a a cc C,,) F- W r -7UO W1--F-'►-t►-aa Z aHMCY>rZaaaQ Zw3 F-i -O00-4I- .)t •0000a0•H r' Hc ..M?
L
U 0 0 0 CU U O 0 CD O Q O O D U O O
4
r!i ' 1
y4
O1.-
..t .4
O
N
O . i
.4
N No
da0
~D0 0 0 0 0
000
**
* I**************
Z0H6-s-40
JZ
WO
? Z~. .. .. U
W W W1-1 r1 i.D J Q Nv -.- 1 Z . OC) C.) N O- 1- V 0 6-4
W d Ls
a Za Z 1>DH rl
~-
Nd
a w 0lD l9 d 0 co G. Zm m Q' 1- N Z O 71 1 / O N
Y o U 1 e O7 .. 17 4W
1 en F- ,1 N0 0 . 1-1
U.1 ri 0 01- F H 0 1O-
NC0 0col11Z Z -Z U 0 W 0 U
CeMNa d ZZ W U' WQ
+ + H 1-4 _ .. U N ZWOO .. . ., as V M U)- 1-- F- .-1 0 •Q +
• * • W000H U Z1 - * J
* • •Z Z 0 • * W ..
* J H11
%.D .-ICr U' ZH * • +* a .
'
1- © 11 -44 11 II 7_e * 1- scUwz Z Z -4 * a w
• . 0 0 0 o o a * w r-~F41-1(., 1-05- 0Oe
- -- 1- 1-OLL.LL•ZOZOZLL. * U. la.0 1-1H'd0 Q(7QH Id H -
to o.•4 N
Q0000 UU '0' UUC)
J 1-1 o W W 1-+
h•1
1-1
. U m . • 1'1 0 11 ec 11
W~ OLL. U..V O00 VfH 1.4 1 H H 1-4 1.9 0-1 0 H
.m
en '1!
1V.
^'4
1-J ^" -td `r r 1Z N !3: ..W T 0-►- 0. H 11'H Z 0 111.+ w m '-
1- 1.4 wN 4-4 + 4
41 + ..
. 1N Sri.. '4 -. . ..0- v
aQZ
W Z H F-F W CD 01-0 ►- !D M
O 4 O it ►-1 H 1.4:D .~ r - P. + + +
O M 0 0^ ~-F-
1 !- 1-0 1.4 0 0 -~ -r +0 0 0 0. a d.• O. •- Z ZM Z .~ N H f- 1-. w .
. V' O1 .7 C9r- rw 4-1 on ao m m
, 1
39
UHU.
*H
*Z
*CD
*1-4
*N
*Z
* Z1-4
*
O* V )
O
* dW
* Wa
* NW
*1 * oH
* JN
0Z
U. VOU O a'
z 0a Z
U1
W 40
0
0 o Z ZM
• O H.-1
•-1
t
T
Is 1O
A
7 [A NI -
1-
Q 0-
W
F-1o
0
T O ►- r
.+
.~
.. 0 WO.
O. a
cn U'N
r•-Y
O 0
H co * WW
a s
w . * 01-
ST
JO *Z
. *1 .4
a s
J W *. 1
J J *• ? W Q . *
1- 0-1
%D J 1•-
lL .+
*l7 -.+
O-' . 4
O Z 1-4
*• II If Z W •tilt' *
• aoaoo0Q~ *7D T a0 T d 11 cc 11 a 0--1
*N W .-IW W T .-1r* Q *1-+ F- O 1- O 1- 0 1- * IY *
Z 1- Z Q. 1- O. *
*U. I.4 0 -I Us. W G W* U
*14 2 0 2 I-4 f c!1 n * 1-+
*0
0
0 *to
or,.~
.4* .4*C.)
000.,C,C3
1. 1
HH N
H
Z0In
W Zfn 0
V)o OU'+ J WN O N C.) ZO U
1-11- o
1- QO NI fa2 a
Z1- F-+Z d
17 M d N W
111 az►I0 N. 0
0
OWN W .Y
.O I-U11
C) Na N O 1-1 *
1-1 *Q
• .
L
r+
1- *2 a
z co 7
• 44O OZ ~+ Z
NZ . 1 Z ~-
O I~
H•
N1-1 •u +
Z0 1-1U
4 at] ♦2 U.o .1 W C.1 '.G J
Z• O O . ao • + 1- ck1 1 S I-
.. II
I Ir-1 1-1 a+- Z
X-- WV ?O Z v ..1 .4 S 1-1 11 H Z U-Q d .C( w OCYO IY 1-v 1~- r ' d Via :II O II W U. 1- N
CJ c., C' C1 HI-4-
0DN
co 0NM M
o o U V U o U
o Q+H tiI- •H +L1 .2 1.-Io ..-
ZH
aF I
SO Y
o
0U1N
4 .
W
r1OI ,
~•
W o OY
LA W0 M R'
X
L
Z o J 0X
J s- 0I'-d
0
Wa co
U.
0n +•
7 1
X
+= C7
d Z C
..1-
N J
.4
YQ -
d L~
1
+W=
R' • CY
Y
J0 1- T 0 O. W
+ .+ d•G. F- Li X > ►- H l9W W O.
W 0
W..JOW
•
Z J• 0 0 0 I- J I.- 1--F W l1.~. •O W J Q
Vf
> OW I
X
• Li
ra CY 0 I I0-- J=
0
•+
W
11 1-0 II II -•X •1-
H J
- 11 oft Aft Y OZI0.
..
2 Z Z+co
0W
O Qf0 W00 0
4.
W
0 + j
1>J r. ++ v4 0U. J+ +p~ ".' r1 L.S .~ .~W J 1 WNC NC> Q Y .j0 t~ + .+ JW 1- H 44 O LiJ J C U.Y1Yd J 4 Z LY 0 d Wl! ~• .+H 1-1 W II O> SW II
NC VI d .. I-I 0 -J • .' -F tY 0 Y II I
aJ Y J II 0-1 II II ++ -- Wr-+ `a- 11 -- .-.JYYO W
T
W30-Fa
o _ .
►-I i l
7
' 4 7 7 Z 7 -J M
J (' T ~. ' v- l7 v n1-a 0
h4
+ .. z++•+Q
W0+, •-W >J II 2CL W II
ZD -ZCY L.90
V' JQY ~ ZQ~JOL . X 1- 4OOZY
ZQ1-1WWI-
W ,Jd ~•-+W J>-LYI- -+~W
•11 WQ>J
JNWd~~-1Q WCI_ ZIL. U-
U.
Z>GCe 0La- 0
J 1 1 > i -
0U. D>W 01-+u-FO
H
Z ZZ>>-0l?
I-IZNC X0H00 0
4
, coLA
CDM
000 C)UC)
0 0 V
41
N
I1
•
•
4.0
X
U-.. N .. •• ZN Z N
• •
• •
..4 D
.-1 N
11 IL
11
•Z • Z%D
• X
• LL
N
•• Z XNQ H (r •W • W M> X >O N 0 •X • ).. X
.t
• N44.144
• Z .tV1
`~ XI-
Z l!' Z •J
141%. H XO
Q .t G IAN
Q' • Q' vW
X X Y -t
- • on XW
Z N. Z1- > x )1-1
4
4 •0
0 0 0 flW
NC J Z z• U. • O
eV'PV'W
I W Z U-14-
w > v (YZ
CC 0 Q WI . 1
.-i4
N 4
-tWJ?WO
..'')Y 4 Y
' .r
0 ]C l9 O Z J
•0 a0
1---WI- a ..
Z z
-J
'• V' N
WW ~►O40 JO0 W'- 01 4I-I- Y0 0 ►-40 oJduO + X0- 1H
•~ - .4 ' •• .1 *I% 1-1 • 1-4
11 11 11 1W
a 40 • rJ JD • O 44 1
. . . 4DQ • •X • •Xa II W 1-1 H MI.D0' .1aC 0 .4
W 1-I41 .I0,4 0-4 11 WW W to v u l %el v Z W+ •+ •-- N '1J •~I- a- ->-'--400-
7.J W G Z W 4 tr. 4 1 1- f W e-$II H4 -J
-MIDI QIDQ Zta_ W O Il_ Q O G O 11 1-'1 0 0 0 O
''5
U. I.4 3 11-. 0 0
I-4
►-1 ►- 0
• v •
N-0HOa
46 U. * 4-4J ..Q JF- 40-0 4 0• A 0HH r N. J3r J v 0 I -Z-1
U-
11-111.190
.1 O4WUJZ
* J▪ D W J 0 0 0 O 0 4• 0->ILQ'ZZZJ1-• I-001-1-4 04 1-4 0▪ + + + + \\\1-F-• W OJU-M0LL 0▪ 0JJ J JJJ1- 1• Z a 0 Q Q 4 1 0• H H F- W 1- I- 1-- 1- Q O• •00J0000O4+▪ 41 F- 1- 1- I-- I- F- I- .4 1 1▪ 11 II II II 11 11 II 11 11 li▪ HQ'0 J1a.UWU. U. W• - J J0_ > 0 W 0▪ trQa19a 0Q' 0 Z1111-1- W 1-000 Z 0
0 0 J 0>>> O a0 1- I- 0- 1- 42 4x 44I CL C..)
%D O 111 0• 7 .-1
7 N.-I .
.-4 .tJD
o Cllf1
:LetU U U
42
0 •
X
Q!
•
M
x
•
. •
O
M
K
.. N
(~
•
3
7 •
K
O •
r • a3
d \
J K
J U-
• \
:3
z
o en,
z
Q' H
W X
G /-•1
H
4d Q
J N
Q. •
X
J
•
(.
K
Q O M
H N
O
t
14 •
L1.
•
Q H
K
• X
O ap
w K
•
X %D
•
IL.
la .
•
X
u •
w 0. •
J X
K
") '7X
Q co
w
K Z
•.. -t
F-
•
K
(/) H
J LL. •
O CO
.J
S d
0N
1--• ►-1• Q O Q~ O Z • w •
K F-
J 'K
W D ao
o r4
J O
IL' •
.J U-
J V)Q
ce x
W N w
d
W .D
O• X
F- Q
W •
>••
w a %)
O W
J Z
O K
.• • •
h- )-
J H
.=
7 v N
•
H K
• F-
Z .
IY• x(~ JHCD, - J O. X v.+ LD dQIL U.
OM
•o
l9 d' •
N
Z • .+ 14 '14
W F- x
o W
K K K N •
J F-•'D
F-.0 _1 ...;
x
J . •
• H
x 6 ,)U
Ha d
J F-
(. I-
J •
•)1-1
Q
V) \
•W O u- K
•~ •
Z t-I N
KJH Q X
- )[X
H 1- •• J K W O •• Z •o LL Q o
O 0-1 • 5 J
30 Z .d
H F- -4
x
n1i
C)H .,
•
(n 1 t• US 14 O! J )-Q d 0-z • •W Q QRK H .. OK LL J'14GI-4*4 >C Ds Z O • •N QW4 1 11- K J US O H H .. X • F- O k- JO •d' •K U-
•"I co co V)zO JF- x I-
N • 1-I
1-I ..• • IL
I -1 O F- Q
..K W)°O ..O, X
. .,x -t 0 ..Q. $c u_O • • F- ,I C U) I- M Z 0-1 X -* 0 : Z
oxKwaoW •
I M
•-)<
w4 Cr J • >- K
cC
.-1 F-
• .-I 1L o QoD .-/ Q X /D N. 3 ... .0- ri .D Q.
N
~D W M c• . 1., J • • O K V) + • Q • •
• O" •F- .4 W •F- X J V_ s-iF- I- • X a0 F-Z K JOXJKOoW 1L II Q :3 •.oIL pOo QO .-1 Z O ,-I OC 0 I--4 0 ) .-4 • W O Q. K F-J•• •O J•+ILI> 0-J0.0. xOJ • C)~ ~ Z F - I.- tw :3 c, Ul F- M Z 04 4, F- F-WdF+F-IW O(Yo04 W1LQ .HWOQ'KF-Z i4xF-E 1* 14 OD ( F CeItCVF-1 S •H C • Q H CC •• H H W Ce • Z H („ 1 O! Xa, C3>< Q'OXx O 11 O: =0 OCC0O!>O q3 U- .t *I 3 U_ U1 vs C) 0 3 0 1L U. U 3 cr U. M
,-I co
N
..4
0- 4O
M
-tt7
a
-
3
at.D
.-1%o
wN
'.DN.
U.N
•• 14
0
11
U. N.
>-0
cm
\ U\ 14 • N ZN 11 0 \ • W• '.Z .4co D04
o NOlL •LL U14 • Fd • O • H
E.* F- +a r1 K U_• • 0-1 Q II U. II IL)►4.F-rT • WII '1-4044>.=KQ.JWU OO II 16-1 L&. U. Z ZJU.C.) 0W 0U. LL W W ZHQ-W Z 0 Q I-4 o
U. WOOCWW WILF -sJ J Q Q Wet dce Ce OCOQC• F- W W W Z d'O O > > Q> O OI-F-- QQ
a (.)K K K K K K '14X• x X X X X X0 0
NM -t Ust iD1- 00
U O U
43
APPENDIX A. 2
Sufficient Design Technique Simulatio n
Program Listing and Documentation
4 4
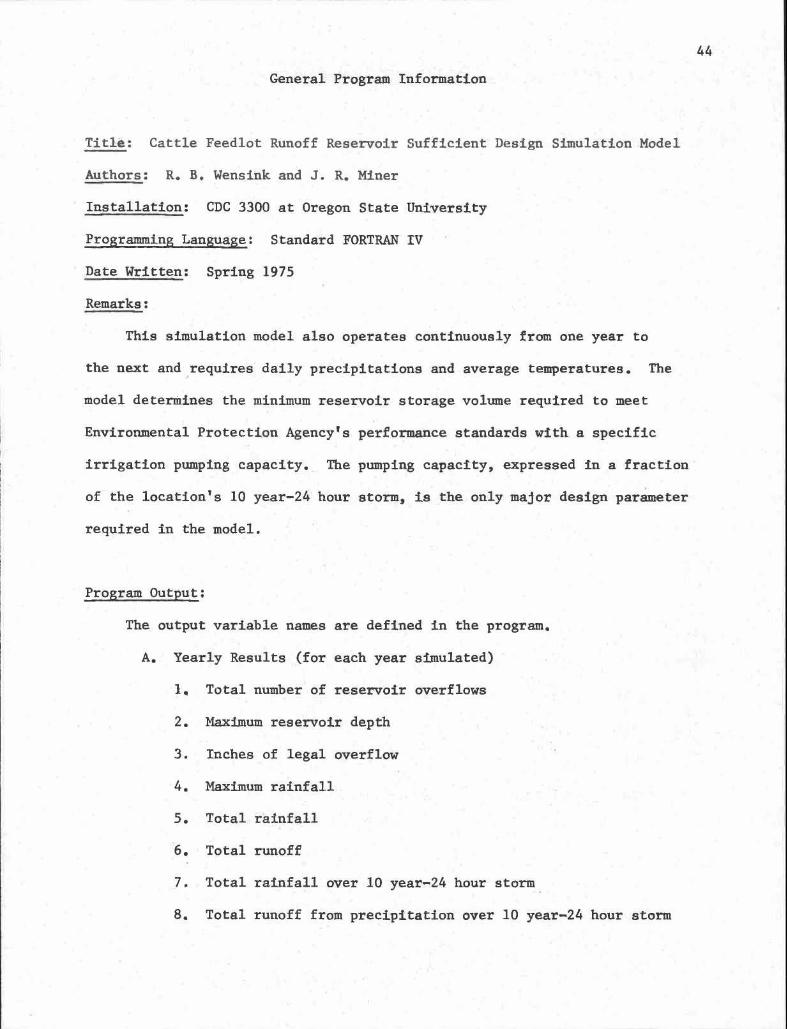
General Program Information
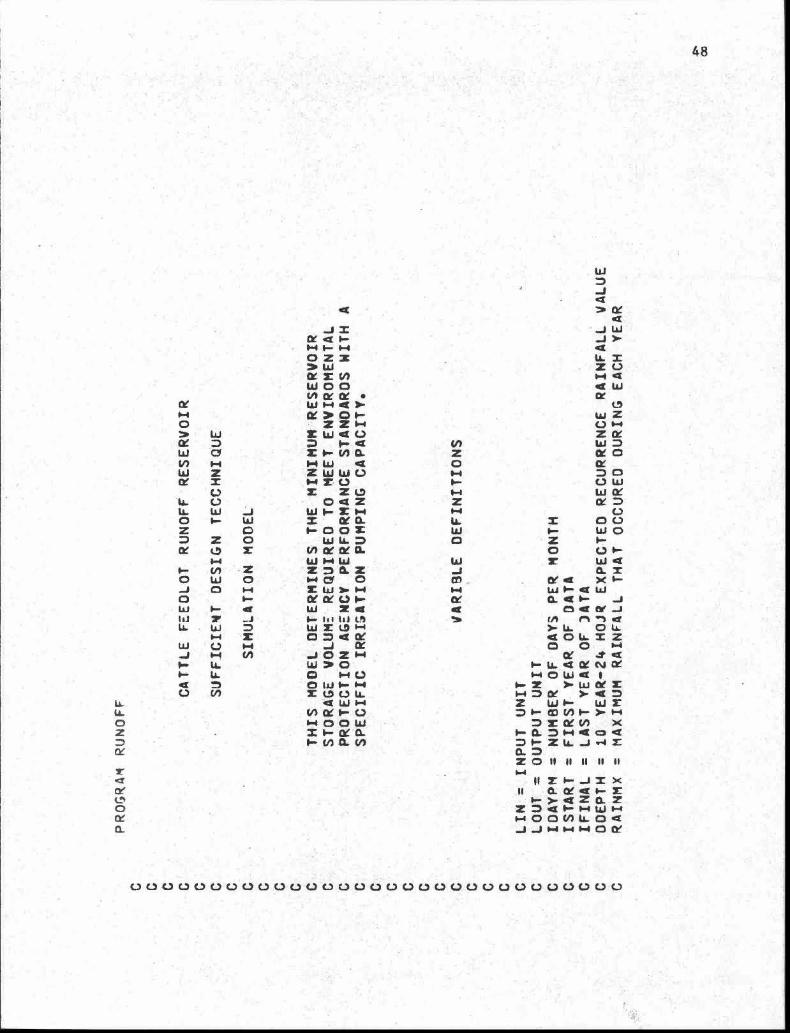
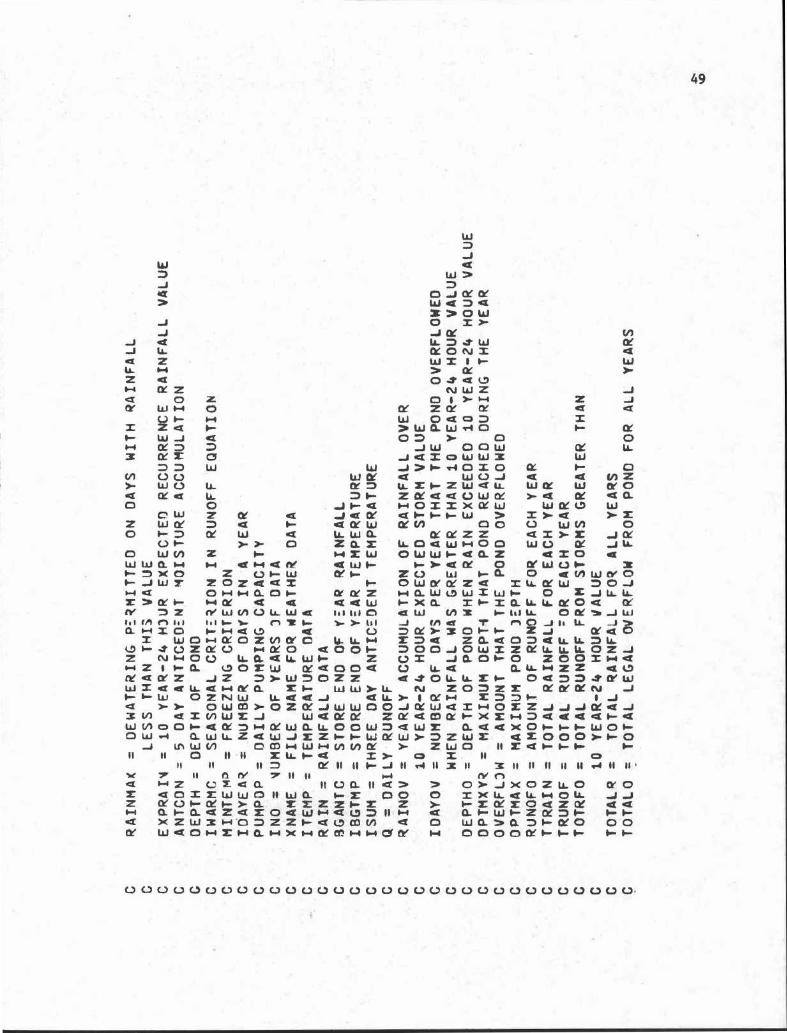
' Title : Cattle Feedlot Runoff Reservoir Sufficient Design Simulation Mode l
Authors : R. B . Wensink and J . R. Miner
Installation : CDC 3300 at Oregon State Ilniversit y
Programming Language : Standard FORTRAN IV
' Date Written : Spring 1975
Remarks :
This simulation model also operates continuously from one year t o
the next and requires' daily precipitations and average temperatures . The
model determines the minimum reservoir storage volume required to mee t
Environmental Protection Agency's performance standards with a specifi c
irrigation pumping capacity . The pumping capacity, expressed in a fraction '
of the location's 10 year-24'hour storm, is the only major design paramete r
required in the model .
Program'Oufput :
-
The output variable names are defined in the program .
A .' Yearly Results (for each year simulated )'
" Total number of reservoir overflows
2. Maximum reservoir depth
3. Inches of legal overflow
•4 . Maximum rainfall .
5. Total-rainfal l
6. • Total runoff
7. Total rainfall over 10 year-24 hour storm
8. Total runoff from precipitation over 10 year--24 hour storm
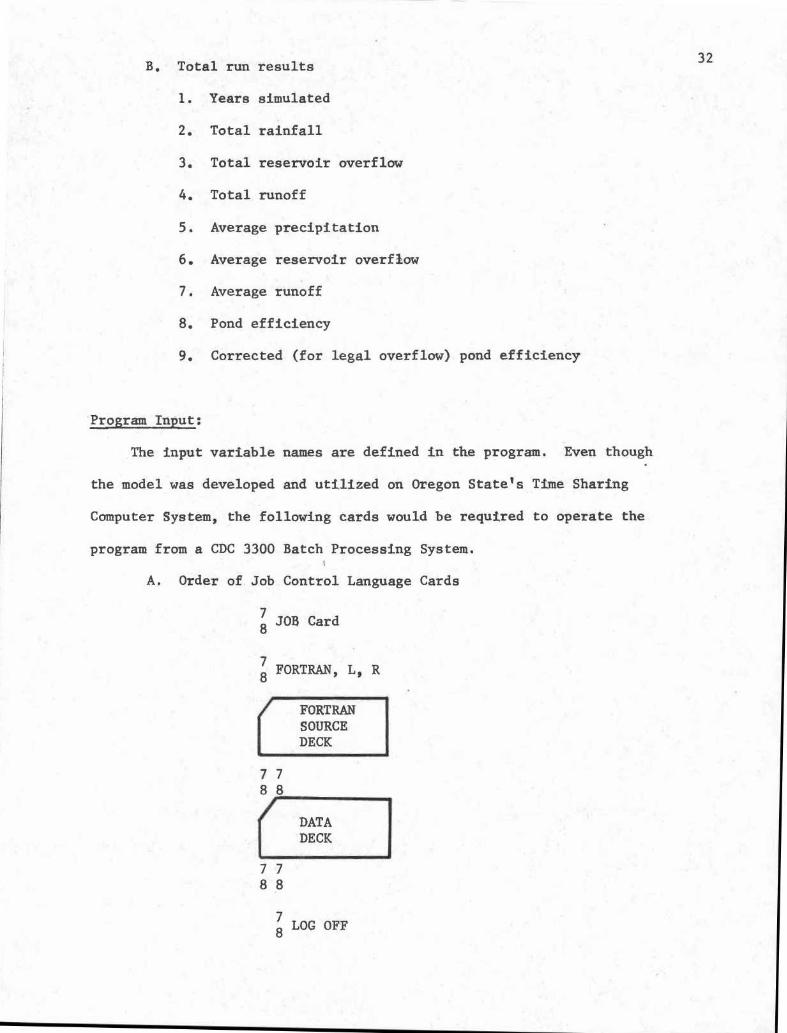
B . Total run results
45
1. Total years simulate d
2. Total rainfal l
3. Total runof f
4. Total legal overflow from precipitation over 10 year-24 hour storm
5. Total runoff from precipitation over 10 year-24 hour storm
6. Average precipitation
7. Average legal overflow from precipitation over 10 year-24 hou r
storm
8. Average runoff
9. Average runoff from precipitation over 10 year-24 hour stor m
10. Minimum design reservoir depth required to hold all precipi-
tation less than 10 year-24 hour storm.
Program Input :
The input variable names are defined in the program. Even though the
model was developed and utilized on Oregon States Time Sharing Computer
System, the following cards would be required to operate the program from
a CDC 3300 Batch Processing System .
A. Order of Job Control Language Card s
8 JOB Card
8 FORTRAN, L, R
FORTRANSOURCEDECK
7 788
46
7 78 8
8 LOGOFF
B . Preparation of the Data Pec k
1 . The data'deck,consists of file names and years of weather '
data. Each card contains a file name which corresponds
to a particular station-year and the corresponding dat a
year . The format is (R8, 2X, I4) .
In addition, the following DATA statements need to b e
defined :
a. ISTART and IFINAL should be set to the first and las t
year, respectively, of the data utilized in a par -
ticular run .
b. LIN and LOUT correspond to computer installation input
and output logical unit numbers, respectively .
c. DDEPTH should be set to the expected 10 year-24 hour
recurrence storm .
d. RAINMAX should be set to 0 .0 unless dewatering is
permitted on days in which rainfall occurs . If this
condition is desired, set RAINMAX to the maximum
level of rainfall at which dewatering is still permitted .
e. EXPRAIN should be set to the statto n l s 10 year-24 hou r
recurrence storm .

47
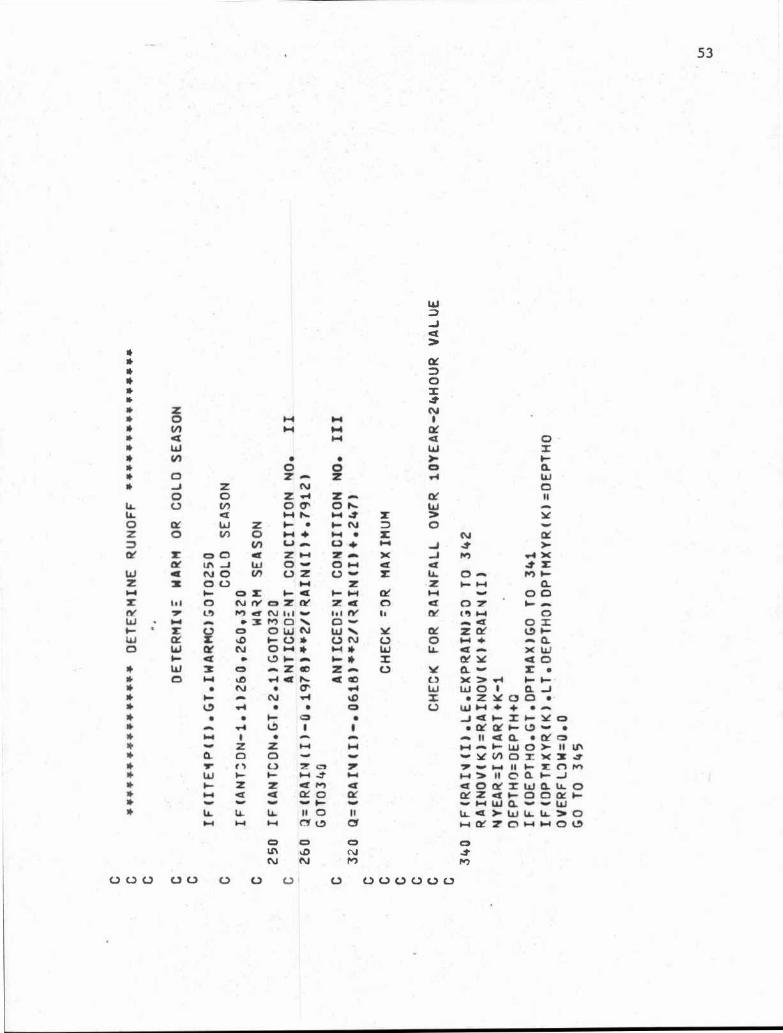
2 . The climatic data files must be created prior to runnin g
this simulation program . Each file must ' contain one yea r
of weather data from-a patticular station .. These data
consist of rainfalls and :temperatures . Each record con-
tains four consecutive days of rainfall-temperature dat a
punched in the following format 4(14, F5 :2) .
.■
.'i'
0z
J 2
- -ZQ1-hW1W
W z-
d" Z NW O OVI R' 'LY .W 1-t Q
~-+
>06-0
Z Z*A C.)
O N• d
N
Z N V) ,CL
.t'W,
. 0
-ZWWU
1- +
rr Z U
0-
Z Z l9
N
O a Z
Z
W 'H ' M
1 .6X'
CL
U.
$- OOZ
W
WLLO
OO
U 6-W
=
Lrrl QJ
d 2Q1
~_ Q xW
W Q Wd~•
o d 6 Jt=s es et _J
en
en -•1 aY LL
Q• 1iaO-4.X ZOo
•441= 'LL_ W'As CCI-1OWet 1.
w:• Z
w er . Z1-1 O Z , Y d ; ''Z WH W r►- CO N 1- > 1-6
O=~N .MO-ZWJ~ fY 0 11 11 11 11 1 16-6
11 Y 1-+• , J Z x11 •G - ~ ;d F- f
1a= -'s-at Z a z•Z' O: 4 I- N W NH•, O' O C 1 ILL O aJJ WHt1-oo w
-o0,c5c7
oo. c -0o oLi aa .
c c.~oaciULaU c
ZW
WOC1
NWn!
NZ2
L LW
' C,IUW J
0 I- WZ C
Z 0
1-tH • V . : Z
0 W 0'•
0 O F-W H dli Z .. JL L
W
W
v1-1 N
F-►-
LLW
U N
NtYa aW N'LWZ ZM~^l O
W UW . Z
-
1+• I, r t*7 uW
L0 F-1
0 J d gJ O Z 1 -1 •W > 0 -0 H U
"0 w 1-+z 0 c Ld
4 w1-+Nr-1 O 0 4w
6-Wa
49
W
J
J-I
J QJ u_
zW
1.1
2N IX z
O ZfY•
W I-I OF- H
=
Q 1-/- W J1.4 to O O2 CY Z Q
WN U U>. W U <L
tY QO
OZ WQ'
Q
FO I-
W
dU►-
» OO W N ZW LU a I.r I-I 4 1-I d W1- x0
Z UI- w1- J W S Z 0 Z d =►-+a
0I-10..0_ 04-Z > tY i- .+ to Q eiN M Z NW V) C.) LL W Q
W CV•
~ 71 -
.J I- Q-14 W4 WLL W 0-Z CL zI4 = W
wI-
I-
CVCY Za a WIII III C1
W2 1 1-> OCq s ate
N W Zq 1 > *••t
a! 2Q' CeLU Odo m> W a W'4 00 > 0
J W O O WJ d= o W w X.J y I-T40 O
W U JW ZI- ZWaLLZ tY4< WCer-+CIC x xa w
0-1--I- W D.Ce C/1
O O
W
w >
O cY orwawa .s>o wo 2 Y
c
NLLD-t w
O N =
QW
-J
Z
JQ a
I-0
IY
WW
I-
0Q
Q V1 ZW a W Col O
> d C
17-W Ce
W2 >
>
U W V)
0aa'ZZ
=>Z -JILQQ WF-1oo WU a JLLO W W N d a Z Q 2 0 4
f- >dtY o o'WC30-
2z U w I- a O Q cn w co, O0WaQ'za SLLCYW O0 J04 aWLDW=w0- O Z JLL1 LI- xa X -=0LLLL0004 Ce
w N 11
4--I41LL
Oa'
w161 V1 CI 161
1 .1
n
F+
!. > III
J
V1 Q
T
n 0 J 11 LL
J0.I0 0-0044 0
U O a'> Z 00-0- Z J
Oe 4Z WOI-1teOZVla
UL LL I-I Z'Q ZC3.d0 :D aLLLLOL L.DI- ?UZRU .- o QOOM- OOOJOW 2 ZaLa.u.U.0Z JZ NI-10U LLadl4 WN
2 0= JLi01-O 20051-4 d04Z , I-0. tDOIW Oe aQ0a V U- 41
0U.■-IZZ 4 0aaQ' Z .JZ
>- WOOZZ
ex .t OLLLL =I- o4» . a' wW= a QLL41.1a'a ZF- W W>LL N ZOO Z= tYA_'CC N1-I--W OZNW 1L.
-J
LL> 1 Ce
;OO1
1 Ja >> 0Wtf7>OCeJW W OOJteWd=I-( OZZJJJIYQ JZ 01 a= V)WZ J
WCe Ce ZaQGDa►- XZHOQQQQL- QW No01-ate c)04OeW O. U. 00 W W a 41 4X x01-1-H W01-0W .-1 a WLL2QW JZZI-0-4J a W>>ZWZ 4% Z000>I- O
J u(WN
I7SF•1W*4 VI 01 Ce >-
2 WO
11 3C d1-1-1-
1-11
n 0 11 11 ZU-0-4
2>
= 11
0II
11
11
a~ 11 11 1- -J 11 .4 11 z 11
11 11 11 11 11 . .4 11 1 1x
'
11
t1 V
7 11 11
1-4
(Y ( )Q
z UT. Q a
It UCL 11 Q> > O> JX0ZLL0 tY 0Z a O= Z W W O II wd I-r 00 O =XLLQLLI-IQIL -I .JZ a'Uh-tY5-> a rZZ2F•
Z >- 1-=t1 Z0aZ
a c14 a1-azec Z0a W1-4a0O II 04 a aW1-ztY 7L- 1-1-04 xzw31-•+oozZl-LDCOV)
0 wawa of- CYO C oQ ' W Q o04ZI-1a 1-+XI-+tYOD 1-I 0ICfQ' I-I Oo0oLxl- 0,- 0- 1-0-
U 0 U 0 U U 0 0 U 0 C) U L3 0 C3 0 C3 C3 C, 0 0 0 0 0 o 0 C! U 0 C .) 0
'
4 .
W'6-
r 1 ~W
V1
U)CZ
Z
0QW V)
JC .)-J 0
Jd
W
tzQ~W}
QU.
=O J OLL Q
11CD_J
N
-1 1 1f
I.
1
.
. w
1
k
• .~
•.
~ .
~. uD
*~D ••
...r Z
o
*C_) 1. 4
•
*1- d
rl
*z Q'
MQI- •L9 1•- •• om • o
i .
*
*.• co •• .-1
*M■D
**
%D iD 0 otD LL M
>O •OZ .1
2 y O MI-4 er [Z •Q r1 • O
U. J U. LA
H .M ..u.z‹0WZ
• •o • .aU. M l9 Z W 2 UO .4
x
OC W >0
■D e3 Ih I I. z
_J ' 0 I-
•4 O IO ~ • '•'~
V1
Mvy•o ~Q' W W W W
••' J N 0
l7LDLILI
O. U. Z • JJQQa W
WI- .-1- •-4 W W fY W 1-
w W CI- M •1-WWWWC)
I- >O 11 ..O>>>> W
H 0 • Z O1-a44 aaa
••a40
X
z .- s- uu II 11 u u W
0 .o / Z01 v Q 04
LL0 IYLL0
v1 CL U.1-+ J-IW>40LL
ZF 0 . ..1a-LDL,
W
Y ~7 4►►-' O>»>
O a Q
d
O H (- Cl 0H a Q Q
.•1 N
I J• 1 •ti
r1If : ,
41
',I
1
II
n
I -
f 0 t..
•
y Zdw
-1 • -N o
W LUO+ •
Q Jrl o
' W
1.AII {I
y
LL
lY-J XQ Q
.-
* . . .
-Z Z V
_ H f
y7 T
•
F-1 1 i~ .H Z
HU. H
•
O O1. 1 Q
Q Q
•. a .a W W W • 1 ~.,• ••
+
CZ CZ Z
r 1
~O-
.. elo
2 C[
Z.4 •) •
F- d
*
) C
O • IT
Q.I-
*
...11 11 11
W 01
C] H O
**
. 1n Z
0
11-Z04
L110 1 Z
*
OW L- QO
4.0 0* -J 04
*CL CZ 0 UN CM M) eX
►-wQ 0 .~ 11 II •Z .4
*
ZIn n x 11 0 11 Q. N u H is
Y
H1-4 o w z II o T D L ]C
*
-J
...v0Z3C W WC]rro
*
- •aaaU1-W1- y a 10 oo *
O0-0-1-0-CLZaz0UN 11
*.X
ZW 1 4 0 Z 0 Z
WO O O Q O H Z H CL H O Z
O'
4
• UUC)CJ 0.000
-ti r ._yl n
I .1~1 1t
I I
wa0
1
1O o- 4-
%' P Z ZN Q Q+ +
O O ...H' l- .4
•,O1
0 0 H •C)0 0 6+ 1-
z zw . . H~O •~ a o• a OG1 co
1.. Cpl 11 + 1 1o W Z• .000 0
0.4 04 - 00-+. ... 1-
FU U.Z0Z 0f-4 IA 4:1
ex 0
L
.~
O
N.J
3O
O1.0N
TI UNN- N .-4
U U U
}
52
zoN4-
ozOJW
ZU W W W
zJ
0UH tir .
1- rY
!-LL
Q W - 0a z
4 1tY Y 0 1,1
coee C]
1Y eelH W O 0
0 Y _► -U 0 0 • Y
C-) 0 W 0 C.)W W
0 N =CU a M U
*O
W* O J* a .
W* J** a** a w* W N* 0 1 4** LL LL
/-4 N
000-00 OC:)0 000
toHz
HV1
.~
zN
OWawO
.-4 F-1-
1 N1-.1 a Zv ~. 0Q. a v .•1 0= N a ~+w .. = a cn0- a 1--a1 Z O W+ W tl H tr
H H M co O 0 0N 11 + + co M • o
1 + .. ., .-1 r4
1-1 r I n t-fv 1-
nH
nQ I-
Q. a aO o = 0Q. Z X 0 0 0W Z 1-- I-- - a ..W La 0 a a O. VI LAtlT 00 N oo+ co LA 0-4 I1 5- w a_a W •t0w tiN+ + +N ZZ J o0M 00 .a .. .-.Z •I-
1 I-1-LO LO %O I. 1 aCL J W01-4 00 , WZ •
1 J J-• a
Z
z
Z I- .-1
LD J I-
I.4-Iv) Z
-4 N t- F- F- 0 .1 0% • Q. o Z 0 1• W
• .1901.1'
0 • 11
II =w
•1--4~-1- a 03 MI CO 1r n on F-0oo mJ 0-1ow W S-4 0 - 4 40 Za II 40 11 O. 0 .1• 11 e , • • II 0 11 .40 It VIW .-1WW= .4T* Q
H1 O1-e1-11'1-ZOZHt-01--OI•-OI-- *• I-4.0 ..ZI-Z•+aI-a* `LL VI0LLLI_VIOCnONtL1-401-4tL W0W* L L1-11-1t911►~04L' CD6-104 Fl7Z6-4 0000* 0-4
*O 111 O O -O O* O%D N. ti a0• J M * a0
.1
.4 * .4*C.)
ti
** Z* 0 1 .4 H* VI H 1•d* H* W* N •* 0 0* 0 Z •- Z* J Z N
0
0
Z .•1 ZL►
0
Vf
O C' O tiW
Q
H I. H .7O
Q
W Z I• F- NZ
0
(#1
0 o-r +
P•1 •V U w UIY
Z o 0 !1 Z h-+ 2 or.Q'
to J W 0 •+ 0 1-- 1W a NO V! OZ 0Z
S O V
1•J
2oX I-a ~ H
1 .I 0 NN 2 f]/ 2 4N
7
t .'
Me N t41-
1 .1 NW
r-t w
• 2 M 0 \ 0 `•'1-
S U
O W N WW
Z
I- U* U NO
W 0' N 0 1•+ *
1-I *1-
Q
• 1_1
** W 3 0 .. Z Z* 0 H i0 0-1 a 1~ a m*
•
N
•
C'
•..1*
H w N .-
Lb*
.-1
•
•
O*
•
• I- O
•* 1•.t I •*
r Z 2*
O. 0 0* r r 1 c~ 7 ~-1* W t- I- ►-4 . 1. 4* 1- Z 2 M Q*
... a a
0 ac* r .r r v F v* li U. 1 1 O I Iir1
6-1
H
r
t^1'
O O O
O
LIB LD
N
?
N N M
M
000 c3U U U 0' U 0 U000
0rI-aW
54
1.4
•
SXM
0 •-1 M.L . HC •
WW X
4
JO • •
Q
X = 1-1a 0-
•
CCx'o X0-W d
0ao •
_0%
4.• • • N.NI- Cl X n• 4 3
Na
zM
J 0 '• O N!1 J • W
W0 CY
N ~ Z U. LA Y 11 IIO W LL 1-1 CY LL en.W W
W • .4 YW O W
X• ?L 0 •o Z x1- ; a X
A •% '• z • d• d Y[] 3 1••4 X .N S W X ZU 0 1-1 r- d -X • 1- O . Z 1-I
O J O Z • 4'0O 11 0- d►-I.W 1-4 ra
• U. V) K dm Z >- 'N
• Ln a CI A TA W M ' t!!
T X 1,1 Z n-. A 1-+J X W • O F- 4' J 0- H Q
el CO .4 1-+ *4 a
. c3 a N Crx = 4 + Z • •WN+ O - Z + +W ••. .. 0•1 EY X O • . . d A Q( H A A> a Y Y a
Y X a Y Y A0 O~~x F- W •XLL. v d x
I J
d » • O J • Z L .J OU.0 0 Z
X J ►-I•-WHO
-+
zxl-F .•a xLn~ as
J Q Z
N
►-10 • 1-WCL W .1W •
Z 4 . 0Q0
• a
• .
.•1w xa>oo 1- •+XN Z + • •
A1-W
d■O +..J a , W 0 H 11 H .4 K? • Q- .H X 1- I-H r
H • 1.1
1 1O I1
II A '.O
•
• 111
11 Q I- 0 0
II
11
.•1
11-
11 A '--- Y X • X '11 LL A M D CL
• •
X-+ ..
aII CY
HCL
NC Y~- •Y3 W xSW
Y
W W I-•0 Q .4 1- +DA+- v ,D -clfX N) OI.-1-O
-1 Z
W i
W
•L.0 Z WW►-+ a 1.4 0 H
U S
1-1--ZKNQ1- F- OO~ tYQ ZI- JO z0.0 C•• Z CL ••- •- Z ~WZJ 1-•111
W>O0.
0!0D0 W LiLL. O0100' 1-10
Sli ?ILCC0 0HH 0N
.i •
L11
N3
..? .1
?
.7M
M .~
M
M.•1
C.)00
000 1~
00 0
11 -JJ>>
1-
M0
1I O. C>• ZW W O X
I-1YCYCL W W a I-
C.,1-1ZLi. Zo )- H
U. 1- 0. 0
O 11 1.11.-11-1,-000
0. + tb
55
H H H Hr r v vOZJLI-W H L1. O0 4 W Z
▪ Z W W= 0 0 0 0▪ OI-Z Z Z▪ IY O 1•1 0-1 1- 4• + + + + \ \ \▪
0W0 U.00 lar▪ 01J. JJJIiJJ JZ W d 4 4 W 4 Q• H 0- 1- 1- F- F- F- 1- 1..-▪ 00 0 0 0 0 0 0 0• .4 1- 1- F- 1- 1.- M- 1- 1-• 11 11 II 11 11 II II 11 11▪ 1 .4 O 'Y 0 1i 0 C.) U.▪ LL JJJLL> O
▪ uN 1- 0- F- 1-- 4., 0 000000> >O 1- 1- 1- Q Q 4 Q
0O O
OLA
O
L11? LA
M
(, .J U V
K
•1L
41
oZ
0I-V) " -
0J
0! > W4 • Y 0F- x Z H
X
.O .1 0LA P- I-
K K• O' (Y
• •'N. •a W •N U .= X . JF- I~WO -1 .DCL
• >- K . LL. I -w K •
0 •
00 J W X
<L xwln 0 111 •
X I- O. • Z • 04 0 K N JZF- • W
KXLl.& •• .D
QI-
•
•111 O •a W 0X X • Z .
")
• 1-trLOK 7• . N O'KKZ41
... XU. .D
O!O •
•
JN . J O • Y Z N d1- OQ JX XD • p..
J Z I- u O'. E &L1130 CC • 1- F- f-
N J h- W K O_
• 0 •W Q
~ Z 0 e. x J1-
• O 1-I • 7 on Q0XKa •. ..
• Z OI- 1- .?
• & Z I.•+ t LK • X K *• 04
• .. W Q'• K .0 • Q on N H O
sc s .4]t
nIYIi. •
.noM O • .0 J >' 1- • .D F.- Q•Z d Q1-X% .
•'H. M • 44 4L Z 0 * 0" • Q V.
cc
X K Z X
I"
I-l
• ?c 1- O44 JI.4IYLL
0 7MM CJ1W Z J d 0 14 4-4
1-1 .4
04 O.. > K Q OC 1- • a X • • a >
K • ti 44 In 1- N) Z X N -to• X Z • C
Z aC • o •.-1 X 1r 0-1 x W 4
v4 0-1 • .D
.4.D .D •ati -F- 01 .D4 .LL .D >
• •K!Y • V) + •O! H •
• 01- .4 J K 44 1-1 f- 4- • •. X M- O
O=QJX 11 CL'~•XtT
>0 .1041 Oa'►-1 a O ")f_ •W O aJ
ILI 1- 1 I■I
1-- _J - - N
I •--1-JOLL D. cs J0- •Z~• OW Q 1-Q'OO04 WtL 4 .004WC '1-$ • 4 l W 41 .0 1 F- CYzu - -0 .H Z • > • ►-+ 14 W CY • Z 04 l.DCeCD04xOxCD n ce >OXOce n,• U .
It
K 1c1 (7 S C u LA C.)
nc
'11.4 N M J
.•1
.-1
.4O
M O
. ~
.4
.D
000 0
C:
56'
\N
V'
N4. \
•► N C+
\ n
• U. \
N 11 CO
• NaO
• Z U. M
' iH
C' (IIC
•
11
•p► U. 0 'N Y WK
•I-11
CY
•O
14.V 2 0 NF-
11
1-
F-
1 1*4
X 0 Cl V Z► 1- W w 0X
a 1- 0 0 J
0w 0 I-ao
a Z 0 wO X 0 WZw a 0. 0
ra
0
xIn
O.
w Juc
> za
0 c 1-+ CY t9W
Z 0.1 O Y WX H W o J
O A W •4I JL1C
W
0
HO W N\ X AI+-
U f N W
JX QC •
V) JV)
WOC'Z XC.)
I- U. O
CC►-~
= N • CY 0 0r-
0 x 4. ~- JV) \\
II
V) 0,04 N N U.
Z\
Z0- • • a Z O Ns[oDX CD .J •O OF- .4 .4 O Z - ILO CY 0-V)1► 1i JOI-CY .4II .
• • Ii. CY
W U. SJ X 'N
U . 1- 20 • Z 0-a 11 H W ►-AO*4Ox0.0- JZ30 3c CL L. .JQ W0 ...I C3 CD CD 04 .J U. U. 3C C50-Q J J000CY►-K Ia_4.JU. L7WCL 0•za
.C
0Yac
wois
0 2XHWIDWa.JIY0 .+ 0G Q> W .4 O.MCS'OJOWW WW .4 %•
U'
l9 tD •J J J J Q a Q Q 45 X
g QCQQCeCIrCCCC • O14 H-0- 0-1- W W W W .1 M. el en O en 50 D0 n, 50 .F- F- 1- 1" 1- Q Qariri x ra x
Wri r,►x a
T • ► • • • • • • F- a.RxXXXxxxxl-~CC0 0q cmcm cm cm cm en cm cm CC CD - ZU. MMMMMMMMS U. V) W
.4N05 ., UN UN JD 0..t7
.-10 ..4
%O45
N