Predicting Horse Racing Result Using TensorFlow - CUHK CSE
55
1 Predicting Horse Racing Result Using TensorFlow LYU1603 Final Year Project Term 1 Report CHENG Tsz Tung (1155051298) LAU Ming Hei (1155051346) Supervised by Prof. LYU Rung Tsong Michael
-
Upload
khangminh22 -
Category
Documents
-
view
1 -
download
0
Transcript of Predicting Horse Racing Result Using TensorFlow - CUHK CSE
1
Predicting Horse Racing Result
Using TensorFlow
LYU1603 Final Year Project Term 1 Report
CHENG Tsz Tung (1155051298)
LAU Ming Hei (1155051346)
Supervised by Prof. LYU Rung Tsong Michael
2
Table of Contents
Abstract ............................................................................................................................... 7
1 Introduction ...................................................................................................................... 8
1.1 Motivation ..................................................................................................................... 8
1.2 Background ................................................................................................................... 8
1.2.1 Horse Racing .......................................................................................................... 8
1.2.2 Hong Kong Jockey Club. ....................................................................................... 8
1.2.3 Pari-mutuel betting ................................................................................................. 9
1.2.4 Types of bets .......................................................................................................... 9
1.3 Objective ..................................................................................................................... 10
2 Data Collection .............................................................................................................. 11
2.1 Fast Approach ............................................................................................................. 11
2.2 Web Crawling ............................................................................................................. 11
3 Data Storage ................................................................................................................... 13
3.1 Tools ............................................................................................................................ 13
3.1.1 PostgreSQL .......................................................................................................... 13
3.1.2 Postico .................................................................................................................. 14
3.2 Database Structure ...................................................................................................... 14
4 More Data ...................................................................................................................... 16
4.1 Extract Features .......................................................................................................... 16
3
5 Data Analysis ................................................................................................................. 17
5.1 Jockey ......................................................................................................................... 17
5.2 Horse ........................................................................................................................... 18
5.3 Trainer ......................................................................................................................... 19
5.4 Draw ............................................................................................................................ 20
5.5 Win odds ..................................................................................................................... 21
5.6 Actual Weight .............................................................................................................. 22
5.7 Declare Weight ............................................................................................................ 23
5.8 Horse’s Age ................................................................................................................. 24
5.9 Time Since Last Race .................................................................................................. 25
5.10 Weight Different ........................................................................................................ 26
5.11 Horse Recent Performance on the Same Track ......................................................... 27
5.12 Public Intelligence .................................................................................................... 28
5.12.1 Data Preparation ................................................................................................. 28
5.12.2 Closing Odds Model .......................................................................................... 29
5.12.3 Accuracy ............................................................................................................ 30
6. Elo Rating System......................................................................................................... 31
6.1 Elo Rating System for multiple player ........................................................................ 31
6.1.1 Estimation score function .................................................................................... 31
6.1.2 Scoring function ................................................................................................... 32
4
6.1.3 Ranking Function ................................................................................................. 32
6.2 Compute the elo .......................................................................................................... 33
6.2.1 Parameter Tuning ................................................................................................. 33
6.2.2 Result ................................................................................................................... 33
7. Possible ways to model the problem ............................................................................. 34
7.1 Strength of a horse ...................................................................................................... 34
7.2 Probability of a horse to win the race ......................................................................... 34
7.3 Finishing Time ............................................................................................................ 34
7.4 Which horse will win in a race ................................................................................... 34
8. Data pre-process and normalization .............................................................................. 36
8.1 Data Filtering .............................................................................................................. 37
8.2 Data Normalization ..................................................................................................... 38
8.2.1 Real Value Data .................................................................................................... 38
8.2.2 Categorical Data ................................................................................................... 38
8.2.3 Crossed Categorical Data ..................................................................................... 39
8.3.3 Categorize real value data .................................................................................... 39
9. Model Training ............................................................................................................. 40
9.1 Pattern Matching Model ............................................................................................. 40
9.1.1 Build Index File ................................................................................................... 41
9.1.2 Find similar k-races .............................................................................................. 41
5
9.1.3 Prediction Race Result ......................................................................................... 42
9.1.4 Accuracy .............................................................................................................. 43
9.2 Linear Model ............................................................................................................... 44
9.2.1 Data Preparation ................................................................................................... 44
9.2.2 Unbalanced dataset .............................................................................................. 44
9.2.3 Training ................................................................................................................ 45
9.2.4 Result ................................................................................................................... 46
9.3 Deep Neural Network Model ...................................................................................... 46
9.3.1 Data Preparation ................................................................................................... 46
9.3.2 Unbalanced dataset .............................................................................................. 46
9.3.3 Training ................................................................................................................ 46
9.3.4 Result ................................................................................................................... 47
10 Models Evaluation ....................................................................................................... 48
11. Limitation and difficulties ........................................................................................... 49
12. Future works ............................................................................................................... 50
13. Conclusion .................................................................................................................. 51
14. Acknowledgements ..................................................................................................... 52
15.References .................................................................................................................... 53
16 Appendix ...................................................................................................................... 54
15.3 Table References ................................................................................................... 55

6
7
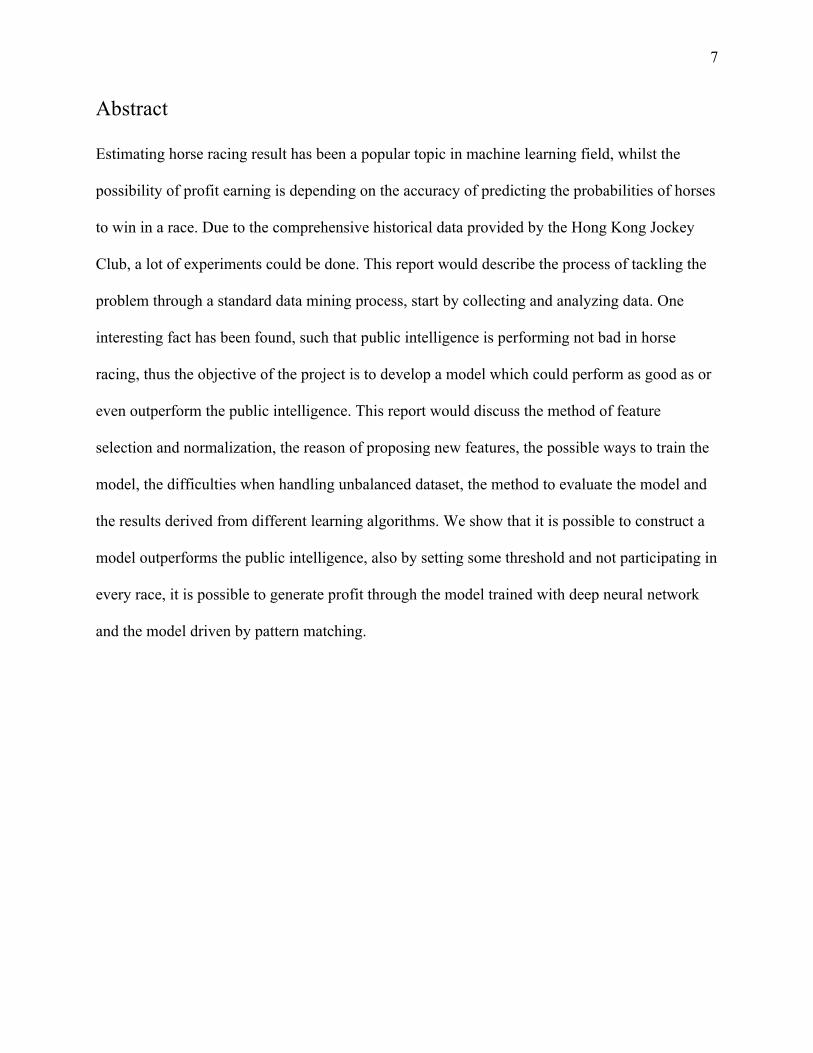
Abstract
Estimating horse racing result has been a popular topic in machine learning field, whilst the
possibility of profit earning is depending on the accuracy of predicting the probabilities of horses
to win in a race. Due to the comprehensive historical data provided by the Hong Kong Jockey
Club, a lot of experiments could be done. This report would describe the process of tackling the
problem through a standard data mining process, start by collecting and analyzing data. One
interesting fact has been found, such that public intelligence is performing not bad in horse
racing, thus the objective of the project is to develop a model which could perform as good as or
even outperform the public intelligence. This report would discuss the method of feature
selection and normalization, the reason of proposing new features, the possible ways to train the
model, the difficulties when handling unbalanced dataset, the method to evaluate the model and
the results derived from different learning algorithms. We show that it is possible to construct a
model outperforms the public intelligence, also by setting some threshold and not participating in
every race, it is possible to generate profit through the model trained with deep neural network
and the model driven by pattern matching.
8
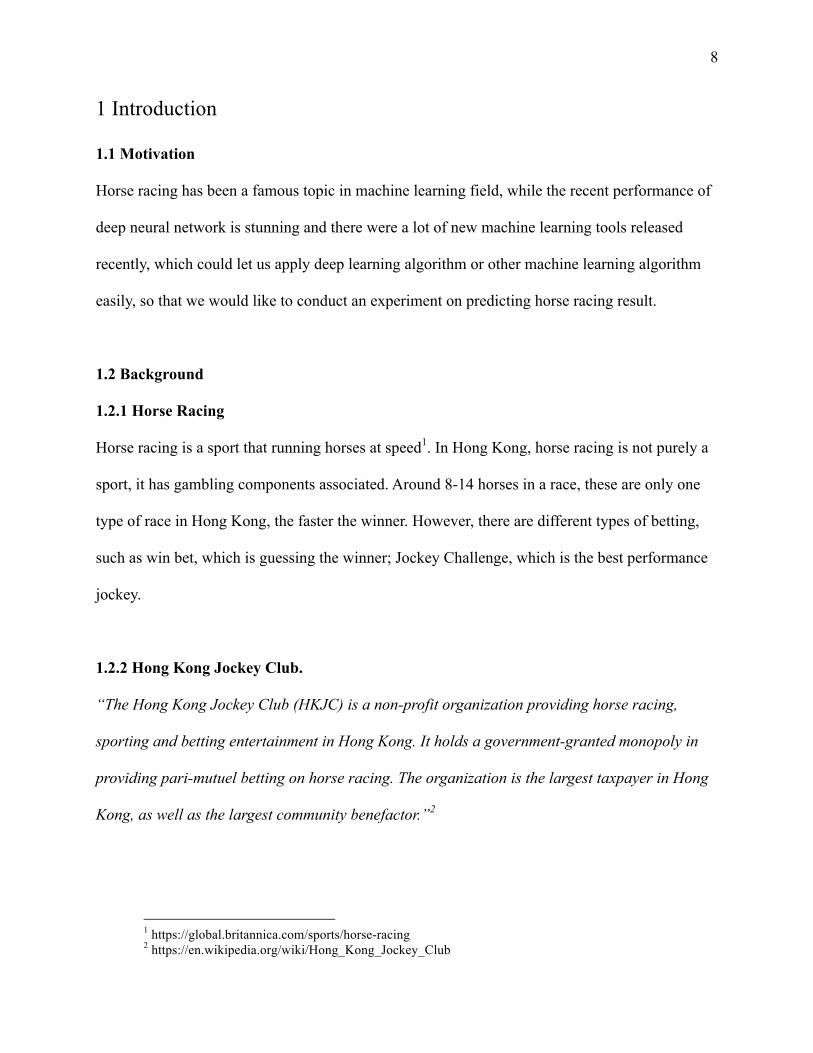
1 Introduction
1.1 Motivation
Horse racing has been a famous topic in machine learning field, while the recent performance of
deep neural network is stunning and there were a lot of new machine learning tools released
recently, which could let us apply deep learning algorithm or other machine learning algorithm
easily, so that we would like to conduct an experiment on predicting horse racing result.
1.2 Background
1.2.1 Horse Racing
Horse racing is a sport that running horses at speed1. In Hong Kong, horse racing is not purely a
sport, it has gambling components associated. Around 8-14 horses in a race, these are only one
type of race in Hong Kong, the faster the winner. However, there are different types of betting,
such as win bet, which is guessing the winner; Jockey Challenge, which is the best performance
jockey.
1.2.2 Hong Kong Jockey Club.
“The Hong Kong Jockey Club (HKJC) is a non-profit organization providing horse racing,
sporting and betting entertainment in Hong Kong. It holds a government-granted monopoly in
providing pari-mutuel betting on horse racing. The organization is the largest taxpayer in Hong
Kong, as well as the largest community benefactor.”2
1 https://global.britannica.com/sports/horse-racing 2 https://en.wikipedia.org/wiki/Hong_Kong_Jockey_Club
9
1.2.3 Pari-mutuel betting
“Pari-mutuel betting is a betting system in which all bets of a particular type are placed together
in a pool and taxes are removed, and payoff odds are calculated by sharing the pool among all
winning bets.”3
“Dividend will be shared by the number of winning combinations of a particular pool. Winners
will share the Net Pool in proportion to their winning stakes.”4
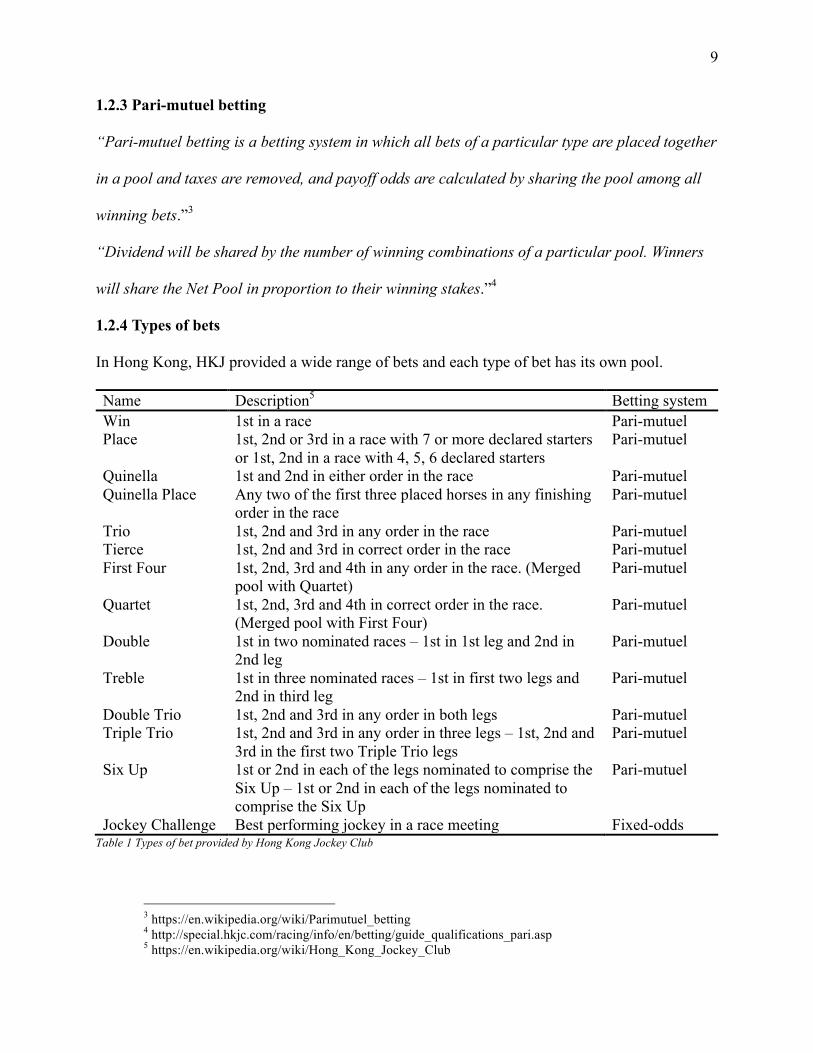
1.2.4 Types of bets
In Hong Kong, HKJ provided a wide range of bets and each type of bet has its own pool.
Name Description5 Betting system Win 1st in a race Pari-mutuel Place 1st, 2nd or 3rd in a race with 7 or more declared starters
or 1st, 2nd in a race with 4, 5, 6 declared starters Pari-mutuel
Quinella 1st and 2nd in either order in the race Pari-mutuel Quinella Place Any two of the first three placed horses in any finishing
order in the race Pari-mutuel
Trio 1st, 2nd and 3rd in any order in the race Pari-mutuel Tierce 1st, 2nd and 3rd in correct order in the race Pari-mutuel First Four 1st, 2nd, 3rd and 4th in any order in the race. (Merged
pool with Quartet) Pari-mutuel
Quartet 1st, 2nd, 3rd and 4th in correct order in the race. (Merged pool with First Four)
Pari-mutuel
Double 1st in two nominated races – 1st in 1st leg and 2nd in 2nd leg
Pari-mutuel
Treble 1st in three nominated races – 1st in first two legs and 2nd in third leg
Pari-mutuel
Double Trio 1st, 2nd and 3rd in any order in both legs Pari-mutuel Triple Trio 1st, 2nd and 3rd in any order in three legs – 1st, 2nd and
3rd in the first two Triple Trio legs Pari-mutuel
Six Up 1st or 2nd in each of the legs nominated to comprise the Six Up – 1st or 2nd in each of the legs nominated to comprise the Six Up
Pari-mutuel
Jockey Challenge Best performing jockey in a race meeting Fixed-odds Table 1 Types of bet provided by Hong Kong Jockey Club
3 https://en.wikipedia.org/wiki/Parimutuel_betting 4 http://special.hkjc.com/racing/info/en/betting/guide_qualifications_pari.asp 5 https://en.wikipedia.org/wiki/Hong_Kong_Jockey_Club

10
1.3 Objective
To reduce the complexity of types of betting, we would restrict our discussion on win bet and
race in Hong Kong only. Our objective is to create a model which could predict the winner in a
race, and perform as well as the public intelligence, or even beat it, in terms of accuracy and
profit earning, by using TensorFlow.
11
2 Data Collection
2.1 Fast Approach
There exist companies offer the sale of horse racing historical data in Hong Kong, a fast
approach is to buy data, though the price is considerable, due to a lack of budget, this approach is
not suitable.
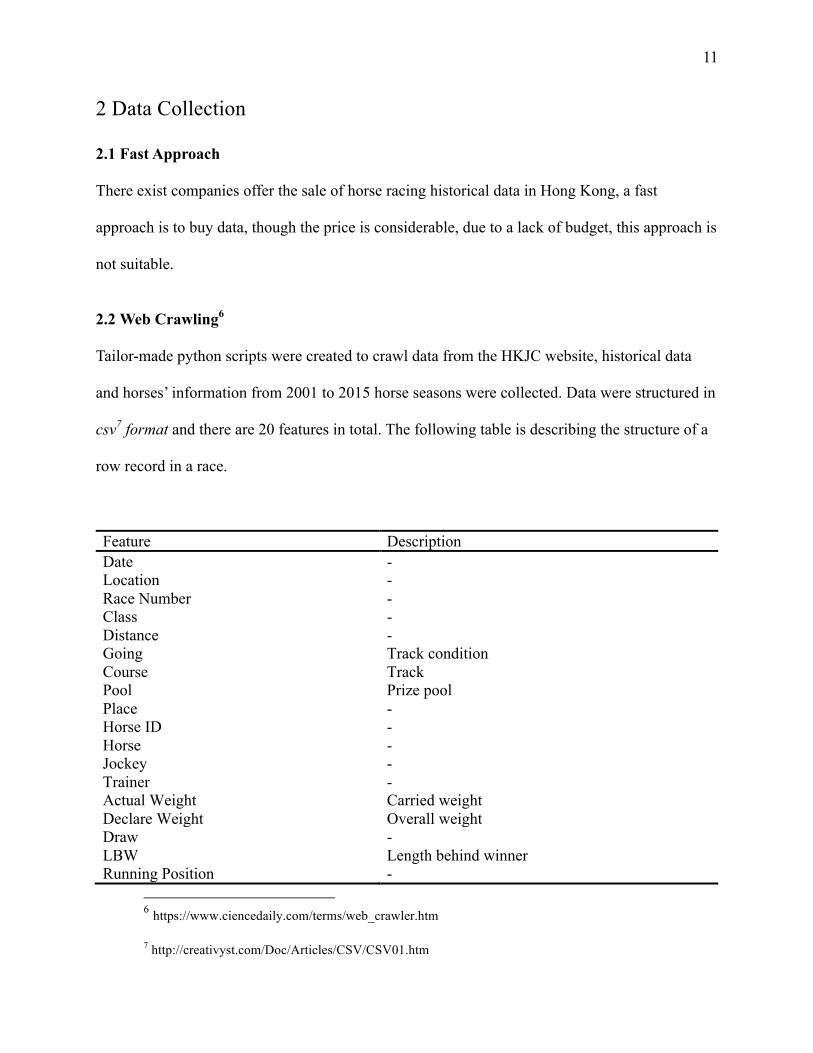
2.2 Web Crawling6
Tailor-made python scripts were created to crawl data from the HKJC website, historical data
and horses’ information from 2001 to 2015 horse seasons were collected. Data were structured in
csv7 format and there are 20 features in total. The following table is describing the structure of a
row record in a race.
Feature Description Date - Location - Race Number - Class - Distance - Going Track condition Course Track Pool Prize pool Place - Horse ID - Horse - Jockey - Trainer - Actual Weight Carried weight Declare Weight Overall weight Draw - LBW Length behind winner Running Position -
6 https://www.ciencedaily.com/terms/web_crawler.htm
7 http://creativyst.com/Doc/Articles/CSV/CSV01.htm

12
Time Finishing time Win Odds Closing odds
Table 2 Race features
The following table is describing the structure of a horse information.
Feature Description Name The name of the horse ID - Country of Origin - Color - Sex - Import Type - Sire - Dam - Dam’s Sire -
Table 3 Horse Features
13
3 Data Storage
3.1 Tools
3.1.1 PostgreSQL
8
Figure 1PostgreSQL Logo
PostgreSQL is an open source Relational Database Management System9. The reason we choose
to use it is because it has a good OSX GUI client, and SQL is good for extracting data from
database.
8 https://twitter.com/postgresql 9 https://www.postgresql.org/about/
14
3.1.2 Postico
10
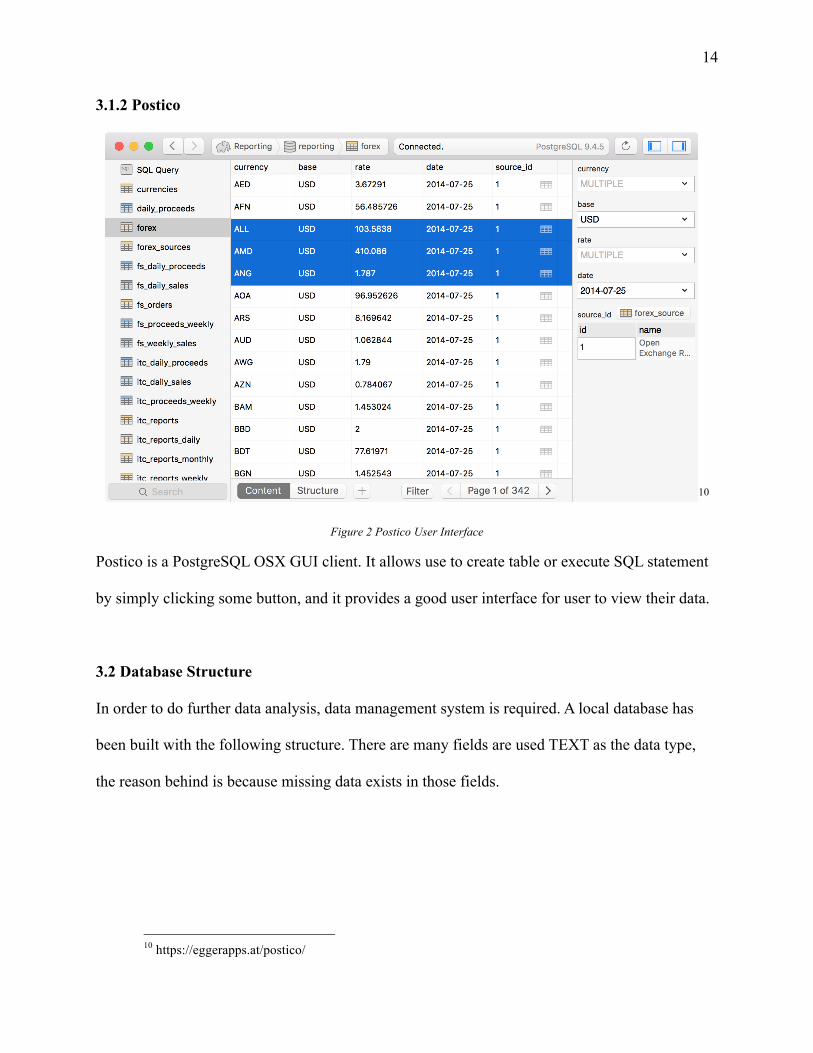
Figure 2 Postico User Interface
Postico is a PostgreSQL OSX GUI client. It allows use to create table or execute SQL statement
by simply clicking some button, and it provides a good user interface for user to view their data.
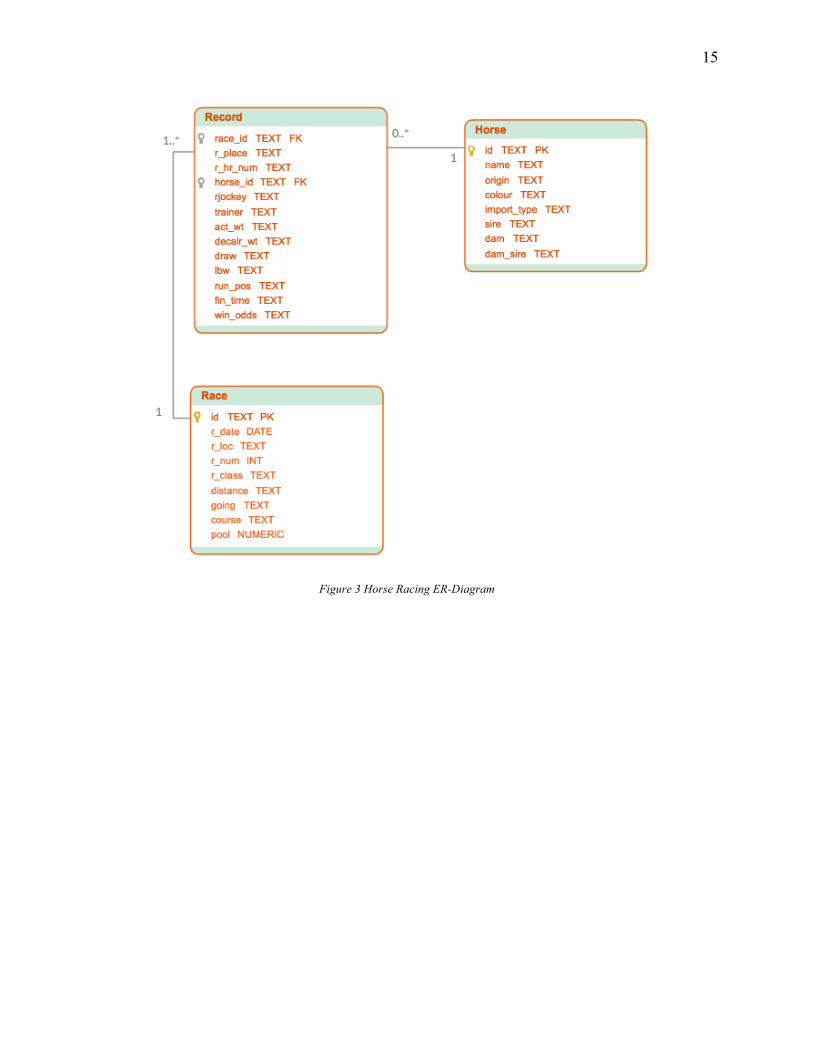
3.2 Database Structure
In order to do further data analysis, data management system is required. A local database has
been built with the following structure. There are many fields are used TEXT as the data type,
the reason behind is because missing data exists in those fields.
10 https://eggerapps.at/postico/
15
Figure 3 Horse Racing ER-Diagram
16
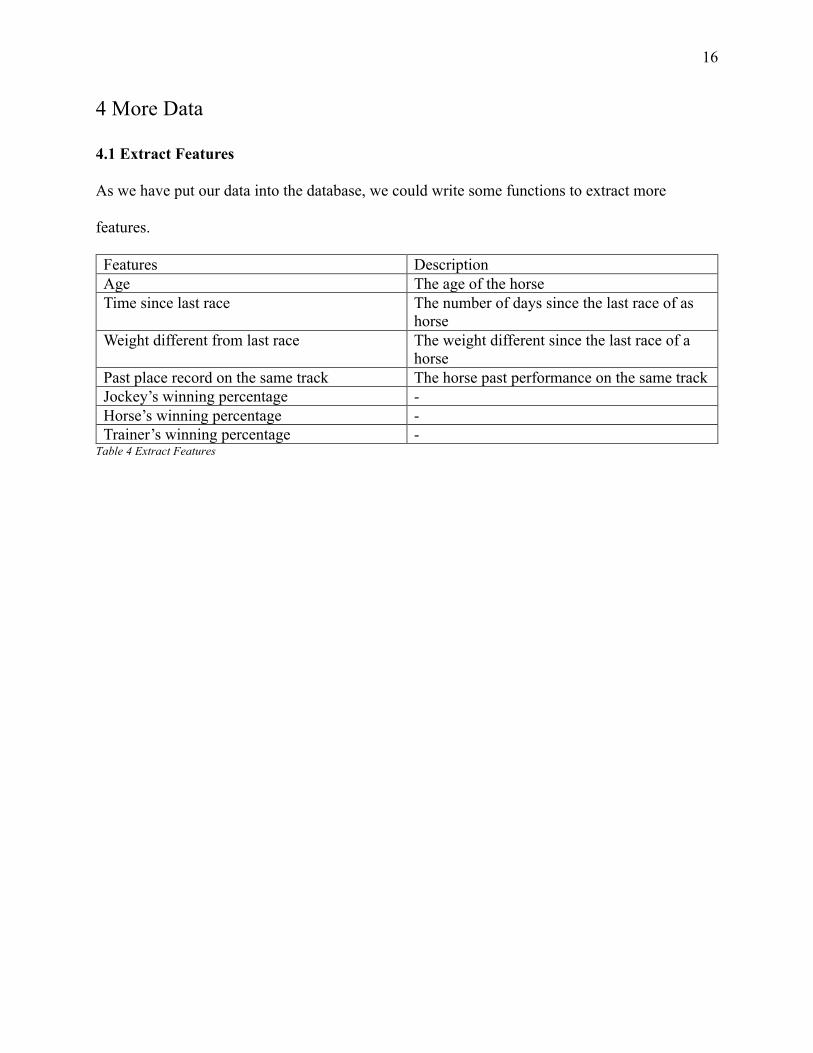
4 More Data
4.1 Extract Features
As we have put our data into the database, we could write some functions to extract more
features.
Features Description Age The age of the horse Time since last race The number of days since the last race of as
horse Weight different from last race The weight different since the last race of a
horse Past place record on the same track The horse past performance on the same track Jockey’s winning percentage - Horse’s winning percentage - Trainer’s winning percentage -
Table 4 Extract Features
17
5 Data Analysis
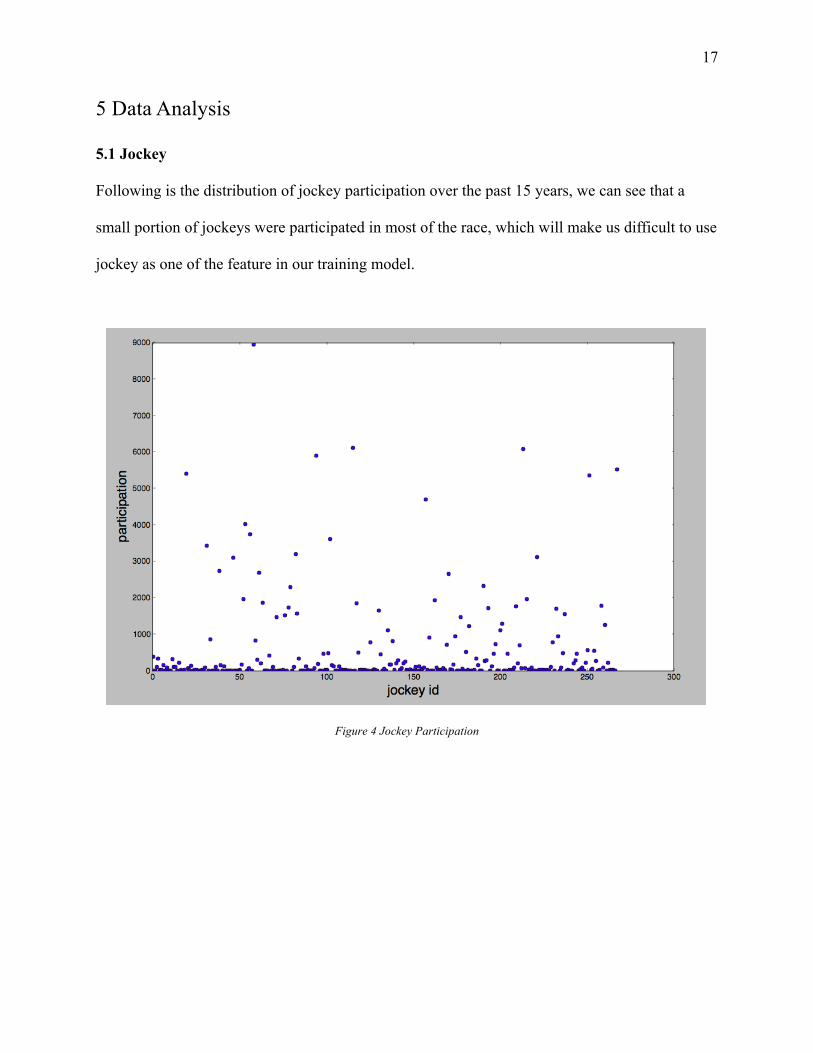
5.1 Jockey
Following is the distribution of jockey participation over the past 15 years, we can see that a
small portion of jockeys were participated in most of the race, which will make us difficult to use
jockey as one of the feature in our training model.
Figure 4 Jockey Participation

18
5.2 Horse
Following is the distribution of horse participation over the past 15 years, we can see that most of
the horses have not participated in more than 20 race, which made us hard to use horse’s id as
one of the feature in our training model.
Figure 5 Horse Participation
19
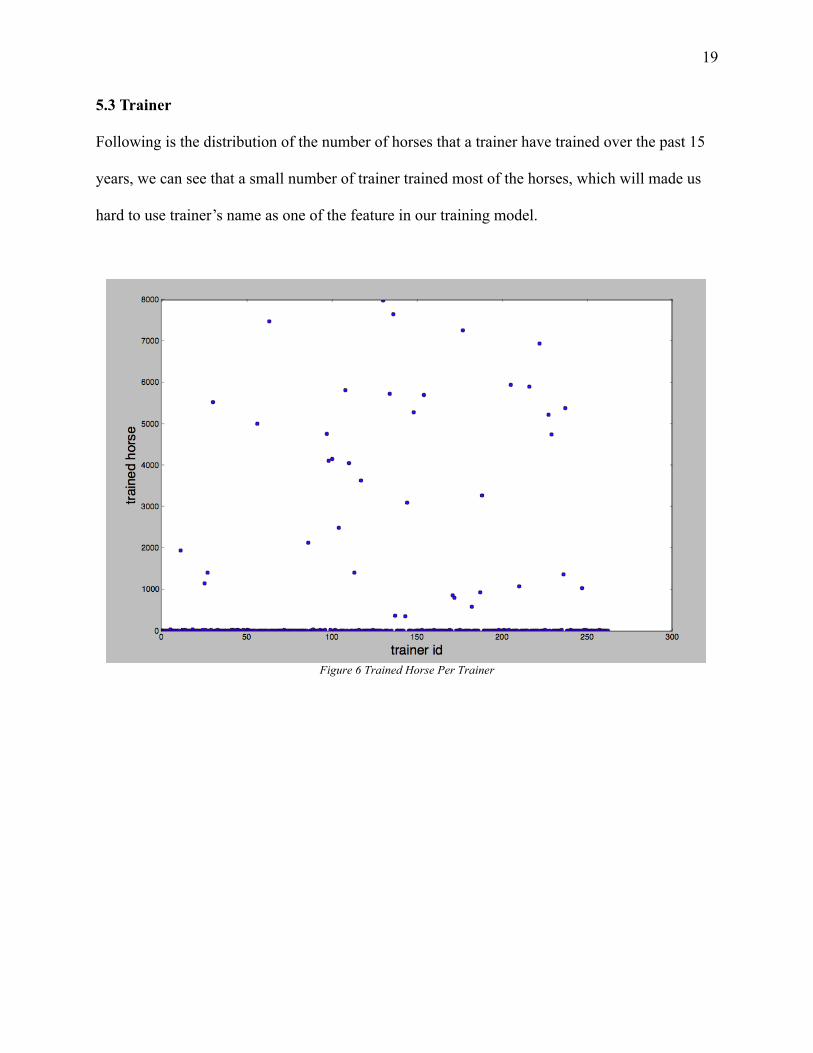
5.3 Trainer
Following is the distribution of the number of horses that a trainer have trained over the past 15
years, we can see that a small number of trainer trained most of the horses, which will made us
hard to use trainer’s name as one of the feature in our training model.
Figure 6 Trained Horse Per Trainer
20
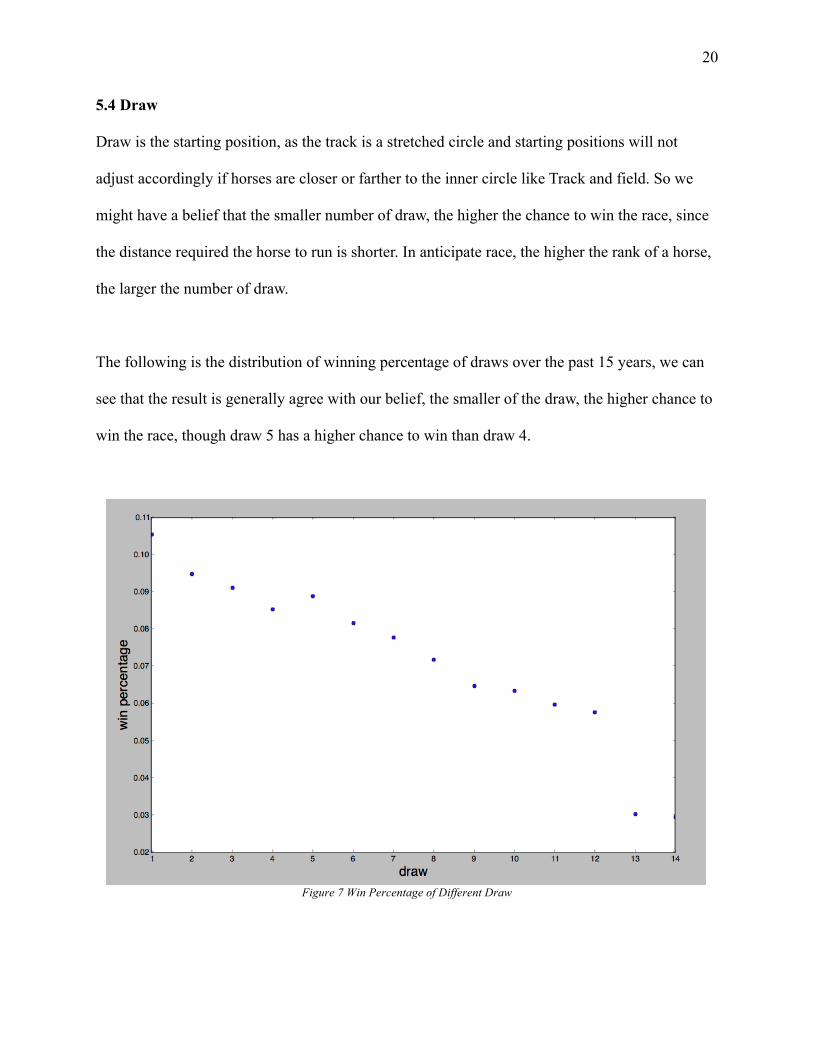
5.4 Draw
Draw is the starting position, as the track is a stretched circle and starting positions will not
adjust accordingly if horses are closer or farther to the inner circle like Track and field. So we
might have a belief that the smaller number of draw, the higher the chance to win the race, since
the distance required the horse to run is shorter. In anticipate race, the higher the rank of a horse,
the larger the number of draw.
The following is the distribution of winning percentage of draws over the past 15 years, we can
see that the result is generally agree with our belief, the smaller of the draw, the higher chance to
win the race, though draw 5 has a higher chance to win than draw 4.
Figure 7 Win Percentage of Different Draw
21
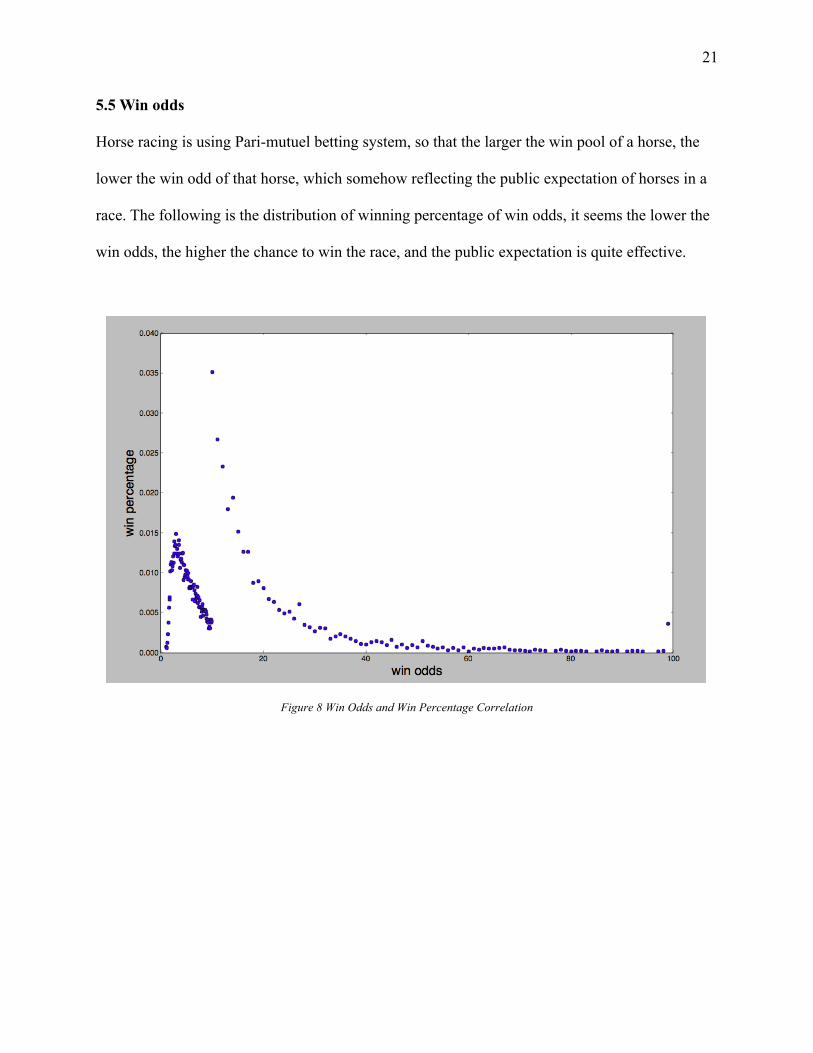
5.5 Win odds Horse racing is using Pari-mutuel betting system, so that the larger the win pool of a horse, the
lower the win odd of that horse, which somehow reflecting the public expectation of horses in a
race. The following is the distribution of winning percentage of win odds, it seems the lower the
win odds, the higher the chance to win the race, and the public expectation is quite effective.
Figure 8 Win Odds and Win Percentage Correlation
22
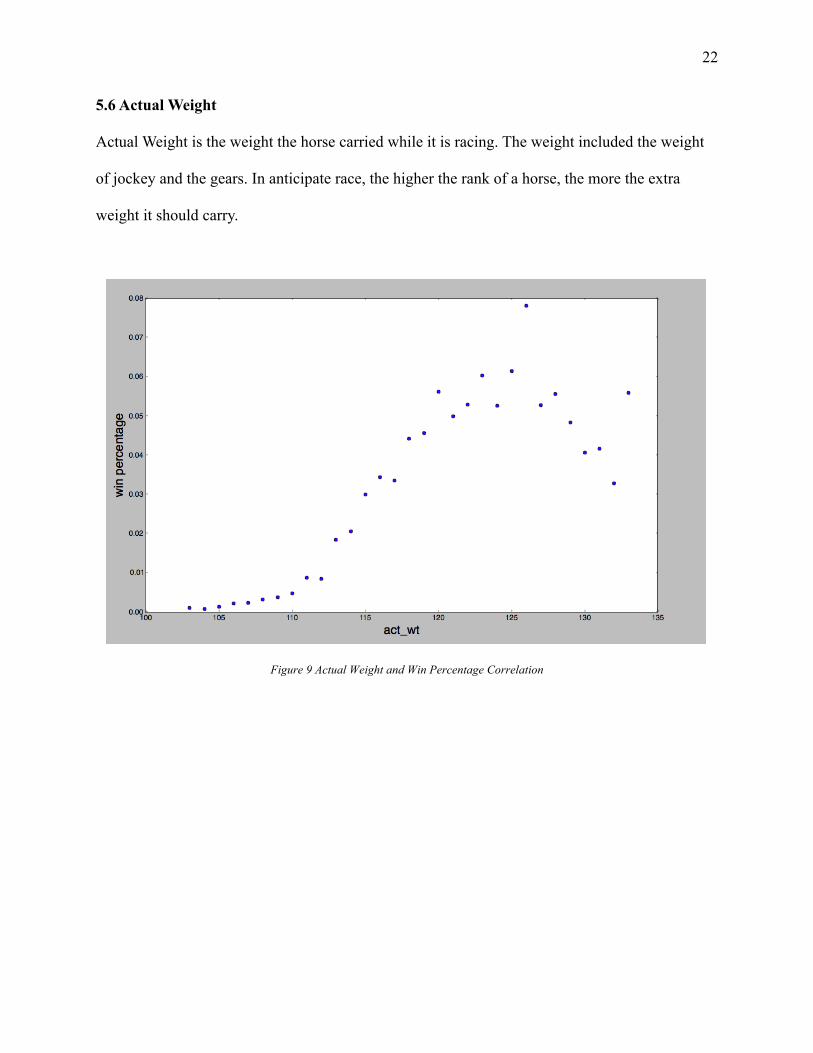
5.6 Actual Weight
Actual Weight is the weight the horse carried while it is racing. The weight included the weight
of jockey and the gears. In anticipate race, the higher the rank of a horse, the more the extra
weight it should carry.
Figure 9 Actual Weight and Win Percentage Correlation
23
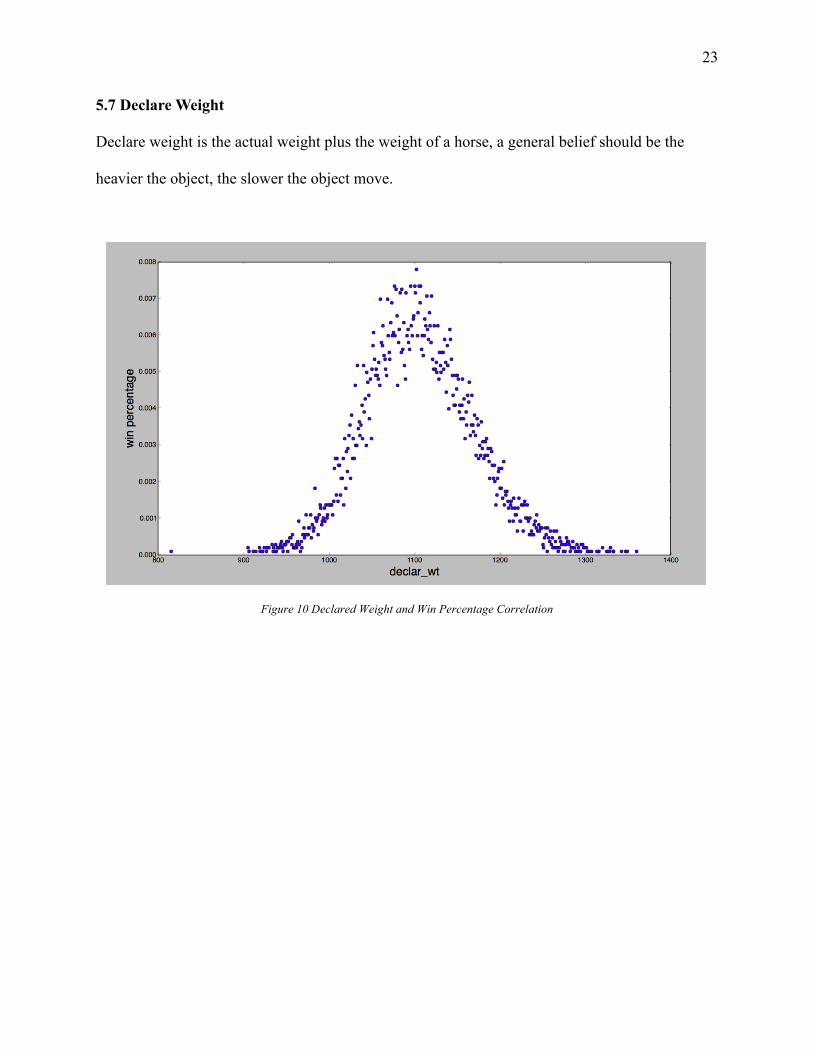
5.7 Declare Weight
Declare weight is the actual weight plus the weight of a horse, a general belief should be the
heavier the object, the slower the object move.
Figure 10 Declared Weight and Win Percentage Correlation
24
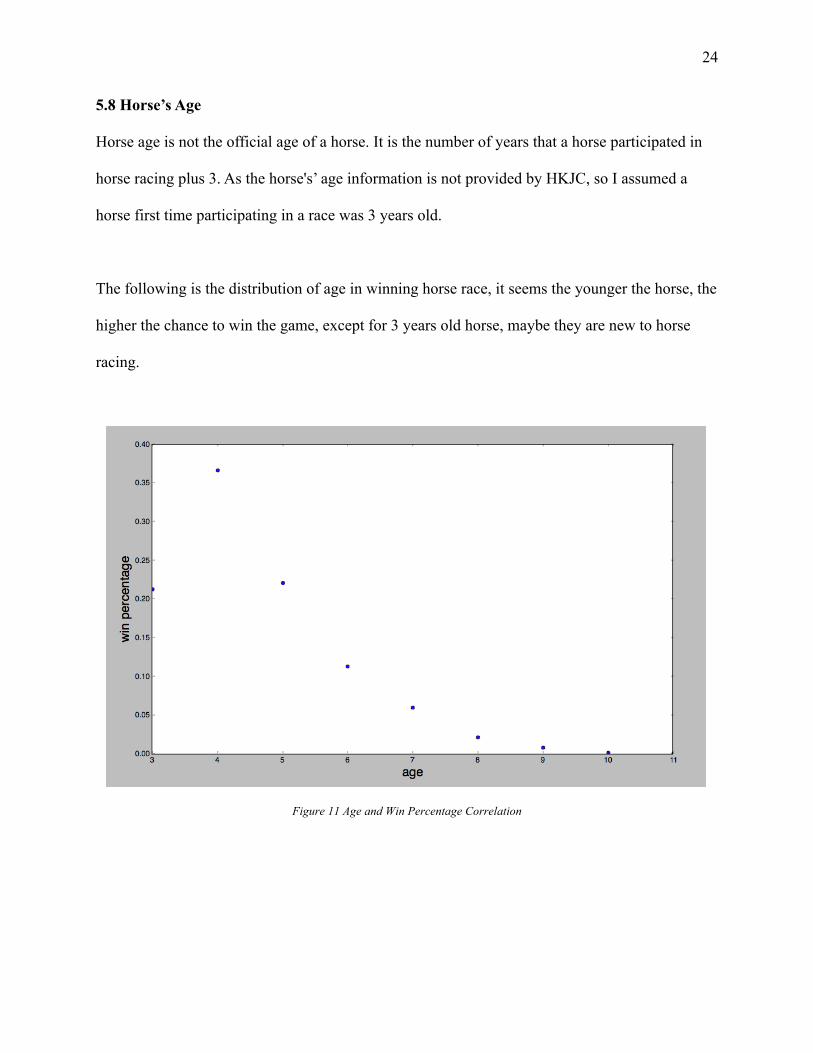
5.8 Horse’s Age
Horse age is not the official age of a horse. It is the number of years that a horse participated in
horse racing plus 3. As the horse's’ age information is not provided by HKJC, so I assumed a
horse first time participating in a race was 3 years old.
The following is the distribution of age in winning horse race, it seems the younger the horse, the
higher the chance to win the game, except for 3 years old horse, maybe they are new to horse
racing.
Figure 11 Age and Win Percentage Correlation
25
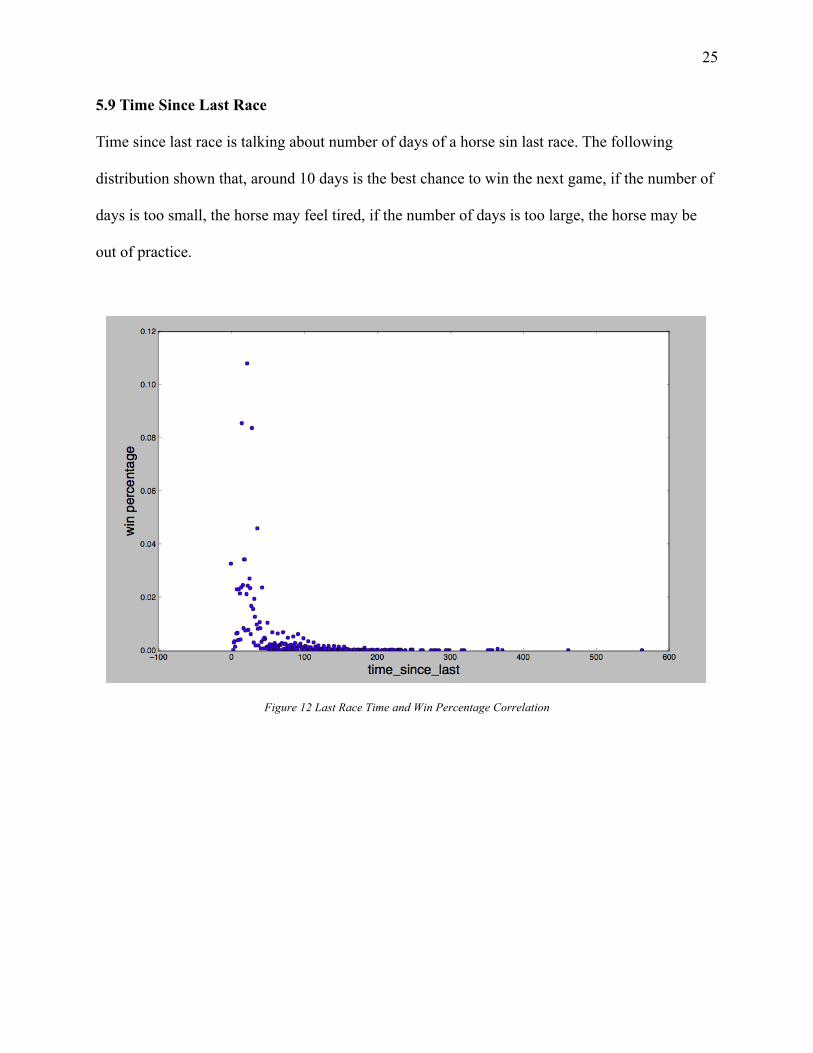
5.9 Time Since Last Race
Time since last race is talking about number of days of a horse sin last race. The following
distribution shown that, around 10 days is the best chance to win the next game, if the number of
days is too small, the horse may feel tired, if the number of days is too large, the horse may be
out of practice.
Figure 12 Last Race Time and Win Percentage Correlation
26
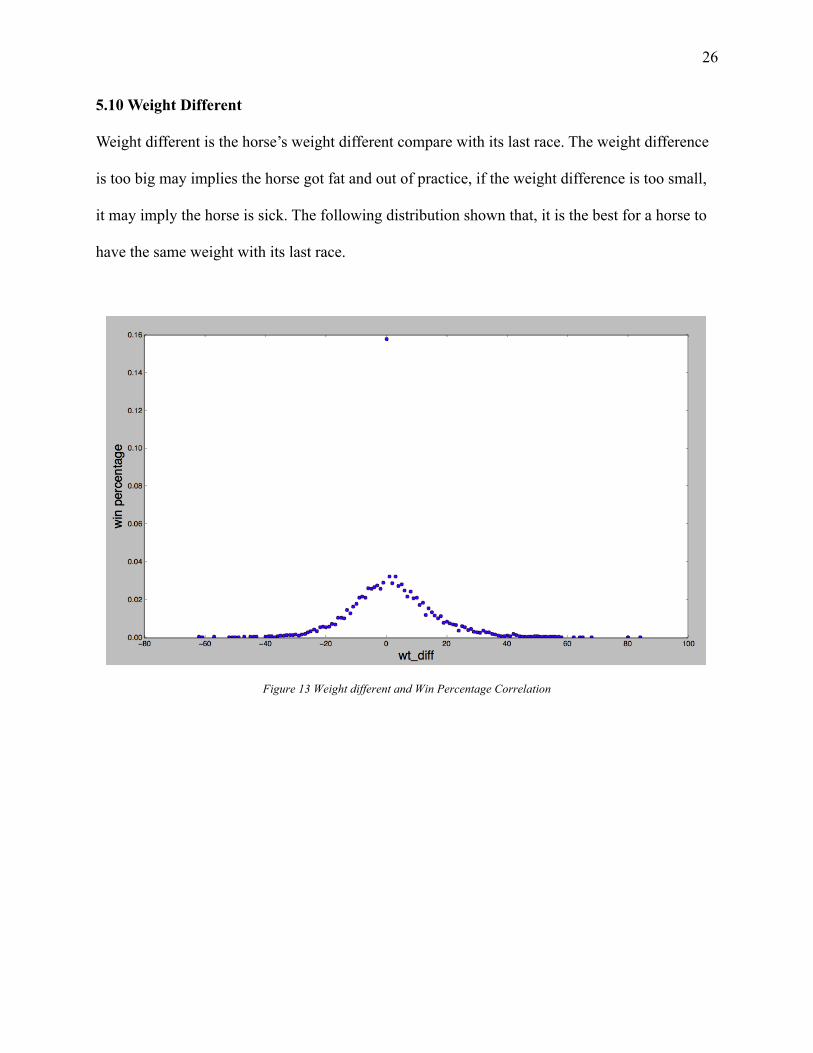
5.10 Weight Different
Weight different is the horse’s weight different compare with its last race. The weight difference
is too big may implies the horse got fat and out of practice, if the weight difference is too small,
it may imply the horse is sick. The following distribution shown that, it is the best for a horse to
have the same weight with its last race.
Figure 13 Weight different and Win Percentage Correlation
27
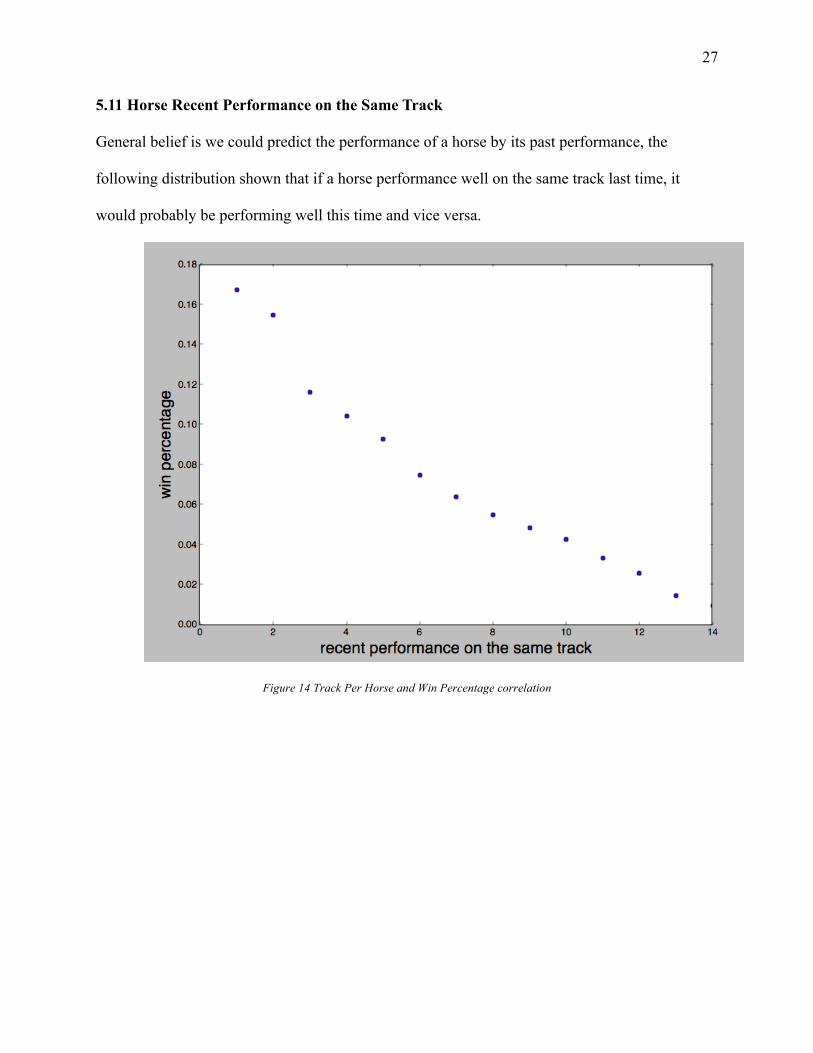
5.11 Horse Recent Performance on the Same Track
General belief is we could predict the performance of a horse by its past performance, the
following distribution shown that if a horse performance well on the same track last time, it
would probably be performing well this time and vice versa.
Figure 14 Track Per Horse and Win Percentage correlation
28
5.12 Public Intelligence
In order to achieve our objective, we need to quantify public intelligence for further comparison.
In betting period, the odds are floating by public expectation, lower odds mean higher
expectation. For that, we are going to use closing odds, final odds after betting period, to
measure the capability of public intelligence.
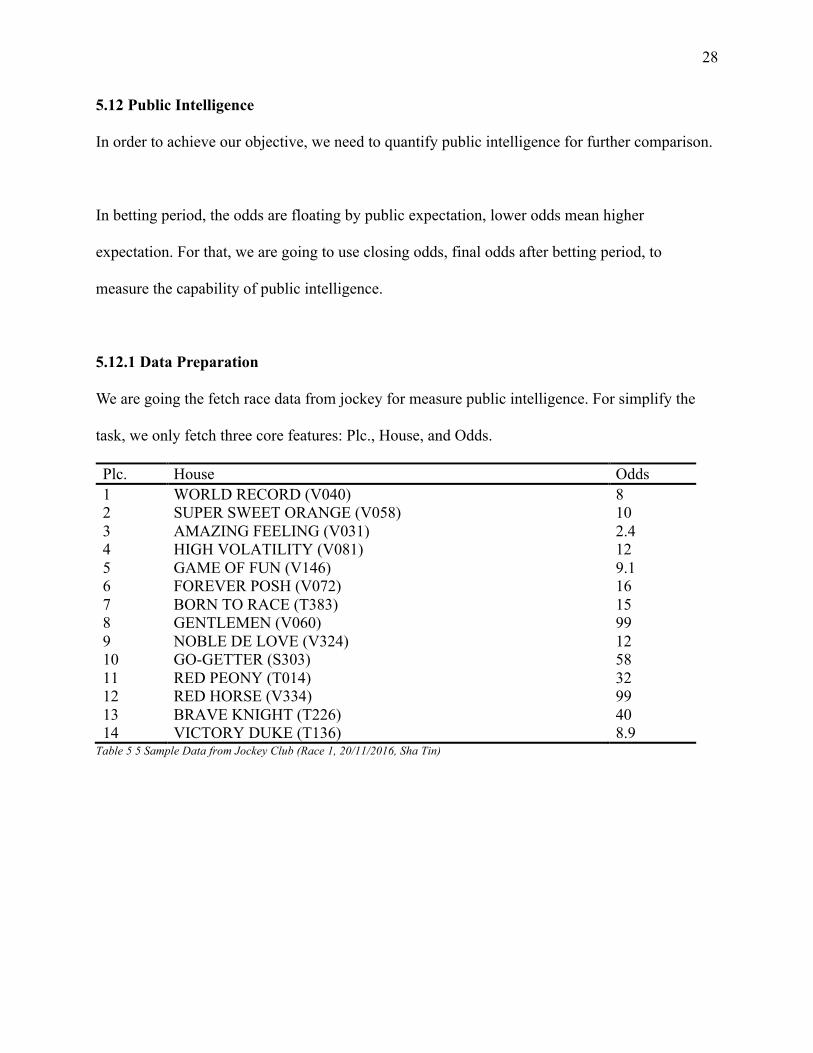
5.12.1 Data Preparation
We are going the fetch race data from jockey for measure public intelligence. For simplify the
task, we only fetch three core features: Plc., House, and Odds.
Plc. House Odds 1 WORLD RECORD (V040) 8 2 SUPER SWEET ORANGE (V058) 10 3 AMAZING FEELING (V031) 2.4 4 HIGH VOLATILITY (V081) 12 5 GAME OF FUN (V146) 9.1 6 FOREVER POSH (V072) 16 7 BORN TO RACE (T383) 15 8 GENTLEMEN (V060) 99 9 NOBLE DE LOVE (V324) 12 10 GO-GETTER (S303) 58 11 RED PEONY (T014) 32 12 RED HORSE (V334) 99 13 BRAVE KNIGHT (T226) 40 14 VICTORY DUKE (T136) 8.9
Table 5 5 Sample Data from Jockey Club (Race 1, 20/11/2016, Sha Tin)
29
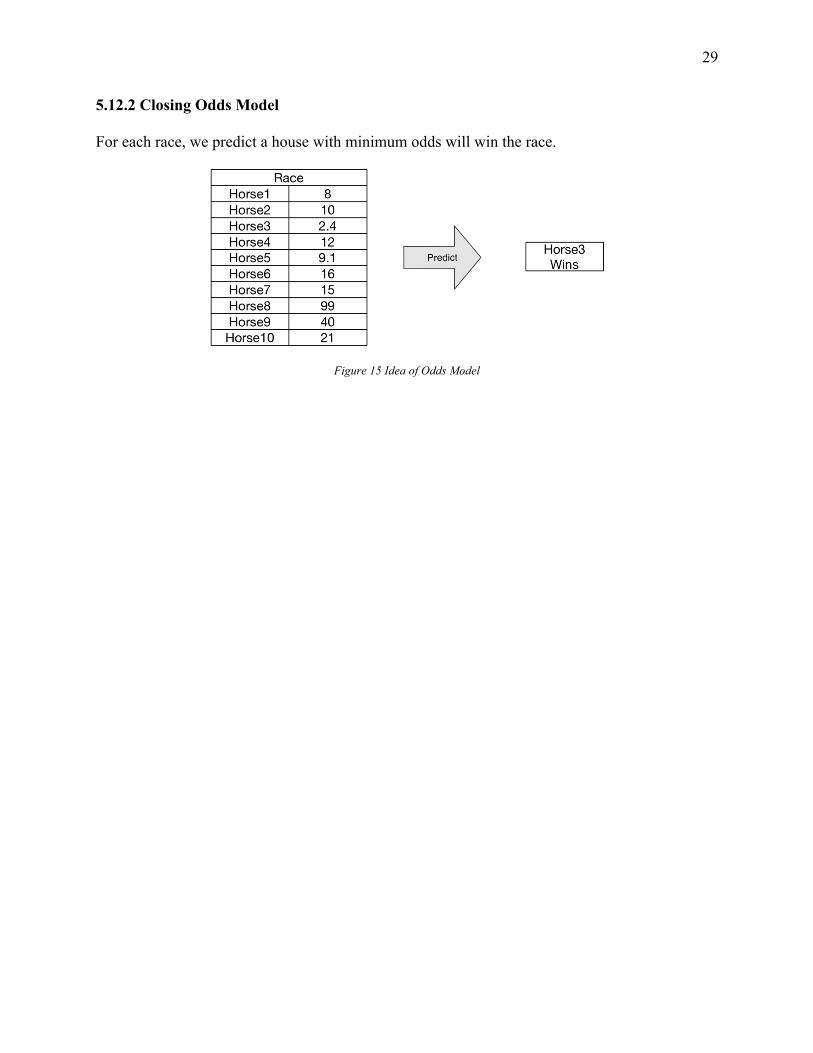
5.12.2 Closing Odds Model
For each race, we predict a house with minimum odds will win the race.
Figure 15 Idea of Odds Model
30
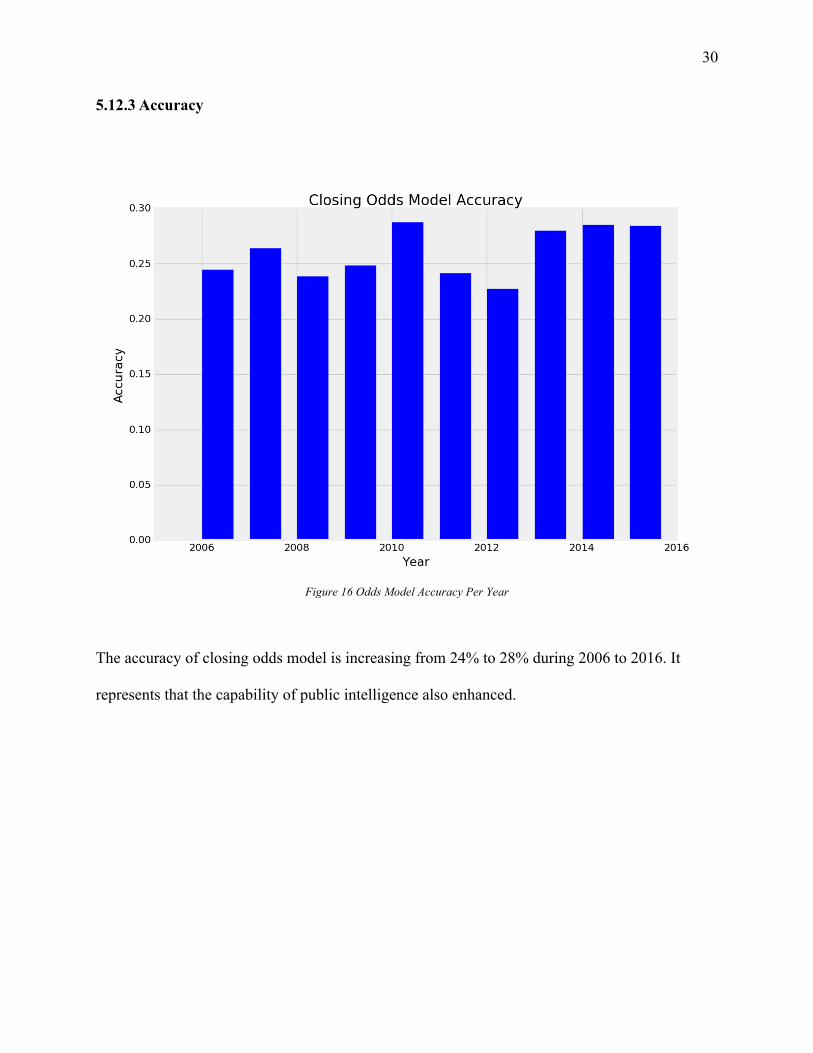
5.12.3 Accuracy
Figure 16 Odds Model Accuracy Per Year
The accuracy of closing odds model is increasing from 24% to 28% during 2006 to 2016. It
represents that the capability of public intelligence also enhanced.
31
6. Elo Rating System
As jockey, horse and trainer itself cannot be used as a single feature, we should find a way or a
value to represent their existence, and we have chosen to use Elo rating system. Elo rating
system is designed for two players originally; a generalized formula is required to apply it on
horse racing.
6.1 Elo Rating System for multiple player11
A generalized Elo rating system for multiple player has been found on the internet12, then we
have slightly modified it to fit the horse racing senatorio.
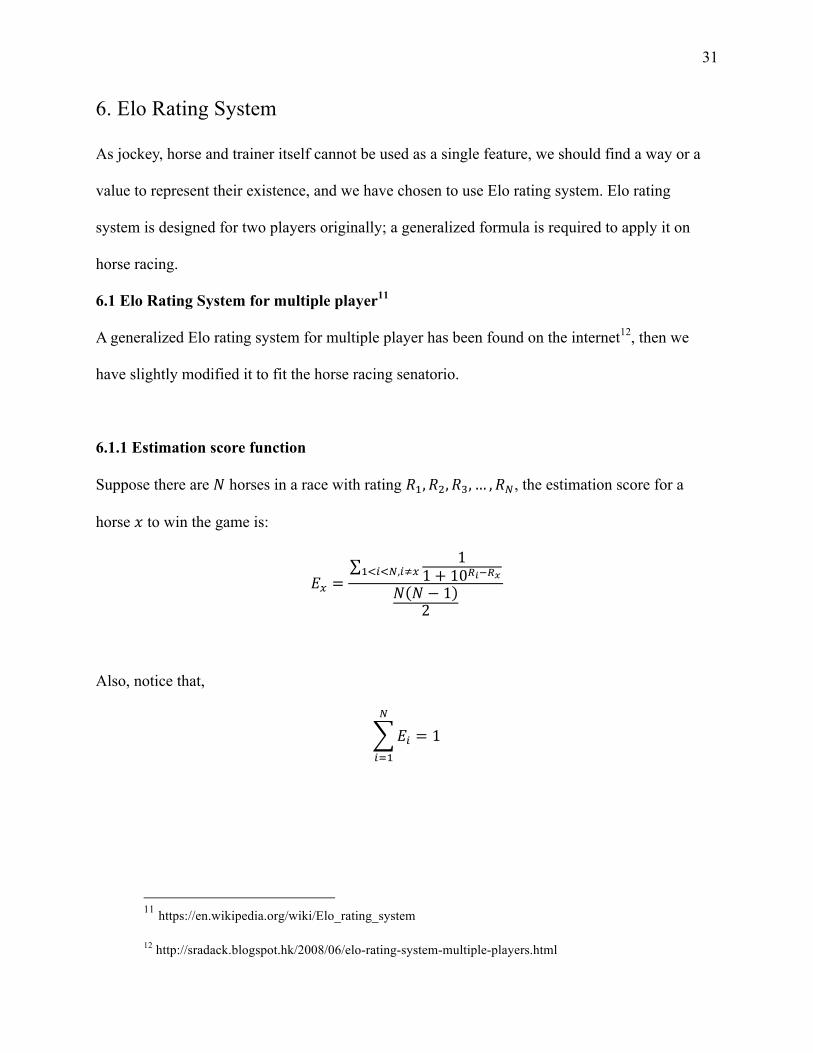
6.1.1 Estimation score function
Suppose there are ! horses in a race with rating "#, "%, "&, … , "(, the estimation score for a
horse ) to win the game is:
*+ =
1
1 + 1001203#454(,56+
! ! − 12
Also, notice that,
*5
(
59#
= 1
11 https://en.wikipedia.org/wiki/Elo_rating_system
12 http://sradack.blogspot.hk/2008/06/elo-rating-system-multiple-players.html
32
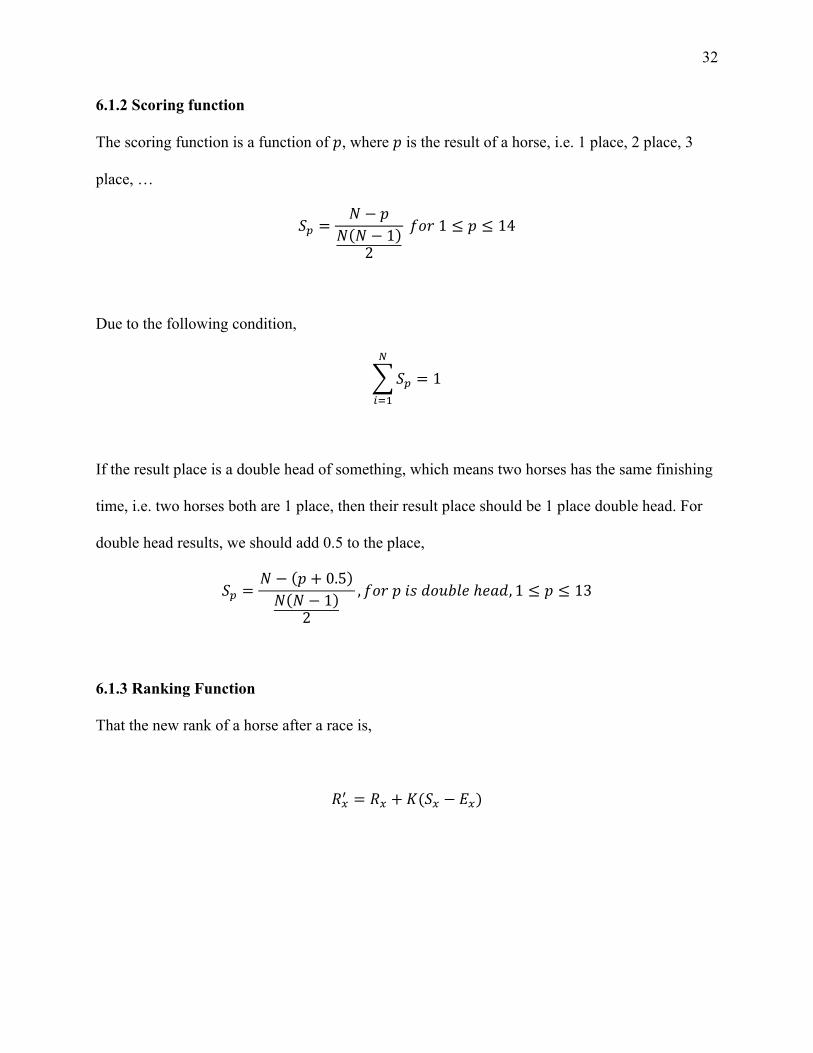
6.1.2 Scoring function
The scoring function is a function of :, where : is the result of a horse, i.e. 1 place, 2 place, 3
place, …
;< =! − :
! ! − 12
>?@1 ≤ : ≤ 14
Due to the following condition,
;<
(
59#
= 1
If the result place is a double head of something, which means two horses has the same finishing
time, i.e. two horses both are 1 place, then their result place should be 1 place double head. For
double head results, we should add 0.5 to the place,
;< =! − : + 0.5
! ! − 12
, >?@:EFG?HIJKℎKMG, 1 ≤ : ≤ 13
6.1.3 Ranking Function
That the new rank of a horse after a race is,
"+O = "+ + P(;+ − *+)
33
6.2 Compute the elo
Our goal is to compute the Elo for jockeys, horses and trainers, so that we can have a value to
represent them. In the equations mentioned above, there is a variable P.
6.2.1 Parameter Tuning
K is a factor that scales the magnitude of the change to a player's rating after a given game13.
We have to find a good K, before that we have to had a method to evaluate the K we have chosen
is good or not. The method we proposed is the following:
For every race over the past 15 years, bet on the highest elo horse/jockey/trainer, depends on
what elo we were calculating, then use the winning percentage over the past 15 years to
determine the K is good or not.
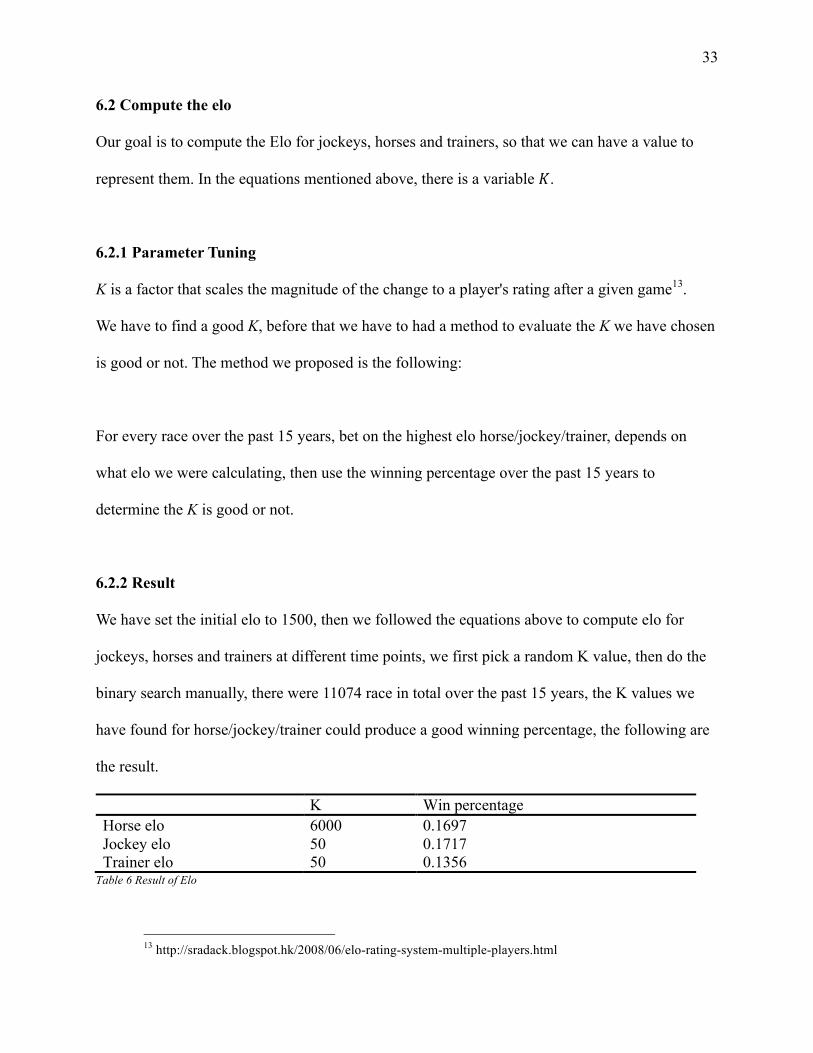
6.2.2 Result
We have set the initial elo to 1500, then we followed the equations above to compute elo for
jockeys, horses and trainers at different time points, we first pick a random K value, then do the
binary search manually, there were 11074 race in total over the past 15 years, the K values we
have found for horse/jockey/trainer could produce a good winning percentage, the following are
the result.
K Win percentage Horse elo 6000 0.1697 Jockey elo 50 0.1717 Trainer elo 50 0.1356
Table 6 Result of Elo
13 http://sradack.blogspot.hk/2008/06/elo-rating-system-multiple-players.html
34
7. Possible ways to model the problem
There are many ways to model the problem, the following are the ways we have considered.
7.1 Strength of a horse We could train a regression model to estimate the strength of a horse, in a race, we could then bet
on the horse with highest estimation score among horses. However, we don’t have a numerical
value that could represent the strength of a horse for us to use as the training label, so that this
method is not suitable for us.
7.2 Probability of a horse to win the race
We could train a classification model to classify a horse will win the race or not. As a
classification model, would produce the probability of different classes, we could then bet on the
horse with the highest probability to win the race among horses. Before we can build the model,
we should create a label for each record, if the place of a record is ‘1’ or ‘1 DH’, then we will set
the label to 1, otherwise 0.
7.3 Finishing Time
We could train a regression model to estimate the finishing time of a horse in the race, in a race,
we could then bet on the horse with the fastest estimated finishing time among horses.
7.4 Which horse will win in a race
We could train a classification model which accepts 8-14 horses’ information, then classify
which horse is more likely to win the race. Before we can build the model, we have to put all

35
horses’ information in a race into a vector, there are around 22 features for a horse, in the worst
case, there could be 308 features in a vector.
Due to a lack of time and resources, we are not able to try all of them, so that we decided to
model the problem as the probability of a horse to win the race.
36
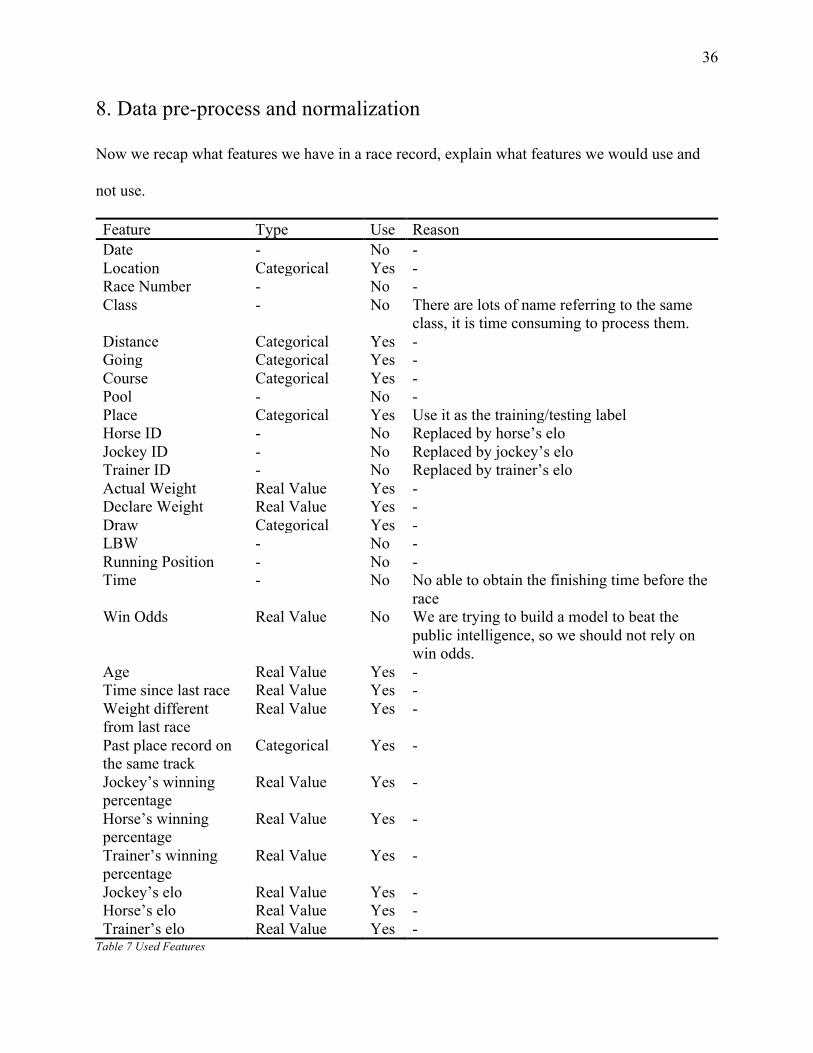
8. Data pre-process and normalization
Now we recap what features we have in a race record, explain what features we would use and
not use.
Feature Type Use Reason Date - No - Location Categorical Yes - Race Number - No - Class - No There are lots of name referring to the same
class, it is time consuming to process them. Distance Categorical Yes - Going Categorical Yes - Course Categorical Yes - Pool - No - Place Categorical Yes Use it as the training/testing label Horse ID - No Replaced by horse’s elo Jockey ID - No Replaced by jockey’s elo Trainer ID - No Replaced by trainer’s elo Actual Weight Real Value Yes - Declare Weight Real Value Yes - Draw Categorical Yes - LBW - No - Running Position - No - Time - No No able to obtain the finishing time before the
race Win Odds Real Value No We are trying to build a model to beat the
public intelligence, so we should not rely on win odds.
Age Real Value Yes - Time since last race Real Value Yes - Weight different from last race
Real Value Yes -
Past place record on the same track
Categorical Yes -
Jockey’s winning percentage
Real Value Yes -
Horse’s winning percentage
Real Value Yes -
Trainer’s winning percentage
Real Value Yes -
Jockey’s elo Real Value Yes - Horse’s elo Real Value Yes - Trainer’s elo Real Value Yes -
Table 7 Used Features
37
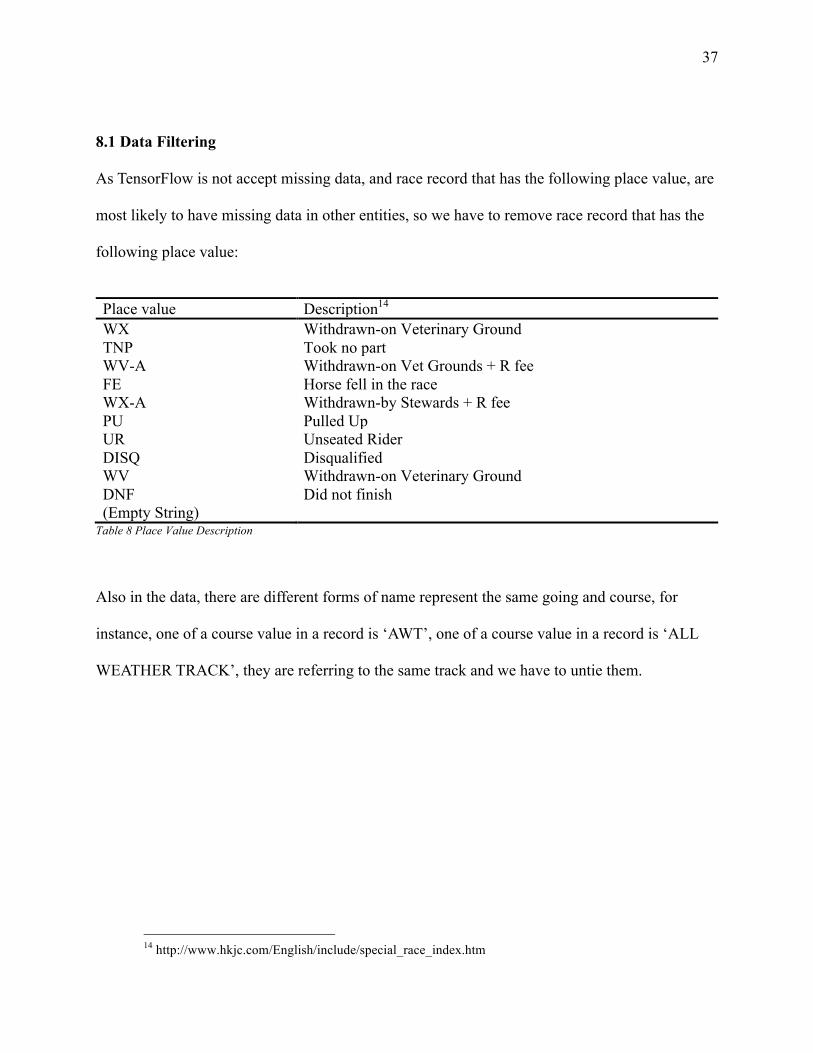
8.1 Data Filtering As TensorFlow is not accept missing data, and race record that has the following place value, are
most likely to have missing data in other entities, so we have to remove race record that has the
following place value:
Place value Description14 WX Withdrawn-on Veterinary Ground TNP Took no part WV-A Withdrawn-on Vet Grounds + R fee FE Horse fell in the race WX-A Withdrawn-by Stewards + R fee PU Pulled Up UR Unseated Rider DISQ Disqualified WV Withdrawn-on Veterinary Ground DNF Did not finish (Empty String)
Table 8 Place Value Description
Also in the data, there are different forms of name represent the same going and course, for
instance, one of a course value in a record is ‘AWT’, one of a course value in a record is ‘ALL
WEATHER TRACK’, they are referring to the same track and we have to untie them.
14 http://www.hkjc.com/English/include/special_race_index.htm
38
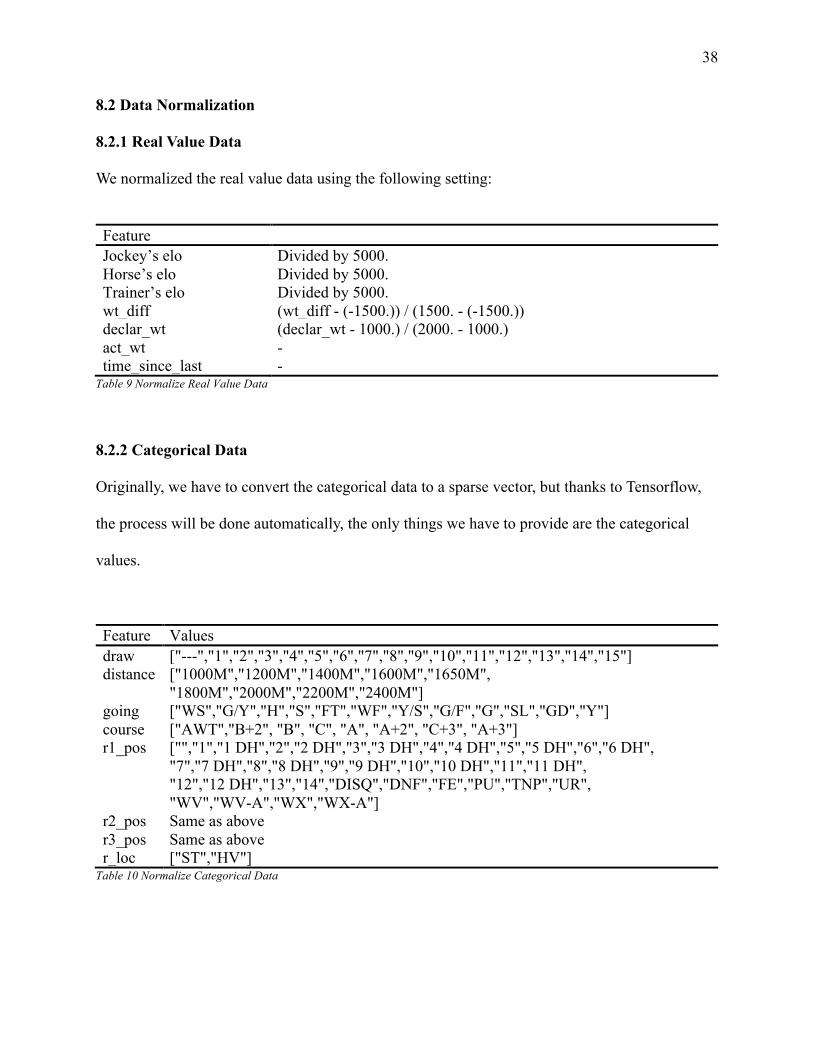
8.2 Data Normalization
8.2.1 Real Value Data We normalized the real value data using the following setting:
Feature Jockey’s elo Divided by 5000. Horse’s elo Divided by 5000. Trainer’s elo Divided by 5000. wt_diff (wt_diff - (-1500.)) / (1500. - (-1500.)) declar_wt (declar_wt - 1000.) / (2000. - 1000.) act_wt - time_since_last -
Table 9 Normalize Real Value Data
8.2.2 Categorical Data
Originally, we have to convert the categorical data to a sparse vector, but thanks to Tensorflow,
the process will be done automatically, the only things we have to provide are the categorical
values.
Feature Values draw ["---","1","2","3","4","5","6","7","8","9","10","11","12","13","14","15"] distance ["1000M","1200M","1400M","1600M","1650M",
"1800M","2000M","2200M","2400M"] going ["WS","G/Y","H","S","FT","WF","Y/S","G/F","G","SL","GD","Y"] course ["AWT","B+2", "B", "C", "A", "A+2", "C+3", "A+3"] r1_pos ["","1","1 DH","2","2 DH","3","3 DH","4","4 DH","5","5 DH","6","6 DH",
"7","7 DH","8","8 DH","9","9 DH","10","10 DH","11","11 DH", "12","12 DH","13","14","DISQ","DNF","FE","PU","TNP","UR", "WV","WV-A","WX","WX-A"]
r2_pos Same as above r3_pos Same as above r_loc ["ST","HV"]
Table 10 Normalize Categorical Data
39
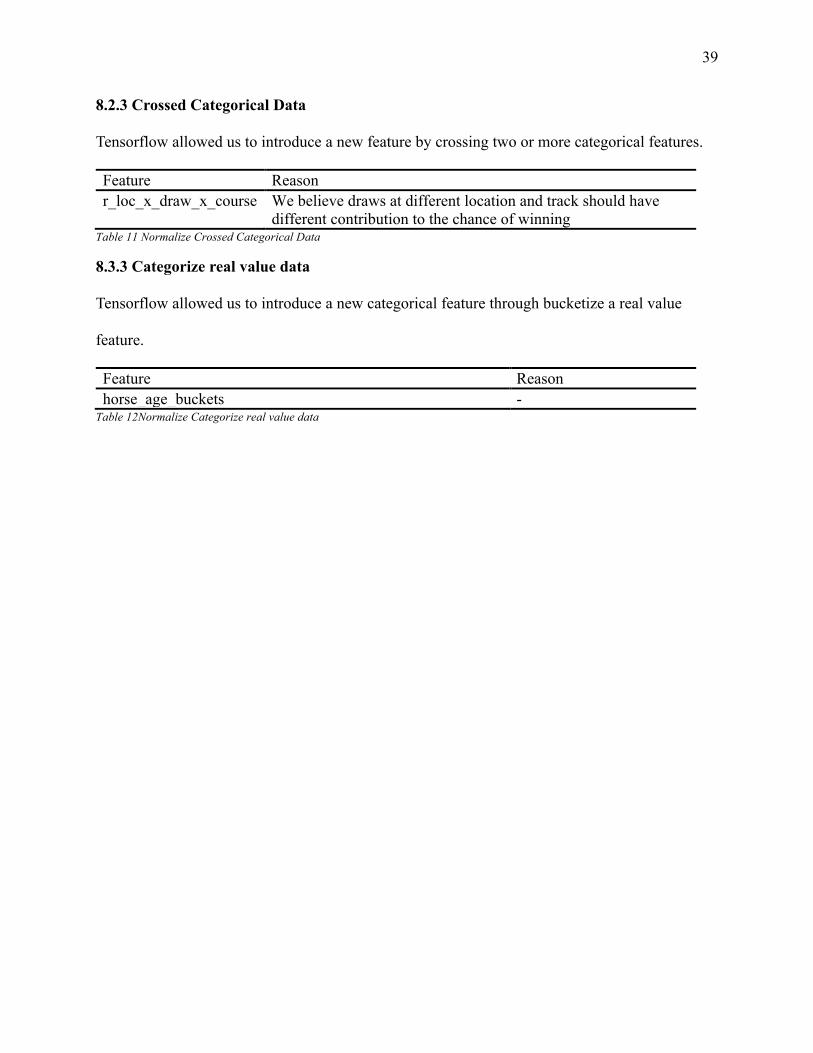
8.2.3 Crossed Categorical Data
Tensorflow allowed us to introduce a new feature by crossing two or more categorical features.
Feature Reason r_loc_x_draw_x_course We believe draws at different location and track should have
different contribution to the chance of winning Table 11 Normalize Crossed Categorical Data
8.3.3 Categorize real value data
Tensorflow allowed us to introduce a new categorical feature through bucketize a real value
feature.
Feature Reason horse_age_buckets -
Table 12Normalize Categorize real value data
40
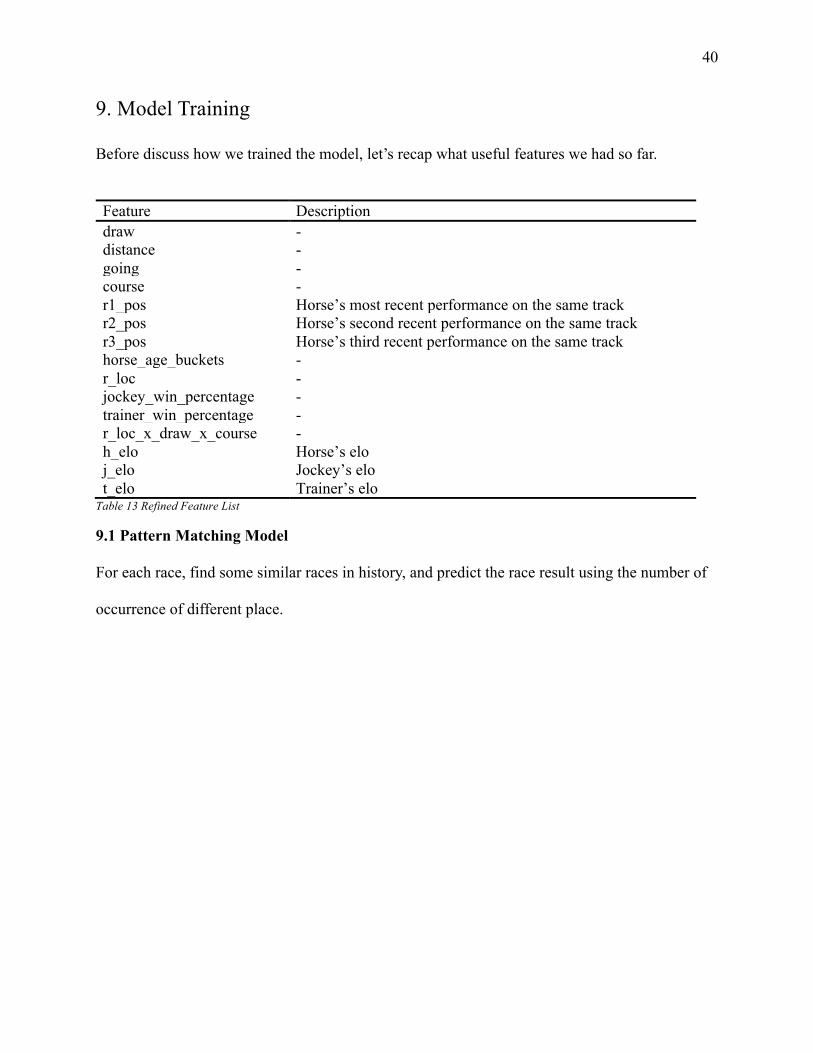
9. Model Training
Before discuss how we trained the model, let’s recap what useful features we had so far.
Feature Description draw - distance - going - course - r1_pos Horse’s most recent performance on the same track r2_pos Horse’s second recent performance on the same track r3_pos Horse’s third recent performance on the same track horse_age_buckets - r_loc - jockey_win_percentage - trainer_win_percentage - r_loc_x_draw_x_course - h_elo Horse’s elo j_elo Jockey’s elo t_elo Trainer’s elo
Table 13 Refined Feature List
9.1 Pattern Matching Model
For each race, find some similar races in history, and predict the race result using the number of
occurrence of different place.
41
9.1.1 Build Index File
We use AnnoyIndex15 to build the races history index file. The construct that, we defined:
S = SHTIK@?>ℎ?@FK
T = SHTIK@?>ℎEFU?@V@MWKF
ℎ = ℎ?@FKKJ?
X = X?WYKVKJ?
U = U@MESK@KJ?
" = ℎ5, X5, U5 >?@1 ≤ E ≤ S
ZSGK) = "5 >?@1 ≤ E ≤ T
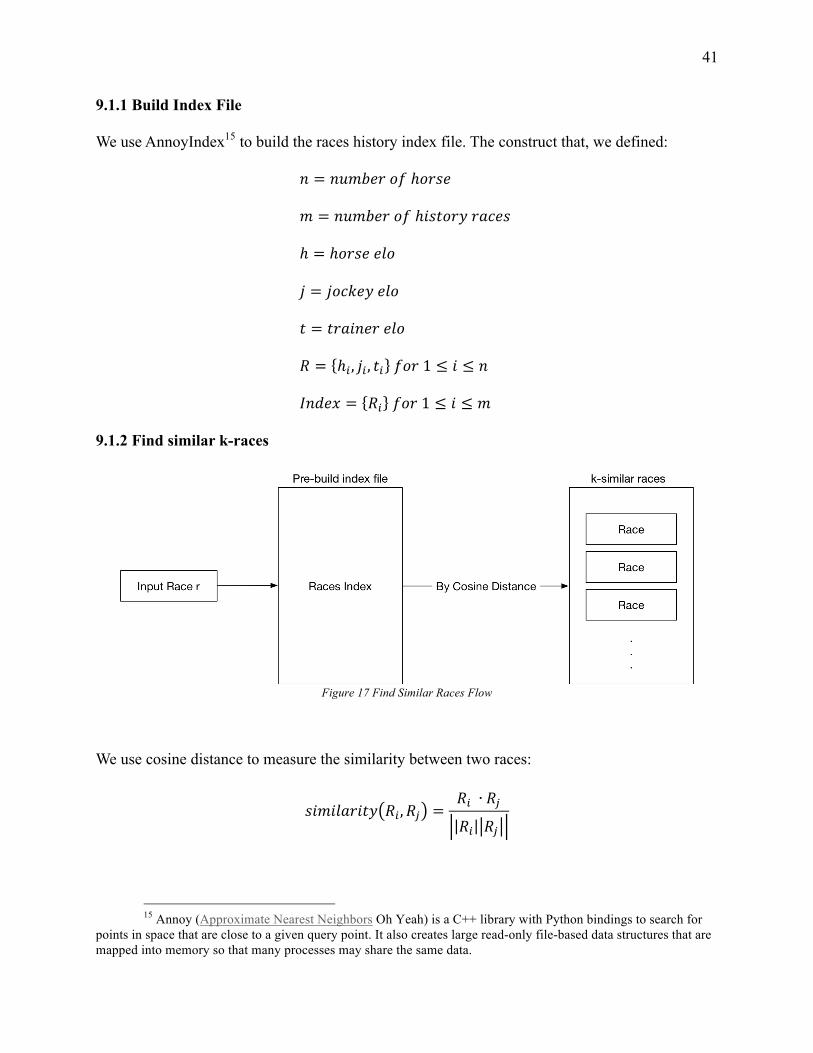
9.1.2 Find similar k-races
Figure 17 Find Similar Races Flow
We use cosine distance to measure the similarity between two races:
FETEJM@EUV "5, "[ ="5 ∙ "[
"5 "[
15 Annoy (Approximate Nearest Neighbors Oh Yeah) is a C++ library with Python bindings to search for
points in space that are close to a given query point. It also creates large read-only file-based data structures that are mapped into memory so that many processes may share the same data.
42
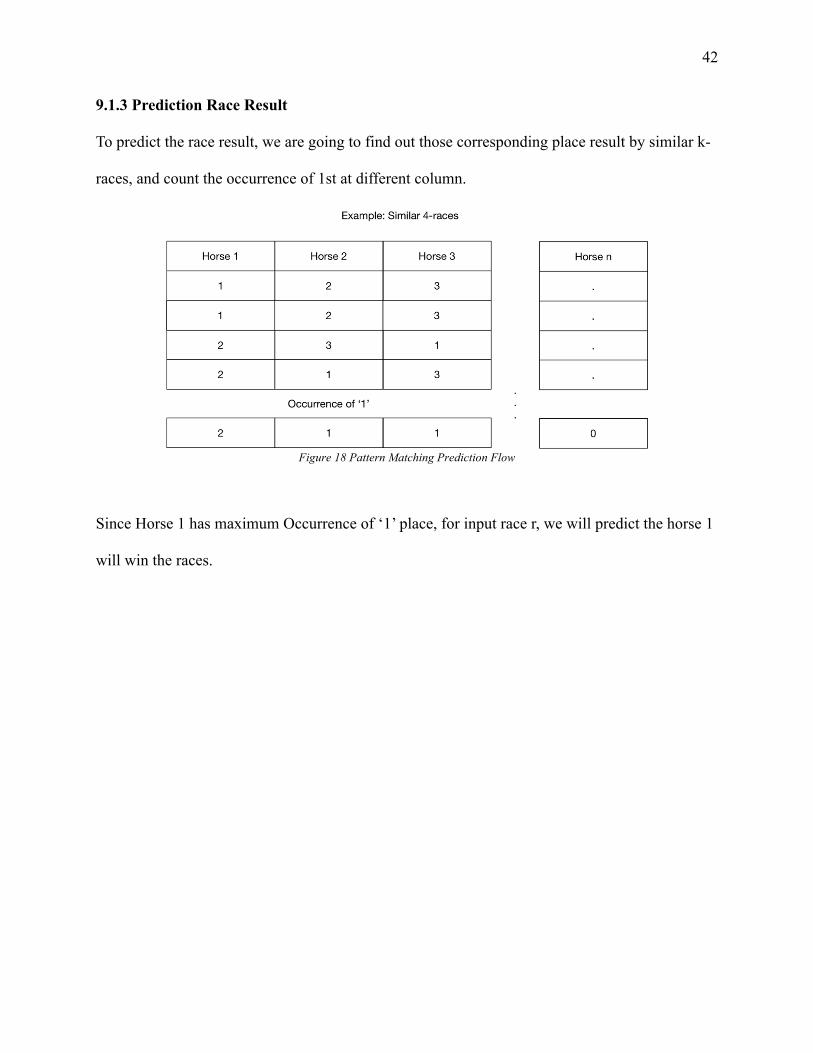
9.1.3 Prediction Race Result
To predict the race result, we are going to find out those corresponding place result by similar k-
races, and count the occurrence of 1st at different column.
Figure 18 Pattern Matching Prediction Flow
Since Horse 1 has maximum Occurrence of ‘1’ place, for input race r, we will predict the horse 1
will win the races.
43
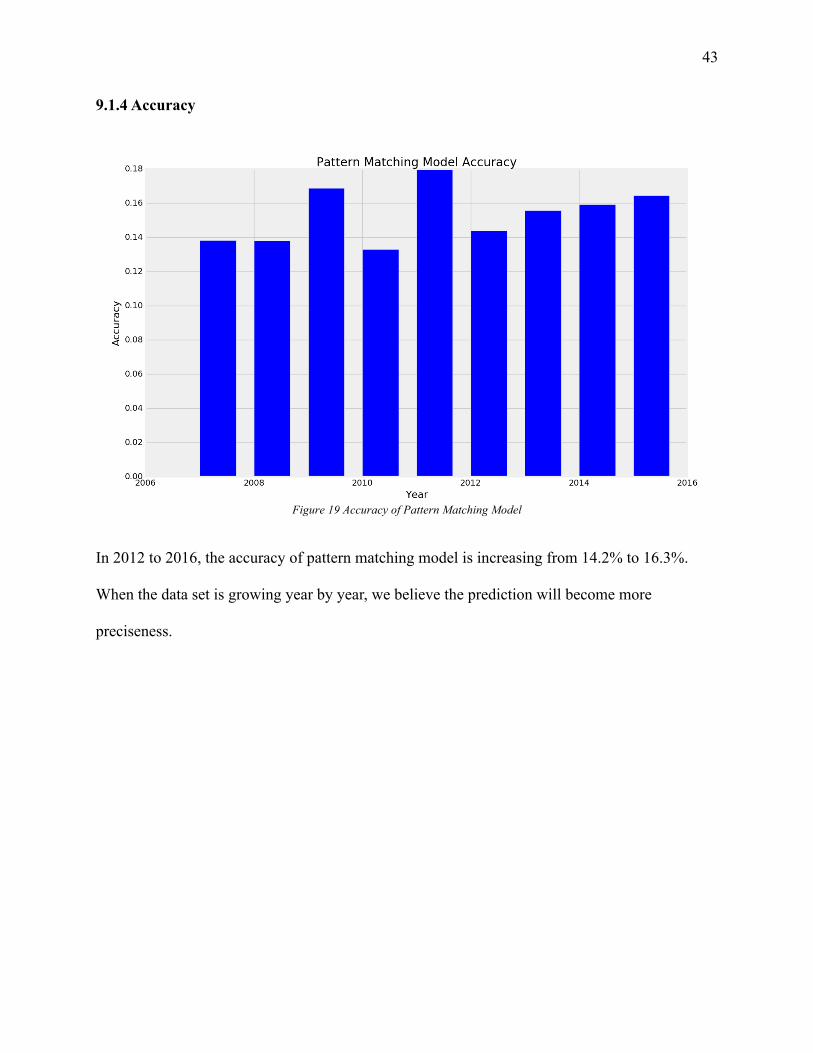
9.1.4 Accuracy
Figure 19 Accuracy of Pattern Matching Model
In 2012 to 2016, the accuracy of pattern matching model is increasing from 14.2% to 16.3%.
When the data set is growing year by year, we believe the prediction will become more
preciseness.
44
9.2 Linear Model
Linear model as known as logistic regression model, the following is the model build-in in
Tensorflow.
] ^ = 1 _ =1
1 + exp −(cd) + I)
where Y is the label, 1 is a horse win the race, 0 is a horse not win the race, X is the set of
features {)#, )%, )&, … , )f}. Thanks to Tensorflow, we don’t have to take care the details, we
things we have to care are how to prepare Y and X.
9.2.1 Data Preparation
For Y, we added one more column for each race record, which called ‘Label’. If the place value
of a race record is ‘1’ or ‘1 DH’, then we set ‘label’ to 1, otherwise set to 0. For X, we will put all
the features mentioned above into one vector called X.
9.2.2 Unbalanced dataset
As each race most likely had one winner and in max only had two, therefore the dataset ratio
would be around 10:1 for Y = 0 and Y = 1, which made the dataset extremely unbalance.
Unbalance dataset could potentially be trained a classifier with very high accuracy, but in fact it
only outputting Y=0 despite what we input, that’s not what we want. We have tried two methods
to solve this issue.
9.2.2.1 Duplicating data
We could duplicate each race record with Y = 1 10 times, then we could maintain the
balance. However, this method would increase the total number of number, increase the training
45
time, this method might also affect the cross-validation result, it is because when we splitting the
dataset into training set and validation set, we should make sure there are not intersection
between two sets.
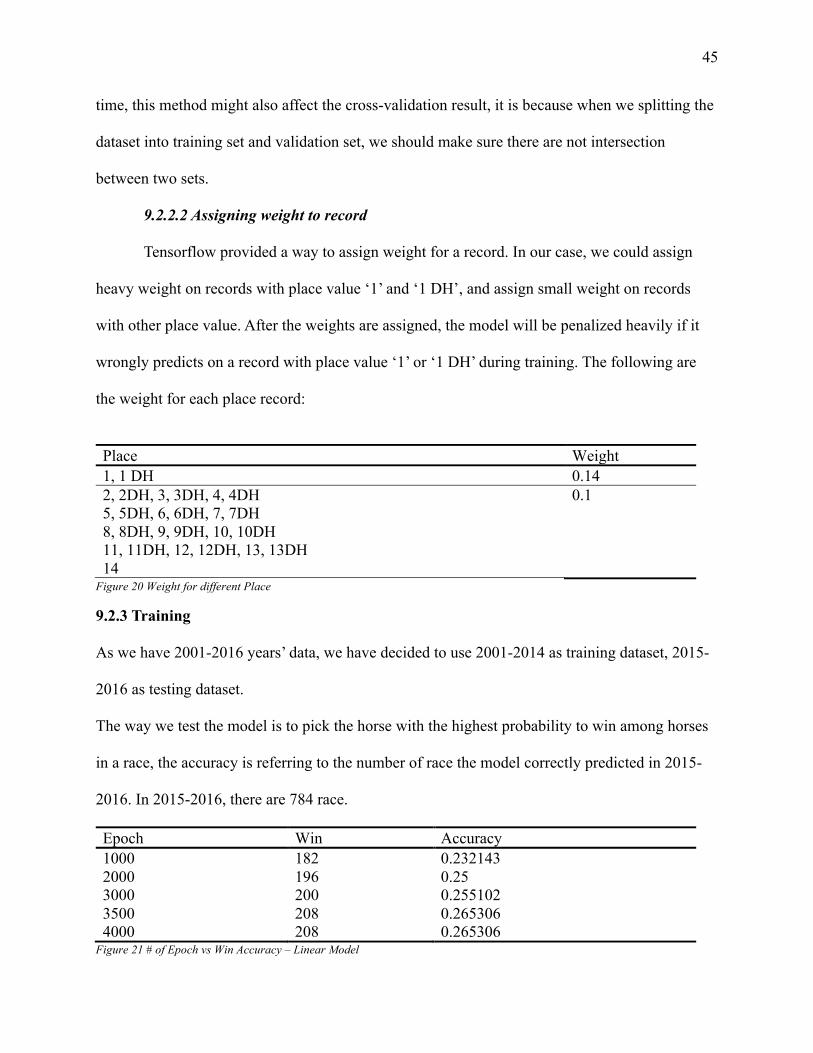
9.2.2.2 Assigning weight to record
Tensorflow provided a way to assign weight for a record. In our case, we could assign
heavy weight on records with place value ‘1’ and ‘1 DH’, and assign small weight on records
with other place value. After the weights are assigned, the model will be penalized heavily if it
wrongly predicts on a record with place value ‘1’ or ‘1 DH’ during training. The following are
the weight for each place record:
Place Weight 1, 1 DH 0.14 2, 2DH, 3, 3DH, 4, 4DH 5, 5DH, 6, 6DH, 7, 7DH 8, 8DH, 9, 9DH, 10, 10DH 11, 11DH, 12, 12DH, 13, 13DH 14
0.1
Figure 20 Weight for different Place
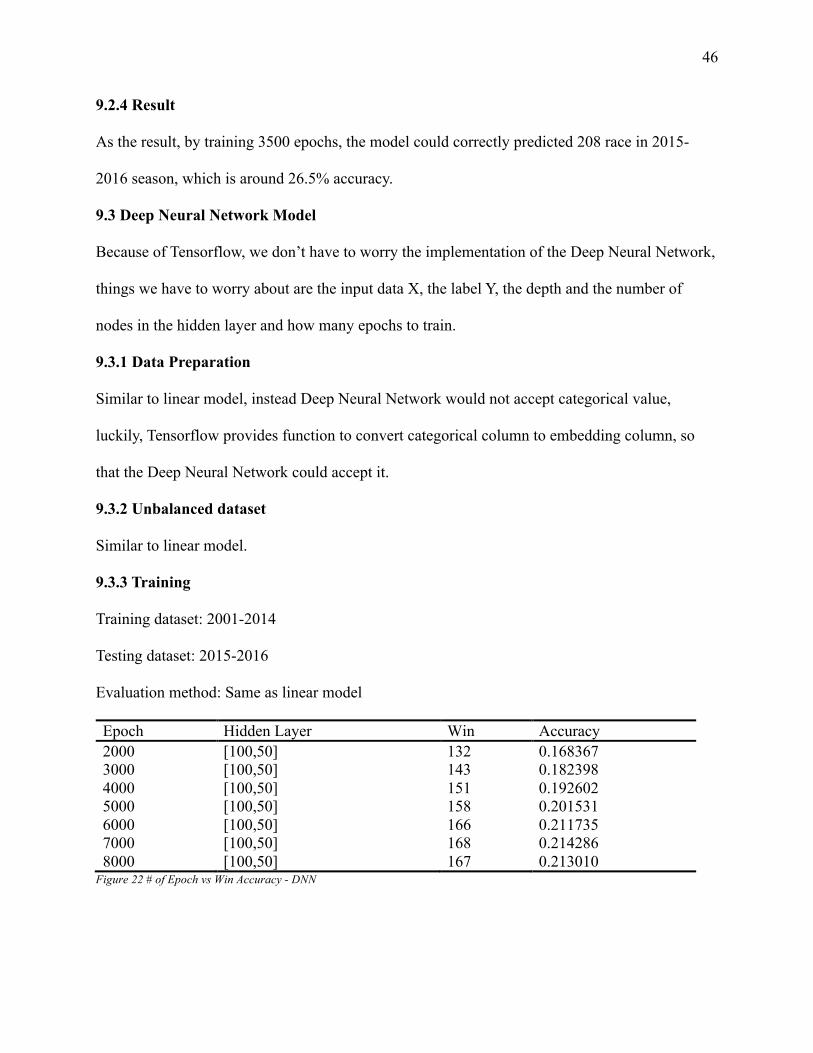
9.2.3 Training
As we have 2001-2016 years’ data, we have decided to use 2001-2014 as training dataset, 2015-
2016 as testing dataset.
The way we test the model is to pick the horse with the highest probability to win among horses
in a race, the accuracy is referring to the number of race the model correctly predicted in 2015-
2016. In 2015-2016, there are 784 race.
Epoch Win Accuracy 1000 182 0.232143 2000 196 0.25 3000 200 0.255102 3500 208 0.265306 4000 208 0.265306
Figure 21 # of Epoch vs Win Accuracy – Linear Model
46
9.2.4 Result
As the result, by training 3500 epochs, the model could correctly predicted 208 race in 2015-
2016 season, which is around 26.5% accuracy.
9.3 Deep Neural Network Model
Because of Tensorflow, we don’t have to worry the implementation of the Deep Neural Network,
things we have to worry about are the input data X, the label Y, the depth and the number of
nodes in the hidden layer and how many epochs to train.
9.3.1 Data Preparation
Similar to linear model, instead Deep Neural Network would not accept categorical value,
luckily, Tensorflow provides function to convert categorical column to embedding column, so
that the Deep Neural Network could accept it.
9.3.2 Unbalanced dataset
Similar to linear model.
9.3.3 Training
Training dataset: 2001-2014
Testing dataset: 2015-2016
Evaluation method: Same as linear model
Epoch Hidden Layer Win Accuracy 2000 [100,50] 132 0.168367 3000 [100,50] 143 0.182398 4000 [100,50] 151 0.192602 5000 [100,50] 158 0.201531 6000 [100,50] 166 0.211735 7000 [100,50] 168 0.214286 8000 [100,50] 167 0.213010
Figure 22 # of Epoch vs Win Accuracy - DNN

47
9.3.4 Result
The best result could achieved by training 7000 epochs.
48
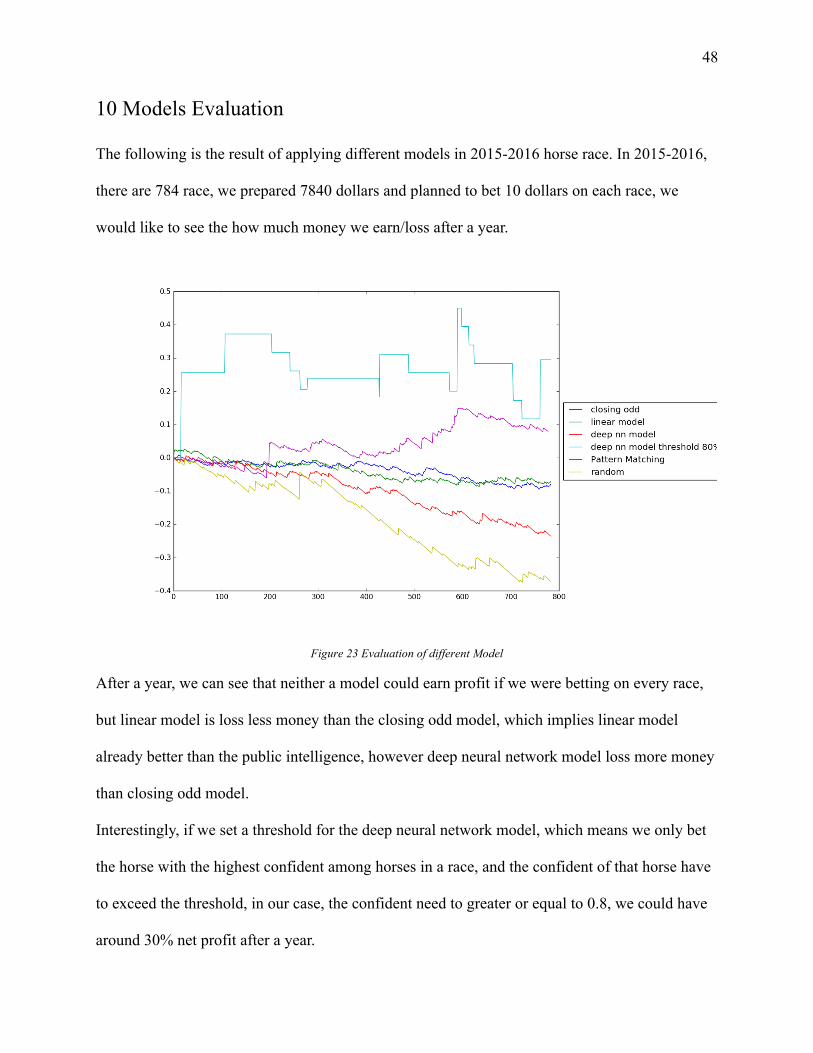
10 Models Evaluation
The following is the result of applying different models in 2015-2016 horse race. In 2015-2016,
there are 784 race, we prepared 7840 dollars and planned to bet 10 dollars on each race, we
would like to see the how much money we earn/loss after a year.
Figure 23 Evaluation of different Model
After a year, we can see that neither a model could earn profit if we were betting on every race,
but linear model is loss less money than the closing odd model, which implies linear model
already better than the public intelligence, however deep neural network model loss more money
than closing odd model.
Interestingly, if we set a threshold for the deep neural network model, which means we only bet
the horse with the highest confident among horses in a race, and the confident of that horse have
to exceed the threshold, in our case, the confident need to greater or equal to 0.8, we could have
around 30% net profit after a year.
49
11. Limitation and difficulties
Webpage technology has changed a lot over years, so that when we are developing the scraper to
collect the data from HKJC, we need to write a lot of exceptional cases, different versions for
different year of data.
Also preparing data is time consuming, in this semester, almost 90% of the time spent on the
project were using for structuring the data, formatting the data and filtering the data.
Moreover, although HKJC provided lots of data on their website, some important data have not
disclosed, such as opening odds, official horse's age, jockey’s health etc. A much more accurate
model could be developed if more data could be reached.

50
12. Future works
Next semester, we would continuous to improve our models in terms of accuracy and profit
earning. We would automate the process of updating data from HKJC, and pack with our trained
model to build a software.

51
13. Conclusion
To conclude, we have successfully trained a model (Linear Model) that could beat the public
intelligence (Closing odds Model) in general, and we could generate profit in 2015-2016 by
setting a 80% threshold in the model trained with deep neural network and by a model driven by
pattern matching.

52
14. Acknowledgements
We would like to express our sincere thanks and appreciation to Professor LYU Rung Tsong
Michael for giving clear guidance, effective opinions and encouragement. Also, we would like to
thank you Mr.Edward Yau for brainstorming and have deep discussions with us.
53
15.References
[1] https://global.britannica.com/sports/horse-racing
[2] https://en.wikipedia.org/wiki/Hong_Kong_Jockey_Club
[3] https://en.wikipedia.org/wiki/Parimutuel_betting
[4] http://special.hkjc.com/racing/info/en/betting/guide_qualifications_pari.asp
[5] https://en.wikipedia.org/wiki/Hong_Kong_Jockey_Club
[6] https://www.sciencedaily.com/terms/web_crawler.htm
[7] http://creativyst.com/Doc/Articles/CSV/CSV01.htm
[8] https://twitter.com/postgresql
[9] https://www.postgresql.org/about/
[10]https://eggerapps.at/postico/
[11]https://en.wikipedia.org/wiki/Elo_rating_system
[12]http://sradack.blogspot.hk/2008/06/elo-rating-system-multiple-players.html
[13]http://sradack.blogspot.hk/2008/06/elo-rating-system-multiple-players.html
[14]http://www.hkjc.com/English/include/special_race_index.htm
54
16 Appendix
Figure 1PostgreSQL Logo ............................................................................................................ 13
Figure 2 Postico User Interface ..................................................................................................... 14
Figure 3 Horse Racing ER-Diagram ............................................................................................. 15
Figure 4 Jockey Participation ........................................................................................................ 17
Figure 5 Horse Participation ......................................................................................................... 18
Figure 6 Trained Horse Per Trainer .............................................................................................. 19
Figure 7 Win Percentage of Different Draw ................................................................................. 20
Figure 8 Win Odds and Win Percentage Correlation .................................................................... 21
Figure 9 Actual Weight and Win Percentage Correlation ............................................................. 22
Figure 10 Declared Weight and Win Percentage Correlation ....................................................... 23
Figure 11 Age and Win Percentage Correlation ............................................................................ 24
Figure 12 Last Race Time and Win Percentage Correlation ......................................................... 25
Figure 13 Weight different and Win Percentage Correlation ........................................................ 26
Figure 14 Track Per Horse and Win Percentage correlation ......................................................... 27
Figure 15 Idea of Odds Model ...................................................................................................... 29
Figure 16 Odds Model Accuracy Per Year .................................................................................... 30
Figure 17 Find Similar Races Flow .............................................................................................. 41
Figure 18 Pattern Matching Prediction Flow ................................................................................ 42
Figure 19 Accuracy of Pattern Matching Model ........................................................................... 43
Figure 20 Weight for different Place ............................................................................................. 45
Figure 21 # of Epoch vs Win Accuracy – Linear Model .............................................................. 45
Figure 22 # of Epoch vs Win Accuracy - DNN ............................................................................ 46
55
Figure 23 Evaluation of different Model ...................................................................................... 48
15.3 Table References
Table 1 Types of bet provided by Hong Kong Jockey Club ........................................................... 9
Table 2 Race features .................................................................................................................... 12
Table 3 Horse Features .................................................................................................................. 12
Table 4 Extract Features ................................................................................................................ 16
Table 5 5 Sample Data from Jockey Club (Race 1, 20/11/2016, Sha Tin) ................................... 28
Table 6 Result of Elo ..................................................................................................................... 33
Table 7 Used Features ................................................................................................................... 36
Table 8 Place Value Description ................................................................................................... 37
Table 9 Normalize Real Value Data .............................................................................................. 38
Table 10 Normalize Categorical Data ........................................................................................... 38
Table 11 Normalize Crossed Categorical Data ............................................................................. 39
Table 12Normalize Categorize real value data ............................................................................. 39
Table 13 Refined Feature List ....................................................................................................... 40