Predicting health outcomes and safety behaviour in taxi drivers
28
Predicting health outcomes and safety behaviour in taxi drivers M. Anthony Machin & Jillian M. D. De Souza Centre for Organisational Research and Evaluation University of Southern Queensland Correspondence concerning this article should be addressed to Dr. Tony Machin, Department of Psychology, University of Southern Queensland, Toowoomba, 4350. Australia. Telephone +61 7 46312587. Fax +61 7 46312721. Email: [email protected] . Web: www.usq.edu.au/users/machin . Running Head: Taxi Driver Health Outcomes and Safety Behaviour Word count: 5,853
Transcript of Predicting health outcomes and safety behaviour in taxi drivers

Predicting health outcomes and safety behaviour in taxi drivers
M. Anthony Machin & Jillian M. D. De Souza
Centre for Organisational Research and Evaluation
University of Southern Queensland
Correspondence concerning this article should be addressed to Dr. Tony Machin, Department
of Psychology, University of Southern Queensland, Toowoomba, 4350. Australia. Telephone
+61 7 46312587. Fax +61 7 46312721. Email: [email protected] . Web:
www.usq.edu.au/users/machin .
Running Head: Taxi Driver Health Outcomes and Safety Behaviour
Word count: 5,853

Taxi Driver Health Outcomes and Safety Behaviour 2
ABSTRACT
Workplace hazards have been a major cause of concern in the taxi industry and management
has been actively involved in trying to reduce the hazards faced by taxi drivers. However, it
appears that there has not been sufficient emphasis placed on the physical health and
emotional well-being of drivers. This research project integrates the various factors that
influence the safety behaviour, physical health and emotional well-being of taxi drivers into a
theoretical model that shows hazards, aversion to risk-taking, aggression, and drivers’
perceptions of management’s commitment to health and safety as directly influencing
physical symptoms, emotional well-being, and unsafe behaviour of taxi drivers. Multiple
regression analyses indicated that the amount of hazards taxi drivers encountered did
contribute to the prediction of their physical health and emotional well-being but not to unsafe
behaviour. Hazards, displaying aggression, and perceptions of management’s commitment to
health and safety were all significant predictors of the amount of drivers’ emotional well-
being, while aversion to risk-taking, aggression, and perceptions of management’s
commitment to health and safety were significant predictors of drivers’ unsafe behaviour. It is
recommended that the taxi industry takes an integrative approach to ensuring taxi driver
health and safety that incorporates prevention of hazardous situations, developing and
communicating a positive climate for safety among taxi drivers, screening of potential drivers,
and health and safety training for drivers.
Key Words: Safety Behaviour, Safety Climate, Health, Well-Being, Taxi Drivers
Taxi Driver Health Outcomes and Safety Behaviour 3
Predicting health outcomes and safety behaviour in taxi drivers
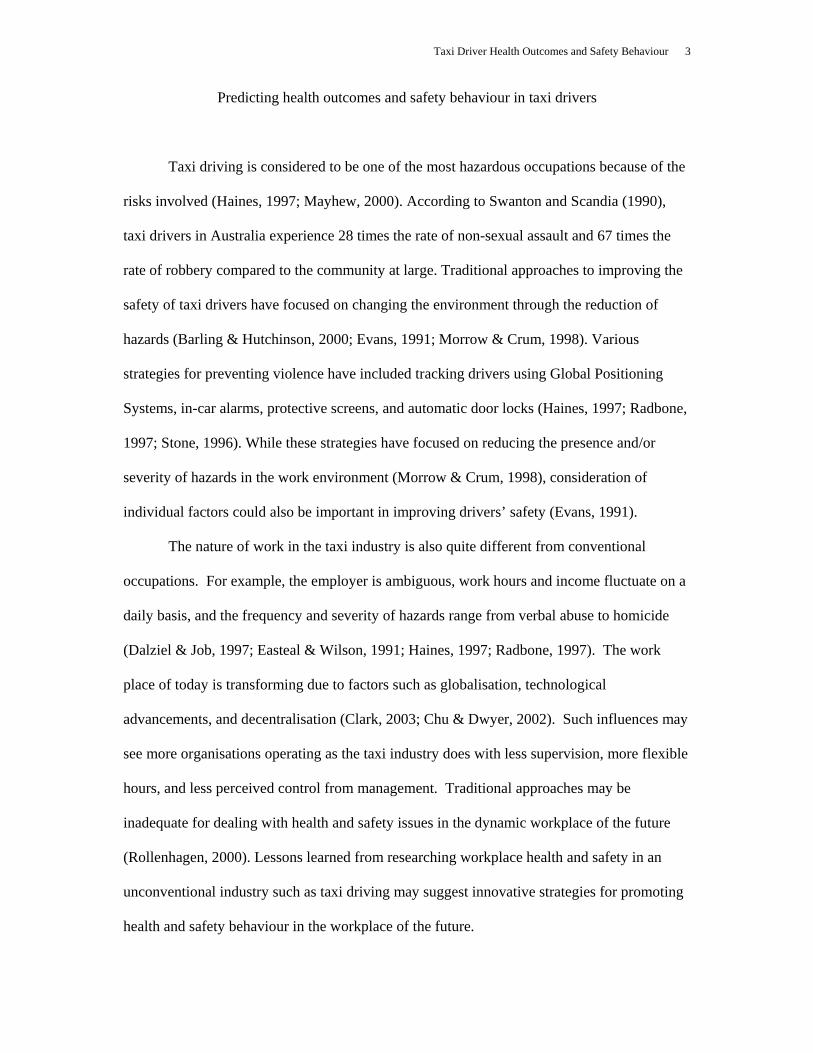
Taxi driving is considered to be one of the most hazardous occupations because of the
risks involved (Haines, 1997; Mayhew, 2000). According to Swanton and Scandia (1990),
taxi drivers in Australia experience 28 times the rate of non-sexual assault and 67 times the
rate of robbery compared to the community at large. Traditional approaches to improving the
safety of taxi drivers have focused on changing the environment through the reduction of
hazards (Barling & Hutchinson, 2000; Evans, 1991; Morrow & Crum, 1998). Various
strategies for preventing violence have included tracking drivers using Global Positioning
Systems, in-car alarms, protective screens, and automatic door locks (Haines, 1997; Radbone,
1997; Stone, 1996). While these strategies have focused on reducing the presence and/or
severity of hazards in the work environment (Morrow & Crum, 1998), consideration of
individual factors could also be important in improving drivers’ safety (Evans, 1991).
The nature of work in the taxi industry is also quite different from conventional
occupations. For example, the employer is ambiguous, work hours and income fluctuate on a
daily basis, and the frequency and severity of hazards range from verbal abuse to homicide
(Dalziel & Job, 1997; Easteal & Wilson, 1991; Haines, 1997; Radbone, 1997). The work
place of today is transforming due to factors such as globalisation, technological
advancements, and decentralisation (Clark, 2003; Chu & Dwyer, 2002). Such influences may
see more organisations operating as the taxi industry does with less supervision, more flexible
hours, and less perceived control from management. Traditional approaches may be
inadequate for dealing with health and safety issues in the dynamic workplace of the future
(Rollenhagen, 2000). Lessons learned from researching workplace health and safety in an
unconventional industry such as taxi driving may suggest innovative strategies for promoting
health and safety behaviour in the workplace of the future.
Taxi Driver Health Outcomes and Safety Behaviour 4
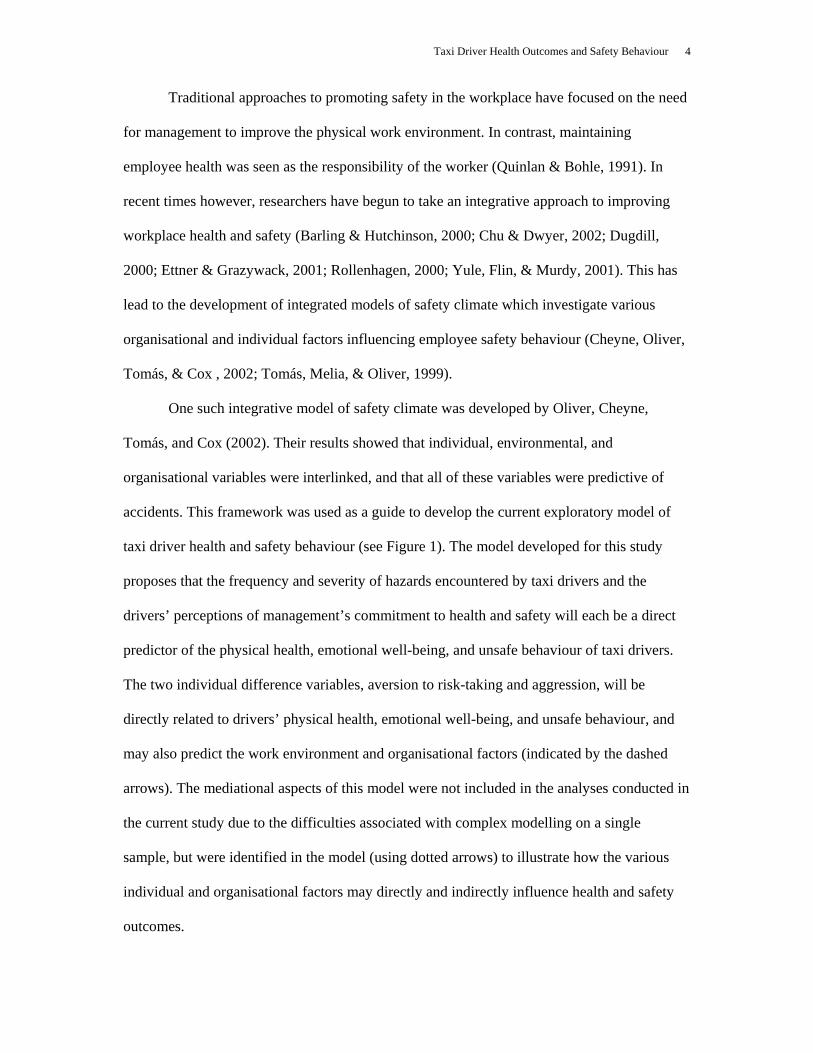
Traditional approaches to promoting safety in the workplace have focused on the need
for management to improve the physical work environment. In contrast, maintaining
employee health was seen as the responsibility of the worker (Quinlan & Bohle, 1991). In
recent times however, researchers have begun to take an integrative approach to improving
workplace health and safety (Barling & Hutchinson, 2000; Chu & Dwyer, 2002; Dugdill,
2000; Ettner & Grazywack, 2001; Rollenhagen, 2000; Yule, Flin, & Murdy, 2001). This has
lead to the development of integrated models of safety climate which investigate various
organisational and individual factors influencing employee safety behaviour (Cheyne, Oliver,
Tomás, & Cox , 2002; Tomás, Melia, & Oliver, 1999).
One such integrative model of safety climate was developed by Oliver, Cheyne,
Tomás, and Cox (2002). Their results showed that individual, environmental, and
organisational variables were interlinked, and that all of these variables were predictive of
accidents. This framework was used as a guide to develop the current exploratory model of
taxi driver health and safety behaviour (see Figure 1). The model developed for this study
proposes that the frequency and severity of hazards encountered by taxi drivers and the
drivers’ perceptions of management’s commitment to health and safety will each be a direct
predictor of the physical health, emotional well-being, and unsafe behaviour of taxi drivers.
The two individual difference variables, aversion to risk-taking and aggression, will be
directly related to drivers’ physical health, emotional well-being, and unsafe behaviour, and
may also predict the work environment and organisational factors (indicated by the dashed
arrows). The mediational aspects of this model were not included in the analyses conducted in
the current study due to the difficulties associated with complex modelling on a single
sample, but were identified in the model (using dotted arrows) to illustrate how the various
individual and organisational factors may directly and indirectly influence health and safety
outcomes.

Taxi Driver Health Outcomes and Safety Behaviour 5
Insert Figure 1 about here
Justification of the model
Oliver et al. (2002) presented a structural model of accidents that included both
general health and safety behaviour. Data were collected from participants from a wide range
of industrial sectors in Spain. Using structural equation modelling, these researchers tested
various nested models to see whether organisational involvement (e.g., indicators of safety
management, safety policy); work environment (e.g., working conditions, hazards); general
health (e.g., anxiety, depression); and safety behaviours (e.g., use of equipment, taking
shortcuts) influenced the occupational accidents directly and indirectly. Results indicated a
direct negative relationship between the physical work environment and general health, and a
direct positive relationship between organisational involvement and both general health and
safety behaviour. Other integrative models by Tomás et al. (1999), and Cheyne et al. (2002),
have shown that individual differences as well as work environment and organisational
factors influence safety behaviour and health outcomes of employees. Research by Dalziel
and Job (1997) found that aggression and risk-taking intentions were two specific individual
factors influential in predicting accident involvement of taxi drivers. The current study is
broadly based on the model by Oliver et al. but also includes individual factors such as
aggression and aversion to risk-taking as additional predictors of health outcomes and safety
behaviour, and an additional outcome variable (physical symptoms)
Aims of the study
The main aim of the current study was to develop an integrated model of taxi driver
health outcomes and safety behaviour so as to investigate whether hazards in the work
environment, driver’s perceptions of management’s commitment to health and safety,
aversion to risk-taking and aggression, were together able to predict physical symptoms, job-
related affective well-being, and unsafe behaviour of taxi drivers. This research was
Taxi Driver Health Outcomes and Safety Behaviour 6
somewhat exploratory in that there was empirical support for including each variable in the
model and yet all of the variables have not yet been examined together in any one model.
The analyses focused on identifying the relationships between the four predictor
variables and each of the outcome variables separately. Due to limitations in the sample size,
the authors did not attempt complex modelling that would have identified the direct and
indirect effects of the predictor variables on the three outcomes. We also chose not to focus on
analysing the relationships between the outcome variables. The models that were proposed
allowed the researchers to address the overall predictability of each of the three outcomes, as
well as provided an estimate of the relative strength of the four predictors.
METHOD
Participants
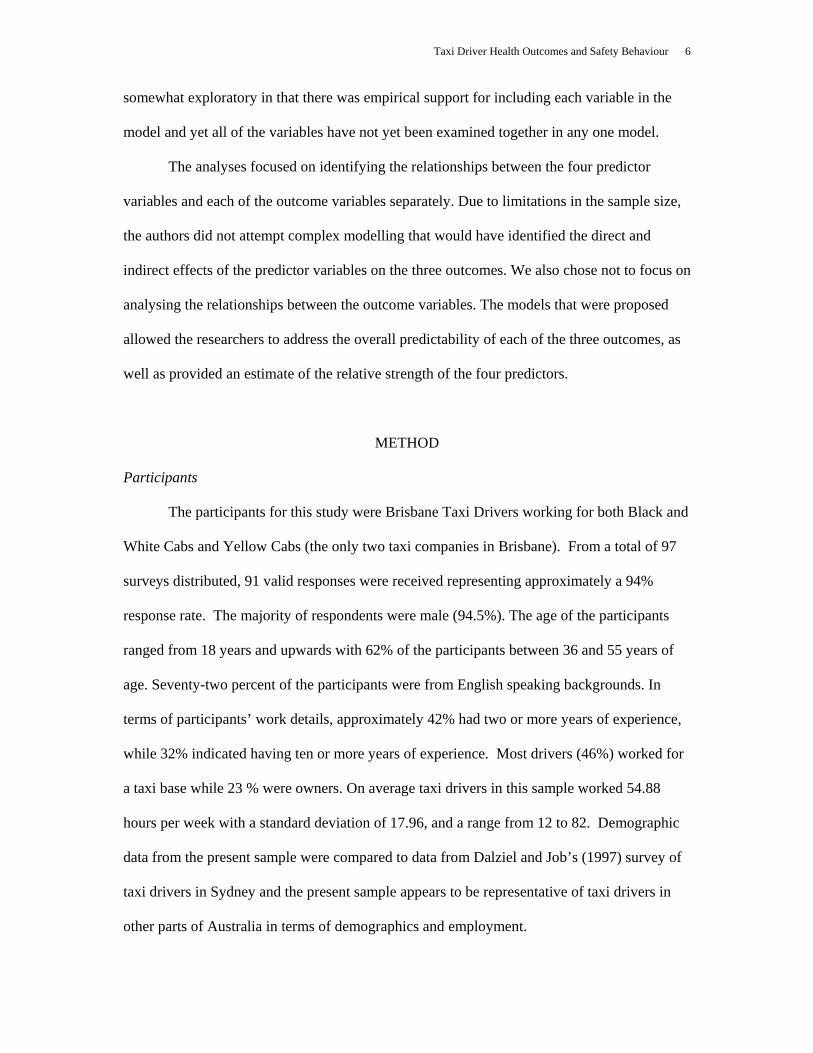
The participants for this study were Brisbane Taxi Drivers working for both Black and
White Cabs and Yellow Cabs (the only two taxi companies in Brisbane). From a total of 97
surveys distributed, 91 valid responses were received representing approximately a 94%
response rate. The majority of respondents were male (94.5%). The age of the participants
ranged from 18 years and upwards with 62% of the participants between 36 and 55 years of
age. Seventy-two percent of the participants were from English speaking backgrounds. In
terms of participants’ work details, approximately 42% had two or more years of experience,
while 32% indicated having ten or more years of experience. Most drivers (46%) worked for
a taxi base while 23 % were owners. On average taxi drivers in this sample worked 54.88
hours per week with a standard deviation of 17.96, and a range from 12 to 82. Demographic
data from the present sample were compared to data from Dalziel and Job’s (1997) survey of
taxi drivers in Sydney and the present sample appears to be representative of taxi drivers in
other parts of Australia in terms of demographics and employment.

Taxi Driver Health Outcomes and Safety Behaviour 7
Measures
The Taxi Driver Safety Survey was developed to identify the factors being measured
in this study. The Taxi Driver Safety Survey was a paper-and-pencil questionnaire consisting
of seven sections that took approximately 20 to 30 minutes to complete. A copy of the
questionnaire is available from the first author’s web site.
Demographic and Work-related Questions. Section one of the questionnaire contained
demographic questions (e.g. age, gender, and whether English was the respondent’s first
language) and some work-related questions (e.g., years of experience, weekly work pattern
such as hours, days, and shifts worked, and whether they pick up clients from hails, ranks,
city, or suburbs). These questions were based on part of the Taxi Driver Survey developed by
the Victorian Taxi Directorate (Haines, 1997). Similar questions were included in a survey
developed by Dalziel and Job (1997) which assessed taxi driver safety in New South Wales.
Management’s Commitment to Health and Safety. This section of the questionnaire
assessed taxi drivers’ perceptions of management’s commitment to health and safety issues.
The items were taken from the Health and Safety Climate Survey Tool developed by the
Health and Safety Executive (HSE, 1997). Examples of the statements included are “The
company cares about the health and safety of employees”; “Management is serious about
health and safety issues”; and “There is good communication between management and
employees about health and safety issues”. The Cronbach’s alpha reliability coefficient for
this scale was .85.
Aggression. This section assessed the general personality trait of aggression using the
Aggression Questionnaire developed by Buss and Perry (1992). The scale was previously
used by Dalziel and Job (1997) in their research on taxi driver safety. The scale comprised 33
items that divided into four subscales: physical aggression, verbal aggression, anger, and
hostility. The physical and verbal components represent the behavioural dimension, anger
Taxi Driver Health Outcomes and Safety Behaviour 8
represents the emotional response, while the hostility component represents the cognitive
dimension (Buss & Perry). Examples of statements include, “I get into fights more than the
average person”; “I tell my friends openly when I disagree with them”; and “I often find
myself disagreeing with people”. The Cronbach’s alpha reliability coefficient for the Total
Aggression score was .84.
Aversion to Risk-taking Behaviour. This section assessed aversion to risk-taking
behaviour specific to the job of taxi driving using some of the questions from the taxi driver
risk-taking scale developed by Dalziel and Job (1997). Six questions relating to aversion to
risk-taking while driving were included, and drivers were asked how dangerous they thought
each item would be. Items included: “running a red light”; “keep driving even though you are
very tired”; and “do an illegal U-turn”. These items did not ask drivers whether they actually
performed any of these behaviours, and therefore the measure was focused on drivers’
attitudes rather than their behaviour. The Cronbach’s alpha reliability coefficient for this scale
was .74.
Hazards in the Workplace. This section provided a measure of workplace hazards
specific to the job of taxi driving and was based on the Taxi Driver Survey developed by the
Victorian Taxi Directorate (Haines, 1997). The respondents were asked to indicate if they
had had to deal with any of five hazardous situations (i.e., verbal abuse, verbal or physical
threat, physical assault, robbery, and fare evasion). Participants were required to indicate the
number of times in the past year they had had to deal with these situations and whether they
considered it to be minor, moderate, or serious. The time frame used in this question was
considerably longer than that used for other scales as the base rate for the events was expected
to be quite low. For the current study, the score for the total number of hazardous situations
faced (that is, number of verbal assaults plus number of verbal or physical threats plus number
of physical assaults etc.) was used in the analysis. No details regarding the reliability and
Taxi Driver Health Outcomes and Safety Behaviour 9
validity of this scale are available as the items were not designed to measure a single
construct. The frequency of any one of the five situations was not expected to be dependent
on the frequency of any other situation thus making reliability indices irrelevant. The scale
had obvious face validity with the second author whose husband was employed as a taxi
driver and who had personally experienced several of the hazards including physical assault
requiring hospitalisation.
Unsafe Behaviour. This section of the questionnaire assessed unsafe behaviour and
included a total of fourteen questions. Ten of the items were taken from a risk-taking measure
developed by Dalziel and Job (1997), which included general driver behaviours as well as
behaviours specific to the job of taxi driving. Drivers were asked how often they did each of
10 different behaviours, such as: “cut across traffic to get to someone hailing you even when
there is a slight risk of an accident”; “ignore safety regulations to get the job done”; “run a red
light”; or “turn right across a busy road even when there is a small chance of collision”. A
time frame for drivers to consider was not specified as drivers worked different hours
depending on their own financial position. The scale focused on obtaining an average
frequency of the target behaviours. Cronbach’s alpha reliability reported by Dalziel and Job
for this scale was .79. Four additional questions were included from the Offshore Safety
Questionnaire (OSQ) by Mearns, Whitaker, and Flin (2001). The measure was clearly focused
on the drivers’ behaviour rather than their perceptions of the riskiness of the behaviour and
therefore was conceptually different from the measure of aversion to risk-taking. The
Cronbach alpha reliability coefficient for this expanded scale was .87.
Emotional Well-being. Section six consisted of the Job-Related Affective Well-being
Scale (JAWS) developed by Van Katwyk, Fox, Spector, and Kelloway (2000) which was
designed to assess employees’ emotional reactions to their job over the previous 30 days. The
scale is comprised of 30 questions of job-related emotional states. It includes questions such
Taxi Driver Health Outcomes and Safety Behaviour 10
as “my job made me feel at ease”; “my job made me feel angry”; “my job made me feel
content”; and “my job made me feel fatigued”. For the current sample, the Cronbach alpha
reliability coefficient was .89.
Physical Symptoms. Section 7 of the questionnaire is comprised of the Physical
Symptoms Inventory (PSI) developed by Spector and Jex (1998) to assess employee physical
and somatic health symptoms. The PSI is a self-report measure in which respondents are
asked to indicate whether or not in the past 30 days they had suffered any of 18 symptoms,
and whether or not they had seen a doctor. Three scores are computed, the number of
symptoms each respondent reported suffering (“Have” symptom), the number for symptoms
for which they saw a doctor (“Doctor” symptom), and the sum of the “Have” symptoms and
the “Doctor” symptoms provides the Total PSI score. Total PSI scores can range from 0 to 18
with higher scores indicating more physical symptoms of ill health. Some examples of
symptoms included on the scale are, headache, backache, fatigue, eye strain, and trouble
sleeping. Only Total PSI scores were utilised for the purpose of the current study. Spector
and Jex state that a measure of the scales reliability would be meaningless due to the fact the
scale is a causal indicator rather than a measure of a construct.
Procedure
Taxi drivers were approached while waiting at the taxi ranks. They completed and
returned the questionnaire while the researcher was present. In an effort to obtain a
representative sample, surveys were conducted during the day at the Brisbane Airport taxi
rank, and during the night at taxi ranks in the Brisbane central business district. The majority
of the surveys were completed in the presence of one of the researchers. Eighteen participants
had partly completed the survey but had to terminate when passengers arrived thus these
respondents were given the questionnaires to complete and return in a reply-paid envelope
provided allowing postage from any location without cost.

Taxi Driver Health Outcomes and Safety Behaviour 11
RESULTS
The means, standard deviations and Intercorrelations of each of the variables of
interest in the current study are presented in Table 1.
Insert Table 1 about here
Three analyses were undertaken in order to test the relationships between the four
predictor variables and each of the outcome variables separately. While traditional standard
multiple regression is a suitable technique to analyse the overall predictability of the three
outcomes, there are several limitations to this technique. First of all, there can be considerable
shrinkage of the multiple correlation coefficient when the sample size is small leading to an
overestimation of the strength of association between the variables. Maxwell, Camp and
Arvey (1981) suggested that the adjusted R2 value is the preferred measure of the strength of
association when it is used as an inferential statistic. Standard multiple regression also fails to
explicitly report the overall fit of the model to the data. Finally, standard multiple regression
assumes that the independent variables are measured without error (Tabachnick & Fidell,
2001).
An alternative to standard regression analysis involves using path analysis to model
the relationships between the predictor variables and the outcome variable(s). Path analysis is
a subset of structural equation modelling (SEM) that describes the relationships between a
group of predictor (or exogenous) variables and one or more outcome (or endogenous)
variables. One difficulty with SEM is that the parameter estimates and tests of fit are sensitive
to size of the sample, with small samples quite likely to be problematic (MacCallum &
Austin, 2000). MacCallum and Austin explained that small samples contribute to less
precision in estimating parameters, especially in models with larger numbers of parameters.
When sample size is small, simpler models are favoured. Millsap (2002) suggested that if the
Taxi Driver Health Outcomes and Safety Behaviour 12
strength of relationships between observed and unobserved variables are strong, then good
results are possible with smaller samples. However, Millsap also warns that it is next to
impossible to provide blanket recommendations regarding minimum sample sizes required in
SEM. The sample size in the current study is adequate for standard multiple regression and all
analyses were rerun using standard multiple regression to determine whether the standardised
path coefficients were any different from the standardised regression coefficients. Both sets of
analyses yielded similar standardised coefficients. The results of the tests of exact fit and
other fit indices should be interpreted extremely cautiously given that the small sample size
results in a low level of power to detect good fitting models (MacCallum, Browne &
Sugawara, 1996).
The following three analyses were conducted using Amos 5 (Arbuckle, 2003). As the
main focus of the paper was the relationships between the predictors and each of the outcome
variables and not the relations among the outcome variables, three separate models were
specified for each of the three outcome variables. Only two of the predictor variables were
permitted to covary (Hazards and Aggression) based on the presence of a significant
correlation between these two variables (r = .28, p < .01). All other covariance paths were
constrained to equal zero.
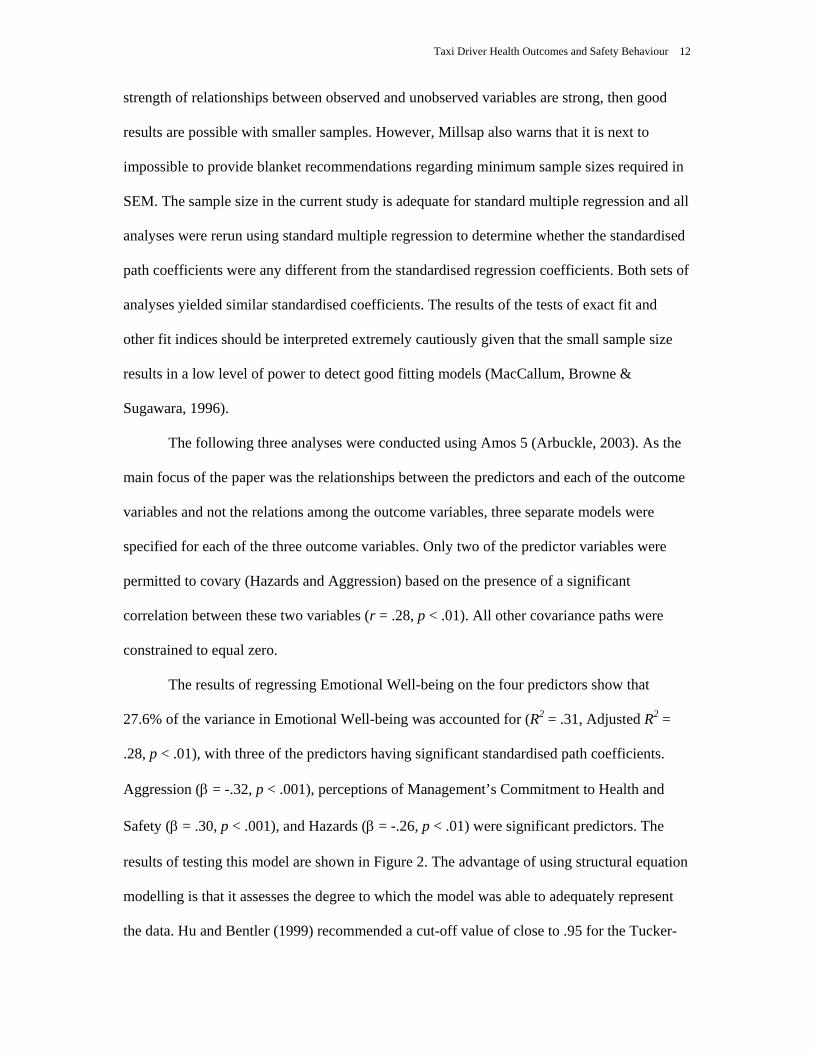
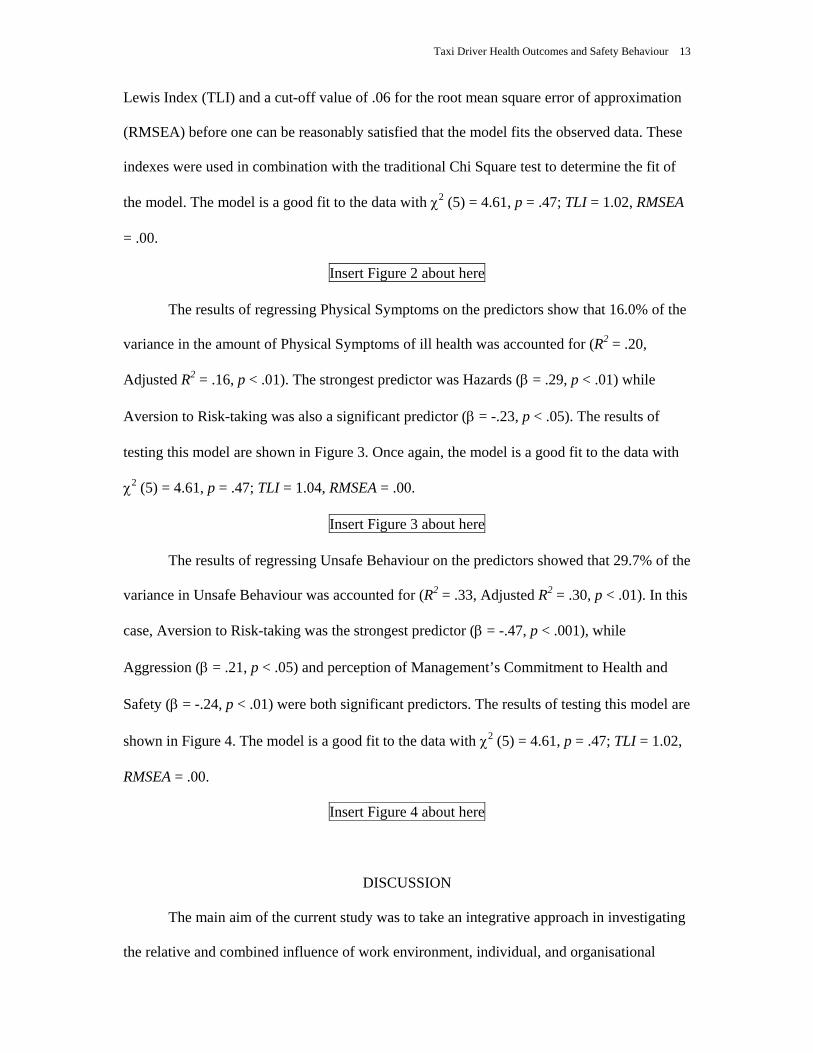
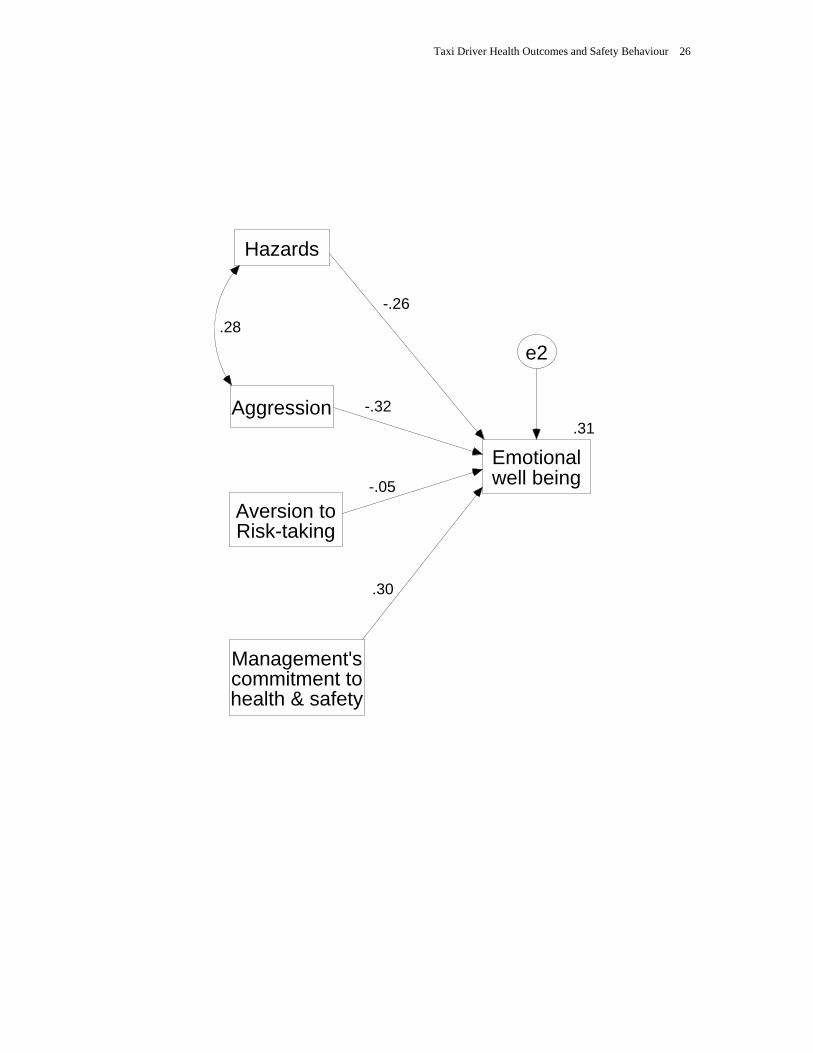
The results of regressing Emotional Well-being on the four predictors show that
27.6% of the variance in Emotional Well-being was accounted for (R2 = .31, Adjusted R2 =
.28, p < .01), with three of the predictors having significant standardised path coefficients.
Aggression (β = -.32, p < .001), perceptions of Management’s Commitment to Health and
Safety (β = .30, p < .001), and Hazards (β = -.26, p < .01) were significant predictors. The
results of testing this model are shown in Figure 2. The advantage of using structural equation
modelling is that it assesses the degree to which the model was able to adequately represent
the data. Hu and Bentler (1999) recommended a cut-off value of close to .95 for the Tucker-
Taxi Driver Health Outcomes and Safety Behaviour 13
Lewis Index (TLI) and a cut-off value of .06 for the root mean square error of approximation
(RMSEA) before one can be reasonably satisfied that the model fits the observed data. These
indexes were used in combination with the traditional Chi Square test to determine the fit of
the model. The model is a good fit to the data with χ2 (5) = 4.61, p = .47; TLI = 1.02, RMSEA
= .00.
Insert Figure 2 about here
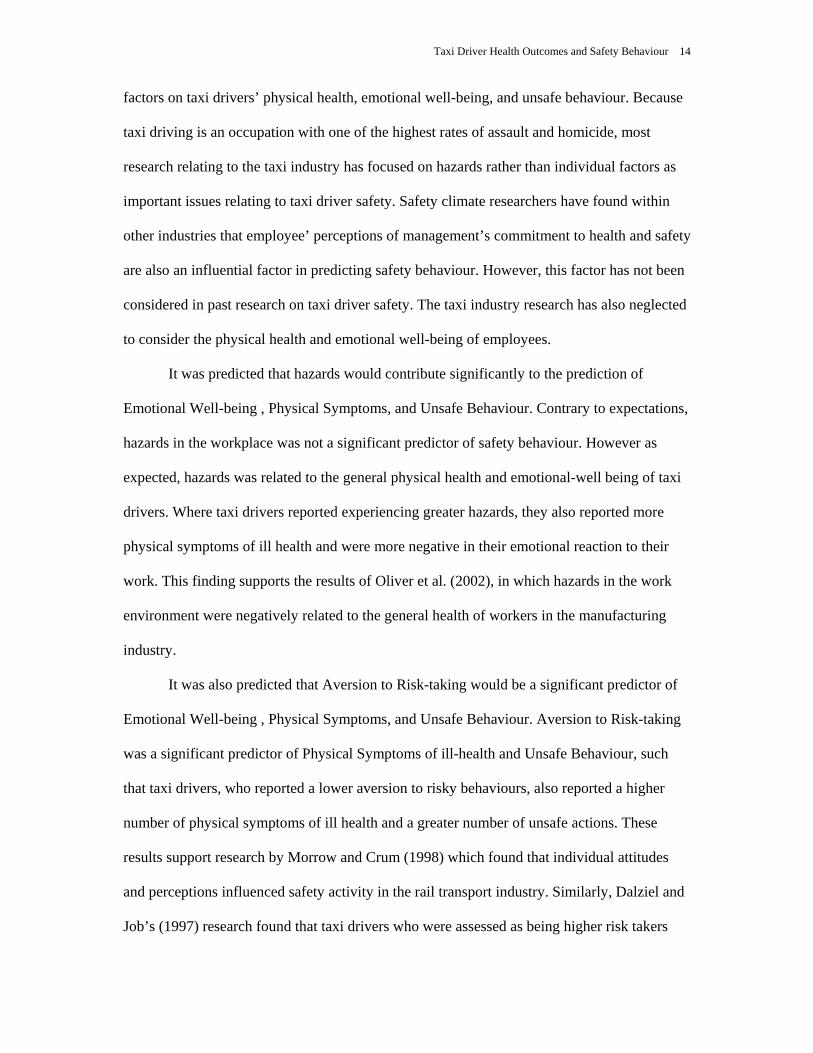
The results of regressing Physical Symptoms on the predictors show that 16.0% of the
variance in the amount of Physical Symptoms of ill health was accounted for (R2 = .20,
Adjusted R2 = .16, p < .01). The strongest predictor was Hazards (β = .29, p < .01) while
Aversion to Risk-taking was also a significant predictor (β = -.23, p < .05). The results of
testing this model are shown in Figure 3. Once again, the model is a good fit to the data with
χ2 (5) = 4.61, p = .47; TLI = 1.04, RMSEA = .00.
Insert Figure 3 about here
The results of regressing Unsafe Behaviour on the predictors showed that 29.7% of the
variance in Unsafe Behaviour was accounted for (R2 = .33, Adjusted R2 = .30, p < .01). In this
case, Aversion to Risk-taking was the strongest predictor (β = -.47, p < .001), while
Aggression (β = .21, p < .05) and perception of Management’s Commitment to Health and
Safety (β = -.24, p < .01) were both significant predictors. The results of testing this model are
shown in Figure 4. The model is a good fit to the data with χ2 (5) = 4.61, p = .47; TLI = 1.02,
RMSEA = .00.
Insert Figure 4 about here
DISCUSSION
The main aim of the current study was to take an integrative approach in investigating
the relative and combined influence of work environment, individual, and organisational
Taxi Driver Health Outcomes and Safety Behaviour 14
factors on taxi drivers’ physical health, emotional well-being, and unsafe behaviour. Because
taxi driving is an occupation with one of the highest rates of assault and homicide, most
research relating to the taxi industry has focused on hazards rather than individual factors as
important issues relating to taxi driver safety. Safety climate researchers have found within
other industries that employee’ perceptions of management’s commitment to health and safety
are also an influential factor in predicting safety behaviour. However, this factor has not been
considered in past research on taxi driver safety. The taxi industry research has also neglected
to consider the physical health and emotional well-being of employees.
It was predicted that hazards would contribute significantly to the prediction of
Emotional Well-being , Physical Symptoms, and Unsafe Behaviour. Contrary to expectations,
hazards in the workplace was not a significant predictor of safety behaviour. However as
expected, hazards was related to the general physical health and emotional-well being of taxi
drivers. Where taxi drivers reported experiencing greater hazards, they also reported more
physical symptoms of ill health and were more negative in their emotional reaction to their
work. This finding supports the results of Oliver et al. (2002), in which hazards in the work
environment were negatively related to the general health of workers in the manufacturing
industry.
It was also predicted that Aversion to Risk-taking would be a significant predictor of
Emotional Well-being , Physical Symptoms, and Unsafe Behaviour. Aversion to Risk-taking
was a significant predictor of Physical Symptoms of ill-health and Unsafe Behaviour, such
that taxi drivers, who reported a lower aversion to risky behaviours, also reported a higher
number of physical symptoms of ill health and a greater number of unsafe actions. These
results support research by Morrow and Crum (1998) which found that individual attitudes
and perceptions influenced safety activity in the rail transport industry. Similarly, Dalziel and
Job’s (1997) research found that taxi drivers who were assessed as being higher risk takers

Taxi Driver Health Outcomes and Safety Behaviour 15
also continued to work when they were tired with the knowledge that it may increase the
chances of them being involved in an accident. Future research should look at whether a lack
of aversion to risk-taking that contributes directly to unsafe behaviour in all situations, or
whether it is moderated by other variables such as the potential for extra earnings.
Researchers should attempt to fathom the motivation behind why drivers take risks and
behave in an unsafe manner.
Aggression was also expected to be a significant predictor of Physical Symptoms,
Emotional Well-being, and Unsafe Behaviour. The results indicated that the higher scores on
aggression were associated with more negative Emotional Well-being and more frequent
Unsafe Behaviours. These results suggest that drivers who display more aggression are more
negative about their job and were less safe in the performance of their day-to-day tasks in.
However, Aggression was not a significant predictor of Physical Symptoms. Future strategies
to improve the health and safety of the taxi industry may require management to take this
result into account when screening new applicants for the job. The extent to which an
individual behaves aggressively also seems to be related to the number of hazards that drivers
may encounter.
Finally, it was predicted that perceptions of Management’s Commitment to Health and
Safety would be a significant predictor of Physical Symptoms, Emotional Well-being, and
Unsafe Behaviour. In line with other research (Oliver et al., 2002), a stronger perception that
management was committed to health and safety was related to more positive emotional well-
being and less unsafe behaviour. However, contrary to expectations and to other research by
Oliver et al., this variable was not a significant direct predictor of Physical Symptoms of ill
health.
Limitations

Taxi Driver Health Outcomes and Safety Behaviour 16
One of the limitations of the current study was its cross sectional design, which meant
that causality could not be implied. This is an inherent problem in social science research.
However, regression analyses do provide a useful way of gaining knowledge about the
relative strength of relationships between variables, and the combined ability of various
factors to predict certain outcomes. In the current study, the variables hypothesised to predict
the three outcomes accounted for between 16 percent (for Physical Symptoms) and 30 percent
(for Unsafe Behaviour) of variance in the outcomes. This demonstrates that the predictor
variables that were included were able to explain a substantial proportion of the variance in
taxi driver health and safety. However, other important influences may have been omitted
from the models. The fact that the models that were specified were able to adequately
represent the data does not suggest that all important predictors of taxi driver health and safety
have been included. Also, the relationships between the predictor variables and the three
outcomes have not been validated in an independent sample and therefore the results should
be interpreted cautiously. This research extends the current trend for integrative research into
predictors of health and safety into an occupation that requires a greater range of perspectives
and innovative strategies for improving health and safety.
Conclusions
Much research has focused on implementing technical improvements, or providing
training on skills to reduce the probability of hazards and improve safety in the taxi industry,
yet no research has been conducted on how these factors influence the health of taxi drivers.
One of the important findings of the current study was that taxi drivers’ physical health and
emotional well-being were related to hazards. Thus it shows the importance of implementing
strategies to reduce the hazards that are faced by taxi drivers.
Another key finding was in the relationship between the perceptions of management’s
commitment and both emotional well-being and less frequent unsafe behaviour. As in other

Taxi Driver Health Outcomes and Safety Behaviour 17
industries, this important aspect of safety climate has been shown to predict two important
outcomes. This finding should encourage managers to focus on the importance of developing
and communicating a positive climate for safety among taxi drivers.
Finally, this study has confirmed that individual difference variables such as
aggression and aversion to risk-taking are able to explain significant slices of the variance in
the emotional well-being and unsafe behaviour (and to a lesser extent, the physical health) of
taxi drivers. Drivers should be assessed to identify those who are less averse to taking risks or
more likely to behave aggressively, and assistance provided in the form of health and safety
training interventions.

Taxi Driver Health Outcomes and Safety Behaviour 18
REFERENCES
Arbuckle, J. L. (2003). Amos for Windows. Analysis of moment structures. Version 5.
Chicago: Smallwaters Corporation.
Barling, J., & Hutchinson, I. (2000). Commitment vs control-based safety practices, safety
reputation, and perceived safety climate. Canadian Journal of Administrative
Sciences, 17(1), 76-84.
Buss, A. H., & Perry, M. (1992). The Aggression Questionnaire. Journal of Personality and
Social Psychology, 63, 452-459.
Cheyne, A., Oliver, A., Tomás, J. M., & Cox, S. (2002). The architecture of employee
attitudes to safety in the manufacturing sector. Personnel Review, 31, 649-670.
Chu, C., & Dwyer, S. (2002). Employer role in integrative workplace health management: A
new model in progress. Disease Management & Health Outcomes, 10(3), 175-186.
Clark, S., (2003). The contemporary workforce: Implications for organisational safety culture.
Personnel Review, 32, 40-57.
Dalziel, J. R., & Job, R. F. S. (1997). Taxi Drivers and Road Safety. A report to the Federal
Office of Road Safety, Department of Transport and Regional Development,
Canberra.
Dugdill, L. (2000). Developing a holistic understanding of workplace health: The case of
bank workers. Ergonomics, 4(10), 1738-1749.
Easteal, P. W., & Wilson, P. R. (1991). Preventing Crime on Transport. Australian Institute
of Criminology. Canberra. [Available online] Retrieved June 24, 2002, from
http://www.aic.gov.au/publications/crimprev/transport/taxi.html
Ettner, S. L., & Grzywacz, J. G. (2001). Workers’ perceptions of how jobs affect health: A
social ecological perspective. Journal of Occupational Health Psychology, 6(2), 101-
113.
Taxi Driver Health Outcomes and Safety Behaviour 19
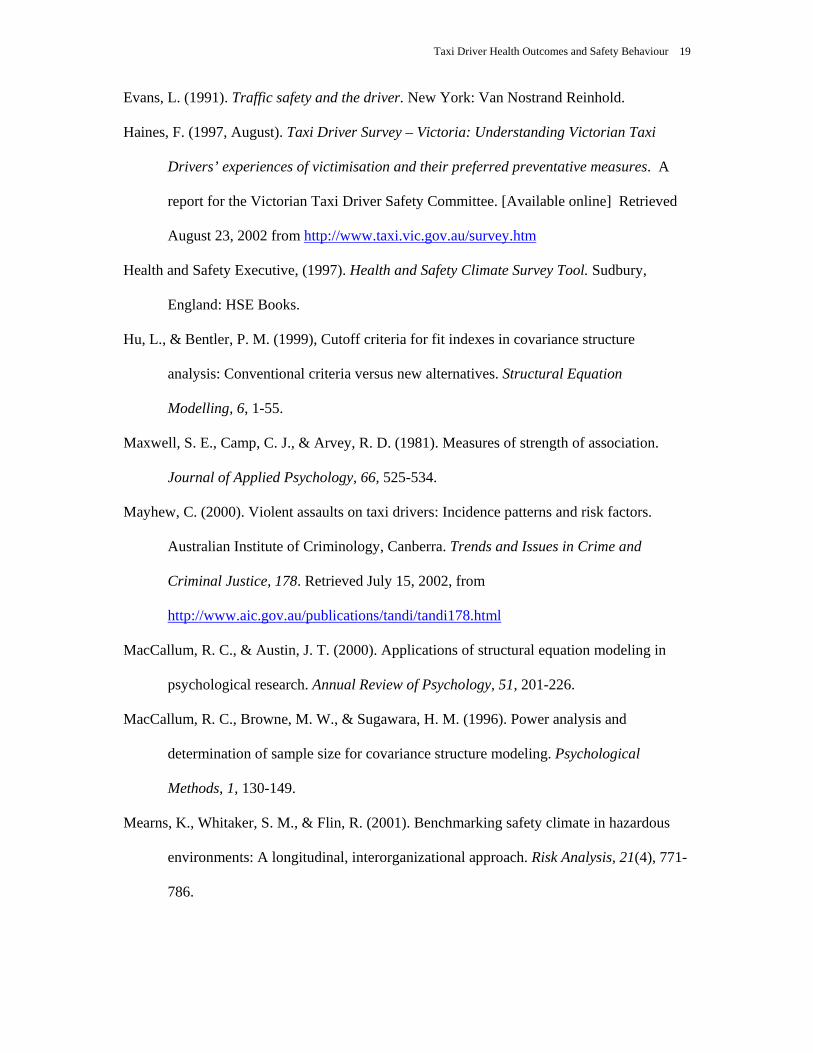
Evans, L. (1991). Traffic safety and the driver. New York: Van Nostrand Reinhold.
Haines, F. (1997, August). Taxi Driver Survey – Victoria: Understanding Victorian Taxi
Drivers’ experiences of victimisation and their preferred preventative measures. A
report for the Victorian Taxi Driver Safety Committee. [Available online] Retrieved
August 23, 2002 from http://www.taxi.vic.gov.au/survey.htm
Health and Safety Executive, (1997). Health and Safety Climate Survey Tool. Sudbury,
England: HSE Books.
Hu, L., & Bentler, P. M. (1999), Cutoff criteria for fit indexes in covariance structure
analysis: Conventional criteria versus new alternatives. Structural Equation
Modelling, 6, 1-55.
Maxwell, S. E., Camp, C. J., & Arvey, R. D. (1981). Measures of strength of association.
Journal of Applied Psychology, 66, 525-534.
Mayhew, C. (2000). Violent assaults on taxi drivers: Incidence patterns and risk factors.
Australian Institute of Criminology, Canberra. Trends and Issues in Crime and
Criminal Justice, 178. Retrieved July 15, 2002, from
http://www.aic.gov.au/publications/tandi/tandi178.html
MacCallum, R. C., & Austin, J. T. (2000). Applications of structural equation modeling in
psychological research. Annual Review of Psychology, 51, 201-226.
MacCallum, R. C., Browne, M. W., & Sugawara, H. M. (1996). Power analysis and
determination of sample size for covariance structure modeling. Psychological
Methods, 1, 130-149.
Mearns, K., Whitaker, S. M., & Flin, R. (2001). Benchmarking safety climate in hazardous
environments: A longitudinal, interorganizational approach. Risk Analysis, 21(4), 771-
786.

Taxi Driver Health Outcomes and Safety Behaviour 20
Millsap, R. E. (2002). Structural equation modeling: A user’s guide. In F. Drasgow & N.
Schmitt (Eds.) Measuring and analysing behaviour in organizations: Advances in
measurement and data analysis (pp. 257-301). San Francisco: Jossey-Bass.
Morrow, P. C., & Crum, M. R. (1998). The effects of perceived and objective safety risk on
employee outcomes. Journal of Vocational Behavior, 53, 300-313.
Oliver, A., Cheyne, A., Tomás, J. M., & Cox, S. (2002). The effects of organisational and
individual factors on occupational accidents. Journal of Occupational and
Organisational Psychology, 75, 473-388.
Quinlan, M., & Bohle, P. (1991). Managing occupational health and safety in Australia: A
multidisciplinary approach. Melbourne: Macmillan Education Australia.
Radbone, I. (1997, March). Taxi safety initiatives study. A report for the Passenger Transport
Board of South Australia (PTB). [Available online] Retrieved April 13, 2002 from
http://www.taxi-l.org/ian01.htm
Rollenhagen, C. (2000). A framework for assessment of organisational characteristics and
their influences on safety. [Electronic version]. Safety Science Monitor, 4 (1).
Spector, P. E., & Jex, S. M. (1998). Development of four self-report measures of job stressors
and strain: Interpersonal Conflict and Work Scale, Organizational Constraints Scale,
Quantitative Workload Inventory, and Physical Symptoms Inventory. Journal of
Occupational Health Psychology, 3, 356-367.
Stone, J. (1996). Taxi Driver Security. Remarks prepared for a speech at the Taxi Driver
Security Conference, December 6, 1996. Retrieved August 23, 2002, from
http://www.taxi-l.org/stone.htm
Swanton, B., & Scandia, A. (1990). There’s a little bit of aggression in all of us: Aggressive
behaviour by taxi passengers. Australian Institute of Criminology, Canberra.
Retrieved August 24, 2002, from http://www.aic.gov.au/publications/taxi/
Taxi Driver Health Outcomes and Safety Behaviour 21
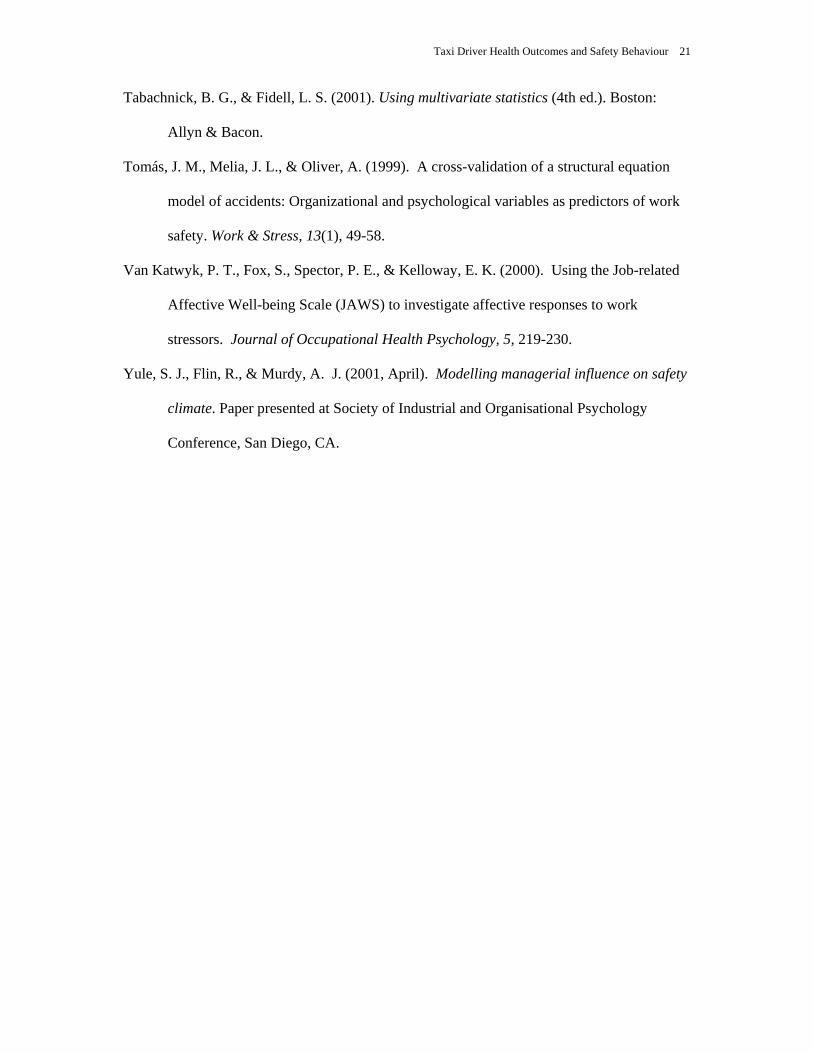
Tabachnick, B. G., & Fidell, L. S. (2001). Using multivariate statistics (4th ed.). Boston:
Allyn & Bacon.
Tomás, J. M., Melia, J. L., & Oliver, A. (1999). A cross-validation of a structural equation
model of accidents: Organizational and psychological variables as predictors of work
safety. Work & Stress, 13(1), 49-58.
Van Katwyk, P. T., Fox, S., Spector, P. E., & Kelloway, E. K. (2000). Using the Job-related
Affective Well-being Scale (JAWS) to investigate affective responses to work
stressors. Journal of Occupational Health Psychology, 5, 219-230.
Yule, S. J., Flin, R., & Murdy, A. J. (2001, April). Modelling managerial influence on safety
climate. Paper presented at Society of Industrial and Organisational Psychology
Conference, San Diego, CA.

Taxi Driver Health Outcomes and Safety Behaviour 22
ACKNOWLEDGEMENTS
We wish to acknowledge the assistance provided by Dr James Dalziel who generously
provided a copy of the questionnaire that was used in his PhD.
We also wish to acknowledge the suggestions made by two anonymous reviewers to the
original version of the manuscript.

Taxi Driver Health Outcomes and Safety Behaviour 23
Table 1
Means, Standard Deviations, and Intercorrelations of all Variables
Variable M SD 1 2 3 4 5 6
1. Hazards 14.68 27.51 --
2. Aversion to Risk-taking 24.09 3.68 .06 --
3. Aggression 84.29 15.12 .28** -.15 --
4. Mgt.’s Commitment 16.14 6.61 .02 -.09 -.07 --
5. Physical Symptoms 4.45 3.16 .32** -.22* .27** -.11 --
6. Emotional Well-Being 92.34 17.18 -.35** -.05 -.40** .32** -.43** --
7. Unsafe Behaviour 27.6 8.25 .07 -.48** .30** -.22* .42** -.29**
Note. * p < .05, **p < .01

Taxi Driver Health Outcomes and Safety Behaviour 24
LIST OF FIGURES
Figure 1. Proposed model of factors influencing taxi driver health outcomes and safety
behaviour.
Figure 2. Results of regressing Emotional Well-Being on the four predictor variables.
Figure 3. Results of regressing Physical Symptoms on the four predictor variables.
Figure 4. Results of regressing Unsafe Behaviour on the four predictor variables.

Taxi Driver Health Outcomes and Safety Behaviour 25
WORK ENVIRONMENT - Hazards INDIVIDUAL
DIFFERENCES - Risk-taking - Aggression
ORGANISAT-IONAL INVOLVEMENT - Perceptions of
management commitment
HEALTH OUTCOMES - Physical
symptoms - Job-related
affective well-being
SAFETY BEHAVIOUR - Unsafe
behaviours
Taxi Driver Health Outcomes and Safety Behaviour 26
Aggression
Management'scommitment tohealth & safety
Hazards
.31
Emotionalwell being
e2
Aversion toRisk-taking
.28-.26
-.32
-.05
.30

Taxi Driver Health Outcomes and Safety Behaviour 27
Aggression
Management'scommitment tohealth & safety
Hazards
.20
Physicalsymptoms
e3
Aversion toRisk-taking
.28
.29
.14
-.23
-.12

Taxi Driver Health Outcomes and Safety Behaviour 28
Aggression
Management'scommitment tohealth & safety
Hazards
.33
Unsafebehaviour
e4
Aversion toRisk-taking
.28.03
.21
-.47
-.24