Predicting functional residues in Plasmodium falciparum plasmepsins by combining sequence and...
18
proteins STRUCTURE FUNCTION BIOINFORMATICS Predicting functional residues in Plasmodium falciparum plasmepsins by combining sequence and structural analysis with molecular dynamics simulations Pedro A. Valiente, 1 Paulo R. Batista, 2 Amaury Pupo, 3 Tirso Pons, 1 Alfonso Valencia, 4 and Pedro G. Pascutti 2 * 1 Facultad de Biologı ´a, Centro de Estudios de Proteı´nas (CEP), Universidad de La Habana, Cuba 2 Instituto de Biofı´sica Carlos Chagas Filho, Universidade Federal do Rio de Janeiro, Brazil 3 Departamento de Bioinforma ´tica, Centro de Inmunologı´a Molecular, Cuba 4 Centro Nacional de Investigaciones Oncologicas (CNIO), Madrid E-28029, Espan ˜a INTRODUCTION Malaria remains one of the world’s biggest health problems because 500 million are infected with this disease each year and it is responsible for about one million deaths annually. 1 The disease is caused by parasites from the genus Plasmo- dium and in humans, it is the result of an infection by the following species: Plasmodium falciparum, Plasmodium malariae, Plasmodium ovalae, and Plasmodium vivax. Of these species P. falciparum is the most lethal and it is there- fore the main target for drug intervention. 2 Once the microbe is transmitted to humans by mosquitoes of the anopheles genus, it causes many problems, the most com- mon of which are severe, recurring fever attacks. The increas- ing resistance of malarial parasites to the existing antimalarial drugs, and in particular of P. falciparum, has focused efforts toward the discovery of more selective and potent drugs. 3 One of the critical stages of the P. falciparum life cycle during human infection is the degradation of hemoglobin, which constitutes the main source of amino acids for its own growth and maturation. 3 During the intraerythrocytic stage of the parasite’s life cycle, this protozoa consumes 75% of the hemoglobin in the infected red blood cell. 4,5 Hemoglo- bin degradation occurs within the acidic food vacuole of the parasite and it is catalyzed by aspartic, 6 cysteine, 7 and metal- lopeptidases. 8 A family of aspartic proteases known as plas- mepsins (Plm) is involved in the initial steps of the hemoglo- Additional Supporting Information may be found in the online version of this article. Grant sponsors: Cuban Ministry of High Education (MES), Structural Biology and Bio- computing Programme of the Spanish National Cancer Research Centre (CNIO), Ma- drid, Spain. Brazilian High Education Support Agency (CAPES), International Union of Biochemistry and Molecular Biology (IUBMB). Received 24 September 2007; Revised 1 February 2008; Accepted 25 February 2008 Published online 28 April 2008 in Wiley InterScience (www.interscience.wiley.com). DOI: 10.1002/prot.22068 *Correspondence to: Pedro G. Pascutti, Instituto de Biofisica Carlos Chagas Filho, Universidade Federal do Rio de Janeiro, Brazil. E-mail: [email protected]. ABSTRACT Plasmepsins are aspartic proteases involved in the initial steps of the hemoglobin degradation pathway, a critical stage in the Plasmodium falciparum life cycle during human infection. Thus, they are attractive targets for novel therapeutic compounds to treat malaria, which remains one of the world’s biggest health problems. The three-dimensional structures available for P. falciparum plasmepsins II and IV make structure-based drug design of antimalarial compounds that focus on inhibiting plas- mepsins possible. However, the structural flexibility of the plasmepsin active site cavity combined with insufficient knowledge of the functional residues and of those deter- mining the specificity of parasitic enzymes is a drawback when designing specific inhibitors. In this study, we have combined a sequence and structural analysis with molecu- lar dynamics simulations to predict the functional resi- dues in P. falciparum plasmepsins. The careful analysis of X-ray structures and 3D models carried out here suggests that residues Y17, V105, T108, L191, L242, Q275, and T298 are important for plasmepsin function. These seven amino acids are conserved across the malarial strains but not in human aspartic proteases. Residues V105 and T108 are localized in a flap of an interior pocket and they only establish contacts with a specific non-peptide achiral in- hibitor. We also observed a rapid conformational change in the L3 region of plasmepsins that closes the active site of the enzyme, which explains earlier experimental find- ings. These results shed light on the role of V105 and T108 residues in plasmepsin specificities, and they should be useful in structure-based design of novel, selective inhibitors that may serve as antimalarial drugs. Proteins 2008; 73:440–457. V V C 2008 Wiley-Liss, Inc. Key words: malaria; aspartic protease; selectivity; compar- ative modeling; molecular dynamics; functional residues. 440 PROTEINS V V C 2008 WILEY-LISS, INC.
Transcript of Predicting functional residues in Plasmodium falciparum plasmepsins by combining sequence and...

proteinsSTRUCTURE O FUNCTION O BIOINFORMATICS
Predicting functional residues in Plasmodiumfalciparum plasmepsins by combiningsequence and structural analysis withmolecular dynamics simulationsPedro A. Valiente,1 Paulo R. Batista,2 Amaury Pupo,3 Tirso Pons,1 Alfonso Valencia,4
and Pedro G. Pascutti2*1 Facultad de Biologıa, Centro de Estudios de Proteınas (CEP), Universidad de La Habana, Cuba
2 Instituto de Biofısica Carlos Chagas Filho, Universidade Federal do Rio de Janeiro, Brazil
3 Departamento de Bioinformatica, Centro de Inmunologıa Molecular, Cuba
4 Centro Nacional de Investigaciones Oncologicas (CNIO), Madrid E-28029, Espana
INTRODUCTION
Malaria remains one of the world’s biggest health problems
because 500 million are infected with this disease each year
and it is responsible for about one million deaths annually.1
The disease is caused by parasites from the genus Plasmo-
dium and in humans, it is the result of an infection by the
following species: Plasmodium falciparum, Plasmodium
malariae, Plasmodium ovalae, and Plasmodium vivax. Of
these species P. falciparum is the most lethal and it is there-
fore the main target for drug intervention.2 Once the
microbe is transmitted to humans by mosquitoes of the
anopheles genus, it causes many problems, the most com-
mon of which are severe, recurring fever attacks. The increas-
ing resistance of malarial parasites to the existing antimalarial
drugs, and in particular of P. falciparum, has focused efforts
toward the discovery of more selective and potent drugs.3
One of the critical stages of the P. falciparum life cycle
during human infection is the degradation of hemoglobin,
which constitutes the main source of amino acids for its own
growth and maturation.3 During the intraerythrocytic stage
of the parasite’s life cycle, this protozoa consumes �75% of
the hemoglobin in the infected red blood cell.4,5 Hemoglo-
bin degradation occurs within the acidic food vacuole of the
parasite and it is catalyzed by aspartic,6 cysteine,7 and metal-
lopeptidases.8 A family of aspartic proteases known as plas-
mepsins (Plm) is involved in the initial steps of the hemoglo-
Additional Supporting Information may be found in the online version of this article.
Grant sponsors: Cuban Ministry of High Education (MES), Structural Biology and Bio-
computing Programme of the Spanish National Cancer Research Centre (CNIO), Ma-
drid, Spain. Brazilian High Education Support Agency (CAPES), International Union
of Biochemistry and Molecular Biology (IUBMB).
Received 24 September 2007; Revised 1 February 2008; Accepted 25 February 2008
Published online 28 April 2008 in Wiley InterScience (www.interscience.wiley.com).
DOI: 10.1002/prot.22068
*Correspondence to: Pedro G. Pascutti, Instituto de Biofisica Carlos Chagas Filho,
Universidade Federal do Rio de Janeiro, Brazil. E-mail: [email protected].
ABSTRACT
Plasmepsins are aspartic proteases involved in the initial
steps of the hemoglobin degradation pathway, a critical
stage in the Plasmodium falciparum life cycle during
human infection. Thus, they are attractive targets for
novel therapeutic compounds to treat malaria, which
remains one of the world’s biggest health problems. The
three-dimensional structures available for P. falciparum
plasmepsins II and IV make structure-based drug design
of antimalarial compounds that focus on inhibiting plas-
mepsins possible. However, the structural flexibility of the
plasmepsin active site cavity combined with insufficient
knowledge of the functional residues and of those deter-
mining the specificity of parasitic enzymes is a drawback
when designing specific inhibitors. In this study, we have
combined a sequence and structural analysis with molecu-
lar dynamics simulations to predict the functional resi-
dues in P. falciparum plasmepsins. The careful analysis of
X-ray structures and 3D models carried out here suggests
that residues Y17, V105, T108, L191, L242, Q275, and
T298 are important for plasmepsin function. These seven
amino acids are conserved across the malarial strains but
not in human aspartic proteases. Residues V105 and T108
are localized in a flap of an interior pocket and they only
establish contacts with a specific non-peptide achiral in-
hibitor. We also observed a rapid conformational change
in the L3 region of plasmepsins that closes the active site
of the enzyme, which explains earlier experimental find-
ings. These results shed light on the role of V105 and
T108 residues in plasmepsin specificities, and they should
be useful in structure-based design of novel, selective
inhibitors that may serve as antimalarial drugs.
Proteins 2008; 73:440–457.VVC 2008 Wiley-Liss, Inc.
Key words: malaria; aspartic protease; selectivity; compar-
ative modeling; molecular dynamics; functional residues.
440 PROTEINS VVC 2008 WILEY-LISS, INC.

bin degradation pathway,5 and these proteases are attrac-
tive targets for the design of novel therapeutic com-
pounds to treat malaria.3 Indeed, Pepstatin A, a nonspe-
cific broad-range aspartic peptidase inhibitor, can cause
the death of the Plasmodium microbes when added to cul-
ture cells infected with parasites.9,10 A similar behavior
has been reported in animal models infected with Plasmo-
dium parasite when E-64, a nonspecific broad-range cyste-
ine peptidase inhibitor, was administered, and both inhibi-
tors display a synergic effect when combined.11–14
Sequencing of the P. falciparum genome has identified
10 plasmepsin encoding genes, numbered PlmI to
PlmX.3,15 Among these, only PlmI, PlmII, HAP (histoas-
partic protease or PlmIII), and PlmIV are active in the
food vacuole.16 The redundant functional roles of these
enzymes in hemoglobin digestion has been demonstrated
by plasmepsin deletion. This feature indicates that more
effective drugs may be obtained by blocking more than
one plasmepsin.17,18
Structure-based drug design of antimalarial com-
pounds targeting plasmepsin inhibition is possible due to
the availability of the three-dimensional (3D) structures
of PlmII (PDB: 1lf4, 1sme, 1xdh, 2bju, 1lee), PlmIV
(PDB: 1ls5, 1pfz) from P. falciparum, Plm from P. malar-
iae (PDB: 2anl) and Plm from P. vivax species (PDB:
1qs8). Although the degree of sequence identity among
the aspartic proteases of Plasmodium species is relatively
high (�60%), substrate specificity and their response to
inhibitors differ, indicating that variations may exist in
the specific binding interactions between the different
plasmepsins.19–22 Among Plasmodium species, only
P. falciparum strains possess genes encoding PlmI, PlmII,
and HAP. Furthermore, Plm IV has a higher level of
sequence identity with plasmepsins from non-falciparum
species (65–76%) than with their paralogs PlmI, PlmII,
and HAP (63%, 62% and 53%, respectively).23 However,
PlmII has been the most extensively characterized,
because several crystal structures have been deter-
mined24–26 and potent inhibitors developed.14,27–30
Nevertheless, these compounds generally have limited se-
lectivity toward the human-related protease cathepsin D
(hCatD)29. The high degree of structural flexibility of
the PlmII active site cavity allows the different molecules
to be accommodated, and this is a drawback when
designing specific inhibitors.31
In this respect, identifying the functional residues re-
sponsible for plasmepsin specificity could help the devel-
opment of more potent and selective inhibitors. Site-
directed mutagenesis of PlmII failed to identify signifi-
cant differences between mutant (M15E, I289E, S79D
and M15E/I289E) and wild-type recombinant enzymes in
terms of hemoglobin-based substrate cleavage, which
indicates that these mutations in the binding site did not
alter the natural function of the enzyme.32
In this manuscript, we present a sequence and struc-
tural analysis of aspartic proteases that include plasmep-
sins from different Plasmodium species, and their homo-
logs, cathepsins, pepsin, rennin, and napsin. The homol-
ogous human enzymes were also studied to better
understand the specificities of the Plasmodium enzymes
and in an effort to develop new specific plasmepsin
inhibitors. We also generated comparative 3D models for
PlmI, HAP and the following complexes: PlmI–Pepsta-
tinA, HAP–PepstatinA, and PlmII/IV–peptide substrates.
Based on these sequence analyses, 3D structures of PlmII
and PlmIV and the comparative 3D models of PlmI and
HAP, we predicted for the first time that residues Y17,
V105, T108, L191, L242, Q275, and T298 are important
for plasmepsin function. These seven promising amino
acid residues are conserved in the malarial strains but
not among human aspartic proteases. Residues V105 and
T108 are located in a flap of an interior pocket and only
establish contacts with a specific nonpeptide achiral in-
hibitor. Residue L242 is located in the L3 loop,31 recently
described as an essential region in cleaving intact hemo-
globin.33 Residue Q275 is situated in the small b1024neighbor to the L4 loop,31 while residues Y17, L191 and
T298 belong to well-defined pockets lining the binding
site cavity. By combining the information derived from
sequence and structural analysis with molecular dynamics
(MD) simulations of Plms–ligand complexes, we suggest
critical contact points for the structure-based design of
novel, selective plasmepsin inhibitors as antimalarial
drugs.
MATERIALS AND METHODS
The methodology followed here to identify new func-
tional residues from P. falciparum plasmepsins is pre-
sented in a flowchart (see Fig. 1). We combined the in-
formation derived from sequence and structural analysis
with MD simulations of Plms–inhibitor complexes to
corroborate our findings.
Sequence and structure analyses
We analyzed 73 amino acid sequences homologous to
P. falciparum plasmepsins, as well as 13 crystallographic
structures of cathepsin D, pepsin, renin, PlmII, and
PlmIV (PDB codes: 1lyw, 1bim, 1f04, 1qdm, 1psn, 1ayf,
1sme, 1qs8, 1ls5, 1fkn, 1lyb, 1xdh, 2bju). For these com-
parisons, the following web servers were used: PSI-
BLAST (http://www.ncbi.nlm.nih.gov/BLAST) for similar-
ity searches in the nonredundant NCBI protein database
(NCBI-nr); MC-CE (http://cl.sdsc.edu/) for structural
superposition; CONSURF (http://consurf.tau.ac.il) to cal-
culate the amino acid conservation; CASTp (http://
sts.bioengr-uic.edu/castp) to identify cavities and calcu-
late their area and volumes; WHAT IF (http://swift.
cmbi.kun.nl/WIWWWI/) to calculate atom–atom con-
tacts between the residues of binding-sites and the func-
tional groups of inhibitors.
Functional Residues in Plasmodium falciparum Plasmepsins
PROTEINS 441

Multiple alignments were performed using the CLUS-
TALW software.34 First, a profile was generated by the
MC-CE structural superposition of the crystallographic
structures of cathepsin D, pepsin, renin, PlmII, and
PlmIV. Then, the remaining protein sequences analyzed
were aligned with respect to the profile with CLUS-
TALW.34 Finally, the multiple alignment was manually
parsed by analyzing the gaps, conserved amino acid
regions and the secondary structure information using
Seaview software.35
Comparative 3D modeling
Three-dimensional models for PlmI, HAP, and their
complexes with the Pepstatin A inhibitor, were generated
with MODELLER software36 using the crystallographic
structures as templates (PDB codes: 2bju, 1xdh). The
multiple sequence alignment obtained was edited using
Seaview software, in order to align the Plms target
sequences with the chosen templates. We calculated 100
models for each target with the spatial restraints
extracted from the target–template alignment. These
models were evaluated using the UCLA web server tools:
ERRAT; VERIFY_3D; PROVE; PROCHECK; WHAT_-
CHEK (http://nihserver.mbi.ucla.edu/SAVS/); and the
DOPE energy function37 provided with the Modeling
package.
To select the best models, we assigned a Zi-score (Zi 5(Qualityi 2 Mean Quality)/Standard Deviation of Qual-
ity) for each solution and those models with positive val-
ues of Zi-score were chosen arbitrarily. A similar process
was used to obtain 3D models of PlmII and PlmIV in
complex with their peptide substrates. To model PlmII
and PlmIV complexes, we selected the 1xdh (PlmII–Pep-
statin A, R 5 1.7 A) and 1ls5 (PlmIV–Pepstatin A, R 52.8 A) crystallographic structures as templates, respectively.
Figure 1Flowchart of the methodology followed to identify the seven new functional residues from P. falciparum plasmepsins by combining the information derived from the
sequence and structural analysis with Molecular Dynamics simulations of Plm–inhibitor complexes.
P.A. Valiente et al.
442 PROTEINS

MD simulations
The molecular mechanics potential energy minimiza-
tions and MD simulations were carried out with the soft-
ware package GROMACS, version 3.3.138 using the
GROMOS96 53a6 force field.39 For all the systems we
used the visual molecular dynamics (VMD)40 software
for molecular visualization and manipulation, to set up
the spatial orientation of complexes, and to have their
principal axes aligned to the cartesian axes. Solvation was
performed with a layer of at least 15 A around the prote-
ase–ligand complex, in a rhombic dodecahedral box (xy-
square) geometry for periodic boundary conditions. The
model of the solvent chosen was single point charge
(SPC) water41 and to neutralize the charge of the system,
chloride (Cl2) counter-ions were inserted. Accordingly,
we ended up with twelve systems for MD simulations,
with their final volumes ranging from 580 to 700 nm3
and each with between 55,000 and 70,000 atoms. For
energy minimization, we used the steepest descent algo-
rithms (preceded by a position restrained stage for pro-
tein atoms) and a conjugate gradient, until an energy
gradient was reached less than 2.39 kcal/mol/A. The MD
simulations were performed according to the following
criteria: 500 ps with the positions of the protein’s atoms
restrained to allow the solvent equilibration; 200 ps with
the positions of the backbone’s protein atoms restrained
to allow the gradually liberation of the system; and then
a full MD for 3.3 ns without restrictions. The Verlet inte-
gration42 scheme (leapfrog) with an MD integration
time step of 2 fs was employed. LINCS43 was used to
constrain all the covalent bonds in non-water molecules,
whereas the SETTLE44 algorithm was used to constrain
bond lengths and angles in water molecules. The temper-
ature was controlled using weak coupling to a bath of
300 K with a time constant of 0.1 ps. Protein, ligands,
ions, and water were independently coupled to the heat
bath.45 Initial velocities were randomly generated from a
Maxwell distribution at 300 K, in accordance with the
masses that were assigned to the atoms. The pressure was
controlled using the weak Berendsen coupling to a
‘‘pressure bath of 1 atm’’ with a time constant of 1.0 ps.
The long-range electrostatic interactions were calculated
using the particle mesh ewald (PME) method46,47 with
a non-bonded cutoff at 1.0 A. The Lennard–Jones inter-
actions were calculated with a cutoff of 1.4 A, and both
non-bonded interactions were calculated every five steps
during the generation of the neighbor-list (10 ps). The
protonation states of protein ionizable residues were
assigned using the PROPKA option48 implemented by
the PDB2PQR web server (http://agave.wustl.edu/
pdb2pqr/server.html), and only the catalytic D34 was
protonated in Plm systems (not D214).
Molecular topology files for Pepstatin A and the achi-
ral inhibitors are not available for the GROMOS96 force
field. Therefore, the parameters necessary to run Plms–
ligand MD simulations were calculated. In a first step, we
used the PRODRG server (http://davapc1.bioch.dundee.ac.
uk/programs/prodrg)49 to generate a set of parameters
for bonds, angles, atom pairs, proper, and improper
dihedrals based on the GROMOS96 force field.50 Then,
ab initio quantum mechanics calculations at the B3LYP/
6-31G** level were made with the Gamess software51
using CHELPG methodology52 in order to obtain the
partial charges of atoms in these molecules. For this cal-
culation we assumed a null total charge for such inhibi-
tors. We also calculated the intermolecular contact sur-
face area from MD trajectories with the ‘‘SurfInMD’’
software, a program based on the Connolly algorithm53
and developed in the laboratory of Professor Pascutti and
coworkers.54
RESULTS
Sequence and structure analysis
We selected 73 amino acid sequences homologous to
P. falciparum PlmI, PlmII, HAP, and PlmIV, from PSI-
BLAST similarity searches carried out in the NCBI-nr
database. These amino acid sequences belong to organ-
isms from different Phyla covering a wide range of specif-
icities in the aspartic proteases family (e.g. Haemosporida,
Mammalia, Amphibia, Archosauria, Arthropoda, Fish,
Fungi, Platyhelminthes, Viridiplantae, Mollusca, Myceto-
zoa, Nematoda and Lepidosauria). A summary of the
annotations to each amino acid sequence used in the
present study is provided as Supplementary Information
(Table I).
To predict the functional residues in P. falciparum plas-
mepsins, we first generated a multiple sequence align-
ment (MSA) for this protein family, which enabled us to
identify regions with different degrees of variability. Con-
served regions or positions indicate residues supposedly
under stronger evolutionary constraints and that thus
might be more important for the protein to fulfill its
function. Moreover, residues that are specifically con-
served in subfamilies point to sequence changes that
occurred during the divergence of a common ancestor,
and they imply functional changes or the acquisition of
modified specificity.55 The MSA was used to calculate
position-specific conservation scores with a Bayesian
algorithm56 available on the Consurf web server (http://
Consurf.tau.ac.il: see Supplementary Figure). The Con-
surf conservation scores are divided into a discrete scale
of 9 grades for visualization: where grade 1 contains the
most variable positions; grade 5 contains intermediately
conserved positions; and grade 9 contains the most con-
served positions.57 The discrete Consurf conservation
scale for the functional residues proposed here are shown
in Table I: Y17, V105, T108, L191, L242, Q275, and
T298, which belonged to S3 sub-site and the flexible
regions known as Flap (N76-G80), L1 (Q12-I14), L2
Functional Residues in Plasmodium falciparum Plasmepsins
PROTEINS 443

(L158-T165), L3 (L231-F244), L4 (I277-G283).20,31
These residues were identified through their conservation
in different malarial strains, but not in related human as-
partic proteases. Residues V105 and T108 are conserved
in malarial strains, whereas at these equivalent positions
amino acids A and Q/G are found in the human related
aspartic proteases Cathepsin D (hCatD) and Cathepsin E
(hCatE). Residues L191 and L242 are specific to P. falcip-
arum plasmepsins, whereas hCatD and hCatE enzymes
have the amino acids A and Q/D at the same positions.
Residue 275 is occupied by a Q in PlmI/PlmII enzymes,
where residues E and D are present in PlmIV and HAP,
respectively. By contrast, the hydrophobic residues L and
V are found at this position in hCatD and hCatE. Resi-
due T298 is conserved across P. falciparum plasmepsins,
whereas the hCatD and hCatE related proteases have a
hydrophobic L at this position. Likewise, residue Y17 is
conserved among P. falciparum plasmepsins whereas the
human-related proteases have an F or Y amino acid at
this position. Nevertheless, the new functional residues
proposed here differ in their degree of conservation,
which could reflect the different activities or specificities
in the protein family.
In a second step, we explored whether these conserved
residues in P. falciparum plasmepsins were located at the
active site cavity or in an adjacent area. For this purpose,
we used the CASTp web server (http://sts.bioengr-uic.
edu/castp) to examine seven different structures of Plms–
inhibitor complexes determined by X-ray diffraction:
PlmII-Achiral (PDB: 2bju), PlmII-Pepstatin A (PDB:
1xdh), PlmIV–Pepstatin A (PDB: 1ls5), PlmII–RS367
(PDB: 1lee), PlmII–RS370 (PDB: 1lf2), PlmII–EH58
(PDB: 1lf3), and PlmII–Statine based compound (PDB:
1me6). This approach allowed us to identify atoms form-
ing protein pockets, to calculate the volumes and areas of
the pockets, to identify atoms forming the ‘‘rims’’ of the
pocket mouth(s), to calculate the number of mouth
openings for each pocket, as well as the area and circum-
ference of the mouth openings.58 We also computed the
molecular volume and the area of the active site cavity
from the hCatD–Pepstatin A complex (PDB: 1lyb), taking
into account that this human enzyme has 35% sequence
identity with P. falciparum PlmII.
We present the surface electrostatic potential of the
active site pockets from four different Plm–inhibitor and
hCatD–Pepstatin A complexes calculated with the APBS
program59 (see Fig. 2). As can be seen through the
chemical–physical properties of residues that belong to
active site cavities, the hCatD and PlmII/IV active sites
have an equivalent polarity. The analysis of the Plm
binding site cavities defined by the Castp server identifies
the following residues in the pocket lining of the parasite
enzymes (according to the PlmII numbering scheme):
F11, Q12, N13, I14, M15, Y17, I32, D34, G36, A38, M75,
Y77, V78, S79, V105, T108, F111, T114, Y115, S118,
F120, I123, L131, Y192, I212, D214, S215, G216, T217,
S218, A219, T221, P243, F244, Q275, L287, N288, I289,
I290, L292, F294, and I300. When we analyzed the area
(Area_sa, Area_ms) and volume (Vol_sa, Vol_ms) param-
eters calculated by the Castp server for the active site of
each complex (Table II), the active site of hCatD–Pepsta-
tin A complex had greater solvent accessible, molecular
surface areas and volumes than the Plm–inhibitor com-
plexes. We also analyzed the differences in Area_sa,
Area_ms, Vol_sa and Vol_ms in the presence (1Inh) or
absence (2Inh) of a ligand in the enzyme binding site
cavity. Our calculations of DArea and DVol for each
complex binding site show that the achiral inhibitor suf-
Table IDiscrete Conservation Scale for the New Functional Residues Proposed in the
Present Article and the Flexible Regions Known as Flap (N76-G80), L1
(Q12-I14), L2 (L158-T165), L3 (L231-F244), L4 (I277-G283) Calculated
with the Consurf Server
Plasmepsin II Human enzyme residuesConsurf
discrete scaleRegion Residue Cathepsin D Cathepsin E
Flap N76 H77 Q84 4Y77 Y78 Y85 8V78 G79 G86 6S79 S80 T87 8G80 G81 G88 9
L1 Q12 M11 L20 3N13 D12 D21 8I14 A13 M22 6
L2 L158 L169 M170 7P159 S170 S171 7V160 R171 S172 4H161 D172 N173 5D162 P173 — 1K163 Q176 G178 1H164 P177 A179 1T165 G178 G180 3
L3 L231 Q248 Q249 5Q232 K249 N250 1N233 A250 A251 2L234 I251 I252 7D235 G252 G253 6V236 A253 A254 7I237 V254 A255 4K238 P255 P256 2V239 L256 V257 4P240 — — 6F241 I257 — 1L242 Q258 D258 1P243 G259 G259 4F244 E260 E260 4
L4 I277 V294 D294 2E278 S295 F295 2D279 Q296 V296 1V280 A297 D297 2G281 G298 G298 5P282 K299 M299 1G283 T300 Q300 4
S3 subsite Y17 Y16 F25 5Flap interior
pocketV105 A118 Q114 7T108 Q121 G117 6
S20 subsite L191 A204 A205 4S3 subsite Q275 L292 L292 2S30 subsite T298 L318 L318 6
P.A. Valiente et al.
444 PROTEINS

fers a greater decrease in Area_sa, Area_ms, Vol_sa, and
Vol_ms than hCatD–Pepstatin A and Plms–Pepstatin A
complexes.
In the third step, we calculated the atomic-contacts
between Plm residues and the functional inhibitory
groups from the 3D structures annotated in the Protein
Data Bank (PDBs: 2bju, 1xdh, 1ls5, 1lee, 1lf2, 1lf3, 1me6)
using the WHAT IF web server (http://swift.cmbi.kun.nl/
WIWWWI/).60 This procedure allowed us to define
non-contact residues near to the active site cavities previ-
ously calculated with the Castp server, and to show the
enzyme residues in contact with functional inhibitory
Figure 2Top view of the surface electrostatic potential representation of active site pockets from: (A) PlmII–Achiral Inhibitor, (B) PlmII–Pepstatin A, (C) PlmIV–Pepstatin A, and
(D) hCatD–Pepstatin A complexes. The surface is colored according to the electrostatic potential: negative regions (in red), positive regions (in blue), and neutral regions
(in gray). We also provided a color intensity scale (from 215 to 15 kT/e) to better represent the electrostatic potential. [Color figure can be viewed in the online issue,
which is available at www.interscience.wiley.com.]
Table IIParameters Calculated by the Castp Web Server for Active Sites of hCatD–Pepstatin A (1lyb), PlmII–Pepstatin A 1xdh), PlmII–Achiral Inhibitor (2bju),
and PlmIV–Pepstatin A (1ls5) Complexes
Crystallographicstructures
Area_sa (A2) Area_ms (A2) Vol_sa (A3) Vol_ms (A3)
2Inh 1Inh D 2Inh 1Inh D 2Inh 1Inh D 2Inh 1Inh D
1lyb 1000 862.6 137.4 1340.9 1293.5 47.4 1205.1 887.8 317.3 2794.8 2349.7 445.11xdh 677.7 217.7 460 934.3 671.1 263.2 757.9 142.3 615.6 1869.8 738.9 1130.92bju 916.9 418.4 498.5 1340.1 627.1 713 1185.6 536.8 648.8 2722.6 1236.2 1486.41ls5 656.5 213.9 442.6 991.8 674.9 316.9 527.1 114.7 412.4 1664.7 696.6 968.1
Area_sa, solvent accessible area; Area_ms, molecular surface area; Vol_sa, solvent accessible volume; and Vol_ms, molecular surface volume. Calculations of these param-
eters were performed taking into account the presence (1Inh) or absence (2Inh) of the inhibitor in the enzyme binding site cavity. Differences between these values are
shown as D symbol in bold.
Functional Residues in Plasmodium falciparum Plasmepsins
PROTEINS 445

groups in the PlmII–Achiral, PlmII–Pepstatin A, PlmIV–
Pepstatin A, PlmII–RS367, PlmII–RS370, PlmII–EH58,
PlmII–Statine based compounds and hCatD–Pepstatin A
complexes (Table III).
Finally and based on their sequence, a manual analysis
of the residues identified at the active site cavities of
Plms was combined with the information derived from
the calculation of atomic-contacts between Plms residues
and inhibitory functional groups from the Plms–ligand
complexes structures deposited at PDB. These data sup-
ported our identification of four of the seven functional
residues in Plms proposed here: Y17, V105, T108, and
Q275. These residues are close to the plasmepsins active
site groove, whereas the remaining three amino acid
positions (L191, L242, and T298) are more distant from
the enzymes active site.
Comparative 3D modeling
To evaluate our predictions regarding these functional
residues, we calculated 3D models for PlmI and HAP,
and their complexes with Pepstatin A inhibitor. Based on
PlmII and PlmIV 3D structures annotated at PDB, we
chose the high resolution (R) crystallographic structures
2bju (PlmII–Achiral Inhibitor, R 5 1.56 A) and 1xdh
(PlmII–Pepstatin A, R 5 1.7 A) as templates to model
Plms and their respective complexes. To obtain 3D mod-
els of PlmII and PlmIV peptide substrate complexes, we
chose the crystallographic structures of PlmII–Pepstatin
A (PDB code: 1xdh, R 5 1.7 A) and PlmIV–Pepstatin A
(PDB code: 1ls5, R 5 2.8 A) as templates. As a result of
the validation process (see Methods section), the follow-
ing models were chosen: PlmI (98), HAP (87), PlmI–
Pepstatin A (23), HAP–Pepstatin A (63), PlmII–IEFLRL
(5), and PlmIV–IEFLRL (1).
We produced a graphic representation of the molecular
interactions in PlmI–Pepstatin A and HAP–Pepstatin A
complexes obtained using Roman Laskowski services in
pdbsum database (http://www.ebi.ac.uk/thornton-srv/
databases/pdbsum/upload.html, Fig. 3). According to
these models, the PlmI residues M15, G36, S79, I123,
T217, and S219 make additional contacts with inhibitory
functional groups when compared to the 3D structure
used as the template. In the HAP–Pepstatin A complex,
there were also additional contacts established with in-
hibitory functional groups by enzyme residues A36, S37,
F114, A216, T217, V219, and V290 when compared with
the 3D structure used as the template.
The enzyme contact residues with functional substrate
groups in PlmII–IEFLRL and PlmIV–IEFLRL complexes
after MD simulations are classified by subsite pockets in
Table IV. The contact residues were assigned to the corre-
sponding binding sites in the protease (S3, S2, S1, S10,S20, and S30) using a 6.0 A distance cutoff, to determine
the atom–atom contacts between the enzyme and sub-
strate residues (P3, P2, P1, P10, P20, and P30). This stand-ard nomenclature for protease substrate cleavage takes
into account that peptide bond scission occurs between
the P1 and P10 residues.61 A more detailed analysis of
the Plm contact residues in Plms–ligand complexes is
presented in the MD simulations section.
MD simulations
P. falciparum plasmepsins show great flexibility in all
the annotated 3D structures. To explore the conforma-
tional fluctuation of these proteins, we performed MD
simulations using Plms and Plms–ligand structures as the
initial conformations. To study the structural flexibility of
free-state Plms during 3 ns of MD simulation, we calcu-
lated the fluctuation of the root mean square (RMSf) per
residue (see Fig. 4) and we generated a visual 3D RMSf
representation of the deviation of the backbone atoms
with the MOLMOL62 software (see Fig. 5). As a result,
we observed several RMSf peaks in Plms regions L1
(RMSf values from 0.139 to 0.165 nm), Flap (RMSf: 0.119
to 0.203 nm), L2 (RMSf: 0.066 to 0.178 nm), L3 (RMSf:
0.099 to 0.287 nm), L4 (RMSf: 0.151 to 0.219 nm), and
between residues 108 and 119 (RMSf: 0.115–0.2 nm).
Table IIIProtein Contact Residues in PlmII–Pepstatin A (1xdh), hCatD–Pepstatin A
(1lyb), PlmIV–Pepstatin A(1ls5), PlmII–Achiral Inhibitor (2bju), PlmII–
RS367(1lee), PlmII–RS370 (1lf2), PlmII–EH58 (1lf3), and PlmII–statine based
compound (1me6) complexes, Calculated with What if Web Server
1xdh 1lyb 1ls5 2bju 1lee 1lf2 1lf3 1me6
— — L14 I14 — — — —— — — M15 — — — M15I32 V31 — I32 — — I32 —D34 D33 D34 D34 D34 D34 D34 D34— — G36 — G36 G36 G36 G36— — S37 — — — — S37— — — W41 — — — —— — — M75 M75 — — —N76 H77 S76 — — N76 — —Y77 Y78 Y77 Y77 Y77 Y77 Y77 Y77V78 G79 G78 — V78 V78 V78 V78— — S79 — S79 S79 S79 S79— — D109 — — — — —— — — F111 F111 F111 F111 —— — E112 — — — — —— — — T114 — — — —— — — Y115 — — — —— — — I123 I123 I123 — I123— — — — L131 L131 L131 —Y192 Y205 Y192 Y192 — — Y192 —D214 D231 — D214 D214 D214 D214 D214G216 G233 G216 G216 — — G216 —— — T217 — T217 T217 — T217— — S218 — — S218 S218 S218— — — — — — — A219— — L290 — I290 — — I290— — I294 — F294 F294 F294 —— I311 — — — — — —I300 I320 — I300 I300 — I300 —
Residues in equivalent positions according to structure superposition between
Plasmepsins and human Cathepsin D are shown in the same table row.
P.A. Valiente et al.
446 PROTEINS

To study the differences in flexibility of the free-state
Plms and Plms–Pepstatin A complexes during MD simu-
lations, we compared the calculated RMSf per residue of
free and bound PlmII structures [Fig. 6(A)]. We found
that the PlmII–Pepstatin A system displayed a smaller
fluctuation in the flap region than free PlmII. In contrast,
the PlmII system showed a smaller fluctuation in the L3
region than PlmII–Pepstatin A. To investigate the struc-
tural changes in the PlmII–Pepstatin A complex during
MD simulation, we analyzed the temporal evolution of
the complex trajectory. A movement of the L3 region in
the PlmII–Pepstatin A complex closed the enzyme active
site cavity during the 3-ns simulation [Fig. 6(B)]. This
structural change promoted a decrease in the molecular
surface volume of the enzyme active site cavity from
738.9 to 379.6 A3. A similar behavior was observed in
the other Plms–Pepstatin A complexes analyzed.
The contact surface area was calculated from MD trajec-
tories for the PlmII–Pepstatin A and hCatD–Pepstatin A
complexes with the ‘‘SurfInMD’’ program (see Fig. 7). A
comparison between hCatD and PlmII contact residues in
these complexes show the following equivalent positions:
M15, I32, D34, G36, S37, M75, N76, Y77, S79, Y192,
D214, G216, S218, and I300 according to the PlmII num-
bering scheme. Additionally, during MD simulation of the
PlmII–Pepstatin A system, we identified new residues
(T221, P243, F244, Q275, and F294) involved in the con-
tact of the enzyme with functional groups of this inhibitor.
To study the structural plasticity of the PlmII–inhibitor
complexes, we compared the RMSf per residue of this
enzyme when bound to achiral (specific) and Pepstatin A
(non-specific) inhibitors (see Fig. 8). The PlmII–Pepsta-
tin A complex showed smaller fluctuations than the
PlmII–Achiral complex in the L1, L2 and flap regions,
whereas the PlmII–Achiral system displayed a smaller
deviation than PlmII–Pepstatin A in the L3 region. To
investigate the differences in the mode of binding of
PlmII with these inhibitors, we calculated the surface
area of contact residues (see Fig. 9) and the hydrogen
bond prevalence (Table V) from the MD trajectories. A
quantitative analysis of the surface area of the PlmII con-
tact residues in both complexes showed differences in
residues I14, M15, F16, S37, W41, M75, V82, V105,
T108, F111, Y115, S118, F120, I123, G216, T298, and
D303. As a result of our MD simulation experiments, we
found that residues V105, T108, and T298 only estab-
lished contacts with functional groups of the specific
non-peptide achiral inhibitor, which revealed their im-
portance as critical contact points for the design of new
potent and plasmepsin inhibitors.
Hydrogen bonds (hbonds) play a very important role
in protein–inhibitor affinity and to qualitatively evalu-
ate the nature of these hbonds, we calculated the preva-
lence of each bond during MD simulation. Accordingly,
there was a decrease in 10 hbonds in PlmII–Achiral
complex compared with PlmII–Pepstatin A complex
(Table V), and we found that hbonds TYR192OH-
ALA5O, SER79N-VAL3O, VAL78N-STA4O, ASN76ND2-
STA6OG, ASP34OD2-STA4OG, ALA5N-GLY36O, STA4OG-
ASP34OD1, STA4N-THR217OG1 have a prevalence
above 90% in the PlmII–Pepstatin A simulation. In con-
trast, the PlmII–Achiral complex only had three hbonds
with a prevalence below of 50% during the dynamic
modeling.
Figure 3Graphic representations of molecular interactions from 3D models from PlmI–Pepstatin A (A) and HAP–Pepstatin A (B) complexes. Green dashed lines represent
intermolecular hydrogen bonds and red dashed semicircles show the Plm residues that contact Pepstatin A. The red hexagons enclose contact residues in HAP–Pepstatin A
and PlmI–Pepstatin A that are not detected in PlmII–Pepstatin A (template structure use to model these complexes). [Color figure can be viewed in the online issue,
which is available at www.interscience.wiley.com.]
Functional Residues in Plasmodium falciparum Plasmepsins
PROTEINS 447

Table IVProtein Contact Residues with Substrate Functional Groups in PlmII–IEFLRL and PlmIV–IEFLRL Complexes after MD Simulations Classified by Subsite Pockets
Enzymesubsites Residues, PlmII Residues, PlmI Residues, HAP Residues, Plm IV Residues, CatD
Residues,conservation
S3 M15 M15 L15 M15 Q14 7Y17 Y17 F17 Y17 Y16 5S218 S218 S218 S218 S235 8A219 S219 V219 T219 L236 6L242 L242 L242 L242 Q258 1F244 L244 L244 L244 E260 4Q275 Q275 E275 D275 L292 2M286 M286 M286 M286 L303 4L287 V287 L287 L287 S304 6N288 S288 N288 Y288 G305 4I290 I290 V290 L290 M307 4
S2 I14 V14 V14 L14 A13 6I32 I32 L32 I32 V31 7S118 G118 S118 S118 A129 6F120 F120 V120 F120 F131 7G216 G216 A216 G216 G233 8T217 T217 T217 T217 T234 9S218 S218 S218 S218 S235 8D303 D303 D303 D303 D323 8
S1 V78 V78 K78 G78 G79 6T217 T217 T217 T217 T234 9A219 S219 V219 T219 L236 6T221 T221 T221 T221 V238 7I290 I290 V290 L290 M307 4L292 V292 I292 V292 M309 5F294 L294 L294 I294 P314 5I300 I300 V300 I300 I320 8
S10 I32 I32 L32 I32 V31 7L33 F33 F33 F33 F32 8D34 D34 H34 D34 D33 9S37 S37 S37 S37 S36 9F111 F111 F111 L111 I124 3F120 F120 V120 F120 F131 7I123 I123 V123 I123 I134 9D214 D214 D214 D214 D231 9G216 G216 A216 G216 G233 8T217 T217 T217 T217 T234 9D34 D34 H34 D34 D33 9G36 G36 A36 G36 G35 9S37 S37 S37 S37 S36 9A38 A38 S38 A38 S37 9N39 N39 N39 N39 N38 9
S20 W41 W41 W41 W41 W41 8M75 M75 L75 I75 I76 7N76 N76 T76 S76 H77 4Y77 Y77 S77 Y77 Y78 8V78 V78 K78 G78 G79 6L131 L131 L131 L131 I142 6L191 L191 L191 L191 A204 4Y192 Y192 M192 Y192 Y205 7D214 D214 D214 D214 D231 9T217 T217 T217 T217 T234 9
S30 V78 V78 K78 G78 G78 6Y192 Y192 M192 Y192 Y205 7I300 I300 V300 I300 I320 8
The contact residues were assigned to the corresponding binding sites in the protease (S3, S2, S1, S10, S20, and S30) using a distance cutoff of 6.0 A as criteria, to deter-
mine atom–atom contacts between enzyme residues and the substrate residues (P3, P2, P1, P10, P20, and P30). The contact residues of HAP, PlmI, and hCatD proteases
with an equivalent substrate were inferred by homology. The discrete conservation score of each residue calculated with the Consurf server is also displayed.
P.A. Valiente et al.
448 PROTEINS

To understand the different activities of Plm II and
PlmIV,21 we carried out MD simulations of our 3D
models for PlmII–IEFLRL and PlmIV–IEFLRL complexes.
To study the structural changes in the Plms–IEFLRL
complexes throughout the simulations, we compared the
calculated RMSf per residue of enzymes and peptide sub-
strate (see Fig. 10). When focusing only on the enzymes,
PlmIV displayed a smaller fluctuation than PlmII in the
flap region, in contrast to the results observed in the L3
region [Fig. 10(A)]. A similar analysis was performed
with the substrate and a smaller fluctuation in atoms cor-
responding to the P1 residue (F) was observed when sub-
strate IEFLRL was bound to PlmIV. The opposite result
was observed for the atoms of the P20 residue [R, Fig.
10(B)]. To investigate the differences in the mode of
PlmII and PlmIV binding to this substrate, we calculated
the surface area of the contact residues from the MD tra-
jectories (see Fig. 11). A quantitative analysis of the sur-
face area in both complexes indicated differences in the
following contact residues: M15, Y17, M75, N76, S79,
E112, P113, T114, F120, I123, L131, L191, Y192, T221,
F241, L242, F244, and M286 according to PlmII number-
ing scheme. The enzyme residues that contact functional
substrate groups in PlmII–IEFLRL and PlmIV–IEFLRL
complexes after MD simulations were classified by subsite
pockets (Table IV). We also inferred the residues of HAP,
Figure 4Representation of the backbone RMS fluctuation (RMSf) per residue of free-state
Plasmepsins from P. falciparum during the MD simulation: black line, PlmII;
red, PlmI; blue, PlmIV; and green, HAP. Black arrows indicate previously
described flexible regions and red hexagons enclose a new flexible region
predicted here. [Color figure can be viewed in the online issue, which is
available at www.interscience.wiley.com.]
Figure 53D representation of RMS fluctuations in free-state Plms (A, PlmI; B, PlmII; C, PlmIV; D, HAP). The RMSf of the backbone for each system was represented by a tube
of varying thickness, the larger the tube the greater the deviation. Plms secondary structures are displayed with different colors: in red, a-helix; in cyan, b-sheets; andlight gray, loop and coiled structures. [Color figure can be viewed in the online issue, which is available at www.interscience.wiley.com.]
Functional Residues in Plasmodium falciparum Plasmepsins
PROTEINS 449

PlmI, and hCatD proteases that contact an equivalent
substrate by homology. A careful analysis of our 3D
models indicated that residues L191 and L242 formed
part of the S10 and S3 subsites. This strongly supports
our initial prediction based on sequence and structural
analyses.
These data enable us to display the seven new func-
tional residues (Y17, V105, T108, L191, L242, Q275, and
T298) in a specific model of Plms of P. falciparum strain
predicted here, obtained by combining sequence and
structure analyses with molecular dynamic simulations
(see Fig. 12).
DISCUSSION
P. falciparum plasmepsins have a unique substrate
specificity that is the result of variation in the residues
lining the active site cavities.32 Earlier mutagenesis stud-
ies on PlmI and PlmII concluded that differences in sub-
strate-cleavage specificity depend more on conforma-
tional differences due to distant sites than on specific
variation at the active site.63 On the basis of sequence/
structure analysis, comparative modeling and molecular
dynamic studies, we propose here seven residues that are
specific to plasmepsins, that potentially influence their
specificity, and that have not been previously studied by
site directed mutagenesis. These seven amino acids are
conserved across malarial strains but not across human
aspartic proteases. Thus, residues V105, T108, and T298
only establish contacts with functional groups of a spe-
cific non-peptide achiral inhibitor, which sheds light on
the role of these critical contact points in plasmepsin
specificity and will be useful information for the struc-
ture-based design of novel and selective inhibitors as
antimalarial drugs. The remaining four amino acid posi-
tions identified here (Y17, L191, L242, and Q275) form
part of the S3 and S2 subsites, and their weaker evolu-
tionary conservation across the aspartic protease family
studied by us suggest their importance in the functional-
ity specificity of P. falciparum plasmepsins.
Experimental evidences that supportour methodology
In this study, we predicted seven new functional resi-
dues from P. falciparum plasmepsins by combining
sequence and structure analyses with molecular dynamic
simulations of Plms–ligand complexes. To understand the
differences in specificity between P. falciparum plasmep-
sins and the human related cathepsin D, we inferred the
contact residues of hCAtD, PlmI, and HAP by homology
from the structural models of PlmII–IEFLRL and PlmIV–
IEFRL complexes after MD simulations. The S3 subsite
in P. falciparum plasmepsins is a highly hydrophobic
Figure 6Comparison of the backbone RMSf per residue between free state Plm II (red line) and Plm II–Pepstatin A complex (black line) along MD simulations. Black arrows
indicate fluctuations in Flap and L3 Plm II regions (A). In B a snapshot from the movement of the L3 region backbone along PlmII–Pepstatin A MD simulation is
displayed. Each of the pictures is taken at 600 ps. In blue, the actual time step frame fitted to the initial simulation structure (red) is represented. [Color figure can be
viewed in the online issue, which is available at www.interscience.wiley.com.]
P.A. Valiente et al.
450 PROTEINS
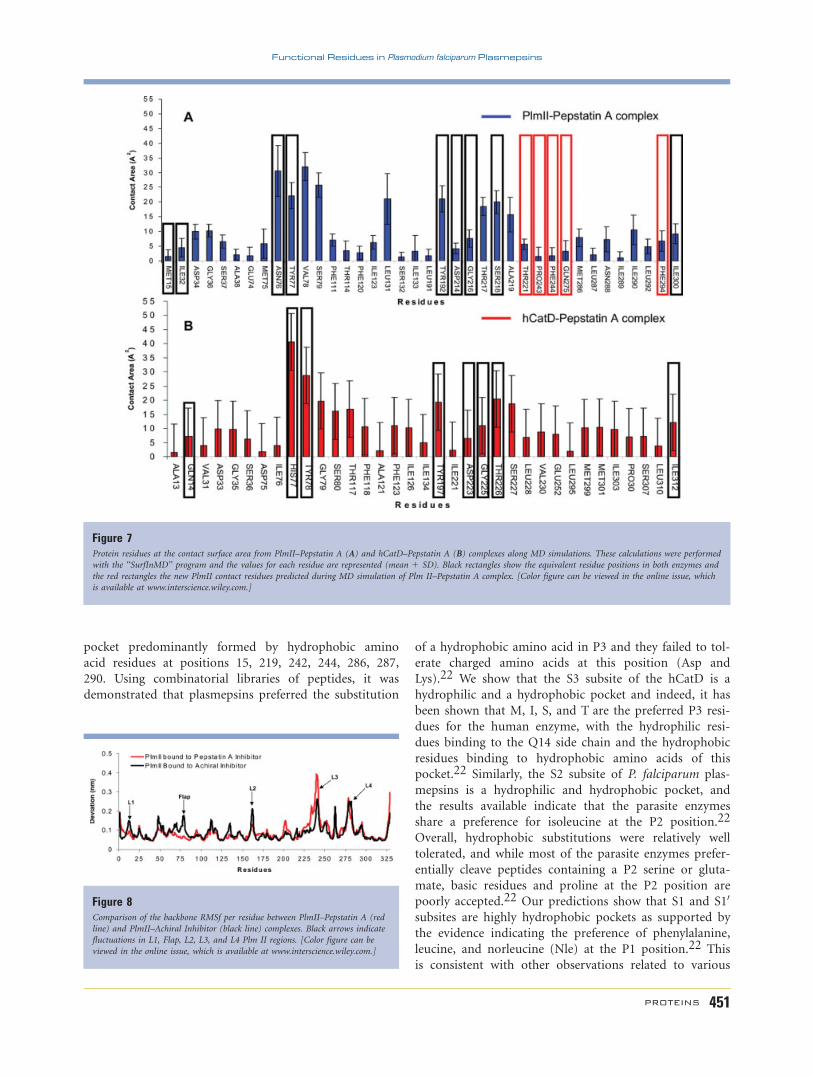
pocket predominantly formed by hydrophobic amino
acid residues at positions 15, 219, 242, 244, 286, 287,
290. Using combinatorial libraries of peptides, it was
demonstrated that plasmepsins preferred the substitution
of a hydrophobic amino acid in P3 and they failed to tol-
erate charged amino acids at this position (Asp and
Lys).22 We show that the S3 subsite of the hCatD is a
hydrophilic and a hydrophobic pocket and indeed, it has
been shown that M, I, S, and T are the preferred P3 resi-
dues for the human enzyme, with the hydrophilic resi-
dues binding to the Q14 side chain and the hydrophobic
residues binding to hydrophobic amino acids of this
pocket.22 Similarly, the S2 subsite of P. falciparum plas-
mepsins is a hydrophilic and hydrophobic pocket, and
the results available indicate that the parasite enzymes
share a preference for isoleucine at the P2 position.22
Overall, hydrophobic substitutions were relatively well
tolerated, and while most of the parasite enzymes prefer-
entially cleave peptides containing a P2 serine or gluta-
mate, basic residues and proline at the P2 position are
poorly accepted.22 Our predictions show that S1 and S10
subsites are highly hydrophobic pockets as supported by
the evidence indicating the preference of phenylalanine,
leucine, and norleucine (Nle) at the P1 position.22 This
is consistent with other observations related to various
Figure 7Protein residues at the contact surface area from PlmII–Pepstatin A (A) and hCatD–Pepstatin A (B) complexes along MD simulations. These calculations were performed
with the ‘‘SurfInMD’’ program and the values for each residue are represented (mean 1 SD). Black rectangles show the equivalent residue positions in both enzymes and
the red rectangles the new PlmII contact residues predicted during MD simulation of Plm II–Pepstatin A complex. [Color figure can be viewed in the online issue, which
is available at www.interscience.wiley.com.]
Figure 8Comparison of the backbone RMSf per residue between PlmII–Pepstatin A (red
line) and PlmII–Achiral Inhibitor (black line) complexes. Black arrows indicate
fluctuations in L1, Flap, L2, L3, and L4 Plm II regions. [Color figure can be
viewed in the online issue, which is available at www.interscience.wiley.com.]
Functional Residues in Plasmodium falciparum Plasmepsins
PROTEINS 451

other members of the aspartic peptidase family.64,65 The
most common residues for the S10 subsite were consis-
tently hydrophobic substitutions.22 Although our models
show that S20 and S30 are hydrophilic and hydrophobic
pockets in P. falciparum plasmepsins, the S20 and S30 sub-sites of plasmepsins have a much broader specificity than
the other subsite pockets examined by the combinatorial
method.22
PlmII is the most extensively characterized P. falcipa-
rum aspartic protease, for which several crystal structures
have been determined,24–26 potent inhibitors devel-
oped14,27–30 and site-directed mutagenesis studies per-
formed.32,66 The enzyme residues that contact with
functional substrate groups in PlmII–IEFLRL and
PlmIV–IEFLRL complexes after MD simulations are clas-
sified by subsite pockets, and the data from previous
site-directed mutagenesis studies supported our 3D mod-
els of PlmII/IV–substrate complexes.32
Mutants of PlmII were constructed to understand the
differences in substrate specificity between the parasite
enzyme and other aspartic proteinases (M15E, I289E,
S79D, and the double mutant M15E/I289E).32 The first
of the PlmII residues altered in this study was M15,
which is located in the S3 subsite, a highly hydrophobic
pocket that determines the preference of large hydropho-
bic residues at P3 position for PlmII. The PlmII M15E
mutant displayed the lowest Michaelis constant for a sub-
strate with K at position P3 among a series of substrates
with variations in this position. This change resulted in a
5.5-fold increase in the specificity constant of the mutant
enzyme with respect to the wild-type enzyme and shows
that the M15 residue contributes to the S3 subsite speci-
ficity of PlmII. These experiments also demonstrate that
pepsin and rhizopuspepsin enzymes that have an E resi-
due in this position could tolerate a K amino acid in the
P3 position of the substrate. However, there were no sig-
nificant differences between the M15E mutant and wild-
type recombinant enzyme in cleaving a hemoglobin-
based substrate, which indicates that this mutation in the
binding site has not altered the natural function of the
enzyme. The second residue altered was I289. This resi-
due lies within the interface of the S2 and S4 subsites of
PlmII. The replacement of this position by an E amino
acid produced a better kcat constant for substrates with K
at position P2 with respect to the wild-type enzyme.
When compared with the M15E single mutant, the
M15E/I289E double mutant demonstrated an additive
effect in the binding constant of P2 or P4 K substrates
and no difference in the kinetic parameters for the P3 ly-
sine substrates. Finally, the introduction of an aspartic
acid at position 79 is insufficient for PlmII to recognize a
substrate having a P1 lysine.32 Our 3D model of the
Figure 9Representation of the Plm II contact surface area from PlmII–Pepstatin A (red bars) and PlmII–Achiral Inhibitor (black bars) complexes during MD simulations as
calculated with the ‘‘SurfInMD’’ program. The values (mean 1 SD) of each residue are represented. Blue rectangles indicate predicted new residues in PlmII that contact
the Achiral inhibitor functional groups (V105, T108, and T298). [Color figure can be viewed in the online issue, which is available at www.interscience.wiley.com.]
Table VHydrogen Bond Prevalence along MD Simulations of PlmII–Pepstatin A (Bold)
and PlmII–Achiral Inhibitor (Italic) Complexes
Donor Acceptor Hydrogen bond stability (%)
ALA219N VAL2O 47.7SER218N VAL2O 68.2TYR192OH ALA5O 98.5SER79N VAL3O 90.6VAL78N STA4O 99.0ASN76ND2 STA6OG 79.3ASP34OD2 STA4OG 98.4STA6N ASN76O 82.2ALA5N GLY36O 93.0STA4OG ASP214OD1 93.1STA4N THR217OG1 94.2VAL3N SER79OG 79.2VAL2N SER218O 87.5SER118OG IH4O27 19.5SER37OG IH4O1 44.3IH4N10 TYR192OH 17.9
P.A. Valiente et al.
452 PROTEINS

PlmII–IEFLRL complex showed that the S79 side chain is
outside of the S1 subsite.
Prediction of functional residues inP. falciparum plasmepsins
Sequence and structure analyses
Key amino acid positions that are important for main-
taining the 3D structure of a protein and/or its functions
(e.g. catalytic activity, binding to ligands, DNA or other
proteins), are often under strong evolutionary con-
straints. Thus, the biological importance of a residue of-
ten correlates with its level of evolutionary conservation
within the protein family.57 To define key residues for
Plms activity, we performed a MSA with 73 homologous
amino acid sequences that show identity ranging from 10
to 88%, in agreement with previous studies.67 The seven
promising residues proposed here are conserved in the
malarial strains but not among human aspartic proteases.
However, they differ in their calculated degree of conser-
vation (indicated in brackets) across the MSA. These resi-
dues are: Y17 [5], V105 [7], T108 [6], L191 [4], L242
[1], Q275 [2], T298 [6] and they have different spatial
locations in the Plm 3D structure. The new positions
proposed here display a well-defined relationship between
the degree of residue conservation and their location in
Figure 10Representation of the backbone RMS fluctuation (RMSf) per residue of Plm II
(dark blue line) and Plm IV (magenta line) along MD simulations of PlmII/
IV–IEFLRL complexes (A). Black arrows indicate fluctuations in the L1, Flap,
L2, L3, and L4 Plm II regions. In B, the RMSf per atom of IEFLRL bound to
Plm II (dark blue line) and Plm IV (magenta line) are displayed during MD
simulations. The substrate groups (P3, P2, P1, P10 , P20, P30) are detached per
atom index. [Color figure can be viewed in the online issue, which is available
at www.interscience.wiley.com.]
Figure 11Protein contact surface area from PlmII–IEFLRL (A) and PlmIV–IEFLRL (B) complexes during MD simulations as calculated with the ‘‘SurfInMD’’ program. The values
(mean 1 SD) of each residue are represented. Black rectangles enclose enzyme residues at positions with different contact surface areas depending on the substrate. [Color
figure can be viewed in the online issue, which is available at www.interscience.wiley.com.]
Functional Residues in Plasmodium falciparum Plasmepsins
PROTEINS 453

the Plm 3D structure. The residues V105 and T108 are
located in an interior flap pocket and they only establish
contacts with a specific non-peptide achiral inhibitor.
Residue L242 is located at the L3 loop30, a highly con-
served region in all Plms that was recently described as
an essential region for cleaving intact hemoglobin.68 Res-
idue Q275 is localized in the small b1024 neighbor to
the L4 loop30, whereas residues Y17, L191, and T298
belong to well-defined pockets lining the binding site
cavity (see Table I).
Both shape and chemical complementarity are the
underlying bases of molecular recognition.58 Based on
this, we performed a detailed analysis of the 3D struc-
tures of seven Plm–inhibitor and hCatD–Pepstatin A
complexes annotated at PDB. There was great plasticity
in shape and size parameters (area and volume) of the
Plm–ligand binding sites cavities. Comparison of Plms–
PepstatinA, hCatD–Pepstatin A and the other Plms–pep-
tidomimetic inhibitor complexes (PlmII–RS367, PlmII–
RS370, PlmII–EH58, PlmII–Statine-based compound),
indicates similar enzyme contact residues with these
functional ligand groups. This explains the poor selectiv-
ity of these peptidomimetic inhibitors for parasite and
hCatD enzymes.69 On the other hand, the difference in
volume and surface binding site cavities for Plms–Pepsta-
tin A and hCatD–Pepstatin A complexes reveals a smaller
active site for parasite enzymes and unoccupied spaces in
active sites of Plms–Pepstatin A complexes, which could
be useful to perform structure-based ligand design. These
phenomena are in agreement with previous studies per-
formed on 51 monomeric enzymes–ligand complexes,
that indicated a linear relationship between ligand vol-
ume and binding site volume when the cavity volumes
was smaller than 700 A.3,58
Comparative 3D modeling of plasmepsinsand plasmepsin–ligand complexes
The 3D structures of proteins in a family are more
conserved than their sequences.70 Therefore, if any simi-
larity between two proteins is detectable at the sequence
level, structural similarity can usually be assumed.71
Although the level of sequence identity among the aspar-
tic proteases of Plasmodium species is rather high
(�60%), substrate specificity and their responses to
inhibitors may be different, indicating variations in the
specific binding interactions among the different plas-
mepsins.19–22 Other 3D models of mature PlmI (PDB:
1lcr), HAP (ModBase: Q81M15), and PlmI/II substrates
complexes have been proposed.72 Recently, the 3D crys-
tallographic structures of PlmII were solved with a higher
resolution (2 bju [PlmII–Achiral Inhibitor, R 5 1.56 A]
and 1xdh [PlmII–Pepstatin A, R 5 1.7 A]). Hence, we
generated 3D models of Plms and Plms–Pepstatin A
complexes using these structures as templates, whereas to
calculate the 3D models of PlmII/IV substrates, we used
1xdh (PlmII–Pepstatin A, R 5 1.7 A) and 1ls5 (PlmIV–
Pepstatin A, R 5 2.8 A) as templates rather than the
1smr (mouse renin complex with a decapeptide inhibitor
(CH66), R 5 2.0 A) employed previously.72 In our 3D
models, T221 changes its location from the S2 to S1 sub-
site. This difference could be explained by considering
the opposing orientation of P1 side chain in ligand tem-
plates. We consider the valine residue 3 of Pepstatin A as
the P1 position whereas others have taken the leucine
residue as the P1 position in the CH-66 inhibitor.72
However, both models explain the residue assignment of
other subsites.
MD simulations of plasmepsins andplasmepsin–ligand complexes
Large-scale movements have increasingly been sug-
gested to play a role in aspartyl protease enzyme activ-
ity.73–77 Previous structural studies of 3D Plm structures
annotated at PDB indicated that these enzymes have
great structural flexibility in the flap, L1, L2, L3, and L4
regions.30 Our MD studies of these proteins define an
additional flexible region between residues 108–119. Resi-
dues (V105, T108) near to the active site cavity establish
new contacts with functional groups of the Achiral inhib-
itor after MD simulation. The MD simulations of Plms
complexed with Pepstatin A inhibitor revealed a move-
ment of the L3 region that closed the protease active site,
and that promoted the formation of new contacts
between the parasite enzymes and the Pepstatin A inhibi-
tor. This movement explained the increase in structural
fluctuation in the L3 region when PlmII is complexed to
the Pepstatin A inhibitor when compared with the PlmII
Figure 12Top view ribbon diagram representation of Plm II from P. falciparum. Licorice
diagram represents the seven new functional residues proposed in this work: Y17,
V105, T108, L191, L242, Q275, and T298 according to Plm II number scheme.
[Color figure can be viewed in the online issue, which is available at
www.interscience.wiley.com.]
P.A. Valiente et al.
454 PROTEINS

free-state. To understand this conformational changes in
the L3 region of PlmII–Pepstatin A complex structure,
we analyzed the high resolution crystallography structure
(1xdh). In this structure PlmII is a dimer, due to a
hydrophobic contact between the L3 region of A and B
chains, although it was recently demonstrated that PlmII
is a functional monomer in solution.68 Similarly, it was
reported that L3 loop residues are essential to cleave he-
moglobin between residues Phe33 and Leu34 at acidic
pH, due to the compromised ability to cleave intact he-
moglobin of a chimeric aspartic protease when the L3
loop of the PlmII sequence is replaced with its equivalent
Cathepsin E sequence.68 These authors had previously
reported that cathepsin E could not cleave intact hemo-
globin at pH 5.66 During our MD simulation, residue
F244 was located in the S3 subsite due to the L3 loop
movement observed in Plms–Pepstatin A and PlmII/IV–
substrate systems. This finding explains the differences in
the kinetics parameters of mutants F244E, F244K, and
F244A with the synthetic substrate DABCYL-GABA-
ERMFLSFP-EDANS (based on sequence 30–37 of hemo-
globin a-chain) previously reported.66 The F244E mu-
tant had a lower Km and kcat than the wild type enzyme
for this substrate. The lower Km of F244E reflected the
improved binding for the wild type enzyme on this sub-
strate, and the lower kcat of F244E suggests a poorer pro-
ductive orientation of the bond to be cleaved than in the
native protease.66
Plasmepsins from P. falciparum species share similar
3D structures but different catalytic properties against
known substrates.22 There is a well-defined correlation
between the higher deviation of the P1 position in the
IEFLRL substrate when it is bound to PlmII in our simu-
lations and the weaker affinity for this substrate and
poorer efficiency when compared to PlmIV.22 This sug-
gests a better productive orientation of the bond to be
cleaved (F–L). Moreover, markedly different preferences
for substrates were demonstrated between PlmII and
PlmIV, suggesting that these enzymes might cleave differ-
ent sites in the globin chains of the hemoglobin.22
Poor selectivity for human aspartic proteases is an im-
portant issue when developing inhibitors of pathogenic
enzymes. The two major concerns are toxicity and/or
possible reduction of the concentrations reaching the
pathogen.3 Plasmepsins have a varying degree of
sequence homology with human aspartic proteases, the
most similar being the lysosomal enzyme cathepsinD.
CathepsinE, renin, and pepsin A, represent other impor-
tant human aspartic proteases that exhibit poor sequence
homology,24,78 although hCatD is commonly used as
the marker for cross-inhibition. To develop new specific
inhibitors for Plms, it is useful to map the residues that
establish contact with specific inhibitors in the enzyme’s
active site, and to exploit the differences in the subsite
preferences of these enzymes.69 A comparison between
the contact residues surface area in PlmII–Achiral and
PlmII–Pepstatin A complexes indicates that residues I14,
M15, F16, S37, W41, M75, V82, V105, T108, F111, Y115,
S118, F120, I123, G216, T298, and D303 are important
to design Plms specific inhibitors. The achiral inhibitor
establish contacts in unoccupied spaces corresponding to
the S3 subsite residues (I14, M15, F16, F120, and I123),
the S2 subsite (S118) of PlmII–Pepstatin A 3D structure,
and those in a new pocket (W41, V82, V105, T108,
F111) formed by rotation of the Y77 and W41 side
chains in combination with a substantial movement of
the flap’s main chain.79 The lower hbonds in PlmII–
Achiral Inhibitor complex compared to the PlmII–Pespta-
tin A complex are also remarkable. Previous studies
reported that Pepstatin A has a better affinity for Plms
than the achiral inhibitor.24,69 Although we have not
performed free energy calculations for these Plms–Inhibi-
tor complexes, our results suggest that electrostatic inter-
actions (hbonds) contribute more to the binding strength
than the van der Waals interactions in PlmII–Pepstatin A
complex than in the PlmII–Achiral inhibitor complex.
This suggests the possibility of improving achiral inhibi-
tor potency by introducing some polar groups in the
molecular structure of the inhibitor without affecting its
selectivity.
CONCLUSIONS
In this work, combining sequence/structure analysis,
molecular modeling and MD methodologies, we propose
seven residues that are specific to plasmepsins: Y17,
V105, T108, L191, L242, Q275, T298 (according to PlmII
numbering scheme) that have not been predicted previ-
ously. Indeed, residues V105 and T108 are located in an
interior flap pocket that only established contacts with a
specific non-peptide achiral Inhibitor, which sheds light
on the role of V105 and T108 residues in plasmepsin
specificity. This information could be useful for the
structure-based design of novel and selective inhibitors to
be employed as antimalarial drugs. We also predict a
conformational change in the L3 region of the Plms 3D
structures when these enzymes are in a complex with
Pepstatin A and peptide substrates. This movement closes
the enzyme active site and explains previous experimental
evidence. Mutagenesis experiments are likely to be the
easiest way to verify the function of the residues identi-
fied in this work and to test the L3 loop flexibility hy-
pothesis that we propose.
ACKNOWLEDGMENTS
PAV thanks the International Union of Biochemistry
and Molecular Biology (IUBMB) for providing a fellow-
ship for traveling to Brazil, and the Government of Brazil
for providing a CAPES research fellowship. TP acknowl-
edges the Spanish Biotechnology Society (SEBiot) for pro-
viding a post-doctoral research fellowship. The authors
Functional Residues in Plasmodium falciparum Plasmepsins
PROTEINS 455

thank MSc. Rossana Garcia and Dr. Mark Sefton for the
helpful revision of the final manuscript versions.
REFERENCES
1. With joint forces against Malaria. Second Annual Biology and
Pathology of the Malaria Parasite conference BioMalPar, April 5
Press release. Heidelberg, Germany 2006.
2. Breman JG. The ears of the hippopotamus: manifestations, determi-
nants, and estimates of the malaria burden. Am J Trop Med Hyg
2001;64:1–11.
3. Coombs GH, Goldberg DE, Klemba M, Berry C, Kay J, Mottram
JC. Aspartic proteases of Plasmodium falciparum and other parasitic
protozoa as drug targets. Trends Parasitol 2001;1:532–537.
4. Goldberg DE, Slater AF, Cerami A, Henderson GB. Hemoglobin
degradation in the malaria parasite Plasmodium falciparum: an or-
dered process in a unique organelle. Proc Natl Acad Sci USA 1990;
87:2931–2935.
5. Goldberg DE, Slater AF, Beavis R, Chait B, Cerami A, Henderson
GB. Hemoglobin degradation in the human malaria pathogen Plas-
modium falciparum: a catabolic pathway initiated by a specific as-
partic protease. J Exp Med 1991;173:961–969.
6. Klemba M, Goldberg DE. Biological roles of proteases in parasitic
protozoa. Annu Rev Biochem 2002;7:275–305.
7. Shenai BR, Sijwali PS, Singh A, Rosenthal PJ. Characterization of
native and recombinant falcipain-2, a principal trophozoite cysteine
protease and essential hemoglobinase of Plasmodium falciparum.
J Biol Chem 2000;75:29000–29010.
8. Murata CE, Goldberg DE. Plasmodium falciparum falcilysin: a met-
alloprotease with dual specificity. J Biol Chem 2003;278:38022–38028.
9. Francis SE, Gluzman IY, Oksman A, Knickerbocker A, Mueller R,
Bryant ML, Sherman DR, Russell DG, Goldberg DE. Molecular
characterization and inhibition of a Plasmodium falciparum apartic
hemoglobinase. EMBO J 1994;13:306–317.
10. Moon RP, Tyas L, Certa U, Rupp K, Bur D, Jacquet C, Matile H,
Loetscher H, Grueninger-Leitch F, Kay J, Dunn BM, Berry C, Ridley
RG. Expression and characterization of plasmepsin I from Plasmo-
dium falciparum. Eur J Biochem 1997;244:552–560.
11. Soni S, Dhawan S, Rosen KM, Chafel M, Chishti AH, Hanspal M.
Characterization of events preceding the release of malaria parasite
from the host red blood cell. Blood Cells Mol Dis 2005;35:201–211.
12. Banerjee R, Goldberg DE. The Plasmodium food vacuole. In:
Rosenthal PJ, editor. Antimalarial chemotherapy, mechanism of
action, resistance, and new directions in drug discovery. Humana,
Totowa, NJ, 2001. pp 43–63.
13. Rosenthal PJ. Antimalarial chemotherapy, mechanisms of action, re-
sistance, and new directions in drug discovery. In: Rosenthal PJ,
editor. Humana, Totowa, NJ, 2001. pp 325–345.
14. Haque TS, Skillman AG, Lee CE, Habashita H, Gluzman IY, Ewing
TJ, Goldberg DE, Kuntz ID, Ellman JA. Potent, low-molecular-
weight non-peptide inhibitors of malarial aspartyl protease plas-
mepsin II. J Med Chem 1999;42:1428–1440.
15. Gardner MJ, Hall N, Fung E, White O, Berriman M, Hyman RW,
Carlton JM, Pain A, Nelson KE, Bowman S, Paulsen IT, James K,
Eisen JA, Rutherford K, Salzberg SL, Craig A, Kyes S, Chan MS,
Nene V, Shallom SJ, Suh B, Peterson J, Angiuoli S, Pertea M, Allen
J, Selengut J, Haft D, Mather MW, Vaidya AB, Martin DMA, Fair-
lamb AH, Fraunholz MJ, Roos DS, Ralph SA, McFadden GI, Cum-
mings LM, Subramanian GM, Mungall C, Venter JC, Carucci DJ,
Hoffman SL, Newbold C, Davis RW, Fraser CM, Barrell B. Genome
sequence of the human malaria parasite Plasmodium falciparum.
Nature 2002;419:498–511.
16. Banerjee R, Liu J, Beatty W, Pelosof L, Klemba M, Goldberg DE.
Four plasmepsins are active in the Plasmodium falciparum food
vacuole, including a protease with an active-site histidine. Proc Natl
Acad Sci USA 2002;99:990–995.
17. Liu J, Gluzman IY, Drew ME, Goldberg DE. The role of Plasmo-
dium falciparum food vacuole plasmepsins. J Biol Chem 2005;280:
1432–1437.
18. Bonilla JA, Bonilla TD, Yowell CA, Fujioka H, Dame JB. Critical
roles for the digestive vacuole plasmepsins of Plasmodium falcipa-
rum in vacuolar function. Mol Microbiol 2007;65:64–75.
19. Wyatt DM, Berry C. Activity and inhibition of plasmepsin IV, a
new aspartic proteinase from the malaria parasite Plasmodium fal-
ciparum. FEBS Lett 2002;513:159–162.
20. Li T, Yowell CA, Beyer BB, Hung SH, Westling J, Lam MT, Dunn
BM, Dame JB. Recombinant expression and enzymatic subsite char-
acterization of plasmepsin4 from the four Plasmodium species
infecting man. Mol Biochem Parasitol 2004;135:101–109.
21. Nezami A, Kimura T, Hidaka K, Kiso A, Liu J, Kiso Y, Goldberg
DE, Freire E. High-affinity inhibition of a family of Plasmodium fal-
ciparum proteases by a designed adaptive inhibitor. Biochemistry
2003;42:8459–8464.
22. Beyer BB, Johnson JV, Chung AY, Li T, Madabushi A, Agbandje-
McKenna M, McKenna R, Dame JB, Dunn BM. Active-site specific-
ity of digestive aspartic peptidases from the four species of Plasmo-
dium that infect humans using chromogenic combinatorial peptide
libraries. Biochemistry 2005;44:1768–1779.
23. Dame JB, Yowell CA, Omara-Opyene L, Carlton JM, Cooper RA, Li T.
Plasmepsin 4, the food vacuole aspartic proteinase found in all Plas-
modium spp. infecting man. Mol Biochem Parasitol 2003;130:1–12.
24. Silva AM, Lee AY, Gulnik SV, Majer P, Collins J, Bhat TN, Collins
PJ, Cachau RE, Luker KE, Gluzman IY, Francis SE, Oksman A,
Goldberg DE, Erickson JW. Structure and inhibition of plasmepsin
II, a emoglobin-degrading enzyme from Plasmodium falciparum.
Proc Natl Acad Sci USA 1996;93:10034–10039.
25. Asojo OA, Gulnik SV, Afonina E, Yu B, Ellman JA, Haque TS, Silva
AM. Novel uncomplexed and complexed structures of plasmepsin
II, an aspartic protease from Plasmodium falciparum. J Mol Biol
2003;327:173–181.
26. Asojo OA, Afonina E, Gulnik SV, Yu B, Erickson JW, Randad R, Med-
jahed D, Silva AM. Structures of ser205 mutant plasmepsin II from Plas-
modium falciparum at 1.8 angstrom in complex with the inhibitors
rs367 and rs370. Acta Crystallogr D Biol Crystallogr 2002;58:2001–2008.
27. Boss C, Richard-Bildstein S, Weller T, Fischli W, Meyer S, Binkert
C. Inhibitors of the Plasmodium falciparum parasite aspartic prote-
ase plasmepsin II as potential antimalarial agents. Curr Med Chem
2003;10:883–907.
28. Ersmark K, Feierberg I, Bjelic S, Hulten J, Samuelsson B, Aqvist J,
Hallberg A. C-2-symmetric inhibitors of Plasmodium falciparum
plasmepsin II: synthesis and theoretical predictions. Bioorg Med
Chem 2003;11:3723–3733.
29. Ersmark K, Feierberg I, Bjelic S, Hamelink E, Hackett F, Blackman
MJ, Hulten J, Samuelsson B, Aqvist J, Hallberg A. Potent inhibitors
of the Plasmodium falciparum enzymes plasmepsin I and II devoid
of cathepsin D inhibitory activity. J Med Chem 2004;47:110–122.
30. Kiso A, Hidaka K, Kimura T, Hayashi Y, Nezami A, Freire E, Kiso
Y. Search for substrate-based inhibitors fitting the S-2 space of ma-
larial aspartic protease plasmepsin II. J Pept Sci 2004;10:641–647.
31. Bhargavi R, Sastry GM, Murty US, Sastry GN. Structural and active
site analysis of plasmepsins of Plasmodium falciparum: potential
anti-malarial targets. Int J Biol Macromol 2005;37:73–84.
32. Westling J, Cipullo P, Hung S, Saft H, Dame JB, Dunn BM. Active
site specificity of plasmepsin II. Protein Sci 1999;8:2001–2009.
33. Liu J, Istvan ES, Goldberg DE. Hemoglobin-degrading plasmepsin
II is active as a monomer. J Biol Chem 2006;281:38682–38688.
34. Thompson JD, Higgins DG, Gibson TJ. CLUSTAL W: improving
the sensitivity of progressive multiple sequence alignment through
sequence weighting, position-specific gap penalties and weight ma-
trix choice. Nucleic Acids Res 1994;22:4673–4680.
35. Galtier N, Gouy M, Gautier C. SEAVIEW and PHYLO_WIN: two
graphic tools for sequence alignment and molecular phylogeny.
Comput Appl Biosci 1996;6:543–548.
P.A. Valiente et al.
456 PROTEINS

36. Sali A, Blundell TL. Comparative protein modeling by satisfaction
of spatial restraints. J Mol Biol 1993;234:779–815.
37. Shen MY, Sali A. Statistical potential for assessment and prediction
of protein structures. Protein Sci 2006;15:2507–2524.
38. Van Der Spoel D, Lindahl E, Hess B, Groenhof G, Mark AE,
Berendsen HJ. GROMACS: fast, flexible, and free. J Comput Chem
2005;26:1701–1718.
39. Oostenbrink C, Villa A, Mark AE, van Gunsteren WF. A biomolecu-
lar force field based on the free enthalpy of hydration and solvation:
the GROMOS force-field parameter sets 53A5 and 53A6 J. Comput
Chem 2004;25:1656–1676.
40. Humphrey W, Dalke A, Schulten K. VMD: visual molecular dynam-
ics. J Mol Graph 1996;14:33–38, 27–28.
41. Berendsen HJC, Postma JPM, Gunsteren WFV, Hermans J. Interac-
tion models for water in relation to protein hydration. In: Pullman
B, editor. Intermolecular forces. Dordrecht, The Netherlands: Rei-
del; 1981. pp 331–342.
42. Verlet L. Computer Experiments on classical fluids I. Thermody-
namical properties of Lennard-Jones molecules. Phys Rev 1967;159:
98–103.
43. Hess B, Bekker H, Berendsen HJC, Fraaije JGEM. LINCS: a linear
constraint solver for molecular simulations. J Comput Chem 1997;
18:1463–1472.
44. Miyamoto S, Kollman PA. Settle an analytical version of the shake
and rattle algorithm for rigid water models. J Comput Chem
1992;13:952–962.
45. Berendsen HJC, Postma JPM, Vangunsteren WF, Dinola A, Haak
JR. Molecular-dynamics with coupling to an external bath. J Chem
Phys 1984;81:3684–3690.
46. Darden T, York D, Pedersen L. Particle mesh Ewald: an N-log(N)
method for Ewald sums in large systems. J Chem Phys 1993;98:
10089–10092.
47. Essmann U, Perera L, Berkowitz ML, Darden T, Lee H, Pedersen
LG. A smooth particle mesh ewald potential. J Chem Phys 1995;
103:8577–8592.
48. Li H, Robertson AD, Jensen JH. Very fast empirical prediction and
rationalization of protein pKa values. Proteins 2005;61:704–721.
49. van Aalten DM, Bywater R, Findlay JB, Hendlich M, Hooft RW,
Vriend G. PRODRG, a program for generating molecular topologies
and unique molecular descriptors from coordinates of small mole-
cules. J Comput Aided Mol Des 1996;10:255–262.
50. van Gunsteren WF, Billeter SR, Eising AA, Hunenberger PH, Kruger
P, Mark AE, Scott WRP, Tironi IG. Biomolecular simulation: the
GROMOS96 manual and user guide. vdf Hochschulverlag AG an
der ETH Zurich and BIOMOS b.v., Zurich, Groningen; 1996.
51. Schmidt MW, Baldridge KK, Boatz JA, Elbert ST, Gordon MS, Jen-
sen JH, Koseki S, Matsunaga N, Nguyen KA, Su SJ, Windus TL,
Dupuis M, Montgomery JA. General atomic and molecular elec-
tronic structure system. J Comput Chem 1993;14:1347–1363.
52. Breneman CM, Wiberg KB. Determining atom-centered monopoles
from molecular electrostatic potentials. The need for high sampling
density in formamide conformational analysis. J Comput Chem 1990;
11:361–373.
53. Connolly ML. Solvent-accessible surfaces of proteins and nucleic-
acids. Science 1983;221:709–713.
54. Batista PR, Wilter A, Durham EH, Pascutti PG. Molecular dynamics
simulations applied to the study of subtypes of HIV-1 protease
common to Brazil, Africa, and Asia. Cell Biochem Biophys 2006;44:
395–404.
55. Lopez-Romero P, Gomez MJ, Gomez-Puertas P, Valencia A. Predic-
tion of functional sites in proteins by evolutionary methods. In:
Kamp RM, Calvete JJ, Choli-Papadopoulou T, editors. Principles
and practice. Methods in proteome and protein analysis, Berlin,
Heidelberg: Springer-Verlag; 2004. Chapter 22, pp 319–340.
56. Mayrose I, Graur D, Ben-Tal N, Pupko T. Comparison of site-spe-
cific rate-inference methods for protein sequences: empirical Bayes-
ian methods are superior. Mol Biol Evol 2004;21:1781–1791.
57. Landau M, Mayrose I, Rosenberg Y, Glaser F, Martz E, Pupko T,
Ben-Tal N. Consurf 2005: the projection of evolutionary conserva-
tion scores of residues on protein structures. Nucleic Acids Res
2005;33:W299–W302.
58. J Liang, Edelsbrunner H, Woodward C. Anatomy of protein pockets
and cavities: measurement of binding site geometry and implica-
tions for ligand design. Protein Sci 1998;7:1884–1897.
59. Baker NA, Sept D, Joseph S, Holst MJ, McCammon JA. Electro-
statics of nanosystems: application to microtubules and the ribo-
some. Proc Natl Acad Sci USA 2001;98:10037–10041.
60. Vriend G. WHAT IF: a molecular modeling and drug design pro-
gram. J Mol Graph 1990;8:52–56.
61. Maly DJ, Huang L, Ellman JA. Combinatorial strategies for target-
ing protein families: application to the proteases. Chembiochem
2002;3:16–37.
62. Koradi R, Billeter M, Wuthrich K. MOLMOL: a program for display
and analysis of macromolecular structures. J Mol Graph 1996;14:51–55.
63. Siripurkpong P, Yuvaniyama J, Wilairat P, Goldberg DE. Active site
contribution to specificity of the aspartic proteases plasmepsins I
and II. J Biol Chem 2002;277:41009–41013.
64. Powers JC, Harley AD, Myers DV. Subsite specificity of porcine
pepsin. Adv Exp Med Biol 1977;95:141–157.
65. Scarborough PE, Guruprasad K, Topham C, Richo GR, Conner GE,
Blundell TL, Dunn BM. Exploration of subsite binding specificity
of human cathepsin D through kinetics and rule-based molecular
modeling. Protein Sci 1993;2:264–276.
66. Istvan ES, Goldberg DE. Distal substrate interactions enhance plas-
mepsin activity. J Biol Chem 2005;280:6890–6896.
67. Altschuh D, Verner T, Berti P, Moras D, Nagai K. Coordinated
amino acid changes in homologous protein families. Protein Eng
1988;2:193–199.
68. Liu J, Istvan ES, Goldberg DE. Hemoglobin-degrading plasmepsin
II is active as a monomer. J Biol Chem 2006;281:38682–38688.
69. Ersmark K, Samuelsson B, Hallberg A. Plasmepsins as potential tar-
gets for new antimalarial therapy. Med Res Rev 2006;26:626–666.
70. Lesk AM, Chothia C. How different amino acid sequences deter-
mine similar protein structures: the structure and evolutionary dy-
namics of the globins. J Mol Biol 1980;136:225–270.
71. Marti-Renom MA, Stuart AC, Fiser A, Sanchez R, Melo F, Sali A.
Comparative protein structure modeling of genes and genomes.
Annu Rev Biophys Biomol Struct 2000;29:291–325.
72. Brinkworth RI, Prociv P, Loukas A, Brindley PJ. Hemoglobin-
degrading, aspartic proteases of blood-feeding parasites: substrate
specificity revealed by homology models. J Biol Chem 2001;276:
38844–38851.
73. Cascella M, Micheletti C, Rothlisberger U, Carloni P. Evolutionarily
conserved functional mechanics across pepsin-like and retroviral as-
partic proteases. J Am Chem Soc 2005;127:3734–3742.
74. Piana S, Carloni P, Parrinello M. Role of conformational fluctua-
tions in the enzymatic reaction of HIV-1 protease. J Mol Biol 2002;319:
567–583.
75. Micheletti C, Carloni P, Maritan A. Accurate and efficient descrip-
tion of protein vibrational dynamics: comparing molecular dynam-
ics and Gaussian models. Proteins 2004;55:635–645.
76. Neri M, Cascella M, Micheletti C. The influence of conformational
fluctuations on enzymatic activity: modelling the functional motion
of b-secretase. J Phys Condens Matter 2005;17:S1581–S1593.
77. Perryman AL, Lin JH, McCammon JA. HIV-1 protease molecular
dynamics of a wild-type and of the V82F/I84V mutant: possible
contributions to drug resistance and a potential new target site for
drugs. Protein Sci 2004;13:1108–1123.
78. Bernstein NK, Cherney MM, Yowell CA, Dame JB, James MNG.
Structural insights into the activation of P. vivax plasmepsin. J Mol
Biol 2003;329:505–524.
79. Prade L, Jones AF, Boss C, Richard-Bildstein S, Meyer S, Binkert C,
Bur D. X-ray structure of plasmepsin II complexed with a potent
achiral inhibitor. J Biol Chem 2005;280:23837–23843.
Functional Residues in Plasmodium falciparum Plasmepsins
PROTEINS 457