Predicting employment outcomes of rehabilitation clients with orthopedic disabilities: a CHAID...
14
RESEARCH PAPER Predicting employment outcomes of rehabilitation clients with orthopedic disabilities: A CHAID analysis FONG CHAN 1 , GLADYS CHEING 2 , JACOB YUI CHUNG CHAN 1 , DAVID A. ROSENTHAL 1 , & JULIE CHRONISTER 3 1 Department of Rehabilitation Psychology and Special Education, University of Wisconsin- Madison, Madison, WI, USA, 2 Department of Rehabilitation Sciences, The Hong Kong Polytechnic University, Hong Kong, and 3 Department of Educational Foundations and Counseling, Hunter College, City University of New York, New York, USA Accepted April 2005 Abstract Purpose. To examine demographic and service factors affecting employment outcomes of people with orthopedic disabilities in public vocational rehabilitation programs in the United States. Method. The sample included 74,861 persons (55% men and 45% women) with disabilities involving the limbs or spinal column who were closed either as rehabilitated or not rehabilitated by their state-run vocational rehabilitation agencies in the fiscal year 2001. Mean age of participants was 41.4 years (SD = 11.2). The dependent variable is employment outcomes. The predictor variables include a set of personal history variables and rehabilitation service variables. Results. The chi-squared automatic interaction detector (CHAID) analysis indicated that job placement services significantly enhanced competitive employment outcomes but were significantly underutilized (only 25% of the clients received this service). Physical restoration and assistive technology services along with support services such as counseling also contributed to positive employment outcomes. Importantly, clients who received general assistance, supplementary security income, and/or social security disability insurance benefits had a significant lower competitive employment rates (45%) than clients without such work disincentives (60%). Conclusion. The data mining approach (i.e., CHAID analysis) provided detailed information and insight about interactions among demographic variables, service patterns, and competitive employment rates through the segmentation of the sample into mutually exclusive homogeneous subgroups. Keywords: Vocational rehabilitation, rehabilitation outcomes, data mining Work is fundamental to the physical and psycholo- gical health and well-being of people living in contemporary societies [1,2]. The importance of work, both therapeutically and economically, has long been recognized by vocational rehabilitation professionals who have consistently advocated that work is a basic human right of persons with disabilities [3,4]. Effectively, the primary goal of vocational rehabilitation is to assist individuals with disabilities gain or regain their independence through employment or some form of meaningful activity [3,5]. The 1998 Amendments to the Rehabilitation Act defined vocational rehabilitation as a compre- hensive sequence of services, mutually planned by the consumer and rehabilitation counselor, to max- imize employability, independence, integration and participation of people with disabilities in the work- place and the community [6]. In the United States, the public vocational rehabilitation program was established to provide vocational rehabilitation services to people with physical and psychological disabilities [7,8]. At present, 78.7% of the budget for the public vocational rehabilitation program comes from the federal government and 21.3% comes from state and local funds—an amount that roughly translates into Correspondence: F. Chan, Department of Rehabilitation Psychology and Special Education, University of Wisconsin-Madison, Madison, WI, USA. Disability and Rehabilitation, March 2006; 28(5): 257 – 270 ISSN 0963-8288 print/ISSN 1464-5165 online ª 2006 Taylor & Francis DOI: 10.1080/09638280500158307
-
Upload
independent -
Category
Documents
-
view
0 -
download
0
Transcript of Predicting employment outcomes of rehabilitation clients with orthopedic disabilities: a CHAID...

RESEARCH PAPER
Predicting employment outcomes of rehabilitation clients withorthopedic disabilities: A CHAID analysis
FONG CHAN1, GLADYS CHEING2, JACOB YUI CHUNG CHAN1,
DAVID A. ROSENTHAL1, & JULIE CHRONISTER3
1Department of Rehabilitation Psychology and Special Education, University of Wisconsin- Madison, Madison, WI, USA,2Department of Rehabilitation Sciences, The Hong Kong Polytechnic University, Hong Kong, and 3Department of Educational
Foundations and Counseling, Hunter College, City University of New York, New York, USA
Accepted April 2005
AbstractPurpose. To examine demographic and service factors affecting employment outcomes of people with orthopedicdisabilities in public vocational rehabilitation programs in the United States.Method. The sample included 74,861 persons (55% men and 45% women) with disabilities involving the limbs or spinalcolumn who were closed either as rehabilitated or not rehabilitated by their state-run vocational rehabilitation agencies in thefiscal year 2001. Mean age of participants was 41.4 years (SD = 11.2). The dependent variable is employment outcomes. Thepredictor variables include a set of personal history variables and rehabilitation service variables.Results. The chi-squared automatic interaction detector (CHAID) analysis indicated that job placement servicessignificantly enhanced competitive employment outcomes but were significantly underutilized (only 25% of the clientsreceived this service). Physical restoration and assistive technology services along with support services such as counselingalso contributed to positive employment outcomes. Importantly, clients who received general assistance, supplementarysecurity income, and/or social security disability insurance benefits had a significant lower competitive employment rates(45%) than clients without such work disincentives (60%).Conclusion. The data mining approach (i.e., CHAID analysis) provided detailed information and insight about interactionsamong demographic variables, service patterns, and competitive employment rates through the segmentation of the sampleinto mutually exclusive homogeneous subgroups.
Keywords: Vocational rehabilitation, rehabilitation outcomes, data mining11
Work is fundamental to the physical and psycholo-
gical health and well-being of people living in
contemporary societies [1,2]. The importance of
work, both therapeutically and economically, has
long been recognized by vocational rehabilitation
professionals who have consistently advocated that
work is a basic human right of persons with
disabilities [3,4]. Effectively, the primary goal of
vocational rehabilitation is to assist individuals with
disabilities gain or regain their independence through
employment or some form of meaningful activity
[3,5]. The 1998 Amendments to the Rehabilitation
Act defined vocational rehabilitation as a compre-
hensive sequence of services, mutually planned by
the consumer and rehabilitation counselor, to max-
imize employability, independence, integration and
participation of people with disabilities in the work-
place and the community [6].
In the United States, the public vocational
rehabilitation program was established to provide
vocational rehabilitation services to people with
physical and psychological disabilities [7,8]. At
present, 78.7% of the budget for the public
vocational rehabilitation program comes from the
federal government and 21.3% comes from state and
local funds—an amount that roughly translates into
Correspondence: F. Chan, Department of Rehabilitation Psychology and Special Education, University of Wisconsin-Madison, Madison, WI, USA.
Disability and Rehabilitation, March 2006; 28(5): 257 – 270
ISSN 0963-8288 print/ISSN 1464-5165 online ª 2006 Taylor & Francis
DOI: 10.1080/09638280500158307

approximately two billion dollars in federal grants
and $645 million in state and local funds. Because of
this federal – state partnership, all public vocational
rehabilitation programs follow a standard rehabilita-
tion process, which include the following phases: (a)
eligibility determination, (b) rehabilitation plan
development, (c) service provision, and (d) job
placement [8].
The eligibility determination phase involves diag-
nostic services such as medical examinations,
psychological assessment, and vocational evaluation.
The purpose of these diagnostic tools are to
determine disability related functional limitations
and to identify psychosocial, educational, and
economic factors that might interact with the
disability to impede the individual’s ability to work
and live independently. The rehabilitation plan phase
involves the development of an individualized plan of
employment that outlines the processes and services
the client will access to reach identified vocational
and educational goals. During this phase, appro-
priate goals are established based on information
gathered from diagnostic services, and services are
identified to assist the client achieve immediate
objectives and long-term vocational rehabilitation
goals. During the service provision stage, an array of
rehabilitation services may be accessed depending on
the individual’s individualized plan and include such
services as restoration of physical function (e.g.,
surgery, prosthesis, or assistive technology), restora-
tion of psychological health (e.g., psychotherapy),
academic, business, or vocational training, personal
or vocational adjustment training, employment
counseling, and job placement and job referral
services [8]. Finally, job placement is the last phase
of the rehabilitation process and may involve services
to support the individual to maintain employment,
which typically occurs for 90 days following job
placement.
Without question, job placement is the driving
force behind the vocational rehabilitation program.
Program evaluation and counselor performance are
integrally related to the number of job placements
obtained by clients. As a result, counselors are faced
with performance based evaluation while working
with ‘hardest to serve’ clientele. One way counselors
may cope with this challenge is to screen out those
individuals with disabilities who are not likely to
attain successful outcomes; for example, counselors
may elect to allocate more money for services for
those clients who are likely to succeed. This process
is wrought with problems as those clients with the
highest needs fail to receive the services needed for
success.
Bolton et al. [9] offer another way to conceptualize
the goal of vocational rehabilitation that has the
potential to reframe vocational rehabilitation coun-
selors’ decision making process. They argue that the
goal of vocational rehabilitation should not be a
successful outcome, but maximizing the probability
of a successful outcome. By redefining the goal of
vocational rehabilitation in this way, counselors
would use a decision making process that would
promote screening clients in for services as opposed
to screening them out. This type of feasibility
decision making would allow for the prescription of
more intensive services for those clients who have a
poor probability of success and higher level of service
needs.
To implement this decision making process among
vocational rehabilitation counselors, Bolton con-
tended that rehabilitation outcome research needs
to focus on answering the question, ‘Which approach
works best for whom under what condition?’ Answer-
ing this question will provide counselors with
information regarding what personal factors and
service provision patterns have a high probability of
predicting successful outcomes for a specified group
of clients. While the notion of finding a homogeneous
group of clients within a heterogeneous population in
order to match the needs of a specific group with
intensive services was advanced by Bolton decades
ago [10 – 12], methodological problems have pre-
vented advancement in this area. According to Bolton
and several other rehabilitation researchers, tradi-
tional inferential statistics have not been adequate to
perform the following types of analyses: For example,
Rubin et al. [13] and Byrd [14] stated that it is
important to examine the statistical interaction
between services and consumer variables in rehabi-
litation outcome research; Lorenz [15] contended
that client outcome is a function of predictor and
process variables, wherein process variables interact
with predictor variables rather than adding to them;
and Sonquist [16] pointed out that interaction among
variables and non-linearity of the data appears to be
the rule in social science research while additivity and
linearity seem to be the exception.
To perform these types of analyses and analyze
rehabilitation data in manner that has clinical utility,
these researchers recommended the use of a pattern
recognition technique (viz., automatic interaction
detector [AID]) as opposed to traditional inferential
statistics for rehabilitation outcome studies. Bolton
[11] identified the following advantages of AID for
analyzing large databases: (a) Compared to other
multivariate prediction methods, AID requires meet-
ing the least number of assumptions; (b) AID sorts
clients into homogeneous groups using an array of
independent characteristics and process variables; (c)
AID produces results which are displayed in a
multivariate expectancy table; and (d) AID allows
for the definition of client end groups which can be
interpreted by following the sequence of variable
258 F. Chan et al.

splits to the end group, thus revealing the number of
clients in the end group and the proportion who are
successful on the outcome variable. Importantly,
Bolton [11] noted that AID is not necessarily
appropriate for testing specific hypotheses deduced
from theory. Rather, it is concerned with inductive
model building by the ex post facto explanation of a
basic set of interrelated propositions which in turn,
forms a middle range theory that can form the basis
for future hypothesis testing.
While the utility of pattern recognition to rehabi-
litation outcome research has long been recognized
[10 – 12], this type of research has not been
performed to date—a likely result of the lack of
computer power and statistical software available to
conduct this type of analyses. Recently, however,
with the arrival of powerful computers and the
advent of the Internet and e-commerce, pattern
recognition has emerged as an important research
tool, particularly among business and marketing
researchers [17]. Today, pattern recognition is
popularly known as data mining and has been
defined as the extraction of hidden predictive
information from large databases [17]. Data mining
includes an array of techniques that are used for
credit scoring, wage prediction, and market segmen-
tation [17,18]. In addition, data mining has been
used to study such areas as the interaction between
demographic characteristics of web users and their
consumer behavior on the Internet. One commonly
used data mining technique includes chi-squared
automatic interaction detector (CHAID), which has
been used to segment Internet users into homo-
geneous subgroups and cater advertisement and
promotion activities to the unique consumer beha-
vior patterns of each homogeneous subgroup [17].
Because of the success of data mining techniques
in solving business and marketing research ques-
tions, these techniques have increasingly been used
to analyze pattern recognition problems in large
healthcare and social service databases, with en-
couraging results. For example, Ma [19] applied
CHAID to discover the determinants of treatment
outcomes for individuals with alcohol abuse (read-
mission) and to subsequently develop a patient-
treatment model. The findings of Ma’s study
indicated that the number of prior arrests, insurance
status, current frequency of alcohol use, gender,
source of referral, multiple addictions, and employ-
ment status significantly predicted the readmission of
alcoholism treatment. Ma also discovered that more
intensive services such as residential programs and
intensive outpatient treatment significantly improved
outcomes. Smith and Grawe [20] utilized CHAID as
a context-sensitive method of data analysis to
conduct an exploratory search for meaningful pat-
terns among therapy process and session-outcome
variables using 3,383 10-min sequences of 740
Therapy Spectrum Analysis (TSA)-rated sessions.
The analysis revealed that clients’ responsiveness to
therapeutic intervention and their level of motivation
were the strongest predictors of session productivity.
Melchoir et al. [21] used CHAID to analyze the
unmet needs of groups of traditionally underserved
individuals with HIV/AIDS. This study was based on
17 indicators reflecting service needs, vulnerabilities,
and demographic characteristics. Segmentation of
the 478 participants into homogeneous subgroups
revealed that those individuals with HIV/AIDS who
used crack cocaine were more likely than other
groups to have unmet service needs. In addition,
those individuals who were homeless or in precarious
housing situations were flagged as highly vulnerable.
Forthofer and Bryant [22] applied CHAID to
compare various approaches to developing health
behavior change strategies. The results not only
provided insight into the determinants of breast
cancer screening among women, but also enabled
the researchers to discover the unique characteristics
of population segments with high needs and to focus
intervention resources in a manner that was likely to
maximize intervention impact [22].
Recently, Chan et al. [23] used CHAID to
examine racial bias in acceptance rates of people
with disabilities for services in the public vocational
rehabilitation program. The analysis revealed that
severity of disability followed by race were the first
and second most important variables in explaining
eligibility decisions. Specifically, individuals with
severe disabilities had a significantly higher rate of
acceptance (93%) than people without severe dis-
abilities (55%). And, in the severe disability group,
Asian Americans had the highest acceptance rate
(96%) and African Americans and Latinos had the
lowest rate (91%). In addition, the analysis revealed
that the prevalence and opportunity for racial bias
was smaller when the criteria for eligibility was more
clearly defined, as in the case of severe disability,
versus situations in which the criteria for eligibility
are ambiguous, as in the case of justifying eligibility
for vocational rehabilitation services for an individual
without a severe disability. Importantly, Chan et al.
indicated that the segmentation of rehabilitation
clients into homogeneous subgroups that interact
significantly with the outcome variable provided
additional insight about racial bias that was not
identifiable through the traditional chi-square test
and logistic regression analysis typically used by
rehabilitation researchers who study racial bias
problems.
With the advent of computer technology and
data mining techniques, it now seems feasible to
use the pattern recognition approach advocated by
early rehabilitation researchers to analyze large
Rehabilitation outcomes 259

rehabilitation datasets to study factors influencing
employment outcomes of vocational rehabilitation
clients. And, the Rehabilitation Service Administra-
tion (RSA)-911 dataset, which contains personal
history, services, and employment outcome informa-
tion on those clients receiving public vocational
rehabilitation services in the United States, is ideally
suited for this type of analyses. This large archival
dataset is gathered from ‘Case Service Reports’
furnished annually to the RSA department of the
federal government by public vocational rehabilita-
tion programs across the country, and has been used
to study racial bias in eligibility determination and
employment outcomes of people with disabilities
[9,24]. The purpose of the current study is to apply
the data mining approach CHAID, to the RSA-911
dataset in order to determine factors influencing
employment rates of a group of vocational rehabilita-
tion clients with orthopedic disabilities.
Method
Participants
Data for this study was extracted from the RSA-911
dataset. The sample consisted of 74,861 persons
with orthopedic disabilities who were closed as
rehabilitated or not rehabilitated by public vocational
rehabilitation agencies in the fiscal year (FY) 2001.
The sample included 41,094 men (55%) and 33,767
women (45%). The majority of these clients were
self-referral (58%); 15% were referred by social
security, workers’ compensation, and state employ-
ment agencies; 8% were educational institutions; 5%
were health organizations and agencies; 5% were
hospitals; 5% were employers; and 4% were welfare
agencies. Of these 74,861 persons, about 23% were
recipients of social security disability insurance
(SSDI) benefits, supplemental security income
(SSI) benefits, or public assistance. Racial and
ethnic backgrounds of these rehabilitation clients
were diverse; 73.2% were European American,
15.4% were African American, 9% were Latino,
1.3% were Native American, and 1.2% were Asian
American. Approximately 36% of the clients were
married; 34% were never married; 21% were
divorced; 6% were separated; and 2% were wi-
dowed. Mean age of participants was 41.4 years
(SD = 11.2). Approximately 43% completed high
school, 20% had less than high school education,
28% had some college education, and 2% had
received special education services. In terms of
severity, 88% were reported to have a severe
disability and 12% a non-severe disability. The
average duration between application and accep-
tance for services was 1.61 months (SD = 2.58);
average duration of the rehabilitation process
was 29.6 months (SD = 25.9); average number of
services received was 3.70 (SD = 2.04); and the
average case expenditure was 4,187 U.S. dollars
(SD = 7580).
Variables
The criterion variable in this study was employment
outcome. For data analysis, individuals closed as
rehabilitated in the competitive employment cate-
gory of were coded as ‘1’ and individuals who were
closed as not working were coded as ‘0’.
The predictor variables included two sets of
variables: personal history and rehabilitation services.
Personal history variables included gender (male or
female); race (European American, African Amer-
ican, Hispanic/Latino, Native American, and Asian
American); severity of disability (severe versus not
severe); age (16 – 34, 35 – 54, 55 – 64, 65 and older);
education (special education, less than a high school
education, high school graduate, and at least some
college); and government benefits (e.g., public
assistance, health insurance, supplemental security
income [SSI], and/or social security disability insur-
ance [SSDI] benefits). Rehabilitation services
variables (1 = Yes, 0 = No) include:
. Assessment—Assessment involves diagnosis
and evaluation and can be medical, psycholo-
gical, social or vocational in scope.
. Restoration (Physical and Mental)—This cate-
gory includes those medical and medically-
related services which are necessary to correct
or substantially modify a physical or mental
condition. Examples of restoration services are
surgery, therapy, treatment and hospitalization.
. College/University Training—Included is all
academic training on a level beyond secondary
schooling. Persons attending full- or part-time
or evening courses conducted by a university,
college, junior college, or a college-level
extension school would be recorded as receiv-
ing this training.
. Business and Vocational Training—This is
non-collegiate post-secondary education. In-
cluded is training in (a) a business/commercial
school or college and (b) a vocational/trade
school. Training in the business/commercial
school or college would prepare the individual
for work in areas of office practice, typing,
word processing, bookkeeping, accounting,
data processing, etc. Training in the voca-
tional/trade school would typically prepare the
person for occupations such as welding,
woodworking, TV repair, electrical wiring,
auto and aviation mechanics, drafting, cosme-
tology, barbering, etc.
260 F. Chan et al.

. Adjustment Training—This is training which
will help the individual adjust to a particular
situation hindering his or her ability to work.
Included would be work conditioning, devel-
oping work tolerance, mobility training,
remedial training, literacy training, lip reading,
braille, etc.
. On-the-Job Training—This is training by a
prospective employer in which the individual
usually works for wages while learning the skills
of a job.
. Miscellaneous Training—This category is pro-
vided to allow classification of types of training
that do not readily fit into the previous group-
ings. Included would be academic training on a
secondary education level or lower as well as
specialized schools for persons who are blind or
deaf which are academic in nature.
. Counseling and Guidance-Substantial—This
means that Counseling and Guidance services
were of overriding importance in the totality of
rehabilitation services delivered to the indivi-
dual, as determined by a large amount of time
and effort expended to provide such services.
. Job-Finding Services—A job-finding service is
provided when enough information has been
imparted to permit the individual to arrange for
a job interview with a possible employer on his
or her own.
. Job Placement—A job placement service is
rendered when the individual is referred to and
is hired by an employer. This service may be
provided by the State rehabilitation agency, the
State employment service, or any other job-
finding source such as a private employment
agency.
. Transportation—Transportation is any service
provided or arranged for by the State agency to
enable the individual to arrive at appointments
for assessment, medical services, training, or
any other rehabilitation service, as well as to
permit the individual to get to work. Included
would be the provision of vans, taxi cabs,
private cars, etc., for the person as well as
payments made to these carriers.
. Maintenance—Included under this category
are services provided to cover the additional
costs incurred by the individual while he or she
is undergoing rehabilitation services.
. Other Services—This category allows classifi-
cation of rehabilitation services that cannot be
recorded elsewhere. Included are occupational
tools and equipment, initial stocks and li-
censes, and services to family members for
the benefit of the individual. Medical care for
acute conditions arising during rehabilitation
and constituting a hazard to the determination
of rehabilitation potential or to the achieve-
ment of the vocational objective is also to be
included in this category.
. Personal Assistance Services—Included under
this category are services such as reader service
for a visually impaired person, an interpreter
for a hearing impaired or deaf-blind person, or
an attendant for any disabled person.
. Rehabilitation Engineering—Rehabilitation en-
gineering is a complex of services entailing an
original design or concept intended to help the
individual maintain or enhance his or her
ability to function personally, socially, and/or
vocationally. The original design or concept
encompasses not only devices, equipment, and
aids, but also modifications to the environ-
ment, work site, and in transportation on
behalf of the individual.
. Assistive Technology—These are services that
directly assist an individual in the selection,
acquisition, or use of an assistive technology
device. These devices include any item, piece
of equipment, or product system, whether
acquired commercially off the shelf, modified,
or customized, that is used to increase, main-
tain, or improve functional capabilities of
individuals with disabilities.
Data analysis
Data was analyzed using the decision-tree technique,
a data mining approach. The decision tree technique
generates rules for the classification of a dataset and
uses a tree-shaped structure to represent sets of
decisions. Specific decision tree methods include
Classification and Regression Trees (CART) for
regression-type problems and CHAID for building
classification trees [18,21,25,26]. In the current
study, Exhaustive CHAID was used to build
classification trees. This technique uses a systematic
algorithm to detect the strongest association between
predictors and the outcome variable (i.e., employ-
ment outcomes) through a comprehensive search of
the predictors and the levels of predictors from the
entire set that show the most differentiation on the
outcome variable. The degree of differentiation is
depicted sequentially in a decision tree format to
show the optimally split predictors. Thus, homo-
geneous groups of vocational rehabilitation clients
could be identified in terms of their observed levels
on the outcome variable. The alpha level for all
statistical tests was 0.05, corrected for the number of
statistical tests within each predictor using a Bonfer-
roni correction. The statistical software SPSS
AnswerTree 2.0 was used to conduct the Exhaustive
CHAID analyses [18]. Notably, the Exhaustive
CHAID requires the use of categorical variables.
Rehabilitation outcomes 261
For this reason, continuous variables (e.g., age and
education) were recoded to categories to conform to
this requirement.
Results
Descriptive statistics
Demographic characteristics and employment rates
of this sample of orthopedic clients is presented in
Table I.
For the overall sample, the employment success
rate was 56% and the unsuccessful rate was 44%.
Notably, the success rate for employment of this
sample of clients who received vocational rehabilita-
tion services (56%) was appreciably higher than the
overall employment rate (31%) of people with
disabilities in the United States [27]. In this study,
women had a slightly higher competitive employ-
ment rate (58%) than men (55%); European and
Latin Americans had higher competitive employ-
ment rates (58%) than African American (51%),
Native Americans (52%), and Asian Americans
(53%); and, people with non-severe disabilities had
a higher competitive employment rate (62%) than
people with severe disabilities (56%).
Data mining results
Results from the Exhaustive CHAID analysis that
looked at the predictors of race, gender, severity of
disability, age, education, government benefits,
health insurance, and services, and the criterion of
employment outcomes revealed a risk of false
classification of 35% and a risk of 36% for cross-
classification. Notably, the overall correct classifica-
tion accuracy of 65% is a significant improvement
over the base rate of 56%. In general, the predictors
were better at predicting vocational rehabilitation
clients who were closed as competitively employed
(74% accuracy) than for predicting those who were
closed as unemployed (52% accuracy). The decision
tree grew to 10 levels and segmented the sample to
203 homogeneous subgroups. In order to fit the
CHAID diagram to the page, the tree diagram is
depicted in two figures: Figure 1 shows the right split
of the decision tree depicting the competitive
employment rates of the sample of clients who were
first segmented by receiving job placement services;
Figure 2 shows the left split of the decision tree
depicting the competitive employment rates of the
sample of clients who did not receive job placement
services. Only three levels of the trees were shown.
The most significant predictor of employment
outcomes was job placement services. The effect size
(odds-ratio) for job placement services was com-
puted to be 2.92 and is considered a medium effect.
Clients who received job placement services had a
significantly higher competitive employment rate
(75%) than clients who did not receive job placement
services (51%). The second most important factor
predicting employment outcomes was work disin-
centives. Clients who received general assistance,
supplementary security income, and/or social secur-
ity disability insurance benefits had a significant
lower competitive employment rates (45%) than
clients without such work disincentives (60%). As
observed from the CHAID analysis, there was a
significant interaction effect between the job place-
ment service variable and the work disincentives
variable.
The gains chart presented in Table II shows the
top 10 subgroups that had significantly higher
successful employment rates as compared to the
overall sample.
Table II shows the subgroups sorted by a gain
score (successful employment rate) revealing from
highest to lowest the top ten successful groups that
have significantly higher competitive employment
rates than the competitive employment rate (56%) of
the overall sample. The following is a brief descrip-
tion of these 10 homogeneous subgroups with higher
than average competitive employment rates:
Group 1. This group represents 157 women with
orthopedic disabilities who belong to two age groups;
they are either between the age of 16 and 34 or over
the age of 65. This group of women had no work
disincentives and received substantial counseling,
university training, and job placement services. In
addition, they had no transportation service needs
and did not need any major physical or mental
restoration services. These 157 women represent
0.21% of the vocational rehabilitation clients in the
Table I. Employment rates of VR clients by gender, race, and
severity of disability.
Employed Not employed
Variable Frequency % Frequency %
Gender
Male 22,734 55 18,360 45
Female 19,599 58 14,168 42
Race
European American 31,586 58 23,199 42
African American 5,908 51 5,593 59
Latino/a 3,852 58 2,851 42
Native American 495 52 451 48
Asian American or
Pacific Islander
492 53 434 47
Severity of disability
Severe 36,622 56 28,967 44
Non-severe 5,711 62 3,561 38
Total 42,333 56 32,528 44
262 F. Chan et al.

Figure 1. CHAID diagram of the partial tree depicting outcome predictors for rehabilitation clients who received job placement services.
Figure 2. CHAID diagram of the partial tree depicting outcome predictors for rehabilitation clients who did not receive job placement
services.
Rehabilitation outcomes 263
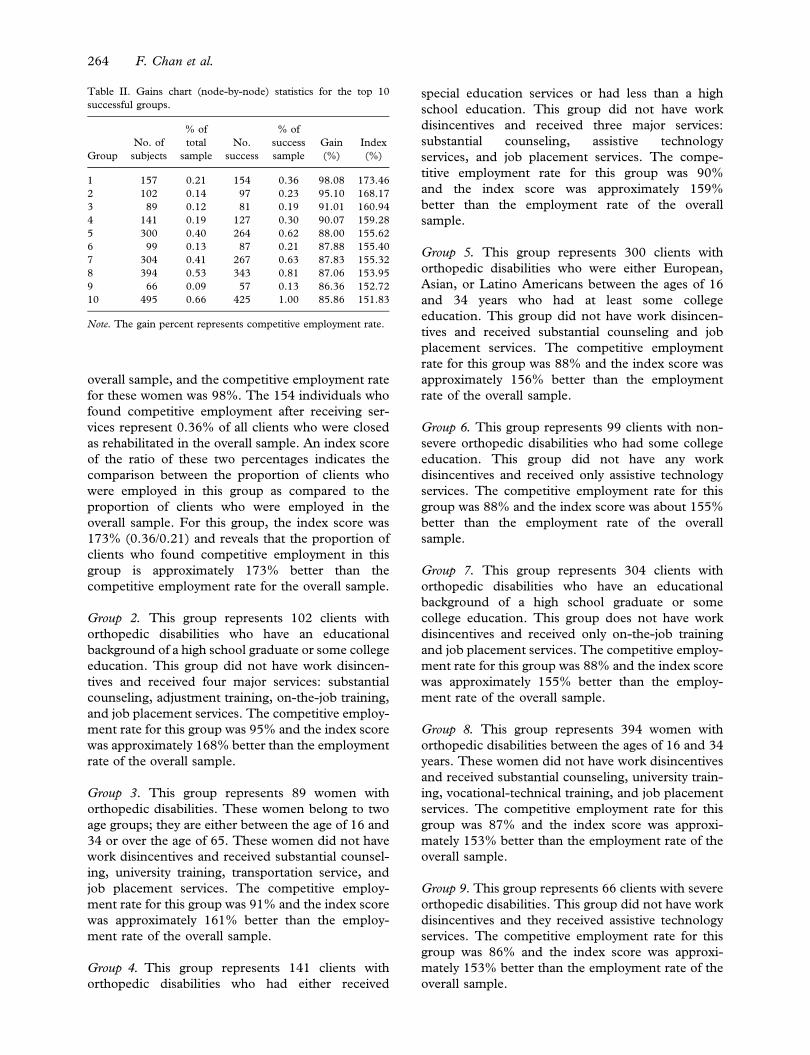
overall sample, and the competitive employment rate
for these women was 98%. The 154 individuals who
found competitive employment after receiving ser-
vices represent 0.36% of all clients who were closed
as rehabilitated in the overall sample. An index score
of the ratio of these two percentages indicates the
comparison between the proportion of clients who
were employed in this group as compared to the
proportion of clients who were employed in the
overall sample. For this group, the index score was
173% (0.36/0.21) and reveals that the proportion of
clients who found competitive employment in this
group is approximately 173% better than the
competitive employment rate for the overall sample.
Group 2. This group represents 102 clients with
orthopedic disabilities who have an educational
background of a high school graduate or some college
education. This group did not have work disincen-
tives and received four major services: substantial
counseling, adjustment training, on-the-job training,
and job placement services. The competitive employ-
ment rate for this group was 95% and the index score
was approximately 168% better than the employment
rate of the overall sample.
Group 3. This group represents 89 women with
orthopedic disabilities. These women belong to two
age groups; they are either between the age of 16 and
34 or over the age of 65. These women did not have
work disincentives and received substantial counsel-
ing, university training, transportation service, and
job placement services. The competitive employ-
ment rate for this group was 91% and the index score
was approximately 161% better than the employ-
ment rate of the overall sample.
Group 4. This group represents 141 clients with
orthopedic disabilities who had either received
special education services or had less than a high
school education. This group did not have work
disincentives and received three major services:
substantial counseling, assistive technology
services, and job placement services. The compe-
titive employment rate for this group was 90%
and the index score was approximately 159%
better than the employment rate of the overall
sample.
Group 5. This group represents 300 clients with
orthopedic disabilities who were either European,
Asian, or Latino Americans between the ages of 16
and 34 years who had at least some college
education. This group did not have work disincen-
tives and received substantial counseling and job
placement services. The competitive employment
rate for this group was 88% and the index score was
approximately 156% better than the employment
rate of the overall sample.
Group 6. This group represents 99 clients with non-
severe orthopedic disabilities who had some college
education. This group did not have any work
disincentives and received only assistive technology
services. The competitive employment rate for this
group was 88% and the index score was about 155%
better than the employment rate of the overall
sample.
Group 7. This group represents 304 clients with
orthopedic disabilities who have an educational
background of a high school graduate or some
college education. This group does not have work
disincentives and received only on-the-job training
and job placement services. The competitive employ-
ment rate for this group was 88% and the index score
was approximately 155% better than the employ-
ment rate of the overall sample.
Group 8. This group represents 394 women with
orthopedic disabilities between the ages of 16 and 34
years. These women did not have work disincentives
and received substantial counseling, university train-
ing, vocational-technical training, and job placement
services. The competitive employment rate for this
group was 87% and the index score was approxi-
mately 153% better than the employment rate of the
overall sample.
Group 9. This group represents 66 clients with severe
orthopedic disabilities. This group did not have work
disincentives and they received assistive technology
services. The competitive employment rate for this
group was 86% and the index score was approxi-
mately 153% better than the employment rate of the
overall sample.
Table II. Gains chart (node-by-node) statistics for the top 10
successful groups.
Group
No. of
subjects
% of
total
sample
No.
success
% of
success
sample
Gain
(%)
Index
(%)
1 157 0.21 154 0.36 98.08 173.46
2 102 0.14 97 0.23 95.10 168.17
3 89 0.12 81 0.19 91.01 160.94
4 141 0.19 127 0.30 90.07 159.28
5 300 0.40 264 0.62 88.00 155.62
6 99 0.13 87 0.21 87.88 155.40
7 304 0.41 267 0.63 87.83 155.32
8 394 0.53 343 0.81 87.06 153.95
9 66 0.09 57 0.13 86.36 152.72
10 495 0.66 425 1.00 85.86 151.83
Note. The gain percent represents competitive employment rate.
264 F. Chan et al.
Group 10. This group represents 495 clients with
orthopedic disabilities who are between the age of 35
and 54 years and either dropped out of high school
or graduated from high school. This group did not
have work disincentives and received vocational-
technical training and job placement services. The
competitive employment rate for this group was 86%
and the index score was approximately 152% better
than the employment rate of the overall sample.
The subgroup analysis confirmed the importance
of job placement services and the helpful effect of not
having government benefits on employment out-
comes. In addition, women and individuals with less
severe disabilities appeared to have greater success in
finding employment. Importantly, substantial coun-
seling appears to be an important support service to
successful rehabilitation outcomes and university
training, vocational-technical school training, and
on-the job training have differential effects on
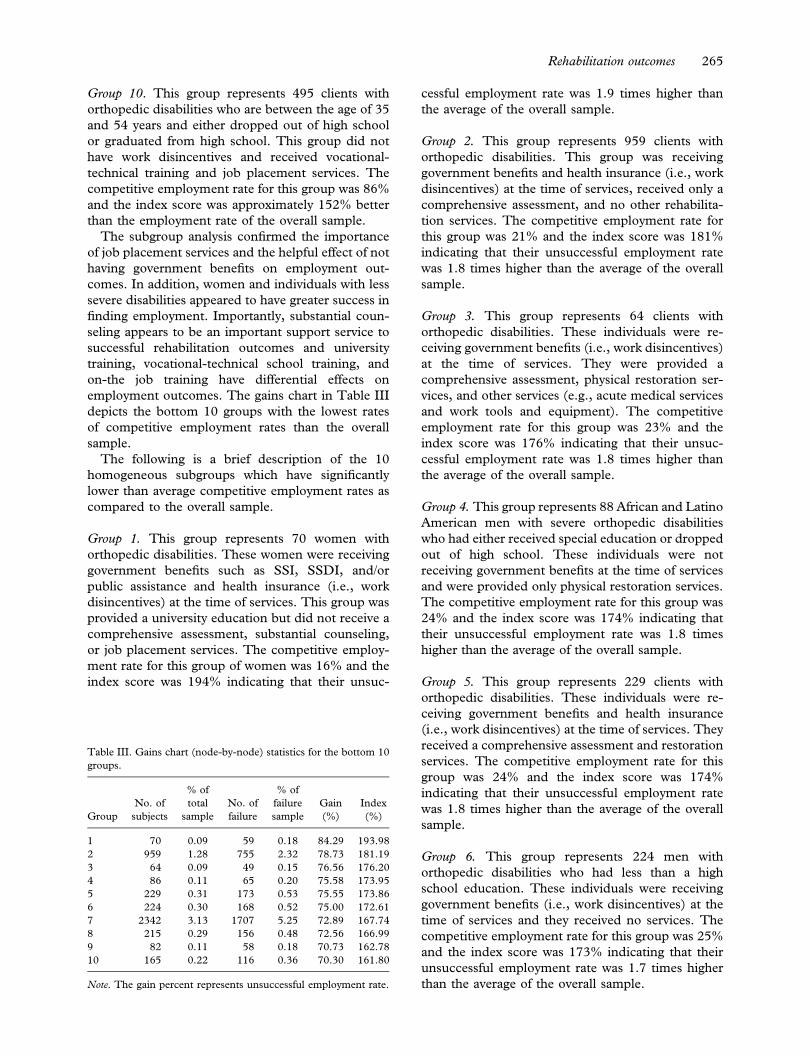
employment outcomes. The gains chart in Table III
depicts the bottom 10 groups with the lowest rates
of competitive employment rates than the overall
sample.
The following is a brief description of the 10
homogeneous subgroups which have significantly
lower than average competitive employment rates as
compared to the overall sample.
Group 1. This group represents 70 women with
orthopedic disabilities. These women were receiving
government benefits such as SSI, SSDI, and/or
public assistance and health insurance (i.e., work
disincentives) at the time of services. This group was
provided a university education but did not receive a
comprehensive assessment, substantial counseling,
or job placement services. The competitive employ-
ment rate for this group of women was 16% and the
index score was 194% indicating that their unsuc-
cessful employment rate was 1.9 times higher than
the average of the overall sample.
Group 2. This group represents 959 clients with
orthopedic disabilities. This group was receiving
government benefits and health insurance (i.e., work
disincentives) at the time of services, received only a
comprehensive assessment, and no other rehabilita-
tion services. The competitive employment rate for
this group was 21% and the index score was 181%
indicating that their unsuccessful employment rate
was 1.8 times higher than the average of the overall
sample.
Group 3. This group represents 64 clients with
orthopedic disabilities. These individuals were re-
ceiving government benefits (i.e., work disincentives)
at the time of services. They were provided a
comprehensive assessment, physical restoration ser-
vices, and other services (e.g., acute medical services
and work tools and equipment). The competitive
employment rate for this group was 23% and the
index score was 176% indicating that their unsuc-
cessful employment rate was 1.8 times higher than
the average of the overall sample.
Group 4. This group represents 88 African and Latino
American men with severe orthopedic disabilities
who had either received special education or dropped
out of high school. These individuals were not
receiving government benefits at the time of services
and were provided only physical restoration services.
The competitive employment rate for this group was
24% and the index score was 174% indicating that
their unsuccessful employment rate was 1.8 times
higher than the average of the overall sample.
Group 5. This group represents 229 clients with
orthopedic disabilities. These individuals were re-
ceiving government benefits and health insurance
(i.e., work disincentives) at the time of services. They
received a comprehensive assessment and restoration
services. The competitive employment rate for this
group was 24% and the index score was 174%
indicating that their unsuccessful employment rate
was 1.8 times higher than the average of the overall
sample.
Group 6. This group represents 224 men with
orthopedic disabilities who had less than a high
school education. These individuals were receiving
government benefits (i.e., work disincentives) at the
time of services and they received no services. The
competitive employment rate for this group was 25%
and the index score was 173% indicating that their
unsuccessful employment rate was 1.7 times higher
than the average of the overall sample.
Table III. Gains chart (node-by-node) statistics for the bottom 10
groups.
Group
No. of
subjects
% of
total
sample
No. of
failure
% of
failure
sample
Gain
(%)
Index
(%)
1 70 0.09 59 0.18 84.29 193.98
2 959 1.28 755 2.32 78.73 181.19
3 64 0.09 49 0.15 76.56 176.20
4 86 0.11 65 0.20 75.58 173.95
5 229 0.31 173 0.53 75.55 173.86
6 224 0.30 168 0.52 75.00 172.61
7 2342 3.13 1707 5.25 72.89 167.74
8 215 0.29 156 0.48 72.56 166.99
9 82 0.11 58 0.18 70.73 162.78
10 165 0.22 116 0.36 70.30 161.80
Note. The gain percent represents unsuccessful employment rate.
Rehabilitation outcomes 265

Group 7. This group represents 2,342 clients with
orthopedic impairments. These individuals were
receiving government benefits and health insurance
(i.e., work disincentives) at the time of services. They
received a comprehensive assessment and substantial
counseling. The competitive employment rate for
this group was 27% and the index score was 168%
indicating that their unsuccessful employment rate
was 1.7 times higher than the average of the overall
sample.
Group 8. This group represents 215 clients with
orthopedic disabilities. These individuals were re-
ceiving government benefits and health insurance
(i.e., work disincentives) at the time of services. They
received a comprehensive assessment, vocational-
technical school training, and transportation ser-
vices. The competitive employment rate for this
group was 27% and the index score was 167%
indicating that their unsuccessful employment rate
was 1.7 times higher than the average of the overall
sample.
Group 9. This group represents 82 men with
orthopedic disabilities. These individuals were re-
ceiving government benefits and health insurance
(i.e., work disincentives) at the time of services. They
received a university education without a compre-
hensive assessment or assistive technology services.
In addition, no job seeking-skills training or job
placement services were provided for these clients.
The competitive employment rate for this group was
29% and the index score was 163% indicating that
their unsuccessful employment rate was 1.6 times
higher than the average of the overall sample.
Group 10. This group represents 165 clients with
orthopedic impairments who had either received
special education services or had less than a high
school education. These individuals were receiving
government benefits at the time of services. They
were provided a comprehensive assessment, sub-
stantial counseling, and physical restoration services.
The competitive employment rate for this group was
30% and the index score was 161% indicating that
their unsuccessful employment rate was 1.6 times
higher than the average of the overall sample.
Analysis of these high-risk subgroups confirmed
the detrimental effect of work disincentives. Particu-
larly, clients who were receiving government benefits
and health insurance appeared to have strong work
disincentives. Others variables contributing to un-
successful employment outcomes included gender,
race, education, transportation, and medical crises.
Specifically, male clients were at a higher risk for
unsuccessful employment outcomes than females;
clients who had less than a high school education or a
history of special education had lower success rates;
and African and Latino Americans with poor
educational backgrounds, individuals with no means
of transportation, and those who had a medical crisis
in the rehabilitation process were all at higher risk for
unsuccessful employment outcomes. Of particular
importance is the finding that providing restoration
and training services without providing important
services such as comprehensive assessment, substan-
tial counseling, and job placement in conjunction
negatively affects outcomes. Specifically, this analysis
showed that providing expensive restoration and
training services without less expensive support
services (e.g., counseling, assistive technology, and
job placement) has an adverse affect on competitive
employment outcomes.
Summary and discussion
The data mining approach provides detailed infor-
mation and insight about interactions among
demographic variables, service patterns, and compe-
titive employment rates through the segmentation of
a sample into mutually exclusive subgroups. In this
study, the results of the CHAID analysis revealed
that vocational rehabilitation clients with the highest
probability of successful employment were women
who had no work disincentives, no transportation
barriers, and received counseling, university training,
and job placement services. In addition, this group
did not need significant physical or mental restora-
tion services, suggesting that their disability and
overall health status was stable.
An important finding from this analysis was the
central role of job placement services in predicting
employment. Specifically, the top five subgroups and
eight out of the ten subgroups most likely to be
employed received job placement services, whereas
the ten subgroups who were at high risk for
unemployment did not receive job placement ser-
vices. This finding is consistent with the
rehabilitation literature that shows that job place-
ment services have a strong relationship to
employment outcomes. For example, Bolton et al.
[9] sampled over 4,000 vocational rehabilitation
clients and found that job placement services were
the single most important predictor of competitive
employment, with service variables in general con-
tributing substantially to the prediction of
competitive employment (26% of the variance),
personally history accounting for approximately 5%
of the variance, and functional limitations not adding
significantly to variance.
Nonetheless, while this study found that job
placement services significantly enhanced competi-
tive employment outcomes, the use of this service
was significantly underutilized (only 25% of the
266 F. Chan et al.
clients received this service). The limited use of job
placement is likely a result of the various models of
job placement (i.e., ‘person-centered job placement’
versus ‘select placement’) and the different philoso-
phies that underlie these approaches. For example
selective placement is defined as ‘a process used for
placing people with disabilities in employment suited
to their age, experience, qualifications, and physical
and mental capacities. . .this is the final stage of
rehabilitation and includes three distinct processes:
knowing the worker, knowing the job, and matching
the worker to the job’ [4]. This model is often
executed in such job placements services as sup-
ported employment, which involves intense staff
support before, during, and following placement.
Solomone [28] argued, ‘the selective placement
approach may impair the dignity, independence,
and self-confidence of clients because this match or
selling approach to placement . . . is more applicable
to object than people’ (p. 401). He contended that
clients who have not engaged in their own successful
job-hunting practices are likely to return, again and
again, to the counselor for additional selective
placement services.
These opposing perspectives are reflected in the
diverse nature of job placement services. Job place-
ment services range in the intensity of pre-
employment support, involvement with employer,
and on-site support (i.e., job coaching) and typically
include either traditional job placement services that
involve preparing the individual for the job search
independently, or a more intense model such as
supported employment. While the type of job
placement service received has historically been
determined by the severity of disability, it is likely
that job placement services that have a more flexible
approach and draw from both these models based on
the needs of the individual would be most beneficial.
Of particular importance is the fact that despite the
passage of the Americans with Disabilities Act, the
employment rate of people of disabilities in the
United States has not changed over the past 20 years,
hovering around 30% [27]. Perhaps more emphasis
on the use of job placement services that match
persons with disabilities to specific employers and
jobs might improve the probability of vocational
rehabilitation clients’ chance of getting a job.
Counselor-centered job placement may be necessary
in light of the strength of employers’ stereotypes,
prejudice, and discrimination towards hiring people
with disabilities and from minority backgrounds. A
current study investigating the role of race in
employer hiring practices reveals the continued
pervasiveness of discriminatory behavior among
employers in the U.S. Labor market. Specifically,
Bertrand and Mullainathan [29] sent 5000 fictitious
resumes to 1300 help-wanted ads in Boston and
Chicago newspapers and found significant bias
against those resumes with African American sound-
ing names as compared to those resumes with white
sounding names. In fact, there were 50% more
interview callbacks for those fictitious persons with
names appearing to belong to white individuals. This
racial gap was found to be uniform across occupa-
tions and industries and there was no difference
between small or large employers, or those that are
listed as ‘Equal Opportunity Employers’. It is logical
to assume that attitudes toward people with dis-
abilities are equally negative and pervasive among
many employers. Thus, rehabilitation professionals
may need to consider job placement service ap-
proaches that help remove the entrenched
discrimination barriers that prevent clients from
achieving the first step towards employment.
Another important finding from this study is the
adverse effect of work disincentives on employment,
despite the introduction of benefits counseling in the
1990s [30]. Specifically, nine of the ten highest
unemployment groups were receiving SSI/SSDI
benefits at the time of services, and the subgroup of
clients who were at highest risk for unemployment
were women receiving government benefits and
health insurance (i.e., work disincentives) and were
provided a university education without going first
going through a comprehensive assessment. As
documented in the literature, without proper finan-
cial planning and vocational support, SSI or SSDI
can be a substantial disincentive to employment
[31,32].
One of the primary barriers to gainful employment
for persons with severe disabilities is weighing the
financial benefits of paid work against the real
possibility of losing benefits. At any given time, only
6% of people receiving SSI are working [31].
Investigations have reported little change in the
numbers of people leaving the disability rolls because
of ‘work recovery’—estimating a dismal 0.5% for
SSDI beneficiaries engaged in the public vocational
rehabilitation system [31] to 3% of all SSDI
beneficiaries [33]. Moreover, up to one third of
those who leave the rolls return. Hennessey [32]
reported in a new beneficiary follow-up study (a
selected sample of those enrolled since 1972) that
approximately 12% of SSDI beneficiaries attempted
work after entitlement and 24% of those individuals
terminated benefits because of recovery (either
medical or work recovery). The results revealed that
less than 3% of the original sample left the rolls
because of working at what the Social Security
Administration calls the ‘substantial gainful activity’
level.
While SSI/SSDI benefits continue to present
obstacles to employment, legislative efforts have
occurred to decrease these disincentives. Prior to
Rehabilitation outcomes 267

the Ticket to Work and Work Incentives Improve-
ment (TWWIIA) Act of 1999, it was not an
uncommon scenario to have individuals lose assis-
tance resources (e.g., medical assistance) by going to
work. Fortunately, recent legislative initiatives have
modified the disincentive effects of Social Security
benefits, whereby persons receiving SSI and SSDI
benefits that are employed are permitted to work for
longer periods of time with less reduction of financial
benefits [30]. Thus, the importance of benefits
counseling has become increasingly apparent within
the vocational rehabilitation system. In fact, Hen-
nessey [32] examined the effect of knowledge of
work incentives on recipients’ tendency to refuse to
work or to stop working following a trial period.
Findings suggested that if SSDI beneficiaries had
knowledge of the trial work period and the extended
period of benefits eligibility under new laws, as well
as confirmation that they would receive Medicare
benefits, the effects of work disincentives dissipated.
Given the importance of benefits counseling in
rehabilitation planning, it is suggested that the
Rehabilitation Services Administration revise the
Case Service Report form to include benefits
counseling as a rehabilitation service in order to
have the capability to include this important variable
in rehabilitation outcome research.
Limitations
All data used in this study was from the RSA-911
dataset generated from information recorded by
counselors at various stages in the case service
process. In RSA-911 data, the information on type
of disability is entered before an eligibility decision is
made, and the wage and occupation data are entered
when the case is closed. Thus, it is possible that, if
counselors do not consult the case file to verify which
services were delivered and relied solely on memory,
data could be incorrect. In addition, data input
errors may be entered by the counselors accidentally.
To overcome these potential errors, the Rehabilita-
tion Services Administration developed 18 cross-
checks to reduce the potential for error. However,
even with these cross-checks in place, an unknown
number of errors may still exist. Fortunately, these
errors are assumed to be random and therefore
should not result in systematic bias in the data.
Finally, because this study used archival data and
employs an ex post facto design, causality cannot be
inferred.
Clinical practice implications
There are several important clinical implications that
emerge from this study. First, an examination of the
RSA-911 dataset for fiscal year 2001 revealed that
vocational rehabilitation applicants with orthopedic
disabilities constitute the second largest group of
clients with the breakdown of client disability status
as follows: psychiatric 32.2%, orthopedic, 20.4%,
developmental disabilities/mental retardation,
19.3%, chronic medical, and 11.4%, sensory,
10.4%. As the order of selection process requires
public vocational rehabilitation providers to serve
individuals with the most severe disabilities first, this
study suggests that rehabilitation counselors need to
better understand the vocational capacities and
service needs of clients with severe orthopedic
disabilities. Bolton et al. [9] noted that persons with
orthopedic disabilities served in vocational rehabili-
tation settings demonstrated more functional
limitations in the areas of physical capacity and
motor function, and that the group on average, spent
longer time in rehabilitation (along with clients with
chronic medical conditions and psychiatric disabil-
ities).
Second, this study highlights the importance of
understanding the service needs of clients with
disabilities in general and those with orthopedic
disabilities in particular. This analysis suggests the
importance of a comprehensive assessment prior to
initiating expensive restoration or training services,
assistive technology services, support services (e.g.,
substantial counseling to all clients), and benefits
counseling. Of central importance is the role of job
placement services in the employment outcomes of
persons with orthopedic disabilities. Rehabilitation
counselors, administrators, and counselor educators
have long known the importance of job development
and job placement activities in vocational rehabilita-
tion [34,35], yet this service remains underutilized.
The clear evidence supporting the use of job
placement services demonstrated in the present
investigation supports an increased emphasis on job
placement in both rehabilitation counselor education
programs and through state vocational rehabilitation
agency training for counselors.
Third, this study provides insight into those clients
with orthopedic disabilities who are at high risk for
poor vocational outcomes such as young African
American and Latino men and clients with poor
educational backgrounds. This information reiterates
the importance of conceptualizing the goal of
vocational rehabilitation as maximizing the prob-
ability of a successful outcome and thereby
prescribing more intensive, adequate services for
high risk clients. Counselors need to work towards
minimizing the influence of stigma against these high
risk groups by advocating for the provision of a broad
array of vocational services while using a decision
making process that uses empirical and evidence
based information to make decisions that are rational
and objective. Lastly, rehabilitation counselors to
268 F. Chan et al.

better understand the contribution of psychosocial
factors to employment success, and minimize bias
against persons from underserved groups as they
attempt to procure employment. To do this,
counselors need to become aware of their potential
for implicit bias against providing viable employment
support services such as job placement for persons
with severe disabilities.
Acknowledgment
Preparation of this report was supported in part
by a Disability and Rehabilitation Research Project
(‘Rehabilitation Research Institute for Underrepre-
sented Populations’), which was funded by Grant#
H133A031705 from the National Institute on Dis-
ability and Rehabilitation Research to Southern
University.
References
1. Chan F, Reid C, Roldan G, Kaskel L, Rahimi M, Mpofu E.
Vocational assessment and evaluation of people with dis-
abilities. Physical Medicine and Rehabilitation Clinics of
North America 1997;8:311 – 325.
2. Perrone KM, Perrone PA, Chan F, Thomas, KR. Assessing
efficacy and importance of career counseling competencies.
Career Development Quarterly 1997;48:212 – 225.
3. Rubin S, Roessler R. Foundations of the vocational rehabilita-
tion process. 5th ed. Austin, TX: Pro-Ed; 2000.
4. Wright, GN. Total rehabilitation. Boston, MA: Little Brown;
1980.
5. Parker, RM, Szymanski, EM. Rehabilitation counseling.
Basics and beyond. Austin, TX: Pro-Ed; 1998.
6. Leahy M, Chan F, Saunders J. A work behavior analysis of
contemporary rehabilitation counseling practices. Rehabilita-
tion Counseling Bulletin 2003;46:66 – 81.
7. Leahy M, Chan F, Saunders J. Case management for
rehabilitation health professionals. Osage Beach, MO: Aspen
Professional Services; 2005.
8. Spitznagel RJ. State/federal vocational rehabilitation program.
In: Andrew JD, Faubion CW, editors. Rehabilitation services:
An introduction for the human services professionals. Osage
Beach, MO: Aspen Professional Services; 2002. p 55 – 89.
9. Bolton, BF, Bellini, JL, Brookings, JB. Predicting client
employment outcomes from personal history, functional
limitations, and rehabilitation services. Rehabilitation Coun-
seling Bulletin 2002;44:10 – 21.
10. Bolton B. Improving the prediction of rehabilitation outcomes
by computer generated pattern analysis. Rehabilitation Re-
search and Practice Review, 1972;3:51 – 53.
11. Bolton B. Predicting client outcome from intake data. Paper
presented at the meeting of the Arkansas Rehabilitation
Association, Hot Springs, AR, 1972.
12. Bolton B. The prediction of rehabilitation outcomes. Journal
of Applied Rehabilitation Counseling 1972;3(2):16 – 24.
13. Rubin SE, Bolton B, Salley K. A review of the literature on the
prediction of rehabilitation client outcome and the develop-
ment of a research model. Arkansas Studies in Vocational
Rehabilitation, V. Fayetteville, AR: University of Arkansas
Rehabilitation Research and Training Center; 1972.
14. Byrd EK. The use of automatic interaction detector in
evaluation of a state vocational rehabilitation program.
Rehabilitation Counseling Bulletin 1978;21:350 – 353.
15. Lorenz JR. A methodology for the development of empirically
based differential service patterns for clients in rehabilitation
facilities. Unpublished doctoral dissertation, University of
Wisconsin-Madison; 1973.
16. Sonquist JA. Multivariate model building: The validation of a
search strategy. Ann Arbor, MI: Institute for Social Research;
1970.
17. Nong Y. Handbook of data mining. Mahwah, NJ: Lawrence
Erlbaum Associates; 2003.
18. SPSS. AnswerTree 2.0 user’s guide. Chicago, IL: SPSS;
1998.
19. Ma TC. Assessing readmission rates of alcohol treatment:
Developing patient-treatment matching by using chi-sqare
interaction detection (Doctoral dissertation, University of
Iowa, 2000). Dissertation Abstracts International 2000;60(12-
B):6005.
20. Smith EC, Grawe K. What makes psychotherapy session
productive? A new approach to bridging the gap between
process research and practice. Clinical Psychology and
Psychotherapy 2003;10:275 – 285.
21. Melchoir LA, Huba GJ, Gallagher T, Jean-Louis E, Mc-
Donald SS, Smereck GAD, German VF, Brown V B, Panter
AT. Unmet needs in groups of traditionally underserved
individuals with HIV/AIDS: Empirical models. Home Health
Care Services Quarterly, 2001;19:29 – 51.
22. Forthofer MS, Bryant CA. Using audience-segmentation
techniques to tailor health behavior change strategies. Amer-
ican Journal of Health Behavior 2000;24(1):36 – 43.
23. Chan F, Wong DW, Rosenthal DA, Kundu MM, Dutta A.
Eligibility rates of traditionally underserved individuals with
disabilities revisited: A data mining approach. Journal of
Applied Rehabilitation Counseling; 2005;36(3):3 – 10.
24. Wilson KB, Harley DA, McCormick K, Jolivette K, Jackson
RL. A literature review of vocational rehabilitation acceptance
and explaining bias in the rehabilitation process. Journal of
Applied Rehabilitation Counseling 2001;32(1):24 – 35.
25. Biggs D, deVille B, Suen E. A method of choosing multiway
partitions for classification and decision trees. Journal of
Applied Statistics 1991;18(1):49 – 62.
26. Hoare R. Using CHAID for classification problems. Paper
presented at the New Zealand Statistical Association Con-
ference, Wellington, New Zealand, 2004.
27. Houtenville AJ. Disability statistics in the United States.
Ithaca, NY: Cornell University Rehabilitation Research and
Training Center, www.disabilitystatistics.org. Posted May 15,
2003. Accessed August 02, 2004.
28. Solomone P. Career counseling and job placement:
Theory and practice. In: Szymanski EM, Parker RM, editors,
Work and disability: Issues and strategies in career develop-
ment and job placement. Austin, TX: Pro-Ed; 1996. p 365 –
420.
29. Bertrand M, Mullainathan S. Are Emily and Grey more
employable than Lakisha and Jamal? A field experiment on
labor market discrimination. The American Economic Re-
view; 2004;94:991 – 1013.
30. Bruyere SM, Brown JA. Legislation affecting employment for
persons with Disabilities. In: Szymanski EM, Parker RM,
editors. Work and disability: Issues and strategies in career
development and job placement. Austin, TX: Pro-Ed; 2003.
p 27 – 52.
31. Berkowitz M. Improving the return to work of social security
disability beneficiaries. In: Mashaw JL, Reno V, Burkhauser
RV, Berkowitz M, editors. Disability, work and cash benefits.
Kalamazoo, MI: W. E. Upjohn Institute for Employment
Research; 1996. p 331 – 353.
32. Hennessey JC. Factors affecting the work efforts of disabled-
worker beneficiaries. Social Security Bulletin 1997;60(3):
3 – 20.
Rehabilitation outcomes 269

33. Muller LS. Disability beneficiaries who work and their
experience under program work incentives. Social Security
Bulletin 1992;55(2):2 – 19.
34. Gilbride D, Stensrud R, Johnson M. Current models of
job placement and employer development: Research, com-
petencies, and educational considerations. Rehabilitation
Education 1994;7:215 – 239.
35. Millington M, Butterworth J, Fesko S, McCarthy H. The
constructs and practices of job placement. In: Parker RM,
Szymanski EM, editors. Rehabilitation counseling: Basics and
beyond. Austin, TX: PRO-ED; 1998. p 379 – 410.
270 F. Chan et al.