Combining orthopedic special tests to improve diagnosis of shoulder pathology
6
Masterclass Combining orthopedic special tests to improve diagnosis of shoulder pathology Eric J. Hegedus a, * , Chad Cook b , Jeremy Lewis c , Alexis Wright a , Jin-Young Park d a High Point University, Department of Physical Therapy, High Point, NC 27262, USA b Physical Therapy Program, Duke University, Durham, NC, USA c Physiotherapy, University of Hertfordshire, Department of Allied Health Professions and Midwifery, School of Health and Social Work, United Kingdom d Shoulder, Elbow & Sports Center, Konkuk University, Seoul, South Korea article info Article history: Received 2 April 2014 Received in revised form 5 July 2014 Accepted 1 August 2014 Keywords: Likelihood ratios Shoulder Diagnosis abstract The use of orthopedic special tests (OSTs) to diagnose shoulder pathology via the clinical examination is standard in clinical practice. There is a great deal of research on special tests but much of the research is of a lower quality implying that the metrics from that research, sensitivity, specificity, and likelihood ratios, is likely to vary greatly in the hands of different clinicians and in varying practice environments. A way to improve the clinical diagnostic process is to cluster OSTs and to use these clusters to either rule in or out different pathologies. The aim of the article is to review the best OST clusters, examine the methodology by which they were derived, and illustrate, with a case study, the use of these OST clusters to arrive at a pathology-based diagnosis. © 2014 Elsevier Ltd. All rights reserved. 1. Introduction Physical examination of the shoulder involves a series of steps typically beginning with history, progressing with motion and muscle testing, and culminating in the use of orthopedic special tests (OSTs) with the aim of diagnosing shoulder pathology. While the process itself is systematic and straightforward, for evidence- based practitioners, there are numerous problems encountered when trying to arrive at a diagnosis. First, there is little evidence reporting the diagnostic accuracy of critical pieces of the clinical examination such as history, motion testing, and muscle testing causing a greater reliance on OSTs. Second, although there is a great deal of research on OSTs of the shoulder, much of that research is of moderate to low quality (Hegedus et al., 2008; Hegedus et al., 2012). Third, even in those OSTs that come from high quality literature, there are very few that display solid diagnostic metrics, high sensitivity and specificity (Hegedus et al., 2008; Hegedus et al., 2012). Fourth, although sensitivity and specificity are helpful in- ternal test metrics, there are issues in the application of these metrics to clinical practice. Finally, clinicians and researchers improve diagnostic accuracy by clustering OSTs together; however, in some cases, the clusters are used incorrectly or provide metrics that lead to post-test probabilities that are no different than use of a single stand alone test. Our aims in this paper are to discuss the importance of likeli- hood ratios and modified probability in the diagnostic process, to explain multivariate modeling and outline the most effective methods to combine tests for either screening or confirmation of diagnosis. For context, we'll briefly review the best test clusters that have been published, and finally, we'll use a case study to illustrate how the best available test clusters should be used to aid in diagnosis. 2. Likelihood ratios and modified probability Diagnostic accuracy studies have design consistencies, stan- dardized metrics, and assumptions. First and foremost, all diag- nostic accuracy studies enroll populations of individuals with and without the condition of interest; the condition of interest being the diagnosis studied. Those without the condition of interest should be individuals with some other competing health malady that would normally be distinguished in a traditional clinical environment. For example, a typical shoulder study enrolls patients with pain, some of whom will have the condition of interest, like a rotator cuff tear, and some of whom will have other usual sources of shoulder pain like tendinosis or a labral tear. The simplest measures of diagnostic accuracy are sensitivity and specificity. Sensitivity is the proportion of people with the condition * Corresponding author. Tel.: þ1 336 906 2133. E-mail address: [email protected] (E.J. Hegedus). Contents lists available at ScienceDirect Physical Therapy in Sport journal homepage: www.elsevier.com/ptsp http://dx.doi.org/10.1016/j.ptsp.2014.08.001 1466-853X/© 2014 Elsevier Ltd. All rights reserved. Physical Therapy in Sport xxx (2014) 1e6 Please cite this article in press as: Hegedus, E. J., et al., Combining orthopedic special tests to improve diagnosis of shoulder pathology, Physical Therapy in Sport (2014), http://dx.doi.org/10.1016/j.ptsp.2014.08.001
-
Upload
independent -
Category
Documents
-
view
3 -
download
0
Transcript of Combining orthopedic special tests to improve diagnosis of shoulder pathology
lable at ScienceDirect
Physical Therapy in Sport xxx (2014) 1e6
Contents lists avai
Physical Therapy in Sport
journal homepage: www.elsevier .com/ptsp
Masterclass
Combining orthopedic special tests to improve diagnosis of shoulderpathology
Eric J. Hegedus a, *, Chad Cook b, Jeremy Lewis c, Alexis Wright a, Jin-Young Park d
a High Point University, Department of Physical Therapy, High Point, NC 27262, USAb Physical Therapy Program, Duke University, Durham, NC, USAc Physiotherapy, University of Hertfordshire, Department of Allied Health Professions and Midwifery, School of Health and Social Work, United Kingdomd Shoulder, Elbow & Sports Center, Konkuk University, Seoul, South Korea
a r t i c l e i n f o
Article history:Received 2 April 2014Received in revised form5 July 2014Accepted 1 August 2014
Keywords:Likelihood ratiosShoulderDiagnosis
* Corresponding author. Tel.: þ1 336 906 2133.E-mail address: [email protected] (E.J. Heg
http://dx.doi.org/10.1016/j.ptsp.2014.08.0011466-853X/© 2014 Elsevier Ltd. All rights reserved.
Please cite this article in press as: Hegedus, ETherapy in Sport (2014), http://dx.doi.org/10
a b s t r a c t
The use of orthopedic special tests (OSTs) to diagnose shoulder pathology via the clinical examination isstandard in clinical practice. There is a great deal of research on special tests but much of the research isof a lower quality implying that the metrics from that research, sensitivity, specificity, and likelihoodratios, is likely to vary greatly in the hands of different clinicians and in varying practice environments. Away to improve the clinical diagnostic process is to cluster OSTs and to use these clusters to either rule inor out different pathologies. The aim of the article is to review the best OST clusters, examine themethodology by which they were derived, and illustrate, with a case study, the use of these OST clustersto arrive at a pathology-based diagnosis.
© 2014 Elsevier Ltd. All rights reserved.
1. Introduction
Physical examination of the shoulder involves a series of stepstypically beginning with history, progressing with motion andmuscle testing, and culminating in the use of orthopedic specialtests (OSTs) with the aim of diagnosing shoulder pathology. Whilethe process itself is systematic and straightforward, for evidence-based practitioners, there are numerous problems encounteredwhen trying to arrive at a diagnosis. First, there is little evidencereporting the diagnostic accuracy of critical pieces of the clinicalexamination such as history, motion testing, and muscle testingcausing a greater reliance on OSTs. Second, although there is a greatdeal of research on OSTs of the shoulder, much of that research is ofmoderate to low quality (Hegedus et al., 2008; Hegedus et al.,2012). Third, even in those OSTs that come from high qualityliterature, there are very few that display solid diagnostic metrics,high sensitivity and specificity (Hegedus et al., 2008; Hegedus et al.,2012). Fourth, although sensitivity and specificity are helpful in-ternal test metrics, there are issues in the application of thesemetrics to clinical practice. Finally, clinicians and researchersimprove diagnostic accuracy by clustering OSTs together; however,in some cases, the clusters are used incorrectly or provide metrics
edus).
. J., et al., Combining orthope.1016/j.ptsp.2014.08.001
that lead to post-test probabilities that are no different than use of asingle stand alone test.
Our aims in this paper are to discuss the importance of likeli-hood ratios and modified probability in the diagnostic process, toexplain multivariate modeling and outline the most effectivemethods to combine tests for either screening or confirmation ofdiagnosis. For context, we'll briefly review the best test clusters thathave been published, and finally, we'll use a case study to illustratehow the best available test clusters should be used to aid indiagnosis.
2. Likelihood ratios and modified probability
Diagnostic accuracy studies have design consistencies, stan-dardized metrics, and assumptions. First and foremost, all diag-nostic accuracy studies enroll populations of individuals with andwithout the condition of interest; the condition of interest beingthe diagnosis studied. Those without the condition of interestshould be individuals with some other competing health maladythat would normally be distinguished in a traditional clinicalenvironment. For example, a typical shoulder study enrolls patientswith pain, some of whomwill have the condition of interest, like arotator cuff tear, and some of whomwill have other usual sources ofshoulder pain like tendinosis or a labral tear.
The simplest measures of diagnostic accuracy are sensitivity andspecificity. Sensitivity is the proportion of peoplewith the condition
dic special tests to improve diagnosis of shoulder pathology, Physical
E.J. Hegedus et al. / Physical Therapy in Sport xxx (2014) 1e62
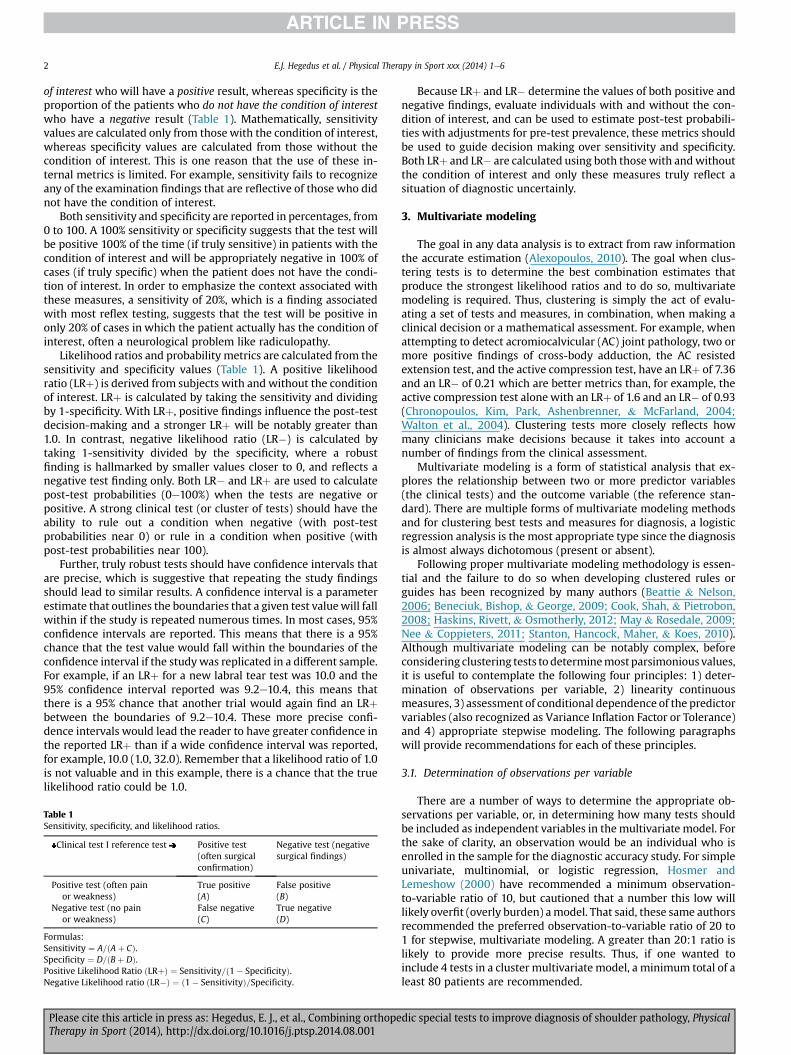
of interest who will have a positive result, whereas specificity is theproportion of the patients who do not have the condition of interestwho have a negative result (Table 1). Mathematically, sensitivityvalues are calculated only from those with the condition of interest,whereas specificity values are calculated from those without thecondition of interest. This is one reason that the use of these in-ternal metrics is limited. For example, sensitivity fails to recognizeany of the examination findings that are reflective of those who didnot have the condition of interest.
Both sensitivity and specificity are reported in percentages, from0 to 100. A 100% sensitivity or specificity suggests that the test willbe positive 100% of the time (if truly sensitive) in patients with thecondition of interest and will be appropriately negative in 100% ofcases (if truly specific) when the patient does not have the condi-tion of interest. In order to emphasize the context associated withthese measures, a sensitivity of 20%, which is a finding associatedwith most reflex testing, suggests that the test will be positive inonly 20% of cases in which the patient actually has the condition ofinterest, often a neurological problem like radiculopathy.
Likelihood ratios and probability metrics are calculated from thesensitivity and specificity values (Table 1). A positive likelihoodratio (LRþ) is derived from subjects with and without the conditionof interest. LRþ is calculated by taking the sensitivity and dividingby 1-specificity. With LRþ, positive findings influence the post-testdecision-making and a stronger LRþ will be notably greater than1.0. In contrast, negative likelihood ratio (LR�) is calculated bytaking 1-sensitivity divided by the specificity, where a robustfinding is hallmarked by smaller values closer to 0, and reflects anegative test finding only. Both LR� and LRþ are used to calculatepost-test probabilities (0e100%) when the tests are negative orpositive. A strong clinical test (or cluster of tests) should have theability to rule out a condition when negative (with post-testprobabilities near 0) or rule in a condition when positive (withpost-test probabilities near 100).
Further, truly robust tests should have confidence intervals thatare precise, which is suggestive that repeating the study findingsshould lead to similar results. A confidence interval is a parameterestimate that outlines the boundaries that a given test valuewill fallwithin if the study is repeated numerous times. In most cases, 95%confidence intervals are reported. This means that there is a 95%chance that the test value would fall within the boundaries of theconfidence interval if the studywas replicated in a different sample.For example, if an LRþ for a new labral tear test was 10.0 and the95% confidence interval reported was 9.2e10.4, this means thatthere is a 95% chance that another trial would again find an LRþbetween the boundaries of 9.2e10.4. These more precise confi-dence intervals would lead the reader to have greater confidence inthe reported LRþ than if a wide confidence interval was reported,for example, 10.0 (1.0, 32.0). Remember that a likelihood ratio of 1.0is not valuable and in this example, there is a chance that the truelikelihood ratio could be 1.0.
Table 1Sensitivity, specificity, and likelihood ratios.
Clinical test I reference test Positive test(often surgicalconfirmation)
Negative test (negativesurgical findings)
Positive test (often painor weakness)
True positive(A)
False positive(B)
Negative test (no painor weakness)
False negative(C)
True negative(D)
Formulas:Sensitivity ¼ A=ðAþ CÞ.Specificity ¼ D=ðBþ DÞ.Positive Likelihood Ratio ðLRþÞ ¼ Sensitivity=ð1� SpecificityÞ.Negative Likelihood ratio ðLR�Þ ¼ ð1� SensitivityÞ=Specificity.
Please cite this article in press as: Hegedus, E. J., et al., Combining orthopeTherapy in Sport (2014), http://dx.doi.org/10.1016/j.ptsp.2014.08.001
Because LRþ and LR� determine the values of both positive andnegative findings, evaluate individuals with and without the con-dition of interest, and can be used to estimate post-test probabili-ties with adjustments for pre-test prevalence, these metrics shouldbe used to guide decision making over sensitivity and specificity.Both LRþ and LR� are calculated using both thosewith andwithoutthe condition of interest and only these measures truly reflect asituation of diagnostic uncertainly.
3. Multivariate modeling
The goal in any data analysis is to extract from raw informationthe accurate estimation (Alexopoulos, 2010). The goal when clus-tering tests is to determine the best combination estimates thatproduce the strongest likelihood ratios and to do so, multivariatemodeling is required. Thus, clustering is simply the act of evalu-ating a set of tests and measures, in combination, when making aclinical decision or a mathematical assessment. For example, whenattempting to detect acromiocalvicular (AC) joint pathology, two ormore positive findings of cross-body adduction, the AC resistedextension test, and the active compression test, have an LRþ of 7.36and an LR� of 0.21 which are better metrics than, for example, theactive compression test alone with an LRþ of 1.6 and an LR� of 0.93(Chronopoulos, Kim, Park, Ashenbrenner, & McFarland, 2004;Walton et al., 2004). Clustering tests more closely reflects howmany clinicians make decisions because it takes into account anumber of findings from the clinical assessment.
Multivariate modeling is a form of statistical analysis that ex-plores the relationship between two or more predictor variables(the clinical tests) and the outcome variable (the reference stan-dard). There are multiple forms of multivariate modeling methodsand for clustering best tests and measures for diagnosis, a logisticregression analysis is the most appropriate type since the diagnosisis almost always dichotomous (present or absent).
Following proper multivariate modeling methodology is essen-tial and the failure to do so when developing clustered rules orguides has been recognized by many authors (Beattie & Nelson,2006; Beneciuk, Bishop, & George, 2009; Cook, Shah, & Pietrobon,2008; Haskins, Rivett, & Osmotherly, 2012; May & Rosedale, 2009;Nee & Coppieters, 2011; Stanton, Hancock, Maher, & Koes, 2010).Although multivariate modeling can be notably complex, beforeconsidering clustering tests to determinemostparsimonious values,it is useful to contemplate the following four principles: 1) deter-mination of observations per variable, 2) linearity continuousmeasures, 3) assessment of conditional dependence of the predictorvariables (also recognized as Variance Inflation Factor or Tolerance)and 4) appropriate stepwise modeling. The following paragraphswill provide recommendations for each of these principles.
3.1. Determination of observations per variable
There are a number of ways to determine the appropriate ob-servations per variable, or, in determining how many tests shouldbe included as independent variables in themultivariate model. Forthe sake of clarity, an observation would be an individual who isenrolled in the sample for the diagnostic accuracy study. For simpleunivariate, multinomial, or logistic regression, Hosmer andLemeshow (2000) have recommended a minimum observation-to-variable ratio of 10, but cautioned that a number this low willlikely overfit (overly burden) amodel. That said, these same authorsrecommended the preferred observation-to-variable ratio of 20 to1 for stepwise, multivariate modeling. A greater than 20:1 ratio islikely to provide more precise results. Thus, if one wanted toinclude 4 tests in a cluster multivariate model, a minimum total of aleast 80 patients are recommended.
dic special tests to improve diagnosis of shoulder pathology, Physical
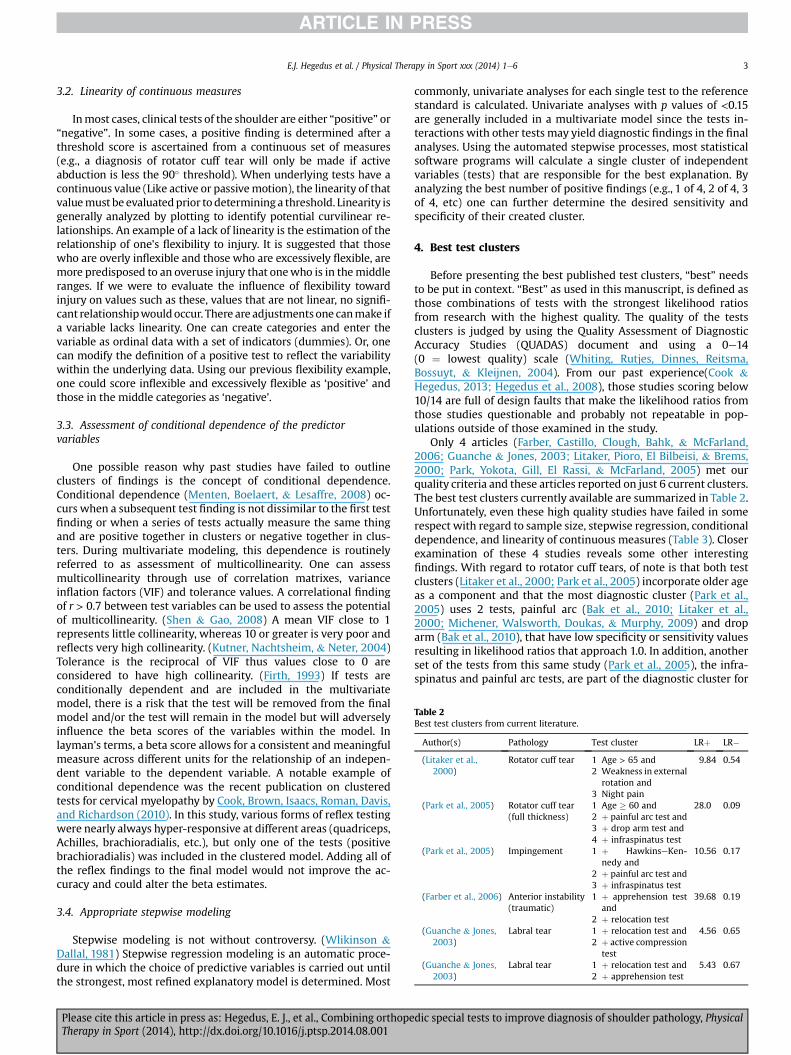
Table 2Best test clusters from current literature.
Author(s) Pathology Test cluster LRþ LR�(Litaker et al.,
2000)Rotator cuff tear 1 Age > 65 and
2 Weakness in externalrotation and
3 Night pain
9.84 0.54
(Park et al., 2005) Rotator cuff tear(full thickness)
1 Age � 60 and2 þ painful arc test and3 þ drop arm test and4 þ infraspinatus test
28.0 0.09
(Park et al., 2005) Impingement 1 þ HawkinseKen-nedy and
2 þ painful arc test and3 þ infraspinatus test
10.56 0.17
(Farber et al., 2006) Anterior instability(traumatic)
1 þ apprehension testand
2 þ relocation test
39.68 0.19
(Guanche & Jones,2003)
Labral tear 1 þ relocation test and2 þ active compression
test
4.56 0.65
(Guanche & Jones,2003)
Labral tear 1 þ relocation test and2 þ apprehension test
5.43 0.67
E.J. Hegedus et al. / Physical Therapy in Sport xxx (2014) 1e6 3
3.2. Linearity of continuous measures
Inmost cases, clinical tests of the shoulder are either “positive” or“negative”. In some cases, a positive finding is determined after athreshold score is ascertained from a continuous set of measures(e.g., a diagnosis of rotator cuff tear will only be made if activeabduction is less the 90� threshold). When underlying tests have acontinuous value (Like active or passivemotion), the linearity of thatvaluemust be evaluatedprior to determininga threshold. Linearity isgenerally analyzed by plotting to identify potential curvilinear re-lationships. An example of a lack of linearity is the estimation of therelationship of one's flexibility to injury. It is suggested that thosewho are overly inflexible and those who are excessively flexible, aremore predisposed to an overuse injury that onewho is in themiddleranges. If we were to evaluate the influence of flexibility towardinjury on values such as these, values that are not linear, no signifi-cant relationshipwouldoccur. There are adjustmentsone canmake ifa variable lacks linearity. One can create categories and enter thevariable as ordinal data with a set of indicators (dummies). Or, onecan modify the definition of a positive test to reflect the variabilitywithin the underlying data. Using our previous flexibility example,one could score inflexible and excessively flexible as ‘positive’ andthose in the middle categories as ‘negative’.
3.3. Assessment of conditional dependence of the predictorvariables
One possible reason why past studies have failed to outlineclusters of findings is the concept of conditional dependence.Conditional dependence (Menten, Boelaert, & Lesaffre, 2008) oc-curs when a subsequent test finding is not dissimilar to the first testfinding or when a series of tests actually measure the same thingand are positive together in clusters or negative together in clus-ters. During multivariate modeling, this dependence is routinelyreferred to as assessment of multicollinearity. One can assessmulticollinearity through use of correlation matrixes, varianceinflation factors (VIF) and tolerance values. A correlational findingof r > 0.7 between test variables can be used to assess the potentialof multicollinearity. (Shen & Gao, 2008) A mean VIF close to 1represents little collinearity, whereas 10 or greater is very poor andreflects very high collinearity. (Kutner, Nachtsheim, & Neter, 2004)Tolerance is the reciprocal of VIF thus values close to 0 areconsidered to have high collinearity. (Firth, 1993) If tests areconditionally dependent and are included in the multivariatemodel, there is a risk that the test will be removed from the finalmodel and/or the test will remain in the model but will adverselyinfluence the beta scores of the variables within the model. Inlayman's terms, a beta score allows for a consistent and meaningfulmeasure across different units for the relationship of an indepen-dent variable to the dependent variable. A notable example ofconditional dependence was the recent publication on clusteredtests for cervical myelopathy by Cook, Brown, Isaacs, Roman, Davis,and Richardson (2010). In this study, various forms of reflex testingwere nearly always hyper-responsive at different areas (quadriceps,Achilles, brachioradialis, etc.), but only one of the tests (positivebrachioradialis) was included in the clustered model. Adding all ofthe reflex findings to the final model would not improve the ac-curacy and could alter the beta estimates.
3.4. Appropriate stepwise modeling
Stepwise modeling is not without controversy. (Wlikinson &Dallal, 1981) Stepwise regression modeling is an automatic proce-dure in which the choice of predictive variables is carried out untilthe strongest, most refined explanatory model is determined. Most
Please cite this article in press as: Hegedus, E. J., et al., Combining orthopeTherapy in Sport (2014), http://dx.doi.org/10.1016/j.ptsp.2014.08.001
commonly, univariate analyses for each single test to the referencestandard is calculated. Univariate analyses with p values of <0.15are generally included in a multivariate model since the tests in-teractions with other tests may yield diagnostic findings in the finalanalyses. Using the automated stepwise processes, most statisticalsoftware programs will calculate a single cluster of independentvariables (tests) that are responsible for the best explanation. Byanalyzing the best number of positive findings (e.g., 1 of 4, 2 of 4, 3of 4, etc) one can further determine the desired sensitivity andspecificity of their created cluster.
4. Best test clusters
Before presenting the best published test clusters, “best” needsto be put in context. “Best” as used in this manuscript, is defined asthose combinations of tests with the strongest likelihood ratiosfrom research with the highest quality. The quality of the testsclusters is judged by using the Quality Assessment of DiagnosticAccuracy Studies (QUADAS) document and using a 0e14(0 ¼ lowest quality) scale (Whiting, Rutjes, Dinnes, Reitsma,Bossuyt, & Kleijnen, 2004). From our past experience(Cook &Hegedus, 2013; Hegedus et al., 2008), those studies scoring below10/14 are full of design faults that make the likelihood ratios fromthose studies questionable and probably not repeatable in pop-ulations outside of those examined in the study.
Only 4 articles (Farber, Castillo, Clough, Bahk, & McFarland,2006; Guanche & Jones, 2003; Litaker, Pioro, El Bilbeisi, & Brems,2000; Park, Yokota, Gill, El Rassi, & McFarland, 2005) met ourquality criteria and these articles reported on just 6 current clusters.The best test clusters currently available are summarized in Table 2.Unfortunately, even these high quality studies have failed in somerespect with regard to sample size, stepwise regression, conditionaldependence, and linearity of continuous measures (Table 3). Closerexamination of these 4 studies reveals some other interestingfindings. With regard to rotator cuff tears, of note is that both testclusters (Litaker et al., 2000; Park et al., 2005) incorporate older ageas a component and that the most diagnostic cluster (Park et al.,2005) uses 2 tests, painful arc (Bak et al., 2010; Litaker et al.,2000; Michener, Walsworth, Doukas, & Murphy, 2009) and droparm (Bak et al., 2010), that have low specificity or sensitivity valuesresulting in likelihood ratios that approach 1.0. In addition, anotherset of the tests from this same study (Park et al., 2005), the infra-spinatus and painful arc tests, are part of the diagnostic cluster for
dic special tests to improve diagnosis of shoulder pathology, Physical
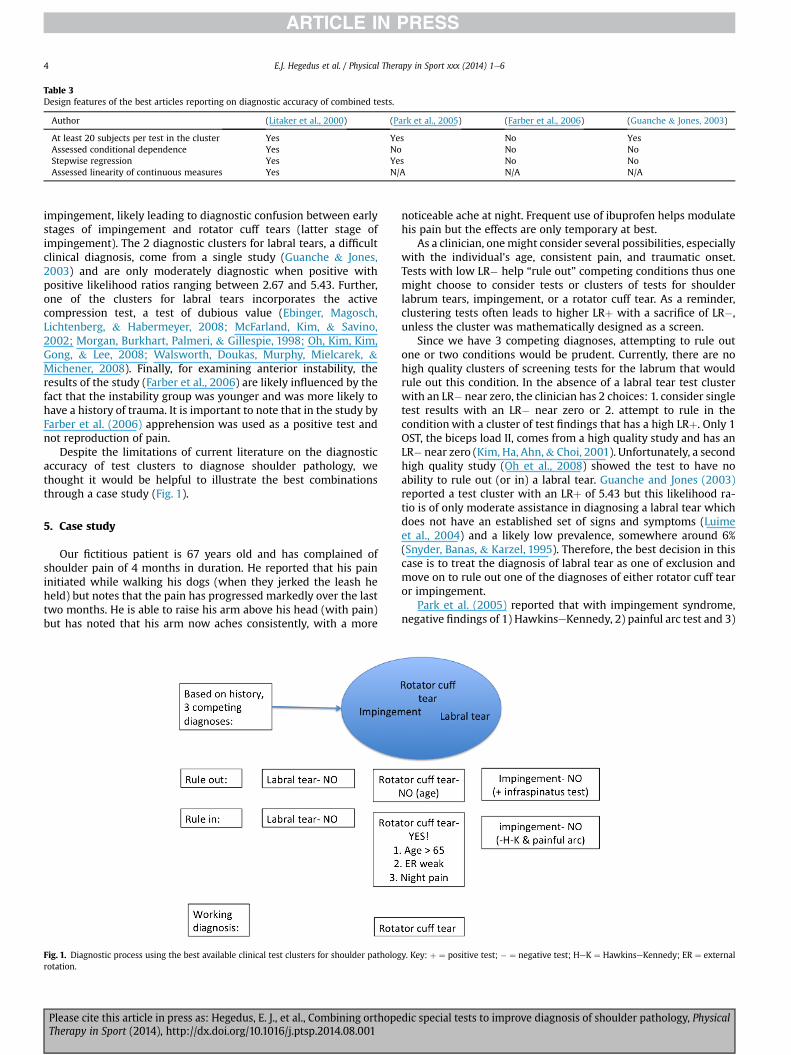
Table 3Design features of the best articles reporting on diagnostic accuracy of combined tests.
Author (Litaker et al., 2000) (Park et al., 2005) (Farber et al., 2006) (Guanche & Jones, 2003)
At least 20 subjects per test in the cluster Yes Yes No YesAssessed conditional dependence Yes No No NoStepwise regression Yes Yes No NoAssessed linearity of continuous measures Yes N/A N/A N/A
E.J. Hegedus et al. / Physical Therapy in Sport xxx (2014) 1e64
impingement, likely leading to diagnostic confusion between earlystages of impingement and rotator cuff tears (latter stage ofimpingement). The 2 diagnostic clusters for labral tears, a difficultclinical diagnosis, come from a single study (Guanche & Jones,2003) and are only moderately diagnostic when positive withpositive likelihood ratios ranging between 2.67 and 5.43. Further,one of the clusters for labral tears incorporates the activecompression test, a test of dubious value (Ebinger, Magosch,Lichtenberg, & Habermeyer, 2008; McFarland, Kim, & Savino,2002; Morgan, Burkhart, Palmeri, & Gillespie, 1998; Oh, Kim, Kim,Gong, & Lee, 2008; Walsworth, Doukas, Murphy, Mielcarek, &Michener, 2008). Finally, for examining anterior instability, theresults of the study (Farber et al., 2006) are likely influenced by thefact that the instability group was younger and was more likely tohave a history of trauma. It is important to note that in the study byFarber et al. (2006) apprehension was used as a positive test andnot reproduction of pain.
Despite the limitations of current literature on the diagnosticaccuracy of test clusters to diagnose shoulder pathology, wethought it would be helpful to illustrate the best combinationsthrough a case study (Fig. 1).
5. Case study
Our fictitious patient is 67 years old and has complained ofshoulder pain of 4 months in duration. He reported that his paininitiated while walking his dogs (when they jerked the leash heheld) but notes that the pain has progressed markedly over the lasttwo months. He is able to raise his arm above his head (with pain)but has noted that his arm now aches consistently, with a more
Fig. 1. Diagnostic process using the best available clinical test clusters for shoulder pathologrotation.
Please cite this article in press as: Hegedus, E. J., et al., Combining orthopeTherapy in Sport (2014), http://dx.doi.org/10.1016/j.ptsp.2014.08.001
noticeable ache at night. Frequent use of ibuprofen helps modulatehis pain but the effects are only temporary at best.
As a clinician, onemight consider several possibilities, especiallywith the individual's age, consistent pain, and traumatic onset.Tests with low LR� help “rule out” competing conditions thus onemight choose to consider tests or clusters of tests for shoulderlabrum tears, impingement, or a rotator cuff tear. As a reminder,clustering tests often leads to higher LRþ with a sacrifice of LR�,unless the cluster was mathematically designed as a screen.
Since we have 3 competing diagnoses, attempting to rule outone or two conditions would be prudent. Currently, there are nohigh quality clusters of screening tests for the labrum that wouldrule out this condition. In the absence of a labral tear test clusterwith an LR� near zero, the clinician has 2 choices: 1. consider singletest results with an LR� near zero or 2. attempt to rule in thecondition with a cluster of test findings that has a high LRþ. Only 1OST, the biceps load II, comes from a high quality study and has anLR� near zero (Kim, Ha, Ahn,& Choi, 2001). Unfortunately, a secondhigh quality study (Oh et al., 2008) showed the test to have noability to rule out (or in) a labral tear. Guanche and Jones (2003)reported a test cluster with an LRþ of 5.43 but this likelihood ra-tio is of only moderate assistance in diagnosing a labral tear whichdoes not have an established set of signs and symptoms (Luimeet al., 2004) and a likely low prevalence, somewhere around 6%(Snyder, Banas, & Karzel, 1995). Therefore, the best decision in thiscase is to treat the diagnosis of labral tear as one of exclusion andmove on to rule out one of the diagnoses of either rotator cuff tearor impingement.
Park et al. (2005) reported that with impingement syndrome,negative findings of 1) HawkinseKennedy, 2) painful arc test and 3)
y. Key: þ ¼ positive test; � ¼ negative test; HeK ¼ HawkinseKennedy; ER ¼ external
dic special tests to improve diagnosis of shoulder pathology, Physical

E.J. Hegedus et al. / Physical Therapy in Sport xxx (2014) 1e6 5
infraspinatus test provides a very low LR� (0.17) and thus, has thecapacity to rule out the condition. Park et al. (2005) also reportedthat ruling out a rotator cuff tear is possible with negative findingson 1) Age � 60, 2) painful arc test, 3) drop arm test, and 4) infra-spinatus test. Since our patient is over age 60, we cannot rule out arotator cuff tear. For the sake of this case, the HawkinseKennedyand the painful arc tests were negative but the infraspinatus test(weakness against resisted external rotation) was positive. Theimpingement test cluster, therefore, cannot rule out impingement.With a negative HawkinseKennedy and painful arc, we also cannotrule in impingement.
To rule in a rotator cuff tear, one could refer back to the findingsof Park et al. (2005) or consider the results from Litaker et al.(2000). Two consistencies with the findings of Park et al. (2005)and Litaker et al. (2000) are age and external rotation strengthlosses. Park et al. (2005) report the benefit of the drop arm sign andthe painful arc test whereas Litaker et al. (2000) report the value ofnight pain. Recall that our patient is 67 years old has night pain, anda positive infraspinatus test (weakness in external rotation). These3 findings complete the test cluster by Litaker et al. (2000). Theclinician must be content with an LRþ of 9.84. Since the painful arctest was previously reported as negative, the cluster of Park et al.(2005), with an LRþ of 28.0, cannot be used.
6. Conclusion
The clinical diagnostic process should be viewed through thelens of odds and probabilities. In order to do so, test clusters fromhigh quality studies should be utilized. In our case study, the patientlikely has a rotator cuff tear but we were unable to rule out or in alabral tear and impingement. High quality clinical test clusters withpowerful diagnostic characteristics for labral tears do not presentlyexist and impingement is an all-encompassing term for tendonpathology at the shoulder that is, at best, unhelpful in guidingtreatment, and, at worst, a clinical illusion (Hegedus et al., 2012;Lewis, 2011). Other important pathologies of the shoulder like bi-ceps tendinopathy, multi-directional instability, and fractures, alsolack powerful clinical diagnostic clusters. Improved research thatfollows the tenets of multivariate modeling outlined in this articlemust be performed in order to improve the tools available to cli-nicians as we attempt to make use of the clinical examination todiagnose shoulder pathology.
Conflict of interestNone.
FundingNone.
Ethical approvalNone.
References
Alexopoulos, E. C. (2010). Introduction to multivariate regression analysis. Hippo-kratia, 14, 23e28.
Bak, K., Sorensen, A. K., Jorgensen, U., Nygaard, M., Krarup, A. L., Thune, C., et al.(2010). The value of clinical tests in acute full-thickness tears of the supra-spinatus tendon: does a subacromial lidocaine injection help in the clinicaldiagnosis? A prospective study. Arthroscopy: The Journal of Arthroscopic &Related Surgery: Official Publication of the Arthroscopy Association of NorthAmerica and the International Arthroscopy Association, 26, 734e742.
Beattie, P., & Nelson, R. (2006). Clinical prediction rules: what are they and what dothey tell us? The Australian Journal of Physiotherapy, 52, 157e163.
Beneciuk, J. M., Bishop, M. D., & George, S. Z. (2009). Clinical prediction rules forphysical therapy interventions: a systematic review. Physical Therapy, 89,114e124.
Please cite this article in press as: Hegedus, E. J., et al., Combining orthopeTherapy in Sport (2014), http://dx.doi.org/10.1016/j.ptsp.2014.08.001
Chronopoulos, E., Kim, T. K., Park, H. B., Ashenbrenner, D., & McFarland, E. G. (2004).Diagnostic value of physical tests for isolated chronic acromioclavicular lesions.The American Journal of Sports Medicine, 32, 655e661.
Cook, C., Brown, C., Isaacs, R., Roman, M., Davis, S., & Richardson, W. (2010). Clus-tered clinical findings for diagnosis of cervical spine myelopathy. The Journal ofManual & Manipulative Therapy, 18, 175e180.
Cook, C., & Hegedus, E. J. (2013). Orthopedic physical examination tests: An evidence-based approach (2nd ed.). Upper Saddle River: Rearson Education, Inc.
Cook, C., Shah, A., & Pietrobon, R. (2008). Lumbopelvic manipulation for treatmentof patients with patellofemoral pain syndrome: development of a clinicalpredication rule. The Journal of Orthopaedic and Sports Physical Therapy, 38, 722.
Ebinger, N., Magosch, P., Lichtenberg, S., & Habermeyer, P. (2008). A new SLAP test:the supine flexion resistance test. Arthroscopy: The Journal of Arthroscopic &Related Surgery: Official Publication of the Arthroscopy Association of NorthAmerica and the International Arthroscopy Association, 24, 500e505.
Farber, A. J., Castillo, R., Clough, M., Bahk, M., & McFarland, E. G. (2006). Clinicalassessment of three common tests for traumatic anterior shoulder instability.The Journal of Bone and Joint Surgery, American Volume, 88, 1467e1474.
Firth, D. (1993). Bias reduction of maximum likelihood estimates. Biometrika, 80,27e38.
Guanche, C. A., & Jones, D. C. (2003). Clinical testing for tears of the glenoid labrum.Arthroscopy: The Journal of Arthroscopic & Related Surgery: Official Publication ofthe Arthroscopy Association of North America and the International ArthroscopyAssociation, 19, 517e523.
Haskins, R., Rivett, D. A., & Osmotherly, P. G. (2012). Clinical prediction rules in thephysiotherapy management of low back pain: a systematic review. ManualTherapy, 17, 9e21.
Hegedus, E. J., Goode, A., Campbell, S., Morin, A., Tamaddoni, M.,Moorman, C. T., 3rd, et al. (2008). Physical examination tests of the shoulder: asystematic review with meta-analysis of individual tests. British Journal ofSports Medicine, 42, 80e92. discussion 92.
Hegedus, E. J., Goode, A. P., Cook, C. E., Michener, L., Myer, C. A., Myer, D. M., et al.(2012). Which physical examination tests provide clinicians with the mostvalue when examining the shoulder? Update of a systematic review with meta-analysis of individual tests. British Journal of Sports Medicine, 46, 964e978.
Hosmer, D. W., & Lemeshow, S. (2000). Applied logistic regression (2nd ed.). NewYork: John Wiley and Sons.
Kim, S. H., Ha, K. I., Ahn, J. H., & Choi, H. J. (2001). Biceps load test II: a clinical test forSLAP lesions of the shoulder. Arthroscopy: The Journal of Arthroscopic & RelatedSurgery: Official Publication of the Arthroscopy Association of North America andthe International Arthroscopy Association, 17, 160e164.
Kutner, M., Nachtsheim, C., & Neter, J. (2004). Applied linear regression models (4thed.). Burr Ridge: McGraw-Hill/Irwin.
Lewis, J. S. (2011). Subacromial impingement syndrome: a musculoskeletal condi-tion or a clinical illusion? Physical Therapy Review, 16, 388e398.
Litaker, D., Pioro, M., El Bilbeisi, H., & Brems, J. (2000). Returning to the bedside:using the history and physical examination to identify rotator cuff tears. Journalof the American Geriatrics Society, 48, 1633e1637.
Luime, J. J., Verhagen, A. P., Miedema, H. S., Kuiper, J. I., Burdorf, A., Verhaar, J. A.,et al. (2004). Does this patient have an instability of the shoulder or a labrumlesion? JAMA: The Journal of the American Medical Association, 292, 1989e1999.
May, S., & Rosedale, R. (2009). Prescriptive clinical prediction rules in back painresearch: a systematic review. The Journal of Manual & Manipulative Therapy, 17,36e45.
McFarland, E. G., Kim, T. K., & Savino, R. M. (2002). Clinical assessment of threecommon tests for superior labral anterioreposterior lesions. The AmericanJournal of Sports Medicine, 30, 810e815.
Menten, J., Boelaert, M., & Lesaffre, E. (2008). Bayesian latent class models withconditionally dependent diagnostic tests: a case study. Statistics in Medicine, 27,4469e4488.
Michener, L. A., Walsworth, M. K., Doukas, W. C., & Murphy, K. P. (2009). Reliabilityand diagnostic accuracy of 5 physical examination tests and combination oftests for subacromial impingement. Archives of Physical Medicine and Rehabili-tation, 90, 1898e1903.
Morgan, C. D., Burkhart, S. S., Palmeri, M., & Gillespie, M. (1998). Type II SLAP le-sions: three subtypes and their relationships to superior instability and rotatorcuff tears. Arthroscopy: The Journal of Arthroscopic & Related Surgery: OfficialPublication of the Arthroscopy Association of North America and the InternationalArthroscopy Association, 14, 553e565.
Nee, R. J., & Coppieters, M. W. (2011). Interpreting research on clinical predictionrules for physiotherapy treatments. Manual Therapy, 16, 105e108.
Oh, J. H., Kim, J. Y., Kim,W. S., Gong, H. S., & Lee, J. H. (2008). The evaluation of variousphysical examinations for the diagnosis of type II superior labrum anterior andposterior lesion. The American Journal of Sports Medicine, 36, 353e359.
Park, H. B., Yokota, A., Gill, H. S., El Rassi, G., & McFarland, E. G. (2005). Diagnosticaccuracy of clinical tests for the different degrees of subacromial impingementsyndrome. The Journal of Bone and Joint Surgery, American Volume, 87, 1446e1455.
Shen, J., & Gao, S. A. (2008). Solution to separation and multicollinearity in multiplelogistic regression. Journal of Data Science, 6, 515e531.
Snyder, S. J., Banas, M. P., & Karzel, R. P. (1995). An analysis of 140 injuries to thesuperior glenoid labrum. Journal of Shoulder and Elbow Surgery/AmericanShoulder and Elbow Surgeons… [et al.], 4, 243e248.
Stanton, T. R., Hancock, M. J., Maher, C. G., & Koes, B. W. (2010). Critical appraisal ofclinical prediction rules that aim to optimize treatment selection for muscu-loskeletal conditions. Physical Therapy, 90, 843e854.
dic special tests to improve diagnosis of shoulder pathology, Physical

E.J. Hegedus et al. / Physical Therapy in Sport xxx (2014) 1e66
Walsworth,M. K., Doukas,W. C.,Murphy, K. P.,Mielcarek, B. J., &Michener, L. A. (2008).Reliability and diagnostic accuracy of history and physical examination for diag-nosing glenoid labral tears. The American Journal of Sports Medicine, 36, 162e168.
Walton, J., Mahajan, S., Paxinos, A., Marshall, J., Bryant, C., Shnier, R., et al. (2004).Diagnostic values of tests for acromioclavicular joint pain. The Journal of Boneand Joint Surgery, American Volume, 86-A, 807e812.
Please cite this article in press as: Hegedus, E. J., et al., Combining orthopeTherapy in Sport (2014), http://dx.doi.org/10.1016/j.ptsp.2014.08.001
Whiting, P., Rutjes, A. W., Dinnes, J., Reitsma, J., Bossuyt, P. M., & Kleijnen, J. (2004).Development and validation of methods for assessing the quality of diagnosticaccuracy studies. Health Technology Assessment, 8(iii), 1e234.
Wlikinson, L., & Dallal, G. E. (1981). Tests of significance in forward selectionregression with an F-to enter stopping rule. Technometrics, 23, 377e380.
dic special tests to improve diagnosis of shoulder pathology, Physical