Predicting agricultural management influence on long-term soil organic carbon dynamics: Implications...
13
Symposium 234 Agronomy Journal • Volume 103, Issue 1 • 2011 Predicting Agricultural Management Influence on Long-Term Soil Organic Carbon Dynamics: Implications for Biofuel Production H. T. Gollany,* R. W. Rickman, Y. Liang, S. L. Albrecht, S. Machado, and S. Kang Published in Agron. J. 103:234–246 (2011) Published online 9 Dec 2010 doi:10.2134/agronj2010.0203s Copyright © 2010 by the American Society of Agronomy, 5585 Guilford Road, Madison, WI 53711. All rights reserved. No part of this periodical may be reproduced or transmitted in any form or by any means, electronic or mechanical, including photocopying, recording, or any information storage and retrieval system, without permission in writing from the publisher. C oncerns about declining fossil fuel supplies have renewed the search for lignocellulosic biomass for renewable biofuel energy (Hill et al., 2006; Lynd et al., 1991). Consequently, there has been an increasing interest in using grain and crop residues as feedstock (Lal, 2007; Perlack et al., 2005; Graham et al., 2007). Agricultural crop residues comprise the largest near-term source of feedstock (Anex et al., 2007). Maize residue (stover), with a current annual availability of approxi- mately 75 Tg (Perlack et al., 2005), is predicted to be the major contributor to biofuel production in the United States (Farrell et al., 2006; Kim and Dale, 2005). Studies have shown that harvest- ing maize stover reduces grain and stover yield (Power et al., 1986; Wilhelm et al., 1986, 2004) in subsequent crops and decreases SOM stocks (Linden et al., 2000; Maskina et al., 1993). Harvest- ing substantial amounts of crop residue under current cropping systems would deplete SOM (Maskina et al., 1993; Clapp et al., 2000), exacerbate risks of soil erosion (Larson, 1979; Lindstrom, 1986; Lindstrom et al., 1979; Nelson, 2002), increase nonpoint- source pollution, degrade soil properties (Balesdent et al., 2000; Blanco-Canqui and Lal, 2009; Blanco-Canqui et al., 2006a, 2006b; Moebius-Clune et al., 2008), reduce crop yields per unit input of fertilizer and water, and decrease agricultural sustainabil- ity (Lal, 2005, 2007; Mann et al., 2002; Wilhelm et al., 2007). However, use of lignocellulosic biomass need not jeopardize SOM stocks and agricultural sustainability. One of the world’s invaluable natural resources is SOM. Soil organic matter influences soil physical, chemical, and biologi- cal properties, and contributes to crop productivity (Gollany et al., 1992; Jenkinson et al., 1991; Lal, 1997). It has important chemical, biological, and physical functions (Carter, 2002; Six et al., 1999; Stevenson, 1994). Management of SOM is critical for sustaining soil productivity and environmental quality. e loss of SOM (30–70%) and release of plant nutrients from United States soils in the first 50-yr aſter converting native prairie or forest to production agriculture is well documented (Huggins et al., 1998; Janzen et al., 1998; Liebig et al., 2005; Paustian et al., 1998b; Post and Kwon, 2000; Rasmussen and Albrecht, 1998). An estimated 5 Pg (5 × 10 15 g) of C has been lost from U.S. soils as a result of cultivation (Lal et al., 1998), with implications for the greenhouse effect and global climate change (Lal et al., 1998; Paustian et al., 1995; Follett, 2010). Soil is also a major pool (1720 Gt) in the cycling of C from the atmosphere to the biosphere (Oades, 1988). e amount of soil C in an agroecosystem is the net result of C inputs through ABSTRACT Long-term field experiments (LTE) are ideal for predicting the influence of agricultural management on soil organic carbon (SOC) dynamics and examining biofuel crop residue removal policy questions. Our objectives were (i) to simulate SOC dynamics in LTE soils under various climates, crop rotations, fertilizer or organic amendments, and crop residue managements using the CQESTR model and (ii) to predict the potential of no-tillage (NT) management to maintain SOC stocks while removing crop residue. Clas- sical LTEs at Champaign, IL (1876), Columbia, MO (1888), Lethbridge, AB (1911), Breton, AB (1930), and Pendleton, OR (1931) were selected for their documented history of management practice and periodic soil organic matter (SOM) measurements. Manage- ment practices ranged from monoculture to 2- or 3-yr crop rotations, manure, no fertilizer or fertilizer additions, and crop residue returned, burned, or harvested. Measured and CQESTR predicted SOC stocks under diverse agronomic practices, mean annual temperature (2.1–19ºC), precipitation (402–973 mm), and SOC (5.89−33.58 g SOC kg −1 ) at the LTE sites were significantly related ( r 2 = 0.94, n = 186, P < 0.0001) with a slope not significantly different than 1. e simulation results indicated that the quantities of crop residue that can be sustainably harvested without jeopardizing SOC stocks were influenced by initial SOC stocks, crop rota- tion intensity, tillage practices, crop yield, and climate. Manure or a cover crop/intensified crop rotation under NT are options to mitigate loss of crop residue C, as using fertilizer alone is insufficient to overcome residue removal impact on SOC stocks. H.T. Gollany, R.W. Rickman (retired), and S.L. Albrecht (retired), USDA-ARS, Columbia Plateau Conservation Research Center, P.O. Box. 370, Pendleton, OR 97801; Y. Liang, Dep. of Biological & Agricultural Engineering, Cooperative Extension Service, Univ. of Arkansas, Fayetteville, AR 72701-1201; S. Machado, Oregon State Univ., Columbia Basin Agricultural Research Center, Pendleton, OR 97801; and S. Kang, Environmental Science Division, Oak Ridge National Lab., P.O. Box 2008, Oak Ridge, TN 37831-6290. Received 2 May 2010. *Corresponding author ([email protected]). Abbreviations: CO 2 , carbon dioxide; CR, conventional stubble mulch or reduced tillage; CT, conventional moldboard plow tillage; CW, continuous spring wheat; H, hay (clover); LC, lack of correlation or scatter; LTE, long- term field experiments; M, maize; MM, continuous maize; MSD, mean square deviation; NT, no-tillage; NT-25, no-tillage with 25% of crop residue removed; NT-50, no-tillage with 50% of crop residue removed; NT-75, no-tillage with 75% of crop residue removed; NT-90, no-tillage with 90% of crop residue removed before the 1950s; NU, non-unity slope; O, oat; SB, squared bias; SO, soybean; SOC, soil organic carbon; SOM, soil organic matter; SW-F, spring wheat–fallow rotation; W-F, wheat–fallow rotation; WW, continuous winter wheat.
-
Upload
independent -
Category
Documents
-
view
0 -
download
0
Transcript of Predicting agricultural management influence on long-term soil organic carbon dynamics: Implications...

Symposium
234 Agronomy Journa l • Volume 103 , I s sue 1 • 2011
Predicting Agricultural Management Infl uence on Long-Term Soil Organic Carbon Dynamics: Implications for Biofuel Production
H. T. Gollany,* R. W. Rickman, Y. Liang, S. L. Albrecht, S. Machado, and S. Kang
Published in Agron. J. 103:234–246 (2011)Published online 9 Dec 2010doi:10.2134/agronj2010.0203sCopyright © 2010 by the American Society of Agronomy, 5585 Guilford Road, Madison, WI 53711. All rights reserved. No part of this periodical may be reproduced or transmitted in any form or by any means, electronic or mechanical, including photocopying, recording, or any information storage and retrieval system, without permission in writing from the publisher.
Concerns about declining fossil fuel supplies have renewed the search for lignocellulosic biomass for
renewable biofuel energy (Hill et al., 2006; Lynd et al., 1991). Consequently, there has been an increasing interest in using grain and crop residues as feedstock (Lal, 2007; Perlack et al., 2005; Graham et al., 2007). Agricultural crop residues comprise the largest near-term source of feedstock (Anex et al., 2007). Maize residue (stover), with a current annual availability of approxi-mately 75 Tg (Perlack et al., 2005), is predicted to be the major contributor to biofuel production in the United States (Farrell et al., 2006; Kim and Dale, 2005). Studies have shown that harvest-ing maize stover reduces grain and stover yield (Power et al., 1986; Wilhelm et al., 1986, 2004) in subsequent crops and decreases SOM stocks (Linden et al., 2000; Maskina et al., 1993). Harvest-ing substantial amounts of crop residue under current cropping systems would deplete SOM (Maskina et al., 1993; Clapp et al., 2000), exacerbate risks of soil erosion (Larson, 1979; Lindstrom, 1986; Lindstrom et al., 1979; Nelson, 2002), increase nonpoint-source pollution, degrade soil properties (Balesdent et al., 2000;
Blanco-Canqui and Lal, 2009; Blanco-Canqui et al., 2006a, 2006b; Moebius-Clune et al., 2008), reduce crop yields per unit input of fertilizer and water, and decrease agricultural sustainabil-ity (Lal, 2005, 2007; Mann et al., 2002; Wilhelm et al., 2007). However, use of lignocellulosic biomass need not jeopardize SOM stocks and agricultural sustainability.
One of the world’s invaluable natural resources is SOM. Soil organic matter infl uences soil physical, chemical, and biologi-cal properties, and contributes to crop productivity (Gollany et al., 1992; Jenkinson et al., 1991; Lal, 1997). It has important chemical, biological, and physical functions (Carter, 2002; Six et al., 1999; Stevenson, 1994). Management of SOM is critical for sustaining soil productivity and environmental quality. Th e loss of SOM (30–70%) and release of plant nutrients from United States soils in the fi rst 50-yr aft er converting native prairie or forest to production agriculture is well documented (Huggins et al., 1998; Janzen et al., 1998; Liebig et al., 2005; Paustian et al., 1998b; Post and Kwon, 2000; Rasmussen and Albrecht, 1998). An estimated 5 Pg (5 × 10¹⁵ g) of C has been lost from U.S. soils as a result of cultivation (Lal et al., 1998), with implications for the greenhouse eff ect and global climate change (Lal et al., 1998; Paustian et al., 1995; Follett, 2010). Soil is also a major pool (1720 Gt) in the cycling of C from the atmosphere to the biosphere (Oades, 1988). Th e amount of soil C in an agroecosystem is the net result of C inputs through
ABSTRACTLong-term fi eld experiments (LTE) are ideal for predicting the infl uence of agricultural management on soil organic carbon (SOC)
dynamics and examining biofuel crop residue removal policy questions. Our objectives were (i) to simulate SOC dynamics in LTE
soils under various climates, crop rotations, fertilizer or organic amendments, and crop residue managements using the CQESTR
model and (ii) to predict the potential of no-tillage (NT) management to maintain SOC stocks while removing crop residue. Clas-
sical LTEs at Champaign, IL (1876), Columbia, MO (1888), Lethbridge, AB (1911), Breton, AB (1930), and Pendleton, OR (1931)
were selected for their documented history of management practice and periodic soil organic matter (SOM) measurements. Manage-
ment practices ranged from monoculture to 2- or 3-yr crop rotations, manure, no fertilizer or fertilizer additions, and crop residue
returned, burned, or harvested. Measured and CQESTR predicted SOC stocks under diverse agronomic practices, mean annual
temperature (2.1–19ºC), precipitation (402–973 mm), and SOC (5.89−33.58 g SOC kg−1) at the LTE sites were signifi cantly related
(r2 = 0.94, n = 186, P < 0.0001) with a slope not signifi cantly diff erent than 1. Th e simulation results indicated that the quantities of
crop residue that can be sustainably harvested without jeopardizing SOC stocks were infl uenced by initial SOC stocks, crop rota-
tion intensity, tillage practices, crop yield, and climate. Manure or a cover crop/intensifi ed crop rotation under NT are options to
mitigate loss of crop residue C, as using fertilizer alone is insuffi cient to overcome residue removal impact on SOC stocks.
H.T. Gollany, R.W. Rickman (retired), and S.L. Albrecht (retired), USDA-ARS, Columbia Plateau Conservation Research Center, P.O. Box. 370, Pendleton, OR 97801; Y. Liang, Dep. of Biological & Agricultural Engineering, Cooperative Extension Service, Univ. of Arkansas, Fayetteville, AR 72701-1201; S. Machado, Oregon State Univ., Columbia Basin Agricultural Research Center, Pendleton, OR 97801; and S. Kang, Environmental Science Division, Oak Ridge National Lab., P.O. Box 2008, Oak Ridge, TN 37831-6290. Received 2 May 2010. *Corresponding author ([email protected]). Abbreviations: CO2, carbon dioxide; CR, conventional stubble mulch or
reduced tillage; CT, conventional moldboard plow tillage; CW, continuous spring wheat; H, hay (clover); LC, lack of correlation or scatter; LTE, long-term fi eld experiments; M, maize; MM, continuous maize; MSD, mean square deviation; NT, no-tillage; NT-25, no-tillage with 25% of crop residue removed; NT-50, no-tillage with 50% of crop residue removed; NT-75, no-tillage with 75% of crop residue removed; NT-90, no-tillage with 90% of crop residue removed before the 1950s; NU, non-unity slope; O, oat; SB, squared bias; SO, soybean; SOC, soil organic carbon; SOM, soil organic matter; SW-F, spring wheat–fallow rotation; W-F, wheat–fallow rotation; WW, continuous winter wheat.
Agronomy Journa l • Volume 103, Issue 1 • 2011 235
primary production and deposition by wind or water erosion, leaching of dissolved organic C through soil, and C losses via respiration, wind, and water erosion (Campbell et al., 1996; Mertens et al., 2007; Paustian et al., 1998a).
Th e turnover rate of diff erent SOM compounds varies due to complex interactions between chemical, physical, and biological processes in soil. Changes in agricultural management gradu-ally infl uence soil C in its stable form as SOC. Under temperate climatic conditions, changes in stable SOC are slow and oft en undetectable even aft er many years. Although changes in SOC have been detected over short periods, when signifi cant manage-ment change occurs and soil C pools are far from equilibrium (Conant and Paustian, 2002; West and Post, 2002), most SOC changes require a long time period (~20 yr) to be detectable by present analytical methods (Rasmussen and Albrecht, 1998). Furthermore, long-term trends may be quite diff erent from results obtained from short duration (1–5 yr) fi eld plot stud-ies (Larson et al., 1983). Because of this slow process and the complex interactions between management factors, edaphic condition, and climate, simulation models (Huggins et al., 1998; Izaurralde et al., 2006; Liang et al., 2008; Lemke et al., 2010; Paustian et al., 1992; Rickman et al., 2002) have been used to describe and predict short- and long-term eff ects of management practices on SOC dynamics. Four conceptual SOC pools have been suggested for modeling purposes: (i) active or labile pool—a readily oxidizable pool; (ii) slowly oxidized pool—associated with macroaggregates; (iii) very slowly oxidized pool—associated with water stable microaggregates; and (iv) recalcitrant or passive pool. Many factors control the sizes of pools. Agronomic man-agement and climatic factors control the size of the active pool. Soil mineralogy, aggregation and agronomic factors, particularly tillage, aff ect the size of slowly oxidized pool (Six et al., 1998). Soil mineralogy impacts the very slowly oxidized pool, and agronomic factors have little impact. Th e recalcitrant or passive pool is controlled by clay mineralogy and microbial products and agronomic factors do not infl uence this pool (Chen and Molina, 1995), except for physical processes such as erosion.
It is critical to examine the consequences of removing crop resi-due on SOC as biofuel production expands. Classical long-term experiments (i.e., >50 yr of duration) provide an excellent database for examining impact of crop residue removal on SOC. Th ese experiments with repeated additions or removals of C sources are ideal for examining SOC changes (Gollany et al., 2006), and have provided insights into SOC dynamics and turnover under a range
of agricultural crops and management practices. In particular, data sets from diverse management practices in diff erent regions of North America are available. Th ese databases in conjunction with process-based models (e.g., CENTURY, CQESTR, and EPIC) are important tools for formulating complex and comprehensive research or policy questions, by defi ning diff erent scenarios, or extrapolating the fi ndings from fi eld-to-landscape scales. Mod-els can be used to predict the long-term eff ects of agricultural practices (e.g., crop residue harvest for bioenergy) on SOC stocks when immediate answers are needed, or extensive data collection is costly, cumbersome or impossible. Models can rapidly evaluate the potential impact of crop residue removal for bioenergy produc-tion using specifi c soil, crop rotations, crop yield, and alternative tillage (Gollany et al., 2010). Th ere are relatively few short-term fi eld trials with conservation tillage (i.e., NT) that have been established recently to examine the impact of crop residue removal on SOC storage and soil properties. Most recent reports discussing consequences of crop residue harvest for biofuel production have been conducted over short durations in the central U.S. Corn Belt. Johnson et al. (2006) showed that stover removal could be feasible under the NT management practice. Since changes in SOC are slow, long-term studies are needed to evaluate SOC changes under diverse climatic, edaphic conditions, and cropping systems. Five classical LTE in North America (Morrow Plots, Sanborn Field, Lethbridge Plots, Breton Plots, and Pendleton Plots) were selected for their periodic SOM measurements, and documented history of tillage and management practice, including past records of residue removal. Our objectives were (i) to simulate SOC dynamics in LTE under various climate, crop rotations, tillage practices, fertil-izer or organic amendments, and crop residue managements and (ii) to predict the potential of the NT management scenarios to maintain SOC, with crop residue removal for bioenergy produc-tion, using the CQESTR model.
MATERIALS AND METHODSSite Description and Management Practices
Classical agricultural long-term experiments (i.e.,>50 yr) rang-ing from 79 to 134-yr in duration (Table 1), with a wide range of mean annual temperature (2.1–19ºC), precipitation (402–973 mm), soil texture (i.e., sandy clay loam, loam, silt loam), and soil drainage class (i.e., moderately drained and well drained) were selected from North America (Buyanovsky et al., 1997; Buyanovsky and Wagner, 1998; Darmody and Peck, 1997; Hug-gins et al., 1998; Izaurralde et al., 1996; Janzen et al., 1997; Juma
Table 1. Main inputs and outputs data for the CQESTR process-based models used in soil organic carbon (SOC) prediction.
ClimateSoil layer/horizon
properties ManagementCropping system Fertilizer/amendments Outputs
Monthly mean temp. no. of layers† tillage implements rotation sequence amendment type SOCMonthly mean precipitation depth of layers depth of tillage crop and residue yields‡ applications date gain/loss§ (>100 yr)
initial SOC# dates of operations residue N content¶recent SOC percentage residue cover
soil bulk densitysoil texturesoil drainage
† Number of layers or horizon with SOC measurements.‡ Crop and residue yields or grain yields and harvest index needed to calculate crop biomass input.§ Soil organic carbon gains or losses for each soil layer or horizon.# Initial SOC sample does not necessarily occur at the initiation of an experiment.¶ Nitrogen content of residue for each crop need and can be selected from default values.
236 Agronomy Journa l • Volume 103, Issue 1 • 2011
et al., 1997; Paul et al., 1997; Rasmussen and Albrecht, 1998; Rasmussen and Smiley, 1997). Th e selected LTEs were: Morrow Plots, Sanborn Field, and Pendleton Plots in the United States; and Breton and Lethbridge Plots in Canada. Th ese studies rep-resent a wide edaphic condition, and a variety of crop rotations, fertility management, and crop residue removal practices (i.e., harvest or burning). Th ese studies are time capsules for anthro-pogenic changes and their data are very useful for modeling, although some do not permit modern rigorous statistical analysis because of their experimental design limitations.
Th e Breton Plots (53º7´ N, 114º13´ W) at Breton, AB were established in 1930 (Izaurralde et al., 1996; Juma et al., 1997). Th e soil is Breton loam (Typic Cryoboralfs) developed on glacial till sandstones and shales of freshwater origin (Paska-poo formation) under a white poplar (Populus tremuloides) and poplar–spruce (Picea glauca) combination. Topsoil (0- to 10-cm) contained 29% sand, 45% silt, and 26% clay and is fairly well drained to well drained. Th e land was settled and cleared circa 1920, and farmed before preliminary trials of the formal experiment establishment in 1929. Th e cropping systems selected for these simulations were fallow wheat (Triticum
aestivum L.) monoculture without fertilizer (Control) and with manure (8.8 Mt ha−1yr−1). In 1941, the original continu-ous spring wheat (CW) system was split in half to create the present-day wheat–fallow (W-F) plots. Th e plots were tilled once in the fall aft er harvest and again in the spring before planting (CR). Weeds in the fallow plots in the 2-yr rotation are controlled with reduced tillage and rod weeding or herbi-cides. Planting was done with a press drill and all aboveground biomass (straw and grain) was removed with no crop residue returned to the soil. Simulations were performed under CR, NT, and NT with 25, 50, and 75% straw removal.
Th e Morrow Plots (40º1́ N, 88º1́ W) at Champaign, IL were established in 1876 (Darmody and Peck, 1997). Th e soil is a Flanagan silt loam (fi ne, smectitic, mesic Aquic Argiudolls), developed in loess over loamy glacial till under tallgrass prairie vegetation. Topsoil (0- to 15-cm) contained about 8% sand, 67% silt, and 25% clay. Tile-drainage lines were installed in the plot borders in 1904 to improve soil drainage. Cropping systems were continuous maize (Zea mays L.) (MM), maize–oat [M-O (Avena sativa L.)], and maize–oat–clover (Trifolium pratense L.) rotations (M-O-H). In 1967, soybean (Glycine max L.) replaced oat in the maize–oat rotation. All plots were under conven-tional moldboard plow tillage (CT). Th e plots were divided into four subplots per rotation. Fertilizer treatments were subplots of the cropping system treatments. Control (no fertilizer) or manure treatments for each rotation were assigned to two or three subplots. Soil organic C contents were reported individu-ally from these plots, but yields were reported as averages. From 1876 until 1955, all aboveground biomass (grain, straw, stover, and hay) was removed while crop stubble and root residues were retained in the soil. Starting in 1955, all crop residues were returned to selected subplots, and in 1967 to all subplots. Simu-lations were performed under CT and NT managements.
Sanborn Field (38º57´ N, 93º20´ W) at Columbia, MO was established in 1888 (Buyanovsky et al., 1997; Buyanovsky and Wagner, 1998). Th e soil is a Mexico silt loam (fi ne, smectitic, mesic Vertic Epiaqualfs), developed in loess over old glacial till under tallgrass prairie, grading into a Lindley loam (fi ne-loamy, mixed,
superactive, mesic Typic Hapludalfs), developed in loess over old glacial till under hardwood forest. Th e plow layer contained 5 to 10% sand, 70 to 80% silt, and 10 to 20% clay. Th e land was in pas-ture with scattered elm (Ulmus americana L.) trees and buck brush (Ceanothus sanguineus L.) before plot establishment. Th ere are 38 plots with a variety of continuous cropping treatments and rota-tions. Cropping systems used in these simulations were continuous maize, and continuous winter wheat (WW), with fertilizer (full treatment) or manure, as the major grain crops. Fertilizer treat-ments included: barnyard manure applied at 13.4 Mg ha−1 yr−1; and NH4NO3 (34–0–0) before 1950 and later as 50–20–20 kg of N, P, and K ha−1 in accord with soil test and plant composition data. Primary tillage consisted of fall moldboard plowing (20-cm depth) followed by secondary disk tillage and a harrow in spring (CT). Th e grain crops were harvested at maturity either by hand, before 1950, or using current farming technology. Crop residues were removed from the plots before 1950, and only stubble and root residues were returned to the soil. Aft er 1950, straw and stover from wheat and maize plots were retained and uniformly spread and incorporated. Simulations were performed for wheat and maize in manure and fertilized treatments under CT and NT with 90% straw or stover removed before the 1950. Simulations for residue removal scenarios were performed for maize under NT with 25, 50, and 75% stover removal.
Th e Lethbridge Plots (49º42́ N, 112º50´ W) at Lethbridge, AB were established in 1911, on a site broken from grassland circa 1908 (Janzen et al., 1997). Th e soil is an Orthic Dark Brown Chernozem (Typic Haploboroll) developed on alluvial lacustrine parent material under native vegetation of short and mid-grass species. Surface soil (0- to 15-cm) contained 46% sand, 23% silt, and 31% clay and is fairly well drained. Moldboard plow, exten-sively used until the late 1920s, was replaced by disc, which was in turn replaced by the wide blade cultivator in 1939, when stubble mulch practices were adopted (CR). All of the straw was removed from the plots by hand until combine harvesters were introduced in 1943. Since then all straw has been returned to the plots. Th e wheat–fallow (W-F) rotation with full fertilizer (45 kg of N and 20 kg of P ha−1) was selected for the CR and NT and NT with 25, 50, and 75% straw removal simulation scenarios.
Th e Pendleton Plots (45º44́ N, 118º37´ W) at Pendleton, OR were established in 1931 on a site broken from a shrub–grassland or sagebrush–grassland steppe with Idaho fescue (Fes-
tuca idahoensis), Bluebunch wheatgrass (Agropyron spicatum) and Sandberg bluegrass (Poa secunda) as the dominant species in the mid-1880s, and had already been farmed for circa 50 yr (Rasmussen and Smiley, 1997). Th e soil is a Walla Walla silt loam (coarse-silty, mixed, superactive, mesic Typic Haploxeroll) developed on loess overlying basalt and is well drained. Th e crop residue plots under moldboard plow tillage (CT) were selected for these simulations. Th ree wheat–fallow treatments selected were: (i) fall burn–no fertilizer added (FB), with straw burned in the fall and the soil plowed in the spring before the fallow summer for minimum residue return; (ii) fertilizer–90 kg N ha−1 applied to each wheat crop, with straw plowed in the spring of the summer fallow; and (iii) manure–22 Mg ha−1 wet manure (mixed with straw bedding) added before plowing in the spring of the fallow year (Rasmussen and Albrecht, 1998; Rasmussen and Smiley, 1997; Rickman et al., 2002). All three treatments used the same fallow methods of cultivation and rod-weeding.
Agronomy Journa l • Volume 103, Issue 1 • 2011 237
Th e three treatments represent various amounts of C inputs under well-drained silt loam soil and similar cropping rotation.
The CQESTR Model Description and Soil Organic Carbon Budget Algorithms
Th e CQESTR model (v. 2.0) was developed to evaluate the eff ect of agricultural management practices on short- and long-term SOM or SOC dynamics (Liang et al., 2009; Rickman et al., 2002). It is a process-based soil C balance model. Th e total SOC budget can be represented by Eq. [1], using units of dry weight per unit area within each soil layer.
SOM DOM S,l DS,l
R DR, A, DA,
C C C C
C C C C
1
,1 1
TOC ( ) ( )
( ) ( )
u
l
v w
m
m n
=
= =
= − + − +
− + −
∑
∑ ∑m n n
[1]
where TOC = total soil organic carbon; CSOM = carbon in the stable soil organic matter; CDOM = decomposed organic matter lost as carbon dioxide (CO2); CS, l = carbon in shoot residue l; CDS, l = carbon lost as carbon dioxide from decomposed shoot residue l; CR,m = carbon in root residue m; CDR, m = carbon lost as carbon dioxide from decomposed root residue m; CA,n = carbon in organic amendment n; CDA, n = carbon lost as carbon dioxide from decomposed amendment n; u, v, w = all applica-tions of organic materials from the initial time to the current day.
Th e CQESTR model computes biological decomposition rates of crop residue or organic amendments as they convert to SOM or SOC and is used for the fi eld-scale evaluation of SOC stocks (Liang et al., 2008; Rickman et al., 2002), operates on a daily time-step, uses readily available input data (Table 2) at the fi eld scale, and performs long-term (100-yr) simulations (Liang et al., 2009). Crop rotation, grain and residue, residue removal and
tillage information are required explicitly. Crop rotation, annual yields, and tillage information are organized in crop management fi les. Th ese consist of crop grain yields, shoot-to-grain ratios, dates of all operations (e.g., tillage, seeding, harvest, biomass addition, biomass removal, etc.), depth of tillage and the fraction of the soil surface covered, and eff ects of tillage on residue (e.g., fraction of pretillage residue weight remaining on the soil surface aft er each tillage). Residue consumption by macrofauna, deposition or loss of SOC at the soil surface, or the physical transfer between soil layers, are not accounted for in the CQESTR model.
Model Simulation Scenarios
In this study, CQESTR was used to simulate SOC dynamics for the LTE sites with various crop rotations under two tillage systems; actual tillage for each site and NT. Th e actual tillage management at each site was either conventional moldboard plow (CT), or stubble-reduced conventional tillage (CR). Since NT management was not present at each site, the actual manage-ment practices were used for CQESTR simulations but without tillage. Th e NT was simulated for each treatment and crop rota-tion for all the sites, since the inception of the experiment at each site. Actual annual grain and residue yields for each treatment at each site were used in NT simulation (assuming comparable yields throughout the period of simulation), with the resulting harvest of maize stover or wheat straw under tillage treatments being equivalent to each harvest rate. Although reduced N availability under NT due to N immobilization (Andraski and Bundy, 2008) and lower mineralization rates under NT are possible, no yield reductions were assumed since the simulations were for long periods of time (e.g., several decades) and no severe consequences due to the residue harvest were imposed.
Table 2. Location, mean annual precipitation (MAP) and temperature (MAT), experiment duration and sampling period, crop ro-tation, management practices, soil sampling depth, soil texture and drainage classes for the selected long-term experiment sites.
Site†Breton, AB Canada
(Breton plots)Champaign, IL (Morrow plots)
Columbia, MO (Sanborn Field)
Lethbridge, AB Canada(Lethbridge plots)
Pendleton, OR (Pendleton plots)
Location 53º07´ N 114º28´ W 40º06´ N 88º13´ W 38º57´ N 93º20´ W 49º42´ N 112º50´ W 45º44´ N 118º37´ WMAP, mm 547 940 973 402 420MAT, ºC 2.1 19 13 5 11Initiation year 1930 1876 1888 1911 1931Duration, yr‡ 60 134 122 99 79Earliest sample§ 1971 1904 1915 1910 1931Latest sample 1995 1993 1986 1990 2005Crop rotation¶ SW-F MM
M-OM-O-H/SO
MMWW
WSW-F
W-F
Management# CRStraw removal
Manure (8.8 Mg ha–1 yr–1)
CTResidue removal
before 1950Two fertility levels
CTResidue removal before 1955
FertilizerManure (13.4 Mg ha–1 yr–1)
CRStraw removal before 1943
Two fertility levels
CTResidue burning
90 kg N ha–1
Manure (11 Mg ha–1 yr–1)Sampling depth, cm
0–15 0–15 0–20 0–15 0–3030–60
Soil texture†† L SiL SiL or L SCL SiLSoil drainage class Well drained Moderately drained Moderately drained Well drained Well drained† AB, Alberta; IL, Illinois; MO, Missouri; OR, Oregon.‡ Refers to the duration time period for reported data used in simulation.§ Earliest soil sample does not necessarily occur at the initiation of an experiment.¶ Crop rotation abbreviations: F, fallow; M, maize; MM, continuous maize; O, oat; H, clover; SO, soybean; W, wheat; WW, continuous wheat. “-”, separates years, and “/” separates crop change during the experiment life time.# Tillage abbreviations: CR, reduced cultivation and rod-weeding; CT, conventional tillage.†† Texture abbreviations: C, clay; L, loam; S, sand; Si, silt.

238 Agronomy Journa l • Volume 103, Issue 1 • 2011
Th e simulation of the NT at Lethbridge Plots assumed aver-age spring wheat yields of 1.00 and 2.10 Mg ha−1 and 1.71 and 3.63 Mg ha−1 of straw for control (no fertilizer) and fertilized plots, respectively, from 1911 to 1991. At Breton, average spring wheat yields of 1.20, 1.93, and 2.05 Mg ha−1 and 1.79, 2.89, and 2.91 Mg ha−1 of straw for control, fertilized, and manure plots, respectively, were assumed from 1935 to 1994. Average winter wheat yields of 2.72, 3.83, and 4.33 Mg ha−1 and straw yields of 5.12, 7.98, and 7.97 Mg ha−1, for the fall-burn, fertilized, and manure plots, respectively, were assumed for NT at Pendleton from 1931 to 2005. For Morrow Plots, average grain yields of 2.24, 2.66, and 4.22 Mg ha−1 and residue yields of 2.09, 2.59, and 3.94 Mg ha−1 were used for MM, M-O, M-O-H rota-tions, respectively, from 1889 to1988. In the NT simulation of the WW under fertilizer and manure scenarios, average grain yields of 1.85 and 1.86 Mg ha−1 and straw yields of 4.07 and 4.05 Mg ha−1, respectively, were assumed for 100-yr at Sanborn Field. Average maize grain yields of 1.41 and 2.89 Mg ha−1 and stover yields of 2.34 and 3.67 Mg ha−1 were used for the fertil-ized and manure plots, respectively, from 1888 to 1988.
Th e residue harvest scenarios were denoted NT-25, NT-50, NT-75, and NT-90, representing conditions where 25, 50, 75, and 90% (for the treatments where the crops were harvested by hand in early inceptions of the plots until combine harvesters were introduced) of the crop residue was removed. Simulations of 25, 50, and 75% removal of the total aboveground biomass were assumed for the NT scenarios where residue was removed since the inception of each LTE. For Brenton Plots, straw production ranged from 1.51 to 5.04 Mg ha−1 (mean ± SE = 3.36 ± 0.37), and 2.81, 1.81, and 0.94 Mg ha−1 of straw were assumed for 25, 50, 75%, respectively. For Lethbridge Plots, straw production ranged from 2.52 to 4.57 Mg ha−1 (mean ± SE = 3.34 ± 0.39), and 3.84, 2.56, and 1.28 Mg ha−1 of straw were assumed for 25, 50, 75% removals, respectively. Root biomass additions were assumed at 0.28 and 0.31% of straw and stover yields as was reported by Buyanovsky and Wagner (1997). Stover produc-tion at Sanborn Field ranged from 3.70 to 6.65 Mg ha−1; 2.88, 1.38, 0.69 Mg ha−1 for fertilized treatment; and 5.50, 3.67, and 1.83 Mg ha−1 for manure treatment were assumed for 25, 50, 75% removal, respectively. No residue removal was considered for control, bale, or burned treatments. Th e NT or NT-90 scenario represents the baseline (i.e., initial and current SOC level of each plot if only tillage practice changed), a condition where the crop residues were removed during residue removal phase and retained in the fi eld later or currently removed (i.e., Breton Plots).
Estimation of Soil Organic Matter Maintenance Requirement for Breton Plots
Mean annual change of simulated SOC (g kg−1 yr−1) stock for Breton Plots was calculated as the diff erence between fi nal SOC, for each straw removal rate, and initial as follows:
SOC (SOC SOC )/f i tΔ = −
[2]
where SOCf = calculated fi nal soil organic carbon content (g kg−1); SOCi = calculated initial soil organic carbon con-tent (g kg−1); t = number of years. Minimum crop residue and organic amendments required to prevent SOC decline were calculated for NT scenario for fertilized and manure treatments.
Statistical ProceduresLinear regression (PROC REG) and Pearson correlation (PROC
CORR) procedures were used to estimate parameters and statistical signifi cance (SAS Institute, 2003). Th e ANOVA was used to com-pute a standard error of the mean. Mean square deviation (MSD) statistics were also used to evaluate the predictive performance of the model against measured data. According to Gauch et al. (2003), the MSD is partitioned into three components: nonunity slope (NU), lack of correlation (LC) or scatter, and squared bias (SB). All three components relate to terms of the linear regression equation (Y = a + bX) and the regression coeffi cient (r2).
In a set of observed (X) and simulated values (Y), the MSD is defi ned as
2MSD ( ) / for 1, 2, ,n nX Y N n N= − = …∑ [3]
Th e fi rst component of MSD, nonunity (NU), measures the degree of rotation of the regression line and is defi ned as
2 2NU (1 ) /nb x N= − ×∑ [4]
where b is the slope of the least-square regression of Y on X,2/n n nb x y x=∑ ∑ [5]
where XXx nn −= , and YYy nn −= . Th e second component, lack of correlation or scatter (LC), is calculated as
2 2LC (1 ) /nr y N= − ×∑ [6]
where r2 is the coeffi cient of determination ∑ ∑∑ )/()( 222nnnn yxyx .
Th e third component (SB), gives a measure of the inequality between the two means X and Y (Gauch et al., 2003).
2SB ( )X Y= − [7]
RESULTS AND DISCUSSIONPerformance of the CQESTR Model
Regression analysis of 184 pairs of simulated and observed SOC values were closely related (r2 = 0.94) with slope not signifi cantly (P < 0.0001) diff erent from 1 (Fig. 1). Th is was also supported by a high Pearson correlation coeffi cient (r = 0.98, data not shown) and small MSD (3.32). Furthermore, predictive performance of CQESTR was illustrated by the small calculated residuals for the majority of the sites except for the Morrow Plots and Sanborn Field where the highest devia-tions from measured values were predicted. Th e contributing components of the MSD were in the following order: scatter (LC = 2.57 or 78% of MSD) > rotation (NU = 0.41 or 12%) > translation (SB = 0.34 or 10% of MSD). Th e higher LC con-tribution to the MSD was due to underestimation of measured SOC stocks by 2.2 g kg−1 (18%) for 1987 sampling in a fertil-ized WW treatment aft er straw was returned at Sanborn Field, underestimation by 6.16 g kg−1 (20%) under M-O-H rota-tion with manure application, and overestimation by 4 g kg−1 (18%) with stover removal in early 1950s at Morrow Plots. Th e correlation between simulated and observed SOC stocks for

Agronomy Journa l • Volume 103, Issue 1 • 2011 239
the majority of values was high, despite underestimation or overestimation of SOC stocks for these two sites.
Impact of Tillage and Straw Removal on Soil Organic Carbon Dynamics
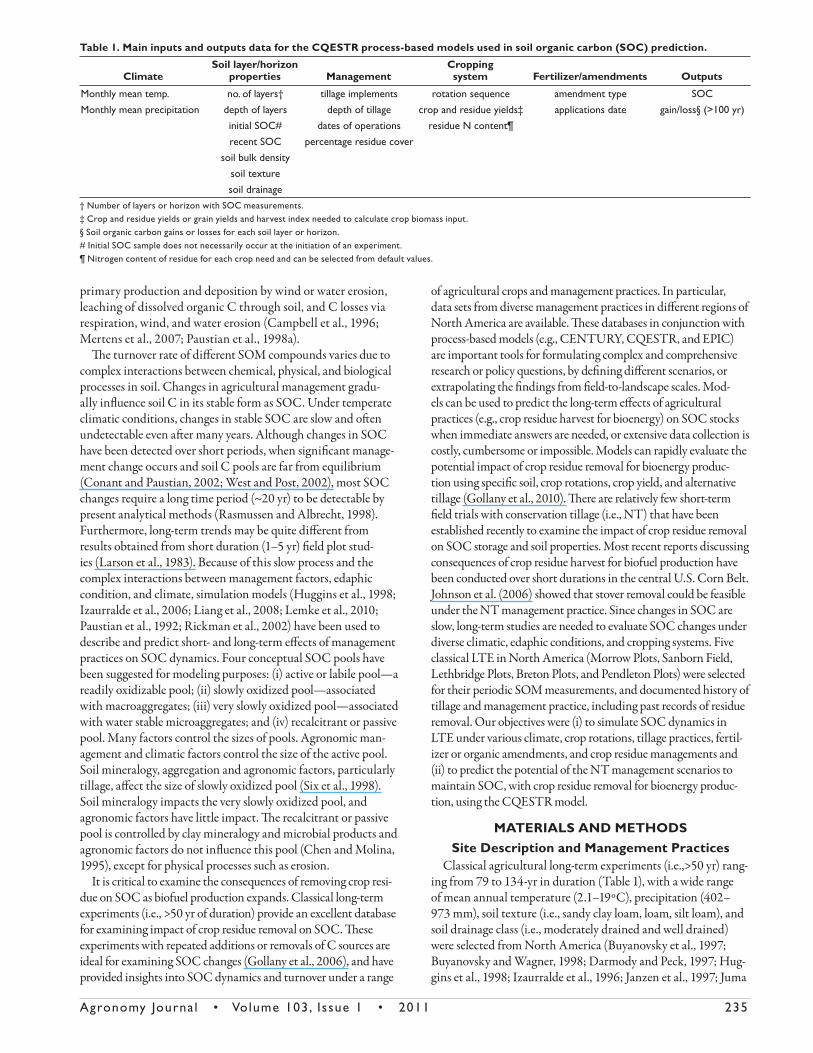
At Lethbridge SOC stocks decreased sharply aft er converting native grassland to production agriculture (Fig. 2). Th e observed SOC stocks in the top 15 cm decreased by 1.8 g SOC kg−1 at a rate of 0.027 g SOC kg−1 yr−1 for SW-F under CR management system in the baled plots from 1922 to 1943 (data not shown). Th e observed SOC stocks for SW-F with supplemental N and P fertil-ization and straw baling until 1943 decreased by 0.06 g SOC kg−1, at a rate of 0.001 g SOC kg−1 yr−1 in this sandy clay loam soil. Predicted SOC stocks followed the same pattern as the observed values. Th e CQESTR model predicted 8% losses for both fertil-ized (Fig. 2) and baled (data not shown) treatments. Th e soils under these systems appear to have approached a new steady state specifi c to the system constraints (Janzen et al., 1997). Th e simu-lated NT practice increased SOC stocks in the top 15-cm depth. However, the predicted SOC stocks decreased by 0.19, 0.48, and 0.82 g SOC kg−1 with straw removal at 25, 50, and 75%, respec-tively, over 68 yr of NT practice. A 50 or 75% straw removal at this location would likely have had a detectable eff ect on SOC stocks even with fertilization under NT practices. Previous estimates have shown that a small amount of straw removal, at 22% of total residue produced for 50 yr, had no measurable eff ect on C inputs in a fallow–wheat–wheat rotation, on a fertile clay Udic Boroll, in the subhumid region of Saskatchewan (Lemke et al., 2010). It would take considerable time before the eff ects of 25% straw removal could be detected; however, straw removal at 50% would likely have a detectable eff ect on the SOC stocks, and removing 75% of the straw should defi nitely be measurable. Lafond et al. (2009) also found no signifi cant diff erence in SOC stocks for a clay soil, aft er 50 yr of <40% straw removal in a fallow–spring wheat–spring wheat rotation. However, CQESTR predicted 4.47 g SOC kg−1 losses, in the top 5 cm of a loamy sand soil in the Mid-Coastal plain region of South Carolina, during 23 yr of conservation tillage with 66% stover removal (Gollany et al., 2010). Th e eff ect of biomass removal on SOC change will not only depend on the amount of C input, but also on the initial SOC content of the soil (Janzen et al., 1998), type of residue, and climate.
Impact of Fertilizer, Manure, Tillage, and Continuous Straw
Removal on Soil Organic Carbon Dynamics
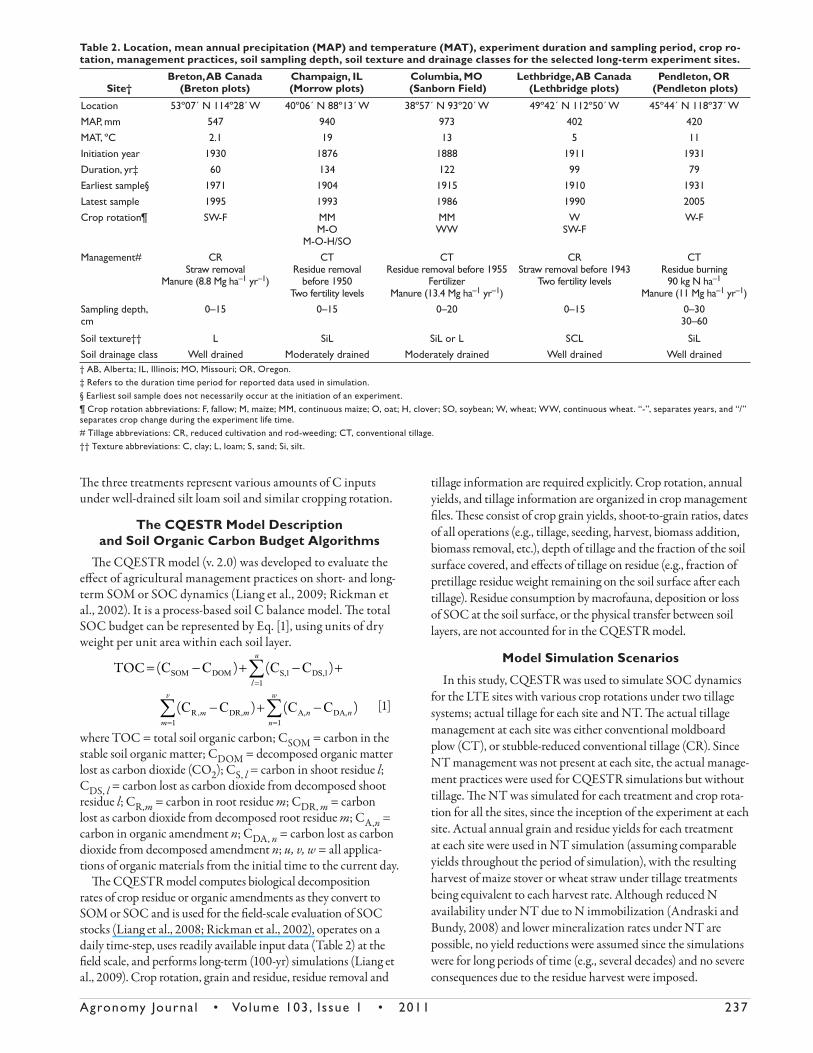
Th e loss of SOC aft er converting native forest to production agriculture at Breton Plots was observed, and predicted very well by the CQESTR model for the SW-F rotation with continuous straw removal and without fertilizer addition (Fig. 3a). From 1937 to 1979, observed SOC stocks decreased from 12.88 to 10.96 g SOC kg−1 in the unfertilized control plots. Th e loss of 1.92 g SOC kg−1 in SOC stocks most likely was due to both low C input returned from SW-F rotation with low straw produc-ing spring wheat crop and oxidation during intensive tillage, in addition to erosion aft er conversion from forest to agriculture land. Izaurralde et al. (1996) attributed the decline in SOC stocks to the tillage practice and the associated SOC losses with erosion in the unfertilized plot. By 1995, fertilizer and manure addi-tion increased the SOC stocks to 15.49 and 16.50 g SOC kg−1,
respectively, compared to observed SOC stocks without fertilizer (10. 96 g SOC kg−1) under CR system. Th e increase in SOC stock for the fertilized and manure plots were 1.74 and 2.75 g SOC kg−1 under CR system, respectively. Th e model predicted a decrease in SOC stock by 0.11 g SOC kg−1 in the unfertilized plots even with the proposed NT management scenario (Fig. 3a). Th is is in agreement with Lemke et al. (2010) who concluded that adoption of NT with straw removal without proper fertilization will not increase SOC signifi cantly. Predicted SOC stocks for fertilized
Fig. 1. Comparison of simulated and observed soil organic carbon (SOC) stocks for the classical long-term experiment sites in North America under diverse soil types, climate, and crop and residue management, used in CQESTR evaluation. The linear fit of simulated vs. observed SOC explained 94% of the variation (P < 0.0001), had a slope of 0.94. †Significant at the 0.0001 probability level.
Fig. 2. Simulated and observed soil organic carbon (SOC) dynamics in the 0- to 15-cm soil depth for spring wheat–fallow (SW-F) rotation with fertilizer (45 g N and 20 g P kg–1) under reduced cultivation and rod-weeding (CR). Simulated no-tillage (NT) with straw removals at 90% before 1943, and 25 (NT-25), 50 (NT-50), and 75% (NT-75) straw removal scenarios at Lethbridge Plots in Alberta, Canada. The symbols are measured values and the lines are simulations from the CQESTR model. Straw was baled during harvest before 1943, and retained afterward.
240 Agronomy Journa l • Volume 103, Issue 1 • 2011
plots decreased by 0.0091 g SOC kg−1 under CR, however, straw return at ~3.8 ± 0.4 Mg ha−1 and NT management since 1936 could have maintained SOC in this type of soil at the initial SOC level in the manure plot. From 1972 to 1995, predicted SOC stocks increased by 0.23 g SOC kg−1 with manure application under NT management (Fig. 3b). Th e simulation results suggest that under fertilized treatment changing to NT would not be expected to improve SOC stocks in this soil appreciably unless C input increased either through manure application or crop inten-sifi cation. Th e slow rate of SOC stock decline under unfertilized treatment was caused by a change in land use, erosion, and contin-uous straw removal since the 1930s. Th is can be explained by the compiled data from the region (southern Saskatchewan) indicating that residue production from precultivated grassland (2300 kg C ha−1 yr −1) was greater than for corresponding wheat (1426 kg C ha−1 yr −1) production systems (van Veen and Paul, 1981).
From 1972 to 1995, in the manure plots under the NT man-agement scenario simulated SOC stocks increased by 0.017 g SOC kg−1 at a rate of 0.001 g SOC kg−1. Manure application has been known to sustain or increase SOC stocks (Tester, 1990; VandenBygaart et al., 2003). Th e predicted slow rates of SOC stock increase even under NT was attributed to continuous straw removal and limited biomass input from SW-F rotation. Th e pre-dicted SOC stock indicates that most of the annual SOC inputs
from the current crop are in the labile pool and are oxidized dur-ing the fallow season, with NT management implementation. Simulated straw removal of 25 and 50% over 60 yr increased SOC stocks by 0.30 and 0.13 g SOC kg−1 in the manure plots under NT, respectively, while simulated NT with 75% residue removal decreased SOC stocks by 0.18 g SOC kg−1 (Fig. 3b).
Impact of Straw Burning, Fertilizer, Tillage, and Manure on Soil Organic Carbon Dynamics
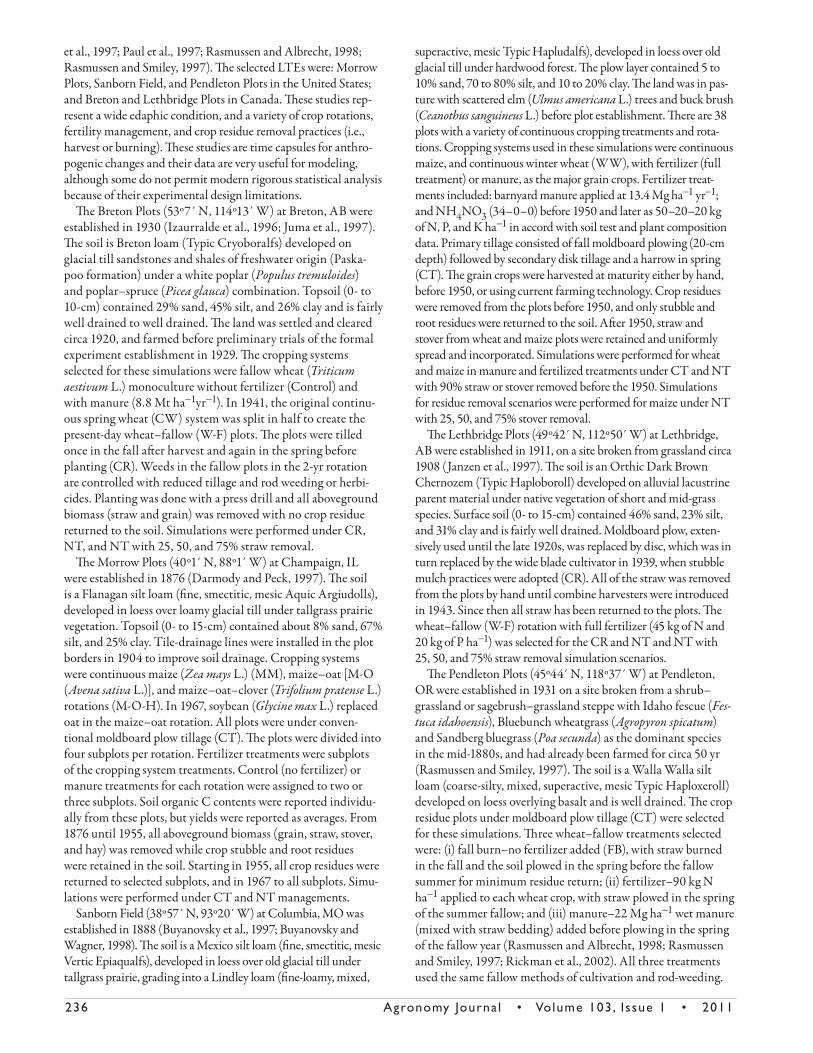
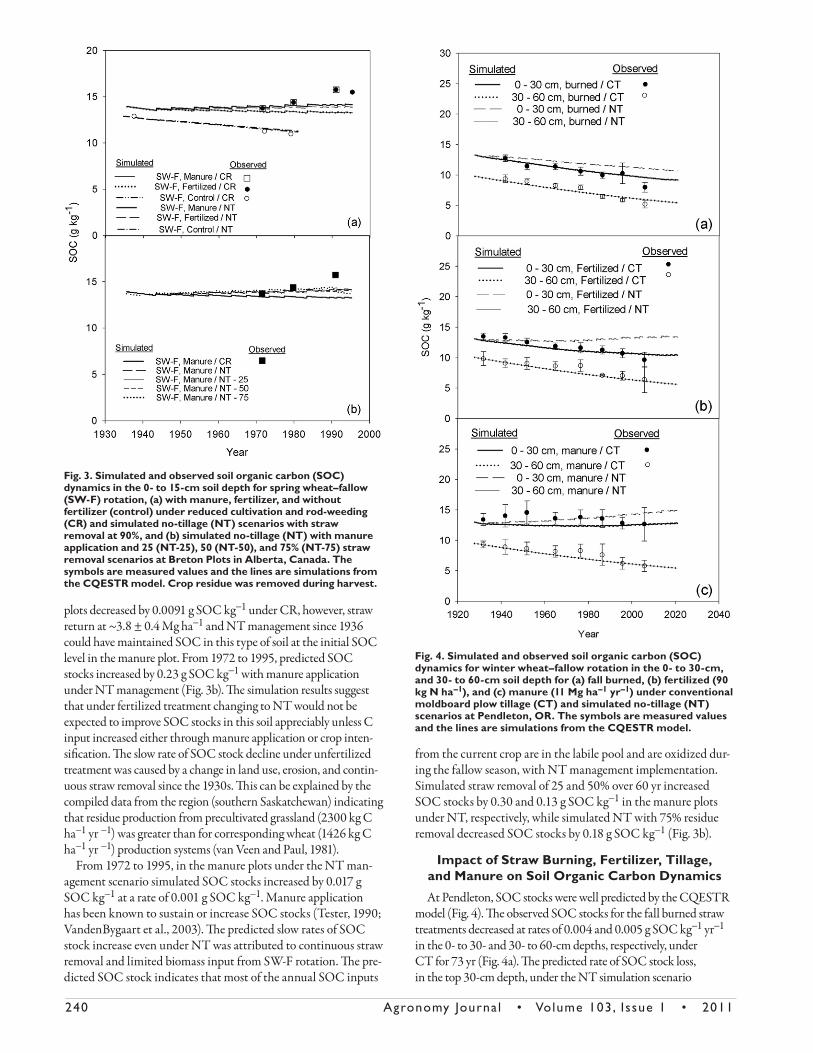
At Pendleton, SOC stocks were well predicted by the CQESTR model (Fig. 4). Th e observed SOC stocks for the fall burned straw treatments decreased at rates of 0.004 and 0.005 g SOC kg−1 yr−1 in the 0- to 30- and 30- to 60-cm depths, respectively, under CT for 73 yr (Fig. 4a). Th e predicted rate of SOC stock loss, in the top 30-cm depth, under the NT simulation scenario
Fig. 3. Simulated and observed soil organic carbon (SOC) dynamics in the 0- to 15-cm soil depth for spring wheat–fallow (SW-F) rotation, (a) with manure, fertilizer, and without fertilizer (control) under reduced cultivation and rod-weeding (CR) and simulated no-tillage (NT) scenarios with straw removal at 90%, and (b) simulated no-tillage (NT) with manure application and 25 (NT-25), 50 (NT-50), and 75% (NT-75) straw removal scenarios at Breton Plots in Alberta, Canada. The symbols are measured values and the lines are simulations from the CQESTR model. Crop residue was removed during harvest.
Fig. 4. Simulated and observed soil organic carbon (SOC) dynamics for winter wheat–fallow rotation in the 0- to 30-cm, and 30- to 60-cm soil depth for (a) fall burned, (b) fertilized (90 kg N ha–1), and (c) manure (11 Mg ha–1 yr–1) under conventional moldboard plow tillage (CT) and simulated no-tillage (NT) scenarios at Pendleton, OR. The symbols are measured values and the lines are simulations from the CQESTR model.

Agronomy Journa l • Volume 103, Issue 1 • 2011 241
was about half (0.001 g SOC kg−1 yr−1) of that under CT (0.002 g SOC kg−1 yr−1). Th e predicted rate of SOC stock loss under both the NT and CT systems was 0.005 g SOC kg−1 yr−1, in the 30- to 60-cm depth. Th e decline of SOC stocks in the subsoil layer could be due to limited contribution of root and root exudates to SOC stocks in the subsoil under W-F in the semiarid region of Pacifi c Northwest (PNW). We expect a decline of SOC stocks in the soil profi le as the result of cultivation and land use changes from native grassland to monoculture W-F cropping system.
Th e observed SOC stocks also decreased at rates of 0.006 and 0.007 g SOC kg−1 yr−1 in the 0- to 30- and 30- to 60-cm depths, respectively, for the fertilized (90 kg N ha−1) plots under CT for 73 yr (Fig. 4b). Decreases of SOC between 20 and 40% aft er cultivation began have been documented previously in semiarid lands (Follett et al., 1997; Janzen et al., 1998; Peterson et al., 1998). Th e rate of decline of SOC stocks in the subsoil was greater in fertilized than fall burn plots (0.007 vs. 0.005 g SOC kg−1 yr−1). Simulated SOC stocks followed the same trend for both soil depths. In the topsoil, the predicted SOC stock approached the initial SOC level aft er 81-yr of fertilization and NT management. Th is increase in SOC stock under NT is attributed to an increase in the labile and slowly oxidized SOC pools that responded to the change in management practice.
In the semiarid region of PNW, application of manure at 11 Mg ha−1 yr−1, under CT, in the W-F system, only maintained SOC stock in the top 30-cm depth (Fig. 4c). Collins et al. (1992) reported that both microbial biomass and enzyme activity were correlated with the total amounts of organic C added as manure in these plots in eastern Oregon. Simulated NT and CT SOC stocks, in the 30- to 60-cm depth, decreased by 0.36 g SOC kg−1, at a rate of 0.004 g SOC kg−1 yr−1. Aft er 73 yr of manure applica-tion under the W-F system, CQESTR predicted an increase in SOC stocks from 12.80 to 14.58 g SOC kg−1, at a rate of 0.002 g SOC kg−1 yr−1 for the top 30-cm depth under the simulated NT scenario. Th e CQESTR model predicted that SOC stock would approach the initial value in the top 30 cm, aft er 41 yr of NT and manure application at 11 Mg ha−1 yr−1 under W-F rotation. Th is is about half the time it takes for fertilized treatments to reach the initial SOC stock levels. A decline in SOC stock at a rate of 0.004 g SOC kg−1 yr−1 was predicted for the 30- to 60-cm depth, even with manure application under the simulated NT scenario. Th e increase in SOC stocks in the topsoil, with manure application under W-F in the NT scenario, could be attributed to increases in both labile and slowly oxidizable SOC pools resulting from the management practice change to NT and incorporation of particulate organic matter into macroaggregates.
Th e CQESTR model predicted dynamics of SOC at Sanborn Field well with straw removal (Fig. 5a). Th e rapid decline in SOC was caused by a change in land use, conversion from native tallgrass prairie and forest to crop land, and 90% straw removal at harvest until the 1950s. Observed and simulated SOC stocks decreased in both manure and fertilized plots until aft er straw was retained, however, the observed SOC stock decline was more pronounced in the fertilized plots than in the manure plots. Dur-ing the fi rst 23 yr, observed SOC stocks in the 0- to 20-cm depth decreased by 1.51 and 1.86 g SOC kg−1 with manure and fertil-izer under CT, respectively. Only when the straw was retained in the 1950s did SOC stocks increase. Th e upward trends in SOC during the period when straw was retained on the land, for both
manure and fertilized treatments, were simulated by CQESTR. In 1987, the simulated and observed SOC stocks were 10.07 and 12.29 g SOC kg−1 for the fertilized plot under the CT, respec-tively. Th e model underestimated SOC stock at this sampling time, with straw retained in the fertilized plots. Th e reason for this discrepancy is not understood; however, it can be attributed to either some factor that cannot be accounted for in the model, or perhaps error in sample collection or handling. Th e predicted SOC stocks in the fertilized plots under NT scenario approxi-mated the observed SOC stocks in 1987 under CT. Th is indicates that it is possible that the sample contained some particulate
Fig. 5. Simulated and observed soil organic carbon (SOC) dynamics in the 0- to 20-cm soil depth for (a) continuous winter wheat (WW) with fertilizer or manure and no-tillage (NT) with straw removals at 90%, (b) continuous maize (MM) with fertilizer or manure under conventional moldboard plow tillage (CT) and simulated NT with stover removals at 90% before 1950, and (c) MM with fertilizer or manure, and simulated NT with stover removal at 25 (NT-25), 50 (NT-50), 75% (NT-75), and 90%, straw removal scenarios at Sanborn Field in Missouri. The symbols are measured values and the lines are simulations from the CQESTR model. Crop residue was removed during harvest before 1950, and retained afterward.

242 Agronomy Journa l • Volume 103, Issue 1 • 2011
organic matter that was measured as total SOC, which CQESTR does not account for in SOC stocks simulated. Th e simulated SOC losses, with 90% straw removal during fi rst 23 yr in the manure plots, were 4 and 6% under the NT and CT scenarios, respectively. Aft er 71 yr of WW cropping system, SOC stocks reached a steady state in this soil with manure application under this management and climatic condition.
Impact of Fertilizer, Manure, Tillage, and Stover Removal on Soil Organic Carbon Dynamics
At Sanborn Field, observed SOC stock declines for continuous maize (MM) under CT was predicted very well by the CQESTR model (Fig. 5b). Continuous loss of SOC stock was observed
under 90% stover removal in the fertilized plots. Th e decline in SOC stocks from long-term maize stover removal under CT has been documented in other studies in Minnesota (Allmaras et al., 2004; Bloom et al., 1982; Wilts et al., 2004), Iowa (Larson et al., 1972), Wisconsin (Vanotti et al., 1997), Indiana (Barber, 1979), Ohio (Blanco-Canqui et al., 2006a), and Michigan (Vitosh et al., 1997). Th e observed SOC losses in the 0- to 20-cm depth were 2.31 g SOC kg−1 (16%) and 3.46 g SOC kg−1 (32%) for the manure and fertilized treatments by 1988, respectively. Both manure and fertilized plots lost SOC during stover removal phase; however, the observed rate of SOC loss in the top 20 cm for the fertilized plots (0.0044 g SOC kg−1 yr−1) was twice that in the manure plots (0.0022 g SOC kg−1 yr−1). Th e predicted SOC stocks followed the same trend. By 1988, the simulated and observed SOC stocks were 7.00 and 7.31 g SOC kg−1 for the fertil-ized treatment under CT, respectively. Th e predicted SOC stocks in the fertilized MM plots were 7.00 and 11.01 g SOC kg−1 under the CT and the NT scenarios, respectively, showing an increase in the top 20 cm under NT. In a NT system aboveground crop residue will primarily stay aboveground, only limited amounts will be transported belowground by macrofauna activity and dissolved C leaching into the soil. In contrast, when crop residue is tilled into the soil under CT, it changes the position of the source C (Allmaras et al., 1996; Staricka et al., 1991) and the decomposi-tion dynamics (Burgess et al., 2002). Ghidey and Alberts (1993) reported incorporation of residue increased annual mass loss by 41, 66, and 78% for the above-surface, surface, and buried maize residue compared to initial amount added, respectively. Th e simulated SOC stock values aft er 71 yr of the NT management were 11.01 and 20.39 g SOC kg−1 for the fertilized and manure NT scenarios, respectively. Th e predicted SOC stocks increased by 5.58 g SOC kg−1 at a rate 0.005 g SOC kg−1 yr−1 during 71 yr of the MM with manure management under NT. Simulated NT with stover removal of 25, 50, and 75% over 71 yr increased SOC stocks by 5.71, 5.31, and 4.72 g SOC kg−1 in the manure plots, respectively, but indicated decreases of 0.59, 0.72, and 1.04 g SOC kg−1 in the fertilized maize plots (Fig. 3c). Th is indicates that we expect SOC losses even under NT with stover removal in the fertilized plots at this site, and only manure addition is expected to maintain or increase SOC with residue removal.
At Morrow Plots, CQESTR captured the decline in SOC stocks well with 90% stover removal from 1876 until 1955 (Fig. 6). Th e observed SOC stock for the MM decreased at a rate of 0.003 g SOC kg−1 yr−1, in the 0- to 15-cm soil depth, because of cultivation and stover removal (Fig. 6a). By the mid-1950s, the observed SOC stocks under MM in the manure and control plots were decreased by 0.93 and 5.5 g SOC kg−1, respectively. Th e management change aft er 1955 increased observed SOC stocks, and this was also simulated by CQESTR. Th e measured (19.31 g SOC kg−1) and simulated (19.35 g SOC kg−1) SOC stocks were greater in manure plots than measured (15.30 g SOC kg−1) or simulated SOC stocks in the control plot under CT system. Th e observed SOC stocks decreased from 21.10 to 15.30 g SOC kg−1 between 1915 and 2004 under maize in the control plot. Th e total observed SOC losses were 2.2 and 5.8 g SOC kg−1 for the manure and control plots during the 89 yr of continuous maize under CT, respectively. Th e predicted 5.79 g SOC kg−1 loss in SOC stocks at a rate of 0.003 g SOC kg−1 yr−1 in the control plot under the NT scenario followed the same trend as the observed
Fig. 6. Simulated and observed soil organic carbon (SOC) dynamics in the 0- to 15-cm soil depth for (a) continuous maize (MM), (b) maize–oat (M-O), and (c) maize–oat–hay (M-O-H), with manure or without fertilizer (control) under conventional moldboard plow tillage (CT) and simulated no-tillage (NT) scenarios at Morrow in Champaign, IL. The symbols are measured values and the lines are simulations from the CQESTR model. Crop residue was removed at 90% during harvest before 1955, and retained afterward.
Agronomy Journa l • Volume 103, Issue 1 • 2011 243
values. Th e simulated SOC stocks in the control plots increased by 0.94 g SOC kg−1 (6%) from the late 1970s to 2004, with residue retention under NT system. Th e predicted SOC stocks declined with 90% residue removal under the NT scenario even with manure application; however, stover retention and manure application increased SOC stocks by 24% in the next 40 yr at a rate of 0.006 g SOC kg−1 yr−1, starting in the late 1950s and continuing through the 1990s. Th e simulated SOC stocks in the manure plots increased by 1.12 g SOC kg−1 during the experi-mental period, and by 4.04 g SOC kg−1 from the late 1970s to 2004, with stover retention under NT system. Stover removal at 50 and 25% increased SOC stocks by 1.48 and 4.13 g SOC kg−1, respectively, while 75% stover removal decreased SOC stocks by 2.2 g SOC kg−1 under NT and manure application since 1905 in the MM cropping system (data not shown). A decrease in SOC can reduce nutrient availability and consequently reduce crop yield if supplemental fertilizer is not added to replace nutrients lost with residue removal (Blanco-Canqui and Lal, 2009; Larson, 1979; Wilhelm et al., 2004). Fronning et al. (2008) suggested use of C amendments such as manure, compost, or cover crops to replace C removed with the maize stover, to maintain or increase SOC levels.
Impact of Crop Rotation, Tillage, and Residue Removal on Soil Organic Carbon Dynamics
Th e CQESTR model captured the decline in SOC stocks with 90% crop residue removal from 1876 until 1955 in maize–oat (M-O) rotation under CT at Morrow (Fig. 6b). Th e observed SOC stock decreased by 5.43 and 5.80 g SOC kg−1 in the manure and control plots, at a rate of 0.002 and 0.003 g SOC kg−1 yr−1, respectively, in the 0- to 15-cm soil depths, because of cultiva-tion and residue removal until 1955. Th e observed SOC stocks decreased from 28.67 to 23.24 g SOC kg−1 under the M-O with manure application which is lower than 5.80 g SOC kg−1 losses for the M-O control plot under CT system. Th e predicted SOC stocks followed the same trends as observed, although CQESTR underestimated SOC stocks in the manure plot. Th ere was a lag time in CQESTR response to return of crop residue in the control plot in the early 1950s, perhaps due to overestimation of decomposition rates of organic matter in this environment. Hug-gins et al. (1998) suggested that factors in addition to C inputs to these plots were controlling management-induced variation in SOC stocks (i.e., SOC decay rates). Th e reason for the discrep-ancy between simulated and observed SOC values from the M-O rotation with manure application is unclear. Perhaps CQESTR underestimated the contribution of oat biomass to SOC stocks before the 1960s because specifi c site parameters were unknown and some values, such as residue or root/shoot ratio and N content of the oat residue were only estimated. Aft er 1967, when the oats was replaced by soybean, CQESTR predicted SOC well, perhaps because proper estimates of plant parameters were used for this crop in the CQESTR model.
Th e predicted SOC stock declined at a rate of 0.002 g SOC kg−1 yr−1 for 89 yr with 90% residue removal under the NT scenario even with manure application in the M-O rotation. In 1994, manure plots had higher SOC stock than control plots (e.g., 24.73 vs. 18.64 g SOC kg−1). Th e predicted SOC stocks increased by 0.96 g SOC kg−1 at a rate of 0.001 g SOC kg−1 yr−1 with residue retention in the late 1950s and continued through the 1990s under the NT scenario with manure application
under M-O at this site. Simulated residue removal at 25, 50, and 75% decreased SOC stocks by 0.37, 2.67, and 5.39 g SOC kg−1, respectively, under NT and manure application since 1905 in the M-O cropping system (data not shown).
Th e CQESTR model captured the SOC dynamic and decline in SOC stocks with 90% crop residue removal from 1876 until 1955 in maize–oat–hay (M-O-H) rotation under CT at Morrow (Fig. 6c). Th e rate of SOC decline under the M-O-H rotation with crop residue removal was less severe, especially for the manure treatment than the other rotations at this site. Th e observed SOC stock in the M-O-H rotation under CT decreased dur-ing the fi rst 49 yr, by 2.2 g SOC kg−1 in manure, and by 3.94 g SOC kg−1 in control plots, because of cultivation and 90% residue removal until 1955. Th e simulated SOC stocks also decreased by 5.4 g SOC kg−1, at a rate of 0.003 g SOC kg−1 yr−1 during 79 yr in the control plots under CT. Th e predicted SOC stocks increased by 6.33 g SOC kg−1 at a rate of 0.002 g SOC kg−1 yr−1 during 89 yr, with 90% residue removal up to the mid-1950s, and residue retention through the 1990s under the NT scenario only with manure application. Most of this increase came aft er leaving residue in the fi eld in the late 1950s. Only the 25% residue removal scenario increased SOC stocks, by 0.66 g SOC kg−1, while 50 and 75% residue removal decreased SOC stocks by 1.80 and 4.45 g SOC kg−1, respectively, under NT and manure application since 1905 in the M-O-H cropping system (data not shown).
Synthesis
Several classical long-term agricultural experiments from across North America, ranging from 79 to 134 yr in duration with a wide range of climate, soil texture, soil drainage class, and cropping systems were used to simulate SOC dynamics, and to predict the potential of NT management to maintain SOC stocks while removing crop residue. Th e CQESTR model successfully pre-dicted potential long-term eff ects of changes in management from CT to NT practices under diverse climate, edaphic conditions, fertility management, cropping systems, and crop residue removal practices (i.e., harvest or burning), providing insights on the pro-posed management option (i.e., establishing NT in the LTE) that were not feasible to answer current concerns about sustainability of SOM, and too costly to be obtained by fi eld measurements even if there were such long-term NT experiments.
Since the 1850s, converting native grasslands or forests to pro-duction agriculture has resulted in SOC losses. Many agronomic practices, especially before 1940, were not conducive to maintain-ing SOC (Allmaras et al., 1998). Crop residues were removed from fi elds during harvest (e.g., Breton, Lethbridge, and Morrow Plots, and Sanborn Field) and used for livestock feed and bedding, or were burned (e.g., Pendleton Plots) to control weeds. Th ere were few fertilizer inputs other than livestock and green manure to return nutrients removed by the harvest of grain and biomass before the 1950s (Allmaras et al., 1998). Crop residue removal or burning decreased SOC stocks at all locations and rates of decline were more severe under monoculture than under crop rotation and under control or unfertilized than fertilized treatments or with manure application especially during residue removal phase. Th e loss of SOC from the early 1900s until the mid-1950s, during residue removal phase at the Morrow Plots, ranged from 0.93 g SOC kg−1 (4%) in the continuous maize with the manure addition to 7.80 g SOC kg−1 (37%) in the control plots without

244 Agronomy Journa l • Volume 103, Issue 1 • 2011
fertilizer addition. However the rate of SOC loss declined in most of the plots aft er residue retention. By the early1980s, the M-O-H was the only treatment with SOC gain when residue was retained on the land since the late 1950s. Simulated SOC stocks under the NT scenario approached the initial SOC level aft er ~58 yr with manure application and residue retention in the M-O-H, and aft er ~82 yr of stover return in the MM rotation.
Th e loss of SOC in the WW rotation with fertilizer addition and 90% straw removal at Sanborn Field, was 17% (1.86 g SOC kg−1) from 1915 until the early 1960s, and decreased to 13% by 1987 with straw retained aft er the 1950s. Th e simulated SOC stocks in the WW rotation under the NT scenario approached the initial SOC stocks in the topsoil aft er ~ 45 yr of manure application with straw retention. During 71 yr of the MM and 90% stover removal until the 1950s, SOC stocks decreased by 16 and 32% with manure addition or fertilizer addition, respectively. Th e loss of SOC with stover removal was more severe in MM at Sanborn Field compared to the Morrow Plots. Th is illustrates that not enough biomass is produced or source C inputs added to balance the decomposition rate of the residue and maintain SOC stocks under the current CT management system at Sanborn Field compared to the Morrow Plots. However, the simulated CQESTR results under the NT scenario predicted that with manure applica-tion SOC stocks could approach the initial level in ~15 yr. Limited stover removal is possible under NT with manure addition man-agement at this site; however, care should be taken to maintain productivity and integrity of the soil structure.
Simulated NT with stover removal of 25, 50, and 75%, over 71 yr at Sanborn Field, increased SOC stocks in the manure plots, but decreased under NT in the fertilized maize plots. Th e CQESTR predictions indicate that SOC losses can be expected even under NT with stover removal in the fertilized plots, and only manure addition or cover crop is expected to maintain or increase SOC with residue removal.
In the semiarid region of PNW at Pendleton, 73 yr of W-F under CT system decreased SOC stocks in the topsoil of the fall straw burning and fertilized treatments, while manure application increased SOC stock by 1% only. Aft er 73 yr of manure application, CQESTR predicted ~14% increase in SOC stocks, at a rate of 0.002 g SOC kg−1 yr−1 for the topsoil under the simulated NT scenario. Simulated SOC stocks under the NT scenario approached the initial SOC level in the topsoil aft er ~41 yr of annual manure application at a rate of 11 Mt ha−1 yr−1, compared with ~81 yr of fertilization.
At Lethbridge with straw baling until 1943, SOC stocks in the W-F under CR management system with supplemental N and P fertilization decreased by 0.4% at a rate of 0.001 g SOC kg−1 yr−1 from 1922 to 1990. It seems that the rate of source C inputs from straw, roots, and root exudates is approximately equal to the rate of organic matter decomposition under cur-rent biomass inputs and management. Th e SOC stock has approached a steady state under the W-F rotation under CR management. Th e recalcitrant SOC pool is in a steady state with the current annual level of C inputs and much change in SOC is not expected in this system (i.e., SW-F rotation), unless annual biomass input into the system is increased in addition to straw return. Th e CQESTR model predicted SOC losses for fertilized treatments even under NT system. Although SOC stock increase was predicted under NT management
simulation, no straw removal is recommended for this site. Straw removal in this inherently low SOC sandy clay loam soil could adversely aff ect its soil properties and production capacity.
It was diffi cult to ascertain the eff ect of crop rotation on SOC as only one site had such an experiment. Th e M-O-H rotation was the only treatment at Morrow Plots that had a 0.93 g SOC kg−1 (4%) gain in the topsoil. Simulation results also indicated that only manure addition under M-O-H rotation and NT practice would increase SOC stock. Th is may be attributed to the amount of residues and biomass C inputs to the system. Wander et al. (1994) reported that long-term manure amendments increased soluble C, while cover crop increased more resistant C fractions. Th e increase in biological activity in response to manure application oft en can be explained by the increased SOC as the result of additional food source for soil biota, as well as improved soil structure, which allows for better air exchange and improve available water holding capacity (Hudson, 1994; Rawls et al., 2003; Olness and Archer, 2005). Soil enzyme activities are also higher in manure plots com-pared to fertilized plots (Fauci and Dick, 1994). Limited residue removal is possible under NT with manure addition management at this site; however, replacement of plant nutrients and a limit on traffi c in the fi eld could be necessary to avoid soil compac-tion and deterioration of soil structure from residue harvest and removal operations. Liang et al. (2008) estimated that a minimum of 4.6 Mg C ha−1 yr−1 of crop residue and organic amendment is required under current CT managements system to maintain SOC level at Morrow Plots. Th e CQESTR model predicted the minimum required C inputs including belowground biomass but without estimates of root exudates.
At Breton, aft er the loss of 15% of SOC stocks during 42 yr of straw removal practices, SOC stocks are approaching a steady state in the SW-F rotation under CR management without fertilization. Aft er 24 yr of straw removal practices, the SOC stock has increased by 20% at a rate of 0.008 g SOC kg−1 yr−1 with manure application. Th e steady state under the manure treatment was attributed to the rate of organic matter decomposition, which approximately equals that of C additions from manure, residue, roots, and root exudates (Izaurralde et al., 1996). Th e predicted SOC stocks increased 2% at a rate of 0.001 g SOC kg−1 yr−1 under NT with manure application.
Predicted SOC stocks decreased at Lethbridge and Breton Plots with straw removal at 75% under NT with fertilization. Th e 50 and 75% straw removal at these locations would likely have a detectable eff ect on SOC stocks even with fertilization under NT practices. At Breton, simulated straw removal of 25 and 50% over 60 yr increased SOC stocks in the manure plots under NT, while simulated NT with 75% straw removal decreased SOC stocks. A minimum of ~5 Mg SOC ha−1 yr−1 of straw and manure was required to prevent SOC stocks decline in the plots at Breton (Fig. 7).
Inclusion of fallow in the rotation (i.e., W-F) as in Pendleton or Breton reduced potential for NT management to maintain SOC level in the fertilized plots compared to WW at Sanborn Field. Very limited straw removal is only advisable under NT with manure application under W-F rotation. Manure and green manure or cover crop with intensifi ed crop rotation (i.e., M-O-H) reduced impact of residue removal on SOC stocks at Morrow Plots and Sanborn Field. Higher SOC stocks were

Agronomy Journa l • Volume 103, Issue 1 • 2011 245
found in all the manure treatments than fertilized treatments under CT and NT systems.
Maintaining SOC is not only a vital factor for sustaining soil functions and properties, but also for the health and sustainabil-ity of our global environment. Th e practical knowledge as well as the theoretical insights gained from LTE provided us with some essential tools to improve the sustainability and environmental quality of agroecosystems (Paustian et al., 1997). Large-scale residue harvest for bioenergy must be balanced with other criti-cal functions that agroecosystems provide, including nutrient and water cycling, and C sequestration, for the maintenance of soil productivity. Th e quantity of crop residue that can be sustainably harvested is directly infl uenced by several factors, including initial SOC stock of a particular soil, crop yield, crop rotation intensity, fi eld management practices (e.g., tillage type, manure application, fertilization, etc.), physical characteristics of the soil (soil type, slope, topography, erodibility index, etc.), and climate. Long-term fi eld data would be useful to validate SOC stocks modeling, especially under NT management practices, when addressing crop residue harvest scenarios. Applying the CQESTR model to generate predicted SOC values suggests that considering the specifi c agroecosystem and overall past manage-ment of the soil is of benefi t when determining how much, if any, residue can be removed without adversely impacting SOC stocks and associated soil health and sustainability.
ACKNOWLEDGMENTS
Technical assistance and data collection by Chris Roager and Karl Rinhart is gratefully acknowledged. The author thanks Dr. C. Walthall for his support to the modeling effort, and Dr. M. Liebig, ARS-Mandan and reviewers for helpful comments and suggestions. This publication is based on work supported by the U.S. Department of Agriculture–Agricultural Research Service under the ARS GRACEnet.
REFERENCESAllmaras, R.R., S.M. Copeland, P.J. Copeland, and M. Oussible. 1996. Spatial relations
between oat residue and ceramic spheres when incorporated sequentially by tillage. Soil Sci. Soc. Am. J. 60:1209–1216.
Allmaras, R.R., D.R. Linden, and C.E. Clapp. 2004. Corn-residue transformations into root and soil carbon as related to nitrogen, tillage and stover management. Soil Sci. Soc. Am. J. 68:1366–1375.
Allmaras, R.R., D.E. Wilkins, O.C. Burnside, and D.J. Mulla. 1998. Agricultural technology and adoption of conservation practices. p. 99–157. In F.J. Pierce and W.W. Frye (ed.) Advances in soil and water conservation. Sleeping Bear Press, Chelsea, MI.
Andraski, T.W., and L.G. Bundy. 2008. Corn residue and nitrogen source eff ects on nitrogen availability in no-till corn. Agron. J. 100:1274–1279.
Anex, R.P., L.R. Lynd, M.S. Laser, A.H. Heggenstaller, and M. Liebman. 2007. Potential for enhanced nutrient cycling through coupling of agricultural and bioenergy systems. Crop Sci. 47:1327–1335.
Balesdent, J., C. Chenu, and M. Balabane. 2000. Relationship of soil organic matter dynamics to physical protection and tillage. Soil Tillage Res. 53:215–230.
Barber, S.A. 1979. Corn residue management and soil organic matter. Agron. J. 71:625–627.Blanco-Canqui, H., and R. Lal. 2009. Corn stover removal for expanded uses reduces soil fertil-
ity and structural stability. Soil Sci. Soc. Am. J. 73:418–426.Blanco-Canqui, H., R. Lal, W.M. Post, R.C. Izaurralde, and L.B. Owens. 2006a. Rapid
changes in soil carbon and structural properties due to stover removal from no-till corn plots. Soil Sci. 171:468–482.
Blanco-Canqui, H., R. Lal, W.M. Post, R.C. Izaurralde, and L.B. Owens. 2006b. Corn sto-ver impacts on near-surface soil properties of no-till corn in Ohio. Soil Sci. Soc. Am. J. 70:266–278.
Bloom, P.R., W.M. Schuh, G.L. Malzer, W.W. Nelson, and S.D. Evans. 1982. Eff ect of nitro-gen fertilizer, and corn residue management on organic matter in Minnesota Mollisols. Agron. J. 74:161–163.
Burgess, M.S., G.R. Mehuys, and C.A. Madramootoo. 2002. Decomposition of grain-corn residues (Zea mays L.): A litterbag study under three tillage systems. Can. J. Soil Sci. 82:127–138.
Buyanovsky, G.A., J.R. Brown, and G.H. Wagner. 1997. Sanborn fi eld eff ect of 100 years of cropping on soil parameter. p. 205–226. In E.A. Paul et al. (ed.) Soil organic matter in temperate agroecosystems. Long-term experiments in North America. CRC Press, Boca Raton, FL.
Buyanovsky, G.A., and G.H. Wagner. 1997. Crop residue input to soil organic matter on San-born fi eld. p. 73–83. In E.A. Paul et al. (ed.) Soil organic matter in temperate agroecosys-tems. Long-term experiments in North America. CRC Press, Boca Raton, FL.
Buyanovsky, G.A., and G.H. Wagner. 1998. Changing role of cultivated land in the global car-bon cycle. Biol. Fertil. Soils 27:242–245.
Campbell, C.A., B.G. McConkey, R.P. Zentner, F.B. Dyck, F. Selles, and D. Curtin. 1996. Long-term eff ects of tillage and crop rotations on soil organic C and total N in a clay soil in southwestern Saskatchewan. Can. J. Soil Sci. 76:395–401.
Carter, M.R. 2002. Soil quality for sustainable land management: Organic matter and aggrega-tion interactions that maintain soil functions. Agron. J. 94:38–47.
Chen, H.H., and J.A.E. Molina. 1995. In search for the bioreactive soil organic carbon: Th e fractionation approaches. p. 343–350. In R. Lal et al. (ed.) Soils and global change. CRC/Lewis Publ., Boca Raton, FL.
Clapp, C.E., R.R. Allmaras, M.F. Layese, D.L. Linden, and R.H. Dowdy. 2000. Soil organic carbon and 13C abundance as related to tillage, crop residue, and nitrogen fertilization under continuous corn management in Minnesota. Soil Tillage Res. 55:127–142.
Collins, H.P., P.E. Rasmussen, and C.L. Douglas, Jr. 1992. Crop rotation and residue manage-ment eff ects on soil carbon and microbial dynamics. Soil Sci. Soc. Am. J. 56:783–788.
Conant, R.T., and K. Paustian. 2002. Spatial variability of soil organic carbon in grasslands: Implications for detecting change at diff erent scales. Environ. Pollut. 116:S127–S135.
Darmody, R.G., and T.R. Peck. 1997. Soil organic changes through time at the university of Illinois Morrow Plots. p. 161–169. In E.A. Paul et al. (ed.) Soil organic matter in tem-perate agroecosystems: Long-term experiments in North America. CRC Press, Boca Raton, FL.
Farrell, A.E., R.J. Plevin, B.T. Turner, A.D. Jones, M. O’Hare, and D.M. Kammen. 2006. Ethanol can contribute to energy and environmental goals. Science (Washington, DC) 311:506–508.
Fauci, M.F., and R.P. Dick. 1994. Soil microbial dynamics: Short and long-term eff ects of inor-ganic and organic nitrogen. Soil Sci. Soc. Am. J. 58:801–806.
Follett, R.F. 2010. Symposium: Soil carbon sequestration and greenhouse gas mitigation. Soil Sci. Soc. Am. J. 74:345–346.
Follett, R., E.A. Paul, S.W. Leavitt, A.D. Halvorson, D. Lyon, and G.A. Peterson. 1997. Car-bon isotope ratios of Great Plains soils in wheat–fallow systems. Soil Sci. Soc. Am. J. 61:1068–1077.
Fronning, B.E., K.D. Th elen, and D. Min. 2008. Use of manure, compost, and cover crops to supplant crop residue carbon in corn stover removed cropping systems. Agron. J. 100:1703–1710.
Gauch, H.G., J.T.G. Hwang, and G.W. Fick. 2003. Model evaluation by comparison of the model-based predictions and measured values. Agron. J. 95:1442–1446.
Ghidey, F., and E. Alberts. 1993. Residue type and placement eff ects on decomposition: Field study at model evaluation. Trans. ASAE 36:1611–1617.
Gollany, H.T., R.R. Allmaras, S.M. Copeland, S.L. Albrecht, and C.L. Douglas, Jr. 2006. Incorporated source carbon and nitrogen fertilization eff ects on carbon storage and soluble silica in a Haploxeroll. Soil Sci. 171:585–597.
Gollany, H.T., J.M. Novak, Y. Liang, S.L. Albrecht, R.W. Rickman, R.F. Follett, W.W. Wil-helm, and P.G. Hunt. 2010. Simulating soil organic carbon dynamics with residue removal using the CQESTR Model. Soil Sci. Soc. Am. J. 74:372–383.
Gollany, H.T., T.E. Schumacher, M.J. Lindstrom, P. Evenson, and G.D. Lemme. 1992. Topsoil depth and desurfacing eff ects on properties and productivity of a Typic Argiustoll. Soil Sci. Soc. Am. J. 56:220–225.
Graham, R.L., R. Nelson, J. Sheehan, R.D. Perlack, and L.L. Wright. 2007. Current and poten-tial U.S. corn stover supplies. Agron. J. 99:1–11.
Hill, J., E. Nelson, D. Tilman, S. Polasky, and D. Tiff any. 2006. Environmental, economic, and energetic costs and benefi ts of biodiesel and ethanol biofuels. Proc. Natl. Acad. Sci. USA 103:11206–11210.
Fig. 7. Annual change in simulated soil organic carbon (SOC) in relation to estimated mean annual total straw (in fertilized plots) or total straw plus manure (in manure plots) returned to the soil for 25, 50, 75, and 90% removal scenarios at Breton Plots in Alberta, Canada.
246 Agronomy Journa l • Volume 103, Issue 1 • 2011
Hudson, B.D. 1994. Soil organic matter and available water capacity. J. Soil Water Conserv. 49:189–194.
Huggins, D.R., G.A. Buyanovsky, G.H. Wagner, J.R. Brown, R.G. Darmody, T.R. Peck, G.W. Lesoing, M.B. Vanotti, and L.G. Bundy. 1998. Soil organic C in the tallgrass prairie-derived region of the Corn Belt: Eff ects of long-term crop management. Soil Tillage Res. 47:219–234.
Izaurralde, R.C., N.G. Juma, J.A. Robertson, W.B. McGill, and J.T. Th urston. 1996. Th e Breton classical plots. p. 351–361. In Powlson et al. (ed.) Evaluation of soil organic mat-ter models using existing long-term datasets. NATO ASI Ser. I., vol. 38. Springer-Verlag, Heidelberg.
Izaurralde, R.C., J.R. Williams, W.B. McGill, N.J. Rosenberg, and M.C. Quiroga Jakas. 2006. Simulation soil C dynamics with EPIC: Model description and testing against long-term data. Ecol. Modell. 192:362–384.
Janzen, H.H., C.A. Campbell, R.C. Izaurralde, B.H. Ellert, N.G. Juma, W.B. McGill, and R.P. Zentner. 1998. Management eff ects on soil C storage on the Canadian prairies. Soil Till-age Res. 47:181–195.
Janzen, H.H., A.M. Johnston, J.M. Carefoot, and C.W. Lindwall. 1997. Soil organic matter dynamics in long-term experiments in Southern Alberta. p. 283–296. In E.A. Paul et al. (ed.) Soil organic matter in temperate agroecosystems. Long-term experiments in North America. CRC Press, Boca Raton, FL.
Jenkinson, D.S., D.E. Adams, and A. Wild. 1991. Model estimates of CO2 emissions from soil in response to global warming. Nature (London) 351:304–306.
Johnson, J.M.F., R.R. Allmaras, and D.C. Reicosky. 2006. Estimating source carbon from crop residues, roots and rhizodeposits using the national grain-yield database. Agron. J. 98:622–636.
Juma, N.G., R.C. Izaurralde, J.A. Robertson, and W.B. McGill. 1997. Crop yield and soil organic matter trends over 60 years in a Typic Cryoboralf at Breton, Alberta. p. 273–281. In E.A. Paul et al. (ed.) Soil organic matter in temperate agroecosystems. Long-term experiments in North America. CRC Press, Boca Raton, FL.
Kim, S., and B. Dale. 2005. Life cycle assessment of various cropping systems utilized for pro-ducing biofuels: Bioethanol and biodiesel. Biomass Bioenergy 29:426–429.
Lafond, G.P., M. Stumborg, R. Lemke, W.E. May, C.B. Holzapfel, and C.A. Campbell. 2009. Quantifying straw removal through baling and measuring the long-term impact on soil quality and wheat production. Agron. J. 101:529–537.
Lal, R. 1997. Residue management, conservation tillage and soil restoration for mitigating greenhouse eff ect by CO2–enrichment. Soil Tillage Res. 43:81–107.
Lal, R. 2005. World crop residues production and implications of its use as a biofuel. Environ. Int. 31:575–584.
Lal, R. 2007. Biofuels from crop residues. Soil Tillage Res. 93:237–238.Lal, R., J.M. Kimble, R.F. Follett, and C.V. Cole. 1998. Th e potential of U.S. cropland to seques-
ter carbon and mitigate the greenhouse eff ect. Sleeping Bear Press, Ann Arbor, MI.Larson, W.E. 1979. Crop residue: Energy production or erosion control? J. Soil Water Conserv.
34:74–76.Larson, W.E., C.E. Clapp, W.H. Pierre, and Y.B. Morachan. 1972. Eff ect of increasing amounts
of organic residues on continuous corn: II. Organic carbon, nitrogen, phosphorus, and sulfur. Agron. J. 64:204–208.
Larson, W.E., J.B. Swan, and M.J. Shaff er. 1983. Soil management for semi-arid regions. Agric. Water Manage. 7:89–114.
Lemke, R.L., A.J. VandenBygaart, C.A. Campbell, G.P. Lafond, and B. Grant. 2010. Crop resi-due removal and fertilizer N: Eff ect on soil organic carbon in a long-term crop rotation experiment on a Udic Boroll. Agric. Ecosyst. Environ. 135:42–51.
Liang, Y., H.T. Gollany, R.W. Rickman, S.L. Albrecht, R.F. Follett, W.W. Wilhelm, J.M. Novak, and C.L. Douglas, Jr. 2008. CQESTR simulation of management practice eff ects on long-term soil organic carbon. Soil Sci. Soc. Am. J. 72:1486–1492.
Liang, Y., H.T. Gollany, R.W. Rickman, S.L. Albrecht, R.F. Follett, W.W. Wilhelm, J.M. Novak, and C.L. Douglas, Jr. 2009. Simulating soil organic matter with CQESTR (v. 2.0): Model description and validation against long-term experiments across North America. Ecol. Modell. 220:568–581.
Liebig, M.A., J.A. Morgan, J.D. Reeder, B.H. Ellert, H.T. Gollany, and G.E. Schumann. 2005. Greenhouse gas contributions and mitigation potential of agricultural practices in northwestern USA and western Canada. Soil Tillage Res. 83:25–52.
Linden, D.R., C.E. Clapp, and R.H. Dowdy. 2000. Long-term corn grain and stover yields as a function of tillage and residue removal in east central Minnesota. Soil Tillage Res. 56:167–174.
Lindstrom, M.J. 1986. Eff ects of residue harvesting on water runoff , soil erosion and nutrient loss. Agric. Ecosyst. Environ. 16:103–112.
Lindstrom, M.J., S.C. Gupta, C.A. Onstad, W.E. Larson, and R.F. Holt. 1979. Tillage and crop residue eff ects on soil erosion in the Corn Belt. J. Soil Water Conserv. 34:80–82.
Lynd, L.R., J.H. Cushman, R.J. Nichols, and C.F. Wyman. 1991. Fuel ethanol from cellulosic biomass. Science (Washington, DC) 231:1318–1323.
Mann, L., V. Tolbert, and J. Cushman. 2002. Potential environmental eff ects of corn (Zea mays L.) stover removal with emphasis on soil organic matter and erosion. Agric. Ecosyst. Environ. 89:149–166.
Maskina, M.S., J.F. Power, J.W. Doran, and W.W. Wilhelm. 1993. Residual eff ects of no-till crop residues on corn yield and nitrogen uptake. Soil Sci. Soc. Am. J. 57:1555–1560.
Mertens, J., J. Vanderborght, R. Kasteel, T. Pütz, R. Merckx, J. Feyen, and E. Smolders. 2007. Dissolved organic carbon fl uxes under bare soil. J. Environ. Qual. 36:597–606.
Moebius-Clune, B.N., H.M. van Es, O.J. Idowu, R.R. Schindelbeck, D.J. Moebius-Clune, D.W. Wolfe, G.S. Abawi, J.E. Th ies, B.K. Gugino, and R. Lucey. 2008. Long-term eff ects of harvesting maize stover and tillage on soil quality. Soil Sci. Soc. Am. J. 72:960–969.
Nelson, R.G. 2002. Resource assessment and removal analysis for corn stover and wheat straw in the Eastern and Midwestern United States-rainfall and wind-induced soil erosion methodology. Biomass Bioenergy 22:349–363.
Oades, J.M. 1988. Th e retention of organic matter in soil. Biogeochemistry 5:35–70.Olness, A., and D. Archer. 2005. Eff ect of organic carbon on available water in soil. Soil Sci.
170:90–101.Paul, E.A., K. Paustian, E.T. Elliott, and C.V. Cole. 1997. In E.A. Paul et al. (ed.) Soil organic
matter in temperate ecosystems: Long-term experiments in North America. CRC Press, Boca Raton, FL.
Paustian, K., C.V. Cole, D. Sauerbeck, and N. Sampson. 1998a. CO2 mitigation by agriculture: An overview. Clim. Change 40:135–162.
Paustian, K., H.P. Collins, and E.A. Paul. 1997. Management controls on soil carbon. p. 15–50. In E.A. Paul et al. (ed.) Soil organic matter in temperate agroecosystems. Long-term experiments in North America. CRC Press, Boca Raton, FL.
Paustian, K., E.T. Elliot, and K. Killian. 1998b. Modeling soil carbon in relation to manage-ment and climate change in some agroecosystems in central North America. p. 459–471. In R. Lal et al. (ed.) Soil processes and the carbon cycle. CRC Press, Boca Raton, FL.
Paustian, K., W.J. Parton, and J. Persson. 1992. Modeling soil organic matter in organic-amended and nitrogen-fertilized long-term plots. Soil Sci. Soc. Am. J. 56:476–488.
Paustian, K., G.P. Robertson, and E.T. Elliot. 1995. Management impacts on carbon storage and gas fl uxes (CO2, CH4) in mid latitude cropland. p. 69–83. In R. Lal et al. (ed.) Soil management and greenhouse eff ect. Lewis Publ., Boca Raton, FL.
Perlack, R.D., L.L. Wright, A.F. Turhollow, R.L. Graham, B.J. Stokes, and D.C. Erbach. 2005. Biomass as feedstock for a bioenergy and bioproducts industry: Th e technical feasibil-ity of a billion-ton annual supply. U.S. Dep. of Energy, DOE/GO-102005–2135 and ORNL/TM-2005/66. Oak Ridge Natl. Lab., Oak Ridge, TN.
Peterson, G.A., A.D. Halvorson, J.L. Havlin, O.R. Jones, D.J. Lyon, and D.L. Tanaka. 1998. Reduced tillage and increased cropping intensity in the Great Plains conserves soil C. Soil Tillage Res. 47:207–218.
Post, W.M., and K.C. Kwon. 2000. Soil carbon sequestration and land-use change: Processes and potential. Glob. Change Biol. 6:317–327.
Power, J.F., W.W. Wilhelm, and J.W. Doran. 1986. Crop residue eff ects on soil environment and dryland maize and soybean production. Soil Tillage Res. 8:101–111.
Rasmussen, P.E., and S.L. Albrecht. 1998. Crop management eff ects on organic carbon in semi-arid Pacifi c Northwest soils. p. 209–219. In R. Lal et al. (ed.) Management of carbon sequestration in soil. CRC Press, Boca Raton, FL.
Rasmussen, P.E., and R.W. Smiley. 1997. Soil carbon and nitrogen change in long-term agricul-tural experiments at Pendleton, Oregon. p. 353–360. In E.A. Paul et al. (ed.) Soil organic matter in temperate agroecosystems: Long-term experiments in North America. CRC Press, Boca Raton, FL.
Rawls, W.J., Y.A. Pachepsky, J.C. Ritchie, T.M. Sobecki, and H. Bloodworth. 2003. Eff ect of soil organic carbon on soil water retention. Geoderma 116:61–76.
Rickman, R., C. Douglas, S. Albrecht, and J. Berc. 2002. Tillage, crop rotation, and organic amendment eff ect on changes in soil organic matter. Environ. Pollut. 116:405–411.
SAS Institute. 2003. SAS/STAT user’s guide. Version 9.1. SAS Inst., Cary, NC.Six, J., E.T. Elliot, and K. Paustian. 1999. Aggregate and soil organic matter dynamics under
conventional and no-tillage systems. Soil Sci. Soc. Am. J. 63:1350–1358.Six, J., E.T. Elliot, K. Paustian, and J.W. Doran. 1998. Aggregation and soil organic matter accu-
mulation in cultivated and native grassland soils. Soil Sci. Soc. Am. J. 62:1367–1377.Staricka, J., R.R. Allmaras, and W.W. Nelson. 1991. Spatial variation of crop residue incorpora-
tion by tillage. Soil Sci. Soc. Am. J. 55:1668–1674.Stevenson, F.J. 1994. Humic chemistry: Genesis, composition, reactions. 2nd ed. John Wiley
& Sons, New York.Tester, C.F. 1990. Organic amendment eff ects on physical and chemical properties of a sandy
soil. Soil Sci. Soc. Am. J. 54:827–831.VandenBygaart, A.J., E.G. Gregorich, and D.A. Angers. 2003. Infl uence of agricultural man-
agement on soil organic carbon: A compendium and assessment of Canadian studies. Can. J. Soil Sci. 83:363–380.
Vanotti, M.B., L.G. Bundy, and A.E. Peterson. 1997. Nitogen fertilizerand legume-cereral rota-tion eff ects on soil productivity and organic matter dynamics in Wisconsin. p. 105–119. In E.A. Paul et al. (ed.) Soil organic matter in temperate agroecosystems: Long-term experiments in North America. CRC Press, Boca Raton, FL.
van Veen, J.A., and E.A. Paul. 1981. Organic carbon dynamics in grassland soils. I. Background information and computer simulation. Can. J. Soil Sci. 61:185–201.
Vitosh, M.L., R.E. Lucas, and G.H. Silva. 1997. Long-term eff ects of fertilizer and manure on corn yield, soil carbon and other soil chemical properties in Michigan. p. 129–139. In E.A. Paul et al. (ed.) Soil organic matter in temperate agroecosystems: Long-term experi-ments in North America. CRC Press, Boca Raton, FL.
Wander, M.M., S.J. Traina, B.R. Stinner, and S.E. Peters. 1994. Organic and conventional management eff ects on biologically active soil organic matter pools. Soil Sci. Soc. Am. J. 58:1130–1139.
West, T.O., and W.M. Post. 2002. Soil organic carbon sequestration rates by tillage and crop rotation: A global data analysis. Soil Sci. Soc. Am. J. 66:1930–1946.
Wilhelm, W.W., J.W. Doran, and J.F. Power. 1986. Corn and soybean yield response to crop residue management under no-tillage production systems. Agron. J. 78:184–189.
Wilhelm, W.W., J.M.F. Johnson, J.L. Hatfi eld, W.B. Voorhees, and D.R. Linden. 2004. Crop and soil productivity response to corn residue removal: A literature review. Agron. J. 96:1–17.
Wilhelm, W.W., J.M.F. Johnson, D.L. Karlen, and D.T. Lightle. 2007. Corn stover to sustain soil organic carbon further constrains biomass supply. Agron. J. 99:1665–1667.
Wilts, A.R., D.C. Reicosky, R.R. Allmaras, and C.E. Clapp. 2004. Long-term corn residue eff ects: Harvest alternatives, soil carbon turnover, and root-derived carbon. Soil Sci. Soc. Am. J. 68:1342–1351.