An assessment of biofuel use and burning of agricultural waste in the developing world
108
-- -- An assessment of biofuel use and burning of agricultural waste in the developing world Rosemarie Yevich Department of Earth and Planetary Sciences, Harvard University Cambridge, Massachusetts, USA Jennifer A. Logan Department of Earth and Planetary Sciences, Harvard University Cambridge, Massachusetts, USA Submitted to Global Biogeochemical Cycles June 30, 2002
-
Upload
independent -
Category
Documents
-
view
2 -
download
0
Transcript of An assessment of biofuel use and burning of agricultural waste in the developing world
-- --
An assessment of biofuel use and burning of agricultural waste in the developing world
Rosemarie YevichDepartment of Earth and Planetary Sciences, Harvard UniversityCambridge, Massachusetts, USA
Jennifer A. LoganDepartment of Earth and Planetary Sciences, Harvard UniversityCambridge, Massachusetts, USA
Submitted to Global Biogeochemical CyclesJune 30, 2002
-- --
- 2 -
We present an assessment of biofuel use and agricultural field burning in the developingworld. We used information from government statistics, energy assessments from the WorldBank, and many technical reports, as well as from discussions with experts in agronomy, fores-try, and agroindustries. We estimate that 2060 Tg biomass fuel was used in the developingworld in 1985; of this 66% was burned in Asia, and 21% and 13% in Africa and Latin America,respectively. Agricultural waste supplies about 33% of total biofuel use, providing 39%, 29%,and 13% of biofuel use in Asia, Latin America, and Africa, and 41% and 51% of the biofuel usein India and China. We find that 400 Tg of crop residues are burned in the fields, with the frac-tion of available residue burned in 1985 ranging from 1% in China, 16 - 30% in the Middle Eastand India, to about 70% in Indonesia; in Africa about 1% residue is burned in the fields of thenorthern drylands, but up to 50% in the humid tropics. We distributed this biomass burning on aspatial grid with resolution of 1° x 1°, and applied emission factors to the amount of dry matterburned to give maps of trace gas emissions in the developing world. The emissions of CO frombiofuel use in the developing world, 156 Tg, are about 50% of the estimated global CO emis-sions from fossil fuel use and industry. The emission of 0.9Pg C (as CO2) from burning ofbiofuels and field residues together is small, but non-negligible when compared with the emis-sions of CO2 from fossil fuel use and industry, 5.3 Pg C. The biomass burning source of 10Tg/yr for CH4 and 2.2 Tg N/ yr of NOx are relatively small when compared with total CH4 andNOx sources; this source of NOx may be important on a regional basis.
-- --
- 3 -
1. Introduction.Biomass burning has a significant impact on global atmospheric chemistry since it provides
large sources of carbon monoxide, nitrogen oxides, and hydrocarbons, primarily in the tropics[Crutzen et al., 1979, Logan et al., 1981]. These gases are precursors of tropospheric ozone andinfluence the chemistry of the OH radical [Logan et al., 1981; Logan, 1985]. Two notable com-ponents of biomass burning are the incineration of wood, charcoal and agricultural waste ashousehold fuel, and the combustion of crop residue in open fields. As the developing worldpopulation continues to rise, the contributions from these types of biomass burning increase[Woods and Hall, 1994: hereafter referenced as WH94]. A quantitative description of the spatialdistribution of biofuel and open field burning is required in order to assess the impact of thisburning on the budgets of trace gases.
Earlier estimates of global biomass burning were formulated using simple quantitativedescriptions and generalizations. The burning of woodfuel was tied directly to forestry statisticspublished by the Food and Agriculture Organization (FAO) of the United Nations, while burningof agricultural residues in the developing and developed world was estimated as a fraction of theavailable residues [e.g., Seiler and Crutzen, 1980; Crutzen and Andreae, 1990; Andreae, 1991;Hao and Liu, 1994]. Since many factors such as geoclimatic conditions, vegetation distribution,farming methods, and population densities influence these types of biomass burning, simple glo-bal characterizations of these burning practices cannot provide reliable estimates. The purposeof this paper is to provide global distributions that reflect major regional differences in biomassburning. We derive more realistic representations of biofuel and open field burning in thedeveloping countries based on examination of the diverse burning practices found in the tropics.A brief overview of these practices in the developed world is also included. All estimates arebased on information pertinent to the specific year of 1985, the year of the GEIA inventories forNOx and SO2 [Benkovitz et al., 1996]. We also provide estimates for 1995 based on an extrapo-lation of our inventory for 1985.
We begin with a review of previous global estimates of biofuel and open field burning(Section 2). We follow with a general discussion of biofuel use in developing countries, includ-ing specific descriptions of fuelwood, charcoal, and crop residue biofuels (Section 3). Themethodology used in this study is described in Section 4. More detailed information on biomassburning in each of Africa, Asia, and Latin America is contained in Sections 5, 6, and 7. We dis-cuss use of biofuels in the developed world briefly in Section 8 and assess potential errors in ourestimates for biofuel use in Section 9. We present our results for 1985 in the form of globalmaps in Section 10, and summarize our findings and compare them with the results of othersimilar work in Section 11. In Section 12 we give estimates for biofuels use and residue burningfor the year 1995. We include estimates of quantities of trace gases emitted from biomass burn-ing in Section 13. Section 14 contains a brief discussion and conclusions.
2. Summary of Previous Work.Earlier studies [Seiler and Crutzen, 1980; Crutzen and Andreae, 1990; Andreae, 1991;
Hao and Liu, 1994] used similar methods to calculate fuelwood use in the developing world,basing their estimates in some measure on the assumption that the production of fuelwood asgiven in the FAO Forest Products Yearbooks is equal to the fuelwood consumption, withmodifications using additional data from surveys and estimates of per capita use. Their estimates
-- --
- 4 -
vary from 620 to 1260 Tg dry matter for the developing world (Table 1). Andreae calculates hisestimate as the mean of the FAO fuelwood production and a mean estimate of per capita usagethroughout the tropics of 1.3 kg/cap/day. He suggests that using only FAO fuelwood statistics islikely to give low estimates since FAO considers only the marketed fuelwood production. Anonnegligible portion of the fuelwood supply in the developing world is the wood debris whichthe rural populations gather for household fuel use [Openshaw, 1978] and which is not includedin the FAO Yearbook estimates.
Most previous studies provide a combined estimate for agricultural residues that are burntas fuel and those that are burnt in the open fields to dispose of the stubble and to return nutrientsto the soil. Seiler and Crutzen[1980] and Andreae[1991] proposed that 80% of available resi-dues are burned in developing countries and 50% in developed countries. Crutzen and Andreae[1990] suggested that 25% of crop waste is burned in the fields of developing countries in thetropics, while Hao and Liu[1994] assumed that 23% of residues are used as fuel and 17% areburned in the field.
The work of Hall and colleagues [WH94] has been seminal in shifting the focus of study ofbiomass combustion in the developing world from the use of woodfuels to a more comprehen-sive picture of ’biofuels’ combustion including the burning of crop residues and dung as fuels.Their estimates of biofuel use are based on the FAO fuelwood and charcoal estimates, theBiomass Users Network country studies, data from the U.N. Statistical Office, and, for countrieswhich have little information available, on the following assumption: use of 2.74 kg/cap/day forrural populations and 1.37 kg/cap/day for urban populations [WH94]. Unfortunately, their studydoes not provide a breakdown by fuel type, nor is this breakdown easily determined [D. Hall,personal commmunication, May 1994]. By converting the other estimates to energy units wefind that the WH94figure of 49.9 EJ biofuels combustion for the sum of developed and develop-ing world is almost one quarter again as large as the high end figure in the range of estimates ofbiofuel burning of Crutzen and Andreae[1990] (19.7-39.3 EJ) .
3. Biofuels.Rural areas of developing countries depend primarily on biomass for fuel [Smil, 1979;
Cecelski et al., 1979; Meyers and Leach, 1989; Leach and Gowen, 1987]. Biofuels include thewoodfuels (fuelwood-- see Openshaw [1986] and charcoal), and agricultural waste, such as cropresidues and dung. The amount of biofuel consumed varies as climate (higher consumption forcolder climates) [Leach, 1988], and with the plenitude of fuel resource; where fuel is easilyobtained, more is consumed [Meyers and Leach, 1989]. The choice of biofuel consumeddepends on availability, local customs, and season [Meyers and Leach, 1989]. Generally, thesub-Saharan African population depends mainly on wood [Cecelski et al., 1979; Scurlock andHall, 1990], as does the rural population in Latin America. The population in Asia uses allbiofuels [Cecelski et al., 1979, Meyers and Leach, 1989]. Biofuels are also major energy sourcesin the urban areas of the developing countries [Barnes et al., 2000]. In the developed worldbiofuels are important [Hall, 1991], but provide a smaller fraction of total energy consumed[WH94, Blandon, 1983].
3.1. Woodfuels.
-- --
- 5 -
Woodfuel is the principal source of domestic energy in developing countries [Openshaw,1974, Eckholm, 1975, Arnold and Jongma, 1978, deMontalembert and Clement, 1983]. Wood-fuel includes charcoal as well as firewood, brushwood, twigs, branches, and cut branches[Openshaw, 1986]. Where available, fuelwood is generally the biofuel of choice [Arnold andJongma, 1978, Openshaw, 1986]. Climate and terrain are the two strongest natural influences onthe growth and abundance of the forest resources, and these vary significantly throughout thedeveloping world [deMontalembert and Clement, 1983]. Even in countries with adequate fuel-wood supply, the resource may be located far from the more populated regions where it isneeded [deMontalembert and Clement, 1983]. Alternative biofuels are used in regions lackingadequate fuelwood [Smil, 1979]. In countries where modern fuels are available and the ruralpopulation has the income to purchase them, fuelwood use is correspondingly lower [Cecelski etal., 1979]. The problems of fuelwood supply and conversion in the humid tropics [Moss andMorgan, 1981] and in Latin America [Bogach, 1985], and projected fuelwood deficit throughoutthe world [Wood and Baldwin, 1985] have been discussed also in earlier works [Earl, 1975,Openshaw, 1986].
3.1.1. Charcoal. A large fraction of urban populations in the developing countries relieson charcoal for cooking and industrial fuel [Barnes et al., 2000]. We consider charcoal as aseparate fuel since trace gases are emitted during its production [WH94], and emissions fromburning charcoal differ from those for wood. The carbonization process used in convertingwood to charcoal is generally inefficient, and volatiles including CO2, CO, CH4, and non-methane hydrocarbons (NMHC) estimated at 60% by weight of the original wood are emitted[WH94]. Openshaw[1978, 1980, 1986] suggests that from six to twelve tons of wood arerequired to make one ton of charcoal.
Nearly all of charcoal production occurs in the developing world [Lew and Kammen, 1994].About half of the world’s charcoal is produced in Africa where it is used as a domestic fuel inmany of the urban areas and as a cooking fuel in eastern and northern regions [Foley, 1986,Hibajene et al, 1993]. In Asia, the pattern of charcoal consumption varies from extensive use asa domestic fuel in both urban and rural Thailand [Foley, 1986, Ishiguro and Akiyama, 1995], andas a large industrial fuel for the steel industries in the Philippines and Malaysia [Foley, 1986], toa much smaller role in the domestic energy supply in India [Foley, 1986, Leach, 1987]. In LatinAmerica charcoal is not a major household fuel, but is a notable source of energy for the steelindustries of Brazil [Bogach, 1985, WH94], Bolivia, [World Bank (WB): Bolivia, 1994], andParaguay [WB: Paraguay, 1984]. A detailed overview of charcoal consumption in the develop-ing countries is given in Wood and Baldwin [1985].
3.2. Agricultural Residues.Billions of tons of agricultural waste are generated each year in the developing and
developed countries. Agricultural residue includes all leaves, straw and husks left in the fieldafter harvest, hulls and shells removed during processing of crop at the mills, as well as animaldung. The types of crop residue which play a significant role as biomass fuels are relatively few.
The single largest category of crops is cereals, with global production of 1800 Tg in 1985[FAO, 1986a]. Wheat, rice, maize, barley, and millet and sorghum account for 28%, 25%, 27%,10%, and 6%, respectively, of these crops. The waste products which are the main contributorsto biomass burning are wheat residue, rice straw and hulls, barley residue, maize stalks and
-- --
- 6 -
leaves, and millet and sorghum stalks. Sugar cane (0.95 gigatons) provides the next sizeableresidue with two major crop wastes: barbojo, or the leaves and stalk, and bagasse, the crop pro-cessing residue. The cotton crop also gives nonnegligible residue in the form of stalks andhusks, both of which are used as biofuels. Four minor crops provide residue from processingthat is frequently used as fuel: palm empty fruit bunch and palm fiber, palm shells, coconut resi-due, groundnut shells, and coffee residue.
Geographical distribution of crop residue (Table 2) is skewed by large crop productions inIndia and China [FAO, 1986a]. The other countries of southeast Asia have rice and sugar caneas dominant crops. In the Middle East, the crop mixture is more diverse with more cereals andless rice and sugar cane. In the drylands of the Near East and Mediterranean northern Africa,wheat and barley predominate. In the sub-Saharan Sahel in Africa, millet and sorghum are themain crops (Table 2). Farther south in the subhumid and humid regions, maize is important. Allthree grains are grown in the highlands of eastern Africa. In Latin America, the crop residues ofmaize and sugar cane provide significant field and factory waste, with Brazil as the foremostcontributor.
Crop residue accumulates in the fields and in factories. The waste from the agroprocessingindustries accumulates at the mills where the crop is prepared for consumption. These includebagasse residue from sugar cane [WB: Ethiopia, 1986], rice husks, cottonseed hulls, palm,coconut, ground nut, cashew, and coffee processing waste. Agroindustrial biomass waste is usedmainly as fuel for the processing industry, and is rarely transported any distance from the millsfor other purposes [Barnard and Kristoferson, 1985, Openshaw, 1986]. It is generally unpalat-able as fodder, and inaccessible, except locally, for household fuel. A more comprehensive dis-cussion of these agroindustrial wastes and estimates of use as fuel is included in Appendix 1.
In the developing world the grain residues are used in various ways: household fuels andconstruction materials in wood-deficit regions, and livestock fodder in dryland regions, asdescribed in Sections 5, 6, and 7. The major field residues are sugar cane barbojo, and post-harvest grain residues as well as cotton stalks. Traditionally, the barbojo is burned in the fieldsas a pre-harvest measure to facilitate the harvesting of the sugar cane [Williams and Larson,1993]. Cotton is a "woody" plant [Townsend, pc], a more likely substitute for fuelwood ashousehold fuel, and a less likely fodder source. In addition, cotton is susceptible to a largenumber of pests and plagues [Percy, pc], so the cotton plants are destroyed after harvest to cur-tail the spread of pest and disease [WB: Burkina, 1986, WB: Ethiopia, 1984, Ramalho, pc, Val-derrama, pc, Tothill, 1954, Matthews, pc]. The cotton stalks are either: mechanically destroyedand the leftover ploughed down [Hadar et al., 1993], as in many Latin American countrieswhere tractors are more accessible [Ramalho, pc, Valderrama, pc, Cuadrado. pc, Jones, pc];burned in heaps as in Africa where tractors are scarce [Tothill, 1954, Matthews, pc, Gray, pc,Poulain, 1980, Carr, pc]; or burned as fuel, as in several Asian countries where fuelwood substi-tutes are needed [Chaudry, pc, Townsend, pc].
4. General Methodology.Detailed information on local fuel consumption and local burning practices is required to
construct a credible assessment of biofuel consumption and open field burning in the developingworld. This information is usually gathered in survey/questionnaire form. Reliable surveys aredifficult to obtain: short term surveys frequently cannot account for seasonal fluctuations in
-- --
- 7 -
residue fuel availability [Hall and Mao, 1994]; surveys which describe rural village habits in onelocale may not be adequate to describe the habits of rural communities located in different geo-climatic regions within the same country [Hosier, 1985]; surveys may not document factorswhich affect biofuel consumption such as fuelwood moisture content [Openshaw, 1986].Difficulties in survey practice are discussed in detail in Hosier [1985] and Kgathi and Zhou[1995], while Openshaw[1986] provides guidelines for constructing comprehensive surveys ofbiofuel use.
4.1. Sources.Energy assessments for individual countries conducted by the World Bank (WB) and the
United Nations Development Programme (UNDP) provided the main source material used inthis analysis. These reports give information on the available energy supplies, with dataobtained from government sources and/or from surveys conducted by participants involved inthe country study. They usually include an annual energy balance which contains estimates foruse of fuelwood, charcoal, bagasse, and other agricultural residues as fuel. The quality of infor-mation varies, depending on the accuracy of the government sources, and the nature of the sur-veys [Openshaw, personal communication; Openshaw, 1986].
The second major group of sources comprises individual reports for countries or regions.The information in these reports ranges from direct quotations of governmental energy statisticson biofuel use to descriptions of very careful surveys which included many participants,extended through several seasons and several locations to provide a comprehensive database foranalysis. Several of the more detailed reports will be described in Sections 5, 6, and 7.
Agricultural statistics usually published as government documents give details on quantitiesof crops and livestock distributed within the provinces or states of a particular country. Thesewere included in the literature survey, as well as statistics on estimated forest land andpasture/grazing lands. Various treatises on biological processes were consulted to ascertainmodes of biomass decomposition in differing climatic conditions. Other botanical papers wereexamined to determine more information about crop growing, processing and consumption prac-tices in the developing world. Specific information on crop residue use was frequently included.
Finally, discussions with personnel in the sugar and cotton processing industry, agronom-ists, botanists, and foresters, and others with experience in the developing world yielded aplethora of anecdotal evidence providing personal observation on burning practices indicative oflarge-scale burning activities within some developing countries.
4.2. Procedure.BiofuelsEstimates of biofuels consumption are presented for different survey years in diverse
energy, volumetric, and gravimetric units, sometimes disaggregated into individual types ofbiofuel use, sometimes reported as a total biofuel consumption. (We discuss the conversion fac-tors used in this paper in Appendix 2.) Most results were reported in mass or volume units;where these were the main sources (e.g. for Africa), we derived rates of fuel consumption percapita. We assumed that household fuel consumption correlates with population size, and com-puted total biofuel use for a given country by multiplying the per capita usage by the populationfor that country for 1985 (Demographic Yearbook, 1992). In contrast, most sources for Latin
-- --
- 8 -
America provided biofuel use in energy units. We utilized this information directly in present-ing the complete biofuel scene for Latin America in energy units in Section 7. We include a dis-cussion of energy content of various biofuels in Appendix 2. In tables which compare biofuelsuse in Latin America and other developing continents, all estimates are expressed in terms ofteragrams (Tg) of dry matter fuel consumed.
4.2.1 WoodfuelsWoodfuels consumption statistics were separated into fuelwood use, consumption of wood
to make charcoal, and charcoal consumption. Charcoal use in Africa is primarily an urbanphenomenon; we therefore present charcoal use in units of weight-per-urban-capita.
Data on charcoal use is available either as the total amount charcoal consumed or as thetotal amount of wood used to produce the charcoal. For both Africa and Asia we estimate char-coal consumption in units of wood used to produce charcoal, a figure calculated from the amountof charcoal used by assuming an efficiency of charcoal production, the fraction by weight of thewood that ends up as charcoal. All efficiencies in this paper are given as percent by weight. Themaximum efficiency in converting wood to charcoal is approximately 30%. Most charcoal pro-duction is more inefficient than this [Openshaw, 1986], with the major exception of the industri-alized production in Brazil [WH94]. Efficiencies adopted in this study are given in Appendix 3.
4.2.2 Residues as BiofuelsFor estimating agricultural waste used as biofuel, a many-faceted approach was taken. We
converted any reported estimates of agricultural waste used as biofuels to units of dry matter percapita. In other circumstances, especially in Africa, when reports specified a woodfuel deficitand the use of agricultural residues as substitute fuel, we estimated the consumption of residuesas fuel in sufficient quantity to fill the woodfuel deficit [Openshaw, 1986; Polycarpou and El-Lakany, 1993; Pokharel and Chandrashekar, 1994]. Many reports noted that agricultural resi-dues were not used for fuel, either owing to sufficient woodfuels available, or need of the residuefor other purposes. For the dung component of biofuels, we relied on reports of specific use in acountry.
4.3 Burning in FieldsThe open field burning of agricultural residue is well documented [e.g. Ponnamperuma,
1984, Williams and Larson, 1993, Poulain, 1980]. We used direct estimates of amount burnedin the fields, when available. The actual amount of crop residue as dry matter (DM) availablefor burning was determined from the country-by-country tallies of crops produced in 1985[FAO, 1986a], the residue-to-crop ratios described below, and some estimate of the fraction ofresidue burned. For example, we prescribed the default fraction of available barbojo residuewhich burns to be about 85%, since a complete burn is rare [J. Kadyzewski, personal communi-cation]; barbojo is used for construction in some regions (see Section 6). In general, to estimatethe percent burned, we referenced discussions with agronomists about the fate of residues ofspecific crops (cotton, sugar cane, wheat and barley) in different regions of the world, and con-structed a plan of open field residue burning for these particular crops. For the remaining resi-dues, we first ascertained whether residues were needed for other purposes, allotted the fractionof residue to each designated use, and assumed the remainder was burned in the fields, if thispractice is common in the region. We were often informed that open field burning was neverseen in given regions, or that, in contrast, all agricultural waste was burned throughout the coun-tryside.
-- --
- 9 -
4.4 Residue-To-Crop RatiosThe amount of residue produced as compared with the amount of crop grown depends on
climate and fertilizer use, and on whether the crop is a high-yielding variety [Barnard and Kris-toferson, 1985]. Many low income farmers in the developing world choose to save seed fromthe old cultivars which produce a high stalk/crop ratio, rather than purchase the modern cultivarseed more often used in the developed countries [Bradow, pc, Percy, pc]. We present a sum-mary of residue/crop ratios available from the literature since 1985 in Table 3, which comparesthese values with the review of Barnard and Kristofferson[1985]. We have selected defaultratios which we feel best approximate average residue/crop production ratios for each type ofresidue, acknowledging the variations in crop variety, climate, and differences in farming prac-tice, as shown in Table 3. Country specific ratios were used where substantially different fromthe default values.
5. Africa.Africa has the lowest per capita consumption of modern fuels in the developing world
[Davidson, 1992]. Modern energy resources are concentrated in a few countries such as Nigeria,Libya, and South Africa [Kahane and Lwakabamba, 1990]. Most African countries are predom-inantly rural and economic output is low, so that the population cannot afford to buy oil-basedfuels. The rural population (and often the urban population also [Cecelski et al., 1979, Barnes etal., 2000]) relies on wood and charcoal as the main fuels for domestic consumption [deMon-talembert and Clement, 1983].
5.1 Woodfuels.Africa is marked by contrasts in geoclimatic and vegetation conditions, from the northern
drylands through the large desert and savanna zones with fuelwood deficits, to the forest zoneswith fuelwood surplus, to the more populous temperate eastern highland areas. Lack of infras-tructure makes the transportation of wood from surplus to deficit regions difficult. The per cap-ita woodfuel consumption depends on availability and demand, and ranges from an estimatedlow of 0.05 kg/cap/day in Lesotho to upwards of 3.0 kg/cap/day in Eastern Highland countries(see Table 4).
5.1.1. Fuelwood. To facilitate analysis of fuelwood availability and consumption, we sub-divided the continent into regions (Table 4), grouping together neighboring countries that sharesimilar woody vegetation and population density. Note, however, that an average per capitafuelwood use cannot describe local and regional variations.
The Mediterranean countries of North Africa have more in common climatologically withthe rainfed drylands of the Middle East than with sub-Saharan Africa. Fuelwood consumption isnegligible in oil-rich states like Libya [deMontalembert and Clement, 1983] and modest in coun-tries like Algeria, which, though a large oil-producer, has forested mountain zones and a sizeablelow-income rural population (Table 4).
The Sahel countries to the south are sparsely populated with desert and subdesert mixedwith savanna regions. Chad, which has desert in the north, and desertification and drought con-ditions in the south, has the lowest fuelwood consumption of 0.3 kg/cap/day. Mali, with itssufficient-to-surplus wood in western and southern regions [WB: Mali, 1991], but major wood-fuel shortages in the three northeastern regions (identified using satellite data [WB: Mali, 1992])
-- --
- 10 -
has the highest consumption of 1.49 kg/day. Sudan is an exception within this group in that itsnorthern climate is desert, while its southern regions have tropical forests and savannas.
The coastal countries of West Africa contain areas of wooded savanna and dense forest,with sparse to heavy population density. The fuelwood consumption estimates are mostly withinthe range of 1.3-1.7 kg/cap/day. Guinea, which has extensive forest cover and abundant fuel-wood resources, is a notable exception, with 3.2 kg/cap/day [WB: Guinea, 1986]. The countrywhich dominates fuelwood use in Africa, Nigeria, is included in this group, although its northernprovinces are in the Sahel region. Our estimate for Nigeria is based on the Silviconsult, Ltd sur-vey (over 2350 households) of the five northern provinces [Hyman, 1994] and the very carefulsurveys of Kersten et al. [1998] in the Osun State of southern Nigeria. Kersten et al. [1998]found that even in the rural areas where an adequate supply of wood was available, there waslow per capita consumption.
The countries of Central Africa have large zones of dense forest with low population den-sity, and relatively high consumption rates, 1.5-2.5 kg/cap/day. Some countries such as Gabonand Equatorial Guinea are relatively prosperous [WB: Gabon, 1988] and their populations usesubstantial quantities of modern fuels in addition to woodfuels.
The highest fuelwood consumption rates occur in the highland countries of southeasternAfrica, at 1.89 to 3.24 kg/cap/day, a consequence of plentiful forest resources and use of fuelsfor heating. Malawi [WB: Malawi, 1982], Uganda [O’Keefe, 1990], and Zambia [WB: Zambia,1983] have extensive forest reserves. Kenya has productive forest land in the central highlands[Senelwa and Hall, 1993], and Tanzania has about 40% forest cover, much of this miombowoodlands [Hosier et al., 1990; WB: Tanzania, 1984].
Countries of the eastern and southern drylands region include sparsely populated savannaareas and dry mountainous zones of degraded forest cover [deMontalembert and Clement, 1983].In many areas crop residues and dung are used as alternate fuels to supplement fuelwood, sincefuelwood is scarce. Fuelwood consumption is fairly low, between 0.05 kg/cap/day in Lesothoand 1.84 kg/cap/day in Ethiopia, with an outlier of 2.04 kg/cap/day in Botswana.
Within the island group there is a wide range of fuelwood consumption. The largest popu-lation inhabits Madagascar which is densely populated and whose fuelwood resources are beingrapidly depleted.
Five countries, Nigeria, Ethiopia, Tanzania, Kenya, and Zaire use 138 Tg/y of fuelwood orabout 50% of the total for Africa (Table 4). Usage varies from 1.50 kg/cap/day in Nigeria to3.21 kg/cap/day in Tanzania. The detailed surveys for Nigeria were discussed above. Ethiopiais classified in the Eastern/Southern Drylands region, but straddles the Eastern Highlands region;the per capita consumption of 1.84 kg/cap/day is somewhat high for the Eastern/Southern Dry-lands region. For Tanzania, Hosier et al.[1990] compared the results of four major reports onwoodfuel balances, including Kaale [1983] on districts facing wood-deficit, Openshaw’s [1984]analysis based on surveys in the 1970’s, a World Bank ESMAP (Energy Sector ManagementAssistance Programme) [1984] assessment of the woodfuel-deficit regions, and Luhanga andKjellstrom [1988] based on remote sensing information. Hosier et al. [1990] analyzed the differ-ences in these studies and noted that, while different in detail for the twenty regions of Tanzania,their average estimates were remarkably similar.
Hosier [1985] compared the results of his survey of energy consumption in 1981 taken inrural households in different ecological zones of rural Kenya with the results of a 1978/1979
-- --
- 11 -
survey among the same households. He noted that the average consumption rate of fuelwoodhad decreased from 2.44 kg/cap/day to 2.17 kg/cap/day. More recently, Kituyi et al. (1999) con-ducted extensive surveys in both rural and urban regions of Kenya in early 1997 using Hosier’smethods and estimated a rate of 1.75 kg/cap/day. We derived a weighted per-capita firewooduse of 1.89 kg/cap/day from the rural estimate of Hosier [1985] and the urban estimate ofO’Keefe and Raskin[1985] along with the work of Kituyi et al. [1999].
Detailed analyses are available for some countries that make smaller contributions to fuel-wood use in Africa. Country-by-country summaries are included in O’Keefe and Munslow’s[1984] report on southern Africa and Karekezi and Mackenzie’s[1993] discussions on energyoptions. Several studies combine aerial and satellite remote sensing together with concomitantground surveys to define coherent data pictures of biomass energy supply and demand [Hall andMao, 1994, WB: Mali, 1991].
5.1.2. Charcoal. Africa has the largest per capita charcoal use among the developing con-tinents [Lew and Kammen, 1994]. Information on charcoal use is provided in Table 5.
The greatest per capita use is in the East African Highlands. These countries have a sub-stantial wood supply which can be converted to charcoal and then transported to regions ofdemand. By contrast, little charcoal is used in the Southern Drylands. Urban users in Zimbabweand Swaziland prefer firewood and coal [Hemstock and Hall, 1997]. No charcoal is produced inBotswana [Wisner, 1984]. In Lesotho [Frolich, 1984], Botswana [Hall and Mao, 1994], andNamibia [K. Openshaw, personal communication], the urban population uses firewood,kerosene, and coal.
Sudan is unusual in that charcoal is significant as an energy source for both the urban andrural populations [Digernes, 1977; Craig, 1991]; almost 80% of the charcoal consumed in theCentral Region is used by the rural population [Elgizouli, 1990]. This explains the very highcharcoal use expressed in per urban-capita units in Table 5.
Among the remaining countries, there are no obvious regional preferences. For WestAfrica, the urban populations of Burkina Faso, Mali [WB: Mali, 1991), and Niger prefer usingfirewood to charcoal, but the populations in the largest cities of Ghana use more charcoal [Foley,1986]. Similarly, surveys indicate that city dwellers in Guinea [WB: Guinea, 1986], Togo [WB:Togo, 1985], Senegal [Lazarus et al., 1994; Foley and van Buren, 1982], and Sierra Leone [WB:Sierra Leone, 1987] are heavy charcoal consumers.
5.2. Agricultural Residues.Crop residue produced in Africa accounts for about 10% of the total agricultural residue in
the developing world, as shown in Table 2 [FAO, 1986a]. We examine the fate of these residuesin the five agro-climatic regions described by McIntire [1992], and results are presented in Table6. About 80% of wheat and barley is grown in the rainfed drylands of the northern coast, while asimilar fraction of millet and sorghum is grown in the sub-Saharan semi-arid Zone. Egypt,Madagascar, and Nigeria provide 62% of the rice residues in Africa, and Egypt and Sudantogether produce 47% of the cotton residues. Maize is grown for the most part (about 75%) inthe eastern countries of Africa, from Egypt south through the temperate highlands countries to,and including, South Africa. Most of the minor agro-industrial crop waste of palm (95%), coffee(56%), groundnut (50%), and coconut (40%) is produced in the tropical subhumid and humidzones.
-- --
- 12 -
5.2.1. Rainfed Drylands Zone. The residues of the wheat and barley grown in Mediter-ranean north Africa are generally used as livestock feed (Figure 1) [Hadjichristodoulou, 1994;Whitman et al., 1989], similar to practices in the Near East (section 6.2). In Algeria, barley isgrown primarily for fodder [Tully, 1989]. In Morocco, the cereal crop residue and barley cropsare the main forage for the ruminant livestock [Tully, 1989; Fenster, 1989]. Once the residuehas been harvested for winter feeding, the ruminants are allowed to graze the remaining stubble.We assumed 99% of the residues are used for fodder, and, as there is evidence of burning wherelivestock are few [United Nations Environment Programme, 1977], we arbitrarily assumed that1% of residues are burned in the field before planting (Figure 1, Table 6).
5.2.2. Semi-Arid SubSaharan Zone. This zone with annual precipitation of 200-1000mm/yr and frequent drought is a region of low biomass productivity, lacking forest cover. Themajor crops which can be grown without irrigation are millet, sorghum and cowpea [Christen-sen, 1994; Norman, 1981]; maize, groundnut, rice, and cotton are also grown. This region pro-duces the most agricultural residue in Africa, in part because of the high residue to crop ratiosfrom millet and sorghum and maize. As in the drylands zone, crop residues are a good source offeed for livestock, especially in the post harvest and dry seasons [Tothill, 1954: Norman, 1981;Lamers et al., 1996; McIntire, 1992; Sandford, 1989]. Crop residues are also needed as house-hold fuel [Ernst, 1977]. Sorghum and maize stalks are important construction materials [Reddy,1981; F. Harris, M. Mortimore, personal communication]. Whatever crop residue remains afterthese uses is either decomposed, eaten by termites [Ofori, 1989; Miracle, 1967], or burned inthe open field prior to the planting season [Watts, 1987].
Livestock are integral to the lives of the farming and transhumant herder populations. Indetailed aerial and ground surveys of land use covering 1.5 x 10⁶ km2 in sub-Saharan Africa, astrong correlation was found between livestock density and the amount of cultivated land [Wintand Bourn, 1994]. While many tribesmen are exclusively stock owners, farmers who do notown any livestock are rare [Pingali et al., 1987; Mortimore, 1987; Dederi, 1990; Draft Report,1986]. The rural population needs crop residues for both fuel and fodder [Alhassan, 1990;Umunna, 1990; Morgan, 1980]. In Burkina Faso [Sivakumar and Gnoumou, 1987], Mali [Dickoand Sangare, 1986], and Niger [Reed, 1992], reports provide evidence of large herds of cattle,sheep, and goats grazing post-harvest crop residues.
While the importance of cereal residues as fodder is evident [Oyenuga, 1968], the task ofquantifying this use is difficult. We relied primarily on measurements of vegetation grazed inmillet and sorghum fields. In Niger, farmers usually leave the residue of the millet crop in thefields for cattle to graze [Reed, 1992]. Measurements showed that 100% of the millet leaves andabout 30% of the millet stems were eaten by cattle [McIntire, 1992]. In neighboring Nigeria, themain use of sorghum straw is for post-harvest and dry season animal feed [Alhassan, 1990,Umunna, 1990]. Studies on grazing habits indicate that in eight weeks after harvest, cattle grazealmost all leaves, 47% of millet stalks and 40% of sorghum stalks [Powell, 1985]; another studysuggests that passing ruminants graze 34% of the total edible sorghum residue left in the fields[van Raay and de Leeuw, 1971]. These data indicate that 30-43% of millet and sorghum residuecollectively are grazed by cattle. Given that sizeable numbers of sheep and goats also graze inthe semi-arid zone, we selected the upper end of the range, 43%, to represent the amount of mil-let and sorghum stalks used for fodder.
-- --
- 13 -
Straw and stalks in the semi-arid zone are used in construction of fences, houses, and com-pounds [Reddy, 1981; van Raay, 1975]. In this case, post-harvest millet and sorghum fields areburned rapidly to clear leaves: the stalks are then cut and bundled for construction use [WB:Benin, 1985]. As much as two-thirds of available sorghum stalks are estimated to be used forconstruction in Kano, Nigeria [F. Harris, p.c.]. On farms with no livestock, millet straw is oftenused as a mulch [Poulain, 1980]. We estimate that 20% of residue is used for construction,mulching, low-level decomposition in this dry region, and termite attack.
A significant portion of crop residue in this zone is used for household fuel (Table 6). Fig-ures for the estimated woodfuel deficit in the northern provinces of Benin [WB: Benin, 1985],Burkina Faso [WB: Burkina, 1986], Mali [WB: Mali, 1991], Togo [WB: Togo, 1985], andNigeria [WB: Nigeria, 1993, Draft Report, 1986, Population Association, 1991] together withestimates of the rural population in each province were combined to give a crude guess as to percapita woodfuel deficit. From this, a per capita residue-as-substitute-fuel was estimated, and thecorresponding amount of residue needed as fuel calculated. For those countries and regionswhere surveys of residue biofuel use were reported, these estimates superceded our rough calcu-lations.
To summarize, approximately 60% of the residue was apportioned for non-burning uses,with the remainder either burned as household fuel or as trash in the field. We use countryspecific reports as guidelines for partitioning the leftover residue between these two types ofburning (Table 6). The farmers burn the leftover stubble to release nutrients into the soil in pre-planting field preparation in March and April [Watts, 1987; Poulain, 1980].
5.2.3. Sub-Humid Zone. The subhumid zone covers a band south of the semi-arid regionthrough the center of west Africa and into east and southern Africa. This zone is better suitedfor agriculture, with 1000-1500 mm/yr rainfall [McIntire, 1992] and a growing period of six tonine months. A greater variety of crops is grown here with more maize and rice than in thesemi-arid zone. However, this zone is less favorable for livestock, due to prevalence of trypano-somiasis and other livestock diseases [Areola, 1991; Sivakumar, 1987]. In estimating fodder useof the residues for the livestock, we note that millet and sorghum are grown in roughly equalproportion in this area; using the post-harvest grazing measurements of Powell [1985] as aguide, we assume 43% of millet and sorghum residue are used for fodder. We assume thatmaize residue is used in similar proportions. We note that much of the crop residue decomposesin this zone, given the favorable temperature and moisture conditions (see Appendix 4).
Most countries, with the exceptions of Malawi and Ivory Coast, have sufficient wood forhousehold use, so there is limited need of residues for construction or fuel. We apportion theremaining cereal residue for decomposition (based on the information in Appendix 4), termiteconsumption, and mulching, with open field burning of any residual crop waste.
The cotton harvest residue is another nonnegligible crop waste. The stalks are usually piledin heaps in the field and burned [Poulain, 1980; WB: Burkina, 1986], and the cottonseed hullsaccumulating at the mills are used mainly as fuel (see Appendix 1).
5.2.4. Humid Zone. This zone which extends along the coast of west and central Africaand through the Congo has heavy rainfall and a long growing season [McIntire, 1992]. Manydifferent crops are grown, and here also, livestock numbers are low due to threat of stockdiseases [McIntire, 1992]. Since forests and natural grazing lands are abundant, crop residue isnot in great demand for either fuel or fodder. For the disposition of these residues, we propose
-- --
- 14 -
the following. After the harvesting and some livestock grazing, the remaining residue decom-poses in the fields for four to six months until March or April. The farmers then burn (Figure 1)the leftover crop waste in the fields before planting [Watts, 1987; Miracle, 1967; J. Holtzmann,pc]. Based on the discussion in Appendix 4, we estimate that in the time between grazing andthe spring preplant burn, 52% of millet and sorghum straw and stalk, 62% of maize stalks, and50% rice straw decompose. These estimates are adjusted if country-specific information is avail-able on the fate of the individual crop residue.
5.2.5. Highland Region. The highland region has a temperate climate, good soils, and along growing season [McIntire, 1992]. The cooler climate fosters a higher population densityand also higher livestock density, as the threat of trypanosomiasis is almost nil [McIntire, 1992].The high livestock count in the countries in this zone, Kenya, Ethiopia, Tanzania, Rwanda, andBurundi, suggests that much of the edible crop residue is used for animals [McIntire, 1992]. Inaddition to fodder, the residue is needed as household fuel (Table 6, Figure 1).
In Kenya crop residue is a commodity, bought or exchanged for plowing time, grazingland, etc. [McIntire, 1992; English et al., 1994]. Although Kenya has one of the highest rates offuelwood use in Africa, Senelwa and Hall[1993] estimate that over 40 PJ (or, about 2.76 milliontons) of crop residue (mainly sorghum and maize stalks) is used as household fuel. The use ofmillet stems as fuel is also reported [Mburu, 1989]. To achieve the level of household fuelestimated by Senelwa and Hall, we apportioned the fate of maize residue as 70%:20%:10% forfuel:fodder:decomposition. The sorghum and millet stalks/stems were divided equally betweenhousehold fuel and decomposition in fields, as millet stems are rarely used to feed animals, butusually gathered for fuel or left to decompose in the fields [Mburu, 1989].
In Tanzania the rural areas depend almost exclusively on wood for fuel, despite a numberof wood-deficit regions in the country [Hosier et al, 1990]. We assigned its millet, sorghum, andmaize residues to reflect this, prescribing only 15% for household fuel use. In contrast, there aremany fuelwood deficit regions throughout Ethiopia [WB: Ethiopia, 1984], so that dung and cropresidues are also used as household fuel.
6. Asia.Asia is the largest contributor to the burning of biofuels and agricultural residue in the
developing world, because of the dominance of China and India; these countries are describedin Sections 6.3 and 6.4, respectively. Estimates for woodfuel consumption are given in Table 7and those for residue fuel use and field burning in Table 8. Aside from China and India, eightother countries account for 75% of the remaining biofuel (woodfuel plus residue fuel) consump-tion on the continent; Indonesia, Vietnam, Thailand, Philippines, Turkey, Myanmar, Bangladesh,and Pakistan. Indonesia is the main contributor, with the largest population in Asia after Chinaand India. (Note that while we list the biofuels use in Japan as part of Asia’s total, it is not con-sidered a developing country.)
Throughout Asia, regions of similar geography and climate frequently share similar pat-terns of biofuels use. In the Near East drylands many countries have abundant supplies ofpetroleum. However, rural populations of some of the larger of these countries use wood, aswell as significant quantities of residue and dung in the fuelwood-deficit zones. Some countriesin the Middle East also have notable fuelwood-deficit regions, and rural populations rely onalternative biofuels [deMontalembert and Clement, 1983]. In southeast Asia, rural populations
-- --
- 15 -
have access to a plentiful wood supply; this is the biofuel of choice. Great quantities of unus-able agricultural residue are burned in the open fields.
A variety of detailed studies and reviews are available for Asia. Biomass as rural energy isdiscussed in country-specific reports in a compendium by Islam et al.(1984); the report on Ban-gladesh, for example, analyzes the results of eight major surveys. Ebinger (1981) presents theresults of a government survey that documents the fuel use patterns throughout Pakistan. Leach[1987] cites these studies and other surveys in his book describing household energy in SouthAsia. A more recent monograph on Vietnam provides data from surveys in rural and urban areasof different agro-ecological regions [WB: Vietnam, 1994]. For urban use, we referred to thework of Barnes and Qian[1992] who collected data in surveys in mid-to-large cities inIndonesia, Thailand, and the Philippines. Studies on crop residue use in the drylands of the Nearand Middle East are described in Whitman et al.[1989] and Papendick and Parr[1988].
6.1. Woodfuels.Fuelwood is used throughout Asia for cooking and also for heating, especially in the higher
plateaus and Himalayan Zones. However, in some regions with abundant fuelwood, dung is cus-tomarily used as a household fuel. Grouping the developing countries of Asia into the divisionsof Middle and Far East facilitates the discussion, although we note that within the two regions,woodfuels consumption habits are not homogeneous. Per capita consumption rates for countriesin Asia are included in Table 7.
6.1.1. Near East and Middle East.Here, geography ranges from the mountains and steppe to shrub deserts, with climate vary-
ing from dry to humid. Turkey, with its large natural forest areas supported by vigorous refores-tation programs [deMontalembert and Clement, 1983], has a relatively high per capita fuelwoodconsumption rate (1.0 kg/capita/day). Other woodfuel consumers are Iraq, Afghanistan and Pak-istan (see Table 7). These countries have fuelwood-deficit regions: high mountain zones wherepeople have higher energy requirements, and open mixed forest-grassland and shrub vegetationzones with only a small wood supply available to the large rural populations [deMontalembertand Clement, 1983].
6.1.2. Far East excluding Indonesia.The vast forest resources of southeast Asia offer a plentiful woodfuel supply, though many
of these forests have been severely degraded by the densely populated rural society and otherforests are almost inaccessible [deMontalembert and Clement, 1983]. In contrast, the hilly andmountainous countries of Nepal, Northern Myanmar, and Upper Thailand have limited fuelwoodresources. Rural populations in the wood-deficit areas supplement woodfuels with crop residuesand dung. Another exceptional case is the densely populated nation of Vietnam. Both rural andurban populations use fuelwood to provide energy, but the rural households also use large quan-tities of crop residue in all regions of Vietnam except the Mekong Delta [WB: Vietnam, 1994;Tuan, 1997].
6.1.3. Indonesia.Wood is the dominant biomass fuel here. Few systematic surveys of woodfuel use within
the densely populated rural communities of Indonesia have been reported. Many of the surveyresults reported in Soesastro[1984] describe rural communities with very different woodfuel usepatterns. From these data a countrywide rural per-capita woodfuels use was calculated by
-- --
- 16 -
combining survey information for rural West Java and other rural Java with figures for the rest ofrural Indonesia, and weighting by the population of each sector. This rural per capita woodfuelconsumption together with an estimate of urban woodfuel consumption taken from Barnes andQian [1992] was used to calculate a weighted average of 1.0 kg/cap/day. This estimate falls inthe range of reported values (0.6 to 4.0 kg/cap/day) [Soesastro, 1984; WH94; Di Marzo, 1994;Kleeman, 1994] with many values clustering about 1.0 kg/cap/day (see Table 7). Our estimatelies on the low end of the range; we feel that survey information does not support the high esti-mates provided in other reports.
6.2. Agricultural Residues.From an agricultural perspective, the main features of Asia are the drylands in the Near
East separated from the tropical moist regions in the southeastern portion of the continent by theunusable lands of the Himalayan Mountains [Matthews, 1983]. There is a concomitant variationin crops from west to east. The main crops and residues grown in the drylands of the Near Eastare wheat, barley and cotton. Farther east, in Iran, Afghanistan, Pakistan, and northern India,sugar cane and rice are also grown. Rice, maize, and sugar cane are the major crops in SoutheastAsia [FAO, 1986a]. The distribution of these crop residues among the Near East, Mid East, andFar East is shown in Figure 2 (which does not include the crop residues in China and India, thedominant sources).
The farmers of the Near East and Middle East rely on the wheat and barley residues forlivestock feed [Ofori, 1989; Papendickand Parr, 1988; Jaradat, 1988], and also use the agricul-tural residues as household fuel in the wood-deficit mid-Eastern region [Ofori, 1989]. However,the rice straw and barbojo in the southeast Asian peninsula and archipelago are generally burnedin the fields [Ponnamperuma, 1984]. Estimates of agricultural residue burned within the regionsof Asia and in the large contributing countries are presented in Table 8.
6.2.1. Near East and Middle East: Residue as Fodder.Much of the farmland is located in rainfed drylands [Tully, 1989], and the main crops are
wheat, barley, (Figure 2) and pulses. Almost all the straw is gathered up after harvest for winterfeeding, and the remaining stubble grazed by sheep and goats [Papendick and Parr, 1988; Jara-dat, 1988]. The crop residue for livestock feed is sometimes more important than the grain forhuman consumption [Pearson et al., 1995]. In Iran, crop residues together with weeds provideabout 70% of the livestock feed and are almost completely removed from the land [Fenster,1989]. Within the drylands of Pakistan, no part of a crop is returned to the soil; the stubble isgrazed by the livestock [Khan et al., 1989]. In Turkey, one of the largest wheat producers in theMiddle East, the farmers traditionally burn the wheat and barley residue in the fields (Table 8)after the animals graze [Parr, personal communication; Whitman, et al., 1989].
6.2.2. Middle East: Residue as Biofuel.The use of agricultural residues as fuel depends mainly on the availability of woodfuels.
For the sizeable rural populations of wood-deficient countries such as Pakistan and Afghanistan,agricultural residues provide a large portion of the total biomass energy [Khan et al., 1989; deMontalembert and Clement, 1983]. In Turkey, quantities of bagasse are used as fuel in the sugarcane processing industry.
6.2.3. Southeast Asia: Residue Burned in Fields.
-- --
- 17 -
Crop residue is used only in small quantities for fuel with several exceptions (see below),and the burning of dung for fuel is practically unknown in Southeast Asia [Leach, 1987]. Insome regions large quantities of surplus rice straw are incinerated to clear the fields [Ponnam-peruma, 1984; Tanaka, 1974; Yoshida, 1978]. In southern Vietnam and the Philippines, farmersgrow more than one rice crop per year generating tons of residue which is then burned [Nguyen,1994, Yoshida, 1978]. On the central plains of Thailand, the floating rice area and surroundingdeep water areas produce rice plants more than two meters in height with significant straw waste,also burnt [Department of Agriculture, 1978]. Similar practices are reported for other countriesin the region, including Malaysia and Indonesia, but there are notable exceptions farther north.In Japan and the Koreas, rice straw is cut close to the ground and used as compost, fodder, andfuel, but rarely burned [Tanaka, 1974, Yoshida, 1978]. In north and northeastern Thailand andnorthern Myanmar and Sri Lanka, the straw is cut and fed to the animals [Department of Agri-culture, 1978; Tanaka, 1974]. An exception to the low residue fuel use is noted for Vietnam: innorth Vietnam rice straw is a principal cooking fuel in wood-deficit rural areas [WB: Vietnam,1994]. Also, in Bangladesh which has wood resources, the rural population traditionally usesresidues and dung for almost half of the household fuel supply [Islam, 1984].
6.3. China.China has the single largest impact on global biomass energy use. In China biofuel burn-
ing is generally confined to household use; commercial energy is used for industry [Wen andEn-Jian, 1983]. Fuelwood is a main source of rural energy and provides about half of the totalbiomass consumption [ESMAP, 1996]. Agricultural residues supply the other half, and drieddung accounts for just one percent [ESMAP, 1996]. Increasingly, however, coal and electricityare replacing the fuelwood and residue use as domestic fuels, and more residue is being burnedin the fields. For the model year of this paper, 1985, rural energy consumption was still based onuse of fuelwood, agricultural residues and dung, and the component of excess residue burned inthe fields was minimal.
6.3.1. Woodfuels.Despite the significance of the biomass energy use in China, little information had been
gathered on the structure of rural energy consumption until the mid-1980’s. Gao and Xu[1991]presented the results of a nationwide survey in 1986 and 1987 on fuelwood consumption andfuelwood deficit estimates in 26 of 29 provinces. Their work is in contrast to previous surveyswhich measured only the available forest resources allocated for consumption. The results ofGao and Xu compare favorably with other national and regional figures available as shown inTable 9; figures in Table 9 are not scaled to a common year estimate. All biofuel use estimatesexcept for one are from the 1980’s; the Gao and Xuwoodfuel estimate is mid-to-high within therange of estimates, and their residue estimate is midway within a narrow range of estimates.Gao and Xu’s estimates for fuelwood consumption in rural China by province are shown inTable 10.
6.3.2. Residues as Biofuel.Gao and Xu[1991] provided an estimate of total agricultural residue use as fuel in China.
We distributed this residue fuel use in the provinces using residue availability as a guide (Table10). However, the two northern provinces with large amounts of fuelwood available were
-- --
- 18 -
assigned a lower residue fuel consumption, despite high residue availability; this assumptionwas based on the finding that fuelwood was the preferred biofuel [ESMAP, 1996]. The resultingdistribution is supported by information on the fuelwood deficit in each region [Gao and Xu,1991].
6.3.3. Dung as Fuel.An estimate of dung use as biomass fuel was given by Gao and Xu[1991]. This was appor-
tioned among the rural population in the four westernmost provinces, based on the followingfactors: there is major use of animal wastes for energy there [Wen and En-Jian, 1983], forestcover is low [Changchun Institute of Geography, 1990], grain production is also low, but thedraught animal population is very high [State Statistical Bureau, 1992]. The ESMAP Study[1996] showed minimal use of dung in its survey of six counties in other provinces of China.
6.3.4. Residue Burned in Fields.All indications are that grain residue was not burned in the fields in China in 1985; other
uses such as fodder, domestic fuel, and fertilizer took priority [Te et al., 1985]. To account forburning of stubble in preplant clearing, we allowed for 1% burning of all grain residue, whichmay be high. For the preharvest burning of sugar cane, we estimated that only 10% of the bar-bojo is burned in the fields [J. Kadyszewski, personal communication]. We assumed that thewoody cotton stalks are used as household fuel.
6.4. India.6.4.1. Biofuels.Biofuel is the primary energy source in rural India. Dung use increases from south to north,
agricultural residue use increases from north to south, and fuelwood consumption reaches itshighest levels in the Eastern plateau and Eastern Himalayan Zones [Joshi et al., 1992]. A largenumber of surveys and studies of rural energy consumption were conducted in the 1980s for thepurposes of determining the extent of the rural energy crisis. The results of these studies wereanalysed by Joshi et al. [1992] as a function of agroclimatic zones, and the statewide use of eachbiofuel was then determined for 1991. We scaled these results to 1985 based on rural populationstatistics, and applied national mean estimates for Jammu and Kashmir for which no estimatewas given, as shown in Table 11.
6.4.2. Residue Burned in Fields.Crop residues are especially important as cattle feed in the semi-arid regions where much
of the land is cultivated and little grassland and pasture land remains [Rao, 1985]. In the north-ern wheat and barley growing zones and in mountain villages, the straw is used for fodder [Pal,1966; J. Parr, J. Day, pc, Negi, 1994]. The farmers of the northeastern provinces prefer to growtraditional rice with long straw as opposed to the short straw modern varieties because the strawis needed for water buffalo fodder [R. Huke, pc]. Similarly, farmers throughout India growwheat varieties which give good returns in straw to provide fodder [Pal, 1966]. In the northwest,the rice straw is mixed with cow dung for use as fuel. Elsewhere, sorghum straw provides amajor share of cattle feed [Oppen and Rao, 1982]. In some parts of India, millet is grownexclusively as a forage crop [Sampath, 1989]. However, residue is burned in the fields in India;for example, in Punjab [Meelu, et al., 1991; Jenkins et al., 1992; Salour et al., 1989; Desai,1985]. Rice straw in the central region around Hyderabad is also burned in the fields.
-- --
- 19 -
To estimate the amount of residue burned in the fields in each province in India, we usedcrop production data for each state (millet, Sivakumar et al. [1984]; maize, Reddy [1991]; wheat,Pal [1966]; rice, Pal [1972]; sugar cane, India [1971]; sorghum, Oppen and Rao [1982]. Joshi etal. [1992] provided estimates for province-by-province consumption of crop residue as biofuel.We took this into account in our assessment of how much residue would be burned in the fields.In addition, for the regions where wheat and barley residues were in abundance, we assumedmost residues are used as fodder, and that only 5% is burned in the fields. Maize stalks and ricestraw are more indigestible as fodder, and the burning of large quantities of rice straw is welldocumented; 35% of these residues was assumed to be burned based on advice from D. Pimen-tel [personal communication]. The cotton stalks are useful as household fuel [Townsend, pc],but, we assume a 5% burning in the fields for those areas which have other fuels, and where con-trol of cotton pests is needed. Sugar cane is grown mainly in central and southern India, and thebarbojo is needed for thatch; we assumed that 20% is burned [J. Kadyszewski, pc]. Residues ofthe agroindustrial processing are burned in the open (see Appendix 1).
7. Central and South America.The biomass resources of Latin America are abundant [deMontalembert and Clement,
1983]. Although biofuel use dominates fuel consumption in rural areas of Latin America, thesefuels provide a lower fraction of the total household energy use than in the other developing con-tinents [Meyers and Leach, 1989] since the population has larger income and greater access tomodern fuels [Leach, 1988]. In addition to sizeable forest resources and sugar cane residuesavailable as biofuels, Latin America also has large oil supplies in the northern countries andsignificant hydroenergy available from the Andes mountains [OLADE, 1981; deMontalembertand Clement, 1983].
Throughout Latin America firewood is the primary source of biomass energy [OLADE,1981]. Regions of woodfuel abundance are located mainly in the tropics, while zones of scarcityare found in the Andean mountains, in some arid semi-desert areas and in some of the denselypopulated sections of Central America and the Caribbean [deMontalembert and Clement, 1983].The countries of Argentina, Brazil, Chile, Mexico, and Venezuela have established forest plan-tations to produce wood for paper-making, household fuel use, and charcoal production [deMon-talembert and Clement, 1983]. Of the agricultural residues, bagasse has major significance as abiofuel, especially in Brazil [WH94]. Dung is also used as a household fuel in many rural high-land communities [Winterhalder et al, 1974].
Estimates of biofuels consumption in Latin America given in Table 12 are based on datafrom a variety of general and country-specific reports, drawn mainly from government sources:the FAO Fuelwood Report [deMontalembert and Clement, 1983], the LBL [Lawrence BerkeleyLaboratory] report [Meyers and Leach, 1989] with biofuels use estimates taken from FAO ForestProducts Yearbooks and from government documents, and the energy balances report for LatinAmerica [OLADE, 1981]. Other notable sources for Latin America were country-specificreports, many provided by the World Bank which contained biofuel estimates derived fromdetailed surveys (or projections based on earlier surveys), and data on forest resources andmodern fuels available.
7.1. Biofuels in Brazil.
-- --
- 20 -
Brazil is the third largest biofuels consumer in the world, following China and India (seeTables 4, 7, and 13). The biofuels consumed in Brazil include wood, charcoal and bagasse andrepresent half of all biofuels utilized in Latin America. We used the estimates in Brasilia [1987]in Table 12. Brazil is the world’s largest charcoal producer [WH94; Brito, 1997, Wood andBaldwin, 1985], and the largest global producer and consumer of bagasse [FAO, 1986a], whichis almost entirely burned in the sugar mills [Ogden et al., 1991; DeCarvalho Macedo, 1992].
Household consumption of biofuels versus modern fuels depends on income of the family,with firewood use decreasing as income rises [Behrens, 1986]. Charcoal use as household fuel issmall, no higher than 9% for any income group, and generally about 1% of total household fueluse [Behrens, 1986]. The use of agricultural residues as household fuel is not reported.
7.2. Biofuels in other Latin American countries.For the purposes of this discussion, the remaining countries in Latin America have been
grouped into the Andean zone (including neighbors), Central America, and the Caribbean regionand North Coast countries of South America. Mexico is discussed separately.
7.2.1. Mexico.Mexico is the second highest consumer of biofuels in Latin America (Table 12) and several
consumption estimates are available [Guzman et al., 1987]. We relied on the summary of Mar-tinez [1992] which describes energy use in the rural communities based on surveys in 1987[Secretaria de Energia, Minas e Industria Paraestatal (SEMIP), 1988]. For this comprehensivestudy, Mexico was divided into ten macroregions where energy supply and demand in the ruralpopulation is roughly homogeneous; these were divided into 38 subregions which were sur-veyed on both household-based and community-based energy use. The SEMIP report concludedthat firewood provides about 70% of energy consumed in the rural sectors. Rural per capita fuel-wood use varies significantly, from a low of 1.0 kg/cap/day in the Pacifico Norte region to 3.0kg/cap/day in the Pacifico Sur region, depending on the abundance of wood and the need forheating. No use of agricultural residues and dung as biofuels was mentioned. However, Guz-man [1987] noted that bagasse is burnt as fuel in the sugar mills.
7.2.2. Andean Countries and Neighbors.Rural populations in this region rely heavily on firewood [WB: Bolivia, 1994; WB: Ecua-
dor, 1994; WB: Peru, 1984; WB: Colombia, 1986; Division, 1986]. The Andean countries haveconsiderable hydroenergy resources [deMontalembert and Clement, 1983; OLADE, 1981] thatare used within the urban and commercial sectors but not by the rural population. Analysis ofcomprehensive surveys in Ecuador of over 1750 urban, suburban, and rural households indicatedthat woodfuels accounted for about 10% of urban household energy use and about 74% of ruralhousehold energy use [Del Buono, 1993, WB: Ecuador, 1994]. The highest rate of woodfuelconsumption is in Paraguay (about 2.9 kg/cap/day: [Division, 1986]) at two to three times therate of any other South American country [WB: Paraguay, 1984]. The industrial woodfuel usein Paraguay is second only to that of Brazil. This large fuelwood use may be explained by theabundant forest resources, and the low price of fuelwood compared to other Latin Americancountries [WB: Paraguay, 1984]. Per-capita consumption of fuelwood is the lowest among therural peoples in the Altiplano region [WB: Bolivia, 1994], a part of the Andes which extendsthrough Peru, eastern Bolivia and northern Chile and Argentina [Winterhalder et al., 1974;Heber, 1986]. In these highland zones with particularly rigorous climate, wood is scarce, and
-- --
- 21 -
dung is a main energy source [WB: Bolivia, 1994; Winterhalder et al., 1974; Heber, 1986].Dung provides some 19% of total biofuels in Bolivia [WB: Bolivia, 1994] and about 15% in Peru[WB: Peru, 1990] (Table 12). In the more densely populated urban environments of the Andeancountries and their close neighbors, households also use some biofuels, less than 10% of fuel usein Ecuador [WB: Ecuador, 1994] and Peru [WB: Peru, 1990] and under 20% in Bolivia [WB:Bolivia, 1994]. Paraguay is an exception in that many urban households use wood [Division,1986].
Charcoal is mainly consumed in the tin smelting mills in Bolivia [WB: Bolivia, 1994], inthe steel mills in Paraguay [WB: Paraguay, 1984], and in the ironworks and other small urbanindustries in Peru [WB: Peru, 1990]. Charcoal is used in limited amounts as a household fuel,primarily in urban environments [WB: Ecuador, 1994; WB: Bolivia, 1994; WB: Peru, 1990].
Bagasse is the main residue that is burned. Some sugar cane mills use other sources ofenergy for processing, and burn the accumulating bagasse as a waste product [WB: Bolivia,1994], but most reports suggest that bagasse is almost completely burnt as fuel in the mills [WB:Colombia, 1986; WB: Paraguay, 1984]. Other agricultural residues are burned as householdfuel in Bolivia [WB: Bolivia, 1994] and Ecuador [WB: Ecuador, 1994], and coconut shells andcotton residues are burned in agroprocessing industries in Paraguay [WB: Paraguay, 1984].
7.2.3. Central America.Per capita fuelwood use is higher in Central than in South America due mainly to the large
forest resources. Forests cover more than 34% of the land with the exception of El Salvador[Central Intelligence Agency, 1991]. As in the Andean countries, fuelwood provides most of thehousehold energy and is used largely for cooking. In Nicaragua, about 47% of the total energyrequirement from 1970-1982 was supplied by woodfuels [van Buren, 1990]. Charcoal use isnegligible in the rural regions of Central America, and is limited to the urban household andcommercial sectors [van Buren, 1990; WB: Honduras, 1987; WB: Guatemala, 1993; WB: CostaRica, 1984]. From the reports of Bianchi et al.[1990], consumption of agricultural residues forbiofuel is dominated by bagasse; other residues used in agro-processing plants are coffee husks,coconut shells, and oil palm kernels [WB: Costa Rica, 1984].
7.2.4. Caribbean and North Coast.Patterns of energy use are very similar among the Caribbean countries [Minott, 1992].
Biofuels are important, but the densely populated zones have limited forest resources [de Mon-talembert and Clement, 1983]. The primary energy needs are for sugar cane-processing andcooking; this explains the relatively high portion of biofuels (Table 12) supplied by bagasse andcharcoal, respectively [OLADE, 1981; WB: Jamaica, 1985; WB: Dominican Republic, 1991;WB: Haiti, 1991]. The major contributor in the North Coast region is Venezuela, an oil-richcountry. OLADE [1981] reports however, that firewood and charcoal are also used in coalplants and in the household sector.
7.3. Open-Air Burning of Residues.Very little has been published as to the extent of open air burning of agricultural residues in
Latin America. The standard practice on the sugar cane plantations is to burn the barbojo in apreharvest burn. [De Carvalho Macedo, 1992; Ball-Coelho et al., 1993]. We assume that this isthe case, unless reports indicate otherwise [Williams and Larson, 1993]. For Brazil, sugar caneproduction in each province is available [Fundacao Instituto Brasileiro, 1984]; we follow thesuggestion of Ball-Coelho [1993] that sugar cane residue is burned over 90-99% of the sugar
-- --
- 22 -
cane crop area of Brazil [Tiessen, pc] before harvest. We estimate that 50% of tobacco wastesare burned in the field as pest-control measures throughout Central and South America [Hall etal., 1993]. By law, cotton stalks must be destroyed as a pest control measure in Colombia; weuse the estimate of a 40% residue burn in the fields [Valderrama, pc]. For Mexico, Brazil, andArgentina, cotton stalks are mechanically destroyed and ploughed down after harvest [Jones, pc,Ramalho, pc, Cuadrado, pc]. In other countries of South and Central America farmers burn thecotton stalks in the field. Wheat residue is burned in northern Mexico [J. McIntire, pc]. Theremaining agricultural residues are either used as fuel, or fodder and mulch [Dewalt et al., 1993],or ploughed back into the soil [WB: Bolivia, 1983].
8. The Developed World.Although the focus of this paper is the developing world, we include estimates for the
developed world for the purposes of comparison (Table 13). National emission inventories forthe developed world sometimes include consumption from uses of wood fuel and agriculturalresidue [EPA (Environmental Protection Agency),1997, Benkovitz et al., 1996]. While estimatesfor woodfuel use and residue burning in the fields are included in some tables, they are notpresented in the global maps of biofuels and residue burning (Figures 4, 5, and 6).
8.1 Woodfuels.Although developed countries are significant contributors to the global fuelwood consump-
tion totals, wood is relatively unimportant in their energy budgets. Information on recent wood-fuel use in the United States and Canada is not readily available [R. Lowe, pc; S. Phelps, pc].The United States has estimates of state-by-state use through 1981 [Energy InformationAdministration, 1982], and also estimates for total woodfuel use in the United States, about 59Tg residential and about 116 Tg industrial for 1985 [Office of Technology Assessment (OTA),1991]. Emissions from burning of wood fuel are included in inventories given by the Environ-mental Protection Agency (EPA, 1997). The Canadian Forest Service provides profiles of fuel-wood use by province (4.8 Tg total), major consumers being paper mills in Quebec and Ontario[Canadian Forestry Statistics 1989, 1992]. An estimate for Australia of about 2.1 Tg woodfuelsuse is reported in the Statistical Yearbook for Asia and the Pacific[1987].
Forest residues are a nonnegligible source of bioenergy in Europe. [International EnergyAgency (IEA), 1987]. Information on woodfuels use in western Europe is reported in severalsources [IEA, 1989; International Energy Agency, 1987; WH94], giving a total of approximately100 Tg. France, Sweden, Finland, and Italy are the main contributors. For the former SovietUnion (FSU), estimates of biofuel use range from 703 PJ (about 43 Tg) for woodfuel [Bergsenand Levine, 1983] to 1720 PJ (in the range of 108 - 127 Tg) for all bioenergy [WH94]. We chosethe highest estimate for fuelwood use (108 Tg), as it is our experience that most estimates for theFSU tend to be on the low side. Blandon [1983] indicates that about 1.3% of the fuel needs ofthe FSU were met by firewood. While this is not a large fraction, it provides a substantial contri-bution to the woodfuels burned in the developed world (390 Tg). Our estimate for the woodfuelsused in the developed world is similar to that for the continent of Africa (Table 13).
8.2 Residues Burned in Fields.In the developed world in 1985, residues were also burned at reportable levels in the fields,
as discussed in Appendix 5. For Canada the only major residue subject to open field burning iswheat straw in Manitoba, Saskatchewan and Alberta [Dept of Agr: Manitoba: Virginia Knerr,pc]. In the United States, barbojo [Webb, pc] and some cereal residues are burned in the fields
-- --
- 23 -
[Jenkins et al., 1991, Seilhon, pc]. Emissions from the burning of these residues are included inthe emission inventories for the United States [EPA, 1997]. Many countries in western Europeban open field burning [Jenkins et al, 1992]. In 1985, however, the U.K. and several Mediter-ranean countries (i.e. Ezcurra et al., 1996) reported burning of cereal straw, ˜14 Tg residue. InAustralia, residues of wheat and coarse grains, as well as sugar cane, some 7 Tg, are burnt in thefields (National Greenhouse Gas Inventory, 1996). The only field burning we assumed for theformer USSR in 1985 was that of cotton stalks within the Central Asian Republics and as theseare needed for fuel during the severe winters [Silvertooth, pc], we estimated a minimal burningin the fields of 5%.
9. Error Estimate for Biofuel Use.The difficulties in calculating fuelwood use were described in Section 4. We assessed
uncertainty in our estimates by examining both the range of per capita estimates in the regionswith similar geoclimatic conditions (Tables 4 and 7) and standard deviations for per capita wooduse for countries with many reported estimates. To establish the range of fuelwood use, we chosethe minimum and maximum per capita use within a region as representative of all countries inthe region, discarding outliers. From the regional extrema, fuelwood usage for Africa was calcu-lated to be between 214 Tg DM/yr and 422 Tg DM/yr, compared to our best estimate of 295 TgDM/yr, giving an error of -30% to +40%. Applying the same method to Asia, our estimate forwoodfuels of 300 Tg dm/yr (excluding India and China) has a range of 181 - 585 Tg DM/yr, or-40% to +95%.
For most countries in Africa and Asia, we have too small a sample of per capita fuelwoodestimates to derive meaningful statistics. We consider the sample size large enough for Nigeria,Ethiopia, Kenya, Tanzania, and Zambia in Africa. The standard deviation for Tanzania is 0.8kg/capita/day; for the other four countries, the standard deviations cluster around 0.5kg/capita/day. The coefficient of variation (standard deviation/mean) for these countries isbetween 0.2 to 0.3. These are somewhat smaller than the error estimates based on the ranges.Data is even more sparse for the countries of Asia. For Indonesia, Thailand, and Bangladesh, wecompute coefficients of varation in per capita fuelwood use of 0.2, 0.5, and 0.7.
We adopted an error estimate of 40% for Africa and Asia, and also used this for LatinAmerica, where there are very few independent estimates. Our estimates for India and China arederived from single sources. If we adopt a 40% error for China and India, and add in a 40%error in charcoal estimates for Africa and Latin America, we derive a range for woodfuel con-sumption in the developing world of 860 to 2000 Tg dm/yr, with a central estimate of 1430 Tgdm/yr.
The uncertainties in quantity of residue used as fuel are extremely difficult to quantify.Sources of error include crop production figures reported in FAO [1986a], residue-to-crop ratios,the estimates of how much residue is needed for animal feed, construction, and mulch, and theerrors in the survey information we used. Clearly, the estimates of total residue production pro-vide a rough upper limit on the amount of residue that can be burned, either as fuel or in thefield. While we believe our estimates represent a significant improvement over prior workwhich prescribe a uniform fraction of residue to be burned, we caution that our estimates couldbe uncertain to at least ± 50%.
10. Spatial Distribution of Biomass Fuel Use and Burning of Agricultural Waste.
-- --
- 24 -
Each of these types of biomass burning: woodfuels (including charcoal), agricultural resi-dues (including dung) as biofuel, and crop residue burning in the fields, is spatially disaggre-gated on a grid of 1° latitude by 1° longitude as shown in Figures 3, 4, and 5. The same colorscale was used for each figure. Our major assumptions in distributing biofuels burning and openfield burning are that in the developing world, biofuels are used mainly by the rural population,and that crop residue accumulates in the farming regions. The development of the 1° by 1° mapsof rural population and cropland is given in Appendix 6.
10.1 Woodfuels.The 1° x 1° distribution of woodfuels (Figure 3) generally correlates withdensity of population, with the largest woodfuel use in southeast Asia, China, and India. InChina, the most densely (rural) populated central province of Sichuan uses the most woodfuels.The northeastern province of Bihar is the largest user in India. Woodfuels are also heavily usedthroughout the populated regions of Africa. For Nigeria woodfuels were distributed homogene-ously over the northern group and over the southern group of states, since the data was notsufficiently accurate to warrant a more detailed spatial distribution within each state. While thewest coast African countries are significant consumers, the Eastern Highlands region is a hotspot for the continent, reflecting the high per-capita use there. In contrast, woodfuels are usedmuch less in Latin America.
10.2 Residue Biofuel.The distribution of residues used as biofuels (Figure 4) is similar to that of the woodfuels
(Figure 3) because the same 1° x 1° spatial pattern was used. Comparison of the maps showsthat woodfuels consumption dominates over residue fuel use in the developing world. Althoughwoodfuels use in parts of Africa is of the same order as that in Asia, crop residue (and dung)biofuels use in Africa is much lower than that in Asia. Sichuan province in central Chinatogether with five states in the northeastern region of China have the highest biofuel use of resi-due in China. In the western provinces of China, where very little wood is used, dung is a pri-mary fuel. In India wood is more uniformly used north to south, but residue use is more heavilyconcentrated in two northern and two southern states. In Latin America woodfuels are moreheavily used than residues with the exception of Cuba where large amounts of sugar cane resi-due are used as fuel in the processing plants.
10.3 Residue Burned in Fields.Open field burning in the developing world is dominated by rice straw burning in southeast
Asia as shown in Figure 5. Field residue burning in Turkey and India are also significant contri-butors. Other obvious hot spots are the sugar cane growing provinces of Brazil, particularly thestate of Sao Paulo, where over 50% of sugar cane is grown. This burning area is corroborated bysatellite fire count data (ATSR World Fire Atlas, 2000) as reported in Duncan et al. [2000].Large quantities of sugar cane waste are also burned in the fields of Central America (e.g.,Cuba). The rest of Latin America shows minor open field burning. Similarly, in Africa, the onlynotable field burning occurs in the tropics; even this is relatively light.
11. Summary and Comparisons with Previous Work on Biofuels.11.1 SummaryBiomass Fuel UseA summary of our estimates of biofuel use is given in Table 13, broken down by type of
fuel and by continent. The table also includes our estimates for burning of agricultural residues
-- --
- 25 -
in the field. Our assessment of biofuel use indicates that about 2060 Tg of biomass fuel wasused in Asia, Africa and Latin America in 1985 (Table 13). The majority of biomass fuel in thedeveloping world is burned in Asia (66%), with China and India accounting for 71% of the theAsian total. Africa and Latin America use 21% and 13% of total biofuels respectively. Biofueluse in the developed world, 390 Tg, is about the same as that in Africa. Agricultural waste pro-vided about 33% of the biofuel use in the developing world in 1985, accounting for 39%, 13%,and 29%, in Asia, Africa, and Latin America (mainly bagasse use in Brazil). In India and China,agricultural waste represents about 41% and 51% of biomass fuel, reflecting fuelwood shortageand residue availability. These figures indicating widely diverse inter- and intra-continental pat-terns of biofuel combustion illustrate that simple assumptions of homogeneous woodfuel andresidue burning cannot account for the variations in this type of biomass burning in the develop-ing world.
Burning of Agricultural Waste in the FieldsCrop residues burned in the fields in the developing world total about 400 Tg (Table 13).
This is about 33% smaller than the amount used as biofuel in the developing world, 600 Tg. Theratio of residue used as fuel to that burned in the fields is 63:37 for Asia, 52:48 for India and98:2 for China, and 50:50 for Latin America and Africa.
From another perspective, the residue burned in the fields is approximately 20% of theavailable crop residue for the developing world (Table 14), with a breakdown of 18% for Asia,28% for Africa, and 23% in Latin America. Since the major crop producer in Asia is China, thispattern depends in large part on the practice of burning residue in fields in China (see below).Neither the average fraction for the developing world, nor those for the individual continents,reflect the widely differing practices of burning in the fields described in Sections 5 - 7. Asshown in Table 8, the fraction of residue burned in the fields in Asia ranges from 1% in China,16 - 30% in the Middle East and India, to 65% and 73% in the Philippines and Indonesia, respec-tively; for Africa, fractions range from 1% in the drylands in the north to 47% in the humidzone, with other regions in the 22-30% range (Table 6).
The residues which are the most significant contributors to field burning of agriculturalwaste are rice straw and barbojo (Table 14). While rice straw burning counts as the single larg-est component of agricultural burning in the fields in Asia, barbojo is the largest component inLatin America, and cereal and cotton residues the largest in Africa.
11.2 Comparisons with previous workWoodfuelsOur estimate of woodfuel use in the developing world, 1324 Tg/yr, is significantly larger
than the estimates of Seiler and Crutzen [1980] and Hao and Liu [1994], 743 and 620 Tg/yrrespectively (Table 1). The latter addressed the tropics only, and appear to have excluded theNear East, Middle East, and China. Both of these studies relied on the statistics reported in theFAO Yearbook of Forest Products for woodfuel use, which are thought to be low, as discussed inSection 2. Consequently, Andreae [1991] based his estimates on an average of the FAO esti-mates and a universal rate of woodfuel consumption, to give overall consumption of 1260 Tg/yr.While his estimate is close to ours, it was derived to give an improved, but rough, global esti-mate, rather than the detailed country-by-country assessment given here. All of the estimates(Table 1) show that Asia uses over half the woodfuels in the developing world. Our estimate for

-- --
- 26 -
Asia (784 Tg) is similar to that of Andreae [1991] (858 Tg). The estimates for Latin America(Table 1) are similar because they rely primarily on government sources for information. Thesesuggest that woodfuel use on this continent is relatively small, with the exception of charcoal usein Brazil (see Figure 3). For Africa we predict substantially higher woodfuels consumption thanearlier reports, with the exception of Andreae [1991].
Brocard et al. [1998] describe domestic woodfuel use in West Africa for 1990 using variousESMAP and ENDA (Environmental Development Action) surveys for estimates of rural andurban wood and charcoal use for most countries in the region and the Silviconsult Ltd. surveysfor northern Nigeria. Their rural (0.8-2.0 kg/capita) and urban (0.4-1.6 kg/capita) per capitafuelwood estimates are similar to our combined urban and rural fuelwood use (0.5-1.9 kg/capita)for the countries in the same region (see Table 4). Their total woodfuels combustion estimatesfor this region was 102 Tg DM, compared with our total of 113 Tg DM for the same countries.
Agricultural Residues as BiofuelEarlier estimates of biofuel use of agricultural residues (see Section 2) assumed a uniform
fraction of residue burned as biofuel in developing countries [Hao and Liu, 1994], or presentedtotal residue burned as a fraction of total residue available, without regard to whether it is burnedas a biofuel or field waste [Seiler and Crutzen, 1980, Crutzen and Andreae, 1990, Andreae,1991]. In contrast, we have shown that the practice of residue burning varies significantly fromregion to region. Our results are considerably lower than those reported previously, with theexception of estimates of Hao and Liu [1994], as shown in Section 2. We concur with Smil[1979] who has suggested that crop residue is used in significant amount as livestock fodder; insome regions this precludes any burning of crop waste whatsoever.
Biofuel by CountrySome reports present country by country estimates of biofuels used in the developing
world. The report of Woods and Hall [WH94] which does not specify the woodfuel and agricul-tural residue components of the biofuel use separately was described in Section 2. Streets andWaldhoff [1998] (henceforth SW98) compiled a biofuel inventory for 94 regions of Asia. Theirestimates, based on information gathered from many sources (some of which were used in thiswork, e.g. [Joshi et al., 1992] for India), provide a detailed breakdown by region of fuelwood,crop residue and animal waste as biofuels for the year 1990.
We compare the results of WH94 and SW98estimated for 1990 with our work (1985) inTable 15. This comparison is given in energy units, those used by WH94and SW98, as we couldnot readily convert the results of WH94 (which include all biofuels) to dry matter. The largestdiscrepancy between our estimates for Asia and those of WH94 and SW98is that for India.While we took the TERI [Joshi et al., 1992] estimates for biofuel use among the rural popula-tions in the provinces of India (we added in Jammu and Kashmir) and scaled them only by popu-lation for 1985, SW98used the TERI 1995 database and added in a component of biofuel use forurban populations. This may provide a more realistic estimate, in that some portion of the urbanpopulation uses biofuels. The difficulty is in determining a good estimate of urban use. WH94prescribed their default urban per capita estimate to be half of their default rural per capita esti-mate for the developing world while SW98simply applied the rural per-capita rate in majorcities like Calcutta. The SW98 estimate is likely to be high. A report on the fuel use in the urbanarea of Hyderabad suggests that biofuels are only used by one third of the urban population withthe remainder using commercial fuels [ESMAP, 1999]. The report also estimates the urban
-- --
- 27 -
woodfuels use in Hyderabad in 1982 to have been about 0.26 kg/cap/yr. Our estimate for Indiabased on rural population alone is likely to be low; if we use the ESMAP [1999] per capita esti-mate as representative of the urban population of India, our total woodfuels use would increaseby about 18 tg (or 282 PJ) for 1985. For individual countries like Indonesia and Vietnam, ourresults are more similar to those of SW98and much lower than those of WH94. If we project our1985 Asia totals for the year 1990 using a simple population ratio (Demographic Yearbook[1999]), we estimate that 1990 Asia biofuel use would be 22,606 PJ, just higher than the estimateof SW98(22,000 PJ for 1990), and significantly lower than WH94(29,700 PJ for 1990).
For Latin America, biofuel use given by WH94 is 10% lower than our estimate. Whiletheir estimate for Mexico is very similar to ours, their estimate for Brazil is 30% lower than ours.It is lower also than the FAO estimate for Brazil’s wood and charcoal use alone.
The WH94biofuel estimate for Africa in 1990 is 9160 PJ, 42% larger than ours, with thelargest contribution from Nigeria (2200 PJ). WH94 takes its woodfuels use estimate for Nigeria(969 PJ) from FAO Forest Products Yearbook [1990]. The total biofuel estimate of WH94(including residue use) is more than twice the FAO estimate for Nigeria. Our estimates of fuel-wood use in Nigeria (838 PJ for 1985) were based, in part, on the Silviconsult, Ltd survey[Hyman, 1994], mentioned above; this survey also included an estimate of the use of sorghumstalk residue as biofuel (about 2.2 Tg, or 30 PJ) in the northern provinces where the sorghum ismostly grown. Our estimate of crop residue used as biofuel for Nigeria is about 5.5 Tg, or 74 PJ.Given the sources we have examined, it is difficult to justify the large WH94estimate for biofueluse in Nigeria.
Burning of agricultural waste in the fields.Although the average fraction of residue burned in the fields in our work (20% in Table 14)
is similar to the uniform fraction adopted for the developing world by Crutzen and Andreae[1990] (25%) and Hao and Liu [1994] (17%) the earlier studies cannot provide a realistic geo-graphical distribution of very different burning practices. Comparing the developing continents(Table 14) and including China as the largest residue producer gives a range of 1 - 28 % of fieldburning of residues in the developing world.
12. Biomass Combustion Estimates for 1995.Using methods for estimating biomass burning in the developing world for the target year
of 1985, estimates for 1995 were calculated. For a simple update, we assumed that the changesin burning could be divided into two parts: those correlated with a change in population andthose tied to changes in crop production. Our assumption is that biofuel use is proportional topopulation, but that the amount of residue used as agroindustrial fuel in the processing of thecrop and the amount of residue burned in the fields increase as crop production increases. Wegive estimates for changes in quantities burned between 1985 and 1995 in Table 16.
We scaled the numbers appropriately by continent (with China, India, and Brazil estimatedseparately), using populations from the Demographic Yearbook [1999] and crop production datafrom FAO [2000]. Overall, the biomass fuel combustion increased by 20%, and residue burningin the fields by 22% for the developing world (Table 16).
Our projection for 1995 assumes that fuel availability did not change through 1995, thatfuel preference did not change (no increase in use of modern fuels and corresponding decrease inbiofuels), and that the habits of burning residue in the fields have been constant. This last
-- --
- 28 -
assumption may not be reliable. The use of mechanization in agriculture is increasing, asreflected in the major increase in the number of tractors in the developing world, 40% from 1985to 1995 [FAO, 2000]. One consequence of this trend is that the preharvest burning of sugar canetrash is a declining practice, at least in Brazil [H.Tiessen, personal communication], and likely inthe other regions of Latin America where tractors are common. On the contrary, in China wherethe rural population has greater access to coal as domestic fuel, Streets et al.[2001] report thatbiofuel use has declined from an estimated 9.2 EJ in 1990 to 7.6 EJ in 2000. In addition, theorganic composting of residue is declining with the increase in use of chemical fertilizers[Zhuang et al., 1996]. The residue must be disposed of before planting, which could correlatewith an increase in field burning. This change in practice is corroborated by remote sensingreports of increases in field burning of residues from rice, wheat, and maize in the Yangtze andYellow River plains [Dwyer et al., 2000]. In addition, a study on use of straw as fodder forruminants estimated that about 100 Tg of straw was burned in the field in 1999 [Suoping et al.,1996]. We derived an upper limit of field burning from an estimate of residue available fromrice, wheat, maize, and sugar cane crops in 1995, 634Tg [FAO,2000] by subtracting out cropwaste used as biofuel, 290Tg, and as fodder, 160Tg. We assumed that waste used as biofuel hasnot increased since 1985, and that 25% of crop waste is used as fodder [Tingshuang andZhenhai, 1996]. Our upper limit of field burning, 185Tg, would release 9.4 Tg CO, 40% of fieldburning emissions of CO in the developing world in 1985.
13. Emissions.Our estimates of trace gas emissions from biomass burning, CO2, CO, CH4, NOx (Tables
17 - 21) are calculated directly from estimates of biomass burned (see Sections 4 - 7) multipliedby appropriate emission factors (Tables 22, 23, 24). A discussion of emission factors is includedin Appendix 3; this appendix describes experiments measuring emissions of trace gases fromcombustion of wood, charcoal, agricultural residues and dung in different types of stoves in vari-ous developing countries, as well as those trace gas emissions from production of charcoal andfrom burning of agricultural trash in the field.
14.1. Biofuels CombustionOur estimate for the amount of total biofuel burned in the developing world in 1985 is 1959
Tg dry matter, distributed as 61% fuelwood, 2% charcoal, 30% crop residue, and about 7%dung (Table 17). We applied the appropriate emission factors for CO2 per species of biofuel inTable 22 to biomass burned; the resulting 2688 Tg/yr CO2 emitted plus 41 Tg/yr CO2 emittedin charcoal production gives about 2720 Tg CO2 released from biofuels use in the developingworld. Similarly, we estimate other trace gases emitted from biofuels use in the developingworld to be 156 Tg/yr for CO (including emissions from charcoal production), 9.7 Tg/yr forCH4, and 2 Tg/yr for N in NOx. In making these estimates, we applied emission factors fordomestic biofuels to industrial use of biofuel, since we lack data on the emissions from the latterfor developing countries. This assumption most likely gives an overestimate of approximately12 Tg/yr of CO in the developing world, as there is evidence that using charcoal in small ironblast furnaces and for the industrial processing of bagasse from sugar cane result in minimal COemissions [Walsh, personal communication, Kilicasian et al., 1999].
Differences in our estimates of trace gases emitted and those in other reports are correlatedwith differences either in amount of biofuel burned or in the choice of emission factors, or both.
-- --
- 29 -
For the region of West Africa, Brocard et al. [1998] reported estimates of 153 Tg CO2 and 7.9Tg CO released in woodfuel combustion which are similar to our values of 166 Tg CO2 and 8.4Tg CO for the same region. As discussed in Section 11.2, the Brocard estimates for fuel use[1998] are very similar to our estimates, and we use their emission factors for CO2 and CO emit-ted from woodfuel burning. Their estimate of 0.32 Tg CH4 differs from ours (0.51 Tg) in thatwe used a larger emission factor. In comparing our estimates of CO2 (527 Tg) and CO (26 Tg)released from biofuel for all of Africa with those of Marufu [1999] 1085 Tg and 65 Tg, respec-tively, we note that Marufu used higher CO2 and CO emission factors for biofuel burning (Table22), as well as the Hall-based biofuel consumption estimates for Africa [WH94], notably higherthan our estimates (Table 15). Olivier et al. [1996, 1999] give an estimate for global emissionsof CO from biofuel of 181 Tg in 1990, as part of the EDGAR 2 inventory. They relied onbiofuel estimates of Hall et al. [1994] for the developing world, which are higher than ours asdiscussed above, and used emission factors of about 75 gCO/kg for wood and 45g CO/kg foragricultural waste; their wood emission factor is similar to ours, but the crop waste factor is justabove half of our factor. Their estimate is similar to ours for 1985 if we allow for emissionsfrom biofuel use in the developed world, increasing our total for 1985 from 155 Tg to 177 Tg,but the similarity is a consequence of their use of higher biofuel estimates and a lower cropwaste emissions factor. The EDGAR 3 inventory has recently been released on-line, and givesestimates for CO from biofuel of 215 Tg for 1990 and 231 Tg for 1995 [Olivier and Berdowski,2001; Olivier et al., 2001; http;//www.rivm.nl/env/int/coredata/edgar/]. EDGAR 3 also relies onHall et al. [1994] for most of the developing world, but uses the OLADE statistics for SouthAmerica and emission factors given in IPCC [1997]. We believe that our estimates are morereliable than those given in EDGAR, because of their reliance on Hall et al. [1994] for biofueluse.
14.2 Emissions from Charcoal Production.Estimates of worldwide charcoal production range from 18.7 Tg for 1985 (21.2 Tg for
1995) [FAO, 1998] to 100 Tg [Smith et al., 1999]. The amount of CO emitted from these esti-mates (using the IPCC default 0.21kg pollutant/ kg charcoal produced--[Smith et al., 1999])would be 3.92 Tg and 21 Tg, respectively. Our charcoal production total is 31.6 Tg in thedeveloping world for 1985 (Table 18) with about 5.8 Tg CO emitted from this process, using theemission factors for different types of kilns in Table 23. For the other trace gases, we estimatedeveloping world totals of 41 Tg CO2, 1.94 Tg/yr CO, 0.38 Tg/yr CH4, and 0.003 Tg N fromNOx from this process. We compare our estimates for Brazil (11.4 Tg CO2, 1.94 Tg CO, 0.38Tg CH4) with those of Pennise et al. [2001] who estimated 8.6 Tg/yr CO2, 2.0 Tg/yr CO and0.31 Tg/yr CH4 emissions for 1996; we note that any agreement is fortuitous since not only aretheir estimates of charcoal production much lower than ours (6.4 Tg vs 11.8 Tg), but the emis-sion factors which they used are much higher [Pennise et al., 2001].
14.3 Emissions from Burning Residue in the Fields.On a global scale, the contributions to the total annual trace gas emissions from the field
burning of residues are comparatively small (0.5 Pg CO2, 23 Tg CO, 1 Tg CH4, and 0.2 Tg Nfrom NOx: see Tables 19 and 20). However, this type of burning can have major effects season-ally on a regional scale, for example, during the months of rice straw burning in southeast Asia,or sugar cane harvesting in Brazil. Clearly, the largest emissions come from Asia (rice straw),followed by emissions from the burning in Latin America (mainly barbojo), then from Africa
-- --
- 30 -
and the developed world.Olivier et al. [1996, 1999] give an estimate for CO emissions from agricultural waste burn-
ing in 1990 of 208 Tg, but this clearly reflects an error in their implementation of the results ofAndreae [1991]. This estimate is revised to 18.6 Tg for 1990 and 16.4 Tg for 1995 in EDGAR 3[http;//www.rivm.nl/env/int/coredata/edgar/]. Their new estimate assumes that constant frac-tions of agricultural waste are burned either as fuel or in the field, 30% in the developing world,and 20% in Eastern Europe and the former Soviet Union, and 5% in OECD countries [Olivier etal., 2001]. Their results are of about 25% smaller than ours, and we have shown that theassumption that a uniform fraction of waste is burned is not valid.
14. Comments and Conclusions.Biomass Fuel UseOur assessment of biofuel use indicates that about 2060 Tg of biomass fuel was used in the
developing world in 1985 (Table 13). This is equivalent to 880 Tg C (Appendix 2), and is 52%of the amount of fossil fuel burned on these continents in 1985, as shown in Table 21. We findthat similar amounts of biomass and fossil fuel are burned in Africa, while in Asia and LatinAmerica, the amount of biomass fuel is approximately half the amount of fossil fuel. Biofueluse in the developed world is about the same as that in Africa (Table 13); it is only 6%, how-ever, of fossil fuel use in the developed world.
EmissionsThe source of CO from burning of biomass fuel in the developing world, 150 Tg, is 40-50%
of that from fossil fuel combustion and industrial activity for the entire world, 300-400 Tg CO,as shown in Table 20. Emissions of CO from field burning of field agricultural residues, 23 Tg,is a relatively minor source of CO, as is charcoal manufacture, 6 Tg.
The source of CO2 from burning of biofuels in the developing world, 0.73 Pg C, is 14% ofthe global source of CO2 from burning of fossil fuels. Of the biofuel source, 0.5 Pg is fromburning of wood fuels, and the remainder from burning of agricultural residue and dung. Thelast two fuels do not provide a net source of CO2 to the atmosphere. The impact of the woodfuels source on the CO2 budget depends on the extent to which harvesting of wood is balancedby annual regrowth [e.g., Houghton et al., 1996].
The methane source of 10 Tg from biofuel and field burning of agricultural waste is a arelatively small source of CH4, and is much less that the source from other types of biomassburning, 23-55 Tg (Table 20). The source of NOx from biofuel and field burning is about 10%of the source from fossil fuel combustion. However, The biofuel source may be important on aregional basis, given the short lifetime of NOx.
ConclusionsBiofuels use in the developing world is dominated by about twenty major countries led by
China, India, Brazil, and Indonesia. Realistic assessments of the current biofuels use and thetrends in fuel use within these countries would be sufficient to provide a fairly good basis forestimating present and future emissions from biofuels use within the developing world.
In comparison with biofuels consumption, field burning of residue contributes a relativelysmall amount to trace gas emissions. However, we note that as China dominates in the produc-tion of wheat and rice, and that China is currently changing its customs of disposing of the resi-due from these grains and burning more in the fields, the contribution to the global trace gasemissions from the field burning of residue should increase significantly (Section 12).

-- --
- 31 -
Reliable estimates of trace gas emissions from biomass burning depend not only on goodestimates of the amount of matter burned, but also on good estimates of emission factors fromburning of household fuels together with comprehensive assessments of the conditions ofdomestic fuel use throughout the developing world.
-- --
- 32 -
Appendix 1. Agroindustrial Use of Residues.Sugar cane bagasse is the largest category of agroindustrial residues, followed closely by
rice hull residue [FAO, 1984, 1986]. Coconut shells, cottonseed and groundnut hulls, palm andcoffee residues accrue in much smaller amounts.
For sugar cane processing we relied on the work of Williams and Larsen [1993]. Bagasseis used as fuel in most of the sugar factories and alcohol distilleries worldwide [Williams andLarson, 1993; WB: Burkina, 1986; WB: Mali, 1991; WB: Swaziland, 1987; WB: Zambia, 1983;WB: Somalia, 1985; WB: Ethiopia, 1984; WB: Senegal, 1983; WB: Tanzania, 1984; WB: Kenya,1982; WB: Uganda, 1983]. Williams and Larsen [1993] indicate that factories usually aresufficiently inefficient so as to consume all available bagasse while processing the cane [c.f.,WB: India, 1991, WB: Burkina, 1986], so we assume that 100% of the bagasse is burned.
Rice hulls are a low density, low nutritive byproduct of the rice-processing industry and aregenerally considered a nuisance [Oyenuga, 1968; F. A. Bernardo, pc]. In many countries, ricehusks are consumed in the boilers of rice processing plants [WB: Indonesia, 1981, WB:Madagascar, 1987; Bernardo, pc]. They are also used as domestic cooking fuel [Waddle,1985; Islam et al., 1984; WB: Thailand, 1985] and for animal feed [WB: Madagascar, 1987],but there is also evidence that they are left in heaps to decompose [WB: Madagascar, 1987] orburned in the open [Roberts, 1973]. Estimates of how much is burned are rare. We interpretphrases such as "substantial quantities" [WB: Thailand, 1985] and "all" [WB: Indonesia, 1981] ofthe rice husks produced from milling operations consumed as fuel to mean 100% rice husk usedin the processing plants in southeast Asia. In India, rice processing plants are frequently diesel-powered, hence, rice hulls accumulate in piles around the mill and are burnt there [R. Huke, pc].We estimate that 40% of rice hulls are burnt outside the mills. For Africa whose rice productionis only 2% of the global total the WB reports for Mali [1991] and Madagascar [1987] suggestthat rice husks are used as an energy source in the factories, that small amounts are used forfodder, but that much of the residue is hauled away to decompose or burn. We assumed that50% is used as industrial fuel, 45% is burned in the open field, and 5% is left to decompose.
Coconut residues are the most important of the minor agricultural residues. The largestsuppliers of coconuts are Indonesia, the Philippines, Malaysia, and Sri Lanka. In many cases,the husks and shells are needed for open-fire drying of the copra [Thampan, 1987; Pushparajahand Soon, 1986; WB: Western Samoa, 1985; WB: Tanzania, 1984; WB: Vanuatu, 1985; WB:Solomon Islands, 1983], for the fuel in the boilers of the processing factories [WB: WesternSamoa, 1985; WB: Ivory Coast, 1985], for charcoal-making [WB: Ivory Coast, 1985; Push-parajah and Soon, 1986], and for domestic fuels [WB Benin, 1985; WB: Ivory Coast, 1985; WB:Western Samoa, 1985]. These sources provide some data on how much husk and shell may beburned. We estimate the use of coconut residue as boiler fuel to be 50-60%, with the reminderused for open-air drying of copra. Where specific estimates are given for such uses as charcoal-making and fish-drying [WB: Ivory Coast, 1985], we assume these figures to be estimates ofdomestic fuel use.
Cottonseed hulls are burned in processing industries, mainly in vegetable oil refineries[WB: Burkina, 1986], but also in sugar refineries [WB: Uganda, 1983] and breweries [WB:Malawi, 1982]. Some individual reports give estimates of the amount of cottonseed husks usedfor agroindustrial fuel, 30-75% in Togo and ∼ 100% in Ivory Coast [WB Togo, 1985; WB IvoryCoast, 1985]. We assumed that 75% of the waste is used as industrial fuel in cotton-growing
-- --
- 33 -
countries where quantitative information is lacking, and that the remaining 25% decomposes orburns in the fields [WB: Niger, 1984].
Groundnut hulls are often used as fuel in the groundnut processing plants [WB: Senegal,1983; WB: Gambia, 1983; WB: Sudan, 1983; WB: Thailand; 1985]. Estimates of this use varyfrom none in Mali [WB: Mali, 1991] and Guinea Bissau [WB: Guinea-Bissau, 1984] to 50%[WB: Senegal, 1983] and 100% [WB: Gambia, 1983]. Remaining groundnut hulls are left todecompose or burn [WB: Mali, 1991]. We assumed equal amounts were used as agroindustrialfuel and burned in the open (possibly near the plants) in the countries for which we had nospecific data.
Coffee residues are used as fuel in the boilers of the coffee processing industry [Silva et al.,1998]; in addition, the excess also accumulates at the processing mills [Senelwa and Hall, 1993;WB: Ethiopia, 1984; WB: Ivory Coast, 1985; WB: Guinea, 1986]. The detailed WB report forEthiopia describes the practice of piling the coffee cherry skins and husks outside the decortica-tion mills. At times, the internal temperature in the piles of husks gets so high that the decom-posing mix ignites spontaneously. Several other reports indicate only minimal fuel use. InUganda, the trucks which deliver the dry coffee cherry to the processing plants return to thefarms with the coffee hulls for mulch in the coffee gardens [Carr, pc]. Given this qualitativeinformation we have crudely apportioned the coffee residue use to be 50% decomposition and50% open air burning.
Malaysia, Indonesia, and Nigeria provide 80% of the world’s palm oil. In Malaysia, left-over fruit bunches are burnt on site at the mills [Philips, pc; Husin et al., 1987; Salam, 1987].Similarly, in Nigeria the fibre and shells are used as fuel in the steam boilers [Omereji, 1993];shells are also used as artisanal and household fuels [Ay, 1980]. Additional detailed reports onpalm oil processing in Benin [WB: Benin, 1985] and Togo [WB: Togo, 1985] suggest all residuein this industry is used for energy. We assume that 100% of palm processing residues areburned as part of the industry, except in Nigeria where we assume 100% of the empty fibrebunch and 50% the shells are burned as part of the industry, with the other 50% used for house-hold fuel.
Appendix 2. Units and Energy Values.To compare the amounts of biomass burned, all data were expressed in gravimetric units.
We converted woodfuel amounts in volumetric units to units of weight using conversion factorsof 1.4 m3/ton (15% moisture content), or 1.5 m3/ton, depending on whether the wood was moredense (in the more arid regions) or less dense (in regions with significant rainfall) (Openshaw,pc). If survey data included a volume to weight ratio, it superceded our default values.
Openshaw [1986] provides a detailed discussion of the factors influencing the energy con-tent of various types of biofuels. The moisture content for wood, and moisture and inorganiccontent (ash) for crop residues and dung are the main determinants of their energy values. Asthe moisture content of wood varies from wet to fully dried, the energy values range from 8.2MJ/kg to 18.7 MJ/kg [Openshaw, 1986]; for a default we chose 16.0 MJ/kg as the energy valuefor fuelwood, assuming a 15% moisture content (dry basis). For crop residue, the energy valuesrange from 5.8 MJ/kg for fresh (100% moisture) residue with 20% ash content, to 16.7 MJ/kg fora completely dry residue with 5% ash content; for our default residue energy value we haveselected 13.5 MJ/kg, for 10% ash content and 15% moisture content (dry basis). The energyvalues for dung range from 6.8 MJ/kg for wet matter and 25% ash content to 17.0 MJ/kg for
-- --
- 34 -
totally dry matter and 20% ash content; we chose as default, 14.5 MJ/kg. For conversion toamount carbon per amount dry matter, we used the multiplicative factors 0.45 gm C/gm DM forwood, 0.40 gm C/gm DM for crop residue, and 0.35 gm C/gm DM for dung [Smith et al., 2000],unless other conversions were indicated.
Appendix 3. Emission Factors.The emission factors of trace gases from biomass combustion are influenced by several fac-
tors including the actual amount of carbon in the preburned dry matter, the size, shape and mois-ture content of the sample, and the flaming versus smoldering pattern of the burning process[Ward et al., 1996]. Most published emission factors are based on emission ratios using a car-bon balance method which requires knowing the carbon content of the fuel. The carbon contentof the biomass fuel is inversely proportional to the moisture content and the non-carbon ash con-tent [Smith et al., 1993] which can range from 0.3% by weight (dry basis) for ponderosa pine to24% for rice straw left in the field over the winter [Jenkins and Ebeling, 1985]. Carbon in thepreburned biofuels or residue can vary from 35% by weight (for rice straw: Jenkins, 1993) to54% (South Africa leaves, Susott et al., 1991), but is often assumed to be about 50% [Marufu,1999, Smith et al., 1993]. Errors in the assumed carbon content can lead to discrepancies inemission factors calculated using the carbon balance method. This method equates the total car-bon in the preburn fuel to the sum of carbon in all its postburn forms, from the charred uncom-busted fuel to the volatiles [Ward and Radke, 1993; Smith et al., 1993]. Published emission fac-tors for CO2 are 1393 - 1620 gm pollutant/kg biofuel with carbon content ranging from 41.8 - 50% [Smith et al., 2000; Zhang et al., 2000; Brocard et al., 1998; Smith etal., 1993; Marufu,1999]; if we adopt a 50% carbon content, the emission factor range is reduced to 1551 - 1664gm CO2/kg biofuel. The distribution of carbon in the products from biomass burning: CO2,CO, CH4, NMHC, TSP, ash, and uncombusted fuel, is strongly influenced by the temporal pat-tern of flaming and smoldering (more and less efficient combustion, respectively) in the burningprocess [Brocard et al., 1998, Marufu, 1999, Jenkins and Turn, 1994, Ward, et al., 1996].
Biofuels.Several groups have designed experiments which replicate conditions commonly found in
the combustion practices in developing countries in order to characterize emission factors forbiofuels [Zhang et al, 1999; Brocard et al., 1998; Marufu, 1999; Bertschi et al., 2002]. Marufuand Brocard et al. used stoves common to Zimbabwe and West Africa, depression-in-the-groundand three-stone stove, respectively; Zhang et al. [1999] examined burning of 56 combinations offuels and stoves commonly used in India and China, and Bertschi et al. [2002] studied traditionalcooking fires in rural Zambia.
We display the results reported by these and other groups in Table 22. We included thepercent carbon measured or assumed for the biofuel in the first column, if available. Marufu[1999] assumed 50% carbon; we used the carbon balance to calculate the CO2 and CO emis-sions if he had assumed the values of Zhang et al. [2000] and Smith et al. [2000]: 45% C in fuel-wood, 33.4% C in dung and 34.8% C in maize residues. Using the measured carbon contentbrings the results of Marufu closer to those of Zhang et al. [2000] and Smith et al. [2000], exceptfor crop residues. In comparing emission factors in Table 22, we observe that the range of fac-tors reported from the experiments of Zhang et al. [2000] and Smith et al. [2000] encompass thefactors published in the other reports, at least for fuelwood combustion. We note that within the

-- --
- 35 -
developing world, domestic fuel burning involves using wood with different carbon and mois-ture content with different methods of flaming and smoldering, depending on the need to con-serve fuel; we do not have information on the how these variables change, region to region. Theexperiments described above use various techniques to measure the products of burning andmake different assumptions of carbon dispersal. More careful assessment of traditional practicesof household fuel use in the developing countries is needed, together with corresponding experi-ments to monitor trace gas emissions from this burning.
To derive estimates of these emissions, we propose the following: biofuels used in house-hold combustion are usually air-dried (giving them higher moisture content than oven-dried sam-ples used in experiment) and also frequently include brush and twigs with higher ash content(Jenkins, personal communication) which argues for fuel with a lower carbon content; weselected 45%. We then chose the emission factors of Brocard et al. [1998] from experiments inWest Africa of 1467 and 70 gms pollutant/kg dry fuel for CO2 and CO, respectively; these areclose to averages of the mean for India [Smith et al., 2000] and for China [Zhang et al., 2000](Table 22). For the emission factors of CH4, NO2, and TSP, we averaged the mean values ofSmith et al. [2000] and Zhang et al. [2000], since Zhang et al. [2000] note that these fuel/stovecombinations represent a large fraction of combinations in use worldwide. The spread of valuesfor emission factors of CH4 and NOx is much larger than those of CO.
The charcoal burning emission factors are taken from the results of Smith et al. [1993]except for NOx which is from the review of Andreae and Merlet [2001]. Two independent stu-dies on combustion of dung [Smith et al., 2000, Marufu, 1999] give very similar emission factorsfor CO and CO2, when adjusted to the correct carbon content; we chose the values from Smith etal. [2000]. For the other gases, we used the work of Andreae and Merlet [2001]. While the rangeof values for residue burning is large, mean emission factors for CO2 and CO from combustionof rice straw, mustard stalk, maize residue, and wheat straw are similar. We used the Zhang et al.[2000] values for all emission factors, except for CO2; for this we took the Smith et al. [2000]as it is close to the other results given in Table 22.
Charcoal Production.Emissions of atmospheric gases during charcoal production depend on the type of kiln used
[Openshaw, 1986, Smith et al., 1999], as well as the type and moisture content of wood used,and the skill of the operator [Foley, 1986, Openshaw, 1986]. Since emission factors are oftenexpressed as amount of trace gas per amount of charcoal produced, and information on charcoalproduction is given in terms of amount of wood used for charcoal production, knowing theefficiency of the conversion process is essential to calculate the trace gas emissions. Kilns in thedeveloping world range from the traditional earth mounds or pits with efficiencies as low as 10%[Foley, 1986] to industrial kilns with efficiencies of up to 33% [WH94].
In Africa, the earth mound kiln is used almost exclusively (Africa: Smith et al., 1999, WestAfrica: Brocard et al., 1998, Zambia: Hibajene et al., 1993, Malawi: Openshaw, 1997, Kenya:Kituyi et al., 1999, Pennise et al., 2001, Senegal and Tanzania: Foley and van Buren, 1982).From World Bank reports for the 1980’s the estimates of efficiencies for these kilns varied from9% to 20%, and were lower than those given in the 1990’s (20-29%) [Smith et al., 1999; Brocardet al, 1998; Openshaw, 1997; Hibajene, 1993]. We chose an estimate of 15% efficiency (20%efficiency for Sudan) for our charcoal numbers for 1985, and used the emission factors of Bro-card et al. [1998] as representative of all the kilns in Africa (see Table 23).
-- --
- 36 -
Smith et al. [1999] described the types of charcoal kilns used in Thailand and suggestedthat these are representative for Asia; the efficiencies of these kilns ranged from 29.4 to 33.3%.From other sources, we have estimates of 18 - 25% efficiency for kilns in Asia [WB: Vietnam,1994; WB: Burma, 1985; IPCC Reference Manual in Smith et al., 1999]. We chose anefficiency of 25% for Asian kilns, unless specified for an individual country and used the char-coal production emission factors from Smith et al. [1999] (see Table 23).
Most of the charcoal used commercially in Brazil is produced in brick or mud beehive kilnswhich have an efficiency of 33% [WH94]. We used emission factors for production in brickbeehive kilns from Smith et al. [1999] for Brazil, as well as for the commercially produced char-coal for the steel and iron industries of Bolivia, Peru, and Paraguay. The recent report of Pen-nise et al. [2001] presents studies on emissions from Brazilian kilns which may provide morerealistic emission factors than those we chose. For charcoal produced for domestic use in LatinAmerica, we adopted the kiln efficiency of 17% reported in van Buren[1990] and used the IPCC(1997) default world average emission factors (Table 23).
Open Field Burning.The emission factors for CO2 from residue combusted in the open field (Table 24) are simi-
lar to those for residue used as biofuel (Table 22). The open field burning emissions of CO andCH4 tend to be much lower than those measured for biofuel. Given that the moisture and ashcontent are very similar (Jenkins and Turn, 1994; Zhang et al., 2000), we can explain the differ-ences by postulating that a larger proportion of uncombusted fuel remains. A variety of tech-niques have been used to measure emissions from burning of agricultural waste. Ezcurra et al[1996] used an aerosol dilution chamber to burn samples of cereal straw while Jenkins and Turn[1994] burned samples of barley, corn, rice, and wheat residues on a conveyor belt in a combus-tion wind tunnel; Nguyen et al. [1994] measured gaseous emissions during burning of rice strawout in the fields in both the wet and dry seasons, but did not provide the biomass loading.
We present all emission factors in units of gm pollutant/kg dry matter to be burnt in Table24 and compare the values for straw burning with estimates for mean values for savanna burninggiven by Andreae and Merlet [2001]. The residues which are the most significant contributors tofield burning of agricultural waste are rice straw and barbojo (see Table 14). We determinedemission factors for the burning gases by weighting the emissions factors for rice straw [Jenkinsand Turn, 1994], barbojo, and other cereals by the fraction of global burning in fields ascribed tothe three components (weighting of 40:31:20 %) Our chosen emission factors fall within theranges presented in Table 24 for CO2 and CO, are somewhat high for NOx (reflecting the dom-inant rice straw burning), and are typical for TPM.
Appendix 4. Decomposition.Decomposition of residues left in the fields after harvest is influenced by substrate composi-
tion and the environment, particularly temperature and moisture [Bell, 1974]. The tropicalregions provide optimal conditions for microbial decomposition of plants. In a simple view, thesequence of the breakdown of plant matter is that the soluble organic matter (the carbohydratesin the form of starches and sugars) decompose most rapidly, followed by the proteins in the formof cellulose and hemicellulose, and finally the woody part of the stalk, known as lignin [Bell,1974]. Since the leafy portion of the residue decomposes very quickly in the tropical rain forest[Bates, 1960] (100% decomposition), we confine our discussion to the stalks and straw of fourmajor crops: maize, millet, sorghum, and rice.
-- --
- 37 -
For all four types of stalk and straw we assume that the soluble organic matter totallydecomposes between the crop harvest and the next preplant burn [Martin et al., 1942; Satchell,1974], and that the lignin portion of the residue (about 10%) remains almost entirely intact[Martin et al., 1942] and burns in the pre-plant burn. The remaining matter, the hemicelluloseand cellulose portion, only partially decomposes [Swift et al., 1979].
For the case of the maize stalks, lignin represents about 8.5% of the dry weight of the stalk[Muller et al., 1971], hemicellulose about 18%, and cellulose about 30% [Swift et al., 1979].From experiments on decomposition rates over 40% of the cellulose and hemicellulose havedecomposed after 30 days [Swift et al., 1979]. Using these data, we estimate that 62% (includingthe soluble organic matter) of the stalks left in the fields decompose, and that the remaining 38%is burned before planting.
The soluble cell content of millet straw is approximately 24% and that of sorghum strawabout 30% [Reed, 1992; Alhassan, 1990]. Assuming that 40% of the hemicellulose and cellu-lose decomposes for these residues also, we estimate that 52% of millet and sorghum stalksdecompose, and 48% burn in the fields.
Quantitative information on the decomposition of rice straw was unavailable, so we basedour estimates on wheat straw [Swift et al., 1979], for which about half the straw decomposes.The remaining 50% is assumed to be burned in the fields, unless other information is available.For the southeast Asia region where several rice crops are grown per year, we presume that withno time for decomposition of the residue, most of the rice straw is burned.
Appendix 5. Open Field Burning in the Developed World.Here we discuss burning of crop residue in the United States, Canada, countries in Western
Europe, and countries of the former Soviet Union (FSU).Open field burning of barbojo and cereal residues occurs in parts of the United States.
About 90% of the barbojo is burned in the four sugar cane producing regions (Hawaii, PuertoRico, Florida, Louisiana) [Walter Webb, pc: Paul Seilhon, pc]. Of the cereals, over one Tg ofrice straw, ∼ 90%, is burned in California [Jenkins et al., 1991; Seilhon, pc (EPA report of1992)], but only small amounts are burned in the southern states (e.g. 7.5% in Louisiana, 1% inTexas), due to the much faster decomposition of the straw in the warmer, wetter climate of thesouth (P. Seilhon, pc). Estimates of the burning of wheat stubble for 1985 range from minor (0-5%) in the southwestern states of Colorado, Arizona, and New Mexico (R. Young, pc) to 5-20%in Missouri, Kansas, Louisiana, Tennessee (Fjell, pc; R. Fears,pc), to ∼ 30% in Montana andNorth Dakota where it is colder and drier and decomposition is slow [Knerr, Gallatin CountyExtension, pc]. Corn residue in the midwest states is left to decompose in the fields (Dudley, pc).Cotton stalks in Texas and California are ploughed under to prevent growth of pests [Crane, pc;Jenkins et al., 1991]. Grass-seed residue is burned in Oregon, the major grass seed producer inthe U.S. [R. Fears, pc; W. Young, pc: Young, 1998].
The major grain-producing provinces in Canada are the large wheat-growing states of Man-itoba, Saskatchewan, and Alberta. Estimates of wheat straw burned are less than 10% for 1985[Agricultural Representative: Dept of Agriculture, Manitoba].
The agricultural wastes burned in Australia are residues of wheat, coarse grains, and sugarcane [Hurst et al., 1995; NGGIC, 1996, Gupta et al., 1994; Canteromartinez et al., 1995]. Weused the state-by-state profiles of crop production for 1990 of the Australian National Green-house Gas Inventory [NGGIC, 1996] for distributing the FAO estimates of Australian production
-- --
- 38 -
of wheat, coarse grains, and sugar cane in 1985 (FAO, 1985). In addition, the inventory con-tained estimates of residue-to-crop ratio, per cent dry matter, and fraction of residue burned inthe field for each crop. We used these estimates in constructing our distributions of agriculturalwaste burned in the fields, even though, in the case of sugar cane, there were unresolved differ-ences between estimates of the Australian NGGIC (1996) and the ones suggested by the UnitedStates EPA (EPA, 2000).
There is a general trend to prohibit burning in western Europe [Jenkins et al., 1992]. How-ever, in the United Kingdom up to 1989, approximately 30% of barley and wheat straw residue(or about 6 Tg) was burned annually [Jenkins et al., 1992]. Ezcurra et al.[1996] document theburning of more than 6 Tg of cereal waste in Spain. In Greece, the burning of up to 80% ofwheat straw (about 2 Tg) occurs [Kalburtzi, pc; Kalburtzi et al., 1990].
For the FSU in 1985, a portion of the crop residue was used as animal fodder [S. Zhourek,pc]. Much of the remaining residue is taken off the field and piled in heaps and left to decom-pose. In Kasakhstan, combines collected the straw and left it in piles and the leftover stubblewas ploughed under; the rice straw in the Dnieper River region was not burned [K. Gray, per-sonal communication]. We assumed that the cotton stalks were burned mainly as fuel, but inminor amount as trash in the fields; since 80% of the FSU cotton was grown in the five CentralAsian Republics [FAO, 1995], we have concentrated it there. From recent AVHRR data compo-site fire images over southern Russia indicate major burning (C. Heald, pc) in March; these firesmight be preplant burning of agricultural trash leftover from the previous year’s harvest. Morecareful analysis is needed to determine if this should be added in to the agricultural residue burn-ing estimate.
Appendix 6. Spatial Distribution of Biofuel Use and Agricultural Waste Burning.Biofuel use within each country (and province for China, India and Brazil) was spatially
distributed using a map of rural population density that we developed specifically for this pur-pose. We used a digital data base developed at the NASA Goddard Institute for Space Studies[Lerner et al., 1988], which labels each land 1° x 1° cell of the world with a code identifying thecountry. China, India and Brazil are sub-divided into their major political entities. Nationalpopulations for 1985 were taken from the UN Demographic Yearbook [1992], and those for thesubdivisions from Encyclopedia Brittanica [1987]. The rural fraction of the population, and theagriculturally active population in each country was taken from the same sources.
Two other global 1° x 1° data bases were used to distribute the rural population within eachcountry, the first to identify habitable land [Lerner et al., 1988], and the second to locate regionsof crop production [Ramankutty and Foley, 1998]. Habitable land was identified using a database developed for the purpose of locating animals; in this case, each grid cell was assigned touse either by animals, lumber industry, ice, or no use at all [Lerner et al., 1988]. We consideredgrid cells designated as animal use and lumbering to be habitable. In countries which wouldcontain no habitable area in this plan, we reassigned certain cells as habitable based on publishedpopulation maps [e.g. Times World Atlas, 1990]. The locations of agriculture were identifiedusing a global map of croplands distribution that detailed the crop fractions within gridboxes offive minute by five minute resolution; these had been determined by analyzing seasonal varia-tions in vegetation indices for AVHRR data [Ramankutty and Foley, 1998]. We note thatalthough the cropland cover within a gridbox provides a suitable surrogate for locating the farm-ing population of a country, it does not give information as to the density of the agricultural
-- --
- 39 -
population or the density of crops. This is a source of error in distributing both the biofuel use(population based) and amount of residue burned in the fields (crop based).
We assume that the major users of biofuels are the rural population. Within each country,the agriculturally active portion of the population was distributed equally within the agriculturalcells and the remaining rural population was apportioned over all habitable cells. For China,India, and Brazil, the population was distributed in the appropriate province. The burnedbiomass in each country (or province) was then spread among the appropriate cells using thepopulation density, to generate Figures 3-5. The burning of crop residues in the fields was distri-buted directly according to the croplands map [Ramankutty and Foley, 1998].
-- --
- 40 -
We extend our sincere appreciation for the detailed advice and information provided by Dr.Keith Openshaw in assessing woodfuel and charcoal use in Africa and Asia. We acknowledgeuseful discussions with Doug Barnes on biofuel use in China and in urban environments. Spe-cial thanks are due to Judith Bradow for providing many interesting facts on cotton productionboth nationally and globally. We thank James Parr for sharing his expertise on fodder use ofcrop residue in northern Africa and the Near East. We benefited from conversations with JohnKadyszewski on characteristics of sugar cane burning worldwide. We would like to thankBryan Jenkins who supplied detailed reports and explanations of experiments to determine emis-sion factors of trace gases from field burning of crop residues. We appreciated both the anecdo-tal and quantitative information from the late David Hall. Finally, we gratefully acknowledge theassistance of the World Bank in providing many of their reports on energy use in developingcountries. This work was funded with support from the National Science Foundation, grantsATM-9320778 and ATM-9903529, and from the National Aeronautics and Space Administra-tion, including grant NAG1-2025.

-- --
- 41 -
REFERENCES.
Abu Sin, M.E. and H.R.J. Davies (eds.), The Future of Sudan’s Capital Region: a Study inDevelopment and Change, 273pp., Khartoum University Press, Khartoum, Sudan, 1991.
Alhassan, W.S., The potential of sorghum straw as a livestock feed in Nigeria, in Industrial Util-ization of Sorghum, Summary Proceedings of a Symposium on the Current Status and Potentialof Industrial Uses of Sorghum in Nigeria 4-6 December 1989, Kano, Nigeria, InternationalCrops Research Institute for the Semi-Arid Tropics (ICRISAT), Zaria, Nigeria, 1990.
Andreae, M.O., Biomass burning: its history, use, and distribution and its impact on environ-mental quality and global climate, in Global Biomass Burning: Atmospheric, Climatic and Bios-pheric Implications, ed. J.S. Levine, MIT Press, Cambridge, Massachusetts, 1991.
Andreae, M.O. and P. Merlet, Emission of trace gases and aerosols from biomass burning, sub-mitted to Global Biogeochemical Cycles, 2000.
Andreae, M.O., E. Atlas, H. Cachier, W.R.Cofer III, G.W.Harris, G.Helas, R. Koppmann, J-PLacaux, D.E. Ward, Trace Gas and Aerosol Emissions from Savanna Fires, pp 278-295 inBiomass Burning and Global Change, Volume 1: Remote Sensing, Modeling and InventoryDevelopment, and Biomass Burning in Africa, ed. J.S. Levine, MIT Press, Cambridge, Mas-sachusetts, 1996a.
Andreae, M.O., E. Atlas, G.W. Harris, G. Helas, A. de Kock, R. Koppmann, W. Maenhaut, S.Mano, W.H. Pollock, J. Rudolph, D. Scharffe, G. Schebeske, and M. Welling, Methyl halideemissions from savanna fires in southern Africa, in J. Geophys. Res., 101, D19, 23603-23613,1996b.
Areola, O., Ecology of Natural Resources in Nigeria, 258pp.,Aldershot, Avebury Publishing,Hants, England, Gower Publishing, Brookfield, Vt., 1991
Arnold, J.E.M. and J. Jongma, Fuelwood and charcoal in developing countries: an economicsurvey, Unasylva 29, 2-9, 1978.
ATSR World Fire Atlas, European Space Agency - ESA/ESRIN,via Galileo Galilei, CP 64,00044 Frascati, Italy. 2000. webpage: http://shark1.esrin.esa.it/FIRE/AF/ATSR/
Ay, P., Fuelwood and charcoal in the West African forest: field research in Western Nigeria, inRural Energy Systems in the Humid Tropics, Proceedings of the First Workshop of the UnitedNations University Rural Energy Systems Project, 10-12 August, 1978, Ife, Nigeria, 56pp., W.B.Morgan, R.P. Moss, and G.J.A. Ojo (eds.), The United Nations University, Tokyo, 1980.
Baguant, J., The case of Mauritius, in Energy Management in Africa, J.Baguant, M. Teferra, L.Mohapeloa, P.M. Noike, and B.A. Okech, 180 pp., Zed Books Ltd, London and New Jersey,
-- --
- 42 -
1992.
Ball-Coelho, B., H. Tiessen, J.W.B. Stewart, I.H. Salcedo, and E.V.S.B. Sampaio, Residuemanagement effects on sugarcane yield and soil properties in Northeastern Brazil, Agron. J. 85,1004-8, 1993.
Banwell, P.S., and R.C. Harriss, Enhancing biomass energy use in Kenya, in Nat. Res. Forum,298-307, 1992.
Barnard, G. and Kristoferson, L., Agricultural Residues as Fuel in the Third World, 178pp.,Earthscan Publications, London, 1985.
Barnes, D.F. and L.Qian, Urban interfuel substitution, energy use, and equity in developingcountries: some preliminary results, Presented at the International Conference of the Interna-tional Association for Energy Economics, Honolulu, Hawaii, July 8-10, 1991.
Barnes, D.F., K. Krutilla, and W. Hyde, The urban energy transition: energy, poverty, and theenvironment in the developing world, Draft Manuscript, World Bank, Washington DC, 2001.
Bashou, S.A., New approaches to the development and utilisation of renewable energy resourcesin Uganda, in African Energy: Issues in Planning and Practice, 157pp., Zed Books, London,1990.
Bates, J.A.R., Studies on a Nigerian forest soil, the distribution of organic matter in the profileand in various soil fractions, J. Soil Sci. 11, 246-257, 1960.
Behrens, A., Total energy consumption by Brazilian households, Energy 11, 607-611, 1986.
Bell, M.K., Decomposition of herbaceous litter, Chapter 2 in Biology of Plant Litter Decomposi-tion Volume I, C.H. Dickinson and G.J.F. Pugh, (eds.), Academic Press, London and New York,1974.
Benkovitz, C. M., M. T, Schultz, J. Pacyna, L. Tarrason, J. Dignon, E. C. Voldner, P. A. Spiro,J. A. Logan, and T. E. Graedel, Global gridded inventories for anthropogenic emissions of sulfurand nitrogen, J. Geophys. Res. 101, 29,239-29,253, 1996.
Bergsen, A. and H.S. Levine, (eds.), The Soviet Economy: Toward the Year 2000, 452pp., G.Allen & Unwin, London and Boston, 1983.
Bhagavan, M.R., Angola, in Energy and Development in Southern Africa: SADCC Country Stu-dies Part I, P. O’Keefe and B. Munslow (eds.), Beijer Institute, Royal Swedish Academy of Sci-ences, Uppsala, Sweden, 1984.
Bianchi, A., V.S. Bogach, G. Best, and M. Wionczek, Energy in Latin America, 138pp., Wiley

-- --
- 43 -
Eastern Limited, New Delhi, United Nations University, Tokyo, International DevelopmentResearch Centre, Ottawa, 1990.
Blandon, P., Soviet Forest Industries, 290pp., Westview Press, Inc., Boulder, 1983.
Bogach, V.S., Wood as Fuel: Energy for Developing Countries, 153pp., Praeger Publishers,New York, 1985.
Bogach, V.S., Energy options in Central America, in Energy in Latin America, A. Bianchi, V.S.Bogach, G. Best, and M. Wionczek, 138pp., Wiley Eastern Limited, New Delhi, United NationsUniversity, Tokyo, International Development Research Centre, Ottawa, 1990.
Brasilia: Ministerio das Minas e Energia, National Energy Balance, 1987, Ministry of Minesand Energy, Brasilia, Brazil, 1987.
Brito, J.O., Fuelwood utilization in Brazil, Biomass and Bioenergy 12, 69-74, 1997.
Brocard, D., J.P. Lacaux, H. Eva , Domestic biomass combustion and associated emissions inWest Africa, Global Biogeochemical cycles 12, 127-139, 1998.
Canadian Forestry Statistics 1989, Statistics Canada, Industry Division, Ottawa, 1992.
Canteromartinez, C., G.J. Oleary, D.J.Connor, Stubble retention and nitrogen fertilisation in afallow-wheat rainfed cropping system .1. soil water and nitrogen conservation, crop growth andyield, Soil & Tillage Res. 34, 79-94, 1995.
Cecelski, E.,J.Dunkerley, and W. Ramsay, Household Energy and the Poor in the Third World,Resources for the Future, Inc., Washington, D.C., 1979.
Central Intelligence Agency, World Factbook, 1984, Central Intelligence Agency, Washington,D.C., 1984.
Central Intelligence Agency, World Factbook, 1991, Central Intelligence Agency, Washington,D.C., 1991.
Christensen, J., North east arid zone development programme: NEAZDP, in The Sahel: Popu-lation, Integrated Rural Development Projects, and Research Components in Development Pro-jects : proceedings of the 6th Danish Sahel Workshop, 6-8 January, 1994, A. Reenberg and B.Markussen, (eds.), Aarhus University Press, Risskov, Denmark, 1994.
Changchun Institute of Geography, Chinese Academy of Sciences, Conservation Atlas of China,238pp., Science Press, Beijing, China, 1990.
CIDA, (Comite Interamericano de Desarrolo Agricola--Inter-American Committee for
-- --
- 44 -
Agricultural Development), Inventory of Information Basic to the Planning of AgriculturalDevelopment in Latin America, Pan American Union, Washington, D.C., 1963-.
Craig, G.M. (ed.), The Agriculture of the Sudan, 468pp., Oxford University Press, Oxford, 1991.
Crutzen, P.J. and M.O. Andreae, Biomass burning in the tropics: Impact on atmospheric chem-istry and biogeochemical cycles, Science, 250, 1669-1678, 1990.
Crutzen, P.J., L.E. Heidt, J.P. Krasnec, W.H. Pollock, and W. Seiler, Biomass burning as asource of atmospheric gases CO, H2, N2O, NO, CH3Cl and COS, Nature, 282,253-256, 1979.
Davidson, O.R., Energy issues in Sub-Saharan Africa, Ann. Rev. Energy Environ., 17, 359-403,1992.
Dederi, W.I., Management of the Nigerian environment with reference to the activities of theKano State, Chapter 11, in, Sustainable Development in Nigeria’s Dry Belt: Problems and Pros-pects, Proceedings of the NEST Annual Workshop, K.O. Ologe (ed) October 1990, in Kano,Nigeria.
De Carvalho Macedo, I., The sugar cane agro-industry--its contribution to reducing CO2 emis-sions in Brazil, Biomass and Bioenergy 3, 77-80, 1992.
De Montalembert, M.R., and J. Clement, Fuelwood supplies in the developing countries. FAOForestry Paper No. 42, Food and Agriculture Organization of the United Nations, Rome 1983.
Del Buono, M., Ecuador: energy and social equity, a preview of the energy consumption survey.The ESMAP Connection 1, 1-12, 1993.
Demographic Yearbook,(1991), Department of Economic and Social Development, StatisticalDivision, United Nations Publication, New York, 1992.
Demographic Yearbook,(1997),Department of International Economic and Social Affairs, Sta-tistical Office, United Nations Publication, New York, 1999.
Department of Agriculture: Ministry of Agriculture and Cooperatives in Thailand, Traditionaland modern practices of utilizing organic materials as fertilizers in Thailand, in Organic Recy-cling in Asia, Workshop on the Use of Organic Materials as Fertilizers in Asia 26 October-5November 1976, in Bangkok, Thailand, FAO (Food and Agriculture Organization of the UnitedNations) Soils Bulletin No. 36, Rome 1978.
Desai, A.V., Ends and means in rural energy surveys, Report for the International DevelopmentResearch Centre, IDRC-MR112e, June 1985.
Dewalt, B.R., S.C. Stonich, and S.L. Hamilton, Population and resource destruction in Honduras,
-- --
- 45 -
in Population and Land Use in Developing Countries: Report of a Workshop, C.L. Jolly andB.B. Torrey, (eds.), 159pp., National Academy Press, Washington, D.C., 1993.
Dicko, M.S. and M. Sangare, Feeding behaviour of domestic ruminants in Sahelian Zone,Rangelands: a Resource Under Siege, Proceedings of the Second International RangelandCongress, P.J. Joss, P.W. Lynch, and O.B. Williams (eds), Adelaide, Australia, CambridgeUniversity Press, 1986.
Digernes, T.H., Wood for fuels: energy crisis implying desertification, The case of Bara, theSudan, Thesis, 128pp., Geografish Institute, Bergen, Norway, 1977.
Di Marzo, L., A conceptual framework of analysis and action on energy and the environment inIndonesia, Report for the Environmental Management Development in Indonesia Project(EMDI), Environmental Reports No. 26, Dalhousie Printing Centre and Indonesia Ministry ofState for Environment, Halifax, N.S. and Jakarta, Indonesia, 1994.
Diphaka, J.B.S. and R. Burton, Photovoltaics and solar water heaters in Botswana, in EnergyOptions for Africa: Environmentally Sustainable Alternatives, S. Karekezi and G.A. Mackenzie(eds.), 184pp., Zed Books , London and New Jersey, 1993.
Division de Programacion Energetica, La Demanda de Lena y Carbon Vegetal en el Paraguay,Proyecto PAR/85/003 PNUD/BIRF, Programa Nacional de Desarrollo Energetico, Republica delParaguay, Presidencia de la Republica, Secretaria Tecnica de Planificacion, Division de Progra-macion Energetica, Asuncion, Paraguay, Noviembre 1986.
Draft report of general household survey, April 1984-March 1985, in National Integrated Surveyof Households, (series), 89pp., Household Surveys Unit, Federal Office of Statistics, Lagos,Nigeria, 1986.
Dwyer, E., S. Pinnock J.M. Gregoire, and J.M.C. Pereira, Global spatial and temporal distribu-tion of vegetation fire as determined from satellite observations, Int. J. Remote Sensing 21,1289-1302, 2000.
Earl, D.E., Forest Energy and Economic Development, 128pp., Clarendon Press, Oxford, 1975.
Ebinger, C.K., Pakistan: Energy Planning in a Strategic Vortex, 155pp., Indiana UniversityPress, Bloomington, Indiana, 1981
Eckholm, E.P., The Other Energy Crisis, Firewood, Worldwatch Paper 1, 22pp., WorldwatchInstitute, Washington, D.C., September, 1975.
Economic Commission for Europe, Efficient Use of Energy Sources in Meeting Heat Demand:the Potential for Energy Conservation and Fuel Substitution in the ECE region, United Nations,New York, 1984.
-- --
- 46 -
Elgizouli, I.A.R., Rural-Urban household energy use and inter-relation in the Central Region ofthe Sudan, in African Energy: Issues in Planning and Practice, 157pp., Zed Books, London,1990.
Ellegard, A., Charcoal utilisation in Zambia, Renewable Energy for Development 7, 4, 1994.
Energy Information Administration (EIA), Estimates of U.S. Wood Energy Consumption from1949 to 1981, report DOE/EIA-0341 prepared by Applied Management Sciences, Inc. for EIA,U.S. Department of Energy, Washington, D.C., August, 1982.
England, S.B., and Kammen, D.M., Energy resources and development in Vietnam, Annu. Rev.Energy Environ. 18, 137-67, 1993.
English, J., M. Tiffen, and M. Mortimore, Land resource management in Machakos District,Kenya, 1930-1990, World Bank Environment Paper No. 5, The World Bank, Washington, D.C.,1994.
EPA, National Air Pollutant Emissions Trends, 1970-1996, EPA-454/R-97-011, U.S. Environ-mental Protection Agency, Research Triangle Park, NC 27111, 1997.
EPA, U.S. Emissions Inventory:http://www.epa.gov/globalwarming/publications/emissions/us2000/, April 2000.
Ernst, E., Fuelwood consumption among rural families in Upper Volta, Prepared for the 8thWorld Forestry Congress (Peace Corps), Ouagadougou, Upper Volta, 1977.
ESMAP (Energy Sector Management Assistance Programme), China: Energy for rural develop-ment in China, An assessment based on a joint Chinese/ESMAP study in six counties, Report ofthe Joint UNDP/World Bank Energy Sector Management Assistance Program and the Ministryof Agriculture, Government of China No. 183/96, The World Bank, Washington, D.C., July1996.
ESMAP, India: Household energy strategies for urban India, the case of Hyderabad, Report ofthe Joint UNDP/World Bank Energy Sector Management Assistance Program and the Indstituteof Energy and Environmental Studies No. 214/99, The World Bank, Washington, D.C., June1999.
Ezcurra, A.T., I. O. de Zarate, J-P Lacaux, and P-V Dinh, Atmospheric impact of Cereal-Wasteburning in Spain, pp780-786 in Biomass Burning and Global Change, Volume 2: Biomass Burn-ing in South America, Southeast Asia, and Temperate and Boreal Ecosystems, and the Oil Firesof Kuwait, ed. J.S. Levine, MIT Press, Cambridge, Massachusetts, 1996.
Fenster, C.R., Effect of weed control on soil water conservation for rainfed agriculture in theNear East, in Soil, Water, and Crop/Livestock Management Systems for Rainfed Agriculture in
-- --
- 47 -
the Near East Region: Proceedings of the Workshop at Amman, Jordan, January 18-23, 1986,C.E. Whitman,J.F. Parr, R.I. Papendick, R.E. Meyer, (eds), USDA, Washington D.C., 1989.
Fesharaki, F., Development of the Iranian Oil Industry: International and Domestic Aspects,,315pp., Praeger Publishers., New York, 1976.
Foley, G., Charcoal making in developing countries, Technical Report No.5, International Insti-tute for Environment and Development, London, 1986.
Foley, G. and A. van Buren, Coal substitution and other approaches to easing the pressure onwoodfuel resources, Nat. Res. Forum, 6, 127-149, 1982.
Food and Agriculture Organization (FAO), Production Yearbook, 1983, vol. 37, Food and Agri-culture Organization of the United Nations, Rome, 1984.
Food and Agriculture Organization (FAO), Production Yearbook, 1985, vol. 39, Food and Agri-culture Organization of the United Nations, Rome, 1986.
Food and Agriculture Organization (FAO), The State of Food and Agriculture 1995, Food andAgriculture Organization of the United Nations, Rome, 1995.
Food and Agriculture Organization (FAO), 1985 Yearbook of Forest Products, FAO forestryseries, Food and Agriculture Organization of the United Nations, Rome, 1986.
Food and Agriculture Organization (FAO), 1988 Yearbook of Forest Products, FAO forestryseries, Food and Agriculture Organization of the United Nations, Rome, 1990.
Food and Agriculture Organization (FAO), http://www.fao.org/forestry/, 1998.
Food and Agriculture Organization (FAO), http://apps.fao.org/, 2000.
Fraser, K.I., Gould, N.S., and Holmes, A.J., The use of cotton stalks and cotton ginning trash asfeedstocks for ethanol fuel production, pp 210-213 in Challenging the Future: Proceedings ofthe World Cotton Research Conference-1, Brisbane, Australia, Feb. 14-17, 1994, G.W. Con-stable and N.W. Forester (eds.), CSIRO, Melbourne, 1994.
Frolich, A., Lesotho, in Energy and Development in Southern Africa: SADCC Country StudiesPart I, P. O’Keefe and B. Munslow (eds.), Beijer Institute and Scandanavian Institute of AfricanStudies, 1984.
Fundacao Instituto Brasileiro de Geografia e Estatistica, Censo Agropecuario, Brasil, Rio deJaneiro, 1984.
Gao, S. and D. Xu, Rural Energy and fuel forests in China, Biomass and Bioenergy 1, 297-99,

-- --
- 48 -
1991.
Gupta, V.V.S.R., M.M. Roper, J.A. Kirkegaard, and J.F. Angus, Changes in microbial biomassand organic matter levels during the first year of modified tillage and stubble managment prac-tices on a red earth, Australian J. Soil Res. 32, 1339-1354, 1994.
Guzman, O., A. Yunez-Naude, and M.S. Wionczek, Energy Efficiency and Conservation in Mex-ico, 354pp., Westview Press, Boulder, Colorado, 1987.
Hadar, Y., Z. Kerem, and B. Gorodecki, Biodegradation of lignocellulosic agricultural wastes byPleurotus ostreatus, Journal of Biotechnology 30, 133-139, 1993.
Hadjichristodoulou, A., Breeding barley for forage and grain production in drylands, TechnicalBulletin No. 158, for Agricultural Research Institute, Ministry of Agr. and Natural Resources,Nicosia, Cyprus, A.P. Mavrogenis, (ed.), May 1994.
Hall, D.O., Biomass Energy, Energy Policy 19, 711-737, 1991.
Hall, D.O. and Y.S. Mao (Eds.), Biomass Energy and Coal in Africa, 196pp., AFREPREN, Lon-don, 1994.
Hall, D.O., F. Rosillo-Calle, R.H. Williams, and J. Woods, Biomass for energy: supply pros-pects, Chapter 14 in Renewable Energy: Sources forFuels and Electricity, T.B. Johansson, H.Kelly, A.K.N. reddy, and R.H. Williams, (eds.), Island Press, Washington D.C., 1993.
Hao, W. M., and M. H. Liu, Spatial and temporal distribution of tropical biomass burning. Glo-bal Biogeochem. Cycles. 8, 495-503, 1994.
Heber, G., and G. Zieroth (preparers), Rural Energy Supply Options in the Altiplano Area ofPeru, Special Energy Programme Documentation No. 2, 207pp., Published jointly by the Bun-desministerium fur wirtschaftliche Zusammenarbeit and the Deutsche Gesellschaft-Verlagsgesellschaft, Eschborn, 1986.
Hemstock, S.L., and Hall, D.O., A biomass energy flow chart for Zimbabwe: an example of themethodology, Solar Energy 59, 49-57, 1997.
Hibajene, S.H., E.N. Chidumayo, and A. Ellegard, Summary of the Zambia Charcoal IndustryWorkshop, Siavonga, Zambia, May, 1993.
Hosier, R., Energy Use in Rural Kenya : Household Demand and Rural Transformation, Energy,Environment, and Development in Africa, 7, 177pp., Beijer Institute and Scandinavian Instituteof African Studies, Stockholm, 1985.
Hosier, R., J. Boberg, M. Luhanga, and M. Mwandosya, Energy planning and wood balances:
-- --
- 49 -
Sustainable energy future for Tanzania,Nat. Res. Forum, 143-154, May 1990.
Hurst, D.F., D.W.T. Griffith, G.D. Cook, Trace gas emissions from biomass burning in Australiain Biomass Burning and Global Change, Volume 2: Biomass Burning in South America,Southeast Asia, and Temperate and Boreal Ecosystems, and the Oil Fires of Kuwait, ed. J.S.Levine, MIT Press, Cambridge, Massachusetts, 1996.
Husin, M., Z.Z. Zakaria, and A.H. Hassan, Potentials of oil palm by-products as raw materialsfor agro-based industries, pp 7-15, in Proceedings of the National Symposium on Oil Palm By-Products for Agro-based Industries, 5-6 November 1985, Kuala Lumpur, Malaysia, Palm OilResearch Institute of Malaysia, Kuala Lumpur, Malaysia, 1987.
Hyman, E.L., Fuel substitution and efficient woodstoves: are they the answers to the fuelwoodsupply problem in northern Nigeria?, Environmental Management 18, 23-32, 1994.
IEA, World energy statistics and balances (1971/1987), Organization for Economic Co-operation and Development (OECD), Paris, 1989.
Ileri, A., and T. Gurer, Energy and exergy utilization in Turkey during 1995, Energy 23, 1099-1106, 1998.
India: Directorate of Economics and Statistics, Indian Agricultural Atlas, 76pp., Department ofAgriculture, Ministry of Agriculture, Govt. of India, New Delhi, 1971.
International Energy Agency (IEA), Renewable Sources of Energy, 334pp., IEA, OECD, Paris,OECD, Washington, D.C., March 1987.
IPCC, Revised 1996 IPCC Guidelines for national greenhouse gas inventories.IPCC/OECD/IEA, Paris, 1997.
IPCC http://www.ipcc-nggip.iges.or.jp/public/gl/invs1.htm Revised 1996 IPCC Guidelines forNational Greenhouse Gas Inventories Reference Manual (Volume 3) Agriculture, 2002.
Ishiguro, M., and T. Akiyama,Energy Demand in Five Major Asian Developing Countries:Structure and Prospects, 181pp., The World Bank, Washington, D.C., 1995.
Islam, M.N., Energy and rural development: critical assessment of the Bangladesh situation, inRural Energy to Meet Development Needs: Asian Village Approaches, M.N. Islam, R. Morse,and M.H. Soesastro (Eds.), 561pp., Westview Press, Inc., Boulder, 1984.
Islam, M.N., R. Morse, and M.H. Soesastro (Eds.), Rural Energy to Meet Development Needs:Asian Village Approaches, 561pp., Westview Press, Inc., Boulder, 1984.
-- --
- 50 -
Jaradat, A.A., An Assessment of Research Needs and Priorities for Rainfed Agriculture, 415pp.,The United States Agency for International Development, Irbid, Jordan, 1988.
Jenkins, B., Properties of Biomass, in Strategic Analysis of Biomass and Waste Fuels for Elec-tric Power Generation, Electric Power Research Institute (EPRI), Palo Alto, Ca: 1993. TR-102773.
Jenkins, B. and J.M. Ebeling, Correlation of physical and chemical properties of terrestrialbiomass with conversion, in Energy From Biomass and Wastes IX Symposium Papers, LakeBuena Vista, Florida (January 28-February 1, 1985), published by the Institue of Gas Technol-ogy, Chicago, Il, 1985.
Jenkins, B. and S.Q. Turn, Primary atmospheric pollutants from agricultural burning: emissionrate determinations from wind tunnel simulations, Paper No. 946008 of the 1994 InternationalSummer Meeting of THE AMERICAN SOCIETY OF AGRICULTURAL ENGINEERS(ASAE) in Kansas City, Kansas (June 19-24, 1994), published by the ASAE, St. Joseph, MI,1994.
Jenkins, B., S.Q. Turn, and R.B. Williams, Survey documents open burning in the San JoaquinValley, Calif. Agr. 45,12-16, 1991.
Jenkins, B., A.D. Jones, S.Q. Turn, and R.B. Williams, Particle concentrations, gas-particle par-titioning, and species intercorrelations for polysyclic aromatic hydrocarbons (PAH) emitted dur-ing biomass burning Atmospheric Environment, (in press).
Jenkins, B., S.Q. Turn, and R.B. Williams, Atmospheric emissions from agricultural burning inCalifornia: determination of burn fracgions, distribution factors, and crop-specific contributions,Agr., Ecosystems., and Env., 38, 313-30, 1992.
Joshi, V., C. Venkataraman, D.R. Ahuja, Emissions from Burning Biofuels in Metal Cookstoves,Environmental Management 13, 763-772, 1989.
Joshi, V., C.S. Sinha, M. Karuppasamy, K.K. Srivastava, and P.B. Singh, Rural energy database,Final Report submitted to Ministry of Non-conventional Energy Sources, Tata Energy ResearchInstitute, New Delhi, September, 1992.
Kahane, A. and S. Lwakabamba, Energy in West Africa, in Energy in Africa, A. Kahane, S.Lwakabamba, P. O’Keefe, B.K. Kaale (eds.), Wiley Eastern Limited, New Delhi, 1990.
Kalburtzi, K.L., D.S. Veresoglou, and P.A. Gerakis, Effects of burnt of unburnt straw on wheatand fababeans as influenced by N fertilisation, Agr., Ecosystems and Env., 31, 173-185, 1990.
Karekezi, S. and G.A. Mackenzie (eds.), Energy Options for Africa: Environmentally Sustain-able Alternatives, 184pp., Zed Books, London and New Jersey, 1993.
-- --
- 51 -
Kersten, I., G. Baumbach, A.F. Oluwole, I.B. Obioh, and O.J. Ogunsola, Urban and rural fuel-wood situation in the tropical rain-forest area of south-west Nigeria, Energy 23, 887-898, 1998.
Kgathi, D.L. and P. Zhou, Biofuel use assessments in Africa: implications for greenhouse gasemissions and mitigation strategies, Env. Monitoring and Assessment 38, 253-269, 1995.
Khan, A.R., A. Qayyum, and G.A. Chaudhary, A country paper on soil, water, and cropmanagement systems for dryland agriculture in Pakistan, in Soil, Water, and Crop/LivestockManagement Systems for Rainfed Agriculture in the Near East Region: Proceedings of theWorkshop at Amman, Jordan, January 18-23, 1986, C.E. Whitman,J.F. Parr, R.I. Papendick,R.E. Meyer, (eds), USDA, Washington D.C., 1989.
Kilicasian, I., H.I. Sarac, E. Ozdemir, K. Ermis, Sugar cane as an alternative energy source forTurkey, Energy Conversion & Management 40, 1-11, 1999.
Kituyi, E., L. Marufu, S.O. Wandiga, I.O. Jumba, M.O. Andreae, and G. Helas, Biofuel availa-bility and domestic use patterns in Kenya, Biomass and Bioenergy 20, 71-82, 1999.
Kleeman, M. (ed.), Energy Use and Air Pollution in Indonesia : supply strategies, environmen-tal impacts, and pollution control, Avebury studies in green research, 288 pp., Ashgate Pub.Co.,Aldershot, Hants, England: Avebury: Brookfield, Vt., 1994.
Kuhlbusch, T.A.J., M.O. Andreae, H. Cachier, J.G. Goldammer, J.P. Lacaux, R. Shea, and P.J.Crutzen, Black carbon formation by savanna fires: Measurements and implications for the glo-bal carbon cycle, Journal of Geophysical Research 101, 23,651-23,665, 1996.
Lamers, J., A. Buerkert, H.P.S. Makkar, M. Vonoppen, K. Becker, Biomass production and feedand economic value of fodder weeds as by-products of millet cropping in a Sahelian farmingsystem, Experimental Agriculture 32, 317-326, 1996.
Lazarus, M., and S. Diallo, Integrated energy-environment planning: Initial Results from Sene-gal, preliminary report for Seminar on Energy Management Policy and the Environment, July1992.
Lazarus, M., S. Diallo, and Y. Sokona, Energy and environment scenarios for Senegal, Nat. Res.Forum 18, 31-47, 1994.
Leach, G., Household Energy in South Asia, 111pp., Elsevier Applied Science, London and NewYork, 1987.
Leach, G., Residential energy in the Third World, Ann. Rev. Energy 1988, 13, 47-65, 1988.
Leach, G., and M. Gowen, Household energy handbook: an interim guide and referencemanual, World Bank Technical Paper No. 67, The World Bank, Washington, D.C., 1987.

-- --
- 52 -
Lerner, J. E. Matthews and I. Fung, Methane emission from animals: a global high resolutiondata base, Global Biogeochemical Cycles, 2, 139-156, 1988.
Lew, E. and D. Kammen, Social and Environmental Impacts of Charcoal, Report of the Science,Technology and Environmental Policy (STEP) Program, Woodrow Wilson School of Public andInternational Affairs, Princeton University, 1994.
Logan, J.A. Tropospheric ozone: seasonal behavior, trends and anthropogenic influence. J.Geophys. Res., 90, 10,463-10,482, 1985.
Logan, J.A., Prather, M.J., Wofsy, S.C. and McElroy,. M.B. Tropospheric Chemistry: A globalperspective. J. Geophys. Res., 86, 7210-7254, 1981.
Martin, T.L., E.A. Anderson, and R. Goates, Influence of the chemical composition of organicmatter on the development of mold flora in soil, Soil Sci. 54, 297-307, 1942.
Marland, G., T.A. Boden, and R.J. Andres. 2001. Global, Regional, and National CO2 Emis-sions. In Trends: A Compendium of Data on Global Change. Carbon Dioxide InformationAnalysis Center, Oak Ridge National Laboratory, U.S. Department of Energy, Oak Ridge,Tenn., U.S.A.
Martinez, M., Renewable energy for rural development in Mexico, in Energy for Rural Develop-ment: Proceedings of the United Nations Group of Experts on the Role of New and RenewableSources of Energy in Integrated Rural Development, M.R.Bhagavan and S. Karekezi, (eds.),258pp., Zed Books, London, New Jersey, 1992.
Marufu, L., Photochemistry of the African Troposphere--the influence of biomass burning,Thesis, 145pp., Universiteit Utrecht, Faculteit Natuur- en Sterrenkunde, Utrecht, Nederlands,1999.
Matthews, E., Global vegetation and land use: new high-resolution data bases for climatestudies,J. Climate Appl. Met., 22, 474-487, 1983.
Mburu, C., Cropping Systems, Production Technology, and Utilization of Small Millets withSpecial Reference to Finger Millet in Kenya, in Small Millets in Global Agriculture: Proceed-ings of the First International Small Millets Workshop, October 29-November 2, 1986, in Ban-galore, India, A. Seetharam, K.W. Riley, and G. Harinarayana (eds.), Oxford & IBH Pub. Co.,New Delhi, 1989.
McIntire, J., D. Bourzat, and Pingali, P., Crop-Livestock Interaction in Sub-Saharan Africa,246pp., The World Bank, Washington, D.C., 1992.
Meelu, O.P., Y. Singh, and B. Singh, Green manure and crop residue management in rice-wheatrotation, in Extended Summary, Proceedings International Symposium Rice Research: New
-- --
- 53 -
Frontiers, 15-18 November, 1990, K. Muralidharan, K.V. Rao, K. Satyanarayana, G.S.V. Prasad,and E.A. Siddiq, (eds.), Directorate of Rice Research, Hyderabad, India, 1991.
Meyers, S., and G. Leach, Biomass fuels in the developing countries: an overview, LawrenceBerkeley Laboratory (LBL-27222), Berkeley, CA, 1989.
Minott, D., The Potential of Renewable Energy in the Caribbean, in Energy for Rural Develop-ment: Proceedings of the United Nations Group of Experts on the Role of New and RenewableSources of Energy in Integrated Rural Development, M.R.Bhagavan and S. Karekezi, (eds.),258pp., Zed Books, London, New Jersey, 1992.
Miracle, M.P., Agriculture in the Congo Basin, 355pp., The University of Wisconsin Press,Madison, Milwaukee, and London, 1967.
Mortimore, M., The lands of northern Nigeria: some urgent issues, Chapter 2 in, Perspectives onLand Administration and Development in Northern Nigeria, edited by M. Mortimore, E.A.Olofin, R.A. Cline-Cole, and A. Abdulkadir, Proceedings of the Workshop on Land Resources,Kano, Nigeria, September 25-28, 1986.
Moss, R.P., and W.B.Morgan, Fuelwood and rural energy production and supply in the humidtropics, report for the United Nations University, Tycooly International Publishing Ltd., Dublin,1981.
Morgan, W.B., Rural energy production and supply--with special reference to SouthwesternNigeria, in Rural Energy Systems in the Humid Tropics: Proceedings of the First Workshop ofthe United Nations University Rural Energy Systems Project Ife, Nigeria, 10-12 August 1978,56pp., W.B. Morgan, R.P. Moss, and G.J.A. Ojo, (eds.),The United Nations University, Tokyo,Japan, 1980.
Mukhtar, Wood fuel as a source of energy in the Sudan, in Proceedings of the First EnergyConference, April 1978, Ministry of Energy and Mining, Khartoum, 1978.
Muller, L.D., R.F. Barnes, L.F. Bauman, and V.F. Colenbrander, Variations in lignin and otherstructural components of brown midrib mutants of maize, Crop Sci. 11, 413-415, 1971.
Mungala, P.M. and K. Openshaw, Estimation of present and future demand for woodfuel inMachakos District, in Wood, Energy and Households: Perspectives on rural Kenya, Volume 6,C. Barnes, J. Ensminger and P. O’Keefe, eds., The Beijer Institute, Stockholm, 1984.
Negi, G.C.S., High yielding vs. traditional crop varieties: a socio-agronomic study in aHimalayan village in India, Mountain Research and Development 14, 251-254, 1994.
Ng’andu, A.N. and A.M. Mwanza, The influence of comparative price in the substitution of coalfor woodfuel and charcoal: the Zambian Case, in African Energy: Issues in Planning and
-- --
- 54 -
Practice, 157pp., Zed Books, London, 1990.
NGGIC, National Greenhouse Gas Inventory 1988 to 1994 (7 volumes), National GreenhouseGas Inventory Committee (NGGIC), Canberra, 1996.
Nguyen, B.C, N. Mihalopoulos, and J.P. Putaud, Rice straw burning in Southeast Asia as asource of CO and COS to the atmostphere, J. Geophys. Res. 99, 16,435-16,439, 1994.
Norman, D.W., M.D. Newman, and I. Ouedraogo, The semi-arid tropics of west Africa, in Farmand Village Production Systems in the Semi-Arid Tropics of West Africa: An InterpretiveReview of Research, Research Bulletin No. 4, Vol 1 for ICRISAT (International Crops ReserachInstitute for the Semi-Arid Tropics), Patancheru P.O., Andrhra Pradesh, India, October, 1981.
O’Keefe, P. Energy in East Africa: Consumer and Resources, in Energy in Africa, A. Kahane, S.Lwakabamba, P. O’Keefe, B.K. Kaale (eds.), Wiley Eastern Limited, New Delhi, 1990.
O’Keefe, P. and B. Munslow, Energy and development in southern Africa: SADCC country stu-dies, in Energy, Environment and Development in Africa 4, Beijer Institute and ScandinavianInstitute of African Studies, Stockholm, 1984.
O’Keefe, P. and P. Raskin, Fuelwood in Kenya: crisis and opportunity, Ambio 14, 220-7, 1985.
O’Keefe, P., P. Raskin, and S. Barrow (eds.), Energy and Development in Kenya: Opportunitiesand Constraints, 185pp., Beijer Institute, Royal Swedish Academy of Sciences, Stockholm,Sweden, 1984.
Office of Technology Assessment (OTA), Energy in Developing countries, OTA-E-486, U.S.Congress, Washington D.C., 1991.
Ofori, C.S., Utilization of crop residues in semiarid regions for effective soil and water conserva-tion, in Soil, Water, and Crop/Livestock Management Systems for Rainfed Agriculture in theNear East Region: Proceedings of the Workshop at Amman, Jordan, January 18-23, 1986, C.E.Whitman,J.F. Parr, R.I. Papendick, R.E. Meyer, (eds), USDA, Washington D.C., 1989.
Ogden, J.M., Williams, R.H. and Fulmer, M.E., Cogeneration applications of biomassgasifier/gas turbine technologies in the cane sugar and alcohol industries, in Energy and theenvironment in the 21st century, J.W. Tester, D.O. Wood, and N.A. Ferrari, (eds), 311-346, MITPress, Cambridge, Massachusetts, 1991.
OLADE (Organizacion Latinoamericana de Energia), Energy Balances for Latin America, M.Banados C. (ed.), Artes Graficas Senal, Quito, Ecuador, November, 1981.
Olivier, J.G.J. and J.J.M. Berdowski (2001a) Global emissions sources and sinks. In: Berdowski,J., Guicherit, R. and B.J. Heij (eds.) "The Climate System", pp. 33-78. A.A. Balkema
-- --
- 55 -
Publishers/Swets & Zeitlinger Publishers, Lisse, The Netherlands, 2001a.
Olivier J., A. F. Bowman, C. van der Maas, J. Berdowski, C. Veldt, J. Bloos, A. Visschedijk, P.Zandveld, and J. Haverlag, Description of EDGAR Version 2.0: A set of global emission inven-tories of greenhouse gases and ozone-depleting substances for all anthropogenic and most natualsources on a per country basis and on a 1°x° grid, RIVM Report No. 771060, TNO report No.R96/119, National Institute for Public Health and the Environment, Bilthoven, the Netherlands,1996.
Olivier J., J.P.J. Bloos, J.J.M. Berdowski, A.J.H. Visschedijk, A.F. Bouwman, A 1990 globalemission inventory of anthropogenic sources of carbon monoxide on 1°x° developed in theframework of EDGAR/GEIA, Chemosphere 1, 1-17, 1999.
Olivier J., et al, CO2, CH4, and N2O emissions for 1990 and 1995; sources and methods. In:"CO2 emissions from fuel combustion 1971-1999," 2001 Edition, pp. III.9 - III.29. InternationalEnergy Agency (IEA), Paris, 2001.
Omereji, G. O., Establishment and management of a modern oil palm estate for maximum pro-ductivity, in Proceedings of the International Palm Oil Conference: Progress, Prospects andChallenges Twards the 21st Century, 9-14 September, 1991, Kuala Lumpur, Malaysia, Palm OilResearch Institute of Malaysia, Kuala Lumpur, 1993.
Openshaw, K.O., Wood fuels the Developing World, New Scientist 61, 271-272, 1974.
Openshaw, K.O., Woodfuel: a time for reassessment, Nat. Res. Forum 3, 35-51, 1978.
Openshaw, K.O., Woodfuel-a time for reassessment, in Energy in the Developing World. TheReal Energy Crisis, 386pp., V. Smil and E. Knowland (Eds.), Oxford University Press, U.K.,1980.
Openshaw, K.O., Concepts and methods for collecting and compiling statistics on biomass usedas energy, paper prepared for N.W. Statistical Office Workshop, Rome, September 29- October3, 1986.
Openshaw, K.O., Urban biomass fuels: production, transportation, and trading study, a consoli-dated report, Malawi Ministry of Energy and Mining, Alternative Energy Development, Inc.,Silver Spring, Maryland, 1997a.
Openshaw, K.O., Malawi: biomass energy strategy study, Alternative Energy Development,Inc., Silver Spring, Maryland, December 1997, 1997b.
Oppen, M. von, and P.P. Rao, Sorghum marketing in India, pp 659-674 in Sorghum in theEighties: Proceedings of the International Symposium on Sorghum, Vol. 2, 2-7 November 1981,ICRISAT Center, Patancheru, A.P., India, ICRISAT, Patancheru, A.P., India, 1982.
-- --
- 56 -
Oyenuga, V.A., Nigeria’s Foods and Feeding-Stuffs: Their Chemistry and Nutritive Value,99pp., Ibadan University Press, Ibadan, 1968.
Pal, B.P., Modern rice research in India, in Rice, Science, and Man, The International RiceResearch Institute (IRRI), Papers presented at the Tenth Anniversary Celebration of the IRRI,20-21 April, 1972, IRRI, Los Banos, Philippines, 1972.
Pal, B.P., Wheat, 370pp., Indian Council of Agricultural Research, New Delhi, 1966.
Papendick, R.I. and J.F. Parr, Proceedings of a workshop on crop residue management to optim-ize crop/livestock production and resource conservation in the Near East region, Amman, Jor-dan, 31 January - 2 February, 1988.
Pearson, C.J., D.W. Norman, and J.R. Dixon, Sustainable Dryland Cropping in Relation to SoilProductivity, Food and Agriculture Organization of the United Nations Soils Bulletin No. 72,Food and Agriculture Organization of the United Nations, Rome, 1995.
Pennise, D.M., K.R. Smith, J.P. Kithinji, M.E. Rezende, T.J. Raad, J. Zhang, and C. Fan, Emis-sions of greenhouse gases and other airborne pollutants from charcoal making in Kenya and Bra-zil, in IJ. Geophys. Res. 106, 24,143-24,155, 2001.
Pingali, P., Y. Bigot, and H.P. Binswanger, Agricultural Mechanization and the Evolution ofFarming Systems in Sub-Saharan Africa, 216pp., The Johns Hopkins University Press, Bal-timore, 1987.
Pokharel, S., and M. Chandrashekar, Biomass resources as energy in Nepal, in Nat. Res. Forum18, 225-230, 1994.
Polycarpou, A., and M.H. El-Lakany, Forestry policies in the Near East region: analysis andsynthesis, FAO Forestry Paper No. 111, Food and Agriculture Organization of the UnitedNations, Rome 1993.
Ponnamperuma, F.N., Straw as a source of nutrients for wetland rice, in Organic Matter andRice, International Conference on Organic Matter and Rice, 1982, International Rice ResearchInstitute (IRRI), Los Banos, Laguna, Philippines, 1984.
Population Association of Nigeria, Population Information, Education and Communication:Proceedings No. 8 of the 1990 Conference Held at the Nigerian Defence Academy, Kaduna,Population Association of Nigeria, 303pp., Ibadan, Nigeria, 1991.
Poulain, J.F., Crop residues in traditional cropping systems of west Africa: Effects on themineral balance and level of organic matter in soils--proposals for their better management, inOrganic Recycling in Africa, Workshop on the Use of Organic Materials as Fertilizers in Africa5-14 December 1977, in Buea, Cameroon, FAO (Food and Agriculture Organization of the
-- --
- 57 -
United Nations) Soils Bulletin No. 43., Rome, 1980.
Powell, J.M., Yields of sorghum and millet and stover consumption by livestock in theSubhumid Zone of Nigeria, Trop. Agric. (Trinidad) 62, 77-81, 1985.
Pushparajah, E. and C.P. Soon (eds.), Cocoa and Coconuts: Progress and Outlook, Proceedingsof the International Conference on Cocoa and Coconuts, Progress and Outlook, 15-17 October,1984, Kuala Lumpur, Malaysia, Incorporated Society of Planters and the Malaysian CocoaGrowers Association, Kuala Lumpur, Malaysia, 1986. Qui, D.X., The role of renewableenergy in rural development in China: achievements and prospects, in Energy for RuralDevelopment: Proceedings of the United Nations Group of Experts on the Role of New andRenewable Sources of Energy in Integrated Rural Development, M.R.Bhagavan and S. Karekezi,(eds.), 258pp., Zed Books, London, New Jersey, 1992.
Rao, P.P., Marketing of fodder in rural and urban areas of India, in Agricultural Markets in theSemi-Arid Tropics, Proceedings of the International Workshop at ICRISAT Center, India, 24-28October 1983, International Crops Research Institute for the Semi-Arid Tropics (ICRISAT),Patancheru, A.P., India, 1985.
Raskin, P., and M. Lazarus, Regional energy development in southern Africa: great potential,great constraints, Ann. Rev. Energy Environ. 16,145-78, 1991.
Reed, J.D., Sorghum and millets as forage crops in the semi-arid tropics, in Utilization ofSorghum and Millets, M.I. Gomez, L.R. House, L.W. Rooney, and D.A.V. Dendy, (eds.),216pp., International Crops Research Institute for the Semi-Arid Tropics (ICRISAT), Patan-cheru, Andhra Pradesh, India, 1992.
Reddy, A.V., Agriculture Marketing, 258pp., Printwell Publishing, Jaipur, India, 1991.
Reddy, K.V.S., Pest management in Sorghum--II, pp 237-246 in Sorghum in the Eighties:Proceedings of the International Symposium on Sorghum, 2-7 November 1981, ICRISAT Center,Patancheru, A.P., India, ICRISAT, Patancheru, A.P., India, 1981.
Report of Rural Agricultural Sample Survey, 1980/81, in Nigeria: National Integrated Survey ofHouseholds, 71pp., Agricultural Survey Unit, Federal Office of Statistics, Lagos, Nigeria, 1983.
Roberts, R.L., Rice hull utilization, in Industrial Uses of Cereals: Symposium Proceedings inConjunction With 58th Annual Meeting of American Association of Cereal Chemists, 4-8November, 1973, St. Louis, Missouri, American Association of Cereal Chemists, St. Paul,Minn., 1973.
Salam, B.A., The contribution of the oil palm by-products towards the national energy policy--an economist point of view, pp133-145, in Proceedings of the National Symposium on Oil PalmBy-Products for Agro-based Industries, 5-6 November 1985, Kuala Lumpur, Malaysia, Palm Oil
-- --
- 58 -
Research Institute of Malaysia, Kuala Lumpur, Malaysia, 1987.
Salour, D., B.M. Jenkins, M. Vafaei, M. Kayhanian, Combustion of Rice Straw andStraw/Wood Fuel Blends in a Fluidized Bed Reactor, Paper No. 89-6574 of the 1989 Interna-tional Winter Meeting of ASAE, published by the ASAE, St. Joseph, MI, 1989.
Sampath, S.R., Scope for using small millets as forage in India, in Small Millets in Global Agri-culture: Proceedings of the First International Small Millets Workshop, October 29-November2, 1986, in Bangalore, India, A. Seetharam, K.W. Riley, and G. Harinarayana (eds.), Oxford &IBH Pub. Co., New Delhi, 1989.
Sandford, S.G., Crop residue/livestock relationship, in Soil, Crop, and Water Management Sys-tems for Rainfed Agriculture in the Sudano-Sahelian Zone: proceedings of an InternationalWorkshop, 11-16 January 1987, ICRISAT Sahelian Center, Niamey, Niger, ICRISAT, Patan-cheru, A.P., India, 1989.
Satchell, J.E., Introduction: Litter--Interface of Animate/Inanimate Matter,in Biology of PlantLitter Decomposition Volume I, C.H. Dickinson, and G.J.F. Pugh, (eds.), Academic Press, Lon-don and New York, 1974.
Scholes, M., P. Matrai, K. Smith, M. O. Andreae, and A. Guenther, Biosphere-AtmosphereInteractions, in Atmospheric Chemistry in a Changing World, edited by G. Brasseur, R. Prinn, &A. Pszenny, Springer-Verlag, in preparation, 2000.
Scholes, R.J. and M.R.van der Merwe, South African greenhouse gas inventory, Report forDEA-918 March 1995, The Department of Environment Affairs and Tourism, Pretoria, 1995.
Scobey, R., Malawi, in Energy and Development in Southern Africa: SADCC Country StudiesPart I, P. O’Keefe and B. Munslow (eds.), Beijer Institute, Royal Swedish Academy of Sciences,Uppsala, Sweden, 1984.
Scurlock, J.M.O. and D.O. Hall, The contribution of biomass to global energy use (1987),Biomass, 21, 75-81, 1990.
Seiler, W. and Crutzen, P. Estimates of the gross and net flux of carbon between the biosphereand the atmosphere from biomass burning. Climatic Change, 2, 207-247, 1980.
Secretaria de Energia, Minas e Industria Paraestatal (SEMIP), Energia Rural en Mexico, SEMIP,Comision de Comunidades Europeas, Mexico City, Mexico, Noviembre 1988.
Senelwa, K.A. and D.O. Hall, A biomass energy flow chart for Kenya, Biomass and Bioenergy 4,35-48, 1993.
Shamsuddin, A.H. and M.T.M. Nor, Potential of fluidised bed technology for combustion of oil
-- --
- 59 -
palm solid by-products, pp146-154, in Proceedings of the National Symposium on Oil Palm By-Products for Agro-based Industries, 5-6 November 1985, Kuala Lumpur, Malaysia, Palm OilResearch Institute of Malaysia, Kuala Lumpur, Malaysia, 1987.
Sivakumar, M.V.K., and F. Gnoumou, Agroclimatology of West Africa: Burkina Faso,ICRISAT (International Crops Research Institute for the Semi-Arid Tropics) information bul-letin No. 23, 192pp., Patancheru, Andhra Pradesh, India, 1987.
Sivakumar, M.V.K., A.K.S. Huda, and S.M.Virmani, Physical environment of sorghum- andmillet-growing areas in south Asia, in Agrometeorology of Sorghum and Millet in the Semi-AridTropics: Proceedings of the International Symposium, International Crops Research Institute forthe Semi-Arid Tropics (ICRISAT), S.M. Virmani and M.V.K. Sivakumar (eds.), ICRISAT,Patancheru, India, 1984.
,mil, V., Energy flows in the Developing World, Am. Scientist 67, 522-531, 1979.
Smith, K.R., Biofuels, Air Pollution, and Health: A Global Review, 452 p., Plenum Press, NewYork and London, 1987.
Smith, K.R., D.M. Pennise, P. Khummongkol, V. Chaiwong, K. Ritgeen, J. Zhang, W.Panyathanya, R.A. Rasmussen, M.A.K. Khalil, Greenhouse Gases from small-scale combustionin developing countries: charcoal-making kilns in Thailand, USEPA, Research Triangle ParkNC, 1999, in press.
Smith, K.R., M.A.K. Khalil, R.A. Rasmussen, S.A. Thornloe, F. Manegdeg, M. Apte, Green-house Gases from biomass and fossil fuel stoves in developed countries: a Manila pilot study,Chemosphere 26, 479-501, 1993.
Smith, K.R., R. Uma, V.V. Kishore, J. Zhang, V. Joshi, M.A.K. Khalil, Greenhouse implicationsof household stoves: an analysis for India Annu. Rev. Energy Environ. 25, 741-763, 2000.
Soesastro. M.H., Policy analysis of rural household energy needs in West Java, in Rural Energyto Meet Development Needs: Asian Village Approaches, M.N. Islam, R. Morse, and M.H.Soesastro (Eds.), 561pp., Westview Press, Inc., Boulder, 1984.
State Statistical Bureau of the People’s Republic of China, China Statistical Yearbook, Interna-tional Centre for the Advancement of Science & Technology, Beijing, 1992.
Statistical Yearbook for Asia and the Pacific, Economic and Social Commission for Asia and thePacific, United Nations Publication, Bangkok, Thailand, 1987.
Streets, D.G. and S.T. Waldhoff, Biofuel use in Asia and acidifying emissions, Energy 23,1029-1042, 1998.

-- --
- 60 -
Streets, D.G., K. Jiang, X. Hu, J.E. Sinton, X. Zhang, D. Xu, M.Z. Jacobson, and J.E. Hansen,Recent Reductions in China’s Greenhouse Gas Emissions, Science 294, 1835-1837, 2001.
Suoping L., Z. Cungen, G. Tingshuang, S. Waldron, The "Straw for Ruminants: Project inChina, Agricultural and Natural Resource Economics Discussion Paper 4/99, School of Naturaland Rural Systems Management, St.Lucia, Australia, September 1999.
Susott, R.A., G.J. Olbu, S.P. Baker, D.E. Ward, J.B. Kauffman, and R.W. Shea, Carbon, Hydro-gen, Nitrogen, and Thermogravimetric Analysis of Tropical Ecosystem Biomass, in GlobalBiomass Burning: Atmospheric, Climatic and Biospheric Implications, ed. J.S. Levine, MITPress, Cambridge, Massachusetts, 1991.
Swift, M.J., O.W. Heal, and J.M. Anderson, Decomposition in Terrestrial Ecosystems, 372 pp.,University of California Press, Berkeley and Los Angeles, 1979.
Tanaka, A., Methods of handling of cereal crop residues in Asian countries and related prob-lems, Food and Fertilizer Technology Center Extension Bulletin No.43, Asian Pacific Manage-ment Resources (ASPAC), Taipei City, Taiwan, 1974.
Te, A., S.G. Zhu, S.L. Travers, H.F. Lai, and R.W.Herdt, The Economics of Hybrid Rice Pro-duction in China, Agric. Econ. Dept.: International Rice Research Institute (IRRI), Los Banos,Laguna, Philippines, 1985.
Tingshuang, G. and Y. Zhenhai, New developments in livestock systems based on crop residuesin China. Paper presented at the Second FAO Electronic Conference on Tropical Feeds (Lives-tock Feed Resources within Integrated Systems). December 2, 1996.
Tothill, J.D. (ed.), Agriculture in the Sudan, being a handbook of agriculture as practised in theAnglo-Egyptian Sudan, 972 pp., Oxford Univ. Press, London, 1954.
Tuan, N.A., Energy and environmental issues in Vietnam, Natural Resources Forum 21, 201-207, 1997.
Tuan, N.A. and T. Lefevre, Analysis of household energy demand in Vietnam, Energy Policy 24,1089-1099, 1996.
Tully, D., Rainfed farming systems of the Near East region, in Soil, Water, and Crop/LivestockManagement Systems for Rainfed Agriculture in the Near East Region: Proceedings of theWorkshop at Amman, Jordan, January 18-23, 1986, C.E. Whitman,J.F. Parr, R.I. Papendick,R.E. Meyer, (eds), USDA, Washington D.C., 1989.
Turn, S.Q., B.M. Jenkins, J.C.Chow, L.C.Pritchett, D. Campbell, T. Cahill, and S.A. Whalen,Elemental characterization of particulate matter emitted from biomass burning: Wind tunnelderived source profiles for herbaceous and wood fuels, Fall Meeting, American Geophysical
-- --
- 61 -
Union (AGU), San Francisco, CA, December 6-10, 1993.
Umunna N.N., and J.P. Alawa, Feed uses of sorghum grain and stover, in Industrial Utilizationof Sorghum, Summary Proceedings of a Symposium on the Current Status and Potential ofIndustrial Uses of Sorghum in Nigeria 4-6 December 1989, Kano, Nigeria, International CropsResearch Institute for the Semi-Arid Tropics (ICRISAT), Zaria, Nigeria, 1990.
United Nations Environment Programme, Residue Utilization Management of Agricultural andAgro-industrial Residues: Vol. 1, Industry Section Seminars, Rome, 18-21 January 1977 ,Foodand Agriculture Organization of the United Nations.
van Buren, A., The Woodfuel Market in Nicaragua, 257pp., Centro de Estudios y Documenta-cion Latinoamericanos (CEDLA), Amsterdam, Netherlands, 1990.
van Raay, H.G.T., Rural Planning in a Savanna Region, Rotterdam University Press, Nether-lands, 1975.
van Raay, H.G.T., and P.N. de Leeuw, The importance of crop residues as fodder: a resourceanalysis in Katsina Province, Nigeria, Samaru Research Bulletin No. 139, Institute of Agricul-tural Research, Zaria, Nigeria, 1971.
Waddle, D.B., Rice hull energy uses in the Philippines, Paper No. 85-5507 of the 1985 WinterMeeting of ASAE, 17-20 December, 1985, Chicago, Illinois, published by ASAE, St. Joseph,MI, 1985.
Watts, M., Drought, environment and food security: some reflections on peasants, pastoralistsand commoditization in dryland West Africa, in Drought and Hunger in Africa: Denying Fam-ine a Future, M.H. Glantz (ed.), Cambridge University Press, Cambridge, 1987.
Ward, D.E. and L.F. Radke, Emissions measurements from vegetation fires: A comparativeevaluation of methods and results, in Fire in the Environment: The Ecological, Atmospheric andClimatic Importance of Vegetation Fires, eds. P.J. Crutzen and J.G. Goldammer, pp. 53-76, JohnWiley, New York, 1993.
Ward, D.E., W.M. Hao, R.A. Susott, and R.E. Babbitt, Effect of fuel composition on combustionefficiency and emission factors for African savanna ecosystems, J. Geophys. Res., 101, D19,23569-23576, 1996.
Wen, W. and C. En-Jian, Our views on the resolution of China’s rural energy requirements,Biomass 3, 287-312, 1983.
Whitman, C.E., J.F. Parr, R.I. Papendick, R.E. Meyer, (eds), Preface, in Soil, Water, andCrop/Livestock Management Systems for Rainfed Agriculture in the Near East Region:Proceedings of the Workshop at Amman, Jordan, January 18-23, 1986, C.E. Whitman et al.
-- --
- 62 -
(eds.), USDA, Washington D.C., 1989.
Williams, R.H. and E.D. Larson, Advanced gasification-based biomass power generation, inRenewable Energy: Sources forFuels and Electricity, T.B. Johansson, H. Kelly, A.K.N. Reddy,and R.H. Williams (eds.), Island Press, Washington, D.C., 1993.
Wint W. and D. Bourn, Livestock and land-use surveys in sub-Saharan Africa, Oxfam ResearchPaper No. 11, Environmental Research Group Oxford, Oxfam, Oxford, UK and Ireland, 1994.
Winterhalder, B., R. Larsen, and R.B. Thomas, Dung as an essential resource in a highland Peru-vian community, Human Ecology 2, 89-104, 1974.
Wisner, B., Botswana, in Energy and Development in Southern Africa: SADCC Country StudiesPart I, P. O’Keefe and B. Munslow (eds.), Beijer Institute, Royal Swedish Academy of Sci-ences, Uppsala, Sweden, 1984.
Wood, T.S. and S. Baldwin, Fuelwood and charcoal use in LDC’s, Ann. Rev. Energy 10, 407-29,1985.
Woods, J., and D.O. Hall, Bioenergy for development: technical and environmental dimensions,FAO Environment and Energy Paper No. 13, Food and Agriculture Organization of the UnitedNations, Rome, 1994.
World Bank, Angola: Issues and options in the energy sector, Report of the Joint UNDP/WorldBank Energy Sector Management Assistance Program No. 7408-ANG, The World Bank, Wash-ington, D.C., May, 1989.
World Bank, Bangladesh: Issues and options in the energy sector, Report of the JointUNDP/World Bank Energy Sector Management Assistance Program No. 3873-BD, The WorldBank, Washington, D.C., October, 1982.
World Bank, Benin: Issues and options in the energy sector, Report of the Joint UNDP/WorldBank Energy Sector Management Assistance Program No. 5222-BEN, The World Bank, Wash-ington, D.C., June, 1985.
World Bank, Bolivia: Issues and options in the energy sector, Report of the Joint UNDP/WorldBank Energy Sector Management Assistance Program No. 4213-BO, The World Bank, Wash-ington, D.C., April, 1983.
World Bank, Bolivia: Household rural energy strategy, Report of the Joint UNDP/World BankEnergy Sector Management Assistance Program No. 162/94, The World Bank, Washington,D.C., January, 1994.
World Bank, Botswana: Issues and options in the energy sector, Report of the Joint
-- --
- 63 -
UNDP/World Bank Energy Sector Management Assistance Program No. 4998-BT, The WorldBank, Washington, D.C., September, 1984.
World Bank, Burkina: Issues and options in the energy sector, Report of the Joint UNDP/WorldBank Energy Sector Management Assistance Program No. 5730-BUR, The World Bank, Wash-ington, D.C., January, 1986.
World Bank, Burma: Issues and options in the energy sector, Report of the Joint UNDP/WorldBank Energy Sector Management Assistance Program No. 5416-BA, The World Bank, Wash-ington, D.C., June, 1985.
World Bank, Burundi: Issues and options in the energy sector, Report of the Joint UNDP/WorldBank Energy Sector Management Assistance Program No. 3778-BU, The World Bank, Wash-ington, D.C., June, 1982.
World Bank, Burundi: Issues and options in the energy sector, Report of the Joint UNDP/WorldBank Energy Sector Management Assistance Program No. 9215, The World Bank, Washington,D.C., January, 1992.
World Bank, Cape Verde: Issues and options in the energy sector, Report of the JointUNDP/World Bank Energy Sector Management Assistance Program No. 5073-CV, The WorldBank, Washington, D.C., August, 1984.
World Bank, Colombia: Basis for formulation of a Colombian energy policy, Report of the JointUNDP/World Bank Energy Sector Management Assistance Program, The World Bank, Wash-ington, D.C., December, 1986.
World Bank, Comoros: Issues and options in the energy sector, Report of the JointUNDP/World Bank Energy Sector Management Assistance Program No. 7104-COM, TheWorld Bank, Washington, D.C., January, 1988.
World Bank, Congo: Issues and options in the energy sector, Report of the Joint UNDP/WorldBank Energy Sector Management Assistance Program No. 6420-COB, The World Bank, Wash-ington, D.C., January, 1988.
World Bank, Costa Rica: Issues and options in the energy sector, Report of the JointUNDP/World Bank Energy Sector Management Assistance Program No. 4655-CR, The WorldBank, Washington, D.C., January, 1984.
World Bank, Dominican Republic: Issues and options in the energy sector, Report of the JointUNDP/World Bank Energy Sector Management Assistance Program No. 8234-DO, The WorldBank, Washington, D.C., May, 1991.
World Bank, Ecuador: Issues and options in the energy sector, Report of the Joint
-- --
- 64 -
UNDP/World Bank Energy Sector Management Assistance Program No. 5865-EC, The WorldBank, Washington, D.C., December, 1985.
World Bank, Ecuador: Energy Pricing, Poverty, and Social Mitigation, Report of the JointUNDP/World Bank Energy Sector Management Assistance Program No. 12831, The WorldBank, Washington, D.C., August, 1994.
World Bank, Ethiopia: Bagasse Energy Survey, Report of the Joint UNDP/World Bank EnergySector Management Assistance Program No. 063/86, The World Bank, Washington, D.C.,December, 1986.
World Bank, Ethiopia: Issues and options in the energy sector, Report of the JointUNDP/World Bank Energy Sector Management Assistance Program No. 4741-ET, The WorldBank, Washington, D.C., July, 1984.
World Bank, Fiji: Issues and options in the energy sector, Report of the Joint UNDP/WorldBank Energy Sector Management Assistance Program No. 4462-FIJ, The World Bank, Wash-ington, D.C., June, 1983.
World Bank, Gabon: Issues and options in the energy sector, Report of the Joint UNDP/WorldBank Energy Sector Management Assistance Program No. 6915-GA, The World Bank, Wash-ington, D.C., July, 1988.
World Bank, The Gambia: Issues and options in the energy sector, Report of the JointUNDP/World Bank Energy Sector Management Assistance Program No. 4743-GM, The WorldBank, Washington, D.C., November, 1983.
World Bank, Ghana: Issues and options in the energy sector, Report of the Joint UNDP/WorldBank Energy Sector Management Assistance Program No. 6234-GH, The World Bank, Wash-ington, D.C., November, 1986.
World Bank, Guatemala: Issues and options in the energy sector, Report of the JointUNDP/World Bank Energy Sector Management Assistance Program No. 12160, The WorldBank, Washington, D.C., September, 1993.
World Bank, Guinea: Issues and options in the energy sector, Report of the Joint UNDP/WorldBank Energy Sector Management Assistance Program No. 6137-GUI, The World Bank, Wash-ington, D.C., November 1986.
World Bank, Guinea-Bissau: Issues and options in the energy sector, Report of the JointUNDP/World Bank Energy Sector Management Assistance Program No. 5083-GUB, TheWorld Bank, Washington, D.C., August, 1984.
World Bank, Haiti: Issues and options in the energy sector, Report of the Joint UNDP/World

-- --
- 65 -
Bank Energy Sector Management Assistance Program No. 3672-HA, The World Bank, Wash-ington, D.C., June, 1982.
World Bank, Haiti: Household energy strategy, Report of the Joint UNDP/World Bank EnergySector Management Assistance Program No. 143/91, The World Bank, Washington, D.C.,December, 1991.
World Bank, Honduras: Issues and options in the energy sector, Report of the JointUNDP/World Bank Energy Sector Management Assistance Program No. 6476-HO, The WorldBank, Washington, D.C., August, 1987.
World Bank, India: Maharashtra bagasse energy efficiency project, Report of the JointUNDP/World Bank Energy Sector Management Assistance Program No. 120/91, The WorldBank, Washington, D.C., May, 1991.
World Bank, Indonesia: Issues and options in the energy sector, Report of, American Associa-tion of Cereal Chemists, St. Paul, Minn., 1973. the Joint UNDP/World Bank Energy SectorManagement Assistance Program No. 3543-IND, The World Bank, Washington, D.C.,November, 1981.
World Bank, Ivory Coast: Issues and options in the energy sector, Report of the JointUNDP/World Bank Energy Sector Management Assistance Program No. 5250-IVC, The WorldBank, Washington, D.C., April, 1985.
World Bank, Jamaica: Issues and options in the energy sector, Report of the Joint UNDP/WorldBank Energy Sector Management Assistance Program No. 5466-JM, The World Bank, Wash-ington, D.C., April, 1985.
World Bank, Kenya: Issues and options in the energy sector, Report of the Joint UNDP/WorldBank Energy Sector Management Assistance Program No. 3800-KE, The World Bank, Wash-ington, D.C., May, 1982.
World Bank, Lesotho: Issues and options in the energy sector, Report of the Joint UNDP/WorldBank Energy Sector Management Assistance Program No. 4676-LSO, The World Bank, Wash-ington, D.C., January, 1984.
World Bank, Liberia: Issues and options in the energy sector, Report of the Joint UNDP/WorldBank Energy Sector Management Assistance Program No. 5279-LBR, The World Bank, Wash-ington, D.C., December, 1984.
World Bank, Madagascar: Issues and options in the energy sector, Report of the JointUNDP/World Bank Energy Sector Management Assistance Program No. 5700-MAG, TheWorld Bank, Washington, D.C., January, 1987.
-- --
- 66 -
World Bank, Malawi: Issues and options in the energy sector, Report of the Joint UNDP/WorldBank Energy Sector Management Assistance Program No. 3903-MAL, The World Bank, Wash-ington, D.C., August, 1982.
World Bank, Mali: Issues and options in the energy sector, Report of the Joint UNDP/WorldBank Energy Sector Management Assistance Program No. 8423, The World Bank, Washington,D.C., November 1991.
World Bank, Republic of Mali: Household energy strategy, Report of the Joint UNDP/WorldBank Energy Sector Management Assistance Program No. 147-92, The World Bank, Washing-ton, D.C., May, 1992.
World Bank, Islamic Republic of Mauritania: Issues and options in the energy sector, Report ofthe Joint UNDP/World Bank Energy Sector Management Assistance Program No. 5224-MAU,The World Bank, Washington, D.C., April, 1985.
World Bank, Mauritius: Issues and options in the energy sector, Report of the JointUNDP/World Bank Energy Sector Management Assistance Program No. 3510-MAS, TheWorld Bank, Washington, D.C., December, 1981.
World Bank, Morocco: Issues and options in the energy sector, Report of the JointUNDP/World Bank Energy Sector Management Assistance Program No. 4157-MOR, TheWorld Bank, Washington, D.C., March, 1984.
World Bank, Mozambique: Issues and options in the energy sector, Report of the JointUNDP/World Bank Energy Sector Management Assistance Program No. 6128-MOZ, TheWorld Bank, Washington, D.C., January, 1987.
World Bank,Namibia: Issues and options in the energy sector, Report of the Joint UNDP/WorldBank Energy Sector Management Assistance Program No. 11320, The World Bank, Washing-ton, D.C., March, 1993.
World Bank, Nepal: Issues and options in the energy sector, Report of the Joint UNDP/WorldBank Energy Sector Management Assistance Program No. 4474-NEP, The World Bank, Wash-ington, D.C., August, 1983.
World Bank, Niger: Issues and options in the energy sector, Report of the Joint UNDP/WorldBank Energy Sector Management Assistance Program No. 4642-NIR, The World Bank, Wash-ington, D.C., May, 1984.
World Bank, Nigeria: Issues and options in the energy sector, Report of the Joint UNDP/WorldBank Energy Sector Management Assistance Program No. 4440-UNI, The World Bank, Wash-ington, D.C., April, 1983.
-- --
- 67 -
World Bank, Nigeria: Issues and options in the energy sector, Report of the Joint UNDP/WorldBank Energy Sector Management Assistance Program No. 11672, The World Bank, Washing-ton, D.C., July, 1993.
World Bank, Papua New Guinea: Issues and options in the energy sector, Report of the JointUNDP/World Bank Energy Sector Management Assistance Program No. 3882-PNG, TheWorld Bank, Washington, D.C., June, 1982.
World Bank, Paraguay: Issues and options in the energy sector, Report of the JointUNDP/World Bank Energy Sector Management Assistance Program No. 5145-PA, The WorldBank, Washington, D.C., October, 1984.
World Bank, Peru: Issues and options in the energy sector, Report of the Joint UNDP/WorldBank Energy Sector Management Assistance Program No. 4677-PE, The World Bank, Wash-ington, D.C., January, 1984.
World Bank, Peru: Guidelines for a short- and medium-term strategy for the energy sector,Report of the Joint UNDP/World Bank Energy Sector Management Assistance Program, TheWorld Bank, Washington, D.C., December, 1990.
World Bank, Rwanda: Issues and options in the energy sector, Report of the Joint UNDP/WorldBank Energy Sector Management Assistance Program No. 3779-RW, The World Bank, Wash-ington, D.C., June, 1982.
World Bank, Rwanda: Issues and options in the energy sector, Report of the Joint UNDP/WorldBank Energy Sector Management Assistance Program No. 8017-RW, The World Bank, Wash-ington, D.C., July, 1991.
World Bank, Sao Tome: Issues and options in the energy sector, Report of the JointUNDP/World Bank Energy Sector Management Assistance Program No. 5803-STP The WorldBank, Washington, D.C., October, 1985.
World Bank, Senegal: Issues and options in the energy sector, Report of the Joint UNDP/WorldBank Energy Sector Management Assistance Program No. 4182-SE, The World Bank, Wash-ington, D.C., July, 1983.
World Bank, Seychelles: Issues and options in the energy sector, Report of the JointUNDP/World Bank Energy Sector Management Assistance Program No. 4693-SEY, The WorldBank, Washington, D.C., January, 1984.
World Bank, Sierra Leone: Issues and options in the energy sector, Report of the JointUNDP/World Bank Energy Sector Management Assistance Program No. 6597-SL, The WorldBank, Washington, D.C., October, 1987.
-- --
- 68 -
World Bank, Solomon Islands: Issues and options in the energy sector, Report of the JointUNDP/World Bank Energy Sector Management Assistance Program No. 4404-SOL, The WorldBank, Washington, D.C., June, 1983.
World Bank, Somalia: Issues and options in the energy sector, Report of the JointUNDP/World Bank Energy Sector Management Assistance Program No. 5796-SO, The WorldBank, Washington, D.C., December, 1985.
World Bank, Sri Lanka: Issues and options in the energy sector, Report of the JointUNDP/World Bank Energy Sector Management Assistance Program No. 3794-CE, The WorldBank, Washington, D.C., May, 1982.
World Bank, St.Lucia: Issues and options in the energy sector, Report of the JointUNDP/World Bank Energy Sector Management Assistance Program No. 5111-SLU, The WorldBank, Washington, D.C., September, 1984.
World Bank, St. Vincent and the Grenadines: Issues and options in the energy sector, Report ofthe Joint UNDP/World Bank Energy Sector Management Assistance Program No. 5103-STV,The World Bank, Washington, D.C., September, 1984.
World Bank, Swaziland: Issues and options in the energy sector, Report of the JointUNDP/World Bank Energy Sector Management Assistance Program No. 6262-SW, The WorldBank, Washington, D.C., February, 1987.
World Bank, Sudan: Issues and options in the energy sector, Report of the Joint UNDP/WorldBank Energy Sector Management Assistance Program No. 4511-SU, The World Bank, Wash-ington, D.C., July, 1983.
World Bank, Syria: Issues and options in the energy sector, Report of the Joint UNDP/WorldBank Energy Sector Management Assistance Program No. 5822-SYR, The World Bank, Wash-ington, D.C., May, 1986.
World Bank, Tanzania: Issues and options in the energy sector, Report of the JointUNDP/World Bank Energy Sector Management Assistance Program No. 4969-TA, The WorldBank, Washington, D.C., November, 1984.
World Bank, Thailand: Issues and options in the energy sector, Report of the JointUNDP/World Bank Energy Sector Management Assistance Program No. 5793-TH, The WorldBank, Washington, D.C., September, 1985.
World Bank, Togo: Issues and options in the energy sector, Report of the Joint UNDP/WorldBank Energy Sector Management Assistance Program No. 5221-TO, The World Bank, Wash-ington, D.C., June, 1985.
-- --
- 69 -
World Bank, Tonga: Issues and options in the energy sector, Report of the Joint UNDP/WorldBank Energy Sector Management Assistance Program No. 5498-TON, The World Bank, Wash-ington, D.C., June, 1985.
World Bank, Trinidad and Tobago: Issues and options in the energy sector, Report of the JointUNDP/World Bank Energy Sector Management Assistance Program No. 5930-TR, The WorldBank, Washington, D.C., November, 1985.
World Bank, Tunisia: Energy management strategy in the residential and tertiary sectors,Report of the Joint UNDP/World Bank Energy Sector Management Assistance Program No.146/92, The World Bank, Washington, D.C., April, 1992.
World Bank, Turkey: Issues and options in the energy sector, Report of the Joint UNDP/WorldBank Energy Sector Management Assistance Program No. 3877-TU, The World Bank, Wash-ington, D.C., March, 1983.
World Bank, Uganda: Issues and options in the energy sector, Report of the Joint UNDP/WorldBank Energy Sector Management Assistance Program No. 4453-UG, The World Bank, Wash-ington, D.C., July, 1983.
World Bank, Vanuatu: Issues and options in the energy sector, Report of the JointUNDP/World Bank Energy Sector Management Assistance Program No. 5577-VA, The WorldBank, Washington, D.C., June, 1985.
World Bank, Vietnam: Rural and household energy issues and options, Report of the JointUNDP/World Bank Energy Sector Management Assistance Program No. 161/94, The WorldBank, Washington, D.C., January, 1994.
World Bank, Western Samoa: Issues and options in the energy sector, Report of the JointUNDP/World Bank Energy Sector Management Assistance Program No. 5497-WSO, TheWorld Bank, Washington, D.C., June, 1985.
World Bank, Yemen Arab Republic: Issues and options in the energy sector, Report of the JointUNDP/World Bank Energy Sector Management Assistance Program No. 4892-YAR, The WorldBank, Washington, D.C., December, 1984.
World Bank, Zaire: Issues and options in the energy sector, Report of the Joint UNDP/WorldBank Energy Sector Management Assistance Program No. 5837-ZR, The World Bank, Wash-ington, D.C., May, 1986.
World Bank, Zambia: Issues and options in the energy sector, Report of the Joint UNDP/WorldBank Energy Sector Management Assistance Program No. 4110-ZA, The World Bank, Wash-ington, D.C., January, 1983.
-- --
- 70 -
World Bank, Zimbabwe: Issues and options in the energy sector, Report of the JointUNDP/World Bank Energy Sector Management Assistance Program No. 3765-ZIM, The WorldBank, Washington, D.C., June, 1982.
World Bank, Zimbabwe: Integrated energy strategy evaluation, Report of the JointUNDP/World Bank Energy Sector Management Assistance Program No. 8768, The WorldBank, Washington, D.C., January, 1992.
World Wildlife Fund, Central Africa: global climate change and development, Technical Report,Biodiversity Support Program/Africa, World Wildlife Fund, Washington, D.C., 1993.
Yager, J.A., The Energy Balance in Northeast Asia, 249pp., Brookings Institution, Washington,D.C., 1984.
Yoshida, T., A review report on the situation of agricultural, agro-industrial and minicipalwastes in some Asian countries, in Organic Recycling in Asia, Workshop on the use of OrganicMaterials as Fertilizers in Asia 26 October-5 November 1976 in Bangkok, Thailand, FAO (Foodand Agriculture Organization of the United Nations) Soils Bulletin No. 36., Rome, 1978.
Young, W., Seed Production, Crop and Soil News/Notes 12, http://www.css.orst.edu/seed-ext,July 1998.
Zhang, J., K.R. Smith, R. Uma, Y. Ma, V.V.N. Kishore, K. Lata, M.A.K. Khalil, R.A.Rasmussen, S.T. Thornloe, Carbon monoxide from cookstoves in developing countries: 1.Emissions factors, Chemosphere: Global Change Science 1, 353-366, 1999.
Zhang, J., K.R. Smith, Y. Ma, S. Ye, F. Jiang, W. Qi, P. Liu, M.A.K. Khalil, R.A. Rasmussen,S.T. Thornloe, Greenhouse Gases and other airborne pollutants from household stoves in China:a database for emission factors, Atmospheric Environment 34, 4537-49, 2000.
Zhuang, Y.H., M. Cao, X. Wang, and H. Yao, Spatial distribution of trace-gas emissions fromburning crop residue in China, in Biomass Burning and Global Change, Volume 2, ed. J.S.Levine, MIT Press, Cambridge, Massachusetts, 1996.
-- --
- 71 -
Figures List.
Figure 1. Crop residue use (%) in Africa distributed within five major geoclimatic regions:Eastern Highlands, Semi-Arid Zone, Sub-Humid Zone, Humid Zone, and Rainfed DrylandsRegion (RANER), plus total Africa. Residue use categories are: biofuel, burning in the fields,decomposition of residue, and fodder for livestock. (Note that fodder use for RANER is 96%,but is truncated at 50%.)
Figure 2. Amount of crop residue in Asia distributed by region in Tg dry matter. China andIndia are excluded.
Figure 3. Woodfuel use in the developing world distributed on a grid of 1° latitude by 1° longi-tude in units of Tg dry matter. Woodfuel includes fuelwood and charcoal.
Figure 4. Crop residue and dung use as biofuels in the developing world distributed on a grid of1° latitude by 1° longitude in units of Tg dry matter.
Figure 5. Burning of agricultural residue in the fields in the developing world distributed on agrid of 1° latitude by 1° longitude with units Tg dry matter.
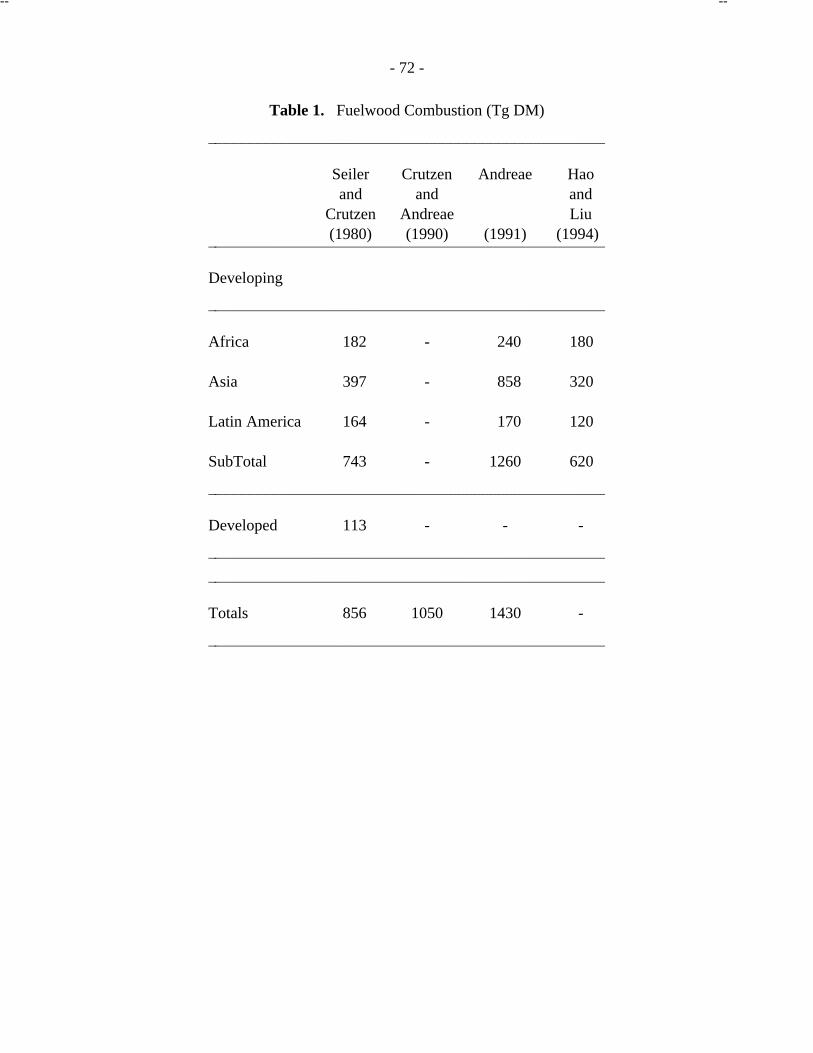
-- --
- 72 -
Table 1. Fuelwood Combustion (Tg DM)
��������������������������������������������������
Seiler Crutzen Andreae Haoand and and
Crutzen Andreae Liu(1980) (1990) (1991) (1994)��������������������������������������������������
Developing
��������������������������������������������������
Africa 182 - 240 180
Asia 397 - 858 320
Latin America 164 - 170 120
SubTotal 743 - 1260 620
��������������������������������������������������
Developed 113 - - -
��������������������������������������������������
��������������������������������������������������
Totals 856 1050 1430 -
��������������������������������������������������
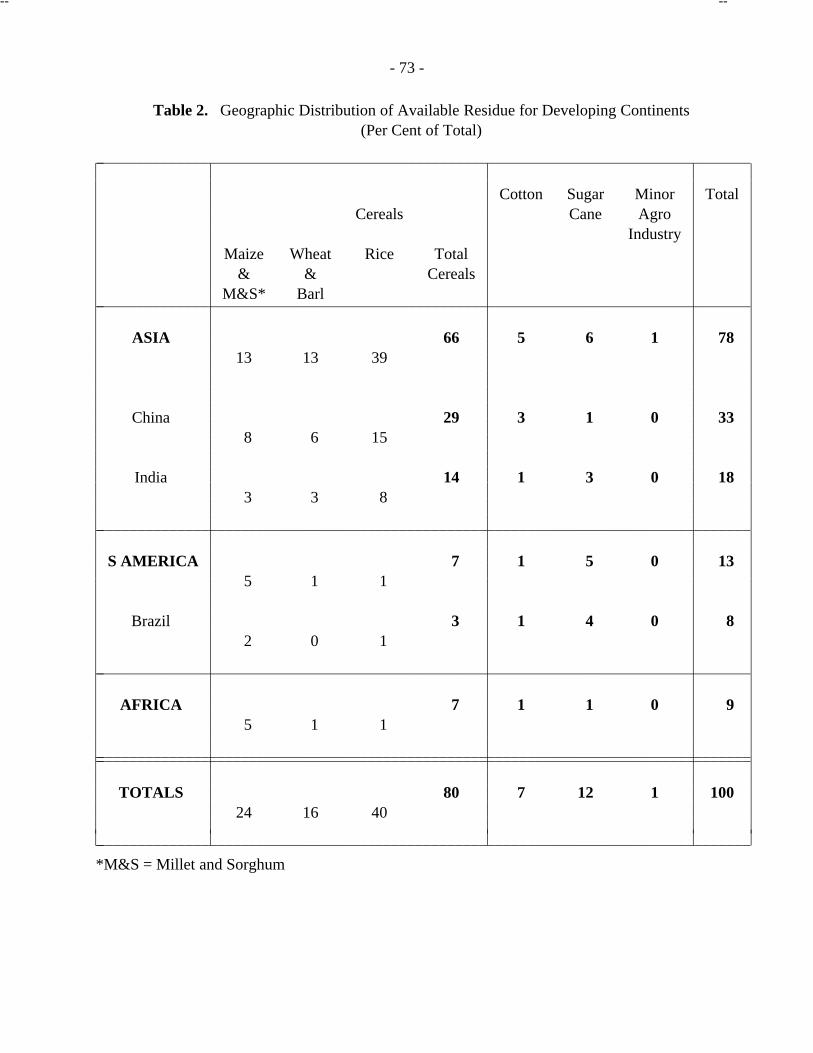
-- --
- 73 -
Table 2. Geographic Distribution of Available Residue for Developing Continents(Per Cent of Total)
�����������������������������������������������������������������������������������
Cotton Sugar Minor TotalCereals Cane Agro
IndustryMaize Wheat Rice Total
& & CerealsM&S* Barl�����������������������������������������������������������������������������������
ASIA 66 5 6 1 7813 13 39
China 29 3 1 0 338 6 15
India 14 1 3 0 183 3 8
�����������������������������������������������������������������������������������
S AMERICA 7 1 5 0 135 1 1
Brazil 3 1 4 0 82 0 1
�����������������������������������������������������������������������������������
AFRICA 7 1 1 0 95 1 1
����������������������������������������������������������������������������������������������������������������������������������������������������������������������
TOTALS 80 7 12 1 10024 16 40
������������������������������������������������������������������������������������������������������������������������������
�������������������������������������������
�������������������������������������������
�������������������������������������������
�������������������������������������������
*M&S = Millet and Sorghum
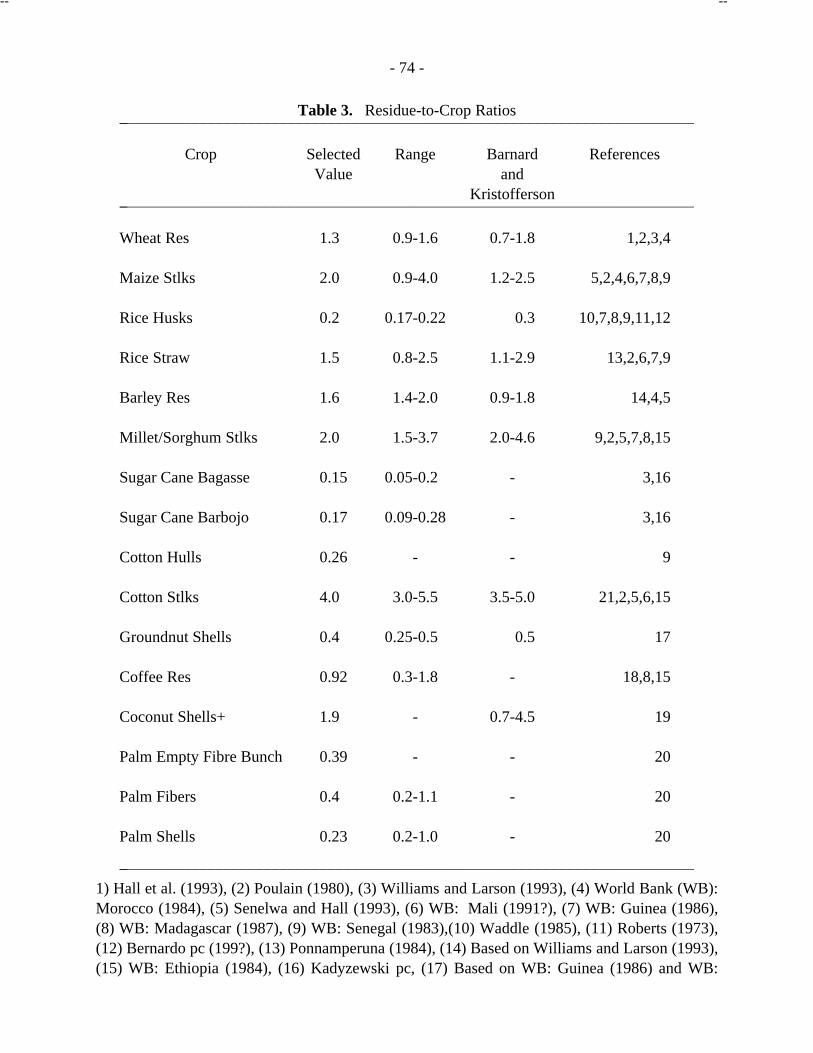
-- --
- 74 -
Table 3. Residue-to-Crop Ratios�������������������������������������������������������������������������
Crop Selected Range Barnard ReferencesValue and
Kristofferson�������������������������������������������������������������������������
Wheat Res 1.3 0.9-1.6 0.7-1.8 1,2,3,4
Maize Stlks 2.0 0.9-4.0 1.2-2.5 5,2,4,6,7,8,9
Rice Husks 0.2 0.17-0.22 0.3 10,7,8,9,11,12
Rice Straw 1.5 0.8-2.5 1.1-2.9 13,2,6,7,9
Barley Res 1.6 1.4-2.0 0.9-1.8 14,4,5
Millet/Sorghum Stlks 2.0 1.5-3.7 2.0-4.6 9,2,5,7,8,15
Sugar Cane Bagasse 0.15 0.05-0.2 - 3,16
Sugar Cane Barbojo 0.17 0.09-0.28 - 3,16
Cotton Hulls 0.26 - - 9
Cotton Stlks 4.0 3.0-5.5 3.5-5.0 21,2,5,6,15
Groundnut Shells 0.4 0.25-0.5 0.5 17
Coffee Res 0.92 0.3-1.8 - 18,8,15
Coconut Shells+ 1.9 - 0.7-4.5 19
Palm Empty Fibre Bunch 0.39 - - 20
Palm Fibers 0.4 0.2-1.1 - 20
Palm Shells 0.23 0.2-1.0 - 20
�������������������������������������������������������������������������
1) Hall et al. (1993), (2) Poulain (1980), (3) Williams and Larson (1993), (4) World Bank (WB):Morocco (1984), (5) Senelwa and Hall (1993), (6) WB: Mali (1991?), (7) WB: Guinea (1986),(8) WB: Madagascar (1987), (9) WB: Senegal (1983),(10) Waddle (1985), (11) Roberts (1973),(12) Bernardo pc (199?), (13) Ponnamperuna (1984), (14) Based on Williams and Larson (1993),(15) WB: Ethiopia (1984), (16) Kadyzewski pc, (17) Based on WB: Guinea (1986) and WB:

-- --
- 75 -
Mali (1991?), and WB: Senegal (1983), (18) WB: Ivory Coast (1985), (19) Use Barnard andKristofferson (1985), (20) Calculations based on Husin et al. (1987), Salam (1987), and Sham-suddin and Nor (1987).
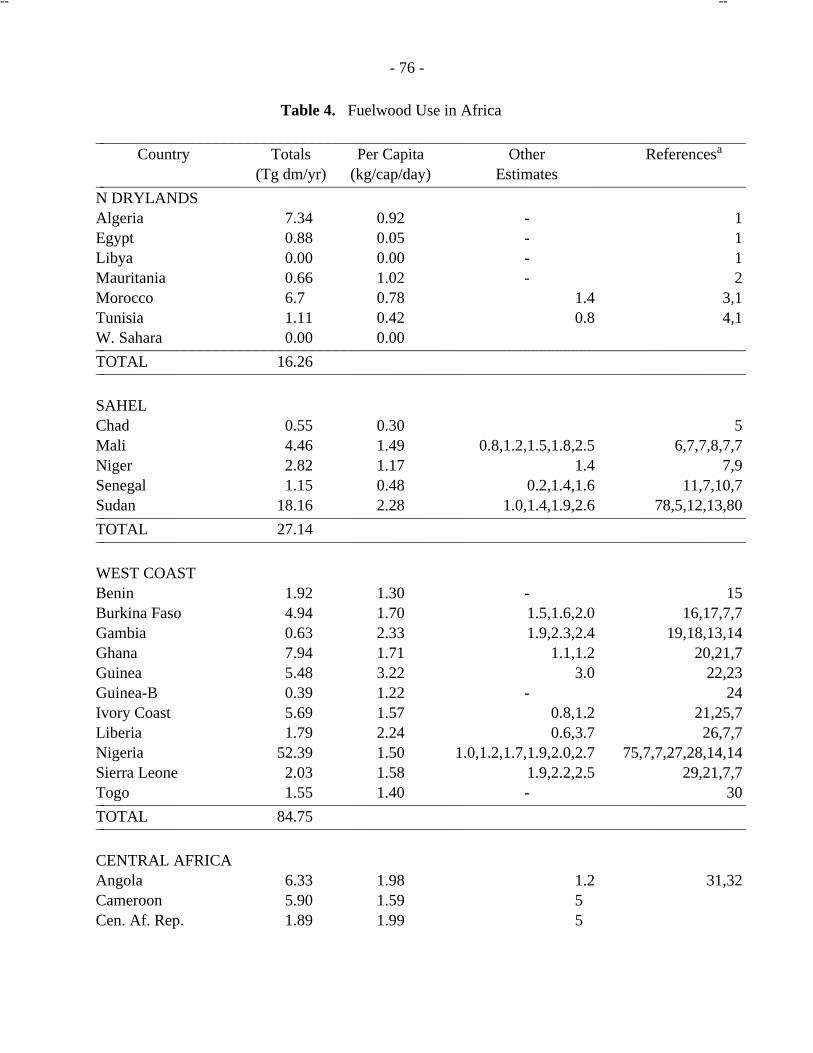
-- --
- 76 -
Table 4. Fuelwood Use in Africa
����������������������������������������������������������������������������������Country Totals Per Capita Other Referencesa
(Tg dm/yr) (kg/cap/day) Estimates����������������������������������������������������������������������������������N DRYLANDSAlgeria 7.34 0.92 - 1Egypt 0.88 0.05 - 1Libya 0.00 0.00 - 1Mauritania 0.66 1.02 - 2Morocco 6.7 0.78 1.4 3,1Tunisia 1.11 0.42 0.8 4,1W. Sahara 0.00 0.00����������������������������������������������������������������������������������TOTAL 16.26����������������������������������������������������������������������������������
SAHELChad 0.55 0.30 5Mali 4.46 1.49 0.8,1.2,1.5,1.8,2.5 6,7,7,8,7,7Niger 2.82 1.17 1.4 7,9Senegal 1.15 0.48 0.2,1.4,1.6 11,7,10,7Sudan 18.16 2.28 1.0,1.4,1.9,2.6 78,5,12,13,80����������������������������������������������������������������������������������TOTAL 27.14����������������������������������������������������������������������������������
WEST COASTBenin 1.92 1.30 - 15Burkina Faso 4.94 1.70 1.5,1.6,2.0 16,17,7,7Gambia 0.63 2.33 1.9,2.3,2.4 19,18,13,14Ghana 7.94 1.71 1.1,1.2 20,21,7Guinea 5.48 3.22 3.0 22,23Guinea-B 0.39 1.22 - 24Ivory Coast 5.69 1.57 0.8,1.2 21,25,7Liberia 1.79 2.24 0.6,3.7 26,7,7Nigeria 52.39 1.50 1.0,1.2,1.7,1.9,2.0,2.7 75,7,7,27,28,14,14Sierra Leone 2.03 1.58 1.9,2.2,2.5 29,21,7,7Togo 1.55 1.40 - 30����������������������������������������������������������������������������������TOTAL 84.75����������������������������������������������������������������������������������
CENTRAL AFRICAAngola 6.33 1.98 1.2 31,32Cameroon 5.90 1.59 5Cen. Af. Rep. 1.89 1.99 5
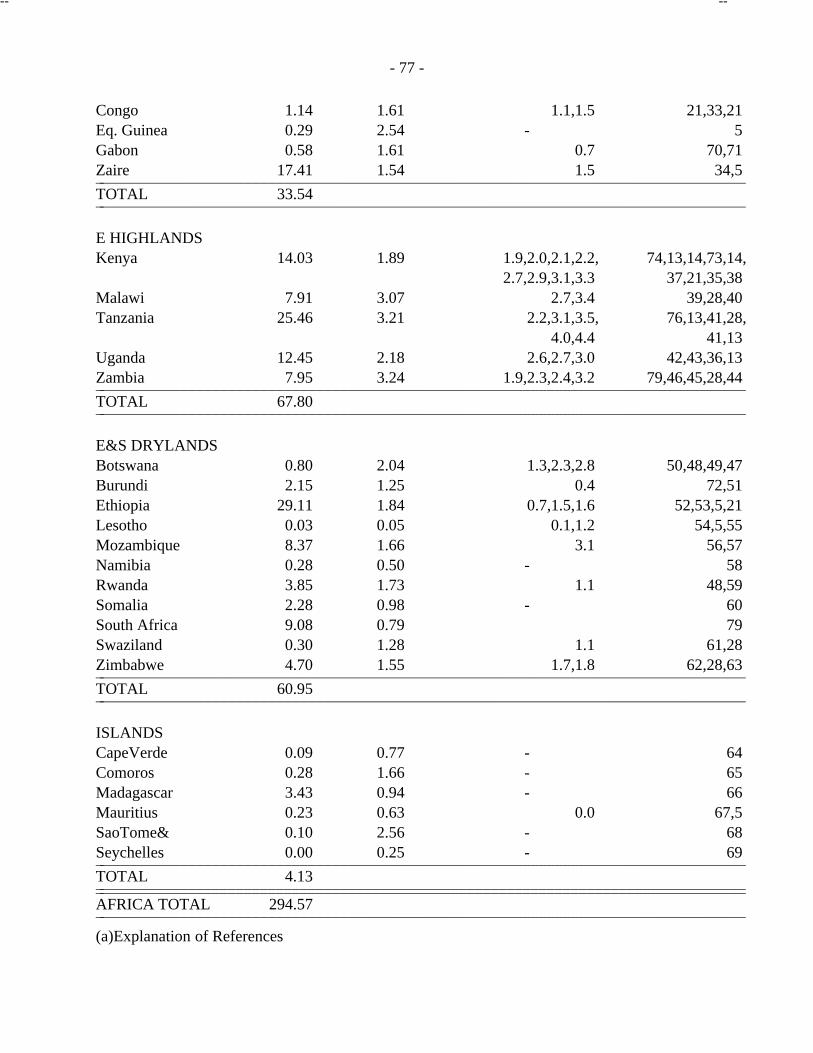
-- --
- 77 -
Congo 1.14 1.61 1.1,1.5 21,33,21Eq. Guinea 0.29 2.54 - 5Gabon 0.58 1.61 0.7 70,71Zaire 17.41 1.54 1.5 34,5����������������������������������������������������������������������������������TOTAL 33.54����������������������������������������������������������������������������������
E HIGHLANDSKenya 14.03 1.89 1.9,2.0,2.1,2.2, 74,13,14,73,14,
2.7,2.9,3.1,3.3 37,21,35,38Malawi 7.91 3.07 2.7,3.4 39,28,40Tanzania 25.46 3.21 2.2,3.1,3.5, 76,13,41,28,
4.0,4.4 41,13Uganda 12.45 2.18 2.6,2.7,3.0 42,43,36,13Zambia 7.95 3.24 1.9,2.3,2.4,3.2 79,46,45,28,44����������������������������������������������������������������������������������TOTAL 67.80����������������������������������������������������������������������������������
E&S DRYLANDSBotswana 0.80 2.04 1.3,2.3,2.8 50,48,49,47Burundi 2.15 1.25 0.4 72,51Ethiopia 29.11 1.84 0.7,1.5,1.6 52,53,5,21Lesotho 0.03 0.05 0.1,1.2 54,5,55Mozambique 8.37 1.66 3.1 56,57Namibia 0.28 0.50 - 58Rwanda 3.85 1.73 1.1 48,59Somalia 2.28 0.98 - 60South Africa 9.08 0.79 79Swaziland 0.30 1.28 1.1 61,28Zimbabwe 4.70 1.55 1.7,1.8 62,28,63����������������������������������������������������������������������������������TOTAL 60.95����������������������������������������������������������������������������������
ISLANDSCapeVerde 0.09 0.77 - 64Comoros 0.28 1.66 - 65Madagascar 3.43 0.94 - 66Mauritius 0.23 0.63 0.0 67,5SaoTome& 0.10 2.56 - 68Seychelles 0.00 0.25 - 69����������������������������������������������������������������������������������TOTAL 4.13��������������������������������������������������������������������������������������������������������������������������������������������������������������������AFRICA TOTAL 294.57����������������������������������������������������������������������������������
(a)Explanation of References
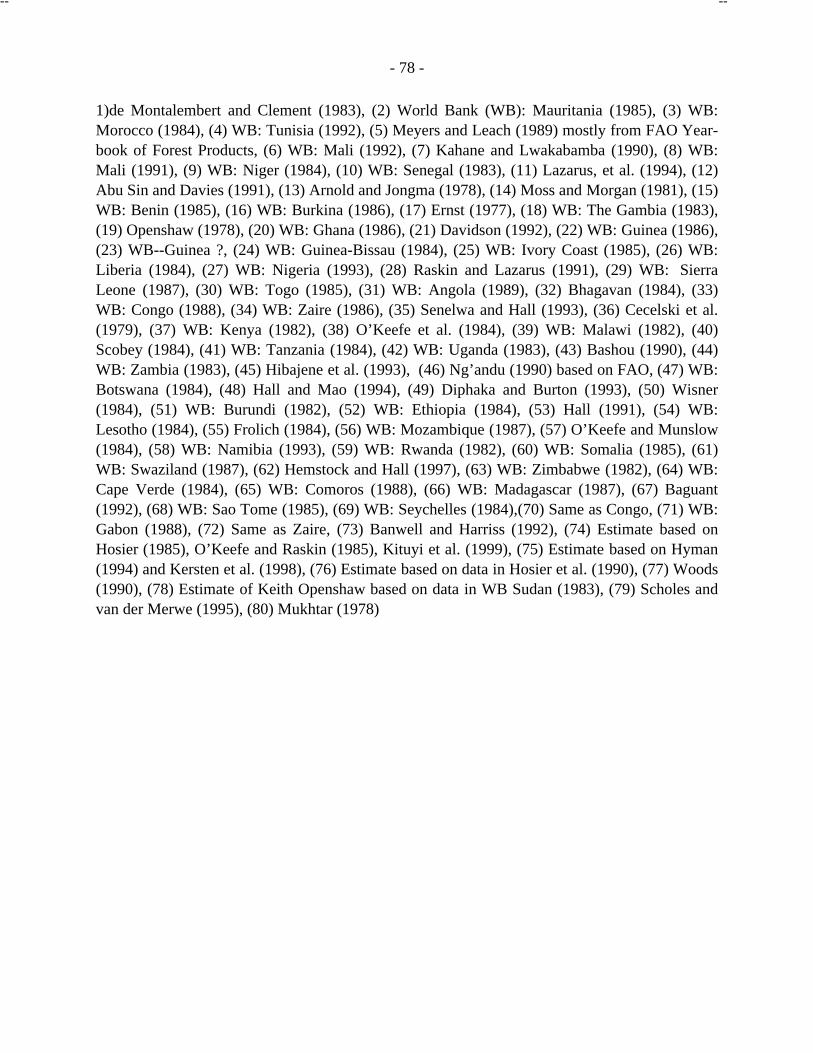
-- --
- 78 -
1)de Montalembert and Clement (1983), (2) World Bank (WB): Mauritania (1985), (3) WB:Morocco (1984), (4) WB: Tunisia (1992), (5) Meyers and Leach (1989) mostly from FAO Year-book of Forest Products, (6) WB: Mali (1992), (7) Kahane and Lwakabamba (1990), (8) WB:Mali (1991), (9) WB: Niger (1984), (10) WB: Senegal (1983), (11) Lazarus, et al. (1994), (12)Abu Sin and Davies (1991), (13) Arnold and Jongma (1978), (14) Moss and Morgan (1981), (15)WB: Benin (1985), (16) WB: Burkina (1986), (17) Ernst (1977), (18) WB: The Gambia (1983),(19) Openshaw (1978), (20) WB: Ghana (1986), (21) Davidson (1992), (22) WB: Guinea (1986),(23) WB--Guinea ?, (24) WB: Guinea-Bissau (1984), (25) WB: Ivory Coast (1985), (26) WB:Liberia (1984), (27) WB: Nigeria (1993), (28) Raskin and Lazarus (1991), (29) WB: SierraLeone (1987), (30) WB: Togo (1985), (31) WB: Angola (1989), (32) Bhagavan (1984), (33)WB: Congo (1988), (34) WB: Zaire (1986), (35) Senelwa and Hall (1993), (36) Cecelski et al.(1979), (37) WB: Kenya (1982), (38) O’Keefe et al. (1984), (39) WB: Malawi (1982), (40)Scobey (1984), (41) WB: Tanzania (1984), (42) WB: Uganda (1983), (43) Bashou (1990), (44)WB: Zambia (1983), (45) Hibajene et al. (1993), (46) Ng’andu (1990) based on FAO, (47) WB:Botswana (1984), (48) Hall and Mao (1994), (49) Diphaka and Burton (1993), (50) Wisner(1984), (51) WB: Burundi (1982), (52) WB: Ethiopia (1984), (53) Hall (1991), (54) WB:Lesotho (1984), (55) Frolich (1984), (56) WB: Mozambique (1987), (57) O’Keefe and Munslow(1984), (58) WB: Namibia (1993), (59) WB: Rwanda (1982), (60) WB: Somalia (1985), (61)WB: Swaziland (1987), (62) Hemstock and Hall (1997), (63) WB: Zimbabwe (1982), (64) WB:Cape Verde (1984), (65) WB: Comoros (1988), (66) WB: Madagascar (1987), (67) Baguant(1992), (68) WB: Sao Tome (1985), (69) WB: Seychelles (1984),(70) Same as Congo, (71) WB:Gabon (1988), (72) Same as Zaire, (73) Banwell and Harriss (1992), (74) Estimate based onHosier (1985), O’Keefe and Raskin (1985), Kituyi et al. (1999), (75) Estimate based on Hyman(1994) and Kersten et al. (1998), (76) Estimate based on data in Hosier et al. (1990), (77) Woods(1990), (78) Estimate of Keith Openshaw based on data in WB Sudan (1983), (79) Scholes andvan der Merwe (1995), (80) Mukhtar (1978)
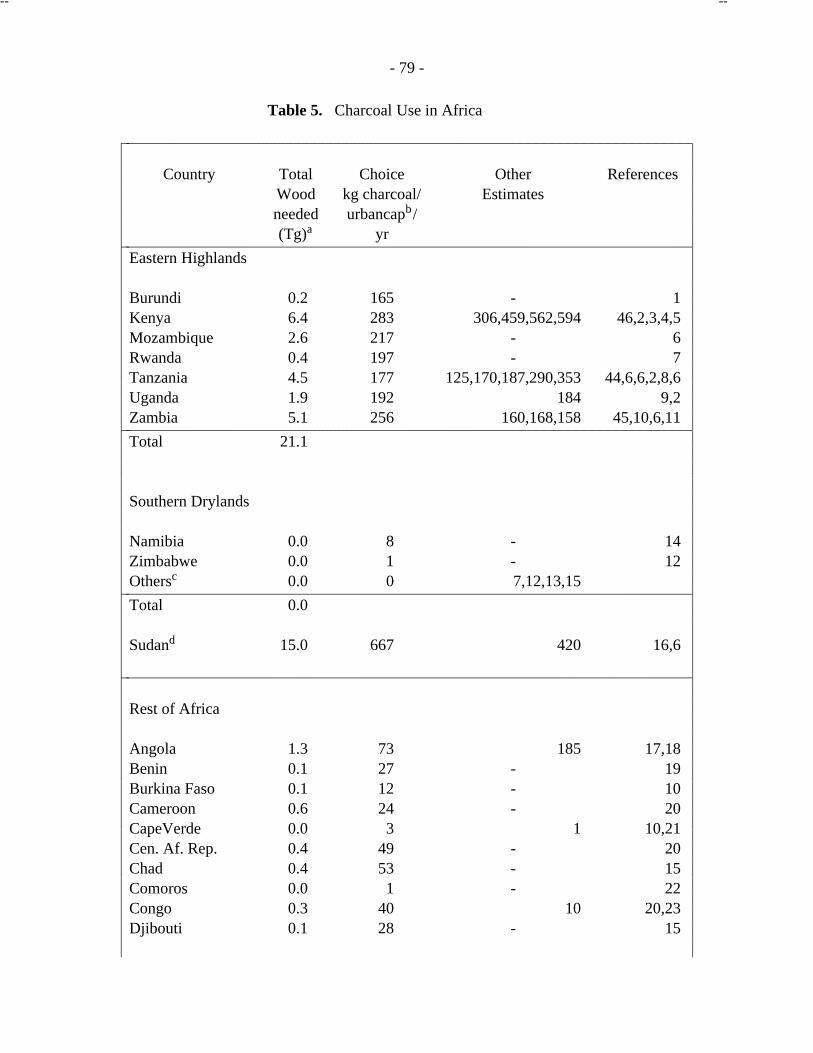
-- --
- 79 -
Table 5. Charcoal Use in Africa
������������������������������������������������������������������������
Country Total Choice Other ReferencesWood kg charcoal/ Estimatesneeded urbancapb/(Tg)a yr������������������������������������������������������������������������
Eastern Highlands
Burundi 0.2 165 - 1Kenya 6.4 283 306,459,562,594 46,2,3,4,5Mozambique 2.6 217 - 6Rwanda 0.4 197 - 7Tanzania 4.5 177 125,170,187,290,353 44,6,6,2,8,6Uganda 1.9 192 184 9,2Zambia 5.1 256 160,168,158 45,10,6,11������������������������������������������������������������������������Total 21.1
Southern Drylands
Namibia 0.0 8 - 14Zimbabwe 0.0 1 - 12Othersc 0.0 0 7,12,13,15������������������������������������������������������������������������Total 0.0
Sudand 15.0 667 420 16,6
������������������������������������������������������������������������
Rest of Africa
Angola 1.3 73 185 17,18Benin 0.1 27 - 19Burkina Faso 0.1 12 - 10Cameroon 0.6 24 - 20CapeVerde 0.0 3 1 10,21Cen. Af. Rep. 0.4 49 - 20Chad 0.4 53 - 15Comoros 0.0 1 - 22Congo 0.3 40 10 20,23Djibouti 0.1 28 - 15
���������������������������������������������������
���������������������������������������������������
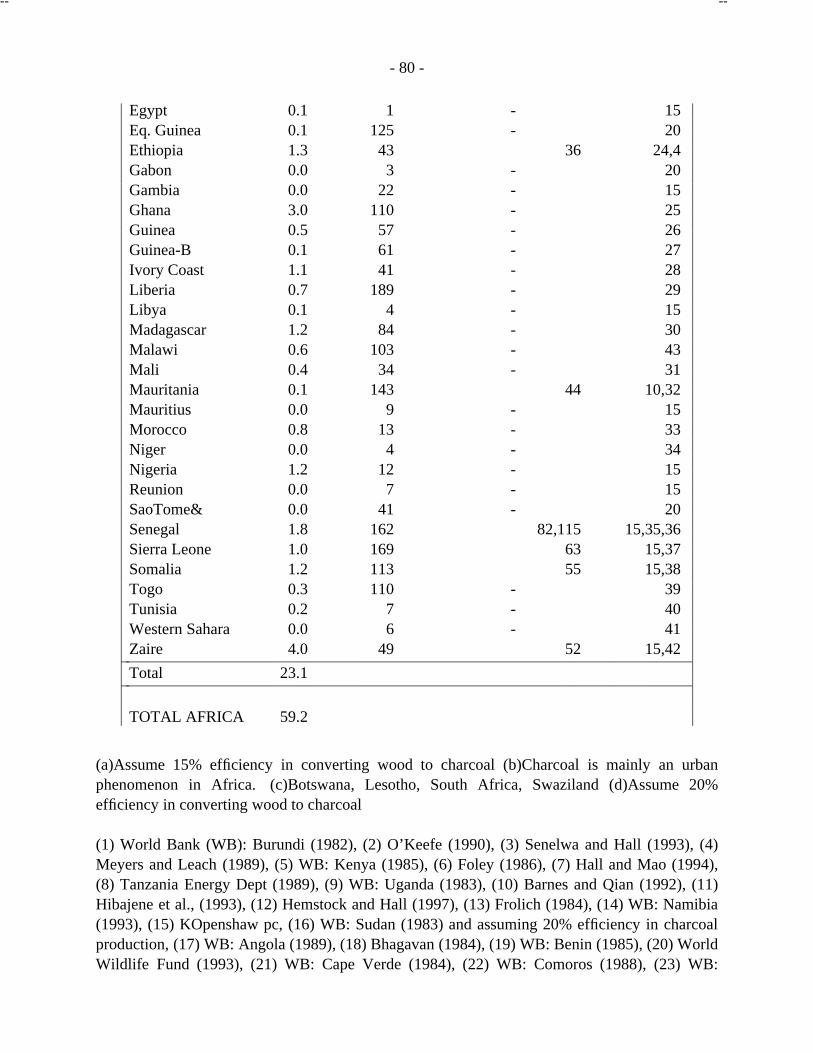
-- --
- 80 -
Egypt 0.1 1 - 15Eq. Guinea 0.1 125 - 20Ethiopia 1.3 43 36 24,4Gabon 0.0 3 - 20Gambia 0.0 22 - 15Ghana 3.0 110 - 25Guinea 0.5 57 - 26Guinea-B 0.1 61 - 27Ivory Coast 1.1 41 - 28Liberia 0.7 189 - 29Libya 0.1 4 - 15Madagascar 1.2 84 - 30Malawi 0.6 103 - 43Mali 0.4 34 - 31Mauritania 0.1 143 44 10,32Mauritius 0.0 9 - 15Morocco 0.8 13 - 33Niger 0.0 4 - 34Nigeria 1.2 12 - 15Reunion 0.0 7 - 15SaoTome& 0.0 41 - 20Senegal 1.8 162 82,115 15,35,36Sierra Leone 1.0 169 63 15,37Somalia 1.2 113 55 15,38Togo 0.3 110 - 39Tunisia 0.2 7 - 40Western Sahara 0.0 6 - 41Zaire 4.0 49 52 15,42������������������������������������������������������������������������Total 23.1������������������������������������������������������������������������
TOTAL AFRICA 59.2���������������������������������������
���������������������������������������
(a)Assume 15% efficiency in converting wood to charcoal (b)Charcoal is mainly an urbanphenomenon in Africa. (c)Botswana, Lesotho, South Africa, Swaziland (d)Assume 20%efficiency in converting wood to charcoal
(1) World Bank (WB): Burundi (1982), (2) O’Keefe (1990), (3) Senelwa and Hall (1993), (4)Meyers and Leach (1989), (5) WB: Kenya (1985), (6) Foley (1986), (7) Hall and Mao (1994),(8) Tanzania Energy Dept (1989), (9) WB: Uganda (1983), (10) Barnes and Qian (1992), (11)Hibajene et al., (1993), (12) Hemstock and Hall (1997), (13) Frolich (1984), (14) WB: Namibia(1993), (15) KOpenshaw pc, (16) WB: Sudan (1983) and assuming 20% efficiency in charcoalproduction, (17) WB: Angola (1989), (18) Bhagavan (1984), (19) WB: Benin (1985), (20) WorldWildlife Fund (1993), (21) WB: Cape Verde (1984), (22) WB: Comoros (1988), (23) WB:
-- --
- 81 -
Congo (1988), (24) WB: Ethiopia (1984), (25) WB: Ghana (1986), (26) WB: Guinea (1986),(27) WB: Guinea-Bissau (1984), (28) WB: Ivory Coast (1985), (29) Kahane and Lwakabamba(1990), (30) WB: Madagascar (1987), (31) WB: Mali (1991), (32) WB: Mauritania (1985), (33)WB: Morocco (1984), (34) WB: Niger (1984), (35) Lazarus (1994), (36) WB: Senegal (1983),(37) WB: Sierra Leone (1987), (38) WB: Somalia (1985), (39) WB: Togo (1985), (40) WB:Tunisia (1992), (41) Estimated from Morocco, (42) WB: Zaire (1986), (43) Openshaw (1997b)assumes 23.6% conversion efficiency, (44) Estimate based on Hosier et al. (1990), (45) Woods(1990), (46) Estimate based on Hosier (1985), Mungala and Openshaw (1984), and Kituyi et al.(1999)
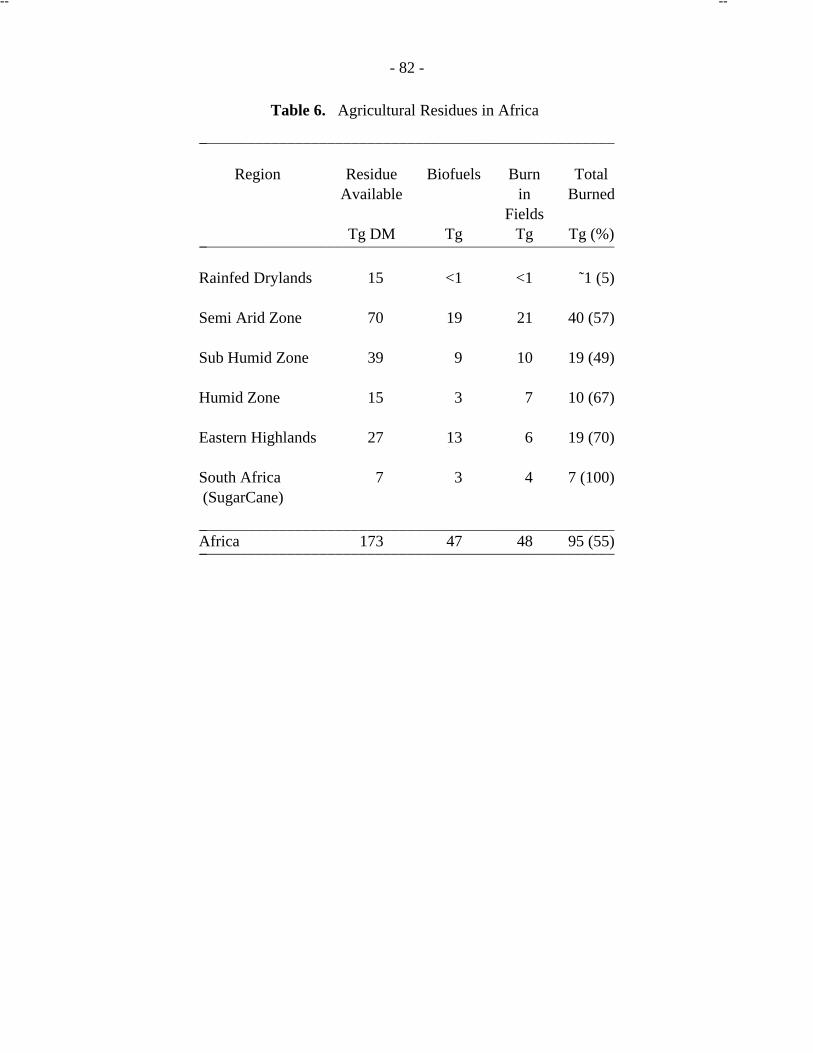
-- --
- 82 -
Table 6. Agricultural Residues in Africa
�����������������������������������������������������
Region Residue Biofuels Burn TotalAvailable in Burned
FieldsTg DM Tg Tg Tg (%)�����������������������������������������������������
Rainfed Drylands 15 <1 <1 ˜1 (5)
Semi Arid Zone 70 19 21 40 (57)
Sub Humid Zone 39 9 10 19 (49)
Humid Zone 15 3 7 10 (67)
Eastern Highlands 27 13 6 19 (70)
South Africa 7 3 4 7 (100)(SugarCane)
�����������������������������������������������������Africa 173 47 48 95 (55)�����������������������������������������������������

-- --
- 83 -
Table 7. Woodfuels Use in Asia
������������������������������������������������������������������������������������
Country Total Per Choice Other ReferencesCent Estimates
(Tg) Charcoal (kg/cap/day) (kg/cap/day)
������������������������������������������������������������������������������������MIDDLE EASTAfghanistan 3.8 NA 0.57 1Iran 0.9 NA 0.05 2Iraq 2.4 NA 0.42 3Pakistan 14.7 0.8 0.42 0.64,0.42 4,1,5Turkey 17.8 NA 0.97 0.64,0.73 6,32,3YemenAR 4.5 1.3 1.57 7
Other Countries 0.3 NA 0.00-0.06 3
FAR EASTBangladesh 14.5 0 0.4 0.07,0.09,0.34,0.55 8,9,5,10,1Bhutan 2.2 3 4.43 1Brunei 0.2 NA 2.43 1Myanmar 25.4 4 1.81 1.68,2.07 31,11,1Indonesia 60.1 1.1 1.00 1.57,1.30,1.44,1.02,0.92 12,1,13,5,14,3Japan 19.0 50 0.43 1Cambodia 7.4 NA 2.83 1KoreaN 3.1 NA 0.42 1KoreaS 4.6 NA 0.31 0.23 1,15Laos 4.3 NA 3.26 1Malaysia 8.6 8 1.48 1Mongolia 1.0 NA 1.45 1Nepal 9.8 2 1.57 0.78,1.28,1.43,2.54 16,17,17,17,1Philippines 29.9 5 1.52 1.0 1,5Sri Lanka 6.4 1 1.06 1.27,0.93 1,18,19Taiwan 1.3 NA 0.18 10Thailand 28.3 53 1.50 2.26,0.7,1.22,2.7,6.3 33,20,21,5,22,10Vietnam 25.8 7 1.18 0.41,0.69,0.81 23,24,5,25WSamoa 0.1 0 1.25 26
PacificIslands 3.4 NA 0.7-2.1 1,27,28,29,30������������������������������������������������������������������������������������Total 299.8
-- --
- 84 -
������������������������������������������������������������������������������������
(1)Openshaw pc, (2) Fesharaki (1976), (3)De Montalembert and Clement, (1983), (4) Ebinger(1981), (5) Meyers and Leach (1989), (6) World Bank (WB): Turkey (1983), (7) WB: YemenArab Republic (1984), (8) Islam (1984), (9) WB: Bangladesh (1982), (10) Office of TechnologyAssessment (1991), (11)WB: Burma (1985), (12) Soesastro (1984), (13) WB: Indonesia (1981),(14) Di Marzo (1994), (15) Yager (1984), (16) WB: Nepal (1983), (17) Earl (1975), (18) Leach(1987), (19) WB: Sri Lanka (1982), (20) Moss&Morgan quoting Openshaw (1976), (21) WB:Thailand (1985), (22) Openshaw (1978), (23) WB: Vietnam (1994), (24) Tuan & Lefevre(1996), (25) England and Kammen (1993), (26) WB: Western Samoa (1985), (27) WB: PapuaNew Guinea (1982), (28) WB: Fiji (1983), (29) WB: Solomon Islands (1992), (30) WB: Vanuatu(1985), (31) Ministry of Forestry: Myanmar (1997), (32) Ileri and Gurer (1998),(33) KeithOpenshaw, personal communication.
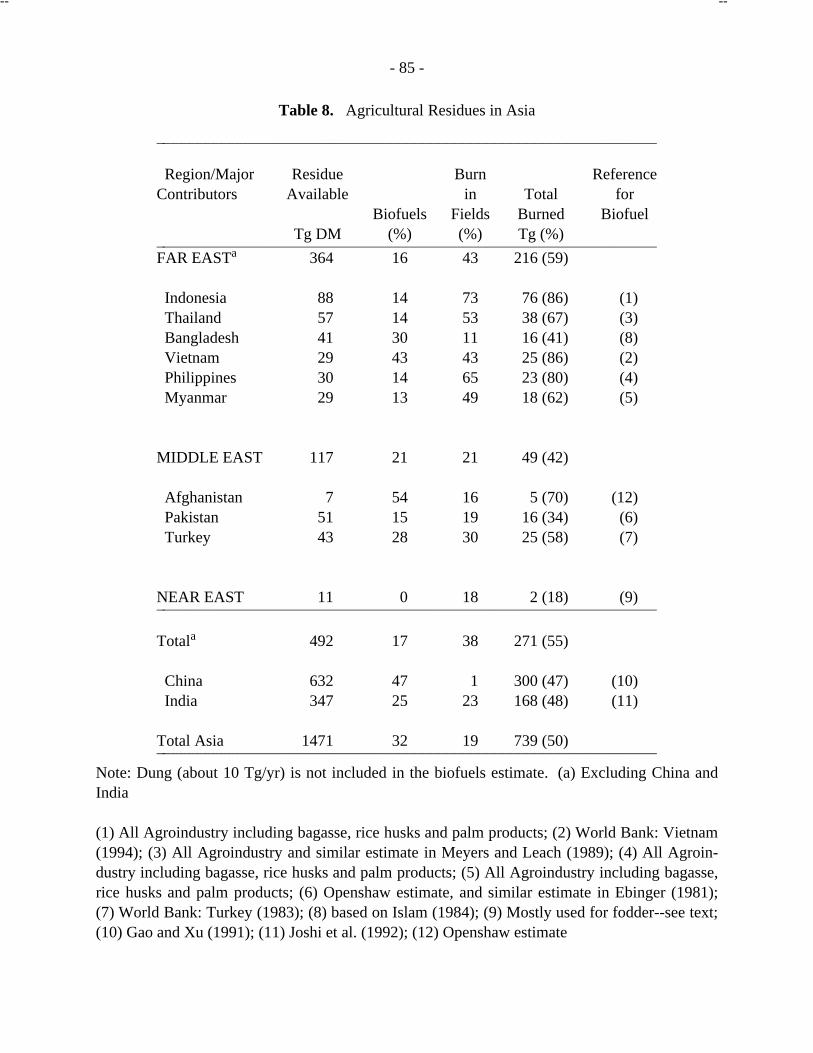
-- --
- 85 -
Table 8. Agricultural Residues in Asia
���������������������������������������������������������������
Region/Major Residue Burn ReferenceContributors Available in Total for
Biofuels Fields Burned BiofuelTg DM (%) (%) Tg (%)���������������������������������������������������������������
FAR EASTa 364 16 43 216 (59)
Indonesia 88 14 73 76 (86) (1)Thailand 57 14 53 38 (67) (3)Bangladesh 41 30 11 16 (41) (8)Vietnam 29 43 43 25 (86) (2)Philippines 30 14 65 23 (80) (4)Myanmar 29 13 49 18 (62) (5)
MIDDLE EAST 117 21 21 49 (42)
Afghanistan 7 54 16 5 (70) (12)Pakistan 51 15 19 16 (34) (6)Turkey 43 28 30 25 (58) (7)
NEAR EAST 11 0 18 2 (18) (9)���������������������������������������������������������������
Totala 492 17 38 271 (55)
China 632 47 1 300 (47) (10)India 347 25 23 168 (48) (11)
Total Asia 1471 32 19 739 (50)���������������������������������������������������������������
Note: Dung (about 10 Tg/yr) is not included in the biofuels estimate. (a) Excluding China andIndia
(1) All Agroindustry including bagasse, rice husks and palm products; (2) World Bank: Vietnam(1994); (3) All Agroindustry and similar estimate in Meyers and Leach (1989); (4) All Agroin-dustry including bagasse, rice husks and palm products; (5) All Agroindustry including bagasse,rice husks and palm products; (6) Openshaw estimate, and similar estimate in Ebinger (1981);(7) World Bank: Turkey (1983); (8) based on Islam (1984); (9) Mostly used for fodder--see text;(10) Gao and Xu (1991); (11) Joshi et al. (1992); (12) Openshaw estimate
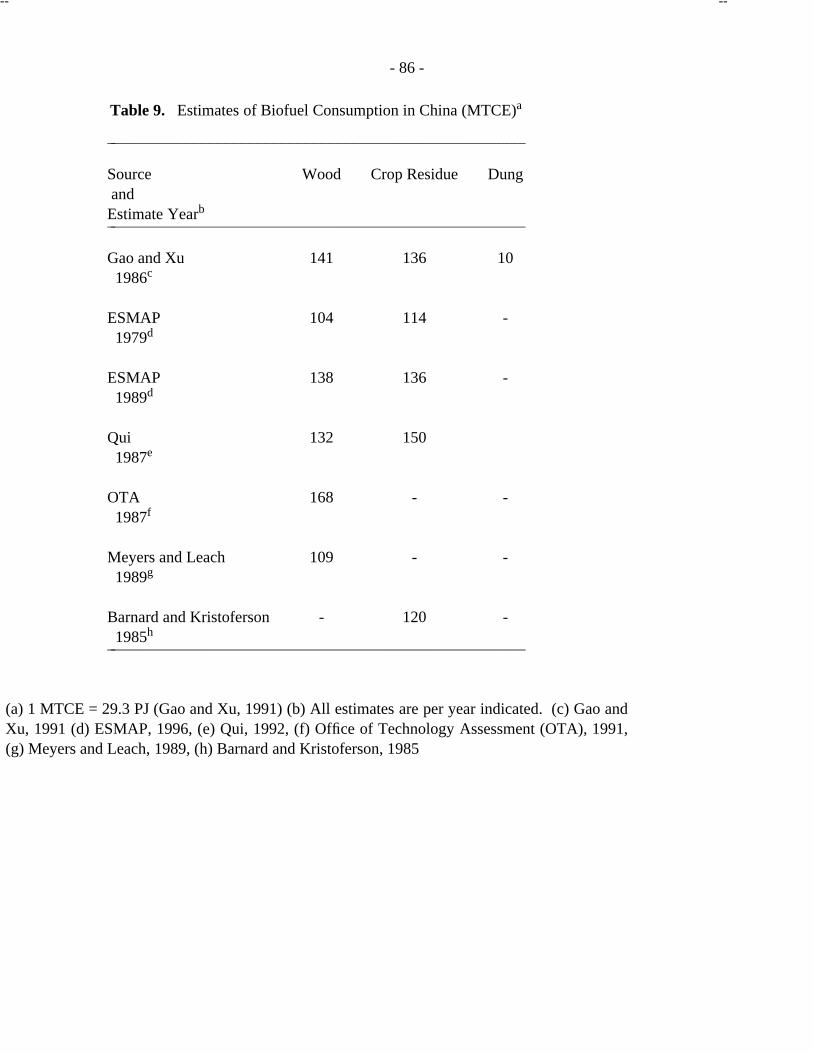
-- --
- 86 -
Table 9. Estimates of Biofuel Consumption in China (MTCE)a
�����������������������������������������������������
Source Wood Crop Residue DungandEstimate Yearb�����������������������������������������������������
Gao and Xu 141 136 101986c
ESMAP 104 114 -1979d
ESMAP 138 136 -1989d
Qui 132 1501987e
OTA 168 - -1987f
Meyers and Leach 109 - -1989g
Barnard and Kristoferson - 120 -1985h
�����������������������������������������������������
(a) 1 MTCE = 29.3 PJ (Gao and Xu, 1991) (b) All estimates are per year indicated. (c) Gao andXu, 1991 (d) ESMAP, 1996, (e) Qui, 1992, (f) Office of Technology Assessment (OTA), 1991,(g) Meyers and Leach, 1989, (h) Barnard and Kristoferson, 1985

-- --
- 87 -
Table 10. Woodfuel, Residue, and Dung Domestic Fuels in China (Tg DM/yr)
�����������������������������������������������������������������Province Woodfuel Agricultural Residue Dung�����������������������������������������������������������������Xinjiang 2.36 5.11 6.72
Xizang - 0.44 0.98Qinghai 0.21 0.81 2.01Gansu 1.21 4.66 10.08Yunnan 22.08 7.85 -Sichuan 34.62 28.83 -Heilongjiang 4.52 7.22 -Nei Monggol 8.60 6.99 -Ningxia 0.29 1.48 -Jilin 3.65 5.00 -Liaoning 5.74 11.56 -Guangxi 15.05 10.06 -Guizhou 20.37 6.04 -Guangdong 13.03 14.04 -Hunan 19.84 19.79 -Hubei 11.48 16.36 -Shaanxi 10.50 7.57 -Shanxi 2.83 5.34 -Henan 14.03 21.30 -Jiangxi 15.47 12.18 -Fujian 13.34 5.97 -Zhejiang 15.55 12.36 -Anhui 7.55 12.18 -Jiangsu 3.20 22.28 -Shandong 15.70 27.18 -Hebei 2.64 16.38 -Beijing - 2.12 -Tianjin - 1.50 -Shanghai - 1.85 -�����������������������������������������������������������������Totals 263.85 294.48 19.79�����������������������������������������������������������������
Taken from Gao and Xu (1991) and scaled to 1985 using populations from FAO, 1986a. Seetext.
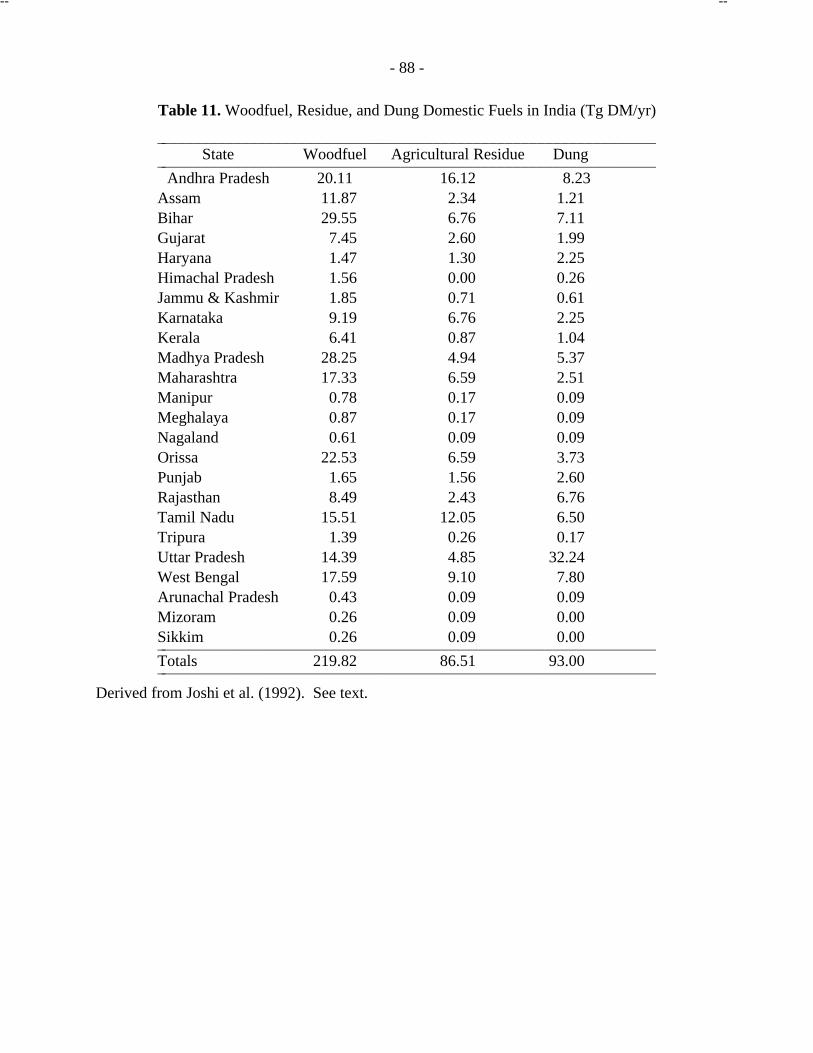
-- --
- 88 -
Table 11. Woodfuel, Residue, and Dung Domestic Fuels in India (Tg DM/yr)
���������������������������������������������������������������State Woodfuel Agricultural Residue Dung���������������������������������������������������������������
Andhra Pradesh 20.11 16.12 8.23Assam 11.87 2.34 1.21Bihar 29.55 6.76 7.11Gujarat 7.45 2.60 1.99Haryana 1.47 1.30 2.25Himachal Pradesh 1.56 0.00 0.26Jammu & Kashmir 1.85 0.71 0.61Karnataka 9.19 6.76 2.25Kerala 6.41 0.87 1.04Madhya Pradesh 28.25 4.94 5.37Maharashtra 17.33 6.59 2.51Manipur 0.78 0.17 0.09Meghalaya 0.87 0.17 0.09Nagaland 0.61 0.09 0.09Orissa 22.53 6.59 3.73Punjab 1.65 1.56 2.60Rajasthan 8.49 2.43 6.76Tamil Nadu 15.51 12.05 6.50Tripura 1.39 0.26 0.17Uttar Pradesh 14.39 4.85 32.24West Bengal 17.59 9.10 7.80Arunachal Pradesh 0.43 0.09 0.09Mizoram 0.26 0.09 0.00Sikkim 0.26 0.09 0.00���������������������������������������������������������������Totals 219.82 86.51 93.00���������������������������������������������������������������
Derived from Joshi et al. (1992). See text.
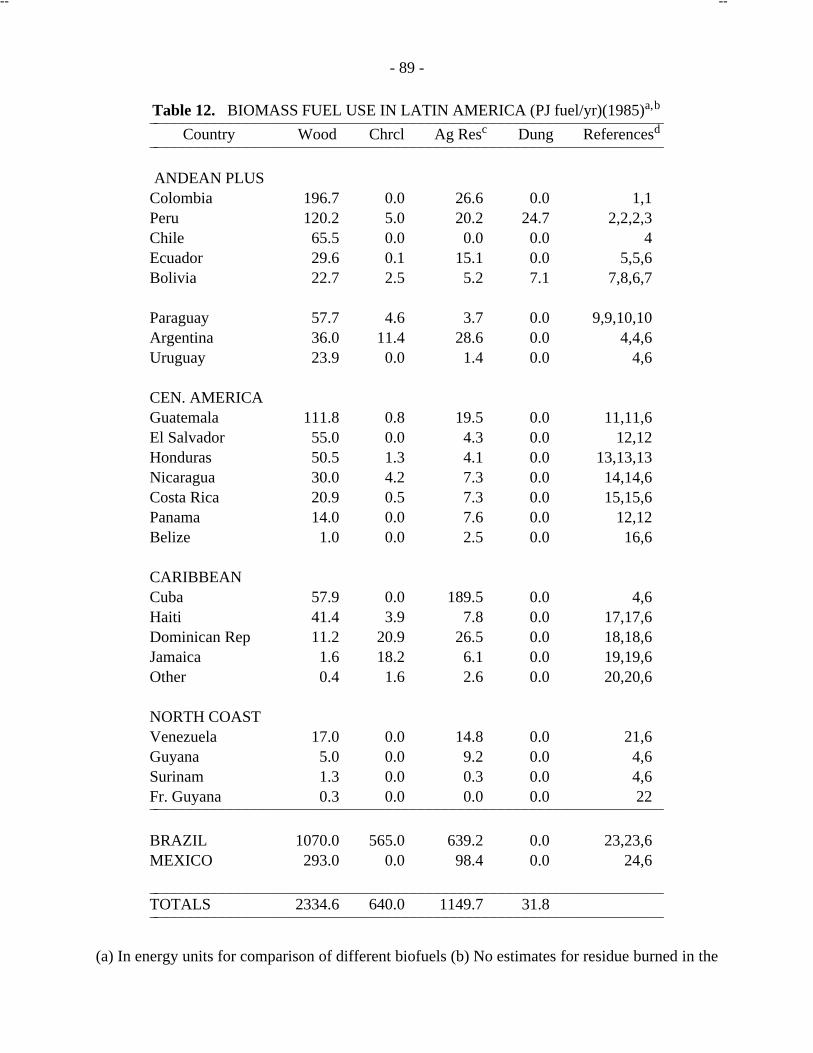
-- --
- 89 -
Table 12. BIOMASS FUEL USE IN LATIN AMERICA (PJ fuel/yr)(1985)a,b�����������������������������������������������������������������
Country Wood Chrcl Ag Resc Dung Referencesd�����������������������������������������������������������������
ANDEAN PLUSColombia 196.7 0.0 26.6 0.0 1,1Peru 120.2 5.0 20.2 24.7 2,2,2,3Chile 65.5 0.0 0.0 0.0 4Ecuador 29.6 0.1 15.1 0.0 5,5,6Bolivia 22.7 2.5 5.2 7.1 7,8,6,7
Paraguay 57.7 4.6 3.7 0.0 9,9,10,10Argentina 36.0 11.4 28.6 0.0 4,4,6Uruguay 23.9 0.0 1.4 0.0 4,6
CEN. AMERICAGuatemala 111.8 0.8 19.5 0.0 11,11,6El Salvador 55.0 0.0 4.3 0.0 12,12Honduras 50.5 1.3 4.1 0.0 13,13,13Nicaragua 30.0 4.2 7.3 0.0 14,14,6Costa Rica 20.9 0.5 7.3 0.0 15,15,6Panama 14.0 0.0 7.6 0.0 12,12Belize 1.0 0.0 2.5 0.0 16,6
CARIBBEANCuba 57.9 0.0 189.5 0.0 4,6Haiti 41.4 3.9 7.8 0.0 17,17,6Dominican Rep 11.2 20.9 26.5 0.0 18,18,6Jamaica 1.6 18.2 6.1 0.0 19,19,6Other 0.4 1.6 2.6 0.0 20,20,6
NORTH COASTVenezuela 17.0 0.0 14.8 0.0 21,6Guyana 5.0 0.0 9.2 0.0 4,6Surinam 1.3 0.0 0.3 0.0 4,6Fr. Guyana 0.3 0.0 0.0 0.0 22�����������������������������������������������������������������
BRAZIL 1070.0 565.0 639.2 0.0 23,23,6MEXICO 293.0 0.0 98.4 0.0 24,6
�����������������������������������������������������������������TOTALS 2334.6 640.0 1149.7 31.8�����������������������������������������������������������������
(a) In energy units for comparison of different biofuels (b) No estimates for residue burned in the
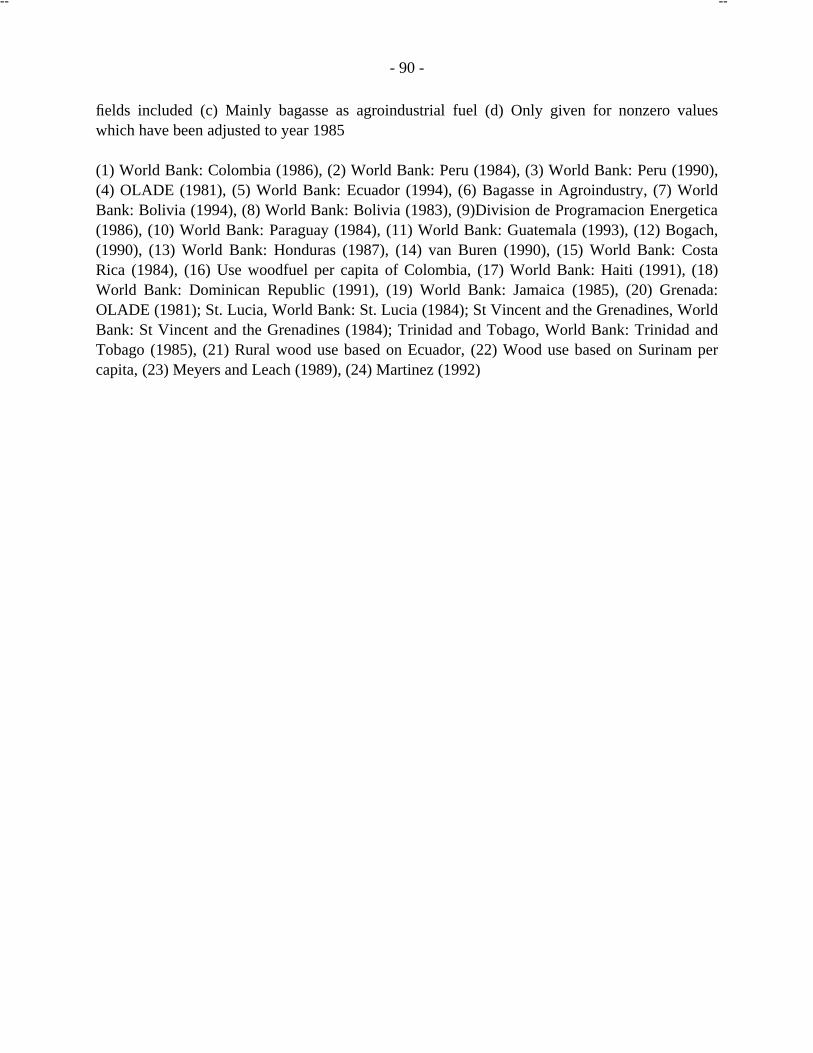
-- --
- 90 -
fields included (c) Mainly bagasse as agroindustrial fuel (d) Only given for nonzero valueswhich have been adjusted to year 1985
(1) World Bank: Colombia (1986), (2) World Bank: Peru (1984), (3) World Bank: Peru (1990),(4) OLADE (1981), (5) World Bank: Ecuador (1994), (6) Bagasse in Agroindustry, (7) WorldBank: Bolivia (1994), (8) World Bank: Bolivia (1983), (9)Division de Programacion Energetica(1986), (10) World Bank: Paraguay (1984), (11) World Bank: Guatemala (1993), (12) Bogach,(1990), (13) World Bank: Honduras (1987), (14) van Buren (1990), (15) World Bank: CostaRica (1984), (16) Use woodfuel per capita of Colombia, (17) World Bank: Haiti (1991), (18)World Bank: Dominican Republic (1991), (19) World Bank: Jamaica (1985), (20) Grenada:OLADE (1981); St. Lucia, World Bank: St. Lucia (1984); St Vincent and the Grenadines, WorldBank: St Vincent and the Grenadines (1984); Trinidad and Tobago, World Bank: Trinidad andTobago (1985), (21) Rural wood use based on Ecuador, (22) Wood use based on Surinam percapita, (23) Meyers and Leach (1989), (24) Martinez (1992)

-- --
- 91 -
Table 13. Biomass Combustion (Tg DM 1985)
�����������������������������������������������������������������������������
Burn Biofuel Totalin Total DM Burned
Fields Residue Dung Woodfuel Fuel (Residue)a
�����������������������������������������������������������������������������
Africa 49 47 11 354 412 461 (96)
Asia 274 465 123 784 1372 1646 (739)India 81 87 93 220 400 481 (168)China 6 294 20 264 578 584 (300)
Latin America 85 85 2 186 273 358 (170)Brazil 42 47 - 102 149 191 (89)
�����������������������������������������������������������������������������
TotalsDevlping World 408 597 136 1324 2057 2465 (1005)
�����������������������������������������������������������������������������
N. America, CIS, 36 (US) - - 388 388 424 (36)W. Europe
Australia 7 - - 2 2 9 (7)
�����������������������������������������������������������������������������
Totals 451 597 136 1714 2447 2898 (1048)
������������������������������������������������������������������������������������������������������������������
�������������������������������������
�������������������������������������
�������������������������������������
�������������������������������������
(a) The last column gives the total dry matter burned, including woodfuels, dung, residue burnedas fuel and residue burned in fields. The number in parenthesis is the total amount of residueburned.
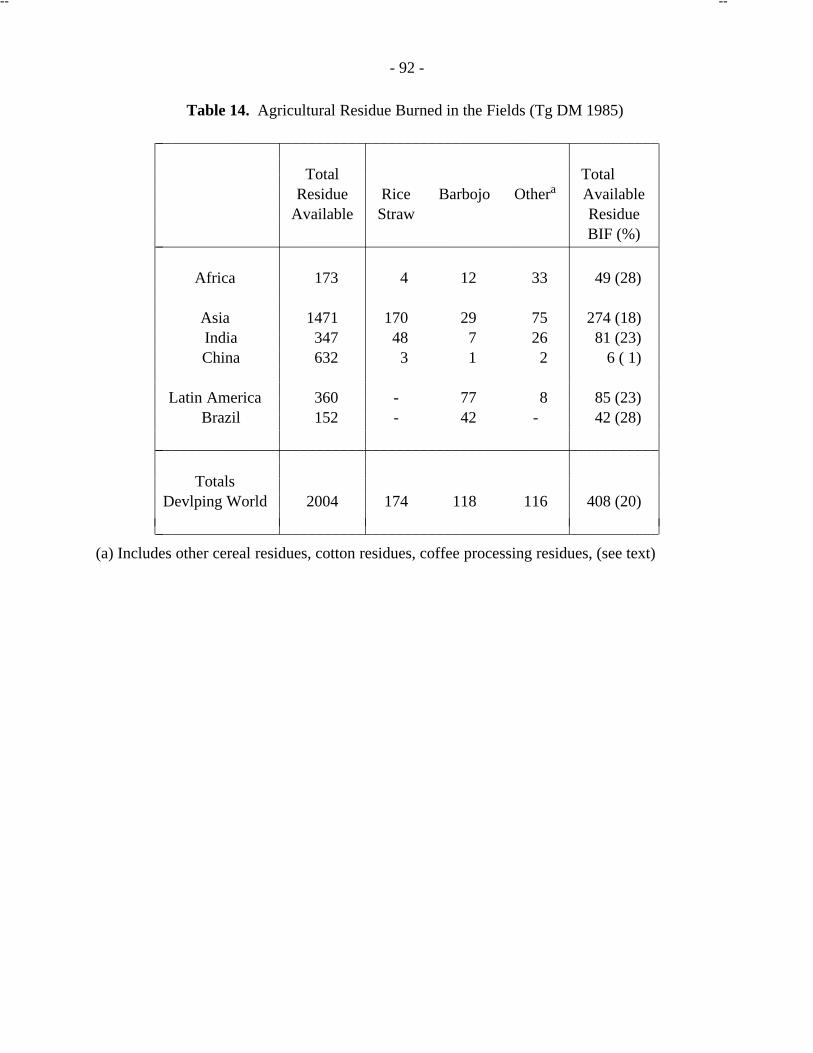
-- --
- 92 -
Table 14. Agricultural Residue Burned in the Fields (Tg DM 1985)
����������������������������������������������������������������
Total TotalResidue Rice Barbojo Othera Available
Available Straw ResidueBIF (%)����������������������������������������������������������������
Africa 173 4 12 33 49 (28)
Asia 1471 170 29 75 274 (18)India 347 48 7 26 81 (23)China 632 3 1 2 6 ( 1)
Latin America 360 - 77 8 85 (23)Brazil 152 - 42 - 42 (28)
����������������������������������������������������������������
TotalsDevlping World 2004 174 118 116 408 (20)
�����������������������������������������������������������������������������������������
�������������������������
�������������������������
�������������������������
�������������������������
(a) Includes other cereal residues, cotton residues, coffee processing residues, (see text)
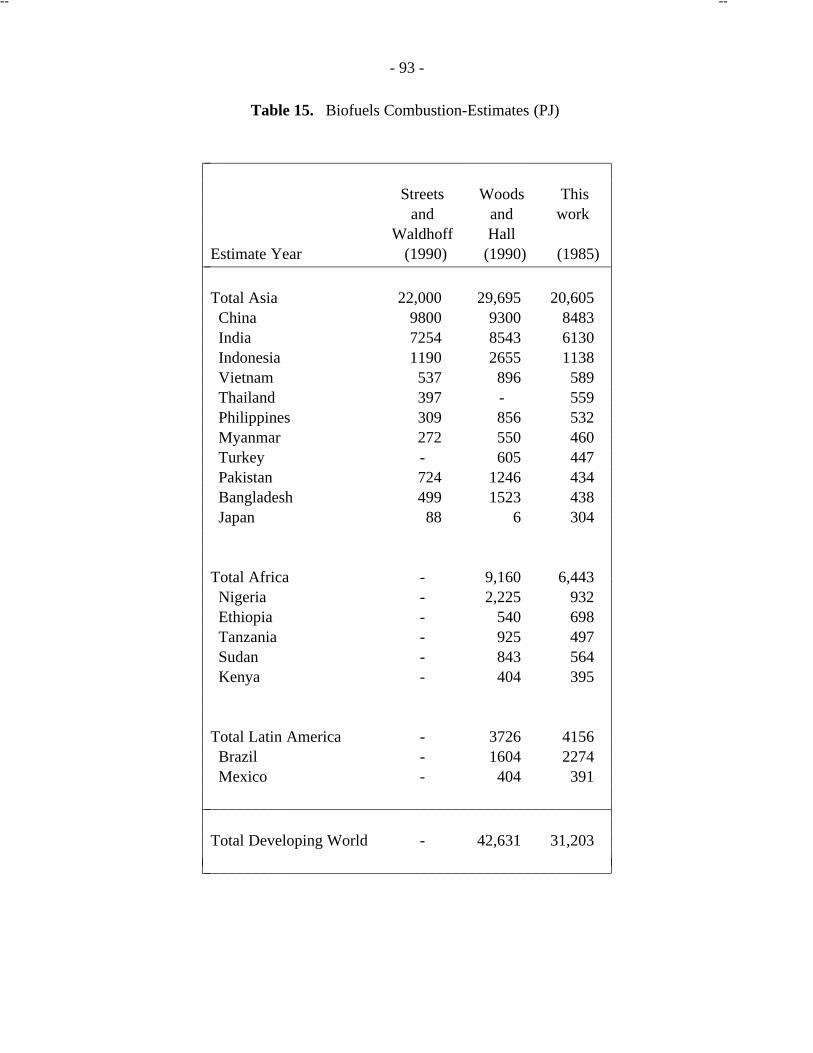
-- --
- 93 -
Table 15. Biofuels Combustion-Estimates (PJ)
����������������������������������������������������
Streets Woods Thisand and work
Waldhoff HallEstimate Year (1990) (1990) (1985)����������������������������������������������������
Total Asia 22,000 29,695 20,605China 9800 9300 8483India 7254 8543 6130Indonesia 1190 2655 1138Vietnam 537 896 589Thailand 397 - 559Philippines 309 856 532Myanmar 272 550 460Turkey - 605 447Pakistan 724 1246 434Bangladesh 499 1523 438Japan 88 6 304
Total Africa - 9,160 6,443Nigeria - 2,225 932Ethiopia - 540 698Tanzania - 925 497Sudan - 843 564Kenya - 404 395
Total Latin America - 3726 4156Brazil - 1604 2274Mexico - 404 391
����������������������������������������������������
Total Developing World - 42,631 31,203
�������������������������������������������������������������������������������������������������
���������������������������������������������
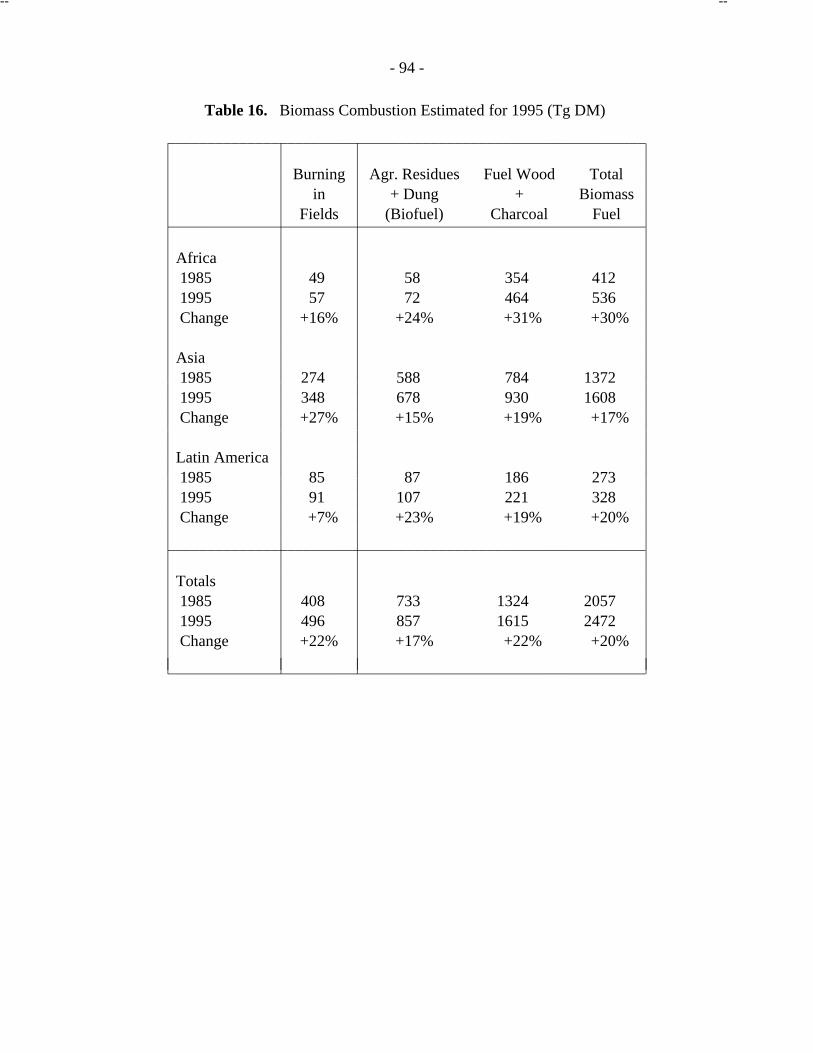
-- --
- 94 -
Table 16. Biomass Combustion Estimated for 1995 (Tg DM)
������������������������������������������������������������
Burning Agr. Residues Fuel Wood Totalin + Dung + Biomass
Fields (Biofuel) Charcoal Fuel������������������������������������������������������������
Africa1985 49 58 354 4121995 57 72 464 536Change +16% +24% +31% +30%
Asia1985 274 588 784 13721995 348 678 930 1608Change +27% +15% +19% +17%
Latin America1985 85 87 186 2731995 91 107 221 328Change +7% +23% +19% +20%
������������������������������������������������������������
Totals1985 408 733 1324 20571995 496 857 1615 2472Change +22% +17% +22% +20%
����������������������������������������������������������������������������������������������
����������������������������������
����������������������������������
����������������������������������
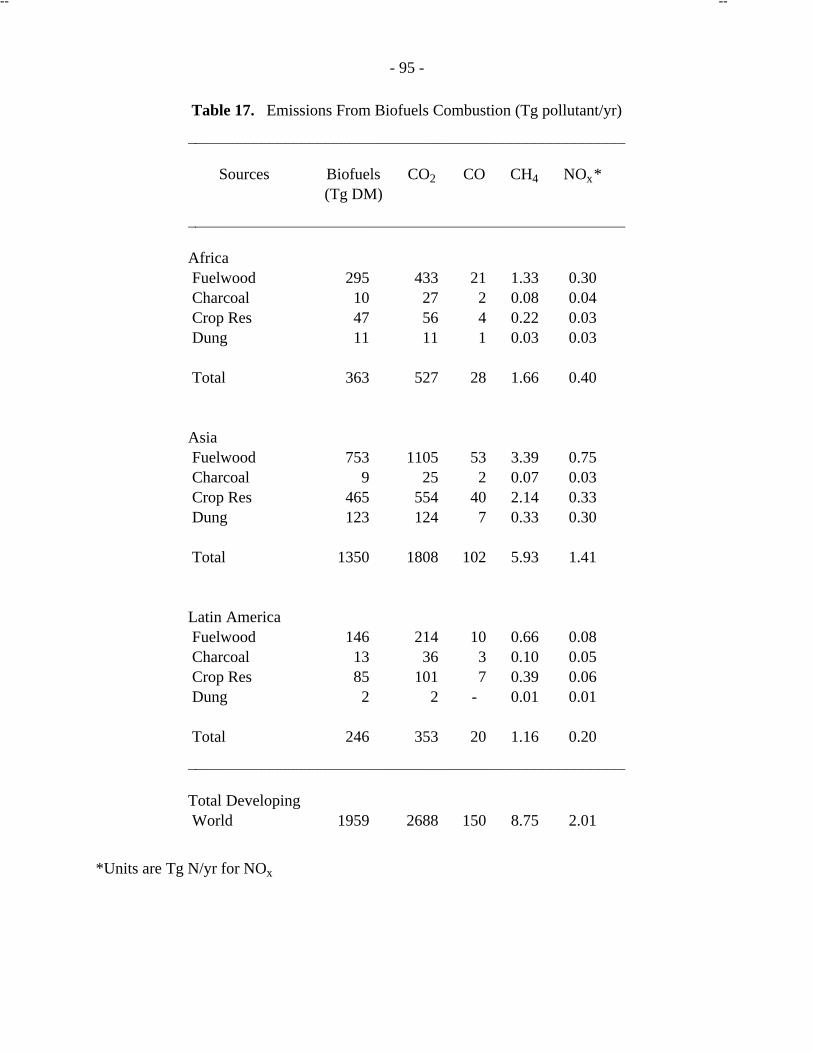
-- --
- 95 -
Table 17. Emissions From Biofuels Combustion (Tg pollutant/yr)
�������������������������������������������������������
Sources Biofuels CO2 CO CH4 NOx*(Tg DM)
�������������������������������������������������������
AfricaFuelwood 295 433 21 1.33 0.30Charcoal 10 27 2 0.08 0.04Crop Res 47 56 4 0.22 0.03Dung 11 11 1 0.03 0.03
Total 363 527 28 1.66 0.40
AsiaFuelwood 753 1105 53 3.39 0.75Charcoal 9 25 2 0.07 0.03Crop Res 465 554 40 2.14 0.33Dung 123 124 7 0.33 0.30
Total 1350 1808 102 5.93 1.41
Latin AmericaFuelwood 146 214 10 0.66 0.08Charcoal 13 36 3 0.10 0.05Crop Res 85 101 7 0.39 0.06Dung 2 2 - 0.01 0.01
Total 246 353 20 1.16 0.20
�������������������������������������������������������
Total DevelopingWorld 1959 2688 150 8.75 2.01
*Units are Tg N/yr for NOx
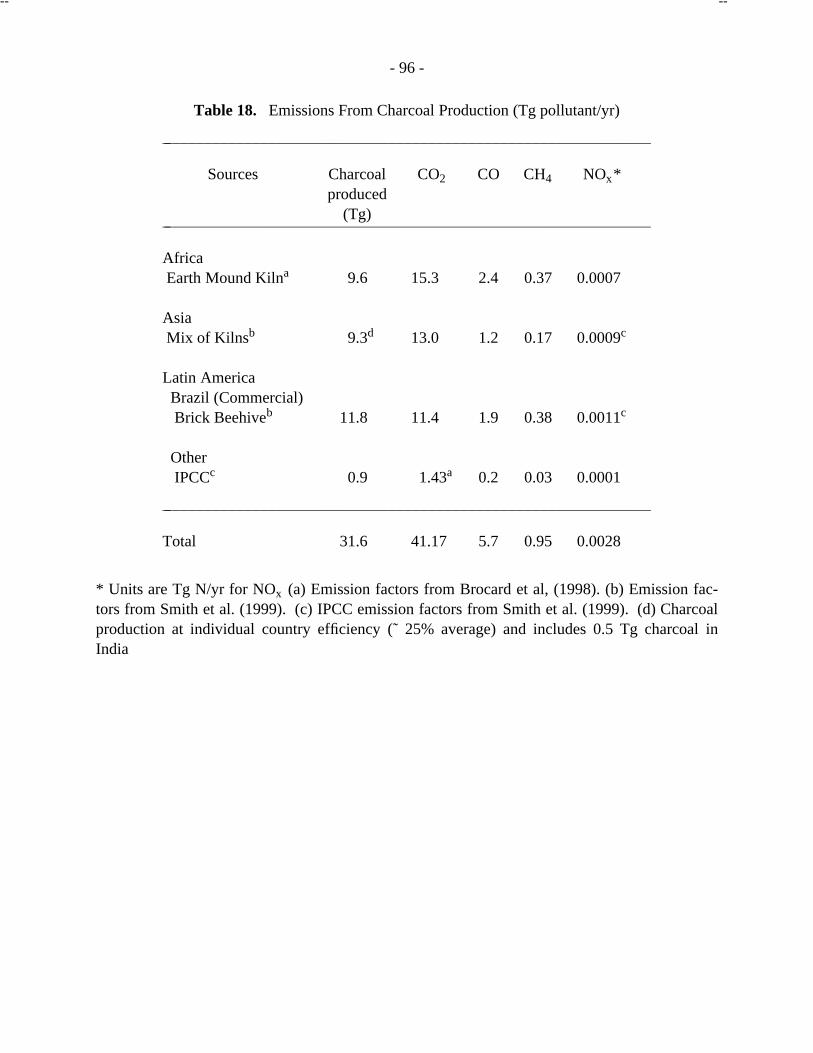
-- --
- 96 -
Table 18. Emissions From Charcoal Production (Tg pollutant/yr)
��������������������������������������������������������������
Sources Charcoal CO2 CO CH4 NOx*produced
(Tg)��������������������������������������������������������������
AfricaEarth Mound Kilna 9.6 15.3 2.4 0.37 0.0007
AsiaMix of Kilnsb 9.3d 13.0 1.2 0.17 0.0009c
Latin AmericaBrazil (Commercial)Brick Beehiveb 11.8 11.4 1.9 0.38 0.0011c
OtherIPCCc 0.9 1.43a 0.2 0.03 0.0001
��������������������������������������������������������������
Total 31.6 41.17 5.7 0.95 0.0028
* Units are Tg N/yr for NOx (a) Emission factors from Brocard et al, (1998). (b) Emission fac-tors from Smith et al. (1999). (c) IPCC emission factors from Smith et al. (1999). (d) Charcoalproduction at individual country efficiency (˜ 25% average) and includes 0.5 Tg charcoal inIndia
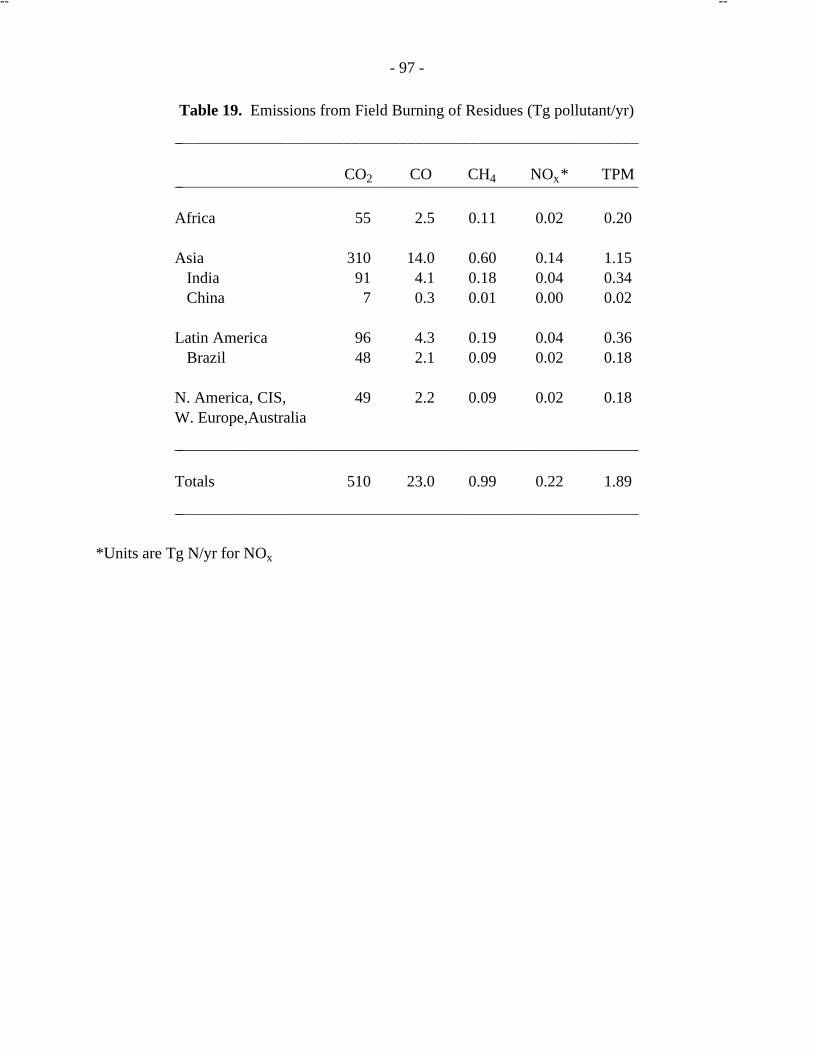
-- --
- 97 -
Table 19. Emissions from Field Burning of Residues (Tg pollutant/yr)
�����������������������������������������������������������
CO2 CO CH4 NOx* TPM�����������������������������������������������������������
Africa 55 2.5 0.11 0.02 0.20
Asia 310 14.0 0.60 0.14 1.15India 91 4.1 0.18 0.04 0.34China 7 0.3 0.01 0.00 0.02
Latin America 96 4.3 0.19 0.04 0.36Brazil 48 2.1 0.09 0.02 0.18
N. America, CIS, 49 2.2 0.09 0.02 0.18W. Europe,Australia
�����������������������������������������������������������
Totals 510 23.0 0.99 0.22 1.89
�����������������������������������������������������������
*Units are Tg N/yr for NOx
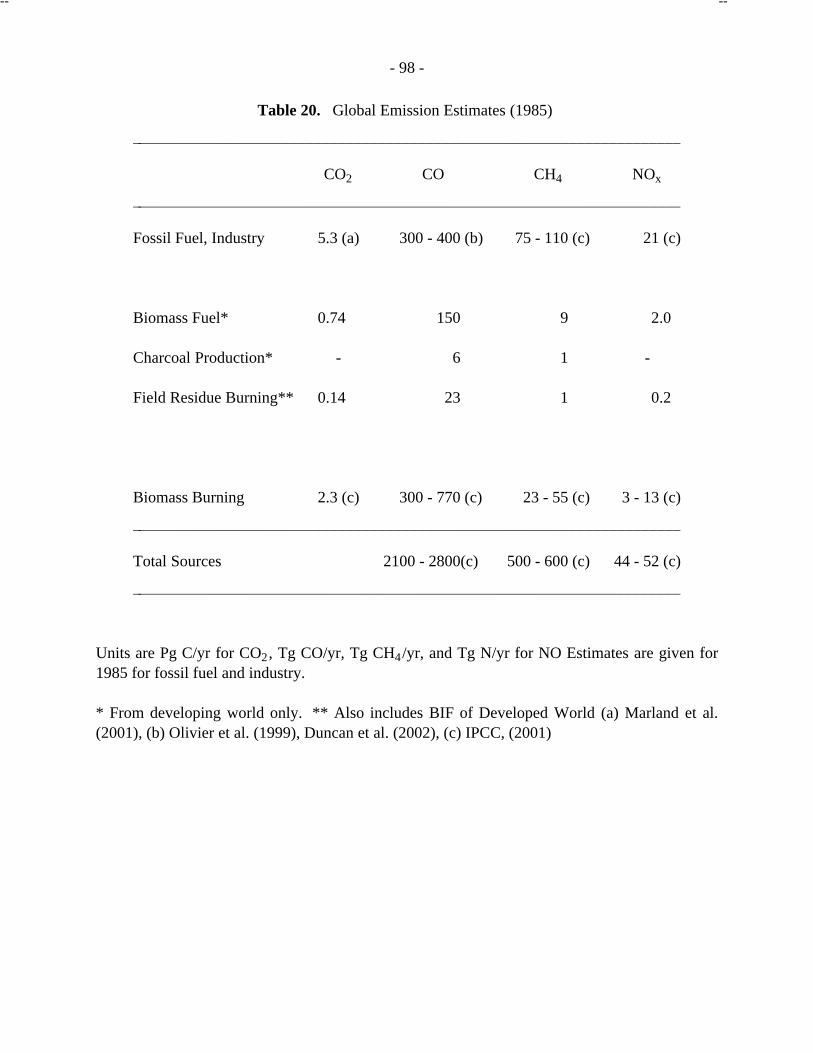
-- --
- 98 -
Table 20. Global Emission Estimates (1985)
���������������������������������������������������������������������
CO2 CO CH4 NOx
���������������������������������������������������������������������
Fossil Fuel, Industry 5.3 (a) 300 - 400 (b) 75 - 110 (c) 21 (c)
Biomass Fuel* 0.74 150 9 2.0
Charcoal Production* - 6 1 -
Field Residue Burning** 0.14 23 1 0.2
Biomass Burning 2.3 (c) 300 - 770 (c) 23 - 55 (c) 3 - 13 (c)
���������������������������������������������������������������������
Total Sources 2100 - 2800(c) 500 - 600 (c) 44 - 52 (c)
���������������������������������������������������������������������
Units are Pg C/yr for CO2, Tg CO/yr, Tg CH4/yr, and Tg N/yr for NO Estimates are given for1985 for fossil fuel and industry.
* From developing world only. ** Also includes BIF of Developed World (a) Marland et al.(2001), (b) Olivier et al. (1999), Duncan et al. (2002), (c) IPCC, (2001)
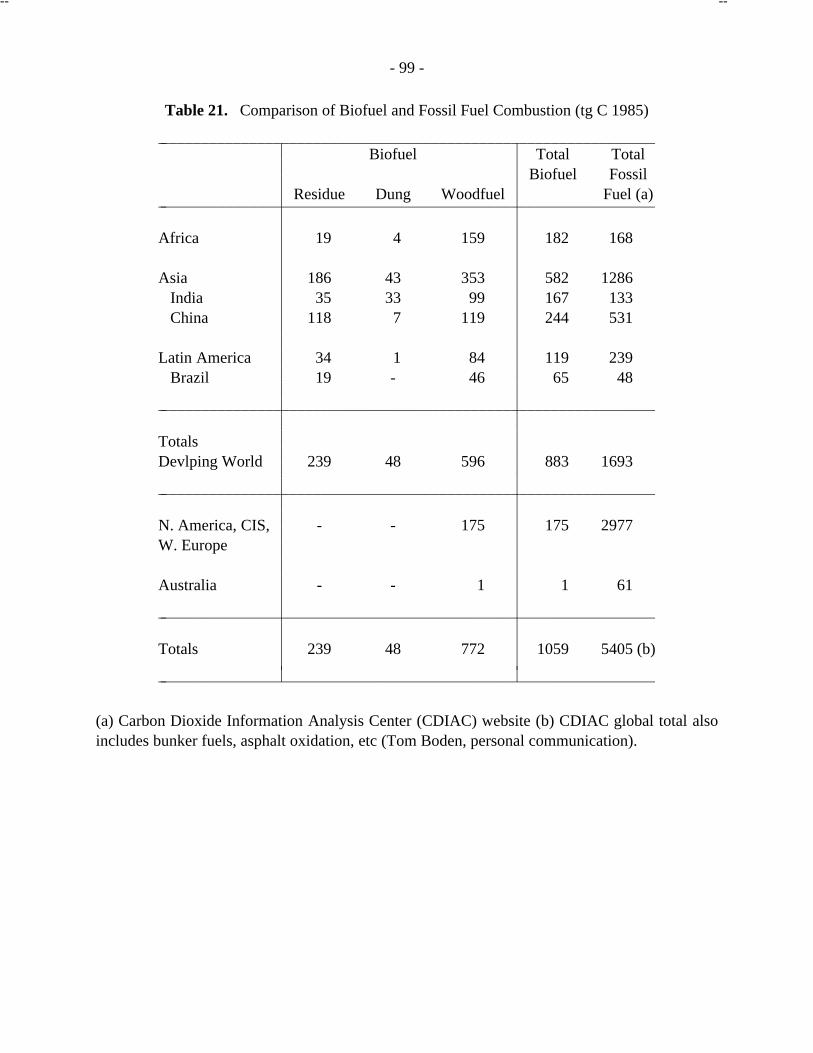
-- --
- 99 -
Table 21. Comparison of Biofuel and Fossil Fuel Combustion (tg C 1985)
���������������������������������������������������������������Biofuel Total Total
Biofuel FossilResidue Dung Woodfuel Fuel (a)���������������������������������������������������������������
Africa 19 4 159 182 168
Asia 186 43 353 582 1286India 35 33 99 167 133China 118 7 119 244 531
Latin America 34 1 84 119 239Brazil 19 - 46 65 48
���������������������������������������������������������������
TotalsDevlping World 239 48 596 883 1693
���������������������������������������������������������������
N. America, CIS, - - 175 175 2977W. Europe
Australia - - 1 1 61
���������������������������������������������������������������
Totals 239 48 772 1059 5405 (b)
�������������������������������������������������������������������������������������������������
����������������������������������
(a) Carbon Dioxide Information Analysis Center (CDIAC) website (b) CDIAC global total alsoincludes bunker fuels, asphalt oxidation, etc (Tom Boden, personal communication).
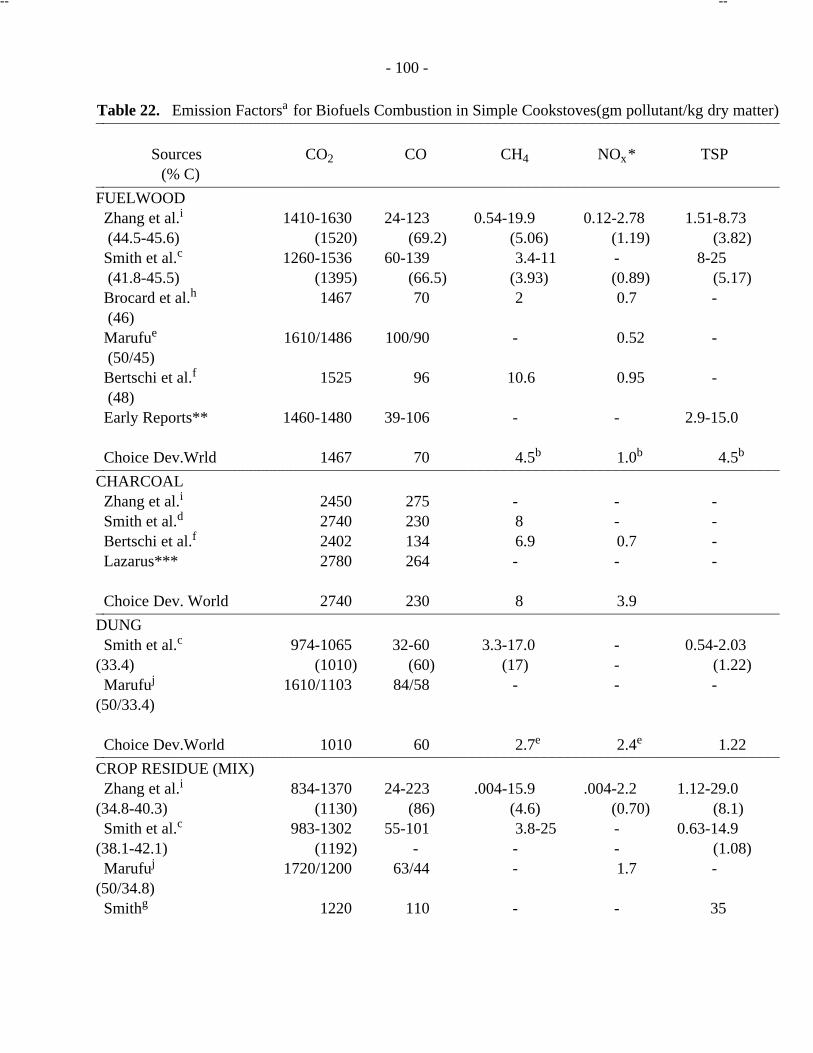
-- --
- 100 -
Table 22. Emission Factorsa for Biofuels Combustion in Simple Cookstoves(gm pollutant/kg dry matter)��������������������������������������������������������������������������������������
Sources CO2 CO CH4 NOx* TSP(% C)��������������������������������������������������������������������������������������
FUELWOODZhang et al.i 1410-1630 24-123 0.54-19.9 0.12-2.78 1.51-8.73(44.5-45.6) (1520) (69.2) (5.06) (1.19) (3.82)Smith et al.c 1260-1536 60-139 3.4-11 - 8-25(41.8-45.5) (1395) (66.5) (3.93) (0.89) (5.17)Brocard et al.h 1467 70 2 0.7 -(46)Marufue 1610/1486 100/90 - 0.52 -(50/45)Bertschi et al.f 1525 96 10.6 0.95 -(48)Early Reports** 1460-1480 39-106 - - 2.9-15.0
Choice Dev.Wrld 1467 70 4.5b 1.0b 4.5b��������������������������������������������������������������������������������������CHARCOALZhang et al.i 2450 275 - - -Smith et al.d 2740 230 8 - -Bertschi et al.f 2402 134 6.9 0.7 -Lazarus*** 2780 264 - - -
Choice Dev. World 2740 230 8 3.9��������������������������������������������������������������������������������������DUNGSmith et al.c 974-1065 32-60 3.3-17.0 - 0.54-2.03
(33.4) (1010) (60) (17) - (1.22)Marufuj 1610/1103 84/58 - - -
(50/33.4)
Choice Dev.World 1010 60 2.7e 2.4e 1.22��������������������������������������������������������������������������������������CROP RESIDUE (MIX)Zhang et al.i 834-1370 24-223 .004-15.9 .004-2.2 1.12-29.0
(34.8-40.3) (1130) (86) (4.6) (0.70) (8.1)Smith et al.c 983-1302 55-101 3.8-25 - 0.63-14.9
(38.1-42.1) (1192) - - - (1.08)Marufuj 1720/1200 63/44 - 1.7 -
(50/34.8)Smithg 1220 110 - - 35

-- --
- 101 -
Choice Dev.World 1192 86 4.6 0.7 8.1��������������������������������������������������������������������������������������
* Units are gms N for NOx ** Mainly Butcher, 1984 as summarized in Lazarus and Diallo(1992) and Smith : Global Review (1987) ***Islam 1987 in Lazarus and Diallo (1992) (a) Firstline gives range of emission factors and second line is the mean. (b) Mean Smith et al. (2000)and Zhang et al. (2000) (c) Smith et al. (2000) (d) Smith et al. (1993) (e) ’/’ is used to give therecalculated value of CO2 if Marufu had used a more realistic C-content of the fuel (f) Bertschiet al. (2002) assumed all burned carbon was volatilized (g) Smith (1987), (h) Brocard et al.(1998), (i) Zhang et al. (2000), (j) Marufu (1999).
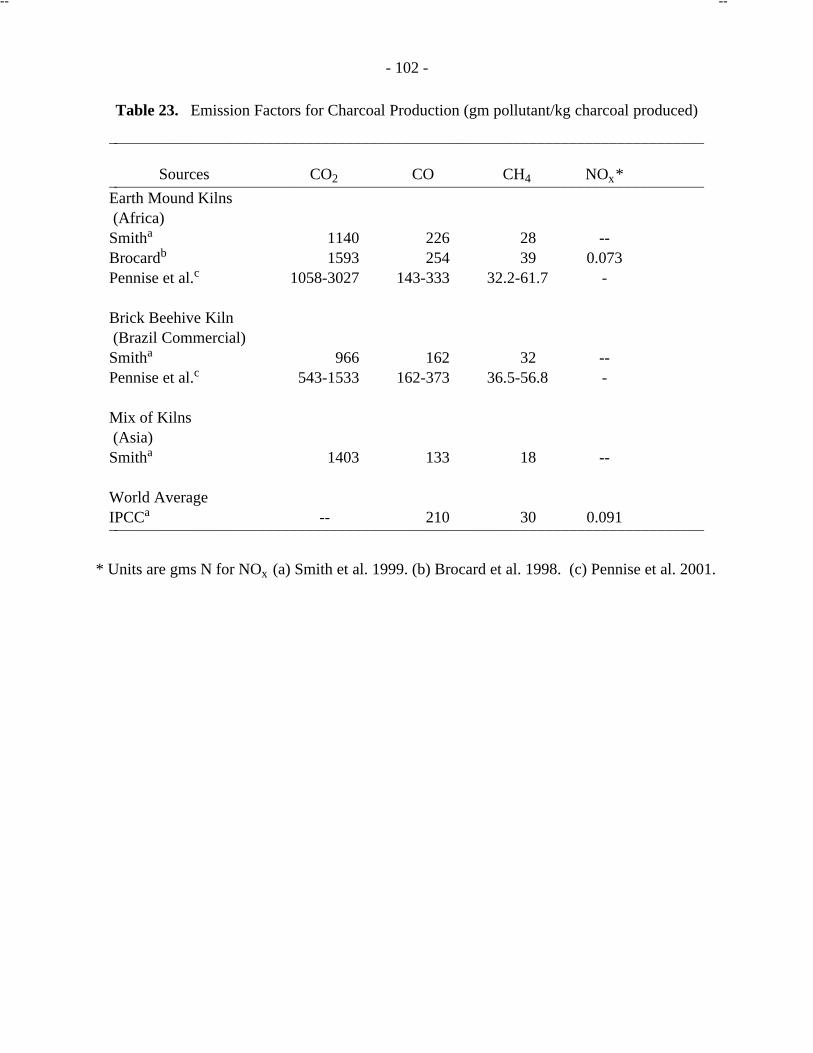
-- --
- 102 -
Table 23. Emission Factors for Charcoal Production (gm pollutant/kg charcoal produced)
���������������������������������������������������������������������������
Sources CO2 CO CH4 NOx*���������������������������������������������������������������������������Earth Mound Kilns(Africa)Smitha 1140 226 28 --Brocardb 1593 254 39 0.073Pennise et al.c 1058-3027 143-333 32.2-61.7 -
Brick Beehive Kiln(Brazil Commercial)Smitha 966 162 32 --Pennise et al.c 543-1533 162-373 36.5-56.8 -
Mix of Kilns(Asia)Smitha 1403 133 18 --
World AverageIPCCa -- 210 30 0.091���������������������������������������������������������������������������
* Units are gms N for NOx (a) Smith et al. 1999. (b) Brocard et al. 1998. (c) Pennise et al. 2001.
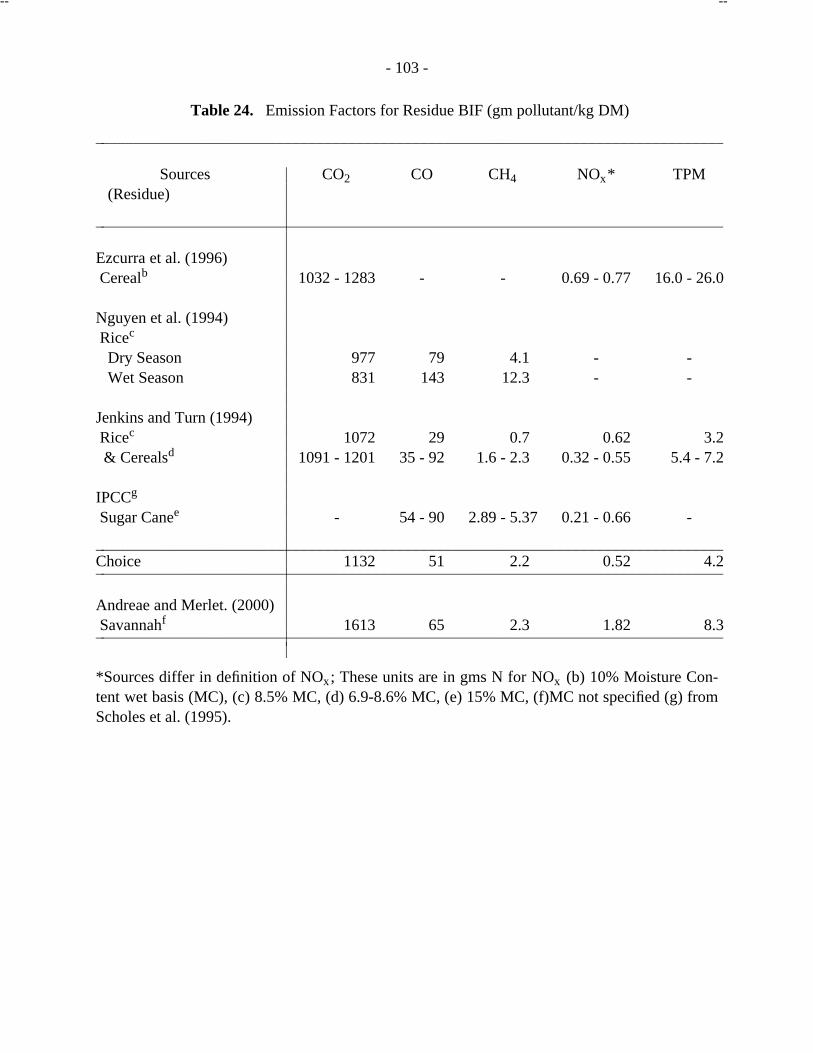
-- --
- 103 -
Table 24. Emission Factors for Residue BIF (gm pollutant/kg DM)
�������������������������������������������������������������������������������
Sources CO2 CO CH4 NOx* TPM(Residue)
�������������������������������������������������������������������������������
Ezcurra et al. (1996)Cerealb 1032 - 1283 - - 0.69 - 0.77 16.0 - 26.0
Nguyen et al. (1994)Ricec
Dry Season 977 79 4.1 - -Wet Season 831 143 12.3 - -
Jenkins and Turn (1994)Ricec 1072 29 0.7 0.62 3.2& Cerealsd 1091 - 1201 35 - 92 1.6 - 2.3 0.32 - 0.55 5.4 - 7.2
IPCCg
Sugar Canee - 54 - 90 2.89 - 5.37 0.21 - 0.66 -
�������������������������������������������������������������������������������Choice 1132 51 2.2 0.52 4.2�������������������������������������������������������������������������������
Andreae and Merlet. (2000)Savannahf 1613 65 2.3 1.82 8.3�������������������������������������������������������������������������������
�������������������������������
*Sources differ in definition of NOx; These units are in gms N for NOx (b) 10% Moisture Con-tent wet basis (MC), (c) 8.5% MC, (d) 6.9-8.6% MC, (e) 15% MC, (f)MC not specified (g) fromScholes et al. (1995).
-- --
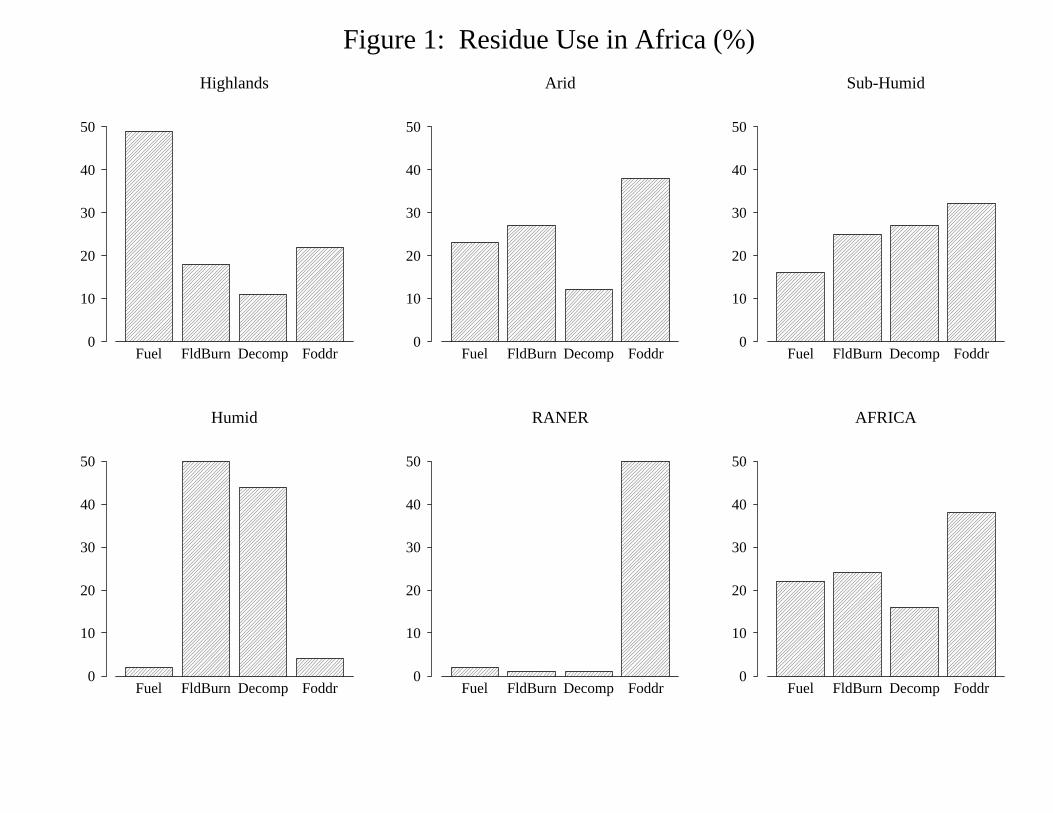
0
10
20
30
40
50
Highlands
Fuel FldBurn Decomp Foddr
0
10
20
30
40
50
Arid
Figure 1: Residue Use in Africa (%)
Fuel FldBurn Decomp Foddr
0
10
20
30
40
50
Sub-Humid
Fuel FldBurn Decomp Foddr
0
10
20
30
40
50
Humid
Fuel FldBurn Decomp Foddr
0
10
20
30
40
50
RANER
Fuel FldBurn Decomp Foddr
0
10
20
30
40
50
AFRICA
Fuel FldBurn Decomp Foddr
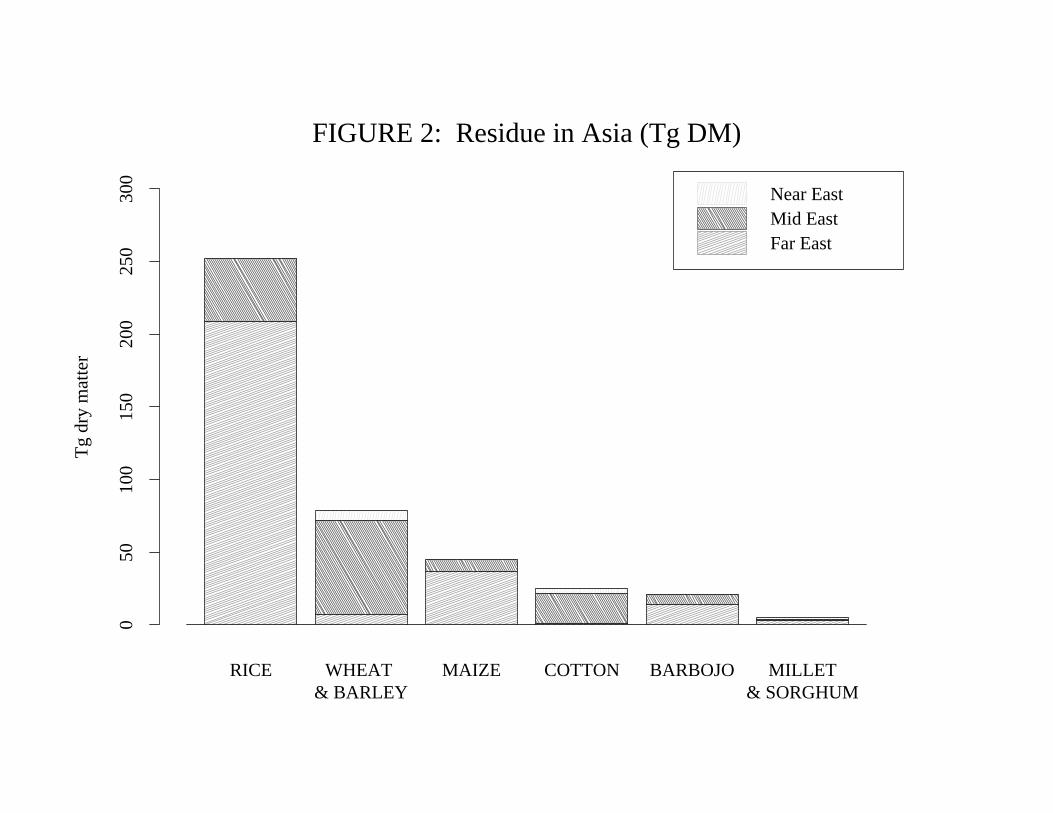
Near EastMid EastFar East
RICE WHEAT & BARLEY
MAIZE COTTON BARBOJO MILLET & SORGHUM
050
100
150
200
250
300
Tg
dry
mat
ter
FIGURE 2: Residue in Asia (Tg DM)
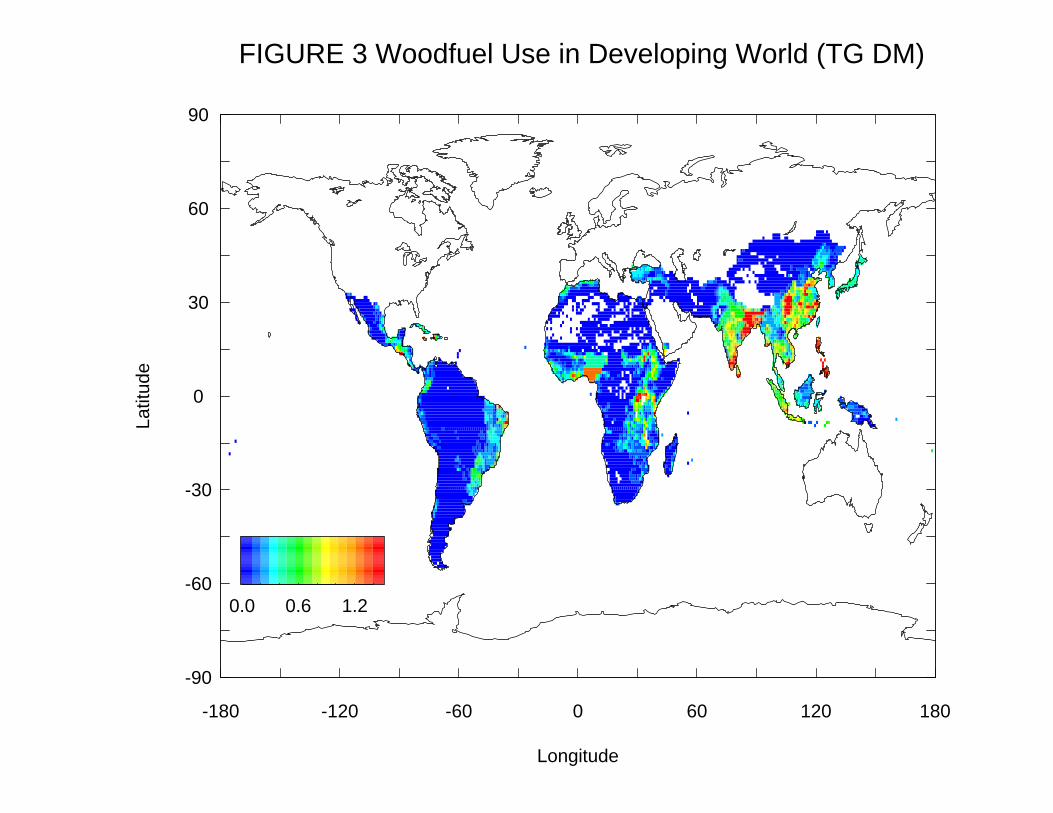
FIGURE 3 Woodfuel Use in Developing World (TG DM)
Longitude
Latit
ude
0.0 0.6 1.2
-180 -120 -60 0 60 120 180
-90
-60
-30
0
30
60
90
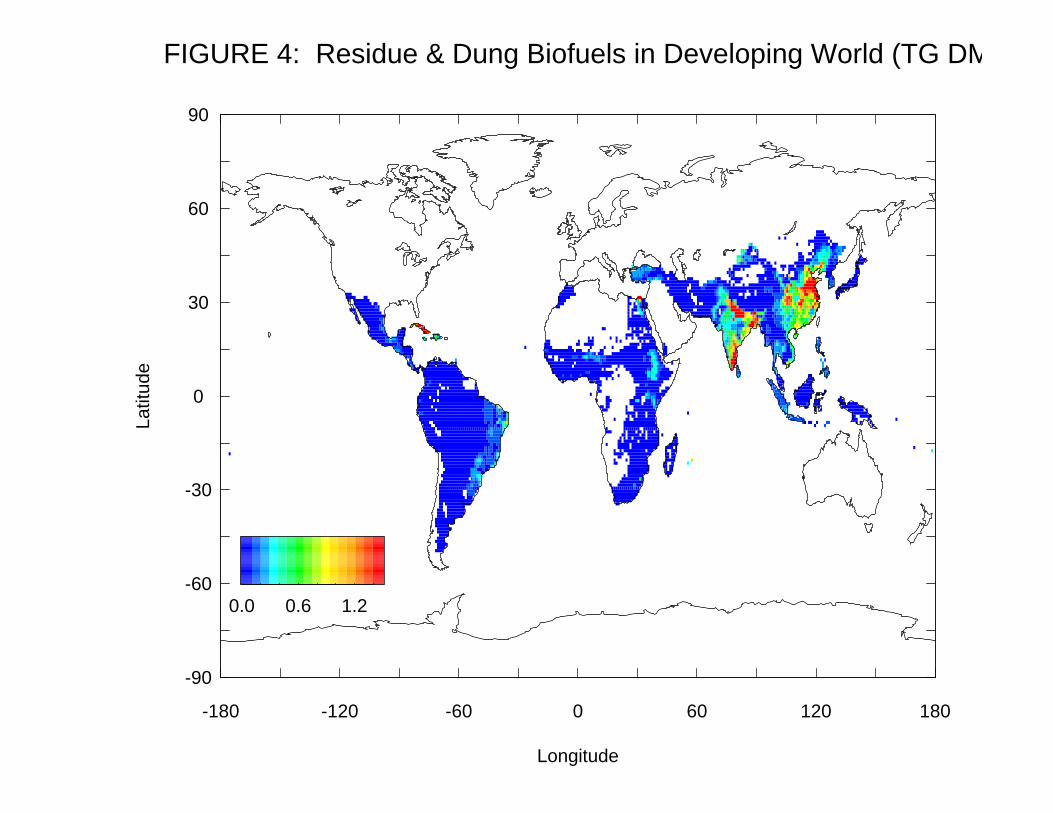
FIGURE 4: Residue & Dung Biofuels in Developing World (TG DM
Longitude
Latit
ude
0.0 0.6 1.2
-180 -120 -60 0 60 120 180
-90
-60
-30
0
30
60
90
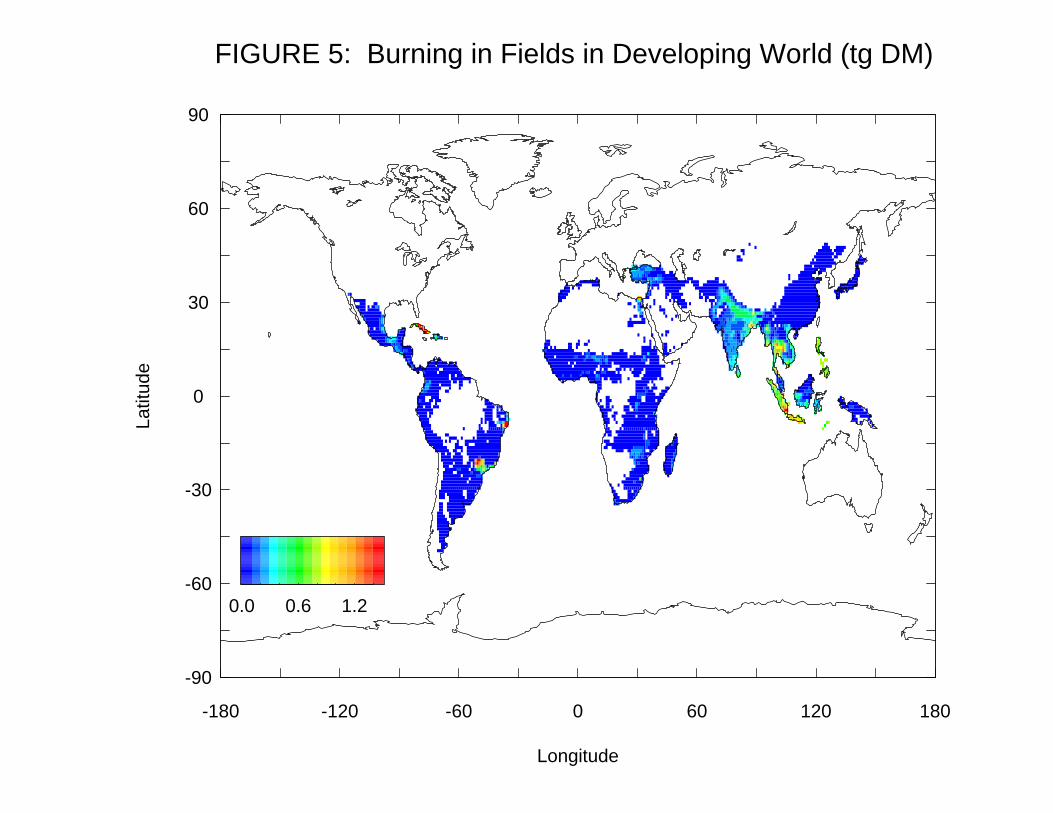
FIGURE 5: Burning in Fields in Developing World (tg DM)
Longitude
Latit
ude
0.0 0.6 1.2
-180 -120 -60 0 60 120 180
-90
-60
-30
0
30
60
90