Pre-processing liquid chromatography/high-resolution mass spectrometry data: extracting pure mass...
7
Pre-processing liquid chromatography/high-resolution mass spectrometry data: extracting pure mass spectra by deconvolution from the invariance of isotopic distribution Shaji Krishnan 1,6 * , Elwin E. R. Verheij 2 , Richard C. Bas 3 , Margriet W. B. Hendriks 4,6 , Thomas Hankemeier 5,6 , Uwe Thissen 5 and Leon Coulier 2,6 1 TNO Research Group Microbiology & Systems Biology, Utrechtseweg 48, 3700 AJ Zeist, The Netherlands 2 TNO Research Group Quality & Safety, Utrechtseweg 48, 3700 AJ Zeist, The Netherlands 3 TNO Triskelion B. V., P.O. Box 844, 3700 AV Zeist, The Netherlands 4 Leiden/Amsterdam Center for Drug Research, Analytical BioSciences, Gorlaeus Laboratories, University of Leiden, Einsteinweg 55, 2333 CC Leiden, The Netherlands 5 KeyGene N.V, P.O. Box 216, 6700 AE Wageningen, The Netherlands 6 Netherlands Metabolomics Centre, Einsteinweg 55, 2333 CC Leiden, The Netherlands RATIONALE: Mass spectra obtained by deconvolution of liquid chromatography/high-resolution mass spectrometry (LC/HRMS) data can be impaired by non-informative mass-over-charge (m/z) channels. This impairment of mass spectra can have significant negative influence on further post-processing, like quantification and identification. METHODS: A metric derived from the knowledge of errors in isotopic distribution patterns, and quality of the signal within a pre-defined mass chromatogram block, has been developed to pre-select all informative m/z channels. RESULTS: This procedure results in the clean-up of deconvoluted mass spectra by maintaining the intensity counts from m/z channels that originate from a specific compound/molecular ion, for example, molecular ion, adducts, 13 C-isotopes, multiply charged ions and removing all m/z channels that are not related to the specific peak. The methodology has been successfully demonstrated for two sets of high-resolution LC/MS data. CONCLUSIONS: The approach described is therefore thought to be a useful tool in the automatic processing of LC/HRMS data. It clearly shows the advantages compared to other approaches like peak picking and de-isotoping in the sense that all information is retained while non-informative data is removed automatically. Copyright © 2013 John Wiley & Sons, Ltd. Hyphenated mass spectrometric techniques, particularly gas chromatography/mass spectrometry (GC/MS) and liquid chromatography/mass spectrometry (LC/MS), are invaluable tools for metabolite analysis with several applications in pharma- ceutical, food and life sciences. [1–5] The amount of data generated from these type of analysis is on a continuous rise due to the increasing number of analyses conducted on one hand, and an increasing mass resolution of the mass spectrometer on the other hand. As a consequence, the tools that are capable of automatically processing these large numbers of hyphenated high-resolution (HR) MS datasets along a specified work-flow is becoming even more necessary. However, due to the complex- ity of the data being analyzed, the development of tools that are able to cover the full spectrum of a typical work-flow – from pre-processing raw data to (un)target metabolite identification – is in continuous advancement. [6] LC/GC/MS data are time-varying discrete vector data that describe the charge densities (intensities) of the different elut- ing compounds (mass-over-charge (m/z)) measured at various instants of time (retention time) or scan intervals (scan). The ultimate goal of pre-processing high-resolution LC/MS data is to obtain pure mass spectra for each peak present in the chromatogram and their corresponding peak area. The impor- tance of having pure mass spectra lies in the fact that it gives the ultimate peak area, i.e. the summation of all ions belong- ing to the same peak/compound. Furthermore, the presence of other m/z channels, like isotopes, adducts, multiply charged ions, besides the molecular ion, can also be useful for identifi- cation purposes. Pre-processing LC/GC/MS data comprises a series of tasks beginning with the task of cleaning a set of raw data that usually is contaminated with instrumental, chemical and process related noises. [7] After data is sufficiently purified, the peaks that represent metabolite data are extracted with targeted methods like peak-picking [8,9] or untargeted methods like deconvolution [10] The extracted peaks are then quantified, and subsequently identified. Excessive cleaning of LC/HRMS data will result in loss of valuable information, while restricted purification will contam- inate data with unwanted or redundant information. There are numerous ways of cleaning LC/HRMS data such as imposing signal thresholds below which that sub-set of data is considered noisy and eliminated, [11] subjecting the data to high frequency filters, and retaining the low frequency components of the * Correspondence to: S. Krishnan, TNO Research Group Microbiology & Systems Biology, Utrechtseweg 48, 3700 AJ Zeist, The Netherlands. E-mail: [email protected] Copyright © 2013 John Wiley & Sons, Ltd. Rapid Commun. Mass Spectrom. 2013, 27, 917–923 Research Article Received: 5 October 2012 Revised: 19 December 2012 Accepted: 5 January 2013 Published online in Wiley Online Library Rapid Commun. Mass Spectrom. 2013, 27, 917–923 (wileyonlinelibrary.com) DOI: 10.1002/rcm.6517 917
-
Upload
independent -
Category
Documents
-
view
0 -
download
0
Transcript of Pre-processing liquid chromatography/high-resolution mass spectrometry data: extracting pure mass...
Research Article
Received: 5 October 2012 Revised: 19 December 2012 Accepted: 5 January 2013 Published online in Wiley Online Library
Rapid Commun. Mass Spectrom. 2013, 27, 917–923
Pre-processing liquid chromatography/high-resolution massspectrometry data: extracting pure mass spectra by deconvolutionfrom the invariance of isotopic distribution
Shaji Krishnan1,6*, Elwin E. R. Verheij2, Richard C. Bas3, Margriet W. B. Hendriks4,6,Thomas Hankemeier5,6, Uwe Thissen5 and Leon Coulier2,61TNO Research Group Microbiology & Systems Biology, Utrechtseweg 48, 3700 AJ Zeist, The Netherlands2TNO Research Group Quality & Safety, Utrechtseweg 48, 3700 AJ Zeist, The Netherlands3TNO Triskelion B. V., P.O. Box 844, 3700 AV Zeist, The Netherlands4Leiden/Amsterdam Center for Drug Research, Analytical BioSciences, Gorlaeus Laboratories, University of Leiden,Einsteinweg 55, 2333 CC Leiden, The Netherlands5KeyGene N.V, P.O. Box 216, 6700 AE Wageningen, The Netherlands6Netherlands Metabolomics Centre, Einsteinweg 55, 2333 CC Leiden, The Netherlands
RATIONALE: Mass spectra obtained by deconvolution of liquid chromatography/high-resolution mass spectrometry(LC/HRMS) data can be impaired by non-informative mass-over-charge (m/z) channels. This impairment of mass spectracan have significant negative influence on further post-processing, like quantification and identification.METHODS: A metric derived from the knowledge of errors in isotopic distribution patterns, and quality of the signalwithin a pre-defined mass chromatogram block, has been developed to pre-select all informative m/z channels.RESULTS: This procedure results in the clean-up of deconvoluted mass spectra by maintaining the intensity counts fromm/z channels that originate from a specific compound/molecular ion, for example, molecular ion, adducts, 13C-isotopes,multiply charged ions and removing all m/z channels that are not related to the specific peak. The methodology has beensuccessfully demonstrated for two sets of high-resolution LC/MS data.CONCLUSIONS: The approach described is therefore thought to be a useful tool in the automatic processing of LC/HRMSdata. It clearly shows the advantages compared to other approaches like peak picking and de-isotoping in the sense that allinformation is retained while non-informative data is removed automatically. Copyright © 2013 John Wiley & Sons, Ltd.
(wileyonlinelibrary.com) DOI: 10.1002/rcm.6517
Hyphenated mass spectrometric techniques, particularly gaschromatography/mass spectrometry (GC/MS) and liquidchromatography/mass spectrometry (LC/MS), are invaluabletools formetabolite analysiswith several applications in pharma-ceutical, food and life sciences.[1–5] The amount of data generatedfrom these type of analysis is on a continuous rise due to theincreasing number of analyses conducted on one hand, andan increasing mass resolution of the mass spectrometer on theother hand. As a consequence, the tools that are capable ofautomatically processing these large numbers of hyphenatedhigh-resolution (HR) MS datasets along a specified work-flowis becoming evenmore necessary. However, due to the complex-ity of the data being analyzed, the development of tools thatare able to cover the full spectrum of a typical work-flow – frompre-processing raw data to (un)target metabolite identification –is in continuous advancement.[6]
LC/GC/MS data are time-varying discrete vector data thatdescribe the charge densities (intensities) of the different elut-ing compounds (mass-over-charge (m/z)) measured at various
* Correspondence to: S. Krishnan, TNO Research GroupMicrobiology & Systems Biology, Utrechtseweg 48, 3700AJ Zeist, The Netherlands.E-mail: [email protected]
Rapid Commun. Mass Spectrom. 2013, 27, 917–923
91
instants of time (retention time) or scan intervals (scan). Theultimate goal of pre-processing high-resolution LC/MS datais to obtain pure mass spectra for each peak present in thechromatogram and their corresponding peak area. The impor-tance of having pure mass spectra lies in the fact that it givesthe ultimate peak area, i.e. the summation of all ions belong-ing to the same peak/compound. Furthermore, the presenceof otherm/z channels, like isotopes, adducts, multiply chargedions, besides the molecular ion, can also be useful for identifi-cation purposes.
Pre-processing LC/GC/MS data comprises a series of tasksbeginning with the task of cleaning a set of raw data thatusually is contaminated with instrumental, chemical andprocess related noises.[7] After data is sufficiently purified, thepeaks that representmetabolite data are extractedwith targetedmethods like peak-picking[8,9] or untargeted methods likedeconvolution[10] The extracted peaks are then quantified, andsubsequently identified.
Excessive cleaning of LC/HRMS data will result in loss ofvaluable information, while restricted purification will contam-inate data with unwanted or redundant information. There arenumerous ways of cleaning LC/HRMS data such as imposingsignal thresholds belowwhich that sub-set of data is considerednoisy and eliminated,[11] subjecting the data to high frequencyfilters, and retaining the low frequency components of the
Copyright © 2013 John Wiley & Sons, Ltd.
7
S. Krishnan et al.
918
data,[7] classifying the ion chromatogram to either informativeor non-informative data depending on the variation of thesignal intensity along the retention axis,[12] etc. However, withinsufficient knowledge of data, which is very common, thesemethods suffer from less accurate settings for the filteringparameters that eventually result either in excessive orrestricted purification of data. In contrast to the abovemethods,some others use known chemical knowledge such as peakisotopic distribution to eliminate redundant information(m/z channels), that otherwise would interfere with the peakpicking or contaminate the peak resolving methods.[13,14] Thisprocess of clustering isotopic peaks of amolecule and removingall except the monoisotopic peak is called de-isotoping.[15] Theprocess of de-isotoping, although advantageous fromthe perspective of cleaning data, is disadvantageous fromthe metabolite identification perspective. This is because thede-isotoping step removes isotopic information of the com-pound from the data which can be helpful in identificationof unknown peaks, e.g. by limiting the number of possibleelemental compositions based on an exact mass.As an alternative to first de-isotoping and then resolving
the peaks via deconvolution, this paper discusses a methodthat combines the de-isotoping and deconvolution procedureto yield a pure mass spectrum. To produce pure spectra forevery peak present in the mass chromatogram, the methoduses the invariance of the isotopic distribution pattern of amolecular ion to multiple deconvolution. The advantage ofthis method is that, besides the molecular peak and isotopes,adducts, dimers, and multiply charged ions are simulta-neously extracted that otherwise remained separated in otherpeak picking methods.
THEORY
The mass spectra of the molecular ion together with its iso-topes form the isotopic distribution pattern of the molecularion. Any observed deviation of a mass spectra from theisotopic distribution pattern of a molecular ion is defined asisotopic error distribution of that molecular ion. Similarly,an ion chromatogram signal of a molecular ion, in contrastto a noisy/non-informative signal, is highly ordered, and pre-serves a characteristic shape depending on the elution profileof molecule. Entropy is a suitable metric that is able to classifyan ordered signal such as an ion chromatogram signal from aless ordered non-informative noisy signal. The followingsections will describe ways to (i) obtain the isotopic error dis-tribution of a molecular ion; (ii) calculate the entropy of an ionchromatogram signal from a molecular ion; (iii) combine theprevious two metrics to select the informative m/z channels,and hence obtain the pure spectra; and (iv) the proceduraldescription to select the informative m/z channels from themass chromatogram data.
Isotopic error distribution
The isotopic distribution of a molecule can be calculated fromtheoretic ruleswhen the constituents of themolecule are knowna priori.[16] However, in a measurement environment such asGC/LC/MS, this is not possible because the constituents ofthe molecules are unknown. Nevertheless, automated decom-position techniques like deconvolution, factor analysis, etc.,
wileyonlinelibrary.com/journal/rcm Copyright © 2013 John Wil
are capable of extracting the isotopic distribution of a molecule.However, in practice, these methods are not able to produce apure decomposition result, either due to contamination of masschromatogram data with noise or loss of informative data. Thecontamination of the data is usually due to noisy m/z channels,while the loss of informative data are from excessive signalsmoothening, de-isotoping, removal of m/z channels, etc.
An estimation of an isotopic distribution of a molecule canbe obtained from an alternating least square deconvolutionmethod,[10] applied multiple times on the same mass chroma-togram dataset (X) with different initializations of either theconcentration (C) or the mass spectra (S), where X=C*S. Sincethe mass chromatogram data satisfies the bi-linear prop-erty,[17] the isotopic distribution pattern of a molecule remainsinvariant, while the noise varies at each deconvolution run.To capture those m/z channels that belong to the isotopic dis-tribution of a molecule, the mass spectra results from eachdeconvolution run are linearly fitted with the mass spectraof a deconvolution run as regressant and the mass spectraof the other as the regressors. The squared error of mass spec-tra to the linear fit is then the isotopic squared error (d2), andcan be described as in Eqn. (1), where f(.) is the linear leastsquares fit function determined from (m0,m1) that are thedeconvoluted mass spectra results from two deconvolutionruns of the mass chromatogram data (X) with different randominitializations (Cinit1,Cinit2) for the concentration profile.
d2 mð Þ ¼ m1 � f m0ð Þð Þ2 (1)
Signal entropy of the mass (m/z) channel
In mass chromatogram data, in contrast to an ion chromato-gram signal of a molecular ion that is uni-modal and character-izable, the noisy (uninformative) signals are highly disorderedand non-characterizable. The equation to measure the disorderof a system, the entropy,[18] can be modified to determine therandomness of the ion chromatogram signal in a m/z channel.Thismeasure, hence called the signal entropy of them/z channel(Sm/z), is calculated as described in Eqn. (2):
Sm=z ¼X
tItm=z log Itm=z
� �(2)
where Itm=z is the normalized ion current at the tth scan time.
Channel selection
The informativem/z channels, besides the molecular ion and itsisotopes, are adducts, dimers, multiply chargedmolecular ions,etc. The isotopic error distribution of the molecule provides aclassification metric for choosing the informative m/z channels.However, due to measurement errors, conditional (chemical)formation of adducts, and other factors like ion suppressioneffects, artifacts, etc., and the subtle linear modeling errorsmight result in an isotopic distribution pattern that is less accu-rate. Thus, the accuracy of the isotopic error distribution patterndepends on the accuracy of the isotopic distribution pattern. Toovercome this, and make the m/z channel classification morerobust against modeling errors, the signal entropies of therespective m/z channels are combined with the isotopicdistribution error to yield the informative m/z channels of amolecular ion.
ey & Sons, Ltd. Rapid Commun. Mass Spectrom. 2013, 27, 917–923
100 200 300 400 500 600 700 800
0.1
0.2
0.3
0.4
0.5
0.6
0.7
0.8
0.9
1
scan number
Inte
nsity
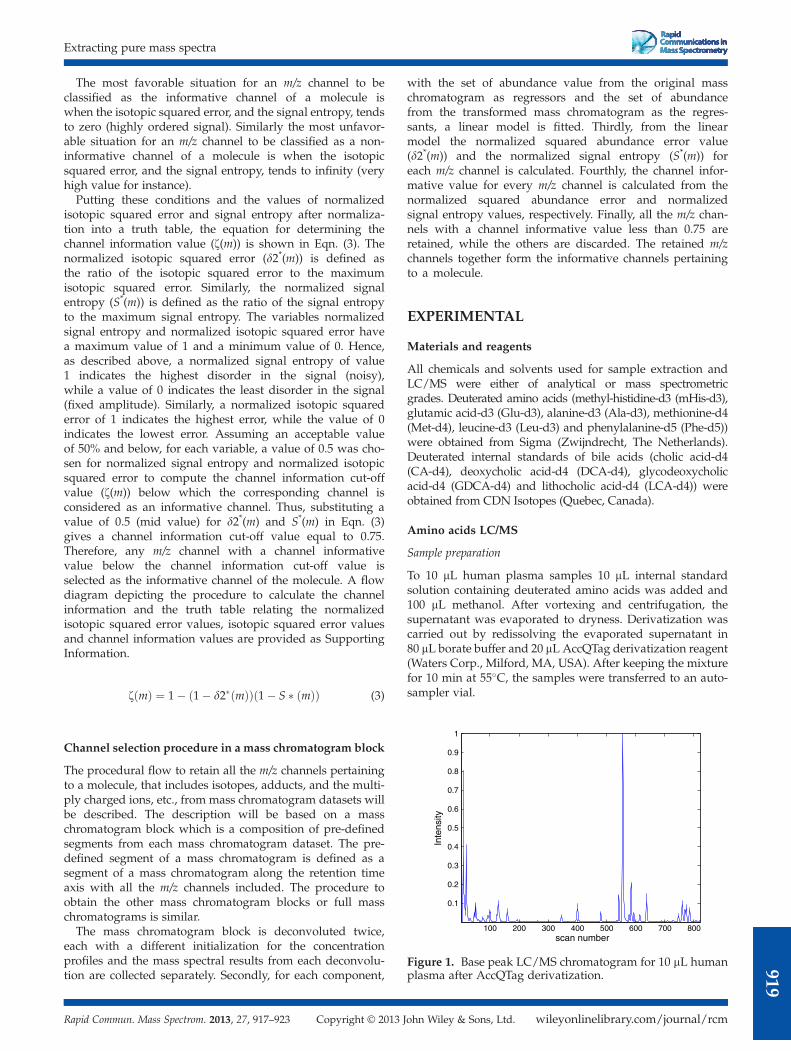
Figure 1. Base peak LC/MS chromatogram for 10 mL humanplasma after AccQTag derivatization.
Extracting pure mass spectra
91
The most favorable situation for an m/z channel to beclassified as the informative channel of a molecule iswhen the isotopic squared error, and the signal entropy, tendsto zero (highly ordered signal). Similarly the most unfavor-able situation for an m/z channel to be classified as a non-informative channel of a molecule is when the isotopicsquared error, and the signal entropy, tends to infinity (veryhigh value for instance).Putting these conditions and the values of normalized
isotopic squared error and signal entropy after normaliza-tion into a truth table, the equation for determining thechannel information value (z(m)) is shown in Eqn. (3). Thenormalized isotopic squared error (d2*(m)) is defined asthe ratio of the isotopic squared error to the maximumisotopic squared error. Similarly, the normalized signalentropy (S*(m)) is defined as the ratio of the signal entropyto the maximum signal entropy. The variables normalizedsignal entropy and normalized isotopic squared error havea maximum value of 1 and a minimum value of 0. Hence,as described above, a normalized signal entropy of value1 indicates the highest disorder in the signal (noisy),while a value of 0 indicates the least disorder in the signal(fixed amplitude). Similarly, a normalized isotopic squarederror of 1 indicates the highest error, while the value of 0indicates the lowest error. Assuming an acceptable valueof 50% and below, for each variable, a value of 0.5 was cho-sen for normalized signal entropy and normalized isotopicsquared error to compute the channel information cut-offvalue (z(m)) below which the corresponding channel isconsidered as an informative channel. Thus, substituting avalue of 0.5 (mid value) for d2*(m) and S*(m) in Eqn. (3)gives a channel information cut-off value equal to 0.75.Therefore, any m/z channel with a channel informativevalue below the channel information cut-off value isselected as the informative channel of the molecule. A flowdiagram depicting the procedure to calculate the channelinformation and the truth table relating the normalizedisotopic squared error values, isotopic squared error valuesand channel information values are provided as SupportingInformation.
z mð Þ ¼ 1� 1� d2� mð Þð Þ 1� S � mð Þð Þ (3)
Channel selection procedure in a mass chromatogram block
The procedural flow to retain all the m/z channels pertainingto a molecule, that includes isotopes, adducts, and the multi-ply charged ions, etc., from mass chromatogram datasets willbe described. The description will be based on a masschromatogram block which is a composition of pre-definedsegments from each mass chromatogram dataset. The pre-defined segment of a mass chromatogram is defined as asegment of a mass chromatogram along the retention timeaxis with all the m/z channels included. The procedure toobtain the other mass chromatogram blocks or full masschromatograms is similar.The mass chromatogram block is deconvoluted twice,
each with a different initialization for the concentrationprofiles and the mass spectral results from each deconvolu-tion are collected separately. Secondly, for each component,
Copyright © 2013 JRapid Commun. Mass Spectrom. 2013, 27, 917–923
with the set of abundance value from the original masschromatogram as regressors and the set of abundancefrom the transformed mass chromatogram as the regres-sants, a linear model is fitted. Thirdly, from the linearmodel the normalized squared abundance error value(d2*(m)) and the normalized signal entropy (S*(m)) foreach m/z channel is calculated. Fourthly, the channel infor-mative value for every m/z channel is calculated from thenormalized squared abundance error and normalizedsignal entropy values, respectively. Finally, all the m/z chan-nels with a channel informative value less than 0.75 areretained, while the others are discarded. The retained m/zchannels together form the informative channels pertainingto a molecule.
EXPERIMENTAL
Materials and reagents
All chemicals and solvents used for sample extraction andLC/MS were either of analytical or mass spectrometricgrades. Deuterated amino acids (methyl-histidine-d3 (mHis-d3),glutamic acid-d3 (Glu-d3), alanine-d3 (Ala-d3), methionine-d4(Met-d4), leucine-d3 (Leu-d3) and phenylalanine-d5 (Phe-d5))were obtained from Sigma (Zwijndrecht, The Netherlands).Deuterated internal standards of bile acids (cholic acid-d4(CA-d4), deoxycholic acid-d4 (DCA-d4), glycodeoxycholicacid-d4 (GDCA-d4) and lithocholic acid-d4 (LCA-d4)) wereobtained from CDN Isotopes (Quebec, Canada).
Amino acids LC/MS
Sample preparation
To 10 mL human plasma samples 10 mL internal standardsolution containing deuterated amino acids was added and100 mL methanol. After vortexing and centrifugation, thesupernatant was evaporated to dryness. Derivatization wascarried out by redissolving the evaporated supernatant in80 mL borate buffer and 20 mL AccQTag derivatization reagent(Waters Corp., Milford, MA, USA). After keeping the mixturefor 10 min at 55�C, the samples were transferred to an auto-sampler vial.
wileyonlinelibrary.com/journal/rcmohn Wiley & Sons, Ltd.
9

S. Krishnan et al.
920
LC/MS
LC/MS analysis was carried out on a Thermo ElectronLTQ Orbitrap system with a Accela UHPLC pump andautosampler (ThermoElectron Corp., San Jose, CA, USA).The LC/MS method was similar to that described byBoughton et al.[19] For separation of the amino acids anWaters Acquity C18 column (100� 2.1 mm, 1.7 mm) wasused with a linear mobile phase gradient from 99.5%mobile phase A (water + 0.1% formic acid) to 100% mobilephase B (acetonitrile+ 0.1% formic acid) in 12 min. The flowrate was 0.4 mL/min, the column temperature was 30�C andthe injection volume was 2 mL. Mass detection was carriedout in high-resolution mode (resolution 15 000) using electro-spray ionization in the positive mode (full MS m/z 150–1250).Raw data were converted to .cdf for further processing.
Bile acids LC/MS
Sample preparation
Human plasma samples (50 mL) were deproteinized with fouraliquots of methanol containing internal standards. After cen-trifugation, the supernatant was transferred to a new vial,snap frozen and lyophilized. The lyophilized samples werere-dissolved in methanol/water (2:1, v/v), centrifuged andtransferred to an autosampler vial.
590 600 610 620 630 640 650 660
0.1
0.2
0.3
0.4
0.5
0.6
0.7
0.8
0.9
1
scan number
inte
nsity
(a)
Figure 2. (a) Normalized mass chromaprofiles after deconvolution with eight est
(a)
Figure 3. Mass spectra of tyrosine (a) before an
wileyonlinelibrary.com/journal/rcm Copyright © 2013 John Wil
LC/MS
LC/MS analysis was carried out using a Thermo ElectronLTQ Orbitrap system. The LC/MS method was similar tothat described by Bobeldijk et al.[20] In summary, extracts(20 mL) containing bile acids were injected on a WatersXBridge C18 column (50� 2.1 mm, 2.5 mm, T= 40�C) andseparated with a mobile phase gradient from 90% mobilephase A (5% methanol in water containing 2 mM NH4OAcat pH 7) to 100% mobile phase B (methanol containing2 mM NH4OAc) in 18 min. Detection was carried outin the negative electrospray ionization mode (full MSm/z 200–800). Raw data were converted to .cdf forfurther processing.
RESULTS AND DISCUSSION
This section will describe two examples that illustrate thecollective usage of the isotopic error distribution and thesignal entropy to obtain informative m/z channels belongingto a peak detected in LC/HRMS data of plasma samples.In the first example, the m/z channels to be retained arethe 13C-isotopes and the doubly charged ions, while, forthe second example, the m/z channels of the 13C-isotopesand adducts are to be retained.
590 600 610 620 630 640 650 660 6700
0.1
0.2
0.3
0.4
0.5
0.6
0.7
0.8
0.9
1
scan number
inte
nsity
peak1peak2peak3peak4peak5peak6peak7peak8
(b)
togram block and (b) rconcentrationimated peaks.
(b)
d (b) after the channel selection procedure.
ey & Sons, Ltd. Rapid Commun. Mass Spectrom. 2013, 27, 917–923

Extracting pure mass spectra
Example 1: Amino acids LC/MS data
Figure 1 shows a typical base peak LC MS chromatogram for10 mL human plasma after AccQTag derivatization. Bothprimary and secondary amines are readily derivatized bythe AccQTag reagent. For monoamine-containing metabolitesthe derivatization mainly produces ions corresponding to [M+AccQ+H]+, i.e. [M+171]+. Polyamines are multiply deriva-tized. For example, diamines will have two amine groupsderivatized by AccQTag which lead to typical ions corre-sponding to [M+2AccQ+H]+ and [M+2AccQ+2H]2+.The mass chromatogram block shown in Fig. 2(a) consists
of block-wise segmented data from one LC/HRMS mea-surement of a plasma extract that spans a width of 80(590–669) scan numbers. The resolved concentration profileswith nine estimated peaks after applying the channel selec-tion procedure are shown in Fig. 2(b). However, for discus-sion purposes, only three target peaks (peak4, peak8,and peak7) are chosen, while the results and discussionsfor the rest are similar.Figure 3(a) shows a mass spectrum that contains one
high-abundance m/z channel, i.e. 352.129, and several low-abundance m/z channels. The main m/z channel correspondsto the [M+AccQ+H]+ ion of tyrosine. After the channel selec-tion procedure only one of the low-abundance m/z channels is
(a)
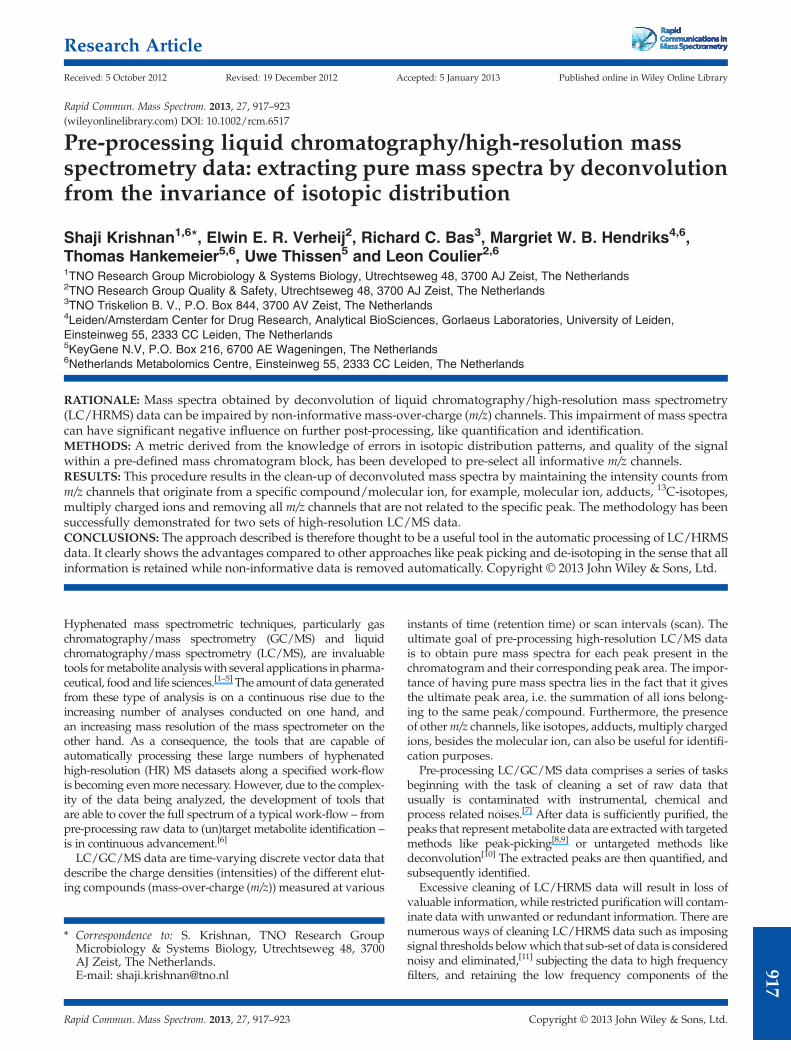
Figure 4. Mass spectra of lysine (a) before an
Figure 5. Mass spectrum of cystine after the channel selec-tion procedure.
Copyright © 2013 JRapid Commun. Mass Spectrom. 2013, 27, 917–923
retained, i.e. 353.132, the 13C-isotope of the [M+AccQ+H]+ ion(see Fig. 3(b)). Hence all other m/z channels are not relatedto tyrosine.
The mass spectrum in Fig. 4(a) shows one high-abundancem/z channel, i.e. 244.108, that corresponds to the [M+2AccQ+2H]2+ ion of lysine. In addition, several low-abundancem/z channels are present. However, after the channel selectionprocedure, only two of these low-abundance m/z values areretained, i.e. 244.609 and 487.209 (see Fig. 4(b)). Thesecorrespond to the 13C-isotope of the [M+2AccQ+2H]2+ ionand the [M+2AccQ+H]+ ion, respectively.
The same can be observed in Fig. 5 for the peak corre-sponding to cystine. Also in this case four m/z channels areretained after channel selection, i.e. 291.067 ([M+2AccQ+2H]2+), 291.569 (13C-isotope of [M+2AccQ+2H]2+), 411.078([M+AccQ+H]+) and 581.127 ([M+2AccQ+H]+). Additionally,it can be seen from Fig. 4(a) that, before the channel selectionprocedure, the two closely eluting peaks, cystine (m/z 291.067)and lysine, are not separated.
Example 2: Bile acids LC/MS data
Figure 6 shows a typical base peak chromatogram obtainedfor a plasma extract analyzed by LC/MS in the negative ESImode as described earlier. The mass chromatogram block
(b)
d (b) after the channel selection procedure.
0 100 200 300 400 500 6000
0.1
0.2
0.3
0.4
0.5
0.6
0.7
0.8
0.9
1
scan number
inte
nsity
Figure 6. Base peak chromatogram obtained for a plasmaextract analyzed by LC/MS in the negative electrosprayionization mode.
wileyonlinelibrary.com/journal/rcmohn Wiley & Sons, Ltd.
921

S. Krishnan et al.
922
shown in Fig. 7(a) shows one block-wise segmented set ofLC/HRMS data for the plasma extracts obtained with theLC/MS method that span the width of 75 scan numbers(520–594). The resolved concentration profiles after deconvo-lution with seven estimated peaks are shown in Fig. 7(b).
520 530 540 550 560 570 580 590
0.1
0.2
0.3
0.4
0.5
0.6
0.7
0.8
0.9
1
scan number
inte
nsity
(a)
Figure 7. (a) Normalized mass chromatogtion profiles after deconvolution with sevepeak 1, peak 2, and rest of the peaks.
Figure 8. Mass spectra of cholic acid-d4 (m/z=411.3procedure.
Figure 9. Mass spectra of glycochenodeoxycholic acithe channel selection procedure.
wileyonlinelibrary.com/journal/rcm Copyright © 2013 John Wil
Figures 8(a) and 8(b) show the mass spectrum before andafter the channel selection procedure, respectively, for peak 1(see Fig. 7(b)). This peak shows one high-abundance m/z chan-nel, i.e. 411.305, and could be assigned to the internal standardcholic acid-d4 (CA-d4). Again, it can be seen in Fig. 8(b) that the
520 530 540 550 560 570 580 5900
0.1
0.2
0.3
0.4
0.5
0.6
0.7
0.8
0.9
1
scan number
inte
nsity
peak1peak2peak3peak4peak5peak6peak7
(b)
ram block and (b) resolved concentra-nestimated peaks: 411.305, 448.305, i.e.
05) (a) before and (b) after the channel selection
d (GCDCA) (m/z =448.305) (a) before and (b) after
ey & Sons, Ltd. Rapid Commun. Mass Spectrom. 2013, 27, 917–923
Extracting pure mass spectra
mass spectrum after the channel selection procedure showsless m/z channels. The m/z channels that remain correspond toCA-d4, i.e. 411.305 ([M–H]�), 412.308 (13C-isotope of [M–H]�),433.279 ([M+Na–2H]�) and 493.329 ([M+NaOAc–H]�).The same can be seen in Fig. 9(a) for the partial peak 2(m/z 448.305) that could be assigned to glycochenodeoxycholicacid (GCDCA). Also in this example the mass spectrum(see Fig. 9(b)) after the channel selection procedure con-tains m/z channels corresponding to [M–H]�, i.e. 448.305,13C-isotope of [M–H]�, i.e. 449.309, [M+Na–2H]�, i.e. 470.286,and [M+NaOAc–H]�, i.e. 530.319. These last two examplesshow that also for this method, using ESI in the negative mode,the channel selection procedure described in this paper cleansup deconvoluted mass spectra thereby removing non-relatedm/z channels but keeping relating m/z channels, like isotopesand adducts.
CONCLUSIONS
With the invariant behavior of an isotopic distribution pattern ofa molecule to multiple deconvolution, in combination with ametric, the entropy, that measures the ordered behavior of theion chromatogram along the retention time, we were able toisolate the informative m/z channels from non-informative ones.The principle was demonstrated for high-resolution LC/MSdatasets from two different LC/MSmethods and clearly showedthat pure mass spectra could be obtained containing only m/zvalues belonging to the molecular ion, 13C-isotopes, adductsand multiply charged ions, while unrelated m/z values wereremoved. The approach described is therefore thought to be auseful tool in the automatic processing of LC/HRMS data. Itclearly shows the advantages compared to other approaches likepeak picking and de-isotoping in the sense that all information isretained while non-informative data is removed automatically.
SUPPORTING INFORMATION
Additional supporting information may be found in theonline version of this article.
AcknowledgementsThis research was conducted with the support of grants fromThe Netherlands Metabolomic Centre (NMC). The authorsacknowledge the contribution of Albert Tas in reviewing andproviding suggestions for improvement to the final manuscript.
REFERENCES
[1] R. J. Cotter, Time-of-flight mass spectrometry: An increasingrole in the life sciences. Biol. Mass Spectrom. 1989, 18, 513.
[2] S. Bijlsma, I. Bobeldijk, E. R. Verheij, R. Ramaker, S. Kochhar,I. A. Macdonald, B. van Ommen, A. K. Smilde. Large-scalehuman metabolomics studies: a strategy for data (pre-)proces-sing and validation. Anal. Chem. 2006, 78, 567.
[3] H. Yoshida, J. Yamazaki, S. Ozawa, T. Mizukoshi, H. Miyano.Advantage of LC-MS metabolomics methodology targetinghydrophilic compounds in the studies of fermented foodsamples. J. Agric. Food Chem. 2009, 57, 1119.
Copyright © 2013 JRapid Commun. Mass Spectrom. 2013, 27, 917–923
[4] W. A. Korfmacher. Foundation review: Principles andapplications of LC-MS in new drug discovery. Drug Discov.Today 2005, 10, 1357.
[5] U. Thissen, L. Coulier, K. M. Overkamp, J. Jetten, B. J. vander Werff, T. van de Ven, M. J. van der Werf. A propermetabolomics strategy supports efficient food qualityimprovement: A case study on tomato sensory properties.Food Quality and Preference 2011, 22, 499.
[6] S. Castillo, P. Gopalacharyulu, L. Yetukuri, M. Oresic,Algorithms and tools for the preprocessing of LC-MSmetabolomics data. Chemometrics and Intelligent LaboratorySystems 2011, 108, 23.
[7] C. A. Smith, E. J. Want, G. O’Maille, R. Abagyan, G. Siuzdak.XCMS: Processing mass spectrometry data for metaboliteprofiling using nonlinear peak alignment, matching, andidentification. Anal. Chem. 2006, 78, 779.
[8] A. Lommen. MetAlign: Interface-driven, versatile metabolo-mics tool for hyphenated full-scan mass spectrometry datapreprocessing. Anal. Chem. 2009, 81, 3079.
[9] X. Wei, X. Shi, S. Kim, L. Zhang, J. S. Patrick, J. Binkley,C. McClain, X. Zhang. Data preprocessing method for liquidchromatography–mass spectrometry based metabolomics.Anal. Chem. 2012, 84, 7963.
[10] R. Tauler, B. Kowalski, S. Fleming. Multivariate curveresolution applied to spectral data from multiple runs ofan industrial process. Anal. Chem. 1993, 65, 2040.
[11] R. H. Jellema, S. Krishnan, M. M. Hendriks, B. Muilwijk,J. T. Vogels. Deconvolution using signal segmentation.Chemometrics and Intelligent Laboratory Systems 2010,104, 132.
[12] S. Krishnan, J. T. Vogels, L. Coulier, R. C. Bas, M.W. Hendriks,T. Hankemeier, U. Thissen. Instrument and process inde-pendent binning and baseline correction methods forliquid chromatography-high resolution-mass spectrometrydeconvolution. Anal. Chim. Acta 2012, 740, 12.
[13] M. Wehofsky, R. Hoffmann. Automated deconvolution anddeisotoping of electrospray mass spectra. J. Mass Spectrom.2002, 37, 223.
[14] N. Jaitly, A.Mayampurath, K. Littlefield, J. Adkins, G. Anderson,R. Smith. Decon2LS: An open-source software package forautomated processing and visualization of high resolutionmass spectrometry data. BMC Bioinformatics 2009, 10, 87.
[15] T. Pluskal, S. Castillo, A. Villar-Briones, M. Oresic. MZmine2: Modular framework for processing, visualizing, andanalyzing mass spectrometry-based molecular profile data.BMC Bioinformatics 2010, 11, 395.
[16] J. A. Yergey. A general approach to calculating isotopicdistributions for mass spectrometry. Int. J. Mass Spectrom.Ion Phys. 1983, 52, 337.
[17] O. M. Kvalheim, Y. Z. Liang. Heuristic evolving latentprojections: resolving two-way multicomponent data. 1.Selectivity, latent-projective graph, datascope, local rank,and unique resolution. Anal. Chem. 1992, 64, 936.
[18] C. Shannon,W.Weaver.Mathematical Theory of Communication,University of Illinois Press, Illinois, 2002. ISBN: 0252725484.
[19] B. A. Boughton, D. L. Callahan, C. Silva, J. Bowne,A. Nahid, T. Rupasinghe, D. L. Tull, M. J. McConville,A. Bacic, U. Roessner. Comprehensive profiling and quantita-tion of amine group containing metabolites. Anal. Chem. 2011,83, 7523.
[20] I. Bobeldijk, M. Hekman, J. de Vries-van der Weij, L. Coulier,R. Ramaker, R. Kleemann, T. Kooistra, C. Rubingh, A.Freidig, E. Verheij. Quantitative profiling of bile acids inbiofluids and tissues based on accurate mass high resolutionLC-FT-MS: Compound class targeting in a metabolomicsworkflow. J. Chromatogr. B 2008, 871, 306.
wileyonlinelibrary.com/journal/rcmohn Wiley & Sons, Ltd.
923