Deconvolution of complex G protein–coupled receptor signaling in live cells using dynamic mass...
50
Schroder, R., Janssen, N., Schmidt, J., Kebig, A., Merten, N., Hennen, S., Muller, A., Blattermann, S, Mohr-Andra, M., Zahn, S., Wenzel, J., Smith, N.J., Gomeza, J., Drewke, C., Milligan, G., Mohr, K. and Kostenis, E. (2010) Deconvolution of complex G protein-coupled receptor signaling in live cells using dynamic mass redistribution measurements. Nature Biotechnology, 28 (9). pp. 943-949. ISSN 1087-0156 http://eprints.gla.ac.uk/38720 Deposited on: 20 September 2010 Enlighten – Research publications by members of the University of Glasgow http://eprints.gla.ac.uk
-
Upload
independent -
Category
Documents
-
view
5 -
download
0
Transcript of Deconvolution of complex G protein–coupled receptor signaling in live cells using dynamic mass...

Schroder, R., Janssen, N., Schmidt, J., Kebig, A., Merten, N., Hennen, S., Muller, A., Blattermann, S, Mohr-Andra, M., Zahn, S., Wenzel, J., Smith, N.J., Gomeza, J., Drewke, C., Milligan, G., Mohr, K. and Kostenis, E. (2010) Deconvolution of complex G protein-coupled receptor signaling in live cells using dynamic mass redistribution measurements. Nature Biotechnology, 28 (9). pp. 943-949. ISSN 1087-0156
http://eprints.gla.ac.uk/38720 Deposited on: 20 September 2010
Enlighten – Research publications by members of the University of Glasgow http://eprints.gla.ac.uk

DECONVOLUTION OF COMPLEX G PROTEIN-COUPLED RECEPTOR
SIGNALING IN LIVE CELLS: TAKING ADVANTAGE OF THE RESOLVING
POWER OF DYNAMIC MASS REDISTRIBUTION TECHNOLOGY
Ralf Schröder1, Nicole Janssen2, Johannes Schmidt1, Anna Kebig2, Nicole Merten1, Stephanie
Hennen1, Anke Müller1, Stefanie Blättermann1, Marion Mohr-Andrä2, Sabine Zahn3, Jörg Wenzel3,
Nicola J. Smith4, Jesús Gomeza1, Christel Drewke1, Graeme Milligan4, Klaus Mohr2, and Evi
Kostenis1
1Molecular-, Cellular-, and Pharmacobiology Section, Institute of Pharmaceutical Biology, University
of Bonn, Nussallee 6, 53115 Bonn, Germany
2Pharmacology and Toxicology Section, Institute of Pharmacy, University of Bonn, Gerhard-Domagk-
Str. 3, 53347 Bonn, Germany
3Department of Dermatology, University of Bonn, Sigmund Freud Str. 25, 53105 Bonn, Germany
4Molecular Pharmacology Group, Neuroscience and Molecular Pharmacology, Faculty of Biomedical
and Life Sciences, University of Glasgow, University Avenue, Glasgow G12 8QQ, Scotland, UK
1

Corresponding authors: Evi Kostenis
Molecular-, Cellular-, and Pharmacobiology Section
Institute of Pharmaceutical Biology
University of Bonn, 53115 Bonn, Germany
Phone: +49 228 732678/ 733194
Fax: +49 228 733250
Email: [email protected]
Klaus Mohr
Pharmacology and Toxicology Section
Institute of Pharmacy
University of Bonn, 53347 Bonn, Germany
Phone: +49 228 73 9103
Fax: +49 228 73 9215
Email: [email protected]
R.S. and N.J. contributed equally to this work.
Short summary
A novel technology platform to deduce signaling of G protein-coupled receptors from cellular
dynamic mass redistribution (DMR) is presented and compared with traditional methods used
to assess receptor activity. DMR captures signaling through all four major G protein pathways
in living cells label-free and in real time, and allows dissection of and new insight into the
complex and adaptable signaling biology of recombinant and primary cells with
unprecedented accuracy and sensitivity.
2
Abstract
Dynamic mass redistribution (DMR) represents a novel, label-free, biosensor technology
promising to translate GPCR signaling into complex optical “fingerprints” in real time and
living cells. Herein, we present a strategy to frame cellular mechanisms that define label-free
responses and compare DMR technology with traditional second messenger assays currently
state of the art in GPCR drug discovery. The resolving power of DMR enabled us to (1) probe
GPCR functionality along all four G protein signaling pathways – at present beyond reach by
many other traditional GPCR assay platforms, (2) dissect complex GPCR signaling patterns
even in primary human cells with unprecedented accuracy, (3) define heterotrimeric G
proteins as the upstream trigger orchestrating the complex optical response profiles, and (4)
disclose previously undetected features of GPCR behavior. Significant impact of DMR is
therefore anticipated in the emerging areas of systems biology and systems pharmacology but
also for the discovery of mechanistically novel drugs.
3

INTRODUCTION
G protein-coupled receptors (GPCRs) are among the the most important drug target classes1.
For many members of this receptor family it is now well established that they oscillate among
multiple conformations which can be differentially stabilized by ligands thus permitting
access to only a subset of the complete repertoire of receptor behaviors2-8. This phenomenon,
also referred to as biased agonism, functional selectivity or signal trafficking, has an
important impact on GPCR drug discovery because it raises the possibility to design signaling
pathway-specific therapeutics. Activation of downstream signaling events of GPCRs is
traditionally recorded with assays based on quantification of distinct intracellular second
messengers such as Ca2+, IP1 and cyclic AMP5,9-11 and/or translocation of β-arrestin
proteins5,12-16. Since GPCRs from different coupling classes typically produce one or more
specific second messenger, and may additionally engage non-G protein effectors17-21, several
assays are needed to obtain quantitative information about each signaling event. Given the
spectrum of cellular activities a single receptor may possess and the dependence of efficacy
on the signaling effectors (“pluridimensionality of efficacy”18), the need to analyze integrated
cellular responses rather than individual components of signaling pathways is becoming
increasingly apparent. Dynamic mass redistribution (DMR) is addressed by a novel optical
biosensor technology competent to monitor such integrated GPCR signaling responses by
detecting redistribution of intracellular constituents triggered upon receptor activation (Fig.
1a)5,22,23. This method allows quantification of GPCR function in living cells without labeling
by capturing receptor activity as optical trace that reflects a generic response of entire living
cells reminiscent of holistic responses obtained in tissue or organ bath experiments. Label-free
technologies could therefore be decisively advantageous to monitor even complex signaling
processes particularly in primary cells which are difficult to analyze with traditional
biochemical methods or which are challenging to be transfected with labeled components of
4
the GPCR signaling cascade for optical studies23-25. It is likely that these obstacles have so far
precluded assessment of drug candidates in their native environment.
Whereas label-free recording of DMR is already being applied in pharmaceutical companies
on a more empirical basis to assess feasibility for high throughput screening, for recording of
signaling in immortalized cell lines, or for pharmacological ligand profiling25-29, no in-depth
analytical study is available to date that examines this technology platform and compares it
with the methods traditionally used in early drug discovery.
Therefore, we applied DMR to monitor signaling of a variety of GPCRs from different
coupling classes in intact living cells and compared the receptor’s functionality for inducing a
whole cell response with the more classical biochemical approaches to define GPCR signal
transduction. An experimental strategy is presented that serves to identify the upstream post-
receptor trigger underlying the optical response profiles and thereby allows - in a cell-type
specific fashion - to precisely assign optical traces to distinct GPCR-mediated signaling
pathways. We then take advantage of this strategy to explore complex GPCR signaling
patterns and the mechanism of drug action in both recombinant and primary human cells.
Importantly, evidence is provided that only simultaneous visualization of signaling pathways
by DMR, but not recording of defined downstream signaling events in single component
functional assays, enables identification of unexpected signaling phenomena, thus implying
the need to shift from single component to system analysis. We suggest that optical recording
of DMR represents an enabling technology with significant impact on both, dissection of
complex biological signaling patterns of GPCRs in basic research and understanding of
mechanisms of drug action in GPCR drug discovery.
RESULTS
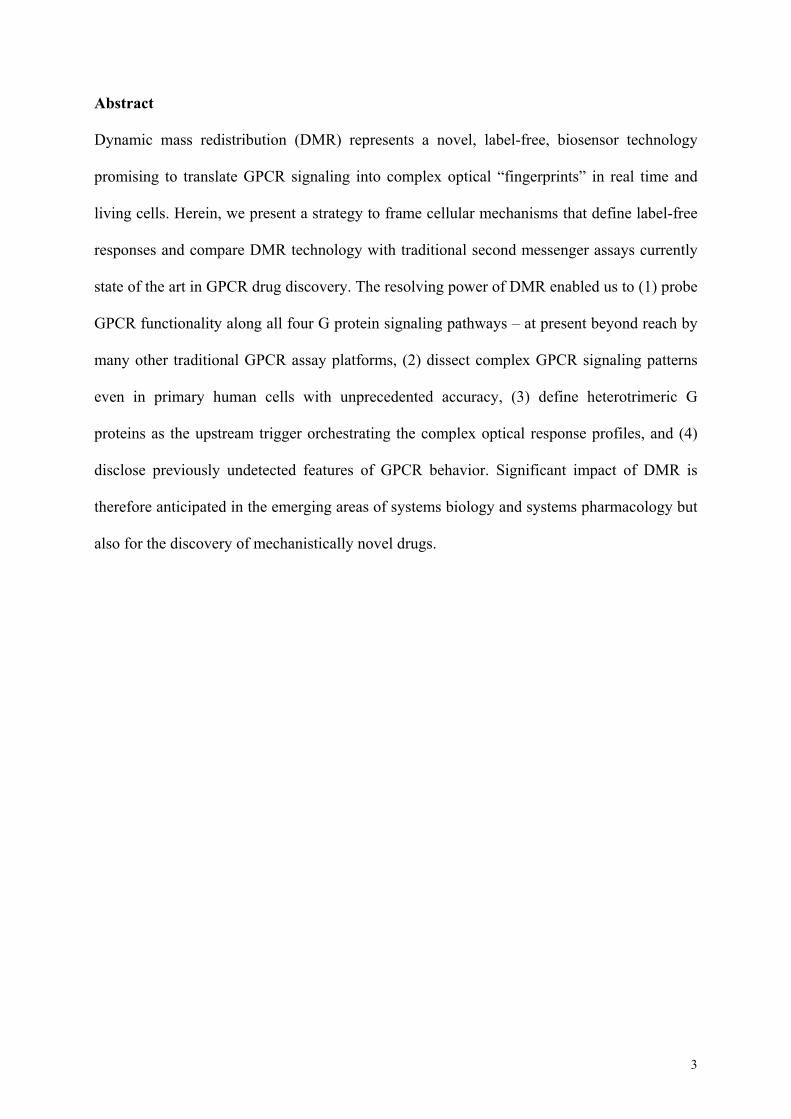
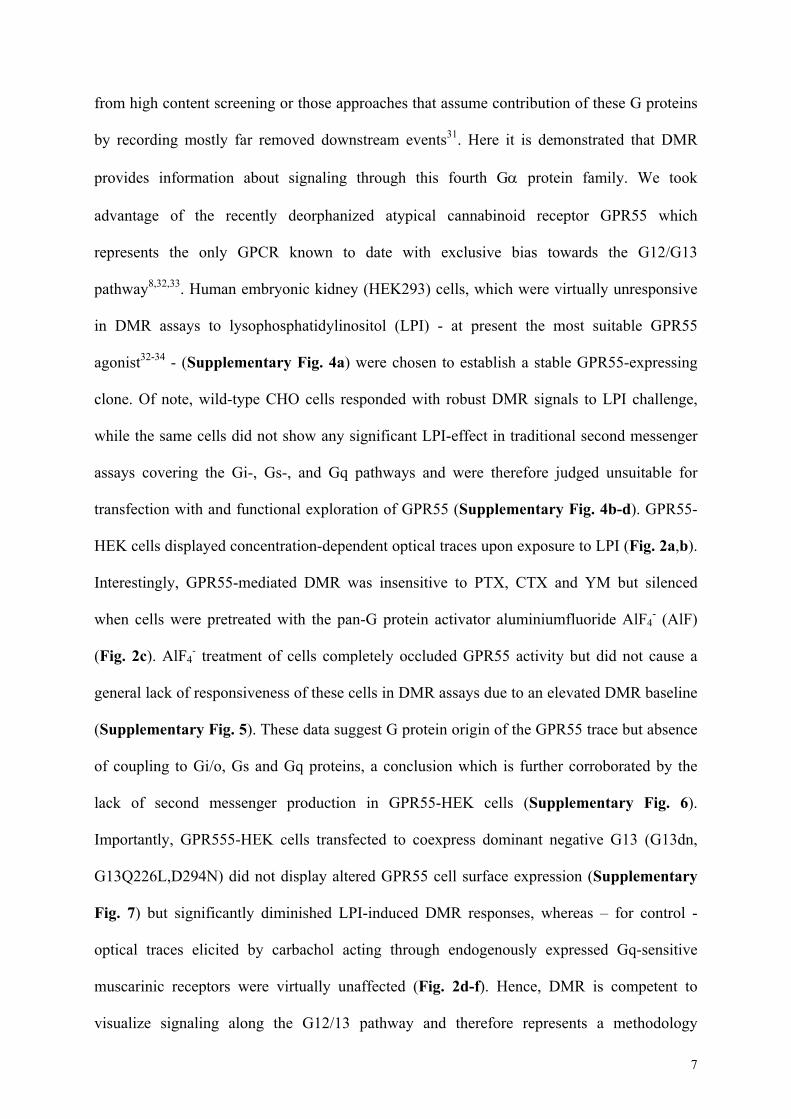
Dynamic mass redistribution faithfully reports signaling of Gi/o-, Gs-, and Gq-linked
receptors. CHO cells stably transfected to express the Gi/o-sensitive muscarinic M2, the Gq-
5
linked muscarinic M3, or the Gs-sensitive adrenergic β2 receptor were challenged with
increasing concentrations of their respective agonists, and dynamic mass redistribution
(DMR) was recorded as a function of receptor activity. For all three receptors real time optical
signatures were concentration-dependent and differed characteristically depending on the
primary signaling pathway of each receptor (Fig. 1b,c,d). Optical traces required presence of
the respective GPCRs since ligand activity was undetectable in native CHO cells
(Supplementary Fig. 1). To unequivocally characterize whether heterotrimeric G proteins are
responsible for orchestrating the specific temporal response patterns, we chose to
pharmacologically silence the three G protein signaling pathways using pertussis toxin (PTX)
to block Gi/o-, YM-254890 (hereafter referred to as YM) to suppress Gq-30, and cholera toxin
(CTX) to mask Gs-signaling. Indeed, M2 receptor optical traces were completely abrogated by
PTX but unaffected by YM and CTX (Fig. 1e) identifying Gi/o proteins as upstream trigger
for this optical fingerprint. On their own, these tools did not induce a DMR response
(Supplementary Fig. 2). Furthermore, G protein-activation as reflected by GTPγS binding
assays is in good agreement with DMR data (Fig. 1h), thus supporting the notion that the
optical traces result from activation of a receptor-dependent Gi-mediated signaling event.
Corresponding observations were made for Gs- and Gq-DMR assays: the Gs signatures of the
β2 receptor were exclusively masked by CTX but not by PTX or YM (Fig. 1f). The Gq
signatures of the M3 receptor were blunted by YM but not by PTX or CTX (Fig. 1g and
Supplementary Fig. 3); note the enhancement of M3 signature after pre-treatment with CTX
that will be addressed below. Again, traditional second messenger assays suggested that
optical traces are a consequence of engaging the respective signaling pathways assigned to
both receptors (Fig. 1i,j).
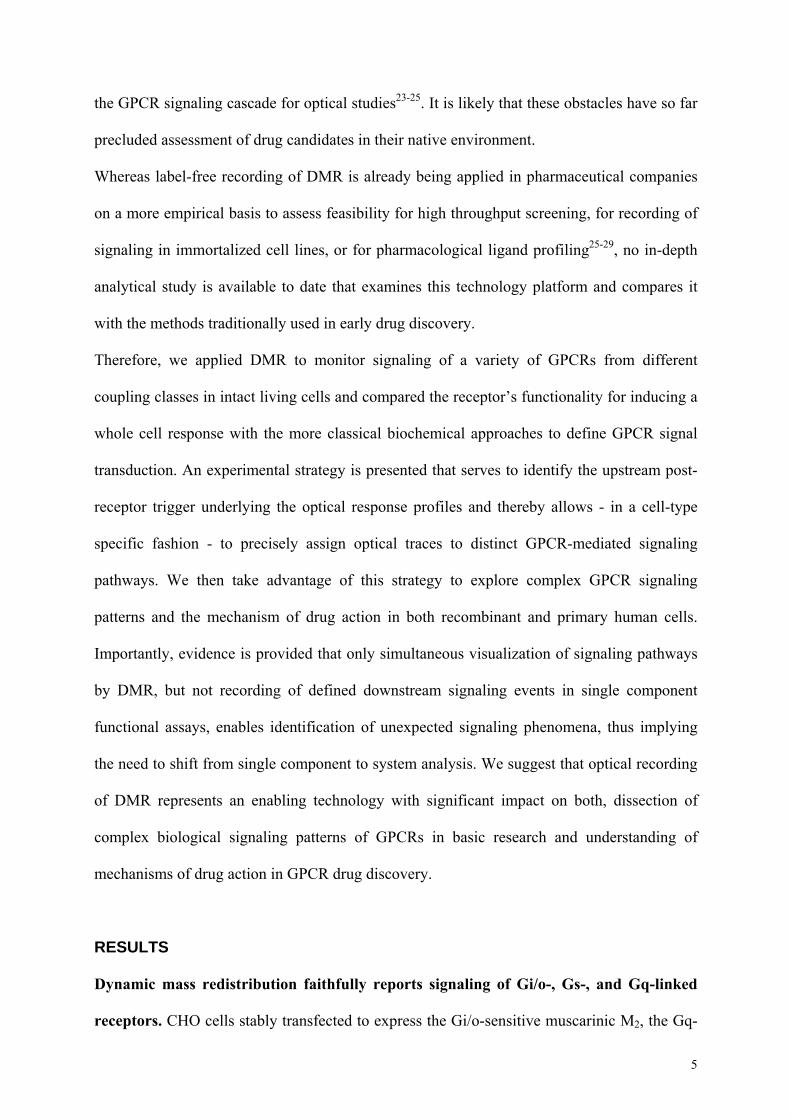
Dynamic mass redistribution is competent to identify signaling along the G12/13
pathway. Whereas second messenger assays are well suited to detect activation of Gi-, Gs-
and Gq-sensitive receptors, no such assay is yet available to detect G12/13 signaling apart
6
from high content screening or those approaches that assume contribution of these G proteins
by recording mostly far removed downstream events31. Here it is demonstrated that DMR
provides information about signaling through this fourth Gα protein family. We took
advantage of the recently deorphanized atypical cannabinoid receptor GPR55 which
represents the only GPCR known to date with exclusive bias towards the G12/G13
pathway8,32,33. Human embryonic kidney (HEK293) cells, which were virtually unresponsive
in DMR assays to lysophosphatidylinositol (LPI) - at present the most suitable GPR55
agonist32-34 - (Supplementary Fig. 4a) were chosen to establish a stable GPR55-expressing
clone. Of note, wild-type CHO cells responded with robust DMR signals to LPI challenge,
while the same cells did not show any significant LPI-effect in traditional second messenger
assays covering the Gi-, Gs-, and Gq pathways and were therefore judged unsuitable for
transfection with and functional exploration of GPR55 (Supplementary Fig. 4b-d). GPR55-
HEK cells displayed concentration-dependent optical traces upon exposure to LPI (Fig. 2a,b).
Interestingly, GPR55-mediated DMR was insensitive to PTX, CTX and YM but silenced
when cells were pretreated with the pan-G protein activator aluminiumfluoride AlF4- (AlF)
(Fig. 2c). AlF4- treatment of cells completely occluded GPR55 activity but did not cause a
general lack of responsiveness of these cells in DMR assays due to an elevated DMR baseline
(Supplementary Fig. 5). These data suggest G protein origin of the GPR55 trace but absence
of coupling to Gi/o, Gs and Gq proteins, a conclusion which is further corroborated by the
lack of second messenger production in GPR55-HEK cells (Supplementary Fig. 6).
Importantly, GPR555-HEK cells transfected to coexpress dominant negative G13 (G13dn,
G13Q226L,D294N) did not display altered GPR55 cell surface expression (Supplementary
Fig. 7) but significantly diminished LPI-induced DMR responses, whereas – for control -
optical traces elicited by carbachol acting through endogenously expressed Gq-sensitive
muscarinic receptors were virtually unaffected (Fig. 2d-f). Hence, DMR is competent to
visualize signaling along the G12/13 pathway and therefore represents a methodology
7
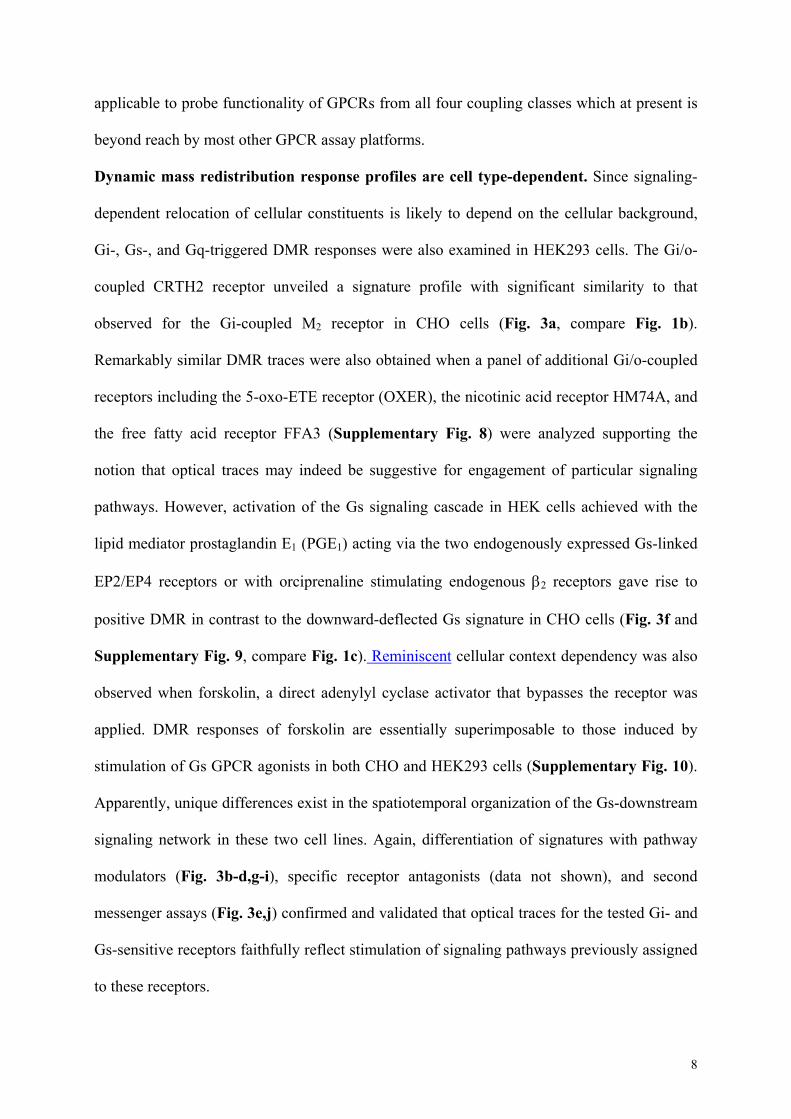
applicable to probe functionality of GPCRs from all four coupling classes which at present is
beyond reach by most other GPCR assay platforms.
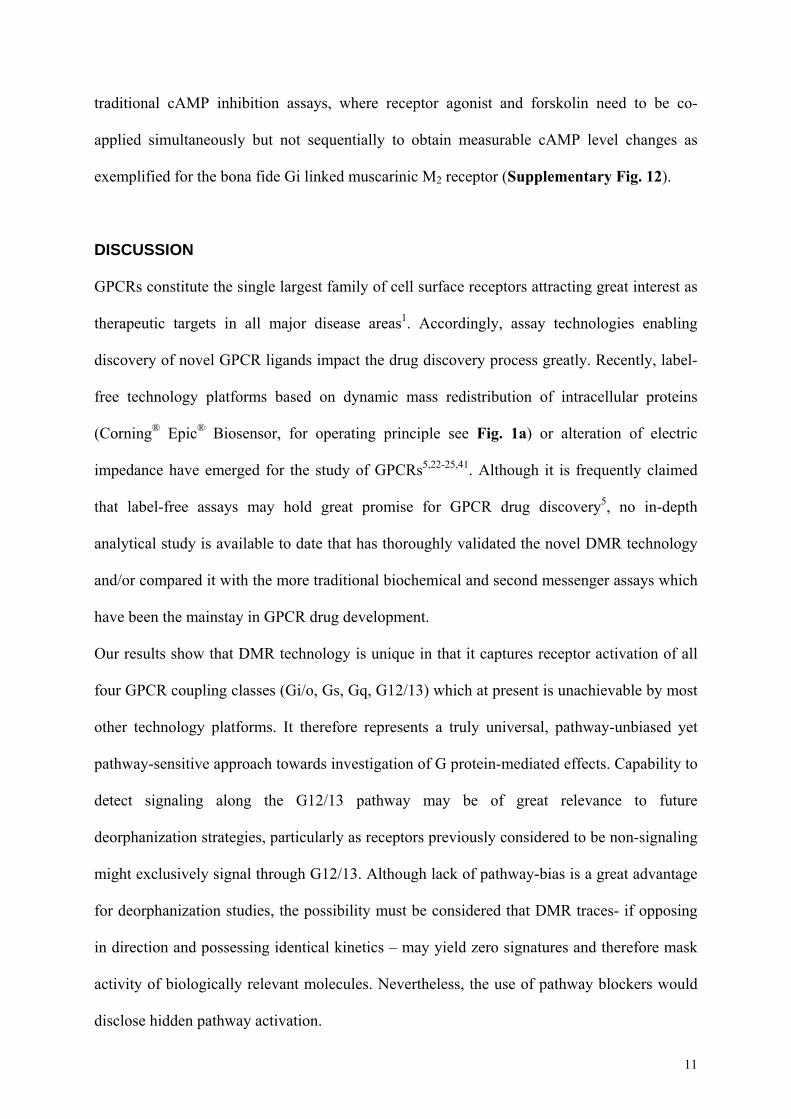
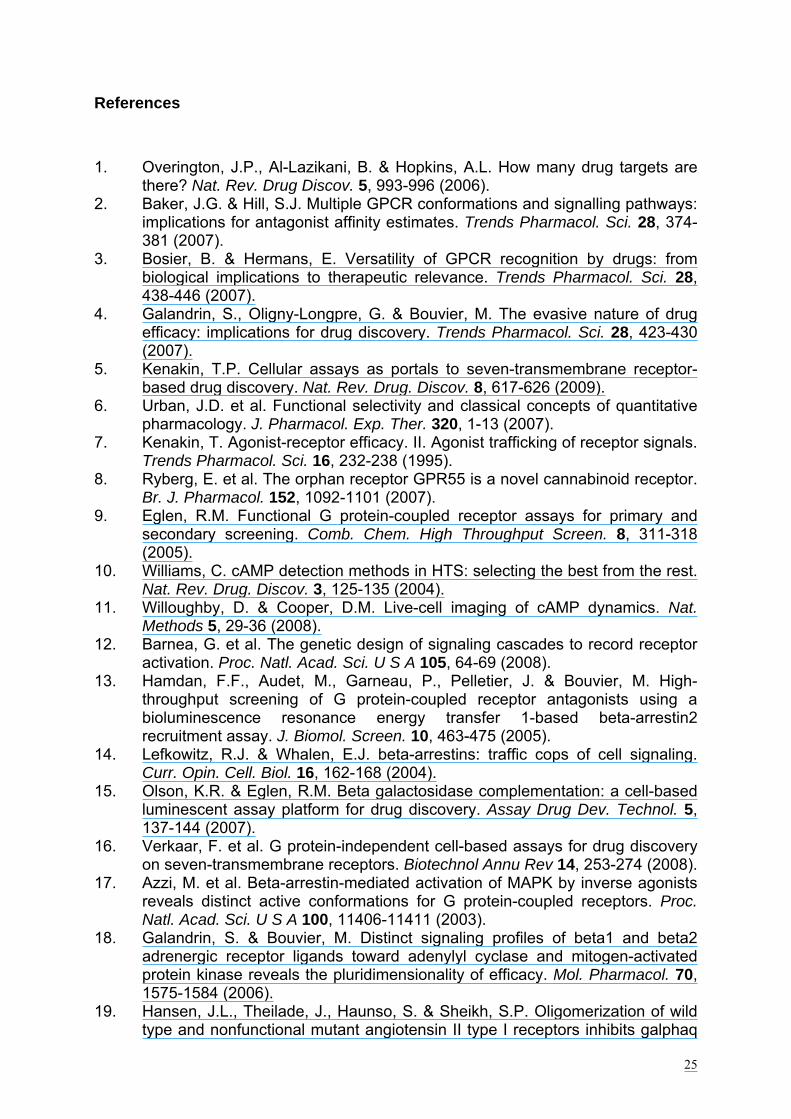
Dynamic mass redistribution response profiles are cell type-dependent. Since signaling-
dependent relocation of cellular constituents is likely to depend on the cellular background,
Gi-, Gs-, and Gq-triggered DMR responses were also examined in HEK293 cells. The Gi/o-
coupled CRTH2 receptor unveiled a signature profile with significant similarity to that
observed for the Gi-coupled M2 receptor in CHO cells (Fig. 3a, compare Fig. 1b).
Remarkably similar DMR traces were also obtained when a panel of additional Gi/o-coupled
receptors including the 5-oxo-ETE receptor (OXER), the nicotinic acid receptor HM74A, and
the free fatty acid receptor FFA3 (Supplementary Fig. 8) were analyzed supporting the
notion that optical traces may indeed be suggestive for engagement of particular signaling
pathways. However, activation of the Gs signaling cascade in HEK cells achieved with the
lipid mediator prostaglandin E1 (PGE1) acting via the two endogenously expressed Gs-linked
EP2/EP4 receptors or with orciprenaline stimulating endogenous β2 receptors gave rise to
positive DMR in contrast to the downward-deflected Gs signature in CHO cells (Fig. 3f and
Supplementary Fig. 9, compare Fig. 1c). Reminiscent cellular context dependency was also
observed when forskolin, a direct adenylyl cyclase activator that bypasses the receptor was
applied. DMR responses of forskolin are essentially superimposable to those induced by
stimulation of Gs GPCR agonists in both CHO and HEK293 cells (Supplementary Fig. 10).
Apparently, unique differences exist in the spatiotemporal organization of the Gs-downstream
signaling network in these two cell lines. Again, differentiation of signatures with pathway
modulators (Fig. 3b-d,g-i), specific receptor antagonists (data not shown), and second
messenger assays (Fig. 3e,j) confirmed and validated that optical traces for the tested Gi- and
Gs-sensitive receptors faithfully reflect stimulation of signaling pathways previously assigned
to these receptors.
8

Simultaneous recording of multiple cellular signaling events uncovers signaling
promiscuity. FFA1 has previously been classified as Gq/11-sensitive receptor35-37.
Stimulation of FFA1-HEK cells with the small molecule agonist TUG42438 induced robust
DMR responses, distinct in shape from those obtained for Gi- and Gs-coupled receptors in
this cellular background (compare Fig. 4a with Fig. 3a,f). However, unlike expected for a Gq-
sensitive receptor, FFA1-mediated DMR was only partly sensitive to inhibition by YM (Fig.
4b, compare black and blue trace), although the same concentration of YM was sufficient to
completely silence FFA1-dependent Gq/11 activity in IP1 assays (Fig. 4c). Apparently, FFA1
is not restricted to the Gq/11 pathway in this particular cellular background but engages an
additional signaling route. Indeed, FFA1 also activates Gi/o, inferred from partial PTX
sensitivity of the DMR signal (Fig. 4b compare black and grey trace) and a PTX-sensitive
component in ERK1/2 MAP kinase phosphorylation assays (Supplementary Fig. 11). In
agreement with a dual Gq-Gi coupling profile, only the combination of PTX and YM was
required and sufficient to completely erase the FFA1 response (Fig. 4b, compare black and
red trace). Strikingly, however Gi activity of FFA1 was hardly detectable when inhibition of
forskolin-stimulated cAMP production was measured in parallel second messenger assays
(Fig. 4d) which is well in agreement with previous observations35,36. These findings highlight
the strength of DMR technology: not only does DMR offer access to high content integrated
cellular information, it also provides mechanistic insight if combined with the inhibitor
strategy proposed herein to deconvolute complex signaling pathways.
Dynamic mass redistribution allows analysis of GPCR functionality in human primary
cells. Analyzing GPCR-mediated signal transduction in primary human cells, i.e. the cell type
in which medicines are intended to mediate their therapeutic effect, is highly desirable for
GPCR drug candidates. To test whether DMR is sufficiently sensitive to detect GPCR
signaling in a native environment, we chose the cAMP-elevating agent PGE1 as a stimulus,
known to affect cell growth and cytokine production of human keratinocytes39, and monitored
9

DMR in both immortalized (HaCaT cells) and primary human keratinocytes obtained from six
patients that underwent skin surgery. HaCaT and primary human keratinocytes responded
with concentration-dependent optical traces reminiscent of those already observed in PGE1-
treated EP2/EP4-HEK293 cells (Fig. 5a,b, compare Fig. 3f). Indeed, PGE1 traces in both
HaCaT and primary human keratinocytes reflect activation of the two Gs-coupled EP2 and
EP4 receptors since the responses were sensitive to inhibition by a combination of EP2 and
EP4 antagonists (Fig. 5c,d) – which when applied alone hardly diminished PGE1 traces (data
not shown, n=3) -, and invisible following CTX- but not PTX- or YM-treatment (Fig. 5e,f and
data not shown). Note: although cAMP and DMR assays were both sufficiently sensitive to
quantify PGE1 activity in primary human cells, DMR was significantly superior with respect
to quality of the signal window under conditions of low receptor expression in human primary
cells (Fig. 5g,h).
Dynamic mass redistribution uncovers unknown signaling paradigms. It has been shown
previously that persistent activation of the Gs signaling pathway can augment muscarinic M3
receptor-mediated inositol phosphate production40. At first glance, the results reported herein
might appear to be in good accordance with this earlier report as we detected enhanced
muscarinic M3 receptor signaling in the presence of cAMP elevating agents such as CTX
(Fig. 1g and Fig. 6a) and forskolin (Fig. 6b; red versus black trace). Surprisingly, however,
these enhanced M3 signaling responses in DMR assays were sensitive to pre-treatment of the
cells with PTX implying a Gi/o-mediated event (Fig. 6a,b; red versus blue trace). In contrast,
M3 DMR was completely insensitive to PTX pre-treatment when intracellular cAMP was not
elevated prior to application of the muscarinic agonist (Fig. 6a,b; grey versus black trace).
Apparently, elevated intracellular cAMP – when present prior to the muscarinic agonist –
serves as a stimulus to confer onto the M3 receptor the ability to engage an additional
signaling pathway. Importantly, detection of Gi activity under conditions of elevated cAMP
can also be accomplished by immunocapture GTPγS binding assays (Fig. 6c) but not
10
traditional cAMP inhibition assays, where receptor agonist and forskolin need to be co-
applied simultaneously but not sequentially to obtain measurable cAMP level changes as
exemplified for the bona fide Gi linked muscarinic M2 receptor (Supplementary Fig. 12).
DISCUSSION
GPCRs constitute the single largest family of cell surface receptors attracting great interest as
therapeutic targets in all major disease areas1. Accordingly, assay technologies enabling
discovery of novel GPCR ligands impact the drug discovery process greatly. Recently, label-
free technology platforms based on dynamic mass redistribution of intracellular proteins
(Corning® Epic® Biosensor, for operating principle see Fig. 1a) or alteration of electric
impedance have emerged for the study of GPCRs5,22-25,41. Although it is frequently claimed
that label-free assays may hold great promise for GPCR drug discovery5, no in-depth
analytical study is available to date that has thoroughly validated the novel DMR technology
and/or compared it with the more traditional biochemical and second messenger assays which
have been the mainstay in GPCR drug development.
Our results show that DMR technology is unique in that it captures receptor activation of all
four GPCR coupling classes (Gi/o, Gs, Gq, G12/13) which at present is unachievable by most
other technology platforms. It therefore represents a truly universal, pathway-unbiased yet
pathway-sensitive approach towards investigation of G protein-mediated effects. Capability to
detect signaling along the G12/13 pathway may be of great relevance to future
deorphanization strategies, particularly as receptors previously considered to be non-signaling
might exclusively signal through G12/13. Although lack of pathway-bias is a great advantage
for deorphanization studies, the possibility must be considered that DMR traces- if opposing
in direction and possessing identical kinetics – may yield zero signatures and therefore mask
activity of biologically relevant molecules. Nevertheless, the use of pathway blockers would
disclose hidden pathway activation.
11
DMR technology- and traditional second messenger assay-platforms also deviate greatly in
another aspect: DMR displays an overall cellular response, most likely encompassing a
variety of cellular events downstream of the GPCR5,22-24 which is in stark contrast to
quantification of defined second messengers that only contribute to the overall cellular
response. In addition, the total cellular level of a second messenger may not necessarily
reflect its local concentration at a site of strategic importance within a signaling cascade.
These aspects are likely to explain why agonist potencies determined with both methods may,
but do not necessarily have to converge. Indeed, the present study revealed an at least equal or
even superior sensitivity (Fig. 1i) of DMR- as compared with second messenger-recording for
the detection of receptor-dependent, G protein-mediated signaling.
Complexity of optical traces obviously raises the possibility that an unimaginable wealth of
intracellular players may be involved in defining the fine details of signature amplitude and
duration. It will be exciting to unravel the individual components shaping complex optical
response patterns. Utilization of libraries of signaling pathway inhibitors could be a starting
point, genome-wide genetic screens exploring siRNA libraries yet another. Our study does not
solve the signature riddle completely but provides a major mechanistic advance towards
understanding the complex optical traces: heterotrimeric G proteins represent the postreceptor
trigger responsible for orchestrating the complex response profiles for the various receptors
and cellular backgrounds examined herein, which was demonstrated using a combination of
toxins and pharmacological pathway inhibitors.
The experimental power of these tools in label-free detection has been shown in this study for
many different receptors and various cellular backgrounds including primary human
keratinocytes Given the emerging successes in directing differentiation of embryonic or
pluripotent stem cells to mature cells such as neurons or endothelial cells42,43, label-free DMR
detection opens the exciting perspective to expand mechanism of drug action studies and even
drug screening processes to physiologically relevant cells. Native signaling has already been
12

addressed in publications using label-free DMR detection25. All of these reports, however,
have embarked on analysis of immortalized cell lines25 which are much less close to tissue
biology as compared with primary human cells used herein.
Another striking revelation of this study is how the collation of signaling routes within one
dynamic all-encompassing response and its mechanistic deconvolution with appropriate
pharmacological tools visualizes both expected and unexpected signaling phenomena.
Identification of an additional signaling pathway for the free fatty acid FFA1 receptor is such
an example. In fact, application of DMR technology to disclose ligand efficacy along the Gi
pathway is particularly noteworthy since this aspect of FFA1 behavior is hardly detectable in
the traditional cAMP inhibition assay (Fig. 4d). Yet another example is constituted by
identification of cAMP as intracellular stimulus to increase the signaling repertoire of the
muscarinic M3 receptor. Although M3-Gi interaction has been inferred indirectly based on
partial PTX-sensitivity of M3-mediated responses many years ago44,45, a defined stimulus for
this event has remained elusive so far. It is therefore important to stress that this particular
mode of cellular crosstalk has been uncovered for two reasons: (i) because DMR visualizes
the summation of individual GPCR signaling routes during a single experiment, and (ii)
because DMR – in contrast to traditional biochemical assays - does not require
pharmacological manipulation of the second messenger adenylyl cyclase-cAMP pathway to
probe G protein (Gi) activity.
In summary, comparative analysis of traditional biochemical methods with the novel DMR
technology platform uncovers the experimental power of whole-cell label-free detection: not
only does DMR provide a temporally resolved readout for the summation of receptor-
triggered signaling events in recombinant and primary living cells with unprecedented
sensitivity and accuracy, it is this cumulative readout of cellular activity which opens the
exciting perspective to disclose further levels of biological complexity in the regulation of
signal transduction processes. We therefore anticipate that DMR as a holistic read-out of cell
13

function will advance the emerging areas of systems biology and systems pharmacology and
thereby promote the discovery of mechanistically novel therapeutics.
14

ACKNOWLEDGEMENTS We thank Ulrike Rick and Marianne Vasmer-Ehses for expert technical assistance
and Corning® Inc. for providing us with the Epic® system. This work was supported by
the DFG (Deutsche Forschungsgemeinschaft) grants KO 1582/3-1 to E.K., MO
821/2-1 to K.M. and WE 4428/1-1 to J.W. and the Dr. Hilmer foundation (PhD
fellowship to S.H.). A.K. is member of the Research Training School GRK 677, which
is supported by the DFG. We thank Marco De Amici and Ulrike Holzgrabe (University
of Milan, Italy, and University of Würzburg, Germany) for kindly providing Hybrid 146,
Trond Ulven (University of Southern Denmark) for TUG42438 and Astellas Pharma
Inc. (Osaka, Japan) for providing us with YM-25489030.
AUTHOR CONTRIBUTIONS
R.S., N.J., J.S., A.K., S.H., A.M., S.B., N.M., M.M.A., N.J.S., designed and performed
the experiments, E.K. and K.M. designed research and wrote the manuscript, S.Z.,
J.W., G.M. provided important biological samples or research tools, C.D., J.G., and
R.S. provided important ideas and edited the manuscript.
DISCLOSURES
The authors declare no competing financial interests.
FIGURE LEGENDS
Figure 1: Dynamic mass redistribution enables analysis of differential receptor-
mediated G protein activation in CHO cells.
(a) Sketch of the Epic® technique for real-time measurement of dynamic mass
redistribution (DMR). Traditional second messenger assays are included.
15
?: conventional second messenger assay is not known. For details see text and
Methods section.
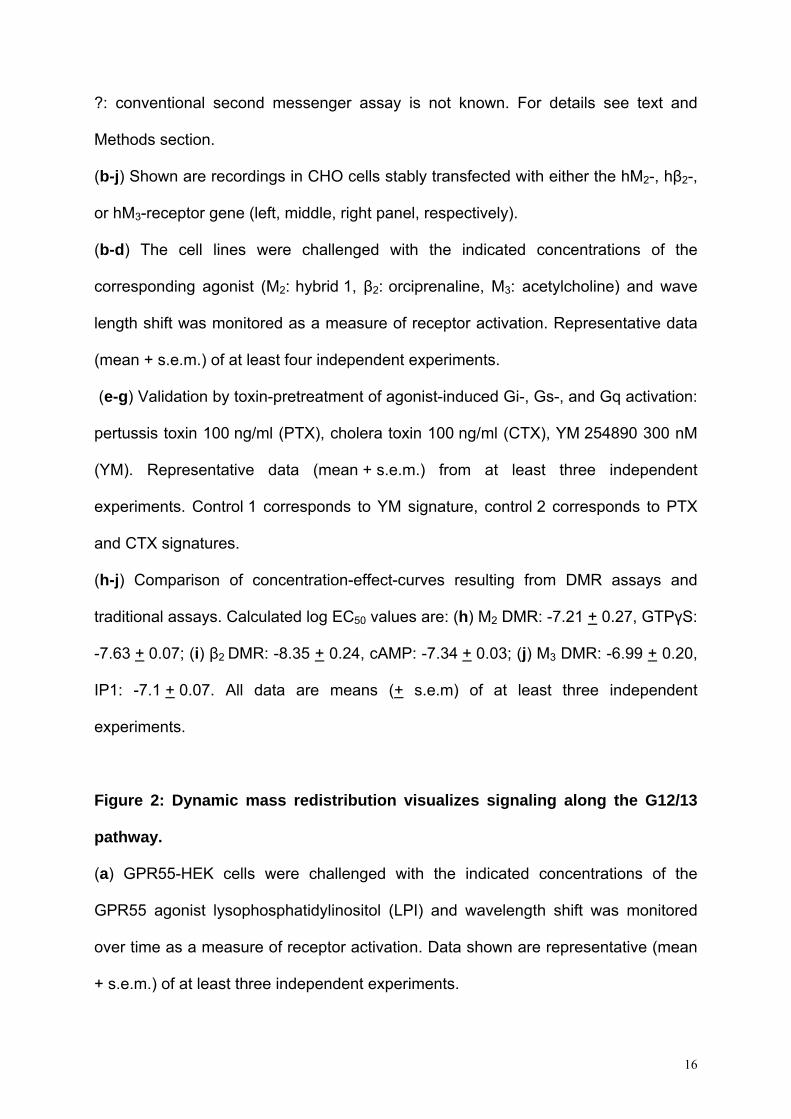
(b-j) Shown are recordings in CHO cells stably transfected with either the hM2-, hβ2-,
or hM3-receptor gene (left, middle, right panel, respectively).
(b-d) The cell lines were challenged with the indicated concentrations of the
corresponding agonist (M2: hybrid 1, β2: orciprenaline, M3: acetylcholine) and wave
length shift was monitored as a measure of receptor activation. Representative data
(mean + s.e.m.) of at least four independent experiments.
(e-g) Validation by toxin-pretreatment of agonist-induced Gi-, Gs-, and Gq activation:
pertussis toxin 100 ng/ml (PTX), cholera toxin 100 ng/ml (CTX), YM 254890 300 nM
(YM). Representative data (mean + s.e.m.) from at least three independent
experiments. Control 1 corresponds to YM signature, control 2 corresponds to PTX
and CTX signatures.
(h-j) Comparison of concentration-effect-curves resulting from DMR assays and
traditional assays. Calculated log EC50 values are: (h) M2 DMR: -7.21 + 0.27, GTPγS:
-7.63 + 0.07; (i) β2 DMR: -8.35 + 0.24, cAMP: -7.34 + 0.03; (j) M3 DMR: -6.99 + 0.20,
IP1: -7.1 + 0.07. All data are means (+ s.e.m) of at least three independent
experiments.
Figure 2: Dynamic mass redistribution visualizes signaling along the G12/13
pathway.
(a) GPR55-HEK cells were challenged with the indicated concentrations of the
GPR55 agonist lysophosphatidylinositol (LPI) and wavelength shift was monitored
over time as a measure of receptor activation. Data shown are representative (mean
+ s.e.m.) of at least three independent experiments.
16

(b) Concentration-effect curve for LPI in GPR55-HEK cells resulting from DMR traces
in three independent experiments. The calculated log EC50 value is -7.34 + 0.05.
(c) LPI-mediated alteration of cell activity in GPR55-HEK cells is not blunted by pre-
treatment with toxin (5 ng/ml PTX, 100 ng/ml CTX) or pathway inhibitor (300 nM YM-
254890), but is sensitive to pre-incubation of cells with 300 µM of the pan-G protein
agonist AlF4- (AlF). Shown are representative data (mean + s.e.m.) from at least three
independent experiments.
(d,e,f) LPI- but not carbachol-mediated DMR is significantly diminished in GPR55-
HEK cells cotransfected to express a dominant negative form of G13 (G13dn,
G13Q226L,D294N). GPR55 cells cotransfected to express G13dn or empty
pcDNA3.1 vector DNA were treated with 1 µM LPI (d) or 100 µM carbachol (e) and
DMR was monitored over time. Depicted are representative optical traces (d,e) and
concentration effect relationships of five such experiments (f).
Figure 3: Dynamic mass redistribution enables measurement of differential
receptor-mediated G protein activation in HEK293 cells.
Shown are DMR and second messenger assays performed with the following cell
lines and receptors: (a-e) HEK293 cells stably expressing CRTH2, (f-j) HEK293 cells
endogenously expressing EP2/EP4 receptors.
(a,f) Cells were challenged with the indicated concentrations of agonists and
wavelength shift was monitored as a measure of receptor activation. Shown are
representative data (mean + s.e.m.) of at least three independent experiments.
(b,g) Pre-treatment of cells with 5 ng/ml PTX inhibits signaling of the Gi-sensitive
CRTH2 receptor but not signaling of the Gs-sensitive EP2/EP4 receptors.
(c,h) Pre-treatment of cells with 100 ng/ml CTX (or 10 µM forskolin) masks signaling
of the Gs-sensitive EP2/EP4 receptors but does not affect Gi traces of CRTH2.
17
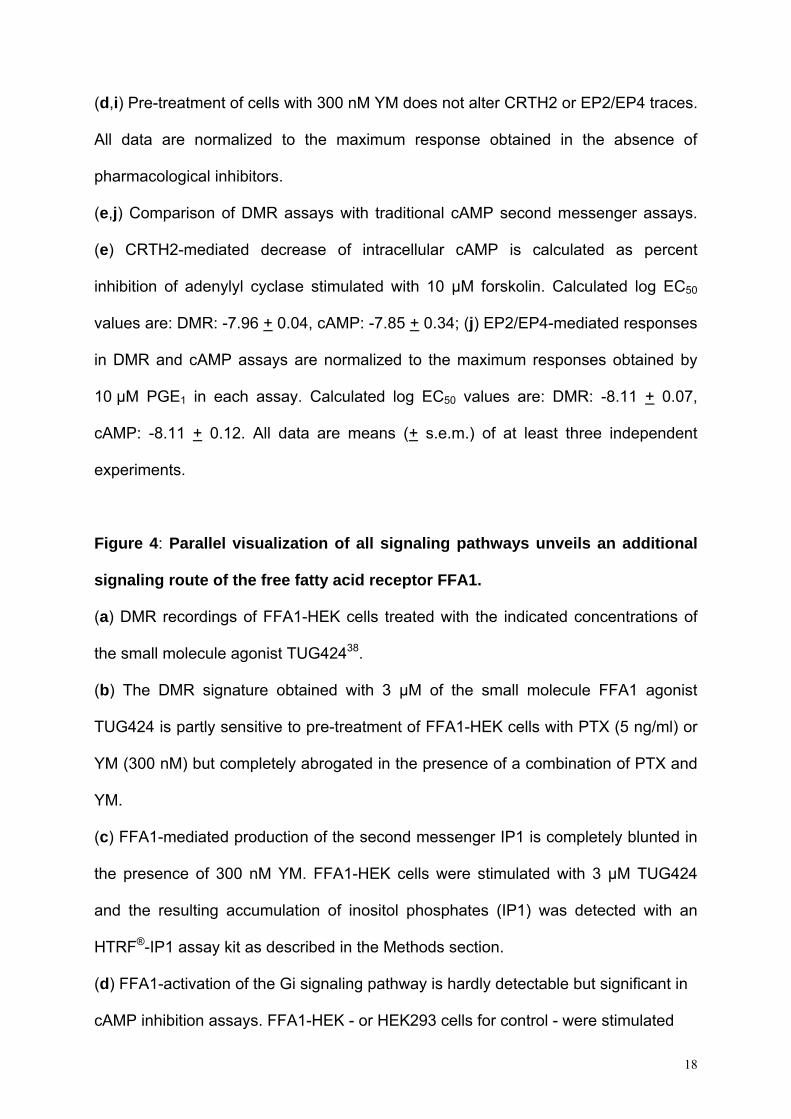
(d,i) Pre-treatment of cells with 300 nM YM does not alter CRTH2 or EP2/EP4 traces.
All data are normalized to the maximum response obtained in the absence of
pharmacological inhibitors.
(e,j) Comparison of DMR assays with traditional cAMP second messenger assays.
(e) CRTH2-mediated decrease of intracellular cAMP is calculated as percent
inhibition of adenylyl cyclase stimulated with 10 µM forskolin. Calculated log EC50
values are: DMR: -7.96 + 0.04, cAMP: -7.85 + 0.34; (j) EP2/EP4-mediated responses
in DMR and cAMP assays are normalized to the maximum responses obtained by
10 µM PGE1 in each assay. Calculated log EC50 values are: DMR: -8.11 + 0.07,
cAMP: -8.11 + 0.12. All data are means (+ s.e.m.) of at least three independent
experiments.
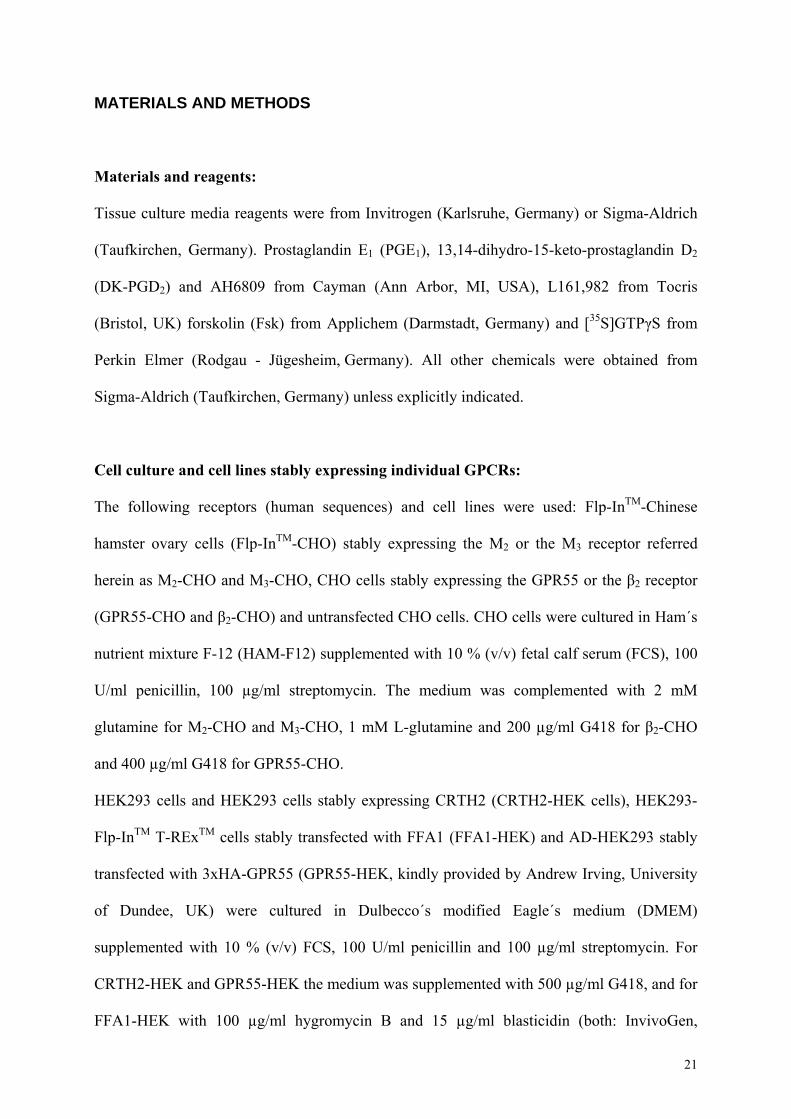
Figure 4: Parallel visualization of all signaling pathways unveils an additional
signaling route of the free fatty acid receptor FFA1.
(a) DMR recordings of FFA1-HEK cells treated with the indicated concentrations of
the small molecule agonist TUG42438.
(b) The DMR signature obtained with 3 µM of the small molecule FFA1 agonist
TUG424 is partly sensitive to pre-treatment of FFA1-HEK cells with PTX (5 ng/ml) or
YM (300 nM) but completely abrogated in the presence of a combination of PTX and
YM.
(c) FFA1-mediated production of the second messenger IP1 is completely blunted in
the presence of 300 nM YM. FFA1-HEK cells were stimulated with 3 µM TUG424
and the resulting accumulation of inositol phosphates (IP1) was detected with an
HTRF®-IP1 assay kit as described in the Methods section.
(d) FFA1-activation of the Gi signaling pathway is hardly detectable but significant in
cAMP inhibition assays. FFA1-HEK - or HEK293 cells for control - were stimulated
18

with 5 µM forskolin and inhibition of cAMP formation was quantified with an HTRF®-
cAMP assay kit as outlined in the Methods section. The cAMP level induced by
stimulation with 5 µM forskolin (Fsk) was set 100 %. Shown are mean values and
s.e.m. of three to six independent experiments. For statistical analysis, individual
concentrations were compared by two-way ANOVA with Bonferroni's correction for
multiple comparisons. **p<0.01, ***p<0.001.
Figure 5: Dynamic mass redistribution enables analysis of GPCR functionality
in immortalized and primary human keratinocytes.
Left panels: immortalized human keratinocytes (HaCaTs), right panels: primary
human keratinocytes. (a,b) The cell lines were challenged with the indicated
concentrations of PGE1 and wavelength shift over time was monitored as a measure
of receptor activation. (a) Representative data (+ s.e.m.) of at least four independent
experiments. (b) Representative data (+ s.e.m.) of cells from one human donor. Cells
of five additional human donors yielded comparable optical traces (not shown).
(c,d) PGE1-mediated DMR is inhibited by pre-treatment with a combination of the
EP2 and EP4 receptor antagonists AH6809 and L161,982 respectively. Optical
traces of 30 nM PGE1 (c) or 100 nM PGE1 (d) in the absence and presence of a
combination of 10 µM AH6809 and 3 µM L161,982. All data are representative data
(+ s.e.m.) of at least four independent experiments.
(e,f) DMR signatures of 100 nM PGE1 are masked when cells are pretreated with
250 ng/ml cholera toxin (CTX). (e) Representative data (+ s.e.m.) of at least four
independent experiments. (f) One representative data set (+ s.e.m.) from one out of
five human subjects.
(g,h) Comparison of DMR assays with traditional endpoint cAMP second messenger
assays. Calculated log EC50 values are: (g) HaCaT: DMR: -8.27 + 0.09, cAMP: -7.78
19

+ 0.09; (h) keratinocytes: DMR: -7.70 + 0.06, cAMP: -7.60 + 0.12. All data are means
(+ s.e.m.) of at least four independent experiments.
Figure 6: The muscarinic M3-receptor adapts to adenylyl cyclase activation with
a changed signaling repertoire. Set of DMR experiments addressing (a) indirect
and (b) direct activation of adenylyl cyclase by CTX and forskolin (Fsk), respectively.
Acetylcholine (100 µM)-induced DMR traces were measured under control conditions
and after pre-treatment with pertussis toxin 100 ng/ml (PTX), cholera toxin 100 ng/ml
(CTX), or forskolin 10 µM as indicated. Representative data (mean + s.e.m.) from at
least three independent experiments. Note that PTX sensitivity emerges only after
pre-treatment with either CTX or forskolin. (c) GTPγS binding assay on membranes
prepared from M3-CHO cells. M3-CHO cells were grown to confluence and left
untreated or were pre-treated with cholera toxin (20 h, 100 ng/ml) prior to membrane
preparation. GTPγS incorporation was determined in the absence and presence of 1
mM acetylcholine followed by immuno-enrichment of Gi proteins with an antiserum to
the C terminal region common to Gi proteins, as described in the Methods section
(mean + s.e.m., n= 3). P values less than 0.05 were considered statistically
significant according to one-way analysis of variance (ANOVA) with Bonferroni’s
correction for multiple comparisons, as appropriate.
20
MATERIALS AND METHODS
Materials and reagents:
Tissue culture media reagents were from Invitrogen (Karlsruhe, Germany) or Sigma-Aldrich
(Taufkirchen, Germany). Prostaglandin E1 (PGE1), 13,14-dihydro-15-keto-prostaglandin D2
(DK-PGD2) and AH6809 from Cayman (Ann Arbor, MI, USA), L161,982 from Tocris
(Bristol, UK) forskolin (Fsk) from Applichem (Darmstadt, Germany) and [35S]GTPγS from
Perkin Elmer (Rodgau - Jügesheim, Germany). All other chemicals were obtained from
Sigma-Aldrich (Taufkirchen, Germany) unless explicitly indicated.
Cell culture and cell lines stably expressing individual GPCRs:
The following receptors (human sequences) and cell lines were used: Flp-InTM-Chinese
hamster ovary cells (Flp-InTM-CHO) stably expressing the M2 or the M3 receptor referred
herein as M2-CHO and M3-CHO, CHO cells stably expressing the GPR55 or the β2 receptor
(GPR55-CHO and β2-CHO) and untransfected CHO cells. CHO cells were cultured in Ham´s
nutrient mixture F-12 (HAM-F12) supplemented with 10 % (v/v) fetal calf serum (FCS), 100
U/ml penicillin, 100 µg/ml streptomycin. The medium was complemented with 2 mM
glutamine for M2-CHO and M3-CHO, 1 mM L-glutamine and 200 µg/ml G418 for β2-CHO
and 400 µg/ml G418 for GPR55-CHO.
HEK293 cells and HEK293 cells stably expressing CRTH2 (CRTH2-HEK cells), HEK293-
Flp-InTM T-RExTM cells stably transfected with FFA1 (FFA1-HEK) and AD-HEK293 stably
transfected with 3xHA-GPR55 (GPR55-HEK, kindly provided by Andrew Irving, University
of Dundee, UK) were cultured in Dulbecco´s modified Eagle´s medium (DMEM)
supplemented with 10 % (v/v) FCS, 100 U/ml penicillin and 100 µg/ml streptomycin. For
CRTH2-HEK and GPR55-HEK the medium was supplemented with 500 µg/ml G418, and for
FFA1-HEK with 100 µg/ml hygromycin B and 15 µg/ml blasticidin (both: InvivoGen,
21

Toulouse, France). For receptor expression FFA1-HEK cells were treated with 1 µg/ml
doxycyclin for 16 h.
Immortalized keratinocytes (HaCaT, human adult low calcium temperature) were grown in
RPMI-1640 supplemented with 10 % (v/v) FCS, 100 U/ml penicillin and 100 µg/ml
streptomycin.
Primary human keratinocytes were obtained from skin samples of healthy patients and were
cultured in KGM2 (Promocell, Heidelberg, Germany) supplemented with 100 U/ml penicillin
and 100 µg/ml streptomycin. All patients had written an informed consent before excision.
The study was approved by the local ethic committee (concession-no. 090/04).
All cells were cultivated with 5% CO2 at 37°C.
Transient transfections of GPR55-HEK cells:
To effectively deliver cDNA coding for dominant-negative G13 (G13Q226L,D294N) into
GPR55-HEK cells an electroporation method was used described previously47. DMR
measurements were performed 48 h after transfection.
Dynamic mass redistribution (DMR) assays (Corning® Epic® Biosensor measurements):
A beta version of the Corning® Epic® System was used consisting of a temperature-control
unit, an optical detection unit, and an on-board robotic liquid handling device. Principle: A
confluent cell layer adheres to the bottom of a well equipped with an optical biosensor.
Ingoing broadband light is directed to travel along the bottom. The electromagnetic field
extends into the cell layer for a depth of about 150 nm, loses energy depending on the optical
density of the adjacent cell area and outgoing wavelength is measured. GPCR-mediated
signaling affects optical density and thereby shifts outgoing wavelength (pm) relative to pre-
stimulus condition and is recorded over time. The magnitude of this wavelength shift is
22
proportional to the amount of relocated intracellular matters: increase of mass contributes
positively and decrease negatively to the overall response22,23.
Cells were seeded onto 384-well Epic® sensor microplates and cultured for 20-24 h to obtain
confluent monolayers. GPR55 cells were treated as described previously34.
Prior to the assay cells were washed with assay-buffer (HBSS with 20 mM HEPES) and
transferred to the Epic® reader for 2 h at 28°C. DMR was monitored before and after addition
of compound solutions. The incubation time for pre-treatment with PTX or CTX was 16-20 h,
for YM-254890 2.5 h, for aluminiumfluoride 1.5 h, and for forskolin 1-2.5 h.
[35S]GTPγS assay:
Membranes were prepared from M2-CHO cells and [35S]GTPγS incorporation measured as
described previously48. For muscarinic M3 receptors [35S]GTPγS binding assays included an
immuno-capture step with an antiserum to the C-terminus of Gi and were performed
according to a previously published procedure49
Second messenger accumulation assays (over expressed receptors):
cAMP and IP1 accumulation was quantified with the HTRF®-cAMP dynamic kit or the
HTRF®-IP1 kit, respectively (both Cisbio, Bagnols-sur-Cèze Cedex, France) as per
manufacturer’s instructions and as described previously50 on a Mithras LB 940 reader
(Berthold Technologies, Bad Wildbad, Germany).
cAMP accumulation assay (endogenously expressed receptors): cAMP accumulation was
quantified with the competitive immunoassay HitHunter™ cAMP-HS+-kit (DiscoveRx
Corporation, Fremont, USA) as per manufacturer’s instructions using the Mithras LB 940
reader.
23

Calculations and Data Analysis:
Quantification of DMR signals for concentration effect curves was performed either by
calculation of the area under the curve (AUC) between 0 and 3600 s (Fig. 1i,j, Fig. 2b,f, Fig.
3j, Fig. 5g,h) or by the maximum value between 300 and 1200 s (Fig. 1h, Fig. 3e) for those
traces that displayed fast kinetics and clear peak maxima. All optical DMR recordings were
buffer/solvent-corrected. For data normalization, indicated as relative response (%), top levels
of concentration effect curves were set 100 % and bottom levels 0 %. Data calculation and
EC50 value determination by nonlinear regression was performed using Prism 4.02 (Graph
Pad, San Diego, CA, USA).
Statistical Analysis:
Where appropriate, differences in means were examined by one-way analysis of variance
(ANOVA) with Bonferroni's multiple comparison post-hoc test using GraphPad Prism 5.01
(GraphPad Software, San Diego, CA, USA). A p value < 0.05 was considered statistically
significant.
24
References
1. Overington, J.P., Al-Lazikani, B. & Hopkins, A.L. How many drug targets are there? Nat. Rev. Drug Discov. 5, 993-996 (2006).
2. Baker, J.G. & Hill, S.J. Multiple GPCR conformations and signalling pathways: implications for antagonist affinity estimates. Trends Pharmacol. Sci. 28, 374-381 (2007).
3. Bosier, B. & Hermans, E. Versatility of GPCR recognition by drugs: from biological implications to therapeutic relevance. Trends Pharmacol. Sci. 28, 438-446 (2007).
4. Galandrin, S., Oligny-Longpre, G. & Bouvier, M. The evasive nature of drug efficacy: implications for drug discovery. Trends Pharmacol. Sci. 28, 423-430 (2007).
5. Kenakin, T.P. Cellular assays as portals to seven-transmembrane receptor-based drug discovery. Nat. Rev. Drug. Discov. 8, 617-626 (2009).
6. Urban, J.D. et al. Functional selectivity and classical concepts of quantitative pharmacology. J. Pharmacol. Exp. Ther. 320, 1-13 (2007).
7. Kenakin, T. Agonist-receptor efficacy. II. Agonist trafficking of receptor signals. Trends Pharmacol. Sci. 16, 232-238 (1995).
8. Ryberg, E. et al. The orphan receptor GPR55 is a novel cannabinoid receptor. Br. J. Pharmacol. 152, 1092-1101 (2007).
9. Eglen, R.M. Functional G protein-coupled receptor assays for primary and secondary screening. Comb. Chem. High Throughput Screen. 8, 311-318 (2005).
10. Williams, C. cAMP detection methods in HTS: selecting the best from the rest. Nat. Rev. Drug. Discov. 3, 125-135 (2004).
11. Willoughby, D. & Cooper, D.M. Live-cell imaging of cAMP dynamics. Nat. Methods 5, 29-36 (2008).
12. Barnea, G. et al. The genetic design of signaling cascades to record receptor activation. Proc. Natl. Acad. Sci. U S A 105, 64-69 (2008).
13. Hamdan, F.F., Audet, M., Garneau, P., Pelletier, J. & Bouvier, M. High-throughput screening of G protein-coupled receptor antagonists using a bioluminescence resonance energy transfer 1-based beta-arrestin2 recruitment assay. J. Biomol. Screen. 10, 463-475 (2005).
14. Lefkowitz, R.J. & Whalen, E.J. beta-arrestins: traffic cops of cell signaling. Curr. Opin. Cell. Biol. 16, 162-168 (2004).
15. Olson, K.R. & Eglen, R.M. Beta galactosidase complementation: a cell-based luminescent assay platform for drug discovery. Assay Drug Dev. Technol. 5, 137-144 (2007).
16. Verkaar, F. et al. G protein-independent cell-based assays for drug discovery on seven-transmembrane receptors. Biotechnol Annu Rev 14, 253-274 (2008).
17. Azzi, M. et al. Beta-arrestin-mediated activation of MAPK by inverse agonists reveals distinct active conformations for G protein-coupled receptors. Proc. Natl. Acad. Sci. U S A 100, 11406-11411 (2003).
18. Galandrin, S. & Bouvier, M. Distinct signaling profiles of beta1 and beta2 adrenergic receptor ligands toward adenylyl cyclase and mitogen-activated protein kinase reveals the pluridimensionality of efficacy. Mol. Pharmacol. 70, 1575-1584 (2006).
19. Hansen, J.L., Theilade, J., Haunso, S. & Sheikh, S.P. Oligomerization of wild type and nonfunctional mutant angiotensin II type I receptors inhibits galphaq
25
protein signaling but not ERK activation. J. Biol. Chem. 279, 24108-24115 (2004).
20. Hoffmann, C., Ziegler, N., Reiner, S., Krasel, C. & Lohse, M.J. Agonist-selective, receptor-specific interaction of human P2Y receptors with beta-arrestin-1 and -2. J. Biol. Chem. 283, 30933-30941 (2008).
21. Violin, J.D. & Lefkowitz, R.J. Beta-arrestin-biased ligands at seven-transmembrane receptors. Trends Pharmacol. Sci. 28, 416-422 (2007).
22. Fang, Y., Ferrie, A.M., Fontaine, N.H., Mauro, J. & Balakrishnan, J. Resonant waveguide grating biosensor for living cell sensing. Biophys. J. 91, 1925-1940 (2006).
23. Fang, Y., Li, G. & Ferrie, A.M. Non-invasive optical biosensor for assaying endogenous G protein-coupled receptors in adherent cells. J. Pharmacol. Toxicol. Methods 55, 314-322 (2007).
24. Fang, Y. & Ferrie, A.M. Optical biosensor differentiates signaling of endogenous PAR1 and PAR2 in A431 cells. BMC Cell Biol. 8, 24 (2007).
25. Rocheville, M. & Jerman, J.C. 7TM pharmacology measured by label-free: a holistic approach to cell signalling. Curr. Opin. Pharmacol. 9, 643-649 (2009).
26. Dodgson, K., Gedge, L., Murray, D.C. & Coldwell, M. A 100K well screen for a muscarinic receptor using the Epic label-free system--a reflection on the benefits of the label-free approach to screening seven-transmembrane receptors. J. Recept. Signal Transduct. Res. 29, 163-172 (2009).
27. Lee, P.H. et al. Evaluation of dynamic mass redistribution technology for pharmacological studies of recombinant and endogenously expressed g protein-coupled receptors. Assay Drug Dev. Technol. 6, 83-94 (2008).
28. McGuinness, R.P. et al. Enhanced selectivity screening of GPCR ligands using a label-free cell based assay technology. Comb. Chem. High Throughput Screen. 12, 812-823 (2009).
29. Peters, M.F., Vaillancourt, F., Heroux, M., Valiquette, M. & Scott, C.W. Comparing Label-Free Biosensors for Pharmacological Screening With Cell-Based Functional Assays. Assay Drug Dev. Technol. (in press).
30. Takasaki, J. et al. A novel Galphaq/11-selective inhibitor. J. Biol. Chem. 279, 47438-47445 (2004).
31. Riobo, N.A. & Manning, D.R. Receptors coupled to heterotrimeric G proteins of the G12 family. Trends Pharmacol. Sci. 26, 146-154 (2005).
32. Henstridge, C.M. et al. The GPR55 ligand L-alpha-lysophosphatidylinositol promotes RhoA-dependent Ca2+ signaling and NFAT activation. Faseb J. 23, 183-193 (2009).
33. Ross, R.A. The enigmatic pharmacology of GPR55. Trends Pharmacol. Sci. 30, 156-163 (2009).
34. Henstridge, C.M. et al. GPR55 ligands promote receptor coupling to multiple signalling pathways. Br. J. Pharmacol. (in press).
35. Briscoe, C.P. et al. The orphan G protein-coupled receptor GPR40 is activated by medium and long chain fatty acids. J. Biol. Chem. 278, 11303-11311 (2003).
36. Itoh, Y. et al. Free fatty acids regulate insulin secretion from pancreatic beta cells through GPR40. Nature 422, 173-176 (2003).
37. Stoddart, L.A., Brown, A.J. & Milligan, G. Uncovering the pharmacology of the G protein-coupled receptor GPR40: high apparent constitutive activity in guanosine 5'-O-(3-[35S]thio)triphosphate binding studies reflects binding of an endogenous agonist. Mol. Pharmacol. 71, 994-1005 (2007).
26

38. Christiansen, E. et al. Discovery of potent and selective agonists for the free fatty acid receptor 1 (FFA(1)/GPR40), a potential target for the treatment of type II diabetes. J. Med. Chem. 51, 7061-7064 (2008).
39. Zhang, J.Z., Maruyama, K., Iwatsuki, K., Ono, I. & Kaneko, F. Effects of prostaglandin E1 on human keratinocytes and dermal fibroblasts: a possible mechanism for the healing of skin ulcers. Exp. Dermatol. 3, 164-170 (1994).
40. McGraw, D.W., Almoosa, K.F., Paul, R.J., Kobilka, B.K. & Liggett, S.B. Antithetic regulation by beta-adrenergic receptors of Gq receptor signaling via phospholipase C underlies the airway beta-agonist paradox. J. Clin. Invest. 112, 619-626 (2003).
41. McGuinness, R. Impedance-based cellular assay technologies: recent advances, future promise. Curr. Opin. Pharmacol. 7, 535-540 (2007).
42. Gaspard, N. et al. Generation of cortical neurons from mouse embryonic stem cells. Nature Protoc. 4, 1454-1463 (2009).
43. James, D. et al. Expansion and maintenance of human embryonic stem cell-derived endothelial cells by TGFbeta inhibition is Id1 dependent. Nature Biotechnol. 28, 161-166 (2010).
44. Burford, N.T., Tobin, A.B. & Nahorski, S.R. Differential coupling of m1, m2 and m3 muscarinic receptor subtypes to inositol 1,4,5-trisphosphate and adenosine 3',5'-cyclic monophosphate accumulation in Chinese hamster ovary cells. J. Pharmacol. Exp. Ther. 274, 134-142 (1995).
45. Schmidt, M., Nehls, C., Rumenapp, U. & Jakobs, K.H. m3 Muscarinic receptor-induced and Gi-mediated heterologous potentiation of phospholipase C stimulation: role of phosphoinositide synthesis. Mol. Pharmacol. 50, 1038-1046 (1996).
46. Antony, J. et al. Dualsteric GPCR targeting: a novel route to binding and signaling pathway selectivity. Faseb J. 23, 442-450 (2009).
47. Pantaloni, C. et al. Alternative splicing in the N-terminal extracellular domain of the pituitary adenylate cyclase-activating polypeptide (PACAP) receptor modulates receptor selectivity and relative potencies of PACAP-27 and PACAP-38 in phospholipase C activation. J. Biol. Chem. 271, 22146-22151 (1996).
48. Jäger, D. et al. Allosteric small molecules unveil a role of an extracellular E2/transmembrane helix 7 junction for G protein-coupled receptor activation. J. Biol. Chem. 282, 34968-34976 (2007).
49. Smith, N.J., Stoddart, L.A., Devine, N.M., Jenkins, L., Milligan, G. The action and mode of Binding of thiazolidinedione ligands at free fatty acid receptor 1. J.Biol.Chem. 284, 17527-17539 (2009)
50. Schröder, R. et al. The C-terminal tail of CRTH2 is a key molecular determinant that constrains Galphai and downstream signaling cascade activation. J. Biol. Chem. 284, 1324-1336 (2009).
27

Figure 1 (Kostenis)
0 1200 2400 3600
-100
0
100
200
-11-10-9-8-7-6-5-4
hybr
id 1
(log
M)
time (s)
resp
onse
(pm
)
0 1200 2400 3600
-200
-100
0
100 -4-5-6-7-8-9-10-11-12
orci
pren
alin
e (lo
g M
)
time (s)
resp
onse
(pm
)
0 1200 2400 3600
-100
0
100
200
300
400
-12-11-10-9-8-7-6-5-4
acet
ylch
olin
e (lo
g M
)
time (s)
resp
onse
(pm
)
0 1200 2400 3600
-25
0
25
50
75
100
125
hybr
id 1
(1 µ
M)control 1
+ YM
control 2
+ PTX
+ CTX
time (s)
rela
tive
resp
onse
(%)
0 1200 2400 3600
-125
-100
-75
-50
-25
0
25
control 1
+ YM
control 2
+ PTX
+ CTX
orci
pren
alin
e (3
0 nM
)
time (s)
rela
tive
resp
onse
(%)
0 1200 2400 3600
-50
0
50
100
150
200ac
etyl
chol
ine
(1 µ
M)
control 2
+ CTX
+ PTX
+ YM
control 1
time (s)
rela
tive
resp
onse
(%)
-12 -10 -8 -6 -4
-250
255075
100125
DMRGTPγS
hybrid 1 (log M)
rela
tive
resp
onse
(%)
-12 -10 -8 -6 -4
-250
255075
100125
DMRcAMP
orciprenaline (log M)
rela
tive
resp
onse
(%)
-12 -10 -8 -6 -4
-250
255075
100125
DMRIP1
acetylcholine (log M)
rela
tive
resp
onse
(%)
a
b c d
e f g
h i j
M2-CHO Gi
β2-CHO Gs
M3-CHO Gq
modulation of cell function
cAMP assay
IP1 assay
Gi Gs Gq G12/13
?
relocation of cellular constituents
GPCR
broadbandlight
wavelengthshift [pm]
change of optical densitycell layer
biosensor DMR signal
modulation of cell function
cAMP assay
IP1 assay
Gi Gs Gq G12/13
?
relocation of cellular constituents
GPCR
broadbandlight
wavelengthshift [pm]
change of optical densitycell layer
biosensor DMR signal

Figure 2 (Kostenis)
0 1200 2400 3600
-50
0
50
100
150
200-5-6-7-8-9-10-11
LPI (
log
M)
time (s)
resp
onse
(pm
)
0 1200 2400 3600
-25
0
25
50
75
100
125
vectorG13dn
LPI
time (s)
rela
tive
resp
onse
(%)
-12 -10 -8 -6 -4
-25
0
25
50
75
100
125
LPI (log M)
rela
tive
resp
onse
(%)
0 1200 2400 3600
-25
0
25
50
75
100
125
vectorG13dn
carbachol
time (s)
rela
tive
resp
onse
(%)
0 1200 2400 3600
-25
0
25
50
75
100
125
control+ PTX+ CTX+ YM
LPI (
100
nM)
- AlF+ AlFre
lativ
e re
spon
se (%
)
time (s)-10 -9 -8 -7 -6 -5 -4
-25
0
25
50
75
100
125
vectorG13dn
LPI (log M)
rela
tive
AUC
(%)
a
b
c
d
e
f
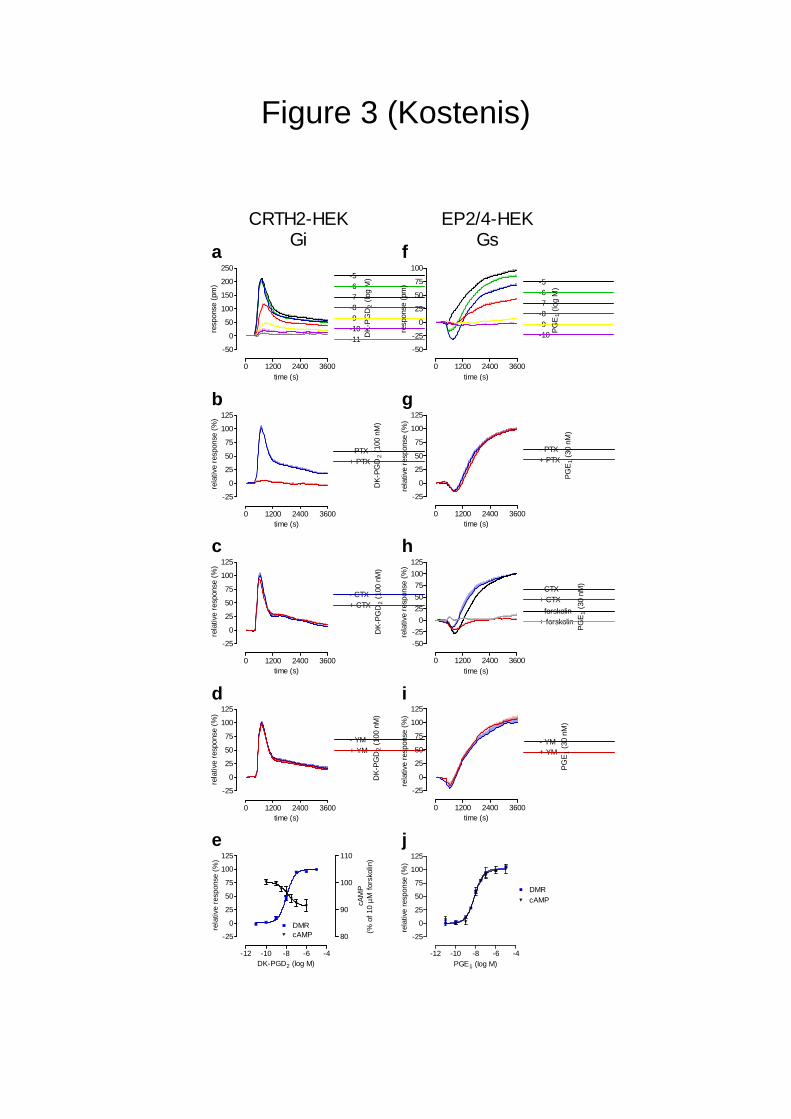
Figure 3 (Kostenis)
0 1200 2400 3600
-50
0
50
100
150
200
250
DK-
PGD
2 (lo
g M
)-5-6
-8-9
-11
-7
-10
time (s)
resp
onse
(pm
)
0 1200 2400 3600
-50
-25
0
25
50
75
100
-5-6-7-8-9-10 PG
E1
(log
M)
time (s)
resp
onse
(pm
)
0 1200 2400 3600
-25
0
25
50
75
100
125
- PTX+ PTX
DK-
PGD
2 (1
00 n
M)
rela
tive
resp
onse
(%)
time (s)0 1200 2400 3600
-25
0
25
50
75
100
125
- PTX+ PTX
PGE
1 (3
0 nM
)
rela
tive
resp
onse
(%)
time (s)
0 1200 2400 3600
-25
0
25
50
75
100
125
- CTX+ CTX
DK-
PGD
2 (1
00 n
M)
rela
tive
resp
onse
(%)
time (s)0 1200 2400 3600
-50-25
0255075
100125
- CTX+ CTX- forskolin+ forskolin
PGE
1 (3
0 nM
)
rela
tive
resp
onse
(%)
time (s)
0 1200 2400 3600
-25
0
25
50
75
100
125
- YM+ YM
DK-
PGD
2 (1
00 n
M)
rela
tive
resp
onse
(%)
time (s)0 1200 2400 3600
-25
0
25
50
75
100
125
- YM+ YM
PGE
1 (3
0 nM
)
rela
tive
resp
onse
(%)
time (s)
-12 -10 -8 -6 -4
-25
0
25
50
75
100
125
cAMPDMR
80
90
100
110
rela
tive
resp
onse
(%)
DK-PGD2 (log M)
cAM
P(%
of 1
0 µM
fors
kolin
)
-12 -10 -8 -6 -4
-25
0
25
50
75
100
125
DMRcAMP
rela
tive
resp
onse
(%)
PGE1 (log M)
a
b
c
e
d
f
g
h
i
j
CRTH2-HEKGi
EP2/4-HEKGs

Figure 4 (Kostenis)
0 1000 2000 3000
-100
0
100
200
300
400
500
-4.5-5-5.5-6
-7-8
-6.5
TUG
424
(log
M)
time (s)
resp
onse
(pm
)
0
500
1000
1500
2000
2500
buffer
TUG 424YM (nM) --- 300
(µM) --- ---300
3 3---
IP1
(arb
itrar
y un
its)
0 1200 2400 3600
-250
255075
100125150175
- PTX / - YM+ PTX+ YM+ PTX / + YM
time (s)
resp
onse
(pm
)
db
a c
-8 -7 -6 -5 -4
95.0
97.5
100.0
102.5
FFA1HEK
*****
*** ***
TUG 424 (log M)
cAM
P (%
of 5
µM fo
rsko
lin)
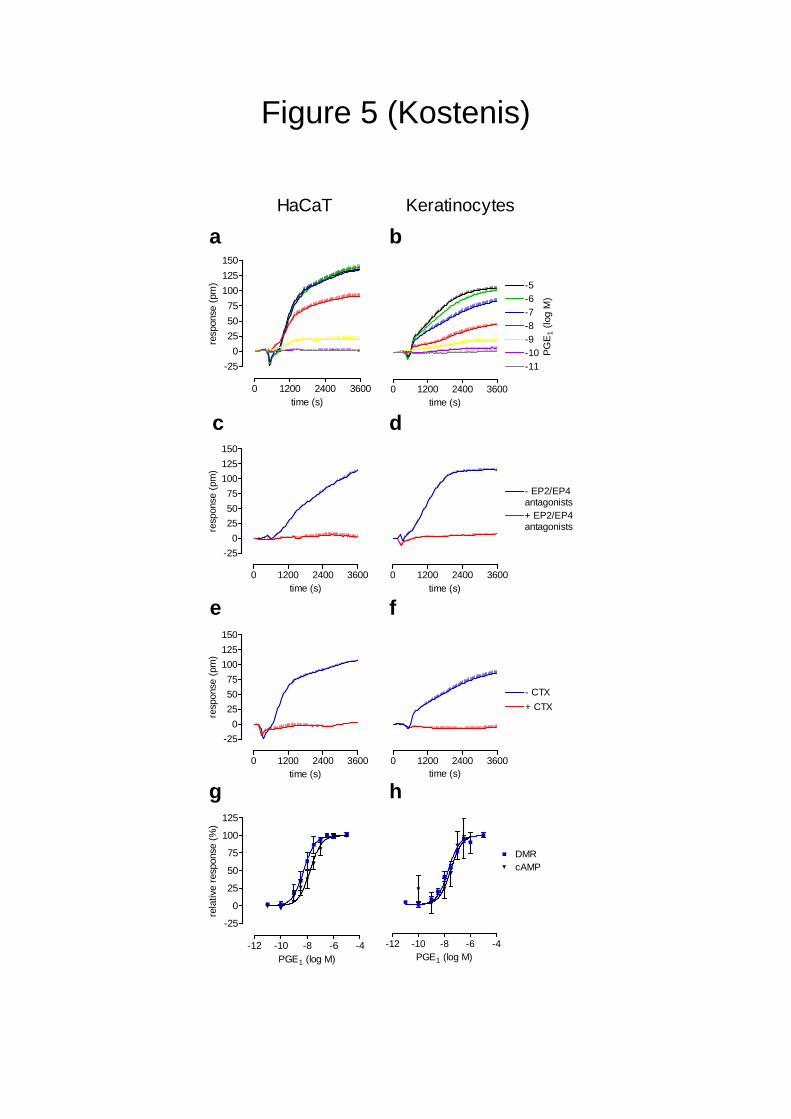
Figure 5 (Kostenis)
0 1200 2400 3600
-250
255075
100125150
time (s)
resp
onse
(pm
)
0 1200 2400 3600
-5-6-7-8-9-10-11
PGE
1 (lo
g M
)
time (s)
0 1200 2400 3600
-250
255075
100125150
time (s)
resp
onse
(pm
)
0 1200 2400 3600
+ EP2/EP4antagonists
- EP2/EP4antagonists
time (s)
0 1200 2400 3600
-250
255075
100125150
time (s)
resp
onse
(pm
)
0 1200 2400 3600
+ CTX- CTX
time (s)
-12 -10 -8 -6 -4
-25
0
25
50
75
100
125
PGE1 (log M)
rela
tive
resp
onse
(%)
-12 -10 -8 -6 -4
cAMPDMR
PGE1 (log M)
a b
c d
e f
g h
HaCaT Keratinocytes
Figure 6 (Kostenis)
0 1200 2400 3600
-100
0
100
200
300
400
+ PTX+ CTX+ PTX + CTX
control
acet
ylch
olin
e (1
00 µ
M)
time (s)
resp
onse
(pm
)
0 1200 2400 3600
-100
0
100
200
300
400
control
+ Fsk+ PTX + Fsk
+ PTX
acet
ylch
olin
e (1
00 µ
M)
time (s)
resp
onse
(pm
)
a b
090
100
110
120
130
acetylcholine (mM)CTX (ng/ml) --- --- 100 100
***
1--- --- 1
[35S]
GTP
γSin
corp
orat
ion
︵% o
f bas
al
︶
c
Supplementary Figure 1 (Kostenis)
0 1200 2400 3600
-100
-50
0
50
100
acetylcholine 100µM
hybrid 1 100µM
time (s)
resp
onse
(pm
)
0 1200 2400 3600
-100
-50
0
50
100
orciprenaline 100 µM
time (s)
resp
onse
(pm
)
Flp-InTM CHOa b CHO K1
Supplementary Figure 1: Lack of agonist-induced DMR in non-transfected CHO
cells.
(a, b) CHO Flp-InTM cells (left panel) or CHO K1 cells (right panel) were exposed to
the indicated agonists at maximally effective concentrations and wavelength shift
(ordinate) was measured. Shown are data (mean values + s.e.m.) from a
representative experiment. Similar findings were obtained in at least two independent
additional experiments.
1

Supplementary Figure 2 (Kostenis)
0 1200 2400 3600
-100
0
100
200
CTX 100 ng/ml
PTX 100 ng/ml
YM 300 nM
time (s)
resp
onse
(pm
)
Flp-InTM CHO
Supplementary Figure 2: The pathway modulators pertussis toxin, cholera
toxin and YM-254890 do not induce significant mass redistribution in native
CHO cells. Flp-InTM CHO cells were exposed to the indicated concentrations of
pathway modulators and wavelength shift was recorded over time. Shown are data
(mean values + s.e.m.) from a single experiment representative for at least three
such experiments.
2
Supplementary Figure 3 (Kostenis)
0 1200 2400 3600
-100
0
100
200
300
YM 1 nMYM 3 nMYM 10 nMYM 30 nMYM 100 nMYM 300 nM
control
acet
ylch
olin
e (1
µM
)time (s)
resp
onse
(pm
)
-10 -9 -8 -7 -6 -5
-25
0
25
50
75
100
125
acet
ylch
olin
e (1
µM
)
YM (log M)
rela
tive
resp
onse
(%)
a bM3-CHO M3-CHO
Supplementary Figure 3: Potency and efficacy of the Gq inhibitor YM-254890 to
quench the human muscarinic M3 receptor-mediated DMR-response.
Shown are recordings in CHO cells stably transfected with the human muscarinic M3
receptor cDNA (M3-CHO).
(a) Cells were pretreated with the indicated concentrations of the Gq inhibitor YM-
254890 (YM) and wavelength shift was monitored as a measure of receptor
activation by 1 µM acetylcholine. Representative data (mean + s.e.m.) of at least
three independent experiments.
(b) Concentration-effect-curve resulting from DMR signals at 3600 sec.: log IC50
value is: -7.60 ± 0.09 (top, bottom, slope factor fixed to 100%, 0% and -1,
respectively).
3

Supplementary Figure 4 (Kostenis)
0 1200 2400 3600
-50
0
50
100
150
200
250
-5-6-6.5-7-7.5 LP
I (lo
g M
)time (s)
resp
onse
(pm
)
0 1200 2400 3600
-50
0
50
100
150
200
250
-7-6.5-6-5.5-5
LPI (
log
M)
time (s)re
spon
se (p
m)
0
25
50
75
100
125
Fsk (µM)(µM)LPI
--- --------- --- 0.1 1
10 10 100.1 1
cAM
P(%
of 1
0 µM
fors
kolin
)
buffe
r
LPI (
0.1 µM
)
LPI (
1 µM)
ATP (100
µM)
-1000
100200300400500600
IP1
(arb
itrar
y un
its)
CHOAD-HEKa b
c dCHOIP1
CHOcAMP
Supplementary Figure 4: Comparison of LPI responsiveness in native HEK293
and CHO cells. Native AD-HEK cells (a) or native CHO cells (b) were challenged
with the indicated concentrations of LPI and wavelength shift over time was
monitored as a measure of receptor activation. Depicted are mean values + s.e.m. of
optical traces from one experiment, representative for three such experiments.
(c) LPI neither increased accumulation of cAMP nor inhibited forskolin-stimulated
cAMP production in native CHO cells. cAMP levels were determined with an HTRF®
cAMP assay kit as outlined in detail in the Methods section. Data shown are mean
values and s.e.m. of three independent experiments.
4
(d) LPI does not mobilize hydrolysis of inositol phosphates in native CHO cells as
opposed to the positive control ATP (agonist of endogenous Gq-sensitive nucleotide
P2Y receptors). IP1 levels were determined with an HTRF® IP1 assay kit as outlined
in detail in the Methods section. Data shown are mean values and s.e.m. of three
independent experiments.
5
Supplementary Figure 5 (Kostenis)
0 1200 2400 3600
-100
0
100
200
300
400
500
AlF 300 µM
time (s)
resp
onse
(pm
)
0 1200 2400 3600
-100
0
100
200
300
400
500
serum (10 %)
time (s)re
spon
se (p
m)
a b
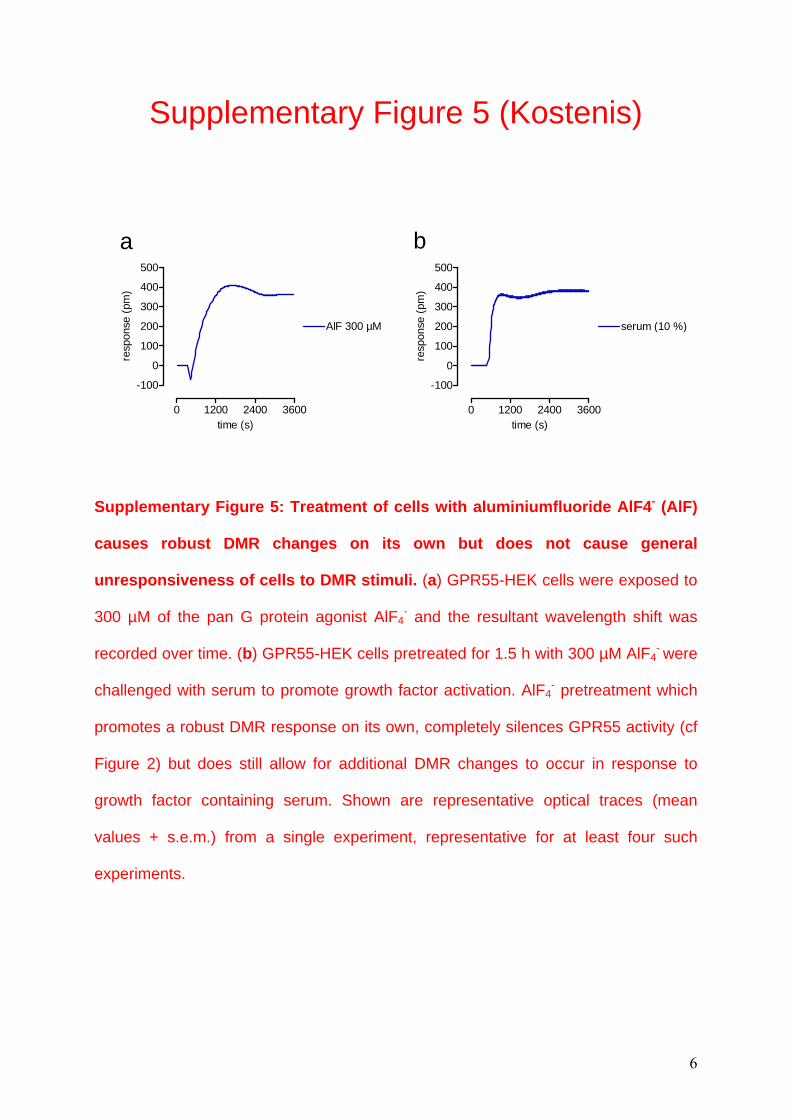
Supplementary Figure 5: Treatment of cells with aluminiumfluoride AlF4- (AlF)
causes robust DMR changes on its own but does not cause general
unresponsiveness of cells to DMR stimuli. (a) GPR55-HEK cells were exposed to
300 µM of the pan G protein agonist AlF4- and the resultant wavelength shift was
recorded over time. (b) GPR55-HEK cells pretreated for 1.5 h with 300 µM AlF4- were
challenged with serum to promote growth factor activation. AlF4- pretreatment which
promotes a robust DMR response on its own, completely silences GPR55 activity (cf
Figure 2) but does still allow for additional DMR changes to occur in response to
growth factor containing serum. Shown are representative optical traces (mean
values + s.e.m.) from a single experiment, representative for at least four such
experiments.
6

Supplementary Figure 6 (Kostenis)
-25
0
25
50
75
100
125
Fsk (µM)(µM)LPI
--- --------- --- 0.1 1
3 3 30.1 1
cAM
P(%
of 3
µM
fors
kolin
)
basa
l
LPI (0
.1µM)
LPI (1
µM)
Cch (1
00 µM
)
-100-50
050
100150200250
IP1
(arb
itrar
y un
its)
a bGPR55-HEKcAMP
GPR55-HEKIP1
Supplementary Figure 6: LPI does not alter the levels of the second
messengers cAMP and IP1 in GPR55-HEK cells.
(a) LPI neither increased accumulation of cAMP nor inhibited forskolin-stimulated
cAMP production in GPR55-HEK293 cells. cAMP levels were determined with an
HTRF® cAMP assay kit as outlined in detail in the Methods section. Data shown are
mean values and s.e.m. of three to four independent experiments.
(b) GPR55-HEK cells were stimulated with the indicated concentrations of
lysophosphatidylinositol (LPI) or carbachol (Cch) as a control (activator of
endogenously expressed muscarinic receptors) and the resulting accumulation of IP1
was detected with an HTRF®-IP1 assay kit as described in the Method section.
7

Supplementary Figure 7 (Kostenis)
GPR55-H
EK + ve
ctor
GPR55-H
EK + G13
dn
AD-HEK
0
25
50
75
100
125Ab
sorb
ance
(450
nm
)(%
of c
ontro
l)
Supplementary Figure 7: Coexpression of G13dn does not impact cell surface
expression of GPR55. AD-HEK293 cells stably expressing GPR55 (GPR55-HEK) or
not (AD-HEK) were transiently transfected with G13dn or pcDNA3.1 control plasmid
and surface expression quantified by ELISA as described in the Method section.
Absorbance of GPR55-HEK cells transfected with pcDNA3.1 vector DNA was set
100%. Data shown are mean values + s.e.m. of three independent experiments each
performed in triplicate.
8
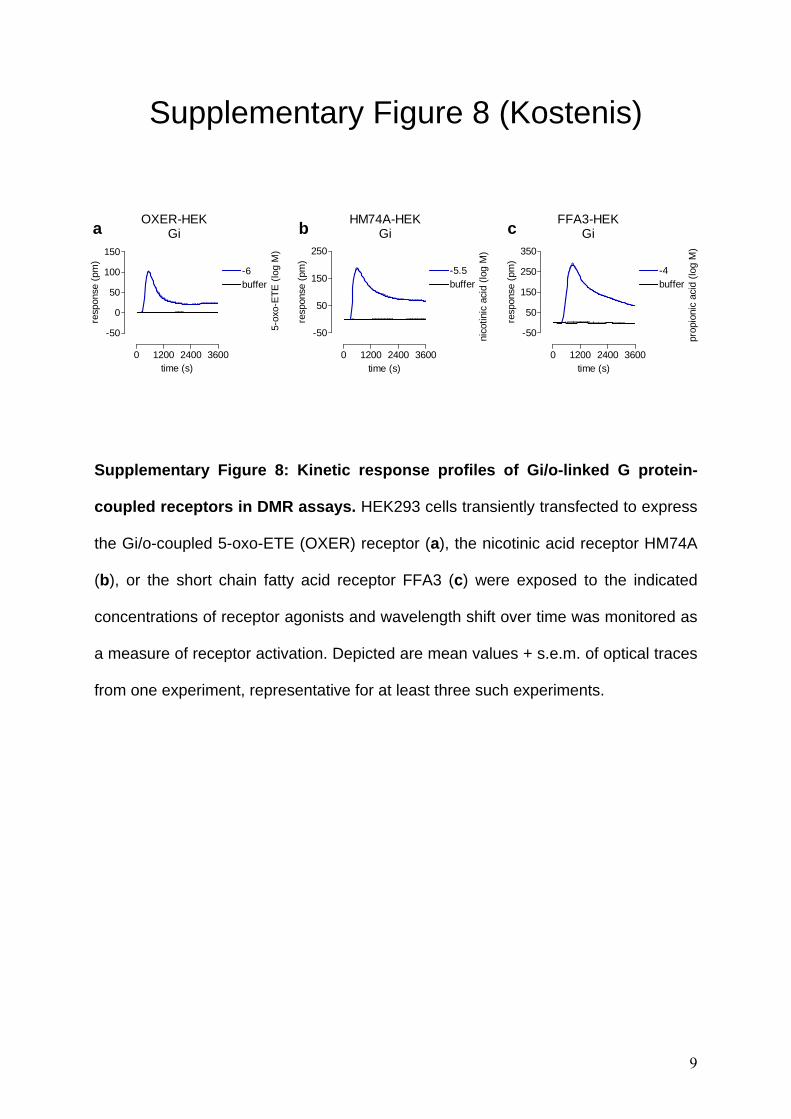
Supplementary Figure 8 (Kostenis)
0 1200 2400 3600
-50
0
50
100
150
-6buffer
5-ox
o-ET
E (lo
g M
)
time (s)
resp
onse
(pm
)
0 1200 2400 3600
-50
50
150
250
-5.5buffer
nico
tinic
aci
d (lo
g M
)
time (s)
resp
onse
(pm
)
0 1200 2400 3600
-50
50
150
250
350
-4buffer
prop
ioni
c ac
id (l
og M
)
time (s)
resp
onse
(pm
)
OXER-HEKGi
HM74A-HEKGi
FFA3-HEKGia b c
Supplementary Figure 8: Kinetic response profiles of Gi/o-linked G protein-
coupled receptors in DMR assays. HEK293 cells transiently transfected to express
the Gi/o-coupled 5-oxo-ETE (OXER) receptor (a), the nicotinic acid receptor HM74A
(b), or the short chain fatty acid receptor FFA3 (c) were exposed to the indicated
concentrations of receptor agonists and wavelength shift over time was monitored as
a measure of receptor activation. Depicted are mean values + s.e.m. of optical traces
from one experiment, representative for at least three such experiments.
9

Supplementary Figure 9 (Kostenis)
0 1200 2400 3600
-100
0
100
200
orciprenaline 10 µM+ propranolol 10 µM
orciprenaline 10 µM
time (s)
resp
onse
(pm
)
0 1200 2400 3600
-100
0
100
200
300
400
500
carbachol 100 µMcarbachol 100 µM+ propranolol 10 µM
time (s)
resp
onse
(pm
)
a bHEK 293 HEK 293
Supplementary Figure 9: Kinetic response profile of the adrenergic β2 receptor
endogenously expressed in HEK293 cells. (a) HEK293 cells were exposed to 10
µM of the β2 agonist orciprenaline and wavelength shift over time was monitored as a
measure of receptor activation. The orciprenalin trace can be specifically inhibited by
the β receptor antagonist propranolol. (b) Propranolol does not diminish the DMR
response triggered upon stimulation of endogenous muscarinic receptors with
carbachol, confirming its specific inhibitory action. Depicted are mean values + s.e.m.
of optical traces from one experiment, representative for four such experiments.
10
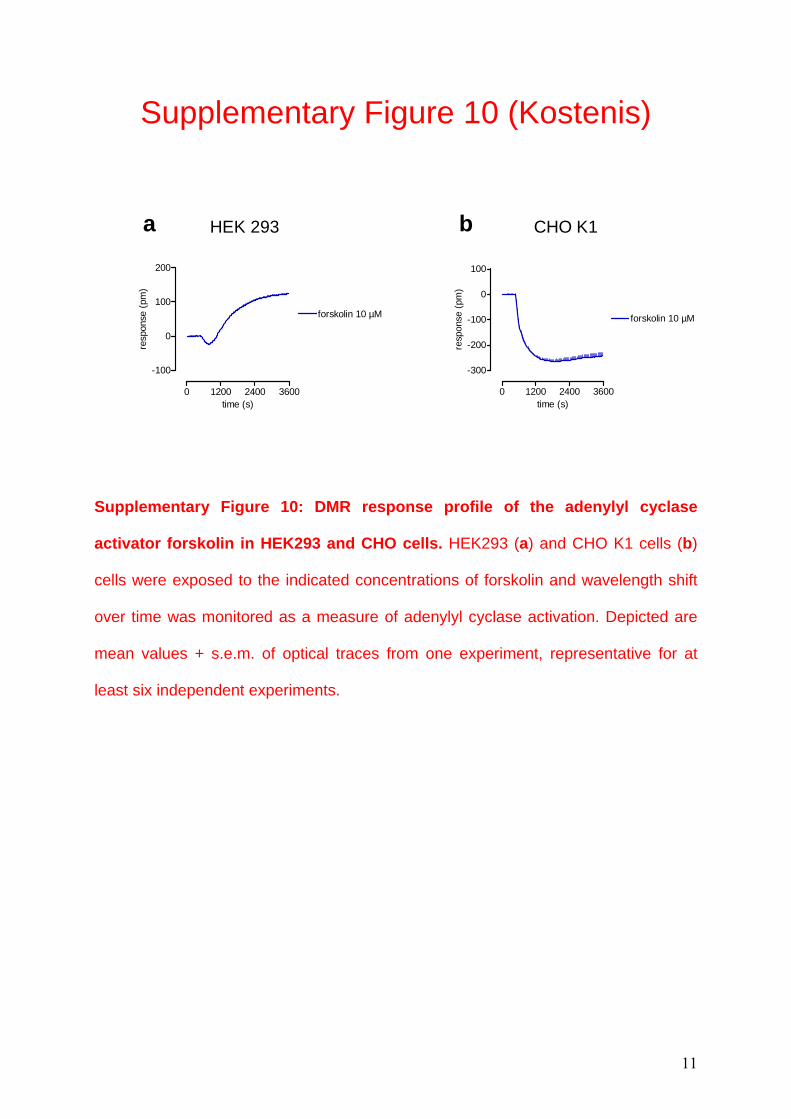
Supplementary Figure 10 (Kostenis)
0 1200 2400 3600
-100
0
100
200
forskolin 10 µM
time (s)
resp
onse
(pm
)
0 1200 2400 3600
-300
-200
-100
0
100
forskolin 10 µM
time (s)
resp
onse
(pm
)
a bHEK 293 CHO K1
Supplementary Figure 10: DMR response profile of the adenylyl cyclase
activator forskolin in HEK293 and CHO cells. HEK293 (a) and CHO K1 cells (b)
cells were exposed to the indicated concentrations of forskolin and wavelength shift
over time was monitored as a measure of adenylyl cyclase activation. Depicted are
mean values + s.e.m. of optical traces from one experiment, representative for at
least six independent experiments.
11
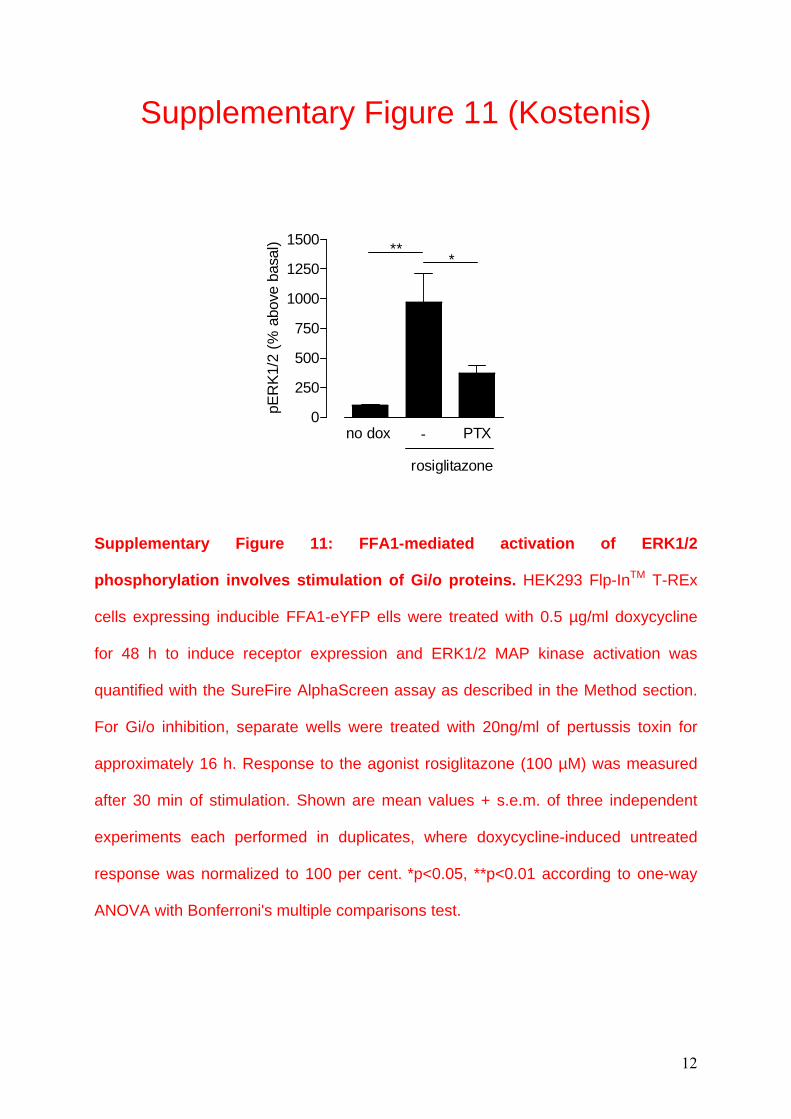
Supplementary Figure 11 (Kostenis)
0
250
500
750
1000
1250
1500 ***
no dox - PTX
rosiglitazone
pER
K1/2
(% a
bove
bas
al)
Supplementary Figure 11: FFA1-mediated activation of ERK1/2
phosphorylation involves stimulation of Gi/o proteins. HEK293 Flp-InTM T-REx
cells expressing inducible FFA1-eYFP ells were treated with 0.5 µg/ml doxycycline
for 48 h to induce receptor expression and ERK1/2 MAP kinase activation was
quantified with the SureFire AlphaScreen assay as described in the Method section.
For Gi/o inhibition, separate wells were treated with 20ng/ml of pertussis toxin for
approximately 16 h. Response to the agonist rosiglitazone (100 µM) was measured
after 30 min of stimulation. Shown are mean values + s.e.m. of three independent
experiments each performed in duplicates, where doxycycline-induced untreated
response was normalized to 100 per cent. *p<0.05, **p<0.01 according to one-way
ANOVA with Bonferroni's multiple comparisons test.
12
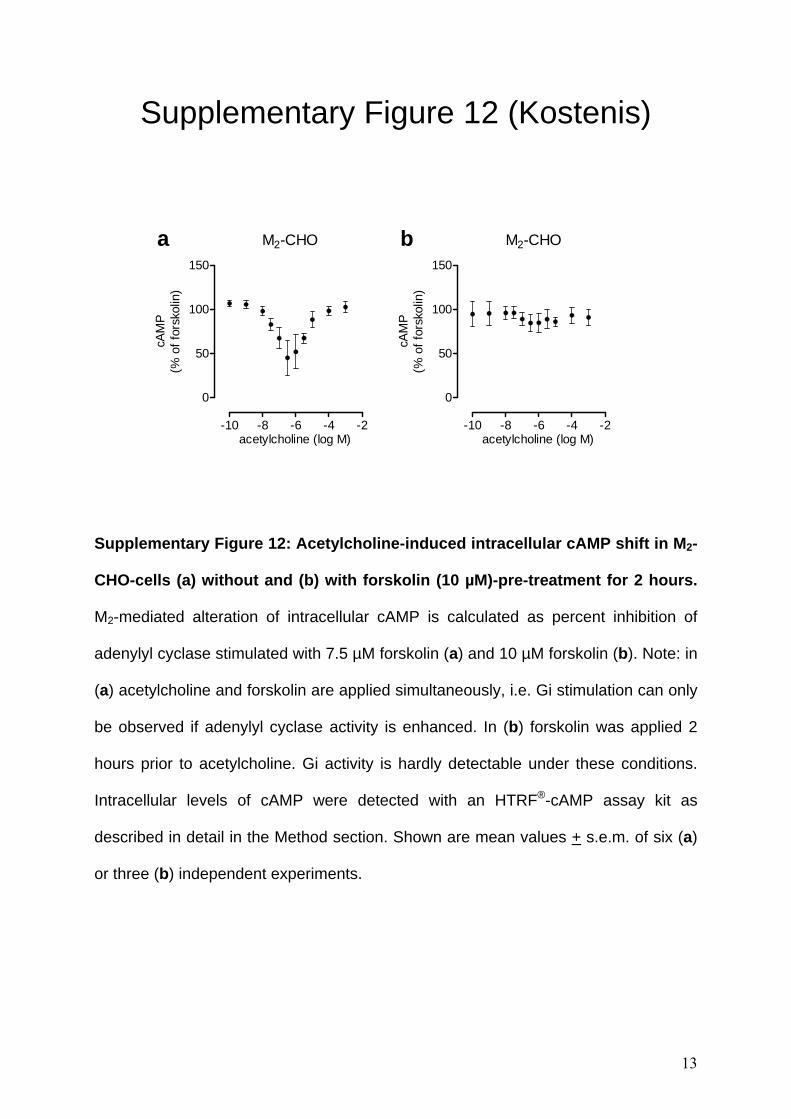
Supplementary Figure 12 (Kostenis)
-10 -8 -6 -4 -2
0
50
100
150
acetylcholine (log M)
cAM
P(%
of f
orsk
olin
)
-10 -8 -6 -4 -2
0
50
100
150
acetylcholine (log M)
cAM
P(%
of f
orsk
olin
)
a bM2-CHO M2-CHO
Supplementary Figure 12: Acetylcholine-induced intracellular cAMP shift in M2-
CHO-cells (a) without and (b) with forskolin (10 µM)-pre-treatment for 2 hours.
M2-mediated alteration of intracellular cAMP is calculated as percent inhibition of
adenylyl cyclase stimulated with 7.5 µM forskolin (a) and 10 µM forskolin (b). Note: in
(a) acetylcholine and forskolin are applied simultaneously, i.e. Gi stimulation can only
be observed if adenylyl cyclase activity is enhanced. In (b) forskolin was applied 2
hours prior to acetylcholine. Gi activity is hardly detectable under these conditions.
Intracellular levels of cAMP were detected with an HTRF®-cAMP assay kit as
described in detail in the Method section. Shown are mean values + s.e.m. of six (a)
or three (b) independent experiments.
13
MATERIAL AND METHODS SUPPLEMENTARY MATERIAL (KOSTENIS)
Chemicals:
Nicotinic acid and propionic acid were purchased from Sigma-Aldrich (Taufkirchen,
Germany) and 5-oxo-6E,8Z,11Z,14Z-eicosatetraenoic acid (5-oxo-ETE) from Cayman
(distributed by Biozol, Eching, Germany).
Plasmid origin:
The high-affinity nicotinic acid receptor HM74A1 was PCR amplified from human adipose
tissue cDNA and inserted into the pcDNA3.1(+) expression vector via 5’ HindIII and 3’EcoRI
sites. The receptor for 5-oxo-eicosatetraenoic acid (OXE) receptor2 and the FFA3 receptor3
were cloned from human leukocyte cDNA and inserted via 5′ HindIII and 3′ EcoRI into
pcDNA3.1(+). Correctness of the constructs was verified by restriction endonuclease
digestion and sequencing in both directions (MWG Biotech, Ebersberg, Germany). 3xHA-
GPR55 cDNA was obtained from the UMR cDNA resource center.
Cell culture and transient transfection of HEK293 cells:
HEK293 cells were cultured as described in Material and Methods. 24 h before transfection
cells were plated at a density of 4 million cells/10 cm2 dish. Cells were transfected using a
calcium phosphate-DNA co-precipitation method, where 20 μg of cDNA was diluted in 500
μl of CaCl2 solution (10 mM Tris base, 1 mM EDTA, pH 8, and 250 mM CaCl2) and
dropwise added to 500 μl of HBS (280 mM NaCl, 50 mM HEPES, and 1.5 mM sodium
phosphate). The precipitation was incubated for 45 min at room temperature and was added to
the cells in 10 ml of fresh culture medium and was incubated at 37°C in a 5% CO2-humidified
atmosphere, 5 h later medium was changed. One day after transfection, the cells were
transferred to fibronectin coated Epic® 384 microwell plates at a density of 15.000 cells/well
and cultured in growth media for additional 18-24 h. Cells were then subjected to functional
analysis using dynamic mass redistribution (DMR) as described in Material and Methods.
Cell culture of CHO K1 and CHO Flp-InTM cells
CHO cell lines were cultured in Ham´s nutrient mixture F-12 (HAM-F12) (Sigma,
Taufkirchen, Germany) supplemented with 10 % (v/v) fetal calf serum (FCS), 100 U/ml
penicillin, 100 µg/ml streptomycin, and 1mM L-glutamine.
14

ELISA
Determination of cell-surface expression levels of GPR55 containing an N-terminal triple
HA-tag was performed in stable GPR55-HEK293 cells transiently cotransfected to express
either G13dn or pcDNA3.1 control plasmid. Twenty-four hours after transfection, cells were
seeded in poly-D-lysine-coated 48-well tissue-culture plates at a density of 50,000 cells/well.
Approximately 48 h after transfection, cells were washed once in minimum essential medium
+ 0.1% BSA. Cells were then fixed with 4% paraformaldehyde, washed three times with PBS,
and blocked with blocking buffer (3% dry milk in 50 mM Tris-HCl, pH 7.5). Hereafter, cells
were incubated with the primary monoclonal mouse anti-HA antibody (Sigma-Aldrich)
diluted in blocking buffer at 1:400 for 1 h at room temperature followed by three washes and
a 1-h incubation with secondary antibody (1:1000, goat anti-mouse conjugated to horseradish
peroxidase, Sigma-Aldrich) in blocking buffer. After three final washes, the secondary
antibody was detected and quantified after adding the colorimetric horseradish peroxidase
substrate 3,3′,5,5′-tetramethylbenzidine (Sigma-Aldrich). When adequate color change was
reached, the reaction was terminated by the addition of 0.5 M H2SO4. Samples were then
transferred to a 96-well plate, and colorimetric readings were obtained at optical density of
450 nM on a Tecan Sunrise absorbance reader (Tecan, Maennedorf, Switzerland). All
experiments were performed in triplicate.
ERK1/2 phosphorylation assays
FFA1-eYFP mediated activation of ERK 1/2 was assessed using the SureFire ERK1/2
AlphaScreen assay from Perkin Elmer (Buckinghamshire, UK) and read on a BMG Labtech
PheraSTAR FS plate reader (Buckinghamshire, UK), as described previously4. Briefly,
HEK293 Flp-InTM T-REx cells expressing inducible FFA1-eYFP were seeded in poly-D-
lysine coated 96-well culture plates at 40,000 cells per well and treated with 0.5 ug/ml
doxycycline to induce receptor expression as required. The night before assay, appropriate
wells were incubated with 20 ng/ml Pertussis toxin, and all cells were serum starved in cell
culture medium lacking dialyzed fetal bovine serum for 2 hours on the day of assay. After 30
min of agonist stimulation, ERK1/2 activation was terminated by aspiration of assay medium
and immediate addition of lysis buffer provided with the kit. Phosphorylated ERK1/2 was
then quantified according to manufacturer's instructions.
15

16
REFERENCES SUPPLEMENTAL MATERIAL (KOSTENIS)
1. Wise, A. et al. Molecular identification of high and low affinity receptors for nicotinic acid. J Biol Chem 278, 9869-9874 (2003).
2. Hosoi, T. et al. Identification of a novel human eicosanoid receptor coupled to G(i/o). J Biol Chem 277, 31459-31465 (2002).
3. Brown, A.J. et al. The Orphan G protein-coupled receptors GPR41 and GPR43 are activated by propionate and other short chain carboxylic acids. J Biol Chem 278, 11312-11319 (2003).
4. Smith, N.J. et al. The mode of binding of thiazolidinedione ligands at free fatty acid receptor 1. J Biol Chem 284, 17527-17539 (2009).