Pre-analytical and analytical variables affecting the measurement of plasma-derived microparticle...
12
Pre-analytical and Analytical Variables Affecting the Measurement of Plasma-Derived Microparticle Tissue Factor Activity RD Lee 1 , DA Barcel 2 , JC Williams 1 , JG Wang 1 , JC Boles 1 , DA Manly 3 , NS Key 1 , and N Mackman 1 1 Division of Hematology/Oncology, Department of Medicine, University of North Carolina at Chapel Hill 2 East Tennessee State University James H. Quillen College of Medicine, Johnson City, Tennessee 37614, USA 3 Brody School of Medicine, East Carolina University Abstract Introduction—Elevated levels of tissue factor positive (TF + ) microparticles (MPs) are observed in plasma from a variety of patients with an increased risk of thrombosis. We and others have described the measurement of TF activity in MPs isolated from plasma. The aim of this study was to investigate the effects of pre-analytical and analytical variables on TF activity of MPs isolated from blood of healthy volunteers treated ex vivo with or without bacterial lipopolysaccharide. Materials and Methods—We evaluated the following parameters: use of different centrifugation speeds to isolate the MPs; comparison of TF activity of MPs isolated from platelet poor plasma versus platelet free plasma; effect of freeze/thaw on MP TF activity; and comparison of the MP TF activity assay with the measurement of TF protein by ELISA or flow cytometry. Results—MPs prepared from platelet poor plasma by centrifugation at 20,000 × g or 100,000 × g for 15 minutes had similar levels of TF activity. However, significantly less TF activity was found in MPs isolated from platelet free plasma compared with platelet poor plasma. Interestingly, freeze/thawing of the plasma showed donor to donor variation in MP TF activity, with a moderate increase in some individuals. Conclusion—TF + MPs can be quantitatively isolated from platelet poor or platelet free plasma by centrifugation at 20,000 × g for 15 minutes. Measurement of MP TF activity in plasma can be used to detect a prothrombotic state in patients with various diseases. Keywords Microparticle; tissue factor; functional assay © 2011 Elsevier Ltd. All rights reserved Correspondence: Nigel Mackman, PhD Division of Hematology/Oncology Department of Medicine University of North Carolina at Chapel Hill Chapel Hill, North Carolina Tel 919 843 3961 Fax 919 966 7639 [email protected]. Publisher's Disclaimer: This is a PDF file of an unedited manuscript that has been accepted for publication. As a service to our customers we are providing this early version of the manuscript. The manuscript will undergo copyediting, typesetting, and review of the resulting proof before it is published in its final citable form. Please note that during the production process errors may be discovered which could affect the content, and all legal disclaimers that apply to the journal pertain. NIH Public Access Author Manuscript Thromb Res. Author manuscript; available in PMC 2013 January 1. Published in final edited form as: Thromb Res. 2012 January ; 129(1): 80–85. doi:10.1016/j.thromres.2011.06.004. NIH-PA Author Manuscript NIH-PA Author Manuscript NIH-PA Author Manuscript
Transcript of Pre-analytical and analytical variables affecting the measurement of plasma-derived microparticle...

Pre-analytical and Analytical Variables Affecting theMeasurement of Plasma-Derived Microparticle Tissue FactorActivity
RD Lee1, DA Barcel2, JC Williams1, JG Wang1, JC Boles1, DA Manly3, NS Key1, and NMackman1
1Division of Hematology/Oncology, Department of Medicine, University of North Carolina atChapel Hill2East Tennessee State University James H. Quillen College of Medicine, Johnson City,Tennessee 37614, USA3Brody School of Medicine, East Carolina University
AbstractIntroduction—Elevated levels of tissue factor positive (TF+) microparticles (MPs) are observedin plasma from a variety of patients with an increased risk of thrombosis. We and others havedescribed the measurement of TF activity in MPs isolated from plasma. The aim of this study wasto investigate the effects of pre-analytical and analytical variables on TF activity of MPs isolatedfrom blood of healthy volunteers treated ex vivo with or without bacterial lipopolysaccharide.
Materials and Methods—We evaluated the following parameters: use of differentcentrifugation speeds to isolate the MPs; comparison of TF activity of MPs isolated from plateletpoor plasma versus platelet free plasma; effect of freeze/thaw on MP TF activity; and comparisonof the MP TF activity assay with the measurement of TF protein by ELISA or flow cytometry.
Results—MPs prepared from platelet poor plasma by centrifugation at 20,000 × g or 100,000 × gfor 15 minutes had similar levels of TF activity. However, significantly less TF activity was foundin MPs isolated from platelet free plasma compared with platelet poor plasma. Interestingly,freeze/thawing of the plasma showed donor to donor variation in MP TF activity, with a moderateincrease in some individuals.
Conclusion—TF+ MPs can be quantitatively isolated from platelet poor or platelet free plasmaby centrifugation at 20,000 × g for 15 minutes. Measurement of MP TF activity in plasma can beused to detect a prothrombotic state in patients with various diseases.
KeywordsMicroparticle; tissue factor; functional assay
© 2011 Elsevier Ltd. All rights reservedCorrespondence: Nigel Mackman, PhD Division of Hematology/Oncology Department of Medicine University of North Carolina atChapel Hill Chapel Hill, North Carolina Tel 919 843 3961 Fax 919 966 7639 [email protected]'s Disclaimer: This is a PDF file of an unedited manuscript that has been accepted for publication. As a service to ourcustomers we are providing this early version of the manuscript. The manuscript will undergo copyediting, typesetting, and review ofthe resulting proof before it is published in its final citable form. Please note that during the production process errors may bediscovered which could affect the content, and all legal disclaimers that apply to the journal pertain.
NIH Public AccessAuthor ManuscriptThromb Res. Author manuscript; available in PMC 2013 January 1.
Published in final edited form as:Thromb Res. 2012 January ; 129(1): 80–85. doi:10.1016/j.thromres.2011.06.004.
NIH
-PA Author Manuscript
NIH
-PA Author Manuscript
NIH
-PA Author Manuscript
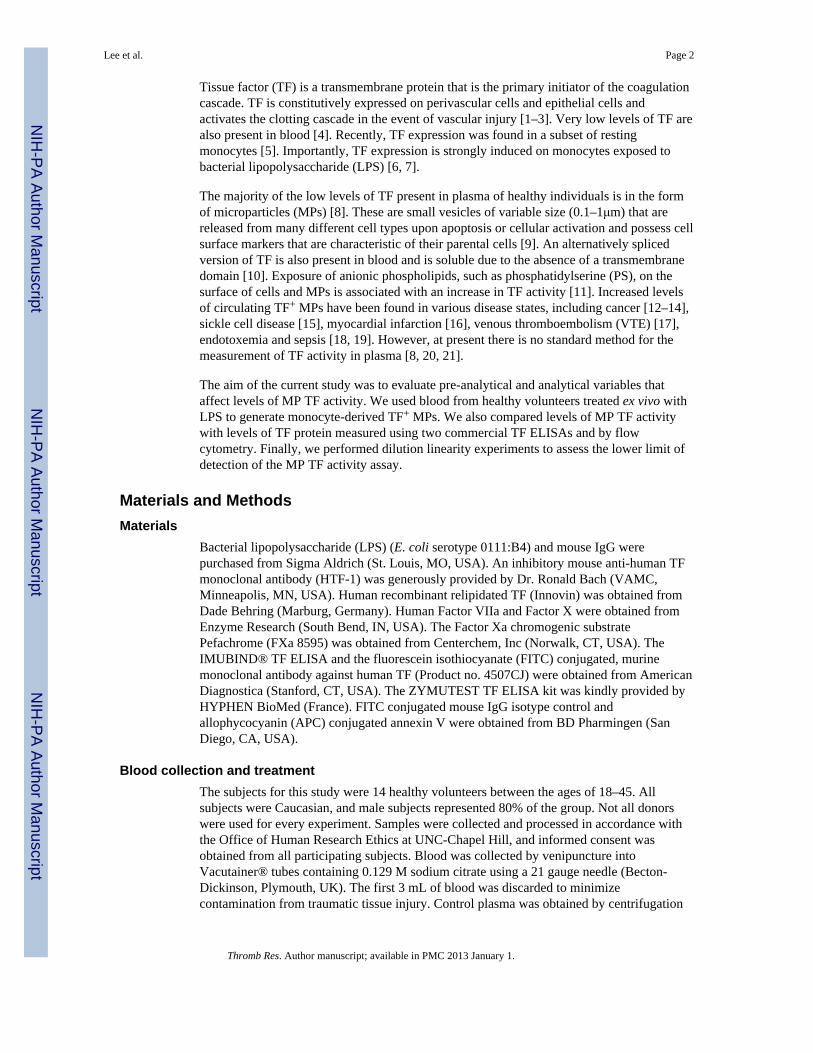
Tissue factor (TF) is a transmembrane protein that is the primary initiator of the coagulationcascade. TF is constitutively expressed on perivascular cells and epithelial cells andactivates the clotting cascade in the event of vascular injury [1–3]. Very low levels of TF arealso present in blood [4]. Recently, TF expression was found in a subset of restingmonocytes [5]. Importantly, TF expression is strongly induced on monocytes exposed tobacterial lipopolysaccharide (LPS) [6, 7].
The majority of the low levels of TF present in plasma of healthy individuals is in the formof microparticles (MPs) [8]. These are small vesicles of variable size (0.1–1μm) that arereleased from many different cell types upon apoptosis or cellular activation and possess cellsurface markers that are characteristic of their parental cells [9]. An alternatively splicedversion of TF is also present in blood and is soluble due to the absence of a transmembranedomain [10]. Exposure of anionic phospholipids, such as phosphatidylserine (PS), on thesurface of cells and MPs is associated with an increase in TF activity [11]. Increased levelsof circulating TF+ MPs have been found in various disease states, including cancer [12–14],sickle cell disease [15], myocardial infarction [16], venous thromboembolism (VTE) [17],endotoxemia and sepsis [18, 19]. However, at present there is no standard method for themeasurement of TF activity in plasma [8, 20, 21].
The aim of the current study was to evaluate pre-analytical and analytical variables thataffect levels of MP TF activity. We used blood from healthy volunteers treated ex vivo withLPS to generate monocyte-derived TF+ MPs. We also compared levels of MP TF activitywith levels of TF protein measured using two commercial TF ELISAs and by flowcytometry. Finally, we performed dilution linearity experiments to assess the lower limit ofdetection of the MP TF activity assay.
Materials and MethodsMaterials
Bacterial lipopolysaccharide (LPS) (E. coli serotype 0111:B4) and mouse IgG werepurchased from Sigma Aldrich (St. Louis, MO, USA). An inhibitory mouse anti-human TFmonoclonal antibody (HTF-1) was generously provided by Dr. Ronald Bach (VAMC,Minneapolis, MN, USA). Human recombinant relipidated TF (Innovin) was obtained fromDade Behring (Marburg, Germany). Human Factor VIIa and Factor X were obtained fromEnzyme Research (South Bend, IN, USA). The Factor Xa chromogenic substratePefachrome (FXa 8595) was obtained from Centerchem, Inc (Norwalk, CT, USA). TheIMUBIND® TF ELISA and the fluorescein isothiocyanate (FITC) conjugated, murinemonoclonal antibody against human TF (Product no. 4507CJ) were obtained from AmericanDiagnostica (Stanford, CT, USA). The ZYMUTEST TF ELISA kit was kindly provided byHYPHEN BioMed (France). FITC conjugated mouse IgG isotype control andallophycocyanin (APC) conjugated annexin V were obtained from BD Pharmingen (SanDiego, CA, USA).
Blood collection and treatmentThe subjects for this study were 14 healthy volunteers between the ages of 18–45. Allsubjects were Caucasian, and male subjects represented 80% of the group. Not all donorswere used for every experiment. Samples were collected and processed in accordance withthe Office of Human Research Ethics at UNC-Chapel Hill, and informed consent wasobtained from all participating subjects. Blood was collected by venipuncture intoVacutainer® tubes containing 0.129 M sodium citrate using a 21 gauge needle (Becton-Dickinson, Plymouth, UK). The first 3 mL of blood was discarded to minimizecontamination from traumatic tissue injury. Control plasma was obtained by centrifugation
Lee et al. Page 2
Thromb Res. Author manuscript; available in PMC 2013 January 1.
NIH
-PA Author Manuscript
NIH
-PA Author Manuscript
NIH
-PA Author Manuscript
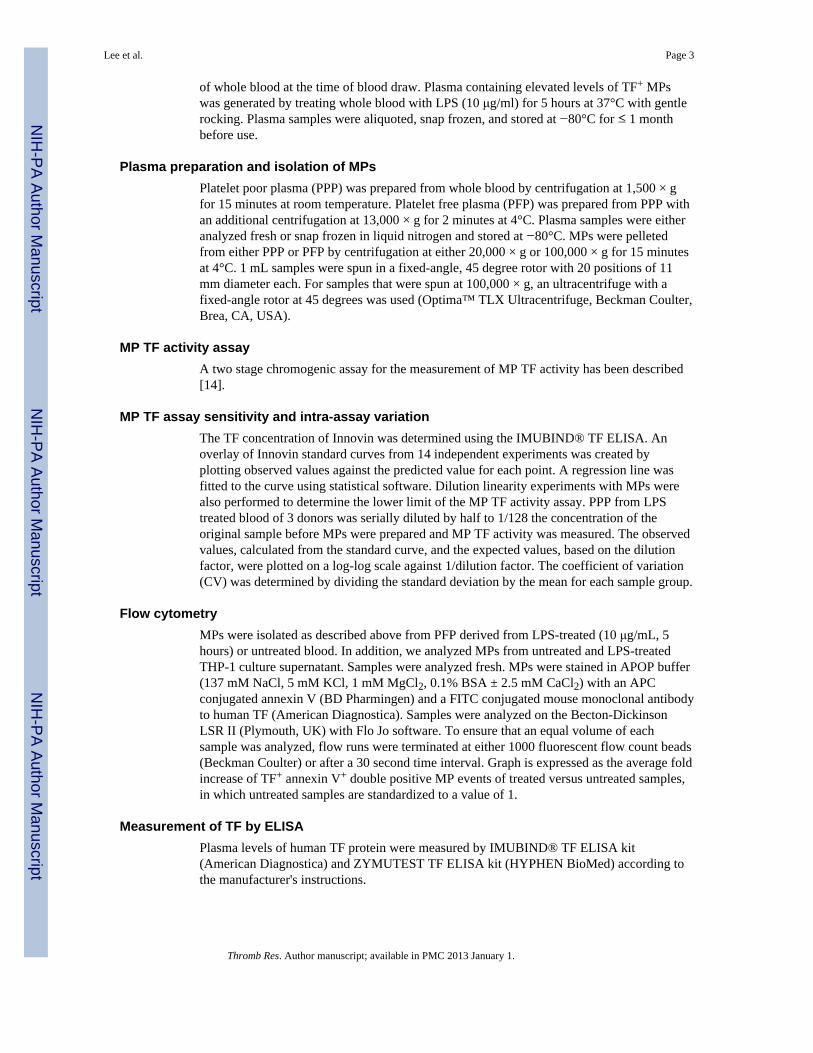
of whole blood at the time of blood draw. Plasma containing elevated levels of TF+ MPswas generated by treating whole blood with LPS (10 μg/ml) for 5 hours at 37°C with gentlerocking. Plasma samples were aliquoted, snap frozen, and stored at −80°C for ≤ 1 monthbefore use.
Plasma preparation and isolation of MPsPlatelet poor plasma (PPP) was prepared from whole blood by centrifugation at 1,500 × gfor 15 minutes at room temperature. Platelet free plasma (PFP) was prepared from PPP withan additional centrifugation at 13,000 × g for 2 minutes at 4°C. Plasma samples were eitheranalyzed fresh or snap frozen in liquid nitrogen and stored at −80°C. MPs were pelletedfrom either PPP or PFP by centrifugation at either 20,000 × g or 100,000 × g for 15 minutesat 4°C. 1 mL samples were spun in a fixed-angle, 45 degree rotor with 20 positions of 11mm diameter each. For samples that were spun at 100,000 × g, an ultracentrifuge with afixed-angle rotor at 45 degrees was used (Optima™ TLX Ultracentrifuge, Beckman Coulter,Brea, CA, USA).
MP TF activity assayA two stage chromogenic assay for the measurement of MP TF activity has been described[14].
MP TF assay sensitivity and intra-assay variationThe TF concentration of Innovin was determined using the IMUBIND® TF ELISA. Anoverlay of Innovin standard curves from 14 independent experiments was created byplotting observed values against the predicted value for each point. A regression line wasfitted to the curve using statistical software. Dilution linearity experiments with MPs werealso performed to determine the lower limit of the MP TF activity assay. PPP from LPStreated blood of 3 donors was serially diluted by half to 1/128 the concentration of theoriginal sample before MPs were prepared and MP TF activity was measured. The observedvalues, calculated from the standard curve, and the expected values, based on the dilutionfactor, were plotted on a log-log scale against 1/dilution factor. The coefficient of variation(CV) was determined by dividing the standard deviation by the mean for each sample group.
Flow cytometryMPs were isolated as described above from PFP derived from LPS-treated (10 μg/mL, 5hours) or untreated blood. In addition, we analyzed MPs from untreated and LPS-treatedTHP-1 culture supernatant. Samples were analyzed fresh. MPs were stained in APOP buffer(137 mM NaCl, 5 mM KCl, 1 mM MgCl2, 0.1% BSA ± 2.5 mM CaCl2) with an APCconjugated annexin V (BD Pharmingen) and a FITC conjugated mouse monoclonal antibodyto human TF (American Diagnostica). Samples were analyzed on the Becton-DickinsonLSR II (Plymouth, UK) with Flo Jo software. To ensure that an equal volume of eachsample was analyzed, flow runs were terminated at either 1000 fluorescent flow count beads(Beckman Coulter) or after a 30 second time interval. Graph is expressed as the average foldincrease of TF+ annexin V+ double positive MP events of treated versus untreated samples,in which untreated samples are standardized to a value of 1.
Measurement of TF by ELISAPlasma levels of human TF protein were measured by IMUBIND® TF ELISA kit(American Diagnostica) and ZYMUTEST TF ELISA kit (HYPHEN BioMed) according tothe manufacturer's instructions.
Lee et al. Page 3
Thromb Res. Author manuscript; available in PMC 2013 January 1.
NIH
-PA Author Manuscript
NIH
-PA Author Manuscript
NIH
-PA Author Manuscript
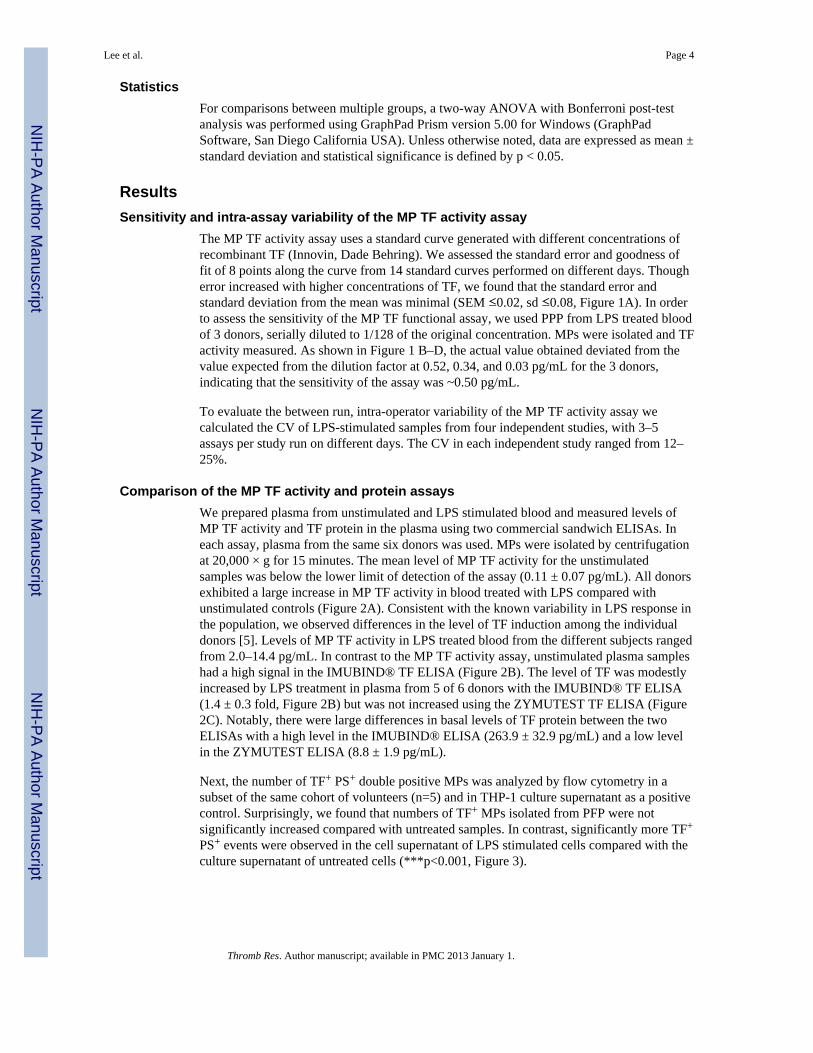
StatisticsFor comparisons between multiple groups, a two-way ANOVA with Bonferroni post-testanalysis was performed using GraphPad Prism version 5.00 for Windows (GraphPadSoftware, San Diego California USA). Unless otherwise noted, data are expressed as mean ±standard deviation and statistical significance is defined by p < 0.05.
ResultsSensitivity and intra-assay variability of the MP TF activity assay
The MP TF activity assay uses a standard curve generated with different concentrations ofrecombinant TF (Innovin, Dade Behring). We assessed the standard error and goodness offit of 8 points along the curve from 14 standard curves performed on different days. Thougherror increased with higher concentrations of TF, we found that the standard error andstandard deviation from the mean was minimal (SEM ≤0.02, sd ≤0.08, Figure 1A). In orderto assess the sensitivity of the MP TF functional assay, we used PPP from LPS treated bloodof 3 donors, serially diluted to 1/128 of the original concentration. MPs were isolated and TFactivity measured. As shown in Figure 1 B–D, the actual value obtained deviated from thevalue expected from the dilution factor at 0.52, 0.34, and 0.03 pg/mL for the 3 donors,indicating that the sensitivity of the assay was ~0.50 pg/mL.
To evaluate the between run, intra-operator variability of the MP TF activity assay wecalculated the CV of LPS-stimulated samples from four independent studies, with 3–5assays per study run on different days. The CV in each independent study ranged from 12–25%.
Comparison of the MP TF activity and protein assaysWe prepared plasma from unstimulated and LPS stimulated blood and measured levels ofMP TF activity and TF protein in the plasma using two commercial sandwich ELISAs. Ineach assay, plasma from the same six donors was used. MPs were isolated by centrifugationat 20,000 × g for 15 minutes. The mean level of MP TF activity for the unstimulatedsamples was below the lower limit of detection of the assay (0.11 ± 0.07 pg/mL). All donorsexhibited a large increase in MP TF activity in blood treated with LPS compared withunstimulated controls (Figure 2A). Consistent with the known variability in LPS response inthe population, we observed differences in the level of TF induction among the individualdonors [5]. Levels of MP TF activity in LPS treated blood from the different subjects rangedfrom 2.0–14.4 pg/mL. In contrast to the MP TF activity assay, unstimulated plasma sampleshad a high signal in the IMUBIND® TF ELISA (Figure 2B). The level of TF was modestlyincreased by LPS treatment in plasma from 5 of 6 donors with the IMUBIND® TF ELISA(1.4 ± 0.3 fold, Figure 2B) but was not increased using the ZYMUTEST TF ELISA (Figure2C). Notably, there were large differences in basal levels of TF protein between the twoELISAs with a high level in the IMUBIND® ELISA (263.9 ± 32.9 pg/mL) and a low levelin the ZYMUTEST ELISA (8.8 ± 1.9 pg/mL).
Next, the number of TF+ PS+ double positive MPs was analyzed by flow cytometry in asubset of the same cohort of volunteers (n=5) and in THP-1 culture supernatant as a positivecontrol. Surprisingly, we found that numbers of TF+ MPs isolated from PFP were notsignificantly increased compared with untreated samples. In contrast, significantly more TF+
PS+ events were observed in the cell supernatant of LPS stimulated cells compared with theculture supernatant of untreated cells (***p<0.001, Figure 3).
Lee et al. Page 4
Thromb Res. Author manuscript; available in PMC 2013 January 1.
NIH
-PA Author Manuscript
NIH
-PA Author Manuscript
NIH
-PA Author Manuscript
Pre-analytical variables affecting MP TF activityDifferent centrifugation speeds have been reported for the preparation of plasma and theisolation of MPs, with some studies using ultra high speed centrifugation, such as 100,000 ×g, to pellet MPs [21]. We and others have used 20,000 × g for 15 minutes to isolate MPs [14,22]. Therefore, we compared the amount of MP TF activity isolated from PPP using 20,000and 100,000 × g. Pelleting MPs from PPP at these two centrifugal forces for 15 minutesyielded similar amounts of MP TF activity from LPS treated blood (Figure 4A). Next, wecompared the amount of MP TF activity from either PPP or PFP derived from the same LPStreated blood using a 20,000 × g, 15 minute spin. Levels of MP TF activity from PFP weresignificantly lower (52% reduction) than those isolated from PPP (3.9 ± 2.4 vs. 2.2 ± 1.9 pg/mL, Figure 4B).
Effect of freeze/thaw on MP TF activityCellular TF activity is significantly increased after cell lysis due to increased exposure of PS[11]. We hypothesized that freeze/thaw of plasma would increase PS levels on the surface ofMPs and therefore increase TF activity. We compared TF activity of MPs isolated fromfresh plasma versus plasma that was snap frozen and thawed once. Variable results wereobserved with the 5 donors, with PPP from 3 of 5 donors showing a modest increase in MPTF activity (1.3–2.3 fold) after a freeze-thaw cycle (*p<0.05, **p<0.01, Figure 4C).However, when the MP TF activities of the 5 donors were combined and the activity of thefresh sample defined as 1, the MP TF activity of frozen PPP compared to fresh failed toreach statistical significance (paired student's t-test, p=0.06, data not shown).
DiscussionIn this study, we determined the effect of pre-analytical plasma preparation and storage onMP TF activity. Currently, the lack of standardization of pre-analytical variables hashindered researchers analyzing MPs [8, 20, 21, 23]. The most critical and discrepantvariables include methods of plasma preparation, MP isolation, and storage of samples. Forexample, assay variability has been shown to be associated with different centrifugationprotocols [24, 25]. Ultra centrifugation of ≥100,000 × g for up to 60 minutes has been usedto isolate MPs [15]. However, this may contaminate the MPs with smaller exosomes. Wefound no significant difference in TF activity of MP isolated from PPP using 100,000 × g or20,000 × g indicating that the lower speed is sufficient to quantitatively recover TF+ MPsfrom plasma.
Previous studies have examined the number of MPs isolated from PFP and PPP usingdifferent centrifugation protocols. One study observed an 80% reduction in the number ofMPs by spinning PPP at 13,000 × g for 2 minutes [26]. Similarly, we found that MP TFactivity from PFP was reduced by 52% compared to the MP TF activity obtained from PPP.Despite this reduction, the level of MP TF activity was still easily detected in PFP. Anotherstudy found that plasma prepared using 2,000 × g for 10 minutes followed by 21,472 × g for10 minutes had 10 fold less MPs than PPP (prepared by 1,550 × g for 20 minutes) [27].
Since our assay measures the procoagulant activity of TF that is affected by the availabilityof PS, cryopreservation and storage of samples is a critical pre-analytical variable whenanalyzing samples for MP TF activity. For instance, freezing of PPP results in plateletfragmentation [28]. Another study found that the total number of MPs and TF+ MPs wasdecreased by freeze-thaw [29]. There is also some discrepancy in the literature regarding PSexposure on MPs. One study found a 20 fold increase in surface PS on MPs after freeze-thawing by flow cytometry [26]. In contrast, another group did not observe a change in PSexposure after freeze-thawing of MPs by flow cytometry (F. Dignat-George, pers. com.).
Lee et al. Page 5
Thromb Res. Author manuscript; available in PMC 2013 January 1.
NIH
-PA Author Manuscript
NIH
-PA Author Manuscript
NIH
-PA Author Manuscript
This is consistent with Tesselaar and colleagues [12] who found no difference in MP TFactivity in fresh versus frozen and thawed samples. We found donor to donor variability inMP TF activity of fresh PPP and PPP that had been snap frozen and thawed once, with 3 of5 donors exhibiting an increase in activity. It is possible that some of this variability may bedue to differences in platelet contamination of the PPP. MP TF activity may be increased insamples with higher levels of platelets due to PS exposure on the platelets. However, itshould be noted that the increase in TF activity in these 3 donors after freeze/thaw wasmodest (1.3–2.3 fold), and no significant increase in TF activity was observed when data forthe 5 donors was combined. These results may explain some of the reported discrepancies inthe effect of freeze/thaw on PS exposure on MPs and MP TF activity.
We compared our MP TF activity assay with two different methods that measure TF protein.We found the MP TF activity assay was able to detect much larger differences in LPSstimulated versus unstimulated samples with low background activity in the unstimulatedsamples. Only one of the two commercial TF ELISAs showed a modest increase in TFprotein levels after LPS stimulation but had a high basal level of TF protein (263.9 ± 32.9pg/mL). One study raised concerns about the high levels of TF protein levels detected usingcommercial TF ELISAs [30]. In a previous study, we found a much lower level of TFprotein (27 pg/ml) in healthy individuals using an “in-house” TF ELISA [14]. Using flowcytometry, we found no statistical difference between levels of TF+ MP isolated fromunstimulated and LPS stimulated blood. In contrast, MPs isolated from LPS-treated THP-1culture supernatant showed a significant increase in TF protein compared with MPs derivedfrom untreated THP-1 culture supernatant (***p<0.001). One explanation for these results isthat a large number of TF+ MPs released from activated monocytes in whole blood bind toactivated platelets and are removed by centrifugation and this significantly reduces theirnumber in the plasma. We have found in a time-course experiment with LPS treated wholeblood that levels of TF in monocytes precede the levels of TF in platelets [31], which isconsistent with transfer of monocyte-derived TF+ MPs to platelets. In addition, other studieshave shown that monocyte-derived TF+ MPs bind to platelets [32, 33]. These results alsosuggest that the TF activity assay is more sensitive than flow cytometry in detecting TF+
MPs. However, TF+ MPs can be detected in the plasma of patients with different diseases[8, 12, 15, 18, 25], indicating that our in vitro model is not optimal for looking at TF+ MPsby flow.
The dilution linearity experiments indicate that MP TF activity below 0.5 pg/mL cannot beaccurately detected with this assay. Importantly, we have shown that plasma from cancerpatients have higher MP TF activities than 0.5 pg/mL, while plasma from healthyindividuals tend to have levels below this concentration [14, 34]. We observed a CV of 12–25% using different samples and with 3 different operators. A previous study reported a CVof <10% using a similar MP TF activity assay [27]. These variations are inherent in abiological assay.
Standardization of the measurement of TF+ MPs in plasma is needed so that results fromdifferent labs can be compared. TF+ MPs may be a useful biomarker for identifying patientsat risk for thrombosis. Further refinement of this and other assays is necessary for analysisof levels of TF+ MP in clinical samples.
AcknowledgmentsThis work was funded by grants from the National Institutes of Health to NM (R01-HL006350) and NM and NK(R01-HL095096). JCB was supported by a grant from the National Hemophilia Foundation.
Lee et al. Page 6
Thromb Res. Author manuscript; available in PMC 2013 January 1.
NIH
-PA Author Manuscript
NIH
-PA Author Manuscript
NIH
-PA Author Manuscript
Abbreviations
(MP) Microparticle
(TF) tissue factor
(PPP) platelet poor plasma
(PFP) platelet free plasma
(PS) phosphatidylserine
(LPS) bacterial lipopolysaccharide
References1. Mackman N. Tissue-specific hemostasis in mice. Arterioscler Thromb Vasc Biol. 2005; 25:2273–
81. [PubMed: 16123318]2. Drake TA, Morrissey JH, Edgington TS. Selective cellular expression of tissue factor in human
tissues. Am J Path. 1989; 134:1087–97. [PubMed: 2719077]3. Fleck RA, Rao LVM, Rapaport SI, Varki N. Localization of human tissue factor antigen by
immunostaining with monospecific, polyclonal anti-human tissue factor antibody. Thromb Res.1990; 57:765–81.
4. Giesen P, Rauch U, Bohrmann B, Kling D, Roque M, Fallon J, Badimon JJ, Riederer M, NemersonY. Blood-borne tissue factor: another view of thrombosis. Proc Natl Acad of Sci USA. 1999;96:2311–5. [PubMed: 10051638]
5. Egorina EM, Sovershaev MA, Bjorkoy G, Gruber FX, Olsen JO, Parhami-Seren B, Mann KG,Osterud B. Intracellular and surface distribution of monocyte tissue factor: application tointersubject variability. Arterioscler Thromb Vasc Biol. 2005; 25:1493–8. [PubMed: 15860742]
6. Gregory SA, Morrissey JH, Edgington TS. Regulation of tissue factor gene expression in themonocyte procoagulant response to endotoxin. Mol Cell Biol. 1989; 9:2752–5. [PubMed: 2503712]
7. Osterud B, Bjorklid E. Sources of tissue factor. Semin Thromb Hemost. 2006; 32:11–23. [PubMed:16479458]
8. Key NS, Mackman N. Tissue factor and its measurement in whole blood, plasma, andmicroparticles. Semin Thromb Hemost. 36:865–75. [PubMed: 21049387]
9. Morel O, Toti F, Hugel B, Bakouboula B, Camoin-Jau L, Dignat-George F, Freyssinet JM.Procoagulant microparticles: disrupting the vascular homeostasis equation? Arterioscler ThrombVasc Biol. 2006; 26:2594–604. [PubMed: 16990554]
10. Bogdanov VY, Balasubramanian V, Hathcock J, Vele O, Lieb M, Nemerson Y. Alternativelyspliced human tissue factor: a circulating, soluble, thrombogenic protein. Nature Med. 2003;9:458–62. [PubMed: 12652293]
11. Wolberg AS, Kon RH, Monroe DM, Ezban M, Roberts HR, Hoffman M. Deencryption of cellulartissue factor is independent of its cytoplasmic domain. Biochem Biophys Res Commun. 2000;272:332–6. [PubMed: 10833414]
12. Tesselaar ME, Romijn FP, Van Der Linden IK, Prins FA, Bertina RM, Osanto S. Microparticle-associated tissue factor activity: a link between cancer and thrombosis? J Thromb Haemost. 2007;5:520–7. [PubMed: 17166244]
13. Hron G, Kollars M, Weber H, Sagaster V, Quehenberger P, Eichinger S, Kyrle PA, Weltermann A.Tissue factor-positive microparticles: cellular origin and association with coagulation activation inpatients with colorectal cancer. Thromb Haemost. 2007; 97:119–23. [PubMed: 17200778]
14. Khorana AA, Francis CW, Menzies KE, Wang JG, Hyrien O, Hathcock J, Mackman N, TaubmanMB. Plasma tissue factor may be predictive of venous thromboembolism in pancreatic cancer. JThromb Haemost. 2008; 6:1983–5. [PubMed: 18795992]
15. Shet AS, Aras O, Gupta K, Hass MJ, Rausch DJ, Saba N, Koopmeiners L, Key NS, Hebbel RP.Sickle blood contains tissue factor-positive microparticles derived from endothelial cells andmonocytes. Blood. 2003; 102:2678–83. [PubMed: 12805058]
Lee et al. Page 7
Thromb Res. Author manuscript; available in PMC 2013 January 1.
NIH
-PA Author Manuscript
NIH
-PA Author Manuscript
NIH
-PA Author Manuscript
16. Huisse MG, Lanoy E, Tcheche D, Feldman LJ, Bezeaud A, Angles-Cano E, Mary-Krause M, deProst D, Guillin MC, Steg PG. Prothrombotic markers and early spontaneous recanalization in ST-segment elevation myocardial infarction. Thromb Haemost. 2007; 98:420–6. [PubMed: 17721626]
17. Tesselaar ME, Romijn FP, van der Linden IK, Bertina RM, Osanto S. Microparticle-associatedtissue factor activity in cancer patients with and without thrombosis. J Thromb Haemost. 2009;7:1421–3. [PubMed: 19500241]
18. Aras O, Shet A, Bach RR, Hvsjulien JL, Slungaard A, Hebbel RP, Escolar G, Jilma B, Key NS.Induction of microparticle- and cell-associated intravascular tissue factor in human endotoxemia.Blood. 103:4545–53. [PubMed: 14988149]
19. Nieuwland R, Berckmans RJ, McGregor S, Boing AN, Romijn FP, Westendorp RG, Hack CE,Sturk A. Cellular origin and procoagulant properties of microparticles in meningococcal sepsis.Blood. 2000; 95:930–5. [PubMed: 10648405]
20. Lacroix R, Robert S, Poncelet P, Dignat-George F. Overcoming limitations of microparticlemeasurement by flow cytometry. Semin Thromb Hemost. 2011; 36:807–18. [PubMed: 21049381]
21. Jy W, Horstman LL, Jimenez JJ, Ahn YS, Biro E, Nieuwland R, Sturk A, Dignat-George F,Sabatier F, Camoin-Jau L, Sampol J, Hugel B, Zobairi F, Freyssinet JM, Nomura S, Shet AS, KeyNS, Hebbel RP. Measuring circulating cell-derived microparticles. J Thromb Haemost. 2004;2:1842–51. [PubMed: 15456497]
22. Leroyer AS, Isobe H, Leseche G, Castier Y, Wassef M, Mallat Z, Binder BR, Tedgui A, BoulangerCM. Cellular origins and thrombogenic activity of microparticles isolated from humanatherosclerotic plaques. J Am Coll Cardiol. 2007; 20:772–7. [PubMed: 17306706]
23. Yuana Y, Bertina RM, Osanto S. Pre-analytical and analytical issues in the analysis of bloodmicroparticles. Thromb Haemost. 105:396–408. [PubMed: 21174005]
24. Berckmans RJ, Neiuwland R, Boing AN, Romijn FP, Hack CE, Sturk A. Cell-derivedmicroparticles circulate in healthy humans and support low grade thrombin generation. ThrombHaemost. 2001; 85:639–46. [PubMed: 11341498]
25. Biro E, Sturk-Maquelin KN, Vogel GM, Meuleman DG, Smit MJ, Hack CE, Sturk A, NieuwlandR. Human cell-derived microparticles promote thrombus formation in vivo in a tissue factor-dependent manner. J Thromb Haemost. 2003; 1:2561–8. [PubMed: 14738565]
26. Lechner D, Weltermann A. Circulating tissue factor-exposing microparticles. Thromb Res. 2008;122(Suppl 1):S47–54. [PubMed: 18691500]
27. Auwerda JJ, Yuana Y, Osanto S, deMaat MP, Sonneveld P, Bertina RM. Microparticle-associatedtissue factor activity and venous thrombosis in multiple myeloma. Thromb Haemost. 2011;105:14–20. [PubMed: 21057704]
28. Mobarrez F, Antovic J, Egberg N, Hansson M, Jorneskog G, Hultenby K, Wallen H. A multicolorflow cytometric assay for measurement of platelet-derived microparticles. Thromb Res. 2010;125:e110–6. [PubMed: 19939440]
29. Shah MD, Bergeron AL, Dong J-F, Lopez J. Flow cytometric measurement of microparticles:pitfalls and protocol modifications. Platelets. 2008; 19:365–372. [PubMed: 18791943]
30. Parhami-Seren B, Butenas S, Krudysz-Ambio J, Mann KG. Immunologic quantitation of tissuefactor. J Thromb Haemost. 2006; 4:1747–55. [PubMed: 16879217]
31. Bach R, Jilma B, Mayr F, Johnson G, Long J, Hysjulien J, Key N. Time course of tissue factorprocoagulant activity increases on mononuclear cells and platelets following endotoxin-inducedsystemic inflammation in humans. Blood. 2003; 102 Abs. #2023.
32. Del Conde I, Shrimpton CN, Thiagarajan P, Lopez J. Tissue factor bearing microparticles arisefrom lipid rafts and fuse with activated platelets to initiate coagulation. Blood. 2005; 106:1604–1611. [PubMed: 15741221]
33. Rauch U, Bondermann B, Badimon JJ, Himber J, Riederer MA, Nemerson Y. Transfer of tissuefactor from leukocytes to platelets is mediated by CD15 and tissue factor. Blood. 2000; 96:170–175. [PubMed: 10891447]
34. Manly DA, Wang J-G, Glover S, Kasthuri R, Liebman HA, Key NS, Mackman N. Increasedmicroparticle tissue factor activity in cancer patients with venous thromboembolism. Thromb Res.2010; 125:511–512. [PubMed: 19854471]
Lee et al. Page 8
Thromb Res. Author manuscript; available in PMC 2013 January 1.
NIH
-PA Author Manuscript
NIH
-PA Author Manuscript
NIH
-PA Author Manuscript
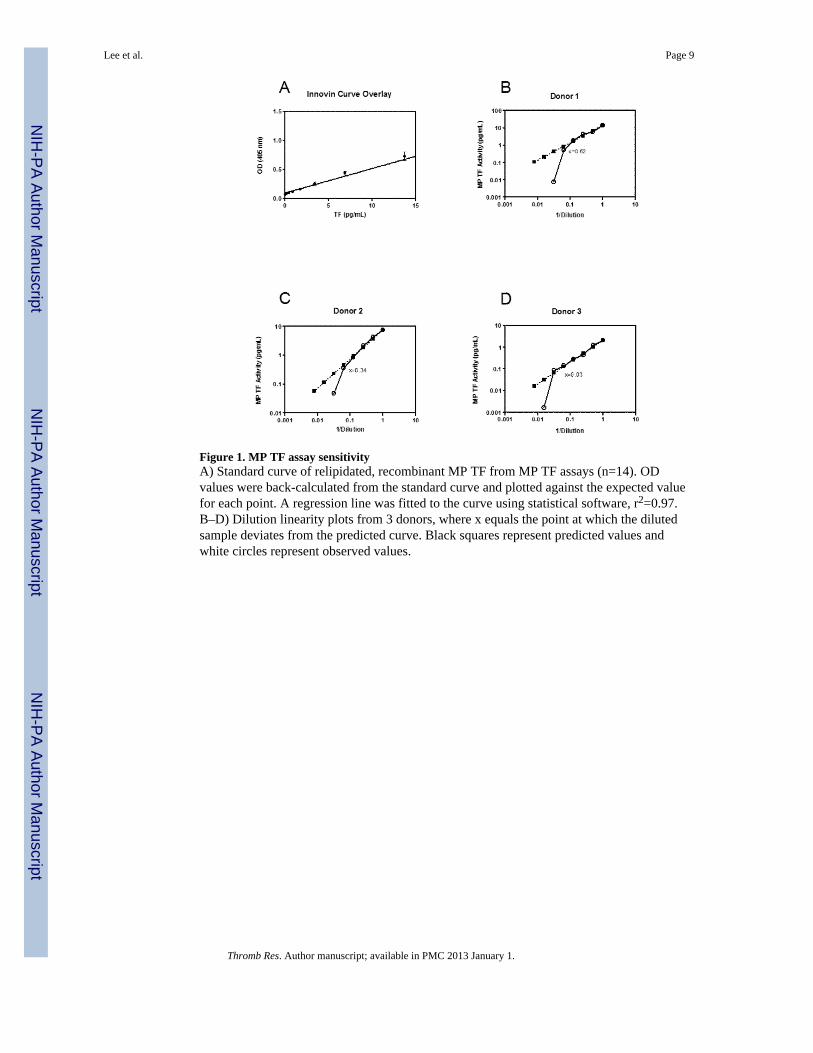
Figure 1. MP TF assay sensitivityA) Standard curve of relipidated, recombinant MP TF from MP TF assays (n=14). ODvalues were back-calculated from the standard curve and plotted against the expected valuefor each point. A regression line was fitted to the curve using statistical software, r2=0.97.B–D) Dilution linearity plots from 3 donors, where x equals the point at which the dilutedsample deviates from the predicted curve. Black squares represent predicted values andwhite circles represent observed values.
Lee et al. Page 9
Thromb Res. Author manuscript; available in PMC 2013 January 1.
NIH
-PA Author Manuscript
NIH
-PA Author Manuscript
NIH
-PA Author Manuscript
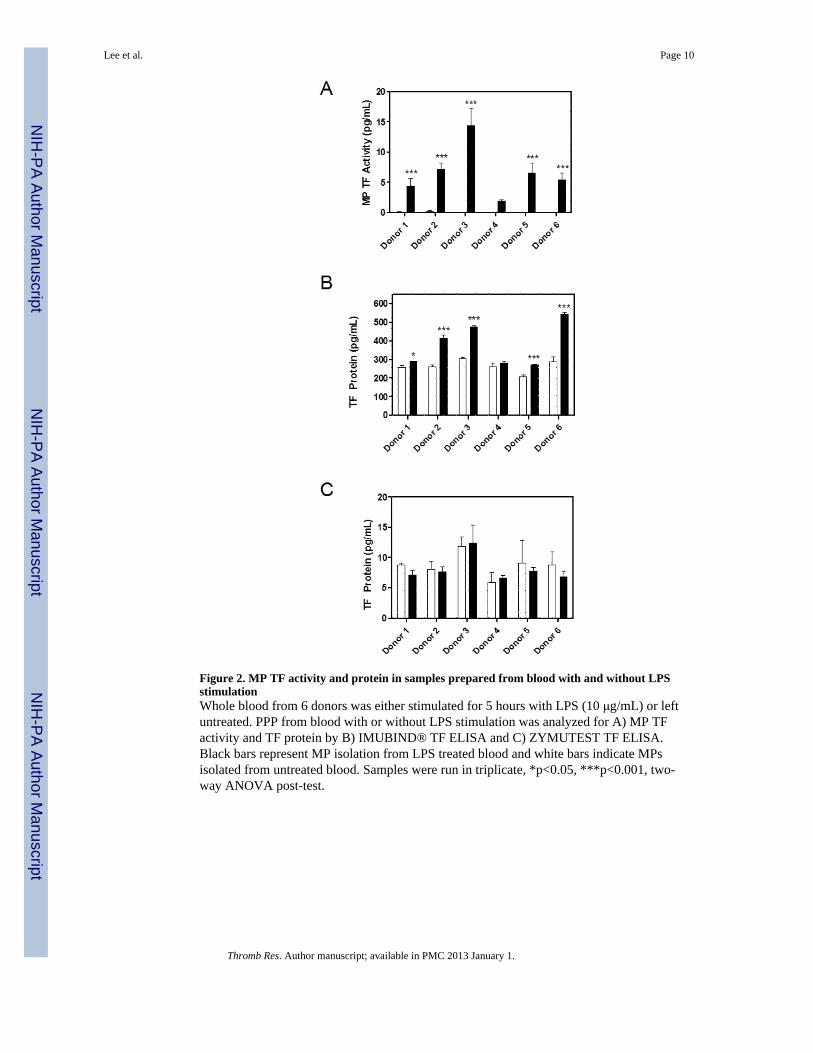
Figure 2. MP TF activity and protein in samples prepared from blood with and without LPSstimulationWhole blood from 6 donors was either stimulated for 5 hours with LPS (10 μg/mL) or leftuntreated. PPP from blood with or without LPS stimulation was analyzed for A) MP TFactivity and TF protein by B) IMUBIND® TF ELISA and C) ZYMUTEST TF ELISA.Black bars represent MP isolation from LPS treated blood and white bars indicate MPsisolated from untreated blood. Samples were run in triplicate, *p<0.05, ***p<0.001, two-way ANOVA post-test.
Lee et al. Page 10
Thromb Res. Author manuscript; available in PMC 2013 January 1.
NIH
-PA Author Manuscript
NIH
-PA Author Manuscript
NIH
-PA Author Manuscript

Figure 3. Flow cytometric analysis of TF+ PS+ MPsMPs were isolated by centrifugation of PFP from either untreated or LPS-stimulated wholeblood from 5 donors or from centrifugation of untreated or LPS-stimulated THP-1 cellsupernatant (10μg/mL of LPS, 5 hours). The graph is expressed as the average fold increaseof TF+ annexin V+ double positive MP events of treated versus untreated samples, in whichuntreated samples are standardized to a value of 1. Black bars represent MP isolation fromLPS treated blood or LPS treated THP-1 cells and white bars indicate MPs isolated fromuntreated blood or unstimulated cells. Samples were run in triplicate, ***p<0.001 by twoway ANOVA post-test.
Lee et al. Page 11
Thromb Res. Author manuscript; available in PMC 2013 January 1.
NIH
-PA Author Manuscript
NIH
-PA Author Manuscript
NIH
-PA Author Manuscript
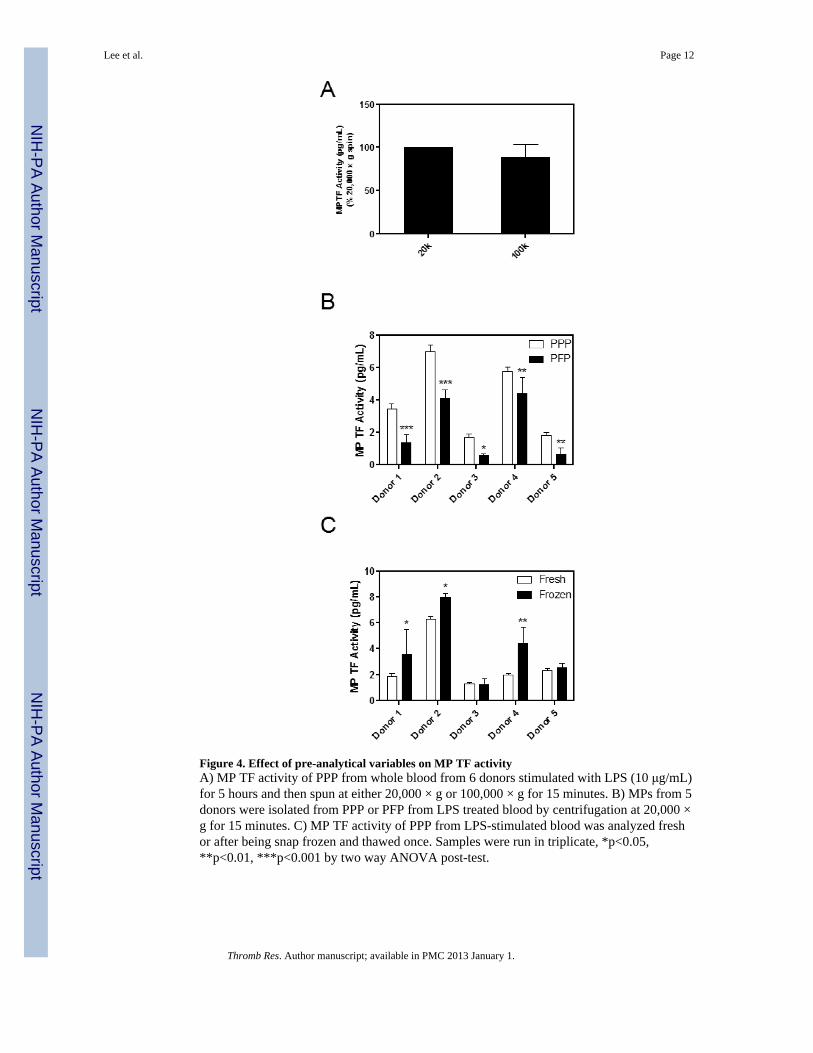
Figure 4. Effect of pre-analytical variables on MP TF activityA) MP TF activity of PPP from whole blood from 6 donors stimulated with LPS (10 μg/mL)for 5 hours and then spun at either 20,000 × g or 100,000 × g for 15 minutes. B) MPs from 5donors were isolated from PPP or PFP from LPS treated blood by centrifugation at 20,000 ×g for 15 minutes. C) MP TF activity of PPP from LPS-stimulated blood was analyzed freshor after being snap frozen and thawed once. Samples were run in triplicate, *p<0.05,**p<0.01, ***p<0.001 by two way ANOVA post-test.
Lee et al. Page 12
Thromb Res. Author manuscript; available in PMC 2013 January 1.
NIH
-PA Author Manuscript
NIH
-PA Author Manuscript
NIH
-PA Author Manuscript