prc study on rapid appraisal of national
233
PRC STUDY ON RAPID APPRAISAL OF NATIONAL RURAL HEALTH MISSION IMPLEMENTATION IN KOZHIKKODE DISTRICT, KERALA, 2008-09 Sponsored by Ministry of Health and Family Welfare Government of India POPULATION RESEARCH CENTRE UNIVERSITY OF KERALA Kariavattom Thiruvanathapuram 2009
-
Upload
khangminh22 -
Category
Documents
-
view
1 -
download
0
Transcript of prc study on rapid appraisal of national

PRC STUDY ON RAPID APPRAISAL OF NATIONAL RURAL HEALTH MISSION IMPLEMENTATION IN
KOZHIKKODE DISTRICT, KERALA, 2008-09
Sponsored by Ministry of Health and Family Welfare
Government of India
POPULATION RESEARCH CENTRE UNIVERSITY OF KERALA
Kariavattom Thiruvanathapuram
2009

CONTRIBUTORS
SANTHOSH S
SAJINI B NAIR
SHYLAJA L
SREERANJINI A
SURESHKUMAR S
ANITHAKUMARY K.R
LINI G.R
RAJESH J NAIR

i
FOREWORD
The “PRC study on Rapid Appraisal of National Rural Health Mission Implementation in
Kozhikkode district, Kerala 2008-09 ” was funded by Statistics division of Ministry of Health
and Family Welfare (MoHFW), Govt of India .The main objective of the study was to critically
analyse the components of NRHM implementation at national level on selected districts to
facilitate the midcourse correction. The statistics division of MoHFW has supported the study
with funding , Training of trainers , questionnaire formulation and data processing software. The
survey was executed by Population Research Centre, University of Kerala in the state during
November 2008 to January 2009.
In Kerala state , the selected district was Kozhikkode under which Kuttiyadi community health
centre(CHC) and Thalakulathoor CHC were selected .Twelve sub centres were selected
altogether at random from the Primary health centres (PHCs) selected (Velam,Narippatta,
Kakkody and Iravalloor) vertically under the selected CHCs. The field survey was implemented
after rigorous training to the field investigators at Vadakara.
The field survey was coordinated by Dr. Sreeranjini A , Research Investigator and Dr.S.Suresh
Kumar, Field Investigator , PRC. The three team supervisors deputed from PRC were
Sri Oommen P.Mathew, Research Investigator; Sri Anilkumar K, Field Investigator and Sri
Sachin K.V, Computor, PRC. The logistic support were arranged by Sri Mohanan R, Driver,
PRC. The survey teams included the following investigators Kavitha B, Sari .K, Seena .K.P,
Sheeja .K, Beena .P.K, Sindhu T.K, Rajitha O.V, Rajan T.P and Vinodkumar .P.
The data processing were supervised by Dr.Anithakumary K.R, Field Investigator and Smt Lini
G.R, Computor, PRC. The data processing were done by Dr.Sajini B Nair, Social Scientist; Sri.
Rajesh J Nair , Computor , PRC ; Anupama Nath S.R and Padma U.S.The office editing was
done by Dr.Suresh Kumar S, Field Investigator,PRC.
The overall activities of the study was directed and monitored by Dr.Santhosh.S, Additional
Director, PRC.

ii
The contributors of the report are Dr.Santhosh.S, Dr.Sajini B Nair, Dr Shylaja L, Dr.Sreeranjini
A , Dr.Sureshkumar S, Dr.Anithakumary , Smt Lini.G.R and Rajesh J Nair.
I am thankful to Dr.Rattanchand, Chief Director; Sri.Praveen Srivasthava,Director and Sri
Rajesh Bhatia Joint Director, Statistics Division, Ministry of Health and Family Welfare, Govt of
India for their support and encouragement to the study.
We are thankful to Dr.Pradeepkumar, State Programme Manager ,NRHM and Dr.Baburaj ,
District Programme Manager,NRHM,Kozhikkode for their cooperation in making the study to
reality.
I am thankful to the staff of Kuttiyadi CHC, Thalakulathoor CHC,Velam PHC,Narippatta PHC,
Kakkody PHC and Iruvalloor PHC for their sincere cooperation.
We express our gratitude to President and staff of Kunnummal Block Panchayath, Velam ,
Narippatta ,Kakkody and Chelannoor panchayaths of Kozhikkode District .
May 8,2009 Dr.Santhosh.S
Thiruvananthapuram Additional Director In-Charge

1
Contents
Page No. Foreword i Chapter 1 State Profile 8 1.1 A brief profile of the state 9 1.2 NRHM survey operations 12 1.3 Population Characteristics 14 1.4 Status of NRHM Interventions 15 Chapter 2 District Profile 20 Part A 2.1 Population Characteristics 20 2.2 Status of NRHM Interventions 21 Part B 2.3 Health facilities at the District Hospital 29 2.4 Human Resources 36 Chapter 3 Community Health Centres 39 3.1 Coverage and Availability of Infrastructure in Community Health Centres 40 3.2 Staff Position 44 3.3 Availability of specific services in CHC 49 3.4 Status of Specific Interventions 50 3.5. Status of Residential facilities for Doctors and other staff 51 3.6. Availability of Laboratory Facilities 52 3.7 Availability of Equipments and Drugs 56 3.8 Service outcome of the CHC 59 Chapter 4 Primary Health Centres 65 4.1 Coverage and facilities of Primary Health Centre 65 4.2 Infrastructure facilities 67 4.3 Staff Position 70 4.4 Status of training 72 4.5 Facilities available 72 4.6 Status of specific Interventions 75 4.7 Availability of selected equipments 77 4.8 Status of Availability of Drugs 79 4.9 Monthly Service outcome of the PHCs 81 4.10 Record maintenance 86

2
Chapter 5 Sub Centres 88 5.1 Coverage of Sub Centres 88 5.2 Availability of Infrastructure 90 5.3 Specific Services 93 5.4 Availability of equipments and drugs 94 5.5 Status of Specific Skills and Procedures 97 5.6 Service Outcome 98 5.7 Status of Untied Grants 103 Chapter 6 Household Characteristics 105 6.1 Characteristics of respondents 105 6.2 Characteristics of Households 106 6.3 NRHM, ASHA, JSY 114 6.4 JSY Beneficiaries 118 6.5 Role of ASHA 122 6.6 Utilization of government health facility 130 6.7 Client Satisfaction 132 6.8 Morbidity status 137 6.9 Family Planning 140 6.10 Awareness about HIV (AIDS) 141 Chapter 7 Status and Performance of ASHA 143 7.1 Status of ASHA. 143 7.2 Role and Performance of ASHA 144 Chapter 8 Role, Awareness and Involvement of Gram Panchayats 149 8.1 Status of Gram Panchayats 150 8.2 Level of awareness and involvement of Gram Panchayats 151 Chapter 9 Quality of Care and Client Satisfaction 154 9.1 IPD facilities 154 9.2 OPD facilities 169 Chapter 10 Summary of Findings 182 Appendix 1 State Schedule Appendix 2 District Schedule

3
List of Tables Page No.
Chapter 1 State Profile
Table 1.1 Demographic, Socio-economic and Health profile of Kerala State as compared to India
11
Table 1.2 Percentage distribution of Total population by caste & residence, Kerala, 2001
14
Table 1.3 Percent distribution of population by caste, sex and residence, Kerala, 2001 14
Table 1.4 Sex Ratio of population by caste & residence , Kerala, 2001 14
Table 1.5 Status of Health Infrastructure and Facility Upgradation 15
Table 1.6 Rogi Kalyan Samitis (RKS)- Hospital management Society 16
Table 1.7 Period of Field survey 18
Table 1.8 Facilities covered in Kozhikode District 18
Table 1.9 Number of IPD and OPD Interviews conducted 19
Chapter 2 District Profile Table 2.1 Percent distribution of Total population by caste & residence, Kozhikode
District, 2001 21
Table 2.2 Percent distribution of population by caste, sex and residence, Kozhikode District, 2001
21
Table 2.3. Sex Ratio of population by caste & residence, Kozhikode District, 2001 21
Table 2.4 Public health Infrastructure facilities 22
Table 2.5 Facilities available in the district for delivery 23
Table 2.6 Human Resources Available in the District 24
Table 2.7 Rogi Kalyan Samitis (RKS) 25
Table 2.8 Janani Suraksha Yojana (JSY) 26
Table 2.9 Procedures carried out in the Obstetrics and Gynecology department 32
Table 2.10 Services available in the Surgical Department 33
Table 2.11 Services available in the Medical Department 33
Table2.12 Equipments available in the Pediatric Section 34
Table 2.13 Availability of Lab Services 35
Table 2.14 Availability of Human resources in the district hospital 36
Chapter 3 Community Health Centres
Table C1.1 Coverage And Availability Of Infrastructure 40
Table C1.2 Availability Of Infrastructure 41

4
Table C.1.3 Availability Of Infrastructure 42
Table C.1.4 Availability Of Infrastructure Facilities 43
Table C.1.5 Availability Of Facilities And Cleanliness 44
Table C.2.1 Position Of Medical Staff (Clinical) In Community Health Centres 45
Table C2.2 Position Of Para-Medical And Support Staff In CHC 47
Table C3 Availability Of Specific Services In CHC 49
Table C4 Status Of Specific Interventions 50
Table C5 Status Of Residential Facilities For Doctors And Other Staff 51
Table C6 Availability Of Laboratory Facilities 52
Table C7 Number Of Lab. Tests Done In CHC In Last 3 Calendar Months 53
Table C8 Number Of Surgeries Performed During 2007-2008 54
Table C9 Reasons For Not Conducting Surgeries 55
Table C10 Status Of Performance Of Labour Room During 2007-2008 55
Table C11 Reasons For Not Conducting Deliveries 56
Table C12.1 Status Of Availability Of Equipments 56
Table C12.2 Status Of Availability Of Drugs 57
Table C13 Availability Of Specific Services 58
Table C14.1 Service Out Come Of The CHC For Last One Month 59
Table C14.2 Service Out Come Of The CHC For Last One Month 61
Table C14.3 Service Out Come Of The CHC For Last One Month 62
Table C14.4 Service Out Come 64
Chapter 4 Primary Health Centres
Table P1 Coverage And Facilities Of Primary Health Centre 66
Table P 2.1 Primary Health Centres By Infrastructure 68
Table P 2.2 Primary Health Centres By Infrastructure 69
Table P 3.1 Staff Position Of In Primary Health Centre 70
Table P 3.2 Staff Position Of In Primary Health Centre 71
Table P4 Status Of Training Of Personnel At Primary Health Centre 72
Table P5 Availability Of Labour Room In Primary Health Centre 73
Table P6 Status Of Performance Of Labour Room During 2007-2008 73
Table P7 Availability Of Laboratory Testing In PHC 74
Table P8 Number Of Tests Done In PHC In Last Three Calendar Months 75

5
Table P9 Status Of Specific Interventions 76
Table P10 Availability Of Selected Equipments In PHC 78
Table P11 Status Of Availability Of Drugs During The Last 6 Months 80
TableP12.1 Monthly Service Outcome (Based On Data For Last Three Months) 82
TableP12.2 Monthly Service Outcome (Based On Data For Last Three Months) 84
TableP12.3 Monthly Service Outcome (Based On Data For Last Three Months) 85
Table P13 Status Of Record Maintenance 87
Chapter 5 Sub Centre
Table S1 Sub Centres Coverage 89
Table S2 Sub Centres Infrastructure 90
Table S3 Sub Centres With ANM Staying With Or Away From SC Village By Distance From SC And Reasons For Not Staying in SC Quarter
91
Table S4 Sub Centres With Staff In Position 92
Table S5 Availability Of Labour Room In Sub Centre 93
Table S6A Number Of Deliveries Performed During 2007-08 93
Table S6B Sub-Centres With Arrangement For Deliveries 94
Table S7 A Percentage Of Sub Centres With Available Equipments 94
Table S7 B Percentage Of Sub Centres With Functional Equipments 95
Table S8 Status Of Availability Of Drugs 96
Table S9 Status Of Specific Skills And Procedures 98
Table S10 Service Outcome (Based On The Data For Last 3 Months) 99
Table S11 Status Of Record Maintenance 100
TableS12A Status Of Awareness Of ANM About JSY Scheme 101
TableS12 B Status Of Procedure Under JSY Scheme 101
Table S13 Status Of Performance Of ANM Under JSY Scheme 102
Table S14 Status Of Untied Grants 103
Chapter 6 Household Characteristics
Table H1 Characteristics Of The Respondents 106
Table H2 Characteristics Of The Household 107
Table H2.1 Characteristics Of The Household 108
Table H3 Percent Distribution Of Households by mode of Waste Disposal, Stagnation of Waste Water And Mosquito Breeding and System Of Medicine Preferred
109

6
Table H 4.1 Percent Distribution Of Household Respondents By Their Information About Availability Of Health Worker, Health Facilities And Transport Used To Take Serious Patients
111
Table H 4.2 Percent Distribution Of Household Respondents By Their Information About Availability Of Health Worker, Health Facilities And Transport Used To Take Serious Patients
113
Table H 5 Percent Distribution Of Household Respondents By Their Knowledge About NRHM,ASHA And Her Activities, VHND, VHSC And JSY
115
Table H 5.1 Percent Distribution Of Household Respondents By Their Knowledge About NRHM,ASHA And Her Activities, VHND, VHSC And JSY
117
Table H6 Percent Distribution Of JSY Beneficiaries By Their Background Characteristics
119
Table H7 Timing, Person Place Of Registration For JSY Scheme 120
Table H8 Receipt Of JSY Card, Role Of ASHA In Getting JSY Card And Difficulties Faced By The Beneficiary In Getting The JSY Card
121
Table H 9 Role Of ASHA During The Pregnancy Of The Beneficiaries 123
Table H 10 Place Of Delivery And Reason For Opting Institutional Delivery 124
Table H 11 Transport Of The Beneficiaries To Reach The Health Institution 126
Table H 12 Waiting Time At The Health Facility, Type Of Delivery, Amount Spent At The Health Facility And Satisfaction Regarding Services Available
127
Table H13 Reason For The JSY Beneficiary To Opt Home Delivery, In Spite Of Cash Incentives Being Available Under The JSY
128
Table H.14 Cash Incentive Received By The Beneficiary Under JSY Scheme 129
Table H 15 Utilization Of Government Health Facility In Last 6 Months 130
Table H. 16 Characteristics Of The Respondents Who Have Availed The Services In Government Health Facility In Last 6 Months
131
Table H.17 Type Of Health Facility Visited, Purpose Visit And Client Satisfaction Regarding Behaviour Of Health Worker, Privacy And Availability Medicines
134
Table H.18 User Fees And Extra Charges 134
Table H19 Services For The BPL Patients 136
Table H 20 Outbreak Of Selected Diseases in Respondents' area during the Last Six Months
137
Table H 21 Action To Be Taken For Selected Diseases 138
Table H 22 Awareness About Spacing Methods And Ideal Gap Between1st and 2nd Child 140
Table H23 Awareness About Modes Of Getting AIDS, Source Of Information About AIDS And Awareness About VCTC
142
7
Chapter 7 Status And Performance Of ASHA 143
Table A1 Status Of ASHA 143 Table A2 Role And Performance Of ASHA 145 Table A3 Distribution Of ASHAs By Reported Types Of Difficulties Faced
And Kind Of Support Required 146
Table A4 Distribution Of ASHAs By Reported Awareness On Different Aspects 147
Chapter 8 Role, Awareness And Involvement Of Gram Panchayats Table 1 Area and Population Of Gram Panchayats Covered 149 Table A1 Status Of Gram Panchayats Covered 150 Table A2 Level Of Awareness And Involvement Of Gram Panchayats 151
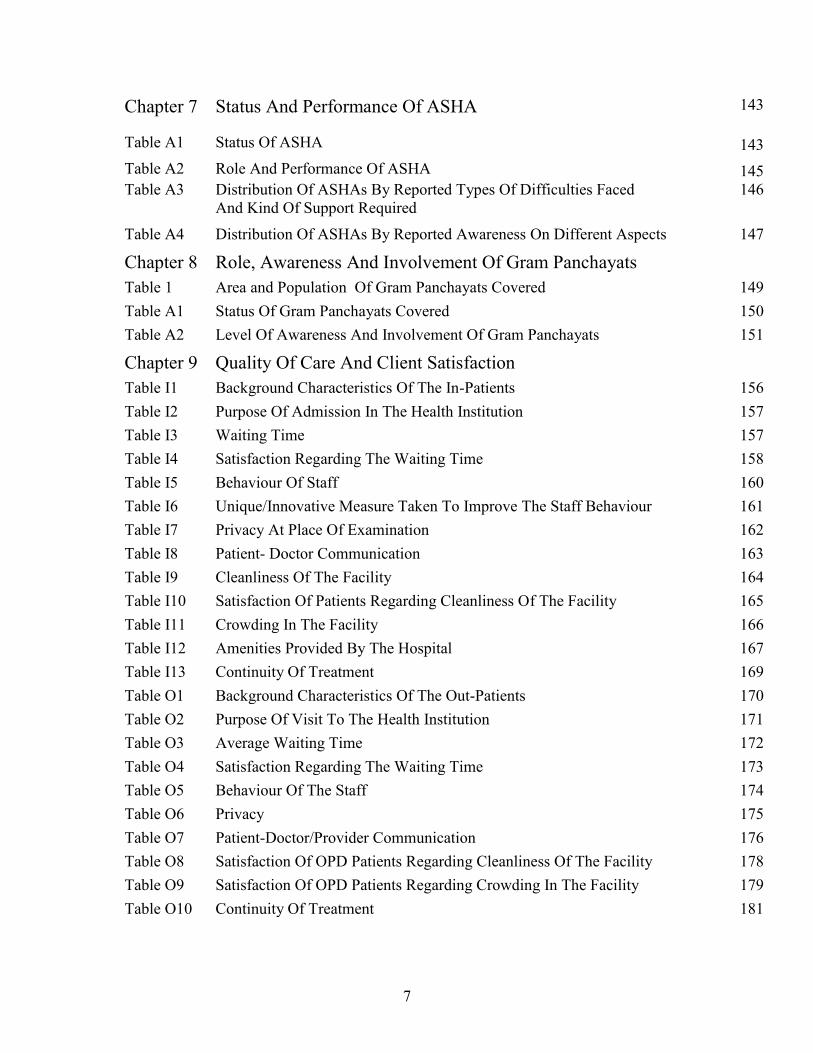
Chapter 9 Quality Of Care And Client Satisfaction Table I1 Background Characteristics Of The In-Patients 156 Table I2 Purpose Of Admission In The Health Institution 157 Table I3 Waiting Time 157 Table I4 Satisfaction Regarding The Waiting Time 158 Table I5 Behaviour Of Staff 160 Table I6 Unique/Innovative Measure Taken To Improve The Staff Behaviour 161 Table I7 Privacy At Place Of Examination 162 Table I8 Patient- Doctor Communication 163 Table I9 Cleanliness Of The Facility 164 Table I10 Satisfaction Of Patients Regarding Cleanliness Of The Facility 165 Table I11 Crowding In The Facility 166 Table I12 Amenities Provided By The Hospital 167 Table I13 Continuity Of Treatment 169 Table O1 Background Characteristics Of The Out-Patients 170 Table O2 Purpose Of Visit To The Health Institution 171 Table O3 Average Waiting Time 172 Table O4 Satisfaction Regarding The Waiting Time 173 Table O5 Behaviour Of The Staff 174 Table O6 Privacy 175 Table O7 Patient-Doctor/Provider Communication 176 Table O8 Satisfaction Of OPD Patients Regarding Cleanliness Of The Facility 178 Table O9 Satisfaction Of OPD Patients Regarding Crowding In The Facility 179 Table O10 Continuity Of Treatment 181

8
Chapter 1
State Profile
The National Rural Health Mission (2005-12) was launched in April 2005 by
Government of India to provide effective health care to the rural population, especially
the disadvantaged groups including women and children. It aims at improving access,
enabling community ownership and demand for health care services. National Rural
Health Mission (NRHM) addresses issues like strengthening public health systems for
efficient service delivery, enhancing equity and accountability and promoting
decentralization. It covers the entire country, with special focus on 18 states where the
public health indicators have to be improved. The targets to be achieved were framed
keeping in mind the Millennium Development Goals (MDGs) of United Nations. The
Mission is conceived as an umbrella programme by integrating the existing programmes
of health and family welfare, including the RCH II, National Disease Control
Programmes for Malaria, TB, Kala Azar, Filaria, Blindness & Iodine Deficiency and
Integrated Disease Surveillance Programme.
The main objectives of the NRHM are:
Reduction in Infant Mortality Rate and Maternal Mortality Rate
Universal access to public health services such as Women‟s health, child health,
water, sanitation & hygiene, immunization, and Nutrition.
Prevention and control of communicable and non-communicable diseases,
including locally endemic diseases
Access to integrated comprehensive primary healthcare
Upgrading community health centres to Indian Public health standards (IPHS)
Population stabilization, gender and demographic balance.
Revitalize local health traditions and mainstream AYUSH
Increase utilization of First referral units (FRUs)
Promotion of healthy life styles

9
NRHM has provided many programmes in different fields of health and other
allied areas such as the institutional framework of NRHM in each state,
programmes and activities related to ASHA, Infrastructure and manpower,
activities of AYUSH, institutional deliveries, Immunization and different
programmes in the health area.
The Ministry of Health and Family Welfare (MOHFW), Government of India is
continuously monitoring and assessing the activities of NRHM regularly to ensure the
planned objectives. The present study “Rapid Appraisal of National Rural Health
Mission Implementation” is part of the mid course correction activities of MOHFW
conducted all over India in selected districts during November, 2008 to January, 2009.
In Kerala state the selected district was Kozhikode.
1.1 A brief profile of the state
1.1.1 Geography
Kerala is wedged between the Arabian sea and the Western Ghats. The state lies
between north latitudes 8°18' and 12°48' and east longitudes 74°52' and 72°22'. The
geographical area is like a narrow stretched piece of land running about 580 kilometers
with a width that varies between 35 and 120 kilometers. It represents 1.18 percent of the
total area of India but has 3.34 percent of the total population of the country. It is
separated from the rest of the peninsula by natural geographic boundaries.
Kerala can be divided into three geographical regions (1) high land (2) mid land (3) low
land. The high lands slope down from the Western Ghats, which rise to an average
height of 900m, with a number of peaks over 1,800 m in height. This is the area of
major plantations like tea, coffee, rubber, cardamom and other species. The mid land
lies between the mountains and the low lands. It is made up of undulating hills and
valleys. This is an area of intensive cultivation - cashew, coconut, areca nut, cassava,
banana, rice, ginger, pepper, sugarcane and vegetables of different varieties are grown
in this area. The 'Western Ghats' with their rich primeval forests having a high degree

10
of rainfall, form the eastern boundary and extend from the north to Kanyakumari in the
south. The entire western border is caressed by the Arabian sea.
1.1.2 Economy
As per the statistics published by Central Statistical Organization(CSO) the revised
estimate of Gross Domestic Product (GDP) of India at factor cost at constant (1999-
2000) prices for the year 2007-08 is estimated at Rs.3122862/- crores as against the
quick estimate of GDP for the year 2006-07 of Rs. 2864310/- crores. The quick estimate
of Gross State Domestic Product (GSDP) at factor cost at constant (1999-2000) prices is
Rs.126452.68 crores during 2007-08. At current prices the Gross State Domestic
Product is estimated as Rs. 162414.79 crore (quick estimate) during 2007-08 as against
the provisional estimate of Rs. 142470.04 crores during 2006-07. The growth rate of
GSDP at current prices is 14 percent in 2007-08 compared to 14.5 percent in 2006-07.
The district wise distribution of Gross State Domestic Product at factor cost at current
prices shows that Ernakulam District continues to have the highest income of Rs.
23324.68 crore in 2007-08, and Kozhikode holds the fourth position with Rs. 14222.63
crore. The highest rate of growth of per capita income at constant (1999-2000) prices of
11.3 percent was recorded in Ernakulam District in 2007-08 followed by Kozhikode
(10.5 percent).
Per-capita GSDP is Rs11,819 above the Indian average and far below the world
average. The phenomenon of high human development Index with low economic
development of the state is widely discussed in the international forum and termed as
“Kerala model of development”. Kerala's economy depends on emigrants working in
foreign countries and their annual remittances contribute more than a fifth of GSDP.
1.1.3 Demographic and health indicators
Comparative figures of major health and demographic indicators are presented in Table
1. The Sex Ratio in the State is uniquely determined by 1058 females per 1000 males as
compared to 933 for the country. The Total Fertility Rate (TFR) of the State is 1.7
which is below replacement level. The Infant Mortality Rate (IMR) is 15 and Maternal
11
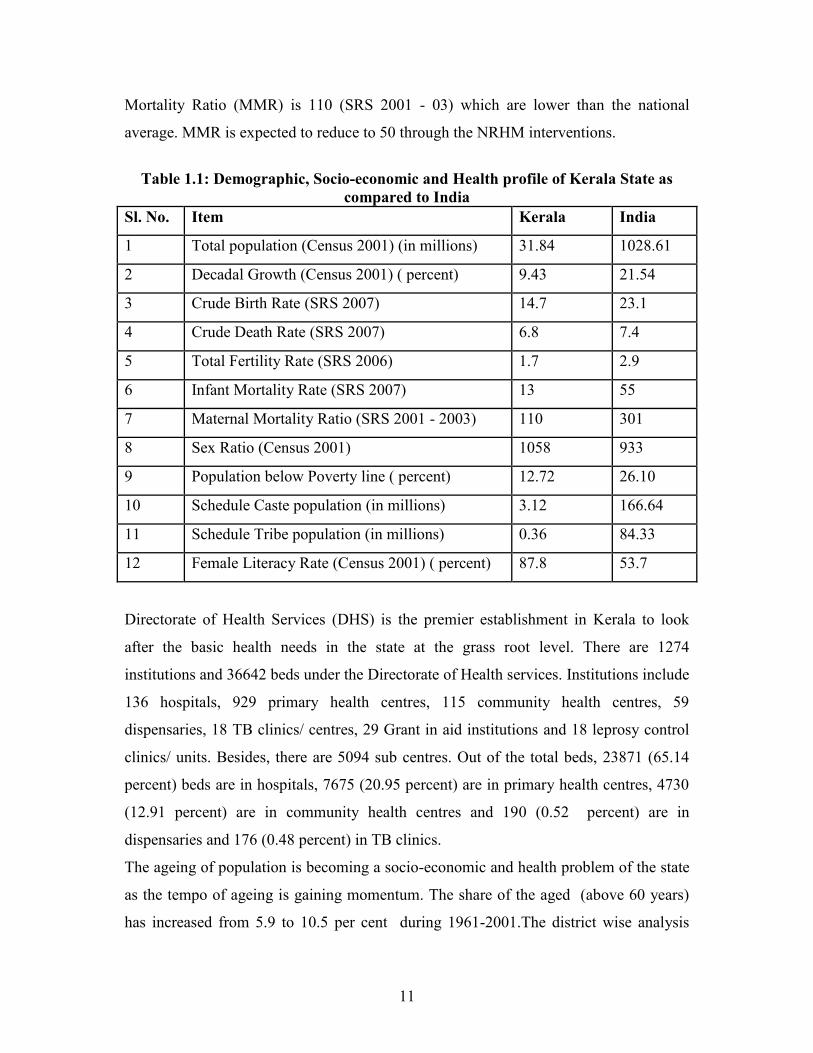
Mortality Ratio (MMR) is 110 (SRS 2001 - 03) which are lower than the national
average. MMR is expected to reduce to 50 through the NRHM interventions.
Table 1.1: Demographic, Socio-economic and Health profile of Kerala State as compared to India
Sl. No. Item Kerala India
1 Total population (Census 2001) (in millions) 31.84 1028.61
2 Decadal Growth (Census 2001) ( percent) 9.43 21.54
3 Crude Birth Rate (SRS 2007) 14.7 23.1
4 Crude Death Rate (SRS 2007) 6.8 7.4
5 Total Fertility Rate (SRS 2006) 1.7 2.9
6 Infant Mortality Rate (SRS 2007) 13 55
7 Maternal Mortality Ratio (SRS 2001 - 2003) 110 301
8 Sex Ratio (Census 2001) 1058 933
9 Population below Poverty line ( percent) 12.72 26.10
10 Schedule Caste population (in millions) 3.12 166.64
11 Schedule Tribe population (in millions) 0.36 84.33
12 Female Literacy Rate (Census 2001) ( percent) 87.8 53.7
Directorate of Health Services (DHS) is the premier establishment in Kerala to look
after the basic health needs in the state at the grass root level. There are 1274
institutions and 36642 beds under the Directorate of Health services. Institutions include
136 hospitals, 929 primary health centres, 115 community health centres, 59
dispensaries, 18 TB clinics/ centres, 29 Grant in aid institutions and 18 leprosy control
clinics/ units. Besides, there are 5094 sub centres. Out of the total beds, 23871 (65.14
percent) beds are in hospitals, 7675 (20.95 percent) are in primary health centres, 4730
(12.91 percent) are in community health centres and 190 (0.52 percent) are in
dispensaries and 176 (0.48 percent) in TB clinics.
The ageing of population is becoming a socio-economic and health problem of the state
as the tempo of ageing is gaining momentum. The share of the aged (above 60 years)
has increased from 5.9 to 10.5 per cent during 1961-2001.The district wise analysis

12
indicates that the highest proportion of elderly population is in Alappuzha district
followed by Ernakulam, Kottayam, Thrissur and Thiruvananthapuram. The lowest is in
Kozhikode and Wayanad Districts. In social and health front, the state has achieved
remarkable levels of development. The state has to adopt re-engineering in its policies
to translate the social development to sustainable development.
1.2 NRHM survey operations
The statistics division of MOHFW, Government of India has supported the field survey
operations through the provision of funding, Training of Trainers (TOT), uniform
questionnaire and data processing software. The field operations were conducted by the
Population Research Centres (PRCs) in the respective states.
1.2.1 Sampling Kozhikode was the district selected from Kerala state for the “Rapid appraisal of
NRHM critical components”. There is only one District hospital in Kozhikode, which is
called Beach Hospital, was selected for the evaluation of NRHM. The list of all
Community Health Centres (CHCs) in the district was prepared and two of them were
selected for the evaluation using the criteria given by the Ministry. The farthest CHC
from the district head quarters named Kuttiyadi CHC was the only CHC with FRU
status. So it was selected for the evaluation. Kuttiyadi CHC is located in Vadakara
taluk. The second CHC selected was Thalakulathur CHC located in Kozhikode taluk.
Two PHCs each were selected at random under the selected CHCs. These PHCs were
vertically under the selected CHCs. No PHC under the selected CHCs was working on
24x7 basis and so criteria couldn‟t be satisfied in the selection of PHCs. Three Sub
Centres (SCs) were selected for each PHC. All of them were vertically under selected
PHCs and one was farthest from PHC. Two panchayat-wards each were selected from
the catchment area of SCs. One ward was where Sub-centre was located; and the second
was farthest from the Sub-Centre. 50 Households were selected systematically from
each of the selected ward. For the purpose of selecting the households, the total number

13
of households in a village was divided by 50 to find out the selection interval, „r‟. After
that first household situated at the north-west corner of the village was selected and
subsequently every rth household was selected moving in an „anti-clock wise‟ direction
till 50 households were selected. Thus 1200 households were selected.
All ASHAs in the selected wards were selected for canvassing ASHA Schedule. The
members of Gram Panchayat representing the selected wards were interviewed for
filling the Panchayat Schedule. 5 to10 IPD and OPD Patients were expected to be
interviewed at each of the facility including District Hospital, CHC and PHC. But none
of the selected PHCs has IP facility and so interviews of only OPD patients were done
in PHCs. Interviews of IPD and OPD patients were done in all the selected CHCs and
District hospital.
1.2.2 Field Training Training was conducted at Vadakara, Kozhikode with seventeen trainees and three
supervisors (PRC staff) for November 12 to 14, 2008. Seventeen trainees who had
previous experience were selected for training programme. Apart form TOT trained
personnel, District Programme Manager, NRHM; NRHM Coordinator, Kozhikode and
Additional Director, PRC handled the invited sessions. The training included question
by question discussion, mock interview and field practice session. On 17th a one day
practice session was given for the selected investigators.
Field work started on 18.11.08 and completed on 17.1.09. Three teams were employed
for data collection. One team consisted of four members (three field investigators and
one supervisor) for the collection of household and institutional data. For ensuring the
quality of data collected, back-check was done in each health facility and in 10 percent
of the households in each ward by supervisors from the PRC.
1.2.3 Data Processing Data Processing was done from 17.2.09 to 13.3.09 using the software provided by
MOHFW. Seven data entry operators and an office editor were employed for data

14
processing. The data entry operators were given sufficient on hand training prior to the
actual data entry.
1.3 Population Characteristics Three-fourths of the population of Kerala state lives in rural areas. About one-tenth of
the population of the state is scheduled caste (SC ) and scheduled tribe (ST) shares 1.1
percent of the total population. ST population of rural area is 1.5 percent while urban
area is less than half percent. Scheduled caste population constitutes 10.8 percent of the
rural population compared to 6.9 percent of urban area (Table 2).
Table 1.2.Percentage distribution of Total population by caste & residence , Kerala, 2001
Rural Urban Total SC 10.8 6.9 9.8 ST 1.5 0.2 1.1 Others 87.7 92.9 89.0 Total 100 100 100
Table 1.3. Percent distribution of population by caste, sex and residence,
Kerala, 2001
Caste
Rural Urban Total
Male percent Female
percent Male
percent Female
percent Male
percent Female
percent
SC 1247537 10.9 1306188 10.8 277577 6.9 292639 6.9 1525114 9.9 1598827 9.8
ST 173267 1.5 176752 1.5 6902 0.2 7268 0.2 180169 1.1 184020 1.1
Others 10030478 87.6 10640227 87.8 3732853 92.9 3949686 92.9 13763331 89.0 14589913 89.1
Total 11451282 100.0 12123167 100.0 4017332 100.0 4249593 100.0 15468614 100.0 16372760 100.0 Table 3 indicates that the there is no sex differential with respect to the caste
distribution in rural and urban areas except for the fact that the share of male and female
of rural areas exceed that of urban area.
Table 1.4. Sex Ratio of population by caste & residence , Kerala, 2001 Rural Urban Total SC 1047 1054 1048 ST 1020 1053 1021 Others 1061 1058 1060 Total 1059 1058 1058

15
The sex ratio of SC and ST population (Table 4) of rural areas are considerably less
than the state average of 1058. The sex ratio of ST population is 1021 compared to 1048
of SC population. Caste differential and rural urban differential in the sex ratio can be
observed.
1.4 Status of NRHM Interventions
Information on the status of health infrastructure, facility upgradation under NRHM and
availability of human resources, Rogi Kalyan Samiti, Janani Suraksha Yojana, financial
mechanism at the state are furnished in this section.
1.4.1 Health Infrastructure and Facility Upgradation
It is important to note that the IPHS survey have been completed in all the Community
health centers (CHCs), FRUs, Subdivisional and District hospitals of the state (Table 5).
Table1.5 Status of Health Infrastructure and Facility Upgradation Infrastructure
Public Health Infrastructure
Total Existing (In Nos.) (As on
30.6.2008)
New Buildings Under
Construction (In Nos.) (As on 30.6.2008)
Total Number where IPHS
facility survey completed (As on 30.6.2008)
No. of facilities
where IPHS Upgradation
completed (As on
30.6.2008) Sub Centre 5094 0 0 0 PHC 929 0 0 0 24x7 PHC 105 1 0 0 CHC 115 63 115 7 First Referral Units(FRU)
65 0 65 0
Mobile medical unit 13 Sub Divisional Hospital
41 0 41 0
District Hospital 18 1 18 0 AYUSH 0
Private Health Infrastructure
Information Not Available
Hospitals (More than 30 bedded)
Nursing Homes (Less than 30 bedded)

16
Only Seven CHCs( 6 percent) have upgraded to the facilities of IPH standard. New
buildings are being constructed for one district hospital 63 CHCs and one round the
clock working (24x7) PHC. It seems that the AYUSH facility has not yet started in the
state.
Information on health facilities of private sector is not available with the NRHM
authorities. The state health information system needs to incorporate details of private
health facilities. It has to be made mandatory by the central health ministry that all
health facilities (both Government and Private) need to be registered in the respective
states under Director of health services or District medical services with all details and
they should be directed to update the details in every year.
1.4.2 Rogi Kalyan Samitis (RKS) or Hospital Management Society
In all the health facilities of the state from PHC to District hospitals the Rogi Kalyan
Samitis (RKS) or Hospital Management Societies (Table 6) have registered and
functioning.(The block PHC and PHC will add to 929 PHCs).
Table1. 6 Rogi Kalyan Samitis (RKS)- Hospital Management Societies Total Functioning No. with Registered
RKS
District Hospital 18 18
Sub Divisional Hospital 41 41
CHC 115 115
PHC 818 818 Block PHC 111 111 Addl. PHC 0 0
1.4.3 Janani Suraksha Yojana (JSY)
JSY ensures safe delivery through cent percent institutional deliveries to reduce
maternal mortality and infant mortality. It includes provision for public- private

17
participation in remote places where Government facilities do not exist. The public
private partnership (PPP) initiative in JSY has been undertaken in the state in 227
facilities.
The caste wise break up of Institutional deliveries was not available at the state NRHM
office. The total such deliveries at Government facility during 2007-08 was 221815 and
at private accredited facilities it is 315942.The total number of JSY beneficiaries
registered both at Government and private facilities add up to 148000 and all of them
have opted for institutional delivery .In the present health care delivery system the
caste wise data are not recorded .
1.4.4 Financial Mechanisms In Kerala state, the merging of vertical health societies of different programmes is being
implemented to form state health society. At the district level all the 14 districts have
registered health societies after merging their vertical health societies. The common
bank account for all programmes has not yet been opened at the state health society.
It is reported that the 14 districts had action plans for the year 2008-09 while state had a
perspective health plan for the current year. All the district action plans were approved
by the State Health Society. The funding to the districts was made on the basis of
requirements of the action plan and as flexi pool funds. The funds from the state are
transferred electronically to all the 14 districts.
All together 5568 sub centres (which include 474 sub centres functioning along with
PHC) have opened the joint account in the name of ANM and Sarpanch in the state. In
addition, all CHCs, PHCs and Sub Centres have received the untied grant from the state
during the reference period.

18
Table 1.7. Period of Field survey of the selected areas in Kozhikode District 18.11.2008- 17.1.2009
CHC PHC Period of Survey 1 Kuttiyadi 1.Velam 18.11.08-30.11.08 2.Naripatta 1.12.08-15.12.08 2 Thalakulathur 1.Kakkody 16.12.08-29.12.08 2.Iravaloor 30.12.08-17.1.09
Table 1.8. Facilities covered in Kozhikode District
CHC PHC SC Selected wards
Kuttiyadi
Velam
Choimadam Ward 7 Ward 9
Cherukunnu Ward 1 Ward 3
Cherapuram Ward 10 Ward 12
Naripatta
Kaiveli Ward 6 Ward 15
Kumbalachola Ward 2 Ward 3
Thazhenaripatta Ward 9 Ward 11
Thalakulathur
Kakkody
Kakkodymukku Ward 9 Ward 11 Makkada Ward 2 Ward 20 Kiraloor Ward 13 Ward 14
Iruvallur
Maruthad SC Ward 1 Ward 3 Oloppara SC Ward 16 Ward 20 Iruvallur SC Ward 7 Ward 11
19
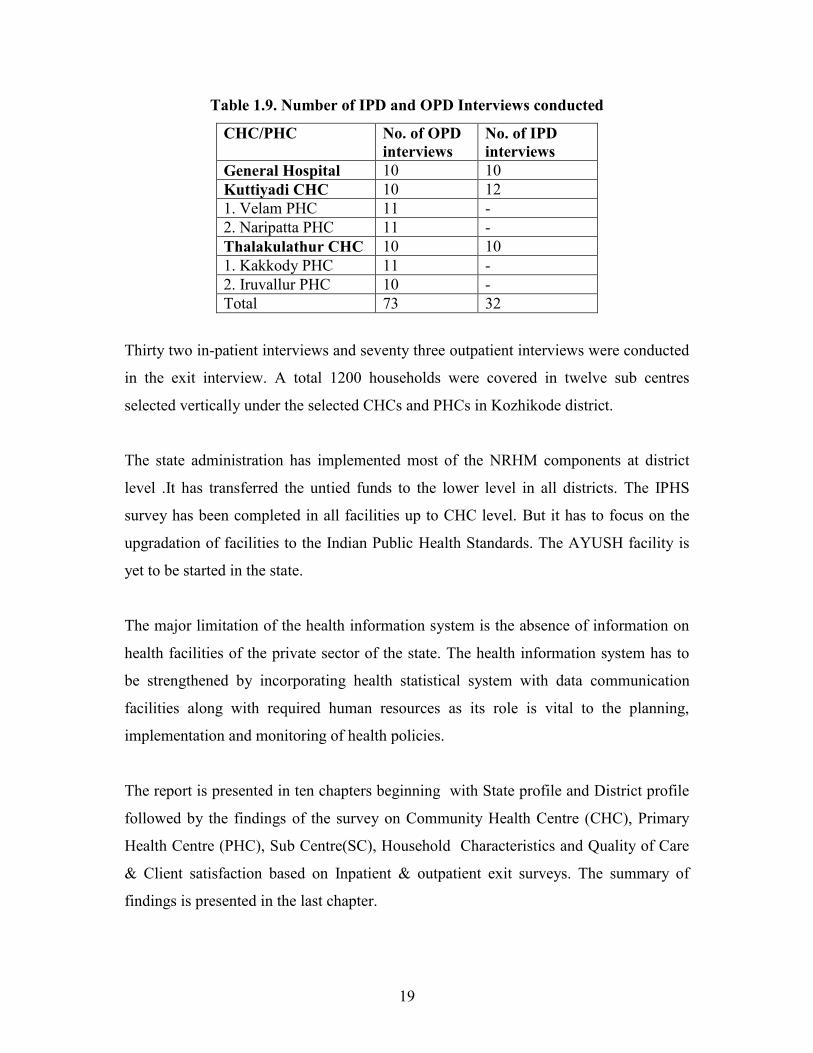
Table 1.9. Number of IPD and OPD Interviews conducted
CHC/PHC No. of OPD interviews
No. of IPD interviews
General Hospital 10 10 Kuttiyadi CHC 10 12 1. Velam PHC 11 - 2. Naripatta PHC 11 - Thalakulathur CHC 10 10 1. Kakkody PHC 11 - 2. Iruvallur PHC 10 - Total 73 32
Thirty two in-patient interviews and seventy three outpatient interviews were conducted
in the exit interview. A total 1200 households were covered in twelve sub centres
selected vertically under the selected CHCs and PHCs in Kozhikode district.
The state administration has implemented most of the NRHM components at district
level .It has transferred the untied funds to the lower level in all districts. The IPHS
survey has been completed in all facilities up to CHC level. But it has to focus on the
upgradation of facilities to the Indian Public Health Standards. The AYUSH facility is
yet to be started in the state.
The major limitation of the health information system is the absence of information on
health facilities of the private sector of the state. The health information system has to
be strengthened by incorporating health statistical system with data communication
facilities along with required human resources as its role is vital to the planning,
implementation and monitoring of health policies.
The report is presented in ten chapters beginning with State profile and District profile
followed by the findings of the survey on Community Health Centre (CHC), Primary
Health Centre (PHC), Sub Centre(SC), Household Characteristics and Quality of Care
& Client satisfaction based on Inpatient & outpatient exit surveys. The summary of
findings is presented in the last chapter.

20
Chapter 2
District Profile
In Kerala state, Kozhikode district was identified for the rapid appraisal of critical
components of National Rural Health Mission (NRHM). The district has historical
importance as it was the headquarters of Zamuthiri Kingdom and later was part of
Madras province before integrating to Kerala state. Kozhikode is bounded on the north
by Kannur district, on the east by Wayanad district, on the south by Malappuram district
and on the west by the Arabian sea. Total area of the district is 2344 sq. kms which
accounts for six percentage of the total area of the state and its coastal length is about 80
KM. Of the total area, 2004 Sq. Kms is rural and 340 Sq. Kms urban. The highland
region accounts for 26.80 per cent and the lowland region for 15.55 per cent of the total
area. Kozhikode district consists of three taluks, 12 Blocks, 77 panchayats and 117
villages.
Part A
2.1 Population Characteristics
Thirty eight percent of the population lives in urban areas of the district. Seven percent
of the total population (2879131) of the district belongs to SC/ST category and ST
population constitute about 0.2 percent (Table 2.1). In rural area 8.3 percent are SC/ST
as compared to 5.5 percent in urban area. The sex distribution of population in rural and
urban areas is presented in Table 2.2. The share of males in the respective caste
categories is slightly more than females in rural and urban areas .The sex ratio of the
population of urban area is less than that of the district average of 1057 (Table 2.3).
Caste wise sex ratio indicates that, both in SC and ST categories it is on lower side as
compared to the district average of 1057. A sex ratio of 938 females per 1000
scheduled tribe males in urban area needs attention.

21
Table 2.1 Percent distribution of Total population by caste & residence, Kozhikode District, 2001
Rural Urban Total SC 8.0 5.39 7.0 ST 0.3 0.05 0.2 Others 91.7 94.56 92.8
Total 100.0(177797
4) 100.0(110115
7) 100.0(287913
1)
Table 2.2 Percent distribution of population by caste, sex and residence, Kozhikode District, 2001
Caste
Rural Urban Total
Male % Female % Male % Female % Male % Female %
SC 69531 8.1 72081 7.9 28855 5.4 30516 5.39 98386 7.0 102597 6.9
ST 2652 0.3 2761 0.3 272 0.1 255 0.05 2924 0.2 3016 0.2
Others 791449 91.6 839500 91.8 506599 94.6 534660 94.56 1298048 92.8 1374160 92.9
Total 863632 100.0 914342 100.0 535726 100.0 565431 100.0 1399358 100.0 1479773 100.0
Table 2.3.Sex Ratio of population by caste & residence, Kozhikode District, 2001 Rural Urban Total SC 1037 1058 1043 ST 1041 938 1031 Others 1061 1055 1059 Total 1059 1055 1057
The state NRHM authorities are not aware of any projected figures of the population of
the state or district for different years of the plan period including the year 2008. The
projected figures need to be disseminated to the state health authorities.
2.2 Status of NRHM Interventions
Improving the infrastructure facilities in the public health institutions is one of the key
components of NRHM. Information on the status health infrastructure, facility
upgradation under NRHM and availability of human resources, Rogi Kalyan Samiti,
Janani Suraksha Yojana, financial mechanism at the district and assessment of health
and family welfare situation at the village level are furnished in this section.

22
2.2.1 Health Infrastructure
Table 2.4 provides details on the public health infrastructure facilities. New buildings
are under construction for eight CHCs and one FRU as on June 30, 2008. All the FRUs
(4), sub divisional hospitals (2) and one district hospital have completed the IPHS
facility survey but the upgradation of facilities to the IPH standards has not been
completed. It seems that the upgradation is progressing in a time bound manner.
Table 2.4 Public health Infrastructure facilities
Infrastructure Public Health Infrastructure
Total Existing (In Nos.) (As on
30.6.2008)
New Buildings
Under Construction
(In Nos.) (As on
30.6.2008)
Total Number
where IPHS facility survey
completed (As on
30.6.2008)
No. of facilities where IPHS Upgradation
completed (As on 30.6.2008)
Sub Centre 305 0 0 0 PHC 69 0 0 0 24x7 PHCs 1 0 0 0 CHC 11 8 11 0 First Referral Units (FRUs)
4 1 4 0
Mobile medical units 0 Sub Divisional Hospitals 2 0 2 0 District Hospitals 1 0 1 0 AYUSH Not
Available
Out of the 305 sub centres and 62 PHCs in the district, none of them completed IPHS
facility survey or IPHS upgradation facilities. There is only one PHC working on 24x7
basis in the district. The facilities of mobile medical units and AYUSH have not stated
in the district yet. The establishment of IPH standards to the CHCs, district and other
hospitals has to take place in the district along with the operational mobile medical unit.
23
AYUSH concept needs more focus at state level to translate into the district health
system.
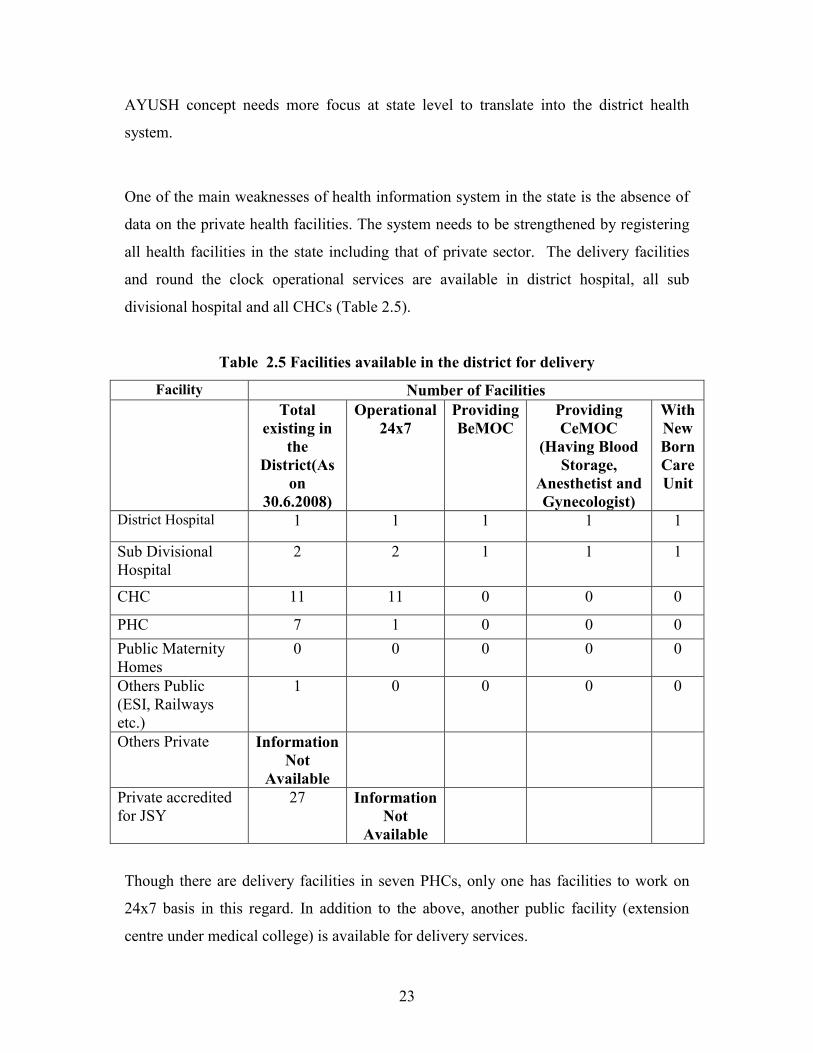
One of the main weaknesses of health information system in the state is the absence of
data on the private health facilities. The system needs to be strengthened by registering
all health facilities in the state including that of private sector. The delivery facilities
and round the clock operational services are available in district hospital, all sub
divisional hospital and all CHCs (Table 2.5).
Table 2.5 Facilities available in the district for delivery
Facility Number of Facilities Total
existing in the
District(As on
30.6.2008)
Operational 24x7
Providing BeMOC
Providing CeMOC
(Having Blood Storage,
Anesthetist and Gynecologist)
With New Born Care Unit
District Hospital 1 1 1 1 1
Sub Divisional Hospital
2 2 1 1 1
CHC 11 11 0 0 0
PHC 7 1 0 0 0 Public Maternity Homes
0 0 0 0 0
Others Public (ESI, Railways etc.)
1 0 0 0 0
Others Private Information Not
Available
Private accredited for JSY
27 Information Not
Available
Though there are delivery facilities in seven PHCs, only one has facilities to work on
24x7 basis in this regard. In addition to the above, another public facility (extension
centre under medical college) is available for delivery services.

24
But emergency and critical care related to delivery like BeMOC, CeMOC and new born
care facilities are available in one sub divisional hospital and district hospital only. The
extension of emergency delivery care and new born care need to be integrated to the
services of CHC and 24x7 PHC.
There are twenty seven private facilities accredited for JSY in the district but other
information is not available. In this case also the details regarding the private health
institutions are not available with the district medical authorities.
2.2.2 Human Resources
Table 2.6 Human Resources Available in the District Category No.
sanctioned
Regular in
Position
Contractual
Recruits
Total in
Position
Medical Officer 273 254 5 259
Gynecologist * 8 8
Anesthetist 6 6
Pediatrician 25 25
Other Specialists 93 93
Staff Nurses 896 876 876
ANM 419 411 411
No specialist posts are sanctioned
The specialists‟ posts are not sanctioned in the district but there are eight Gynecologist,
six Anesthetist and 25 Pediatricians working in the heath system of the district (Table
2.6). Out of the 273 sanctioned Medical Officer‟s posts, 259 are in position including 5
doctors appointed on contract basis thereby making a shortage of 14 Medical Officers.
There are 93 other specialists providing service in the district. As regards the position
of both Staff Nurses and ANMs 98 percent are filled up or is in position or in other
words, there is a shortage of twenty staff nurses and eight ANMs in the district.

25
2.2.3 Rogi Kalyan Samiti (RKS)
In Kerala, Rogi Kalyan Samitis (RKS) are known as Hospital Management Society
(HMS).In all the facilities of the district the RKS are registered and functioning well. It
is reported that there are sixty nine RKS at PHC level (Table 2.7).
Table 2.7 Rogi Kalyan Samitis (RKS)
Number of facilities having Rogi Kalyan Samitis (RKS) Registered
Total functioning No. with Registered RKS
District Hospital 1 1
Sub Divisional Hospital 2 2
CHC 11 11
PHC 69 69
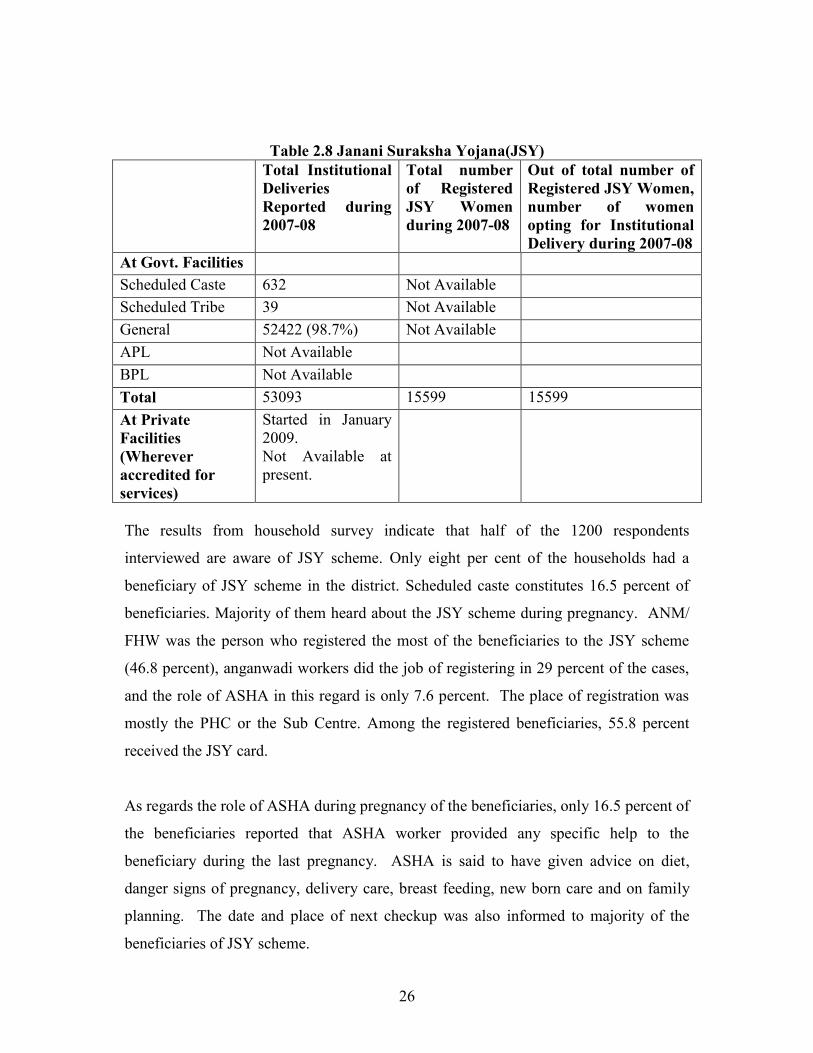
2.2.4 Janani Suraksha Yojana (JSY) The details on the number of institutional deliveries, number of registered JSY women
and the number of JSY women opting for Institutional Delivery during 2007-08 are
provided in this section. The total institutional deliveries of the district in 2007-08 were
53093 and out of this SC/ST women constitute only 1.3 percent (Table 2.8). The caste
wise break up of JSY beneficiaries are not available as such data are not recorded .The
total JSY beneficiaries registered during 2007-08 was 15599. The public private
participation (PPP) in JSY is a recent programme started in the district in January 2009
with 27 accreditations. As it is in the initial stage the data are not available.
26
Table 2.8 Janani Suraksha Yojana(JSY)
Total Institutional Deliveries Reported during 2007-08
Total number of Registered JSY Women during 2007-08
Out of total number of Registered JSY Women, number of women opting for Institutional Delivery during 2007-08
At Govt. Facilities Scheduled Caste 632 Not Available Scheduled Tribe 39 Not Available General 52422 (98.7%) Not Available APL Not Available BPL Not Available Total 53093 15599 15599 At Private Facilities (Wherever accredited for services)
Started in January 2009. Not Available at present.
The results from household survey indicate that half of the 1200 respondents
interviewed are aware of JSY scheme. Only eight per cent of the households had a
beneficiary of JSY scheme in the district. Scheduled caste constitutes 16.5 percent of
beneficiaries. Majority of them heard about the JSY scheme during pregnancy. ANM/
FHW was the person who registered the most of the beneficiaries to the JSY scheme
(46.8 percent), anganwadi workers did the job of registering in 29 percent of the cases,
and the role of ASHA in this regard is only 7.6 percent. The place of registration was
mostly the PHC or the Sub Centre. Among the registered beneficiaries, 55.8 percent
received the JSY card.
As regards the role of ASHA during pregnancy of the beneficiaries, only 16.5 percent of
the beneficiaries reported that ASHA worker provided any specific help to the
beneficiary during the last pregnancy. ASHA is said to have given advice on diet,
danger signs of pregnancy, delivery care, breast feeding, new born care and on family
planning. The date and place of next checkup was also informed to majority of the
beneficiaries of JSY scheme.

27
ASHA volunteers can initiate the JSY along with ANM and Anganwadi worker at the
community level which will lead to safe delivery and child survival. Now ASHAs are at
their initial stage of positioning in the village with two modules of training. ASHA can
facilitate in delivering the cash benefits to the beneficiaries but providing assistance in
transporting and accompanying the pregnant woman need to be ensured. The reported
limitations related to the training and provision of medical kit of ASHA can be
improved with further modules of training. But the services of ASHA were accepted by
the society at Sub Centre level and they were appointed with the recommendation of
panchayat officials or ANM or MSS or Kudumbasree to ensure quality.
2.2.5 Financial Mechanisms
The financial information was collected from the district accounts officer of the District
Programme Management Unit of NRHM. All the vertical societies of different
programmes of Kozhikode district were merged to a single society at district level and it
is registered. But the district health society has not opened single bank account for all
the programmes. The funds are being received by district based on its activities, as flexi
pool funds and based on certain formula parameters like size of the district. The transfer
of NRHM funds from the state was facilitated to the district through electronic transfer
of funds.
Another basic information lacking in the district is the district plan and it needs
attention of authorities. It is mandatory for every district to have integrated district
action plan under NRHM. All sub centres (305) had joint bank accounts in the name of
ANM and Sarpanch.
All PHCs and Sub Centres under the district have received the untied grant for the
current year. In the case of CHCs, nine out of eleven only received the untied grants.
The electronic transfer of funds facilitated easier access at all levels. The health centres
could do the maintenance of the respective health facilities with the help of untied funds
and user‟s fees generated by them. The health facilities are following a transparent
mechanism with the involvement of PRIs in the financial management of the centres.

28
2.2.6 Health and Family welfare situation at village level An overall picture of the health and family welfare situation is discernible from the
household interviews and the facilities available that cater to the general needs of the
population can assessed from the information collected from the CHCs, PHCs and the
SCs. Wards are the basic unit of study in the state and the average distance from PHC
to farthest SCs, that from the PHCs to CHC are not too long (around 10 kms) and the
time taken to reach the centres is just around half an hour. Most of the SCs are working
in government buildings. The upgradation of health facilities to Indian public health
standards is one of the key component of NRHM. But the district is lagging behind in
achieving the goal as none of the health facilities are upgraded to the IPH standards.
People at village level are aware of the disease proneness of the area regarding
incidences of Malaria, Jaundice, Measles and Gastroenteritis. The outbreak in last six
months of these diseases were reported in the survey within a variation of two to ten
percent. Awareness and practice of preventive measures adopted by the respondents to
keep away the common childhood diseases are also good because medical attention was
reported to be given as a primary step to illnesses like fever, persistent cough, loose
motion and diarrhea. The general sense of hygiene of the selected household population
appears to be good because majority of the households selected dispose the waste
generated either by burning or burying in pit.
Almost half the households under study are BPL households. Over two-thirds each are
from medium and high standard of living category respectively. Allopathy is the mostly
used system of medicine followed by Ayurveda, Homeopathy. Only a small proportion
(about one percent) of the people report using Yoga and Naturopathy, Unani or Siddha.
Respondents mostly take serious patients to District/Sub District hospital.
Utilization of Government health Facility in the last 6 months was reported by more
than half of the households with no difference among households located in the Sub
Centre Head Quarter wards and other wards in the district. Health problems among the
aged population are visible here for 16 percent of the respondents seeking treatment in

29
Government health facility are aged 60+ years. Females dominate in the number
seeking treatment.
Majority of the respondents are aware of different family planning methods. Most of
those interviewed feel that the ideal gap between the first and second child is 3 or more
years and the spacing methods known to more than two-thirds of the respondents are
IUD, Oral pills and Nirodh/Condom. About 14 percent of the respondents are ignorant
about the spacing methods.
Majority of respondents have heard about HIV (AIDS). Eighty eight percent of the
respondents know that AIDS is transmitted through sexual contact, nearly 67 percent
are of the view that sharing needles and syringes can transmit AIDS. Misconceptions
on the modes of transmission still prevail in the community in small proportions.
Important source of information on HIV/AIDS is the television, radio, news papers and
Health workers.
Part B 2.3 Health facilities at the District Hospital
2.3.1 Location and status of IPHS Identification details of the District Hospital were collected from the medical
Superintendent of the hospital. The Government district
hospital of Kozhikode is also
known as the Beach hospital
housed in a building
constructed in 1951.
District hospital, Kozhikode
30
The nearest Community Health Centre under the district hospital is thirteen kilometers
away from the district hospital and can be reached within twenty minutes. The farthest
CHC is situated fifty kilometers away from the district hospital and need two hours
journey to reach there. The nearest bus stop to the hospital is within five hundred meters
distance. The IPHS facility survey has been carried out in the district hospital.
The upgradation facilities of the hospitals and health centers to IPH standards have to be
started in the district. Similarly the extension of health delivery services to round the
clock has to gain momentum. The vacancies of the medical, paramedical and support
staff have to be filled at district hospital to PHC levels urgently for the effective health
care delivery to achieve the targets of NRHM at the district. Mobile medical units and
AYUSH facilities are yet to start in the district.
The strengthening of health information system is urgently needed as part of the
mission at the district and state levels. Infrastructure facilities for data communication
and strengthening the statistical system along with the supporting human resources are
the minimum requirements for the success of the mission.
2.3.2 Physical infrastructure
The total area of the district hospital which is situated in a residential area is eight
thousand and two hundred square meters and five hundred and fifty indoor beds are
available there. But the environmental clearance from the Pollution Control Board is
not obtained by the hospital and the building is not disable friendly as per the provisions
of disability act.
2.3.2.1 Administrative Block
Enough waiting space is available adjacent to each consultation and treatment room.
Registration counter, blood bank, doctor‟s duty room, treatment room, pharmacy,
intensive care unit and examination and preparation room are available in the hospital.

31
At the same time, isolation room, high dependency wards and critical care area are not
available in the hospital.
The district hospital has a kitchen, central sterile and supply department, laundry,
medical and general stores, ventilation in the wards and water coolers or refrigerators.
An overhead water storage tank with pumping and boosting arrangements is made in
the hospital. Thus round the clock water supply is available in the hospital. Drainage
and sanitation system for waste water, surface water, sub soil water and sewerage are
properly maintained in the hospital. The bio-medical waste is disposed by outsourcing
the activity to an agency and three different bins are used to segregate the bio-medical
waste. But engineering services backup and provision for firefighting do not exist in the
hospital.
Residential quarters are available in the district hospital for the staff. Among the
available three quarters, two were occupied by the medical staff. Only hostel facility is
available for the Para medical staff. Fifteen hostel rooms are occupied by thirty staff of
the hospital. There is acute shortage of accommodation facility for the medical and
paramedical staff of the district hospital.
The disease classification is being carried out as per the protocol and medical records
section is also working in the hospital. Though communication facilities like, telephone,
fax and computers are available, the internet facility is not available in the district
hospital.
2.3.2.2 Hospital Services
Obstetrics and Gynecology section
Details of Obstetrics and Gynecology section were collected from the civil surgeon in
the hospital. A separate female ward is maintained in the hospital which has two
hundred beds. Bed occupancy rate for the last twelve months in the female ward is 80
percent and in the last three calendar months, 2415 out patients were recorded here. A

32
separate operation theatre is available for the Gynecology and Obstetrics department.
Six hundred and twenty five deliveries were conducted in the last three months and
2325 deliveries in the last one year. Among these, 700 cases were Caesarian section and
697 cases were assisted delivery and eight Forceps delivery were also done in the last
one year. On an average 194 deliveries were performed per month. Out of the deliveries
only two- fifths was normal and thirty percent was caesarian. Caesarian section for JSY
was done but the number is not recorded in the hospital.
The facility for Medical termination of pregnancy is also available in the hospital and in
the last one year, 40 cases were carried out. No mid trimester abortion was carried out
during the reference period. The facilities like Sterilization, Suturing Cervical Tear and
Hysterectomy are available in the hospital. During 2007-2008, 600 sterilization, three
suturing cervical tear and 246 hysterectomy cases were conducted in the district
hospital.
Table 2.9 Procedures carried out in the Obstetrics and Gynecology department
Services available Services not available
Caesarean section deliveries, Caesarean section
for JSY, Assisted delivery, Forceps delivery,
MTP, Mid trimester Abortion, Sterilization,
Suturing Cervical Tear, Hysterectomy
Ectopic Pregnancy, Retained
Placenta, Eclampsia, PPH, Infertility
Treatment
Ectopic pregnancy, Retained Placenta, Eclampsia and PPH are not available in the
hospital. The treatment for infertility is also not offered in the hospital.
Surgical section
Information about the surgical ward was taken from the sister in- charge of the ward. In
the last three months, total of 5400 surgical out-patients were registered in the hospital
out of which females constitute 44 percent.

33
Table 2.10 Services available in the Surgical Department
Services available Services not available
Emergency (Accident & other emergency)
(Casualty), Pancreas surgery, Abdomen
surgery, Breast surgery
Spleen and Portal Hypertension surgery,
Leprosy Reconstructive surgery
Among the total 588 in- patient cases, 300 (52 percent) were females and 288 cases
were males. The facilities like, Emergency care, Pancreas surgery, Abdomen surgery
and Breast surgery are offered in the hospital and in the last three months 680
emergency cases were recorded in the hospital. About 27 emergency cases were
attended by the surgical section per month.
Spleen and portal hypertension surgery and Leprosy reconstructive surgery are not
available in the hospital.
Medical section
Table 2.11 Services available in the Medical Department
Services available Services not available
Services under NLEP, Pleural Aspiration,
Pleural Biopsy, Lumbar Puncture, Skin
scraping for fungus/ AFB, Bone Marrow
Biopsy, Psychiatry services
Dermatology and Venerology (Skin &
VD) RTI/STI, Bronchoscopy, Pericardial
tapping, Endoscopic Specialised
Procedures
Details about Medical section were collected from the staff nurse in-charge of the
medical ward. Out of the 7875 OP patients, 56 percent were females. On an average
2625 out-patients have been registered per month in the medical section. A total number
of 4210 in- patients were registered during the last three months out of which 60.5
percent were females. Services under NLEP, Pleural aspiration, Pleural biopsy, Lumbar
puncture, Skin scraping for fungus or AFB, Bone marrow biopsy and Psychiatry
services are available in the hospital. At the same time, Dermatology and Venerology
(Skin and VD) RTI/STI, Bronchoscopy, Pericardial tapping and Endoscopic Specialised
procedures are not offered in the hospital.

34
Pediatric section
Information about Pediatric section was collected from the Head Nurse in-charge of the
Pediatric ward. In the year 2007-2008, the OPD of pediatric section registered 25500
children of which 49 percent were female children.
Table2.12 Equipments available in the Pediatric Section
Available Not available
Cradle, Incubator, Radiant Heat Warner,
Phototherapy unit, Laryngoscope, Oxygen
Mask, Suction Machine, Thermometer
Bag with Mask
Four beds are available for newborn care. The total number of patients admitted in the
Pediatric ward during the year 2007-2008 was 1819. Majority (82 percent) were
children above one year and below five years of age. Neonates constitute about 8
percent and infants up to one year were 181. The services like Asphyxia management,
Management of severe malnourished children, Management of Neo natal sepsis,
Management of dehydration and diarrhoeal cases and Management of respiratory tract
or pneumonia cases are offered in the Pediatric ward.
The necessary equipments like, Cradle, Incubator, Radiant heat warmer, Phototherapy
unit, Laryngoscope, Oxygen mask, Suction machine and Thermometer are available in
the hospital and all are in working condition. But Bag with mask is not available there.
The drugs like ORS (WHO new formula), Vitamin A solution and Pediatric antibiotics
are available in the hospital. Iron folic acid syrup is not available but the tablet for the
same is available there.
Diagnostic section
Particulars of Diagnostic section were taken from the Public Relation Officer of the
hospital. During the last three months, a total of 3580 OP patients were diagnosed of
which 70 percent were females.

35
The facilities like X-ray, Ultrasound, and ECG are available in the hospital. During the
last three months period, 2500 X-rays and 1200 Ultrasound scans and 2863 ECGs have
been taken in the hospital.
Lab Services
Details of lab services were answered by senior lab technician of the hospital. During
the last three months period, 2500 females and 2000 used the lab facility of the hospital.
The equipments to carry out Haematology, Urine analysis, Stool analysis, Sputum,
Serology and Biochemistry are available in the hospital. Seven thousand haematology,
3500 urine analysis, 60 stool analysis, 572 sputum, 200 serology and 3700 biochemistry
tests have been carried out in the last three months.
Table 2.13 Availability of Lab Services
Available Services Not available
Haematology, Urine Analysis
Stool Analysis, Sputum
Serology, Biochemistry
Semen Analysis
CSF Analysis (cell count, culture sensitivity etc., gram
staining), Aspirated fluids (cell count cytology), PAP
smear, Split Skin Smear Examination for Leprosy,
Histopathology, Microbiology, Physiology
(Pulmonary function test)
Semen analysis (morphology count) CSF analysis (cell count, culture sensitivity etc.,
gram staining), Aspirated fluids (cell count cytology), PAP smear, Split skin smear
examination for leprosy, Histopathology, Microbiology and Physiology (Pulmonary
function test) testing facilities are not available in the hospital.
2.4 Human resources The details of human resources of the hospital were collected from the statistics section
of the office of Medical Superintendent of the hospital. One Hospital Superintendent
post was allotted to the hospital and at present the post is occupied. Six medical
specialists are sanctioned and only four among them are occupied.

36
Table 2.14 Availability of Human resources in the district hospital
No. Category Sanctioned Regular in position
Contractual in position Total Vacancy
to be filled 1 Hospital Superintendent 1 1 0 1 0 2 Medical Specialist 6 4 0 4 2 3 Surgery Specialist 4 4 0 4 0 4 Gynecologist 8 6 0 6 2 5 Pediatrician 4 4 0 4 0 6 Anesthetist 3 2 1 3 1 7 Radiologist 1 1 0 1 0 8 General Duty Doctor 4 3 0 3 1 9 Psychiatrist 2 1 0 1 1 10 Dermatologist/ Venerologist 2 0 0 0 2 11 ENT Surgeon 4 4 0 4 0 12 Ophthalmologist 4 4 0 4 0 13 Orthopaedician 4 3 0 3 1 14 Dental Surgeon 2 2 0 2 0 15 Staff Nurse 115 112 0 112 3 16 Hospital Worker 59 46 0 46 13 17 Sanitary Worker 79 59 0 59 20 18 OphthalmicAssistant/ Refractionist 4 4 0 4 0 19 Social Worker 1 0 1 1 0 20 ECG Technician 2 2 0 2 0 21 Laboratory Technician 7 5 1 6 2 22 Laboratory Assistant 1 1 0 1 0 23 Dietician 1 1 0 1 0 24 JPHN 2 2 0 2 0 25 Radiographer 1 1 0 1 0 26 Pharmacist 7 7 0 7 0 27 Matron 5 4 0 4 1 28 Physiotherapist 1 1 0 1 0 29 Medical Records Officer 1 1 0 1 0 30 Manager 1 1 0 1 0 31 Office Superintendent 1 1 0 1 0 32 Driver 3 2 0 2 1
33 Peon 2 2 0 2 0

37
Four surgeries, specialist posts are sanctioned in the hospital and four posts are
occupied by regular staff in position. Among the eight sanctioned Gynecologist‟s post,
only six are occupied, showing a shortage of two Gynecologists. Four pediatrician posts
are sanctioned and four are occupied there. Including one contractual in position and
two regular staff, the post of Anesthetist is fully occupied. One Radiologist is
sanctioned and is occupied. Among the four sanctioned General duty doctors, only three
are filled up in the district hospital. Two Psychiatrist posts are sanctioned in the hospital
but one is vacant. The available two posts of Dermatologist are vacant. Four ENT
Surgeon posts are occupied. Four Ophthalmologist posts are in position. Among the
four sanctioned Orthopaedicians, three are occupied by regular staff and one post is
vacant. Two Dental surgeon posts are allowed and are occupied by regular staff.
Altogether fifty one vacancies in various positions are vacant. Vacancies of specialists
like Anesthetist and Gynecologist have to be filled. Shortage is reported in the support
staff category like hospital worker and sanitary workers. Public Health Manager,
AYUSH Physician, Pathologists and Microbiologist posts are not sanctioned in the
district hospital.
Four Ophthalmic posts are sanctioned in the hospital and are occupied by regular staffs.
One Social worker working in the hospital is on contractual basis and two ECG
technicians are allowed and are occupied by regular staffs. Out of seven Laboratory
technicians, five are regular in position and one post is occupied by contractual staff.
The sanctioned post of one Laboratory attendant is in position. One Dietician post is
sanctioned and is occupied by regular staff. Two JPHN posts are allowed and are
regular in position. One post each sanctioned for Radiographer, Physiotherapist and
Medical records officer or technician in the hospital all are working on regular basis.
Seven Pharmacists are sanctioned and are regular in position. Among the sanctioned
five Matron posts, four are regular in position and one post is vacant.

38
In the administrative section, one Manager and one office Superintendent were posted
on regular basis. Among the three sanctioned driver posts only two are occupied. The
sanctioned two Peon posts are occupied and are regular in position.
The Rogi Kalyan Samiti is established and registered for the hospital and is known as
Hospital Management Society. Additional revenue was generated through user fees by
charging for consultation and procedures while patients belonging to BPL, SC and ST
are exempted from payment. The eligibility criterion for the exemption of user fee is
decided on the basis of BPL ration card or certificate by hospital authorities or
Government or Revenue certificates. The funds generated by Rogi Kalyan Samiti are
retained within the facility for local use. The feedback mechanism is operated through a
complaint box placed at the hospital. Complaints and suggestions received through the
complaint box are discussed in the RKS meeting for its redressal .The board showing
the number of members and number of meetings of RKS is not displayed in the
hospital.
The Rogi Kalyan Samitis are functioning well in the district at all levels with the
participation of PRIs and corrective measures are adopted through the feedback
mechanism operated by suggestion boxes.
The utilization of Government facilities has improved and the community is aware of
the preventive measures towards the outbreak of various diseases. The respondents have
reported satisfaction over the services at Government health facilities. Most of them are
aware of various family planning methods.
The family welfare programmes were more focused at PHCs and SCs in the district.
The supply of emergency contraceptives and IUDs has to be ensured at PHCs and SCs.
The ANMs need to be trained for the insertion and removal of IUDs so that the service
can be provided at Sub Centre level. There is a need of awareness creation programmes
at village level as fourteen percent of the eligible women were not aware of spacing
methods.

39
Chapter 3
Community Health Centres
Community Health Centres are established and maintained by the State Governments,
manned by four specialists i.e. Surgeon, Physician, Gynecologist and pediatrician and
supported by 21 paramedical and other staff, a CHC has 30 indoor beds with one OT, X
ray facility, a labour room and laboratory facility. It serves as a referral centre for 4
PHCs. One of the key components of NRHM is the strengthening of Community Health
Centres to Indian Public Health Standards. Kerala state has 114 Community Health
Centers functioning across the 14 districts. Out of these CHCs eleven are in Kozhikode
district.
For the purpose of the study the list of all CHCs in Kozhikode district was prepared and
two were selected for the evaluation using the criteria given by the MOHFW. The
farthest CHC from the district head quarters named Kuttiyadi CHC was the only CHC
with FRU status and hence formed one of the selected CHC. Kuttiyadi CHC is located
in Vadakara taluk. The second CHC selected was Thalakulathur CHC located in
Kozhikode taluk.
Community Health Centre, Kuttiyadi
Community Health Centre, Thalakulathur

40
The present chapter deals with the information about selected Community Health
Centres. It includes the coverage and availability of infrastructure in the community
health centres, position of medical, paramedical and support staff, availability of
specific services in the CHC, status of specific interventions, status of residential
facilities for doctors and other staff, availability of laboratory facilities and number of
laboratory tests conducted, number of surgeries performed, status of performance of
labour rooms, status of availability of equipments and drugs etc. in the selected
community health centres and information about service outcome of the CHCs.
3.1 Coverage and Availability of Infrastructure in Community Health Centres Population coverage, distance and time taken to travel from the selected CHCs to the
PHCs are shown in Table C1.1. Population served by Kuttiyadi CHC is 2,27,219
persons and that of Thalakulathur Community Health Centre is 1,51,700. The distance
from the CHC to the nearest PHC is 5 km and that to the farthest PHC in Kuttiyadi is 12
kms. It takes 10 minutes to reach the nearest PHC and 25 minutes to reach the farthest
PHCs. In Thalakulathur the nearest PHC is 7 km away from the CHC whereas farthest
is 13 km from there and it takes 20 minutes and 40 minutes to reach the respective
PHCs.
Table C1.1 Coverage and Availability of Infrastructure Coverage
Coverage Kuttiyadi CHC
Thalakulathur CHC
Population Served by the CHC Numbers 227,219 151,700 Nearest PHC Coverage Area Distance 5 7 Time 10 20 Farthest PHC Coverage Area: Distance 12 13 Time 25 40 District Hospital Area: Distance 65 12 Time 120 40 No of Beds: Male 28 9 Female 76 9

41
Distance from Thalakulathur CHC to the District hospital is 12 km and can be reached
in 40 minutes whereas from the farthest CHC to the District hospital is 65km and can be
reached in 2 hours time. There are 28 beds for men and 76 beds for women in Kuttiyadi
CHC as against 9 beds each for men and women in Thalakulathur.
The availability of facilities as given in Table C1.2 shows that the selected CHCs have
their own building and regular electricity supply. Kuttiyadi CHC has other facilities like
30 or more beds, generator, telephone, computer, Internet connection, ambulance and
laboratory facilities. Thalakulathur CHC does not have the required number of 30 beds,
generator and ambulance service. Telephone, computer, internet facility and laboratory
facilities are however available in Thalakulathur CHC.
Table C1.2 Availability of Infrastructure
Availability of Infrastructure Kuttiyadi CHC
Thalakulathur CHC
Status of Building Own Government Building 1 1 Rented Premises - - Other Rent: Free Building - - Electricity in all parts: No Regular electricity supply - - Regular electricity supply in all parts 1 1 30 or more beds Yes 1 - No - 1 Generator Yes 1 - No - 1 Telephone Yes 1 1 No - - Computer Yes 1 1 No - - Internet Connection Yes 1 1 No - - Running Vehicle/Ambulance Yes 1 - No - - Laboratory Yes 1 1 No - -

42
The availability of investigative facilities as shown in Table C.1.3 reveals that ECG, X-
ray, operation theatre, OT used for Gynecology, labour room with separate areas for
Septic and Aseptic deliveries and new born care corner are available in Kuttiyadi centre.
Thalakulathur CHC does not have ECG and X-ray facilities. Even though Operation
Theatre (it is also used for gynecological purposes) and labour room are available in
Thalakulathur CHC, there are no separate areas for septic and aseptic deliveries and
new born care corner. But ultra sound facility is not available in both the Centres.
Table C.1.3 Availability of Infrastructure
Availability of Infrastructure Kuttiyadi CHC
Thalakulathur CHC
Investigative facilities ECG Yes 1 - No - 1 X Ray Yes 1 - No - 1 Ultrasound Yes - - No 1 1 Operation Theatre Yes 1 1 No - - OT used for Gynecology Yes 1 1 No - - Labour Room Availability Yes 1 1 No - - Separate Areas for Septic and Aseptic Deliveries Yes 1 - No - 1 New Born Care Corner Yes 1 - No - 1
Table C.1.4 reveals that the two centres are seen to be maintaining record for JSY
beneficiaries. Pharmacy for drug dispensing and drug storage is available in the selected
two centres. There are counters working near the entrance of both CHCs (Kuttiyadi and
Thalakulathur) distributing contraceptives ORS packets, vitamin A and medicines. A
separate public utility (toilets) for males and females is available only at Kuttiyadi
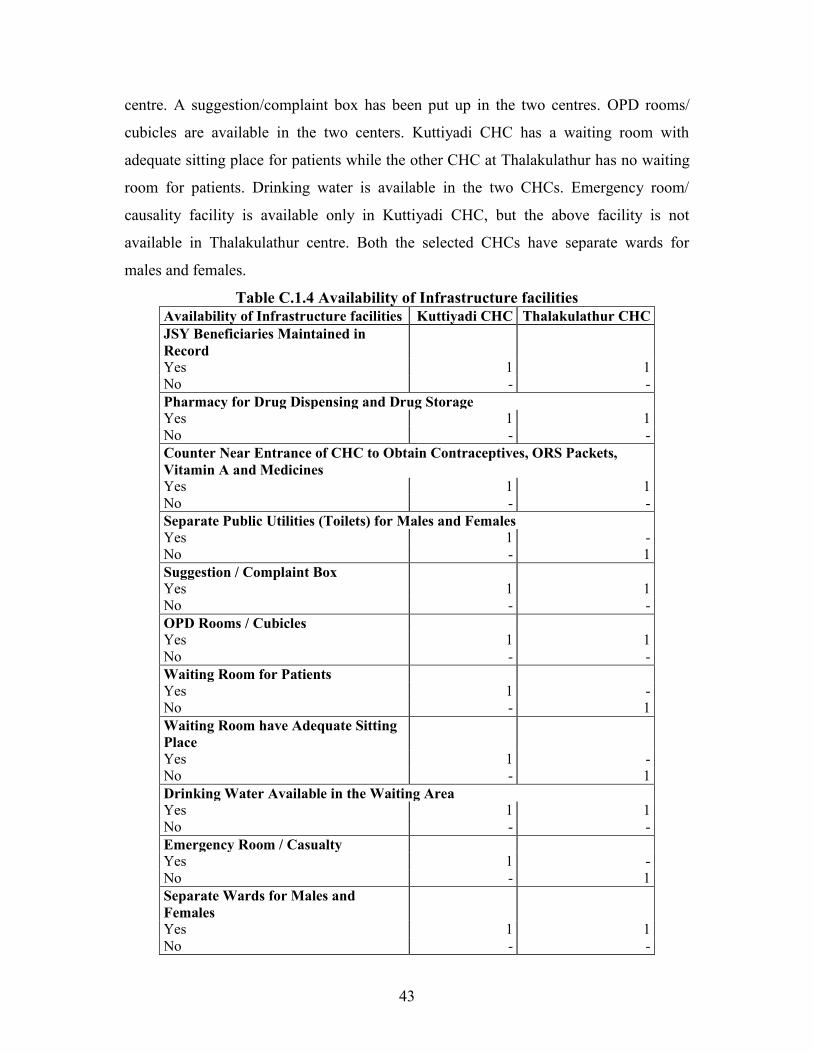
43
centre. A suggestion/complaint box has been put up in the two centres. OPD rooms/
cubicles are available in the two centers. Kuttiyadi CHC has a waiting room with
adequate sitting place for patients while the other CHC at Thalakulathur has no waiting
room for patients. Drinking water is available in the two CHCs. Emergency room/
causality facility is available only in Kuttiyadi CHC, but the above facility is not
available in Thalakulathur centre. Both the selected CHCs have separate wards for
males and females.
Table C.1.4 Availability of Infrastructure facilities Availability of Infrastructure facilities Kuttiyadi CHC Thalakulathur CHC JSY Beneficiaries Maintained in Record Yes 1 1 No - - Pharmacy for Drug Dispensing and Drug Storage Yes 1 1 No - - Counter Near Entrance of CHC to Obtain Contraceptives, ORS Packets, Vitamin A and Medicines Yes 1 1 No - - Separate Public Utilities (Toilets) for Males and Females Yes 1 - No - 1 Suggestion / Complaint Box Yes 1 1 No - - OPD Rooms / Cubicles Yes 1 1 No - - Waiting Room for Patients Yes 1 - No - 1 Waiting Room have Adequate Sitting Place Yes 1 - No - 1 Drinking Water Available in the Waiting Area Yes 1 1 No - - Emergency Room / Casualty Yes 1 - No - 1 Separate Wards for Males and Females Yes 1 1 No - -
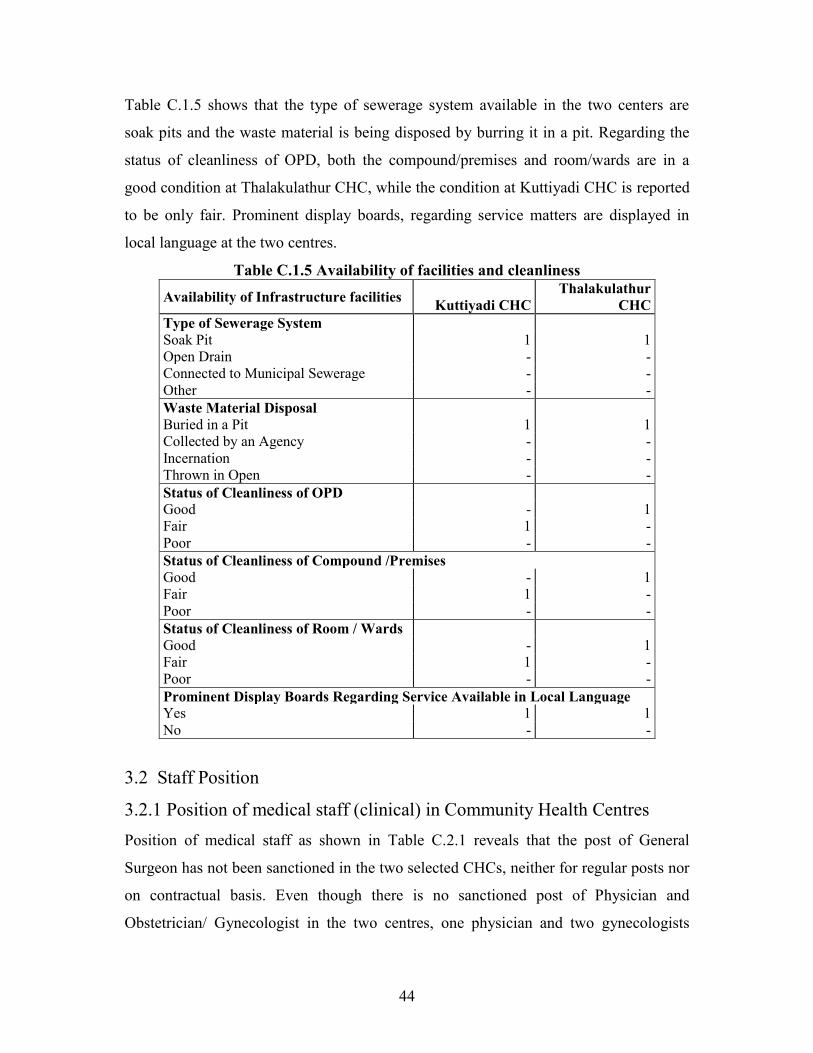
44
Table C.1.5 shows that the type of sewerage system available in the two centers are
soak pits and the waste material is being disposed by burring it in a pit. Regarding the
status of cleanliness of OPD, both the compound/premises and room/wards are in a
good condition at Thalakulathur CHC, while the condition at Kuttiyadi CHC is reported
to be only fair. Prominent display boards, regarding service matters are displayed in
local language at the two centres.
Table C.1.5 Availability of facilities and cleanliness
Availability of Infrastructure facilities Kuttiyadi CHC Thalakulathur
CHC Type of Sewerage System Soak Pit 1 1 Open Drain - - Connected to Municipal Sewerage - - Other - - Waste Material Disposal Buried in a Pit 1 1 Collected by an Agency - - Incernation - - Thrown in Open - - Status of Cleanliness of OPD Good - 1 Fair 1 - Poor - - Status of Cleanliness of Compound /Premises Good - 1 Fair 1 - Poor - - Status of Cleanliness of Room / Wards Good - 1 Fair 1 - Poor - - Prominent Display Boards Regarding Service Available in Local Language Yes 1 1 No - -
3.2 Staff Position
3.2.1 Position of medical staff (clinical) in Community Health Centres Position of medical staff as shown in Table C.2.1 reveals that the post of General
Surgeon has not been sanctioned in the two selected CHCs, neither for regular posts nor
on contractual basis. Even though there is no sanctioned post of Physician and
Obstetrician/ Gynecologist in the two centres, one physician and two gynecologists

45
have been recruited and are working at the Kuttiyadi CHC on contractual basis.
Table C.2.1 Position of medical staff (clinical) in Community Health Centres
Type of Staff Numbers in Position Kuttiyadi CHC Thalakulathur CHC General Surgeon Sanctioned - - Regular in Position - - Contractual Recruited - - Total in Position - - Physician Sanctioned - - Regular in Position - - Contractual Recruited - - Total in Position - - Obstetrician / Gynecologist Sanctioned - - Regular in Position - - Contractual Recruited 2 - Total in Position 2 - Medical Officer Trained with Short Term Obstetrics Course Sanctioned - - Regular in Position - - Contractual Recruited - - Total in Position - - Pediatrician Sanctioned - - Regular in Position - - Contractual Recruited 2 1 Total in Position 2 1 Anesthetist Sanctioned - - Regular in Position - - Contractual Recruited - - Total in Position - - Medical Officer Trained with Short Term Anesthesia Course Sanctioned - - Regular in Position - - Contractual Recruited - - Total in Position - - General Duty Medical Officer Sanctioned 8 4 Regular in Position 8 4 Contractual Recruited 1 1 Total in Position 9 5 Eye Surgeon Sanctioned - - Regular in Position - - Contractual Recruited - - Total in Position - -

46
The post of Medical Officer trained with short term obstetrics course has neither been
sanctioned nor recruited on contractual basis in the two selected CHCs. There are no
sanctioned post of Pediatrician in the selected two centers, however two pediatricians in
Kuttiyadi and one in Thalakulathur has been recruited (through NRHM) on contractual
basis. Clinical staff like anesthetist or medical Officer trained with short term anesthesia
course have not been sanctioned or recruited on contractual basis in the selected CHCs.
In case of general duty medical officer, there are eight sanctioned posts in Kuttiyadi
CHC and four in Thalakulathur centre. All the posts of general duty medical officer
have been properly filled with regular posts and in addition to this, one more general
duty medical officer has been posted in each CHC on contractual basis. Thus, the total
number of general duty medical officers in Kuttiyadi CHC and Thalakulathur CHC is 9
and 5 respectively. Both the selected CHCs do not have any eye surgeon.
3.2.2 Position of Para-medical and support staff in CHCs
There are twelve sanctioned posts of public health nurse in Kuttiyadi CHC and all the
above posts have been filled with regular posts, but in Thalakulathur centre, there is no
sanctioned post or any other post, of public health Nurse (Table C2.2). One post of
Lady Health Visitor (LHV) has been sanctioned in Kuttiyadi and two posts in
Thalakulathur centre and these posts are filled on a regular basis.
One Block Extension Educator (BEE) post has been sanctioned in each selected CHC
and is also filled on a regular basis. In Kuttiyadi centre, there is no sanctioned post of
ANM/JPHN while in Thalakulathur there are six sanctioned posts of ANM/JPHN and
all are regular posts. The sanctioned posts of staff nurse in Kuttiyadi and Thalakulathur
CHCs are 14 and 3 respectively. All the sanctioned posts are filled regular in position.
In addition to these sanctioned posts, two staff nurses have been posted on contractual
basis in Thalakulathur centre. Thus total number of staff nurses is 14 in Kuttiyadi CHC
and 5 in Thalakulathur CHC. The post of Dresser has not yet been sanctioned in
Thalakulathur centre while ten such posts have been sanctioned to Kuttiyadi centre and

47
all of them are occupied on regular basis. The sanctioned post of pharmacist/
compounder in Kuttiyadi and Thalakulathur CHCs are two and one respectively and all
of them are regular posts
Table C2.2 Position of Para-medical and support staff in CHCs
Type of Staff Numbers in Position Kuttiyadi CHC Thalakulathur CHC Public Health Nurse Sanctioned 12 - Regular in Position 12 - Contractual Recruited - - Total in Position 12 - Lady Health Visitor (LHV): Sanctioned 1 2 Regular in Position 1 2 Contractual Recruited - - Total in Position 1 2 Block Extension Educator (BEE) Sanctioned 1 1 Regular in Position 1 1 Contractual Recruited - - Total in Position 1 1 ANM Sanctioned - 6 Regular in Position - 6 Contractual Recruited - - Total in Position - 6 Staff Nurse Sanctioned 14 3 Regular in Position 14 3 Contractual Recruited - 2 Total in Position 14 5 Dresser Sanctioned 10 - Regular in Position 10 - Contractual Recruited - - Total in Position 10 - Pharmacist / Compounder Sanctioned 2 1 Regular in Position 2 1 Contractual Recruited - - Total in Position 2 1 Lab_Technician Sanctioned 2 2 Regular in Position 1 2 Contractual Recruited 1 - Total in Position 2 2

48
Type of Staff Numbers in Position Kuttiyadi CHC Thalakulathur CHC Radiographer Sanctioned - - Regular in Position - - Contractual Recruited 1 - Total in Position 1 - Ophthalmic Assistant Sanctioned 1 1 Regular in Position 1 1 Contractual Recruited - - Total in Position 1 1 Statistical Assistant/Data Entry Operator Sanctioned - - Regular in Position - - Contractual Recruited 1 - Total in Position 1 - OT Attendant Sanctioned - - Regular in Position - - Contractual Recruited - - Total in Position - - Ambulance Driver Sanctioned - - Regular in Position - - Contractual Recruited 1 - Total in Position 1 - Registration Clerk Sanctioned - 4 Regular in Position - 4 Contractual Recruited - - Total in Position - 4
.
There are two sanctioned post of lab-technician in each selected CHC. In Kuttiyadi
centre one of the posts is filled on regular basis and the other one is on contractual basis,
but in Thalakulathur, the existing posts have been filled on regular basis. The post of
radiographer has not been sanctioned to the selected CHCs, but in Kuttiyadi CHC one
radiographer has been posted on contractual basis. One post of ophthalmic Assistant is
sanctioned in each selected centres and are regular posts. The post of statistical
assistant/ data entry operator has not been sanctioned in both CHCs, but one statistical
assistant/ data entry operator is posted on contractual basis in Kuttiyadi CHC. The post
of OT attendant and ambulance driver post has not been sanctioned or filled in the
selected centers. But one ambulance driver has been recruited on contractual basis in

49
Kuttiyadi CHC. There is no sanctioned post of registration clerk in Kuttiyadi CHC, but
four such posts exist on a regular basis in Thalakulathur CHC.
3.3 Availability of specific services in CHC Information on availability of some specific services in the selected CHCs including
timing and type of functioning and different services rendered by CHCs has been
evaluated (Table C3).
Table C3. Availability of Specific Services in CHC Availability of Specific Services
Kuttiyadi CHC Thalakulathur CHC
Functioning on 24 x 7 Basis Yes 1 - No - 1 Functioning as FRU Yes 1 - No - 1 Emergency Care for Sick Children Yes 1 - No - 1 Full Range of Family Planning Services Yes 1 - No - 1 AYUSH Services Yes - - No 1 1 VCTC Yes - - No 1 1 Cataract Surgery Yes - - No 1 1 Treatment of STI/RTI Yes 1 1 No - - Dots Yes 1 1 No - -
Kuttiyadi Centre is the only one CHC functioning on 24*7 basis and as FRU
functioning in the remote area of Kozhikode District. The centre has in addition, the
facility of emergency care for sick children and is providing full range of family
planning services. All the above facilities are not available in Thalakulathur CHC. The

50
two centres lack the AYUSH services and VCTC and cataract surgery has not been
performed in these centres. The facility for treatment of RTI/STI and Dots are available
in both centres.
3.4. Status of Specific Interventions
Details of status of some specific interventions performed in the selected CHCs are
given in Table C4. IPHS (Indian Public Health Standard) facility survey has been
carried out neither in Kuttiyadi centre nor in Thalakulathur CHC. Funds for the
utilization of the above CHCs, are being electronically transferred from the district
office. Both the CHCs have registered HMC (Hospital Management Society) instead of
Rogi Kalyan Samiti and HMC generates resources through user fees. The fund or
money generated by HMC is being utilized for local use.
Table C4. Status of Specific Interventions IPHS Facility Survey been Carried out
Kuttiyadi CHC Thalakulathur CHC
Yes - - No 1 1 Funds Being Electronically Transferred from District Yes 1 1 No - - Registered Rogi Kalyan Samiti Yes 1 1 No - - RKS Generate Resources: User Fees Yes 1 1 No - - Money generated by RKS being used Yes 1 1 No - - Display board showing no. of meetings & members of RKS Yes 1 1 No - - Feedback mechanism in place for grievances redressed by RKS Yes - 1 No 1 - Citizen Charter Been Publicly Displayed Yes 1 1 No - - All Standard Treatment Guidelines and Protocols Available Yes - 1 No 1 -

51
There is a display board showing details about number of meetings and members of
HMC in each selected CHC. In Thalakulathur CHC, the feed back mechanism in place
for the grievances redressed by HMC is through complaint box, but Kuttiyadi CHC do
not have any feed back mechanism for the above purpose. Citizen charter has been
publicly displayed in both the centers. All standard treatment guidelines and protocols
are available in Thalakulathur CHC, but not in Kuttiyadi CHC.
3.5. Status of Residential facilities for Doctors and other staff Residential facilities must be available there in the CHC for doctors and other staff, who
are residing far away from the centre. Table C5 shows the status of residential facilities
available for doctors and other staff in the two selected CHCs. It can be seen that the
residential facilities (residential quarters) are available for doctors in both the centres.
Table C5: Status of Residential Facilities for Doctors and Other Staff Kuttiyadi CHC Thalakulathur CHC Residential Facility for Doctors Yes 1 1 No - - Non-Occupied Residential Quarters Yes - - No 1 1 Main Reasons for Non:Occupancy: Dilapidated Condition Yes - - No 1 - Insecurity Yes - - No 1 - Lack of Electricity and Water Supply Yes - - No 1 - Residential Facility for other staff Yes 1 1 No - - Non-Occupied Residential Quarters Yes - - No 1 1
All the residential quarters have been occupied by doctors and other staffs in
Thalakulathur CHC. In Kuttiyadi CHC, the residential quarters for doctors are vacant
(non-occupied) because they have their own accommodation or arrangement and not

52
because of lack of facilities. Seven residential quarters are available for other staffs in
Kuttiyadi centre and four in Thalakulathur CHC and all the residential quarters have
been occupied by them.
3.6. Availability of Laboratory Facilities
Availability of some important laboratory facilities is given in Table C6. Facility for
testing of blood group is available in Kuttiyadi CHC but not in Thalakulathur centre.
Table C6. Availability of Laboratory Facilities
Laboratory Testing Kuttiyadi CHC Thalakulathur CHC Blood Grouping Yes 1 - No - 1 Haemoglobin Yes 1 1 No - - Bleeding Time Clotting Time Yes 1 - No - 1 RTI/STIs Yes - - No 1 1 Blood Sugar Yes 1 1 No - - Malaria Parasite Yes 1 1 No - - Urine Test Yes 1 1 No - - Rapid Test for Pregnancy Yes 1 1 No - - RPR Test for Syphilis Yes 1 - No - 1 Rapid Test for HIV Yes 1 - No - 1 Blood Smear: Yes 1 1 No - -

53
Facilities for testing haemoglobin, blood sugar test, and blood smear examination for
malaria parasite, rapid test for pregnancy, Urine and blood smear examination are
available in each of the selected CHC. Testing of bleeding time and clotting time
facility is available only in Kuttiyadi centre. Laboratory testing facility of RTI/STIs is
not available in the selected CHCs. RPR test for syphilis and Rapid test for HIV are
available only in Kuttiyadi CHC. Blood smear testing facility is available in each
selected centre.
Details of number of important laboratory tests performed in the selected CHCs in the
last 3 months prior to the survey are furnished in Table C7. In Kuttiyadi CHC, 1530
Haemoglobin tests were conducted during the last three months prior to the survey in
contrast to 90 tests in Thalakulathur CHC.
Table C7: Number of Lab. tests done in CHC in last 3 calendar months Type of tests done Kuttiyadi CHC Thalakulathur CHC
Haemoglobin 1,530 90
Blood Sugar 2,016 1,600
Blood Grouping 510 -
Blood Smear - 485
Bleeding Time Clotting Time 520 -
RTI/STIs - -
Malaria Parasite 2,336 1,677
Rapid Test for Pregnancy 206 13
RPR Test for Syphilis 504 -
Rapid Test for HIV 504 -
Urine Test 2,304 750
The number of blood tests done is 2,016 and 1,600 in Kuttiyadi and Thalakulathur CHC
respectively. Blood grouping tests were done only in Kuttiyadi (500), where as blood
smear tests were performed only in Thalakulathur (485). About 520 bleeding time and
clotting time tests were done in Kuttiyadi CHC. The number of blood smear
examination for malaria parasite was done in Kuttiyadi CHC is 2,336 and that in

54
Thalakulathur CHC is 1,677. In case of Rapid tests for pregnancy, 206 examinations
are performed in Kuttiyadi CHC while only 13 such tests were performed in
Thalakulathur. During the last three months prior to the survey, 504 RPR tests for
syphilis and a same number of rapid tests for HIV were conducted in Kuttiyadi CHC,
but such no tests were performed in Thalakulathur CHC. In the place of 2,304 urine
routine examinations done in Kuttiyadi CHC, only 750 were done in Thalakulathur
CHC.
Table C8: Number of surgeries performed during 2007-2008 Type of surgeries Kuttiyadi CHC Thalakulathur CHC
Caesarean Sections - -
No of C Section Deliveries for JSY - -
Surgical Cases - -
Cataract - -
Tubectomy 342 -
Laproscopic Sterlisation - -
NSV 12 27
Conventional Vasectomy - -
MTP 2 -
Laprotomy - -
Information regarding surgical deliveries and family planning aspects and other
surgeries are given in Table C8. No Caesarean Sections deliveries were conducted in
the two centres during 2007-2008. Tubectomy cases carried out in Kuttiyadi CHC were
342. The number of sterilization carried out during the last year that is NSV, is 12 and
27 in Kuttiyadi and Thalakulathur respectively. In Kuttiyadi two MTP were performed
during the year 2007-08.
As both the centres do not have surgeon or anesthetist posted, no major surgeries are
performed.

55
Table C9: Reasons for not conducting surgeries
Reasons Kuttiyadi CHC Thalakulathur CHC
Non availability of doctor/anaesthetist/staff Yes - - No - - Lack of equipment/poor physical state of the operation theatre Yes - - No - - No power supply in the OT Yes - - No - - Other Yes - - No - -
Table C10 gives the status of performance of labour room during the year 2007-08. It is
found that Kuttiyadi CHC is far better in performance for conducting deliveries. During
2007-08, 128 deliveries were conducted, out of which 21 were carried out before 8 pm
and 8 am. In Kuttiyadi centre 34 neonates have been resuscitated. Only two deliveries
were carried out in Thalakulathur during 2007-08.
Table C10. Status of performance of Labour Room during 2007-2008
Status of performance of Labour Room Kuttiyadi
CHC
Thalakulathur
CHC
Total Institutional Deliveries 128 2
Deliveries Carried Out from 8.PM to 8 AM 21 -
Institutional Deliveries for JSY Card Holders 12 -
No of Neonates Resuscitated 34 -
Kozhikode Medical College, District Hospital and Women and Children Hospital are
near to Thalakulathur centre. These may be the reasons for a small number of deliveries
in the centre. So no reason was stated.

56
Table C11: Reasons for not conducting deliveries
Reasons
Kuttiyadi CHC
Thalakulathur CHC
Non availability of doctor / anaesthetist/staff Yes - - No - - Poor condition of the labour room Yes - - No - - No power supply in the labour room Yes - - No - -
3.7 Availability of Equipments and Drugs
Information regarding availability of equipments and drugs are furnished in Table
C12.1 Boyles Apparatus is available in Kuttiyadi CHC but is not in a working
condition. ECG Machine is also available and is in working condition.
Table C12.1: Status of availability of Equipments Type of Equipments (Yes =1, No =0)
Kuttiyadi CHC Thalakulathur CHC Available Working Available Working
Boyles Apparatus 1 0 0 -
ECG Machine 1 1 0 -
Cardiac Monitor for OT 0 - 0 -
Defibrillator for OT 0 - 0 -
Ventilator for OT 0 - 0 -
Horizontal High Pressure Sterilizer 1 1 0 -
Vertical High Pressure Sterilizer 0 - 1 1
OT Care Fumigation Apparatus 0 - 0 -
Gloves Dusting Machines 0 - 0 -
Oxygen Cylinder 1 1 1 1
Hydraulic Operation Table 0 - 1 1
Resuscitation Trolley 1 1 1 1
Phototherapy Unit 1 1 0 -
MVA Syringe 0 - 0 -
Baby Incubator 0 - 0 -
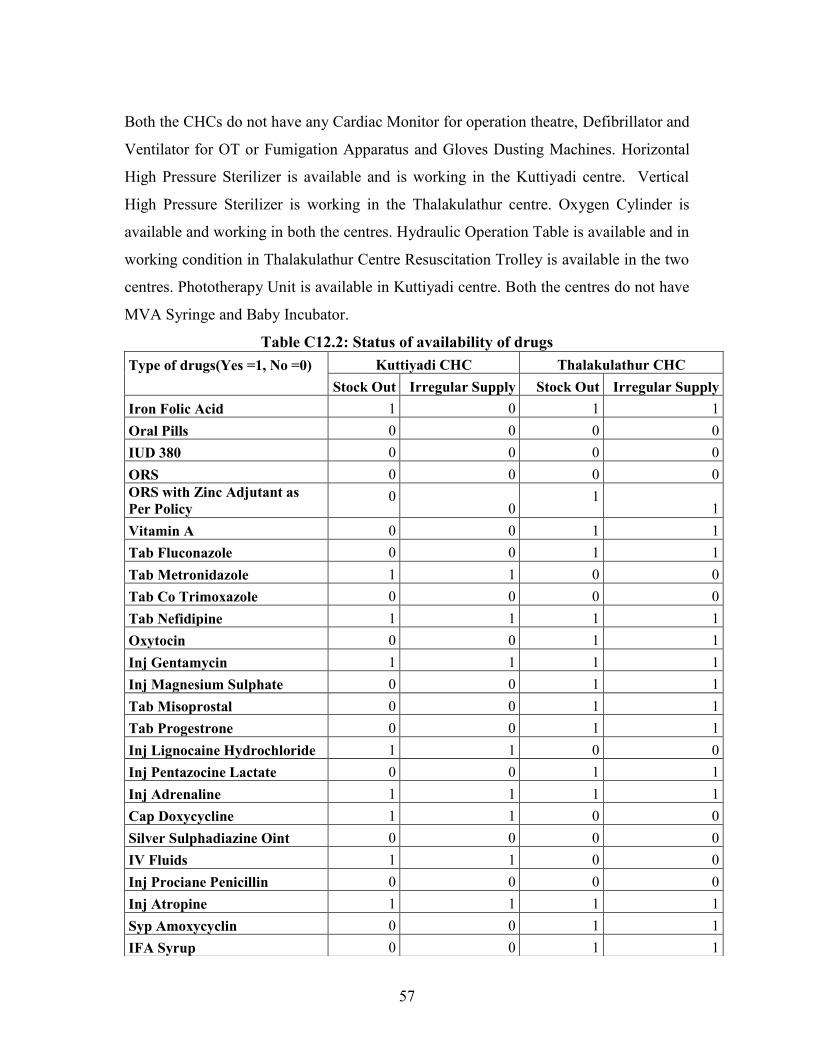
57
Both the CHCs do not have any Cardiac Monitor for operation theatre, Defibrillator and
Ventilator for OT or Fumigation Apparatus and Gloves Dusting Machines. Horizontal
High Pressure Sterilizer is available and is working in the Kuttiyadi centre. Vertical
High Pressure Sterilizer is working in the Thalakulathur centre. Oxygen Cylinder is
available and working in both the centres. Hydraulic Operation Table is available and in
working condition in Thalakulathur Centre Resuscitation Trolley is available in the two
centres. Phototherapy Unit is available in Kuttiyadi centre. Both the centres do not have
MVA Syringe and Baby Incubator.
Table C12.2: Status of availability of drugs Type of drugs(Yes =1, No =0)
Kuttiyadi CHC Thalakulathur CHC Stock Out Irregular Supply Stock Out Irregular Supply
Iron Folic Acid 1 0 1 1 Oral Pills 0 0 0 0 IUD 380 0 0 0 0 ORS 0 0 0 0 ORS with Zinc Adjutant as Per Policy
0 0
1 1
Vitamin A 0 0 1 1 Tab Fluconazole 0 0 1 1 Tab Metronidazole 1 1 0 0 Tab Co Trimoxazole 0 0 0 0 Tab Nefidipine 1 1 1 1 Oxytocin 0 0 1 1 Inj Gentamycin 1 1 1 1 Inj Magnesium Sulphate 0 0 1 1 Tab Misoprostal 0 0 1 1 Tab Progestrone 0 0 1 1 Inj Lignocaine Hydrochloride 1 1 0 0 Inj Pentazocine Lactate 0 0 1 1 Inj Adrenaline 1 1 1 1 Cap Doxycycline 1 1 0 0 Silver Sulphadiazine Oint 0 0 0 0 IV Fluids 1 1 0 0 Inj Prociane Penicillin 0 0 0 0 Inj Atropine 1 1 1 1 Syp Amoxycyclin 0 0 1 1 IFA Syrup 0 0 1 1

58
When the stock out and supply of drugs are taken into consideration, no stock out or
irregular supply of Tab Co Trimoxazole, ORS and IUD 380 was reported during the last
six months prior to the survey in the centres. In Kuttiyadi there has been stock out of
IFA, Tab Metronidazole and Tab Nefidipine. ORS with Zinc Adjutant as Per Policy,
Vitamin A, Tab Fluconazol and Tab Nefidipine are not available in Thalakulathur and
irregular supply has also been reported.
The drugs reported as both stock out and as irregular supply during last six months in
Kuttiyadi are Inj Gentamycin, Inj Lignocaine Hydrochloride, Inj Adrenaline, Inj
Atropine, Cap Doxycycline and IV Fluids. Drugs available in this centre are Inj
Oxytocin, Inj Magnesium Sulphate, Tab Misoprostal, Tab Progestrone, Inj Pentazocine
Lactate, Inj. Prociane Penicillin, Syp Amoxycyclin, and IFA Syrup. These drugs are
reportedly not available in Thalakulathur CHC.
Availability of specific services like management of certain diseases, wounds, burns
and snake bites are given in Table C13.
Table C13. Availability of Specific Services
Specific Services
Kuttiyadi CHC
Thalakulathur CHC
Primary Management of Wounds Yes 1 1 No - - Primary Management Fracture Yes 1 - No - 1 Primary Management of Cases of Poisoning Snake Insect or Scorpion Bite Yes 1 - No - 1 Primary Management of Dog Bite Yes 1 1 No - - Primary Management of Burns Yes 1 1 No - - Management of RTI/STI Yes 1 1 No - -

59
Kuttiyadi CHC is equipped with the management of some special services such as
wounds, fracture, bites of snake, scorpion and dogs, burns and RTI/STI problems.
Thalakulathur centre do not report managing cases of poisoning snake or scorpion bite. 3.8 Service outcome of the CHC The service outcome of the CHCs in terms of specific services conducted is validated in
this section.
Table C14. 1 Service out come of the CHC for last one month Service out come of the CHC Kuttiyadi CHC Thalakulathur CHC Total ANC Registration SC 4 21 ST * * Others 319 250 Total 323 272 Total JSY Cases Registration SC 2 14 ST * * Others 119 67 Total 121 82 1st Trimester Registration SC 3 18 ST * * Others 283 182 Total 286 200 ANC Given 3 Checkups as Per RCH Schedule SC 3 23 ST - - Others 297 188 Total 299 211 Out of Above the No of JSY Beneficiaries SC 333 333 ST 333 333 Others 3,333 3,333 Total 33,333 33,333 ANC Given TT SC 1 23 ST - - Others 311 229 Total 313 252 Note: replace *,-,33,333,33333 which 0 because this figures represent the cases for which values is :Not available/Not applicable

60
Total ANC registration for one month as given in Table C14.1 is 323 in Kuttiyadi and
272 in Thalakulathur. Total cases of ANC registration for SC is 4 and 21 respectively in
Kuttiyadi and Thalakulathur. There are 121 and 82 ANS cases of JSY card holders in
Kuttiyadi and Thalakulathur respectively. The number of cases of ANC with 3
Checkups as per RCH Schedule is 299 in Kuttiyadi and 211 in Thalakulathur centre.
Out of the total ANC cases of JSY beneficiaries, the separate list of SC, ST and others
are not available. The total number of ANC with TT given is 313 in Kuttiyadi and 252
in Thalakulathur centre.
Information about service outcome of CHCs for the last one month prior to the survey is
given in Table C14.2 The number of JSY beneficiaries by SC/ST and others are not
available in Kuttiyadi CHC or in Thalakulathur CHC. In Kuttiyadi centre, out of the
total 293 ANC completed IFA prophylaxis cases, except to one case that pertain to SC,
and 292 fall in the „others‟ group. Separate list for the above mentioned cases for one
month are not maintained or not available in Thalakulathur CHC. Total number of
pregnant women identified and attended with obstetric complications during one month
prior to the survey in Kuttiyadi and in Thalakulathur is 17 and 30 respectively. All the
seventeen cases in Kuttiyadi CHC belong to others category and out of the 30 cases in
Thalakulathur CHC, one case belong to SC and the remaining 29 cases come under
„others‟ group. Out of the above 30 cases of pregnant women with obstetric
complications attended in Thalakulathur CHC, all of them have been referred from
PHC/SHC, but the number of cases referred from PHC/SHC is not available in
Kuttiyadi CHC. In Kuttiyadi CHC, 93 cases of institutional deliveries were performed.
Information on institutional deliveries is not available in Thalakulathur during this
period. Out of the 93 cases of institutional deliveries in Kuttiyadi, 17 of them are JSY
cases. Separate list for SC, ST and others have not been kept for this one month.

61
Table C14. 2 Service out come of the CHC for last one month Service out come of the CHC Kuttiyadi CHC Thalakulathur CHC No of JSY Beneficiaries SC 333 333 ST 333 333 Others 3,333 3,333 Total 33,333 33,333 ANC Completed IFA Prophylaxis SC 1 333 ST - 333 Others 292 3,333 Total 293 33,333 Out of No of JSY Beneficiaries SC 333 333 ST 333 333 Others 3,333 3,333 Total 33,333 33,333 No of Pregnant Women Identified and Attended with Obstetric Complications SC - 1 ST - - Others 17 29 Total 17 30 How Many have Been Referred from PHC / SHC SC 333 1 ST 333 - Others 3,333 29 Total 33,333 30 Total Institutional Deliveries SC - 333 ST * 333 Others 93 3,333 Total 93 33,333 No of JSY Cases (Out of Total Institutional Deliveries) SC 333 333 ST 333 333 Others 3,333 3,333 Total 17 33,333 Note: replace *,-,33,333,33333 which 0 because this figures represent the cases for which values is :Not available/Not applicable
Total number of infants who were given BCG immunization for one month prior to the
survey in Kuttiyadi and Thalakulathur are 132 and 253 respectively (Table C14.3). Out
of the 132 cases in Kuttiyadi CHC, except for two cases (one SC and one ST) 130
belong to „other‟ community. Similarly, out of 253 infants received BCG injection in
Thalakulathur, 19 infants belong to SC and the remaining 233 cases fall in to „others‟
group.

62
Table C14.3. Service out come of the CHC for last one month Service out come of the CHC Kuttiyadi CHC Thalakulathur CHC No of Infants Given BCG SC 1 19 ST 1 - Others 130 233 Total 132 253 No of Infants Given DPT3 SC 3 31 ST - - Others 160 263 Total 163 294 No of Infants Given Measles SC 2 24 ST - - Others 284 232 Total 287 256 No of Infants Given Vit A First Dose SC 1 5 ST - - Others 75 54 Total 76 59 Children Given IFA S SC 333 333 ST 333 333 Others 3,333 3,333 Total 33,333 33,333 IUD Inserted SC * - ST - - Others 24 23 Total 24 23 Total Indoor Patients SC 333 - ST 333 - Others 3,333 26 Total 854 26 No of Cases Referred Beyond CHC SC 1 333 ST - 333 Others 15 3,333 Total 16 4 No of Leprosy Cases Currently Under Treatment CHC SC - 333 ST - 333 Others - 3333 Total 1 * No of New TB Cases Enrolled For Dots SC - 333 ST - 333 Others - 3333 Total 1 4 Note: replace *,-,33,333,33333 which 0 because this figures represent the cases for which values is :Not available/Not applicable
63
Total number of infants who received DPT3 vaccination from Kuttiyadi and
Thalakulathur CHCs are 163 and 294 respectively. Out of the163 above cases in
Kuttiyadi centre, three are SC and 160 infants are from „others‟ category. Out of 294
infants given DPT3 during one month in Thalakulathur centre, 31 infants are SC and
263 are from others category. In case of infants who were given measles vaccination
during the last one month prior to the survey, a total of 287 infants received measles
vaccination in Kuttiyadi centre and 256 in Thalakulathur CHC(Table C14.3). Among
the measles vaccinated infants, two in Kuttiyadi and 24 in Thalakulathur are from SC
category and the remaining from others category.
Information on total number of infants given Vitamin A first dose drug during last one
month prior to the survey in Kuttiyadi and Thalakulathur are 76 and 59 respectively.
Out of the total infants received Vitamin A, one infant in Kuttiyadi CHC and 5 infants
in Thalakulathur are from SC group and the remaining from the others category.
Number of children (6-60 months) given IFA syrup during the last one month is not
available in both the centres. Total number of IUD insertions for last one month in
Kuttiyadi and thalakulathur centres is 24 and 23 respectively and all of them are for
„others‟ category. Number of IUD insertions for SC and ST are not available/ applicable
in both CHCs. Total number of indoor patients are 854 in Kuttiyadi CHC and 26 in
Thalakulathur CHC. Separate list for SC, ST and others are not being kept at Kuttiyadi
but all the 26 cases are from other castes in Thalakulathur CHC. Out of sixteen cases
referred beyond CHC in Kuttiyadi 15 are from other category and the total number of
cases referred beyond CHC in Thalakulathur is four. One case of leprosy was identified
and is currently under treatment for the last one month in Kuttiyadi CHC and no such
cases have been reported from Thalakulathur centre during the above period. Table
C14.3 reveals that the total number of new TB cases enrolled for DOTS in Kuttiyadi
and Thalakulathur centres is one and four respectively and separate caste list is not
available in the aspect.

64
Table C14.4 Service out come
Service outcome
Kuttiyadi CHC
Thalakulathur CHC
No of Cases Given Blood Transfusion in Last 3 Months Numbers - - Bed Occupancy Rate in the Last 12 Months Rate 96 63 OPD Attendance Male Average 187 78 OPD Attendance Female Average 245 126 OPD Attendance Children Average 89 59 Out of the Total OPD Attendance Specify the Referred Cases from PHC / SHC Average 12 3,333 Note: replace *,-,33,333,33333 which 0 because this figures represent the cases for which values is :Not available/Not applicable
From the information collected from the CHCs, it is observed that there was no case of
blood transfusion during the last 3 months in Kuttiyadi centre or in Thalakulathur. Bed
occupancy rate during the last twelve month in the selected CHCs is 32 in Kuttiyadi and
21 in Thalakulathur. The average male OPD attendance is 62 in Kuttiyadi and 26 in
Thalakulathur. Similarly the average female OPD attendance is 82 in Kuttiyadi and 42
in Thalakulathur. Average OPD attendance of Children in Kuttiyadi and Thalakulathur
are 30 and 20 respectively. Out of these, 12 cases are referred from PHC/SHC in
Kuttiyadi centre and the same average for Thalakulathur CHC is not available.

65
Chapter 4
Primary Health Centres
In India, Primary Health Centres (PHCs) are the backbone of rural healthcare. PHCs
bring health care delivery as close as possible to where people live and work. Each PHC
is targeted to cover a population of 20,000 to 30,000 and is charged with providing
promotive, preventive, curative and rehabilitative care. There are three to six sub-
centres (SCs) for a PHC, operated by an Auxiliary Nurse Midwife (ANM). ANM is
supervised by the Lady Health Visitor (LHV) posted at PHC. One of the aims of the
NRHM is to strengthen the PHCs for quality preventive, curative, supervisory and
outreach services by adequate and regular supply of equipments and drugs, observance
of standard treatment guidelines, provision of 24 hour service to fifty percent of the
PHCs and upgradation for referral services.
The present chapter evaluates the facilities, staff pattern and performance of the PHCs
in Kozhikode district. Two PHCs each were selected at random from the PHCs coming
under the two CHCs (Kuttiyadi and Thalakulathur) selected for the study. Kuttiyadi
CHC is in the Vadakara taluk and Thalakulathur is in Kozhikode taluk. The PHCs
selected under Kuttiyadi CHC are Velam PHC and Narippatta PHC. The PHCs selected
under Thalakulathur CHC are Kakkodi PHC and Iruvallur PHC. The details collected
from the PHCs are given below.
4.1. Coverage and facilities of Primary Health Centre Out of the four PHCs under study two have 4 Sub Centres each, one has 3 Sub Centres
and the remaining PHC has only two Sub Centres. On an average 3 Sub Centres are
there for the PHCs under study. The PHC with 3 Sub Centres is Narippatta under CHC
Kuttiyadi and the PHC with 2 Sub Centres is Iruvallur under CHC Thalakulathur. The
average population covered under selected PHCs is 32688. At the same time the
average coverage of population of the PHCs under Kuttiyadi CHC is 27436 and that of
PHCs under Thalakulathur CHC is 37940. That is PHCs under Thalakulathur CHC

66
cover about 10,000 more population on an average, compared to the PHCs under
Kuttiyadi CHC. The reason for this may be the difference in the nature of geographical
areas covered under CHCs. The coverage area of PHCs selected under Kuttiyadi CHC
were mostly hilly terrain compared to that of the PHCs under Thalakulathur CHC.
Table P1. Coverage and facilities of Primary Health Centre
Coverage and facilities CHC Kuttiyadi CHC Thalakulathur Average
PHC Velam
PHC Narippatta
PHC Kakkodi
PHC Iruvallur
Number of SC Under the PHC Numbers 4 3 4 2 3 Population Covered Numbers 27,842 27,030 37,949 37,932 32688 Nearest SC in the Coverage Area: Distance 5 3.5 2 6 4.1 Time 20 15 5 15 13.8 Farthest SC in the Coverage Area: Distance 9 12 5 8 8.5 Time 30 30 10 20 22.5 Nearest CHC : Distance 7 13 8 6 8.5 Time 25 40 15 15 23.8 No of Beds : Male 0 0 0 0 0 Female 0 0 0 0 0 PHC Functioning on 24 x 7 Basis Yes - - - - 0 No 1 1 1 1 PHC Equipped to Provide Basic Obstetric Services Yes - - 1 - 0.25 No 1 1 - 1 PHC with 4-6 Beds Yes - - - - 0 No 0 0 0 0
The average distance of the PHCs to the nearest Sub Centre is 4.3 km, the farthest
distance to Iruvallur being 6 kms and the shortest distance to Kakkodi PHC being 2
kms. The average time taken to reach nearest Sub Centre from PHC is 13.8 minutes; the
farthest being 20 minutes from Velam PHC and the shortest being five minutes from
Kakkodi PHC. The average distance of farthest Sub Centre from PHC is 8.5 km; the
farthest being 12 km from Narippatta PHC and the shortest being 5 km from Kakkodi
PHC. Average time taken to reach the farthest Sub centre is 22.5 minutes. For both the

67
PHCs under Kuttiyadi CHC, that is, Velam and Narippatta, the time taken to reach the
farthest Sub centre is half an hour, compared to only 10 minutes from Kakkodi and 20
minutes from Iruvallur PHC.
Average distance of CHC from the PHC is 8.5 km. The shortest distance of 7 kms is
from Velam PHC and the longest of 13 km is from Narippatta PHC; both of them come
under Kuttiyadi CHC. Also the time taken to reach the CHC from these two PHCs are
comparatively higher (40 minutes and 25 minutes respectively) compared to the other
two PHCs (15 minutes each).
None of the PHCs under evaluation have been functioning on 24*7 basis and are not
equipped to provide basic obstetric services. Also none of them had beds for in-patients.
4.2. Infrastructure facilities Infrastructure facilities of the PHCs are shown in the Table P2.1. Out of the four PHCs
under study three are working in designated Govt. buildings. The fourth one (Iruvallur)
occupies a rented building
Iruvallur PHC functions in
a building which was
constructed for two shops.
It has very limited facility
to function as a PHC.
Primary Health Centre, Iruvallur

68
Table P 2.1 Primary Health Centres by Infrastructure CHC Kuttiyadi CHC Thalakulathur
Infrastructure Velam PHC
Narippatta PHC
Kakkodi PHC
Iruvallur PHC
Percentage
PHC functioning in Designated govt. Building Yes 1 1 1 - 75.0 No - - - 1 25.0 Labour Room Yes - - - - 0.0 No 1 1 1 1 100.0 Prominent Display Boards Regarding Service Availability in Local Language Yes 1 1 1 1 100.0 No - - - - 0.0 Names of JSY Beneficiaries Maintained in Record Yes 1 1 1 1 100.0 No - - - - 0.0 Pharmacy for Drug Dispensing and Drug Storage Yes 1 1 1 1 100.0 No - - - - 0.0 Separate Public Utilities for Males and Females Yes - - 1 - 25.0 No 1 1 - 1 75.0 Suggestion / Complaint Box Yes 1 1 1 - 75.0 No - - - 1 25.0 OPD Rooms / Cubicles Yes 1 1 1 - 75.0 No - - - 1 25.0 Piped water supply Yes - - - 1 25.0 No 1 1 1 - 75.0 No Regular electricity Yes - - - - 0.0 No 1 1 1 1 100.0 Regular Electric Supply in all Parts Yes 1 1 1 1 100.0 No - - - - 0.0 Telephone Yes 1 1 1 1 100.0 No - - - - 0.0 Computer Yes 1 1 1 1 100.0 No - - - - 0.0 Internet Yes - - - - 0.0 No 1 1 1 1 100.0
None of the PHCs under study have a labour room. All of them have prominent display
boards regarding service availability, in local language Malayalam. All the PHCs have

69
records maintaining the names of JSY beneficiaries and have pharmacy for drug
dispensing and drug storage and also complaint or suggestion box.
Only one PHC (25 percent) had separate public utilities for males and females. Three of
the PHCs, which are working in own buildings have OP rooms/ cubicles (Table P2.1).
Only one PHC (25 percent) has piped public water supply. All others have own well as
source of water and have overhead tanks and pipe line. All the four PHCs (100 percent)
have telephone facility and regular electricity in all parts. But none of the centres have a
standby facility. Even though all of the centres have computer availability, none have
internet facility.
Table P 2.2 Primary Health Centres by Infrastructure
Velam PHC
Narippatta PHC
Kakkodi PHC
Iruvallur PHC
Percentage
Type of Sewerage System Soak Pit 1 1 1 - 75.0 Connected to Municipal Sewerage - - - - 0.0 Open Drain - - - 1 25.0 Other - - - - 0.0 How Waste Material is Being Disposed Buried in a Pit 1 1 1 1 100.0 Collected by an Agency - - - - 0.0 Incernation - - - - 0.0 Thrown in Open - - - - 0.0 Standby Facility Available Yes - - - - 0.0 No 1 1 1 1 100.0 Separate Areas for Septic and Aseptic Deliveries Available Yes - - - - - No - - - - - New Born Care Available Yes - - - - 0.0 No 1 1 1 1 100.0 Status of Cleanliness of OPD Good 1 1 1 - 75.0 Fair - - - 1 25.0 Poor - - - - 0.0 Status of Cleanliness of Compound / Premises Good 1 1 1 - 75.0 Fair - - - 1 25.0 Poor - - - - 0.0 Status of Cleanliness of Room / Wards Good 1 1 1 - 75.0 Fair - - - 1 25.0 Poor - - - - 0

70
Three of the PHCs under study (75 percent) have soak pit type of sewage system and
the other one has open drain system (Table P 2.2). Waste materials of all the PHCs have
been disposed by burying in pits. None of the PHCs under study have facilities for
delivery and newborn care.
As far as the status of cleanliness is concerned, all the PHCs except one (Iruvallur)
cleanliness are good in OPD, in the wards/rooms and in the premises/ compound.
4.3. Staff Position The staff position in the PHCs is given in Table P 3.1 and Table P 3.2.
Table P 3.1: Staff Position of in Primary Health Centre
CHC Kuttiyadi CHC Thalakulathur
Type of Staff Velam PHC Narippatta
PHC Kakkodi
PHC Iruvallur
PHC Medical Officer : Sanctioned 1 1 1 1 Regular in Position 1 1 1 1 Contractual Recruited - - - - Total in Position 1 1 1 1 Pharmacist : Sanctioned 1 1 1 1 Regular in Position 1 1 1 1 Contractual Recruited - - - - Total in Position 1 1 1 1 Nurses : Sanctioned - - 2 - Regular in Position - - 2 - Contractual Recruited - - - - Total in Position - - 2 - ANM/JPHN : Sanctioned 4 4 5 3 Regular in Position 4 3 5 3 Contractual Recruited - - - - Total in Position 4 3 5 3 Lab Technician : Sanctioned - - - - Regular in Position - - - - Contractual Recruited - - - - Total in Position - - - - Driver : Sanctioned - - - - Regular in Position - - - - Contractual Recruited - - - - Total in Position - - - -

71
All the four PHCs have one Medical Officer each in position. Similarly all PHCs have
one pharmacist each. All are regular in position and no contractual recruitment of
Medical Officers and pharmacist are there in these centres. The post of Nurse is there
only in one Kakkodi PHC. Here out of the 2 sanctioned posts of staff nurse both are
regular staff. In the PHCs under Kuttiyadi CHC, there are four posts each of JPHNs.
All are filled on a regular basis in Velam, but only three posts are filled on a regular
basis in Narippatta. One post in Narippatta is vacant. In the PHCs under Thalakulathur
CHC, one (Kakkodi) has 5 posts of JPHNs and the other (Iruvallur) has only three posts
and all are filled up on a regular basis.
Table P 3.2: Staff Position in Primary Health Centre
CHC Kuttiyadi CHC Thalakulathur
Type of Staff Velam PHC
Narippatta PHC
Kakkodi PHC
Iruvallur PHC
Medical Officer AYUSH Sanctioned - - - - Regular in Position - - - - Contractual Recruited - - - - Total in Position - - - - Staff Nurse : Sanctioned - - - - Regular in Position - - - - Contractual Recruited - - - - Total in Position - - - - Lady Health Visitor : Sanctioned - 1 1 - Regular in Position - - 1 - Contractual Recruited - - - - Total in Position - 0 1 - Lab Assistant : Sanctioned - - - - Regular in Position - - - - Contractual Recruited - - - - Total in Position - - - -
Block Health Education and Information Officer Sanctioned - - - - Regular in Position - - - - Contractual Recruited - - - - Total in Position - - - - Statistical Assistant : Sanctioned - - - - Regular in Position - - - - Contractual Recruited - - - - Total in Position - - - -

72
In Narippatta and Kakkodi PHCs there are one post each of Lady Health Visitor and is
filled on a regular basis in Kakkodi PHC and is vacant in Narippatta PHC. None of the
PHCs have posts of AYUSH Medical Officer, Lab technician, Lab assistant, driver,
staff nurse, block health education and information officer and statistical assistant.
4.4. Status of training
None of the medical officers of the PHCs under evaluation have undergone trainings on
safe abortion, newborn care, skill birth attendant training, and pre service IMNCI as
shown in Table P 4.
Table P4: Status of training of personnel at Primary Health Centre
Training
PHC having personnel trained CHC1 CHC2
Kuttiyadi Thalakulathur
Velam PHC Narippatta
PHC Kakkodi
PHC Iruvallur
PHC Pre Service IMNCI Yes - - - - No 1 1 1 1 Safe Abortion Methods Yes - - - - No 1 1 1 1 Skill Birth Attendant Training Yes - - - - No 1 1 1 1 New Born Care Yes - - - - No 1 1 1 1
4.5. Facilities available Facilities in the PHCs for conducting delivery and for various laboratory tests are
analysed in this section. Labour room facilities and laboratory facilities are shown
separately.

73
4.5.1. Availability of Labour room and Number of Deliveries Conducted According to the Tables P5 and P6 no PHC under study has labour room facility and so
no deliveries were carried out in these PHCs during 2007-2008.
Table P5: Availability of Labour Room in Primary Health Centre
CHC1 CHC2 CHC Kuttiyadi CHC Thalakulathur
Labour Room facilities Velam PHC Narippatta PHC
Kakkodi PHC
Iruvallur PHC
Availability of Labour Room Yes - - - - No 1 1 1 1 Labour Room Currently in Use Yes - - - - No - - - - Reasons for Deliveries Not Conducting in Labour Room: Non Availability of Doctors / Staff Yes - - - - No - - - - Poor Condition of the Labour Room Yes - - - - No - - - - No Power Supply in the Labour Room Yes - - - - No - - - - Other Yes - - - - No - - - -
Table P6: Status of performance of Labour Room during 2007-2008
Number of Deliveries
Number of deliveries performed in PHC CHC1 CHC2
CHC Kuttiyadi CHC Thalakulathur Velam
PHC Narippatta
PHC Kakkodi PHC Iruvallur
PHC Total Institutional Deliveries Numbers - - - - Deliveries Carried Out from 8 Pm to 8 Am Numbers - - - - Institutional Deliveries for JSY Card Holders Numbers - - - - No of Neonates Resuscitated Numbers - - - -

74
4.5.2 Laboratory Facility According to the Table P7 and P8 no PHC under study has laboratory facility for doing
the testes mentioned and so no tests have been done in these PHCs during the last three
months preceding the survey.
Table P7: Availability of Laboratory Testing in PHC CHC Kuttiyadi CHC Thalakulathur
Availability of Laboratory Velam PHC
Narippatta PHC
Kakkodi PHC
Iruvallur PHC
Yes - - - - No 1 1 1 1 Availability of Laboratory Testing Hemoglobin Yes - - - - No - - - - Urine RE Yes - - - - No - - - - Blood Sugar Yes - - - - No - - - - Blood Grouping Yes - - - - No - - - - Blood Smear Yes - - - - No - - - - Bleeding Time, Clotting Time Yes - - - - No - - - - Diagnosis of RTI / STIs with Wet Mounting, Grams Stain Etc Yes - - - - No - - - - Blood Smear Examination for Malaria Parasite Yes - - - - No - - - - Rapid Test for Pregnancy Yes - - - - No - - - - RPR Test for Syphilis Yes - - - - No - - - - Rapid Test for HIV Yes - - - - No - - - -

75
Table P8: Number of tests done in PHC in last three calendar months Type of Test Velam
PHC Narippatta
PHC Kakkodi
PHC Iruvallur
PHC Hemoglobin Number - - - - Urine RE Number - - - - Blood Sugar Number - - - - Blood Grouping Number - - - - Blood Smear Number - - - - Bleeding Time, Clotting Time Number - - - - Diagnosis of RTI / STIs with Wet Mounting, Grams Stain Etc Number - - - - Blood Smear Examination for Malaria Parasite Number - - - - Rapid Test for Pregnancy Number - - - - RPR Test for Syphilis Number - - - - Rapid Test for HIV Number - - - -
4.6. Status of specific Interventions
Status of specific interventions are given in Table P9. IPHS facility survey is not done
in any PHC under study. No PHC is functioning on 24*7 basis. Ayush doctor is not
there in any of the PHCs under study. Rogi Kalyan Samiti or the Hospital Management
Societies (HMC) functioning in the PHCs is not yet registered. In all the PHCs Hospital
Management Societies generate resources through user fees and the money generated
has been retained within the facility for local use. But no PHC displays board showing
members of HMC and number of meetings. Citizen‟s charter is displayed in all the
PHCs and all standard treatment guidelines and protocols are available with them. But
feed back mechanism for grievance redressal by HMC is available only in one PHC.

76
Table P9: Status of specific Interventions CHC Kuttiyadi CHC Thalakulathur
Status of Specific Interventions Velam PHC Narippatta
PHC Kakkodi PHC Iruvallur
PHC IPHS Facility Survey done Yes - - - - No 1 1 1 1 PHC Functioning on 24 x 7 Basis Yes - - - - No 1 1 1 1 AYUSH Doctor Providing Services Yes - - - - No 1 1 1 1 Registered Rogi Kalyan Samiti Yes - - - - No 1 1 1 1 RKS generating resources through user fees Yes 1 1 1 1 No - - - - Money generated by RKS being used Yes 1 1 1 1 No - - - - Display board showing no. of meetings & members of RKS Yes - - - - No 1 1 1 1 Citizen Charter Publicly Displayed Yes 1 1 1 1 No - - - - All Standard Treatment Guidelines and Protocols Available Yes 1 1 1 1 No - - - - Feedback mechanism in place for grievances redressed by RKS Yes - - 1 - No 1 1 - 1 Primary Management of Wounds Yes 1 1 1 1 No - - - - Primary Management Fracture Yes - 1 1 - No 1 - - 1 Management of Neonatal Asphyxia, sepsis Yes - - - - No 1 1 1 1 Management of Malnourished Children Yes 1 1 1 - No - - - 1 Minor Surgeries Like Draining of Abscess etc Yes 1 1 1 - No - - - 1
Contd….

77
CHC Kuttiyadi CHC Thalakulathur
Status of Specific Interventions Velam PHC Narippatta
PHC Kakkodi PHC Iruvallur
PHC Primary Management of Cases of Poisoning / Snake Insect or Scorpion Bite Yes - - 1 - No 1 1 - 1 Primary Management of Dog Bite Cases Yes - - 1 - No 1 1 - 1 Primary Management of Burns Yes 1 1 1 - No - - - 1 Facility for MTP Available Yes - - - - No 1 1 1 1 Management of RTI/STI Yes - - - - No 1 1 1 1 AYUSH Services Yes - - - - No 1 1 1 1
As far as the management of ailments is concerned it can be seen that all the PHCs
have facility to manage wounds. Facilities for management of malnourished children
and management of burns are available in all the PHCs except one (Iruvallur PHC).
Also minor surgeries like draining of abscess etc are done at these three PHCs. Primary
management of Fracture is done only in Narippatta and Kakkodi PHCs. Primary
management of poisoning, snakebite etc and management of dog bite is available only
in one Kakkodi PHC. None of the four PHCs have facilities for the management of
neonatal asphyxia, sepsis, facility for doing MTP and management of RTI/STI. Also
none of them have availability of AYUSH services
4.7. Availability of selected equipments
Availability of selected equipments in the PHCs is given in the Table P10. All the four
PHCs have thermometer and water purifier available in the centre and are in working
condition. Examination table and sterilization equipment are available at all the PHCs
except Iruvallur PHC. All the examination tables available are in good condition and the
sterilization equipment in the Velam PHC is not in working condition.

78
Table P10: Availability of selected equipments in PHC
Equipments
available/ working
(Yes-1, No-0)
CHC Kuttiyadi CHC Thalakulathur
Velam PHC Narippatta PHC Kakkodi PHC Iruvallur PHC Available Working Available Working Available Working Available Working
Patient Trolley 0 - 0 - 0 - 0 -
Examination Table 1 1 1 1 1 1 0 -
Delivery Table 0 - 0 - 0 - 0 -
Wheel Chair 0 - 0 - 0 - 0 -
Stretcher / Trolley 0 - 0 - 0 - 0 -
Oxygen Cylinder 0 - 0 - 0 - 0 -
Suction Apparatus 0 - 0 - 0 - 0 -
Infant Warmer 0 - 0 - 0 - 0 -
Radiant Warmer 0 - 0 - 0 - 0 -
Cradle 0 - 0 - 0 - 0 -
Autoclave 0 - 0 - 1 1 0 -
Sterlisation
Equipment 1 0 1 1 1 1 0 -
Bag and Mask 0 - 0 - 0 - 0 -
Laryngoscope 0 - 0 - 0 - 0 -
Oxygen Mask 0 - 0 - 0 - 0 -
Thermometer 1 1 1 0 1 1 1 1
Suction Machine 0 - 1 1 0 - 0
Water Purifier 1 1 1 1 1 1 1 1
Microscope 0 - 0 - 0 - 0 -
Hemoglobinometer 1 1 0 - 1 1 1 1
Auto Analyser 0 - 0 - 0 - 0 -
Autoclave 0 - 0 - 1 1 0 -
Resucitation
Equipment 0 - 0 - 1 0 0 -
Suction machine is available only in one PHC (Narippatta) and is in working condition.
At the same time all other PHCs except Narippatta have haemoglobinometer and are in

79
working condition. Autoclave and resuscitation equipment are available with only one
PHC (Kakkodi) and are in working condition. None of the PHCs under study have
patient trolley, delivery table, wheel chair, stretcher/trolley, oxygen cylinder, suction
apparatus, infant warmer, radiant warmer cradle, bag& mask, laryngoscope, oxygen
mask, microscope and auto analyzer.
4.8. Status of Availability of Drugs
Status of availability of drugs in PHCs is given in Table P11. No stock out have been
reported for IFA tablets, oral pills, vitamin A, measles vaccine, ORS, Albendazole
tablet, Cotrimoxazole syrup, Paracetamol syrup and DOTs drugs in all the PHCs in the
six months period preceding the survey. Of the above drugs, supply of vitamin A was
irregular in two PHCs, supply of Albendazole/Mabendazole was irregular in one PHC
during the reference period. No stock out of disposable gloves was there in any of the
PHCs in the last six months prior to the survey, but an irregular supply was reported in
one PHC. Iron syrup was out of stock in one PHC and there the supply was irregular.
Even though the supply of IUDs was regular in all the PHCs, there was a stock out in
one PHC. Ciprofloxacin tablet showed a stock out in one PHC even though the supply
was irregular in two PHCs. Even though the supply of AD syringe was regular in all the
PHCs one of the PHCs had a stock out in the last six months. At the same time in one
PHC there was a stock out and irregular supply of Bandages. Also in three out of the
four PHCs MDT drugs Blister packs were out of stock and the supply was irregular in
two centres.

80
Table P11: Status of Availability of Drugs during the last 6 months
Drugs Stock out/ Irregular supply (Yes-1, No-0)
CHC Kuttiyadi CHC Thalakulathur Velam PHC Narippatta PHC Kakkodi PHC Iruvallur PHC
Stock out
Irregular Supply
Stock out
Irregular Supply
Stock out
Irregular Supply
Stock out
Irregular Supply
IFA Tablets 0 0 0 0 0 0 0 0
Iron Syrup 1 1 1 1 1 1 0 0
Oral Pills 0 0 0 0 0 0 0 0
Vitamin A 0 1 0 0 0 1 0 0
Measles Vaccine 0 0 0 0 0 0 0 0
ORS 0 0 0 0 0 0 0 0
Tab Maethergin 1 1 1 1 1 1 1 1
Tab Albendazole / Mabendazole
0 0 0 1 0 0 0 0
IUDs 0 0 0 0 0 0 0 0
Inj Oxytocin 0 0 0 0 0 0 0 0
Magnesium Sulphate 1 1 1 1 1 1 1 0
Tab Fluconazole 1 1 1 1 1 1 0 0
Partograph 1 1 1 1 1 1 1 0
MVA Syringe 1 1 1 1 1 1 1 1
Tab Ciprofloxacin 0 0 0 0 0 1 1 1
Syp Cotrimoxazole 0 0 0 0 0 0 0 0
Syp Paracetamol 0 0 0 0 0 0 0 0
Ringers Lactate 1 1 1 1 1 1 1 1
Haemoccele 1 1 1 1 1 1 1 1
AD Syringes 0 0 1 0 0 0 0 0
Disposable Gloves 0 0 0 0 0 1 0 0
Bandages 0 0 0 0 0 0 0 0
AYUSH Drugs 1 1 1 1 1 1 1 1
Dots Drugs 0 0 0 0 0 0 0 0
MDT Drugs BlisterPacks
1 0 0 0 1 1 1 1

81
4.9. Monthly Service outcome of the PHCs Average monthly service outcome of the PHCs based on data for three months prior to
the evaluation is given in Table P12. Caste wise split up of the number of ANC
registration, number of JSY cases registered, number of first trimester registration,
number of ANC given 3 checkups, ANC given TT1, ANC given TT2+ booster and
ANC completed IFA Prophylaxis were not available in Narippatta PHC. The number of
ANC cases registered per month varied from 13 in Narippatta PHC to 88 in Iruvallur
PHC. The numbers of cases in the other two PHCs were 43 and 66. The average number
of ANC registration per PHC was 53. ANC cases of Scheduled Tribe population was
recorded only in Iruvallur PHC and it also was only one case in three months. Number
of ANC registration for SC population ranged from 2 in Velam to 11 in Iruvallur.
The JSY cases registered ranged from only 1 in Narippatta to 32 in Iruvallur. The
numbers of cases in the other two PHCs were 11 in Velam and 17 in Kakkodi. Average
number of JSY cases per PHC per month was 15. The number of cases of SC
population registered were 1 in Velam, 1 in Kakkodi and 10 in Iruvallur. Among ST
population only one case was registered in three months and was in Iruvallur.
The number of first trimester registration was lowest in Narippatta (9) and highest in
both Kakkodi and Iruvallur PHCs (50). In Velam PHC there were 37 cases of first
trimester registration. On an average 37 cases of first trimester registrations were done
per PHC. The number of SC registration were 2 in Velam, 4 in Kakkodi and 8 in
Iruvallur. The number of ANC given 3 checkups was 11 in Narippatta and the highest
of 65 was in Kakkodi. In Velam 38 cases and in Iruvallur 55 cases were given 3 ANC
checkups. Average number of ANC given three checkups per PHC was 42. The number
of SC given 3 ANC checkups were 2 in Velam, 5 in Kakkodi and 10 in Iruvallur.

82
Table P12.1 : Monthly Service Outcome (based on data for last three months) CHC Kuttiyadi CHC Thalakulathur
Indicator Velam PHC Narippatta
PHC Kakkodi
PHC Iruvallur
PHC Average Total ANC Registration SC 2 - 5 11 ST 0 - 0 * Others 41 - 61 77 Total 43 13 66 88 53 Total JSY Case Registered SC 1 - 1 10 ST - - - * Others 10 - 15 22 Total 11 1 17 32 15 1st Trimester Registration SC 2 - 4 8 ST - - - * Others 35 - 46 41 Total 37 9 50 50 37 ANC Given 3 Checkups SC 2 - 5 10 ST - - - - Others 35 - 60 46 Total 38 11 65 55 42 ANC Given TT1 : SC 1 - 6 10 ST - - - * Others 13 - 62 63 Total 14 13 68 73 42 ANC Given TT2+ Booster
SC 1 - 6 11 ST - - - - Others 11 - 59 64 Total 12 10 65 75 41 ANC Completed IFA Prophylaxis SC 4 - 1 21 ST - - - - Others 27 - 20 64 Total 31 3 21 85 35 Total Institutional Deliveries : SC - - - - ST - - - - Others - - - - Total - - - - 0 No of JSY delivery Cases : SC - - - - ST - - - - Others - - - - Total - - - - 0

83
The number of ANC given TT1 was lowest in Narippatta (13) and highest in Iruvallur
(73). In Velam 14 antenatal women were given TT1 and in Kakkodi 68 women were
given TT1(Table P 12.1). Average number of ANC given TT1 per PHC was 42. In the
case of antenatal women belonging to SC, 1 was given TT1 in Velam, 6 in Kakkodi and
10 in Iruvallur. The number of ANC women given TT2+booster per month was 75 in
Iruvallur, 65 in Kakkodi, 12 in Velam and 10 in Narippatta. The average number of
ANC given TT2+ booster per PHC was 41. In Iruvallur 11 cases were SC women. In
Narippatta SC women received TT2+booster in ANC care was 6 and in Velam the
number was only one (Table P 12.1). The number of ANC completed IFA prophylaxis
in Iruvallur was 85 followed by 31 in Velam, 21 in Kakkodi and only 3 in Narippatta.
The average number of ANC completed IFA prophylaxis per PHC was 35. Facility for
delivery was not there in the PHCs under study. So number of institutional deliveries
and JSY cases were nil in all the PHCs .
Table P12.2 shows that the number of infants given BCG varied from zero in Kakkodi
to 67 in Iruvallur. The number of infants given BCG was 12 in Narippatta and 38 in
Velam. The average number of infants given BCG per PHC per month was 29. The
infants belonging to SC given BCG was nil in Kakkodi, 5 in Velam and 8 in Iruvallur.
In Narippatta there was only one case in the three months prior to the survey. At the
same time the number of infants who were given DPT3 varied from 14 in Narippatta to
53 in Iruvallur. The number was 16 in Velam and 52 in Kakkodi . The number of
infants who were given DPT3 per PHC per month was 34. The number of infants given
Measles vaccine ranged from 16 in Narippatta to 79 in Iruvallur (Table P12.2). The
number was 34 in Velam and 55 in Kakkodi. No infant was given Vitamin A in Velam
Number of infants given Vitamin A was highest in Iruvallur (57), followed by 23 in
Kakkodi PHC . In Narippatta PHC only 2 infants were given Vitamin A first dose.
Average number of infants given Vitamin A per PHC was 21. No one was given IFA
syrup from the four PHCs under study. The number of IUDs (Copper-T) inserted was
highest in Kakkodi (11) followed by Iruvallur(5) . In both Velam and Narippatta 2 cases
each were reported. Average number of Copper T insertion per PHC was only 5 (Table
P12.2). Only one IUD insertion of SC case was reported in the three months and was in

84
Velam PHC. No male sterilization was carried out in the PHCs under study. None of
the PHCs under study had facilities for indoor patients and no patients were admitted in
the centres as inpatients (Table P12.2).
Table P12.2 : Monthly Service Outcome (based on data for last three months) CHC Kuttiyadi CHC Thalakulathur
Indicator Velam PHC Narippatta
PHC Kakkodi
PHC Iruvallur
PHC Average No of Infants Given BCG SC 5 * - 8 ST - - - - Others 33 11 - 59 Total 38 12 0 67 29 No of Infants Given DPT3 SC 2 * - 7 ST - - - - Others 14 14 - 46 Total 16 14 52 53 34 No of Infants Given Measles SC 5 * - 9 ST - - - - Others 29 15 - 69 Total 34 16 55 79 46 No of Infants Given Vit A First Dose SC - - - 6 ST - - - - Others - - - 51 Total - 2 23 57 21 Syp IFA SC - - - - ST - - - - Others - - - - Total - - - - 0 IUD (Copper - T) Inserted :
SC * - - - ST - - - - Others 1 - - 5 Total 2 2 11 5 5 Male Sterlisation Carried Out SC - - - - ST - - - - Others - - - - Total - - - - 0 Female Sterlisation Carried Out SC - - - - ST - - - - Others - - - - Total - - - - 0

85
Table P12.3 : Monthly Service Outcome (based on data for last three months) CHC Kuttiyadi CHC Thalakulathur
Indicator Velam PHC Narippatta
PHC Kakkodi
PHC Iruvallur
PHC Average Total Indoor Patients: SC - - - - ST - - - - Others - - - - Total - - - - 0 Total Out Patients : SC 3 - - - ST - - - - Others 17 - - - Total 20 824 2,686 684 1054 RTI / STI Cases Treated SC 1 - - 6 ST - - - - Others 6 - - 10 Total 7 - - 16 6 No of Maternal Deaths in 2007 2008 : SC - - - - ST - - - - Others - - - - Total - - - - 0 No of Cases of Obstetric Complications Referred Beyond PHC SC - - - - ST - - - - Others - - - - Total - - - - 0 No of Cataract Surgeries Carried Out SC - - - - ST - - - - Others - - - - Total - - - - 0 No of New TB Cases Enrolled For Dots SC - - - - ST - - - - Others 3 - - 2 Total 3 1 1 2 2 No of New Leprosy Cases Registered for MDT : SC - - - - ST - - - - Others - - - - Total - - - - 0 No of Leprosy Cases Completed Treatment for Leprosy : SC - - - - ST - - - - Others - - - - Total - - - - 0 * only one case in last three months

86
From Table P12.3 it can be noted that the average number of out-patients per month
was highest in Kakkodi PHC(2686), followed by Narippatta with 824 patients and
Iruvallur with 684 patients. Number of out-patients were lowest in Velam PHC, which
was only 20. It may be mainly due to the absence of medical officer in the PHC due to
training. On an average 1054 out patients were registered per PHC under study. Caste
wise split up of the number of out-patients was available only in Velam PHC. In Velam,
3 SC patients sought treatment and no ST case was there among out-patients.
The number of RTI/STI cases treated was 16 in Iruvallur and 7 in Velam (Table P 12.3).
In the other two PHCs no RTI/STI cases were treated. The average number of RTI/STI
patients treated per PHC was 6. As the facility for delivery was not available, no
maternal deaths and cases of obstetric complications referred beyond PHC were nil in
the PHCs under study.
Number of TB cases enrolled per month was highest in Velam (3) followed by Iruvallur
with 2 cases. In Narippatta and Kakkodi 1 case each were enrolled (Table P 12.3). On
an average 2 new TB cases were enrolled in a PHC per month. No new TB cases were
reported among SC and ST categories. No new leprosy cases were registered for MDT
in the PHCs under study.
4.10. Record maintenance All the PHCs are expected to maintain registers or records that provide the details
regarding provision of services like antenatal and post natal care, list of eligible couples,
family planning, birth and death, immunization, meetings and JSY beneficiaries. The
status of record maintenance in the PHCs under study is given in the Table P13.

87
Table P13: Status of record maintenance
CHC Kuttiyadi CHC Thalakulathur
Type of Records Velam PHC
Narippatta PHC
Kakkodi PHC
Iruvallur PHC
Ante Natal Register Yes 1 1 1 1 No - - - - Eligible Couple Register Yes 1 1 1 1 No - - - - Post Natal Care Register Yes 1 - 1 1 No - 1 - - Family Planning Register Yes 1 1 1 1 No - - - - Birth and Death Register Yes 1 1 1 1 No - - - - Immunisation Register Yes 1 1 1 1 No - - - - Meeting Register Yes 1 1 1 1 No - - - - JSY Register Yes 1 1 1 1 No - - - - Untied Funds Register Yes 1 - 1 1 No - 1 - -
All the PHCs maintain Antenatal register, Eligible couple register, Postnatal care
register, Family planning register, Birth and death register, Immunisation register,
Meeting register and JSY register. Post natal care register and Untied fund register
were not maintained in Narippatta PHC.

88
Chapter 5
Sub Centre
The most peripheral health unit and the first contact point between the primary health
care system and the community is the Sub Centre. Each Sub Centre has one Female
Health Worker/ANM and one Male Health Worker. Sub centers perform the duties
related to components of primary health care. Basic drugs for minor ailments needed
for immediate health needs of the population it caters to are provided at the Sub Centre.
Recent health infrastructure statistics shows that in the state of Kerala, there exist 5094
Sub Centres (RCH Bulletin, 2007). Out of this, Kozhikode has 389 Sub Centres (Govt.
of Kerala, 2008). In the place of 6003 ANMs that the state of Kerala requires, there
exists only 5634 ANMs. Similarly there is a short fall of 828 male health workers in the
Sub Centres (RCH Bulletin, 2007).
5.1 Coverage of Sub Centres In Kerala, wards are the lowest unit in Panchayati Raj Institutions and Sub Centre is the
basic health unit in Health Delivery system (Govt. of India, 2007). Details of the Sub
Centres selected for the survey are provided in Table S1. Out of the 12 Sub Centres selected, two centres do not have Junior Public Health Nurse
(in one Sub Centre – Kumbalachola- the post is vacant and in one Sub Centre-
Thazenaripatta- the ANM is on long leave). So the interviews with the ANMs could not
be done in these centres. Data on basic facilities are collected from male health workers
of the respective Sub Centres. Three of the Sub Centres serve a population of more
than 12000 in the Thalakulathur community health centre. On an average an ANM has
to serve 8525 population.

89
Table S1: Sub Centres Coverage
Coverage of Sub-Centre
Kuttiyadi Thalakulathur
Ave
rage
per
S C
Velam Naripatta Kakkodi Iruvallur
Che
rapu
ram
Che
ruku
nnu
Cho
imad
am
Kai
veli
Kum
bala
chol
a
Thaz
hena
ripat
ta
Kak
kodi
muk
ku
Kira
loor
Mak
kada
Mar
utha
d
Olo
ppar
a
Mai
n ce
ntre
Population coverage 7003 6944 6963 7236 7204 6223 7244 7780 7790 12563 12666 12685 8525 Number of wards covered by Sub Centre 4 1 1 4 4 1 1 1 1 1 1 7 2.3 Distance between (in kms) Farthest ward to Sub Centre 2.0 3.0 8.0 5.0 8 25 3.0 2.0 5.0 5.0 5.0 10.0 6.75 Sub Centre to PHC 3.0 2.0 5.0 3.0 8 6 3.0 2.0 5.0 5.0 7.0 0 4.1 Sub Centre to CHC 8.0 7.0 13.0 11.0 17 15 15.0 15.0 7.0 10.0 10.0 8.0 11.0 Time Taken (In minutes) to travel in public transport / available mode from Farthest ward to Sub Centre 15 30 30 30 15 60 5.0 5.0
30.0 25.0
45.0 30.0 26.7
Sub Centre to PHC 30 15 30 15 20 30 5.0 5.0
30.0 25.0 60 0 22.1
Sub Centre to CHC 45 40 45 40 45 60 45 45
30.0 50 60 45 45.8
No. of ASHAs working in the Sub Centre 2 2 2 9 6 4 6 6 6 10 9 6 6.5
In Kerala, a village is quite big and all Sub Centres lie within the village area. Hence a
Panchayat ward is considered as a village unlike in other states. Hence an ANM has to
serve 2 wards on an average. The distance from the farthest village to Sub Centre is 6.5
km, from Sub Centre to PHC is 4 km and from SC to CHC is 11 km. Average time
taken to reach the respective centres is 27, 22 and 46 minutes. Average number of
ASHA workers working in the Sub Centre area is 7.

90
5.2 Availability of Infrastructure One important proposal under the NRHM is the strengthening of Sub Centres in the
form of untied funds of Rs 10,000 per annum to be utilized for local needs and
maintenance of Sub Centres. Information on the facilities available at the Sub Centre is
important with regard to its functioning and is given in Table S2.
Table S2: Sub Centres Infrastructure Kuttiyadi Thalakulathur
% of Sub Centre having
respective facility
Availability of Infrastructure in Sub Centres (Yes:1; No:-)
Velam Naripatta Kakkodi Iruvallur
Che
rapu
ram
Che
ruku
nnu
Cho
imad
am
Kai
veli
Kum
bala
chol
a
Thaz
hena
ripat
ta
Kak
kodi
muk
ku
Kira
loor
Mak
kada
Mar
utha
d
Olo
ppar
a
Mai
n ce
ntre
Functioning in designated government building 1 1 1 1 1 1 1 - 1 1 1 - 83.3 IPHS Facility Survey Done 1 - - - - - 1 1 - - 1 - 33.3 Labour Room - - - - - - - - - - - - - Piped water supply - - - 1 - - - - - - - 1 16.7 Regular electricity supply 1 - 1 1 - 1 1 1 1 1 1 1 83.3 Telephone - - - - - - - - - - - - - Type of Sewerage System Soak Pit 1 - 1 1 - 1 1 1 - 1 1 1 75.0 Connected to any Sewerage Line - - - - - - - - 1 - - - 8.3 Open Drain - 1 - - 1 - - - - - - - 16.7 Waste Material is Being Disposed Buried in Pit 1 1 1 - 1 1 1 1 1 1 1 1 91.7 Collected by Agency - - - - - - - - - - - - - Incernation - - - 1 - - - - - - - - 8.3 Thrown in Open - - - - - - - - - - - - -
Out of the 12 centres, 10 are working in Government buildings. IPHS Facility Survey
was done in 33.3 percent of the Sub Centres. There is no labour room facility in any
centre. Only about17 percent have piped water facility, but 83.3 percent have regular
electricity supply. Telephone facility is not available in any centre. Soak pit is the main

91
type of sewerage system in the Sub Centres. Majority (91.7) of Sub Centres bury the
waste materials in a pit.
Table S3 that gives details on availability of quarters for ANM and distance from the
Sub Centre shows that half of the Sub Centres have quarters for ANM and out of these
83 percent of them are occupied by the ANMs.
Table S3: Sub Centres with ANM staying with or away from SC village by distance from Sub Centre and reasons for not staying in Sub Centre quarter
Residential status of ANM (Yes:1; No:-)
Sub Centre Kuttiyadi Thalakulathur
Velam Naripatta Kakkodi Iruvallur
% of Sub Centres
Che
rapu
ram
Che
ruku
nnu
Cho
imad
am
Kai
veli
Kum
bala
chol
a
Thaz
hena
ripat
ta
Kak
kodi
muk
ku
Kira
loor
Mak
kada
Mar
utha
d
Olo
ppar
a
Mai
n ce
ntre
Sub Centre with ANM quarter 1 - 1 1 - - 1 - - 1 1 - 50.0 Sub Centre with ANM staying in SC's quarter 1 - 1 1 - - 1 - - 1 - - 83.3 Sub Centre with ANM staying within SC's village - - - - - - - - - - - - - Sub Centre with ANM staying outside SC's village - 1 - - - - - 1 1 - 1 1 41.7 Reason for ANM not staying in SC quarter: Quality of quarter - - - - - - - - - - - - - Family related reasons - - - - - - - - - - - - - Security reasons - - - - - - - - - - 1 - 100.0 Education and other facilities for children not available - - - - - - - - - - - - - Water/ Power facility not available - - - - - - - - - - 1 - 100.0 Own residence is nearby - - - - - - - - - - - - -
Five ANMs are staying outside the quarters. Main reasons for not staying outside the
quarter are stated as security reasons and lack of water or power facility. Out of the 12
ANMs, about 42 percent are living out side the Sub Centre ward.

92
Sub Centre, Makkada (A Sub Centre without residential facility for ANM as it shares a building put up for Youth Club)
Sub Centre, Cherapuram (A Sub Centre with residential facility for ANM)
The staff in position at the Sub Centres is provided in Table S4. Four Sub Centres have
the Male health worker.
Table S4: Sub Centres with Staff in Position
Availability of Staff (Yes:1; No:0)
Kuttiyadi Thalakulathur
% of Sub Centres with specific staff
available
Velam Naripatta Kakkodi Iruvallur
Che
rapu
ram
Che
ruku
nnu
Cho
imad
am
Kai
veli
Kum
bala
chol
a
Thaz
hena
ripat
ta
Kak
kodi
muk
ku
Kira
loor
Mak
kada
Mar
utha
d
Olo
ppar
a
Mai
n ce
ntre
Health worker male in position - - - - 1 1 - - 1 1 1 1 50.0 Health worker female in position 1 1 1 1 - - 1 1 1 1 1 1 83.3 Additional ANM contractual - - - - - - - - - - 1 - 8.3
All the Sub Centres except that 2 centres at Thazhenaripatta and Kumbalachola of the
Naripatta PHC under Kuttiyadi CHC have ANM. One Sub Centre has an additional
ANM on contractual basis. Under Kuttiyadi CHC, Velam PHC has no MHW in its
three Sub Centres.

93
Table S5: Availability of Labour Room in Sub Centre Kuttiyadi Thalakulathur
% of Sub Centres
Labour Room (Yes:1; No:0) Velam Naripatta Kakkodi Iruvallur
Che
rapu
ram
Che
ruku
nnu
Cho
imad
am
Kai
veli
Kum
bala
chol
a
Thaz
hena
ripat
ta
Kak
kodi
muk
ku
Kira
loor
Mak
kada
Mar
utha
d
Olo
ppar
a
Mai
n ce
ntre
Availability of Labour Room - - - - - - - - - - - - - Labour Room currently in use - - - - - - - - - - - - - Reasons for not using Labour Room ANM not staying - - - - - - - - - - - - - Poor condition - - - - - - - - - - - - - No power supply - - - - - - - - - - - - - No electric supply - - - - - - - - - - - - - Other - - - - - - - - - - - - -
No labour room is available in any Sub Centre as shown in Table S6 5.3 Specific Services Specific services of the Sub Centres include services of the delivery
Table S6A: Number of deliveries performed during 2007-08
Sub Centre Kuttiyadi Thalakulathur
Average delivery
conducted per Sub Centre
Velam Naripatta Kakkodi Iruvallur
Che
rapu
ram
Che
ruku
nnu
Cho
imad
am
Kai
veli
Kum
bala
chol
a
Thaz
hena
ripat
ta
Kak
kodi
muk
ku
Kira
loor
Mak
kada
Mar
utha
d
Olo
ppar
a
Mai
n ce
ntre
Total deliveries conducted - - - - - - - - - - - - -
Due to the non-availability of labour rooms in the Sub Centres, no deliveries are conducted.

94
Table S6B: Sub-Centres with arrangement for deliveries
Arrangement for deliveries (Yes:1; No:-)
Sub Centre
% o
f Sub
Cen
tres
Kuttiyadi Thalakulathur Velam Naripatta Kakkodi Iruvallur
Che
rapu
ram
C
heru
kunn
u
Cho
imad
am
Kai
veli
Kum
bala
chol
a
Thaz
hena
ripat
ta
Kak
kodi
muk
ku
Kira
loor
M
akka
da
Mar
utha
d
Olo
ppar
a M
ain
cent
re
Deliveries conducted at Sub Centre Itself if required referred to higher facility - - - - - - - - - - - - - Deliveries not conducted at Sub Centre but referred to higher facility - - - - - - - - - - - - - Referred to Private/NGO facility - - - - - - - - - - - - -
Since no deliveries are conducted at Sub Centres due to the non availability of labour
rooms, referring deliveries to higher facility is not done.
5.4 Availability of equipments and drugs Analysis of the availability of equipments and drugs of the Sub Centre is necessary in
order to assess its performance as primary health care unit.
Table S7 A: Percentage of Sub Centres with Available equipments
Availability of the equipments (Yes:1; No:-)
Kuttiyadi Thalakulathur
% of Sub Centres with equipment available
Velam Naripatta Kakkodi Iruvallur
Che
rapu
ram
Che
ruku
nnu
Cho
imad
am
Kai
veli
Kum
bala
chol
a
Thaz
hena
ripat
ta
Kak
kodi
muk
ku
Kira
loor
Mak
kada
Mar
utha
d
Olo
ppar
a
Mai
n ce
ntre
Sterilizer - - - - - - - - - - - 1 8.3 Haemoglobinometer 1 1 1 - - - 1 1 1 1 1 1 75.0 Bag & Mask - - - - - - - - - - - - 0.0 Suction Machine 1 - - - - - - - - - - - 8.3 Thermometer 1 1 1 - - 1 1 1 1 1 1 1 83.3 BP Apparatus 1 1 1 1 1 1 1 1 1 1 1 1 100.0 Weighing Machine 1 1 1 1 1 1 1 1 1 1 1 1 100.0 Height Measuring Scale 1 1 1 - - - - - - - - 1 33.3 Reagent Strip for Urine Test - 1 - - - - - 1 - - - 1 25.0 Cuscos Speculum - - - 1 - - - - - - - 1 16.7 Mucus Extractor - - - 1 - - - - - - - - 8.3 Fetoscope 1 1 1 1 - 1 - 1 1 1 1 1 83.3

95
Availability of equipments at the Sub Centres is shown in Table S7A. Only one SC is
equipped with sterilizer. More than 75 percent of the Sub Centres have
Haemoglobinometer, all the Sub Centres have BP Apparatus and Weighing Machine.
Two Sub Centres of Kaiveli and Kumbalachola do not have a Thermometer and
Fetoscope. Steriliser is available only for one Sub Centre. Bag & Mask is not
available in any centre. Height Measuring Scale is available in 4 centres. Reagent Strip
for Urine Test is available in only 3 Sub Centres.
Table S7 B: Percentage of Sub Centres with functional equipments
Functional equipments (Yes:1; No:-)
Kuttiyadi Thalakulathur
% of Sub Centres with functional equipment
Velam Naripatta Kakkodi Iruvallur
Che
rapu
ram
Che
ruku
nnu
Cho
imad
am
Kai
veli
Kum
bala
chol
a
Thaz
hena
ripat
ta
Kak
kodi
muk
ku
Kira
loor
Mak
kada
Mar
utha
d
Olo
ppar
a
Mai
n ce
ntre
Sterliser - - - - - - - - - - - - 0.0
Haemoglobinometer 1 1 1 - - - 1 1 1 1 1 1 75.0
Bag & Mask - - - - - - - - - - - - 0.0
Suction Machine - - - - - - - - - - - - 0.0
Thermometer 1 1 1 - - 1 1 1 1 1 1 1 83.3
BP Apparatus 1 1 1 1 1 1 - 1 1 1 1 1 91.7
Weighing Machine 1 1 1 1 1 1 1 1 1 1 1 1 100.0
Height Measuring Scale 1 1 1 - - - - - - - - 1 33.3
Reagent Strips for Urine
Test - - - - - - - 1 - - - 1 16.7
Cuscos Speculum - - - - - - - - - - - 1 8.3
Mucus Extractor - - - - - - - - - - - -
Fetoscope 1 1 1 1 - 1 - 1 1 1 1 1 83.3
Among the Sub Centres that have different equipments, the functioning status of the
equipments is shown in Table S7B.

96
The sterilizer and Mucus Extractor are not functioning in the Sub Centres which report
availability. Out of the two Sub Centre with cuscos speculum, only one instrument is
functioning. Among 12
sub centers, in one Sub
Centre BP Apparatus is
not working. Weighing
machines is working in
all centres.
Examination room at Kakkodimukku Sub
Centre
Table S8: Status of availability of drugs
Type of Drugs Available (Yes:1; No:-)
Kuttiyadi Thalakulathur % of Sub Centres reporting availability of drug on date of survey
Velam Naripatta Kakkodi Iruvallur
Che
rapu
ram
Che
ruku
nnu
Cho
imad
am
Kai
veli
Kum
bala
chol
a
Thaz
hena
ripat
ta
Kak
kodi
muk
ku
Kira
loor
Mak
kada
Mar
utha
d
Olo
ppar
a
Mai
n ce
ntre
Iron/ Folic Acid - - - 1 1 1 - - - - 1 - 33.3 Disposable Delivery Kit - - - - - - - - - - - - 0.0 Oral Pills 1 1 1 1 1 1 1 1 1 - 1 1 91.7 Emergency Contraceptive - - - - - - - - 1 - 1 - 16.7 Condoms 1 1 1 1 1 1 1 1 1 - 1 - 83.3 IUD 1 1 1 1 - - - - - - - 1 41.7 ORS 1 1 1 1 1 1 1 1 1 1 1 1 100.0 Tab. Flucanazole Vaginal - - - - - - - - - - - - 0.0 Partograph - - - - - - - - 1 1 1 - 25.0 Pregnancy Test Kit 1 1 1 - - - 1 1 1 1 1 1 75.0 Tab. Misoprostal - - - - - - - - - - - - 0.0 Syp Paracetamol - - 1 - - - - - - - - - 8.3 Vi. A 1 1 1 1 1 1 1 1 1 1 1 1 100.0 Tab Ciprofloxacin - - - - - - - - - - - - 0.0 Disposable Gloves 1 1 1 1 - 1 1 - 1 1 1 - 75.0

97
Availability of drugs on the date of survey as shown in Table S8 reveals that Iron/ Folic
Acid are available in 33.3 percent of the Sub Centres whereas Disposable Delivery Kit
is not available in any centre. Oral pills are available in all the Sub Centres except
Maruthad Sub Centre. Condoms are not available in Maruthad SC and Main centre.
Emergency contraceptive is available only in 2 Sub Centres of Makkada and Oloppara.
Vitamin A and ORS is available in all centres. Pregnancy Test Kit and disposable
gloves are available in 75 percent of the Sub Centres. Tab. Flucanazole Vaginal, Tab.
Misoprostal and Tab. Ciprofloxacin are not available in any centre.
5.5 Status of Specific Skills and Procedures Evaluation of the specific skills and procedures of the ANMs is important to assess the
center‟s performance.
Table S9 that shows the specific skills and procedures performed at the Sub Centre
reveals that out of the 10 centres with ANMs, registration of pregnancy within three
months are performed in cent percent of the Sub Centres. In all the centres, the ANM
ensure 3 ANC visits as per the RCH schedule (1st: 6th month, 2nd: 7th month, 3rd: 9th
month for their clients) and report carrying out specific examinations like Blood
Pressure, Hemoglobin, and Urine. All centres have ANMs identifying high risk
pregnancies in their area.
But with regard to training received by ANMs on different aspects, only 20 percent of
the ANMs have been trained on the insertion/ removal of IUD A380. In no Sub Centres
IUD insertions are carrying out but they take the women to PHC for insertion. Two Sub
Centres have ANM who have trained in syndromic treatment of RTI/ STI. Nine out of
ten Sub Centres report carrying out immunization services.

98
Table S9: Status of Specific Skills and Procedures
Type of Skills/ Procedure (Yes: 1; No: -)
Kuttiyadi Thalakulathur % of Sub Centres reporting availability of specific skills/ procedure
Velam Naripatta Kakkodi Iruvallur
Che
rapu
ram
Che
ruku
nnu
Cho
imad
am
Kai
veli
Kum
bala
chol
a
Thaz
hena
ripat
ta
Kak
kodi
muk
ku
Kira
loor
Mak
kada
Mar
utha
d
Olo
ppar
a
Mai
n ce
ntre
Register pregnancy within three month 1 1 1 1 - - 1 1 1 1 1 1 100.0 Carry out 3 ANC visits as per the RCH schedule (1st: 6th month, 2nd: 7th month, 3rd: 9th month) 1 1 1 1 - - 1 1 1 1 1 1 100.0 Carry out specific examinations like Blood Pressure, Hemoglobin, and Urine 1 1 1 1 - - 1 1 1 1 1 1 100.0 Provision of TT, IFA etc. 1 1 1 1 - - 1 1 1 1 1 1 100.0 Identification of High Risk Pregnancies 1 1 1 1 - - 1 1 1 1 1 1 100.0 Is the ANM carrying out IUCD insertion/ removal - *1 - - - - - - - - - 1 20.0 Is IUCD insertion being carried out using IUD A380 - 1 - - - - - - - - - 1 100.0 Is the supply of IUD A380 regularly available - 1 - - - - - - - - - 1 100.0 Has the ANM been trained on the insertion/ removal of IUD A380 - - 1 - - - - - - - - 1 20.0 Is the ANM trained in syndromic treatment of RTI/ STI - 1 1 - - - - - - - - - 20.0 Immunization services 1 1 1 - - - 1 1 1 1 1 1 90.0
* Insertion carrying out in PHC
5.6 Service Outcome Information on service outcome of the ANMS including total ANC registered, high risk
cases identified, neonate infections identified etc are shown in Table S10.
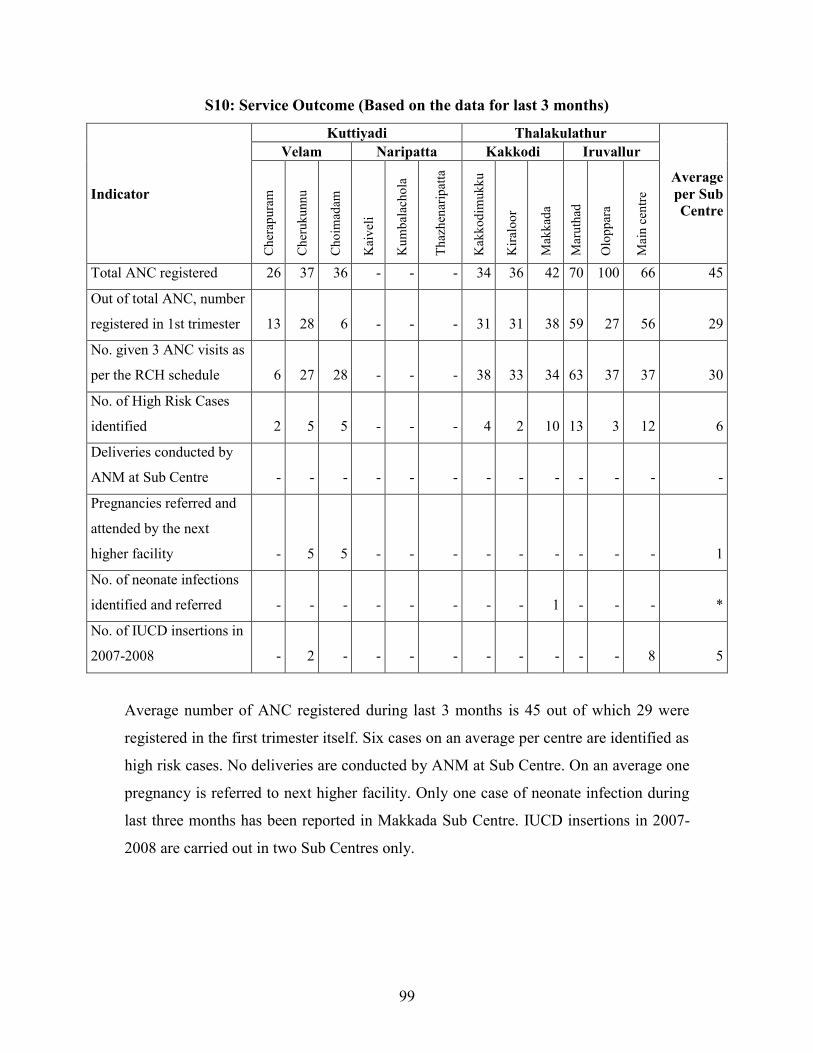
99
S10: Service Outcome (Based on the data for last 3 months)
Indicator
Kuttiyadi Thalakulathur
Average per Sub Centre
Velam Naripatta Kakkodi Iruvallur
Che
rapu
ram
Che
ruku
nnu
Cho
imad
am
Kai
veli
Kum
bala
chol
a
Thaz
hena
ripat
ta
Kak
kodi
muk
ku
Kira
loor
Mak
kada
Mar
utha
d
Olo
ppar
a
Mai
n ce
ntre
Total ANC registered 26 37 36 - - - 34 36 42 70 100 66 45
Out of total ANC, number
registered in 1st trimester 13 28 6 - - - 31 31 38 59 27 56 29
No. given 3 ANC visits as
per the RCH schedule 6 27 28 - - - 38 33 34 63 37 37 30
No. of High Risk Cases
identified 2 5 5 - - - 4 2 10 13 3 12 6
Deliveries conducted by
ANM at Sub Centre - - - - - - - - - - - - -
Pregnancies referred and
attended by the next
higher facility - 5 5 - - - - - - - - - 1
No. of neonate infections
identified and referred - - - - - - - - 1 - - - *
No. of IUCD insertions in
2007-2008 - 2 - - - - - - - - - 8 5
Average number of ANC registered during last 3 months is 45 out of which 29 were
registered in the first trimester itself. Six cases on an average per centre are identified as
high risk cases. No deliveries are conducted by ANM at Sub Centre. On an average one
pregnancy is referred to next higher facility. Only one case of neonate infection during
last three months has been reported in Makkada Sub Centre. IUCD insertions in 2007-
2008 are carried out in two Sub Centres only.

100
Table S11: Status of Record Maintenance
Type of Records maintained (Yes:1; No:0)
Kuttiyadi Thalakulathur
% of SCs reporting
maintenance of record
Velam Naripatta Kakkodi Iruvallur
Che
rapu
ram
Che
ruku
nnu
Cho
imad
am
Kai
veli
Kum
bala
chol
a
Thaz
hena
ripat
ta
Kak
kodi
muk
ku
Kira
loor
Mak
kada
Mar
utha
d
Olo
ppar
a
Mai
n ce
ntre
Household Survey
Register - 1 1 - - - 1 1 1 1 1 1 80.0
Ante Natal Register - 1 1 - - - 1 1 1 1 1 1 80.0
Eligible Couple
Register - 1 1 - - - 1 1 1 1 1 - 70.0
Post Natal Care Register - 1 1 - - - - - 1 1 1 - 50.0
Family Planning
Register - 1 1 - - - 1 1 1 1 1 1 80.0
Birth and Death
Register - 1 1 - - - - - - - - 1 30.0
Immunisation Register 1 1 1 - - - 1 1 1 1 1 1 90.0
Meeting Register - 1 1 - - - 1 1 1 1 1 1 80.0
JSY Register - 1 1 - - - 1 - - 1 1 1 60.0
Untied Funds Register - 1 1 - - - 1 1 1 1 1 - 70.0
Cash Book - 1 1 - - - - - - - 1 - 30.0
Important among the duties of the ANM are maintenance of proper records at the Sub
Centre relating to all work carried out, records of individual patients, in particular, the
prenatal and antenatal records and birth registries. Table S11 shows this aspect at the
Sub Centre. Out of the 10 ANMs interviewed, a major proportion are maintaining
household survey register and Antenatal register, family planning register,
immunization register, meeting register and untied fund register. Cash book and birth
and death register is maintained only by 30 percent of the ANMs, post natal care
register by 50 percent. It is found that 60 percent are maintaining JSY register and 70
percent are maintaining eligible couple registers.

101
Table S12 A: Status of Awareness of ANM about JSY Scheme ANM's awareness about JSY Value Aware about JSY Number of ANMs interviewed 10 Number of ANMs reporting awareness 10 Percent reporting awareness 100.0 Aware about average amounts to be given to beneficiaries for A. Institutional Delivery 700 B. Home Delivery 714.3 C. Transport Facility 300.0 ANM reporting increase in demand for Institutional delivery after implementation of JSY Scheme Number of ANMs interviewed 10 Number of ANMs reporting awareness 10 Percent reporting awareness 100.0
Table S12 reports awareness about JSY scheme among ANMs. Cent percent of them
reported that they are aware about the JSY scheme. Average amount to be given to
beneficiaries for institutional deliveries as known to the ANMs is Rs.700 and for home
delivery is Rs.714.3 and average amount to be given for transportation facility is
Rs.300. Some ANMs are not aware about the amount to be given for home delivery,
may be because of the absence of home deliveries in their area.
Table S12 B: Status of procedure under JSY Scheme
ANM's awareness about JSY Percentage Funds being paid to beneficiaries by Cash 100.0 Cheque - Vouchers - Average time taken after birth for JSY payment to beneficiary Less than 1 Week 70.0 1 : 2 Weeks - More than 2 Weeks 30.0 Transport for shifting of cases available from Sub Centre to PHC/ CHC - Register available for recording of JSY expenditure 50.0 Total no. of ANMs interviewed 10
When the ANMs were asked about the mode of payment of cash incentive to JSY
beneficiaries, all the ANMs reported that the amount was given in cash. Regarding the
time taken after birth for payment, 70 percent of the ANMs are of the opinion that
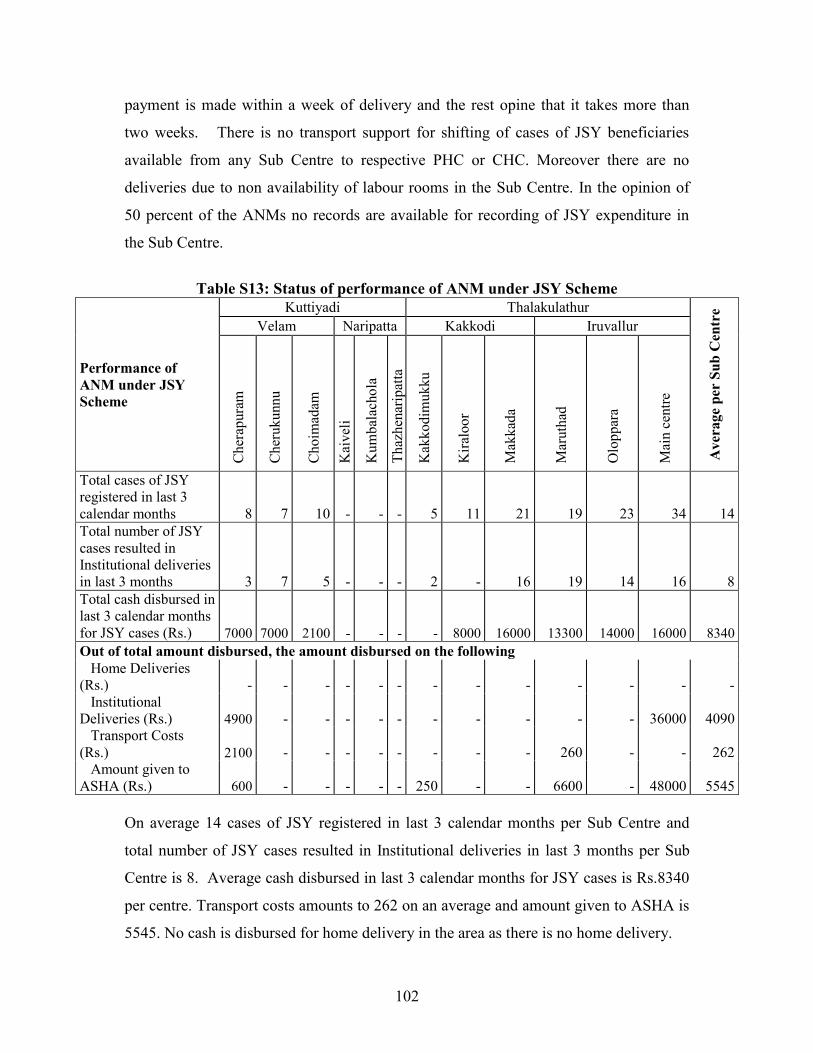
102
payment is made within a week of delivery and the rest opine that it takes more than
two weeks. There is no transport support for shifting of cases of JSY beneficiaries
available from any Sub Centre to respective PHC or CHC. Moreover there are no
deliveries due to non availability of labour rooms in the Sub Centre. In the opinion of
50 percent of the ANMs no records are available for recording of JSY expenditure in
the Sub Centre.
Table S13: Status of performance of ANM under JSY Scheme
Performance of ANM under JSY Scheme
Kuttiyadi Thalakulathur
Ave
rage
per
Sub
Cen
tre
Velam Naripatta Kakkodi Iruvallur
Che
rapu
ram
Che
ruku
nnu
Cho
imad
am
Kai
veli
Kum
bala
chol
a
Thaz
hena
ripat
ta
Kak
kodi
muk
ku
Kira
loor
Mak
kada
Mar
utha
d
Olo
ppar
a
Mai
n ce
ntre
Total cases of JSY registered in last 3 calendar months 8 7 10 - - - 5 11 21 19 23 34 14 Total number of JSY cases resulted in Institutional deliveries in last 3 months 3 7 5 - - - 2 - 16 19 14 16 8 Total cash disbursed in last 3 calendar months for JSY cases (Rs.) 7000 7000 2100 - - - - 8000 16000 13300 14000 16000 8340 Out of total amount disbursed, the amount disbursed on the following Home Deliveries (Rs.) - - - - - - - - - - - - - Institutional Deliveries (Rs.) 4900 - - - - - - - - - - 36000 4090 Transport Costs (Rs.) 2100 - - - - - - - - 260 - - 262 Amount given to ASHA (Rs.) 600 - - - - - 250 - - 6600 - 48000 5545
On average 14 cases of JSY registered in last 3 calendar months per Sub Centre and
total number of JSY cases resulted in Institutional deliveries in last 3 months per Sub
Centre is 8. Average cash disbursed in last 3 calendar months for JSY cases is Rs.8340
per centre. Transport costs amounts to 262 on an average and amount given to ASHA is
5545. No cash is disbursed for home delivery in the area as there is no home delivery.

103
5.7 Status of Untied Grants As part of the National Rural Health Mission, Sub Centres are provided with Rs.10,000
as an untied fund to facilitate meeting urgent yet discrete activities that need relatively
small sums of money. The fund has to be kept in a joint bank account of the ANM and
the Sarpanch. Decisions on activities for which the funds are to be spent will be
approved by the Village Health Committee (VHC) and be administered by the ANM.
The status of untied funds is given in Table S14.
Table S14: Status of Untied Grants
Status of Untied Grants (Yes:1; No:-)
Kuttiyadi Thalakulathur
% o
f Sub
Cen
tres
Velam Naripatta Kakkodi Iruvallur
Che
rapu
ram
Che
ruku
nnu
Cho
imad
am
Kai
veli
Kum
bala
chol
a
Thaz
hena
ripat
ta
Kak
kodi
muk
ku
Kira
loor
Mak
kada
Mar
utha
d
Olo
ppar
a
Mai
n ce
ntre
Sub Centre received Untied Grant 1 1 1 1 - - 1 1 1 1 1 - 90.0 Sub Centre expenditure from Untied Grant 1 1 1 1 - - 1 1 1 1 1 - 100.0 ANM having a joint account with the
Sarpanch/ any other GP functionary 1 1 1 1 - - 1 - 1 1 1 - 88.9
Sub Centre reporting maintenance of register to
record the decisions taken to spend this amount 1 1 1 1 - - 1 1 1 1 1 - 100.0
Sub Centre reporting written record of
transactions being carried out on Untied funds - 1 1 1 - - 1 1 1 1 1 - 88.9
Sub Centre reporting that Sarpanch/ others ever
reviewed the expenditure records - 1 1 - - - 1 - - 1 1 - 55.6
Sub Centre reporting expenditure from Untied Grant on the following: Spent on Purchase of Drugs - - - - - - - - - - - - -
Arranging Transport - - - - - - - - - - - - -
Paying of Power/ Telephone bills - - - - - - - - - - - - -
Arranging facilities like Water Cooler etc. for
patients - -
1 - - -
1 - 1 - - - 33.3
Other (like white wash, maintenance etc.) 1 1 1 1 - - 1 1 1 1 1 - 100.0
Majority of the Sub Centres (90 percent) received untied grant and all report
expenditure from Untied Grant. Around 89 percent reported that they have a joint

104
account with the Sarpanch or any other GP functionary. All the Sub Centres maintain
register to record the decisions taken to spend this amount and about 89 percent keep
written records of transactions being carried out on untied funds. In 55.6 percent of the
Sub Centres, Sarpanch or others have reviewed the expenditure records. Majority of the
ANMs report that the untied funds are used for white washing, other maintenance
works, for cleaning wells in the Sub Centre area, or for organizing medical camp.

105
Chapter 6
Household Characteristics
Information on household characteristics was obtained from 1200 households. The
location of the households is such that 600 households are located within the Sub Centre
Head Quarter Village (ward) and the remaining 600 households selected are located at a
distance farthest from the Sub-Centre. These households were selected from 24 wards
that come under 12 Sub Centres. Fifty households each were selected systematically
from each of the selected ward. For the purpose of selecting the households, the total
number of households in a village was divided by 50 to find out the selection interval,
„r‟. After that first household situated at the north-west corner of the village was
selected and subsequently every rth household was selected moving in an „anti-clock
wise‟ direction till 50 households were selected.
This chapter presents the demographic characteristics of respondents, characteristics of
household, respondent‟s knowledge about NRHM, ASHA, JSY, background
characteristics of JSY beneficiaries, utilization of government health facilities and
client satisfaction, information on morbidity and respondents knowledge about AIDS.
6.1 Characteristics of respondents Age, sex, marital status etc are important background characteristics that play a vital
role in any demographic or socio-economic study. Information collected on the basic
demographic characteristics like age, sex, and also education and marital status of
respondents are provided in Table H1. Out of the 1200 respondents, the proportion
aged 30-39 years accounts for one-fourth of the total, about 23 percent are from 40-49
year age group and another 22 percent are aged less than 30 years. The percentage of
respondents aged 60 years and above constitutes almost 16 percent and the remaining
14 percent are aged 50-59 years. More than three-fourths of the respondents are
females (76.3 percent).
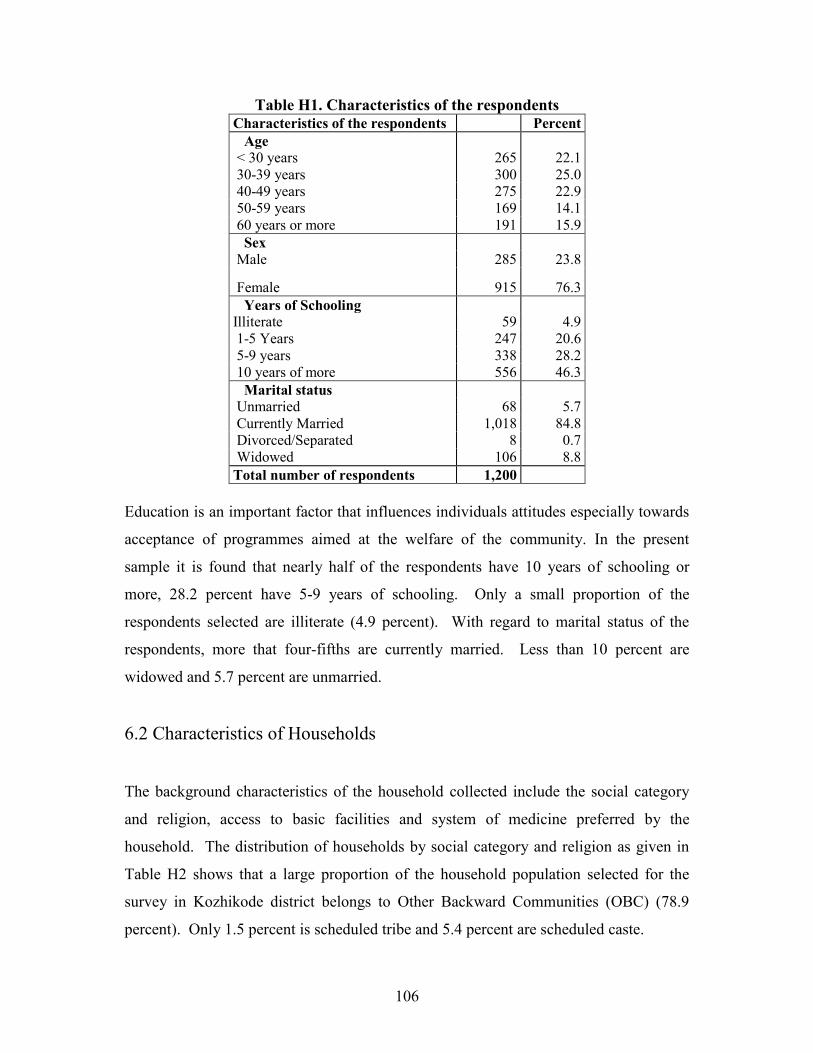
106
Table H1. Characteristics of the respondents Characteristics of the respondents Percent Age < 30 years 265 22.1 30-39 years 300 25.0 40-49 years 275 22.9 50-59 years 169 14.1 60 years or more 191 15.9 Sex Male 285 23.8
Female 915 76.3 Years of Schooling Illiterate 59 4.9 1-5 Years 247 20.6 5-9 years 338 28.2 10 years of more 556 46.3 Marital status Unmarried 68 5.7 Currently Married 1,018 84.8 Divorced/Separated 8 0.7 Widowed 106 8.8 Total number of respondents 1,200
Education is an important factor that influences individuals attitudes especially towards
acceptance of programmes aimed at the welfare of the community. In the present
sample it is found that nearly half of the respondents have 10 years of schooling or
more, 28.2 percent have 5-9 years of schooling. Only a small proportion of the
respondents selected are illiterate (4.9 percent). With regard to marital status of the
respondents, more that four-fifths are currently married. Less than 10 percent are
widowed and 5.7 percent are unmarried.
6.2 Characteristics of Households
The background characteristics of the household collected include the social category
and religion, access to basic facilities and system of medicine preferred by the
household. The distribution of households by social category and religion as given in
Table H2 shows that a large proportion of the household population selected for the
survey in Kozhikode district belongs to Other Backward Communities (OBC) (78.9
percent). Only 1.5 percent is scheduled tribe and 5.4 percent are scheduled caste.

107
Table H2. Characteristics of the household
Characteristics of the household Percent Social category Scheduled caste 64 5.4 Scheduled tribe 18 1.5 OBC 938 78.9 Others 169 14.2 Religion Hindu 842 70.2 Muslim 321 26.8 Christian 37 3.1 Sikhs - - Other - - Households having BPL status Yes 489 40.8 No 711 59.3 Household living in pucca house Yes 917 76.4 No 283 23.6 Households with electricity Yes 1,087 90.6 No 113 9.4 Households with toilet facility Yes 1,169 97.4 No 31 2.6 Households with piped water supply Yes 133 11.1 No 1,067 88.9 Households using LPG/Biogas for cooking Yes 498 41.5 No 702 58.5 Household with own agricultural land Yes 993 82.8 No 207 17.3 Households have a mobile phone Yes 722 60.2 No 478 39.8 Households own a colour/B&W television Yes 781 65.1 No 419 34.9 Households with low standard of living index Yes 104 8.7 No 1,096 91.3 Total number of respondents 1,200 Religious break up reveals that 70.2 percent of the households belong to Hindu religion,
followed by Muslims (26.8 percent) and the rest are Christians (3.1 percent).

108
Availability of basic amenities like proper housing, water, sanitation facilities,
electricity, owning agricultural land etc are important indicators of the health of the
population. Presence or absence of these basic facilities speaks of the socio-economic
status of the household. Data on households having BPL status was collected as many
of the schemes introduced under the NRHM like the JSY are specific to BPL families.
Here, among the households selected for the study in the district, two-fifths (40.8
percent) are BPL households, and the rest 59.3 percent of the household do not have the
BPL status. More than three fourths household population lives in pucca houses.
Majority of the households have electricity (90.6 percent), proportion with toilet facility
constitute 97.4 percent but those with piped water facility constitute only 11 percent.
Among the other household possessions, 41.5 percent have LPG/Biogas for cooking,
more than two-thirds have mobile phones (60.2 percent) and colour/black and white
television (65.1 percent). About 83 percent of the households own agricultural land.
The standard of living index estimated on the basis of the availability of the basic
amenities and household possessions reveal that only 8.7 percent of the household have
low standard of living.
Table H2.1. Characteristics of the household
Characteristics of the household Number Number of households with living children born in last five years:Total Total 454 Number of households with Institutional delivery:Total Total 454 % of children born in Health Institutions during last 5 years
The number of households interviewed that had living children born in the last five
years adds up to 454 children. Of these, cent percent were institutional deliveries.
Maintaining good hygiene by proper disposal of waste and preventing water stagnation
that leads to insect breeding is a corner stone to the health of the community. Stagnant
water is the breeding ground for disease spreading insects. In the wake of outbreak of
communicable diseases, information on these aspects and the system of medicine

109
preferred by the respondents was collected in the survey, details of which are furnished
in Table H3.
Table H3: Percent distribution of households by their waste disposal, stagnation of waste water and mosquito breeding around the house and system of medicine
preferred by them Households located in
Sub Centre HQ Village Households located in
other village All
Number Percent Number Percent Number Percent Method of waste disposal by the household Thrown in the open 25 4.2 37 6.2 62 5.2 Buried in a pit 167 28.0 139 23.3 306 25.6 Burnt 377 63.3 395 66.2 772 64.7 Other 27 4.5 26 4.4 53 4.4 Stagnation of waste water around the household Yes 27 4.5 19 3.2 46 3.8 No 573 95.5 579 96.8 1,152 96.2 Instance of any mosquito breeding Yes 27 100.0 15 93.8 42 97.7 No - - 1 6.3 1 2.3 System of medicine preferred: Allopathic
Yes 589 98.2 595 99.2 1,184 98.7 No 11 1.8 5 0.8 16 1.3 Ayurveda Yes 254 42.3 243 40.5 497 41.4 No 346 57.7 357 59.5 703 58.6 Yoga and Naturopathy Yes 7 1.2 5 0.8 12 1.0 No 593 98.8 595 99.2 1,188 99.0 Unani Yes 6 1.0 3 0.5 9 0.8 No 594 99.0 597 99.5 1,191 99.3 Siddha Yes 2 0.3 1 0.2 3 0.3 No 598 99.7 599 99.8 1,197 99.8 Homeopathy Yes 190 31.7 203 33.8 393 32.8 No 410 68.3 397 66.2 807 67.3 Traditional healing Yes 4 0.7 5 0.8 9 0.8 No 596 99.3 595 99.2 1,191 99.3 Any other Yes 1 0.2 - - 1 0.1 No 599 99.8 600 100.0 1,199 99.9 None Yes - - - - - - No 600 100.0 600 100.0 1,200 100.0 Total Number of Households 600 600 1,200

110
The general sense of hygiene of the selected household population appears to be good
because majority of the households selected dispose the waste generated either by
burning (64.7 percent) or burying in pit (25.6 percent). Only about 5 percent of the
household follow the unhygienic practice of throwing the waste in the open area.
Similarly comparing the method of disposal of waste among households located in the
Sub Centre HQ wards and those households located in other wards, much variation is
not found though safe practice of waste disposal methods are slightly higher in wards
located in the Sub Centre HQ wards. In 4 percent of the households where presence of
stagnant water is reported, cent percent instances of mosquito breeding exists especially
in households located in Sub Centre Head Quarter Wards. In other households located
in other wards, the situation is only little better where there is 93.8 percent.
The officially recognized traditional systems of medicines are Ayurveda, Yoga &
Naturopathy, Unani, and Siddha. Homoeopathy though not a traditional system, but is
an integral part of the country‟s health delivery system. AYUSH is the Government
approved acronym used to represent these systems of medicine. NRHM aims at
strengthening the health delivery system with increased public spending and envisages
provisioning of traditional systems of medicine in the primary health network. There is
focused attention to the development of Education & Research in Ayurveda, Yoga &
Naturopathy, Unani, Siddha and Homoeopathy systems. The systems of medicine
people in Kozhikode district is assessed here, information about which are presented in
Table H3. The most widely used system of medicine is Allopathy (98.7 percent)
followed by Ayurveda (41.4 percent) and Homeopathy (32.8 percent). Only a small
proportion (about one percent) of the people report using Yoga and Naturopathy, Unani
or Siddha.
Respondent‟s knowledge about the primary health care, particularly the service
providing health worker, details on availability of health worker, availability of health
facility, and the transport used at times of need are assessed and presented in Table H4.

111
Table H 4.1. Percent distribution of household respondents by their information about availability of health worker, health facilities and transport used to take
serious patients
Households located in Sub Centre HQ
Village
Households located in other village
All
Number Percent Number Percent Number Percent Heard about ANM Yes 517 86.2 516 86.0 1,033 86.1 No 83 13.8 84 14.0 167 13.9 Heard about male health worker
Yes 282 47.2 312 52.0 594 49.6 No 316 52.8 288 48.0 604 50.4 Visited by a Health Worker in last one month
Yes 128 21.5 116 19.5 244 20.5 No 466 78.5 478 80.5 944 79.5 Health worker available at the time of need
Yes 301 50.4 318 53.4 619 51.9 No 296 49.6 278 46.6 574 48.1 Available health facility in need: RMP
Yes 152 25.3 165 27.5 317 26.4 No 448 74.7 435 72.5 883 73.6 Private clinic/NGO Yes 269 44.8 259 43.2 528 44.0 No 331 55.2 341 56.8 672 56.0 Sub Centre Yes 35 5.8 24 4.0 59 4.9 No 565 94.2 576 96.0 1,141 95.1 PHC Yes 374 62.3 377 62.8 751 62.6 No 226 37.7 223 37.2 449 37.4 CHC Yes 159 26.5 146 24.3 305 25.4 No 441 73.5 454 75.7 895 74.6 Other Yes 98 16.3 95 15.8 193 16.1 No 502 83.7 505 84.2 1,007 83.9 Contd…… .. Over 86 percent of the respondents have heard of ANM but only half the respondents
interviewed have heard about male health worker. But only one in five households was
visited by a health worker during the last one month. This proportion shows only slight
variation by location of households in Sub Centre Head Quarter Wards and Other

112
Wards (21.5 percent as against 19.5 percent respectively). When the respondents were
asked whether they received timely service of the health worker, only just over half of
the respondents responded positively (51.9 percent). This proportion is a little better in
favour of households located in wards other than the Sub Centre Head Quarter Wards
(53.4 percent as against 50.4 percent respectively). With regard to the type of health
facility available at the time of need, over three-fifths of the respondents reported that
service from the PHC (62.4 percent) is available, over two-fifths said service of the
Private clinic/NGO is available (44.0 percent), just over a quarter said service of the
Registered Medical Practitioner (26.4 percent) and Community Health Centre (25.4
percent) is available at times of need. Much difference is not visible between the
response from household located within and outside the Sub Centre Head Quarter
Wards.
But the health facilities that people prefer for treatment of serious problems vary from
those that are usually available in the area depending on the facilities available for
treatment of serious ailments. Nearly half of the respondents said they take serious
patients to District/Sub District hospital (47.4 percent) for treatment of serious ailments.
The proportional response is slightly greater among households located in Sub Centre
Head Quarter Wards (50.7 percent) that those households located outside the Sub
Centre Head Quarter Wards (44.2 percent). The next important health facility is
reported as the “Other” facility (40.3 percent) which mainly includes the Kozhikode
Medical College. Only 18 percent of the respondents said they take serious patients to
CHC, 16 percent avail the service of Registered Medical Practitioner, 12 percent to
NGO hospital or clinic and 8 percent use the service available at a PHC.
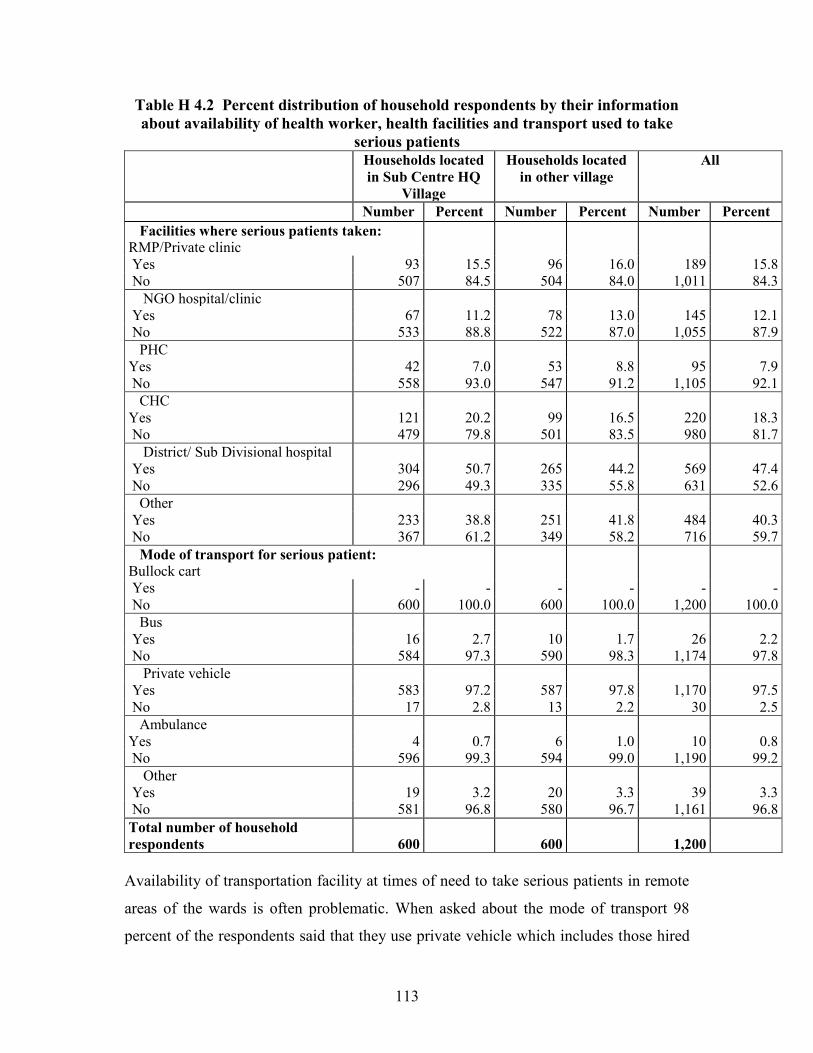
113
Table H 4.2 Percent distribution of household respondents by their information about availability of health worker, health facilities and transport used to take
serious patients
Households located in Sub Centre HQ
Village
Households located in other village
All
Number Percent Number Percent Number Percent Facilities where serious patients taken: RMP/Private clinic
Yes 93 15.5 96 16.0 189 15.8 No 507 84.5 504 84.0 1,011 84.3 NGO hospital/clinic Yes 67 11.2 78 13.0 145 12.1 No 533 88.8 522 87.0 1,055 87.9 PHC Yes 42 7.0 53 8.8 95 7.9 No 558 93.0 547 91.2 1,105 92.1 CHC Yes 121 20.2 99 16.5 220 18.3 No 479 79.8 501 83.5 980 81.7 District/ Sub Divisional hospital Yes 304 50.7 265 44.2 569 47.4 No 296 49.3 335 55.8 631 52.6 Other Yes 233 38.8 251 41.8 484 40.3 No 367 61.2 349 58.2 716 59.7 Mode of transport for serious patient: Bullock cart
Yes - - - - - - No 600 100.0 600 100.0 1,200 100.0 Bus Yes 16 2.7 10 1.7 26 2.2 No 584 97.3 590 98.3 1,174 97.8 Private vehicle Yes 583 97.2 587 97.8 1,170 97.5 No 17 2.8 13 2.2 30 2.5 Ambulance Yes 4 0.7 6 1.0 10 0.8 No 596 99.3 594 99.0 1,190 99.2 Other Yes 19 3.2 20 3.3 39 3.3 No 581 96.8 580 96.7 1,161 96.8 Total number of household respondents 600
600
1,200
Availability of transportation facility at times of need to take serious patients in remote
areas of the wards is often problematic. When asked about the mode of transport 98
percent of the respondents said that they use private vehicle which includes those hired

114
(car, jeep, trucker etc) and owned vehicles. Only 2 percent use bus and less than 1
percent use ambulance.
6.3 NRHM, ASHA, JSY
The National Rural Health Mission was launched in India in April 2005, to provide
accessible, affordable and accountable quality of health services even to the poorest
households in the remotest rural regions. NRHM is popularly known as „Arogya
Keralam in the state. It started out much later in August 2006 in Kerala.
In Kozhikode district, only about half of the respondents have heard of NRHM. An
important source of information to these respondents has been the radio/television (71.2
percent). This proportion is 68.6 percent among households located in Sub Centre Head
Quarter Wards and 73.6 percent in wards located in other wards. The next important
source of information is the newspaper (25.6 percent), other sources (20 percent) that
include mainly the relatives, family members, school and friends. Only 2 percent said
they heard about NRHM from ASHA.
One of the key components of the NRHM is to provide every village in the country with
a trained female community health activist – „ASHA‟ or Accredited Social Health
Activist. She is primarily a resident of the village and trained to work as an interface
between the community and the public health system. As ASHA will be the first port of
call for any health related demands of deprived sections of the population, especially
women and children, who find it difficult to access health services, the community is
supposed to be well aware of her presence. But it is seen that only just over one-third of
the respondents have heard about ASHA in households located in wards other than Sub
Centre Head Quarter Wards (31.8 percent) as against 38.4 percent in households located
in Sub Centre Head Quarter Wards (Table H5).

115
Table H 5. Percent distribution of household respondents by their knowledge about NRHM,ASHA and her activities, VHND, VHSC and JSY
Households located in Sub Centre HQ Village
Households located in other village
All
Have heard of NRHM Number Percent Number Percent Number Percent Yes 287 47.8 299 49.8 586 48.8 No 313 52.2 301 50.2 614 51.2 Source of information about NRHM: ASHA
Yes 6 2.1 6 2.0 12 2.0 No 281 97.9 293 98.0 574 98.0 Radio/television Yes 197 68.6 220 73.6 417 71.2 No 90 31.4 79 26.4 169 28.8 Newspaper Yes 70 24.4 80 26.8 150 25.6 No 217 75.6 219 73.2 436 74.4 Panchayat Yes 15 5.2 12 4.0 27 4.6 No 272 94.8 287 96.0 559 95.4 Community member Yes 20 7.0 14 4.7 34 5.8 No 267 93.0 285 95.3 552 94.2 Other Yes 64 22.3 53 17.7 117 20.0 No 223 77.7 246 82.3 469 80.0 Number of respondents heard about ASHA Yes 230 38.4 191 31.8 421 35.1 No 369 61.6 409 68.2 778 64.9 ASHA carries a kit Yes 34 24.3 27 22.0 61 23.2 No 106 75.7 96 78.0 202 76.8 ASHA provides common medicine free of cost Yes 59 37.6 53 40.2 112 38.8 No 98 62.4 79 59.8 177 61.2 ASHA held discussion about: Hand washing Yes 70 48.6 65 51.6 135 50.0 No 74 51.4 61 48.4 135 50.0 ASHA held discussion about: Construction of household toilets Yes 55 38.7 57 45.6 112 41.9 No 87 61.3 68 54.4 155 58.1 ASHA held discussion about: Safe drinking water Yes 78 53.4 72 57.6 150 55.4 No 68 46.6 53 42.4 121 44.6 Village Health and Nutrition Day being organized in the village Yes 359 60.0 365 61.0 724 60.5 No 239 40.0 233 39.0 472 39.5 Presence of village health and sanitation committee in the village Yes 148 24.7 121 20.3 269 22.5 No 450 75.3 476 79.7 926 77.5

116
Empowered with knowledge and a drug-kit to deliver first-contact healthcare, every
ASHA is expected to be a fountainhead of community participation in public health
programmes in her village. In the present survey, it is found that only 23.2 percent of
the respondents report that ASHA carries a kit with her. But about 40 percent of the
respondents opine that she provides common medicines free of cost. ASHA is also a
promoter of good health practices and is expected to provide information to the
community on determinants of health such as nutrition, basic sanitation & hygienic
practices, healthy living and working conditions, information on existing health services
and the need for timely utilisation of health & family welfare services. Among those
who have heard about ASHA, half the respondents said that ASHA held discussions
about hand washing, about 42 percent said that she held discussions about constructions
of household toilets and 55.4 percent reported of discussing about safe drinking water.
The Village Health and Sanitation Committees (VHSC) are another key strategy of
communitisation under NRHM. Every village is supposed to benefit from the Health &
Sanitation Committee of the Gram Panchayat. All ASHAs are supposed to be involved
in this VHSC of the Panchayat either as members or as special invitees. When the
respondents were asked about the presence of a VHSC, only 22.5 percent said there is
such a committee. About 61 percent of the respondents reported that Village Health
and Nutrition days have been organized. The frequency of such health and nutrition
days has been reported to be monthly by half the respondents (50.8 percent), as
quarterly by 36.7 percent and as annually by 10 percent of the respondents. It can also
be observed that more respondents from household located in Sub Centre Head Quarter
Wards report of frequent monthly meetings whereas more respondents from households
located in wards other than the Sub Centre Head Quarter Wards report quarterly
meetings.

117
Table H 5.1. Percent distribution of household respondents by their knowledge about NRHM,ASHA and her activities, VHND, VHSC and JSY
Households located in Sub Centre HQ
Village
Households located in other village
All
Number Percent Number Percent Number Percent Frequency of Village Health and Nutrition Weekly 6 2.9 4 2.1 10 2.5 Monthly 113 53.8 89 47.3 202 50.8 Quarterly 69 32.9 77 41.0 146 36.7 Annual 22 10.5 18 9.6 40 10.1 Don't know - - - - - - Number of respondents aware about the JSY scheme Yes 478 79.7 509 84.8 987 82.3 No 122 20.3 91 15.2 213 17.8 Source of Information Radio/Television
Yes 329 68.8 360 70.7 689 69.8 No 149 31.2 149 29.3 298 30.2 Pamphlets Yes 4 0.8 7 1.4 11 1.1 No 474 99.2 502 98.6 976 98.9 Hoardings at SC/PHC etc Yes 74 15.5 65 12.8 139 14.1 No 404 84.5 444 87.2 848 85.9 ASHA worker Yes 18 3.8 18 3.5 36 3.6 No 460 96.2 491 96.5 951 96.4 Anganwadi Centre/Worker Yes 66 13.8 82 16.1 148 15.0 No 412 86.2 427 83.9 839 85.0 ANM Yes 38 7.9 36 7.1 74 7.5 No 440 92.1 473 92.9 913 92.5 Doctor Yes 6 1.3 5 1.0 11 1.1 No 472 98.7 504 99.0 976 98.9 Gram Panchayat Yes 16 3.3 9 1.8 25 2.5 No 462 96.7 500 98.2 962 97.5 NGOs/SHGs Yes - - - - - - No 478 100.0 509 100.0 987 100.0 Others Yes 92 19.2 65 12.8 157 15.9 No 386 80.8 444 87.2 830 84.1 Any one in the household is JSY beneficiary Yes 42 8.8 37 7.3 79 8.0 No 436 91.2 472 92.7 908 92.0 Total number of respondents 478 509 987

118
Janani Suraksha Yojana (JSY) aims at modifying the existing National Maternity
Benefit Scheme (NMBS). The vision of the programme is to reduce over all maternal
mortality ratio and infant mortality rate, and increase institutional deliveries in BPL
families. JSY integrates the cash assistance with antenatal care during the pregnancy
period, institutional care during delivery and immediate post-partum period in a health
centre by establishing a system of coordinated care by field level health worker. All
pregnant women belonging to the below poverty line (BPL) households and of the age
of 19 years or above up to two live births are the target group.
Knowledge about the JSY scheme and the number of beneficiaries of the scheme are
dealt with in the section (Table H5). About 82 percent of the respondents are aware of
the JSY scheme. This awareness is slightly better among households located in villages
outside the Sub Centre Head Quarter Wards (84.8 percent as against 79.7 percent in Sub
Centre Head Quarter Wards). One important source of information is the
radio/television (70 percent) followed by Anganwadi workers (15 percent), hoardings at
SC/PHC (14 percent), other sources (16 percent) that include friends and relatives.
Only a small proportion got to hear about JSY from a doctor, ANM, gram panchayat
and pamphlets. With regard to the number of beneficiaries, only 8 percent of the
households have a beneficiary of JSY scheme in the district.
6.4 JSY Beneficiaries
The background socio-economic and demographic characteristics of JSY beneficiaries
are presented in Table H6. About 44 percent of the beneficiaries are aged 20-24 years
and 40.5 percent in the 25-29 year age group. Just over one in ten are aged 30-39 years.
As regards parity, two-thirds of the beneficiaries are in their second parity and the rest
are of third parity or more. About three-fourths of the beneficiaries belong to Other
Backward Communities and 16.5 percent are Scheduled Castes.
Majority of the respondents are Hindus (91 percent) and the rest are Muslims (9
percent). Classifying the beneficiaries by their standard of living, it can be observed

119
that one in two beneficiaries belong to medium standard of living category, 34.2 percent
are from high standard of living category and the rest 15.2 percent are in the low
standard of living group.
Table H6. Percent distribution of JSY beneficiaries by their background characteristics
Number Percent Total number of JSY beneficiaries 79 Age < 20 years 2 2.5 20-24 years 35 44.3 25-29 years 32 40.5 30-34 years 9 11.4 35-39 years 1 1.3 40-44 years - - 45-49 years - - Parity 0 - - 1 - - 2 48 60.8 3 & 3+ 31 39.2 Social category SC 13 16.5 ST 5 6.3 OBC 58 73.4 Others 3 3.8 Religion of the household Hindu 72 91.1 Muslim 7 8.9 Christian - - Sikhs - - Other - - SLI of the household Low 12 15.2 Medium 40 50.6 High 27 34.2 BPL household Yes 71 89.9 No 8 10.1 Place of last delivery Household 0 0 Health Institution 76* 100.0
* 3 missing cases Among all the beneficiaries 90 percent of the households from which they come from
have BPL status. JSY beneficiaries were asked about the place of last delivery to which
cent percent of the respondents reported that their last delivery was in a health
institution.

120
6.4.1 Registration of JSY beneficiaries This section provides details of the registration of respondents in the JSY Scheme. The
timing and place of registration of beneficiaries and the person who registered the
beneficiary into the JSY scheme are given in Table H7.
Table H7. Timing, person place of registration for JSY scheme
Timing, place of registration for JSY card Number Percent Timing of hearing about JSY scheme Before being pregnant 13 16.9 During pregnancy 64 83.1 Whether know about the stage of pregnancy when beneficiary registered under JSY scheme Yes 44 57.1 No 33 42.9 Stage of pregnancy when beneficiary got registered for JSY scheme 1st month 1 2.2 2nd month 2 4.3 3rd month 12 26.1 4th month 5 10.9 5th month or later 26 56.5 Person who registered the beneficiary for JSY scheme Doctor 1 1.3 LHV 7 8.9 ANM/FHW 37 46.8 Anganwadi worker 23 29.1 ASHA worker 6 7.6 Others 5 6.3 Place where the beneficiary was registered for JSY scheme District/Sub-District Hospital 8 10.1 Community Health Centre 1 1.3 PHC 46 58.2 Sub-Centre 12 15.2 Anganwadi Centre 10 12.7 Pvt. Hosp. accredited by the Govt. - - At home - - Other places 2.5 Other 2 Total number of JSY beneficiaries 79
About 83 percent of the beneficiaries had heard about the JSY scheme during
pregnancy and the rest before their pregnancy. The stage of pregnancy when a person
should be registered in the scheme was known to 57 percent of the beneficiaries.
Among JSY the beneficiaries, 56.5 percent got registered during or after their fifth

121
month of pregnancy, 26 percent during the third month and 11 percent during the fourth
month. ANM/ FHW was the person who registered the most of the beneficiaries to the
JSY scheme (46.8 percent), anganwadi workers did the job of registering in 29 percent
of the cases, and the role of ASHA in this regard is only 7.6 percent. The place of
registration was the PHC in 58.2 percent of the cases, Sub Centre in 15.2 percent of the
registrations, Anganwadi centre in 12.7 percent and at the District / Sub District hospital
in 10 percent.
6.4.2 JSY Card Once a person is registered in the JSY scheme, she is given a JSY card that can be used
to avail services at the health facility. The proportion of beneficiaries who received the
JSY card, the role of ASHA in getting the card to the beneficiary and difficulties faced
by the beneficiary in getting the card are dealt with in this section (Table H8).
Table H8. Receipt of JSY card, role of ASHA in getting JSY card and difficulties
faced by the beneficiary in getting the JSY card JSY Card Number Percent JSY card received by the beneficiary Yes 43 55.8 No 34 44.2 Total number of JSY beneficiaries 77 ASHA worker helped the beneficiary in getting JSY card Yes 10 22.2 No 35 77.8 Not applicable - - Beneficiary faced difficulty in procuring JSY card Yes 2 4.8 No 40 95.2 Problem faced in procuring JSY card: Cards were not available Yes - - No 5 100.0 Formalities in making card were too cumbersome Yes - - No 5 100.0 Asked to pay money for card Yes - - No 5 100.0 Other Yes 2 40.0 No 3 60.0

122
Among the registered beneficiaries, 55.8 percent received the JSY card. The role of
ASHA worker in helping the beneficiary receive the JSY card is visible in 22.2 percent
of the registrations. Only 4.8 percent of the beneficiaries reported of facing difficulty in
getting the card and the difficulty is mentioned as „other‟ reasons.
6.5 Role of ASHA
The role of ASHA during pregnancy of the beneficiaries, specific help provided to the
beneficiaries is assessed and presented in Table H9.
Only 16.5 percent of the beneficiaries reported that ASHA worker provided any specific
help to the beneficiary during the last pregnancy. Out of these, the proportion of
beneficiaries who said that they received advice from ASHA on diet is 19 percent, 12.7
percent received advice on danger signs of pregnancy, 16.5 percent on delivery care, 9
percent on breast feeding, 10 percent on new born care and another 9 percent on family
planning.
Among the various duties of ASHA, informing the beneficiaries of the time and place
of ante-natal check ups and delivery is important. Here 92.4 percent of the beneficiaries
reported that ASHA informed them of date of next checkup, 74.7 percent were
informed of place of next check-up, about 85 percent were informed of expected date of
delivery. Over one-third of the beneficiaries received information on place of delivery
from ASHA but the place of referral in case of complications were told to only less than
2 percent of the beneficiaries.

123
Table H 9. Role of ASHA during the pregnancy of the beneficiaries
Number Percent ASHA worker provided any specific help to beneficiary in last pregnancy Yes 13 16.5 No 66 83.5 Not Applicable - - Beneficiary received advice from ASHA- Diet
Yes 15 19.0 No 64 81.0 Danger signs Yes 10 12.7 No 69 87.3 Delivery Care Yes 13 16.5 No 66 83.5 Breastfeeding Yes 7 8.9 No 72 91.1 Newborn care Yes 8 10.1 No 71 89.9 Family Planning Yes 7 8.9 No 72 91.1 Not applicable (ASHA not appointed in the village) Yes - - No 79 100.0 Information given to the beneficiary – Date of next check-up Yes 73 92.4 No 6 7.6 Place of next check-up Yes 59 74.7 No 20 25.3 Date of expected delivery Yes 67 84.8 No 12 15.2 Place of delivery Yes 27 34.2 No 52 65.8 Place of referral, if complications arise Yes 1 1.3 No 78 98.7 Total number of JSY beneficiaries 79

124
The place of delivery of the JSY beneficiaries, and the reason for choosing a particular
place for delivery as reported by the beneficiary is given in Table H10.
The place of delivery of almost 95 percent of the beneficiaries was District/Sub District
hospital. The other places of delivery reported are CHC (2.5 percent) and private
hospital (2.5 Percent).
Table H 10. Place of delivery and reason for opting institutional delivery
Place of delivery and reason for opting institutional delivery Number Percent Place of delivery District/Sub-District Hospital 75 94.9 Community Health Centre 2 2.5 PHC - - Sub-Centre - - Trust/NGO Hospital - - Private Hospital 2 2.5 Pvt. Hosp. accredited by the Govt. - - At home - - Total number of JSY beneficiaries 79 Reasons for opting Institutional Delivery- Money available under JSY scheme Yes 4 5.1 No 75 94.9 Better access to institutional delivery Yes 56 70.9 No 23 29.1 Better care for mother and new born child Yes 52 65.8 No 27 34.2 Services in the area Yes 16 20.3 No 63 79.7 Support provided by ASHA Yes - - No 79 100.0 Availability of transport assistance Yes 10 12.7 No 69 87.3 Previous child was born in an institution Yes 3 3.8 No 76 96.2 Others Yes - - No 79 100.0 Total number of JSY beneficiaries 79

125
An inquiry into the reason for choosing institutional delivery reveal that 71 percent of
the respondents opted institutional delivery because of the better access to it, 65.8
percent valued the better care for mother and new born child, 20.3 percent considered
the services in the area, 12.7 percent said that transportation facility was available and
about 4 percent opted institutional delivery because they had their last delivery in a
health institution.
Table H11 provides details on the issue of referral slip, difficulties faced by
beneficiaries with regard to availability of transport facilities, distance of the health
facility chosen from the place of stay, mode of transport used by the beneficiary to
reach the ultimate place of delivery, persons who facilitated in arranging the transport,
details regarding payment for transport and the person who accompanied beneficiary to
the health institution.
Once the beneficiary is registered in the JSY scheme, the ASHA worker has to provide
her a referral slip to enable them to access services at the place of delivery. In the
district, only 28.2 percent of the beneficiaries said that they received referral slip from
ASHA. Difficulty in reaching the health institution is reported by 6.3 percent of the
beneficiaries and the difficulties mentioned was that it was late at night (40 percent).
The average distance to the ultimate place of delivery from the beneficiary residence
was 32 kms. With regard to the mode of transport, 89 percent used private vehicle (own
or hired) and the rest by other means. When asked about the person who facilitated in
arranging the transport, all the beneficiaries mentioned that it was „others‟ which
include friends, relatives and family members. Also it was the relatives who
accompanied them to the place of delivery in cent percent of the cases. About 94
percent of the beneficiaries said that they had money to pay for the transport service.
The average amount spent on transportation was Rs. 164.30. The average amount
received under the JSY scheme was Rs. 522.80.

126
Table H 11. Transport of the beneficiaries to reach the Health Institution Process of Transport Number Percent Received referral slip from ASHA/health personnel to access delivery services Yes 22 28.2 No 56 71.8 Faced difficulty in reaching Health Institution Yes 5 6.3 No 74 93.7 Faced difficulty in reaching Health Institution: It was late in the night Yes 2 40.0 No 3 60.0 Did not have sufficient money Yes - - No 5 100.0 Transport was not immediately available - Yes 5 100.0 No Male members in the household were not present Yes - - No 5 100.0 ASHA was not readily available Yes - - No 5 100.0 Others Yes - - No 5 100.0 Average distance to the ultimate place of delivery from the beneficiary residence Average 32.0 Mode of transport used by the beneficiary to reach the ultimate place of delivery Government Ambulance - - Private Vehicle 70 88.6 Vehicle arranged by Local Health Committee - - Others 9 11.4 Persons who facilitated in arranging the transport ASHA - - ANM - - Village Health Committee - - Others 79 100.0 Beneficiary had money to pay for the transport services Yes 74 93.7 No 5 6.3 Average amount spent on transport (in Rs.) Average 164.3 Average amount of transport assistance received under JSY scheme Average 522.8 Person who accompanied beneficiary to the health institution ASHA - - Relatives 79 100.0 Others - - Total number of JSY beneficiaries 79

127
The type of facilities available at the health facility is an important factor in client
satisfaction. One vital aspect that the beneficiaries expect is the quick access to services
especially in case of delivery. Table H12 draws inference on this aspect and the cost
incurred for delivery and also the satisfaction of beneficiaries with the available
services.
The average waiting time until some health staff attended the beneficiary is 23 minutes.
Of all the JSY beneficiaries, 78.5 percent had normal delivery and the rest 21.5 percent
were caesarean deliveries. On an average they spent 7.2 days in the health institution
till discharge. About 21.5 percent had to pay at the health centre for the delivery, the
average amount being Rs. 2119.
Table H 12. Waiting time at the health facility, type of delivery, amount spent at the health facility and satisfaction regarding services available
Number Percent Average waiting time at the facility until someone attended the beneficiary (in minutes)
Average 62 22.7 Type of delivery beneficiary - Normal 17 78.5 Assisted (Forceps, Vacuum) - Caesarean 21.5 Average number of days spent in the facility till discharge
Average 7.2 Percent beneficiary who have to pay at the health centre
Yes 17 21.5 No 62 78.5 Average amount paid at the health centre (Rs.) Average 2,118.9 Satisfied with the services at health centre Satisfied 48 60.8 Somewhat satisfied 28 35.4 Not satisfied 3 3.8 Reason for dissatisfaction Staff was rude 1 33.3 Facility was not clean - - Poor quality of services 2 66.7 Others - -

128
When the beneficiaries were asked about their attitude towards the services available at
the health centre, almost 61 percent said they were satisfied and 35 percent somewhat
satisfied with the services provided to them. The reason for non-satisfaction among 4
percent of the beneficiaries was rudeness of the staff during their visit to the health
institution.
Table H13. Reason for the JSY beneficiary to opt home delivery, in spite of cash incentives being available under the JSY
Number Percent Reasons for home delivery: Home delivery is more convenient
Yes - - No - - Fear of stitches/caesarean Yes - - No - - Indifferent behaviour of medical/paramedical staff
Yes - - No - - Cultural/social reasons Yes - - No - - Transport not being available Yes - - No - - Can't afford Yes - - No - - Others Yes - - No - - Total number of JSY beneficiaries under Home Delivery
-
No home deliveries were reported among the JSY beneficiaries. Details about the cash incentive received by the beneficiary under the JSY scheme are
given in Table H14. All the beneficiaries reported that they received the cash incentive.
The average amount they received was Rs. 823.00 and they received the money as one
time payment. The timing of receipt of the cash incentive is found to be varying. Over
half of the beneficiaries received the amount at a time much after delivery, one-third

129
received the money within a week of delivery and about 6 percent mentioned of
receiving it immediately after delivery.
Table H.14 Cash incentive received by the beneficiary under JSY scheme Number Percent Beneficiary received cash incentive under JSY scheme Yes 79 100.0 No - - Total number of JSY beneficiaries 79 Average amount received by beneficiary as cash incentive Average 823.4 Received the cash incentive In one go 79 100.0 In 2-3 installments - - Timing of the receipt of the cash incentive by beneficiary At the time of registration - - At the time of antenatal check up - - Much before delivery 1 1.3 Within a week before the EDD 1 1.3 Immediately after the delivery 5 6.3 Within a week of delivery 25 31.6 Much later 42 53.2 Not received yet - - Other 1 1.3 Do not know/ Husband knows 4 5.1 Person who delivered the cash incentive to the beneficiary Doctor 7 9.5 LHV 3 4.1 ANM/FHW 24 32.4 Anganwadi worker 4 5.4 ASHA worker 1 1.4 Other 35 47.3 Place where the cash incentive received by the beneficiary District/Sub-District Hospital 29 36.7 Community Health Centre 2 2.5 PHC 23 29.1 Sub-Centre 3 3.8 Anganwadi Centre 4 5.1 Pvt. Hosp. accredited by the Govt. - - At home - - Other 18 22.8 Faced any difficulty in getting money Yes 7 9.0 No 71 91.0 Type of difficulty faced by the beneficiary Was asked to pay the bribe - - Was paid by cheque/draft 1 14.3 Others 6 85.7

130
The ANM/FHW was the person through whom one-third of the beneficiaries received
the money. In 10 percent of the cases, the doctor paid the money, 5 percent of the
beneficiaries received it from the AWC, 1.4 percent from ASHA worker and in 47.3
percent of the cases it was “others” mainly specified as office staff. The beneficiaries
received the amount mostly at the health institution. Depending on the place of
delivery, it is seen that 37 percent of the beneficiaries received the cash incentive at the
District/Sub-district hospital, another 29 percent got the money at the PHC, 5 percent at
the AWC, 4 percent at the Sub Centre and 2.5 percent of the beneficiaries received it at
the CHC. The reason for difficulty in receiving the money among 9 percent of the
beneficiaries is reported as the difficulty due to receiving the amount as cheque or draft
(14 percent) and „other reasons‟ (85.7 percent) specified as difficulty in filling form and
paper work, getting panchayat letter and technical difficulties.
6.6 Utilization of government health facility
Kerala has the highest density of public and private medical facilities among major
states in India (Government of India, 2003). The health delivery system is decentralized
and most public sector medical institutions are located in rural areas (Narayana and Hari
Kurup, 2000). However, the level of utilization of the health services heavily depends
on the availability of services especially in the rural areas. The NRHM initiative to
upgrade the facilities at the CHCs, PHCs, and the SCs is expected to make a drastic
difference in the utilization rate. The utilization of Government health facilities during
the last six months prior to the survey period, background characteristics of respondent
who availed service and the type of health facility visited, assessed in the present survey
is dealt with in this section.
Table H 15. Utilization of government health facility in last 6 months
Percent of household who availed health services in government health facility in last 6 months
Households located in Sub Centre HQ Village
Households located in other village
All
Number Percent Number Percent Number Percent Yes 349 58.2 348 58.0 697 58.1 No 251 41.8 252 42.0 503 41.9 Total no. of households 600 600 1,200

131
The level of utilization of Government health Facility in the last 6 months as furnished
in Table H15 shows that 58 percent of the households have availed services at the
Government health facility. This proportion is almost same among households located
in the Sub Centre Head Quarter wards and other wards in the district.
Table H. 16 Characteristics of the respondents who have availed the services in government health facility in last 6 months
Number Percent Age <16 years 2 0.3 16-19 years 14 2.1 20-29 years 163 24.0 30-39 years 171 25.2 40-49 years 134 19.7 50-59 years 84 12.4 60 years or more 111 16.3 Sex Male 125 18.4 Female 554 81.6 Years of schooling completed Illiterate 60 8.8 1-5 years 131 19.3 6-9 years 207 30.5 10+ years 280 41.3 Marital status Unmarried 30 4.4 Currently married 586 86.3 Divorced/Separated 3 0.4 Widowed 60 8.8 Social category of the household SC 35 5.1 ST 10 1.5 OBC 569 82.7 Others 74 10.8 Religion of the household Hindu 492 70.6 Muslim 188 27.0 Christian 17 2.4 Sikhs - - Other - - BPL Household Yes 344 49.4 No 353 50.6 Standard of Living Index Low 72 10.3 Medium 305 43.8 High 320 45.9

132
The background socio-economic and demographic characteristics of the respondents
who availed services at the Government health facility during the last six months prior
to the survey is given in Table H16. Almost a quarter of the respondents who availed
services at the Government health facility are those in the prime reproductive ages and
another one-quarter are aged 30-39 years. Health problems among the aged population
are visible here for 16 percent of the respondents seeking treatment in Government
health facility are aged 60+ years. Females dominate in the number seeking treatment
81.6 percent).
About 41.3 percent of the respondents are educated with 10+ years of schooling and
another 30.5 percent have 6-9 years of schooling. Majority of the treatment seekers in
Government health facility are currently married (86.3 percent)and about 9 percent are
widowed. With regard to the social category of the respondents availing services of the
Government health facility, over four-fifths are from Other Backward Communities and
a small proportion of Scheduled Caste and Tribes. Nearly 71 percent are Hindus, 27
percent are Muslims and 24 percent of the respondents who availed the services are
Christians. Almost half the households are BPL households. With regard to the
standard of living of the respondents who availed service from Government health
facility 43.8 percent and 45.9 percent are from medium and high standard of living
category respectively.
6.7 Client Satisfaction
Assessing client satisfaction is a vital aspect of health facility management. Client
satisfaction is often based on the availability of good facilities, good behaviour of staff,
regular availability of medicines etc especially at the Government health facility where
services are accessed more by the rural folks. The more the efficacy of medical
treatment, the more the patient‟s satisfaction. Client-centered care requires providers to
respect a clients‟ point of view, encourage clients to discuss their needs, provide the
appropriate medical information to the client and assist them in making decisions rather

133
than telling them what to do. (Kim et. al., 2000). Table H17 draws inference on these
aspects.
The type of health facility where the respondents went for availing some service is
mainly the District/Sub-district hospital (32.4 percent) and the PHC (37 percent). It is
mostly for treatment of minor ailments (among 67 percent) that they went to the
Government health facility. Next important reason is child care (13.4 percent) and other
reasons (11.6 percent).
Availability of good facilities and decent behaviour of staff at the Government health
facilities are important requirements to prompt people to utilize the services at the
health facility. Over half of the respondents said that the behaviour of health staff was
courteous, but 47 percent of the treatment seekers felt that the behaviour of staff as
casual/indifferent. Three-fourths of those interviewed said that the doctor listened to
their complaints.
Privacy at the place of treatment, availability of medicines are important aspects that the
health institution must account for. About 71 percent of the women patients do agree
that there is privacy at the place of treatment but only 41 percent said that medicines are
available for chronic ailments. About 43 percent opine that doctors take up private
practice during duty hours, 10 percent deny such a practice and the rest 46.8 percent are
ignorant of this aspect.
The overall satisfaction at the services available at the health facility as provided in
Table H17 shows that 56.6 percent are satisfied and 41 percent are somewhat satisfied.
About 53 percent are satisfied with the behaviour of the staff at the Government health
facility and almost 45 percent somewhat satisfied.

134
Table H.17 Type of health facility visited, purpose visit and client satisfaction regarding behaviour of health worker, privacy and availability medicines
Number Percent Type of health facility where service availed District/ Sub district hospital 220 32.4 CHC 134 19.7 PHC 251 37.0 Sub Centre 13 1.9 AYUSH 61 9.0 Purpose of visit to health facility Treatment of minor ailment 455 67.0 ANC care 34 5.0 Child care 91 13.4 Immunization 20 2.9 Other 79 11.6 Behaviour of staff at health facility Courteous 52.6 Causal/Indifferent 47.1 Insulting/Derogatory 0.3 Courteous 357 Causal/Indifferent 320 Insulting/Derogatory 2 Listening of complaints by Doctor/staff Listened to complaints 517 76.1 Somewhat listened 156 23.0 Not listened 4 0.6 Cannot say 2 0.3 Women patient were treated in privacy Yes 477 71.1 No 154 23.0 Do not know 40 6.0 Patients with chronic disease get regular medicines from health facility Yes 279 41.3 No 68 10.1 Do not know 328 48.6 Private practice of the doctors during and after the duty hours Yes 288 42.7 No 71 10.5 Do not know 316 46.8 Satisfied with overall services and staff of Govt Health Facility Satisfied 380 56.6 Somewhat satisfied 276 41.1 Not satisfied 15 2.2 Satisfied with the behaviour of staff at Govt. Health Facility Satisfied 358 53.1 Somewhat satisfied 302 44.8 Not satisfied 14 2.1
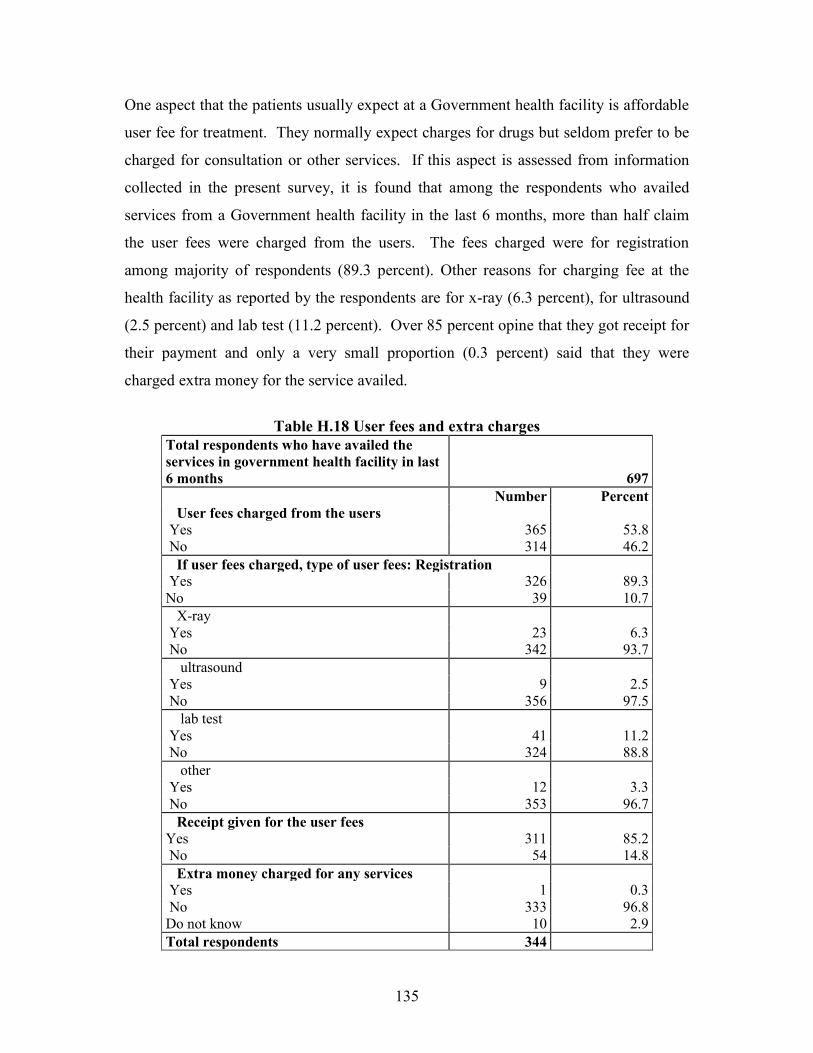
135
One aspect that the patients usually expect at a Government health facility is affordable
user fee for treatment. They normally expect charges for drugs but seldom prefer to be
charged for consultation or other services. If this aspect is assessed from information
collected in the present survey, it is found that among the respondents who availed
services from a Government health facility in the last 6 months, more than half claim
the user fees were charged from the users. The fees charged were for registration
among majority of respondents (89.3 percent). Other reasons for charging fee at the
health facility as reported by the respondents are for x-ray (6.3 percent), for ultrasound
(2.5 percent) and lab test (11.2 percent). Over 85 percent opine that they got receipt for
their payment and only a very small proportion (0.3 percent) said that they were
charged extra money for the service availed.
Table H.18 User fees and extra charges
Total respondents who have availed the services in government health facility in last 6 months
697 Number Percent User fees charged from the users Yes 365 53.8 No 314 46.2 If user fees charged, type of user fees: Registration Yes 326 89.3 No 39 10.7 X-ray Yes 23 6.3 No 342 93.7 ultrasound Yes 9 2.5 No 356 97.5 lab test Yes 41 11.2 No 324 88.8 other Yes 12 3.3 No 353 96.7 Receipt given for the user fees Yes 311 85.2 No 54 14.8 Extra money charged for any services Yes 1 0.3 No 333 96.8 Do not know 10 2.9 Total respondents 344

136
Most of the programmes under the NRHM are targeted at the improvement of the
people below poverty line. Government hospitals are sensitive towards providing
medical facilities to the poor population. BPL families are issued BPL cards for
accessing services available to them. All the BPL families with such cards are entitled
to avail free medical and health services in government facility. Table H19 draws
inference on the services for the BPL patients. BPL patients who were provided
free/subsidized services account for 66.5 percent of the BPL respondents. Only 5
percent said that they faced problems in paper work for free/subsidized services.
Table H19. Services for the BPL patients Number Percent BPL patients provided free / subsidized services
Yes 119 66.5 No 35 19.6 Do not know 25 14.0 BPL patients faced any problem in paper work for free/subsidized services
Yes 9 5.0 No 128 71.5 Do not know 42 23.5 RKS facilitated the paperwork for BPL patients
Yes 17 9.5 No 68 38.0 Do not know 94 52.5 Total BPL respondents 179
These questions are addressed only to BPL patients
The Rogi Kalyan Samiti (RKS), introduced in NRHM is a form of communitisation
/public participation adopted as part of a strategy to improve the quality of management
and therefore facility outcomes and as a form of providing flexible funds for facility
improvement. RKS is seen to have facilitated the paperwork in only 9.5 percent of the
BPL respondents while 38 percent deny this aspect and over half of the BPL
respondents are ignorant of who did the paper work for them.

137
6.8 Morbidity status
The morbidity status of a community reflects the general health status of the area. To
get a picture of the morbidity status of the community in the event of out break of
communicable diseases, some information was collected on the outbreak of selected
diseases in the respondent‟s area in the last six months prior to survey.
Table H 20. Outbreak of selected diseases in the respondents' area During the last six months
Number Percent Malaria in last six months in the area Yes 17 1.4 No 1,129 94.5 Do not know 49 4.1 Measles in last six months in the area Yes 68 5.7 No 1,096 91.6 Do not know 32 2.7 Gastroenteritis in last six months in the area
Yes 51 4.3 No 1,128 94.0 Do not know 21 1.8 Jaundice in last six months in the area Yes 117 9.8 No 1,082 90.2 Do not know 1 0.1 Other disease in last six months in the area Yes 365 30.5 No 764 63.8 Do not know 68 5.7 Total number of household respondents 1,197
Outbreak of malaria in the area was reported by only 1.4 percent of the respondents.
About 5.7 percent of the respondents report outbreak of measles in the last six months.
Gastroenteritis was reported by 4.3 percent of the respondents and jaundice was
reported to be prevalent by 9.8 percent of the respondents. About 31 percent of the
respondents report other diseases.

138
Table H 21. Action to be taken for selected diseases Number Percent
Prevention of diarrhoea: Hand washing
538
44.8
Use of safe food and water 1,053 87.8 Use of covered container 639 53.3 Proper disposal of garbage 282 23.5 other 314 26.2 Don't know 90 7.5 Action for high fever: Blood test for malaria
113
9.4
Taken to RMP 685 57.1 Taken to nearest government health facility 900 75.0 Consult ASHA 3 0.3 Try home remedies 266 22.2 Other 42 3.5 Don't know 3 0.3 Action for persistent cough: Taken for sputum testing
262
21.8
Taken to RMP 647 53.9 Taken to nearest government health facility 876 73.0 Consult ASHA 1 0.1 Try home remedies 313 26.1 Other 57 4.8 Don't know 3 0.3 Action for loose-motions:
Stop giving oral fluids/food etc
57
4.8 Start giving ORS 578 48.2 Taken to RMP 574 47.8 Taken to nearest govt health facility 838 69.8 Consult ASHA 1 0.1 Try home remedies 826 68.8 Other 62 5.2 Don't know 5 0.4
Action for persistent cough and breathing problem:
Try home remedies
183
15.3 Taken to RMP 664 55.3 Taken to nearest govt health facility 827 68.9 Consult ASHA - - Other 34 2.8 Don't know 10 0.8
Total number of household respondents 1,200

139
Some of the common diseases prevalent in the community especially among children
are diarrhoea, fever, persistent cough and breathing problems. Inorder to assess the
knowledge about prevention of such diseases and the treatment seeking habit among the
people, respondents were asked about the preventive measures they usually adopt and
the nature of treatment they seek in case of incidence of a particular disease. Table H21
shows details on these aspects. The preventive measures that they adopt for diarrhoea
are hand washing as reported by over two-fifths of the respondents, about 88 percent of
the respondents opine that they use safe food and water, 53.3 percent cover the food
containers, 23.5 percent practice proper disposal of garbage, 26.2 percent other methods
like maintaining environmental and personal hygiene, avoiding close contact with the
infected person, avoiding over eating etc, and about 8 percent are ignorant about
preventive methods.
Respondents were asked what they would do if a member of the household had fever
lasting for over a week. Three fourths of the respondents said that they would take the
patient to the nearest government health facility, 57 percent said they would take the
patient to a Registered Medical Practitioner (RMP), 22.2 percent relied on trying home
remedies to bring down the fever, and 9.4 percent would do a blood test for malaria. In
case of persistent cough for 2 weeks, about three- fourths of the respondents claim that
they would take the sick person to the nearest hospital, about 54 percent would take the
help of an RMP, 22 percent would do sputum testing and 26 percent they would try
home remedies.
Actions taken in case of loose-motion to a household member for over 24 hours were
also assessed. Almost 70 percent said they would take the patient to the nearest
government health facility, an almost equal number are of the view that they would rely
on trying home remedies, 48 percent opine that they would take the patient to an RMP,
same proportion of respondents said they would start giving ORS solution. A very small
proportion of respondents replied that they would stop giving oral fluids/food or adopt
other means.

140
In case a person in the household had persistent cough for over a week and have
breathing problems, the most common action (70 percent of the respondent) taken
would be taking the patient to the nearest health facility. More than half the patients
said they would go to an RMP and only 15 percent would rely on home remedies for
cure.
6.9 Family Planning The survey also collected information on awareness about Family Planning methods
and the respondents view of the ideal gap between their children especially first and
second child. Table H22 draws inference on these aspects.
Table H 22. Awareness about spacing methods and ideal gap between
1st and 2nd child Number Percent Aware of family planning methods Yes 1,044 87.0 No 156 13.0 Total number of household respondents 1,200 Ideal gap between first and second child 1 year 4 0.4 2 year 129 12.4 3 and more year 911 87.3 Spacing method: IUD Yes 642 61.5 No 402 38.5 Oral Pills Yes 511 48.9 No 533 51.1 Nirodh/Condom Yes 625 59.9 No 419 40.1 Any other Yes 57 5.5 No 987 94.5 Don't know Yes 145 13.9 No 899 86.1 Total number of household respondents 1,044
It is seen that 87 percent of the respondents are aware of different family planning
methods. Majority of those interviewed feel that the ideal gap between the first and
second child is 3 or more years (87.3 percent), 12.4 percent feel that a gap of 2 years

141
would be ideal. To maintain the desired gap between children, the spacing methods
known to the respondents are IUD (61.5 percent), Oral pills (48.9 percent),
Nirodh/Condom (59.9 percent) and other methods (5.5 percent) that are mostly
specified as safe period. About 14 percent of the respondents are ignorant about the
spacing methods.
6.10 Awareness about HIV (AIDS)
HIV (AIDS) is continuing to be a serious epidemic in the country. Though Kerala is a
low risk state, it is a matter of concern to the state given its nearness to the high
prevalent state of Tamil Nadu. Knowledge about AIDS itself lowers the risk of getting
the disease. Awareness about modes of getting AIDS, source of information about
AIDS and awareness about VCTC are given in Table H23.
A large proportion of respondents (96 percent) have heard about HIV (AIDS). When
88.4 percent of the respondents know that AIDS is transmitted through sexual contact,
nearly 67 percent are of the view that sharing needles and syringes can transmit AIDS.
Only 9 percent know that it is transmitted from mother to child.
Misconceptions on the modes of transmission still prevail in the community in small
proportions. Less than 2 percent of the respondents still are of the view that AIDS
transmits from one person to another through insect bite and sneezing, kissing and
shaking hands.
Source of information on HIV/AIDS among nearly three-fourths of the respondents is
the television, 54 percent heard about AIDS from radio, news papers form an important
source among 52.2 percent. Health workers were the source of information of AIDS
among 23 percent and posters among 15 percent of the respondents. Other source of
information like friends, relatives, neighbours and schools and colleges accounted for
almost 24 percent.

142
Table H23. Awareness about modes of getting AIDS, source of information about AIDS and awareness about VCTC
Number Percent Heard about HIV/AIDS Yes 1,151 95.9 No 49 4.1 Total number of household respondents 1,200
Mode of HIV/AIDS: Sexual contact 1,018 88.4 Blood transfusion 769 66.8 Sharing needles/syringes 695 60.4 From mother to child 219 19.0 Shaking hands 2 0.2 Sneezing 11 1.0 Insect bite 17 1.5 Kissing 10 0.9 Other 33 2.9 Source of information on HIV/AIDS: Radio 620 53.9 TV 825 71.7 Health workers 265 23.0 Posters 169 14.7 News papers 601 52.2 Other 273 23.7 Aware of HIV/AIDS counseling centre/VCTC nearby 188 16.4 Location of counseling centre
PHC 2 1.1 CHC 5 2.7 District Hospital 85 45.7 Sub District Hospital 16 8.6 Private Hospital 1 0.5 Other 77 41.4 Total number of household respondents 186
One way to control transmission of AIDS is by knowing if a person is positive to the
diseases. Government centres where free blood testing procedures are done are the
HIV/AIDS counseling centres / VCTC. Only 16.4 percent of the respondents have
heard of such centres. Among those who are aware of these centres, 45.7 percent of the
respondents said that these centres are located in district hospital, 8.6 percent said it is
located in the sub district hospital.

143
Chapter 7
Status and Performance of ASHA
One of the key components of the NRHM is to provide every village with in the country
with a trained female community health activist-„ASHA‟, selected from the village
itself and accountable to it. She is entitled to serve a population of 1000 people. ASHA
must be selected from the village itself and she should preferably in the age group of 25
to 45 yrs. The selection of ASHAs is done by the District Health Society envisaged
under NRHM.
This chapter provides information on the status, role and performance of ASHA
difficulties faced and the kind of support required by ASHAs
7.1 Status of ASHA. Table A1 shows the status of ASHAs and the mode of selection.
Table A1 Status of ASHA
Status of ASHA Value
A. Number of ASHA interviewed in the district 29
B. Average population served by ASHAs interviewed 1,000.0
C. Average number of village/habitations served by ASHAs covered 1.0
D. Percentage of ASHAs by method of selection
Selected on recommendation of ANM 58.6 Selected on recommendation of Gram Pradhan 48.3 Selected on recommendation of Anganwadi worker 20.7 Selected on recommendation of Village Health Committee 10.3 Previously worked as Dai 3.4 Other 62.1 E. Percentage of ASHA undergone training 100.0
F. Percentage of ASHAs undergone training by modules
Module 1 79.3
Module 2 51.7
Module 3 -
Module 4 -
G. Percentage of ASHAs issued ASHA kit -

144
In Kozhikode district a total of 29 ASHAs were interviewed in the survey. Average
population served by an ASHA is 1000. The selection of ASHAs in the district is based
on the recommendation by the ANM in 59 percent of the selected ASHAs, Gram
pradhan recommended 48.3 percent, the anganwadi workers and the village health
committee recommended 20.7 percent and 10.3 percent respectively. The selection
based on the previous experience as Dai were 3.4 percentage. „Other‟ people who made
recommendations in the selection of ASHA account for 62 percent which mainly
includes the Mahila Swasth Sankh (MSS) and Kudumbasree worker.
Capacity building of ASHA is envisaged as a continuous process. ASHA will have to
undergo a series of training episodes to acquire the necessary knowledge, skills and
confidence for performing her spelled out roles. Training programmes for ASHA are
carried out in different modules. In the district, among the 29 ASHAs interviewed,
about 79 percent have completed Module 1 of the training programme, and 52 percent
of ASHAs completed second module. As per the guidelines, every ASHA is to be
provided with a drug kit and she shall dispense the medicine at the local level at the
times of need. However no ASHA‟s interviewed in the survey reported of having
received any ASHA kit.
7.2 Role and Performance of ASHA Among the responsibilities of ASHA, would also deliver Directly Observed Treatment
Short (DOTS) course for tuberculosis and oral dehydration. The survey points out that
in the district, forty eight percentages of the ASHAs under study were DOTS providers
at the time of interview (Table A2). During the last three months prior to the survey,
ASHAs facilitated around 3 cases of Janani Suraksha Yojana (JSY) per month on an
average. Among the duties of the ASHA during the last 3 months, ASHAs who
handled cases of children with diarrhea by giving ORS account for 3.3 percent 1.4
percent accompanied the institutional delivery cases, 1.4 percent distributed oral pills,
only 0.1 percent gave drugs to malaria patients and 5 percent identified new pregnancy
cases.

145
Table A2: Role and Performance of ASHA
Role and Performance of ASHA Percent
A. Percentage of ASHAs who are DOTS provider 48.3
B. Average monthly no. of JSY cases facilitated in last 3 months by ASHA 2.5
C. Average number of cases handled in last 3 months
Children with diarrhea given ORS 3.3
Accompanied institutional delivery cases 1.4
Number of Oral Pills distributed 1.4
Number of Malaria Patients given drugs 0.1
Number of new pregnancies identified 5.0
Number of group meetings like Mahila Mandals arranged 3.0
Number of Health and Nutrition day arranged 1.7
Number of cases 28
D. Average money incentive received by an ASHA on an average per month
JSY 422.2
Sterilization 715.7
VHND 38.5
Other 46.7
Total 496.9
Number of ASHA interviewed in the district 29
ASHA has the responsibility of holding monthly meetings. On an average, 3 group
meetings of Mahila mandals per month were arranged by ASHAs during the last three
months. Also an average of 2 Health and Nutrition days was observed by ASHAs
during the reference period. Financial benefits of ASHAs from the above mentioned
services are also given in the Table A2. On an average, amount received by the ASHAs
for facilitating JSYs is Rs. 422 per month. In connection with sterilization, ASHAs
received a mean sum of Rs. 716 per month. Relating to VHND, an average amount of
Rs.39 per month was received by the ASHAs. They also reported getting an incentive
of Rs.47 per month on an average for other cases.

146
Table A3: Distribution of ASHAs by reported types of difficulties faced
and kind of support required
Reported types of difficulties faced and kind of support required Percent
A. Percentage of ASHAs by types of difficulties faced in implementing programme activities under NRHM Funds not available in time 6.9
Adequate training is not provided 10.3
Delayed supply of drugs 6.9
Behaviour of staff in health facilities is not appropriate -
Inadequate facilities for institutional deliveries -
B. Reported kind of support require to ASHA to enable her to implement the programme more effectively More training is to be arranged for ASHA & Community members 58.6
ASHA should be paid a fixed remuneration 79.3
Payments should be made timely 13.8
Other 20.7
Number of ASHA interviewed in the district 29
The details of difficulties faced by ASHA in implementing the programme activities
under NRHM are given in Table 3. Non availability of funds is reported by 7 percent of
the ASHAs and 10.3 percent report inadequacy of training provided under NRHM.
Around 7 percent of the ASHAs report the delay in drug supply as one of the main
difficulties faced. No one complained about inappropriate behaviour of health staff or
inadequacy of facilities for institutional deliveries in the implementation of the NRHM
programme.
With a view of improving the performance, ASHAs were asked about the kind of
support required to perform their role effectively. About 79 percent of the ASHAs
demanded fixation of remuneration of their salary. More than half of the ASHAs
demanded more training for better implementation of their duties Execution of timely
payment is yet another kind of support demanded by 14 percent of ASHAs. Need of
ASHA kit, uniform, identity card and cooperation of ANM were the other requirements
reported by 20.7 percent of ASHAs.

147
Table A4: Distribution of ASHAs by reported awareness on different aspects
Reported awareness on different aspects Percent
A. Percentage of ASHAs reporting important steps for prevention of diarrhea
Hand washing 58.6
Use of safe water 96.6
Use of covered container 37.9
Proper disposal of garbage 55.2
Other 13.8
Don't know -
B. Percentage of ASHAs reporting ideal time for initiating breastfeeding
Within 1 hour of delivery 93.1
Within 6 hours of delivery 6.9
Within 24 hour of delivery -
After child has given water, honey ghutti etc -
Other -
Don't know -
C. Percentage of ASHAs reporting exclusive breastfeeding months for a child
2 months -
3 months 3.4
6 months 89.7
Number of ASHA interviewed in the district 29
Details of the awareness of ASHAs on prevention practices of Diarrhea collected are
given in Table 4. The general awareness of the ASHA workers on diarrhea prevention
appears to be good. Majority of the ASHAs are aware of the importance of safe
drinking water for Diarrhea prevention (96.6 percent). Importance of washing hands is
reported by about three-fifths of the ASHAs, followed by proper disposal of garbage
(55.2 percent) and use of covered containers (37.9.percent). Other non-specific reasons
were reported by 13.8 percent of the respondents.
The level of awareness regarding the time of initiation for breastfeeding after delivery
was good among the ASHAs interviewed for the study. Around 93 percent report that
breastfeeding should be started within one hour after delivery and others report the ideal

148
time as within 6 hours after delivery. The knowledge on the time required for exclusive
breastfeeding is also good. About 90 percent of the ASHAs reported the need of 6
months exclusive breastfeeding for children.

149
Chapter 8
Role, Awareness and involvement of Gram Panchayats Gram Panchayats play an important role in the implementation of NRHM activities. It
supervises the VHC in the preparation of Village Health Plan and maintenance of
village level data. The Gram Panchayat has an important role in leading the ASHA
initiative in selection of ASHA, providing regular support in undertaking many health
related tasks through its statutory health committee and in the compensation incentive.
To ensure that the health plan is in harmony with the overall local plan, the Gram
Panchayats work with the Village Health Committee.
The four Gram Panchayats in which the selected PHCs are located are Velam,
Narippatta, Kakkodi and Chelannur. Velam and Narippatta Gram panchayats come
under Kunnummel Block in Vadakara Taluk. There are 16 wards each in the Velam and
Narippatta Gram Panchayats. Chelannur and Kakkodi Gram Panchayats come under
the Chelannur Block. There are 16 wards in Kakkodi Gram panchayat and 20
panchayat-wards in Chelannur Gram panchayat. The details of the four panchayats
according to 2001 census are given below.
Table 1: Area and Population of Gram Panchayats Covered
Name of Panchayat
Area
No of households
Population Sex Ratio
Total Male Female
Velam 5063 5471 26018 12680 13338 1052
Narippatta 2580 5053 25122 12180 12942 1063
Kakkodi 1859 7400 36097 17392 18705 1075
Chelannur 2383 7528 35459 17427 18032 1035
Velam and Narippatta have larger area compared to Kakkodi and Chelannur Panchayats
but lesser number of households and lesser population. It is due to the fact that the

150
former panchayats comprise of more hilly regions compared to the latter panchayats.
Sex Ratio of all selected panchayats are favourable to females.
8.1 Status of Gram Panchayats This section provides information regarding the status of Gram Panchayats, level of
awareness and involvement of leaders of Gram panchayat in NRHM activities in the
study area of Kozhikode district.
Table A1: Status of Gram Panchayats Covered
Status of Gram Panchayat Covered Value
A. Number of Gram Panchayats covered in the district 24
B. Average population of the Gram Panchayat covered
Scheduled Caste 3,605.6
Scheduled Tribe 68.2
Total 31,400.7
C. Average number of Households in the Gram Panchayat covered
Scheduled Caste 509.3
Scheduled Tribe 26.8
Total 6,858.1
D. Average number of BPL families in the Gram Panchayat covered
Scheduled Caste 345.3
Scheduled Tribe 18.7
Total 2,951.2
The study covered 24 Gram Panchayats in the district. Average population covered
under the Gram Panchayats is 31,401 out of which average scheduled caste population
is 3,606 and the Scheduled tribe population is only 68 (Table A1). As far as the number
of household is concerned, among the total 6,858 households, the number of Scheduled
caste households is 509 and that of scheduled tribe is 27. A total of 2,951 BPL families
are there in the selected Gram Panchayats, of which the number of scheduled caste
families is 345 and the corresponding number of scheduled tribe families is 19.

151
8.2 Level of awareness and involvement of Gram Panchayats Table A2: Level of awareness and involvement of Gram Panchayats
Level of awareness and involvement of Gram Panchayats Percent
A. Percentage of Gram Panchayat reporting regular availability of ANM 65.2
B. Percentage of Gram Panchayat reporting timely services provided by Sub Centre to the patients
70.8
C. Percentage of Gram Panchayat reporting role of Gram Panchayat in conducting/finalizing IEC programme in Gram Panchayat
95.8
D. Percentage of Gram Panchayat reporting existence of VHSC in their Gram Panchayat
95.8
E. Percentage of Gram Panchayat reporting regular meetings of VHSC 91.3
F. Percentage of Gram Panchayat reporting Village Health Plan been prepared by VHSC
73.9
G. Percentage of Gram Panchayat reporting that VHSC has received any Untied Fund
82.6
H. Percentage of Gram Panchayat reporting ASHA worker in position 100.0
I. Percentage of Gram Panchayat reporting awareness of the benefits under JSY scheme
95.8
J. Percentage of Gram Panchayat reporting that NRHM brought about any improvement in their area
95.8
K. Distribution of Gram Panchayats covered by type of improvement reported due to NRHM
Funds available for maintenance of Sub Centres 87.0
Community support is available as ASHA worker 65.2
Funds/facilities are available under JSY 52.2
Better facilities are available for CHCs/PHCs for referred patients 60.9 Transport facilities are available 17.4
Other 26.1
L. Distribution of Gram Panchayats by type of difficulties faced in implementing programme activities under NRHM
Funds not available in time 20.8
Decision making with community leaders are difficult 12.5
ASHA has not been adequately trained 4.2
Adequate facility for institutional deliveries are not available 4.2
Other 12.5
M. Distribution of Gram Panchayats by kind of support required to implement programme more effectively
More funds are required for maintenance/ effective functioning 87.5
Gram Panchayat should be given direct control over funds 37.5
More training is to be arranged for ASHA and Community members 8.3
Any Other 4.2

152
The level of awareness and involvement of Gram Panchayats in the district is given in
Table A2. Sixty five percent of the total twenty four Gram Panchayats report the
regular availability of Auxiliary Nurse Mid Wife (ANM). The proportion of Gram
Panchayats reporting that timely services are provided by the sub centre to the patients
adds up to 71 percent. Majority of Gram Panchayats have role in conducting or
finalizing IEC programme (96 percent) and 91 percent report the existence of VHSCs.
Ninety one percent of the Gram Panchayats report that there were regular meetings of
VHSC. Almost three- fourths of Gram Panchayats report that the village health plan
was prepared by VHSC and four-fifths of the Gram Panchayats report that VHSC has
received untied fund. ASHA workers are present in all the Gram Panchayats.
Majority of the Gram panchayat leaders are aware of the benefits under JSY scheme
(95.8 percent). As far as the work status of NRHM is concerned, majority of Gram
Panchayats report that the NRHM has brought about improvement in their area (95.8
percent).
As regards the type of improvement, 87 Percent of Gram Panchayats received funds for
the maintenance of Sub Centres and 65.2 percent got community support as ASHA
worker. For 52.2 percent of the GPs the improvement was due to the funds/facilities
available under JSY scheme. In three-fifths of the GPs, better facilities are available for
CHCs/PHCs for referred patients and transport facilities are available among 17.4
percent. Improvements like VHSC formulation, improvement in IEC activities etc. took
place in 26.1 percent of GPs.
Gram Panchayats report of facing many difficulties in implementing programme
activities under NRHM. Among the problems faced, 20.8 percent report that they are
not getting funds in time. Decision making problems with community leaders constitute
12.5 percent and 4.2 percent report that ASHAs are not adequately trained. Adequate
facilities for institutional deliveries are not available in 4.2 percent of the Gram
Panchayats. Difficulties like lack of adequate fund, lack of man power etc. are faced by
12.5 percent of Gram Panchayats

153
The kind of support required by the Gram Panchayats to implement NRHM programme
are also given in Table 2A. About 88 percent of Gram Panchayats require more funds
for the maintenance/ effective functioning. About 38 percent need direct control over
the funds and 8.3 percent of Gram Panchayats requested that more training should be
given to ASHAs and community members who work in health care activities.

154
Chapter 9
Quality of Care and Client Satisfaction The present chapter describes the quality of health care and client satisfaction, based on
the data collected from the in-patients and out-patients exit from the hospital after
discharge or treatment. The sample was taken from every third patient exiting from the
hospital after treatment or discharge. A total of 32 in-patient interviews were carried out
from the District hospital (Beach hospital) Kozhikode, CHC Kuttiyadi, and CHC
Thalakulathur. Out of the 32 interviews, 10 are from the District hospital, 12 from CHC
Kuttiyadi and 10 from CHC Thalakulathur. There are no in-patients in the PHC‟s as, in
general, many of the PHCs in Kerala lack adequate facilities needed for the treatment of
in-patients. Similarly, a total of 73 out-patient interviews were also carried out from
District hospital Kozhikode, CHC Kuttiyadi, CHC Thalakulathur and 2 PHC‟S that
come vertically under the CHC Kuttiyadi (namely Velam PHC & Narippatta PHC) and
CHC Thalakulathur (namely Kakkodi PHC and Iravalloor PHC). Out of the 73 out-
patients 10 are from each institution except Velam PHC, Narippatta PHC and Kakkodi
PHC from where 11 outpatients each were interviewed.
9.1 IPD facilities
In-patient Department in any hospital is regarded as the centre where prolonged care,
proper attention and correct medication would enable the patient to recover from any
illness. In-patient services include medical, surgical, pediatric, obstetric and
rehabilitation services. Many hospitals also provide mental health services and services
for older people. Medical appraisals handle the observance of standards of medical
treatment at all level of health care delivery system. In-patients usually spend more time
in the health facilities. There are various problems faced by the patients in the in-patient
departments like over delay in different services (registration, doctor‟s examination,
admission to the ward, getting services and to get discharged), behaviour of the staff

155
(doctors, nurses, technical staff, ayah, ward boys and counter clerk), privacy at the place
of examination etc. Patient doctor communication and cleanliness of the different areas
(floor, bath room, changing uniform and changing bed sheets) and crowding in different
facilities in the ward that lead to patient dissatisfaction are other areas to be addressed.
The discontent may lead to unpleasant situation that have to be eliminated at any
expense. To overcome the unhealthy situations in the in-patient department, proper
utilization of the available resources and careful management of the patient‟s
requirement during the time of admission to the time of discharge are imperative. The
present chapter evaluates various factors that constitute to the build up of patient
discontent if any, with respect to different health facilities like DH, CHC and PHC.
9.1.1 Background characteristics of the in-patients
Table 1 shows the background characteristics of the in-patients. Age distribution of the
inpatients highlights the health problems of the aged population for 37.5 percent of the
in-patients belongs to the age group of „60 years or more‟. Inpatients in the prime
reproductive age group 20-29 years form 18.8 percent 9.4 percent respondents are aged
less than 20 years‟ and „40-49 years‟ and 12.5 percent are aged 30-39 years and 50-59
years. Three in five in-patients are females. About three-fourths are currently married,
9.4 percent are widowed, 16 percent are unmarried and only three percent represent
divorced and separated. More than four-fifths are from rural areas (87.5 percent).
Around 69 percent of the in-patients seek treatment from CHC‟S, and the rest from
district hospital.
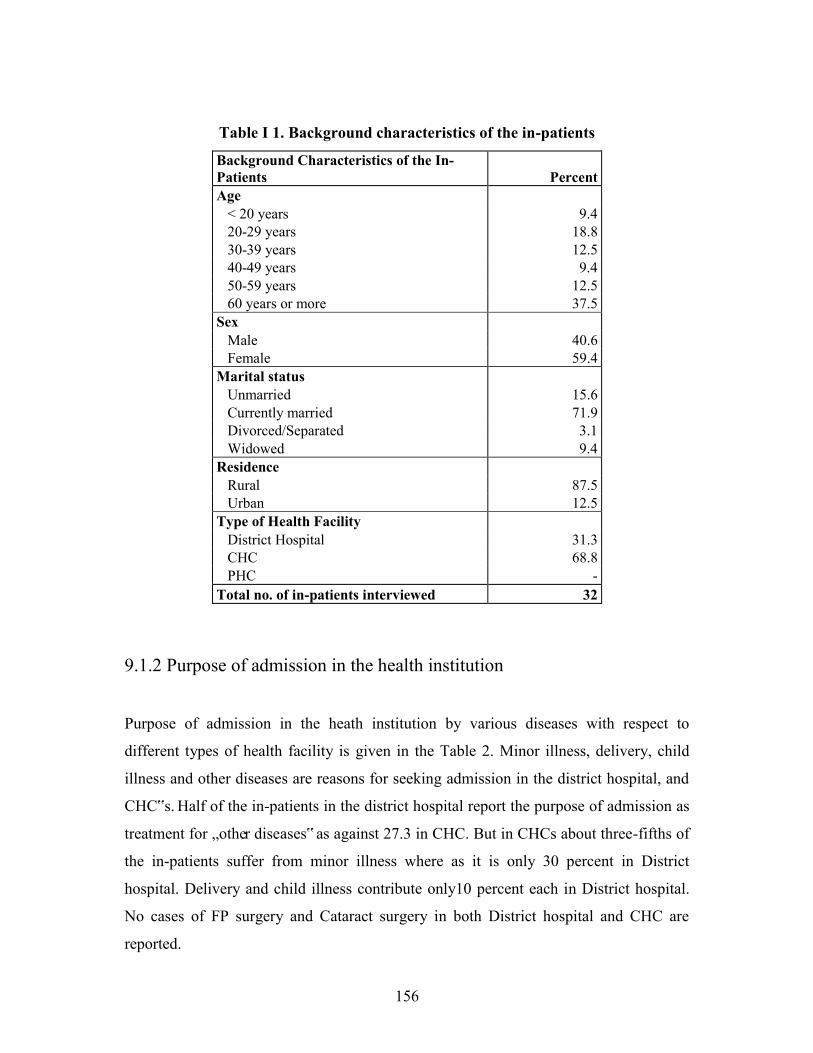
156
Table I 1. Background characteristics of the in-patients
Background Characteristics of the In-Patients Percent Age < 20 years 9.4 20-29 years 18.8 30-39 years 12.5 40-49 years 9.4 50-59 years 12.5 60 years or more 37.5 Sex Male 40.6 Female 59.4 Marital status Unmarried 15.6 Currently married 71.9 Divorced/Separated 3.1 Widowed 9.4 Residence Rural 87.5 Urban 12.5 Type of Health Facility District Hospital 31.3 CHC 68.8 PHC - Total no. of in-patients interviewed 32
9.1.2 Purpose of admission in the health institution
Purpose of admission in the heath institution by various diseases with respect to
different types of health facility is given in the Table 2. Minor illness, delivery, child
illness and other diseases are reasons for seeking admission in the district hospital, and
CHC‟s. Half of the in-patients in the district hospital report the purpose of admission as
treatment for „other diseases‟ as against 27.3 in CHC. But in CHCs about three-fifths of
the in-patients suffer from minor illness where as it is only 30 percent in District
hospital. Delivery and child illness contribute only10 percent each in District hospital.
No cases of FP surgery and Cataract surgery in both District hospital and CHC are
reported.

157
Table I 2. Purpose of admission in the health institution
Purpose of admission in Health Institution
Type of Health Facility (Percent) District
Hospital CHC PHC All Minor illness 30.0 59.1 - 50.0 FP surgery - - - - Delivery 10.0 13.6 - 12.5 Cataract surgery - - - - Child admitted 10.0 - - 3.1 Other 50.0 27.3 - 34.4 Total no. of in-patients interviewed 10 22 - 32
9.1.3 Waiting time Table 3 shows the average waiting time in minutes for various formalities in different
types of health facility. Time taken to get discharged from the health facility on an
average is more compared to other formalities. The average waiting time for being
discharged is over one hour. In-patients reportedly wait nearly half an hour on an
average for doctor‟s call and around 10 minutes for other services like getting
admission to ward, for registration, for doctor‟s examination or getting other services.
The average waiting time for getting discharged from the district hospital is about one
hour forty five minutes in contrast to 50 minutes taken for the same in a CHC. Both,
waiting time for doctor‟s call and time for doctor‟s examination are comparatively
lesser in District hospital than in CHC.
Table I 3. Waiting time
Average waiting time for:
Type of Health Facility (Average waiting time in minutes)
District Hospital CHC PHC All
Registration 8.3 12.0 - 10.9
Doctor's call 15.3 35.0 - 28.8
Doctor's examination 8.0 10.9 - 10.0
Admission to ward 15.0 10.8 - 12.1
Getting services 10.8 8.4 - 9.2
To get discharged 106.5 49.8 - 67.5 Total no. of in-patients interviewed 10 22 - 32

158
9.1.4 Satisfaction regarding the waiting time
A patient‟s experience in waiting time will radically influence his/her perceptions on
quality of the health service facility. Table 4 judges the in-patients‟ responses on
waiting time in the health facility which in turn will measure the level of satisfaction
with the services rendered by each type of health facility.
Table I 4. Satisfaction regarding the waiting time
Waiting time for/Satisfaction
Type of Health Facility District
Hospital CHC PHC All Registration Too long - 18.2 - 12.5 Appropriate - 36.4 - 25.0 Too short 100.0 45.5 - 62.5 Can't say - - - - Doctor's call Too long - 40.9 - 28.1 Appropriate 20.0 31.8 - 28.1 Too short 80.0 27.3 - 43.8 Can't say - - - - Doctor's examination Too long - 4.5 - 3.1 Appropriate 60.0 77.3 - 71.9 Too short 30.0 13.6 - 18.8 Can't say 10.0 4.5 - 6.3 Admission to ward Too long - 4.5 - 3.1 Appropriate 50.0 63.6 - 59.4 Too short 50.0 31.8 - 37.5 Can't say - - - - Getting services Too long - - - - Appropriate 40.0 50.0 - 46.9 Too short 60.0 50.0 - 53.1 Can't say - - - - To get discharged Too long 10.0 13.6 - 12.5 Appropriate 90.0 72.7 - 78.1 Too short - 9.1 - 6.3 Can't say - 4.5 - 3.1 Total no. of in-patients interviewed 10 22 - 32

159
Patients in the District hospital have full satisfaction regarding the waiting time for
registration whereas 18.2 percent of patients in CHC complain the waiting period for
registration to be too long. Two-
fifths of the in-patients waiting
time for Doctor‟s call in CHCs
to be too long. Long queues
before the doctor‟s room are a
common sight.
Long queue before the doctor’s room at Kuttiyadi CHC.
But this dissatisfaction is more or less compensated as more than 77 percent of the
patient in CHC feel that time for doctor‟s examination is quite appropriate. Both in
District hospital and the CHC the patients do not show any dissatisfaction (other than
the 4.5 percent in CHC) regarding waiting time for either admission to the ward or time
for getting services. Even though the waiting period for getting discharged in District
hospital is higher than that in CHC, 90 percent of the patients feel it to be appropriate
time.
9.1.5 Behaviour of staff
Table 5 shows the behaviour of Doctors, Nurses, Technical staff, Ayah, Ward boys and
Counter clerk towards the in-patients in District hospital and CHC. No patients report
any type of rude, arrogant, negligent or indifferent attitude from any of the above
mentioned staff they meet in the health facility. All the patients in the District hospital
and CHC‟s agree that the doctors greet in friendly manner. All are of the opinion that
the behaviour of Technical staff, Ayahs, Ward boys and the Counter clerk is good/very
kind. In District hospital, only 10 percent of the in-patients are of the opinion that the
behaviour of the doctors and Nurses are only reasonably good.

160
Table I 5. Behaviour of staff
Staff Behaviour Type of Health Facility (Percent)
Staff Behaviour District
Hospital CHC PHC All
Doctor greet in a friendly manner Yes 100.0 100.0 - 100.0 Somewhat - - - - No - - - -
Behaviour of Doctor Rude - - - - Reasonable 10.0 - - 3.1 Good 60.0 90.9 - 81.3 Very kind 30.0 9.1 - 15.6
Behaviour of Nurse Rude - - - - Reasonable 10.0 - - 3.1 Good 60.0 86.4 - 78.1 Very kind 30.0 13.6 - 18.8
Behaviour of Technical Staff Rude - - - - Reasonable - - - - Good 71.4 100.0 - 90.5 Very kind 28.6 - - 9.5
Behaviour of Ayah Negligent - - - - Arrogant - - - - Indifferent - - - - Good 100.0 100.0 - 100.0
Negligent - - - - Arrogant - - - - Indifferent - - - - Good 100.0 100.0 - 100.0
Behaviour of Counter Clerk Negligent - - - - Arrogant - - - - Indifferent - - - - Good 100.0 100.0 - 100.0
Total no. of in-patients interviewed 10 22 - 32

161
9.1.6 Unique/Innovative measure taken to improve the staff behaviour
The staff‟s behaviour in the health institution is very important for the proper
functioning of the institution. Hence, unique or innovative measures taken to improve
the staff behaviour are significant. Table 6 provides the response of the patients about
the unique/innovative measures taken to improve the staff behaviour. Both district
hospital and the CHC‟s, majority of the in-patients viz., 60 and 86.4 percent
respectively, have no idea about the measures taken by the Government to improve the
staff behaviour. This probably owes to the fact that the behaviour of the staff are
reportedly good as seen earlier. Only 6.3 percent of the total in-patients know about the
innovative measures taken to improve the staff behaviour.
Table I 6. Unique/Innovative measure taken to improve the staff behaviour
Staff Behaviour
Type of Health Facility (Percent)
District Hospital CHC PHC All
Unique/innovative measure taken to improve the staff behaviour22 Yes 20.0 - - 6.3 No 20.0 13.6 - 15.6 Don't know 60.0 86.4 - 78.1
Total no. of in-patients interviewed 10 22 - 32
9.1.7 Privacy at place of examination
Privacy at the place of doctor‟s examination room is needed for the patients to convey
about all the symptoms regarding their illness. Table 7 indicates the privacy for the
patients at the place of examination. It is evident that 91 percent of the in-patients from
CHC‟s reports they get privacy at the time of doctors examination whereas in District
hospital only 50 percent feel that they get privacy. In total, 78 percent reports about
getting privacy during medical examination.

162
Table I 7. Privacy at place of examination
Privacy
Type of Health Facility (Percent)
District Hospital CHC PHC All
Patients reporting presence of privacy at the place of examination 50.0 90.9 - 78.1
Total no. of in-patients interviewed 10 22 - 32
9.1.8 Patient- doctor communication
The most effective and successful healthcare begins with a considerate relationship
between doctors and patients where communication is the most important component.
Table 8 deals in detail about different aspects of patient-doctor communication and how
effectively the interaction is accomplished. All the patients in the District hospital have
the complaint that the doctor did not listen to the ailment patiently. The situation in
CHC is slightly better where at least 31.8 percent of the patients agree that doctor
listened to their ailments patiently. The patients in District hospital (90 percent) are not
even allowed by the doctor to ask questions. But in CHC, around 41 percent of the
patients are allowed to ask questions. When all of the questions raised by the patients in
District hospital went unanswered, 36.4 percent of CHC in-patients feel that they got
proper reply from the doctors. All the patients of district Hospital invariably opine that
doctors are kind enough to discuss about their ailments. Meanwhile, around 13 percent
of CHC patients‟ ailment are not been discussed by the doctor. Four out of five
inpatients in district hospital and 68 percent of them in CHC said that the doctors talked
about the recovery from disease. Around 70 and 32 percent of patients from District
hospital and CHC respectively got advice from the Doctors.
The lesser waiting period as evidenced in Table 4 may be regarded as the direct
consequence of the reluctance from the part of the Doctors of District hospital not to
have more interaction with the patients.

163
Table I 8. Patient- doctor communication
Patient-Doctor/ Provider Communication
Type of Health Facility (Percent) District
Hospital CHC PHC All Doctor listened to description of ailment patiently Yes, somewhat - - - - Yes, always - 31.8 - 21.9 No 100.0 68.2 - 78.1 Did not interact with doctor - - - - Doctor allowed to ask question Yes, somewhat - - - - Yes, always 10.0 40.9 - 31.3 No 90.0 59.1 - 68.8 Did not interact with doctor - - - - Doctor responded to question Yes, somewhat - - - - Yes, always - 36.4 - 25.0 No 100.0 63.6 - 75.0 Did not interact with doctor - - - - Doctor discussed about ailment Yes 100.0 86.4 - 90.6 No - 13.6 - 9.4 Did not interact with doctor - - - - Doctor talked about the recovery Yes 80.0 68.2 - 71.9 No 20.0 31.8 - 28.1 Did not interact with doctor - - - - Doctor gave 'other advice' Yes 70.0 31.8 - 43.8 No 30.0 68.2 - 56.3 Did not interact with doctor - - - - Total no. of in-patients interviewed 10 22 - 32
9.1.9 Cleanliness of the facility
Inadequate cleanliness in hospitals causes disease outbreaks and therefore enacting the
proper standards in hospitals is a matter of guaranteeing public health and safety.
Therefore, cleanliness of the health institutions is very much important just like
treatment and medicine. Table 5 provides the views and judgment of the patients
regarding the measures taken for keeping cleanliness of the health facility. In District

164
hospital, 70 percent of the patients are of the view that floor cleaning is done only once
in a day but the remaining 30 percent says that the frequency of floor cleaning as twice
a day.
Table I 9. Cleanliness of the facility
Type of facility/ Frequency of cleaning
Type of Health Facility (Percent) District
Hospital CHC PHC All Floor Thrice a day - - - - Twice a day 30.0 4.5 - 12.5 Once a day 70.0 95.5 - 87.5 Less than once a day - - - - Not applicable - - - - Toilet/ Bathroom cleaning Thrice a day - - - - Twice a day 40.0 18.2 - 25.0 Once a day 60.0 81.8 - 75.0 Less than once a day - - - - Not applicable - - - - Changing patient's uniform Twice a day - - - - Once a day - - - - Less than once a day - - - - Not changed 100.0 100.0 - 100.0 Not applicable - - - - Changing bed-sheets Twice a day - - - - Once a day - - - - Less than once a day - 90.9 - 83.3 Not changed 100.0 9.1 - 16.7 Not applicable - - - - Total no. of in-patients interviewed 2 22 - 24
In CHC, 95.5 percent of the patients opine that floor cleaning is done once in a day and
the rest 4.5 percent has the opinion that the frequency is twice a day. The frequency
Toilet/Bathroom cleaning in District Hospital according to 60.0 percent is once in a day.
But in CHC about 82 percent says that the cleaning job is carried out only once in a day.
No respondent positively answered the query regarding change of patients‟ uniform in
the District Hospital and CHC which may be due to the nonexistence of such a practice

165
in general. In District hospital there is no practice of changing bed-sheets. But in CHC,
according to 91 percent, the frequency of changing of bed-sheets is less than once a day.
9.1. 10 Satisfaction of patients regarding cleanliness of the facility
Table 10 explains the level satisfaction of the patients regarding the cleanliness of the
facility. Patients are satisfied with floor cleaning activities in District Hospital whereas
in CHC, 13.6 percent of the patients are not satisfied with the floor cleaning.
Table I 10. Satisfaction of patients regarding cleanliness of the facility
Type of facility/ Satisfaction
Type of Health Facility (Percent) District
Hospital CHC PHC All Floor cleaning Satisfied 90.0 45.5 - 59.4 Somewhat satisfied 10.0 40.9 - 31.3 Not satisfied - 13.6 - 9.4 Toilet/ Bathroom cleaning Satisfied 60.0 40.9 - 46.9 Somewhat satisfied 20.0 13.6 - 15.6 Not satisfied 20.0 45.5 - 37.5 Changing patient's uniform Satisfied - - - - Somewhat satisfied - - - - Not satisfied 100.0 100.0 - 100.0 Changing bed sheets Satisfied - 27.3 - 25.0 Somewhat satisfied - 18.2 - 16.7 Not satisfied 100.0 54.5 - 58.3 Total no. of in-patients interviewed 2 22 - 24
When it comes to Toilet/bathroom cleaning, 45.5 percent of the in-patients in CHC
express dissatisfaction compared to 20 percent in District hospital. Patients of both the
health facilities unanimously express their dissatisfaction regarding the changing of
patient‟s uniform. In District hospital the practice of changing bed sheets is seldom

166
seen. In CHC also 54.5 percent expresses their dissatisfaction regarding periodic
changing of bed sheets. It has to be bared in mind that a good proportion of the in-
patients were admitted for minor ailments and practice of changing patient‟s uniform
and bed sheets largely depend on the duration of stay.
9.1.11Crowding in the facility
Space constrains and resulting from over crowding and related problems constitutes an
important aspect in modern health care. The present table incorporates the patients‟
response regarding various crucial aspects leading to overcrowding at the health
facilities. All the in-patients report that cots are available even at the time of admission
up to time of discharge in both District hospital and CHC.
Table I 11. Crowding in the facility
Crowding in the facility
Type of Health Facility (Percent) District Hospital CHC PHC All
Availability of cot Immediately 100.0 100.0 - 100.0 Not immediately but same day - - - - Next day - - - - After more than a day - - - - Never got the cot - - - - Availability of cot/bed till the time of discharge Yes 100.0 100.0 - 100.0 No - - - - Adequacy of space in the ward Adequate 80.0 63.6 - 68.8 Somewhat adequate 20.0 22.7 - 21.9 Not adequate - 13.6 - 9.4 Satisfaction with the ward arrangement Satisfied 60.0 68.2 - 65.6 Somewhat satisfied 10.0 13.6 - 12.5 Not satisfied 30.0 18.2 - 21.9 Adequacy of space in IPD Adequate 80.0 72.7 - 75.0 Somewhat adequate 20.0 4.5 - 9.4 Not adequate - 22.7 - 15.6 Total no. of in-patients interviewed 10 22 - 32

167
Only 13.6 percent of the CHC patients complain about space inadequacy in CHC.
Dissatisfaction regarding the ward arrangement among 30 percent of the in-patients in
the district hospital and 18.2 percent in the CHC are evident. Around 23 percent of the
CHC patients express their unhappiness about the inadequacy of space. But in the
district hospital none of them show any discontent in this regard.
9.1.12Amenities provided by the hospital
Amenities such as canteen, television, medical shop, telephone, ambulance and
accommodation facility for relatives, play significant role in ascertaining the quality of
service rendered by a hospital. Table 12 incorporates the responses of the patients
regarding the above mentioned amenities in the hospitals.
Table I 12. Amenities provided by the hospital
Percentage of in-patients reporting availability/ % reporting satisfaction
Type of Health Facility
Percent District
Hospital Percent CHC Percent PHC Percent All Availability of amenities Television - - 54.5 12 - - 37.5 12 Canteen 100.0 10 22.7 5 - - 46.9 15 Medical shop 80.0 8 100.0 22 - - 93.8 30 Telephone 40.0 4 4.5 1 - - 15.6 5 Accommodation for relatives 40.0 4 40.9 9 - - 40.6 13 Ambulance 90.0 9 54.5 12 - - 65.6 21 Satisfaction among those who said the amenity is available Television - - 100.0 12 - - 100.0 12 Canteen 90.0 9 60.0 3 - - 80.0 12 Medical shop 87.5 7 50.0 11 - - 60.0 18 Telephone 75.0 3 100.0 1 - - 80.0 4 Accommodation for relatives 75.0 3 33.3 3 - - 46.2 6 Ambulance 77.8 7 83.3 10 - - 81.0 17
District hospital does not have any television. Over half of the in-patients in CHC
mentioned about the availability of television and all of them expressed their
satisfaction. All the inpatients of District hospital report that there is canteen facility and

168
90 percent of these inpatients are satisfied with the canteen facility. The corresponding
proportion in the CHC is 22.7 percent (availability) and 60 percent (satisfaction)
respectively. Eighty percent of the in-patients of District hospital report that medical
shop is available and almost 88 percent are satisfied with the facility. Even though all
the respondents in CHC positively respond the existence of the medical shop, only 50
percent are satisfied. Out of the 40 percent of District hospital in-patients who report the
availability of telephone, three-fourths are satisfied with the telephone facility. In
contrast the small proportion of in-patients (4.5 percent) of CHC seems to be satisfied
with the availability of the telephone facility. Two-fifths of the in-patients in District
hospital and CHC report the availability of accommodation for the relatives out of
which 75 percent and 33 percent respectively have satisfactions. Regarding the
ambulance service 90.0 and 54.5 percent of District hospital and CHC patients
respectively report the availability the facility out of which 77.8 percent and 83.3
percent respectively express their satisfaction.
9.1.13 Continuity of treatment
Table 13 includes the response of the patients regarding the patient‟s opinion to
continue using the health facility. The overall satisfaction on visiting the health facility
is greater among in-patients of District hospital than the CHC (70 percent as against
54.5 percent).
The reason for dissatisfaction among 10 percent and 27.3 percent of patients in District
hospital and CHC respectively is lack of facilities. All the patients in District hospital
and 86.4 percent of in-patients in CHC said they would come again in case they fell sick
and all the in-patients invariably said they would recommend the respective facilities to
other people.

169
Table I 13. Continuity of treatment
Continuity of treatment
Type of Health Facility (Percent) District
Hospital CHC PHC All Overall satisfaction on visiting to facility Dissatisfied 10.0 27.3 - 21.9 Somewhat satisfied 20.0 18.2 - 18.8 Satisfied 70.0 54.5 - 59.4 Reason of dissatisfaction Lack of facilities 100.0 100.0 - 100.0 Bad experience with doctor - - - - Poor quality of services - - - - Charges are exorbitant - - - - Other - - - - Would like to come again in case fell sick Yes 100.0 86.4 - 90.6 No - - - - May come/unsure - 13.6 - 9.4 Whether recommend this hospital to other Yes 100.0 100.0 - 100.0 No - - - - Total no. of in-patients interviewed 10 22 - 32
9.2 OPD facilities
Out patient Department in any hospital is considered to be the shop window of the
hospital. Most hospitals provide out-patient services including emergency services, day
procedures, diagnostic and assessment services, and therapy services. Hospitals also
support various community based programs to prevent or reduce the need for
hospitalization. Out patients normally spend lesser time than the inpatients in the health
facilities. There are various problems faced by the patients in out patient department
like over crowding, delay in consultation, cleanliness of the different areas like OPD
room, laboratory, dispensary etc that leads to patient dissatisfaction. Now a day, patients
get irritated and become annoyed with even minute problems that arise even during
consultation with doctor or nursing staff. The displeasure may lead to unpleasant

170
developments that have to be eliminated at any expense. This is only possible with
optimum utility of the resources and careful management of the patient‟s problems
during the OP consultation process. The present study evaluates various factors that
constitute to the building up of patient discontent with respect to different health
facilities like DH, CHC and PHC.
9.2. 1Background characteristics of the out-patients
The distribution of out-patients by different background characteristics is given in
Table 1. About 30 percent of the out-patients, who visited the health institution, belong
to the age group 30-39 years followed by those aged 60 years and above (23.3 percent).
Out-patients aged below 20 years is only 4.1 percent. The 20-29 years of age and of 40-
49 years of age account for more than 12 percent each.
Table O1. Background characteristics of the out-patients
Background Characteristics of the Out-Patients Percent Age < 20 years 4.1 20-29 years 12.3 30-39 years 30.1 40-49 years 17.8 50-59 years 12.3 60 years or more 23.3 Sex Male 34.2 Female 65.8 Marital status Unmarried 8.2 Currently married 79.5 Divorced/Separated 2.7 Widowed 9.6 Place of residence Rural 100.0 Urban - Type of Health Facility District Hospital 13.7 CHC 27.4 PHC 58.9 Total no. of out-patients interviewed 73

171
Two thirds of the in-patients are females. With respect to the marital status four out of
five are currently married, 10 percent are widowed, 8 percent are unmarried and around
three percent represent divorced/separated. All the respondents are from rural areas.
Around 59 percent of the in-patients seek treatment from PHC‟S, about 27 percent from
the CHC and the rest from district hospital.
9.2.2 Purpose of visit to the health institution Table 2 provides the information about the type of health institution visited for
treatment of various diseases/ services. Minor illness, FP services, antenatal care, Post
natal care (PNC), eye checkup, Multi drug Treatment-Directly observed treatment
strategy (MDT-DOTs), child illness and other disease are the diseases and services
accounted for.
The purpose of visit to District hospital among half the patients is reported as treatment
for minor illness. This proportion is 70 percent in the CHC and 81.4 percent in PHC.
One –fifth of the out-patients who visited the District hospital and 5 percent who visited
the PHC mentioned the purpose of visit as family planning services. No one from the
sample visited the CHC for family planning service. Ten percent of the out-patients of
District hospital took treatment for their child‟s illness, and 10 percent for antenatal
care. No visits are reported in the District hospital or CHC or PHC for PNC, eye
checkup and MDT-DOTs.
Table O2. Purpose of visit to the health institution
Purpose of visit to Health Institution
Type of Health Facility (Percent) District Hospital CHC PHC All
Minor illness 50.0 70.0 81.4 74.0 FP services 20.0 - 4.7 5.5 Antenatal care 10.0 - - 1.4 PNC - - - - Eye checkup - - - - MDT-DOTs - - - - Child illness 10.0 20.0 7.0 11.0 Other 10.0 10.0 7.0 8.2 Total interviewed 10 20 43 73

172
9.2.3 Average waiting time The average waiting time in minutes for various formalities/services with respect to
different type of health facility is given in Table 3. Waiting time taken for registration,
doctor‟s examination, getting medicines, dressing and paying bill are the formalities and
services assessed in the survey. The average waiting time is reportedly longer only for
doctor‟s examination in CHC (51 minutes) and payment of bills in the District hospital
(15.5 minutes). Out-patients report that the average waiting time for formalities like
registration, injection, getting medicines and dressing of wounds is less than 10
minutes.
Table O3. Average waiting time
Waiting time for
Type of Health Facility
District Hospital
CHC PHC All
Registration Number of patients availed the service 10 20 43 73 Average waiting time (in minutes) 5.6 5.7 3.5 4.4
Doctor's examination Number of patients availed the service 10 20 43 73 Average waiting time (in minutes) 5.3 50.7 4.5 17.3
Injection Number of patients availed the service 2 - - 2 Average waiting time (in minutes) 2.0 - - 2.0
Getting medicines Number of patients availed the service 9 19 43 71 Average waiting time (in minutes) 3.0 4.6 2.7 3.2
Dressing Number of patients availed the service - - 2 2 Average waiting time (in minutes) - - 2.0 2.0
Paying bill Number of patients availed the service 2 4 - 6 Average waiting time (in minutes) 15.5 6.0 - 9.2
9.2.4 Satisfaction regarding the waiting time Table 4 shows the satisfaction of out-patients regarding the waiting time for different
formalities/services in the health facilities. Majority of the out-patients are satisfied with
the average waiting time for registration for doctor‟s examination, for injection, getting
medicines, dressing of wounds and paying bill irrespective of the type of health facility
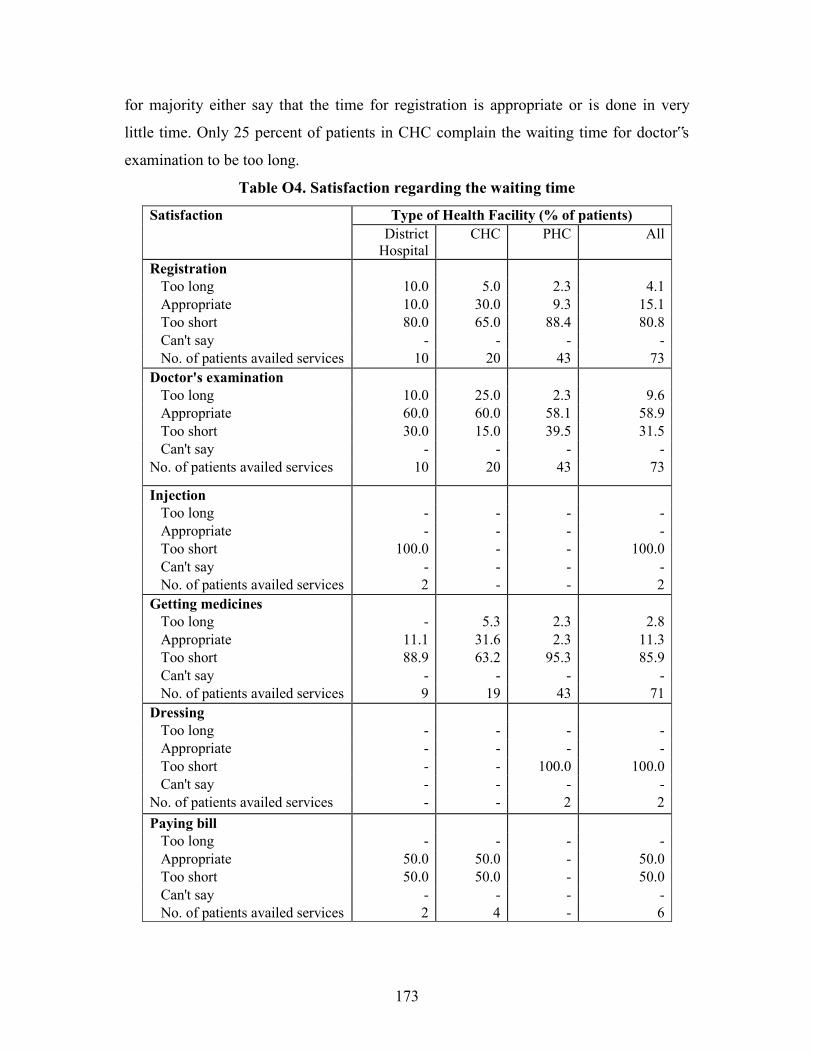
173
for majority either say that the time for registration is appropriate or is done in very
little time. Only 25 percent of patients in CHC complain the waiting time for doctor‟s
examination to be too long.
Table O4. Satisfaction regarding the waiting time
Satisfaction Type of Health Facility (% of patients) District
Hospital CHC PHC All
Registration Too long 10.0 5.0 2.3 4.1 Appropriate 10.0 30.0 9.3 15.1 Too short 80.0 65.0 88.4 80.8 Can't say - - - - No. of patients availed services 10 20 43 73 Doctor's examination Too long 10.0 25.0 2.3 9.6 Appropriate 60.0 60.0 58.1 58.9 Too short 30.0 15.0 39.5 31.5 Can't say - - - - No. of patients availed services 10 20 43 73
Injection Too long - - - - Appropriate - - - - Too short 100.0 - - 100.0 Can't say - - - - No. of patients availed services 2 - - 2 Getting medicines Too long - 5.3 2.3 2.8 Appropriate 11.1 31.6 2.3 11.3 Too short 88.9 63.2 95.3 85.9 Can't say - - - - No. of patients availed services 9 19 43 71 Dressing Too long - - - - Appropriate - - - - Too short - - 100.0 100.0 Can't say - - - - No. of patients availed services - - 2 2 Paying bill Too long - - - - Appropriate 50.0 50.0 - 50.0 Too short 50.0 50.0 - 50.0 Can't say - - - - No. of patients availed services 2 4 - 6

174
9.2.5 Behaviour of the staff Table 5 shows the behaviour of Doctors, Nurses, dispenser and technicians towards the
patients in the health facilities. Half the out-patients, who went to the District hospital
either fully or half heartedly agrees that the doctors greets the in a friendly manner.
Table O5. Behaviour of the staff
Staff Behaviour
Type of Health Facility District
Hospital CHC PHC All
Doctor greet in a friendly manner Not friendly - - - - Yes, somewhat 50.0 15.0 7.0 15.1 Yes 50.0 85.0 93.0 84.9 Did not interact/ Not applicable - - - - Behaviour of Doctor Rude - - - - Reasonable - 10.0 7.0 6.8 Good 90.0 80.0 79.1 80.8 Very kind 10.0 10.0 14.0 12.3 Did not interact/ Not applicable - - - - Behaviour of Nursing Staff Rude - - - - Reasonable 10.0 10.0 7.0 8.2 Good 90.0 50.0 74.4 69.9 Very kind - 10.0 14.0 11.0 Did not interact/ Not applicable - 30.0 4.7 11.0 Behaviour of Dispenser Rude - - - - Reasonable - 10.0 7.0 6.8 Good 70.0 75.0 81.4 78.1 Very kind 30.0 10.0 9.3 12.3 Did not interact/ Not applicable - 5.0 2.3 2.7 Behaviour of Technician Rude - - 2.3 1.4 Reasonable 10.0 15.0 2.3 6.8 Good 60.0 15.0 20.9 24.7 Very kind 20.0 5.0 4.7 6.8 Did not interact/ Not applicable 10.0 65.0 69.8 60.3 Total no. of out-patients interviewed 10 20 43 73
Those who fully agree that doctors in CHC and PHC greets them friendly accounts for
85 percent and 93 percent respectively. 90 percent patients from the District hospital,
80 percent from the CHC and 79 percent from the PHC fully concur that the doctor‟s

175
behaviour is good. Other says the doctors are very kind. Only 10 percent of the patients
in CHC and 7 percent in PHC said that the doctor‟s behaviour is reasonable. Similarly
except for 10 percent of the out-patients in CHC and 7 percent in PHC, all the out-
patients report the behaviour of the nursing staff and dispenser to be either good or very
kind. Among those out-patients who interacted with a technician in the health facility,
a good proportion from each health facility reports the behaviour of the dispenser to be
either good or very kind.
9.2.6 Privacy
Table 6 indicates the privacy during treatment extended to out-patients at the place of
examination. All the patients visiting the District hospital feel that there is privacy at the
place of doctor‟s examination. The opinion on privacy is positive among 95 percent in
PHC and 70 percent in the CHC.
Table O6. Privacy
Privacy Type of Health Facility (Percent)
District Hospital CHC PHC All
Patients reporting presence of privacy at the place of examination 100.0 70.0 95.3 89.0 Total no. of out-patients interviewed 10 20 43 73
9.2.7 Patient-Doctor/provider communication
Patient-Doctor/provider communication is an important component of patient care and
improvements in provider-patient communication can have beneficial effects on health
outcomes. Table 7 point out various aspects of the patient-doctor communication such
as whether doctor listened to the description of ailment patiently, allowed the patients to
ask questions, responded to questions of the patients, talked about the recovery etc.

176
Table O7. Patient-Doctor/provider communication
Patient-Doctor Communication
Type of Health Facility (Percent) District
Hospital CHC PHC All Doctor listened to description of ailment patiently Yes, somewhat - 25.0 9.3 12.3 Yes, always 100.0 75.0 90.7 87.7 No - - - - Did not interact/Not Applicable - - - - Doctor allowed to ask questions Yes, somewhat - 5.6 4.7 4.2 Yes, always 100.0 83.3 95.3 93.0 No - 11.1 - 2.8 Did not interact/Not Applicable - - - - Doctor responded to questions Yes, somewhat - 11.1 - 2.8 Yes, always 100.0 66.7 100.0 91.5 No - 22.2 - 5.6 Did not interact/Not Applicable - - - - Doctor discussed about the ailment Yes 100.0 40.0 88.4 76.7 No - 60.0 11.6 23.3 Did not interact/Not Applicable - - - - Doctor talked about the recovery Yes 100.0 40.0 81.4 72.6 No - 60.0 18.6 27.4 Did not interact/Not Applicable - - - - Doctor gave 'other advice' Yes 50.0 5.0 30.2 26.0 No 50.0 95.0 69.8 74.0 Did not interact/Not Applicable - - - - Total no. of out-patients interviewed 10 20 43 73

177
All the patients in the District hospital, interviewed, are of the opinion that the doctor
always listened to description of the ailment very patiently and allowed them to ask
questions. Doctor always responded to their questions and discussed about the ailment
and recovery too. However 50 percent of them say that the doctor did not give any
„other advice‟. The picture in CHC is slightly different in some of the aspects. Three-
fourths of the patients interviewed totally agree that the doctor listened to description of
ailment patiently, and the remaining one-quarter half heartedly agrees to the statement
thereby showing slight dissatisfaction in the communication. When 11 percent of the
respondents in CHC say that the doctor did not always respond to their questions, 22.2
are of the opinion that the doctor never respond to their questions. Sixty percent of the
out-patients feel that the doctor neither discussed about the ailment nor talked about the
recovery. A large majority (95 percent) opine that the doctor did not give „other advice‟
to them.
9.2.8 Satisfaction of OPD patients regarding cleanliness of the facility
Impact of quality consciousness in all sectors of life has augmented the need for
healthcare facilities and institutions to keep themselves aware of the needs and
expectations of their customers and end users of which cleanliness is a major aspect.
Table 8 shows complete satisfaction of the District hospital out-patients regarding the
cleanliness of OPD room, examination room, injection room and dressing room. Only
20 percent and 10 percent the patients regard the dispensary and laboratory respectively
as partially clean, the rest of them are completely satisfied with the cleanliness of the
facility. As regards the situation in the CHC, 70 percent opine that OPD room is clean,
90 percent report that the examination room is clean, 65 percent feel that the dispensary
is clean and 80 percent are positive about the cleanliness of the laboratory. Nobody
complain about lack of cleanliness in facilities like OPD room, examination room
dispensary, injection room and dressing room in the PHC except for 5 percent of the
out-patients who claim the examination to be unclean. According to 33.3 percent and
44.4 percent of OPD patients in PHC, the injection room, and dressing room
respectively are only partially clean.

178
Table O8. Satisfaction of OPD patients regarding cleanliness of the facility
Satisfaction regarding cleanliness in the facility
Type of Health Facility (Percent of patients) District
Hospital CHC PHC All OPD Room Not clean - - - - Partially clean - 30.0 14.0 16.4 Clean 100.0 70.0 86.0 83.6 No. of patients availed the services 10 20 43 73 Examination Room Not clean - 5.0 - 1.4 Partially clean - 5.0 9.3 6.8 Clean 100.0 90.0 90.7 91.8 No. of patients availed the services 10 20 43 73 Dispensary Not clean - - - - Partially clean 20.0 35.0 9.3 17.8 Clean 80.0 65.0 90.7 82.2 No. of patients availed the services 10 20 43 73 Laboratory Not clean - - - - Partially clean 10.0 20.0 - 13.3 Clean 90.0 80.0 - 86.7 No. of patients availed the services 10 5 - 15 Injection Room Not clean - - - - Partially clean - - 33.3 23.1 Clean 100.0 - 66.7 76.9 No. of patients availed the services 4 - 9 13 Dressing Room Not clean - - - - Partially clean - - 44.4 33.3 Clean 100.0 - 55.6 66.7 No. of patients availed the services 3 - 9 12
9.2.9 Satisfaction of OPD patients regarding crowding in the facility Patient satisfaction surveys are useful in gaining an understanding of user‟s needs and
their perception of the service received. Patient‟s satisfaction is an important indicator
in evaluating the quality of the patient care in the out-patient department. Table 9 shows

179
the satisfaction level of patients in the district hospital regarding the space available in
the examination room, injection room and dressing room.
Table O9. Satisfaction of OPD patients regarding crowding in the facility
Satisfaction regarding crowding in the facility Type of Health Facility (Percent of patients)
Satisfaction regarding crowding in the facility
District Hospital CHC PHC All
OPD Room Not adequate - 30.0 16.3 17.8 Somewhat adequate 10.0 25.0 30.2 26.0 Adequate 90.0 45.0 53.5 56.2 Not applicable - - - - No. of patients availed the facility 10 20 43 73 Examination Room Not adequate - 20.0 18.6 16.4 Somewhat adequate - 25.0 20.9 19.2 Adequate 100.0 55.0 60.5 64.4 No. of patients availed the facility 10 20 43 73 Dispensary Not adequate - 15.0 20.9 16.4 Somewhat adequate 10.0 20.0 20.9 19.2 Adequate 90.0 65.0 58.1 64.4 No. of patients availed the facility 10 20 43 73 Laboratory Not adequate - - - - Somewhat adequate 10.0 50.0 - 20.0 Adequate 90.0 50.0 100.0 80.0 No. of patients availed the facility 10 4 1 15 Injection Room Not adequate - - 63.6 46.7 Somewhat adequate - - 9.1 6.7 Adequate 100.0 - 27.3 46.7 No. of patients availed the facility 4 - 11 15 Dressing Room Not adequate - - 80.0 61.5 Somewhat adequate - - 10.0 7.7 Adequate 100.0 - 10.0 30.8 No. of patients availed the facility 3 - 10 13

180
Patients of District hospital do not report of crowding in any of the facilities. Patients in
the PHC also report that laboratory space is quite adequate. Those reporting satisfaction
on space available in the OPD room, dispensary and laboratory in District hospital, is 90
percent each and the remaining 10 percent are somewhat satisfied. Thirty percent of the
CHC patients and 16.3 percent of the PHC patients clearly expresses the inadequacy of
space in the OPD room, the rest of them say that the space in the OPD room is
somewhat adequate or adequate. Space in the examination room is reported to be
adequate by 55 percent of the patients in the CHC and60.5 percent in the PHC. Around
twenty percent in CHC and PHC feel the space in the examination room to be
inadequate. With regard to the space available in the dispensary, except for 15 percent
of the out-patients in the CHC and 20.9 percent in the PHC, all feel that the space to be
either adequate or somewhat adequate. The laboratory space of CHC according to 50
percent is adequate, and to the remaining 50 percent it is some what adequate.
Interestingly only one respondent who seem to have used the laboratory facility in the
PHC opine that adequate space is available in the facility. But with regard to injection
room and dressing room 63.6 and 80.0 percent of PHC patients respectively point out
the inadequacy of the space.
9.2.10 Continuity of treatment
Table 10 discusses the level of satisfaction among the patients about the treatment they
received from the facility, by assessing their attitude towards continuing the treatment
in the same health facility. In the District hospital and CHC, 30 percent each of the
patients are totally dissatisfied by the visit to the respective health facility whereas no
patient of PHC shows such dissatisfaction. Lack of facilities has been singled out as the
major reason by 33.3 and 50 percent of patients in District hospital and CHC
respectively for their dissatisfaction. When 66.7 percent of patients of District hospital
do not clearly point out any other reason for their dissatisfaction, 16.7 percent each of
CHC point out bad experience with doctors and poor quality of experience as the reason
for their dissatisfaction.
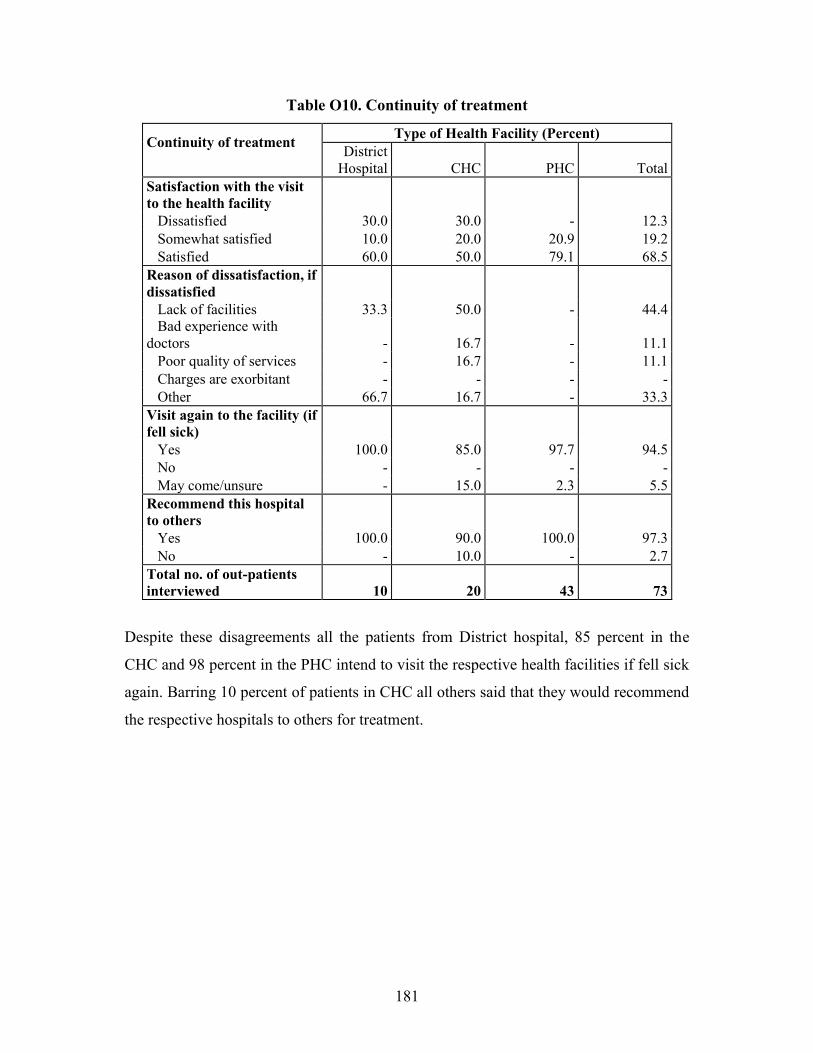
181
Table O10. Continuity of treatment
Continuity of treatment
Type of Health Facility (Percent) District
Hospital CHC PHC Total Satisfaction with the visit to the health facility Dissatisfied 30.0 30.0 - 12.3 Somewhat satisfied 10.0 20.0 20.9 19.2 Satisfied 60.0 50.0 79.1 68.5 Reason of dissatisfaction, if dissatisfied Lack of facilities 33.3 50.0 - 44.4 Bad experience with doctors - 16.7 - 11.1 Poor quality of services - 16.7 - 11.1 Charges are exorbitant - - - - Other 66.7 16.7 - 33.3 Visit again to the facility (if fell sick) Yes 100.0 85.0 97.7 94.5 No - - - - May come/unsure - 15.0 2.3 5.5 Recommend this hospital to others Yes 100.0 90.0 100.0 97.3 No - 10.0 - 2.7 Total no. of out-patients interviewed 10 20 43 73
Despite these disagreements all the patients from District hospital, 85 percent in the
CHC and 98 percent in the PHC intend to visit the respective health facilities if fell sick
again. Barring 10 percent of patients in CHC all others said that they would recommend
the respective hospitals to others for treatment.

182
Chapter 10
Summary of Findings
The district selected for the „PRC Study on Rapid Appraisal of NRHM Implementation‟
is Kozhikode. The study evaluates the progress of activities under NRHM in the District
hospital, two CHCs at Kuttiyadi and Thalakulathur; four PHCs under the selected CHCs
and twelve Sub Centres. Apart from this, information from 1200 households (50 each
from 24 wards) were collected inorder to learn about the characteristics of households,
peoples knowledge about NRHM, role of ASHA, JSY scheme and the characteristics
of JSY beneficiaries, utilization of Government Health Facilities and the health and
family welfare situation in the district. Also, all ASHAs in the selected wards, the
members of Gram Panchayat representing the selected wards were interviewed. About
5 to10 in-patients and out-patients at each of the facility including District Hospital,
CHC and PHC were interviewed to learn about the IPD and OPD facilities and quality
of care and client satisfaction.
10.1 State Profile The state profile gives an account of the overall status of NRHM interventions
especially, information on the status of health infrastructure, facility upgradation under
NRHM and availability of human resources, Rogi Kalyan Samiti, Janani Suraksha
Yojana and financial mechanism at the state. It is seen that the IPHS survey has been
completed in all the Community health centers (CHCs), FRUs, Subdivisional and
District hospitals of the state. Only Seven out of 114 CHCs in the state have been
upgraded to the facilities of IPH standard. New buildings are being constructed for one
district hospital 63 CHCs and one round the clock working (24x7) PHC. The AYUSH
facility has not kicked off in the state.
In all the health facilities of the state from PHC to District hospitals the Rogi Kalyan
Samitis (RKS) or Hospital Management Societies is functioning. JSY ensures safe

183
delivery through cent percent institutional deliveries to reduce maternal mortality and
infant mortality. The caste wise break up of Institutional deliveries was not available at
the state NRHM office. The total number of JSY beneficiaries registered both at
Government and private facilities add up to 1,48,000 and all of them have opted for
institutional delivery. In the present health care delivery system the caste wise data are
not recorded.
In Kerala state, the merging of vertical health societies of different programmes is being
implemented to form state health society. At the district level all the 14 districts have
registered health societies after merging their vertical health societies. The common
bank account for all programmes has not yet been opened at the state health society.
The funding to the districts was made on the basis of requirements of the action plan
and as flexi pool funds. The funds from the state are transferred electronically to all the
14 districts. All together 5568 Sub Centres have opened the joint account in the name of
ANM and Sarpanch in the state. In addition, all CHCs, PHCs and Sub Centres have
received the untied grant from the state during the reference period. The major
limitation of the health information system is the absence of information on health
facilities of the private sector of the state.
10.2 District Profile
The status of NRHM interventions when viewed at the district level, point out that the
implementation of NRHM activities in Kozhikode district is in its initial stages and is
progressing in a time bound manner. With regard to public health infrastructure
facilities, new buildings are under construction for eight CHCs and one FRU (as on
June 30, 2008). All the FRUs (4), sub divisional hospitals (2) and one district hospital
have completed the IPHS facility survey but the upgradation of facilities to the IPH
standards has not been completed. The facilities of mobile medical units and AYUSH
have not stated in the district yet. Though there are delivery facilities in seven PHCs,
only one has facilities to work on 24x7 basis. But emergency and critical care related to

184
delivery like BeMOC, CeMOC and new born care facilities are available in one sub
divisional hospital and district hospital only.
The public private participation (PPP) in JSY is a recent programme started in the
district in January 2009 with 27 accreditations. The total institutional deliveries of the
district in 2007-08 were 53093 and out of this SC/ST women constitute only 1.3. The
total JSY beneficiaries registered during 2007-08 was 15599.
The financial information as collected from the district accounts officer of the District
Programme Management Unit of NRHM shows that all the vertical societies of
different programmes of Kozhikode district were merged to a single society at district
level and it is registered. But the district health society has not opened single bank
account for all the programmes. The funds are being received by district based on its
activities, as flexi pool funds and based on certain formula parameters like size of the
district.
All PHCs and Sub Centres under the district have received the untied grant for the
current year. In the case of CHCs, nine out of eleven only received the untied grants.
The electronic transfer of funds facilitated easier access at all levels. The health centres
could do the maintenance of the respective health facilities with the help of untied funds
and user‟s fees generated by them. The health facilities are following a transparent
mechanism with the involvement of PRIs in the financial management of the centres.
Identification details of the District Hospital collected from the medical Superintendent
of the hospital reveals that the District hospital housed in a building constructed in
1951, is just thirteen kilometers away from the nearest CHC. The extension of health
delivery services to round the clock system has to gain momentum. The vacancies of
the medical, paramedical and support staff have to be filled at district hospital to PHC
levels urgently for the effective health care delivery to achieve the targets of NRHM at
the district. Mobile medical units and AYUSH facilities are yet to start in the district.

185
Enough waiting space is available adjacent to each consultation and treatment room.
Registration counter, blood bank, doctor‟s duty room, treatment room, pharmacy,
intensive care unit and examination and preparation room are available in the hospital.
Drainage and sanitation system for waste water, surface water, sub soil water and
sewerage are properly maintained but engineering services backup and provision for
firefighting do not exist in the hospital. Residential quarters are available in the district
hospital for the staff. But there is acute shortage of accommodation facility for the
medical and paramedical staff of the district hospital.
With regard to the Obstetrics and Gynecology section, a separate female ward is
maintained in the hospital which has two hundred beds. Bed occupancy rate for the last
twelve months in the female ward is 80 percent. A separate operation theatre is
available for the Gynecology and Obstetrics department and 625 deliveries were
conducted in the last three months. The facility for Medical termination of pregnancy,
sterilization, Suturing Cervical Tear and Hysterectomy are available in the hospital.
Information collected about the surgical ward reveals that, in the last three months, total
of 5400 surgical out-patients were registered in the hospital out of which females
constitute 44 percent, 680 emergency cases were recorded in the hospital and about 27
emergency cases were attended by the surgical section per month. In the Medical
section, on an average 2625 out-patients and 4210 in-patients have been registered per
month. As regards the Pediatric section, registered number of children is 25,500 in the
year 2007-2008. Four beds are available for newborn care. The total number of patients
admitted in the Pediatric ward during the year 2007-2008 was 1819. Particulars of
Diagnostic section collected shows that during the last three months, a total of 3580 OP
patients were diagnosed. Facilities like X-ray, Ultrasound, and ECG are available in the
hospital.
Human resources of the hospital are adequately filled. One Hospital Superintendent, six
medical specialists, Four surgeries specialists, six Gynecologists, four Pediatricians, six
Anesthetists, one Radiologist, four General duty doctors, one Psychiatrist, four ENT

186
Surgeons and Ophthalmologists, three Orthopaedicians, and two Dental surgeons are
posted in the district hospital. Altogether fifty one vacancies in various positions are
vacant. In the administrative section, one Manager and one office Superintendent two
drivers and two Peons are posted on a regular basis.
The Rogi Kalyan Samitis are functioning well in the district at all levels with the
participation of PRIs and corrective measures are adopted through the feedback
mechanism operated by suggestion boxes. The feedback mechanism is operated through
a complaint box placed at the hospital. Complaints and suggestions received through the
complaint box are discussed in the RKS meeting for its redressal .The board showing
the number of members and number of meetings of RKS is not displayed in the
hospital.
The utilization of Government facilities has improved and the community is aware of
the preventive measures towards the outbreak of various diseases. The respondents have
reported satisfaction over the services at Government health facilities. Most of them are
aware of various family planning methods. The family welfare programmes were more
focused at PHCs and SCs in the district. The supply of emergency contraceptives and
IUDs has to be ensured at PHCs and SCs. The ANMs need to be trained for the
insertion and removal of IUDs so that the service can be provided at Sub Centre level.
There is a need of awareness creation programmes at village level as fourteen percent of
the eligible women were not aware of spacing methods. 10.3 Community Health Centres
The selected CHCs for the evaluation of NRHM from Kozhikode district are Kuttiyadi
(the only one CHC functioning on 24*7 basis and functioning as FRU in Kozhikode
district) and Thalakulathur CHC. Population served by Kuttiyadi CHC is 2,27,219
persons and that of Thalakulathur Community Health Centre is 1,51,700. Distance
from Thalakulathur to the District hospital is 12 km and the time taken to reach there is

187
40 minutes whereas from the farthest CHC (Kuttiyadi centre) to the District hospital is
65 km and it will take 2 hours to reach there.
As regards facilities, Kuttiyadi CHC has better facilities than Thalakulathur CHC. Most
of the facilities are available except ultrasound scan facility in Kuttiyadi centre.
Thalakulathur CHC does not have enough number of beds, generator, ambulance
service, ECG, X-ray and ultrasound facilities. Even though Operation theatre (it is also
used for gynecological purposes) and labour room are available there are no separate
areas for septic and aseptic deliveries and new born care corner. The two centres are
maintaining record for JSY beneficiaries.
Separate public utilities (toilets) for males and females, emergency room/ causality
facility and a waiting room with adequate sitting place for patients are available only at
Kuttiyadi centre. Regarding the status of cleanliness of OPD, both the
compound/premises and room/wards are in a good condition at Thalakulathur CHC,
while the condition at Kuttiyadi CHC is only fair. Prominent display boards, regarding
service matters are displayed in local language at the two centres.
The posts of General surgeon, Physician, Obstetrician/ Gynecologist, Medical Officer
trained with short term obstetrics course, Paediatrician, Anesthetist and eye surgeons
have not been sanctioned in the two selected CHCs. One physician and two
gynecologists at the Kuttiyadi CHC and two pediatricians in Kuttiyadi and one in
Thalakulathur have been recruited (through NRHM) on contractual basis. Nine General
duty Medical Officers in Kuttiyadi and four in Thalakulathur are present.
There are twelve Public Health Nurses in Kuttiyadi CHC but in Thalakulathur centre,
there is no such post. The sanctioned posts of Lady Health Visitor (LHV), Block
Extension Educator (BEE), ANM/JPHN, staff nurse, pharmacist/ compounder, and
Ophthalmic Assistant in the two centres are filled on regular basis. In addition to three
sanctioned posts, two staff nurses have been posted on contractual basis in
Thalakulathur centre.

188
With regard to specific services rendered by CHCs, Kuttiyadi CHC is functioning on
24*7 basis and functioning as FRU, have the facility of emergency care for sick
children and provides full range of family planning services. All the above facilities
have not been available in Thalakulathur CHC. Services like AYUSH, VCT centre,
cataract surgery have not been performed in the selected two CHCs. Treatment of
RTI/STI and Dots have been performed Kuttiyadi and Thalakulathur CHCs.
Details of the status of some specific interventions performing in the selected CHCs
reveals that IPHS facility survey has not been carried out in the selected CHCs. Both the
CHCs have registered Hospital Management Societies instead of Rogi Kalyan Samiti
and generate resources through user fees and is being utilized for local use. All standard
treatment guidelines and protocols are available in Thalakulathur CHC, but not in
Kuttiyadi CHC.
Residential facilities are available for doctors and other staff in both centres. The
facilities for testing of blood grouping, testing of bleeding time and clotting time, RPR
test for syphilis and rapid test for HIV are available only in Kuttiyadi CHC. Facilities
for haemoglobin test, blood smear examination for malaria parasite, blood sugar testing,
urine test and rapid test for pregnancy are available in both the selected CHC.
Laboratory testing facility of RTI/STIs is not available in the selected CHCs. During
the last 3 months prior to the survey, more number of laboratory tests has been
conducted in Kuttiyadi CHC and so exhibits far better performance than Thalakulathur
CHC.
Surgeries performed in the two CHCs during 2007-2008 reveals that 342 cases of
tubectomies were carried out in Kuttiyadi and no Caesarean Sections deliveries were
conducted in the two centres. The selected centres have no general surgeon or
anesthetist. Kuttiyadi centre has two gynecologists. Performance of Kuttiyadi CHC is
far better in conducting deliveries. Thirty four neonates have been resuscitated here.
The nearness of Kozhikode Medical College, District Hospital and Women and

189
Children Hospital to Thalakulathur centre could perhaps be the reason for poor
performance in Thalakulathur centre.
Availability of equipments and drugs have also been evaluated. Though Boyles
Apparatus is available in Kuttiyadi CHC it is not in a working condition. ECG Machine
is also available there and is in working condition. Cardiac Monitor for operation
theatre, Defibrillator and Ventilator for OT, OT Care Fumigation Apparatus, Gloves
Dusting Machines, MVA Syringe and Baby Incubator are not available in both the
centres. Phototherapy Unit is available in Kuttiyadi centre. Kuttiyadi CHC is equipped
with the management of some special services such as wounds, fracture, bites of snake,
scorpion and dogs, burns and RTI/STI problems. Thalakulathur centre do not report
managing cases of poisoning snake or scorpion bite.
Total ANC registration for one month is 323 in Kuttiyadi and 272 in Thalakulathur.
There are 121 and 82 ANC cases of JSY card holders in Kuttiyadi and Thalakulathur
respectively. In Kuttiyadi centre, 293 ANC completed IFA prophylaxis cases were
reported. All the 30 cases of pregnant women with obstetric complications attended in
Thalakulathur CHC have been referred from PHC/SHC. In Kuttiyadi CHC, 93 cases of
institutional deliveries were performed, out of which 17 were JSY cases.
Performance of CHCs with regard to immunization is better in Thalakulathur CHC.
Total number of infants who were given BCG and DPT3 during one month prior to the
survey is almost double in Thalakulathur than Kuttiyadi. Total number of IUD
insertions is almost the same in both CHCs. Number of indoor patients is much high in
Kuttiyadi CHC (854 as against 26). The total number of new TB cases enrolled for
DOTS in Kuttiyadi and Thalakulathur centres is one and four respectively and separate
caste list is not available in the aspect.
The average male OPD attendance is 62 in Kuttiyadi and 26 in Thalakulathur. Similarly
the average female OPD attendance is 82 in Kuttiyadi and 42 in Thalakulathur.
Average OPD attendance of Children in Kuttiyadi and Thalakulathur are 30 and 20

190
respectively. Out of these, 12 cases are referred from PHC/SHC in Kuttiyadi centre and
the same average for Thalakulathur CHC is not available.
10.4 Primary Health Centres
The four PHCs under study are Velam, Narippatta, Kakkodi and Iruvallur. On an
average 3 Sub Centres are there for the PHCs under study. The average population
covered under selected PHCs is 32688. The average distance of the PHCs to the nearest
Sub Centre is 4.3 km. The average time taken to reach nearest Sub Centre from PHC is
13.8 minutes. The average distance of farthest Sub Centre from PHC is 8.5 km and the
average time taken to reach the farthest Sub centre is 22.5 minutes. Average distance of
CHC from the PHC is 8.5 km.
None of the PHCs under evaluation had been functioning on 24*7 basis and were not
equipped to provide basic obstetric services. Also none of them had beds for in-patients.
Three out of the four PHCs were working in designated Govt. buildings, the PHC at
Iruvallur is put up in a single room. None of the PHCs under study had a labour room
and so no facilities for delivery and newborn care. All the PHCs had pharmacy for drug
dispensing and drug storage. Three of the PHCs with own buildings had OP rooms/
cubicles. All the four PHCs had telephone, computer and regular electricity in all parts.
But none of the centres had a standby facility. As far as the status of cleanliness is
concerned, all the PHCs except one were found to have good cleanliness in OPD, in the
wards/ rooms and in the premises/compound.
All the four PHCs had one Medical Officer each on a regular basis. Similarly all these
centres had one pharmacist each regular in position. The PHCs had four posts of JPHN
on an average. None of the PHCs had posts of AYUSH Medical Officer, Lab
technician, Lab assistant, driver, staff nurse, block health education and information
officer and statistical assistant. No Medical Officers of the PHCs under evaluation had
undergone trainings on safe abortion, newborn care, skill birth attendant training, and
pre service IMNCI. IPHS facility survey was not done in any of the PHCs under study.

191
With regard to availability of equipments, all the four PHCs owned thermometer and
water purifier in working condition. Examination table and sterilization equipment were
available at all the PHCs except Iruvallur. None of the PHCs under study had patient
trolley, delivery table, wheel chair, stretcher/trolley, oxygen cylinder, suction apparatus,
infant warmer, radiant warmer cradle, bag& mask, laryngoscope, oxygen mask,
microscope and auto analyzer. No stock out had been reported for IFA tablets, oral pills,
vitamin A, measles vaccine, ORS, Albendazole tablet, Cotrimoxazole syrup,
Paracetamol syrup and DOTs drugs in all the PHCs in the six months period preceding
the survey. Maethergin tablet, Oxytocin injection, Magnesium sulphate, Partograph,
MVA syringe, Ringers Lactate and Haemoccele were the drugs not available in all the
PHCs in the six months period prior to the survey.
The average number of ANC cases registered per PHC was 53. The JSY cases
registered on an average per PHC per month was 15. Thirty seven cases of first
trimester registrations on an average were done per PHC. Average number of ANC
given TT1 per PHC was 42, ANC given TT2+ booster was 41 and infants given
Vitamin A per PHC was 21.
As regards in-patients and out-patients, no PHC under study had facilities for indoor
patients and so no patients were admitted in the centres as inpatients. On an average
1054 out patients were registered monthly per PHC under study. Number of TB cases
enrolled per month was highest in Velam (3) followed by Iruvallur with 2 cases. In
Narippatta and Kakkodi one case each were enrolled. No new leprosy cases were
registered for MDT in the PHCs under study. Maintenance of registers was good as all
the PHCs maintained Antenatal register, Eligible-couple register, Post-natal care
register, Family Planning register, Birth and Death register, Immunisation register,
Meeting register and JSY register. Post-natal care register and Untied-fund register were
not maintained in Narippatta PHC.

192
10.5 Sub Centre
Evaluation of Sub Centres based on information provided by Junior Public Health
Nurse pertains to 10 out of the twelve SCs selected as 2 centres do not have JPHNs.
Data on basic facilities were collected from male health workers of the respective 2 Sub
Centres. Even though a Sub Centre is supposed to serve 5000 population, three of the
Sub Centres in the sample serve a population of more than 12000 and the average
number of population per Sub Centre is 8525. The distance from the farthest village to
Sub Centre is 6.5 km, from Sub Centre to PHC is 4 km and from SC to CHC is 11 km.
Average number of ASHA workers working in the Sub Centre area is 7.
More than eighty percent of the Sub Centres are working in government buildings. In
most of the centres, IPHS Facility Survey was not done. Only 2 Sub Centres has piped
water facility, but majority have regular electricity supply. Soak pit is the main type of
sewerage system. Majority of Sub Centres bury the waste in a pit. Half of them have
quarters for ANM. In cases of non occupancy, main reasons are security reasons and
lack of water or power facility. Male health worker is available in four Sub Centres.
And one Sub Centre has an additional ANM on contractual basis.
As far as facilities are concerned, there is no labour room facility in any centre. Hence
no deliveries are conducted in any of the Sub Centres. More than 75 percent of the Sub
Centres have Haemoglobinometer, BP Apparatus, Weighing Machine, Thermometer
and Fetoscope. Vitamin A and ORS is available in all centres. Pregnancy Test Kit and
disposable gloves are available in 75 percent Sub Centres. Tab. Flucanazole Vaginal,
Tab. Misoprostal and Tab. Oral pills are available in more than 90 percent of the Sub
Centres. Cent percent of the ANM report the registration of pregnancy within three
months and carried out specific examinations like Blood Pressure, Hemoglobin, and
Urine tests. All ANMs identify high risk pregnancies in their area. Only 20 percent of
the ANM has been trained on the insertion or removal of IUD A380. Average ANC
registered during last 3 months is 45 out of which 29 were registered in the first
trimester itself. Six cases on an average per centre are identified as high risk cases.
193
Out of the 10 ANMs interviewed, a major proportion maintains household survey
register, antenatal register, family planning register, immunization register, meeting
register and untied fund register. All ANM are aware about the amount given for JSY
beneficiaries with respect to institutional delivery and for transportation. All the ANMs
reported that the amount given under JSY to beneficiaries is given in cash and a large
proportion are given the payment within a week. There is no transport support for
shifting of cases of beneficiaries available from any Sub Centre to respective PHC or
CHC. On an average, 14 cases of JSY were registered in last 3 calendar months per Sub
Centre. Average cash disbursed in last 3 calendar months for JSY cases is Rs.8340 per
centre. Transport costs amounts to 262 on an average and amount given to ASHA is
5545. No cash is disbursed for home delivery in the area as there is no home delivery.
Majority of the ANMs interviewed received untied grant and all of them reported that
they had spent the amount and have a joint account with the panchayat member in their
area. All Sub Centres maintain a register to record the decisions taken to spend the
untied fund.
10.6 Household Characteristics
The survey collected information on household characteristics from 1200 respondents.
One in four respondents is aged 30-39 years, about a quarter are from 40-49 year age
group and those aged 60 years and above constitutes almost 16 percent. More than
three-fourths of the respondents are females. Nearly half of the respondents have 10
years of schooling or more, 28.2 percent have 5-9 years of schooling. Only a small
proportion of the respondents selected are illiterate. More that four-fifths are currently
married. A large proportion of the household population selected for the survey in
Kozhikode district belongs to Other Backward Communities (OBC), only 1.5 percent
are scheduled tribe and 5.4 percent are scheduled caste. Hindus account for 70 percent,
followed by Muslims (26.8 percent) and the rest are Christians.

194
Two-fifths of the households selected for the survey have BPL status. With regard to
household amenities, more than three fourths household population lives in pucca
houses. Majority of the households have electricity (90.6 percent), proportion with
toilet facility constitute 97.4 percent but those with piped water facility constitute only
11 percent. Two-fifths of the households have LPG/Biogas for cooking, more than two-
thirds have mobile phones and colour/black and white television. About 83 percent of
the households own agricultural land. The standard of living is low only in 8.7 percent
of the households. The number of households interviewed that had living children born
in the last five years adds up to 454 children and all were institutional deliveries.
The general sense of hygiene of the selected household population appears to be good
because majority of the households selected dispose the waste generated either by
burning or burying in pit. This proportion does not vary between households located in
the Sub Centre HQ wards and those households located in other wards. Cent percent
instances of mosquito breeding exists in 4 percent of the households where presence of
stagnant water is reported, especially in households located in Sub Centre Head Quarter
Wards.
The systems of medicine people in Kozhikode district mostly prefer is Allopathy (98.7
percent) followed by Ayurveda (41.4 percent) and Homeopathy (32.8 percent). Only a
small proportion (about one percent) of the people report using Yoga and Naturopathy,
Unani or Siddha. Nearly half of the respondents take serious patients to District/Sub
District hospital (47.4 percent) for treatment of serious ailments. The proportional
response is slightly greater among households located in Sub Centre Head Quarter
Wards (50.7 percent) that those households located outside the Sub Centre Head
Quarter Wards (44.2 percent). Two-fifths use the services of the Kozhikode Medical
College. Only 18 percent of the respondents said they take serious patients to CHC.
The mode of transport used is private vehicle (98 percent) which includes those hired
(car, jeep, trucker etc) and owned vehicles.
195
In Kozhikode district, only about half of the respondents have heard of NRHM
popularly known as „Arogya Keralam‟ in the state. An important source of information
to these respondents has been the radio/television (71.2 percent). Only 2 percent have
heard about NRHM from ASHA. Only just over one-third of the respondents have
heard about ASHA in households located in wards other than Sub Centre Head Quarter
Wards. Among those who have heard about ASHA, half the respondents said that
ASHA held discussions about hand washing, about 42 percent said that she held
discussions about constructions of household toilets and 55.4 percent reported of
discussing about safe drinking water.
Nearly one quarter of the respondents report the presence of the Village Health and
Sanitation Committees (VHSC) in their village. The frequency of Village Health and
Nutrition days organized in the district is reported to be monthly by half the respondents
(50.8 percent), as quarterly by 36.7 percent and as annually by 10 percent of the
respondents. More respondents from household located in Sub Centre Head Quarter
Wards report of frequent monthly meetings whereas more respondents from households
located in wards other than the Sub Centre Head Quarter Wards report quarterly
meetings.
JSY scheme is known to about 82 percent of the respondents. Awareness is slightly
better among households located in villages outside the Sub Centre Head Quarter
Wards. One important source of information is the radio/television (70 percent)
followed by Anganwadi workers (15 percent), hoardings at SC/PHC (14 percent). Only
8 percent of the households have a beneficiary of JSY scheme in the district.
The age distribution of beneficiaries shows that about 44 percent of the beneficiaries are
aged 20-24 years and 40.5 percent in the 25-29 year age group. Two-thirds of the
beneficiaries are in their second parity and the rest are of third parity or more. About
three-fourths of the beneficiaries belong to Other Backward Communities and 16.5
percent are Scheduled Castes. Majority of the respondents are Hindus (91 percent) and
the rest are Muslims (9 percent). One in two beneficiaries belongs to medium standard
196
of living category, one in three is from high standard of living category and the rest 15.2
percent are in the low standard of living group. The place of last delivery among cent
percent of the beneficiaries was a health institution.
About 83 percent of the beneficiaries had heard about the JSY scheme during
pregnancy and the rest before their pregnancy. More than half of the beneficiaries are
aware of the stage of pregnancy when a person should be registered in the scheme.
Among the JSY beneficiaries, 56.5 percent got registered during or after their fifth
month of pregnancy. ANM/ FHW was the person who registered the most of the
beneficiaries to the JSY scheme, anganwadi workers did the job of registering in almost
one-third of the cases, and the role of ASHA in this regard is less than 10 percent. The
place of registration was the PHC in nearly two-fifths of the cases, Sub Centre in 15.2
percent of the registrations. Among the registered beneficiaries, more than half received
the JSY card. The role of ASHA worker in helping the beneficiary receive the JSY card
is visible in 22.2 percent of the registrations. Only 4.8 percent of the beneficiaries
reported of facing difficulty in getting the card.
The role of ASHA during pregnancy of the beneficiaries was reported by only 16.5
percent. ASHA is said to have given advice on diet to less than 20 percent of the
beneficiaries, over 10 percent received advice on danger signs of pregnancy and
delivery care, around 10 percent on breast feeding, new born care and family planning.
The date and place of next checkup and expected date of delivery was informed to
majority of them.
The place of delivery of almost 95 percent of the beneficiaries was District/Sub District
hospital. About 71 percent of the respondents opted institutional delivery because of
the better access to it, 65.8 percent valued the better care for mother and new born child,
20.3 percent considered the services in the area.
In the district, only 28.2 percent of the beneficiaries said that they received referral slip
from ASHA. The average distance to the ultimate place of delivery from the

197
beneficiary residence was 32 kms. The mode of transport used by 89 percent of the
beneficiaries was private vehicle (own or hired). Majority of the beneficiaries reported
that friends, relatives and family members facilitated the transport and in cent percent of
the cases relatives and friends accompanied them to the place of delivery. About 94
percent of the beneficiaries had money to pay for the transport service. The average
amount spent on transportation was Rs. 164.30. The average amount received under the
JSY scheme was Rs. 522.80. The average waiting time until some health staff attended
the beneficiary is 23 minutes. Normal delivery accounted for 78.5 percent. On an
average they spent 7.2 days in the health institution till discharge. About 21.5 percent
had to pay at the health centre for the delivery, the average amount being Rs. 2119.
Almost 61 percent were satisfied with the services provided to them. The reason for
non-satisfaction among a small proportion of the beneficiaries was rudeness of the staff
during their staff in the health institution. No home deliveries were reported among the
JSY beneficiaries.
All the beneficiaries reported that they received the cash incentive. The average amount
they received was Rs. 823.00 and they received the money as one time payment either
through the ANM or from the Office. The timing of receipt of the cash incentive is
found to be varying. The beneficiaries received the amount mostly at the health
institution. Nine percent reported of facing difficulty in receiving the money.
Utilization of Government health Facility in the last 6 months was reported by 58
percent of the households with no difference among households located in the Sub
Centre Head Quarter wards and other wards in the district. Almost a quarter of the
respondents who availed services at the Government health facility are those in the
prime reproductive ages and another one-quarter are aged 30-39 years. Health
problems among the aged population are visible here for 16 percent of the respondents
seeking treatment in Government health facility are aged 60+ years. Females dominate
in the number seeking treatment. Over two-fifths of the respondents who availed service
from a Government health facility are educated with 10+ years of schooling and another
30.5 percent have 6-9 years of schooling. Majority of the treatment seekers in

198
Government health facility are currently married, over four-fifths are from Other
Backward Communities and a small proportion of Scheduled Caste and Tribes. Nearly
71 percent are Hindus, 27 percent are Muslims and 24 percent of the respondents who
availed the services are Christians. Almost half the households are BPL households.
Majority are either from the medium or high standard of living category.
The type of health facility where the respondents went for availing some service is
mainly the District/Sub-district hospital (32.4 percent) and the PHC (37 percent). It is
mostly for treatment of minor ailments that they went to the Government health facility.
Next important reason is child care. Over half of the respondents said that the
behaviour of health staff was courteous, but 47 percent of the treatment seekers felt that
the behaviour of staff as casual/indifferent. Three-fourths of those interviewed said that
the doctor listened to their complaints. Privacy at the place of treatment was reported
by about 71 percent of the women patients but only 41 percent said that medicines are
available for chronic ailments. About 43 percent opine that doctors take up private
practice during duty hours, 10 percent deny such a practice and the rest 46.8 percent are
ignorant of this aspect. Client satisfaction level is good among 56.6 percent and 41
percent were somewhat satisfied. About 53 percent were satisfied with the behaviour of
the staff at the Government health facility and almost 45 percent somewhat satisfied.
Among the respondents who availed services from a Government health facility in the
last 6 months, more than half claim the user fees were charged from the users for
registration or other services like x-ray, ultrasound and lab test. Over 85 percent opine
that they got receipt for their payment.
BPL patients who were provided free/subsidized services account for 66.5 percent of
the BPL respondents. Only 5 percent said that they faced problems in paper work for
free/subsidized services. The Rogi Kalyan Samiti (RKS), introduced in NRHM is seen
to have facilitated the paperwork in only 9.5 percent of the BPL respondents while 38
percent deny this aspect and over half of the BPL respondents are ignorant of who did
the paper work for them.

199
General morbidity status is good in that outbreak of malaria, measles; gastroenteritis
and jaundice was reported by only a few respondents. Awareness and practice of
preventive measures adopted by the respondents to keep away the common childhood
diseases are also good. The preventive measures adopted for diarrhoea are hand
washing as reported by over two-fifths of the respondents, about 88 percent of the
respondents opine that they use safe food and water, 53.3 percent cover the food
containers, 23.5 percent practice proper disposal of garbage and only about 8 percent
are ignorant about preventive methods.
The most important action taken by the household if a member of the household had
fever lasting for one week or persistent cough for 2 weeks or loose motion for more
than 24 hours or persistent cough with breathing problem is taking the patient to a
nearest health facility (around three-fourths of the respondent). Another measure
frequently adopted is taking the patient to a Registered Medical Practitioner (around
half of the respondents). Respondents try home remedies more in case of loose-motion
than other illness considered. Respondents also report doing blood testing for malaria
in case of fever (9 percent) and sputum testing (22 percent) in case of persistent cough.
Information was also sought on family planning methods and HIV (AIDS). Those on
family planning methods pertain mostly to awareness of family planning methods in
general, spacing methods and respondents view of ideal number of children. Eighty
seven percent of the respondents are aware of different family planning methods.
Majority of those interviewed feel that the ideal gap between the first and second child
is 3 or more years and the spacing methods known to the respondents are IUD (61.5
percent), Oral pills (49 percent) and Nirodh/Condom (60 percent). About 14 percent of
the respondents are ignorant about the spacing methods.
Majority of respondents (96 percent) have heard about HIV (AIDS). Eighty eight
percent of the respondents know that AIDS is transmitted through sexual contact, nearly
67 percent are of the view that sharing needles and syringes can transmit AIDS. Only 9

200
percent know that it is transmitted from mother to child. Misconceptions on the modes
of transmission still prevail in the community in small proportions (among 2 percent).
Source of information on HIV/AIDS among nearly three-fourths of the respondents is
the television, 54 percent heard about AIDS from radio, news papers form an important
source among 52.2 percent. Health workers were the source of information of AIDS
among 23 percent. Only 16.4 percent of the respondents have heard of counseling
centres / VCTC. Among those who are aware of these centres, 45.7 percent of the
respondents said that these centres are located in district hospital, 8.6 percent said it is
located in the sub district hospital.
10.7 Status and Performance of ASHA
An account of the status, role and performance of ASHAs in the selected areas
evaluated in the present study shows that most of the ASHAs were selected based on
their experience as Mahila Swasth Sankh(MSS) and Kudumbasree worker. ASHAs
interviewed were received at least one module of training. However no ASHA received
any ASHA kit.
The survey points out that in the district, forty eight percentages of the ASHAs under
study were DOTS providers at the time of interview. Regarding their role in Janani
Suraksha Yojana (JSY), during the last three months ASHAs facilitated around 3 cases
per month. ASHAs handled children with diarrhea by giving ORS, accompanied
institutional delivery cases, provide medicines to patients who are accommodated in
Mahila Mandir, identified number of pregnancies in their area, arranged health and
nutrition day etc.
ASHAs received a sum of rupees 497 as Cash incentive for facilitating cases like JSY,
sterilization, Village Health Nutrition Day(VHND) etc. ASHAs reported of facing
many difficulties like non availability of fund in time, inadequacy of training, delay in
the supply of drugs etc. The difficulties support the requirement of more training and
timely availability of fixed remuneration for ASHAs. The awareness of ASHAs on
201
different health related aspects like prevention of diarrhea, ideal time for initiating
breast feeding and need of exclusive breast feeding etc were found to be good.
10.8 Role, Awareness and involvement of Gram Panchayats
The study covered 24 Gram Panchayats in the district. Average population covered
under the Gram Panchayats is 31,401 out of which average scheduled caste population
is 3,606 and the Scheduled tribe population is only 68. Among the total 6,858
households, the number of Scheduled caste households is 509 and that of scheduled
tribe is 27. A total of 2,951 BPL families are there in the selected Gram Panchayats, of
which the number of scheduled caste families is 345 and the corresponding number of
scheduled tribe families is 19.
In most of the Gram Panchayats ANMs are regularly available and Sub Centres provide
timely service to the patients. Majority of the Gram Panchayats had role in conducting
IEC programmes. Village Health Sanitation Committee (VHSC) existed in majority of
the GPs. More than 90 percent of Gram Panchayats conduct regular meeting of VHSC.
In about 74 percent of Gram Panchayats village health plan has been prepared by
VHSC. Most of them reported the VHSC has received untied fund. All of them have
ASHA worker in their area. Majority reported that NRHM has brought about
improvement in their area. Most of the Panchayats received funds for the maintenance
of Sub Centres.
As ASHA is expected to be a fountain head of community participation in public health
programmes in her village, she gets community support for effective functioning of
her work. More than half of Gram Panchayats received funds under JSY. In about 61
percent of the GPs the improvements are in terms of better facilities available for
referred patients in CHCs/PHcs.
Difficulties in the implementation of NRHM Programme activities do exist by way of
non availability of funds in time, decision making problems with the community

202
leaders, inadequately trained ASHAs and lack of facilities for institutional deliveries. So
Gram panchayat require more funds for effective functioning, they also wish to be given
direct control over funds. They also suggested that more training should be arranged for
ASHAs and community members dealing health care activities.
10.9 Quality of Care and Client Satisfaction
The quality of care and client satisfaction assessed in the survey is based on the data
collected from the in-patients and out-patients exit from the hospital after discharge or
treatment. The sample was taken from every third patient exiting from the hospital after
treatment or discharge. A total of 32 in-patient and 73 out-patient interviews were
carried out from the District hospital (Beach hospital) Kozhikode, CHC Kuttiyadi, and
CHC Thalakulathur and 2 PHCs
10.9.1 IPD facilities
Age distribution of the in-patients highlights the health problems of the aged population
for nearly two-fifths of the in-patients are aged „60 years or more‟. Inpatients in the
prime reproductive age group 20-29 years form 18.8 percent. Three in five in-patients
are females. About three-fourths are currently married. More than four-fifths are from
rural areas.
More than two-thirds of the in-patients sought treatment from CHC‟S, and the rest from
district hospital. Minor illness, delivery, child illness and other diseases are reasons for
seeking admission in the district hospital, and CHC‟s. Delivery and child illness
contribute only10 percent each in District hospital. No cases of FP surgery and Cataract
surgery in both District hospital and CHC are reported.
Average waiting time assessed in minutes for various formalities in different types of
health facility showed that the time taken to get discharged (one hour) from the health

203
facility on an average is more compared to other formalities. In-patients reportedly
wait nearly half an hour on an average for doctor‟s call and around 10 minutes for other
services like getting admission to ward, for registration, for doctor‟s examination or
getting other services. Both, waiting time for doctor‟s call and time for doctor‟s
examination are comparatively lesser in District hospital than in CHC. Patients in the
District hospital have full satisfaction regarding the waiting time for registration
whereas 18.2 percent of patients in CHC complain the waiting period for registration to
be too long. Two-fifths of the in-patients reported waiting time for Doctor‟s call in
CHCs to be too long.
The behaviour of Doctors, Nurses, Technical staff, Ayah, Ward boys and Counter clerk
towards the in-patients in District hospital and CHC were assessed. No patients report
any type of rude, arrogant, negligent or indifferent attitude from any of the above
mentioned staff they meet in the health facility. All the patients in the District hospital
and CHC‟s agree that the doctors greet in friendly manner. All are of the opinion that
the behaviour of Technical staff, Ayahs, Ward boys and the Counter clerk is good/very
kind.
Privacy at the place of doctor‟s examination room is needed for the patients to convey
about all the symptoms regarding their illness. When majority of the in-patients from
CHC‟s got privacy at the time of doctors examination in District hospital only half the
in-patients felt that they get privacy. With regard to patient-doctor communication and
how effectively the interaction is accomplished, all the patients in the District hospital
have the complaint that the doctor did not listen to the ailment patiently. The situation in
CHC is slightly better. Majority of the in-patients at the District hospital are not even
allowed by the doctor to ask questions. But in CHC, around 41 percent of the patients
are allowed to ask questions. When all of the questions raised by the patients in District
hospital went unanswered, over one-third of CHC in-patients feel that they got proper
reply from the doctors. Four out of five inpatients in district hospital and over two-
thirds of them in CHC said that the doctors talked about the recovery from disease.

204
Space constrains resulting from over crowding and related problems constitutes an
important aspect in modern health care. All the in-patients report that cots are available
even at the time of admission up to time of discharge in both District hospital and CHC.
Only 13.6 percent of the CHC patients complain about space inadequacy in CHC.
Dissatisfaction regarding the ward arrangement in the district hospital and the CHC
among some in-patients are evident.
As regards facilities available, District hospital does not have any television but there is
canteen facility, medical shop, telephone, accommodation for relatives and ambulance
service. The CHC on the other hand has a television and the other facilities mentioned.
Satisfaction level varies with the availability of facility but in general, satisfaction level
is more among patients in the District hospital. All the patients in District hospital and
86.4 percent of in-patients in CHC said they would come again in case they fell sick and
all the in-patients invariably said they would recommend the respective facilities to
other people.
10.9.2 OPD facilities Among the 73 out-patients interviewed, about one-third are aged 30-39 years followed
by those aged 60 years and above. Two thirds of the in-patients are females and four
out of five are currently married. All the respondents are from rural areas. Around 59
percent of the in-patients seek treatment from PHC‟S, about 27 percent from the CHC
and the rest from district hospital.
The purpose of visit to District hospital among half the patients is reported as treatment
for minor illness. This proportion is 70 percent in the CHC and 81.4 percent in PHC.
One –fifth of the out-patients visited the District hospital for family planning services.
A small proportion sought treatment for antenatal care and their child‟s illness. No
visits are reported in the District hospital or CHC or PHC for PNC, eye checkup and
MDT-DOTs.

205
The average waiting time is reportedly longer only for doctor‟s examination in CHC
and payment of bills in the District hospital. Out-patients report that the average waiting
time for formalities like registration, injection, getting medicines and dressing of
wounds is less than 10 minutes. Majority of the out-patients are satisfied with the
average waiting time for registration for doctor‟s examination, for injection, getting
medicines, dressing of wounds and paying bill irrespective of the type of health facility
for majority either say that the time for registration is appropriate or is done in very
little time.
In the context of behaviour of staff, half the out-patients, who went to the District
hospital and majority in CHCs and PHCs either fully or half heartedly agrees that the
doctors greets the in a friendly manner. Majority fully concur that the doctor‟s
behaviour is good Also the behaviour of the nursing staff, technician and dispenser are
reported to be either good or very kind.
All the patients visiting the District hospital feel that there is privacy at the place of
doctor‟s examination and that the doctor always listened to description of the ailment
very patiently and allowed them to ask questions. Majority opined that doctor always
responded to their questions and discussed about the ailment and recovery too. The
picture in CHC is slightly different in some of the aspects. Three-fourths of the patients
interviewed totally agree that the doctor listened to description of ailment patiently, and
the remaining one-quarter half heartedly agrees to the statement thereby showing slight
dissatisfaction in the communication.
Complete satisfaction of the patients of all health facilities regarding the cleanliness of
OPD room, examination room, injection room and dressing room were good signs of
quality of care. Very few percent of the patients regarded the dispensary and laboratory
respectively as partially clean, the rest of them are completely satisfied regarding
cleanliness of the facility. Patients were also more or less satisfied with the space
available in the examination room, injection room and dressing room. Fairly good
cleanliness and relatively lesser overcrowding reported give strong indications of the

206
quality of the patient care offered in the outpatient departments. Certain improvements
in space are needed in the laboratory space of CHC for reducing crowding.
In the District hospital and CHC, 30 percent each of the patients are totally dissatisfied
by the visit to the respective health facility whereas no patient of PHC shows such
dissatisfaction. Lack of facilities has been singled out as the major reason by 33.3 and
50 percent of patients in District hospital and CHC respectively for their dissatisfaction.
When 66.7 percent of patients of District hospital do not clearly point out any other
reason for their dissatisfaction. Despite these disagreements all the patients from
District hospital, 85 percent in the CHC and 98 percent in the PHC intend to visit the
respective health facilities if fell sick again. Barring 10 percent of patients in CHC all
others said that they would recommend the respective hospitals to others for treatment.

STATE SCHEDULE
SCHEDULE (S): STATE SCHEDULE
S1o1.5102.
Name of the State
Total Number of Districts
S103. Total Number of Census Villages (2001 census) 6 .4S104. Name of the Respondent T>za• OOM AILLeS105. Designation of the Respondent '3 P, 'A M caJn .
KG R 4L-A,.
l4
Dr.Santhosh
Text Box
APPENDIX 1

STATE SCHEDULE
^^(^ W lK^*+ fl
MO 4
Q. No.
8114 . Name of the Respondent $ S a5115. Designation of the Respondent to, M av ,
Public Health Total New Total No. of facilitiesInfrastructure Existing Buildings Number where IPHS
(In Nos.) Under where IPHS Upgradation(As on Construction facility completed (As on
30.6.2008) ( In Nos.) survey 30.6.2008)(As on completed
30.6.2008) (As on30.6.2008
8116. Sub Centre SO q 4 O O O8117. PHC
q 2c b O5118. 24x7 FHC
I ps- 1 •O5119 . CHC
115' t,3 1 15 -5120 . First Referral
Uni FRU I O G S 08121 . Mobile medical U ..
8122 : Sub Divisional Hop4 41C) p
8123 . District Hospital I $ I O'1 06
5124. AYUSH
^rlKfl Health Total Existing^^.Jftrraat c ( In Nos.) (As on 30.6.2008)
8125. Hospitals(More than30 bedded)
8126. Nursing Homes (Lessthan 30 bedded
Q No ,;,;,,;, . q}y maRy f 4lIF^i' s have Rogi Kalyan Samitles (RKS) Registered?
R 1 Total Functioning No. with Registered RKS3127. District Hospital
1$5128. Sub Divisional Hospital I
45129 . CHC
11 c 11 S$130 . PHC
$ I 18S131 . Block PHC : ;
Ill 1 1
8132 . Addl. PHC0

STATE SCHEDULE
5133. Whether any PPPinitiative undertaken inthe state for theimplementation of JSYScheme?
Response Category I Skip
Yes ....................Q
No ......................2
5134. If yes, number ofprivate health facilitiesaccredited for JSYscheme
> Q. S135
227
Q. No. : Total Institutional Total number of Out of total numberDeliveries Registered JSY of Registered JSYReported... during Women during Women , number of2007-08.. 2007-08 women opting for
Institutional Deliveryduring 2007-08
5135. Scheduledcaste ^^P N A ni ;^
5136 . ScheduledTribe
S137. General
5138. BPL
5139. APL
5140. Total 2 21 S719-
S141 . ScheduledCaste
5142. ScheduledTribe
5143. General
5144. BPL
5145. APL
5146. Total ! 2 -
- T - ;

Q. No. Response Category Skip
S147 . Name of the Respondent .^• 9.ic^NN &cirOQ9^
S148. Designation of the Respondent ^' ,(¢ f e'a n Ce
S149. Have all the vertical health societies Yesr .................................. Ql V b"created under different programmes No .....................................2 Q S152merged in to State Health Societyunder NRHM?
5150. How many districts have mergedrem used health societies?
5151. Is there a common bank account Yes .....................................Ifor all programmes in State Health ..................................NoSociety .
.
$152. Has the perspective Statte'iHealth Yes ..................................... 0Plan been prepared for 200 $0?? No... 2 > Q S155
515,34 How many districts have Districtf he current yearor tAction Plans
(2008-09)?- S154.. . Have . these plans been approved by Yes ...................................
the state society?. Np ................................. ....2
Sin. . allHow are the funds being orated Activity wise..........................A
IelAs fled pool funds .... .........
option,e all applicablenctr• ^ Based on a set formula likesize of district etc..................... C
Based on previous year's1, . expenditure ............................ D AS
.Otters-(please specify)............
5156.. Are the funds being transferredtd thetSthll
es .... .. . ..58a eey by telectronica No ..... ....... .............2 > Q 51
district?
S157. If yes, then to how many districts is
it being transferred electronically?
S158 . How many Sub Centres havef
556 8Operational Joint Bank Account oANM and Sarpanch?
N`o 'of centres for which Untied Grant for the current year transferred? .
S159 . CHC
5160. PHC 939 -
5161. Sub Centre' $J^6 $ -

DISTRICT SCHEDULE
SCHEDULE (D): DISTRICT SCHEDULE
The Interviewer is expected to interact with District NRHM society (Part A) member for collection of district level
information andfollow this up with a visit to the district hospital (Part B)
Part A
D101.
D102.
D103.
D104.
D105.
D106.
D107.
D108.
D109.
D110.
D111.
D112.
D113.
Name of the District
Total Number of Blocks In the District
Total Number of Census Villages (2001 census) in theDistrict
Name of the Respondent
Designation of the Respondent
ScheduledCaste
ScheduledTribe
Others
Total
Populi
ScheduledCaste
ScheduledTribe
Others
Total
o k-to a 4.3k 9 1co
(t"isits(As on March, 20
Kozo- ' Y-2CLe_.12
117
Population Census)
,yn,;1`4
3
user
Text Box
APPENDIX 2

DISTRICT SCHEDULE
Q. No.
D114. Name of the Respondent
D115 . Designation of the Respondent t J a s (DLO V CPublic Health Total New Total No. of facilitiesInfrastructure Existing Buildings Number Where IPHS
(in Nos.) Under Where IPHs U pqradation(As on
30.6.2008 )ConstructionI N
facility Cunlilietad (Aeon8( n os.) (As survey .6.008)
on 30.6.2008) cottt let90(As .0,
0116. Sub Centre 305 o pD117. PHC A " !, 62lr?
0118. 24x7 PHCsO O
D119 . CHC IIl)_ O
D120 . First Referral Units(FRUs) 4 4
D121. Mobile medical unitsO
D122 . Sub Divisional Hospitals 2 0 C)D123. District Hospitals I i
D124. AYUSHtJ
Private Health Infrastructure Total Existing( In Nos.) (As on 30,64008)
0125 Hospitals (More than 30 bedded). -D126 . Nursing Homes (Less than 30 bedded) --
nJ P
Facilities available in the district for deliveryFacility Number of Facilities
Total Operational Providing Providing With New Born Care nitexisting in 240 BeMOC CeMOCthe District ( Having
(As on Blood30.6.2008) Storage,
Anesthetistand
Gynecologist)D127. District y^ .
Hospital
D128. SubDivisional 2 2 I 1Hospital
D129. CHCI1 11 D b
D130. PHC
D131. PublicMaternity oHomes
oi, K'44-a" t ^ e./ 7

JDISTRICT SCHEDULE
D132 . Others Public(ESI, i d p 0 0Railways etc.
D133 . Others Private NA _ _
D134 . Privateaccredited for 2 7
N l .. -BY
`.
$} le i i r strict (I't for a to he'^ ftipm 01sf,i x ems. , za +& ,
Q. No.
Category No.sanctioned
Regular inPosition
ContractualRecruits
Total inPosition
D135. Medical Officer a73 2S4D136. Gynaecologist
D137. Anaesthetist
D138. Paediatrician
D139 . Other Specialists
D140 . Staff Nurses $ 9 6$ 7b
_
D141 . ANM 4lq 4th -
isM° es ( do to be eoljeered, rem DLt/rlci" Prq s'tm' 1R
Q. No.
D142 . Name of theRespondent
D143. Designation of theRespondent ^la^ ncteu vo^S w
Number of facilities having Rogi Kalyan Samities (RKS) Registered?
Total functioning No. with RegisteredRKS
D144 . District Hospital
D145 . Sub Divisional Hospital 2 2
D146 . CHC 1 I
1}147. PHC6 69,
'It ^'° path 1 ' • P4-01 oLuc.^ s
8

DISTRICT SCHEDULE
^^. M^ T ^
^
Npn419 reculleete4 om /! ti{bt pnbyplt' 145Tr
L. .
n.ice. ..x t •. .. ^ . i
Q. No.
Response Category SkipD148. Whether any PPP QKYes .................
initiative being...
No . 2undertaken in the district
.....................Q D 13
for the implementation ofJSY Scheme?
D149 . If yes, number of privatehealth facilities 2 7accredited for JSY .scheme
D150 . Which of the following Lab services ........... . Aareas are covered under
.. .......Diagnostics like Ultrasound &
PPP initiatives (Encircle all X-Rays ..................... Bapplicable options) ......
Bio Medical waste Disposal..C
Sanitation ....................... DSecurity ..........................EHiring of specialist services....FProcurement of Drugs/Equipment ........................GProviding transportation facilityfor delivery & referral cases....HOther .......................................I
Q. No. Total Institutional Total number of Out of total numberDeliveries Registered JSY of Registered JSYReported during Women during Women, number of2007-08 2007-08 women opting for
Institutional Deliveryduring 2007a08
At Govt.Facilities
D151. Scheduled Caste6 3 2 t,al cwoul0.b(A _
D152. Scheduled Tribe 3
D153 . General5 22
D154. APL_
D155 : BPL -- -
D156. Total5 3 0 3 t'S 5 9 E$ g
7
9

DISTRICT SCHEDULE
At PrivateFacilities 9il(Whereveraccredited forservices)
11157. Scheduled Caste
11158 . Scheduled Tribe
11159. General
D160. APL
11161. BPL
11162. Total
,x. x.
Q. No.
11163. Name of the Respondent V'v;v^
11164. Designation of the Respondent c t Uvv) -i
Response Category skip11165. Have all the vertical health Yes .....................0
societies created under different No 2 >Q DI68programmes merged in to a DistrictHealth Society?
11166. Whether the merged district health Yes.... .................society is registered?
No .......................2
11167. Is there a common bank account for Yes ...................... Iall programmes in District Health
No ....................Society
11168 . Whether the district has prepared Yes ......................1District Action Plan for the current No >Q DI 70year?
11169 . If yes, has the plan been approved Yes ......................1by the district society? No ....... 2... ............
10

D170.
D171.
D172.
D173.
.D174.
D175.
How are the funds being receivedfrom the State in the district(Encircle all applicable options)
Are the funds received weretransferred electronically by theState
How many Sub Centres h aveOperational Joint Bank Account ofANM and Sarpanch?
No. of centres for---which Untiedtn ed
Grant for the current yeartransferred?
DISTRICT SCHEDULE
Activity wise .....................'As flexi pool fltnds..^„Based on a set formula like size fdistrict etc ...................Based on previous year'sexpenditureBased on Annual Action plan ...1Others (pi Specify) ...............FNot aware ....................... ..........a
II
^ d
t0 2 t^w7

DISTRICT SCHEDULE
DISTRICT SCHEDULE
Part B
District Hospital
The infrastructure details to be supported by digital photographs of the faclllty and other pteas like operationTheater, wards, pharmacy, lab etc
„ etail tk.f h or ^tio to be co apt d from ilia Of Medical
Q Qu iods ' for both Marinate)D176 . Name of District Hospital -
^^ 16 ND177 . Name of the Respondent
D178 . Designation of the Respondent M.s.Distance & Time Taken to travel to District Hospital in pistante ( in Time (inpublic transport from Kme.) Hrs.)
D179 . Nearest CHC in the coverage area13 020 07
D180 . Farthest CHC in the coverage area SDD181 . Distance of District Hos i al rim the Dearest - a in
Kms.)0 .5 -1 Km ............ B>1 Km ....................C
D182 . Has the IPHS facility survey been carried out in the District Yes .......... .........Hospital
t " ical infrastructure Informailon to he callectedfoni the Office ` Medlcaltai tendon! `, theHrs italandsh le observ toens Response Category
D183 . Area of the Hos p ital ( in S mtrs.)D184 . Number of indoor beds available 5S0D185 . Is the hospital located near residential area ? Yes"....,...""'
No, .2D186 . Is necessary environmental clearance obtained from Yes ...................
Pollution Control Board b the Hospital?ital? No ..... ............ 2D187. Whether hospital building is disable friendly as per Yes ........ ........:
provisions of Disability Act? (Ramp, Lift , wheel chair No ..................2movement etc.)
a
1
12.
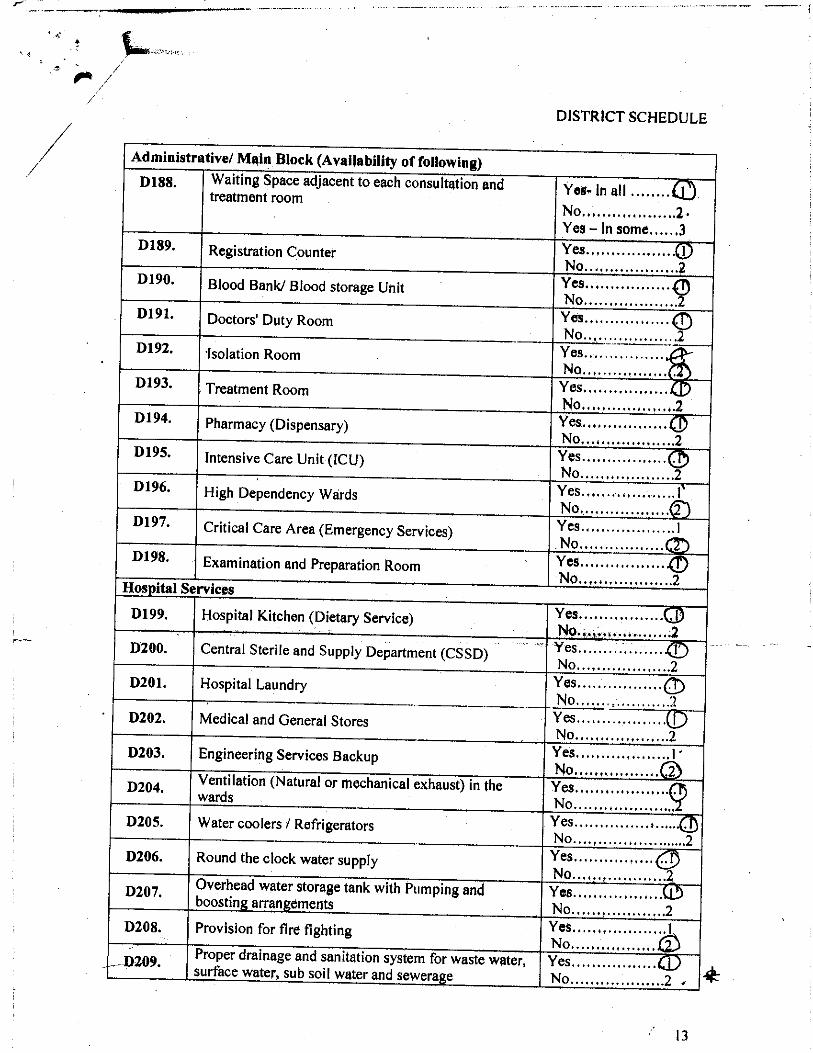
DISTRICT SCHEDULE
aammistrative/ Main Block (Availability of following)D188 . Waiting Space adjacent to each consultation and
Yes- in all .treatment room ,,.,...No.... . . . ............ 2•Yes - In some......3
D189. Registration Counter Yes .................. INo. ..2
D190 . Blood Bank/ Blood storage Unit Yes .................No,
D191. Doctors' Duty Room Yes ................. 40No, _ .2
D192. Isolation Room__
Yes ................No,
D193. Treatment Room Yes ............... ..No ...................2
D194. Pharmacy (Dispensary) Yes,,,,,,,,,,,,,,,,,No.... .,2
D195 . Intensive Care Unit (ICU) Yes .................No: .,. ..2
D196. High Dependency Wards Yes ................... INo. 2
D197. Critical Care Area (Emergency Services) Yes ...................INo.
D198. Examination and Preparation Room Yes ................•No ...................2
Hos ital Services
D199. Hospital Kitchen (Dietary Service) Yes...............•..hNo,,,,, .,,.,.2
D200. Central Sterile and Supply Department (CSSD) Yes .................No. ..2
D201. Hospital Laundry Yes .................0No. .2
D202. Medical and General Stores Yes.................. (?^%No ..2
D203 . Engineering Services Backup Yes ...................I
D204 . Ventilation (Natural or mechanical exhaust) in theNo,,,,,,,,,,,,,,,,, J^b
(fjYes .............wards•......
No .... ................D205. Water coolers / Refrigerators Yes ....... ..............• ,
No. ... ..2D206. Round the clock water supply Yes ..................
D207, Overhead water storage tank with Pumping andNo ...................2Yes .........
boosting arrangements...... •
No. ..2
D208. Provision for fire fighting Yes ...... I
0209 Proper drainage and sanitation system for waste water, Yes ........surface water, sub soil water and sewers e
.........No .. .. ... ............2
13

DISTRICT SCHEDULE
Burled .................A
D210 .How is the Bio Medical Waste disposed ? (Encircle all
li bl i
Incarnation ............. HOutsourced to agencyapp ca e opt ons)
Thrown In open .,,.... D
D211 .Is Bio Medical Waste segregated in three different Yes ................. .
©bins? No ..................
Number of Residential Quarters available for all No. No.medical and Para medical staff Available Occupied
D212 . Medical Staff '4 3 2D213 . Para medical staff
D214 . Parking place Yes .................No. ,.2
D215 . Medical Records Section Yes .................No.' .,.2
D216 .Is the disease classification being carried out as per Yes. ................protocols No ................... 2
D217. Availability of telephone Yes.........."....'No. . ..2,
D218 . Availability of Fax equipment ............ .:Yes . :..No 2
D219 . Availability of Computers Yes ................' 1No ...................2
D220 . Availability of Internet services Yes ................... INO ,,,.;
4
Obstetrics & Gynae Section ( Information to be collected from the Slater In charge of ttynse Ward £supplemented by Observation from records)
D221 Name of the Re ondent. sp
D222 . Designation of the Respondent , Ci VO S
Response Category Skip
D223. Is there a separate Ward for FemalePatients?
Yes .................... 1
No ......................2 >Q D226
D224. If Yes, the number of beds
D225 . Bed Occupancy Rate in the last 12months (As on March 31, 2008) 8
016
D226 . Total OPD in last 3 calendar months 9-4 15D227. Total deliveries in last 3 calendar
months 6 2- 57-
7t I5 Uvs l Rte. "' 30 ^ o Ai any c ^y^v, ar
14

DISTRICT SCHEDULE
D228. Is there a separate OT available forGynaecology & Obstetrics
Yes ....................QNo .......................2
Procedures Carried Out
Particulars
D229. Total deliveries conducted
D230 . Caesarean section deliveries
Availability of Services
Yes ................... I
No .......................2
If Yes, Nuihbers in2007-2008
2325
7CC.If yes, no. done in2007-08
D231. (Caesarean section for JSY
D232. (Assisted Delivery
D233 . Forceps delivery
D234. a4TP
D235. Mid trimester Abortion
D236. IEctopic Pregnancy
D237. atetained Placenta
D238. gciampsia
D239. IPPH
D240. iSterlisation
D241. puturing Cervical Tear
D242 . Hysterectomy
D243. Infertility Treatment
Yes .................... 1No .................. ..2
Yes .................... 0No ..... . ........ ..... ....2Yes ................... .. . INo: .Yes .....................INo ..................... nYes... .... ... . .... ...... .No ...................Yes ......................No.Yes ...................No, .. 2Yes .................. 7-No. .................... .. 2Yes ...................No. ..2Yes ...................... I
.sa3 o,.toa:lobG..
Gm
600
3
alb
Surgical Section (Information to be collected from the Sister in charge ofSarglcai ward 4 supplemented byObservation) 1 2 11 t V-D244 . Name of the Respondent Kow)ojla u alUD245 . Designation of the Respondent
^I8 m e 4tNo. of Surgical -OPD in last threemonths
P D2 66 . Female
D247 . Male
5el' + TO 15

DISTkICT SCHEDULE
Medical Section pp jormgtionby to be collected fom the Sister In chargeObservation) p, .) , jrt IS _ of Medical ward d supplemented
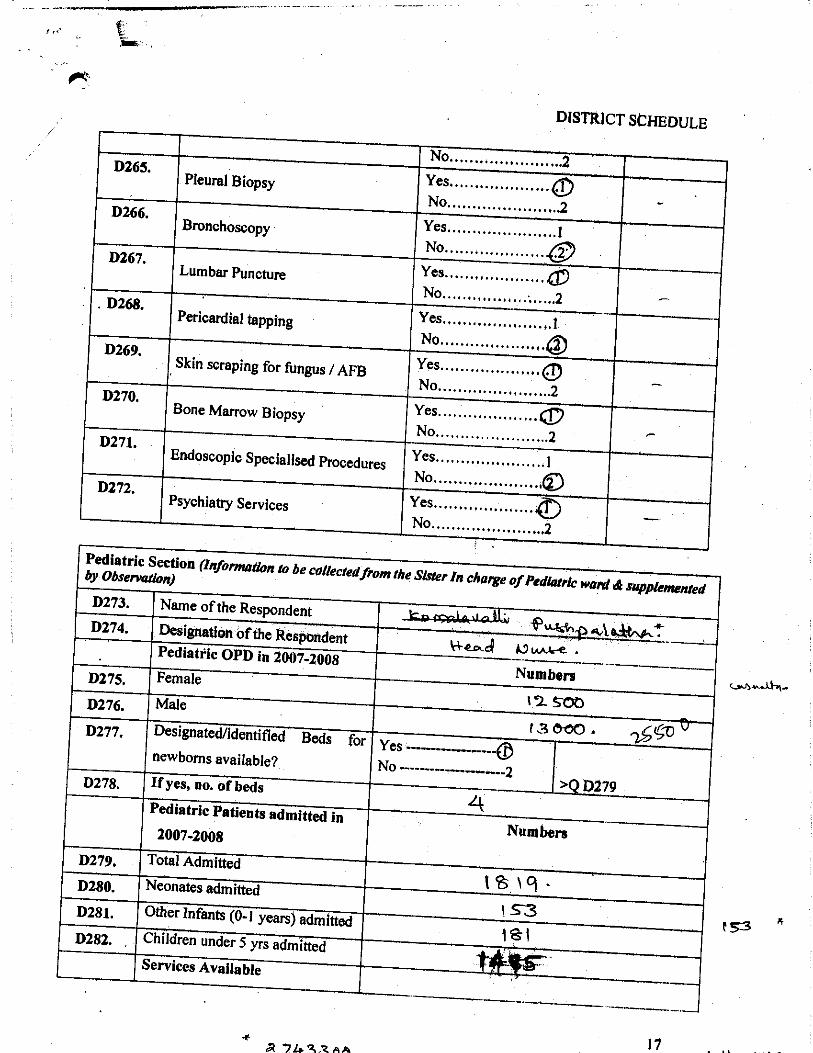
DISTRICT SCHEDULE
Yes ...................No............ 2
Yes .............. . .... . .1No ..................
Pediatric Section (informationby Observation) to be collected from the Sister In charge ofFedlaIrk
* 17a'742,zAa

DISTRICT SCHEDULE
Pediatric Section (Information to be collected from the Sister In charge of Pediatric Ward A supplementedby Observation)
D283 . Asphyxia Management Yes ....................No ................ ..2
D284 . Management of severe Yes ....................malnourished children No , . I .... ..... .12'.
D285. Yes ......................IManagement of Neo Natal SepsisNo ........ :..........2
D286. Management of Dehydration and Yes, ............ .......QDiarrhoeal Cases No .......................2
D287. Management of Respiratory Tract Yes .................... ./ Pnuemonia Cases No .......................2
Available? If available whetherEquipment Available ,working?
D288. Yes..................... Yoe.........Cradle .........No .................. - No .......................
D289. Yes .................... Yes................... QDIncubatorNo .......................2 No ................ , .....2
D290. Yes ....................0 Yes . .Radiant Heat Warmer ... .. .............No .......................2 No .......................2
D291 . Yes ....................Q Yes.................... QPhototherapy UnitNo ........... ........2 No. ...............2
D292, YesBag with MaskNo ........ .........2
D293 . Yes ....................40 Yes....................LaryngoscopeNo ......................2 No .....................2
D294. ... . . ©MaskOxygen. ..... .........
D295. Yes ....................Q Yoe. . QSuction Machine ..... .............No ..... .... 2 No 2......... . ............... ..
D296. Yes . Yes 1Thermometer . , ........ I .........No .............. ......2 No......... ..........2
Availability of drugs
D297 . Yes ....ORS (WHO new formula)
................No .......................2
D298 . Yes DVitamin A Solution ....................No .......................2
18

DISTRICT SCHEDULE
Pediatric Section (Information to be rnUect de from inc Sister /n charge of Pediatr►c ward $ supplementedby Observation)
D299.
D300.Paediatric Antibiotics
Yes ....................No ........ .........M 'FYes ...................
Diagnostic Section (informationto be coUeMedfroth Radiology Section & snpp/etnented by Observation)0301 . Name of th Re espondent
D302. Designation of the Re- spondentDiagnostic OPD in last 3 months
D303.
D304.
D305.
D306.
D307.
D308.
Availability of services
Ultrasound
Ultrasound guided Biopsy
Response Category
Yes .................... QNo ................... 2
Yes ..................... toNo ......................
Yes ........ ..........iceNo.........

DISTRICT SCHEDULE
Lab Services (Information to be collectedfrom the Lab Technician & supp[emented by Observation)D313. Y
11314.
11315.
11316.
11317.
11318.
11319.
11320.
11321.
11322.
11323.
11324.
11325.
11326.
Haematology
Urine Analysis
Stool Analysis
Semen Analysis (morphology,count)
CSF Analysis (Cell count, culturesensitivity etc., gram staining)
Aspirated fluids (cell countcytology)
PATHO ORGY
PAP smear
Split Skin Smear Examination forleprosy
Sputum
Histopathology
Microbiology
Serology
Biochemistry
Physiology (Pulmonary fbnctiontest)
es ...................No .......................2
Yes.............. .. .. . .0No .....................2
Yes .................... .©
No .......................2
Yes................ .. . . .. 1No ... ............d
Yes .....................INo ....................aYes . ..................No ....................
Yes ......................1No ................... cZ
Yes ...................... INo .....................a
Yes ...................No ......................2-
Yes ................No ... . . . . . ... . . . . .
Yes ...................... lNo. .. ......®
Yes ...................
7ScYO .
3 StTt
68
S72
02 et cl^ b )Yes ...................aNo .......................
Yes .............. .......I
No .....................^
a7O^t
Block C. Human Resource (Information to be collectedfrom the Statittics Section gjthe Office ofMedical Superintendent of the Hos it l)p a
11327 . Name of the Respondent11328. Designation of the Respondent Rvo ,
20

DISTRICT SCHEDULE
0
Block C. Human Resource (li{ormatlon to be collectedfrom the SMNstics Seatlon of theMedical Superintendent of the Hospital)OJrTce of
21

DISTRICT SCHEDULE
Block C. Human Resource(14 formation to be collectedfrom the Stattstlcc section the OJaof Office ofMedical Superintendent hojt e Hospital)
D355.
D356.
D357.
D358.
D359.
D360.
D361.
D362.
D363.
D364.
D366.
D367.
D368.
D369.
D370.
D371.
D372.
Dietician
ANM
LHV
PHN 'Ca- 4j-^
Radi ogra her
Pharmacist
Matron
Medical Records Officer /TechnicianAdministrative Staff
Junior Administrative Officer
Office Superintendent
Block D . Other Framework and Structure Related Iasues (Information to be co/%%d /toln theOffice of Medical Superintendent of Ike Hospital)
D373.
D374.
D375.
D376.
Whether the Rogi Kalyan Samitiestablished for the HospitalIf Yes, whether Rogi KalyanSamiti Registered for theHospital?Are there any official charges forconsultation/ procedures?If yes, are people belonging to BPL/SC/ ST exempted/ subsidized?
Response CategoryYes ..................No ................... .. ..Yes......__No ......................2
D382
Yes . ..............No.Yes ....................
D37
No. ...........2
22

DISTRICT SCHEDULE
Block D. Other Framework and Structure Related Issues (In ormatlon to be co NO theOffice of Medical Superintendent of the Hospital)
D377. If yes, what is the procedure for Based on BPL Rationgranting exemption (Encircle all Card . . . .applicable options)
. . . ............... .Based on Certification byhospital authorities/govt ........................Based on recommendation ofRKS................... ..CBased on Financialcompensation byRKS ........................I)Others (please
t}MC . specify) ....................._
a Ce+D378 . How do RKS generate additional Donation ......................A
resources other than govt. grants ? User fees ....................40
(Encircle all applicable options) Other innovative means(through arrangements likePPP, outsourcing of servicesetc. ..c
D379 . How is the money generated used? Retained wi in the faoility(Encircle all applicable options) for local use ............ . .....®
Retained but not used........13Transferred to districtAccounts ....................COther. ..D
D380 . Is display board put up In Hospital Yes . . lshowing number of members , number....................
of m f S etc? No ..................... 2t^D381 . How tbedbeck ittaken for grievance Social Audit. :..............
redressal by RKS? Public Scrutiny of action.taken ... ........ ... . .. .. .. ......a
No feedback mechanism .....Others leases 1 ly) . a^fa S
D382 . Any Other Special Ward/ Procedures not covered above
D383. Any other remarksj'y MS of the hospital/ Other members which have not been captured inthe questions - above but are relevant
23

DISTRICT SCHEDULE
D384. Any other remarks or suggestions for improvement of services by ObriirVer which have notbeen captured in the questions above but are relevant
If the patient has availed service either in (OPD or IPD) the observer to go to ExitInterview Schedule
D D M M Y Y
L H oNDate Name of the I it
S fl% ^Cwv"o^ ' i
nves lister signature or the Investigator
24