Practical aspects of Lee–Goldburg based CRAMPS techniques for high-resolution 1H NMR spectroscopy...
20
This article appeared in a journal published by Elsevier. The attached copy is furnished to the author for internal non-commercial research and education use, including for instruction at the authors institution and sharing with colleagues. Other uses, including reproduction and distribution, or selling or licensing copies, or posting to personal, institutional or third party websites are prohibited. In most cases authors are permitted to post their version of the article (e.g. in Word or Tex form) to their personal website or institutional repository. Authors requiring further information regarding Elsevier’s archiving and manuscript policies are encouraged to visit: http://www.elsevier.com/copyright
Transcript of Practical aspects of Lee–Goldburg based CRAMPS techniques for high-resolution 1H NMR spectroscopy...
This article appeared in a journal published by Elsevier. The attachedcopy is furnished to the author for internal non-commercial researchand education use, including for instruction at the authors institution
and sharing with colleagues.
Other uses, including reproduction and distribution, or selling orlicensing copies, or posting to personal, institutional or third party
websites are prohibited.
In most cases authors are permitted to post their version of thearticle (e.g. in Word or Tex form) to their personal website orinstitutional repository. Authors requiring further information
regarding Elsevier’s archiving and manuscript policies areencouraged to visit:
http://www.elsevier.com/copyright
Author's personal copy
Practical aspects of Lee–Goldburg based CRAMPS techniques for high-resolution 1HNMR spectroscopy in solids: Implementation and applications
Cristina Coelho a, João Rocha a, P.K. Madhu b, Luís Mafra a,*
a Department of Chemistry, CICECO, University of Aveiro, 3810-193 Aveiro, Portugalb Department of Chemical Sciences, Tata Institute of Fundamental Research, Homi Bhabha Road, Colaba, Mumbai 400 005, India
a r t i c l e i n f o
Article history:Received 18 June 2008Revised 15 July 2008Available online 24 July 2008
Keywords:1HHomonuclear techniques2D homonuclear correlationSolid-state NMRLee–GoldburgHigh-resolution proton decouplingLG decouplingCRAMPS techniquesInorganic–organic hybrids materialsFSLGPMLG
a b s t r a c t
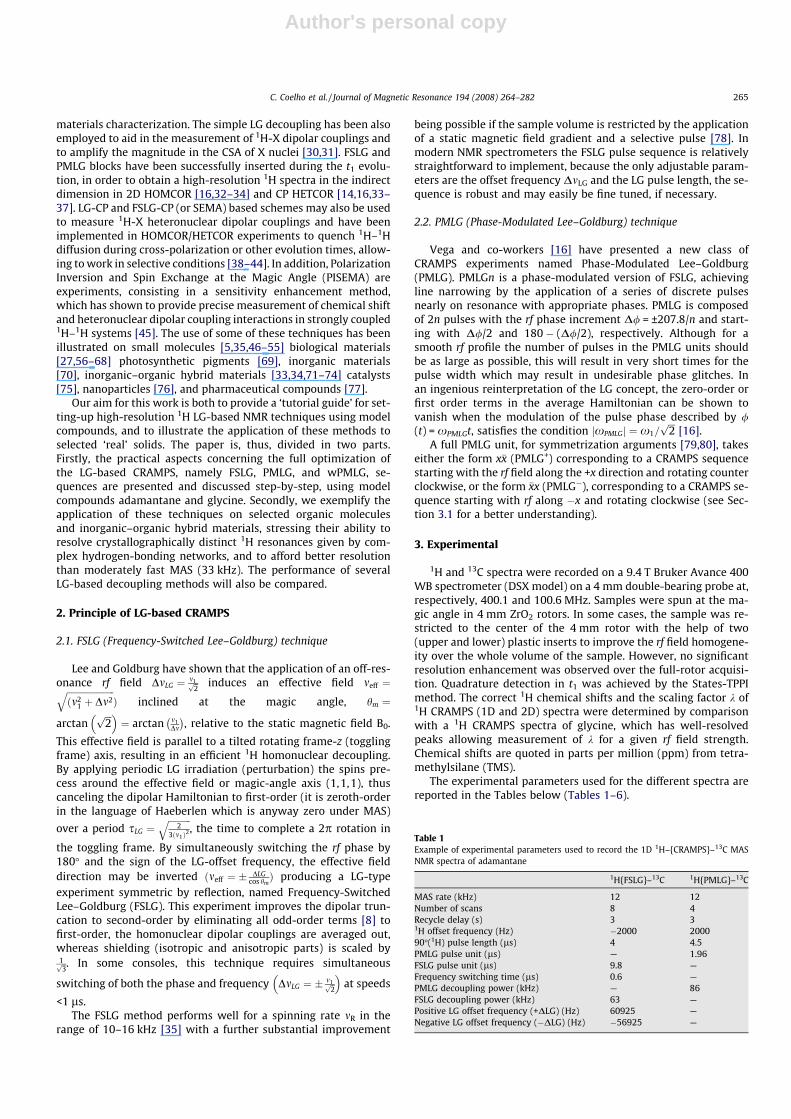
Elucidating the local environment of the hydrogen atoms is an important problem in materials science.Because 1H spectra in solid-state nuclear magnetic resonance (NMR) suffer from low resolution due tohomogeneous broadening, even under magic-angle spinning (MAS), information of chemical interestmay only be obtained using certain high-resolution 1H MAS techniques. 1H Lee–Goldburg (LG) CRAMPS(Combined Rotation And Multiple-Pulse Spectroscopy) methods are particularly well suited for studyinginorganic–organic hybrid materials, rich in 1H nuclei. However, setting up CRAMPS experiments is time-consuming and not entirely trivial, facts that have discouraged their widespread use by materials scien-tists. To change this status quo, here we describe and discuss some important aspects of the experimentalimplementation of CRAMPS techniques based on LG decoupling schemes, such as FSLG (FrequencySwitched), and windowed and windowless PMLG (Phase Modulated). In particular, we discuss the influ-ence on the quality of the 1H NMR spectra of the different parameters at play, for example LG (Lee–Gold-burg) pulses, radio-frequency (rf) phase, frequency switching, and pulse imperfections, using glycine andadamantane as model compounds. The efficiency and robustness of the different LG-decoupling schemesis then illustrated on the following materials: organo-phosphorus ligand, N-(phosphonomethyl)iminodi-acetic acid [H4pmida] [I], and inorganic–organic hybrid materials (C4H12N2)[Ge2(pmida)2OH2]�4H2O [II]and (C2H5NH3)[Ti(H1.5PO4)(PO4)]2�H2O [III].
� 2008 Elsevier Inc. All rights reserved.
1. Introduction
1H is the most naturally abundant among the nuclear magneticresonance (NMR) observable nuclear spins in organic moleculeswith high sensitivity, making it the most widely used nuclearprobe in solution state NMR. 1H chemical-shift ranges are wellknown and they are used to ascertain the presence of functionalgroups, yielding important information to chemists. In contrast,1H NMR is not routinely used to characterize solids, mainly be-cause it is not straightforward to record high-resolution spectra,due to the strong 1H–1H homonuclear dipolar couplings, whichbroaden the spectral lines up to the kHz range. However, solid-state 1H NMR is a powerful and unique local probe of the intermo-lecular interactions, such as strong and weak hydrogen-bonding[1–3] and p–p stacking effects [4], which determine the self-assembly of chemical species.
To remove the interactions which broaden the 1H spectra reso-nances of solids, periodic multiple rf pulses and fast MAS (up to70 kHz) have been used [5,6]. The latter consists in averaging out
the space part of the 1H homonuclear Hamiltonian by mechanicalrotation of the sample, while the former entails the applicationof periodic multiple rf pulses, resulting in an averaging in the spinspace. Considerable progress has been made in order to combine,in an efficient way, these two complementary approaches inCRAMPS schemes. Several strategies are available based on (i) win-dowless pulse schemes MREV-8 [7,8], WHH-4 [9], CORY-24 [10],BLEW-12 and -48 [11], MSHOT-3 [12], FSLG [13,14] or FFLG [15],PMLGn [16–18], DUMBO-1/eDUMBO [19–21], and (ii) windowedacquisition methods, BR-24 [22,23], wPMLGn [24,25], FSLG 240w[26], wDUMBO-1 [27]. CRAMPS experiments may also be classifiedaccording to the ratio between the rf multiple-pulse cycle time andthe rotor period. Traditional CRAMPS uses long rf multiple-pulseperiods and relatively slow spinning, while most recent CRAMPStechniques, such as FSLG, PMLG, and DUMBO employ much shorterrf cycle times, allowing higher spinning rates (up to 20 kHz). Othermethods (not based on a quasi-static approximation) based onMAS synchronized sequences, using symmetry-based schemes,have been reported recently and demonstrated at 20–30 kHzMAS rate [28,29].
Lee–Goldburg based homonuclear decoupling schemes, areprobably the most used pulse sequences for 1H observation in
1090-7807/$ - see front matter � 2008 Elsevier Inc. All rights reserved.doi:10.1016/j.jmr.2008.07.019
* Corresponding author.E-mail address: [email protected] (L. Mafra).
Journal of Magnetic Resonance 194 (2008) 264–282
Contents lists available at ScienceDirect
Journal of Magnetic Resonance
journal homepage: www.elsevier .com/ locate/ jmr
Author's personal copy
materials characterization. The simple LG decoupling has been alsoemployed to aid in the measurement of 1H-X dipolar couplings andto amplify the magnitude in the CSA of X nuclei [30,31]. FSLG andPMLG blocks have been successfully inserted during the t1 evolu-tion, in order to obtain a high-resolution 1H spectra in the indirectdimension in 2D HOMCOR [16,32–34] and CP HETCOR [14,16,33–37]. LG-CP and FSLG-CP (or SEMA) based schemes may also be usedto measure 1H-X heteronuclear dipolar couplings and have beenimplemented in HOMCOR/HETCOR experiments to quench 1H–1Hdiffusion during cross-polarization or other evolution times, allow-ing to work in selective conditions [38–44]. In addition, PolarizationInversion and Spin Exchange at the Magic Angle (PISEMA) areexperiments, consisting in a sensitivity enhancement method,which has shown to provide precise measurement of chemical shiftand heteronuclear dipolar coupling interactions in strongly coupled1H–1H systems [45]. The use of some of these techniques has beenillustrated on small molecules [5,35,46–55] biological materials[27,56–68] photosynthetic pigments [69], inorganic materials[70], inorganic–organic hybrid materials [33,34,71–74] catalysts[75], nanoparticles [76], and pharmaceutical compounds [77].
Our aim for this work is both to provide a ‘tutorial guide’ for set-ting-up high-resolution 1H LG-based NMR techniques using modelcompounds, and to illustrate the application of these methods toselected ‘real’ solids. The paper is, thus, divided in two parts.Firstly, the practical aspects concerning the full optimization ofthe LG-based CRAMPS, namely FSLG, PMLG, and wPMLG, se-quences are presented and discussed step-by-step, using modelcompounds adamantane and glycine. Secondly, we exemplify theapplication of these techniques on selected organic moleculesand inorganic–organic hybrid materials, stressing their ability toresolve crystallographically distinct 1H resonances given by com-plex hydrogen-bonding networks, and to afford better resolutionthan moderately fast MAS (33 kHz). The performance of severalLG-based decoupling methods will also be compared.
2. Principle of LG-based CRAMPS
2.1. FSLG (Frequency-Switched Lee–Goldburg) technique
Lee and Goldburg have shown that the application of an off-res-onance rf field DmLG ¼ m1ffiffi
2p induces an effective field meff ¼ffiffiffiffiffiffiffiffiffiffiffiffiffiffiffiffiffiffiffiffiffi
ðm21 þ Dm2
qÞ inclined at the magic angle, hm ¼
arctanffiffiffi2p� �
¼ arctan m1Dm
� �, relative to the static magnetic field B0.
This effective field is parallel to a tilted rotating frame-z (togglingframe) axis, resulting in an efficient 1H homonuclear decoupling.By applying periodic LG irradiation (perturbation) the spins pre-cess around the effective field or magic-angle axis (1,1,1), thuscanceling the dipolar Hamiltonian to first-order (it is zeroth-orderin the language of Haeberlen which is anyway zero under MAS)
over a period sLG ¼ffiffiffiffiffiffiffiffiffiffi
23ðm1Þ2
q, the time to complete a 2p rotation in
the toggling frame. By simultaneously switching the rf phase by180� and the sign of the LG-offset frequency, the effective fielddirection may be inverted ðmeff ¼ � DLG
cos hmÞ producing a LG-type
experiment symmetric by reflection, named Frequency-SwitchedLee–Goldburg (FSLG). This experiment improves the dipolar trun-cation to second-order by eliminating all odd-order terms [8] tofirst-order, the homonuclear dipolar couplings are averaged out,whereas shielding (isotropic and anisotropic parts) is scaled by1ffiffi3p . In some consoles, this technique requires simultaneous
switching of both the phase and frequency DmLG ¼ � m1ffiffi2p
� �at speeds
<1 ls.The FSLG method performs well for a spinning rate mR in the
range of 10–16 kHz [35] with a further substantial improvement
being possible if the sample volume is restricted by the applicationof a static magnetic field gradient and a selective pulse [78]. Inmodern NMR spectrometers the FSLG pulse sequence is relativelystraightforward to implement, because the only adjustable param-eters are the offset frequency DmLG and the LG pulse length, the se-quence is robust and may easily be fine tuned, if necessary.
2.2. PMLG (Phase-Modulated Lee–Goldburg) technique
Vega and co-workers [16] have presented a new class ofCRAMPS experiments named Phase-Modulated Lee–Goldburg(PMLG). PMLGn is a phase-modulated version of FSLG, achievingline narrowing by the application of a series of discrete pulsesnearly on resonance with appropriate phases. PMLG is composedof 2n pulses with the rf phase increment D/ = ±207.8/n and start-ing with D//2 and 180 � (D//2), respectively. Although for asmooth rf profile the number of pulses in the PMLG units shouldbe as large as possible, this will result in very short times for thepulse width which may result in undesirable phase glitches. Inan ingenious reinterpretation of the LG concept, the zero-order orfirst order terms in the average Hamiltonian can be shown tovanish when the modulation of the pulse phase described by /(t) = xPMLGt, satisfies the condition jxPMLGj ¼ x1=
ffiffiffi2p
[16].A full PMLG unit, for symmetrization arguments [79,80], takes
either the form x�x (PMLG+) corresponding to a CRAMPS sequencestarting with the rf field along the +x direction and rotating counterclockwise, or the form �xx (PMLG�), corresponding to a CRAMPS se-quence starting with rf along �x and rotating clockwise (see Sec-tion 3.1 for a better understanding).
3. Experimental
1H and 13C spectra were recorded on a 9.4 T Bruker Avance 400WB spectrometer (DSX model) on a 4 mm double-bearing probe at,respectively, 400.1 and 100.6 MHz. Samples were spun at the ma-gic angle in 4 mm ZrO2 rotors. In some cases, the sample was re-stricted to the center of the 4 mm rotor with the help of two(upper and lower) plastic inserts to improve the rf field homogene-ity over the whole volume of the sample. However, no significantresolution enhancement was observed over the full-rotor acquisi-tion. Quadrature detection in t1 was achieved by the States-TPPImethod. The correct 1H chemical shifts and the scaling factor k of1H CRAMPS (1D and 2D) spectra were determined by comparisonwith a 1H CRAMPS spectra of glycine, which has well-resolvedpeaks allowing measurement of k for a given rf field strength.Chemical shifts are quoted in parts per million (ppm) from tetra-methylsilane (TMS).
The experimental parameters used for the different spectra arereported in the Tables below (Tables 1–6).
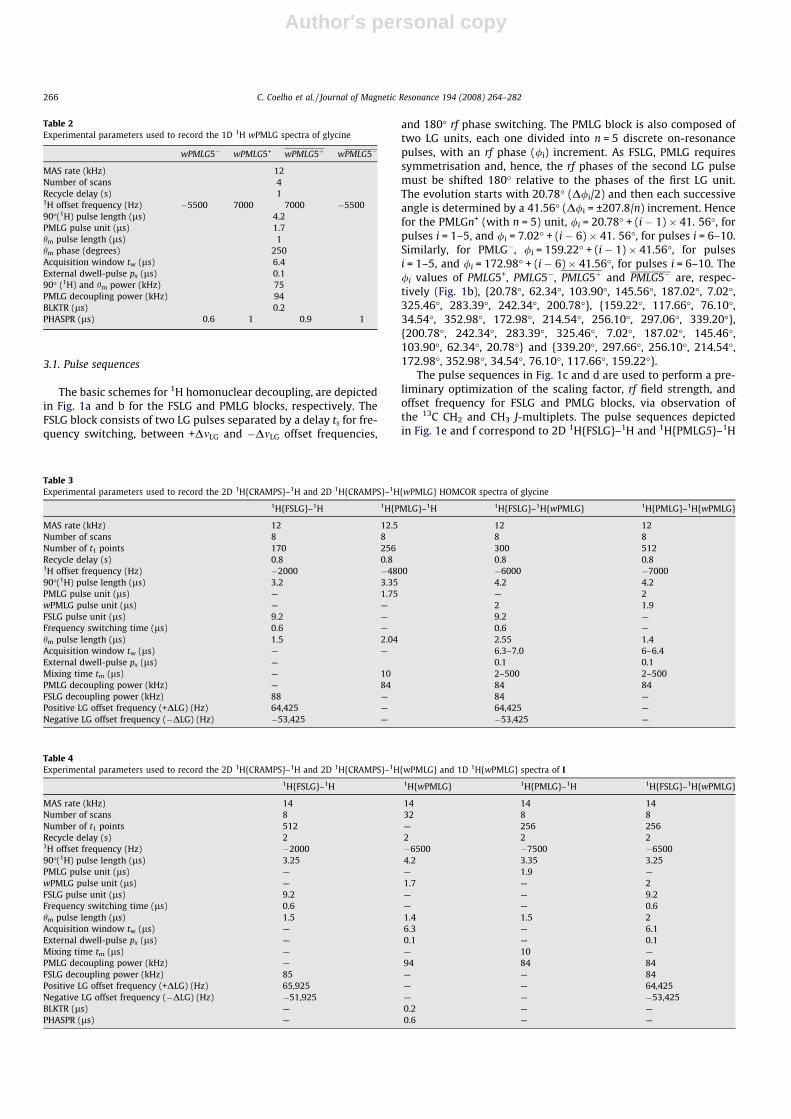
Table 1Example of experimental parameters used to record the 1D 1H–{CRAMPS}–13C MASNMR spectra of adamantane
1H{FSLG}–13C 1H{PMLG}–13C
MAS rate (kHz) 12 12Number of scans 8 4Recycle delay (s) 3 31H offset frequency (Hz) �2000 200090�(1H) pulse length (ls) 4 4.5PMLG pulse unit (ls) — 1.96FSLG pulse unit (ls) 9.8 —Frequency switching time (ls) 0.6 —PMLG decoupling power (kHz) — 86FSLG decoupling power (kHz) 63 —Positive LG offset frequency (+DLG) (Hz) 60925 —Negative LG offset frequency (�DLG) (Hz) �56925 —
C. Coelho et al. / Journal of Magnetic Resonance 194 (2008) 264–282 265
Author's personal copy
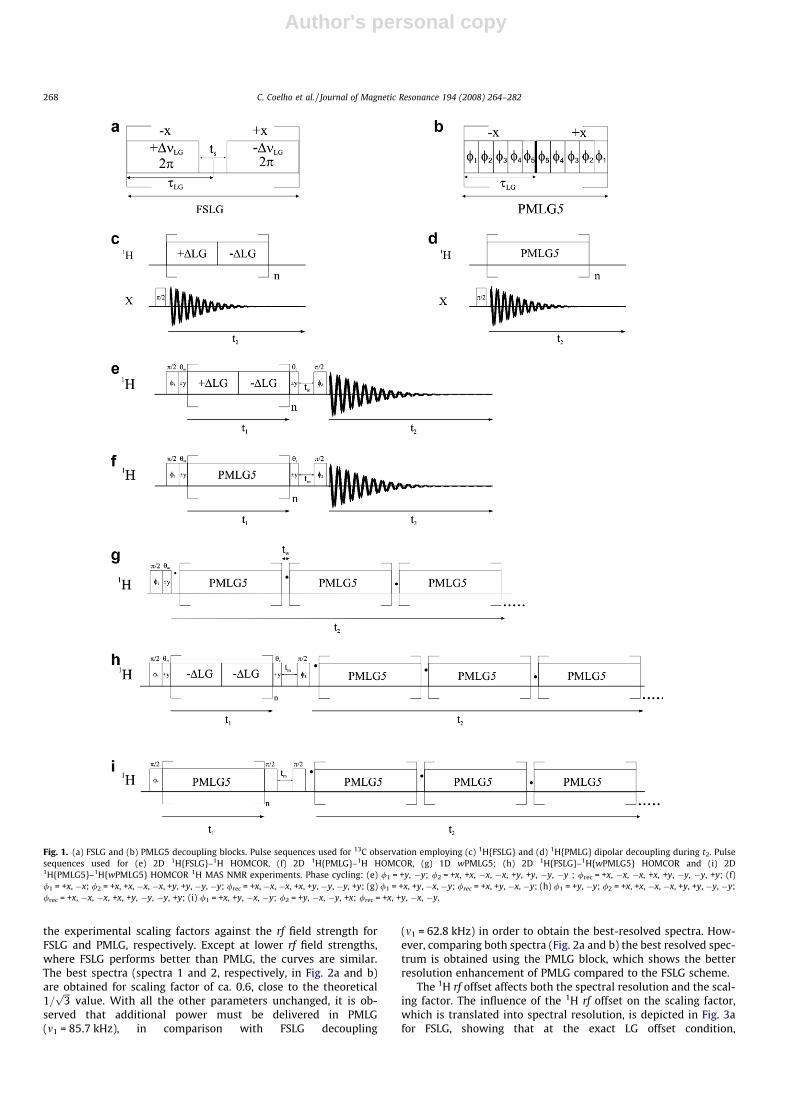
3.1. Pulse sequences
The basic schemes for 1H homonuclear decoupling, are depictedin Fig. 1a and b for the FSLG and PMLG blocks, respectively. TheFSLG block consists of two LG pulses separated by a delay ts for fre-quency switching, between +DmLG and �DmLG offset frequencies,
and 180� rf phase switching. The PMLG block is also composed oftwo LG units, each one divided into n = 5 discrete on-resonancepulses, with an rf phase (/i) increment. As FSLG, PMLG requiressymmetrisation and, hence, the rf phases of the second LG pulsemust be shifted 180� relative to the phases of the first LG unit.The evolution starts with 20.78� (D/i/2) and then each successiveangle is determined by a 41.56� (D/i = ±207.8/n) increment. Hencefor the PMLGn+ (with n = 5) unit, /i = 20.78� + (i � 1) � 41. 56�, forpulses i = 1–5, and /i = 7.02� + (i � 6) � 41. 56�, for pulses i = 6–10.Similarly, for PMLG�, /i = 159.22� + (i � 1) � 41.56�, for pulsesi = 1–5, and /i = 172.98� + (i � 6) � 41.56�, for pulses i = 6–10. The/i values of PMLG5+, PMLG5�, PMLG5þ and PMLG5� are, respec-tively (Fig. 1b), {20.78�, 62.34�, 103.90�, 145.56�, 187.02�, 7.02�,325.46�, 283.39�, 242.34�, 200.78�}, {159.22�, 117.66�, 76.10�,34.54�, 352.98�, 172.98�, 214.54�, 256.10�, 297.06�, 339.20�},{200.78�, 242.34�, 283.39�, 325.46�, 7.02�, 187.02�, 145.46�,103.90�, 62.34�, 20.78�} and {339.20�, 297.66�, 256.10�, 214.54�,172.98�, 352.98�, 34.54�, 76.10�, 117.66�, 159.22�}.
The pulse sequences in Fig. 1c and d are used to perform a pre-liminary optimization of the scaling factor, rf field strength, andoffset frequency for FSLG and PMLG blocks, via observation ofthe 13C CH2 and CH3 J-multiplets. The pulse sequences depictedin Fig. 1e and f correspond to 2D 1H{FSLG}–1H and 1H{PMLG5}–1H
Table 2Experimental parameters used to record the 1D 1H wPMLG spectra of glycine
wPMLG5� wPMLG5+ wPMLG5þ wPMLG5�
MAS rate (kHz) 12Number of scans 4Recycle delay (s) 11H offset frequency (Hz) �5500 7000 7000 �550090�(1H) pulse length (ls) 4.2PMLG pulse unit (ls) 1.7hm pulse length (ls) 1hm phase (degrees) 250Acquisition window tw (ls) 6.4External dwell-pulse px (ls) 0.190� (1H) and hm power (kHz) 75PMLG decoupling power (kHz) 94BLKTR (ls) 0.2PHASPR (ls) 0.6 1 0.9 1
Table 3Experimental parameters used to record the 2D 1H{CRAMPS}–1H and 2D 1H{CRAMPS}–1H{wPMLG} HOMCOR spectra of glycine
1H{FSLG}–1H 1H{PMLG}–1H 1H{FSLG}–1H{wPMLG} 1H{PMLG}–1H{wPMLG}
MAS rate (kHz) 12 12.5 12 12Number of scans 8 8 8 8Number of t1 points 170 256 300 512Recycle delay (s) 0.8 0.8 0.8 0.81H offset frequency (Hz) �2000 �4800 �6000 �700090�(1H) pulse length (ls) 3.2 3.35 4.2 4.2PMLG pulse unit (ls) — 1.75 — 2wPMLG pulse unit (ls) — — 2 1.9FSLG pulse unit (ls) 9.2 — 9.2 —Frequency switching time (ls) 0.6 — 0.6 —hm pulse length (ls) 1.5 2.04 2.55 1.4Acquisition window tw (ls) — — 6.3–7.0 6–6.4External dwell-pulse px (ls) — 0.1 0.1Mixing time tm (ls) — 10 2–500 2–500PMLG decoupling power (kHz) — 84 84 84FSLG decoupling power (kHz) 88 — 84 —Positive LG offset frequency (+DLG) (Hz) 64,425 — 64,425 —Negative LG offset frequency (�DLG) (Hz) �53,425 — �53,425 —
Table 4Experimental parameters used to record the 2D 1H{CRAMPS}–1H and 2D 1H{CRAMPS}–1H{wPMLG} and 1D 1H{wPMLG} spectra of I
1H{FSLG}–1H 1H{wPMLG} 1H{PMLG}–1H 1H{FSLG}–1H{wPMLG}
MAS rate (kHz) 14 14 14 14Number of scans 8 32 8 8Number of t1 points 512 — 256 256Recycle delay (s) 2 2 2 21H offset frequency (Hz) �2000 �6500 �7500 �650090�(1H) pulse length (ls) 3.25 4.2 3.35 3.25PMLG pulse unit (ls) — — 1.9 —wPMLG pulse unit (ls) — 1.7 — 2FSLG pulse unit (ls) 9.2 — — 9.2Frequency switching time (ls) 0.6 — — 0.6hm pulse length (ls) 1.5 1.4 1.5 2Acquisition window tw (ls) — 6.3 — 6.1External dwell-pulse px (ls) — 0.1 — 0.1Mixing time tm (ls) — — 10 —PMLG decoupling power (kHz) — 94 84 84FSLG decoupling power (kHz) 85 — — 84Positive LG offset frequency (+DLG) (Hz) 65,925 — — 64,425Negative LG offset frequency (�DLG) (Hz) �51,925 — — �53,425BLKTR (ls) — 0.2 — —PHASPR (ls) — 0.6 — —
266 C. Coelho et al. / Journal of Magnetic Resonance 194 (2008) 264–282
Author's personal copy
HOMCOR experiments, where Fig. 1a and b building blocks, respec-tively, may be inserted during t1 evolution. In our spectrometerbest results are obtained when the pulse sequences start with ap/2 + hm pulse that creates magnetization in the plane perpendicu-lar to the direction of the effective rf field, the tilted z-axis [14].Then, CRAMPS homonuclear decoupling is introduced and, at theend of the t1 evolution, a p/2 � hm (=hc) pulse places the magneti-zation along the rotating-frame z-axis. The last p/2 pulse bringsthe magnetization back to the xy transverse plane for detection.1H spin diffusion may be studied by adding a mixing time tm justbefore the last p/2 pulse. It is worth mentioning that other authorsmay perform these experiments in a slightly different way. Forexample, the pulse sequence may be initiated by a single p/2 pulse[81]; however the addition of a pre-pulse hm pulse may help opti-mizing the 1H spectra in the t1 dimension. The influence of hm willbe discussed later.
Fig. 1g shows the pulse sequence used to record high-resolution1D 1H NMR spectra, with windowed acquisition of the sampleddata points during signal detection (t2), i.e., the data sampling is
interrupted periodically (t2 windows, tW) for insertion of PMLGblocks.
The pulse schemes (Fig. 1h and i) used in 2D1H{FSLG}–1H{wPMLG} and 2D 1H{PMLG}–1H{wPMLG} afford1H–1H spectra exhibiting high resolution t1 and t2 dimensionsusing, respectively, windowless and windowed 1H–1H decoupling.In such experiments, the t1 and t2 homonuclear decouplings areoptimized separately. The windowless decoupling (t1) may be opti-mized using 1D (Fig. 1c and d) or 2D (Fig. 1e and f) pulse sequences.The windowed PMLG decoupling (t2) is optimized by employingthe 1D 1H wPMLG sequence (Fig. 1g). The different optimizationssteps are now discussed.
4. Results and discussion
The optimization of, among others, the following parameters inLG-based CRAMPS sequences will be discussed using model com-pounds adamantane and glycine: LG rf field strength, 1H rf offset,rotation frequency, and variation of the scaling factor.
Among the different PMLGn sequences, those with n = 3, 5 and 9are the most commonly used. Here, we deal mainly with thePMLG5 scheme because of its wide application at moderately highspinning frequencies [17].
4.1. Optimizing FSLG and PMLG 1H–1H decoupling via 1D spectra
1D 1H–13C experiments (Fig. 1a,b) are very useful to optimizethe FSLG and PMLG unit blocks, and they consist in monitoringthe 13C JCH splitting values of CH2 and CH3 while changing the pulsesequence parameters (1H rf field strength, and rf offset). The shapeand resolution of the 13C J-multiplets are very sensitive to the mis-set of the parameters. For instance, through the direct observationof the experimentally scaled J-coupling and comparison with thesolution NMR J-coupling values [82] the experimental scaling fac-tors may be estimated.
4.1.1. LG rf field strength and 1H rf offsetThese are the two critical parameters to be optimized in FSLG
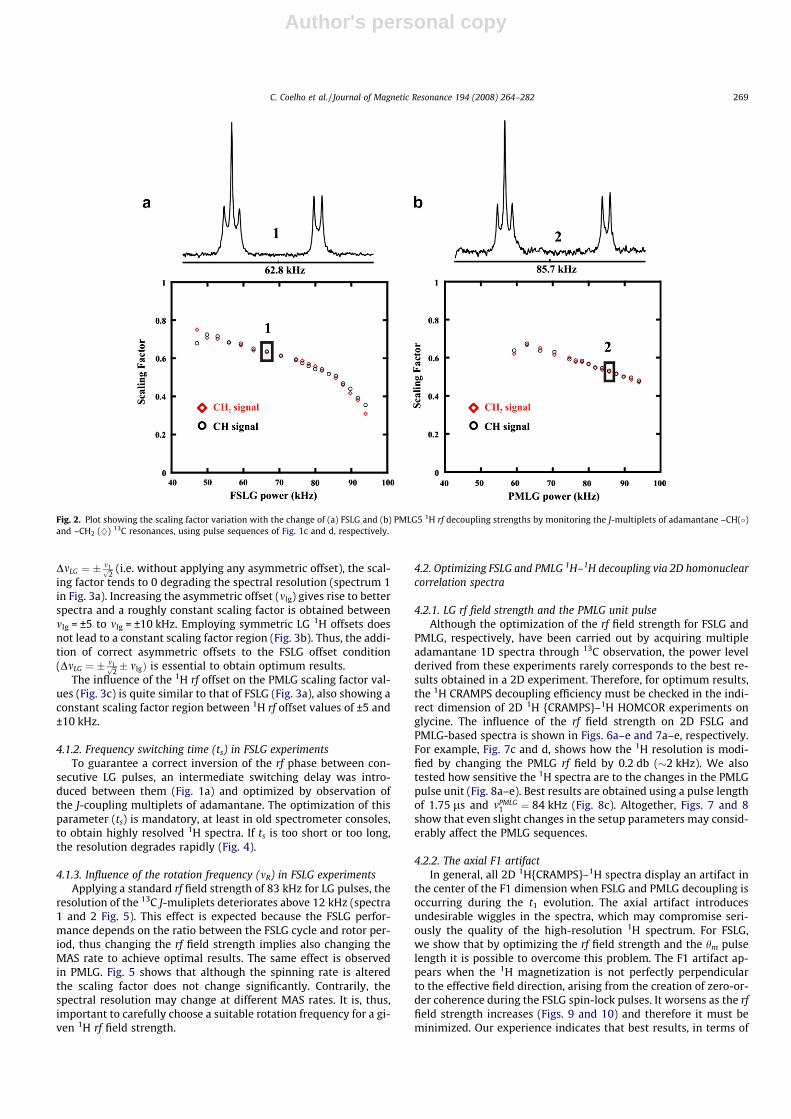
and PMLG decoupling schemes. LG rf field strength is the power le-vel to be applied during each LG unit. Keeping the rf offsets (±DmLG)and LG pulse (sLG) length (see experimental section) fixed to theirtheoretical values, one may easily tune the LG rf field strength untila good-quality spectrum is obtained. Fig. 2a and b gives a plot of
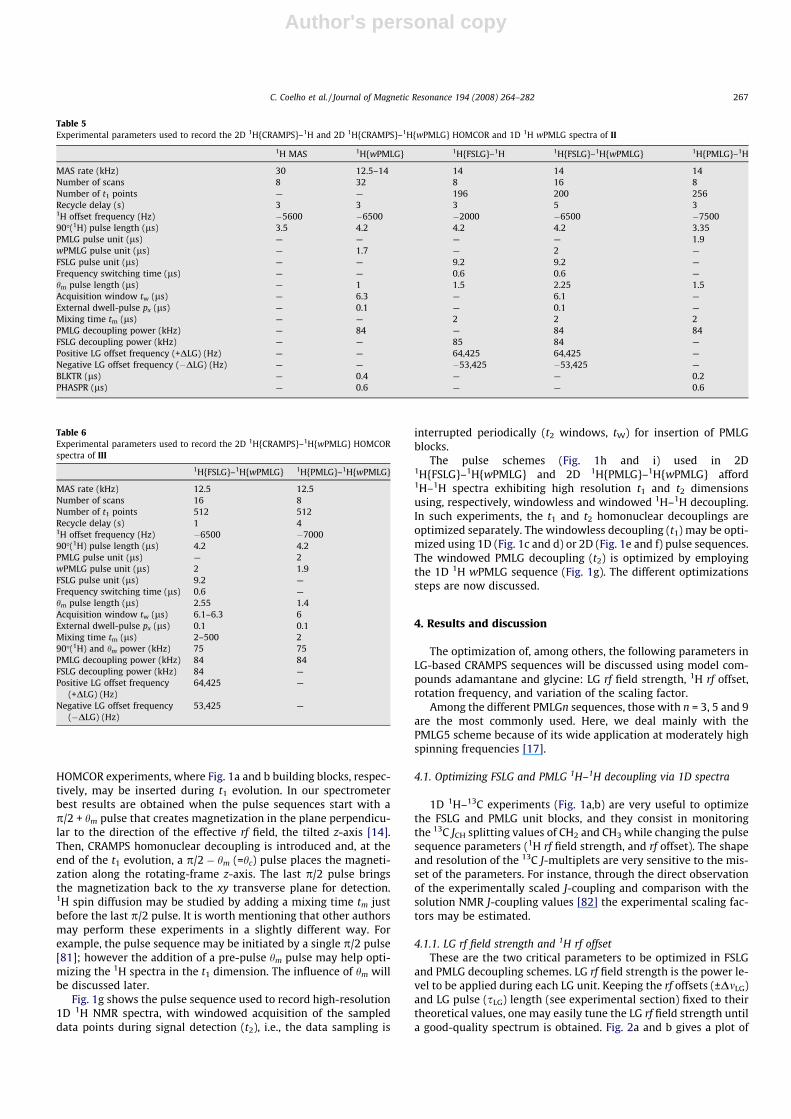
Table 5Experimental parameters used to record the 2D 1H{CRAMPS}–1H and 2D 1H{CRAMPS}–1H{wPMLG} HOMCOR and 1D 1H wPMLG spectra of II
1H MAS 1H{wPMLG} 1H{FSLG}–1H 1H{FSLG}–1H{wPMLG} 1H{PMLG}–1H
MAS rate (kHz) 30 12.5–14 14 14 14Number of scans 8 32 8 16 8Number of t1 points — — 196 200 256Recycle delay (s) 3 3 3 5 31H offset frequency (Hz) �5600 �6500 �2000 �6500 �750090�(1H) pulse length (ls) 3.5 4.2 4.2 4.2 3.35PMLG pulse unit (ls) — — — — 1.9wPMLG pulse unit (ls) — 1.7 — 2 —FSLG pulse unit (ls) — — 9.2 9.2 —Frequency switching time (ls) — — 0.6 0.6 —hm pulse length (ls) — 1 1.5 2.25 1.5Acquisition window tw (ls) — 6.3 — 6.1 —External dwell-pulse px (ls) — 0.1 — 0.1 —Mixing time tm (ls) — — 2 2 2PMLG decoupling power (kHz) — 84 — 84 84FSLG decoupling power (kHz) — — 85 84 —Positive LG offset frequency (+DLG) (Hz) — — 64,425 64,425 —Negative LG offset frequency (�DLG) (Hz) — — �53,425 �53,425 —BLKTR (ls) — 0.4 — — 0.2PHASPR (ls) — 0.6 — — 0.6
Table 6Experimental parameters used to record the 2D 1H{CRAMPS}–1H{wPMLG} HOMCORspectra of III
1H{FSLG}–1H{wPMLG} 1H{PMLG}–1H{wPMLG}
MAS rate (kHz) 12.5 12.5Number of scans 16 8Number of t1 points 512 512Recycle delay (s) 1 41H offset frequency (Hz) �6500 �700090�(1H) pulse length (ls) 4.2 4.2PMLG pulse unit (ls) — 2wPMLG pulse unit (ls) 2 1.9FSLG pulse unit (ls) 9.2 —Frequency switching time (ls) 0.6 —hm pulse length (ls) 2.55 1.4Acquisition window tw (ls) 6.1–6.3 6External dwell-pulse px (ls) 0.1 0.1Mixing time tm (ls) 2–500 290�(1H) and hm power (kHz) 75 75PMLG decoupling power (kHz) 84 84FSLG decoupling power (kHz) 84 —Positive LG offset frequency
(+DLG) (Hz)64,425 —
Negative LG offset frequency(�DLG) (Hz)
53,425 —
C. Coelho et al. / Journal of Magnetic Resonance 194 (2008) 264–282 267
Author's personal copy
the experimental scaling factors against the rf field strength forFSLG and PMLG, respectively. Except at lower rf field strengths,where FSLG performs better than PMLG, the curves are similar.The best spectra (spectra 1 and 2, respectively, in Fig. 2a and b)are obtained for scaling factor of ca. 0.6, close to the theoretical1=
ffiffiffi3p
value. With all the other parameters unchanged, it is ob-served that additional power must be delivered in PMLG(m1 = 85.7 kHz), in comparison with FSLG decoupling
(m1 = 62.8 kHz) in order to obtain the best-resolved spectra. How-ever, comparing both spectra (Fig. 2a and b) the best resolved spec-trum is obtained using the PMLG block, which shows the betterresolution enhancement of PMLG compared to the FSLG scheme.
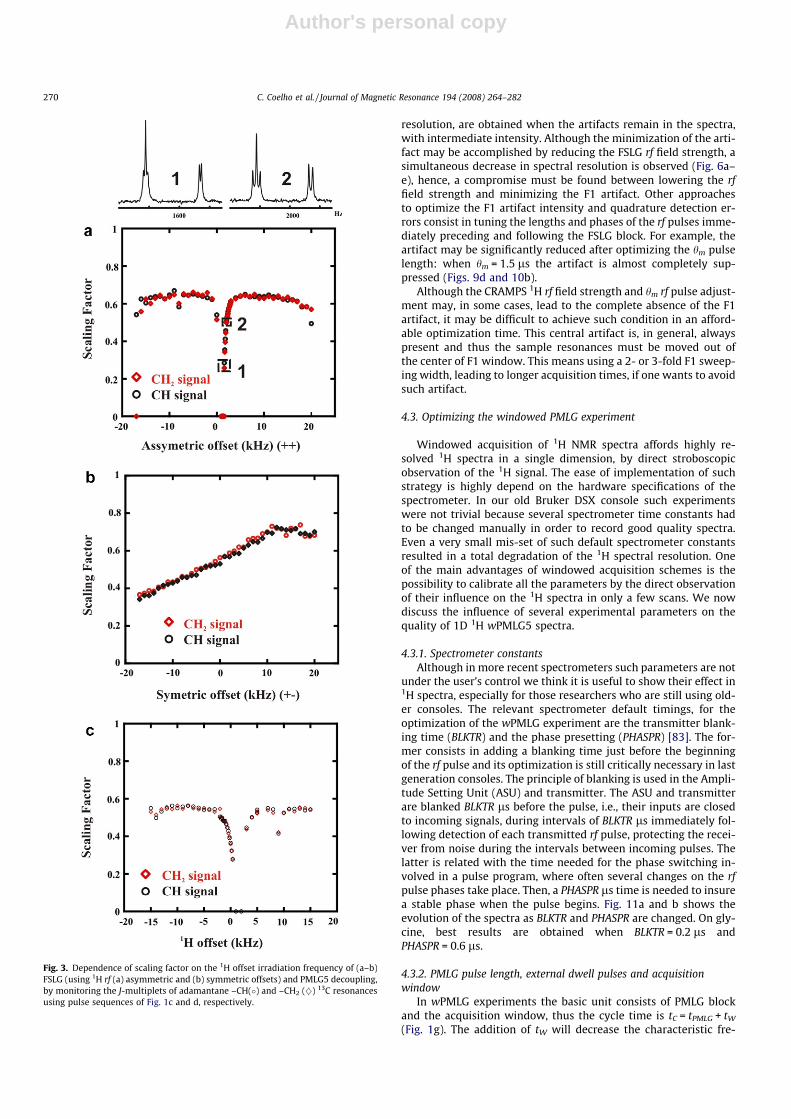
The 1H rf offset affects both the spectral resolution and the scal-ing factor. The influence of the 1H rf offset on the scaling factor,which is translated into spectral resolution, is depicted in Fig. 3afor FSLG, showing that at the exact LG offset condition,
Fig. 1. (a) FSLG and (b) PMLG5 decoupling blocks. Pulse sequences used for 13C observation employing (c) 1H{FSLG} and (d) 1H{PMLG} dipolar decoupling during t2. Pulsesequences used for (e) 2D 1H{FSLG}–1H HOMCOR, (f) 2D 1H{PMLG}–1H HOMCOR, (g) 1D wPMLG5; (h) 2D 1H{FSLG}–1H{wPMLG5} HOMCOR and (i) 2D1H{PMLG5}–1H{wPMLG5} HOMCOR 1H MAS NMR experiments. Phase cycling: (e) /1 = +y, �y; /2 = +x, +x, �x, �x, +y, +y, �y, �y ; /rec = +x, �x, �x, +x, +y, �y, �y, +y; (f)/1 = +x, �x; /2 = +x, +x, �x, �x, +y, +y, �y, �y; /rec = +x, �x, �x, +x, +y, �y, �y, +y; (g) /1 = +x, +y, �x, �y; /rec = +x, +y, �x, �y; (h) /1 = +y, �y; /2 = +x, +x, �x, �x, +y, +y, �y, �y;/rec = +x, �x, �x, +x, +y, �y, �y, +y; (i) /1 = +x, +y, �x, �y; /2 = +y, �x, �y, +x; /rec = +x, +y, �x, �y.
268 C. Coelho et al. / Journal of Magnetic Resonance 194 (2008) 264–282
Author's personal copy
DmLG ¼ � m1ffiffi2p (i.e. without applying any asymmetric offset), the scal-
ing factor tends to 0 degrading the spectral resolution (spectrum 1in Fig. 3a). Increasing the asymmetric offset (mlg) gives rise to betterspectra and a roughly constant scaling factor is obtained betweenmlg = ±5 to mlg = ±10 kHz. Employing symmetric LG 1H offsets doesnot lead to a constant scaling factor region (Fig. 3b). Thus, the addi-tion of correct asymmetric offsets to the FSLG offset condition(DmLG ¼ � m1ffiffi
2p � mlgÞ is essential to obtain optimum results.
The influence of the 1H rf offset on the PMLG scaling factor val-ues (Fig. 3c) is quite similar to that of FSLG (Fig. 3a), also showing aconstant scaling factor region between 1H rf offset values of ±5 and±10 kHz.
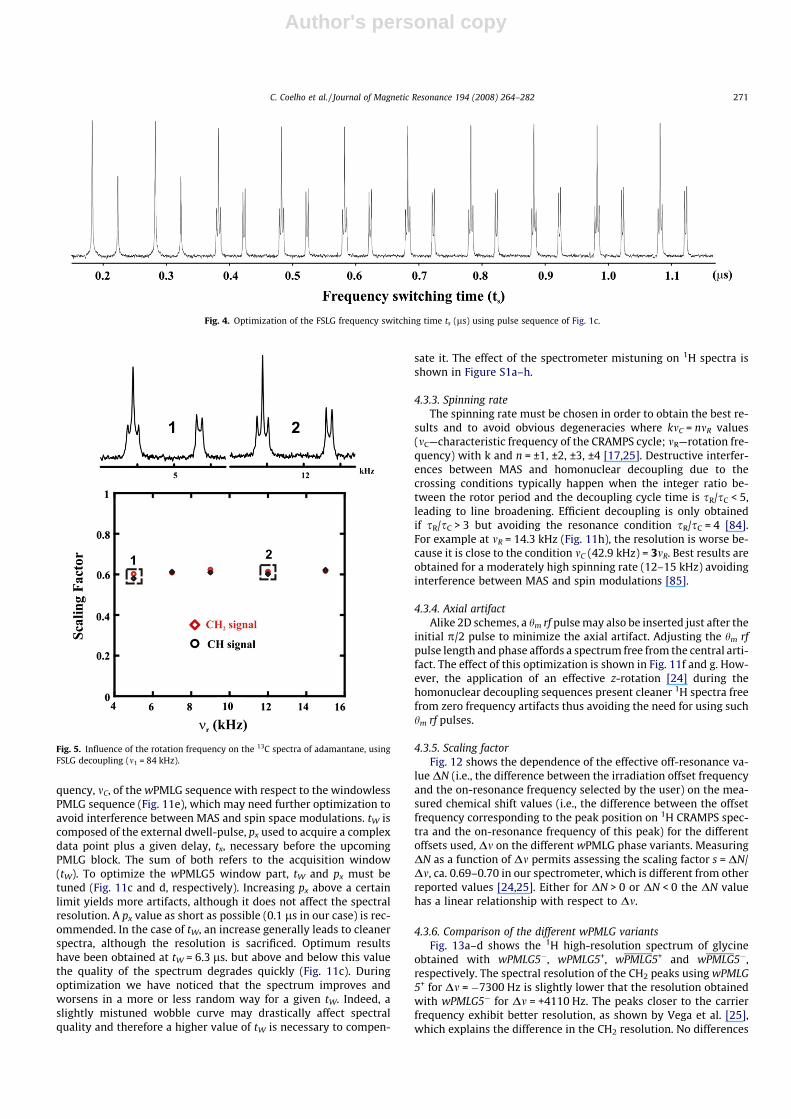
4.1.2. Frequency switching time (ts) in FSLG experimentsTo guarantee a correct inversion of the rf phase between con-
secutive LG pulses, an intermediate switching delay was intro-duced between them (Fig. 1a) and optimized by observation ofthe J-coupling multiplets of adamantane. The optimization of thisparameter (ts) is mandatory, at least in old spectrometer consoles,to obtain highly resolved 1H spectra. If ts is too short or too long,the resolution degrades rapidly (Fig. 4).
4.1.3. Influence of the rotation frequency (mR) in FSLG experimentsApplying a standard rf field strength of 83 kHz for LG pulses, the
resolution of the 13C J-muliplets deteriorates above 12 kHz (spectra1 and 2 Fig. 5). This effect is expected because the FSLG perfor-mance depends on the ratio between the FSLG cycle and rotor per-iod, thus changing the rf field strength implies also changing theMAS rate to achieve optimal results. The same effect is observedin PMLG. Fig. 5 shows that although the spinning rate is alteredthe scaling factor does not change significantly. Contrarily, thespectral resolution may change at different MAS rates. It is, thus,important to carefully choose a suitable rotation frequency for a gi-ven 1H rf field strength.
4.2. Optimizing FSLG and PMLG 1H–1H decoupling via 2D homonuclearcorrelation spectra
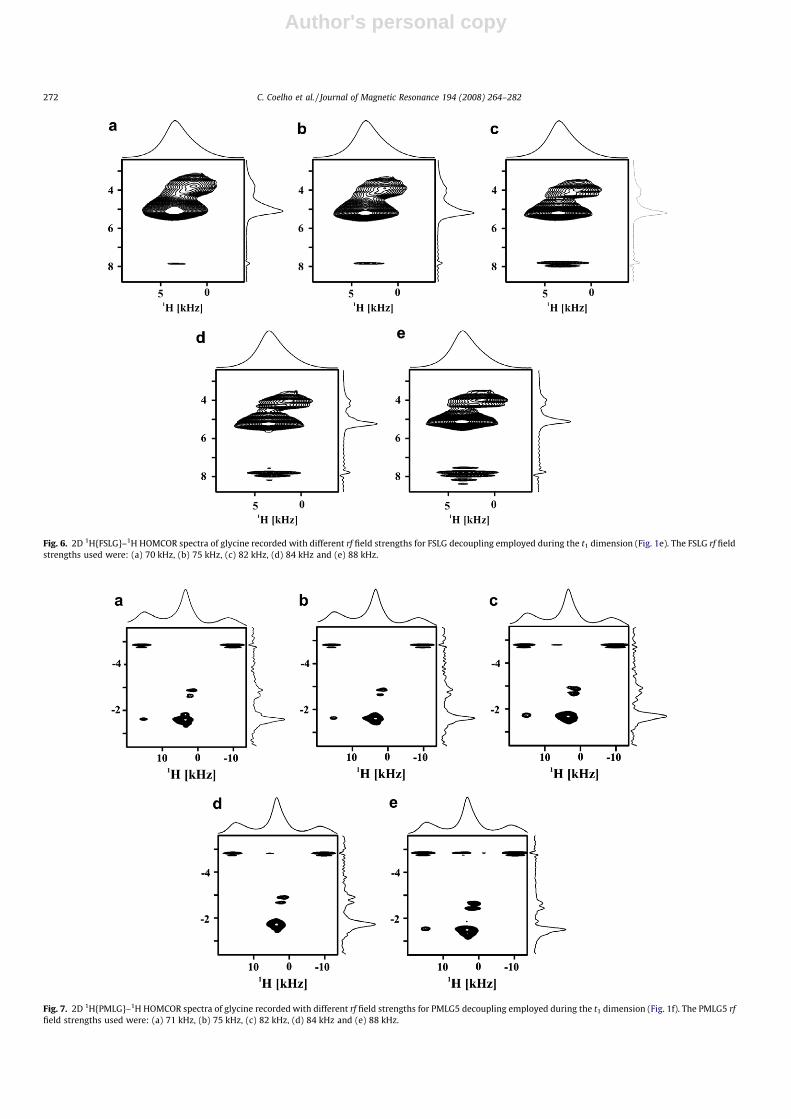
4.2.1. LG rf field strength and the PMLG unit pulseAlthough the optimization of the rf field strength for FSLG and
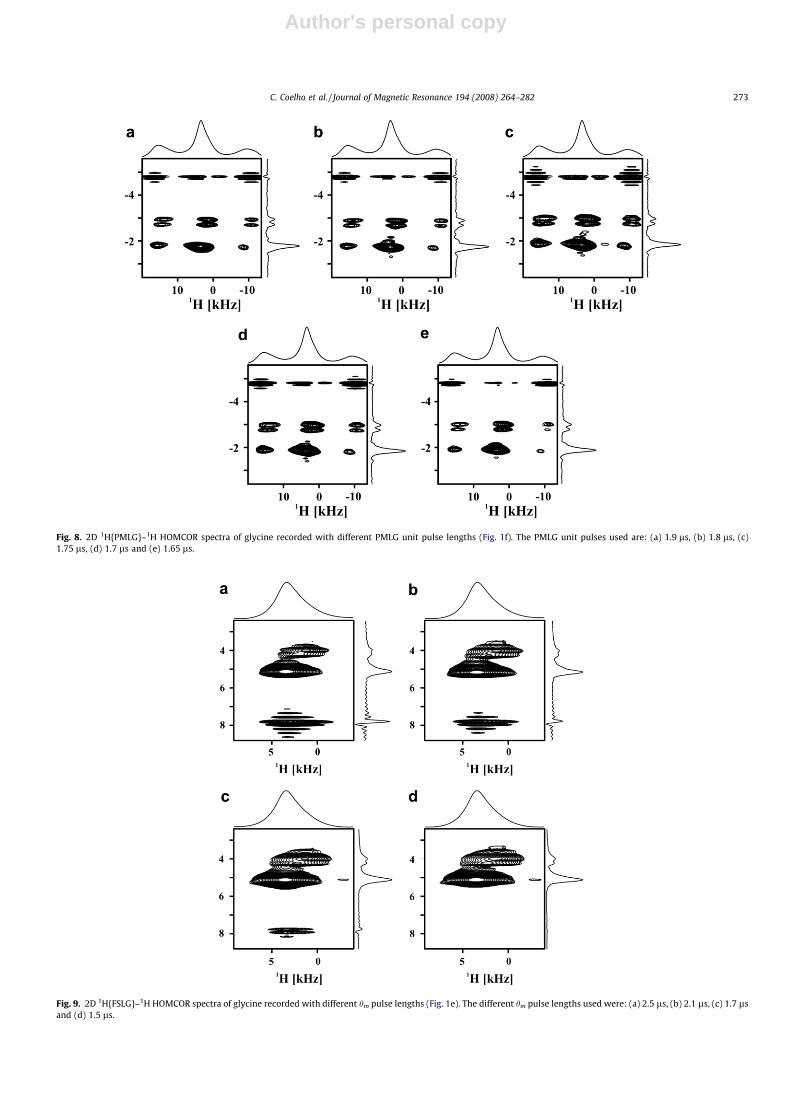
PMLG, respectively, have been carried out by acquiring multipleadamantane 1D spectra through 13C observation, the power levelderived from these experiments rarely corresponds to the best re-sults obtained in a 2D experiment. Therefore, for optimum results,the 1H CRAMPS decoupling efficiency must be checked in the indi-rect dimension of 2D 1H {CRAMPS}–1H HOMCOR experiments onglycine. The influence of the rf field strength on 2D FSLG andPMLG-based spectra is shown in Figs. 6a–e and 7a–e, respectively.For example, Fig. 7c and d, shows how the 1H resolution is modi-fied by changing the PMLG rf field by 0.2 db (�2 kHz). We alsotested how sensitive the 1H spectra are to the changes in the PMLGpulse unit (Fig. 8a–e). Best results are obtained using a pulse lengthof 1.75 ls and mPMLG
1 ¼ 84 kHz (Fig. 8c). Altogether, Figs. 7 and 8show that even slight changes in the setup parameters may consid-erably affect the PMLG sequences.
4.2.2. The axial F1 artifactIn general, all 2D 1H{CRAMPS}–1H spectra display an artifact in
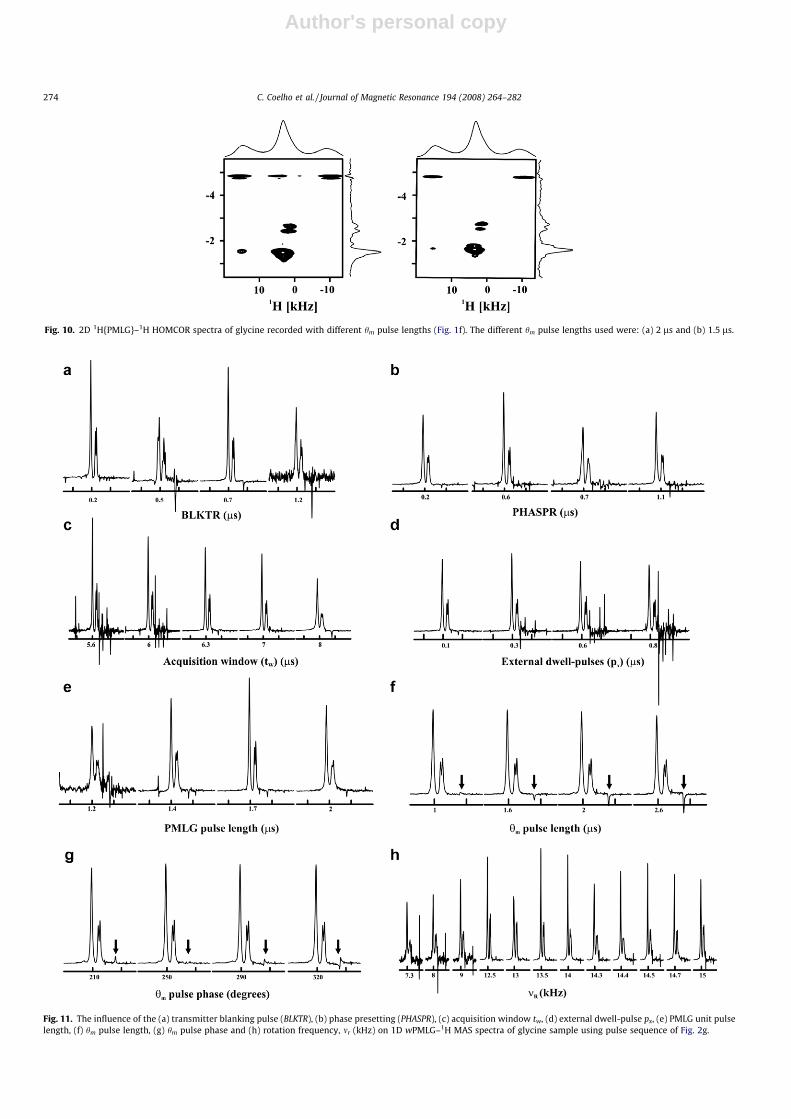
the center of the F1 dimension when FSLG and PMLG decoupling isoccurring during the t1 evolution. The axial artifact introducesundesirable wiggles in the spectra, which may compromise seri-ously the quality of the high-resolution 1H spectrum. For FSLG,we show that by optimizing the rf field strength and the hm pulselength it is possible to overcome this problem. The F1 artifact ap-pears when the 1H magnetization is not perfectly perpendicularto the effective field direction, arising from the creation of zero-or-der coherence during the FSLG spin-lock pulses. It worsens as the rffield strength increases (Figs. 9 and 10) and therefore it must beminimized. Our experience indicates that best results, in terms of
Fig. 2. Plot showing the scaling factor variation with the change of (a) FSLG and (b) PMLG5 1H rf decoupling strengths by monitoring the J-multiplets of adamantane –CH(�)and –CH2 (}) 13C resonances, using pulse sequences of Fig. 1c and d, respectively.
C. Coelho et al. / Journal of Magnetic Resonance 194 (2008) 264–282 269
Author's personal copy
resolution, are obtained when the artifacts remain in the spectra,with intermediate intensity. Although the minimization of the arti-fact may be accomplished by reducing the FSLG rf field strength, asimultaneous decrease in spectral resolution is observed (Fig. 6a–e), hence, a compromise must be found between lowering the rffield strength and minimizing the F1 artifact. Other approachesto optimize the F1 artifact intensity and quadrature detection er-rors consist in tuning the lengths and phases of the rf pulses imme-diately preceding and following the FSLG block. For example, theartifact may be significantly reduced after optimizing the hm pulselength: when hm = 1.5 ls the artifact is almost completely sup-pressed (Figs. 9d and 10b).
Although the CRAMPS 1H rf field strength and hm rf pulse adjust-ment may, in some cases, lead to the complete absence of the F1artifact, it may be difficult to achieve such condition in an afford-able optimization time. This central artifact is, in general, alwayspresent and thus the sample resonances must be moved out ofthe center of F1 window. This means using a 2- or 3-fold F1 sweep-ing width, leading to longer acquisition times, if one wants to avoidsuch artifact.
4.3. Optimizing the windowed PMLG experiment
Windowed acquisition of 1H NMR spectra affords highly re-solved 1H spectra in a single dimension, by direct stroboscopicobservation of the 1H signal. The ease of implementation of suchstrategy is highly depend on the hardware specifications of thespectrometer. In our old Bruker DSX console such experimentswere not trivial because several spectrometer time constants hadto be changed manually in order to record good quality spectra.Even a very small mis-set of such default spectrometer constantsresulted in a total degradation of the 1H spectral resolution. Oneof the main advantages of windowed acquisition schemes is thepossibility to calibrate all the parameters by the direct observationof their influence on the 1H spectra in only a few scans. We nowdiscuss the influence of several experimental parameters on thequality of 1D 1H wPMLG5 spectra.
4.3.1. Spectrometer constantsAlthough in more recent spectrometers such parameters are not
under the user’s control we think it is useful to show their effect in1H spectra, especially for those researchers who are still using old-er consoles. The relevant spectrometer default timings, for theoptimization of the wPMLG experiment are the transmitter blank-ing time (BLKTR) and the phase presetting (PHASPR) [83]. The for-mer consists in adding a blanking time just before the beginningof the rf pulse and its optimization is still critically necessary in lastgeneration consoles. The principle of blanking is used in the Ampli-tude Setting Unit (ASU) and transmitter. The ASU and transmitterare blanked BLKTR ls before the pulse, i.e., their inputs are closedto incoming signals, during intervals of BLKTR ls immediately fol-lowing detection of each transmitted rf pulse, protecting the recei-ver from noise during the intervals between incoming pulses. Thelatter is related with the time needed for the phase switching in-volved in a pulse program, where often several changes on the rfpulse phases take place. Then, a PHASPR ls time is needed to insurea stable phase when the pulse begins. Fig. 11a and b shows theevolution of the spectra as BLKTR and PHASPR are changed. On gly-cine, best results are obtained when BLKTR = 0.2 ls andPHASPR = 0.6 ls.
4.3.2. PMLG pulse length, external dwell pulses and acquisitionwindow
In wPMLG experiments the basic unit consists of PMLG blockand the acquisition window, thus the cycle time is tC = tPMLG + tW
(Fig. 1g). The addition of tW will decrease the characteristic fre-
Fig. 3. Dependence of scaling factor on the 1H offset irradiation frequency of (a–b)FSLG (using 1H rf (a) asymmetric and (b) symmetric offsets) and PMLG5 decoupling,by monitoring the J-multiplets of adamantane –CH(�) and –CH2 (}) 13C resonancesusing pulse sequences of Fig. 1c and d, respectively.
270 C. Coelho et al. / Journal of Magnetic Resonance 194 (2008) 264–282
Author's personal copy
quency, mC, of the wPMLG sequence with respect to the windowlessPMLG sequence (Fig. 11e), which may need further optimization toavoid interference between MAS and spin space modulations. tW iscomposed of the external dwell-pulse, px used to acquire a complexdata point plus a given delay, tx, necessary before the upcomingPMLG block. The sum of both refers to the acquisition window(tW). To optimize the wPMLG5 window part, tW and px must betuned (Fig. 11c and d, respectively). Increasing px above a certainlimit yields more artifacts, although it does not affect the spectralresolution. A px value as short as possible (0.1 ls in our case) is rec-ommended. In the case of tW, an increase generally leads to cleanerspectra, although the resolution is sacrificed. Optimum resultshave been obtained at tW = 6.3 ls. but above and below this valuethe quality of the spectrum degrades quickly (Fig. 11c). Duringoptimization we have noticed that the spectrum improves andworsens in a more or less random way for a given tW. Indeed, aslightly mistuned wobble curve may drastically affect spectralquality and therefore a higher value of tW is necessary to compen-
sate it. The effect of the spectrometer mistuning on 1H spectra isshown in Figure S1a–h.
4.3.3. Spinning rateThe spinning rate must be chosen in order to obtain the best re-
sults and to avoid obvious degeneracies where kmC = nmR values(mC—characteristic frequency of the CRAMPS cycle; mR—rotation fre-quency) with k and n = ±1, ±2, ±3, ±4 [17,25]. Destructive interfer-ences between MAS and homonuclear decoupling due to thecrossing conditions typically happen when the integer ratio be-tween the rotor period and the decoupling cycle time is sR/sC < 5,leading to line broadening. Efficient decoupling is only obtainedif sR/sC > 3 but avoiding the resonance condition sR/sC = 4 [84].For example at mR = 14.3 kHz (Fig. 11h), the resolution is worse be-cause it is close to the condition mC (42.9 kHz) = 3mR. Best results areobtained for a moderately high spinning rate (12–15 kHz) avoidinginterference between MAS and spin modulations [85].
4.3.4. Axial artifactAlike 2D schemes, a hm rf pulse may also be inserted just after the
initial p/2 pulse to minimize the axial artifact. Adjusting the hm rfpulse length and phase affords a spectrum free from the central arti-fact. The effect of this optimization is shown in Fig. 11f and g. How-ever, the application of an effective z-rotation [24] during thehomonuclear decoupling sequences present cleaner 1H spectra freefrom zero frequency artifacts thus avoiding the need for using suchhm rf pulses.
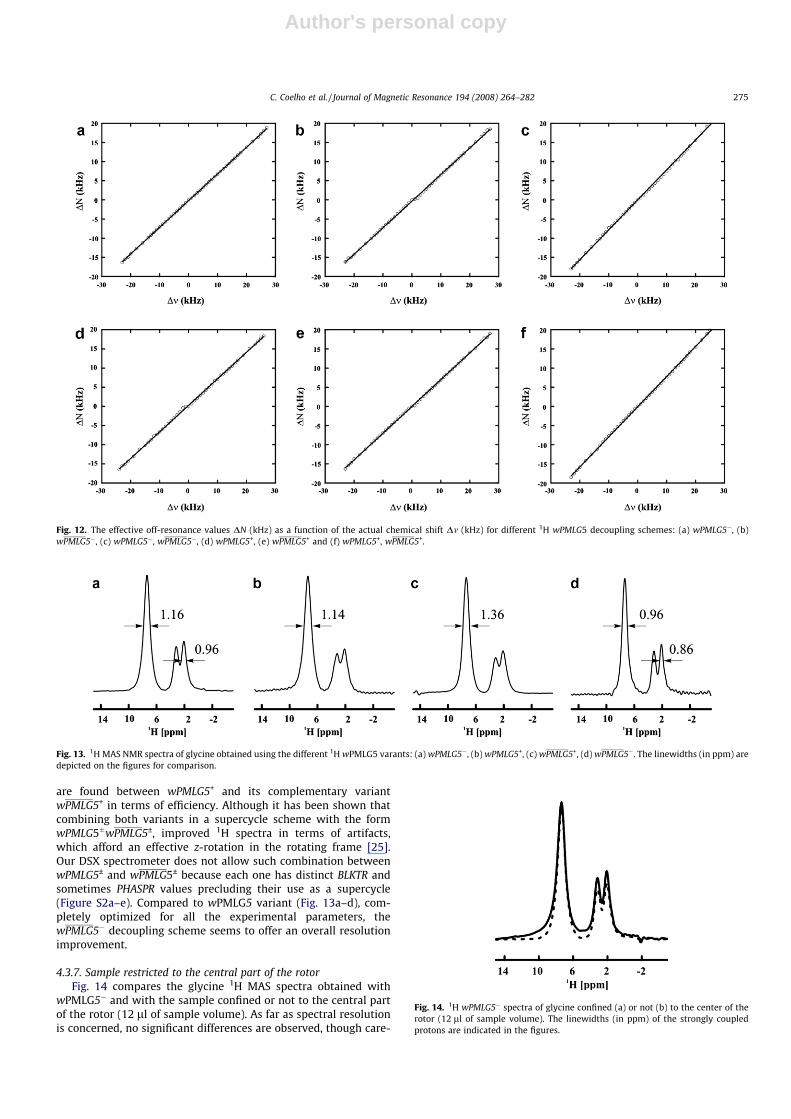
4.3.5. Scaling factorFig. 12 shows the dependence of the effective off-resonance va-
lue DN (i.e., the difference between the irradiation offset frequencyand the on-resonance frequency selected by the user) on the mea-sured chemical shift values (i.e., the difference between the offsetfrequency corresponding to the peak position on 1H CRAMPS spec-tra and the on-resonance frequency of this peak) for the differentoffsets used, Dm on the different wPMLG phase variants. MeasuringDN as a function of Dm permits assessing the scaling factor s = DN/Dm, ca. 0.69–0.70 in our spectrometer, which is different from otherreported values [24,25]. Either for DN > 0 or DN < 0 the DN valuehas a linear relationship with respect to Dm.
4.3.6. Comparison of the different wPMLG variantsFig. 13a–d shows the 1H high-resolution spectrum of glycine
obtained with wPMLG5�, wPMLG5+, wPMLG5+ and wPMLG5�,respectively. The spectral resolution of the CH2 peaks using wPMLG5+ for Dm = �7300 Hz is slightly lower that the resolution obtainedwith wPMLG5� for Dm = +4110 Hz. The peaks closer to the carrierfrequency exhibit better resolution, as shown by Vega et al. [25],which explains the difference in the CH2 resolution. No differences
Fig. 4. Optimization of the FSLG frequency switching time ts (ls) using pulse sequence of Fig. 1c.
Fig. 5. Influence of the rotation frequency on the 13C spectra of adamantane, usingFSLG decoupling (m1 = 84 kHz).
C. Coelho et al. / Journal of Magnetic Resonance 194 (2008) 264–282 271
Author's personal copy
Fig. 6. 2D 1H{FSLG}–1H HOMCOR spectra of glycine recorded with different rf field strengths for FSLG decoupling employed during the t1 dimension (Fig. 1e). The FSLG rf fieldstrengths used were: (a) 70 kHz, (b) 75 kHz, (c) 82 kHz, (d) 84 kHz and (e) 88 kHz.
Fig. 7. 2D 1H{PMLG}–1H HOMCOR spectra of glycine recorded with different rf field strengths for PMLG5 decoupling employed during the t1 dimension (Fig. 1f). The PMLG5 rffield strengths used were: (a) 71 kHz, (b) 75 kHz, (c) 82 kHz, (d) 84 kHz and (e) 88 kHz.
272 C. Coelho et al. / Journal of Magnetic Resonance 194 (2008) 264–282
Author's personal copy
Fig. 8. 2D 1H{PMLG}–1H HOMCOR spectra of glycine recorded with different PMLG unit pulse lengths (Fig. 1f). The PMLG unit pulses used are: (a) 1.9 ls, (b) 1.8 ls, (c)1.75 ls, (d) 1.7 ls and (e) 1.65 ls.
Fig. 9. 2D 1H{FSLG}–1H HOMCOR spectra of glycine recorded with different hm pulse lengths (Fig. 1e). The different hm pulse lengths used were: (a) 2.5 ls, (b) 2.1 ls, (c) 1.7 lsand (d) 1.5 ls.
C. Coelho et al. / Journal of Magnetic Resonance 194 (2008) 264–282 273
Author's personal copy
Fig. 10. 2D 1H{PMLG}–1H HOMCOR spectra of glycine recorded with different hm pulse lengths (Fig. 1f). The different hm pulse lengths used were: (a) 2 ls and (b) 1.5 ls.
Fig. 11. The influence of the (a) transmitter blanking pulse (BLKTR), (b) phase presetting (PHASPR), (c) acquisition window tw, (d) external dwell-pulse px, (e) PMLG unit pulselength, (f) hm pulse length, (g) hm pulse phase and (h) rotation frequency, mr (kHz) on 1D wPMLG–1H MAS spectra of glycine sample using pulse sequence of Fig. 2g.
274 C. Coelho et al. / Journal of Magnetic Resonance 194 (2008) 264–282
Author's personal copy
are found between wPMLG5+ and its complementary variantwPMLG5+ in terms of efficiency. Although it has been shown thatcombining both variants in a supercycle scheme with the formwPMLG5�wPMLG5±, improved 1H spectra in terms of artifacts,which afford an effective z-rotation in the rotating frame [25].Our DSX spectrometer does not allow such combination betweenwPMLG5± and wPMLG5± because each one has distinct BLKTR andsometimes PHASPR values precluding their use as a supercycle(Figure S2a–e). Compared to wPMLG5 variant (Fig. 13a–d), com-pletely optimized for all the experimental parameters, thewPMLG5� decoupling scheme seems to offer an overall resolutionimprovement.
4.3.7. Sample restricted to the central part of the rotorFig. 14 compares the glycine 1H MAS spectra obtained with
wPMLG5� and with the sample confined or not to the central partof the rotor (12 ll of sample volume). As far as spectral resolutionis concerned, no significant differences are observed, though care-
Fig. 12. The effective off-resonance values DN (kHz) as a function of the actual chemical shift Dm (kHz) for different 1H wPMLG5 decoupling schemes: (a) wPMLG5�, (b)wPMLG5�, (c) wPMLG5�, wPMLG5�, (d) wPMLG5+, (e) wPMLG5+ and (f) wPMLG5+, wPMLG5+.
Fig. 13. 1H MAS NMR spectra of glycine obtained using the different 1H wPMLG5 varants: (a) wPMLG5�, (b) wPMLG5+, (c) wPMLG5+, (d) wPMLG5�. The linewidths (in ppm) aredepicted on the figures for comparison.
Fig. 14. 1H wPMLG5� spectra of glycine confined (a) or not (b) to the center of therotor (12 ll of sample volume). The linewidths (in ppm) of the strongly coupledprotons are indicated in the figures.
C. Coelho et al. / Journal of Magnetic Resonance 194 (2008) 264–282 275
Author's personal copy
ful inspection of the NH3 line-shape shows that the resonance isnarrower at the baseline, i.e., a slightly better Gaussian shape is ob-tained when the sample is restricted to the central part of the rotor(Fig. 14, dotted line).
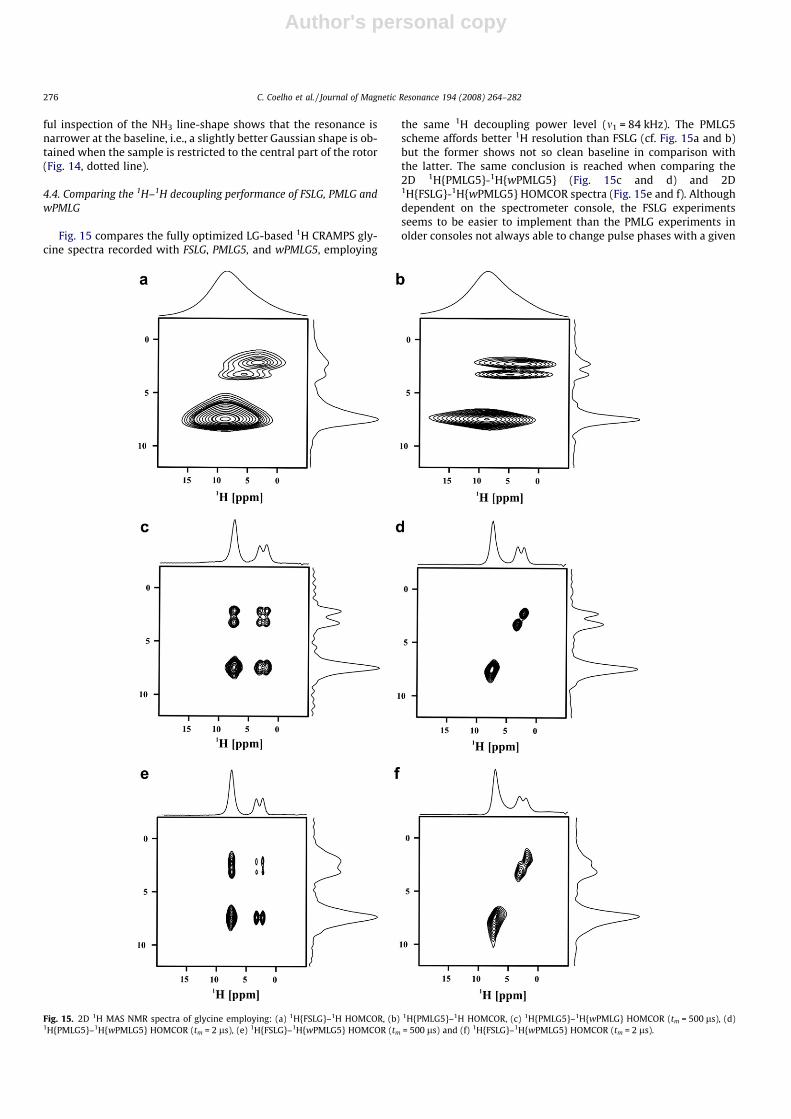
4.4. Comparing the 1H–1H decoupling performance of FSLG, PMLG andwPMLG
Fig. 15 compares the fully optimized LG-based 1H CRAMPS gly-cine spectra recorded with FSLG, PMLG5, and wPMLG5, employing
the same 1H decoupling power level (m1 = 84 kHz). The PMLG5scheme affords better 1H resolution than FSLG (cf. Fig. 15a and b)but the former shows not so clean baseline in comparison withthe latter. The same conclusion is reached when comparing the2D 1H{PMLG5}-1H{wPMLG5} (Fig. 15c and d) and 2D1H{FSLG}-1H{wPMLG5} HOMCOR spectra (Fig. 15e and f). Althoughdependent on the spectrometer console, the FSLG experimentsseems to be easier to implement than the PMLG experiments inolder consoles not always able to change pulse phases with a given
Fig. 15. 2D 1H MAS NMR spectra of glycine employing: (a) 1H{FSLG}–1H HOMCOR, (b) 1H{PMLG5}–1H HOMCOR, (c) 1H{PMLG5}–1H{wPMLG} HOMCOR (tm = 500 ls), (d)1H{PMLG5}–1H{wPMLG5} HOMCOR (tm = 2 ls), (e) 1H{FSLG}–1H{wPMLG5} HOMCOR (tm = 500 ls) and (f) 1H{FSLG}–1H{wPMLG5} HOMCOR (tm = 2 ls).
276 C. Coelho et al. / Journal of Magnetic Resonance 194 (2008) 264–282
Author's personal copy
phase increment along n � 10 consecutive pulses (for the case ofPMLG5).
The windowed PMLG5 based 2D experiments have shown aremarkable performance on both dimensions in terms of 1H resolu-tion. PMLG or FSLG decoupling blocks may be easily placed duringt1, while a windowed acquisition using wPMLG5 may be appliedduring t2. In such sequences (Fig. 1g–i) the wPMLG5 block mustbe carefully optimized as discussed above, by running several 1DwPMLG5 experiments. Essentially, the different 1H CRAMPS vari-ants shown here may be chosen according to: (i) the 1H region tobe enhanced in terms of resolution (ii) the possibility to implementthem because such techniques are strongly depend on thespectrometer console and probe characteristics since fast changesin phase or frequency are required. For further details concerningadditional insights into homonuclear decoupling, a theoretical com-parison between FSLG, PMLG, and DUMBO homonuclear decouplingsequences was very recently reported [84]. In that work numericalsimulations applied on such decoupling schemes are used toexplore the interaction between the magic-angle spinning and rfdecoupling, the effects of tilt pulses in acquisition windows andthe effects of phase propagation delay on tilted axis precession.
4.5. Application of 1H CRAMPS techniques to organic and inorganic–organic materials
In this second part, the aim is to demonstrate the robustnessand usefulness of 1H CRAMPS LG-based decoupling techniques
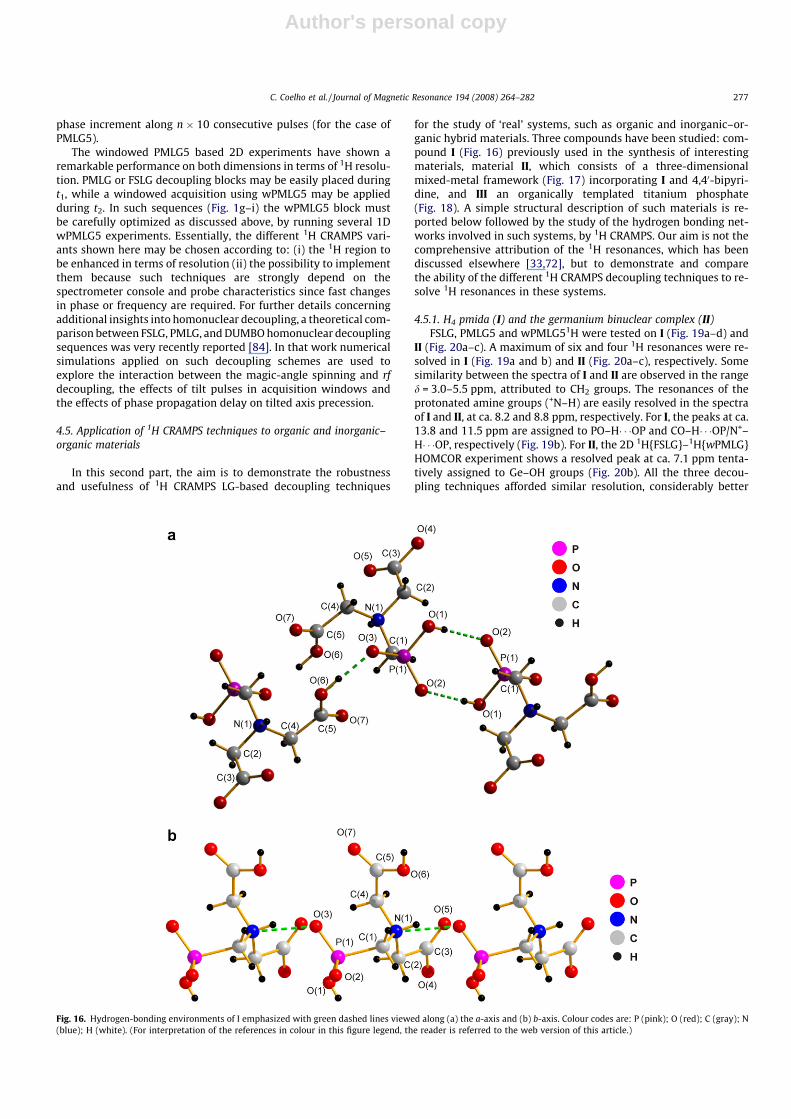
for the study of ‘real’ systems, such as organic and inorganic–or-ganic hybrid materials. Three compounds have been studied: com-pound I (Fig. 16) previously used in the synthesis of interestingmaterials, material II, which consists of a three-dimensionalmixed-metal framework (Fig. 17) incorporating I and 4,40-bipyri-dine, and III an organically templated titanium phosphate(Fig. 18). A simple structural description of such materials is re-ported below followed by the study of the hydrogen bonding net-works involved in such systems, by 1H CRAMPS. Our aim is not thecomprehensive attribution of the 1H resonances, which has beendiscussed elsewhere [33,72], but to demonstrate and comparethe ability of the different 1H CRAMPS decoupling techniques to re-solve 1H resonances in these systems.
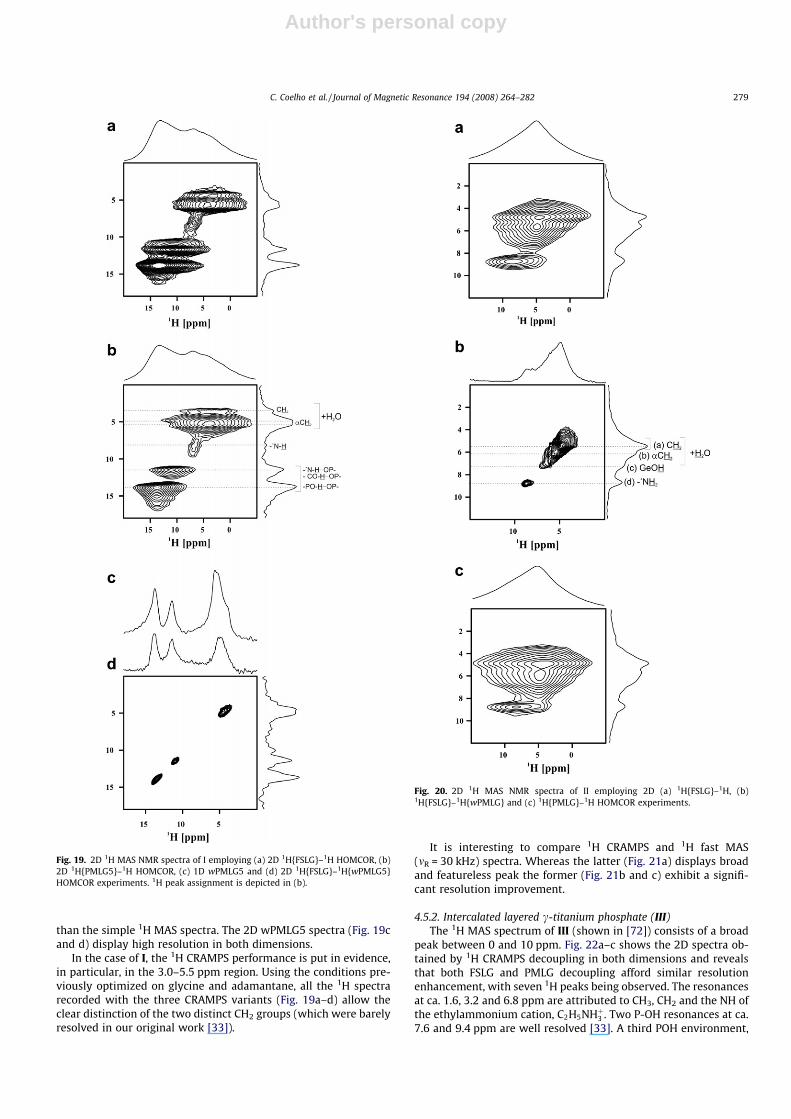
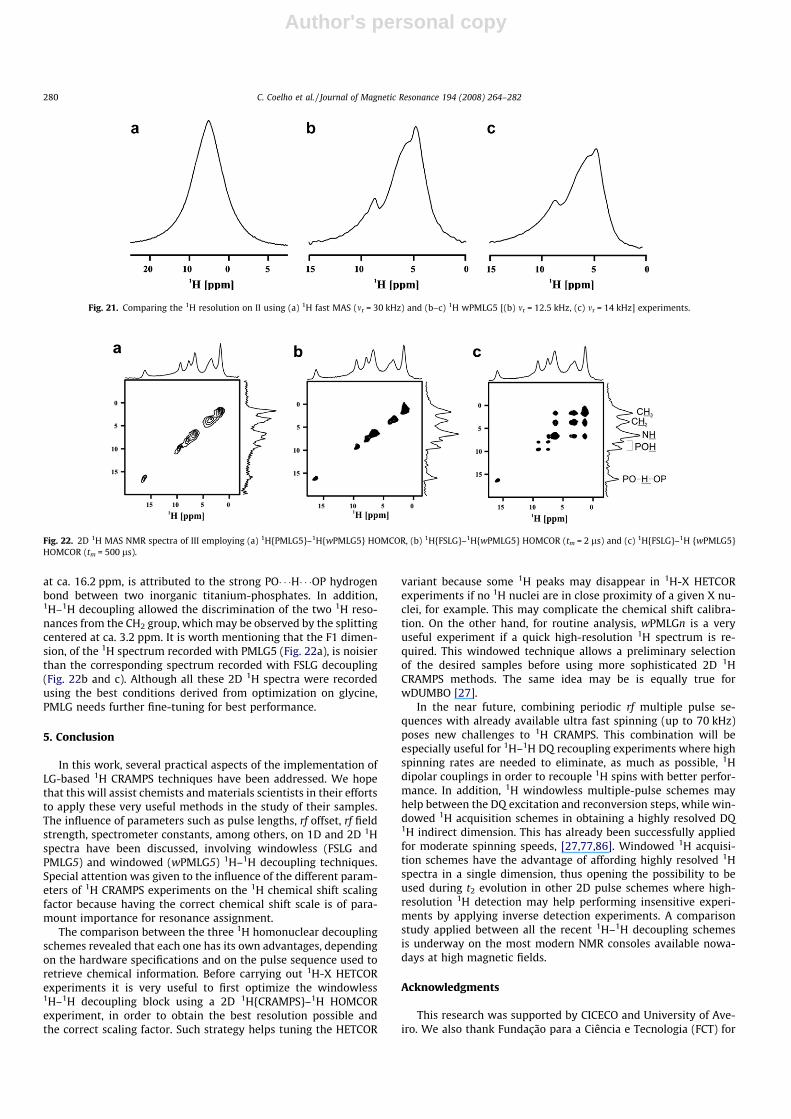
4.5.1. H4 pmida (I) and the germanium binuclear complex (II)FSLG, PMLG5 and wPMLG51H were tested on I (Fig. 19a–d) and
II (Fig. 20a–c). A maximum of six and four 1H resonances were re-solved in I (Fig. 19a and b) and II (Fig. 20a–c), respectively. Somesimilarity between the spectra of I and II are observed in the ranged = 3.0–5.5 ppm, attributed to CH2 groups. The resonances of theprotonated amine groups (+N–H) are easily resolved in the spectraof I and II, at ca. 8.2 and 8.8 ppm, respectively. For I, the peaks at ca.13.8 and 11.5 ppm are assigned to PO–H� � �OP and CO–H� � �OP/N+–H� � �OP, respectively (Fig. 19b). For II, the 2D 1H{FSLG}–1H{wPMLG}HOMCOR experiment shows a resolved peak at ca. 7.1 ppm tenta-tively assigned to Ge–OH groups (Fig. 20b). All the three decou-pling techniques afforded similar resolution, considerably better
Fig. 16. Hydrogen-bonding environments of I emphasized with green dashed lines viewed along (a) the a-axis and (b) b-axis. Colour codes are: P (pink); O (red); C (gray); N(blue); H (white). (For interpretation of the references in colour in this figure legend, the reader is referred to the web version of this article.)
C. Coelho et al. / Journal of Magnetic Resonance 194 (2008) 264–282 277
Author's personal copy
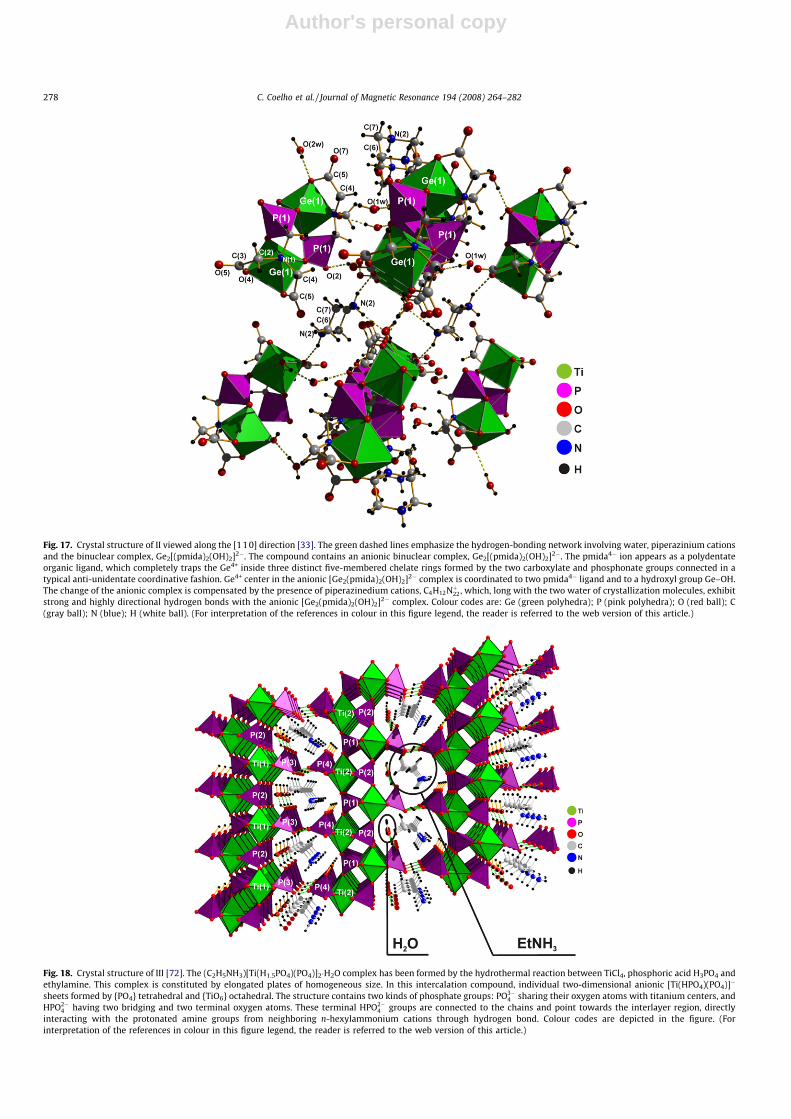
Fig. 17. Crystal structure of II viewed along the [110] direction [33]. The green dashed lines emphasize the hydrogen-bonding network involving water, piperazinium cationsand the binuclear complex, Ge2[(pmida)2(OH)2]2�. The compound contains an anionic binuclear complex, Ge2[(pmida)2(OH)2]2�. The pmida4� ion appears as a polydentateorganic ligand, which completely traps the Ge4+ inside three distinct five-membered chelate rings formed by the two carboxylate and phosphonate groups connected in atypical anti-unidentate coordinative fashion. Ge4+ center in the anionic [Ge2(pmida)2(OH)2]2� complex is coordinated to two pmida4� ligand and to a hydroxyl group Ge–OH.The change of the anionic complex is compensated by the presence of piperazinedium cations, C4H12Nþ22, which, long with the two water of crystallization molecules, exhibitstrong and highly directional hydrogen bonds with the anionic [Ge2(pmida)2(OH)2]2� complex. Colour codes are: Ge (green polyhedra); P (pink polyhedra); O (red ball); C(gray ball); N (blue); H (white ball). (For interpretation of the references in colour in this figure legend, the reader is referred to the web version of this article.)
Fig. 18. Crystal structure of III [72]. The (C2H5NH3)[Ti(H1.5PO4)(PO4)]2�H2O complex has been formed by the hydrothermal reaction between TiCl4, phosphoric acid H3PO4 andethylamine. This complex is constituted by elongated plates of homogeneous size. In this intercalation compound, individual two-dimensional anionic [Ti(HPO4)(PO4)]�
sheets formed by {PO4} tetrahedral and {TiO6} octahedral. The structure contains two kinds of phosphate groups: PO3�4 sharing their oxygen atoms with titanium centers, and
HPO2�4 having two bridging and two terminal oxygen atoms. These terminal HPO2�
4 groups are connected to the chains and point towards the interlayer region, directlyinteracting with the protonated amine groups from neighboring n-hexylammonium cations through hydrogen bond. Colour codes are depicted in the figure. (Forinterpretation of the references in colour in this figure legend, the reader is referred to the web version of this article.)
278 C. Coelho et al. / Journal of Magnetic Resonance 194 (2008) 264–282
Author's personal copy
than the simple 1H MAS spectra. The 2D wPMLG5 spectra (Fig. 19cand d) display high resolution in both dimensions.
In the case of I, the 1H CRAMPS performance is put in evidence,in particular, in the 3.0–5.5 ppm region. Using the conditions pre-viously optimized on glycine and adamantane, all the 1H spectrarecorded with the three CRAMPS variants (Fig. 19a–d) allow theclear distinction of the two distinct CH2 groups (which were barelyresolved in our original work [33]).
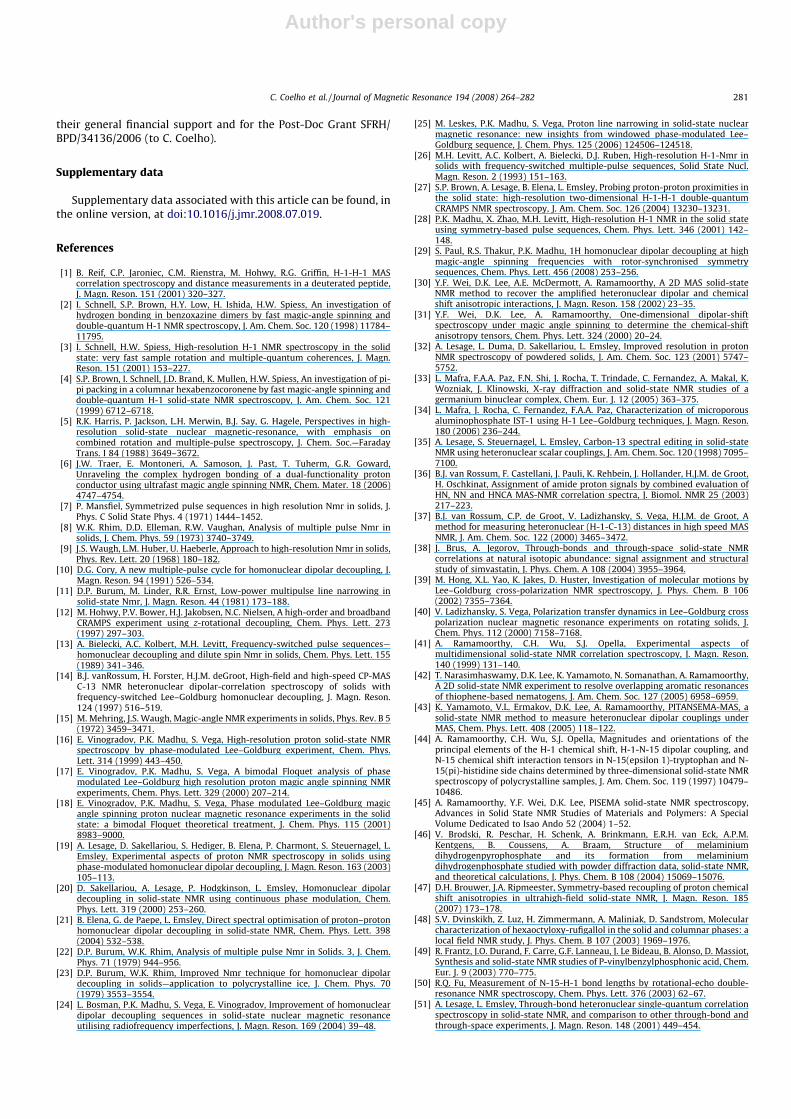
It is interesting to compare 1H CRAMPS and 1H fast MAS(mR = 30 kHz) spectra. Whereas the latter (Fig. 21a) displays broadand featureless peak the former (Fig. 21b and c) exhibit a signifi-cant resolution improvement.
4.5.2. Intercalated layered c-titanium phosphate (III)The 1H MAS spectrum of III (shown in [72]) consists of a broad
peak between 0 and 10 ppm. Fig. 22a–c shows the 2D spectra ob-tained by 1H CRAMPS decoupling in both dimensions and revealsthat both FSLG and PMLG decoupling afford similar resolutionenhancement, with seven 1H peaks being observed. The resonancesat ca. 1.6, 3.2 and 6.8 ppm are attributed to CH3, CH2 and the NH ofthe ethylammonium cation, C2H5NHþ3 . Two P-OH resonances at ca.7.6 and 9.4 ppm are well resolved [33]. A third POH environment,
Fig. 19. 2D 1H MAS NMR spectra of I employing (a) 2D 1H{FSLG}–1H HOMCOR, (b)2D 1H{PMLG5}–1H HOMCOR, (c) 1D wPMLG5 and (d) 2D 1H{FSLG}–1H{wPMLG5}HOMCOR experiments. 1H peak assignment is depicted in (b).
Fig. 20. 2D 1H MAS NMR spectra of II employing 2D (a) 1H{FSLG}–1H, (b)1H{FSLG}–1H{wPMLG} and (c) 1H{PMLG}–1H HOMCOR experiments.
C. Coelho et al. / Journal of Magnetic Resonance 194 (2008) 264–282 279
Author's personal copy
at ca. 16.2 ppm, is attributed to the strong PO� � �H� � �OP hydrogenbond between two inorganic titanium-phosphates. In addition,1H–1H decoupling allowed the discrimination of the two 1H reso-nances from the CH2 group, which may be observed by the splittingcentered at ca. 3.2 ppm. It is worth mentioning that the F1 dimen-sion, of the 1H spectrum recorded with PMLG5 (Fig. 22a), is noisierthan the corresponding spectrum recorded with FSLG decoupling(Fig. 22b and c). Although all these 2D 1H spectra were recordedusing the best conditions derived from optimization on glycine,PMLG needs further fine-tuning for best performance.
5. Conclusion
In this work, several practical aspects of the implementation ofLG-based 1H CRAMPS techniques have been addressed. We hopethat this will assist chemists and materials scientists in their effortsto apply these very useful methods in the study of their samples.The influence of parameters such as pulse lengths, rf offset, rf fieldstrength, spectrometer constants, among others, on 1D and 2D 1Hspectra have been discussed, involving windowless (FSLG andPMLG5) and windowed (wPMLG5) 1H–1H decoupling techniques.Special attention was given to the influence of the different param-eters of 1H CRAMPS experiments on the 1H chemical shift scalingfactor because having the correct chemical shift scale is of para-mount importance for resonance assignment.
The comparison between the three 1H homonuclear decouplingschemes revealed that each one has its own advantages, dependingon the hardware specifications and on the pulse sequence used toretrieve chemical information. Before carrying out 1H-X HETCORexperiments it is very useful to first optimize the windowless1H–1H decoupling block using a 2D 1H{CRAMPS}–1H HOMCORexperiment, in order to obtain the best resolution possible andthe correct scaling factor. Such strategy helps tuning the HETCOR
variant because some 1H peaks may disappear in 1H-X HETCORexperiments if no 1H nuclei are in close proximity of a given X nu-clei, for example. This may complicate the chemical shift calibra-tion. On the other hand, for routine analysis, wPMLGn is a veryuseful experiment if a quick high-resolution 1H spectrum is re-quired. This windowed technique allows a preliminary selectionof the desired samples before using more sophisticated 2D 1HCRAMPS methods. The same idea may be is equally true forwDUMBO [27].
In the near future, combining periodic rf multiple pulse se-quences with already available ultra fast spinning (up to 70 kHz)poses new challenges to 1H CRAMPS. This combination will beespecially useful for 1H–1H DQ recoupling experiments where highspinning rates are needed to eliminate, as much as possible, 1Hdipolar couplings in order to recouple 1H spins with better perfor-mance. In addition, 1H windowless multiple-pulse schemes mayhelp between the DQ excitation and reconversion steps, while win-dowed 1H acquisition schemes in obtaining a highly resolved DQ1H indirect dimension. This has already been successfully appliedfor moderate spinning speeds, [27,77,86]. Windowed 1H acquisi-tion schemes have the advantage of affording highly resolved 1Hspectra in a single dimension, thus opening the possibility to beused during t2 evolution in other 2D pulse schemes where high-resolution 1H detection may help performing insensitive experi-ments by applying inverse detection experiments. A comparisonstudy applied between all the recent 1H–1H decoupling schemesis underway on the most modern NMR consoles available nowa-days at high magnetic fields.
Acknowledgments
This research was supported by CICECO and University of Ave-iro. We also thank Fundação para a Ciência e Tecnologia (FCT) for
Fig. 21. Comparing the 1H resolution on II using (a) 1H fast MAS (mr = 30 kHz) and (b–c) 1H wPMLG5 [(b) mr = 12.5 kHz, (c) mr = 14 kHz] experiments.
Fig. 22. 2D 1H MAS NMR spectra of III employing (a) 1H{PMLG5}–1H{wPMLG5} HOMCOR, (b) 1H{FSLG}–1H{wPMLG5} HOMCOR (tm = 2 ls) and (c) 1H{FSLG}–1H {wPMLG5}HOMCOR (tm = 500 ls).
280 C. Coelho et al. / Journal of Magnetic Resonance 194 (2008) 264–282
Author's personal copy
their general financial support and for the Post-Doc Grant SFRH/BPD/34136/2006 (to C. Coelho).
Supplementary data
Supplementary data associated with this article can be found, inthe online version, at doi:10.1016/j.jmr.2008.07.019.
References
[1] B. Reif, C.P. Jaroniec, C.M. Rienstra, M. Hohwy, R.G. Griffin, H-1-H-1 MAScorrelation spectroscopy and distance measurements in a deuterated peptide,J. Magn. Reson. 151 (2001) 320–327.
[2] I. Schnell, S.P. Brown, H.Y. Low, H. Ishida, H.W. Spiess, An investigation ofhydrogen bonding in benzoxazine dimers by fast magic-angle spinning anddouble-quantum H-1 NMR spectroscopy, J. Am. Chem. Soc. 120 (1998) 11784–11795.
[3] I. Schnell, H.W. Spiess, High-resolution H-1 NMR spectroscopy in the solidstate: very fast sample rotation and multiple-quantum coherences, J. Magn.Reson. 151 (2001) 153–227.
[4] S.P. Brown, I. Schnell, J.D. Brand, K. Mullen, H.W. Spiess, An investigation of pi-pi packing in a columnar hexabenzocoronene by fast magic-angle spinning anddouble-quantum H-1 solid-state NMR spectroscopy, J. Am. Chem. Soc. 121(1999) 6712–6718.
[5] R.K. Harris, P. Jackson, L.H. Merwin, B.J. Say, G. Hagele, Perspectives in high-resolution solid-state nuclear magnetic-resonance, with emphasis oncombined rotation and multiple-pulse spectroscopy, J. Chem. Soc.—FaradayTrans. I 84 (1988) 3649–3672.
[6] J.W. Traer, E. Montoneri, A. Samoson, J. Past, T. Tuherm, G.R. Goward,Unraveling the complex hydrogen bonding of a dual-functionality protonconductor using ultrafast magic angle spinning NMR, Chem. Mater. 18 (2006)4747–4754.
[7] P. Mansfiel, Symmetrized pulse sequences in high resolution Nmr in solids, J.Phys. C Solid State Phys. 4 (1971) 1444–1452.
[8] W.K. Rhim, D.D. Elleman, R.W. Vaughan, Analysis of multiple pulse Nmr insolids, J. Chem. Phys. 59 (1973) 3740–3749.
[9] J.S. Waugh, L.M. Huber, U. Haeberle, Approach to high-resolution Nmr in solids,Phys. Rev. Lett. 20 (1968) 180–182.
[10] D.G. Cory, A new multiple-pulse cycle for homonuclear dipolar decoupling, J.Magn. Reson. 94 (1991) 526–534.
[11] D.P. Burum, M. Linder, R.R. Ernst, Low-power multipulse line narrowing insolid-state Nmr, J. Magn. Reson. 44 (1981) 173–188.
[12] M. Hohwy, P.V. Bower, H.J. Jakobsen, N.C. Nielsen, A high-order and broadbandCRAMPS experiment using z-rotational decoupling, Chem. Phys. Lett. 273(1997) 297–303.
[13] A. Bielecki, A.C. Kolbert, M.H. Levitt, Frequency-switched pulse sequences—homonuclear decoupling and dilute spin Nmr in solids, Chem. Phys. Lett. 155(1989) 341–346.
[14] B.J. vanRossum, H. Forster, H.J.M. deGroot, High-field and high-speed CP-MASC-13 NMR heteronuclear dipolar-correlation spectroscopy of solids withfrequency-switched Lee–Goldburg homonuclear decoupling, J. Magn. Reson.124 (1997) 516–519.
[15] M. Mehring, J.S. Waugh, Magic-angle NMR experiments in solids, Phys. Rev. B 5(1972) 3459–3471.
[16] E. Vinogradov, P.K. Madhu, S. Vega, High-resolution proton solid-state NMRspectroscopy by phase-modulated Lee–Goldburg experiment, Chem. Phys.Lett. 314 (1999) 443–450.
[17] E. Vinogradov, P.K. Madhu, S. Vega, A bimodal Floquet analysis of phasemodulated Lee–Goldburg high resolution proton magic angle spinning NMRexperiments, Chem. Phys. Lett. 329 (2000) 207–214.
[18] E. Vinogradov, P.K. Madhu, S. Vega, Phase modulated Lee–Goldburg magicangle spinning proton nuclear magnetic resonance experiments in the solidstate: a bimodal Floquet theoretical treatment, J. Chem. Phys. 115 (2001)8983–9000.
[19] A. Lesage, D. Sakellariou, S. Hediger, B. Elena, P. Charmont, S. Steuernagel, L.Emsley, Experimental aspects of proton NMR spectroscopy in solids usingphase-modulated homonuclear dipolar decoupling, J. Magn. Reson. 163 (2003)105–113.
[20] D. Sakellariou, A. Lesage, P. Hodgkinson, L. Emsley, Homonuclear dipolardecoupling in solid-state NMR using continuous phase modulation, Chem.Phys. Lett. 319 (2000) 253–260.
[21] B. Elena, G. de Paepe, L. Emsley, Direct spectral optimisation of proton–protonhomonuclear dipolar decoupling in solid-state NMR, Chem. Phys. Lett. 398(2004) 532–538.
[22] D.P. Burum, W.K. Rhim, Analysis of multiple pulse Nmr in Solids. 3, J. Chem.Phys. 71 (1979) 944–956.
[23] D.P. Burum, W.K. Rhim, Improved Nmr technique for homonuclear dipolardecoupling in solids—application to polycrystalline ice, J. Chem. Phys. 70(1979) 3553–3554.
[24] L. Bosman, P.K. Madhu, S. Vega, E. Vinogradov, Improvement of homonucleardipolar decoupling sequences in solid-state nuclear magnetic resonanceutilising radiofrequency imperfections, J. Magn. Reson. 169 (2004) 39–48.
[25] M. Leskes, P.K. Madhu, S. Vega, Proton line narrowing in solid-state nuclearmagnetic resonance: new insights from windowed phase-modulated Lee–Goldburg sequence, J. Chem. Phys. 125 (2006) 124506–124518.
[26] M.H. Levitt, A.C. Kolbert, A. Bielecki, D.J. Ruben, High-resolution H-1-Nmr insolids with frequency-switched multiple-pulse sequences, Solid State Nucl.Magn. Reson. 2 (1993) 151–163.
[27] S.P. Brown, A. Lesage, B. Elena, L. Emsley, Probing proton-proton proximities inthe solid state: high-resolution two-dimensional H-1-H-1 double-quantumCRAMPS NMR spectroscopy, J. Am. Chem. Soc. 126 (2004) 13230–13231.
[28] P.K. Madhu, X. Zhao, M.H. Levitt, High-resolution H-1 NMR in the solid stateusing symmetry-based pulse sequences, Chem. Phys. Lett. 346 (2001) 142–148.
[29] S. Paul, R.S. Thakur, P.K. Madhu, 1H homonuclear dipolar decoupling at highmagic-angle spinning frequencies with rotor-synchronised symmetrysequences, Chem. Phys. Lett. 456 (2008) 253–256.
[30] Y.F. Wei, D.K. Lee, A.E. McDermott, A. Ramamoorthy, A 2D MAS solid-stateNMR method to recover the amplified heteronuclear dipolar and chemicalshift anisotropic interactions, J. Magn. Reson. 158 (2002) 23–35.
[31] Y.F. Wei, D.K. Lee, A. Ramamoorthy, One-dimensional dipolar-shiftspectroscopy under magic angle spinning to determine the chemical-shiftanisotropy tensors, Chem. Phys. Lett. 324 (2000) 20–24.
[32] A. Lesage, L. Duma, D. Sakellariou, L. Emsley, Improved resolution in protonNMR spectroscopy of powdered solids, J. Am. Chem. Soc. 123 (2001) 5747–5752.
[33] L. Mafra, F.A.A. Paz, F.N. Shi, J. Rocha, T. Trindade, C. Fernandez, A. Makal, K.Wozniak, J. Klinowski, X-ray diffraction and solid-state NMR studies of agermanium binuclear complex, Chem. Eur. J. 12 (2005) 363–375.
[34] L. Mafra, J. Rocha, C. Fernandez, F.A.A. Paz, Characterization of microporousaluminophosphate IST-1 using H-1 Lee–Goldburg techniques, J. Magn. Reson.180 (2006) 236–244.
[35] A. Lesage, S. Steuernagel, L. Emsley, Carbon-13 spectral editing in solid-stateNMR using heteronuclear scalar couplings, J. Am. Chem. Soc. 120 (1998) 7095–7100.
[36] B.J. van Rossum, F. Castellani, J. Pauli, K. Rehbein, J. Hollander, H.J.M. de Groot,H. Oschkinat, Assignment of amide proton signals by combined evaluation ofHN, NN and HNCA MAS-NMR correlation spectra, J. Biomol. NMR 25 (2003)217–223.
[37] B.J. van Rossum, C.P. de Groot, V. Ladizhansky, S. Vega, H.J.M. de Groot, Amethod for measuring heteronuclear (H-1-C-13) distances in high speed MASNMR, J. Am. Chem. Soc. 122 (2000) 3465–3472.
[38] J. Brus, A. Jegorov, Through-bonds and through-space solid-state NMRcorrelations at natural isotopic abundance: signal assignment and structuralstudy of simvastatin, J. Phys. Chem. A 108 (2004) 3955–3964.
[39] M. Hong, X.L. Yao, K. Jakes, D. Huster, Investigation of molecular motions byLee–Goldburg cross-polarization NMR spectroscopy, J. Phys. Chem. B 106(2002) 7355–7364.
[40] V. Ladizhansky, S. Vega, Polarization transfer dynamics in Lee–Goldburg crosspolarization nuclear magnetic resonance experiments on rotating solids, J.Chem. Phys. 112 (2000) 7158–7168.
[41] A. Ramamoorthy, C.H. Wu, S.J. Opella, Experimental aspects ofmultidimensional solid-state NMR correlation spectroscopy, J. Magn. Reson.140 (1999) 131–140.
[42] T. Narasimhaswamy, D.K. Lee, K. Yamamoto, N. Somanathan, A. Ramamoorthy,A 2D solid-state NMR experiment to resolve overlapping aromatic resonancesof thiophene-based nematogens, J. Am. Chem. Soc. 127 (2005) 6958–6959.
[43] K. Yamamoto, V.L. Ermakov, D.K. Lee, A. Ramamoorthy, PITANSEMA-MAS, asolid-state NMR method to measure heteronuclear dipolar couplings underMAS, Chem. Phys. Lett. 408 (2005) 118–122.
[44] A. Ramamoorthy, C.H. Wu, S.J. Opella, Magnitudes and orientations of theprincipal elements of the H-1 chemical shift, H-1-N-15 dipolar coupling, andN-15 chemical shift interaction tensors in N-15(epsilon 1)-tryptophan and N-15(pi)-histidine side chains determined by three-dimensional solid-state NMRspectroscopy of polycrystalline samples, J. Am. Chem. Soc. 119 (1997) 10479–10486.
[45] A. Ramamoorthy, Y.F. Wei, D.K. Lee, PISEMA solid-state NMR spectroscopy,Advances in Solid State NMR Studies of Materials and Polymers: A SpecialVolume Dedicated to Isao Ando 52 (2004) 1–52.
[46] V. Brodski, R. Peschar, H. Schenk, A. Brinkmann, E.R.H. van Eck, A.P.M.Kentgens, B. Coussens, A. Braam, Structure of melaminiumdihydrogenpyrophosphate and its formation from melaminiumdihydrogenphosphate studied with powder diffraction data, solid-state NMR,and theoretical calculations, J. Phys. Chem. B 108 (2004) 15069–15076.
[47] D.H. Brouwer, J.A. Ripmeester, Symmetry-based recoupling of proton chemicalshift anisotropies in ultrahigh-field solid-state NMR, J. Magn. Reson. 185(2007) 173–178.
[48] S.V. Dvinskikh, Z. Luz, H. Zimmermann, A. Maliniak, D. Sandstrom, Molecularcharacterization of hexaoctyloxy-rufigallol in the solid and columnar phases: alocal field NMR study, J. Phys. Chem. B 107 (2003) 1969–1976.
[49] R. Frantz, J.O. Durand, F. Carre, G.F. Lanneau, J. Le Bideau, B. Alonso, D. Massiot,Synthesis and solid-state NMR studies of P-vinylbenzylphosphonic acid, Chem.Eur. J. 9 (2003) 770–775.
[50] R.Q. Fu, Measurement of N-15-H-1 bond lengths by rotational-echo double-resonance NMR spectroscopy, Chem. Phys. Lett. 376 (2003) 62–67.
[51] A. Lesage, L. Emsley, Through-bond heteronuclear single-quantum correlationspectroscopy in solid-state NMR, and comparison to other through-bond andthrough-space experiments, J. Magn. Reson. 148 (2001) 449–454.
C. Coelho et al. / Journal of Magnetic Resonance 194 (2008) 264–282 281
Author's personal copy
[52] M. Marjanska, F. Castiglione, J.D. Walls, A. Pines, Measurement of dipolarcouplings in partially oriented molecules by local field NMR spectroscopy withlow-power decoupling, J. Magn. Reson. 158 (2002) 52–59.
[53] G. Piedra, J.J. Fitzgerald, N. Dando, S.F. Dec, G.E. Maciel, Solid-state H-1 NMRstudies of aluminum oxide hydroxides and hydroxides, Inorg. Chem. 35 (1996)3474–3478.
[54] D. Sakellariou, A. Lesage, L. Emsley, Proton–proton constraints in powderedsolids from H-1-H-1-H-1 and H-1-H-1-C-13 three-dimensional NMR chemicalshift correlation spectroscopy, J. Am. Chem. Soc. 123 (2001) 5604–5605.
[55] Z.T. Gu, S.J. Opella, Three-dimensional C-13 shift/H-1-N-15 coupling/N-15 shiftsolid-state NMR correlation spectroscopy, J. Magn. Reson. 138 (1999) 193–198.
[56] Alia, J. Matysik, I. de Boer, P. Gast, H.J. van Gorkom, H.J.M. de Groot,Heteronuclear 2D (H-1-C-13) MAS NMR resolves the electronic structure ofcoordinated histidines in light-harvesting complex II: assessment of chargetransfer and electronic delocalization effect, J. Biomol. NMR 28 (2004) 157–164.
[57] V. Chevelkov, B.J. van Rossum, F. Castellani, K. Rehbein, A. Diehl, M. Hohwy, S.Steuernagel, F. Engelke, H. Oschkinat, B. Reif, H-1 detection in MAS solid-stateNMR spectroscopy of biomacromolecules employing pulsed field gradients forresidual solvent suppression, J. Am. Chem. Soc. 125 (2003) 7788–7789.
[58] A.F.L. Creemers, S. Kiihne, P.H.M. Bovee-Geurts, W.J. DeGrip, J. Lugtenburg,H.J.M. de Groot, H-1 and C-13 MAS NMR evidence for pronounced ligand–protein interactions involving the ionone ring of the retinylidene chromophorein rhodopsin, Proceedings of the National Academy of Sciences of the UnitedStates of America 99 (2002) 9101–9106.
[59] R.Q. Fu, C.L. Tian, T.A. Cross, NMR spin locking of proton magnetization under afrequency-switched Lee–Goldburg pulse sequence, J. Magn. Reson. 154 (2002)130–135.
[60] D. Huster, S. Yamaguchi, M. Hong, Efficient beta-sheet identification inproteins by solid-state NMR spectroscopy, J. Am. Chem. Soc. 122 (2000)11320–11327.
[61] D. Huster, X.L. Yao, M. Hong, Membrane protein topology probed by H-1 spindiffusion from lipids using solid-state NMR spectroscopy, J. Am. Chem. Soc.124 (2002) 874–883.
[62] H. Kono, T. Erata, M. Takai, Determination of the through-bond carbon–carbonand carbon–proton connectivities of the native celluloses in the solid state,Macromolecules 36 (2003) 5131–5138.
[63] A. Lesage, P. Charmont, S. Steuernagel, L. Emsley, Complete resonanceassignment of a natural abundance solid peptide by through-bondheteronuclear correlation solid-state NMR, J. Am. Chem. Soc. 122 (2000)9739–9744.
[64] K. Murata, H. Kono, E. Katoh, S. Kuroki, I. Ando, A study of conformationalstability of polypeptide blends by solid state two-dimensional C-13-H-1heteronuclear correlation NMR spectroscopy, Polymer 44 (2003) 4021–4027.
[65] B.J. van Rossum, F. Castellani, K. Rehbein, J. Pauli, H. Oschkinat, Assignment ofthe nonexchanging protons of the alpha-spectrin SH3 domain by two- andthree-dimensional H-1-C-13 solid-state magic-angle spinning NMR andcomparison of solution and solid-state proton chemical shifts, Chembiochem2 (2001) 906–914.
[66] K. Yamauchi, S. Kuroki, I. Ando, The amide proton NMR chemical shift andhydrogen-bonded structure of glycine-containing peptides and polypeptidesin the solid state as studied by multi-pulse-associated high-speed MAS H-1NMR, J. Mol. Struct. 602 (2002) 9–16.
[67] X.L. Yao, V.P. Conticello, M. Hong, Investigation of the dynamics of an elastin-mimetic polypeptide using solid-state NMR, Magn. Reson. Chem. 42 (2004)267–275.
[68] Y.F. Wei, D.K. Lee, K.J. Hallock, A. Ramamoorthy, One-dimensional H-1-detected solid-state NMR experiment to determine amide-H-1 chemical shiftsin peptides, Chem. Phys. Lett. 351 (2002) 42–46.
[69] B.J. van Rossum, E.A.M. Schulten, J. Raap, H. Oschkinat, H.J.M. de Groot, A 3-Dstructural model of solid self-assembled chlorophyll a/H2O from multispinlabeling and MAS NMR 2-D dipolar correlation spectroscopy in high magneticfield, J. Magn. Reson. 155 (2002) 1–14.
[70] X.J. Ai, F. Deng, J.X. Dong, W. Hu, H. Xu, C.H. Ye, One- and two-dimensionalsolid-state magic angle spinning NMR studies on the hydration process oflayered sodium disilicate SKS-6, Solid State Nucl. Magn. Reson. 25 (2004) 216–226.
[71] B. Alonso, D. Massiot, Mufti-scale NMR characterisation of mesostructuredmaterials using H-1 ? C-13 through-bond polarisation transfer, fast MAS, andH-1 spin diffusion, J. Magn. Reson. 163 (2003) 347–352.
[72] L. Mafra, J. Rocha, C. Fernandez, G.R. Castro, S. García-Granda, A. Espina, S.A.Khainakov, J.R. García, Characterization of layered c-titanium phosphate(C2H5NH3)[Ti(H1�5PO4)(PO4)]2�H2O intercalate: a combined NMR,synchrotron XRD, and DFT calculations study, Chemistry of Materials (2008).
[73] D. Massiot, B. Alonso, F. Fayon, F. Fredoueil, B. Bujoli, New NMR developmentsfor structural investigation of proton-bearing materials at different lengthscales, Solid State Sci. 3 (2001) 11–16.
[74] J. Trebosc, J.W. Wiench, S. Huh, V.S.Y. Lin, M. Pruski, Studies of organicallyfunctionalized mesoporous silicas using heteronuclear solid-state correlationNMR spectroscopy under fast magic angle spinning, J. Am. Chem. Soc. 127(2005) 7587–7593.
[75] P. Sozzani, S. Bracco, A. Comotti, R. Simonutti, I. Camurati, Stoichlometriccompounds of magnesium dichloride with ethanol for the supported Ziegler-Natta catalysis: first recognition and multidimensional MAS NMR study, J. Am.Chem. Soc. 125 (2003) 12881–12893.
[76] V. Ladizhansky, G. Hodes, S. Vega, Solid state NMR study of water binding onthe surface of CdS nanoparticles, J. Phys. Chem. B 104 (2000) 1939–1943.
[77] J.M. Griffin, D.R. Martin, S.P. Brown, Distinguishing anhydrous and hydrousforms of an active pharmaceutical ingredient in a tablet formulation usingsolid-state NMR spectroscopy, Angew. Chem. Int. Ed. 46 (2007) 8036–8038.
[78] P. Charmont, A. Lesage, S. Steuernagel, F. Engelke, L. Emsley, Sample restrictionusing magnetic field gradients in high-resolution solid-state NMR, J. Magn.Reson. 145 (2000) 334–339.
[79] U. Haeberlen, High Resolution NMR Solids (1976).[80] M. Mehring, J.S. Waugh, Magic-angle Nmr experiments in solids, Phys. Rev. B 5
(1972) 3459.[81] B.J. van Rossum, G.J. Boender, F.M. Mulder, J. Raap, T.S. Balaban, A. Holzwarth,
K. Schaffner, S. Prytulla, H. Oschkinat, H.J.M. de Groot, Multidimensional CP-MAS C-13 NMR of uniformly enriched chlorophyll, Spectrochim. Acta A Mol.Biomol. Spectrosc. 54 (1998) 1167–1176.
[82] M. Ernst, A. Verhoeven, B.H. Meier, High-speed magic-angle spinning C-13MAS NMR spectra of adamantane: self-decoupling of the heteronuclear scalarinteraction and proton spin diffusion, J. Magn. Reson. 130 (1998) 176–185.
[83] B.A.G. Xwin, NMR Software Manual, 1999.[84] V.E. Zorin, M. Ernst, S.P. Brown, P. Hodgkinson, Insihts into homonuclear
decoupling from effiient numerical simulation: techniques and examples, J.Magn. Reson. 192 (2008) 183–196.
[85] E. Vinogradov, P.K. Madhu, S. Vega, Strategies for high-resolution protonspectroscopy in solid-state NMR, New Techn. Solid-State NMR 246 (2005) 33–90.
[86] P.K. Madhu, E. Vinogradov, S. Vega, Multiple-pulse and magic-angle spinningaided double-quantum proton solid-state NMR spectroscopy, Chem. Phys. Lett.394 (2004) 423–428.
282 C. Coelho et al. / Journal of Magnetic Resonance 194 (2008) 264–282