
Data-Driven Online Optimization for Enhancing Power System ...
Upload
independentCategory
view
0download
0
Power System Optimization (PSO)
EDSA MICRO CORPORATION 16870 West Bernardo Drive, Suite 330
San Diego, CA 92127 U.S.A.
© Copyright 2008
All Rights Reserved
Version 3.10.00 October 2008
Power System Optimization (PSO)
Table of Contents
Page 1 Overview of DesignBase Power System Optimization...................................................................1
1.1 V&V for Inclusion Of Feeder/Transformer Loading Constraints.............................................3 2 Solution Algorithm of the PSO program .........................................................................................7
3 Objective Functions Supported by PSO.........................................................................................8
4 Power Systems Controls in PSO....................................................................................................9
5 Constraint Modeling in PSO .........................................................................................................10
6 Power System Optimization Tutorial ............................................................................................11
7 Optimization Settings for Utility Buses .........................................................................................14
8 Optimization Settings for Load Buses, Bus Bars & Nodes ..........................................................15
9 Optimization Settings for Transformers........................................................................................16
10 Optimization Settings for Feeders ................................................................................................17
11 The Power System Optimization Program Interface ....................................................................18
12 Changing Bus Voltage Limits .......................................................................................................19
13 Minimization of System Losses ....................................................................................................20
14 Minimization of Generation Costs ................................................................................................23
15 Minimization of Controls Movements ...........................................................................................26
16 The PSO Report Manager............................................................................................................29
17 How to Perform Minimization of Active Power Generation ..........................................................30
18 How to Perform Minimization of Load Shedding Analysis............................................................36
19 How to Perform Optimization of Reactive Power Resources.......................................................42
20 How to Perform Minimum Control Adjustments ...........................................................................47
i

Power System Optimization (PSO)
ii
List of Figures Page Figure 1: Defining Large Feeder Loading Constraints.........................................................................3 Figure 2: Defining Large Transformer Loading Constraints ................................................................3 Figure 3: Improved Optimization Reporting: Optimization Result - Loading Constraints not
considered ............................................................................................................................5 Figure 4: Optimization Result - Loading Constraints are taken into Account ......................................6 Figure 5: Single Line Diagram of the Sample Jobfile used in V&V of the “Minimization of
Generation Cost” ................................................................................................................30 Figure 6: Control Settings used in V&V of the “Minimization of Generation Cost” ............................30 Figure 7: Piece-Wise Generation Cost for bus “AAA138 Generator” used in V&V of the
“Minimization of Generation Cost” ......................................................................................31 Figure 8: Single Line Diagram of the Sample Jobfile used in V&V of the “Minimization of Load
Shedding” ...........................................................................................................................36 Figure 9: Control Settings used in V&V of the “Minimization of Load Shedding” ..............................37 Figure 10: Candidate Buses for the Load Shedding used in V&V of the “Minimization of Load
Shedding” ...........................................................................................................................37 Figure 11: Single Line Diagram of the Sample Jobfile used in V&V of the “Optimization of
Reactive Power Resources” ...............................................................................................42 Figure 12: Control Settings used in V&V of the “Optimization of Reactive Power Resources”...........42 Figure 13: Candidate Buses for reactive power resources used in V&V of the “Optimization of
Reactive Power Resources” ...............................................................................................43 Figure 14: Single Line Diagram of the Sample Jobfile used in V&V of the “Minimum Control
Adjustments”.......................................................................................................................47 Figure 15: Control Settings used in V&V of the “Minimum Control Adjustments” ...............................47 Note: You can view this manual from your CD as an Adobe Acrobat PDF file. The file name is:
Power System Optimization PSO.pdf
You will find the Test/Job files used in this tutorial in the following location:
C:\DesignBase\Samples\PSO = Power System Optimization Test Files: PSO, Pso_14node_MinControls, PSO_14node_MinGenCost2
ALL RIGHTS RESERVED COPYRIGHT 2008

Power System Optimization (PSO)
1 Overview of DesignBase Power System Optimization The Power System Optimization (PSO) is an advanced security constrained optimal powerflow (SCOPF) software that is also a tool for optimal sizing and placement of reactive power resources (reactors, capacitors, and SVCs). The control settings such as generators active power, transformer taps, scheduled voltages of generators are optimized not only for the basecase system configuration but also for up to fifty different system configurations! PSO in the SCOPF mode finds an operating point that optimizes a given objective function and satisfies a set of physical and operating constraints for the base network configuration and contingency situations. In the reactive power planning mode of operation, PSO determines a minimum cost reactive power expansion plan in VAr equipment which ensures feasible system operation simultaneously for the normal state (basecase) and under contingency situations. The PSO utilizes the state-of-the art in optimization techniques to assist engineers to minimize system losses, perform economic dispatch, minimize load shedding, plan reactive power resources, and optimize system voltage profile with minimum control setting movements. The present release of PSO supports the following power system optimization functions:
Minimization of Total System Losses: PSO finds the optimum control settings for the generators scheduled voltages, active power generations, transformer taps, SVCs scheduled voltages such that total system active power losses is minimized. PSO at the same time makes sure that all system voltages are within user defined range, power flows through lines and transformers are within limits, active power generations are within minimum and maximum generators limits, and transformer taps are within their upper and lower bounds.
Minimization of Total Generation Cost: (also known as economic dispatch) PSO will allocate active power generations to different generators in the system such that total generation cost is minimized. Again PSO will make sure that all system constraints are met (i.e. system voltages are within user defined range, power flows through lines and transformers are within limits, etc.).
Minimization of Controls Movements: PSO finds minimum controls movements (generators scheduled voltages, active power generations, transformer taps, SVCs scheduled voltages) such that all system voltages are within user defined range, power flows through lines and transformers are within limits, active power generations are within minimum and maximum generators limits, and transformer taps are within their upper and lower bounds.
Minimization of Load Shedding: PSO will determine the minimum amount of load shedding (including locations) required such that all system constraints are met (i.e. system voltages are within user defined range, power flows through lines and transformers are within limits, etc.)
Minimization of Reactive Power Resource Allocation Cost: PSO minimizes the cost of addition of new reactive resources (i.e., capacitors/inductors) such that all system constraints are met. The user can select the locations of reactive power resources or PSO program will identify the most effective sites.
The following optimization functions will be supported in the next release of the PSO (these functions are already implemented and at the present time they are in the V&V stage):
1

Power System Optimization (PSO)
2
Maximization of Active Power Flow Across an Interface: PSO maximizes active power flow across an interface (set of circuits) while at the same time maintaining feasibility in the contingency configurations and basecase (i.e., all system constraints are met). This function is of paramount importance in determination of “Available Transfer Capability” (ATC).
Maximization of Loads at a Group of Buses: PSO maximizes the load at a group of buses while maintaining the same load power factor and feasibility in the basecase and contingency configurations. PSO can also determine the optimal direction of load increase. Candidate sites for load increase can be specified individually, by area, or by zone. This objective function can be used in the computation of voltage stability margins (voltage collapse) capability in a given area.
Maximization of Active Power Transfer between two Groups of Buses: PSO maximizes the active power transfer between any pair of network buses while insuring system feasibility in the basecase and contingency configurations. This function can also be used to determine the “Available Transfer Capability” (ATC).
Minimization of Swing Bus Generation: PSO will re-allocate the power generation at the swing bus(es) to all other generators in the system such that all system constraints are met.
PSO is capable of handling power systems comprising thousands of buses and has been successfully used to optimize the planning and operation of large number of complex power systems. This user guide will highlight the practical aspects of using PSO and provides examples.

Power System Optimization (PSO)
1.1 V&V for Inclusion Of Feeder/Transformer Loading Constraints To show that this new feature is working as expected, we first define the feeders/transformers loading limits to be large (e.g. 500% of their rating), as shown below:
Figure 1: Defining Large Feeder Loading Constraints
Figure 2: Defining Large Transformer Loading Constraints
The result of optimization is shown below which are exactly the same as those obtained for loss minimization in version 2.00.00 of program (see section 20) where feeder/transformer loading constraints were not imposed:
3
Power System Optimization (PSO)
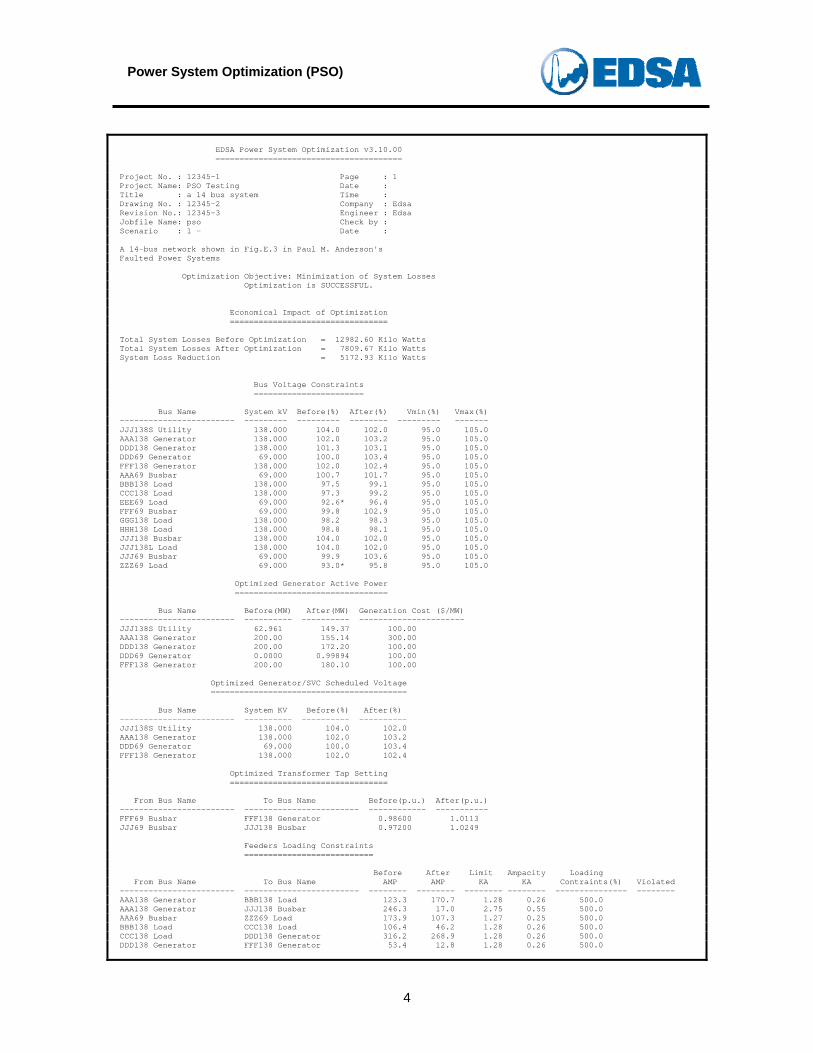
EDSA Power System Optimization v3.10.00 ======================================= Project No. : 12345-1 Page : 1 Project Name: PSO Testing Date : Title : a 14 bus system Time : Drawing No. : 12345-2 Company : Edsa Revision No.: 12345-3 Engineer : Edsa Jobfile Name: pso Check by : Scenario : 1 - Date : A 14-bus network shown in Fig.E.3 in Paul M. Anderson's Faulted Power Systems Optimization Objective: Minimization of System Losses Optimization is SUCCESSFUL. Economical Impact of Optimization ================================= Total System Losses Before Optimization = 12982.60 Kilo Watts Total System Losses After Optimization = 7809.67 Kilo Watts System Loss Reduction = 5172.93 Kilo Watts Bus Voltage Constraints ======================= Bus Name System kV Before(%) After(%) Vmin(%) Vmax(%) ------------------------ --------- --------- -------- --------- ------- JJJ138S Utility 138.000 104.0 102.0 95.0 105.0 AAA138 Generator 138.000 102.0 103.2 95.0 105.0 DDD138 Generator 138.000 101.3 103.1 95.0 105.0 DDD69 Generator 69.000 100.0 103.4 95.0 105.0 FFF138 Generator 138.000 102.0 102.4 95.0 105.0 AAA69 Busbar 69.000 100.7 101.7 95.0 105.0 BBB138 Load 138.000 97.5 99.1 95.0 105.0 CCC138 Load 138.000 97.3 99.2 95.0 105.0 EEE69 Load 69.000 92.6* 96.4 95.0 105.0 FFF69 Busbar 69.000 99.8 102.9 95.0 105.0 GGG138 Load 138.000 98.2 98.3 95.0 105.0 HHH138 Load 138.000 98.8 98.1 95.0 105.0 JJJ138 Busbar 138.000 104.0 102.0 95.0 105.0 JJJ138L Load 138.000 104.0 102.0 95.0 105.0 JJJ69 Busbar 69.000 99.9 103.6 95.0 105.0 ZZZ69 Load 69.000 93.0* 95.8 95.0 105.0 Optimized Generator Active Power ================================ Bus Name Before(MW) After(MW) Generation Cost ($/MW) ------------------------ ---------- ---------- ---------------------- JJJ138S Utility 62.961 149.37 100.00 AAA138 Generator 200.00 155.14 300.00 DDD138 Generator 200.00 172.20 100.00 DDD69 Generator 0.0000 0.99894 100.00 FFF138 Generator 200.00 180.10 100.00 Optimized Generator/SVC Scheduled Voltage ========================================= Bus Name System KV Before(%) After(%) ------------------------ ---------- ---------- ---------- JJJ138S Utility 138.000 104.0 102.0 AAA138 Generator 138.000 102.0 103.2 DDD69 Generator 69.000 100.0 103.4 FFF138 Generator 138.000 102.0 102.4 Optimized Transformer Tap Setting ================================= From Bus Name To Bus Name Before(p.u.) After(p.u.) ------------------------ ------------------------ ------------ ----------- FFF69 Busbar FFF138 Generator 0.98600 1.0113 JJJ69 Busbar JJJ138 Busbar 0.97200 1.0249 Feeders Loading Constraints =========================== Before After Limit Ampacity Loading From Bus Name To Bus Name AMP AMP KA KA Contraints(%) Violated ------------------------ ------------------------ -------- -------- -------- -------- --------------- -------- AAA138 Generator BBB138 Load 123.3 170.7 1.28 0.26 500.0 AAA138 Generator JJJ138 Busbar 246.3 17.0 2.75 0.55 500.0 AAA69 Busbar ZZZ69 Load 173.9 107.3 1.27 0.25 500.0 BBB138 Load CCC138 Load 106.4 46.2 1.28 0.26 500.0 CCC138 Load DDD138 Generator 316.2 268.9 1.28 0.26 500.0 DDD138 Generator FFF138 Generator 53.4 12.8 1.28 0.26 500.0
4

Power System Optimization (PSO)
DDD69 Generator EEE69 Load 130.1 121.5 1.27 0.25 500.0 EEE69 Load FFF69 Busbar 108.9 112.2 1.27 0.25 500.0 JJJ138 Busbar JJJ138S Utility 537.9 667.9 2.75 0.55 500.0 JJJ138 Busbar JJJ138L Load 467.8 467.8 2.75 0.55 500.0 GGG138 Load FFF138 Generator 394.8 279.1 1.28 0.26 500.0 HHH138 Load GGG138 Load 200.4 55.6 1.28 0.26 500.0 JJJ138 Busbar HHH138 Load 99.2 160.4 1.28 0.26 500.0 ZZZ69 Load JJJ69 Busbar 102.1 125.8 1.27 0.25 500.0 Transformers Loading Constraints ================================ Before After Limit Capacity Loading From Bus Name To Bus Name KVA KVA KVA KVA Contraints(%) Violated ------------------------ ------------------------ -------- -------- -------- -------- --------------- -------- AAA69 Busbar AAA138 Generator 20762.0 12829.5 500000.0 100000.0 500.0 DDD69 Generator DDD138 Generator 14819.1 17419.5 500000.0 100000.0 500.0 FFF69 Busbar FFF138 Generator 13683.7 14063.7 500000.0 100000.0 500.0 JJJ69 Busbar JJJ138 Busbar 13683.7 15929.2 500000.0 100000.0 500.0
Figure 3: Improved Optimization Reporting: Optimization Result - Loading Constraints not considered
The result of optimization when loading limits are imposed is reported below. As expected, if the feeder/transformer loading constraints are taken into account, the saving in the system losses are smaller than when loading limits are not considered (3191.29 kW versus 5172.93 kW): EDSA Power System Optimization v3.10.00 ======================================= Project No. : 12345-1 Page : 1 Project Name: PSO Testing Date : Title : a 14 bus system Time : Drawing No. : 12345-2 Company : Edsa Revision No.: 12345-3 Engineer : Edsa Jobfile Name: pso Check by : Scenario : 1 - Date : A 14-bus network shown in Fig.E.3 in Paul M. Anderson's Faulted Power Systems Optimization Objective: Minimization of System Losses Optimization is SUCCESSFUL. Economical Impact of Optimization ================================= Total System Losses Before Optimization = 12982.60 Kilo Watts Total System Losses After Optimization = 9791.31 Kilo Watts System Loss Reduction = 3191.29 Kilo Watts Bus Voltage Constraints ======================= Bus Name System kV Before(%) After(%) Vmin(%) Vmax(%) ------------------------ --------- --------- -------- --------- ------- JJJ138S Utility 138.000 104.0 101.0 95.0 105.0 AAA138 Generator 138.000 102.0 104.5 95.0 105.0 DDD138 Generator 138.000 101.3 103.2 95.0 105.0 DDD69 Generator 69.000 100.0 103.6 95.0 105.0 FFF138 Generator 138.000 102.0 101.3 95.0 105.0 AAA69 Busbar 69.000 100.7 103.1 95.0 105.0 BBB138 Load 138.000 97.5 99.8 95.0 105.0 CCC138 Load 138.000 97.3 99.6 95.0 105.0 EEE69 Load 69.000 92.6* 96.3 95.0 105.0 FFF69 Busbar 69.000 99.8 102.8 95.0 105.0 GGG138 Load 138.000 98.2 97.1 95.0 105.0 HHH138 Load 138.000 98.8 96.9 95.0 105.0 JJJ138 Busbar 138.000 104.0 101.0 95.0 105.0 JJJ138L Load 138.000 104.0 101.0 95.0 105.0 JJJ69 Busbar 69.000 99.9 102.4 95.0 105.0 ZZZ69 Load 69.000 93.0* 95.8 95.0 105.0
5

Power System Optimization (PSO)
6
Optimized Generator Active Power ================================ Bus Name Before(MW) After(MW) Generation Cost ($/MW) ------------------------ ---------- ---------- ---------------------- JJJ138S Utility 62.961 115.95 100.00 AAA138 Generator 200.00 213.79 300.00 DDD138 Generator 200.00 181.99 100.00 DDD69 Generator 0.0000 0.98951 100.00 FFF138 Generator 200.00 147.08 100.00 Optimized Generator/SVC Scheduled Voltage ========================================= Bus Name System KV Before(%) After(%) ------------------------ ---------- ---------- ---------- JJJ138S Utility 138.000 104.0 101.0 AAA138 Generator 138.000 102.0 104.5 DDD69 Generator 69.000 100.0 103.6 FFF138 Generator 138.000 102.0 101.3 Optimized Transformer Tap Setting ================================= From Bus Name To Bus Name Before(p.u.) After(p.u.) ------------------------ ------------------------ ------------ ----------- FFF69 Busbar FFF138 Generator 0.98600 1.0229 JJJ69 Busbar JJJ138 Busbar 0.97200 1.0238 Feeders Loading Constraints =========================== Before After Limit Ampacity Loading From Bus Name To Bus Name AMP AMP KA KA Contraints(%) Violated ------------------------ ------------------------ -------- -------- -------- -------- --------------- -------- AAA138 Generator BBB138 Load 123.3 236.3 0.26 0.26 100.0 AAA138 Generator JJJ138 Busbar 246.3 166.1 0.55 0.55 100.0 AAA69 Busbar ZZZ69 Load 173.9 153.7 0.25 0.25 100.0 BBB138 Load CCC138 Load 106.4 17.6 0.26 0.26 100.0 CCC138 Load DDD138 Generator 316.2 215.3 0.26 0.26 100.0 Yes DDD138 Generator FFF138 Generator 53.4 84.9 0.26 0.26 100.0 DDD69 Generator EEE69 Load 130.1 139.1 0.25 0.25 100.0 EEE69 Load FFF69 Busbar 108.9 100.2 0.25 0.25 100.0 JJJ138 Busbar JJJ138S Utility 537.9 542.7 0.55 0.55 100.0 JJJ138 Busbar JJJ138L Load 467.8 467.8 0.55 0.55 100.0 GGG138 Load FFF138 Generator 394.8 253.4 0.26 0.26 100.0 Yes HHH138 Load GGG138 Load 200.4 23.4 0.26 0.26 100.0 JJJ138 Busbar HHH138 Load 99.2 193.5 0.26 0.26 100.0 ZZZ69 Load JJJ69 Busbar 102.1 98.0 0.25 0.25 100.0 Transformers Loading Constraints ================================ Before After Limit Capacity Loading From Bus Name To Bus Name KVA KVA KVA KVA Contraints(%) Violated ------------------------ ------------------------ -------- -------- -------- -------- --------------- -------- AAA69 Busbar AAA138 Generator 20762.0 18367.1 100000.0 100000.0 100.0 DDD69 Generator DDD138 Generator 14819.1 19605.5 100000.0 100000.0 100.0 FFF69 Busbar FFF138 Generator 13683.7 12373.2 100000.0 100000.0 100.0 JJJ69 Busbar JJJ138 Busbar 13683.7 12002.9 100000.0 100000.0 100.0
Figure 4: Optimization Result - Loading Constraints are taken into Account

Power System Optimization (PSO)
2 Solution Algorithm of the PSO program The methodology implemented in PSO to solve the reactive power resource optimization problem alone or together with the security constrained optimal powerflow, is based on a hierarchical decomposition of the original problem into two parts:
The reactive power planning problem, where the location and size of new reactive sources are determined
The security constrained optimal powerflow problem in which the reactive power resources are used to optimize system operation.
The overall solution is achieved in an iterative method of the investment and operation sub-problems. The investment sub problem initially produces trial values for reactive resources. The effect of addition of these resources in terms of operating feasibility is evaluated by the operating sub problem. If operational constraints are not violated, then, the optimal solution has been found. Otherwise, information about problem infeasibility is fed back to the investment sub problem to obtain a revised reactive resources planning. This process continues until a feasible solution is found. When the option for optimizing a base case objective function along with reactive resources investment cost is considered, both feasibility and the optimality criterions are tested before the iterative process is terminated. PSO solves the reactive power resource planning sub problem by a mixed integer programming method and the operation sub problem by an advanced nonlinear primal-dual interior point method. If contingencies are to be considered, then, the operation sub problem itself is further subdivided into basecase and contingency operation sub problems making the entire process a three level hierarchical structure. To solve the pure SCOPF problem a two level hierarchical structure is used consisting only of the operation sub problem. The PSO finds the optimal operation of a power system by adjusting controllable quantities such that physical and operational constraints are satisfied. Mathematically it can be expressed as follows:
UzL 0)( subject to
)( Minimize
≤≤=zh
zg (1)
g(z) is the objective function and h(z) is the equality constraints. z is a vector that includes the independent (x) and control variables (u), i.e. z=[x,u]. The power flow equations are given by h(z) and equipment limits and system operating limits are specified by L and U. There are many standard OPF objective functions that are commonly in use. Some of the more classical ones that are also supported by PSO are minimization of:
System Active Losses Generation Cost (also known as economic dispatch) Minimum System Adjustments to meet acceptable operating conditions (e.g. voltage
profile, equipment overloading, etc.) Minimization of Load Shedding Minimization of Cost of Reactive Power Resources
Equation (1) above, is general form of OPF in which the objective functions is minimized by adjusting the available controls. The constraints in OPF include the followings:
7

Power System Optimization (PSO)
Maximum and minimum voltage limits Equipments loading limits Maximum and minimum active and reactive power generation Maximum and minimum transformer tap positions Etc.
Optimization of a power system when outage of network equipments is allowed is known as a security constrained OPF. In most optimization software the inequality constraints are converted into equality constraints. In linear programming, slack variables are used to convert any inequality constraints to equality constraints. PSO uses a nonlinear optimization technique that employs barrier method (primal and dual) to convert inequalities to equalities. Equation (1), then, is reformulated as follows in the PSO implementation:
Uz
Lzzh
zulzzg
ss
j jjjjj
=−
=−
=⎭⎬⎫
⎩⎨⎧
−−−− ∑ ∑
2
1
0)( subject to
)log()log()( Minimize μμ
Where S1 and S2 are slack variables representing system and equipments constraints. PSO will optimize the objective function by adjusting the control setting of the equipments (i.e., generator active power and voltage set-points, transformers tap positions, and voltage set-points of switchable shunts). These controls can be optimized separately or in any combination. It should be noted that a powerflow program solves equality constraints, h(z), defined in equation (1) above and keep the equipment settings within their acceptable ranges (e.g. generator reactive power is in between maximum and minimum reactive power generation). PSO solves complete system of equations defined in (1) respecting constraints on system variables (e.g. bus voltages, power flows, etc.). 3 Objective Functions Supported by PSO The following objective functions are implemented in the present version of PSO software: Economic Dispatch, Minimum Generation Cost One of the most important objective functions supported by PSO is determination of minimum active power generation cost also known as economic dispatch (ED). PSO will assign the active power of each generator such that the total cost of generation is minimized while ensuring feasible system operation simultaneously for the normal state (base case) and under contingency situations. It is important that realistic cost coefficient (cost of generation, $/MW) for each of the generators are specified. Generation costs are considered to be piece-wise linear in PSO.
8
Power System Optimization (PSO)
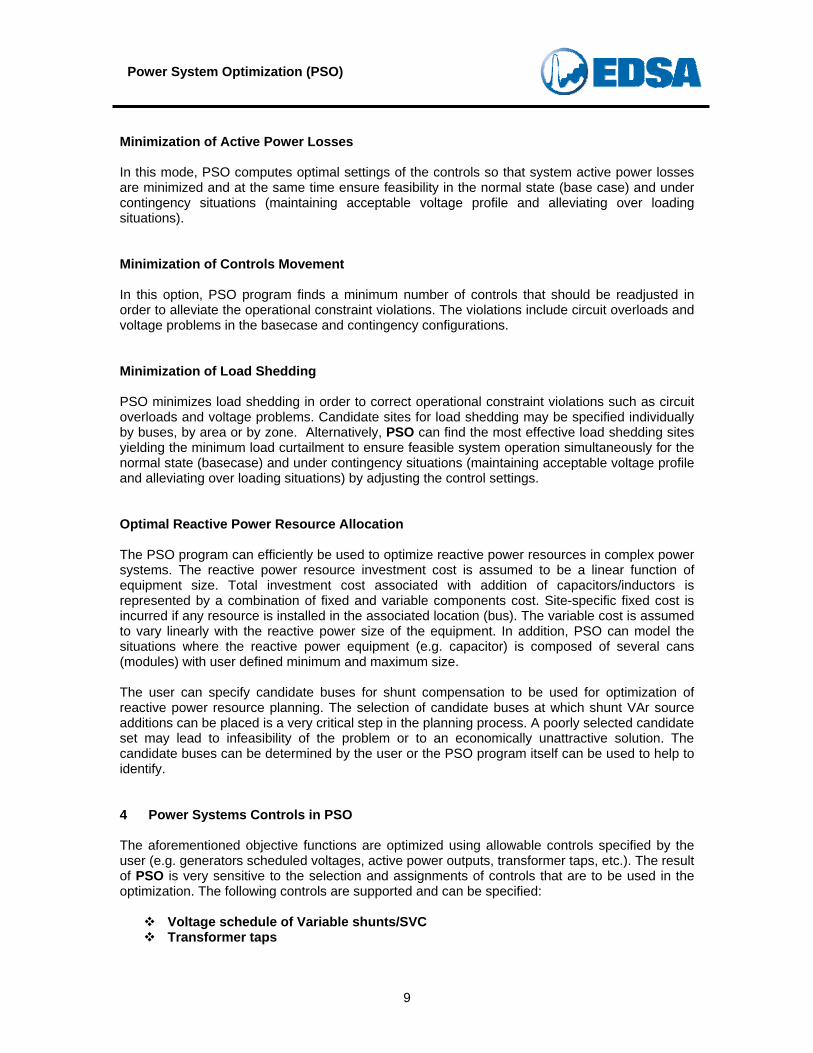
Minimization of Active Power Losses In this mode, PSO computes optimal settings of the controls so that system active power losses are minimized and at the same time ensure feasibility in the normal state (base case) and under contingency situations (maintaining acceptable voltage profile and alleviating over loading situations). Minimization of Controls Movement In this option, PSO program finds a minimum number of controls that should be readjusted in order to alleviate the operational constraint violations. The violations include circuit overloads and voltage problems in the basecase and contingency configurations. Minimization of Load Shedding PSO minimizes load shedding in order to correct operational constraint violations such as circuit overloads and voltage problems. Candidate sites for load shedding may be specified individually by buses, by area or by zone. Alternatively, PSO can find the most effective load shedding sites yielding the minimum load curtailment to ensure feasible system operation simultaneously for the normal state (basecase) and under contingency situations (maintaining acceptable voltage profile and alleviating over loading situations) by adjusting the control settings. Optimal Reactive Power Resource Allocation The PSO program can efficiently be used to optimize reactive power resources in complex power systems. The reactive power resource investment cost is assumed to be a linear function of equipment size. Total investment cost associated with addition of capacitors/inductors is represented by a combination of fixed and variable components cost. Site-specific fixed cost is incurred if any resource is installed in the associated location (bus). The variable cost is assumed to vary linearly with the reactive power size of the equipment. In addition, PSO can model the situations where the reactive power equipment (e.g. capacitor) is composed of several cans (modules) with user defined minimum and maximum size. The user can specify candidate buses for shunt compensation to be used for optimization of reactive power resource planning. The selection of candidate buses at which shunt VAr source additions can be placed is a very critical step in the planning process. A poorly selected candidate set may lead to infeasibility of the problem or to an economically unattractive solution. The candidate buses can be determined by the user or the PSO program itself can be used to help to identify. 4 Power Systems Controls in PSO The aforementioned objective functions are optimized using allowable controls specified by the user (e.g. generators scheduled voltages, active power outputs, transformer taps, etc.). The result of PSO is very sensitive to the selection and assignments of controls that are to be used in the optimization. The following controls are supported and can be specified:
Voltage schedule of Variable shunts/SVC Transformer taps
9

Power System Optimization (PSO)
10
Generator terminal voltages Generation active power output
5 Constraint Modeling in PSO The following constraints may be specified in PSO:
Acceptable bus voltage limits in the normal and emergency operation Branch flow limits (MW/MVAr) Transformer tap limits Generator MW and MVAr limits Phase Shifter Angles (controlling MW flow)

Power System Optimization (PSO)
11
6 Power System Optimization Tutorial
This tutorial will be based on the EDSA project file called “PSO.epr” shown in this figure. Notice that all the buses in the network are subdivided into two areas, namely, Area 212 and Area 213.
Area 212 Area 213

Power System Optimization (PSO)
12
Step 1. Start the EDSA program, and from the samples folder, open the drawing file called “PSO.axd” or the project file “PSO.epr”.
Step 2. Proceed to define the “Optimization” settings required for Utilities, Generators, Lines, Transformers, Buses and Loads. Follow the instructions in the next sections of this tutorial.

Power System Optimization (PSO)
13
Optimization Settings for Generator Buses
Step 1. To illustrate how to define the Optimization settings for a typical generator, we will use the generator bus “AAA138” as an example. Proceed to double click on this bus in order to access its editor.
Step 2. Proceed to assign the “Area” designation for this bus. In this case the area will be typed in as “212”.
Step 3. Select the “Optimization” tab.
Step 4. Define the “Normal” operating voltage limits.
Step 5. Define the “Emergency” operating voltage limits.
Step 6. Enter the operating costs for the generator in $/KWH.
Step 7. Enter the “Minimum” and “Maximum” active power limits for the generator in either KW or MW.
Step 8. Enable Voltage and/or Active Power Control capabilities for this generator, by selecting the “On” functions as required. Select “OK” when finished.

Power System Optimization (PSO)
14
7 Optimization Settings for Utility Buses
Step 1. To illustrate how to define the Optimization settings for a typical utility bus, we will use bus “JJJ138S Utility” as an example. Proceed to double click on this bus in order to access its editor.
Step 2. Proceed to assign the “Area” designation for this bus. In this case the area will be typed in as “212”.
Step 3. Select the “Optimization” tab.
Step 4. Define the “Normal” operating voltage limits.
Step 6. Enter the operating costs for the generator in $/KWH.
Step 7. Enter the “Minimum” and “Maximum” active power limits for the generator in either KW or MW.
Step 8. Enable Voltage and/or Active Power Control capabilities for this utility bus, by selecting the “On” functions as required. Select “OK” when finished.
Step 5. Define the “Emergency” operating voltage limits.

Power System Optimization (PSO)
15
8 Optimization Settings for Load Buses, Bus Bars & Nodes
Step 1. To illustrate how to define the Optimization settings for a typical bus, we will use bus “JJJ138L Load” as an example. Proceed to double click on this bus in order to access its editor.
Step 2. Proceed to assign the “Area” designation for this bus. In this case the area will be typed in as “212”.
Step 3. Select the “Optimization” tab.
Step 4. Define the “Normal” operating voltage limits.
Step 5. Define the “Emergency” operating voltage limits. Select “OK” when finished.

Power System Optimization (PSO)
16
9 Optimization Settings for Transformers
Step 1. To illustrate how to define the Optimization settings for a transformer, we will use transformer “JJJ69 Busbar – JJJ138 Busbar” as an example. Proceed to double click on this branch in order to access its editor.
Step 2. Select the “Load Flow” tab.
Step 3. To assign “N-1 Security” constraint, select “On” or “Off” as required.
Step 4. Select the winding in which the adjustable taps are located (Primary or Secondary).
Step 5. If this transformer will be used as a control transformer in the optimization calculations, select “On”. Otherwise the transformer will retain (throughout the optimization analysis) the same fixed settings entered in the “Tap Settings (Per Unit)” section.
Step 6. Select “OK” to continue.

Power System Optimization (PSO)
17
10 Optimization Settings for Feeders
Step 1. To illustrate how to define the Optimization settings for a typical feeder, we will use feeder “AAA138 Generator – BBB138 Load” as an example. Proceed to double click on this branch in order to access its editor.
Step 2. Select the “Load Flow” tab”
Step 3. Assign the appropriate “N-1 Security” constraint status to the branch by selecting “On” or “Off” as required. Select “OK” when finished.

Power System Optimization (PSO)
18
11 The Power System Optimization Program Interface
Step 1. To invoke the PSO program, select this icon.
Step 2. Verify that the following toolbar appears.
Runs the PSO Analysis. Show the output report.
Types of Optimization Objectives that can be analyzed by the PSO program.
Allows global or group editing of “Bus Voltage Limits”.
Accesses the error log file.
Updates the control buses and branches with the new calculated settings.
Types of controls that can be used in the chosen optimization objective.

Power System Optimization (PSO)
19
12 Changing Bus Voltage Limits Step 1.
To change bus voltage limits individually or in groups, select the “Options” icon.
Step 2. Select the “Setting Bus Voltage Limits” button.
Step 3. Specify the new voltage settings for “Normal” and/or “Emergency” operation.
Step 4. Select the buses that are to be updated with the new limits by either of the following methods: 1. By placing a check mark next to the bus or buses. 2. By selecting buses in specific Zones/Areas
Step 5. Select the “Update” function as shown here. Repeat steps 1-5 as necessary. Select “Done” to complete the operation.
3. By selecting all buses if the changes are global.
Power System Optimization (PSO)
20
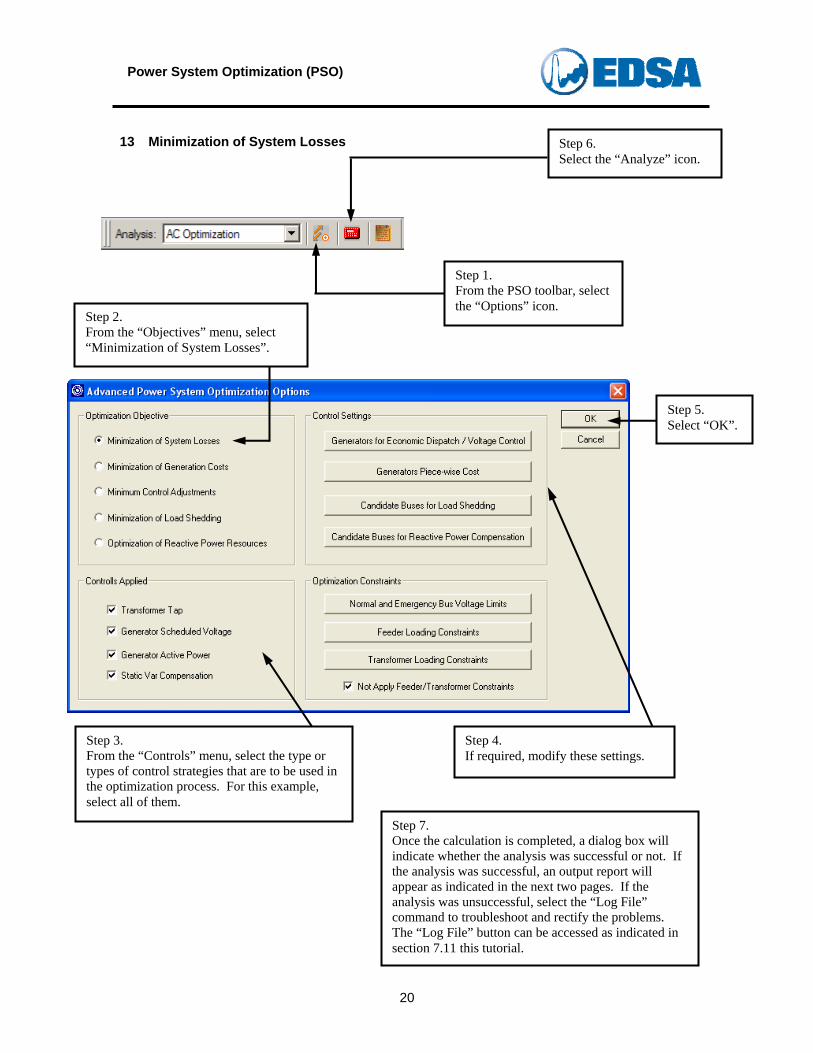
13 Minimization of System Losses
Step 1. From the PSO toolbar, select the “Options” icon.
Step 6. Select the “Analyze” icon.
Step 2. From the “Objectives” menu, select “Minimization of System Losses”.
Step 5. Select “OK”.
Step 4. If required, modify these settings.
Step 3. From the “Controls” menu, select the type or types of control strategies that are to be used in the optimization process. For this example, select all of them.
Step 7. Once the calculation is completed, a dialog box will indicate whether the analysis was successful or not. If the analysis was successful, an output report will appear as indicated in the next two pages. If the analysis was unsuccessful, select the “Log File” command to troubleshoot and rectify the problems. The “Log File” button can be accessed as indicated in section 7.11 this tutorial.

Power System Optimization (PSO)
21
The net reduction of system losses is shown here.
The voltage correction report is shown here. The buses marked with an asterisk, indicate values that were outside the acceptable limits prior to the optimization process

Power System Optimization (PSO)
22
This section of the report shows the control-generator settings before and after the optimization analysis.
This section shows the generators output voltage change, before and after the optimization analysis.
This section shows the tap settings for the two control transformers, before and after the optimization process.
Step 8. Select “Done” to exit.

Power System Optimization (PSO)
23
14 Minimization of Generation Costs
Step 2. From the ““Minimi
Objectives” menu, select zation of Generation Costs”.
Step 3. From the “Controls” menu, select the type or types of control strategies that are to be used in the optimization process. For this example, select all of them.
Step 4. If required, modify these settings.
Step 5. Select “OK”.
Step 1. From the PSO toolbar, select the “Options” icon.
Step 6. Select the “Analyze” icon.
Step 7. Once the calculation is completed, a dialog box will indicate whether the analysis was successful or not. If the analysis was successful, an output report will appear as indicated in the next two pages. If the analysis was unsuccessful, select the “Log File” command to troubleshoot and rectify the problems. The “Log File” button can be accessed as indicated in section 7.11 this tutorial.

Power System Optimization (PSO)
24
The net reduction of system generation costs and losses are shown here.
The voltage correction report is shown here. The buses marked with an asterisk, indicate values that were outside the acceptable limits prior to the optimization process

Power System Optimization (PSO)
25
This section of the report shows the control-generator settings before and after the optimization analysis.
This section shows the generators output voltage change, before and after the optimization analysis.
This section shows the tap settings for the two control transformers, before and after the optimization process.
Step 8. Select “Done” to exit.
Power System Optimization (PSO)
26
15 Minimization of Controls Movements
Step 3. From the “Controls” menu, select the type or types of control strategies that are to be used in the optimization process. For this example, select all of them.
Step 4. If required, modify these settings.
Step 1. From the PSO toolbar, selectthe “Options” icon. Step 5.
Select “OK”.
Step 6. Select the “Analyze” icon.
Step 2. Select the “Minimum Control Adjustments” function.
Step 7. Once the calculation is completed, a dialog box will indicate whether the analysis was successful or not. If the analysis was successful, an output report will appear as indicated in the next two pages. If the analysis was unsuccessful, select the “Log File” command to troubleshoot and rectify the problems. The “Log File” button can be accessed as indicated in section 7.11 this tutorial.

Power System Optimization (PSO)
27
The net reduction of system losses after the optimization is shown here.
The voltage correction report is shown here. The buses marked with an asterisk, indicate values that were outside the acceptable limits prior to the optimization process

Power System Optimization (PSO)
28
This section of the report shows the control-generator settings before and after the optimization analysis.
This section shows the generators output voltage change, before and after the optimization analysis.
This section shows the tap settings for the two control transformers, before and after the optimization process. Notice that in this case no adjustments are required.
Step 8. Select “Done” to exit.

Power System Optimization (PSO)
29
16 The PSO Report Manager
Select the “Log File” to view important convergence data generated during the analysis. This feature can assist the user in troubleshooting unsuccessful PSO calculations.
The “Result Report” command, is used to re-display (if necessary) the output report for the last performed analysis, after having closed it using the “Done” command.
The “Update Jobfile” command allows the user to update all the control devices with settings calculated by the last optimization analysis.

Power System Optimization (PSO)
17 How to Perform Minimization of Active Power Generation The jobfile used to demonstrate this optimization option is named “pso_14node_MinGenCost2” which is in the DesignBase\Samples\PSO directory. This sample case is also used in the validation and verification of the PSO for this optimization function. The system one line diagram is shown below:
Figure 5: Single Line Diagram of the Sample Jobfile used in V&V of the “Minimization of Generation Cost”
The optimization control setting for this jobfile is shown below:
Figure 6: Control Settings used in V&V of the “Minimization of Generation Cost”
30

Power System Optimization (PSO)
Here we select all the controls, i.e., Transformer tap adjustment, generator scheduled voltage, generator active power, and static var compensator scheduled voltage. In this example we have used a piece-wise linear cost function for several of the units in this jobfile. The PSO program accepts both constant generation cost or user defined piece-wise linear generation cost function. A piece-wise generation cost for the generator at bus “AAA138 Generator” is shown below:
Figure 7: Piece-Wise Generation Cost for bus “AAA138 Generator” used in V&V of the “Minimization of Generation Cost”
As seen in the above dialog, the user can specify the generation cost coefficient in either $/kWh or alternatively, provide cost in $/million Btu as shown below:
31

Power System Optimization (PSO)
32
To complete the V&V, perform the following steps:
• Run optimization program, the results include bus voltages before and after optimized control settings
• Set the controls (generator scheduled voltages and active powers, and the transformer taps) according to the result obtained by the Optimization program as follows:
• After updating the control settings, run advanced power flow program for pso_14node_MinGenCost2. The bus voltage result should be the same as the result obtained by PSO program.
• The following table gives a summary comparison showing excellent match
Voltage in % by PSO Voltage in % by ADVPF Difference in %
Bus NAme Before after Before After Before After JJJ138S Utility 104.0 105.0 104.0 105.0 0 0 AAA138 Generator 102.0 105.0 102.0 105.0 0 0 DDD138 Generator 101.3 99.9 101.3 100.0 0 0.1 DDD69 Generator 100.0 105.0 100.0 105.0 0 0
Power System Optimization (PSO)
Voltage in % by PSO Voltage in % by ADVPF Difference in % FFF138 Generator 102.0 101.4 102.0 101.4 0 0 AAA69 Busbar 100.7 103.2 100.8 103.2 0.1 0 BBB138 Load 97.5 95.0 97.5 95.0 0 0 CCC138 Load 97.3 95.1 97.3 95.2 0 0.1 EEE69 Load 92.6 98.1 92.6 98.0 0 0.1 FFF69 Busbar 99.8 104.4 99.8 104.3 0 0.1 GGG138 Load 98.2 96.9 98.2 96.9 0 0 HHH138 Load 98.8 96.8 98.8 96.8 0 0 JJJ138 Busbar 104.0 105.0 104.0 105.0 0 0 JJJ138L Load 104.0 105.0 104.0 105.0 0 0 JJJ69 Busbar 99.9 101.0 99.9 101.1 0 0.1 ZZZ69 Load 93.0 95.2 93.0 95.2 0 0
Note: The bus voltages achieved in optimizations are all within defined limits. Optimization Result for “Minimization of Generation Cost” is summarized below: EDSA Power System Optimization ============================== Project No. : 12345-1 Page : 1 Project Name: PSO Min Gen Cost Date : Title : a 14 bus system Time : Drawing No. : 12345-2 Company : Edsa Revision No.: 12345-3 Engineer : Edsa Jobfile Name: pso_14node_mingencost2 Check by : Scenario : 1 - Date : A 14-bus network shown in Fig.E.3 in Paul M. Anderson's Faulted Power Systems Optimization Objective: Minimization of Generation Costs Optimization is SUCCESSFUL. Economical Impact of Optimization ================================= Total System Losses Before Optimization = 13009.88 Kilo Watts Total System Losses After Optimization = 38539.25 Kilo Watts System Loss Reduction = -25529.36 Kilo Watts Total Generation cost before optimization = 35996.49 dollars Total Generation cost after optimization = 25097.91 dollars Saving in generation cost = 10898.59 dollars Bus Voltage Change ================== Bus Name System kV Before(%) After(%) Vmin(%) Vmax(%) ------------------------ --------- --------- -------- --------- ------- JJJ138S Utility 138.000 104.0 105.0 95.0 105.0 AAA138 Generator 138.000 102.0 105.0 95.0 105.0 DDD138 Generator 138.000 101.3 99.9 95.0 105.0 DDD69 Generator 69.000 100.0 105.0 95.0 105.0 FFF138 Generator 138.000 102.0 101.4 95.0 105.0 AAA69 Busbar 69.000 100.7 103.2 95.0 105.0 BBB138 Load 138.000 97.5 95.0 95.0 105.0 CCC138 Load 138.000 97.3 95.1 95.0 105.0 EEE69 Load 69.000 92.6* 98.1 95.0 105.0 FFF69 Busbar 69.000 99.8 104.4 95.0 105.0
33

Power System Optimization (PSO)
GGG138 Load 138.000 98.2 96.9 95.0 105.0 HHH138 Load 138.000 98.8 96.8 95.0 105.0 JJJ138 Busbar 138.000 104.0 105.0 95.0 105.0 JJJ138L Load 138.000 104.0 105.0 95.0 105.0 JJJ69 Busbar 69.000 99.9 101.0 95.0 105.0 ZZZ69 Load 69.000 93.0* 95.2 95.0 105.0
Optimized Generator Active Power ================================
Bus Name Before(MW) After(MW) Generation Cost ($/MW) ------------------------ ---------- ---------- ---------------------- JJJ138S Utility 63.591 236.17 29.170 AAA138 Generator 200.00 284.87 25.697 DDD138 Generator 200.00 50.001 100.00 FFF138 Generator 200.00 117.77 50.000 Optimized Generator/SVC Scheduled Voltage ========================================= Bus Name System KV Before(%) After(%) ------------------------ ---------- ---------- ---------- JJJ138S Utility 138.000 104.0 105.0 AAA138 Generator 138.000 102.0 105.0 DDD69 Generator 69.000 100.0 105.0 FFF138 Generator 138.000 102.0 101.4 Optimized Transformer Tap Setting ================================= From Bus Name To Bus Name Before(p.u.) After(p.u.) ------------------------ ------------------------ ------------ ----------- FFF69 Busbar FFF138 Generator 0.98600 1.0325 JJJ69 Busbar JJJ138 Busbar 0.97200 0.96766 Bus voltages using advanced power flow program before optimization: EDSA Advanced Power Flow Program ================================ Project No. : 12345-1 Page : 1 Project Name: PSO Testing Date : Title : a 14 bus system Time : 02 Drawing No. : 12345-2 Company : Edsa Revision No.: 12345-3 Engineer : Edsa Jobfile Name: pso_14node_mingencost2 Check by : Scenario : 1 - Date : A 14-bus network shown in Fig.E.3 in Paul M. Anderson's Faulted Power Systems Bus Voltage Results =================== Bus Name Type V DROP ANG P Q PF (PU) (%) (DEG) (PU) (PU) (%) ------------------------ ------ -------- ------ ----- -------- -------- ------ JJJ138S Utility Swing 1.0400 -4.00 0.0 0.6359 1.1206 49.36 AAA138 Generator Gen * 1.0200 -2.00 6.6 1.0000 -0.1179 99.31 DDD138 Generator Gen * 1.0126 -1.26 9.8 1.0000 0.0584 99.83 DDD69 Generator Gen * 1.0000 0.00 8.8 0.0000 0.0317 0.00 FFF138 Generator Gen * 1.0200 -2.00 8.5 1.0000 0.1779 98.45 AAA69 Busbar None 1.0075 -0.75 5.2 0.0000 0.0000 BBB138 Load P_Load 0.9746 2.54 4.1 -0.5000 -0.0600 99.29
34

Power System Optimization (PSO)
CCC138 Load P_Load 0.9733 2.67 5.7 -0.5000 -0.2500 89.44 EEE69 Load P_Load 0.9264 7.36 6.2 -0.2500 -0.1142 90.96 FFF69 Busbar None * 0.9979 0.21 7.7 0.0000 0.0000 GGG138 Load P_Load 0.9823 1.77 3.1 -0.5000 -0.2500 89.44 HHH138 Load P_Load 0.9875 1.25 0.1 -0.5000 -0.0550 99.40 JJJ138 Busbar None 1.0400 -4.00 0.0 0.0000 0.0000 JJJ138L Load P_Load 1.0400 -4.00 0.0 -1.0000 -0.5000 89.44 JJJ69 Busbar None * 0.9990 0.10 -0.4 0.0000 0.0000 ZZZ69 Load P_Load 0.9298 7.02 0.3 -0.2500 -0.1135 91.05 * : Voltage Controlled Buses Bus voltages using advanced power flow program after optimization: EDSA Advanced Power Flow Program ================================= Project No. : 12345-1 Page : 1 Project Name: PSO Testing Date : Title : a 14 bus system Time : Drawing No. : 12345-2 Company : Edsa Revision No.: 12345-3 Engineer : Edsa Jobfile Name: pso_14node_mingencost2 Check by : Scenario : 1 - Date : A 14-bus network shown in Fig.E.3 in Paul M. Anderson's Faulted Power Systems Bus Voltage Results =================== Bus Name Type V DROP ANG P Q PF (PU) (%) (DEG) (PU) (PU) (%) ------------------------ ------ -------- ------ ----- -------- -------- ------ JJJ138S Utility Swing 1.0500 -5.00 0.0 2.3695 0.6884 96.03 AAA138 Generator Gen 1.0500 -5.00 1.5 1.8501 0.2041 99.40 DDD138 Generator Gen 1.0000 0.00 -25.6 -0.5000 0.0709 99.01 DDD69 Generator Gen 1.0500 -5.00 -26.3 0.0000 0.6193 0.00 FFF138 Generator Gen 1.0140 -1.40 -22.8 0.1779 0.4951 33.81 AAA69 Busbar None 1.0323 -3.23 0.5 0.0000 0.0000 BBB138 Load P_Load 0.9504 4.96 -15.9 -0.5000 -0.0693 99.05 CCC138 Load P_Load 0.9517 4.83 -22.2 -0.5000 -0.2500 89.44 EEE69 Load P_Load 0.9804 1.96 -27.1 -0.2500 -0.1039 92.34 FFF69 Busbar None 1.0434 -4.34 -23.9 0.0000 0.0000 GGG138 Load P_Load 0.9693 3.07 -20.4 -0.5000 -0.2500 89.44 HHH138 Load P_Load 0.9677 3.23 -15.2 -0.5000 -0.0627 99.22 JJJ138 Busbar None 1.0500 -5.00 -0.0 0.0000 0.0000 JJJ138L Load P_Load 1.0500 -5.00 -0.0 -1.0000 -0.5000 89.44 JJJ69 Busbar None 1.0106 -1.06 -0.7 0.0000 0.0000 ZZZ69 Load P_Load 0.9521 4.79 -2.1 -0.2500 -0.1094 91.62 Conclusions
a. The voltages at buses “EEE69 Load” and “ZZZ69 Load” were low and out of the normal voltage limits before optimization and were corrected after optimization.
b. The optimal scheduled generator voltages and active powers can easily be reflected in
the jobfile using the “Update” facility. The bus voltage result obtained by the Advanced
35
Power System Optimization (PSO)
Powerflow (after the optimal settings found by PSO were reflected in the jobfile) agrees very well with the result obtained by PSO
c. PSO can efficiently be used to perform secure economic dispatch
18 How to Perform Minimization of Load Shedding Analysis The jobfile used in this sample case is named “PSO-Min-Load-Shedding” which is in the DesignBase\Samples\PSO directory. The one line diagram for this network is shown below:
Figure 8: Single Line Diagram of the Sample Jobfile used in V&V of the “Minimization of Load Shedding”
The optimization control setting for this jobfile is shown below:
36

Power System Optimization (PSO)
Figure 9: Control Settings used in V&V of the “Minimization of Load Shedding”
We have intentionally disabled all the controls to see how much load shedding is required to alleviate the low voltages in the sample jobfile. It is important that the user assigns appropriate load interruption costs to each of the system loads. If the load interruption cost is not of main concern, then, the user can assign high interruption cost to the critical loads and lower cost to the non-essential loads. The following load buses were selected as candidate buses for load shedding:
Figure 10: Candidate Buses for the Load Shedding used in V&V of the “Minimization of Load Shedding”
To complete the V&V, perform the following steps:
• Run optimization program, the results include bus voltages before and after optimized control settings
• Run advanced power flow program, the calculated bus voltages should match the results obtained by optimization program
37

Power System Optimization (PSO)
• Shed the same amount of loads indicated by the result of PSO and then re-run advanced power flow program. The bus voltage results should be the same as the results obtained by optimization program.
• The following table gives a summary comparison showing a good match
Voltage in % by PSO Voltage in % by ADVPF Difference in % Bus NAme Before after Before After Before After JJJ138S Utility 104.0 104.0 104.0 104.0 0 0 AAA138 Generator 102.0 102.0 102.0 102.0 0 0 DDD138 Generator 101.3 101.3 101.3 101.3 0 0 DDD69 Generator 100.0 100.0 100.0 100.0 0 0 FFF138 Generator 102.0 102.0 102.0 102.0 0 0 AAA69 Busbar 100.7 101.1 100.8 101.1 0.1 0 BBB138 Load 97.5 97.5 97.5 97.5 0 0 CCC138 Load 97.3 97.3 97.3 97.3 0 0 EEE69 Load 92.6 95.0 92.6 95.1 0 0.1 FFF69 Busbar 99.8 100.0 99.8 100.1 0 0.1 GGG138 Load 98.2 98.1 98.2 98.1 0 0 HHH138 Load 98.8 98.6 98.8 98.6 0 0 JJJ138 Busbar 104.0 104.0 104.0 104.0 0 0 JJJ138L Load 104.0 104.0 104.0 104.0 0 0 JJJ69 Busbar 99.9 100.0 99.9 100.1 0 0.1 ZZZ69 Load 93.0 95.0 93.0 95.0 0 0 Optimization Result for “Minimization of Load Shedding” is summarized below: EDSA Power System Optimization ============================== Project No. : 12345-1 Page : 1 Project Name: PSO Min Load Shedding Date : Title : a 14 bus system Time : Drawing No. : 12345-2 Company : Edsa Revision No.: 12345-3 Engineer : Edsa Jobfile Name: pso-min-load-shedding Check by : Scenario : 1 - Date : A 14-bus network shown in Fig.E.3 in Paul M. Anderson's Faulted Power Systems Optimization Objective: Minimization of Load Shedding Optimization is SUCCESSFUL. Economical Impact of Optimization ================================= Total System Losses Before Optimization = 13009.88 Kilo Watts Total System Losses After Optimization = 13527.97 Kilo Watts System Loss Reduction = -518.09 Kilo Watts Bus Voltage Change ================== Bus Name System kV Before(%) After(%) Vmin(%) Vmax(%) ------------------------ --------- --------- -------- --------- ------- JJJ138S Utility 138.000 104.0 104.0 95.0 105.0 AAA138 Generator 138.000 102.0 102.0 95.0 105.0 DDD138 Generator 138.000 101.3 101.3 95.0 105.0 DDD69 Generator 69.000 100.0 100.0 95.0 105.0 FFF138 Generator 138.000 102.0 102.0 95.0 105.0 AAA69 Busbar 69.000 100.7 101.1 95.0 105.0
38
Power System Optimization (PSO)
BBB138 Load 138.000 97.5 97.5 95.0 105.0 CCC138 Load 138.000 97.3 97.3 95.0 105.0 EEE69 Load 69.000 92.6* 95.0 95.0 105.0 FFF69 Busbar 69.000 99.8* 100.0 100.0 100.0 GGG138 Load 138.000 98.2 98.1 95.0 105.0 HHH138 Load 138.000 98.8 98.6 95.0 105.0 JJJ138 Busbar 138.000 104.0 104.0 95.0 105.0 JJJ138L Load 138.000 104.0 104.0 95.0 105.0 JJJ69 Busbar 69.000 99.9* 100.0 100.0 100.0 ZZZ69 Load 69.000 93.0* 95.0 95.0 105.0 Optimized Generator Active Power ================================ Bus Name Before(MW) After(MW) Generation Cost ($/MW) ------------------------ ---------- ---------- ---------------------- JJJ138S Utility 63.591 45.836 0.0000 Optimized Generator/SVC Scheduled Voltage ========================================= Bus Name System KV Before(%) After(%) ------------------------ ---------- ---------- ---------- JJJ138S Utility 138.000 104.0 104.0 AAA138 Generator 138.000 102.0 102.0 DDD69 Generator 69.000 100.0 100.0 FFF138 Generator 138.000 102.0 102.0 Optimized Transformer Tap Setting ================================= From Bus Name To Bus Name Before(p.u.) After(p.u.) ------------------------ ------------------------ ------------ ----------- FFF69 Busbar FFF138 Generator 0.98600 0.98503 JJJ69 Busbar JJJ138 Busbar 0.97200 0.97157 Report of Load Shedding ======================= Bus Name Initial Load(KVA) PowerFactor(%) Percent Load Shed Interruption Cost($) ------------------------ ----------------- -------------- ----------------- -------------------- EEE69 Load 32015.6 78.09 21.57 20. FFF138 Generator 111803.4 89.44 7.96 20. ZZZ69 Load 32015.6 78.09 17.28 20. Total Cost of Load Interruption($)= 353.4 Bus voltages using Advanced Powerflow program before load shedding EDSA Advanced Power Flow Program ================================ Project No. : 12345-1 Page : 1 Project Name: PSO Min Load Shedding Date : Title : a 14 bus system Time : Drawing No. : 12345-2 Company : Edsa Revision No.: 12345-3 Engineer : Edsa Jobfile Name: pso-min-load-shedding Check by : Scenario : 1 - Date : A 14-bus network shown in Fig.E.3 in Paul M. Anderson's Faulted Power Systems
39

Power System Optimization (PSO)
Bus Voltage Results =================== Bus Name Type V DROP ANG P Q PF (PU) (%) (DEG) (PU) (PU) (%) ------------------------ ------ -------- ------ ----- -------- -------- ------ JJJ138S Utility Swing 1.0400 -4.00 0.0 0.6359 1.1206 49.36 AAA138 Generator Gen * 1.0200 -2.00 6.6 1.0000 -0.1179 99.31 DDD138 Generator Gen * 1.0126 -1.26 9.8 1.0000 0.0584 99.83 DDD69 Generator Gen * 1.0000 0.00 8.8 0.0000 0.0317 0.00 FFF138 Generator Gen * 1.0200 -2.00 8.5 1.0000 0.1779 98.45 AAA69 Busbar None 1.0075 -0.75 5.2 0.0000 0.0000 BBB138 Load P_Load 0.9746 2.54 4.1 -0.5000 -0.0600 99.29 CCC138 Load P_Load 0.9733 2.67 5.7 -0.5000 -0.2500 89.44 EEE69 Load P_Load 0.9264 7.36 6.2 -0.2500 -0.1142 90.96 FFF69 Busbar None * 0.9979 0.21 7.7 0.0000 0.0000 GGG138 Load P_Load 0.9823 1.77 3.1 -0.5000 -0.2500 89.44 HHH138 Load P_Load 0.9875 1.25 0.1 -0.5000 -0.0550 99.40 JJJ138 Busbar None 1.0400 -4.00 0.0 0.0000 0.0000 JJJ138L Load P_Load 1.0400 -4.00 0.0 -1.0000 -0.5000 89.44 JJJ69 Busbar None * 0.9990 0.10 -0.4 0.0000 0.0000 ZZZ69 Load P_Load 0.9298 7.02 0.3 -0.2500 -0.1135 91.05 * : Voltage Controlled Buses Bus voltages using Advanced Powerflow program after load shedding EDSA Advanced Power Flow Program ================================ Project No. : 12345-1 Page : 1 Project Name: PSO Min Load Shedding Date : Title : a 14 bus system Time : Drawing No. : 12345-2 Company : Edsa Revision No.: 12345-3 Engineer : Edsa Jobfile Name: pso-min-load-shedding Check by : Scenario : 1 - Date : A 14-bus network shown in Fig.E.3 in Paul M. Anderson's Faulted Power Systems Bus Voltage Results =================== Bus Name Type V DROP ANG P Q PF (PU) (%) (DEG) (PU) (PU) (%) ------------------------ ------ -------- ------ ----- -------- -------- ------ JJJ138S Utility Swing 1.0400 -4.00 0.0 0.4647 1.1674 36.99 AAA138 Generator Gen * 1.0200 -2.00 7.3 1.0000 -0.1446 98.97 DDD138 Generator Gen * 1.0128 -1.28 11.8 1.0000 0.0582 99.83 DDD69 Generator Gen * 1.0000 0.00 11.0 0.0000 -0.0004 0.00 FFF138 Generator Gen * 1.0200 -2.00 10.7 1.0796 0.1376 99.20 AAA69 Busbar None 1.0108 -1.08 6.0 0.0000 0.0000 BBB138 Load P_Load 0.9745 2.55 5.4 -0.5000 -0.0601 99.29 CCC138 Load P_Load 0.9730 2.70 7.3 -0.5000 -0.2500 89.44 EEE69 Load P_Load 0.9505 4.95 8.7 -0.1961 -0.0665 94.70 FFF69 Busbar None * 1.0011 -0.11 10.1 0.0000 0.0000 GGG138 Load P_Load 0.9807 1.93 4.7 -0.5000 -0.2500 89.44 HHH138 Load P_Load 0.9860 1.40 1.2 -0.5000 -0.0556 99.39 JJJ138 Busbar None 1.0400 -4.00 0.0 0.0000 0.0000 JJJ138L Load P_Load 1.0400 -4.00 0.0 -1.0000 -0.5000 89.44
40

Power System Optimization (PSO)
JJJ69 Busbar None * 1.0009 -0.09 -0.2 0.0000 0.0000 ZZZ69 Load P_Load 0.9503 4.97 1.0 -0.2068 -0.0751 93.99 * : Voltage Controlled Buses Conclusions
a. The voltages at buses “EEE69 Load” and “ZZZ69 Load” were low and out of the normal voltage limits before optimization and were corrected after optimization.
b. The bus voltage result obtained by the Advanced Powerflow (after the minimum load
shedding scheme found by PSO were reflected in the jobfile) agrees very well with the result obtained by PSO
c. PSO can efficiently be used to design load shedding schemes in order to maintain power
system security
41

Power System Optimization (PSO)
19 How to Perform Optimization of Reactive Power Resources The jobfile used for this analysis option is named “PSO-Reactive-Optimization” which is in the DesignBase\Samples\PSO directory. The one line diagram of the system is shown below:
Figure 11: Single Line Diagram of the Sample Jobfile used in V&V of the “Optimization of Reactive Power Resources”
The optimization control setting for this jobfile is shown below:
Figure 12: Control Settings used in V&V of the “Optimization of Reactive Power Resources”
42

Power System Optimization (PSO)
Again, we have intentionally disabled all the control to see how much and where reactive power resources (i.e. capacitors and/or inductors) are required to alleviate the low/high voltages in the sample jobfile. In this example, all the system buses were selected as candidate buses for reactive power resources having the same cost as shown below:
Figure 13: Candidate Buses for reactive power resources used in V&V of the “Optimization of Reactive Power Resources”
To complete the V&V, perform the following steps:
• Run optimization program, the results include bus voltages before and after optimized control settings
• Run advanced power flow program, the calculated bus voltages should match the results obtained by optimization program
• Set the reactive powers indicated by PSO and then re-run advanced power flow program. The bus voltage results should be the same as the results obtained by optimization program
• The following table gives a summary comparison showing a good match
Voltage in % by PSO Voltage in % by ADVPF Difference in % Bus NAme Before after Before After Before After JJJ138S Utility 104.0 104.0 104.0 104.0 0 0 AAA138 Generator 102.0 102.0 102.0 102.0 0 0 DDD138 Generator 101.3 101.0 101.3 101.1 0 0.1 DDD69 Generator 100.0 100.0 100.0 100.0 0 0 FFF138 Generator 102.0 102.0 102.0 102.0 0 0 AAA69 Busbar 100.7 101.2 100.8 101.2 0.1 0 BBB138 Load 97.5 97.0 97.5 97.1 0 0.1 CCC138 Load 97.3 96.7 97.3 96.8 0 0.1 EEE69 Load 92.7 95.0 92.7 95.0 0 0 FFF69 Busbar 99.8 100.0 99.8 100.3 0 0.3 GGG138 Load 98.2 98.2 98.2 98.2 0 0 HHH138 Load 98.8 98.7 98.8 98.8 0 0.1 JJJ138 Busbar 104.0 104.0 104.0 104.0 0 0 JJJ138L Load 104.0 104.0 104.0 104.0 0 0 JJJ69 Busbar 99.9 100.0 99.9 100.3 0 0.3 ZZZ69 Load 93.0 95.0 93.0 95.0 0 0
43

Power System Optimization (PSO)
No
te: the bus voltages after optimization are all within defined limits.
Optimal result on Optimization of Reactive Power Resources EDSA Power System Optimization ======================================= Project No. : 12345-1 Page : 1 Project Name: PSO Testing Date : Title : a 14 bus system Time : Drawing No. : 12345-2 Company : Edsa Revision No.: 12345-3 Engineer : Edsa Jobfile Name: pso-reactive-optimization Check by : Scenario : 1 - Date : A 14-bus network shown in Fig.E.3 in Paul M. Anderson's Faulted Power Systems Optimization Objective: Optimization of Reactive Power Resources Optimization is SUCCESSFUL. Economical Impact of Optimization ================================= Total System Losses Before Optimization = 12979.39 Kilo Watts Total System Losses After Optimization = 12546.50 Kilo Watts System Loss Reduction = 432.89 Kilo Watts Bus Voltage Change ================== Bus Name System kV Before(%) After(%) Vmin(%) Vmax(%) ------------------------ --------- --------- -------- --------- ------- JJJ138S Utility 138.000 104.0 104.0 95.0 105.0 AAA138 Generator 138.000 102.0 102.0 95.0 105.0 DDD138 Generator 138.000 101.3 101.0 95.0 105.0 DDD69 Generator 69.000 100.0 100.0 95.0 105.0 FFF138 Generator 138.000 102.0 102.0 95.0 105.0 AAA69 Busbar 69.000 100.7 101.2 95.0 105.0 BBB138 Load 138.000 97.5 97.0 95.0 105.0 CCC138 Load 138.000 97.3 96.7 95.0 105.0 EEE69 Load 69.000 92.7* 95.0 95.0 105.0 FFF69 Busbar 69.000 99.8* 100.0 100.0 100.0 GGG138 Load 138.000 98.2 98.2 95.0 105.0 HHH138 Load 138.000 98.8 98.7 95.0 105.0 JJJ138 Busbar 138.000 104.0 104.0 95.0 105.0 JJJ138L Load 138.000 104.0 104.0 95.0 105.0 JJJ69 Busbar 69.000 99.9* 100.0 100.0 100.0 ZZZ69 Load 69.000 93.0* 95.0 95.0 105.0 Optimized Generator Active Power ================================ Bus Name Before(MW) After(MW) Generation Cost ($/MW) ------------------------ ---------- ---------- ---------------------- JJJ138S Utility 62.979 62.545 0.0000
44

Power System Optimization (PSO)
Optimized Generator/SVC Scheduled Voltage ========================================= Bus Name System KV Before(%) After(%) ------------------------ ---------- ---------- ---------- JJJ138S Utility 138.000 104.0 104.0 AAA138 Generator 138.000 102.0 102.0 DDD69 Generator 69.000 100.0 100.0 FFF138 Generator 138.000 102.0 102.0 Optimized Transformer Tap Setting ================================= From Bus Name To Bus Name Before(p.u.) After(p.u.) ------------------------ ------------------------ ------------ ----------- FFF69 Busbar FFF138 Generator 0.98600 0.98259 JJJ69 Busbar JJJ138 Busbar 0.97200 0.96897 Optimally Allocated Reactive Power ================================== Bus Name kVAR MVAR ------------------------ ------------ ------------ CCC138 Load -4699.7 -4.70 EEE69 Load 9243.1 9.24 ZZZ69 Load 7004.9 7.00 Bus voltages using advanced powerflow program before reactive power adjustment EDSA Advanced Power Flow Program ================================ Project No. : 12345-1 Page : 1 Project Name: PSO Testing Date : Title : a 14 bus system Time : Drawing No. : 12345-2 Company : Edsa Revision No.: 12345-3 Engineer : Edsa Jobfile Name: pso-reactive-optimization Check by : Scenario : 1 - Date : A 14-bus network shown in Fig.E.3 in Paul M. Anderson's Faulted Power Systems Bus Voltage Results =================== Bus Name Type V DROP ANG P Q PF (PU) (%) (DEG) (PU) (PU) (%) ------------------------ ------ -------- ------ ----- -------- -------- ------ JJJ138S Utility Swing 1.0400 -4.00 0.0 0.6298 1.1209 48.98 AAA138 Generator Gen * 1.0200 -2.00 6.6 1.0000 -0.1182 99.31 DDD138 Generator Gen * 1.0127 -1.27 9.8 1.0000 0.0600 99.82 DDD69 Generator Gen * 1.0000 0.00 8.8 0.0000 0.0311 0.00 FFF138 Generator Gen * 1.0200 -2.00 8.5 1.0000 0.1766 98.48 AAA69 Busbar None 1.0075 -0.75 5.2 0.0000 0.0000 BBB138 Load P_Load 0.9747 2.53 4.1 -0.5000 -0.0600 99.29 CCC138 Load P_Load 0.9734 2.66 5.7 -0.5000 -0.2500 89.44 EEE69 Load P_Load 0.9265 7.35 6.2 -0.2500 -0.1142 90.96 FFF69 Busbar None * 0.9979 0.21 7.7 0.0000 0.0000 GGG138 Load P_Load 0.9823 1.77 3.1 -0.5000 -0.2500 89.44 HHH138 Load P_Load 0.9875 1.25 0.2 -0.5000 -0.0550 99.40
45
Power System Optimization (PSO)
JJJ138 Busbar None 1.0400 -4.00 0.0 0.0000 0.0000 JJJ138L Load P_Load 1.0400 -4.00 0.0 -1.0000 -0.5000 89.44 JJJ69 Busbar None * 0.9991 0.09 -0.4 0.0000 0.0000 ZZZ69 Load P_Load 0.9301 6.99 0.3 -0.2500 -0.1135 91.06 * : Voltage Controlled Buses Bus voltages using advanced power flow program after reactive power adjustment EDSA Advanced Power Flow Program ================================ Project No. : 12345-1 Page : 1 Project Name: PSO Testing Date : Title : a 14 bus system Time : Drawing No. : 12345-2 Company : Edsa Revision No.: 12345-3 Engineer : Edsa Jobfile Name: pso-reactive-optimization Check by : Scenario : 1 - Date : A 14-bus network shown in Fig.E.3 in Paul M. Anderson's Faulted Power Systems Bus Voltage Results =================== Bus Name Type V DROP ANG P Q PF (PU) (%) (DEG) (PU) (PU) (%) ------------------------ ------ -------- ------ ----- -------- -------- ------ JJJ138S Utility Swing 1.0400 -4.00 0.0 0.6256 1.0856 49.93 AAA138 Generator Gen * 1.0200 -2.00 6.6 1.0000 -0.1346 99.11 DDD138 Generator Gen * 1.0105 -1.05 9.9 1.0000 0.0600 99.82 DDD69 Generator Gen * 1.0000 -0.00 8.9 0.0000 0.0000 0.00 FFF138 Generator Gen * 1.0200 -2.00 8.6 1.0000 0.1466 98.94 AAA69 Busbar None 1.0116 -1.16 5.2 0.0000 0.0000 BBB138 Load P_Load 0.9710 2.90 4.1 -0.5000 -0.0614 99.25 CCC138 Load P_Load 0.9680 3.20 5.8 -0.5000 -0.2940 86.20 EEE69 Load P_Load 0.9495 5.05 5.4 -0.2500 -0.0265 99.44 FFF69 Busbar None * 1.0027 -0.27 7.8 0.0000 0.0000 GGG138 Load P_Load 0.9823 1.77 3.2 -0.5000 -0.2500 89.44 HHH138 Load P_Load 0.9875 1.25 0.2 -0.5000 -0.0550 99.40 JJJ138 Busbar None 1.0400 -4.00 0.0 0.0000 0.0000 JJJ138L Load P_Load 1.0400 -4.00 0.0 -1.0000 -0.5000 89.44 JJJ69 Busbar None * 1.0031 -0.31 -0.4 0.0000 0.0000 ZZZ69 Load P_Load 0.9501 4.99 -0.3 -0.2500 -0.0465 98.31 * : Voltage Controlled Buses Conclusions
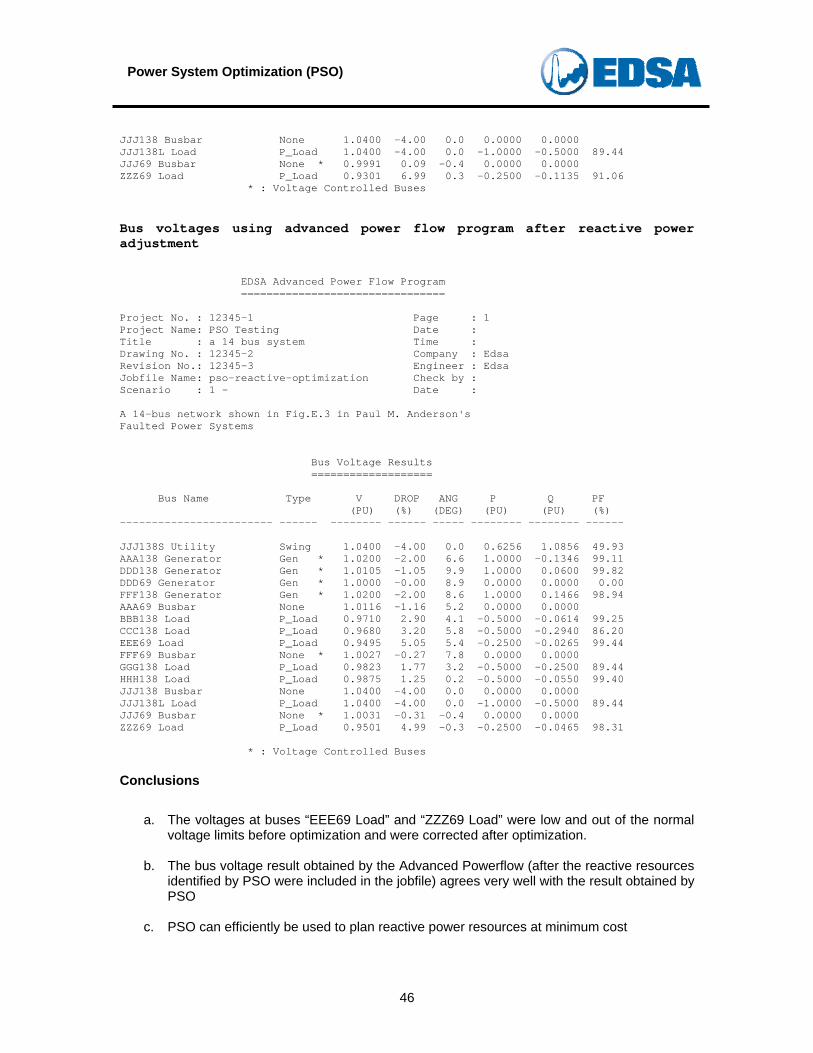
a. The voltages at buses “EEE69 Load” and “ZZZ69 Load” were low and out of the normal voltage limits before optimization and were corrected after optimization.
b. The bus voltage result obtained by the Advanced Powerflow (after the reactive resources
identified by PSO were included in the jobfile) agrees very well with the result obtained by PSO
c. PSO can efficiently be used to plan reactive power resources at minimum cost
46

Power System Optimization (PSO)
47
20 How to Perform Minimum Control Adjustments The jobfile used for this analysis option is named “Pso_14node_MinControls” which is in the DesignBase\Samples\PSO directory. The one line diagram of the system is shown below:
Figure 14: Single Line Diagram of the Sample Jobfile used in V&V of the “Minimum Control Adjustments”
In this analysis option all of the available controls, i.e., transformer taps, generators scheduled voltages, etc. are selected to see how many controls should be adjusted in order to satisfy the constraints (voltages are within prescribed limits, powerflow are within the transformers/cables loading capabilities, etc.). However, normally active power generation is not selected in this type of analysis.
Figure 15: Control Settings used in V&V of the “Minimum Control Adjustments”
Power System Optimization (PSO)
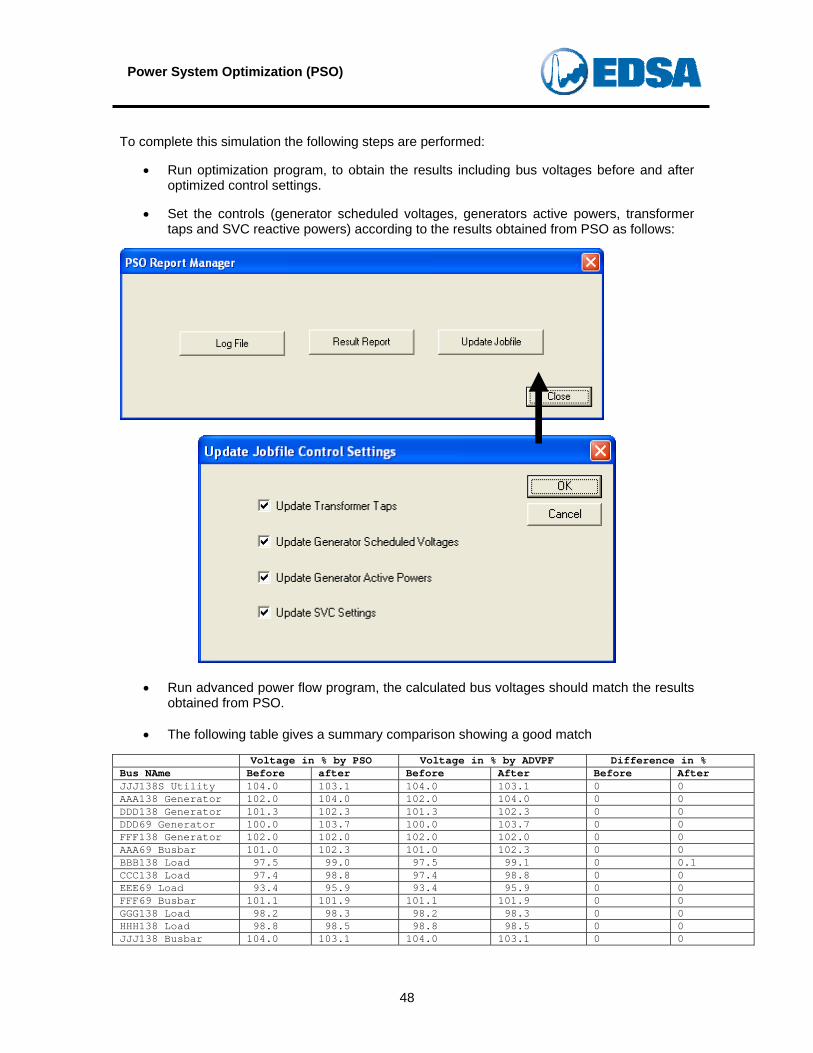
To complete this simulation the following steps are performed:
• Run optimization program, to obtain the results including bus voltages before and after optimized control settings.
• Set the controls (generator scheduled voltages, generators active powers, transformer
taps and SVC reactive powers) according to the results obtained from PSO as follows:
• Run advanced power flow program, the calculated bus voltages should match the results obtained from PSO.
• The following table gives a summary comparison showing a good match
Voltage in % by PSO Voltage in % by ADVPF Difference in %
Bus NAme Before after Before After Before After JJJ138S Utility 104.0 103.1 104.0 103.1 0 0 AAA138 Generator 102.0 104.0 102.0 104.0 0 0 DDD138 Generator 101.3 102.3 101.3 102.3 0 0 DDD69 Generator 100.0 103.7 100.0 103.7 0 0 FFF138 Generator 102.0 102.0 102.0 102.0 0 0 AAA69 Busbar 101.0 102.3 101.0 102.3 0 0 BBB138 Load 97.5 99.0 97.5 99.1 0 0.1 CCC138 Load 97.4 98.8 97.4 98.8 0 0 EEE69 Load 93.4 95.9 93.4 95.9 0 0 FFF69 Busbar 101.1 101.9 101.1 101.9 0 0 GGG138 Load 98.2 98.3 98.2 98.3 0 0 HHH138 Load 98.8 98.5 98.8 98.5 0 0 JJJ138 Busbar 104.0 103.1 104.0 103.1 0 0
48
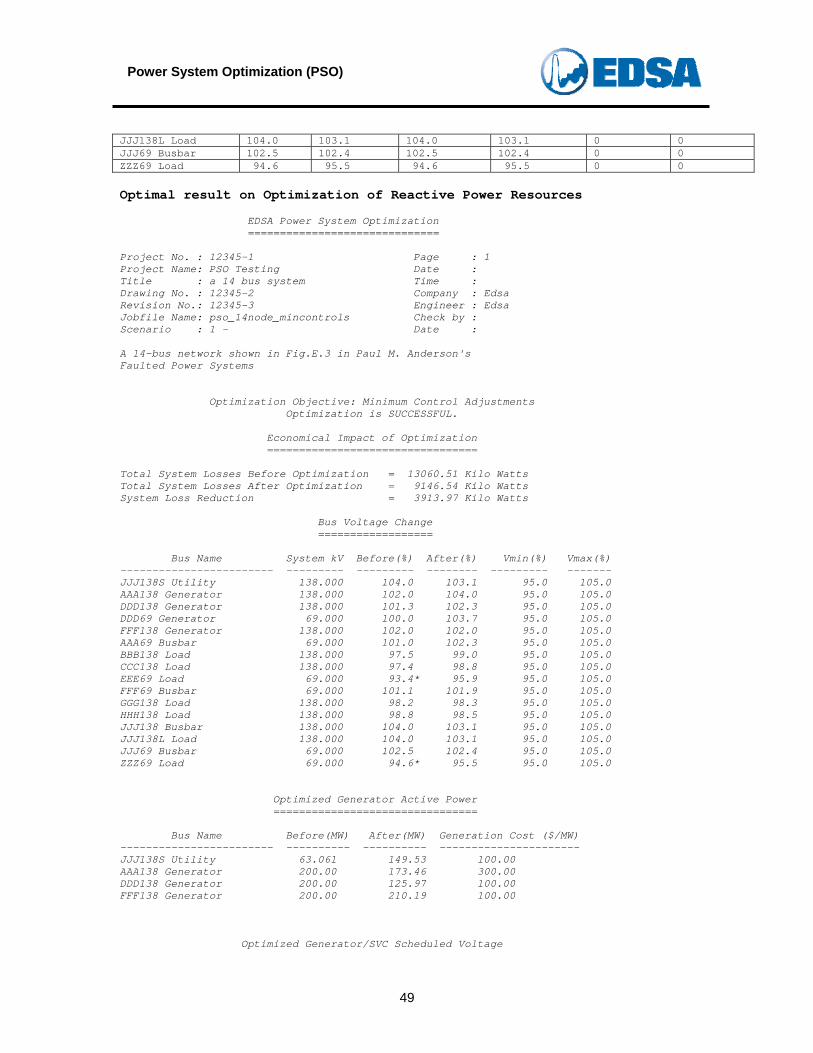
Power System Optimization (PSO)
JJJ138L Load 104.0 103.1 104.0 103.1 0 0 JJJ69 Busbar 102.5 102.4 102.5 102.4 0 0 ZZZ69 Load 94.6 95.5 94.6 95.5 0 0 Optimal result on Optimization of Reactive Power Resources EDSA Power System Optimization ============================== Project No. : 12345-1 Page : 1 Project Name: PSO Testing Date : Title : a 14 bus system Time : Drawing No. : 12345-2 Company : Edsa Revision No.: 12345-3 Engineer : Edsa Jobfile Name: pso_14node_mincontrols Check by : Scenario : 1 - Date : A 14-bus network shown in Fig.E.3 in Paul M. Anderson's Faulted Power Systems Optimization Objective: Minimum Control Adjustments Optimization is SUCCESSFUL. Economical Impact of Optimization ================================= Total System Losses Before Optimization = 13060.51 Kilo Watts Total System Losses After Optimization = 9146.54 Kilo Watts System Loss Reduction = 3913.97 Kilo Watts Bus Voltage Change ================== Bus Name System kV Before(%) After(%) Vmin(%) Vmax(%) ------------------------ --------- --------- -------- --------- ------- JJJ138S Utility 138.000 104.0 103.1 95.0 105.0 AAA138 Generator 138.000 102.0 104.0 95.0 105.0 DDD138 Generator 138.000 101.3 102.3 95.0 105.0 DDD69 Generator 69.000 100.0 103.7 95.0 105.0 FFF138 Generator 138.000 102.0 102.0 95.0 105.0 AAA69 Busbar 69.000 101.0 102.3 95.0 105.0 BBB138 Load 138.000 97.5 99.0 95.0 105.0 CCC138 Load 138.000 97.4 98.8 95.0 105.0 EEE69 Load 69.000 93.4* 95.9 95.0 105.0 FFF69 Busbar 69.000 101.1 101.9 95.0 105.0 GGG138 Load 138.000 98.2 98.3 95.0 105.0 HHH138 Load 138.000 98.8 98.5 95.0 105.0 JJJ138 Busbar 138.000 104.0 103.1 95.0 105.0 JJJ138L Load 138.000 104.0 103.1 95.0 105.0 JJJ69 Busbar 69.000 102.5 102.4 95.0 105.0 ZZZ69 Load 69.000 94.6* 95.5 95.0 105.0 Optimized Generator Active Power ================================ Bus Name Before(MW) After(MW) Generation Cost ($/MW) ------------------------ ---------- ---------- ---------------------- JJJ138S Utility 63.061 149.53 100.00 AAA138 Generator 200.00 173.46 300.00 DDD138 Generator 200.00 125.97 100.00 FFF138 Generator 200.00 210.19 100.00 Optimized Generator/SVC Scheduled Voltage
49

Power System Optimization (PSO)
========================================= Bus Name System KV Before(%) After(%) ------------------------ ---------- ---------- ---------- JJJ138S Utility 138.000 104.0 103.1 AAA138 Generator 138.000 102.0 104.0 DDD69 Generator 69.000 100.0 103.7 FFF138 Generator 138.000 102.0 102.0 Bus voltages using advanced power flow program before optimization EDSA Advanced Power Flow Program ================================ Project No. : 12345-1 Page : 1 Project Name: PSO Testing Date : Title : a 14 bus system Time : Drawing No. : 12345-2 Company : Edsa Revision No.: 12345-3 Engineer : Edsa Jobfile Name: pso_14node_mincontrols Check by : Scenario : 1 - Date : A 14-bus network shown in Fig.E.3 in Paul M. Anderson's Faulted Power Systems Bus Voltage Results =================== Bus Name Type V DROP ANG P Q PF (PU) (%) (DEG) (PU) (PU) (%) ------------------------ ------ -------- ------ ----- -------- -------- ------ JJJ138S Utility Swing 1.0400 -4.00 0.0 0.6306 1.1456 48.22 AAA138 Generator Gen 1.0200 -2.00 6.7 1.0000 -0.1446 98.97 DDD138 Generator Gen 1.0130 -1.30 9.9 1.0000 0.0620 99.81 DDD69 Generator Gen 1.0000 0.00 8.9 0.0000 0.0169 0.00 FFF138 Generator Gen 1.0200 -2.00 8.5 1.0000 0.1881 98.28 AAA69 Busbar None 1.0102 -1.02 5.4 0.0000 0.0000 BBB138 Load P_Load 0.9749 2.51 4.2 -0.5000 -0.0599 99.29 CCC138 Load P_Load 0.9736 2.64 5.8 -0.5000 -0.2500 89.44 EEE69 Load P_Load 0.9337 6.63 6.3 -0.2500 -0.1128 91.15 FFF69 Busbar None 1.0106 -1.06 7.7 0.0000 0.0000 GGG138 Load P_Load 0.9823 1.77 3.2 -0.5000 -0.2500 89.44 HHH138 Load P_Load 0.9875 1.25 0.2 -0.5000 -0.0550 99.40 JJJ138 Busbar None 1.0400 -4.00 0.0 0.0000 0.0000 JJJ138L Load P_Load 1.0400 -4.00 0.0 -1.0000 -0.5000 89.44 JJJ69 Busbar None 1.0251 -2.51 -0.5 0.0000 0.0000 ZZZ69 Load P_Load 0.9463 5.37 0.4 -0.2500 -0.1105 91.47
50
Power System Optimization (PSO)
51
Bus voltages using advanced power flow program after optimization EDSA Advanced Power Flow Program ================================ Project No. : 12345-1 Page : 1 Project Name: PSO Testing Date : Title : a 14 bus system Time : Drawing No. : 12345-2 Company : Edsa Revision No.: 12345-3 Engineer : Edsa Jobfile Name: pso_14node_mincontrols Check by : Scenario : 1 - Date : A 14-bus network shown in Fig.E.3 in Paul M. Anderson's Faulted Power Systems Bus Voltage Results =================== Bus Name Type V DROP ANG P Q PF (PU) (%) (DEG) (PU) (PU) (%) ------------------------ ------ -------- ------ ----- -------- -------- ------ JJJ138S Utility Swing 1.0307 -3.07 0.0 1.4952 0.5940 92.94 AAA138 Generator Gen 1.0401 -4.01 0.2 0.7346 0.1448 98.11 DDD138 Generator Gen 1.0228 -2.28 -3.8 0.2598 0.0620 97.27 DDD69 Generator Gen 1.0372 -3.72 -4.5 0.0000 0.3216 0.00 FFF138 Generator Gen 1.0200 -2.00 -0.0 1.1019 0.0249 99.97 AAA69 Busbar None 1.0234 -2.34 -0.7 0.0000 0.0000 BBB138 Load P_Load 0.9905 0.95 -5.8 -0.5000 -0.0538 99.43 CCC138 Load P_Load 0.9877 1.23 -6.0 -0.5000 -0.2500 89.44 EEE69 Load P_Load 0.9589 4.11 -4.8 -0.2500 -0.1080 91.79 FFF69 Busbar None 1.0186 -1.86 -1.1 0.0000 0.0000 GGG138 Load P_Load 0.9829 1.71 -3.3 -0.5000 -0.2500 89.44 HHH138 Load P_Load 0.9848 1.52 -4.0 -0.5000 -0.0560 99.38 JJJ138 Busbar None 1.0307 -3.07 -0.0 0.0000 0.0000 JJJ138L Load P_Load 1.0307 -3.07 -0.0 -1.0000 -0.5000 89.44 JJJ69 Busbar None 1.0238 -2.38 -0.8 0.0000 0.0000 ZZZ69 Load P_Load 0.9546 4.54 -2.8 -0.2500 -0.1089 91.68 Conclusions
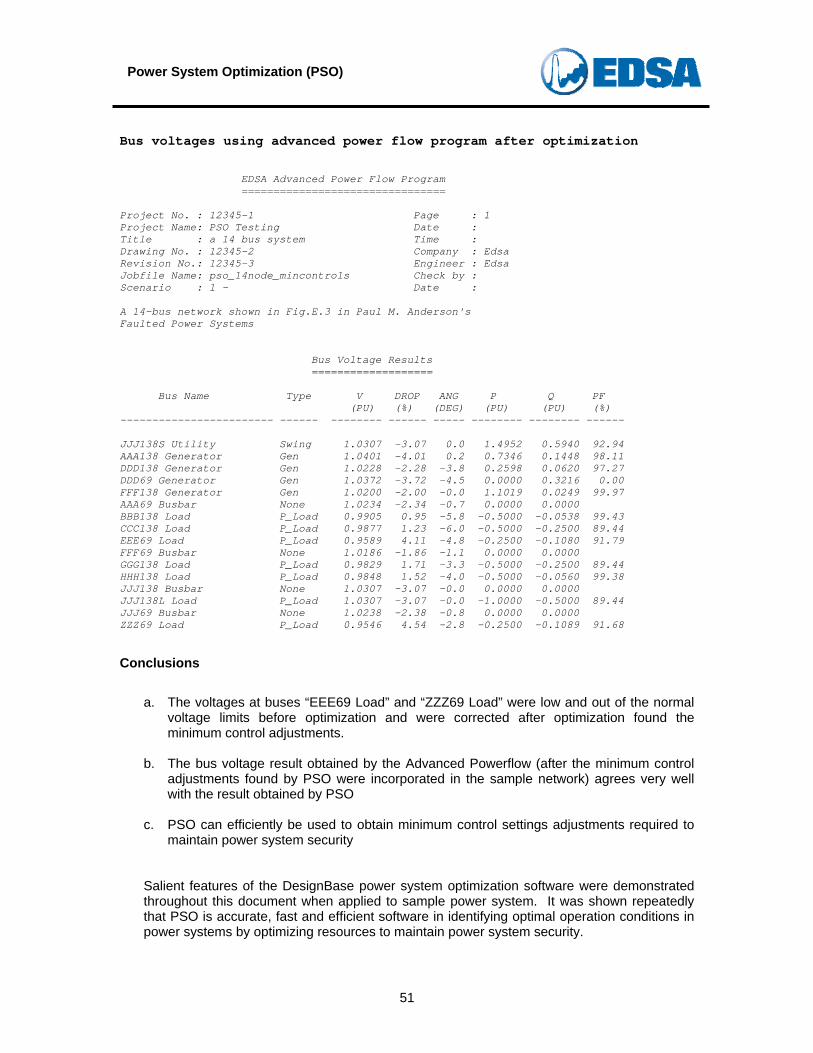
a. The voltages at buses “EEE69 Load” and “ZZZ69 Load” were low and out of the normal voltage limits before optimization and were corrected after optimization found the minimum control adjustments.
b. The bus voltage result obtained by the Advanced Powerflow (after the minimum control
adjustments found by PSO were incorporated in the sample network) agrees very well with the result obtained by PSO
c. PSO can efficiently be used to obtain minimum control settings adjustments required to
maintain power system security
Salient features of the DesignBase power system optimization software were demonstrated throughout this document when applied to sample power system. It was shown repeatedly that PSO is accurate, fast and efficient software in identifying optimal operation conditions in power systems by optimizing resources to maintain power system security.
Copyright © 2022 FDOKUMEN