Data-Driven Online Optimization for Enhancing Power System ...
10
1 Abstract—This paper reports an initial work on power sys- tem oscillation damping improvement using a data-driven online optimization method. An online oscillation damping op- timization model is proposed and formulated in a form solvable by the data-driven method. Key issues in the online optimiza- tion procedures, including the damping sensitivity identification method, its compatibility with the dispatch plans, as well as other practical issues in real large-scale system are discussed. Simulation results based on a 2-area 4-machine system, an 8- machine 36-bus system and NETS-NYPS 68-bus system verify the feasibility and efficiency of the proposed method. The re- sults also show the capability of the proposed method to bridge the gap between online data analysis and complex optimization for power system dynamics. Index Terms—data-driven method, damping improvement, inter-area mode oscillation, online optimization, sensitivity identification. I. INTRODUCTION ODERN power systems are undergoing a series of evo- lutions including the popularization of power electronic devices, the deepening integration of massive renewa- ble energy sources (RESs), the rapid development of electric- ity markets, and the extensive application of various hetero- geneous controllers [1-3]. Under such circumstances, high uncertainty and complexity become new features of modern power systems, which increasingly complicates system dy- namics. One of the most complicate issues frequently encountered in modern power systems is the oscillations. In general, pow- er system oscillations are caused by insufficient damping, forced oscillations, unmatched controller settings, unmatched network parameters, or nonlinear phenomenon [4-10]. Alt- hough most oscillations can be eliminated by controllers, it is still desirable that certain oscillations that are highly related to the system operating points, such as inter-area low fre- quency oscillations, can be resolved in an operation manner, rather than employing more sophisticated wide area control- lers, which may cause even more control stability issues since the control systems may become more and more com- plex. This work was supported in part by the National Natural Science Founda- tion of China (51607071), and the Natural Science Foundation of Guangdong Province, China (2018B030306041). Zhihao Chen, Junbo Zhang (Corresponding Author) and Lin Guan are with School of Electrical Power, South China University of Technology, Guangzhou, Guangdong, P. R. China. E-mail: [email protected]. Hanchen Xu is with Department of Electrical and Computer Engineering, University of Illinois at Urbana-Champaign, Urbana, IL 61801, USA. To prevent system from inter-area low frequency oscilla- tions, the system should be operated at a secure operating point, at which the minimum damping ratio of the critical inter-area oscillation mode is higher than 3-4%. However, in some cases, to mitigate the impacts from uncertainty caused by the RESs, the system may operate at a poorly damped point, at which the minimum damping ratio is lower than 3- 4%, and then re-dispatch measures must be taken to restore the system to security again, which raises the problem of damping improvement using re-dispatch strategies [11-12]. Conventionally, damping improvement using re-dispatch strategy is designed offline with model-based optimization method [11-12], and it can hardly adapt to various operation conditions in the uncertain modern power systems. In recent years, with the development of signal processing and data science, online oscillation damping monitoring becomes pos- sible [13-14], making it feasible to establish the connection between the oscillation damping and various system opera- tion conditions, and consequently makes the data-driven based damping improvement feasible. Some pioneers in this area have tried using damping sensi- tivity as an intermediate variable for system re-dispatch, but they ignored the fact that the damping sensitivity varies sig- nificantly along the re-dispatch process; therefore, these methods are generally inappropriate for real power systems [15]. Some other researchers tried artificial neural networks, but initial results were limited to a fixed system operation condition, making the algorithm impractical in real power systems [16]. In fact, while improving system damping with re-dispatch may sound attempting, developing a practical data-driven method for it is quite challenging due to 1) the time-varying nature of the optimization problem, 2) the accu- racy problem of parameters used in the optimization, and 3) the poor data quality and the high cost for data communica- tion [17-20]. Indeed, all these issues may lead to various practical concerns that need extensive investigation. In addi- tion, machine learning algorithms for a large-scale system operation may also encounter issues such as incomplete data, underdetermined model, and ill-conditioned problems, which highlight the need of feature reduction using problem specific decomposition. In this paper, an initial work on power system oscillation damping improvement using data-driven based online optimization method is reported, which can also be regarded as a bridge between the situation awareness and practical power system operations and an attempt to justify the capability of online real-time data analysis in complicat- ed power system dynamic optimizations. The proposed method has the following merits: Data-Driven Online Optimization for Enhancing Power System Oscillation Damping Zhihao Chen, Student Member, IEEE, Hanchen Xu, Student Member, IEEE, Junbo Zhang, Senior Member, IEEE, and Lin Guan, Member, IEEE M
-
Upload
khangminh22 -
Category
Documents
-
view
2 -
download
0
Transcript of Data-Driven Online Optimization for Enhancing Power System ...
1
Abstract—This paper reports an initial work on power sys-
tem oscillation damping improvement using a data-driven online optimization method. An online oscillation damping op-timization model is proposed and formulated in a form solvable by the data-driven method. Key issues in the online optimiza-tion procedures, including the damping sensitivity identification method, its compatibility with the dispatch plans, as well as other practical issues in real large-scale system are discussed. Simulation results based on a 2-area 4-machine system, an 8-machine 36-bus system and NETS-NYPS 68-bus system verify the feasibility and efficiency of the proposed method. The re-sults also show the capability of the proposed method to bridge the gap between online data analysis and complex optimization for power system dynamics.
Index Terms—data-driven method, damping improvement, inter-area mode oscillation, online optimization, sensitivity identification.
I. INTRODUCTION ODERN power systems are undergoing a series of evo-lutions including the popularization of power electronic devices, the deepening integration of massive renewa-
ble energy sources (RESs), the rapid development of electric-ity markets, and the extensive application of various hetero-geneous controllers [1-3]. Under such circumstances, high uncertainty and complexity become new features of modern power systems, which increasingly complicates system dy-namics.
One of the most complicate issues frequently encountered in modern power systems is the oscillations. In general, pow-er system oscillations are caused by insufficient damping, forced oscillations, unmatched controller settings, unmatched network parameters, or nonlinear phenomenon [4-10]. Alt-hough most oscillations can be eliminated by controllers, it is still desirable that certain oscillations that are highly related to the system operating points, such as inter-area low fre-quency oscillations, can be resolved in an operation manner, rather than employing more sophisticated wide area control-lers, which may cause even more control stability issues since the control systems may become more and more com-plex.
This work was supported in part by the National Natural Science Founda-
tion of China (51607071), and the Natural Science Foundation of Guangdong Province, China (2018B030306041).
Zhihao Chen, Junbo Zhang (Corresponding Author) and Lin Guan are with School of Electrical Power, South China University of Technology, Guangzhou, Guangdong, P. R. China. E-mail: [email protected].
Hanchen Xu is with Department of Electrical and Computer Engineering, University of Illinois at Urbana-Champaign, Urbana, IL 61801, USA.
To prevent system from inter-area low frequency oscilla-tions, the system should be operated at a secure operating point, at which the minimum damping ratio of the critical inter-area oscillation mode is higher than 3-4%. However, in some cases, to mitigate the impacts from uncertainty caused by the RESs, the system may operate at a poorly damped point, at which the minimum damping ratio is lower than 3-4%, and then re-dispatch measures must be taken to restore the system to security again, which raises the problem of damping improvement using re-dispatch strategies [11-12].
Conventionally, damping improvement using re-dispatch strategy is designed offline with model-based optimization method [11-12], and it can hardly adapt to various operation conditions in the uncertain modern power systems. In recent years, with the development of signal processing and data science, online oscillation damping monitoring becomes pos-sible [13-14], making it feasible to establish the connection between the oscillation damping and various system opera-tion conditions, and consequently makes the data-driven based damping improvement feasible.
Some pioneers in this area have tried using damping sensi-tivity as an intermediate variable for system re-dispatch, but they ignored the fact that the damping sensitivity varies sig-nificantly along the re-dispatch process; therefore, these methods are generally inappropriate for real power systems [15]. Some other researchers tried artificial neural networks, but initial results were limited to a fixed system operation condition, making the algorithm impractical in real power systems [16]. In fact, while improving system damping with re-dispatch may sound attempting, developing a practical data-driven method for it is quite challenging due to 1) the time-varying nature of the optimization problem, 2) the accu-racy problem of parameters used in the optimization, and 3) the poor data quality and the high cost for data communica-tion [17-20]. Indeed, all these issues may lead to various practical concerns that need extensive investigation. In addi-tion, machine learning algorithms for a large-scale system operation may also encounter issues such as incomplete data, underdetermined model, and ill-conditioned problems, which highlight the need of feature reduction using problem specific decomposition. In this paper, an initial work on power system oscillation damping improvement using data-driven based online optimization method is reported, which can also be regarded as a bridge between the situation awareness and practical power system operations and an attempt to justify the capability of online real-time data analysis in complicat-ed power system dynamic optimizations. The proposed method has the following merits:
Data-Driven Online Optimization for Enhancing Power System Oscillation Damping
Zhihao Chen, Student Member, IEEE, Hanchen Xu, Student Member, IEEE, Junbo Zhang, Senior Member, IEEE, and Lin Guan, Member, IEEE
M
2
• purely data-driven without relying on system parameters and offline models;
• complementary to the damping controllers to solve low damping problems caused by fast load/renewable energy changing;
• online adaptable to various system operating conditions; and
• feasible to be implemented in large-scale systems using problem specific feature reduction techniques. The remainder of this paper is organized as follows. Sec-
tion II proposes a data-driven online optimization method for power system oscillation damping improvement. Section III discusses key issues in the optimization procedures, including the damping sensitivity identification and its compatibility to the dispatch plans, as well as practical issues for online ap-plications. Section IV provides three case studies on a 2-area 4-machine system, and an 8-generator 36-node system as well as the NETS-NYPS 68-bus system, respectively. Section V concludes the paper.
II. DATA-DRIVEN ONLINE DAMPING OPTIMIZATION In this section, an initial model of damping optimization is
first developed, and a modified model is presented, which can be solved by a data-driven approach online.
A. Damping Optimization Problem Power system operation conditions can be characterized
by system states and parameters [4]. The former include power flows, device connection and operation states, while the latter include network parameters, device parameters, and etc. In general, when the system operates in a steady state, these parameters vary smoothly, and the system operation condition is mainly determined by the power flow, which is further determined by the active and reactive power injec-tions at each bus in the system. Therefore, if we measure the power injections at each bus as x, the system state matrix A of the system linearized model becomes a function of x. Then, the damping ratios of the eigenvalues of A, denoted by ζ, can be calculated as a function of x as follows:
. (1)
In this case, the online damping ratio optimization can be summarized as the following problem: given x[t] at time t, if the minimum damping ratio of the system, ζ[t], is lower than 3%, the objective is to determine the optimal changes of x at time t+1, Δx[t+1], so as to maximize the minimum damping ratio of ζ[t+1] determined by x[t+1]:
(2)
where and are the lower and upper
bounds of Δx[t+1], respectively; and are the lower and upper bounds of x[t+1], respectively.
Note that, the lower and upper bounds of x and Δx at time
t are determined by the boundaries of generation, the genera-tion ramp rates, the N-1 stability constraints, and etc. In this work, due to the space limitation, we assume the boundaries are already available and focus on the framework of the data-driven online damping optimization.
B. Online Optimization Algorithm The above problem can be solved when the system model
f is available at each time t and the computation time from t to t+1 is sufficient. However, these two requirements are hardly satisfied because 1) the multi-machine bulk power system are integrated with intermittent and uncertain RESs and loads, and 2) the system has complex control networks which are difficult to model. Moreover, since the system is time-varying, it is impossible to obtain the real optimal point because the regulation takes time. Therefore, we modify the optimal problem so as to get a model that is applicable in real-time and gives near optimal results. Given x[t] at time t, approximating f with the following affine function:
, (3)
where is the sensitivity matrix. Then, (2) can be formu-lated as:
. (4)
Introducing an auxiliary variable δ, the above optimal func-tion can be further formulated as:
(5)
Problem (5) is a linear program (LP) and can be solved effi-ciently using a variety of algorithms [21].
C. The Data-Driven Approach Optimization problem (5) is solvable online if parameters
, , and are available. For power sys-
tems, and are mainly determined by the ramp rate and capability of generators, the dispatch intervals, and the original dispatch schedule [22]. While for , which is a nonlinear and time-varying vector, it can be esti-mated using the operation data provided by the wide-area measurement systems (WAMS) and the supervisory control and data acquisition system (SCADA). Therefore, we have the data-driven approach in three parallel threads, which is illustrated via the flow chart shown in Fig. 1.
Parallel thread 1: measure system states with WAMS and SCADA;
Parallel thread 2: estimate minimum damping of the sys-tem using a variety of methods such as the ones in [13] and [14];
Parallel thread 3: if the minimum damping ratio of the system, ζ[t], is lower than 3% at time t, estimate damping
)(= xfζ
]1+[]1+[Δ+][]1+[
]1+[Δ]1+[Δ]1+[Δ..
])}1+[Δ+][({minmaxΔ
tttt
tttts
ttjj
xxxx
xxx
xxfx
≤≤
≤≤
]1+[Δ tx ]1+[Δ tx
]1+[tx ]1+[tx
]1+[Δ][+][=])1+[Δ+][( tttζtt jj xΨxxf
][tΨ
]1+[Δ]1+[Δ]1+[Δ..
]1+[Δ][+][maxΔ
tttts
tttζ j
xxx
xΨx
≤≤
]1+[Δ]1+[Δ]1+[Δ
]1+[Δ][..
max,Δ
ttt
δttts
δ
j
δ
xxx
xΨx
≤≤
≥
][tΨ ]1+[Δ tx ]1+[Δ tx
]1+[Δ tx ]1+[Δ tx
][tΨ

3
sensitivity using the method to be discussed in Section III, and then solve (5) to re-dispatch the system at t+1 with the optimal result Δx[t+1].
Note that, among these three threads, the sensitivity ma-trix identification is just one part of the approach frame, but it is the very key to a successful optimization at a power sys-tem operating point.
In addition, it is possible that the minimum eigenvalue may change during the operation. However, the proposed method attempts to improve the damping ratio of the small signal stability problem but not to get trace of the same ei-genvalue. In this case, the proposed method will adjust the minimum eigenvalue as long as the minimal one reach the requirement.
Fig. 1. Flow chart of the data-driven based online damping optimization.
D. Discussions To implement the proposed method in real power systems,
there are some practically issues to be considered: First, the matrix A of a power system is not only influ-
enced by injections but also by grid topological modifica-tions. The grid topological modifications will change the impedance in the direct path between the main groups of oscillating machines of an inter-area mode and therefore modify the damping of the mode. However, in large power systems, one or two grid topological modifications would not bring large changes to the damping ratio and the damping sensitivities of the dominant interarea mode since one grid topological modification is too limited. In this case, the pro-posed method can be reset according to the new operating data, and then it can work after the transient.
Second, the low damping problem in a real power system may cause by a fault or fast load/renewable energy change. In the former case, damping controllers such as power system stabilizers (PSSs) are equipped to increase the damping. While in the second case, generator re-dispatch should be performed, and the proposed approach could play a comple-mentary role to the damping control.
Third, the sensitivity matrix identification is one part of the approach frame, but it is the very key to a successful op-timization, which guarantees the damping ratio of the mini-mum eigenvalue will be improved at time t compared to the case without optimization, and we are going to discuss this issue in the following section. However, it does not guarantee
the minimum eigenvalue at time t will always be improved compared to the one at time t-1 due to the planned dispatch and load/RESs change.
III. KEY ISSUES IN OPTIMIZATION PROCEDURES In this part, we provide solutions to the key issues in the
online optimization procedures, including the damping sensi-tivity identification, the compatibility with the dispatch plans, and its potential to be implemented in large-scale power systems. Some other practical issues are also dis-cussed.
A. Damping Sensitivity Identification Given x[t] at time t, the linearized form of (1) for the min-
imum damping mode is:
, (6)
where Ψj[t] is a constant vector and εj[t] is the error term which is independent and identically Gaussian distributed [23-24].
Suppose the system is stable and x[t] is an equilibrium op-erating point, (6) may hold for the same damping sensitivity Ψj at t = 1, 2, ..., N, which leads to the following matrix form:
, (7)
where
(8)
Since Δζ can be estimated with many ambient signal anal-ysis methods, ΔX is directly measurable, Ψj is solvable with regression methods.
Generally, to fit the nonlinear and time-varying power system property, as well as to overcome collinearity and noise impacts of the system data, a noise assisted ensemble regression is applied. We can estimate Ψj with the cost func-tion in (9), the estimator in (10).
(9)
(10)
where W = diag{wi} is a diagonal weight matrix. Some parameters appeared in the algorithm can be tuned
with the same methods in [25] and [26]. To focus on the most important issues and also due to the space limitation, we do not provide more discussions here. We refer the interested readers to the above references for more details.
B. Re-dispatch with Compatibility to the Planned Dispatch In order to be compatible with other planned dispatch ap-
plications, we have the following considerations: 1) Given x[t] at time t, the dispatched value at time t+1
should be formulated as x[t+1] = x[t] + Δx[t+1]R + Δx[t+1]O, where Δx[t+1]R is the solution of (5) and Δx[t+1]O is the dis-
][tΨ
WAMS/SCADA Data
Power System
Solving (5) for Optimal Δx[t+1]
System condition and boundaries for Δx[t+1]
Real time estimation of Ψ[t]
Measurement systems
Monitoring ζ[t]
Calculate center
Trigger
][+][Δ][=][Δ tεtttζ jj xΨ
jj εXΨζ +Δ=Δ
T
T
T
[ [1], [2], ..., [ ]] ,[ [1], [2], ..., [ ]] ,[ [1], [2], ..., [ ]] .j j j j
NN
ε ε ε N
D = D D D
D = D D D
D = D D D
ζ ζ ζ ζX x x xε
22 ˆ+ΔˆΔ= jkJ ΨζζW
-
- 1ˆ ( )T Tj k= D D + D DΨ X W X I X W ζ
4
patch value for other planned dispatch such as day ahead planning and economic dispatch [23].
2) Constraint in (5) is
modified as , where Δx[t+1]O is considered as a known constant.
= max{- , } and = min{ ,
}, where is the limitation by the ramp rate.
3) Once a generator hit the limit, its re-dispatch value Δx[t+1]R becomes zero while its planned dispatch value Δx[t+1]O should be distributed to other generators.
The above considerations are integrated into thread 3 in Section II when damping optimization is online processed.
C. Potential to Large-Scale Power System Implementation Therefore, the implementation of the proposed method in
large-scale power systems is an important concern that needs to be tackled carefully. The major challenge lays on the ex-plosion of the feature space of the input-output regression model in (7), where variables ΔX and Δζ could be thousands of dimensions. In this case, directly solving (7) is impossible. However, we can focus on reducing the feature space of the problem using our domain knowledge.
Basically, there are two ways achieving the above goal, one is from the side of the input variable space, and the other is from the side of the output variable space. Fortunately, the latter is quite easy to be accomplished because oscillation modes with poor damping are quite limited and obvious in many large power systems [27]. For example, the dominant mode of the ENTSO-E system is the one dominates the oscil-lation between generators in Turkey, Spanish and Portugal [28-29]. Therefore, once the dominant mode is selected, the target is to narrow the input feature space, which is also tricky enough because: 1) a mode in a system is in general dominated by a part of generators, say less than 1/3 of the total population in a common sense, which significantly re-duces the input feature space; 2) the automatic generation control is implemented to power stations with several to tens of generators, especially for the hydro-power stations, which means the input features could be further divided by a factor of several to tens; 3) dispatching center is often layer-structured, meaning commands from the top layer are gener-ally delivered to areas/districts, therefore small generators such as wind farms and PV stations are non-dispatchable and treated as irrelevant inputs. Given these tricks, any large power system with thousands of generators could be feature reduced using this problem specific decomposition by a fac-tor of tens to a hundred, making the input space limited in a solvable scale, and consequently (7) is solvable.
It should be noticed that, feature reduction is quite differ-ent from model reduction or dynamic model equivalent. The former removes irrelevant generators and clusters dispatcha-ble generators in one station only in the algorithm part for the data processing; while the latter aggregates generators and change the simulation model.
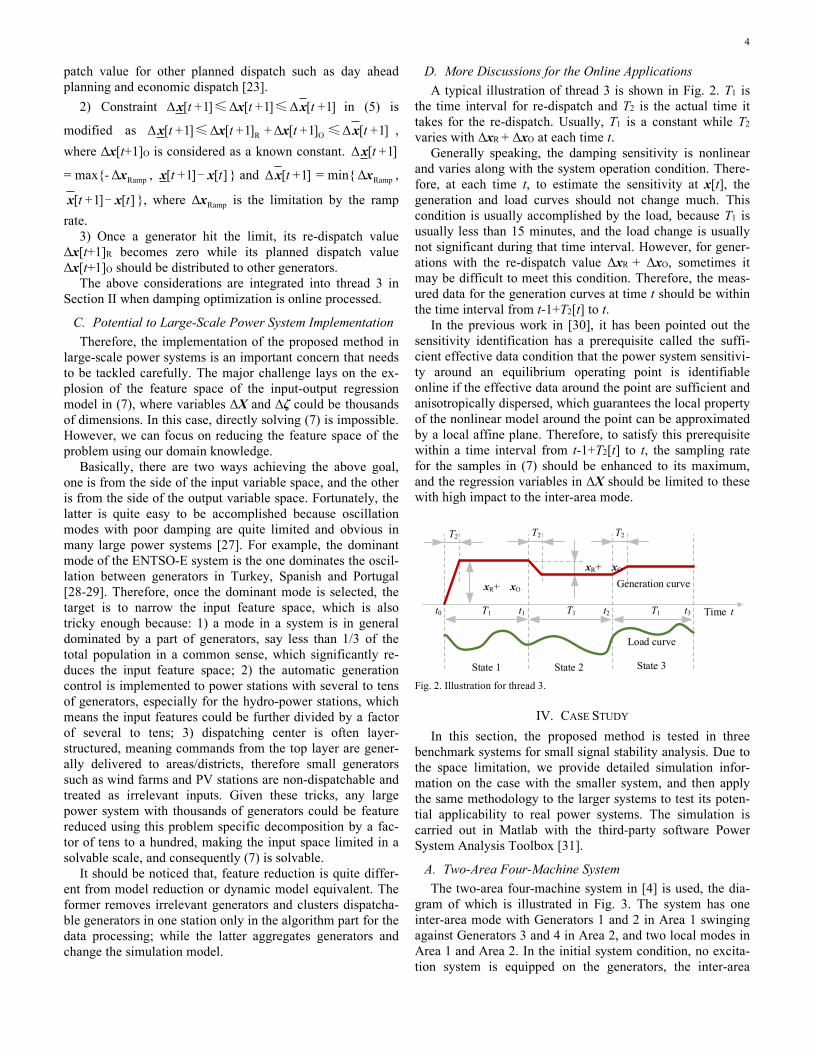
D. More Discussions for the Online Applications A typical illustration of thread 3 is shown in Fig. 2. T1 is
the time interval for re-dispatch and T2 is the actual time it takes for the re-dispatch. Usually, T1 is a constant while T2 varies with ΔxR + ΔxO at each time t.
Generally speaking, the damping sensitivity is nonlinear and varies along with the system operation condition. There-fore, at each time t, to estimate the sensitivity at x[t], the generation and load curves should not change much. This condition is usually accomplished by the load, because T1 is usually less than 15 minutes, and the load change is usually not significant during that time interval. However, for gener-ations with the re-dispatch value ΔxR + ΔxO, sometimes it may be difficult to meet this condition. Therefore, the meas-ured data for the generation curves at time t should be within the time interval from t-1+T2[t] to t.
In the previous work in [30], it has been pointed out the sensitivity identification has a prerequisite called the suffi-cient effective data condition that the power system sensitivi-ty around an equilibrium operating point is identifiable online if the effective data around the point are sufficient and anisotropically dispersed, which guarantees the local property of the nonlinear model around the point can be approximated by a local affine plane. Therefore, to satisfy this prerequisite within a time interval from t-1+T2[t] to t, the sampling rate for the samples in (7) should be enhanced to its maximum, and the regression variables in ΔX should be limited to these with high impact to the inter-area mode.
Fig. 2. Illustration for thread 3.
IV. CASE STUDY In this section, the proposed method is tested in three
benchmark systems for small signal stability analysis. Due to the space limitation, we provide detailed simulation infor-mation on the case with the smaller system, and then apply the same methodology to the larger systems to test its poten-tial applicability to real power systems. The simulation is carried out in Matlab with the third-party software Power System Analysis Toolbox [31].
A. Two-Area Four-Machine System The two-area four-machine system in [4] is used, the dia-
gram of which is illustrated in Fig. 3. The system has one inter-area mode with Generators 1 and 2 in Area 1 swinging against Generators 3 and 4 in Area 2, and two local modes in Area 1 and Area 2. In the initial system condition, no excita-tion system is equipped on the generators, the inter-area
]1+[Δ]1+[Δ]1+[Δ ttt xxx ≤≤
]1+[Δ]1+[Δ+]1+[Δ]1+[Δ OR tttt xxxx ≤≤
]1+[Δ tx
RampΔx ][]1+[ tt xx - ]1+[Δ tx RampΔx
][]1+[ tt xx - RampΔx
TimeT1 T1 T1
T2 T2 T2
Load curve
Generation curvexR+ xO
xR+ xO
t1t0 t2 t3 t
State 1 State 2 State 3
5
mode is unstable, and the local modes are stable. To achieve a stable condition, each generator is equipped with a casual type excitation as in [4], with a suitable gain to create a poor-ly damped inter-area mode, while the local modes are very stable. In the following parts, we focus on improving damp-ing of the inter-area mode with the proposed method.
Fig. 3. The two-area four-machine system.
Fig. 4. Data generation procedure in P. 1.
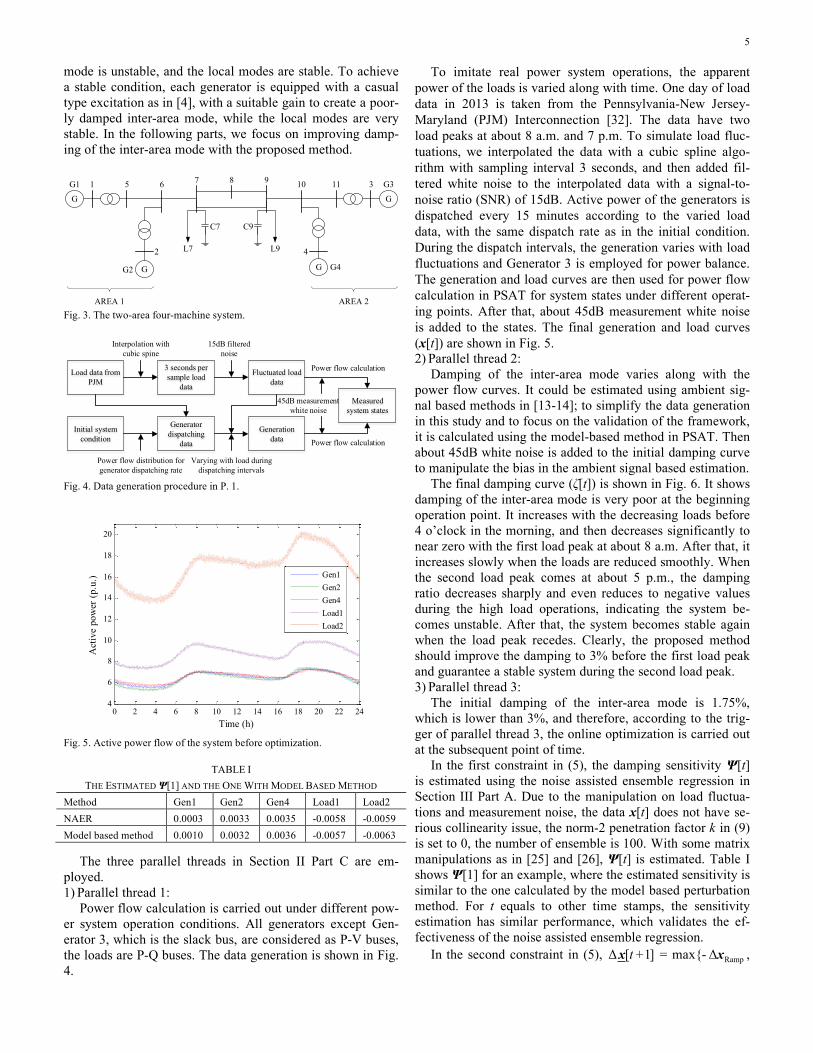
Fig. 5. Active power flow of the system before optimization.
TABLE I THE ESTIMATED Ψ[1] AND THE ONE WITH MODEL BASED METHOD
Method Gen1 Gen2 Gen4 Load1 Load2 NAER 0.0003 0.0033 0.0035 -0.0058 -0.0059 Model based method 0.0010 0.0032 0.0036 -0.0057 -0.0063
The three parallel threads in Section II Part C are em-ployed. 1) Parallel thread 1:
Power flow calculation is carried out under different pow-er system operation conditions. All generators except Gen-erator 3, which is the slack bus, are considered as P-V buses, the loads are P-Q buses. The data generation is shown in Fig. 4.
To imitate real power system operations, the apparent power of the loads is varied along with time. One day of load data in 2013 is taken from the Pennsylvania-New Jersey-Maryland (PJM) Interconnection [32]. The data have two load peaks at about 8 a.m. and 7 p.m. To simulate load fluc-tuations, we interpolated the data with a cubic spline algo-rithm with sampling interval 3 seconds, and then added fil-tered white noise to the interpolated data with a signal-to-noise ratio (SNR) of 15dB. Active power of the generators is dispatched every 15 minutes according to the varied load data, with the same dispatch rate as in the initial condition. During the dispatch intervals, the generation varies with load fluctuations and Generator 3 is employed for power balance. The generation and load curves are then used for power flow calculation in PSAT for system states under different operat-ing points. After that, about 45dB measurement white noise is added to the states. The final generation and load curves (x[t]) are shown in Fig. 5. 2) Parallel thread 2:
Damping of the inter-area mode varies along with the power flow curves. It could be estimated using ambient sig-nal based methods in [13-14]; to simplify the data generation in this study and to focus on the validation of the framework, it is calculated using the model-based method in PSAT. Then about 45dB white noise is added to the initial damping curve to manipulate the bias in the ambient signal based estimation.
The final damping curve (ζ[t]) is shown in Fig. 6. It shows damping of the inter-area mode is very poor at the beginning operation point. It increases with the decreasing loads before 4 o’clock in the morning, and then decreases significantly to near zero with the first load peak at about 8 a.m. After that, it increases slowly when the loads are reduced smoothly. When the second load peak comes at about 5 p.m., the damping ratio decreases sharply and even reduces to negative values during the high load operations, indicating the system be-comes unstable. After that, the system becomes stable again when the load peak recedes. Clearly, the proposed method should improve the damping to 3% before the first load peak and guarantee a stable system during the second load peak. 3) Parallel thread 3:
The initial damping of the inter-area mode is 1.75%, which is lower than 3%, and therefore, according to the trig-ger of parallel thread 3, the online optimization is carried out at the subsequent point of time.
In the first constraint in (5), the damping sensitivity Ψ[t] is estimated using the noise assisted ensemble regression in Section III Part A. Due to the manipulation on load fluctua-tions and measurement noise, the data x[t] does not have se-rious collinearity issue, the norm-2 penetration factor k in (9) is set to 0, the number of ensemble is 100. With some matrix manipulations as in [25] and [26], Ψ[t] is estimated. Table I shows Ψ[1] for an example, where the estimated sensitivity is similar to the one calculated by the model based perturbation method. For t equals to other time stamps, the sensitivity estimation has similar performance, which validates the ef-fectiveness of the noise assisted ensemble regression.
In the second constraint in (5), = max{- ,
G
G
G
G
G1 G3
G4G2
1
2
3
4
5 6 7 8 9 10 11
C7 C9
L7 L9
AREA 1 AREA 2
Initial system condition
Load data from PJM
3 seconds per sample load
data
Fluctuated load data
Generator dispatching
data
Generation data
15dB filtered noise
Interpolation with cubic spine
Power flow distribution for generator dispatching rate
Varying with load during dispatching intervals
Measured system states
45dB measurement white noise
Power flow calculation
Power flow calculation
0 2 4 6 8 10 12 14 16 18 20 22 244
6
8
10
12
14
16
18
20
Act
ive
pow
er (p
.u.)
Time (h)
Gen1Gen2Gen4Load1Load2
]1+[Δ tx RampΔx
6
}, = min{ , }, and the value of Δx[t+1]O is calculated as the dispatch incre-ment of the generation curves in Fig. 5. is the gen-erator capacity, is set to 20% of the generator capaci-ty, and is 5% of the generator capacity.
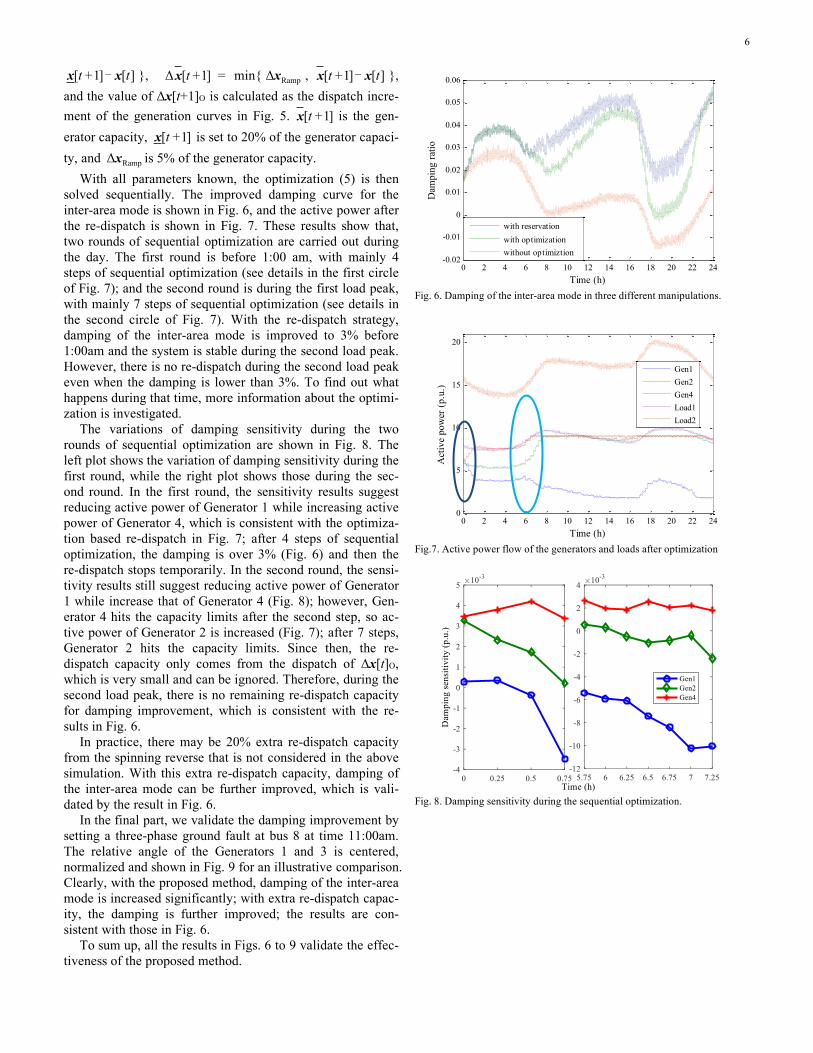
With all parameters known, the optimization (5) is then solved sequentially. The improved damping curve for the inter-area mode is shown in Fig. 6, and the active power after the re-dispatch is shown in Fig. 7. These results show that, two rounds of sequential optimization are carried out during the day. The first round is before 1:00 am, with mainly 4 steps of sequential optimization (see details in the first circle of Fig. 7); and the second round is during the first load peak, with mainly 7 steps of sequential optimization (see details in the second circle of Fig. 7). With the re-dispatch strategy, damping of the inter-area mode is improved to 3% before 1:00am and the system is stable during the second load peak. However, there is no re-dispatch during the second load peak even when the damping is lower than 3%. To find out what happens during that time, more information about the optimi-zation is investigated.
The variations of damping sensitivity during the two rounds of sequential optimization are shown in Fig. 8. The left plot shows the variation of damping sensitivity during the first round, while the right plot shows those during the sec-ond round. In the first round, the sensitivity results suggest reducing active power of Generator 1 while increasing active power of Generator 4, which is consistent with the optimiza-tion based re-dispatch in Fig. 7; after 4 steps of sequential optimization, the damping is over 3% (Fig. 6) and then the re-dispatch stops temporarily. In the second round, the sensi-tivity results still suggest reducing active power of Generator 1 while increase that of Generator 4 (Fig. 8); however, Gen-erator 4 hits the capacity limits after the second step, so ac-tive power of Generator 2 is increased (Fig. 7); after 7 steps, Generator 2 hits the capacity limits. Since then, the re-dispatch capacity only comes from the dispatch of Δx[t]O, which is very small and can be ignored. Therefore, during the second load peak, there is no remaining re-dispatch capacity for damping improvement, which is consistent with the re-sults in Fig. 6.
In practice, there may be 20% extra re-dispatch capacity from the spinning reverse that is not considered in the above simulation. With this extra re-dispatch capacity, damping of the inter-area mode can be further improved, which is vali-dated by the result in Fig. 6.
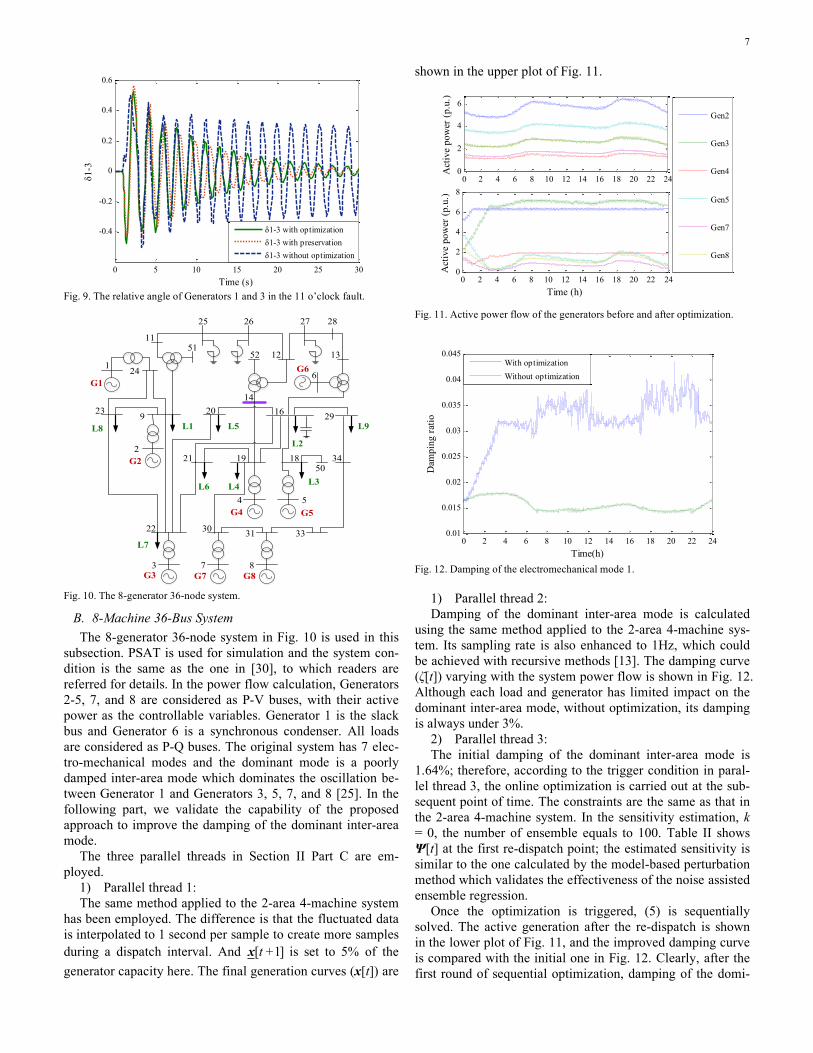
In the final part, we validate the damping improvement by setting a three-phase ground fault at bus 8 at time 11:00am. The relative angle of the Generators 1 and 3 is centered, normalized and shown in Fig. 9 for an illustrative comparison. Clearly, with the proposed method, damping of the inter-area mode is increased significantly; with extra re-dispatch capac-ity, the damping is further improved; the results are con-sistent with those in Fig. 6.
To sum up, all the results in Figs. 6 to 9 validate the effec-tiveness of the proposed method.
Fig. 6. Damping of the inter-area mode in three different manipulations.
Fig.7. Active power flow of the generators and loads after optimization
Fig. 8. Damping sensitivity during the sequential optimization.
][]1+[ tt xx - ]1+[Δ tx RampΔx ][]1+[ tt xx -
]1+[tx]1+[tx
RampΔx
0 2 4 6 8 10 12 14 16 18 20 22 24-0.02
-0.01
0
0.01
0.02
0.03
0.04
0.05
0.06
Time (h)
Dam
ping
ratio
with reservationwith optimizationwithout optimiztion
0 2 4 6 8 10 12 14 16 18 20 22 240
5
10
15
20
Time (h)
Act
ive
pow
er (p
.u.)
Gen1Gen2Gen4Load1Load2
7
Fig. 9. The relative angle of Generators 1 and 3 in the 11 o’clock fault.
Fig. 10. The 8-generator 36-node system.
B. 8-Machine 36-Bus System The 8-generator 36-node system in Fig. 10 is used in this
subsection. PSAT is used for simulation and the system con-dition is the same as the one in [30], to which readers are referred for details. In the power flow calculation, Generators 2-5, 7, and 8 are considered as P-V buses, with their active power as the controllable variables. Generator 1 is the slack bus and Generator 6 is a synchronous condenser. All loads are considered as P-Q buses. The original system has 7 elec-tro-mechanical modes and the dominant mode is a poorly damped inter-area mode which dominates the oscillation be-tween Generator 1 and Generators 3, 5, 7, and 8 [25]. In the following part, we validate the capability of the proposed approach to improve the damping of the dominant inter-area mode.
The three parallel threads in Section II Part C are em-ployed.
1) Parallel thread 1: The same method applied to the 2-area 4-machine system
has been employed. The difference is that the fluctuated data is interpolated to 1 second per sample to create more samples during a dispatch interval. And is set to 5% of the generator capacity here. The final generation curves (x[t]) are
shown in the upper plot of Fig. 11.
Fig. 11. Active power flow of the generators before and after optimization.
Fig. 12. Damping of the electromechanical mode 1.
1) Parallel thread 2: Damping of the dominant inter-area mode is calculated
using the same method applied to the 2-area 4-machine sys-tem. Its sampling rate is also enhanced to 1Hz, which could be achieved with recursive methods [13]. The damping curve (ζ[t]) varying with the system power flow is shown in Fig. 12. Although each load and generator has limited impact on the dominant inter-area mode, without optimization, its damping is always under 3%.
2) Parallel thread 3: The initial damping of the dominant inter-area mode is
1.64%; therefore, according to the trigger condition in paral-lel thread 3, the online optimization is carried out at the sub-sequent point of time. The constraints are the same as that in the 2-area 4-machine system. In the sensitivity estimation, k = 0, the number of ensemble equals to 100. Table II shows Ψ[t] at the first re-dispatch point; the estimated sensitivity is similar to the one calculated by the model-based perturbation method which validates the effectiveness of the noise assisted ensemble regression.
Once the optimization is triggered, (5) is sequentially solved. The active generation after the re-dispatch is shown in the lower plot of Fig. 11, and the improved damping curve is compared with the initial one in Fig. 12. Clearly, after the first round of sequential optimization, damping of the domi-
0 5 10 15 20 25 30
-0.4
-0.2
0
0.2
0.4
0.6
Time (s)
δ1-3
δ1-3 with optimizationδ1-3 with preservationδ1-3 without optimization
1 24
23 9
2
3
22
11
25
51
26
52 12
27 28
13
6
2014
16 29
21 19 1850
34
33
4 5
7 8
30 31
L1
L2
L3L4
L5
L6
L7
L8 L9
G1
G2
G3
G4 G5
G6
G7 G8
]1+[tx
0 2 4 6 8 10 12 14 16 18 20 22 240
2
4
6
Act
ive
pow
er (p
.u.)
0 2 4 6 8 10 12 14 16 18 20 22 240
2
4
6
8
Act
ive
pow
er (p
.u.)
Time (h)
Gen2
Gen3
Gen4
Gen5
Gen7
Gen8
0 2 4 6 8 10 12 14 16 18 20 22 240.01
0.015
0.02
0.025
0.03
0.035
0.04
0.045
Time(h)
Dam
ping
ratio
With optimizationWithout optimization
8
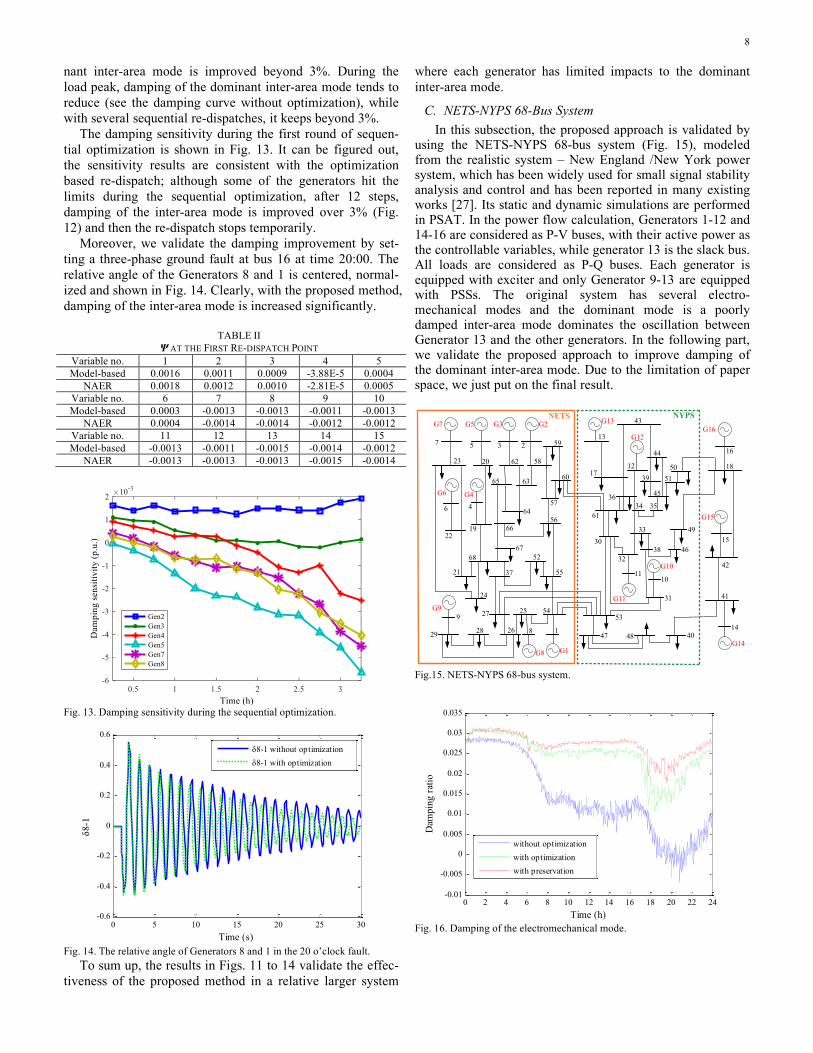
nant inter-area mode is improved beyond 3%. During the load peak, damping of the dominant inter-area mode tends to reduce (see the damping curve without optimization), while with several sequential re-dispatches, it keeps beyond 3%.
The damping sensitivity during the first round of sequen-tial optimization is shown in Fig. 13. It can be figured out, the sensitivity results are consistent with the optimization based re-dispatch; although some of the generators hit the limits during the sequential optimization, after 12 steps, damping of the inter-area mode is improved over 3% (Fig. 12) and then the re-dispatch stops temporarily.
Moreover, we validate the damping improvement by set-ting a three-phase ground fault at bus 16 at time 20:00. The relative angle of the Generators 8 and 1 is centered, normal-ized and shown in Fig. 14. Clearly, with the proposed method, damping of the inter-area mode is increased significantly.
TABLE II
Ψ AT THE FIRST RE-DISPATCH POINT Variable no. 1 2 3 4 5 Model-based 0.0016 0.0011 0.0009 -3.88E-5 0.0004
NAER 0.0018 0.0012 0.0010 -2.81E-5 0.0005 Variable no. 6 7 8 9 10 Model-based 0.0003 -0.0013 -0.0013 -0.0011 -0.0013
NAER 0.0004 -0.0014 -0.0014 -0.0012 -0.0012 Variable no. 11 12 13 14 15 Model-based -0.0013 -0.0011 -0.0015 -0.0014 -0.0012
NAER -0.0013 -0.0013 -0.0013 -0.0015 -0.0014
Fig. 13. Damping sensitivity during the sequential optimization.
Fig. 14. The relative angle of Generators 8 and 1 in the 20 o’clock fault.
To sum up, the results in Figs. 11 to 14 validate the effec-tiveness of the proposed method in a relative larger system
where each generator has limited impacts to the dominant inter-area mode.
C. NETS-NYPS 68-Bus System In this subsection, the proposed approach is validated by
using the NETS-NYPS 68-bus system (Fig. 15), modeled from the realistic system – New England /New York power system, which has been widely used for small signal stability analysis and control and has been reported in many existing works [27]. Its static and dynamic simulations are performed in PSAT. In the power flow calculation, Generators 1-12 and 14-16 are considered as P-V buses, with their active power as the controllable variables, while generator 13 is the slack bus. All loads are considered as P-Q buses. Each generator is equipped with exciter and only Generator 9-13 are equipped with PSSs. The original system has several electro-mechanical modes and the dominant mode is a poorly damped inter-area mode dominates the oscillation between Generator 13 and the other generators. In the following part, we validate the proposed approach to improve damping of the dominant inter-area mode. Due to the limitation of paper space, we just put on the final result.
Fig.15. NETS-NYPS 68-bus system.
Fig. 16. Damping of the electromechanical mode. 0 5 10 15 20 25 30
-0.6
-0.4
-0.2
0
0.2
0.4
0.6
Time (s)
δ8-1
δ8-1 without optimizationδ8-1 with optimization
G7 G5 G3 G2
G6 G4
G13
G12G16
G15
G14
G10
G11
G1G8
G9
7 5 3 2 59
58
606365
622023
46
2219 66
56
5764
6768 52
553721
24
9
29 28 26 18
27 25 5453
47 48 4014
4131
1011
32
30
61
4638
4933
34 35
4536
17
13
42
15
18
1644
505139
43
12
NETS NYPS
0 2 4 6 8 10 12 14 16 18 20 22 24-0.01
-0.005
0
0.005
0.01
0.015
0.02
0.025
0.03
0.035
Time (h)
Dam
ping
ratio
without optimizationwith optimizationwith preservation
9
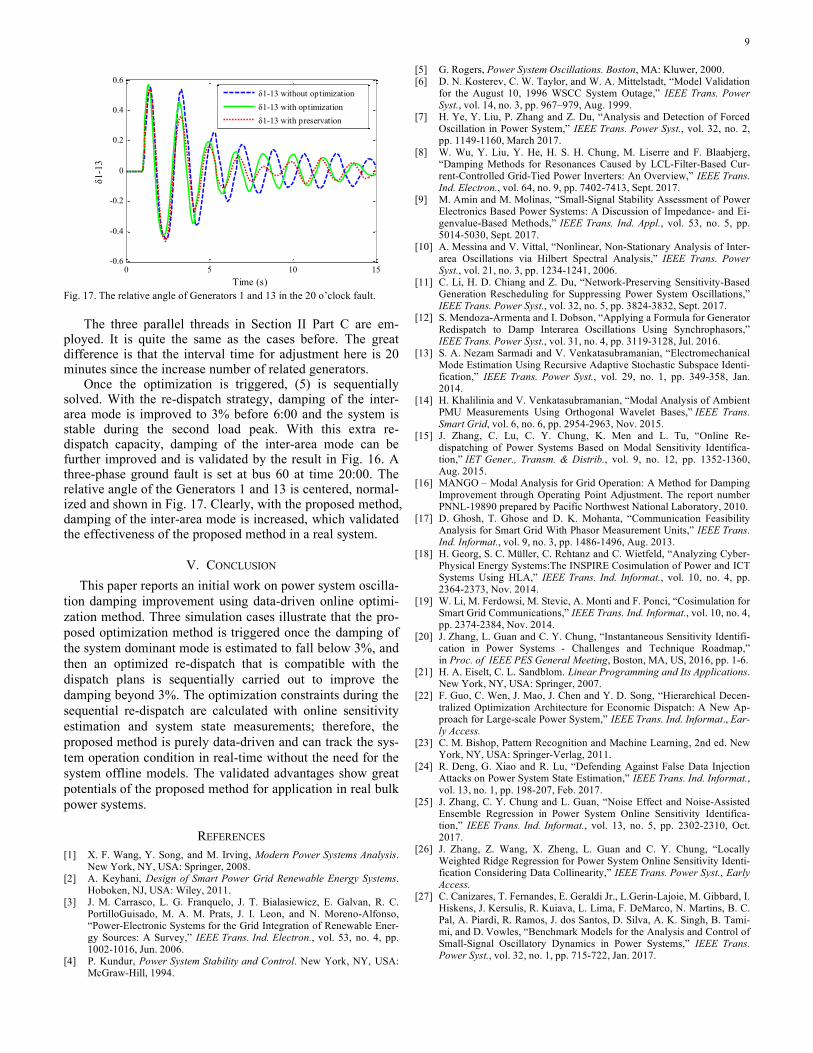
Fig. 17. The relative angle of Generators 1 and 13 in the 20 o’clock fault.
The three parallel threads in Section II Part C are em-
ployed. It is quite the same as the cases before. The great difference is that the interval time for adjustment here is 20 minutes since the increase number of related generators.
Once the optimization is triggered, (5) is sequentially solved. With the re-dispatch strategy, damping of the inter-area mode is improved to 3% before 6:00 and the system is stable during the second load peak. With this extra re-dispatch capacity, damping of the inter-area mode can be further improved and is validated by the result in Fig. 16. A three-phase ground fault is set at bus 60 at time 20:00. The relative angle of the Generators 1 and 13 is centered, normal-ized and shown in Fig. 17. Clearly, with the proposed method, damping of the inter-area mode is increased, which validated the effectiveness of the proposed method in a real system.
V. CONCLUSION This paper reports an initial work on power system oscilla-
tion damping improvement using data-driven online optimi-zation method. Three simulation cases illustrate that the pro-posed optimization method is triggered once the damping of the system dominant mode is estimated to fall below 3%, and then an optimized re-dispatch that is compatible with the dispatch plans is sequentially carried out to improve the damping beyond 3%. The optimization constraints during the sequential re-dispatch are calculated with online sensitivity estimation and system state measurements; therefore, the proposed method is purely data-driven and can track the sys-tem operation condition in real-time without the need for the system offline models. The validated advantages show great potentials of the proposed method for application in real bulk power systems.
REFERENCES [1] X. F. Wang, Y. Song, and M. Irving, Modern Power Systems Analysis.
New York, NY, USA: Springer, 2008. [2] A. Keyhani, Design of Smart Power Grid Renewable Energy Systems.
Hoboken, NJ, USA: Wiley, 2011. [3] J. M. Carrasco, L. G. Franquelo, J. T. Bialasiewicz, E. Galvan, R. C.
PortilloGuisado, M. A. M. Prats, J. I. Leon, and N. Moreno-Alfonso, “Power-Electronic Systems for the Grid Integration of Renewable Ener-gy Sources: A Survey,” IEEE Trans. Ind. Electron., vol. 53, no. 4, pp. 1002-1016, Jun. 2006.
[4] P. Kundur, Power System Stability and Control. New York, NY, USA: McGraw-Hill, 1994.
[5] G. Rogers, Power System Oscillations. Boston, MA: Kluwer, 2000. [6] D. N. Kosterev, C. W. Taylor, and W. A. Mittelstadt, “Model Validation
for the August 10, 1996 WSCC System Outage,” IEEE Trans. Power Syst., vol. 14, no. 3, pp. 967–979, Aug. 1999.
[7] H. Ye, Y. Liu, P. Zhang and Z. Du, “Analysis and Detection of Forced Oscillation in Power System,” IEEE Trans. Power Syst., vol. 32, no. 2, pp. 1149-1160, March 2017.
[8] W. Wu, Y. Liu, Y. He, H. S. H. Chung, M. Liserre and F. Blaabjerg, “Damping Methods for Resonances Caused by LCL-Filter-Based Cur-rent-Controlled Grid-Tied Power Inverters: An Overview,” IEEE Trans. Ind. Electron., vol. 64, no. 9, pp. 7402-7413, Sept. 2017.
[9] M. Amin and M. Molinas, “Small-Signal Stability Assessment of Power Electronics Based Power Systems: A Discussion of Impedance- and Ei-genvalue-Based Methods,” IEEE Trans. Ind. Appl., vol. 53, no. 5, pp. 5014-5030, Sept. 2017.
[10] A. Messina and V. Vittal, “Nonlinear, Non-Stationary Analysis of Inter-area Oscillations via Hilbert Spectral Analysis,” IEEE Trans. Power Syst., vol. 21, no. 3, pp. 1234-1241, 2006.
[11] C. Li, H. D. Chiang and Z. Du, “Network-Preserving Sensitivity-Based Generation Rescheduling for Suppressing Power System Oscillations,” IEEE Trans. Power Syst., vol. 32, no. 5, pp. 3824-3832, Sept. 2017.
[12] S. Mendoza-Armenta and I. Dobson, “Applying a Formula for Generator Redispatch to Damp Interarea Oscillations Using Synchrophasors,” IEEE Trans. Power Syst., vol. 31, no. 4, pp. 3119-3128, Jul. 2016.
[13] S. A. Nezam Sarmadi and V. Venkatasubramanian, “Electromechanical Mode Estimation Using Recursive Adaptive Stochastic Subspace Identi-fication,” IEEE Trans. Power Syst., vol. 29, no. 1, pp. 349-358, Jan. 2014.
[14] H. Khalilinia and V. Venkatasubramanian, “Modal Analysis of Ambient PMU Measurements Using Orthogonal Wavelet Bases,” IEEE Trans. Smart Grid, vol. 6, no. 6, pp. 2954-2963, Nov. 2015.
[15] J. Zhang, C. Lu, C. Y. Chung, K. Men and L. Tu, “Online Re-dispatching of Power Systems Based on Modal Sensitivity Identifica-tion,” IET Gener., Transm. & Distrib., vol. 9, no. 12, pp. 1352-1360, Aug. 2015.
[16] MANGO – Modal Analysis for Grid Operation: A Method for Damping Improvement through Operating Point Adjustment. The report number PNNL-19890 prepared by Pacific Northwest National Laboratory, 2010.
[17] D. Ghosh, T. Ghose and D. K. Mohanta, “Communication Feasibility Analysis for Smart Grid With Phasor Measurement Units,” IEEE Trans. Ind. Informat., vol. 9, no. 3, pp. 1486-1496, Aug. 2013.
[18] H. Georg, S. C. Müller, C. Rehtanz and C. Wietfeld, “Analyzing Cyber-Physical Energy Systems:The INSPIRE Cosimulation of Power and ICT Systems Using HLA,” IEEE Trans. Ind. Informat., vol. 10, no. 4, pp. 2364-2373, Nov. 2014.
[19] W. Li, M. Ferdowsi, M. Stevic, A. Monti and F. Ponci, “Cosimulation for Smart Grid Communications,” IEEE Trans. Ind. Informat., vol. 10, no. 4, pp. 2374-2384, Nov. 2014.
[20] J. Zhang, L. Guan and C. Y. Chung, “Instantaneous Sensitivity Identifi-cation in Power Systems - Challenges and Technique Roadmap,” in Proc. of IEEE PES General Meeting, Boston, MA, US, 2016, pp. 1-6.
[21] H. A. Eiselt, C. L. Sandblom. Linear Programming and Its Applications. New York, NY, USA: Springer, 2007.
[22] F. Guo, C. Wen, J. Mao, J. Chen and Y. D. Song, “Hierarchical Decen-tralized Optimization Architecture for Economic Dispatch: A New Ap-proach for Large-scale Power System,” IEEE Trans. Ind. Informat., Ear-ly Access.
[23] C. M. Bishop, Pattern Recognition and Machine Learning, 2nd ed. New York, NY, USA: Springer-Verlag, 2011.
[24] R. Deng, G. Xiao and R. Lu, “Defending Against False Data Injection Attacks on Power System State Estimation,” IEEE Trans. Ind. Informat., vol. 13, no. 1, pp. 198-207, Feb. 2017.
[25] J. Zhang, C. Y. Chung and L. Guan, “Noise Effect and Noise-Assisted Ensemble Regression in Power System Online Sensitivity Identifica-tion,” IEEE Trans. Ind. Informat., vol. 13, no. 5, pp. 2302-2310, Oct. 2017.
[26] J. Zhang, Z. Wang, X. Zheng, L. Guan and C. Y. Chung, “Locally Weighted Ridge Regression for Power System Online Sensitivity Identi-fication Considering Data Collinearity,” IEEE Trans. Power Syst., Early Access.
[27] C. Canizares, T. Fernandes, E. Geraldi Jr., L.Gerin-Lajoie, M. Gibbard, I. Hiskens, J. Kersulis, R. Kuiava, L. Lima, F. DeMarco, N. Martins, B. C. Pal, A. Piardi, R. Ramos, J. dos Santos, D. Silva, A. K. Singh, B. Tami-mi, and D. Vowles, “Benchmark Models for the Analysis and Control of Small-Signal Oscillatory Dynamics in Power Systems,” IEEE Trans. Power Syst., vol. 32, no. 1, pp. 715-722, Jan. 2017.
0 5 10 15-0.6
-0.4
-0.2
0
0.2
0.4
0.6
Time (s)
δ1-1
3
δ1-13 without optimizationδ1-13 with optimizationδ1-13 with preservation
10
[28] M. Larsson, P. Korba, W. Sattinger, P. Owen “Monitoring and Control of Power System Oscillations using FACTS/HVDC and Wide-area Phasor Measurements,” CIGRE Session, Paris, 2012.
[29] A. Semerow et al., “Dynamic Study Model for the interconnected power system of Continental Europe in different simulation tools,” 2015 IEEE Eindhoven PowerTech, Eindhoven, 2015, pp. 1-6.
[30] J. Zhang, X. Zheng, Z. Wang, L. Guan and C. Y. Chung, “Power System Sensitivity Identification—Inherent System Properties and Data Quali-ty,” IEEE Trans. Power Syst., vol. 32, no. 4, pp. 2756-2766, July 2017.
[31] F. Milano, “An Open Source Power System Analysis Toolbox,” IEEE Trans. Power Syst., vol. 20, no. 3, pp. 1199-1206, Aug., 2005.
[32] PJM. [Online]. Available: http://www.pjm.com/markets-and-operations/opsanalysis/historical-load-data.aspx
Zhihao Chen (S’17) was born in Guangdong, China, on September 25, 1995. He received his B.Eng. degree in electrical engineering from the School of Electric Power, South China University of Technology, in 2018. He has stud-ied power system analysis, statistics, and several power and energy engineer-ing related courses. His research interests include power system stability and control, system identification and data analysis in power system. Hanchen Xu (S’12) received the B.Eng. and M.S. degrees in electrical engi-neering from Tsinghua University, Beijing, China, in 2012 and 2014, respec-tively, and the M.S. degree in applied mathematics from the University of Illinois at Urbana-Champaign, Urbana, IL, USA, in 2017, where he is current-ly working toward the Ph.D. degree at the Department of Electrical and Com-puter Engineering. His current research interests include optimization, rein-forcement learning, with applications to power systems and electricity mar-kets. Junbo Zhang (S’10-M’14-SM’19) received his B.Eng. and Ph.D. from Tsinghua University in 2008 and 2013, respectively, followed by a postdoc fellow at the same university. He studied at The Hong Kong Polytechnic University from 2009 to 2010, and is now visiting Stanford University for a one year program. He is a professor at the School of Electric Power, South China University of Technology. His research areas include power system stability and control, knowledge management and intelligent decisions in power systems and power system economics. Lin Guan (M’14) received the B.Eng. degree and the Ph.D. degree in electri-cal engineering from Huazhong University of Science and Technology, Chi-na, in 1990 and 1995, respectively. She is now a professor and the chair in the School of Electric Power, South China University of Technology. Her re-search interests include power system stability and control, planning and operation, and smart grid