
A RISK-DRIVEN BUSINESS
17
ISSUE 05 EXPOSURE IN TOTAL HARMONY A collective vision of RMS from the top OFF THE BASELINE Responding to the influence of climate change POWER OUTAGE Puerto Rico’s slow recovery from Hurricane Maria A RISK-DRIVEN BUSINESS
-
Upload
khangminh22 -
Category
Documents
-
view
3 -
download
0
Transcript of A RISK-DRIVEN BUSINESS

ISSUE 05
EXPOSUREIN TOTAL HARMONY A collective vision of RMS from the top
OFF THE BASELINE Responding to the influence of climate change
POWER OUTAGEPuerto Rico’s slow recovery from Hurricane Maria
A RISK-DRIVEN BUSINESS

2 | EXPOSURE | Issue 04 www.rms.com/exposure www.rms.com/exposure Issue 05 | EXPOSURE | 3
FOREWORD
AT A TIPPINGPOINT
elcome to the latest edition of EXPOSURE magazine in which we explore some of the innovations, market developments and technologies helping to shape the insurance industry for the future.
Our industry is in many ways reaching a tipping point in its evolution as multiple seismic shifts
coincide. There are strong market pressures to improve efficiency and loss ratios, boost performance and achieve better business outcomes. In tandem, a rapidly advancing technology ecosystem is generating new potential opportunities for growth.
During my career I have been fortunate to witness and be part of some of the most fundamental changes in the business environment, including the move from client-server to Internet computing, which has impacted virtually every company function since.
What I see in the insurance industry is that perfect alignment of a powerful market shift coupled with a huge technology shift — and when these two developments come together, the momentum for change they create can be phenomenal.
The key, of course, is in how we harness technology to help drive that change. At RMS, that process begins with listening hard to our clients. Only then can we look at how innovation and evolving capabilities can best be leveraged to help achieve goals and deliver high impact.
The momentum is building and we are looking forward to the positive changes innovation will bring to the insurance industry over the coming years.
W
KAREN WHITECEO, RMS
EXPOSURE is published by Zebra Media Limited. www.zebracm.com Editors: Helen Yates, Nigel Allen. Designer: Maria Gonzalez. Publisher: Suzanne Hirst.
The material published in EXPOSURE is provided for informational purposes only and whilst the publisher and RMS make every attempt to ensure the accuracy and reliability of any content, it should not be relied upon. The publisher and RMS are not responsible for any loss, however arising, from the use of or reliance on any material published
in EXPOSURE or from any inaccuracies, errors or omissions in this publication, or other documents that are referenced by or linked to this publication. Information published in EXPOSURE may only be used with the prior written permission of RMS.
When the lights went out
The future for flood protection
Are we moving off the baseline?
Cloud adoption to the core
Factors slowing Puerto Rico’s recovery from Hurricane Maria
New innovations to help build a robust flood insurance market
How climate change is influencing natural perils and weather extremes
Now is the time to ditch the “comfort blanket” and embrace Cloud computing
PAGE 19
PAGE 26
PAGE 16
PAGE 29
A RISK-DRIVEN BUSINESS
PUSHING BACK THE WATER
A move toward risk-based pricing for earthquake-related property cover may herald a fundamental shift in the New Zealand insurance sector
High-resolution flood data will be critical to Flood Re’s efforts to create an affordable U.K. flood insurance market
The rationale, challenges and benefits of adopting an outsourced model function
PAGE 10
PAGE 13
PAGE 22
OTHER STORIES
IN TOTAL HARMONYKaren White, Moe Khosravy and Mohsen Rahnama discuss their collective vision for RMS and how innovation and technology are impacting the risk management arena
IN THIS ISSUE
PAGE 6
A MODEL OPERATION

4 | EXPOSURE | Issue 05 www.rms.com/exposure
NEWS ANALYSISIFRS 17: UNDER THE MICROSCOPE
� ey may not be coming into eff ect until January 1, 2021, but the new IFRS 17 accounting standards are already shaking up the insurance industry. And they are expected to have an impact on the January 1, 2019, renewals as insurers ready them-selves for the new regime.
Crucially, IFRS 17 will require insurers to recognize immediately the full loss on any unprofi table insurance business. “� e stand-ard states that reinsurance contracts must now be valued and accounted for separate to the underlying contracts, meaning that tradi-tional ‘netting down’ (gross less reinsured) and approximate methods used for these calculations may no longer be valid,” explained PwC partner Alex Bertolotti in a blog post.
“Even an individual reinsurance contract could be material in the context of the over-all balance sheet, and so have the potential to create a signifi cant mismatch between the value placed on reinsurance and the value placed on the underlying risks,” he continued.
“� is problem is not just an accounting issue, and could have signifi cant strategic and operational implications as well as an impact on the transfer of risk, on tax, on capital and on Solvency II for European operations.”
In fact, the requirements under IFRS 17 could lead to a drop in reinsurance purchas-ing, according to consultancy fi rm Hymans Robertson, as cedants are forced to ques-tion why they are deriving value from
How new accounting standards could reduce demand for reinsurance as cedants are forced to look more closely at underperforming books of business
REGULATION
reinsurance rather than the underlying business on unprofi table accounts. “� is may dampen demand for reinsurance that is used to manage the impact of loss making business,” it warned in a white paper.
Cost of compliance� e new accounting standards will also be a costly compliance burden for many insur-ance companies. Ernst & Young estimates that fi rms with over US$25 billion in Gross Written Premium (GWP) could be spending over US$150 million preparing for IFRS 17.
Under the new regime, insurers will need to account for their business performance at a more granular level. In order to achieve this, it is important to capture more detailed information on the underlying business at the point of underwriting, explained Corina Sutter, director of government and regula-tory aff airs at RMS.
� is can be achieved by deploying systems and tools that allow insurers to capture, manage and analyze such granular data in increasingly high volumes, she said. “It is key for those systems or tools to be well-inte-grated into any other critical data reposito-ries, analytics systems and reporting tools.
“From a modeling perspective, analyzing performance at contract level means precisely understanding the risk that is being taken on by insurance fi rms for each individual account,” continued Sutter. “So, for P&C lines, catastrophe risk modeling may be required at account level. Many fi rms already do this today in order to better inform their pricing decisions. IFRS 17 is a further push to do so.
“It is key to use tools that not only allow the capture of the present risk, but also the risk associated with the future expected value of a contract,” she added. “Probabilistic modeling provides this capability as it eval-uates risk over time.”
Firms with over US$25 billion in GWP could be spending
>US$150mpreparing for IFRS 17
www.rms.com/exposure Issue 05 | EXPOSURE | 5
MAKING IT CLEAR
In the aftermath of Hurricances Harvey, Irma and Maria (HIM), there was much comment on the disparity among the loss estimates produced by model vendors. Con-cerns have been raised about significant outlier results released by some modelers.
“It’s no surprise,” explains Dr. Pete Dailey, vice president at RMS, “that ven-dors who approach the modeling differently will generate different estimates. But rather than pushing back against this, we feel it’s critical to acknowledge and understand these differences.
“At RMS, we develop probabilistic models that operate across the full model space and deliver that insight to our clients. Uncer-tainty is inherent within the modeling pro-cess for any natural hazard, so we can’t rely solely on past events, but rather simulate the full range of plausible future events.”
There are multiple components that contribute to differences in loss estimates, including the scientific approaches and technologies used and the granularity of the exposure data.
“As modelers, we must be fully transpar-ent in our loss-estimation approach,” he states. “All apply scientific and engineering knowledge to detailed exposure data sets to generate the best possible estimates given the skill of the model. Yet the models always provide a range of opinion when events happen, and sometimes that is wider than expected. Clients must know exactly what steps we take, what data we rely upon, and how we apply the models to produce our estimates as events unfold. Only then can stakeholders conduct the due diligence to
MODELING
“INCREASED DEMAND FOR MORE IMMEDIATE DATA IS ENCOURAGING MODELERS TO PUSH THE ENVELOPE”
Pete Dailey of RMS explains why model transparency is critical to client confidence
effectively understand the reasons for the differences and make important financial decisions accordingly.”
Outlier estimates must also be scruti-nized in greater detail. “There were some outlier results during HIM, and particularly for Hurricane Maria. The onus is on the individual modeler to acknowledge the disparity and be fully transparent about the factors that contributed to it. And most importantly, how such disparity is being addressed going forward,” says Dailey.
“A ‘big miss’ in a modeled loss estimate generates market disruption, and without clear explanation this impacts the credibil-ity of all catastrophe models. RMS models performed quite well for Maria. One reason for this was our detailed local knowledge of the building stock and engineering practices in Puerto Rico. We’ve built strong relation-ships over the years and made multiple visits to the island, and the payoff for us and our client comes when events like Maria happen.”
As client demand for real-time and pre-event estimates grows, the data challenge placed on modelers is increasing.
“Demand for more immediate data is encouraging modelers like RMS to push the scientific envelope,” explains Dailey, “as it should. However, we need to ensure all modelers acknowledge, and to the degree possible quantify, the difficulties inherent in real-time loss estimation — especially since it’s often not possible to get eyes on the ground for days or weeks after a major catastrophe.”
Much has been said about the need for modelers to revise initial estimates months after an event occurs. Dailey acknowledges that while RMS sometimes updates its esti-mates, during HIM the strength of early estimates was clear.
“In the months following HIM, we didn’t need to significantly revise our initial loss figures even though they were produced when uncertainty levels were at their peak as the storms unfolded in real time,” he states. “The estimates for all three storms were sufficiently robust in the immediate aftermath to stand the test of time. While no one knows what the next event will bring, we’re confident our models and, more importantly, our transparent approach to explaining our estimates will continue to build client confidence.”
View of Hurricane Harvey from space
6 | EXPOSURE | Issue 05 www.rms.com/exposure
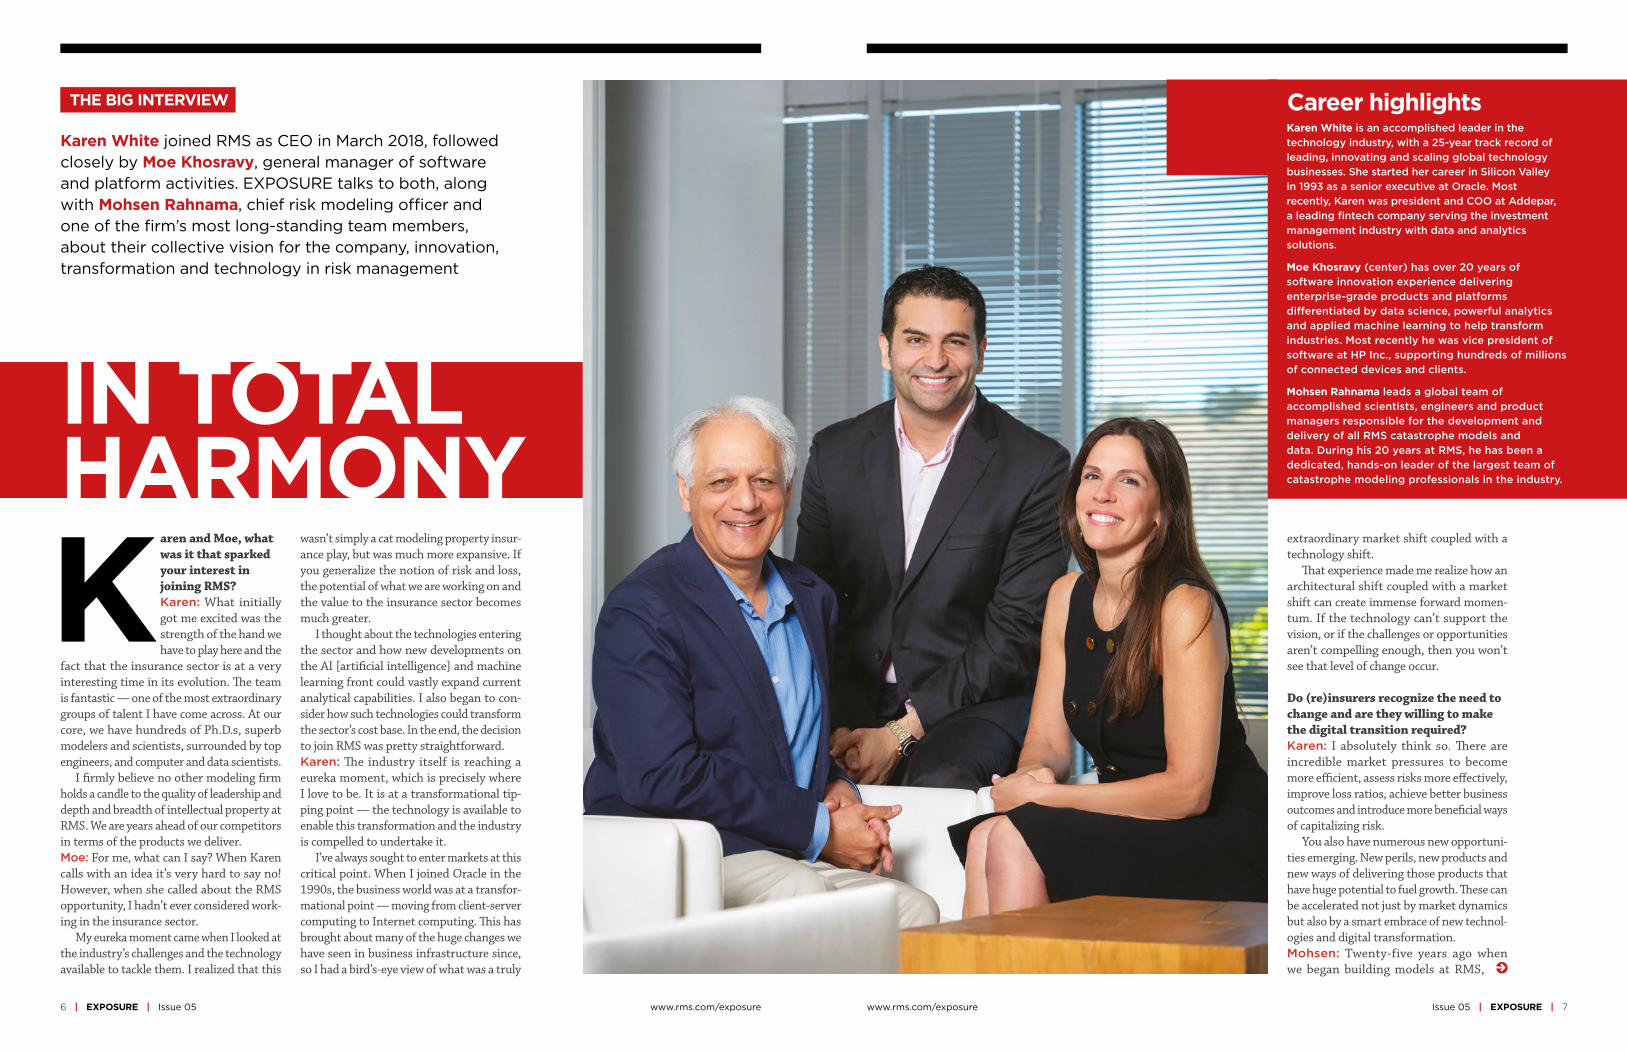
Karen and Moe, what was it that sparked your interest in joining RMS?Karen: What initially got me excited was the strength of the hand we have to play here and the
fact that the insurance sector is at a very interesting time in its evolution. The team is fantastic — one of the most extraordinary groups of talent I have come across. At our core, we have hundreds of Ph.D.s, superb modelers and scientists, surrounded by top engineers, and computer and data scientists.
I firmly believe no other modeling firm holds a candle to the quality of leadership and depth and breadth of intellectual property at RMS. We are years ahead of our competitors in terms of the products we deliver.Moe: For me, what can I say? When Karen calls with an idea it’s very hard to say no! However, when she called about the RMS opportunity, I hadn’t ever considered work-ing in the insurance sector.
My eureka moment came when I looked at the industry’s challenges and the technology available to tackle them. I realized that this
THE BIG INTERVIEW
IN TOTAL HARMONY
Karen White joined RMS as CEO in March 2018, followedclosely by Moe Khosravy, general manager of softwareand platform activities. EXPOSURE talks to both, alongwith Mohsen Rahnama, chief risk modeling officer andone of the firm’s most long-standing team members, about their collective vision for the company, innovation, transformation and technology in risk management
wasn’t simply a cat modeling property insur-ance play, but was much more expansive. If you generalize the notion of risk and loss, the potential of what we are working on and the value to the insurance sector becomes much greater.
I thought about the technologies entering the sector and how new developments on the AI [artificial intelligence] and machine learning front could vastly expand current analytical capabilities. I also began to con-sider how such technologies could transform the sector’s cost base. In the end, the decision to join RMS was pretty straightforward.Karen: The industry itself is reaching a eureka moment, which is precisely where I love to be. It is at a transformational tip-ping point — the technology is available to enable this transformation and the industry is compelled to undertake it.
I’ve always sought to enter markets at this critical point. When I joined Oracle in the 1990s, the business world was at a transfor-mational point — moving from client-server computing to Internet computing. This has brought about many of the huge changes we have seen in business infrastructure since, so I had a bird’s-eye view of what was a truly
www.rms.com/exposure Issue 05 | EXPOSURE | 7
extraordinary market shift coupled with a technology shift.
That experience made me realize how an architectural shift coupled with a market shift can create immense forward momen-tum. If the technology can’t support the vision, or if the challenges or opportunities aren’t compelling enough, then you won’t see that level of change occur.
Do (re)insurers recognize the need to change and are they willing to make the digital transition required?Karen: I absolutely think so. There are incredible market pressures to become more efficient, assess risks more effectively, improve loss ratios, achieve better business outcomes and introduce more beneficial ways of capitalizing risk.
You also have numerous new opportuni-ties emerging. New perils, new products and new ways of delivering those products that have huge potential to fuel growth. These can be accelerated not just by market dynamics but also by a smart embrace of new technol-ogies and digital transformation. Mohsen: Twenty-five years ago when we began building models at RMS,
Karen White is an accomplished leader in the technology industry, with a 25-year track record of leading, innovating and scaling global technology businesses. She started her career in Silicon Valley in 1993 as a senior executive at Oracle. Most recently, Karen was president and COO at Addepar, a leading fintech company serving the investment management industry with data and analytics solutions.
Moe Khosravy (center) has over 20 years of software innovation experience delivering enterprise-grade products and platforms differentiated by data science, powerful analytics and applied machine learning to help transform industries. Most recently he was vice president of software at HP Inc., supporting hundreds of millions of connected devices and clients.
Mohsen Rahnama leads a global team of accomplished scientists, engineers and product managers responsible for the development and delivery of all RMS catastrophe models and data. During his 20 years at RMS, he has been a dedicated, hands-on leader of the largest team of catastrophe modeling professionals in the industry.
Career highlights
8 | EXPOSURE | Issue 05 www.rms.com/exposure
practitioners simply had no effective means of assessing risk. So, the adoption of model technology was a relatively simple step. Today, the extreme levels of competition are making the ability to differentiate risk at a much more granular level a critical factor, and our model advances are enabling that.
In tandem, many of the Silicon Valley technologies have the potential to greatly enhance efficiency, improve processing power, minimize cost, boost speed to market, enable the development of new products, and positively impact every part of the insurance workflow.
Data is the primary asset of our indus-try — it is the source of every risk decision, and every risk is itself an opportunity. The amount of data is increasing exponentially, and we can now capture more information much faster than ever before, and analyze it with much greater accuracy to enable better decisions. It is clear that the potential is there to change our industry in a positive way.
The industry is renowned for being risk averse. Is it ready to adopt the new technologies that this transformation requires?Karen: The risk of doing nothing given cur-rent market and technology developments is far greater than that of embracing emerg-ing tech to enable new opportunities and improve cost structures, even though there are bound to be some bumps in the road.
I understand the change management can be daunting. But many of the technologies RMS is leveraging to help clients improve price performance and model execution are not new. AI, the Cloud and machine learning are already tried and trusted, and the insur-ance market will benefit from the lessons other industries have learned as it integrates these technologies. Moe: Making the necessary changes will challenge the perceived risk-averse nature of the insurance market as it will require new ground to be broken. However, if we can clearly show how these capabilities can help companies be measurably more productive
and achieve demonstrable business gains, then the market will be more receptive to new user experiences. Mohsen: The performance gains that tech-nology is introducing are immense. A few years ago, we were using computation fluid dynamics to model storm surge. We were conducting the analysis through CPU [cen-tral processing unit] microprocessors, which was taking weeks. With the advent of GPU [graphics processing unit] microprocessors, we can carry out the same level of analysis in hours.
When you add the supercomputing capa-bilities possible in the Cloud, which has enabled us to deliver HD-resolution models to our clients — in particular for flood, which requires a high-gradient hazard model to dif-ferentiate risk effectively — it has enhanced productivity significantly and in tandem price performance.
Is an industry used to incremental change able to accept the stepwise change technology can introduce?Karen: Radical change often happens in increments. The change from client-server to Internet computing did not happen over-night, but was an incremental change that came in waves and enabled powerful market shifts.
Amazon is a good example of market leadership out of digital transformation. It launched in 1994 as an online bookstore in a mature, relatively sleepy industry. It evolved into broad e-commerce and again with the introduction of Cloud services when it launched AWS [Amazon Web Services] 12 years ago — now a US$17 billion business that has disrupted the computer industry and is a huge portion of its profit. Amazon has total revenue of US$178 billion from nothing over 25 years, having disrupted the retail sector.
Retail consumption has changed dramat-ically, but I can still go shopping on Lon-don’s Oxford Street and about 90 percent of retail is still offline. My point is, things do change incrementally but standing still is not a great option when technology-fueled market dynamics are underway. Getting out in front can be enormously rewarding and create new leadership.
However, we must recognize that how we introduce technology must be driven by the
DEVELOPMENTS SUCH AS AI AND MACHINE LEARNING ARE NOT FAIRY DUST TO SPRINKLE ON THE INDUSTRY’S PROBLEMS”
THE SECTOR IS NOT YET ATTRACTING THE KIND OF TALENT THAT IS ATTRACTED TO FIRMS SUCH AS GOOGLE, MICROSOFT OR AMAZON — AND IT NEEDS TO”
www.rms.com/exposure Issue 05 | EXPOSURE | 9
challenges it is being introduced to address. I am already hearing people talk about devel-opments such as AI, machine learning and neural networks as if they are fairy dust to sprinkle on the industry’s problems. That is not how this transformation process works.
How are you approaching the challenges that this transformation poses?Karen: At RMS, we start by understanding the challenges and opportunities from our customers’ perspectives and then look at what value we can bring that we have not brought before. Only then can we look at how we deliver the required solution.Moe: It’s about having an “outward-in” perspective. We have amazing technol-ogy expertise across modeling, computer science and data science, but to deploy that effectively we must listen to what the market wants.
We know that many companies are oper-ating multiple disparate systems within their networks that have simply been built upon again and again. So, we must look at harnessing technology to change that, because where you have islands of data, applications and analysis, you lose fidelity, time and insight and costs rise. Moe: While there is a commonality of purpose spanning insurers, reinsurers and brokers, every organization is different. At RMS, we must incorporate that into our software and our platforms. There is no one-size-fits-all and we can’t force everyone to go down the same analytical path.
That’s why we are adopting a more mod-ular approach in terms of our software. Whether the focus is portfolio manage-ment or underwriting decision-making, it’s about choosing those modules that best meet your needs.Mohsen: When constructing models, we focus on how we can bring the right technol-ogy to solve the specific problems our clients have. This requires a huge amount of critical thinking to bring the best solution to market.
How strong is the talent base that is helping to deliver this level of capability?Mohsen: RMS is extremely fortunate to have such a fantastic array of talent. This caliber of expertise is what helps set us apart from competitors, enabling us to
push boundaries and advance our modeling capabilities at the speed we are.
Recently, we have set up teams of model-ers and data and computer scientists tasked with developing a range of innovations. It’s fantastic having this depth of talent, and when you create an environment in which innovative minds can thrive you quickly reap the rewards — and that is what we are seeing. In fact, I have seen more innovation at RMS in the last six months than over the past several years. Moe: I would add though that the sector is not yet attracting the kind of talent seen at firms such as Google, Microsoft or Ama-zon, and it needs to. These companies are either large-scale customer-service provid-ers capitalizing on big data platforms and leading-edge machine-learning techniques to achieve the scale, simplicity and flexibility their customers demand, or enterprises actu-ally building these core platforms themselves.
When you bring new blood into an orga-nization or industry, you generate new ideas
that challenge current thinking and practices, from the user interface to the underlying platform or the cost of performance. We need to do a better PR job as a technology sector. The best and brightest people in most cases just want the greatest problems to tackle — and we have a ton of those in our industry.Karen: The critical component of any suc-cessful team is a balance of complementary skills and capabilities focused on having a high impact on an interesting set of chal-lenges. If you get that dynamic right, then that combination of different lenses correctly aligned brings real clarity to what you are trying to achieve and how to achieve it.
I firmly believe at RMS we have that bal-ance. If you look at the skills, experience and backgrounds of Moe, Mohsen and myself, for example, they couldn’t be more different. Bringing Moe and Mohsen together, how-ever, has quickly sparked great and different thinking. They work incredibly well together despite their vastly different technical focus and career paths. In fact, we refer to them as the “Moe-Moes” and made them match-ing inscribed giant chain necklaces and pre-sented them at an all-hands meeting recently. Moe: Some of the ideas we generate during our discussions and with other members of the modeling team are incredibly powerful. What’s possible here at RMS we would never have been able to even consider before we started working together. Mohsen: Moe’s vast experience of building platforms at companies such as HP, Intel and Microsoft is a great addition to our capabil-ities. Karen brings a history of innovation and building market platforms with the disci-pline and the focus we need to deliver on the vision we are creating. If you look at the huge amount we have been able to achieve in the months that she has been at RMS, that is a testament to the clear direction we now have.Karen: While we do come from very different backgrounds, we share a very well-defined culture. We care deeply about our clients and their needs. We challenge ourselves every day to innovate to meet those needs, while at the same time maintaining a hell-bent pragmatism to ensure we deliver.Mohsen: To achieve what we have set out to achieve requires harmony. It requires a clear vision, the scientific know-how, the drive to learn more, the ability to innovate and the technology to deliver — all working in harmony.
DATA IS THE PRIMARY ASSET OF OUR INDUSTRY — IT IS THE SOURCE OF EVERY RISK DECISION, AND EVERY RISK IS ITSELF AN OPPORTUNITY”

www.rms.com/exposure Issue 05 | EXPOSURE | 11
column inches has been the marginal declines available to the vast majority of households in the less seismically active regions, as the high-risk earthquake burden on their pre-mium is reduced.
A key factor in Tower’s decision was the increasing quality and granularity of the underwriting data at its disposal. “Tower has always focused on the quality of its data and has invested heavily in ensuring it has the highest-resolution information available,” says Michael Drayton, senior risk modeler for RMS, based in New Zealand.
In fact, in the aftermath of the Christ-church earthquakes, RMS worked with Tower as RMS rebuilt its New Zealand High-Defi-nition (HD) Earthquake Model due to the caliber of their data. Prior to the earthquake, claims data was in very short supply given that there had been few previous events with large-scale impacts on highly built-up areas.
“On the vulnerability side,” Drayton explains, “we had virtually no local claims data to build our damage functions. Our previous model had used comparisons of building performance in other earthquake- exposed regions. After Christchurch, we suddenly had access to billions of dollars of claims information.”
RMS sourced data from numerous parties, including EQC and Tower, as well as geosci-ence research firm GNS Science, as it recon-structed the model from this swell of data.
“RMS had a model that had served the market well for many years,” he explains. “On the hazard side, the fundamentals remained the same — the highest hazard is along the plate boundary, which runs offshore along the east coast of North Island traversing over to the western edge of South Island. But we had now gathered new information on fault
he ramifications of the Christchurch earthquakes of 2010-11 continue to reverberate through the New Zealand insurance market. The country’s Earthquake Commission
(EQC), which provides government-backed natural disaster insurance, is forecast to have paid around NZ$11 billion (US$7.3 billion) by the time it settles its final claim.
The devastating losses exposed signif-icant shortfalls in the country’s insurance market. These included major deficiencies in insurer data, gaps in portfolio management and expansive policy wordings that left carri-ers exposed to numerous unexpected losses.
Since then, much has changed. Policy terms have been tightened, restrictions have been introduced on coverage and concerted efforts have been made to bolster data-bases. The EQC has also announced plans to increase the cap limit on the government- mandated residential cover it provides to all householders from NZ$100,000 (US$66,000) (a figure set in 1993) to NZ$150,000. A sig-nificant increase, but well below the average house price in New Zealand as of December 2017, which stood at NZ$669,565, and an average rebuild cost of NZ$350,000. It is also set to remove contents coverage.
More recently, however, one development has taken place that has the potential to have a much more profound impact on the market.
Risk-based pricing In March 2018, New Zealand insurer Tower Insurance announced a move to risk-based pricing for home insurance. It aims to ensure premium levels are commensurate with individual property risk profiles, with those in highly exposed areas experiencing a price rise on the earthquake component of their coverage.
Describing the shift as a “fairer and more equitable way of pricing risk,” Tower CEO Richard Harding says this was the “right thing to do” both for the “long-term bene-fit of New Zealand” and for customers, with risk-based pricing “the fairest way to distrib-ute the costs we face as an insurer.”
The move has generated much media cov-erage, with stories highlighting instances of triple-digit percentage hikes in earth-quake-prone regions such as Wellington. Yet, what has generated significantly fewer
“THE EARTHQUAKES GENERATED THE MOST EXTENSIVE LIQUEFACTION IN A BUILT-UP AREA SEEN IN A DEVELOPED COUNTRY” — MICHAEL DRAYTON, RMS
T lines, activity rates, magnitudes and sub-duction zones. We also updated our ground motion prediction equations.”
One of the most high-profile model developments was the advanced liquefac-tion module. “The 2010-11 earthquakes generated probably the most extensive liquefaction in a built-up area seen in a developed country. With the new infor-mation, we were now able to capture the risk at much higher gradients and in much greater resolution,” says Drayton.
This data surge enabled RMS to construct its New Zealand Earthquake HD Model on a variable resolution grid set at a far more localized level. In turn, this has helped give Tower sufficient confidence in the granular-ity and accuracy of its data at the property level to adopt risk-based pricing.
The ripple effectsAs homeowners received their renewal notices, the reality of risk-based pricing started to sink in. Tower is the third-largest insurer for domestic household, contents and private motor cover in New Zealand and faces stiff competition. Over 70 percent of the market is in the hands of two players, with IAG holding around 47 percent and Suncorp approximately 25 percent.
Recent news reports suggest there is movement from the larger players. AMI and State, both owned by IAG, announced that three-quarters of its policyholders — those at heightened risk of earthquake, landslide or flood — will see an aver-age annual premium increase of NZ$91 (US$60); the remaining quarter at lower risk will see decreases averaging NZ$54 per year. A handful of households could see increases or decreases of up to NZ$1,000. According to the news website Stuff, IAG has not changed premiums for its NZI poli-cyholders, with NZI selling house insurance policies through brokers.
“One interesting dynamic is that a small number of start-ups are now enter-ing the market with the same risk-based pricing stance taken by Tower,” Drayton points out. “These are companies with new purpose-built IT systems that are small and nimble and able to target niche sectors.”
“It’s certainly a development to watch closely,” he continues, “as it raises the potential for larger players, if they are not able to respond effectively, being
10 | EXPOSURE | Issue 05 www.rms.com/exposure
Following Tower Insurance’s switch to risk-based pricing in New Zealand, EXPOSURE examines how recent market
developments may herald a more fundamental industry shift
COVER STORY
A RISK-DRIVEN BUSINESS
12 | EXPOSURE | Issue 05 www.rms.com/exposure
selected against. It will be interesting to see if the rate of these new entrants increases.”
The move from IAG suggests risk-based pricing will extend beyond the earthquake component of cover to flood-related ele-ments. “Flood is not a reinsurance peril for New Zealand, but it is an attritional one,” Drayton points out. “Then there is the issue of rising sea levels and the potential for coastal flooding, which is a major cause for concern. So, the risk-based pricing shift is feeding into climate change discussions too.”
A fundamental shiftPaul Burgess, RMS regional vice president for client development in Asia-Pacific, believes that policyholders have been shielded from the risk reality of earthquakes in recent years and that a move to risk-based pricing will change that.
“Policyholders in risk-exposed areas such as Wellington are almost totally unaware of how much higher their insurance should be based on their property exposure,” he says. “In effect, the EQC levy has served to mask this as it is simply absorbed into household cover premiums and paid by the insurer.”
Drayton agrees that recent developments are opening the eyes of homeowners. “There
is a growing realization that New Zealand’s insurance market has operated very differ-ently from other insurance markets and that that is now changing.”
One major marketwide development in recent years has been the move from full replacement cover to fixed sums insured in household policies. “This has a lot of peo-ple worried they might not be covered,” he explains. “Whereas before, people simply assumed that in the event of a big loss the insurer would cover it all, now they’re slowly realizing it no longer works like that. This will require a lot of policyholder education and will take time.”
At a more foundational level, current
Key to understanding the rationale behind the shift to risk-based pricing is understanding the broader economic context of New Zealand, says Tower CEO Richard Harding.
“The New Zealand economy is comparatively small,” he explains, “and we face a range of unique climatic and geological risks. If we don’t plan for and mitigate these risks, there is a chance that reinsurers will charge insurers more or restrict cover.
“Before this happens, we need to educate the community, government, councils and regulators, and by moving toward risk-based pricing, we’re putting a signal into the market to drive social change through these organizations.
“These signals will help demonstrate to councils and government that more needs to be done to plan for and mitigate natural disasters and climate change.”
Harding feels that this risk-based pricing shift is a natural market evolution. “When you look at global trends, this is happening around the world. So, given that we face a number of large risks here in New Zealand, in some respects, it’s surprising it hasn’t happened sooner,” he says.
While some parties have raised concerns that there may be a fall in insurance uptake in highly exposed regions, Harding does not believe this will be the case. “For the average home, insurance may be more expensive than it currently is, but it won’t be unattainable,” he states.
Moving forward, he says that Tower is working to extend its risk-based pricing approach beyond the earthquake component of its cover, stating that the fi rm “is actively pursuing risk-based pricing for fl ood and other natural perils, and over the long term we would expect other insurers to follow in our footsteps.”
In terms of the potential wider implications if this occurs, Harding says that such a development would compel government, councils and other organizations to change how they view risk in their planning processes. “I think it will start to drive customers to consider risk more holistically and take this into account when they build and buy homes,” he concludes.
MAKING THE MOVEmarket dynamics also address the funda-mental role of insurance. “In many ways, the pricing developments expose the con-flicted role of the insurer as both a facili-tator of risk pooling and a profit-making enterprise,” Burgess says. “When invest-ment returns outweighed underwriting profit, cross-subsidization wasn’t a big issue. However, current dynamics mean the operating model is squarely focused on underwriting returns — and that favors risk-based pricing.”
Cross-subsidization is the basis upon which EQC is built, but is it fair? Twenty cents in every NZ$100 (US$66) of home or contents fire insurance premium, up to a maximum of NZ$100,000 insured, is passed on to the EQC. While to date there has been limited government response to risk-based pricing, it is monitoring the situation closely given the broader implications.
Looking globally, in a recent RMS blog, chief research officer Robert Muir-Wood also raises the question whether “flat-rated” schemes, like the French cat nat scheme, will survive now that it has become clear how to use risk models to calculate the wide differ-entials in the underlying cost of the risk. He asks whether “such schemes are established in the name of ‘solidarity’ or ignorance?”
While there is no evidence yet, current developments raise the potential for certain risks to become uninsurable (see our climate change feature). Increasingly granular data combined with the drive for greater prof-itability may cause a downward spiral in a market built on a shared burden.
Drayton adds: “Potential uninsurabil-ity has more to do with land-use planning and building consent regimes, and insur-ers shouldn’t be paying the price for poor planning decisions. Ironically, earthquake loading codes are very sophisticated and have evolved to recognize the fine grada-tions in earthquake risk provided by local-ized data. In fact, they are so refined that structural engineers remark that they are too nuanced and need to be simpler. But if you are building in a high-risk area, it’s not just designing for the hazard, it is also managing the potential financial risk.”
He concludes: “The market shifts we are seeing today pose a multitude of questions and few clear answers. However, the only constant running through all these discus-sions is that they are all data driven.”
“THE MARKET SHIFTS WE ARE SEEING TODAY POSE A MULTITUDE OF QUESTIONS AND FEW CLEAR ANSWERS” — MICHAEL DRAYTON, RMS
www.rms.com/exposure Issue 05 | EXPOSURE | 13
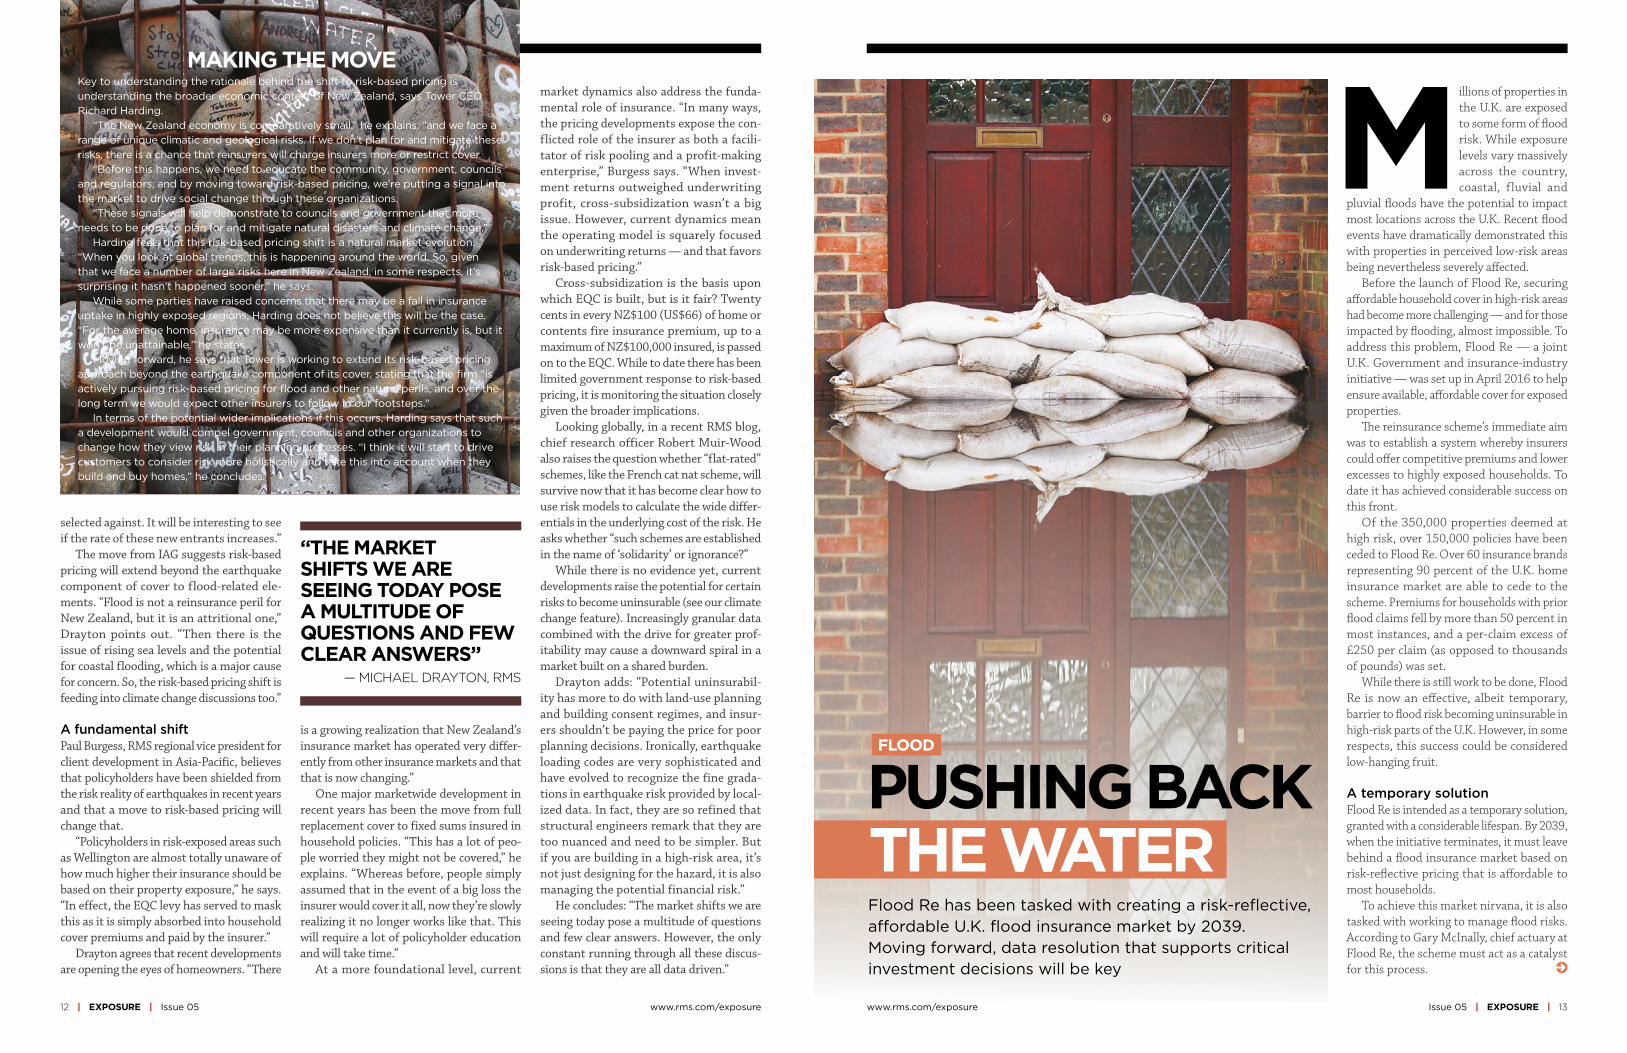
PUSHING BACK THE WATER
FLOOD
Flood Re has been tasked with creating a risk-refl ective, a� ordable U.K. fl ood insurance market by 2039. Moving forward, data resolution that supports critical investment decisions will be key
illions of properties in the U.K. are exposed to some form of fl ood risk. While exposure levels vary massively across the country, coastal, fluvial and
pluvial fl oods have the potential to impact most locations across the U.K. Recent fl ood events have dramatically demonstrated this with properties in perceived low-risk areas being nevertheless severely aff ected.
Before the launch of Flood Re, securing aff ordable household cover in high-risk areas had become more challenging — and for those impacted by fl ooding, almost impossible. To address this problem, Flood Re — a joint U.K. Government and insurance-industry initiative — was set up in April 2016 to help ensure available, aff ordable cover for exposed properties.
� e reinsurance scheme’s immediate aim was to establish a system whereby insurers could off er competitive premiums and lower excesses to highly exposed households. To date it has achieved considerable success on this front.
Of the 350,000 properties deemed at high risk, over 150,000 policies have been ceded to Flood Re. Over 60 insurance brands representing 90 percent of the U.K. home insurance market are able to cede to the scheme. Premiums for households with prior fl ood claims fell by more than 50 percent in most instances, and a per-claim excess of £250 per claim (as opposed to thousands of pounds) was set.
While there is still work to be done, Flood Re is now an eff ective, albeit temporary, barrier to fl ood risk becoming uninsurable in high-risk parts of the U.K. However, in some respects, this success could be considered low-hanging fruit.
A temporary solutionFlood Re is intended as a temporary solution, granted with a considerable lifespan. By 2039, when the initiative terminates, it must leave behind a fl ood insurance market based on risk-refl ective pricing that is aff ordable to most households.
To achieve this market nirvana, it is also tasked with working to manage fl ood risks. According to Gary McInally, chief actuary at Flood Re, the scheme must act as a catalyst for this process.
M

14 | EXPOSURE | Issue 05 www.rms.com/exposure www.rms.com/exposure Issue 05 | EXPOSURE | 15
“Flood Re has a very clear remit for the longer term,” he explains. “That is to reduce the risk of flooding over time, by helping reduce the frequency with which properties flood and the impact of flooding when it does occur. Properties ought to be presenting a level of risk that is insurable in the future. It is not about removing the risk, but rather promoting the transformation of previously uninsurable properties into insurable prop-erties for the future.”
To facilitate this transition to improved property-level resilience, Flood Re will need to adopt a multifaceted approach promoting research and development, consumer educa-tion and changes to market practices to rec-ognize the benefit. Firstly, it must assess the potential to reduce exposure levels through implementing a range of resistance (the abil-ity to prevent flooding) and resilience (the ability to recover from flooding) measures at the property level. Second, it must promote options for how the resulting risk reduction can be reflected in reduced flood cover prices and availability requiring less support from Flood Re.
According to Andy Bord, CEO of Flood Re: “There is currently almost no link between the action of individuals in protecting their properties against floods and the insurance premium which they are charged by insurers. In principle, establishing such a positive link is an attractive approach, as it would provide a direct incentive for households to invest in property-level protection.
“Flood Re is building a sound evidence base by working with academics and others to quantify the benefits of such mitigation measures. We are also investigating ways the scheme can recognize the adoption of resil-ience measures by householders and ways we can practically support a ‘build-back-better’ approach by insurers.”
Modeling flood resilienceMultiple studies and reports have been con-ducted in recent years into how to reduce flood exposure levels in the U.K. However, an extensive review commissioned by Flood Re spanning over 2,000 studies and reports found that while helping to clarify potential appropriate measures, there is a clear lack of data on the suitability of any of these measures to support the needs of the insurance market.
A 2014 report produced for the U.K. Environment Agency identified a series of
previous generations of U.K. flood models and reflects ... over 20 years of experience in mod-eling this critical peril.”
The model also enables a much more accu-rate and transparent means of assessing the impact of permanent and temporary flood defenses and their role to protect against both fluvial and pluvial flood events.
“As a result,” Savina continues, “the model framework provides ... the transparency, gran-ularity and flexibility to calculate the potential benefits of the various resistance and resilience measures at the individual property level.”
Putting data to the test“The recent advances in HD modeling have provided greater transparency and so allow us to better understand the behavior of the model in more detail than was possible pre-viously,” McInally believes. “That is enabling us to pose much more refined questions that previously we could not address.”
While the Environment Agency study pro-vided significant data insights, the LTIS model does not incorporate the capability to model pluvial and fluvial flooding at the individual property level, he explains.
“We were able to use our U.K. flood HD model to conduct the same analysis recently carried out by the Environment Agency,” says John Brierly, product manager at RMS, “but using our comprehensive set of flood events
as well as our vulnerability, uncertainty and loss modeling framework. This meant that we were able to model the vulnerability of each resistance/resilience package for a particular building at a much more granular level.”
Commenting on the work of the previous analysis, Savina points out that LTIS was designed for a different scope, and it might be simplistic to think that it can be used for probabilistic property-level flood loss analysis.
“We took the same vulnerability data used by the Environment Agency, which is rela-tively similar to the one used by our model,” he says, “and ran this through our flood model. This meant that we were able to output the impact of each of the resistance and resilience packages against a vulnerability baseline to establish their overall effectiveness.”
The results revealed a significant difference between the model numbers generated by the LTIS model and those produced by the RMS Europe Inland Flood HD Models.
“What we found was that since the hazard data used by the Environment Agency did not include pluvial flood risk, combined with general lower resolution layers than what is used in our model,” Savina explains, “the LTIS study presented an overconcentration and hence overestimation of flood depths at the property level, and as a result the perceived benefits of the various resilience and resis-tance measures were underestimated.
possible packages of resistance and resilience measures. The study was based on the agen-cy’s Long-Term Investment Scenario (LTIS) model and assessed the potential benefit of the various packages to U.K. properties at risk of flooding.
The 2014 study is currently being updated by the Environment Agency, with the new study examining specific subsets based on the levels of benefit delivered.
Packages considered will encompass resis-tance and resilience measures spanning both active and passive components. These include: waterproof external walls, flood-resistant doors, sump pumps and concrete flooring. The effectiveness of each is being assessed at various levels of flood severity to generate depth damage curves.
While the data generated will have a foun-dational role in helping support outcomes around flood-related investments, it is imper-ative that the findings of the study undergo rigorous testing, as McInally explains. “We want to promote the use of the best-available data when making decisions,” he says. “That’s why it was important to independently verify the findings of the Environment Agency study.
If the findings differ from studies conducted by the insurance industry, then we should work together to understand why.”
To assess the results of key elements of the study, Flood Re called upon the flood model-ing capabilities of RMS.
Recently, RMS launched its Europe Inland Flood High-Definition (HD) Models, which provide the most comprehensive and gran-ular view of flood risk currently available in Europe, covering 15 countries including the U.K. As Maurizio Savina, director of model product management at RMS, explains, advances in the firm’s modeling capabilities have enabled an unparalleled level of flood-data clarity.
“The model,” he says, “enables us to assess flood risk and the uncertainties associated with that risk right down to the individual property and coverage level. In addition, it provides a much longer simulation timeline, capitalizing on advances in computational power through Cloud-based computing to span 50,000 years of possible flood events across Europe. Further, it can generate over 200,000 possible flood scenarios for the U.K. alone. This is a signifi-cant improvement on what was possible using
“IT IS NOT ABOUT REMOVING THE RISK, BUT RATHER PROMOTING THE TRANSFORMATION OF PREVIOUSLY UNINSURABLE PROPERTIES INTO INSURABLE PROPERTIES” — GARY MCINALLY, FLOOD RE
The flood pictureFlood Re
5.3M £20K–£40KU.K. households are at risk of flooding
Typical cost for fully repairing a flooded home
Number of households that had made previous flood claims that could get quotes from two or more insurers; 0% could get quotes from five or more insurers before Flood Re
9%
“Deploying our all-source flood hazard combined with higher resolution data, we were able to get a much clearer picture of the risk at property level. What our out-puts showed was that the potential benefits attributed to each package in some instances were almost double those of the original study.
“For example, we could show how using a particular package across a subset of about 500,000 households in certain specific loca-tions, you could achieve a potential reduction in annual average losses from flood events of up to 40 percent, and this was at country level,” he reveals.
“What we hope is that with this data,” Sav-ina concludes, “Flood Re can better inform the use of the LTIS model when it is used to understand how to allocate resources to generate the greatest potential and achieve the most significant benefit.”
A return on investment?There is still much work to be done to estab-lish an evidence base for the specific value of property-level resilience and resistance measures of sufficient granularity to better inform flood-related investment decisions.
“The initial indications from the ongoing Flood Re cost-benefit analysis work are that resistance measures, because they are cheaper to implement, will prove a more cost-effective approach across a wider group of properties in flood-exposed areas,” McInally indicates. “However, in a post-repair scenario, the cost-benefit results for resilience measures are also favorable.”
However, he is wary about making any definitive statements at this early stage based on the research to date.
“Flood by its very nature includes signifi-cant potential ‘hit-and-miss factors’,” he points out. “You could, for example, make cities such as Hull or Carlisle highly flood resistant and resilient, and yet neither location might experience a major flood event in the next 30 years while the Lake District and West Midlands might experience multiple floods. So the actual impact on reducing the cost of flooding from any program of investment will, in practice, be very different from a simple modeled long-term average benefit. Insurance industry modeling approaches used by Flood Re, which includes the use of the RMS Europe Inland Flood HD Models, could help improve understanding of the range of investment ben-efit that might actually be achieved in practice.”
of the market offer Flood Re
policies written in 2018
90%
150,000
4 out of 5households saw more than 50% price reduction
How poor infrastructure, grid blackouts and runaway business interruption has hampered Puerto Rico’s recovery in the aftermath of Hurricane Maria
PUERTO RICO
WHEN THE LIGHTSWENT OUT
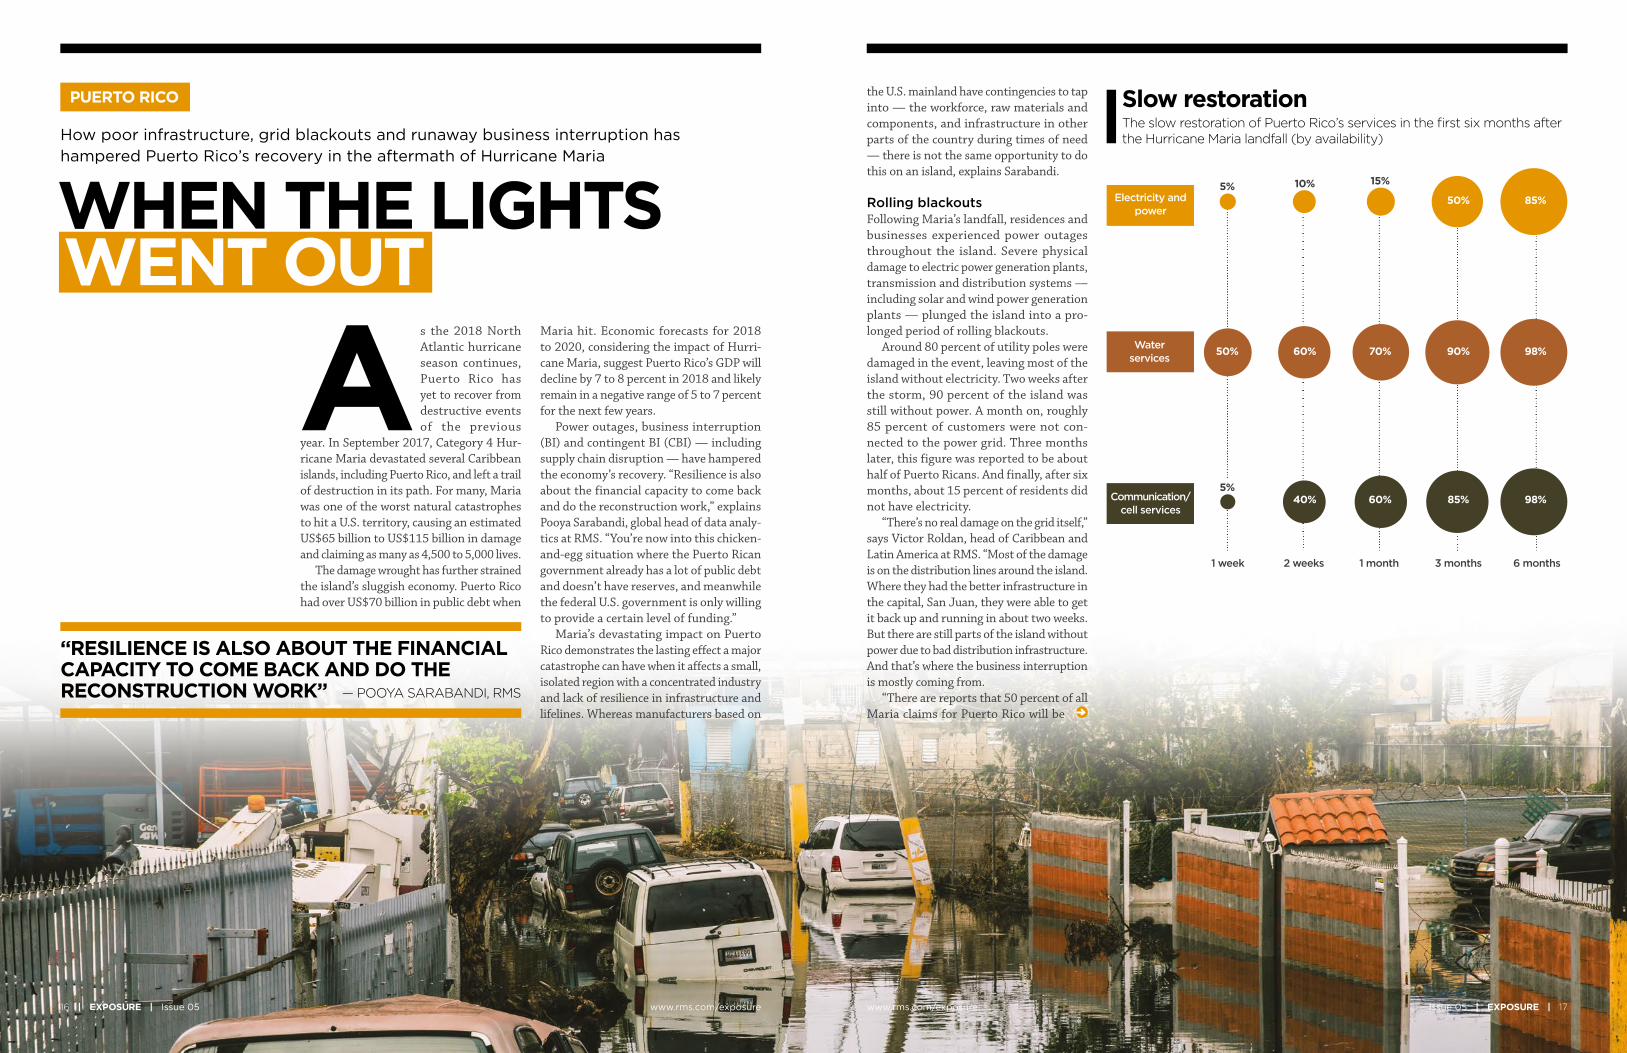
Slow restorationThe slow restoration of Puerto Rico’s services in the first six months after the Hurricane Maria landfall (by availability)
1 week 2 weeks 1 month 3 months 6 months
Electricity and power
5% 10% 15%
50% 85%
Water services 98%90%70%60%50%
5%Communication/
cell services98%85%60%40%
www.rms.com/exposure Issue 05 | EXPOSURE | 1716 | EXPOSURE | Issue 05 www.rms.com/exposure
the U.S. mainland have contingencies to tap into — the workforce, raw materials and components, and infrastructure in other parts of the country during times of need — there is not the same opportunity to do this on an island, explains Sarabandi.
Rolling blackouts Following Maria’s landfall, residences and businesses experienced power outages throughout the island. Severe physical damage to electric power generation plants, transmission and distribution systems — including solar and wind power generation plants — plunged the island into a pro-longed period of rolling blackouts.
Around 80 percent of utility poles were damaged in the event, leaving most of the island without electricity. Two weeks after the storm, 90 percent of the island was still without power. A month on, roughly 85 percent of customers were not con-nected to the power grid. Three months later, this figure was reported to be about half of Puerto Ricans. And finally, after six months, about 15 percent of residents did not have electricity.
“There’s no real damage on the grid itself,” says Victor Roldan, head of Caribbean and Latin America at RMS. “Most of the damage is on the distribution lines around the island. Where they had the better infrastructure in the capital, San Juan, they were able to get it back up and running in about two weeks. But there are still parts of the island without power due to bad distribution infrastructure. And that’s where the business interruption is mostly coming from.
“There are reports that 50 percent of all Maria claims for Puerto Rico will be
Maria hit. Economic forecasts for 2018 to 2020, considering the impact of Hurri-cane Maria, suggest Puerto Rico’s GDP will decline by 7 to 8 percent in 2018 and likely remain in a negative range of 5 to 7 percent for the next few years.
Power outages, business interruption (BI) and contingent BI (CBI) — including supply chain disruption — have hampered the economy’s recovery. “Resilience is also about the financial capacity to come back and do the reconstruction work,” explains Pooya Sarabandi, global head of data analy- tics at RMS. “You’re now into this chicken- and-egg situation where the Puerto Rican government already has a lot of public debt and doesn’t have reserves, and meanwhile the federal U.S. government is only willing to provide a certain level of funding.”
Maria’s devastating impact on Puerto Rico demonstrates the lasting effect a major catastrophe can have when it affects a small, isolated region with a concentrated industry and lack of resilience in infrastructure and lifelines. Whereas manufacturers based on
s the 2018 North Atlantic hurricane season continues, Puerto Rico has yet to recover from destructive events of the previous
year. In September 2017, Category 4 Hur-ricane Maria devastated several Caribbean islands, including Puerto Rico, and left a trail of destruction in its path. For many, Maria was one of the worst natural catastrophes to hit a U.S. territory, causing an estimated US$65 billion to US$115 billion in damage and claiming as many as 4,500 to 5,000 lives.
The damage wrought has further strained the island’s sluggish economy. Puerto Rico had over US$70 billion in public debt when
“RESILIENCE IS ALSO ABOUT THE FINANCIAL CAPACITY TO COME BACK AND DO THE RECONSTRUCTION WORK” — POOYA SARABANDI, RMS
A

18 | EXPOSURE | Issue 05 www.rms.com/exposure
CBI related,” adds Roldan. “Insurers were very competitive, and CBI was included in commercial policies without much thought to the consequences. Policyholders probably paid a fifth of the premiums they should have, way out of kilter with the risk. The majority of CBI claims will be power related, the businesses didn’t experience physical damage, but the loss of power has hit them financially.”
Damage to transportation infrastructure, including railways and roads, only delayed the pace of recovery. The Tren Urbano, the island’s only rail line that serves the San Juan metropolitan area (where roughly 60 percent of Puerto Ricans live), started limited service for the first time almost three months after Hurricane Maria struck. There were over 1,500 reported instances of damage to roads and bridges across the island. San Juan’s main airport, the busiest in the Caribbean, was closed for several weeks.
A concentration of riskRoughly half of Puerto Rico’s economy is based on manufacturing activities, with around US$50 billion in GDP coming from industries such as pharmaceutical, medi-cal devices, chemical, food, beverages and tobacco. Hurricane Maria had a significant impact on manufacturing output in Puerto Rico, particularly on the pharmaceutical and medical devices industries, which is respon-sible for 30 percent of the island’s GDP.
According to Anthony Phillips, chairman of Willis Re Latin America and Caribbean, the final outcome of the BI loss remains unknown but has exceeded expectations due to the length of time in getting power reinstalled. “It’s hard to model the BI loss when you depend on the efficiency of the power companies,” he says. “We used the models and whilst personal lines appeared to come in within expectations, commercial lines has exceeded them. This is mainly due to BI and the inability of the Puerto Rico Elec-tric Power Authority (PREPA) to get things up and running.”
Home to more than 80 pharmaceutical manufacturing facilities, many of which are operated by large multinational companies, Puerto Rico’s pharmaceutical hub was a sig-nificant aggregation of risk from a supply chain and insurance perspective. Although only a few of the larger pharmaceutical plants were directly damaged by the storm,
operations across the sector were suspended or reduced, in some cases for weeks or even months, due to power outages, lack of access and logistics.
“The perception of the BI insurers antic-ipated, versus the reality, was a complete mismatch,” says Mohsen Rahnama, chief risk modeling officer at RMS. “All the big names in pharmaceuticals have operations in Puerto Rico because it’s more cost-effec-tive for production. And they’re all global companies and have backup processes in place and cover for business interruption. However, if there is no diesel on the island for their generators, and if materials cannot get to the island, then there are implications across the entire chain of supply.”
While most of the plants were equipped with backup power generation units, manu-facturers struggled due to long-term lack of connection to the island’s only power grid. The continuous functioning of on-site generators was not only key to resuming production lines, power was also essential for refrigeration and storage of the phar-maceuticals. Five months on, 85 medicines in the U.S. were classified by the Food and Drug Administration (FDA) as “in shortage.”
There are several reasons why Puerto Rico’s recovery stalled. Its isolation from the U.S. mainland and poor infrastructure were both key factors, highlighted by comparing the island’s recovery to recovery operations following U.S. mainland storms, such as Hur-ricane Harvey in Texas last year and 2012’s Superstorm Sandy.
Not only did Sandy impact a larger area when it hit New York and New Jersey, it also caused severe damage to all transmission and distribution systems in its path. How-ever, recovery and restoration took weeks, not months.
It is essential to incorporate the vul-nerabilities created by an aggregation of risk, inadequate infrastructure and lack of contingency options into catastrophe and pricing models, thinks Roldan. “There is only one power company and the power company is facing bankruptcy,” he says. “It hasn’t invested in infrastructure in years. Maria wasn’t even the worst-case scenario because it was not a direct hit to San Juan. So, insurers need to be prepared and under-writing business interruption risks in a more sophisticated manner and not succumbing to market pressures.”
Large-magnitude, high-consequence events have a lasting impact on local populations. Businesses can face increased levels of disruption and loss of revenue due to unavailability of customers, employees or both. These resourcing issues need to be properly considered in the scenario-planning stage, particularly for sectors such as hospitality and tourism.
Puerto Rico’s hospitality and tourism sectors are a signifi cant source of its GDP. While 69 percent of hotels and 61 percent of casinos were operational six weeks after Maria struck, according to the Puerto Rico Tourism Company, other factors continued to deter visitors.
It was not until the end of February 2018, fi ve months after the event, that roughly 80 percent of Puerto Rico’s hotels and restaurants were back in business with tourists returning to the island. This suggests a considerable loss of income due to indirect business interruption in the hospitality and tourism industry.
CBI IMPACT ON HOSPITALITY AND TOURISM
“THE PERCEPTION OF THE BUSINESS INTERRUPTION INSURERS ANTICIPATED, VERSUS THE REALITY, WAS A COMPLETE MISMATCH” — MOHSEN RAHNAMA, RMS
www.rms.com/exposure Issue 05 | EXPOSURE | 19
FLOOD PROTECTION
INSURANCE-LINKED SECURITIES
With innovation in the fl ood market increasing, EXPOSURE explores whether high-defi nition (HD) fl ood models are one of the keys to closing the protection gap
Flooded streets in Houston, Texas, after Hurricane Harvey
n August 2017, Hurricane Harvey brought the highest level of rainfall associated with a tropical cyclone in the U.S. since records began, causing catastrophic fl ooding in some of the most populated areas of the Texas coast, including Houston. � e per-
centage of losses attributed to inland fl ood versus wind damage was signifi cant, altering the historical view that precipitation result-ing from a tropical storm or hurricane is an attritional loss and highlighting the need for stochastic modeling.
Total economic losses resulting from Harvey were around US$85 billion and insured losses were US$30 billion, reveal-ing a signifi cant protection gap, particularly where inland fl ood damage was concerned. Around 200,000 homes were inundated by the fl oods, and yet 80 percent of homes in the Houston area were uninsured.
Now, an innovative catastrophe bond sug-
I gests one way this protection gap could be reduced in the future, particularly as a pri-vate fl ood insurance market develops in the U.S. FloodSmart Re, which was announced at the end of July, secured US$500 million of reinsurance protection on behalf of FEMA’s National Flood Insurance Program (NFIP). Reinsurer Hannover Re was acting as the ceding reinsurer for the transaction, sitting between the NFIP and its Bermuda-based special purpose insurer.
“It’s a landmark transaction — the fi rst time in history that the U.S. federal govern-ment is sponsoring a catastrophe bond,” says John Seo, co-founder and managing principal at Fermat Capital. “It’s just tremendous and I couldn’t be more excited. Events like Harvey are going to accelerate the development of the fl ood market in terms of risk transfer to the insurance-linked securities (ILS) market.
“You have to have more effi cient risk pool-ing and risk sharing mechanisms,” he
THE FUTURE FOR
20 | EXPOSURE | Issue 05 www.rms.com/exposure www.rms.com/exposure Issue 05 | EXPOSURE | 21
“The appetite for new perils is generally strong, so there’s always strong interest when new risks are brought to market,” says Ben Brookes, managing director of capital and resilience solutions at RMS.
He thinks improvements in the underly-ing data quality along with high-definition flood models make it more likely that inland flood could be included as a peril in future catastrophe bond issuances on behalf of pri-vate insurers, on an indemnity basis.
“In the early days of the cat bond market, new perils would typically be issued with para-metric triggers, because investors were skep-tical that sufficient data quality was achieved or that the indemnity risks were adequately captured by cat models. But that changed as investor comfort grew, and a lot of capital entered the market and you saw all these deals becoming indemnity. Increased comfort with risk modeling was a big part of that.”
The innovative Blue Wings catastrophe bond, which covered insurer Allianz for severe U.K. flood risk (and some U.S. and Canadian quake) and was completed in 2007, is a good example. The parametric bond used an index to calculate flood depths at over 50 locations across the U.K., was ahead of its time and is the only U.K. flood catastrophe bond that has come to market.
According to Anger, as models have become more robust for flood risk — whether due
to tropical cyclone (storm surge and excess precipitation) or inland flooding (other than from tropical cyclone) — the investor base has been open to trigger selection (e.g., indemnity or parametric).
“In general, insurers are preferring indemnity-triggered solutions,” she adds, “which the ILS market has concurrently been open to. Additionally, for this peril, the ILS community has been open to per occurrence and annual aggregate structures, which gives flexibility to sponsors to incorporate ILS cap-ital in their risk transfer programs.”
As the private market develops, cat bond sponsors from the insurance market would be more likely to bundle inland flood risk in with other perils, thinks Charlotte Acton, director of capital and resilience solutions at RMS. “A degree of hurricane-induced inland flood risk is already present on a non- modeled basis within some transactions in the market,” she says. “And Harvey illus-trates the value in comprehensive modeling of flooding associated with named storms.
“So, for a broader portfolio, in most cases, inland flood would be one piece of the pic-ture as it will be exposed to multiple perils. However, a stand-alone inland flood bond is possible for a public sector or corporate spon-sor that has specific exposure to flood risk.”
With inland flood, as with all other perils, sophisticated models help to make markets. “A fund would look at the risk in and of itself in the deal, but of course they’d also want to understand the price and returns perspective as well,” says Brookes. “Models play into that quite heavily. You can’t price a bond well, and understand the returns of a bond, unless you understand the risk of it.”
As the ILS market makes increasing use of indemnity protection through ultimate net loss (UNL) triggers, sophisticated HD flood modeling will be essential in order to transfer the peril to the capital markets. This allows clear parameters to be set around different hours clauses and deductible structures, for instance, in addition to modeling all causes
“IT’S A LANDMARK TRANSACTION — THE FIRST TIME IN HISTORY THAT THE U.S. FEDERAL GOVERNMENT IS SPONSORING A CATASTROPHE BOND” — JOHN SEO, FERMAT CAPITAL
of flood and the influence of local defenses. Jillian Williams, head of portfolio analysis
at Leadenhall Capital Partners, notes that ILS is increasingly bundling together multiple perils in an effort to gain diversification.
“Diversification is important for any investment strategy, as you are always trying to minimize the risk of losing large amounts in one go,” she says. “Cat bonds (144A’s) cur-rently have defined perils, but collateralized reinsurance and private cat bonds can cover all perils. Complexities and flow of informa-tion to all parties will be a challenge for cat bonds to move from defined perils to UNL all perils.
“Any new peril or structure in a cat bond will generate many questions, even if they don’t have a major impact on the potential losses,” she continues. “Investors will want to know why the issuers want to include these new perils and structures and how the associated risk is calculated. For UNL, all flood (not just sea surge) would be included in the cat bond, so the definition of the peril, its complexities, variables and its correlation to other perils will need to be evaluated and represented in the flood models used.”
She thinks the potential to transfer more flood to the capital markets is there, but that the complexity of the peril are challenges that need to be overcome, particularly in the U.S. “Flood coverage is already starting to move into the capital markets, but there are many issues that need to be worked through before it can be moved to a 144A transaction in a UNL format for many territories,” says Williams. “Just one of the complexities is that flood risk may be covered by government pools.
“To move flood perils from government pools to private insurers is like any evolu-tion, it can take time, particularly if exist-ing coverage is subsidized,” she adds. “For private insurers, the complexity is not just about flood modeling but also about ensuring risk-adequate pricing and navigating through government legislation.”
adds. “There’s over US$200 trillion dollars of capital in the world, so there’s obviously enough to efficiently absorb event risk. So, it’s about, how do you get it out into that larger capital base in an efficient way?”
While the bond only provides cover for flooding arising from named storms, either due to storm surge or rainfall, it is a “good test case for the ILS market’s appetite for flood risks,” according to ILS blog Artemis. While “it is not a broad flood coverage, it will likely help to make it more palatable to cat bond investors given their comfort with modeling the probability of named storms, tropical storms and hurricanes.”
According to Cory Anger, global head of ILS origination and structuring at GC Secu-rities, the ILS market is certainly showing an appetite for flood risk — including inland flood risk — with several catastrophe bonds completed over the last year for European flood risk (Generali’s Lion II), Japanese flood risk (MSI and ADI’s Akibare Series 2018-1 Notes) and U.S. flood risk.
“Both public and private sector entities see value from utilizing capital markets’ capacity to manage flood risk,” she says. “We think there are other geographic regions that would be interested in ILS capacity that haven’t yet tapped the ILS markets. Given the recent suc-cess of FEMA/NFIP’s FloodSmart Re Series 2018-1 Notes, we expect FEMA/NFIP to continue to utilize ILS capacity (along with traditional reinsurance capital) to support future U.S. flood risk transfer opportunities.”
The ILS sector has grown significantly over the past 15 years, with deals becoming more complex and innovative over time. Many mar-ket commentators feel the market was put to the test following the major natural catastro-phe losses in 2017. Not only did bonds pay out where they were triggered, fresh capital re-entered, demonstrating investors’ confi-dence in the sector and its products.
“I’m hearing people starting to coin the phrase that 2018 is the ‘great reload,’” says Seo. “This is something I have been saying for quite some years: That the traditional hard-soft, soft-hard market cycle is over. It’s not that you can’t have an event so large that it doesn’t impact the market, but when it comes to capital markets, high yields are actually a siren call for capital.
“I don’t think anyone doubts that had 2017 occurred in the absence of the ILS market it would have been a completely different story,
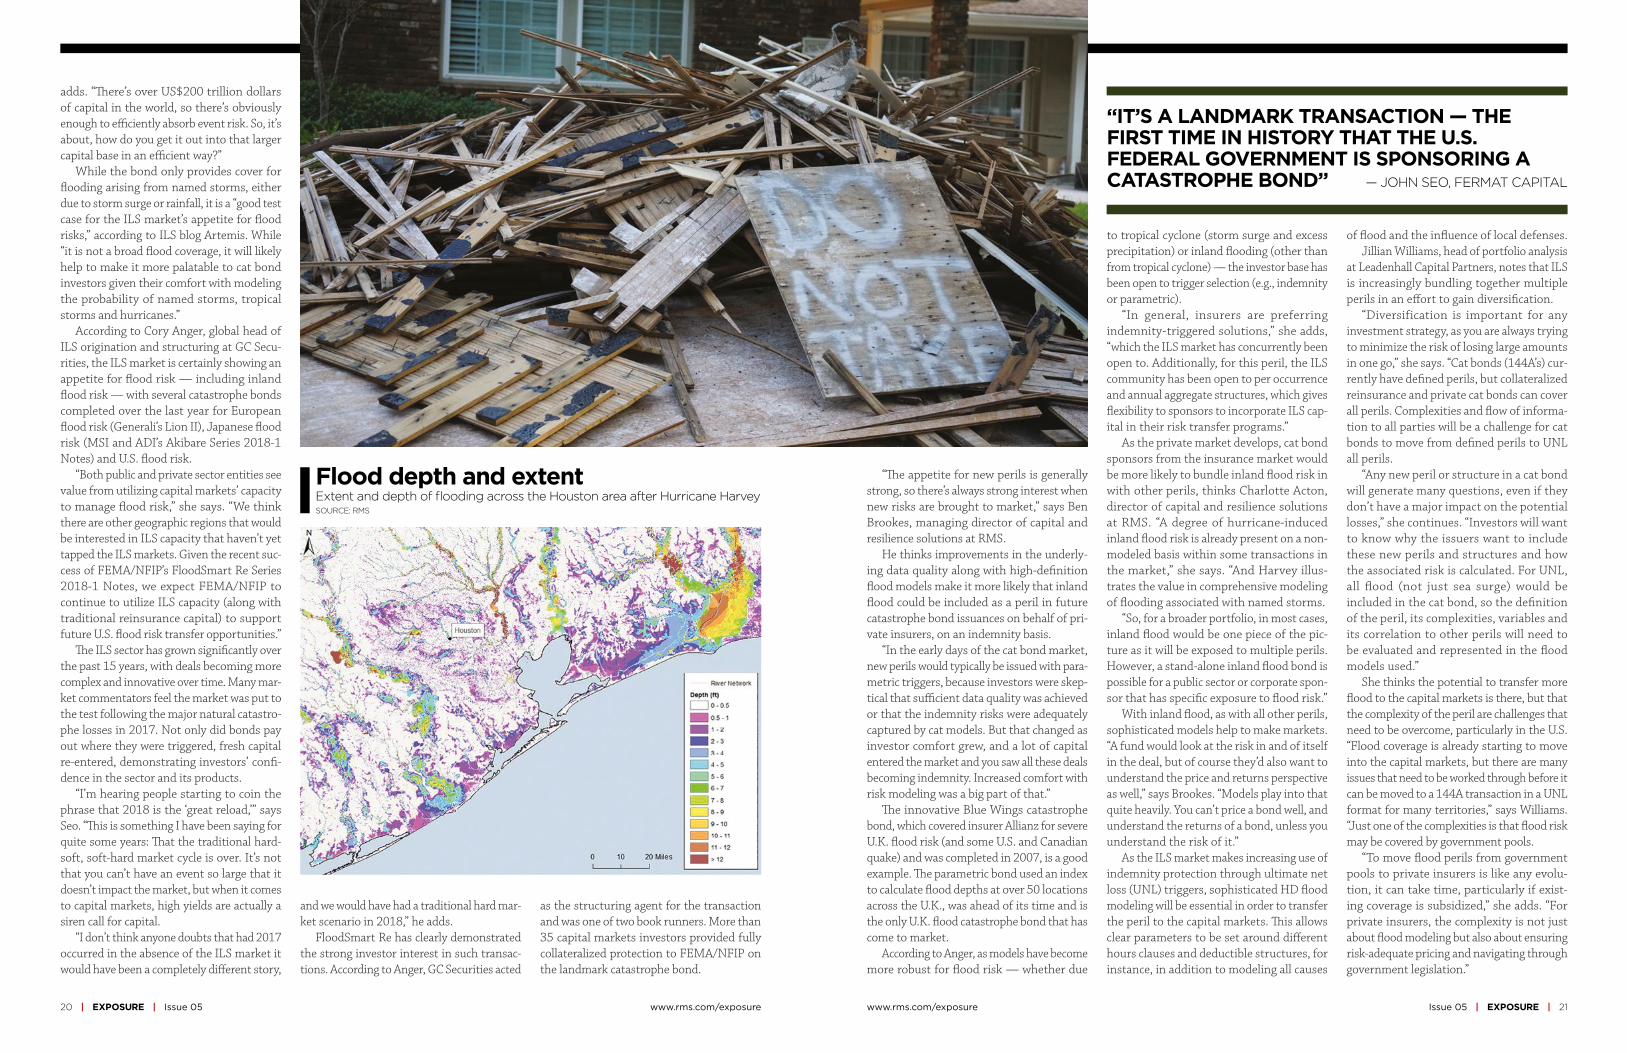
Flood depth and extentExtent and depth of flooding across the Houston area after Hurricane HarveySOURCE: RMS
and we would have had a traditional hard mar-ket scenario in 2018,” he adds.
FloodSmart Re has clearly demonstrated the strong investor interest in such transac-tions. According to Anger, GC Securities acted
as the structuring agent for the transaction and was one of two book runners. More than 35 capital markets investors provided fully collateralized protection to FEMA/NFIP on the landmark catastrophe bond.

EXPOSURE explores the rationale, challenges and benefi ts of adopting an outsourced model function
OUTSOURCING
A MODEL OPERATION
B usiness process out-sourcing has become a mainstay of the oper-ational structure of many organizations. In recent years, reflecting new technologies and
changing market dynamics, the outsourced function has evolved significantly to fit seamlessly within existing infrastructure.
On the modeling front, the exponential increase in data coupled with the drive to reduce expense ratios while enhancing per-formance levels is making the outsourced model proposition an increasingly attrac-tive one.
The business rationaleThe rationale for outsourcing modeling activities spans multiple possible origin points, according to Neetika Kapoor Seh-dev, senior manager at RMS.
“Drivers for adopting an outsourced modeling strategy vary significantly depending on the company itself and their specific ambitions. It may be a new startup that has no internal modeling capabilities, with outsourcing providing access to every component of the model function from day one.”
There is also the flexibility that such access provides, as Piyush Zutshi, director of RMS Analytical Services points out.
“In those initial years, companies often require the flexibility of an outsourced modeling capability, as there is a degree of uncertainty at that stage regarding potential growth rates and the possibility that they may change track and consider alternative lines of business or territories should other areas not prove as profitable as predicted.”
Another big outsourcing driver is the potential to free up valuable internal exper-tise, as Sehdev explains.
“Often, the daily churn of data process-ing consumes a huge amount of internal analytical resources,” she says, “and limits the opportunities for these highly skilled experts to devote sufficient time to ana-lyzing the data output and supporting the decision-making process.”
This all-too-common data stumbling block for many companies is one that not only affects their ability to capitalize fully on their data, but also to retain key ana-lytical staff.
“THAT CREATES A HUGE VALUE-ADD IN TERMS OF OUR CATASTROPHE RESPONSE CAPABILITIES — KNOWING THAT WE ARE ABLE TO REPORT OUR LATEST POSITION HAS MADE A BIG DIFFERENCE ON THIS FRONT” — JUDITH WOO, STARSTONE
22 | EXPOSURE | Issue 05 www.rms.com/exposure www.rms.com/exposure Issue 05 | EXPOSURE | 23
“Companies hire highly skilled analysts to boost their data performance,” Zutshi says, “but most of their working day is taken up by data crunching. That makes it extremely challenging to retain that caliber of staff as they are massively overqualified for the role and also have limited potential for career growth.”
Other reasons for outsourcing include new model testing. It provides organiza-tions with a sandbox testing environment to assess the potential benefits and impact of a new model on their underwriting pro-cesses and portfolio management capabil-ities before committing to the license fee.
The flexibility of outsourced model capa-bilities can also prove critical during renewal periods. These seasonal activity peaks can be factored into contracts to ensure that organizations are able to cope with the spike in data analysis required as they reanalyze portfolios, renew contracts, add new busi-ness and write off old business.
“At RMS Analytical Services,” Zutshi explains, “we prepare for data surge points well in advance. We work with clients to understand the potential size of the ana-lytical spike, and then we add a factor of 20 to 30 percent to that to ensure that we have the data processing power on hand should that surge prove greater than expected.”
Things to considerIntegrating an outsourced function into existing modeling processes can prove a demanding undertaking, particularly in the early stages where companies will be required to commit time and resources to the knowledge transfer required to ensure a seamless integration. The structure of the existing infrastructure will, of course, be a major influencing factor in the ease of transition.
“There are those companies that over the years have invested heavily in their in-house capabilities and developed their own sys-tems that are very tightly bound within their processes,” Sehdev points out, “which can mean decoupling certain aspects is more challenging. For those operations that run much leaner infrastructures, it can often be more straightforward to decouple particular components of the processing.”
RMS Analytical Services has, how-ever, addressed this issue and now works increasingly within the systems of such
clients, rather than operating as an exter-nal function. “We have the ability to work remotely, which means our teams operate fully within their existing framework. This removes the need to decouple any parts of the data chain, and we can fit seamlessly into their processes.”
This also helps address any potential data transfer issues companies may have, particularly given increasingly stringent information management legislation and guidelines.
There are a number of factors that will influence the extent to which a company will outsource its modeling function. Unsurprisingly, smaller organizations and startup operations are more likely to take the fully outsourced option, while larger companies tend to use it as a means of augmenting internal teams — particularly around data engineering.
RMS Analytical Services operate various different engagement models. Managed services are based on annual contracts governed by volume for data engineering and risk analytics. On-demand services are available for one-off risk analytics projects, renewals support, bespoke analysis such as event response, and new IP adoption. “Modeler down the hall” is a third option that provides ad hoc work, while the firm also offers consulting services around areas such as process optimization, model assess-ment and transition support.
Making the transition workStarstone Insurance, a global specialty insurer providing a diversified range of property, casualty and specialty insurance to customers worldwide, has been operating an outsourced modeling function for two and a half years.
“My predecessor was responsible for introducing the outsourced component of our modeling operations,” explains Judith Woo, head of exposure management at Starstone. “It was very much a cost-driven decision as outsourcing can provide a very cost-effective model.”
The company operates a hybrid model, with the outsourced team working on most of the pre- and post-bind data processing, while its internal modeling team focuses on the complex specialty risks that fall within its underwriting remit.
“The volume of business has increased over the years as has the quality of data we receive,” she explains. “The amount of information we receive from our brokers has grown significantly. A lot of the data processing involved can be automated and that allows us to transfer much of this work to RMS Analytical Services.”
On a day-to-day basis, the process is straightforward, with the Starstone team uploading the data to be processed via the RMS data portal. The facility also acts as a messaging function with the two teams com-municating directly. “In fact,” Woo points out, “there are email conversations that take place directly between our underwriters and the RMS Analytical Service team that do not always require our modeling division’s input.”
However, reaching this level of inte-gration and trust has required a strong commitment from Starstone to making the relationship work.
The outsourcing driversSOURCE: RMS ANALYTICAL SERVICES
New entrant
High volumes
Limited team
Optimize cost of adoption
Limited exposure
One-time run needed
Set up new processes
Understand industry standards
Unsure of volumes
New model
Renewal period
Sudden attrition
New line of business
Seasonal peaks
Key resource turnover
1
3
5
4
2
“You are starting to work with a third-party operation that does not under-stand your business or its data processes. You must invest time and energy to go through the various systems and processes in detail,” she adds, “and that can take months depending on the complexity of the business.
“You are essentially building an exten-sion of your team, and you have to commit to making that integration work. You can’t simply bring them in, give them a particular problem and expect them to solve it with-out there being the necessary knowledge transfer and sharing of information.”
Her internal modeling team of six has access to an outsourced team of 26, she explains, which greatly enhances the firm’s data-handling capabilities.
“With such a team, you can import fresh data into the modeling process on a much more frequent basis, for example. That creates a huge value-add in terms of our catastrophe response capabilities — knowing that we are able to report our lat-est position has made a big difference on this front.”
Creating a partnershipAs with any working partnership, the initial phases are critical as they set the tone for the ongoing relationship.
“We have well-defined due diligence and transition methodologies,” Zutshi states. “During the initial phase, we work to under-stand and evaluate their processes. We then create a detailed transition methodology, in which we define specific data templates, establish monthly volume loads, lean peri-ods and surge points, and put in place com-munication and reporting protocols.”
At the end, both parties have a full doc-umented data dictionary with business rules governing how data will be managed, coupled with the option to choose from a repository of 1,000+ validation rules for data engineering. This is reviewed on a reg-ular basis to ensure all processes remain aligned with the practices and direction of the organization.
Service level agreements (SLAs) also form also form a central tenet of the relationship plus stringent data compliance procedures.
“Robust data security and storage is crit-ical,” says Woo. “We have comprehensive NDAs [non-disclosure agreements] in place
that are GDPR compliant to ensure that the integrity of our data is maintained through-out. We also have stringent SLAs in place to guarantee data processing turnaround times. Although, you need to agree on a reasonable time period reflecting the data complexity and also when it is delivered.”
According to Sehdev, most SLAs that the analytical team operates require a 24-hour data turnaround rising to 48-72 hours for more complex data requirements, but cli-ents are able to set priorities as needed.
“However, there is no point delivering on turnaround times,” she adds, “if the quality of the data supplied is not fit for purpose. That’s why we apply a number of data quality assurance processes, which means that our first-time accuracy level is over 98 percent.”
The value-addMost clients of RMS Analytical Services have outsourced modeling functions to the division for over seven years, with a number having worked with the team since it launched in 2004. The decision to incorporate their services is not taken lightly given the nature of the informa-tion involved and the level of confidence required in their capabilities.
“The majority of our large clients bring us on board initially in a data-engineering capacity,” explains Sehdev. “It’s the build-ing of trust and confidence in our ability, however, that helps them move to the next tranche of services.”
The team has worked to strengthen and mature these relationships, which has enabled them to increase both the size and scope of the engagements they undertake.
“With a number of clients, our role has expanded to encompass account model-ing, portfolio roll-up and related consult-ing services,” says Zutshi. “Central to this maturing process is that we are interacting with them daily and have a dedicated team that acts as the primary touch point. We’re also working directly with the underwrit-ers, which helps boost comfort and confi-dence levels.
“For an outsourced model function to become an integral part of the client’s team,” he concludes, “it must be a close, coordinated effort between the parties. That’s what helps us evolve from a standard vendor relationship to a trusted partner.”
“OFTEN, THE DAILY CHURN OF DATA PROCESSING CONSUMES A HUGE AMOUNT OF INTERNAL ANALYTICAL RESOURCES AND LIMITS THE OPPORTUNITIES TO DEVOTE SUFFICIENT TIME TO ANALYZING THE DATA OUTPUT” — NEETIKA KAPOOR SEHDEV, RMS
24 | EXPOSURE | Issue 05 www.rms.com/exposure www.rms.com/exposure Issue 05 | EXPOSURE | 25
One thing that aspects of climate change are telling us is that past experience may not be refl ective of what the future holds. Whether that means greater or fewer losses, we don’t always know as there are so many variables at play. But it is clear that as more uncertainty and complexity is introduced into a system, this creates a society that’s very vulnerable to shocks.
� ere is complexity at the climate level — because we are in uncharted territory with feedback loops, etc. — and complexity within the society that we’ve built around us, which is so dependent on interlinked infrastructure and technology. One story around Florida has been that the improvement in building codes since Hurricane Andrew has made a tremendous diff erence to the losses.
� ere is also this trade-off in how you deal with exposure to multiple hazards and underwrite that risk. So, if you’re making a roof wind resistant does that have an impact on seismic resistance? Does one peril exacerbate
another? In California, we’ve seen some large fl ood events and wildfi res, and there’s a certain interplay there when you experience extremes from one side and the other.
We can’t ignore the socio-economic as well as the scientifi c and climate-related factors when considering the risk. While the industry talks a lot about systemic risk, we are still a long way off from really addressing that. And you’re never going to underwrite systemic risk as such, but thinking about how one risk could potentially impact another is something that we all need to get better at.
Every discipline or industry is based upon a set of assumptions. And it’s not that we should necessarily throw our assumptions out the window, but we should have a sense of when we need to change those. Certainly, the assumption that you have this relatively stable environment with the occasional signifi cant loss year is one to consider. Volatility is something I would expect to see a lot more of in the future.
It’s key for underwriters to understand the importance of the ranges in model outputs and to interpret the data as best they can. Of course, model vendors can help interpret the data, but at the end of the day it’s the underwriter who must make the decision. � e models are there to inform underwriting decisions, not to make underwriting decisions. I think sometimes people use them for the latter, and that’s when they get into trouble.
� ere was noticeable skepticism around modeled loss ranges released in the wake of Hurricanes Harvey, Irma and Maria in 2017. So clearly, there was an opportunity to explore how the industry was using the models. What are we doing right? What could we be doing diff erently?
One thing that could improve catastrophe
model effi cacy is improving the way that they are understood. Better communication on the part of the modeling fi rms could improve outcomes. � is may sound qualitative, but we’ve got a lot of very quantitative people in the industry and they don’t always get it right.
It’s also incumbent on the modeling fi rms to continue to learn to look at their own output empirically over a long period of time and understand where they got it right, where they got it wrong and then show everybody how they’re learning from it. And likewise, underwriters need to understand the modelers are not aiming for metaphysical accuracy, but for sensible estimates and ranges. � ese are supposed to be starting points, not endpoints.
GREGORY LOWE Global Head of Resilience and Sustainability, Aon
DAVID FLANDRO Head of Global Analytics, JLT Re
THE ONE THING
WHAT ONE THING WOULD... HELP IMPROVE THE LEVEL OF UNCERTAINTY WHEN ASSESSING RISKS?

26 | EXPOSURE | Issue 05 www.rms.com/exposure www.rms.com/exposure Issue 05 | EXPOSURE | 27
How is climate change influencing natural perils and weather extremes, and what should reinsurance companies do to respond?
CLIMATE CHANGE
ARE WE
THE BASELINE?
einsurance companies may feel they are rela-tively insulated from the immediate effects of climate change on their business, given that most property
catastrophe policies are renewed on an annual basis. However, with signs that we are already moving off the historical base-line when it comes to natural perils, there is evidence to suggest that underwriters should already be selectively factoring the influence of climate change into their day-to-day decision-making.
Most climate scientists agree that some of the extreme weather anticipated by the United Nations Intergovernmental Panel on Climate Change (IPCC) in 2013 is already here and can be linked to climate change in real time via the burgeoning field of extreme weather attribution. “It’s a new area of sci-ence that has grown up in the last 10 to 15 years,” explains Dr. Robert Muir-Wood, chief research officer at RMS. “Scientists run two climate models for the whole globe, both of them starting in 1950. One keeps the atmospheric chemistry static since then, while the other reflects the actual increase in greenhouse gases. By simulating thousands of years of these alternative worlds, we can find the difference in the probability of a particular weather extreme.”
For instance, climate scientists have run their models in an effort to determine how
much the intensity of the precipitation that caused such devastating flooding during last year’s Hurricane Harvey can be attributed to anthropogenic climate change. Research conducted by scientists at the World Weather Attribution (WWA) project has found that the record rainfall produced by Harvey was at least three times more likely to be due to the influence of global warming.
This suggests, for certain perils and geog-raphies, reinsurers need to be considering the implications of an increased potential for certain climate extremes in their under-writing. “If we can’t rely on the long-term baseline, how and where do we modify our perspective?” asks Muir-Wood. “We need to attempt to answer this question peril by peril, region by region and by return period. You cannot generalize and say that all per-ils are getting worse everywhere, because they’re not. In some countries and perils there is evidence that the changes are already material, and then in many other areas the jury is out and it’s not clear.”
Keeping pace with the changeWhile the last IPCC report was published five years ago (the next one is due in 2019), there is some consensus on how climate change is beginning to influence natural perils and climate extremes. Many regional climates naturally have large variations at interan-nual and even interdecadal timescales, which makes observation of climate change, and validation of predictions, more difficult.
“There is always going to be uncertainty when it comes to climate change,” empha-sizes Swenja Surminski, head of adaptation research at the Grantham Research Institute on Climate Change and the Environment, part of the London School of Economics and Political Science (LSE). “But when you look at the scientific evidence, it’s very clear what’s happening to temperature, how the average temperature is increasing, and the impact that this can have on fundamental things, including extreme events.”
According to the World Economic Forum’s Global Risks Report 2018, “Too little has been done to mitigate climate change and ... our own analysis shows that the likelihood of missing the Paris Agreement target of limiting global warming to two degrees Cel-sius or below is greater than the likelihood of achieving it.”
The report cites extreme weather events
UNDERWRITERSSHOULD BE FACTORING THE INFLUENCE OF CLIMATE CHANGE INTO THEIR DAY-TO-DAY DECISION-MAKING
ROver the long term, the industry likely will be increasingly insuring the impact of anthropogenic climate change. One question is whether we will see “no-go” areas in the future, where the risk is simply too high for insurance and reinsurance companies to take on. As Robert Muir-Wood of RMS explains, there is often a tension between the need for (re)insurers to charge an accurate price for the risk and the political pressure to ensure cover remains available and affordable.
He cites the community at Queen’s Cove in Grand Bahama, where homes were unable to secure insurance given the repeated storm surge flood losses they have sustained over the years from a number of hurricanes. Unable to maintain a mortgage without insurance, properties were left to fall into disrepair. “Natural selection came up with a solution,” says Muir-Wood, whereby some homeowners elevated buildings on concrete stilts thereby making them once again insurable.
“In high-income, flood-prone countries, such as Holland, there has been sustained investment in excellent flood defenses,” he says. “The challenge in developing countries is there may not be the money or the political will to build adequate flood walls. In a coastal city like Jakarta, Indonesia, where the land is sinking as a result of pumping out the groundwater, it’s a huge challenge.
“It’s not black and white as to when it becomes untenable to live somewhere. People will find a way of responding to increased incidence of flooding. They may simply move their life up a level, as already happens in Venice, but insurability will be a key factor and accommodating the changes in flood hazard is going to be a shared challenge in coastal areas everywhere.”
Political pressure to maintain affordable catastrophe insurance was a major driver of the U.S. residual market, with state-backed Fair Access to Insurance Requirements (FAIR) plans providing basic property insurance for homes that are highly exposed to natural catastrophes. Examples include the California Earthquake Association, Texas Windstorm Insurance Association and Florida Citizens Property Insurance Corporation (and state reinsurer, the FHCF).
However, the financial woes experienced by FEMA’s National Flood Insurance Program (NFIP), currently the principal provider of residential flood insurance in the U.S., demonstrates the difficulties such programs face in terms of being sustainable over the long term.
With the U.K.’s Flood Re scheme, investment in disaster mitigation is a big part of the solution, explains CEO Andy Bord. However, even then he acknowledges that “for some homes at the very greatest risk of flooding, the necessary investment needed to reduce risks and costs would simply be uneconomic.”
and natural disasters as the top two “most likely” risks to happen in the next 10 years and the second- and third-highest risks (in the same order) to have the “biggest impact” over the next decade, after weapons of mass destruction. The failure of climate change mitigation and adaptation is also ranked in the top five for both likelihood and impact. It notes that 2017 was among the three hottest years on record and the hottest ever without an El Niño.
It is clear that climate change is already exacerbating climate extremes, says Sur-minski, causing dry regions to become drier and hot regions to become hotter. “By now, based on our scientific understanding and also thanks to modeling, we get a much bet-ter picture of what our current exposure is and how that might be changing over the next 10, 20, even 50 to 100 years,” she says.
“There is also an expectation we will have more freak events, when suddenly the weather produces really unexpected, very unusual phenomena,” she continues. “That’s not just climate change. It’s also tied into El Niño and other weather phenomena occur-ring, so it’s a complex mix. But right now, we’re in a much better position to under-stand what’s going on and to appreciate that climate change is having an impact.”
Pricing for climate changeFor insurance and reinsurance underwriters, the challenge is to understand the extent to which we have already deviated from the
Ice calving off the Perito Moreno Glacier at Lago Argentino in Patagonia, Argentina
THE EDGE OF INSURABILITY
MOVING OFF
28 | EXPOSURE | Issue 05 www.rms.com/exposure
historical record and to manage and price for that appropriately. It is not an easy task given the inherent variability in existing weather patterns, according to Andy Bord, CEO of Flood Re, the U.K.’s flood risk pool, which has a panel of international reinsurers.
“The existing models are calibrated against data that already includes at least some of the impact of climate change,” he says. “Some model vendors have also recently produced models that aim to assess the impact of climate change on the future level of flood risk in the U.K. We know at least one larger reinsurer has undertaken their own climate change impact analyses.
“We view improving the understanding of the potential variability of weather given today’s climate as being the immediate challenge for the insurance industry, given the relatively short-term view of markets,” he adds.
The need for underwriters to appreciate the extent to which we may have already moved off the historical baseline is com-pounded by the conflicting evidence on how climate change is influencing different per-ils. And by the counterinfluence or conflu-ence, in many cases, of naturally occurring climate patterns, such as El Niño and the Atlantic Multidecadal Oscillation (AMO).
The past two decades have seen below-normal European windstorm activ-ity, for instance, and evidence builds that the unprecedented reduction in Arctic sea ice during the autumn months is the main cause, according to Dr. Stephen Cusack, director of model development at RMS. “In turn, the sea ice declines have been driven both by the ‘polar amplification’ aspect of anthropogenic climate change and the positive phase of the AMO over the past two decades, though their relative roles are uncertain.
“The (re)insurance market right now is saying, ‘Your model has higher losses than our recent experience.’ And what we are
saying is that the recent lull is not well understood, and we are unsure how long it will last. Though for pricing future risk, the question is when, and not if, the rebound in European windstorm activity happens. Regarding anthropogenic climate change, other mechanisms will strengthen and counter the currently dominant ‘polar amplification’ process. Also, the AMO goes into positive and negative phases,” he con-tinues. “It’s been positive for the last 20 to 25 years and that’s likely to change within the next decade or so.”
And while European windstorm activity has been somewhat muted by the AMO, the same cannot be said for North Atlantic hur-ricane activity. Hurricanes Harvey, Irma and Maria (HIM) caused an estimated US$92 billion in insured losses, making 2017 the second costliest North Atlantic hurricane season, according to Swiss Re Sigma. “The North Atlantic seems to remain in an active phase of hurricane activity, irrespective of climate change influences that may come on top of it,” the study states.
While individual storms are never caused by one factor alone, stressed the Sigma study, “Some of the characteristics observed in HIM are those predicted to occur more frequently in a warmer world.” In particular, it notes the high level of rainfall over Hous-ton and hurricane intensification. While storm surge was only a marginal contributor to the losses from Hurricane Harvey, Swiss Re anticipates the probability of extreme storm surge damage in the northeastern U.S. due to higher seas will almost double in the next 40 years.
“From a hurricane perspective, we can talk about the frequency of hurricanes in a given year related to the long-term average, but what’s important from the climate change point of view is that the frequency and the intensity on both sides of the distribution are increasing,” says Dr. Pete Dailey, vice presi-dent at RMS. “This means there’s more like-lihood of quiet years and more likelihood of very active years, so you’re moving away from the mean, which is another way of thinking about moving away from the baseline.
“So, we need to make sure that we are modeling the tail of the distribution really well, and that we’re capturing the really wet years — the years where there’s a higher frequency of torrential rain in association with events that we model.”
The 5 risks most likely to happen in the next 10 years1 Extreme weather events
2 Natural disasters
3 Cyberattacks
4 Data fraud and theft
5 Failure of climate change mitigation
The 5 risks that will have the biggest impact in the next 10 years1 Weapons of mass destruction
2 Extreme weather events
3 Natural disasters
4 Failure of climate change mitigation and adaptation
5 Water crises
SOURCE: GLOBAL RISKS PERCEPTION SURVEY 2017-2018, WORLD ECONOMIC FORUM
“WE VIEW IMPROVING THE UNDERSTANDING OF THE POTENTIAL VARIABILITY OF WEATHER GIVEN TODAY’S CLIMATE AS BEING THE IMMEDIATE CHALLENGE FOR THE INSURANCE INDUSTRY, GIVEN THE RELATIVELY SHORT-TERM VIEW OF MARKETS” — ANDY BORD, FLOOD RE
TAKING CLOUD ADOPTION TO THE CORE
TECH TALK
Insurance and reinsurance companies have been more reticent than other business sectors in embracing Cloud technology. EXPOSURE explores why it is time to ditch “the comfort blanket”
he main benefits of Cloud computing are well-established and include scale, effi ciency and cost eff ectiveness. � e Cloud also offers economical access to huge amounts of
computing power, ideal to tackle the big data/big analytics challenge. And exciting inno-vations such as microservices — allowing access to prebuilt, Cloud-hosted algorithms, artifi cial intelligence (AI) and machine learn-ing applications, which can be assembled to build rapidly deployed new services — have the potential to transform the (re)insurance industry.
And yet the industry has continued to demonstrate a reluctance in moving its core services onto a Cloud-based infrastructure. While a growing number of insurance and reinsurance companies are using Cloud ser-vices (such as those off ered by Amazon Web Services, Microsoft Azure and Google Cloud) for nonessential offi ce and support functions, most have been reluctant to consider Cloud for their mission-critical infrastructure.
In its research of Cloud adoption rates in regulated industries, such as banking, insurance and health care, McKinsey found, “Many enterprises are stuck supporting both their ineffi cient traditional data-center envi-
T ronments and inadequately planned Cloud implementations that may not be as easy to manage or as aff ordable as they imagined.”
No magic bullet It also found that “lift and shift” is not enough, where companies attempt to move existing, monolithic business applications to the Cloud, expecting them to be “magically endowed with all the dynamic features.”
“We’ve come up against a lot of that when explaining the diff erence in what the RMS(one)® platform off ers,” says Farhana Alarakhiya, vice president of products at RMS. “Basically, what clients are showing us is their legacy off ering placed on a new Cloud plat-form. It’s potentially a better user interface, but it’s not really transforming the process.”
Now is the time for the market-leading (re)insurers to make that leap and really trans-form how they do business, she says. “It’s about embracing the new and diff erent and taking comfort in what other industries have been able to do. A lot of Cloud providers are making it very easy to deliver analytics on the Cloud. So, you’ve got the story of agility, scalability, predictability, compliance and secu-rity on the Cloud and access to new analytics, new algorithms, use of microservices when it comes to delivering predictive analytics.”
� is ease to tap into highly advanced analytics and new applications, unburdened from legacy systems, makes the Cloud highly attractive. Hussein Hassanali, managing part-ner at VTX Partners, a division of Volante
Global, commented: “Cloud can also enhance long-term pricing adequacy and profi tability driven by improved data capture, historical data analytics and automated links to third-party market information. Further, the ‘plug-and-play’ aspect allows you to continuously innovate by connecting to best-in-class third-party applications.”
While moving from a server-based plat-form to the Cloud can bring numerous advan-tages, there is a perceived unwillingness to put high-value data into the environment, with concerns over security and the regulatory implications that brings.
� is includes data protection rules govern-ing whether or not data can be moved across borders. “� ere are some interesting dichot-omies in terms of attitude and reality,” says Craig Beattie, analyst at Celent Consulting. “Cloud-hosting providers in western Europe and North America are more likely to have better security than (re)insurers do in their internal data centers, but the board will often not support a move to put that sort of data outside of the company’s infrastructure.
“Today, most CIOs and executive boards have moved beyond the knee-jerk fears over security, and the challenges have become more practical,” he continues. “� ey will ask, ‘What can we put in the Cloud? What does it cost to move the data around and what does it cost to get the data back? What if it fails? What does that backup look like?’”
With a hybrid Cloud solution, insur-ers wanting the ability to tap into
www.rms.com/exposure Issue 05 | EXPOSURE | 29
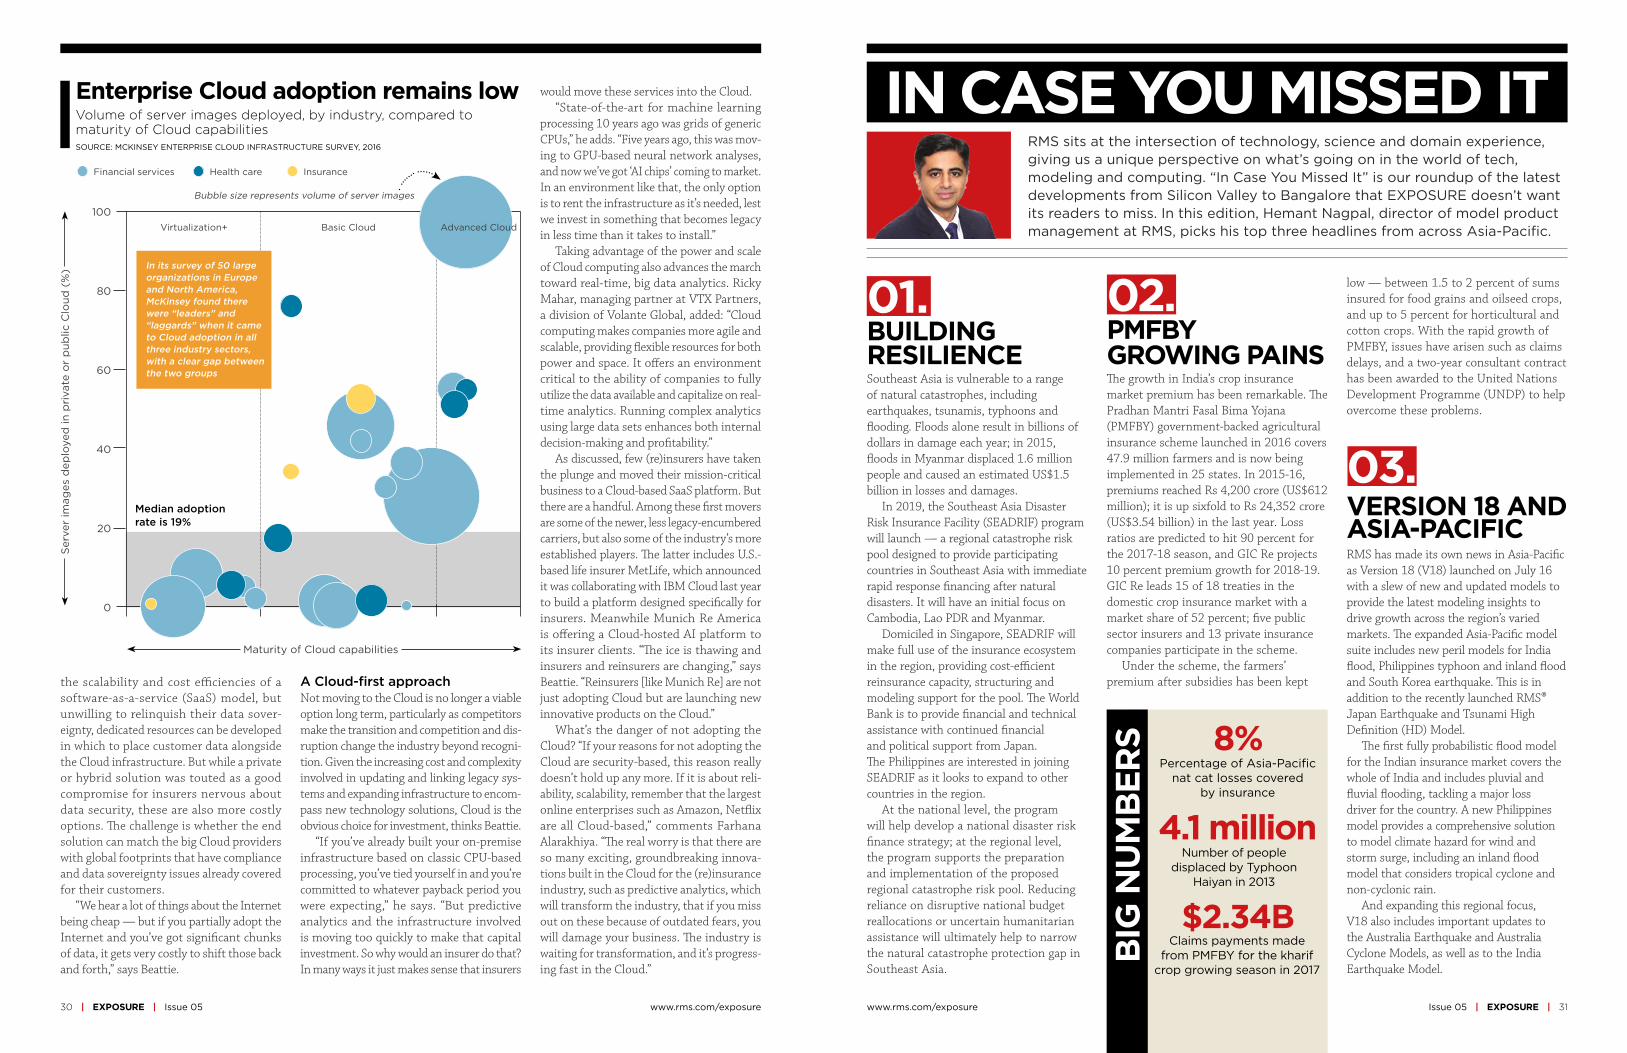
30 | EXPOSURE | Issue 05 www.rms.com/exposure
the scalability and cost effi ciencies of a software-as-a-service (SaaS) model, but unwilling to relinquish their data sover-eignty, dedicated resources can be developed in which to place customer data alongside the Cloud infrastructure. But while a private or hybrid solution was touted as a good compromise for insurers nervous about data security, these are also more costly options. � e challenge is whether the end solution can match the big Cloud providers with global footprints that have compliance and data sovereignty issues already covered for their customers.
“We hear a lot of things about the Internet being cheap — but if you partially adopt the Internet and you’ve got signifi cant chunks of data, it gets very costly to shift those back and forth,” says Beattie.
would move these services into the Cloud.“State-of-the-art for machine learning
processing 10 years ago was grids of generic CPUs,” he adds. “Five years ago, this was mov-ing to GPU-based neural network analyses, and now we’ve got ‘AI chips’ coming to market. In an environment like that, the only option is to rent the infrastructure as it’s needed, lest we invest in something that becomes legacy in less time than it takes to install.”
Taking advantage of the power and scale of Cloud computing also advances the march toward real-time, big data analytics. Ricky Mahar, managing partner at VTX Partners, a division of Volante Global, added: “Cloud computing makes companies more agile and scalable, providing fl exible resources for both power and space. It off ers an environment critical to the ability of companies to fully utilize the data available and capitalize on real-time analytics. Running complex analytics using large data sets enhances both internal decision-making and profi tability.”
As discussed, few (re)insurers have taken the plunge and moved their mission-critical business to a Cloud-based SaaS platform. But there are a handful. Among these fi rst movers are some of the newer, less legacy-encumbered carriers, but also some of the industry’s more established players. � e latter includes U.S.-based life insurer MetLife, which announced it was collaborating with IBM Cloud last year to build a platform designed specifi cally for insurers. Meanwhile Munich Re America is off ering a Cloud-hosted AI platform to its insurer clients. “� e ice is thawing and insurers and reinsurers are changing,” says Beattie. “Reinsurers [like Munich Re] are not just adopting Cloud but are launching new innovative products on the Cloud.”
What’s the danger of not adopting the Cloud? “If your reasons for not adopting the Cloud are security-based, this reason really doesn’t hold up any more. If it is about reli-ability, scalability, remember that the largest online enterprises such as Amazon, Netfl ix are all Cloud-based,” comments Farhana Alarakhiya. “� e real worry is that there are so many exciting, groundbreaking innova-tions built in the Cloud for the (re)insurance industry, such as predictive analytics, which will transform the industry, that if you miss out on these because of outdated fears, you will damage your business. � e industry is waiting for transformation, and it’s progress-ing fast in the Cloud.”
A Cloud-fi rst approachNot moving to the Cloud is no longer a viable option long term, particularly as competitors make the transition and competition and dis-ruption change the industry beyond recogni-tion. Given the increasing cost and complexity involved in updating and linking legacy sys-tems and expanding infrastructure to encom-pass new technology solutions, Cloud is the obvious choice for investment, thinks Beattie.
“If you’ve already built your on-premise infrastructure based on classic CPU-based processing, you’ve tied yourself in and you’re committed to whatever payback period you were expecting,” he says. “But predictive analytics and the infrastructure involved is moving too quickly to make that capital investment. So why would an insurer do that? In many ways it just makes sense that insurers
Enterprise Cloud adoption remains low
SOURCE: MCKINSEY ENTERPRISE CLOUD INFRASTRUCTURE SURVEY, 2016
Volume of server images deployed, by industry, compared to maturity of Cloud capabilities
Financial services Health care Insurance
Maturity of Cloud capabilities
Virtualization+
Bubble size represents volume of server images
Basic Cloud Advanced Cloud
Median adoption rate is 19%
100
80
60
40
20
0
Ser
ver
imag
es d
eplo
yed
in p
riva
te o
r p
ublic
Clo
ud (
%) In its survey of 50 large
organizations in Europe and North America, McKinsey found there were “leaders” and “laggards” when it came to Cloud adoption in all three industry sectors, with a clear gap between the two groups
www.rms.com/exposure Issue 05 | EXPOSURE | 31
IN CASE YOU MISSED IT
VERSION 18 AND ASIA-PACIFIC
PMFBY GROWING PAINS
BUILDING RESILIENCE
02.01.
Claims payments made from PMFBY for the kharif
crop growing season in 2017
Percentage of Asia-Pacifi c nat cat losses covered
by insurance
BIG
NU
MB
ERS
$2.34B
Number of people displaced by Typhoon
Haiyan in 2013
4.1 million
8%
03.
RMS has made its own news in Asia-Pacifi c as Version 18 (V18) launched on July 16 with a slew of new and updated models to provide the latest modeling insights to drive growth across the region’s varied markets. � e expanded Asia-Pacifi c model suite includes new peril models for India fl ood, Philippines typhoon and inland fl ood and South Korea earthquake. � is is in addition to the recently launched RMS® Japan Earthquake and Tsunami High Defi nition (HD) Model.
� e fi rst fully probabilistic fl ood model for the Indian insurance market covers the whole of India and includes pluvial and fl uvial fl ooding, tackling a major loss driver for the country. A new Philippines model provides a comprehensive solution to model climate hazard for wind and storm surge, including an inland fl ood model that considers tropical cyclone and non-cyclonic rain.
And expanding this regional focus, V18 also includes important updates to the Australia Earthquake and Australia Cyclone Models, as well as to the India Earthquake Model.
RMS sits at the intersection of technology, science and domain experience, giving us a unique perspective on what’s going on in the world of tech, modeling and computing. “In Case You Missed It” is our roundup of the latest developments from Silicon Valley to Bangalore that EXPOSURE doesn’t want its readers to miss. In this edition, Hemant Nagpal, director of model product management at RMS, picks his top three headlines from across Asia-Pacifi c.
Southeast Asia is vulnerable to a range of natural catastrophes, including earthquakes, tsunamis, typhoons and fl ooding. Floods alone result in billions of dollars in damage each year; in 2015, fl oods in Myanmar displaced 1.6 million people and caused an estimated US$1.5 billion in losses and damages.
In 2019, the Southeast Asia Disaster Risk Insurance Facility (SEADRIF) program will launch — a regional catastrophe risk pool designed to provide participating countries in Southeast Asia with immediate rapid response fi nancing after natural disasters. It will have an initial focus on Cambodia, Lao PDR and Myanmar.
Domiciled in Singapore, SEADRIF will make full use of the insurance ecosystem in the region, providing cost-effi cient reinsurance capacity, structuring and modeling support for the pool. � e World Bank is to provide fi nancial and technical assistance with continued fi nancial and political support from Japan. � e Philippines are interested in joining SEADRIF as it looks to expand to other countries in the region.
At the national level, the program will help develop a national disaster risk fi nance strategy; at the regional level, the program supports the preparation and implementation of the proposed regional catastrophe risk pool. Reducing reliance on disruptive national budget reallocations or uncertain humanitarian assistance will ultimately help to narrow the natural catastrophe protection gap in Southeast Asia.
� e growth in India’s crop insurance market premium has been remarkable. � e Pradhan Mantri Fasal Bima Yojana (PMFBY) government-backed agricultural insurance scheme launched in 2016 covers 47.9 million farmers and is now being implemented in 25 states. In 2015-16, premiums reached Rs 4,200 crore (US$612 million); it is up sixfold to Rs 24,352 crore (US$3.54 billion) in the last year. Loss ratios are predicted to hit 90 percent for the 2017-18 season, and GIC Re projects 10 percent premium growth for 2018-19. GIC Re leads 15 of 18 treaties in the domestic crop insurance market with a market share of 52 percent; fi ve public sector insurers and 13 private insurance companies participate in the scheme.
Under the scheme, the farmers’ premium after subsidies has been kept
low — between 1.5 to 2 percent of sums insured for food grains and oilseed crops, and up to 5 percent for horticultural and cotton crops. With the rapid growth of PMFBY, issues have arisen such as claims delays, and a two-year consultant contract has been awarded to the United Nations Development Programme (UNDP) to help overcome these problems.

RMS solutions help insurers, financial markets, corporations and public agencies evaluate and manage risks throughout the world, promoting resilient societies and a sustainable global economy.
Risk Management Solutions, Inc. 7575 Gateway Blvd. Newark, CA 94560 USAwww.rms.com
©2018 Risk Management Solutions, Inc. RMS is a registered trademark and the RMS logo is a trademark of Risk Management Solutions, Inc. All other trademarks are property of their respective owners.
EXPOSURE