Power-Optimization Method for the Implementation of IEEE 802.11 Multi-Hop Networks
18
GESTS Int’l Trans. Computer Science and Engr., Vol.60, No.1 1 ⓒGESTS-Jun.2010 Power-Optimization Method for the Imp lementation of IEEE 802.11 Multi-Hop Networks I INTRODUCTION L. N. Gumbi 1 , MO. Odhiambo 2 ,and D. Chatelain 1 1 French South African Technical Institute in Electronics Tshwane University of Technology, Private Bag X680 Pre ria 0001, South Africa {lucas.gumbi, Damien.chatelain}@fsatie.ac.za 2 Department of Electrical & Mining Engineering, university of South Africa, Private Bag X6 Florida 1710, South Africa [email protected] Abstract: In recent years the telecommunications society has witnessed an upsurge of interest in infrastructure- b as ed multi -hop communication. The fundamental reason being that multi -hop communication provides benefits such as coverage e tensions, combating of shadowing at high radio frequencies and reduced infrastructure deployment costs. It is envisioned that the WLAN technology will likely be merged with future wireless broadband technologies such as 3G, for the provisioning of pervasive and user seamless communication, however, WLANs are limited in range. One standard approach to extending the range of WLANs is to use multi -hop communication systems, but, in IEEE 802.11, multi -hop communication systems are not optimized in terms o ower consumption. This paper presents a power- efficient multi -hop communication algorithm (PMCA) for the implementation of IEEE 802.11 multi - hop networks. The proposed scheme estimates the number of nodes, transmit power level and the transmitter-receiver separation distance based on transmission distance, receiver sensitivity, energy consumption and infrastru ture costs. Simulation results show that our algorithm significantly optimizes power consumption as compared to the conventional multi -hop communication. Key words: Relays, Power Consumption, IEEE 802.11b Networks, Multi -hop Communication. here has been a phenomenal spate of interest in multi -hop communication in recent years. This is indicated by the seed concept in 3GPP, mesh networks in IEEE 802.16, and cov age extensions in HiperLAN/2 through relays [3]. A multi - hop wireless network is one in which a packet may have to traverse multiple consec tive wireless links in order to reach its destination [4]. Over the years multi -hop communication has manifested itself under numerous forms, such as developed several decades ago for military applications, and more recently networks which refer to a collection of hosts communicating over a wireless chan . Multi-hop communication provides benefits such as range extension, combating of shadowing at high frequencies, network partitioning avoidance and reduced infrastructure de oyment costs. The IEEE 802.11 WLANs are becoming increasingly more p pular, as they are envisioned as the cornerstone of future wireless broadband communications, which are character by very high data rates. The merging of such heterogeneous technologies may form a network with an increased syst m capacity and hence improved system performance. The resulting network may use WLAN techniques for peer-to-peer communication or serve as relay networks to extend the range and increase the capacity of future wireless broadband net orks, which provides links to the wired Internet [1]. WLANs were fundamentally designed to provide broadband wireless a ess to home and office users, however that notion has changed now, since it is clear that they will play an integral part in future wireless broadband networks. WLANs use traditional LAN technology with a wireless interface, and provide rela ively high-speed data communication (up-to 11Mbps for IEEE 802.11b) i n small areas such as a building or an office [2]. The w eless connection allows users to roam in a bounded area while still connected to the networks. Even though IEEE 802.11 families of WLAN provide a low cost broadband wireless access, they have a limited transmission range. One way to extend the range is to use multi-hop communication. The typical way of implementing multi -hop communication in static networks, is to randomly select node transmit power levels (normally maximum transmit power) that can link the nodes together to cover a specific range (conventional multi -hop system). This mechanism result in higher consumption of transmit pow and energy, and a higher probability of interference. Power is a scarce resource in wireless networks, consequently we cannot afford its wastage. In IEEE 802.11, the main standard approach used for tr it power optimization is varying the transmit power level to the minimum level that still achieves correct reception of packets despite the intervening interference [13]. This approach is realized through TPC (transmit power control) schemes veloped within the IEEE 802.11 framework [4][14][15]. However, the work done by [14][15][16] indicates that the TPC s mes have the following disadvantages: 1. Most TPC schemes use different transmit powers on different nodes, this creates asymmetric links that result in more collisions and consequently network throughput degradation. 2. Applying TPC schemes on real multi -hop networks raises unexpected issues not revealed during simulations. 3. Most TPC schemes cannot be implemented efficiently on urrent wireless IEEE 802.11 devices because of hardware, driver and operating systems issues. In essence, the existing IEEE 802.11 devices do not fulfil the requirements of transmit power control algorithms. T Packet R adio Networks ad hoc
-
Upload
unisouthafr -
Category
Documents
-
view
4 -
download
0
Transcript of Power-Optimization Method for the Implementation of IEEE 802.11 Multi-Hop Networks
GESTS Int’l Trans. Computer Science and Engr., Vol.60, No.1 1
ⓒGESTS-Jun.2010
Power-Optimization Method for the Implementation of IEEE 802.11 Multi-HopNetworks
I INTRODUCTION
L. N. Gumbi1, MO. Odhiambo2,and D. Chatelain1
1French South African Technical Institute in ElectronicsTshwane University of Technology, Private Bag X680 Pre ria 0001, South Africa
{lucas.gumbi, Damien.chatelain}@fsatie.ac.za2Department of Electrical & Mining Engineering, university of South Africa,
Private Bag X6 Florida 1710, South [email protected]
Abstract: In recent years the telecommunications society has witnessed an upsurge of interest in infrastructure-based multi-hopcommunication. The fundamental reason being that multi-hop communication provides benefits such as coverage e tensions, combating ofshadowing at high radio frequencies and reduced infrastructure deployment costs. It is envisioned that the WLAN technology will likely bemerged with future wireless broadband technologies such as 3G, for the provisioning of pervasive and user seamless communication,however, WLANs are limited in range. One standard approach to extending the range of WLANs is to use multi-hop communicationsystems, but, in IEEE 802.11, multi-hop communication systems are not optimized in terms o ower consumption. This paper presents apower-efficient multi-hop communication algorithm (PMCA) for the implementation of IEEE 802.11 multi-hop networks. The proposedscheme estimates the number of nodes, transmit power level and the transmitter-receiver separation distance based on transmission distance,receiver sensitivity, energy consumption and infrastru ture costs. Simulation results show that our algorithm significantly optimizes powerconsumption as compared to the conventional multi-hop communication.
Key words: Relays, Power Consumption, IEEE 802.11b Networks, Multi-hop Communication.
here has been a phenomenal spate of interest in multi-hop communication in recent years. This is indicated by the seedconcept in 3GPP, mesh networks in IEEE 802.16, and cov age extensions in HiperLAN/2 through relays [3]. A multi-hop wireless network is one in which a packet may have to traverse multiple consec tive wireless links in order to reach
its destination [4]. Over the years multi-hop communication has manifested itself under numerous forms, such asdeveloped several decades ago for military applications, and more recently networks which refer to a
collection of hosts communicating over a wireless chan . Multi-hop communication provides benefits such as rangeextension, combating of shadowing at high frequencies, network partitioning avoidance and reduced infrastructure de oymentcosts.The IEEE 802.11 WLANs are becoming increasingly more p pular, as they are envisioned as the cornerstone of futurewireless broadband communications, which are character by very high data rates. The merging of such heterogeneoustechnologies may form a network with an increased syst m capacity and hence improved system performance. The resultingnetwork may use WLAN techniques for peer-to-peer communication or serve as relay networks to extend the range andincrease the capacity of future wireless broadband net orks, which provides links to the wired Internet [1]. WLANs werefundamentally designed to provide broadband wireless a ess to home and office users, however that notion has changed now,since it is clear that they will play an integral part in future wireless broadband networks. WLANs use traditional LANtechnology with a wireless interface, and provide rela ively high-speed data communication (up-to 11Mbps for IEEE802.11b) in small areas such as a building or an office [2]. The w eless connection allows users to roam in a bounded areawhile still connected to the networks. Even though IEEE 802.11 families of WLAN provide a low cost broadband wirelessaccess, they have a limited transmission range. One way to extend the range is to use multi-hop communication. The typicalway of implementing multi-hop communication in static networks, is to randomly select node transmit power levels (normallymaximum transmit power) that can link the nodes together to cover a specific range (conventional multi-hop system). Thismechanism result in higher consumption of transmit pow and energy, and a higher probability of interference. Power is ascarce resource in wireless networks, consequently we cannot afford its wastage.In IEEE 802.11, the main standard approach used for tr it power optimization is varying the transmit power level to theminimum level that still achieves correct reception of packets despite the intervening interference [13]. This approach isrealized through TPC (transmit power control) schemes veloped within the IEEE 802.11 framework [4][14][15]. However,the work done by [14][15][16] indicates that the TPC s mes have the following disadvantages:
1. Most TPC schemes use different transmit powers on different nodes, this creates asymmetric links that result in morecollisions and consequently network throughput degradation.
2. Applying TPC schemes on real multi-hop networks raises unexpected issues not revealed during simulations.3. Most TPC schemes cannot be implemented efficiently on urrent wireless IEEE 802.11 devices because of hardware,
driver and operating systems issues. In essence, the existing IEEE 802.11 devices do not fulfil the requirements oftransmit power control algorithms.
TPacket
Radio Networks ad hoc
2 Power-Optimization Method for the Implementation of IEEE …
ⓒGESTS-Jun.2010
The latter TPC issues clearly indicate that there is a need for a practically viable, power efficient and cost effective solution topower optimisation problems of IEEE 802.11 multi-hop networks. This paper presents an efficient power consumption multi-hop communication algorithm for IEEE 802.11b. Unlike t ventional multi-hop system and the latter TPC schemes, ourproposed scheme estimate the number of nodes, transmit power level and the T-R separation distance based on transmissionrange, receiver sensitivity, energy consumption and inf astructure costs to optimize transmit power and subsequently energyconsumption.In this paper we consider the IEEE 802.11b standard, w h supports 1Mbps, 2Mbps, 5.5Mbps and 11Mbps data rates. Thestandard is chosen for its popularity and widespread use in the WLAN infrastructure.The rest of the paper is organized as follows. In Sect on II, we analyze multi-hop communication with regard to transmitpower. Section III presents the modeling of the IEEE 802.11b performance metrics, i.e. received signal strength (RSS), Signal-to-noise ratio (SNR), Bit Error Rate (BER), throughput an the wireless Channel. The proposed algorithm is presented inSection IV. In Section V we evaluate the performance of the algorithm. Finally, Section VI concludes the paper.
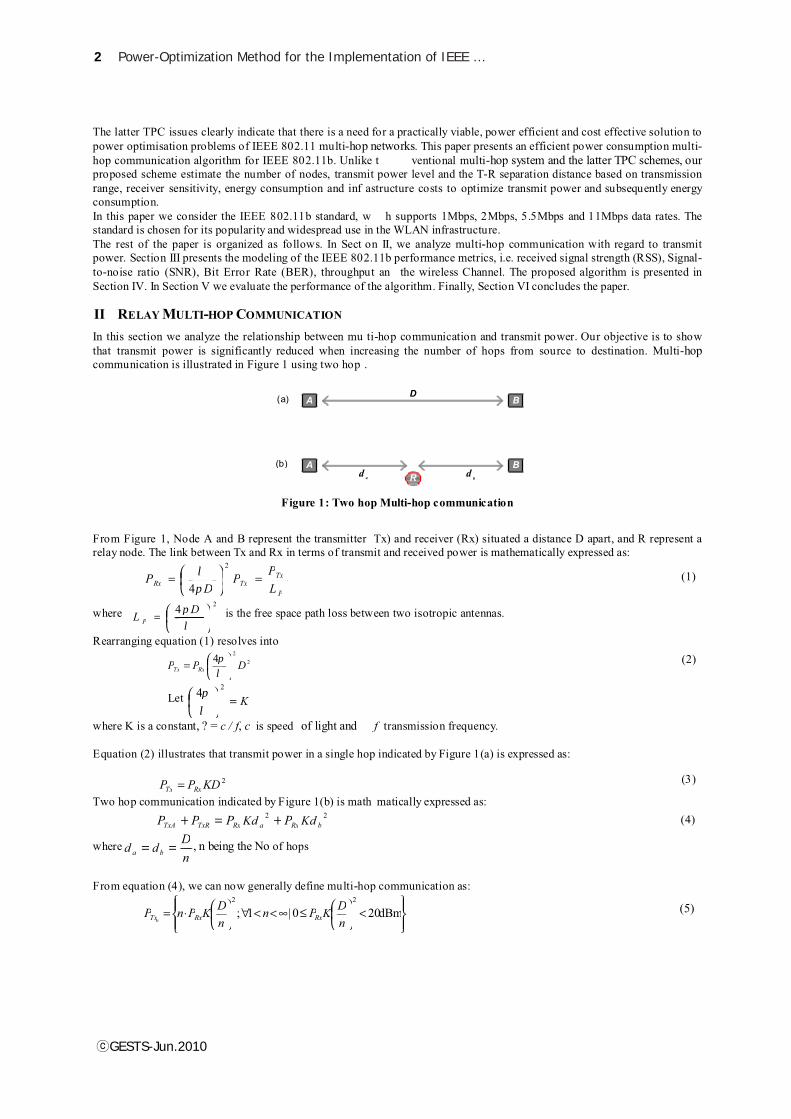
In this section we analyze the relationship between mu ti-hop communication and transmit power. Our objective is to showthat transmit power is significantly reduced when increasing the number of hops from source to destination. Multi-hopcommunication is illustrated in Figure 1 using two hop .
From Figure 1, Node A and B represent the transmitter Tx) and receiver (Rx) situated a distance D apart, and R represent arelay node. The link between Tx and Rx in terms of transmit and received power is mathematically expressed as:
2
4(1)
where24 is the free space path loss between two isotropic antennas.
Rearranging equation (1) resolves into2
24 (2)
Let24
where K is a constant, ? = , is speed of light and transmission frequency.
Equation (2) illustrates that transmit power in a single hop indicated by Figure 1(a) is expressed as:
2 (3)
Two hop communication indicated by Figure 1(b) is math matically expressed as:22 (4)
where , n being the No of hops
From equation (4), we can now generally define multi-hop communication as:
dBm200|1;22
(5)
II RELAYMULTI-HOP COMMUNICATION
Figure 1: Two hop Multi-hop communication
AR
B
DA B
ad bd
(a)
(b)
P
TxTxRx L
PPD
P
DL P
DPP RxTx
K
c / f c f
KDPP RxTx
bRxaRxTxRTxA KdPKdPPP
nD
dd ba
nDKPn
nDKPnP RxRxTxn
=⎟⎠⎞⎜
⎝⎛=
⎠⎞⎜
⎝⎛=
⎟⎠⎞⎜
⎝⎛=
=⎟⎠⎞⎜
⎝⎛
=
+=+
==
⎪⎭
⎪⎬⎫
⎪⎩
⎪⎨⎧
<⎟⎠⎞⎜
⎝⎛≤∞<<∀⎟
⎠⎞⎜
⎝⎛⋅=
p
l
l
p
lp
l
p
GESTS Int’l Trans. Computer Science and Engr., Vol.60, No.1 3
ⓒGESTS-Jun.2010
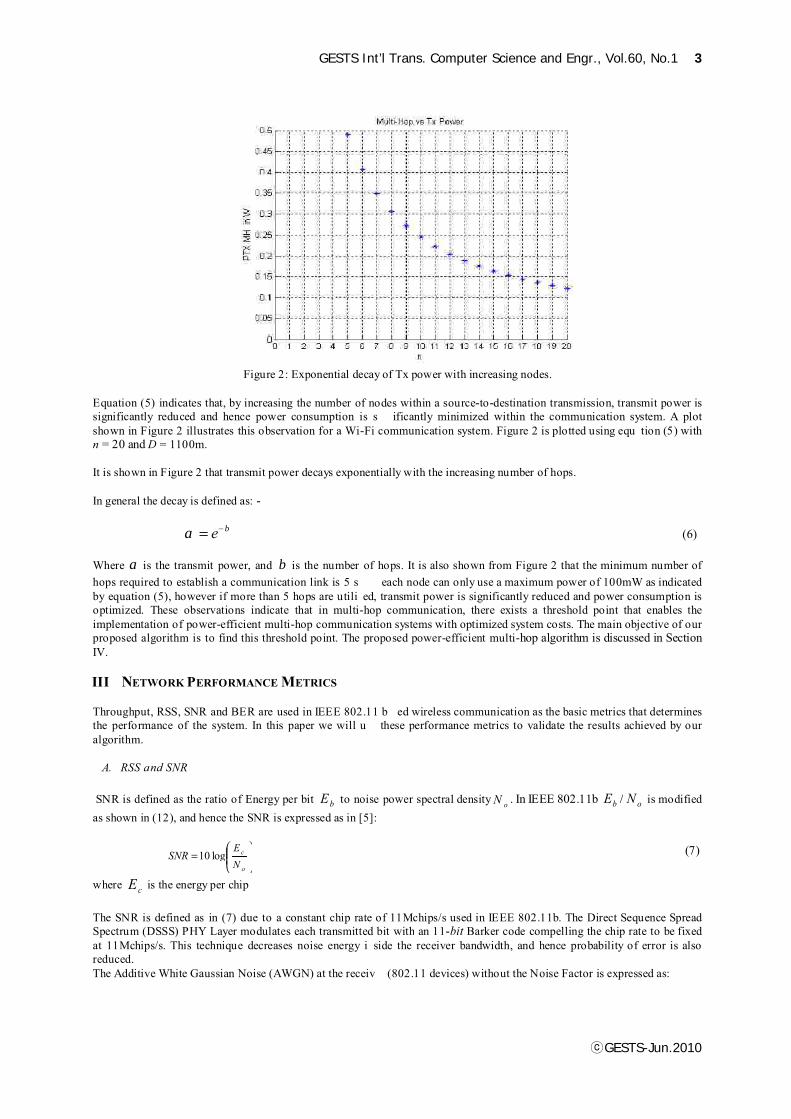
Figure 2: Exponential decay of Tx power with increasing nodes.
Equation (5) indicates that, by increasing the number of nodes within a source-to-destination transmission, transmit power issignificantly reduced and hence power consumption is s ificantly minimized within the communication system. A plotshown in Figure 2 illustrates this observation for a Wi-Fi communication system. Figure 2 is plotted using equ tion (5) with= 20 and = 1100m.
It is shown in Figure 2 that transmit power decays exponentially with the increasing number of hops.
In general the decay is defined as: -
(6)
Where is the transmit power, and is the number of hops. It is also shown from Figure 2 that the minimum number ofhops required to establish a communication link is 5 s each node can only use a maximum power of 100mW as indicatedby equation (5), however if more than 5 hops are utili ed, transmit power is significantly reduced and power consumption isoptimized. These observations indicate that in multi-hop communication, there exists a threshold point that enables theimplementation of power-efficient multi-hop communication systems with optimized system costs. The main objective of ourproposed algorithm is to find this threshold point. The proposed power-efficient multi-hop algorithm is discussed in SectionIV.
Throughput, RSS, SNR and BER are used in IEEE 802.11 b ed wireless communication as the basic metrics that determinesthe performance of the system. In this paper we will u these performance metrics to validate the results achieved by ouralgorithm.
SNR is defined as the ratio of Energy per bit to noise power spectral density . In IEEE 802.11b / is modifiedas shown in (12), and hence the SNR is expressed as in [5]:
log10 (7)
where is the energy per chip
The SNR is defined as in (7) due to a constant chip rate of 11Mchips/s used in IEEE 802.11b. The Direct Sequence SpreadSpectrum (DSSS) PHY Layer modulates each transmitted bit with an 11- Barker code compelling the chip rate to be fixedat 11Mchips/s. This technique decreases noise energy i side the receiver bandwidth, and hence probability of error is alsoreduced.The Additive White Gaussian Noise (AWGN) at the receiv (802.11 devices) without the Noise Factor is expressed as:
n D
e
A. RSS and SNR
bE oN ob NE
o
c
NE
SNR
cE
bit
ba
a b
−=
⎟⎟⎠
⎞⎜⎜⎝
⎛=
III NETWORKPERFORMANCEMETRICS

4 Power-Optimization Method for the Implementation of IEEE …
ⓒGESTS-Jun.2010
(8)
where k = Boltzmann constant = 1.38 * 10-23 J/°K/HzT = ambient temperature = 20 °C = 293°KB = bandwidth of receiver = 18 MHz
Therefore
(9)
where is the received signal strength expressed as in equation (1)
The BER (Bit Error Probability) is used as the standard measure of the quality of digital signals in wireless communicationsystems. It indicates the ratio of the number of bits received in error vs the total number of bits sent. The higher the bit errorprobability, the poor the reliability of a communication system. For a given SNR, the bit error probability can be easilyattained for the IEEE 802.11b modulation schemes (DBPS K, and CCK).
Figure 3: PLCP Protocol Data Unit (PPDU) Format [7]
The IEEE 802.11 frame format is shown in Figure 3. The Physical Layer Convergence Procedure (PLCP) Preamble and thePLCP Header are transmitted using DBPSK modulation at a transmission rate of 1Mbps and the MPDU (MAC Protocol DataUnit) is transmitted on the chosen rate among 1, 2, 5.5 and 11Mbps [8].The is mathematically expressed as:
___ 111 (9)
where _ is the physical layer overhead error probability and _ the MPDU error probability.
8241__ 11 (10)
where 1_ is the when transmitting physical layer overhead.
8282__ 11 (11)
where 2_ is the when transmitting the MPDU.
To express 1_ and 2_ , / is derived from / using the 11- Barker spreading sequence. The
Barker sequence modifies / to the following equation.
1111 (12)
The 1_ and 2_ is now derived from (12) for IEEE 802.11b modulation s es.
For 1 Mbps DBPSK, 1_ is expressed as:
111_(13)
This equation applies to every operational mode since is also used for physical layer overhead information transmission.
kTBNo
oNRSS
SNR
RSS
B. Bit Error Probability
frame error probability
errorMACerrorphyerrorframe PPP
errorphyP errorMACP
errorbiterrorphy PP
errorbitP bit error probability
MSDUerrorbiterrorMAC PP
errorbitP bit error probability
erro rb itP errorbitP oc NE ob NE bit
ob NE
SNRNE
NE
o
c
DBPSKo
b
errorbitP errorbitP
erro rb itPSNRQP errorbit
=
=
( ) ( )−⋅−−=
( ) ⋅−−=
( )( )⋅+−−=
⋅=⋅=⎟⎟⎠
⎞⎜⎜⎝
⎛
( )⋅=

GESTS Int’l Trans. Computer Science and Engr., Vol.60, No.1 5
ⓒGESTS-Jun.2010
For 2 Mbps DQPSK, 2_ is expressed as:
5.52_(14)
For 5.5 Mbps CCK5.5, 2_ is expressed as:
5.0,11min 25.02_ (15)
where 16814
For 11 Mbps CCK11, 2_ is expressed as:
5.0,11min 8/12_
(16)
where
161224
10168174
16814
The Q function is defined as the area under the tail o the Gaussian probability density function with zero mean and unitvariance. It is expressed as:
2
2
21)( (17)
In this subsection we present an analysis of the IEEE 802.11b throughp t using similar approach as in [7] and [8]. Throughputis analyzed under Distributed Coordination Function (DCF) MAC layer scheme illustrated in Figure 4. In this paper weconsider the same parameters, assumptions and conditions considered in [7] and [8].
Figure 4: IEEE 802.11 MAC Layer DCF Operation
To model the throughput we need to calculate the average time to transmit a single frame. The average transmission time for asingle frame is dependent on the following
The time taken to successfully transmit a single frameThe time taken between two consecutive frame transmissions if there exists a failed frame transmission
As shown in Figure 4, the time taken to successfully t ansmit a frame is defined as:
)()( (18)
where = the number of consecutive unsuccessful transmissions.= Distributed Inter Frame Space period= Short Inter Frame Space period)( = Backoff Time Interval
errorbitP
SNRQP erro rb it
errorbitPSERP errorbit
SNRQSNRQSER
errorbitP
SERP erro rb it
SNRQSNRQ
SNRQSNRQ
SNRQSNRQSER
dtexQx
t
C. IEEE 802.11b Throughput Analysis
sTSIFSTiTDIFSiT ackda taback o ffS
iDIFSSIFS
iTbackof f
( )⋅=
( )( )−−=( ) ( )⋅+⋅⋅=
( )( )−−=
( ) ( )( ) ( )
( ) ( )⋅+⋅⋅+⋅⋅+⋅⋅+
⋅+⋅⋅=
∫∞
=
[ ]++++=
p
m
1.2.
6 Power-Optimization Method for the Implementation of IEEE …
ⓒGESTS-Jun.2010
dataT
ackT
dataT ackT
sMbpstxrMSDUtPhytPhyT PLCPheaderlePLCPpreambdata s
MbpstxrtPhytPhyT PLCPheaderlePLCPpreamback
txrlePLCPpreambtPhy PLCPheadertPhy
iTbackoff
isSLOTCW
iTi
backoff
isSLOTCWiTbackoff
sSLOTTSIFSTiTDIFSiT ackdatabackofff
siTjTppTTi
S
i
jf
iSfram e
MbpsT
MSDUThroughputfram e
D. Channel Modeling
ddndPLdBPL
d d n
= Data frame transmission duration
= Acknowledgement frame transmission duration.
and are defined as:
][8*28 (19) 814 (19)
where = Transmission rate (1,2,5.5 or 11Mbps)and = Physical layer overhead information.
MAC Service Data Unit (MSDU) = Information passed from IP layer to MAC layer.
)( is expressed as:
60*2
1)1min(2)( (20)
Or
6*2max)( (21)
Secondly, if the frame transmission fails then the time between two consecutive frame transmissions is defined as:
)()()( (22)
By using (18) and (22) we derive the average transmission time for a single me as:
1
1
0)()(1)0( (23)
Throughput is then finally modeled as:
8* (24)
In a wireless environment, the RSS is largely influenc d by transmit power, large-scale path loss and small-scale multi-pathfading. Path loss determines the mean RSS as a functio of distance. Multi-path fading is caused by the superposition ofmultiple in-phase and out-of-phase copies of the original transmitted signal. It causes rapid fluctuations in the RSS over veryshort time scales [9]. Since we are dealing with fixed nodes we do not consider multi-path fading in this paper, because thereis relatively no movement between the sender and the r eiver.Path loss is a fundamental and very important factor in the design or simulations of wireless systems. It i e link between thetransmitter and the receiver. There are several well-established mathematical models for path loss. In this paper we considerthe log-distance path loss model described in [10].
00 log10)()( (25)
where 0 is the close-in reference distance, the distance between the transmitter and the receiver, and the path lossexponent defined in [10].
In this section, we present the implementation of our proposed algorithm. The analysis presented in section II, has shown thatincreasing the number of hops within a source to destination transmission reduces power consum . However, it was alsoindicated that increasing the number of hops result in increased infrastructure costs, which in turn increases the overall systemcosts. Thus, there exists a point that optimizes both power consumption and system costs. Our pro osed algorithm is designedto establish this threshold point. Its principle is to estimate the number of nodes, transmit power level and the T-R separationdistance of nodes based on transmission distance, receiver sensitivity, energy consumption and infrastructure costs.
( )⎠
⎞⎜⎜⎝
⎛ +++= [ ]⎠
⎞⎜⎜⎝
⎛ ⋅++=
[ ] <≤⎟⎟⎠
⎞⎜⎜⎝
⎛ −+=
[ ] ≥⎠⎞⎜
⎝⎛=
+++++=
( ) [ ]∑ ∑+∞
=
−
=⎥⎦
⎤⎢⎣
⎡+−+=
⎠
⎞⎜⎜⎝
⎛=
⎠
⎞⎜⎜⎝
⎛⋅⋅+=
m m
m
m
m
m
IV POWER EFFICIENTMULTI-HOP ALGORITHM
GESTS Int’l Trans. Computer Science and Engr., Vol.60, No.1 7
ⓒGESTS-Jun.2010
A. Proposed Algorithm
jiCijjiC PPEptDPPPij
iNi
iNnj
ji
Thresholdifif
CC
CC
NP
NP
ij
ij
MultihopOptimized-UniMultihopOptimizedjCoststureInfrastrucN c
iP jP ijD
CE CN
S e t I n p u t P a r a m e te r s
E n te r T x m i t d i s ta n c e
kh o p k
kh o p
k
k
k
h o ph o ph o p
kh o p
kh o pkh o p
O p t im i z e dh o p k
kh o p
P a t h lo s s ex p o n en tR e ce iv e S en s it iv i tyE n e r g y C o s tN o d e C o s tD u r a t io n
func_block1func_block2
func_block3
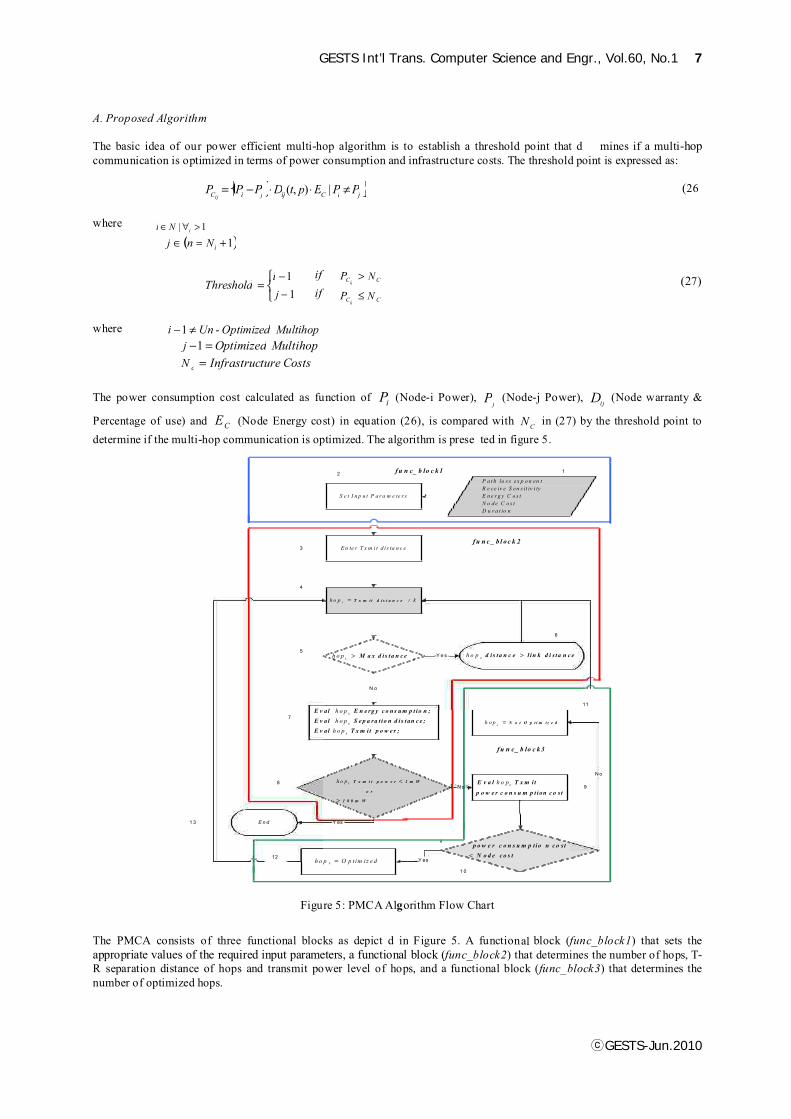
The basic idea of our power efficient multi-hop algorithm is to establish a threshold point that d mines if a multi-hopcommunication is optimized in terms of power consumption and infrastructure costs. The threshold point is expressed as:
|),( (26
where 1|
1
11 (27)
where 11
The power consumption cost calculated as function of (Node-i Power), (Node-j Power), (Node warranty &
Percentage of use) and (Node Energy cost) in equation (26), is compared with in (27) by the threshold point todetermine if the multi-hop communication is optimized. The algorithm is prese ted in figure 5.
Figure 5: PMCAAl orithm Flow Chart
The PMCA consists of three functional blocks as depict d in Figure 5. A functional block ( ) that sets theappropriate values of the required input parameters, a functional block ( ) that determines the number of hops, T-R separation distance of hops and transmit power level of hops, and a functional block ( ) that determines thenumber of optimized hops.
( ){ }≠⋅⋅−=
>∀∈
( )+=∈
⎩⎨⎧
−−
=≤
>
≠−=−
=
=
> >
>
<
<=
=
/d i s t a n c eT x m i t
d i s ta n c eM a x
p o w e r ;T x m i tE v ald i s tan c e ;S e p a ra t io nE v al
n ;c o n s um p t ioE n e rg yE v al
d i s ta n c el in kd i s ta n c e
1 0 0 m W
o r
1 m Wp o w e rT x m i t
c o s tnc o n s u m p t iop o w e r
T x m i tE v a l
c o s tN o d ec o s tnc o n s u m p t iop o w e r
O p t i m i z e dN o t
fu n c_ b lo c k1
fu n c _ b l o c k 2
fu n c_ b lo c k3
Y e s
N o
No
Y es
No
Y es
2 1
3
4
5
6
7
11
89
12
1 0
1 3 E n d
g
8 Power-Optimization Method for the Implementation of IEEE …
ⓒGESTS-Jun.2010
In the path loss exponent, receiver sensitivity and node adius are required as inputs. The path loss isrepresentative of the environmental factors affecting he transmitted signal. The receiver sensitivity is an indicatio of theminimum signal required by the receiver to receive data at a specific data rate (throughput) given the path loss. For a givenreceiver sensitivity and the path loss, a specific tra smission range is achieved. The node radius is representative of this range.The receiver sensitivity and node radius are set for a single hop link in accordance with the maximum transmit power.
In the algorithm determines the number of hops for a specific transmission distance based on the single hop lparameter settings ( . The numbers of hops are designated , where is expressed as: -
:| (28)
The energy consumption, T-R separation distance between nodes and transmit power levels of nodes are then determined.
In the algorithm determines the power consumption cost ba d on equation (26) and utilizes the inequation (27) to determine optimized and un-optimized number of hops
In this section we evaluate the performance of the PMCA algorithm by conducting a comparative study. We compare a multi-hop communication system implemented conventionally and a multi-hop communication system implemented using thePMCA algorithm in order to validate the performance of the PMCA algorithm. All simulation tests were run in Matlab [12].
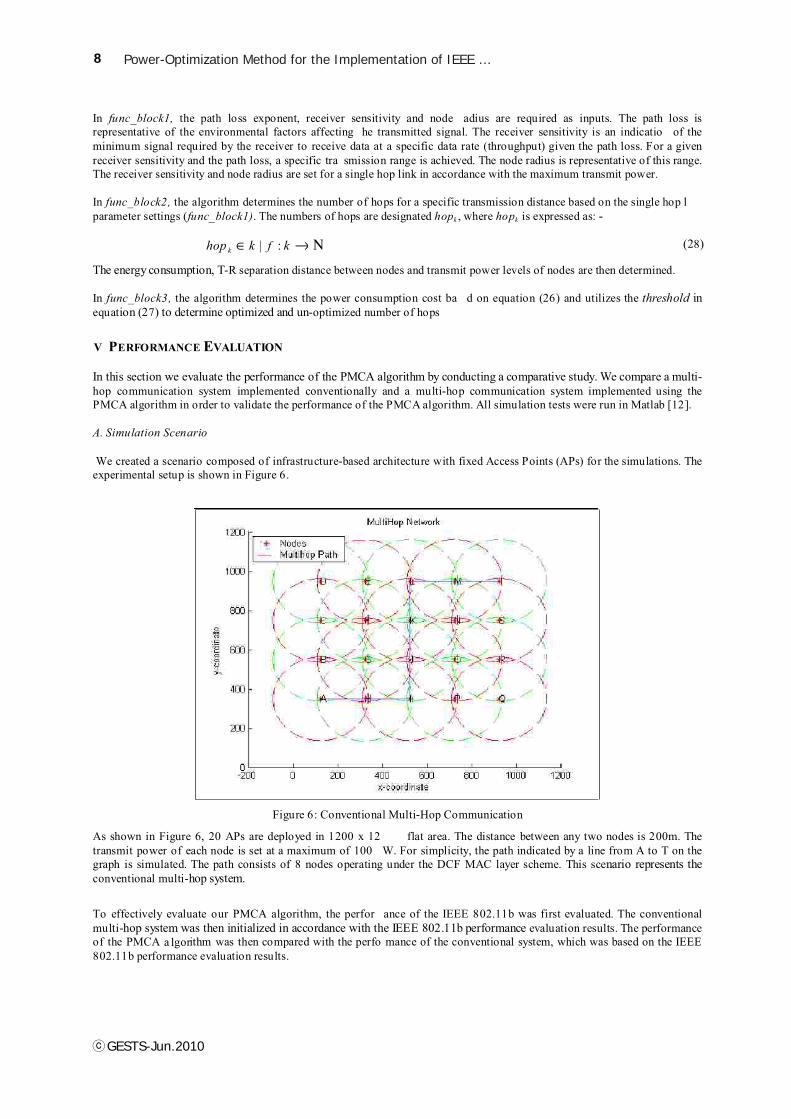
We created a scenario composed of infrastructure-based architecture with fixed Access Points (APs) for the simulations. Theexperimental setup is shown in Figure 6.
Figure 6: Conventional Multi-Hop Communication
As shown in Figure 6, 20 APs are deployed in 1200 x 12 flat area. The distance between any two nodes is 200m. Thetransmit power of each node is set at a maximum of 100 W. For simplicity, the path indicated by a line from A to T on thegraph is simulated. The path consists of 8 nodes operating under the DCF MAC layer scheme. This scenario represents theconventional multi-hop system.
To effectively evaluate our PMCA algorithm, the perfor ance of the IEEE 802.11b was first evaluated. The conventionalmulti-hop system was then initialized in accordance with the IEEE 802.11b performance evaluation results. The performanceof the PMCA a lgorithm was then compared with the perfo mance of the conventional system, which was based on the IEEE802.11b performance evaluation results.
func_block1,
func_block2,func_block1) hopk hopk
kfkhop k
func_block3, threshold
A. Simulation Scenario
Ν→∈
V PERFORMANCE EVALUATION
GESTS Int’l Trans. Computer Science and Engr., Vol.60, No.1 9
ⓒGESTS-Jun.2010
B. Simulation Results
1. Simulation Parameter settings
2. Propagation Model
n
3. IEEE 802.11b Performance evaluation
Tframe
This subsection provides results for the PMCA algorithm based on the previously discussed simulation scenario.
The simulation parameter settings for IEEE 802.11b and Conventional multi-hop system performance evaluation aredescribed in table 1 below. The path loss exponent, node radius and node transmit power rameters are set in accordance withthe scenario depicted in Figure 6.
Table 1: Simulation Parameters
The IEEE 802.11b performance metrics models described in section III are implemented in MATLAB utilizing the parametersshown in table 1.
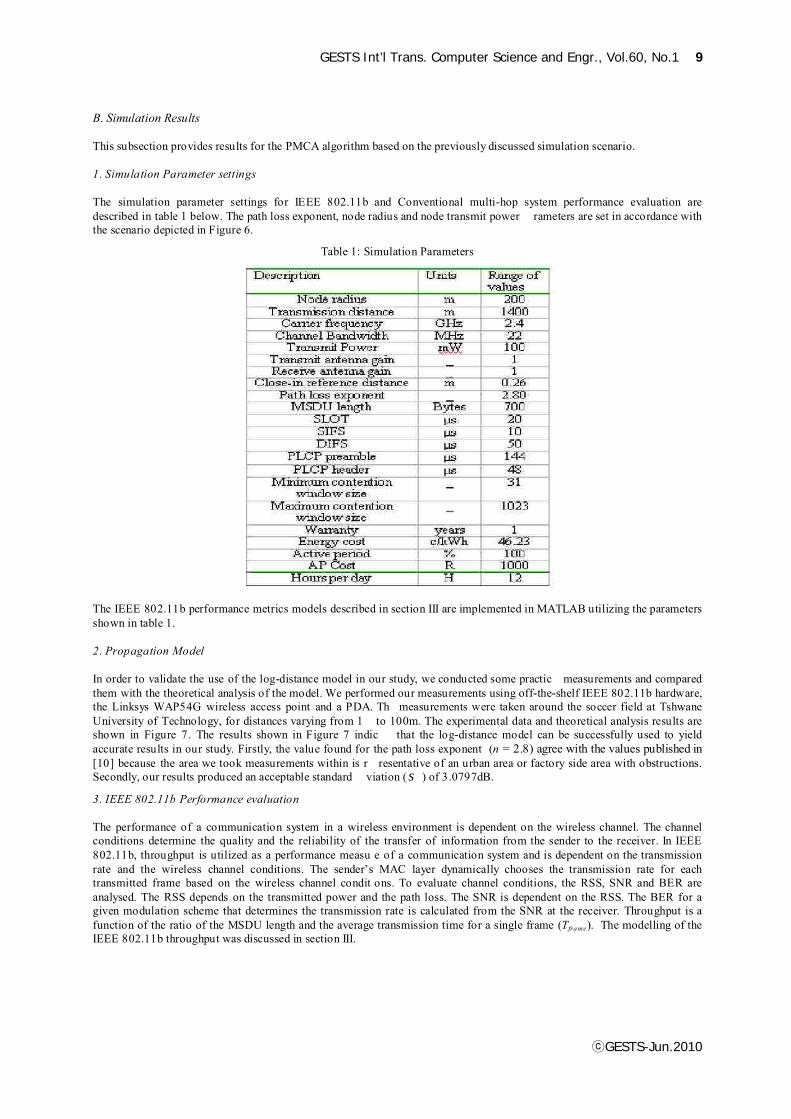
In order to validate the use of the log-distance model in our study, we conducted some practic measurements and comparedthem with the theoretical analysis of the model. We performed our measurements using off-the-shelf IEEE 802.11b hardware,the Linksys WAP54G wireless access point and a PDA. Th measurements were taken around the soccer field at TshwaneUniversity of Technology, for distances varying from 1 to 100m. The experimental data and theoretical analysis results areshown in Figure 7. The results shown in Figure 7 indic that the log-distance model can be successfully used to yieldaccurate results in our study. Firstly, the value found for the path loss exponent ( = 2.8) agree with the values published in[10] because the area we took measurements within is r resentative of an urban area or factory side area with obstructions.Secondly, our results produced an acceptable standard viation ( ) of 3.0797dB.
The performance of a communication system in a wireless environment is dependent on the wireless channel. The channelconditions determine the quality and the reliability of the transfer of information from the sender to the receiver. In IEEE802.11b, throughput is utilized as a performance measu e of a communication system and is dependent on the transmissionrate and the wireless channel conditions. The sender’s MAC layer dynamically chooses the transmission rate for eachtransmitted frame based on the wireless channel condit ons. To evaluate channel conditions, the RSS, SNR and BER areanalysed. The RSS depends on the transmitted power and the path loss. The SNR is dependent on the RSS. The BER for agiven modulation scheme that determines the transmission rate is calculated from the SNR at the receiver. Throughput is afunction of the ratio of the MSDU length and the average transmission time for a single frame ( ). The modelling of theIEEE 802.11b throughput was discussed in section III.
s
10 Power-Optimization Method for the Implementation of IEEE …
ⓒGESTS-Jun.2010
Figure 7: Comparison of Measured Path loss and Theoretical Path loss
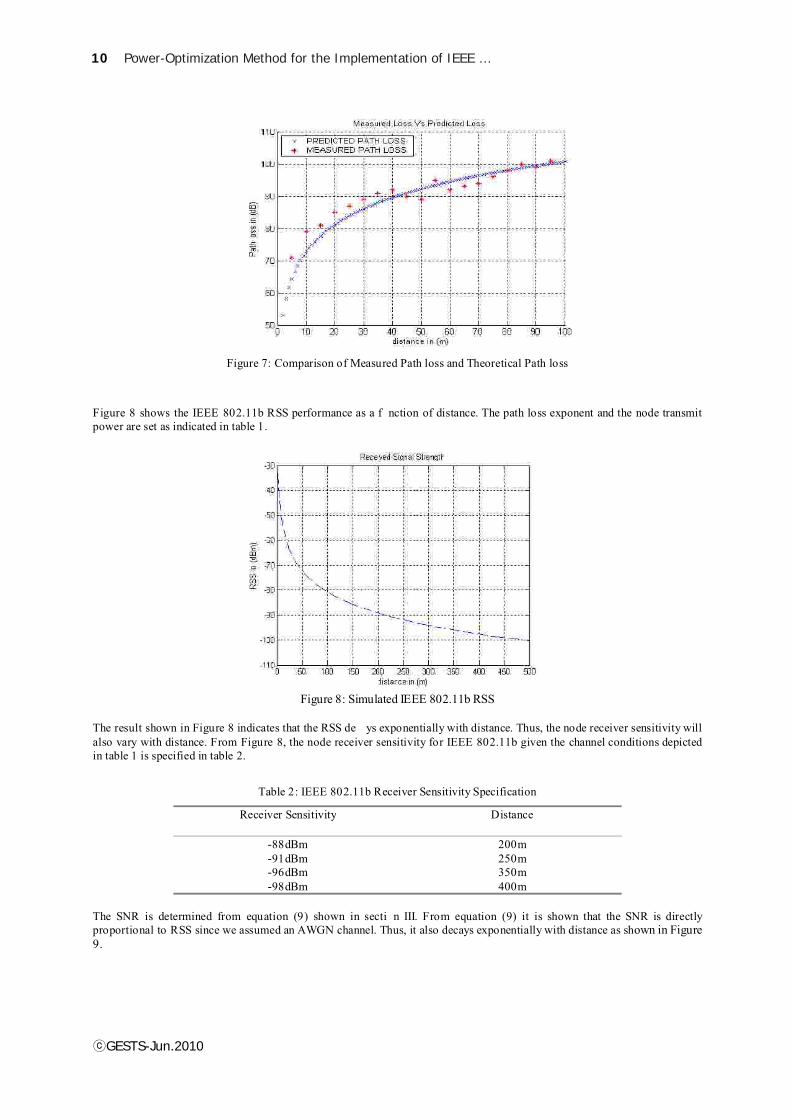
Figure 8 shows the IEEE 802.11b RSS performance as a f nction of distance. The path loss exponent and the node transmitpower are set as indicated in table 1.
Figure 8: Simulated IEEE 802.11b RSS
The result shown in Figure 8 indicates that the RSS de ys exponentially with distance. Thus, the node receiver sensitivity willalso vary with distance. From Figure 8, the node receiver sensitivity for IEEE 802.11b given the channel conditions depictedin table 1 is specified in table 2.
Table 2: IEEE 802.11b Receiver Sensitivity Specification
Receiver Sensitivity Distance
-88dBm 200m-91dBm 250m-96dBm 350m-98dBm 400m
The SNR is determined from equation (9) shown in secti n III. From equation (9) it is shown that the SNR is directlyproportional to RSS since we assumed an AWGN channel. Thus, it also decays exponentially with distance as shown in Figure9.
GESTS Int’l Trans. Computer Science and Engr., Vol.60, No.1 11
ⓒGESTS-Jun.2010
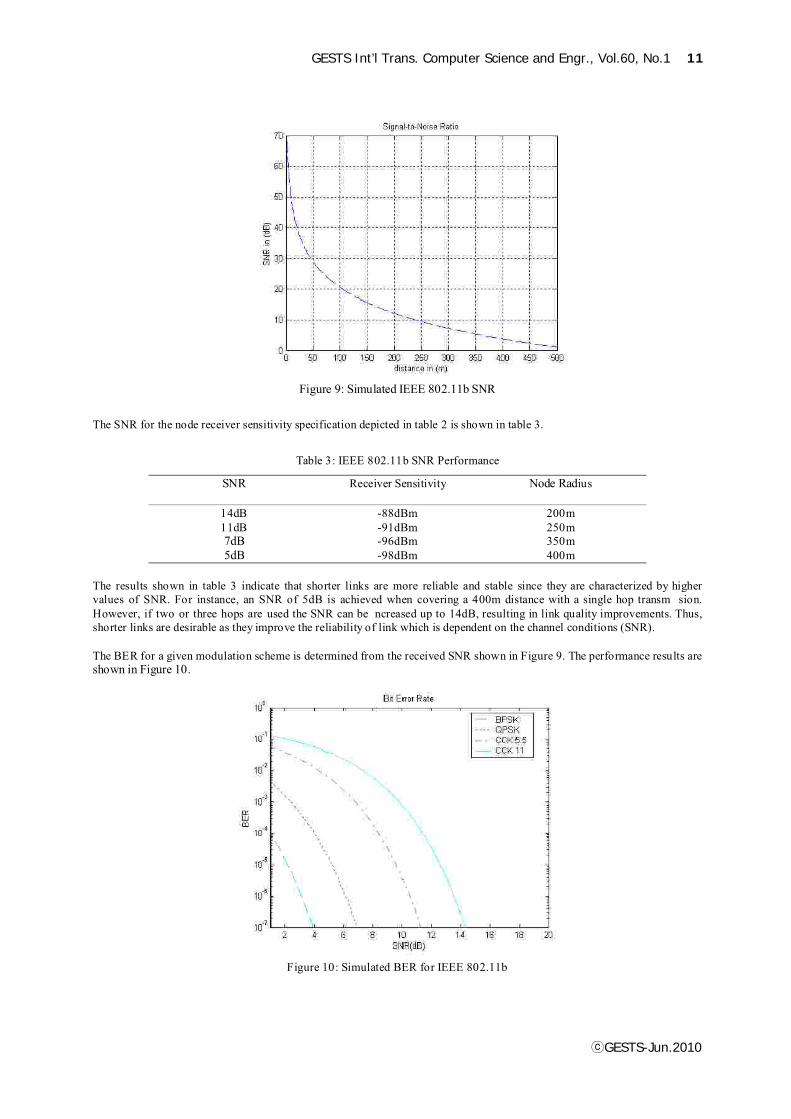
Figure 9: Simulated IEEE 802.11b SNR
The SNR for the node receiver sensitivity specification depicted in table 2 is shown in table 3.
Table 3: IEEE 802.11b SNR Performance
SNR Receiver Sensitivity Node Radius
14dB -88dBm 200m11dB -91dBm 250m7dB -96dBm 350m5dB -98dBm 400m
The results shown in table 3 indicate that shorter links are more reliable and stable since they are characterized by highervalues of SNR. For instance, an SNR of 5dB is achieved when covering a 400m distance with a single hop transm sion.However, if two or three hops are used the SNR can be ncreased up to 14dB, resulting in link quality improvements. Thus,shorter links are desirable as they improve the reliability of link which is dependent on the channel conditions (SNR).
The BER for a given modulation scheme is determined from the received SNR shown in Figure 9. The performance results areshown in Figure 10.
Figure 10: Simulated BER for IEEE 802.11b
12 Power-Optimization Method for the Implementation of IEEE …
ⓒGESTS-Jun.2010
It is shown in Figure 10 that the transmission rate is dependent on the channel conditions (SNR). As the channel conditionsdegrades, a lower rate is chosen by the MAC layer to reduce the BER. If the SNR drops from 14dB to 5dB, the transmissionrate is reduced from 11Mbps to 1Mbps to keep the BER at a minimum of 10-7. Otherwise, if the same transmission rate isutilized, then the BER will be increased to approximately 10-1 .2 and this will result in packets being lost. The transm ssion rateselection given the channel conditions (SNR) indicated in table 3 is shown in table 4.
Table 4: Transmission rate selection based on channel conditions
ModulationTechnique
TransmissionRate
SNR Distance
CCK 11Mbps 14dB 200mCCK 5.5Mbps 11dB 250mQPSK 2Mbps 7dB 350mBPSK 1Mbps 5dB 400m
The results shown in table 4 suggests that shorter lin sults in improvements in transmission rates. A transmission rate of1Mbps is achieved with a single hop transmission (400m . However, when utilizing multi-hop transmission, the transmissionrate can be increased up to 11Mbps. Thus, shorter link are desirable for high data rate transmission.
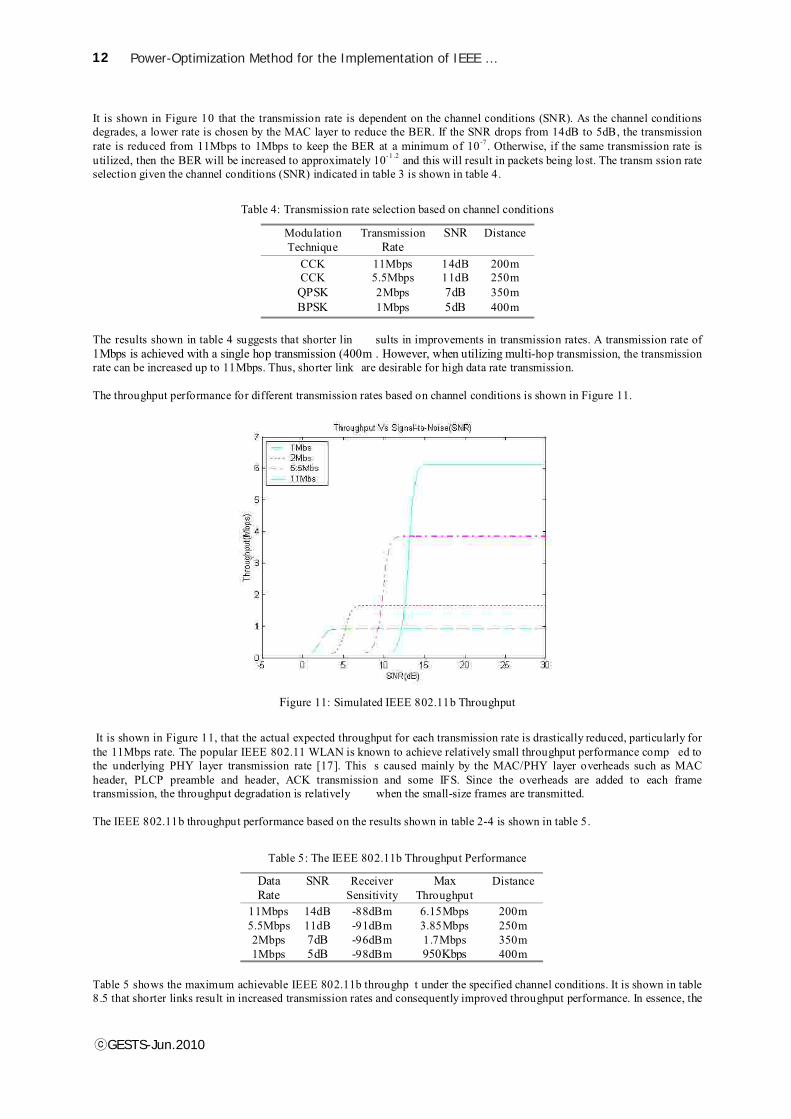
The throughput performance for different transmission rates based on channel conditions is shown in Figure 11.
Figure 11: Simulated IEEE 802.11b Throughput
It is shown in Figure 11, that the actual expected throughput for each transmission rate is drastically reduced, particularly forthe 11Mbps rate. The popular IEEE 802.11 WLAN is known to achieve relatively small throughput performance comp ed tothe underlying PHY layer transmission rate [17]. This s caused mainly by the MAC/PHY layer overheads such as MACheader, PLCP preamble and header, ACK transmission and some IFS. Since the overheads are added to each frametransmission, the throughput degradation is relatively when the small-size frames are transmitted.
The IEEE 802.11b throughput performance based on the results shown in table 2-4 is shown in table 5.
Table 5: The IEEE 802.11b Throughput Performance
DataRate
SNR ReceiverSensitivity
MaxThroughput
Distance
11Mbps 14dB -88dBm 6.15Mbps 200m5.5Mbps 11dB -91dBm 3.85Mbps 250m2Mbps 7dB -96dBm 1.7Mbps 350m1Mbps 5dB -98dBm 950Kbps 400m
Table 5 shows the maximum achievable IEEE 802.11b throughp t under the specified channel conditions. It is shown in table8.5 that shorter links result in increased transmission rates and consequently improved throughput performance. In essence, the
GESTS Int’l Trans. Computer Science and Engr., Vol.60, No.1 13
ⓒGESTS-Jun.2010
results shown in table 2-5 indicates that the performance of a multi-hop system can be improved by using several shorter li ksinstead of long distance links to implement the system
The PMCA based multi-hop system is simulated based on the performance evaluation of the IEEE 802.11b d cussed in theprevious subsection. The objective is to compare the t ansmit power consumption efficiency of the conventional multi-hopsystem and the PMCA based system. It should be recalle that the distinguishing factor for the two systems is that inconventional multi-hop system, transmit power levels of nodes are normally randomly set to maximum levels that link thenodes together to extend the network coverage area and in PMCA based systems the Power-efficient Multi-hopCommunication Algorithm (PMCA) is used to set appropriate transmit power levels of nodes to optimize transmit powerconsumption.
In the scenario depicted in Figure 6, a throughput of 6.15Mbps is achieved in a single hop transmission as shown in table 5.To extend the range to 1400m with the same throughput erformance, 7 hops are utilized as shown in Figure 6. This scenariorepresents the conventional multi-hop system.
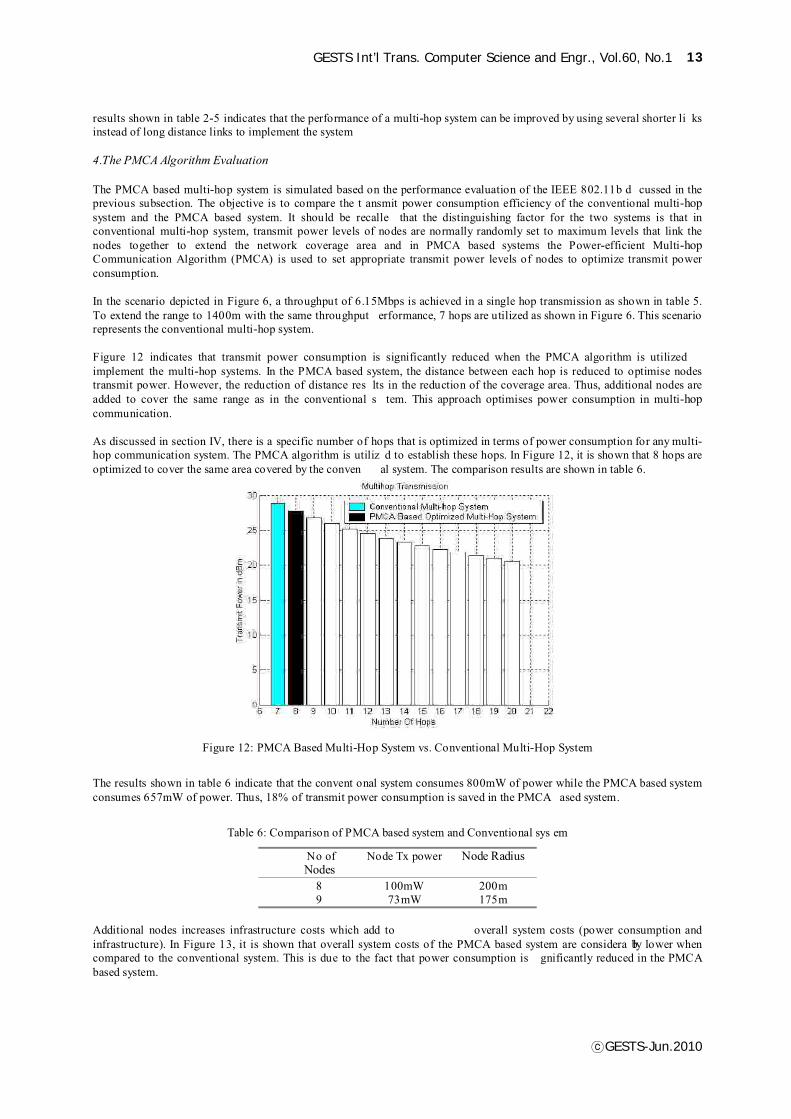
Figure 12 indicates that transmit power consumption is significantly reduced when the PMCA algorithm is utilizedimplement the multi-hop systems. In the PMCA based system, the distance between each hop is reduced to optimise nodestransmit power. However, the reduction of distance res lts in the reduction of the coverage area. Thus, additional nodes areadded to cover the same range as in the conventional s tem. This approach optimises power consumption in multi-hopcommunication.
As discussed in section IV, there is a specific number of hops that is optimized in terms of power consumption for anymulti-hop communication system. The PMCA algorithm is utiliz d to establish these hops. In Figure 12, it is shown that 8 hops areoptimized to cover the same area covered by the conven al system. The comparison results are shown in table 6.
Figure 12: PMCA Based Multi-Hop System vs. Conventional Multi-Hop System
The results shown in table 6 indicate that the convent onal system consumes 800mW of power while the PMCA based systemconsumes 657mW of power. Thus, 18% of transmit power consumption is saved in the PMCA ased system.
Table 6: Comparison of PMCA based system and Conventional sys em
No ofNodes
Node Tx power Node Radius
8 100mW 200m9 73mW 175m
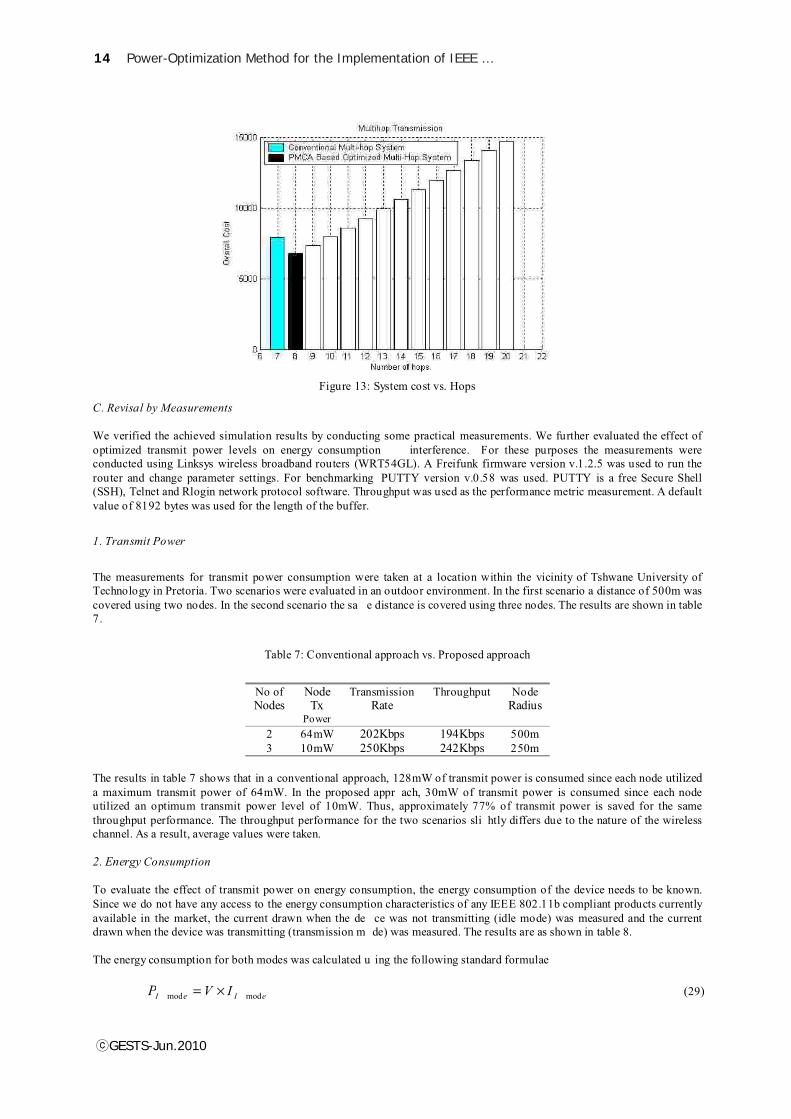
Additional nodes increases infrastructure costs which add to overall system costs (power consumption andinfrastructure). In Figure 13, it is shown that overall system costs of the PMCA based system are considera bly lower whencompared to the conventional system. This is due to the fact that power consumption is gnificantly reduced in the PMCAbased system.
4.The PMCA Algorithm Evaluation
14 Power-Optimization Method for the Implementation of IEEE …
ⓒGESTS-Jun.2010
Figure 13: System cost vs. Hops
We verified the achieved simulation results by conducting some practical measurements. We further evaluated the effect ofoptimized transmit power levels on energy consumption interference. For these purposes the measurements wereconducted using Linksys wireless broadband routers (WRT54GL). A Freifunk firmware version v.1.2.5 was used to run therouter and change parameter settings. For benchmarking PUTTY version v.0.58 was used. PUTTY is a free Secure Shell(SSH), Telnet and Rlogin network protocol software. Throughput was used as the performance metric measurement. A defaultvalue of 8192 bytes was used for the length of the buffer.
The measurements for transmit power consumption were taken at a location within the vicinity of Tshwane University ofTechnology in Pretoria. Two scenarios were evaluated in an outdoor environment. In the first scenario a distance of 500m wascovered using two nodes. In the second scenario the sa e distance is covered using three nodes. The results are shown in table7.
Table 7: Conventional approach vs. Proposed approach
No ofNodes
NodeTxPower
TransmissionRate
Throughput NodeRadius
2 64mW 202Kbps 194Kbps 500m3 10mW 250Kbps 242Kbps 250m
The results in table 7 shows that in a conventional approach, 128mW of transmit power is consumed since each node utilizeda maximum transmit power of 64mW. In the proposed appr ach, 30mW of transmit power is consumed since each nodeutilized an optimum transmit power level of 10mW. Thus, approximately 77% of transmit power is saved for the samethroughput performance. The throughput performance for the two scenarios sli htly differs due to the nature of the wirelesschannel. As a result, average values were taken.
To evaluate the effect of transmit power on energy consumption, the energy consumption of the device needs to be known.Since we do not have any access to the energy consumption characteristics of any IEEE 802.11b compliant products currentlyavailable in the market, the current drawn when the de ce was not transmitting (idle mode) was measured and the currentdrawn when the device was transmitting (transmission m de) was measured. The results are as shown in table 8.
The energy consumption for both modes was calculated u ing the following standard formulae
mod_mod_ (29)
C. Revisal by Measurements
1. Transmit Power
2. Energy Consumption
eIeI IVP ×=
GESTS Int’l Trans. Computer Science and Engr., Vol.60, No.1 15
ⓒGESTS-Jun.2010
Where is the idle mode power, is the voltage supply and is the idle mode current.
Similarly
mod_mod_ (30)
Where is the transmission mode power, is the voltage supply and is the transmission mode current.
From Equation (30)
mod_mod_ (31)
Where is the idle mode energy consumption and is time in seconds.
From Equation (31)
mod_mod_ (32)
Where is the transmission mode energy consumption and is time in seconds.
Table 8: Power Characteristics of the Linksys WRT54GL
245mA 320mA 64mW 12V
The energy consumption for the two modes is shown in t le 9. The results are for nodes transmitting continuously for 12seconds.
Table 9: Idle Mode and Transmission Mode Energy Consumption
2.94J 0.9J
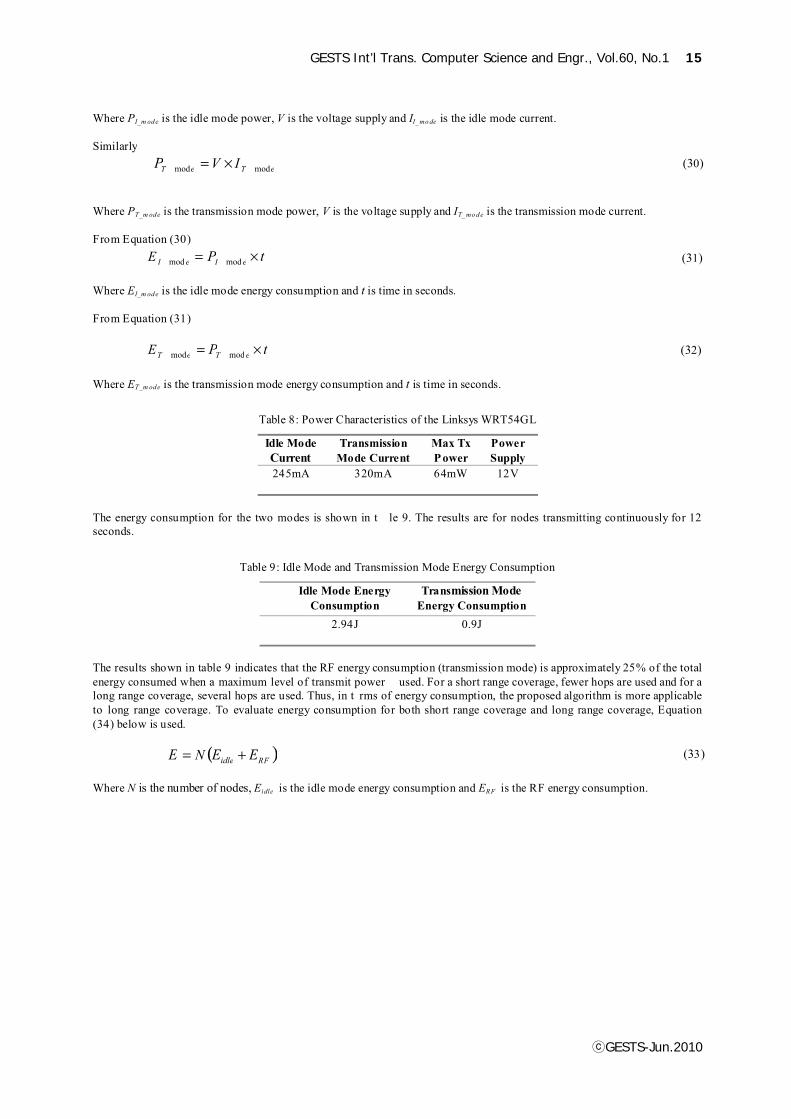
The results shown in table 9 indicates that the RF energy consumption (transmission mode) is approximately 25% of the totalenergy consumed when a maximum level of transmit power used. For a short range coverage, fewer hops are used and for along range coverage, several hops are used. Thus, in t rms of energy consumption, the proposed algorithm is more applicableto long range coverage. To evaluate energy consumption for both short range coverage and long range coverage, Equation(34) below is used.
(33)
Where is the number of nodes, is the idle mode energy consumption and is the RF energy consumption.
PI_m ode V II_mode
eTeT IVP
PT_m ode V IT_mode
tPE eIeI
EI_m ode t
tPE eTeT
ET_m ode t
RFidle EENE
N Eidle ERF
×=
×=
×=
( )+=
Idle ModeCurrent
TransmissionMode Current
Max TxPower
PowerSupply
Idle Mode EnergyConsumption
TransmissionModeEnergy Consumption
16 Power-Optimization Method for the Implementation of IEEE …
ⓒGESTS-Jun.2010
Figure14: Energy consumption analysis for short range rage
In Figure 8.8, it is shown that 300% of energy is consumed when 3 nodes with maximum node transmit power levels are used.An extra node is added and the distance between nodes is halved when utilizing the proposed approach. Thus, node transmitpower is reduced by 77% as discussed in sub-section 1. Energy consumption is increased to 323% as n in Figure 8.8resulting in energy consumption being increased by 7.3% in the proposed approach.
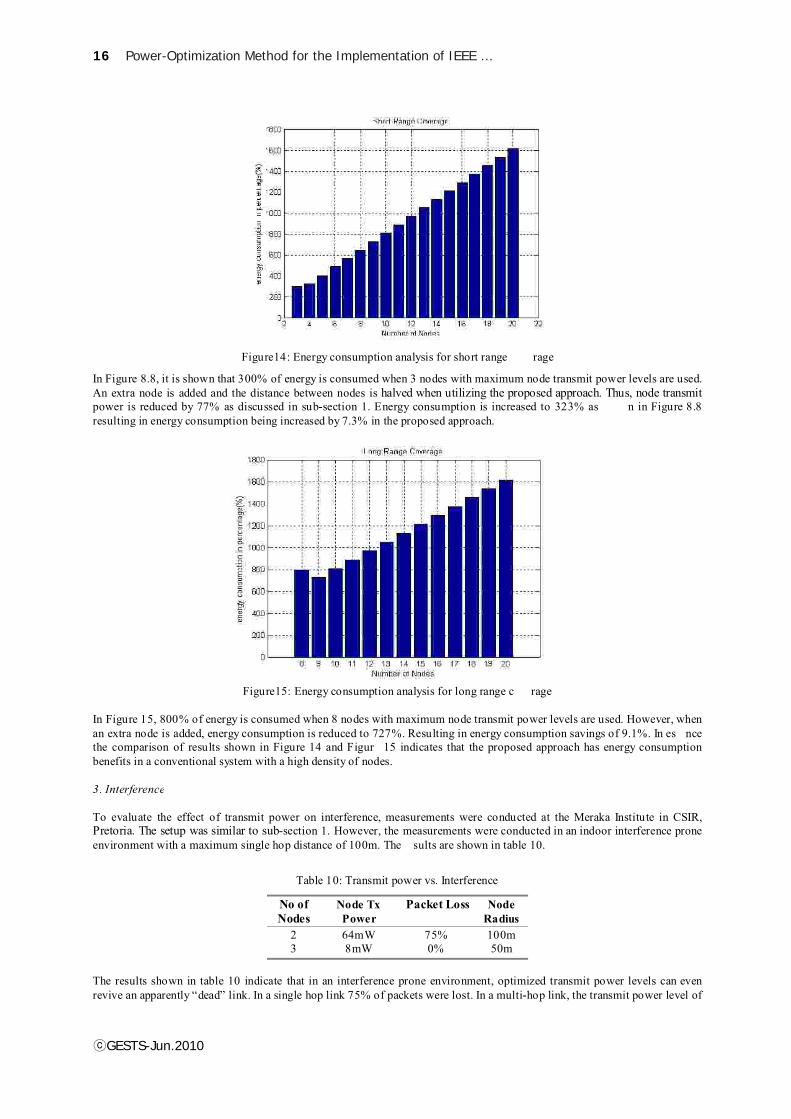
Figure15: Energy consumption analysis for long range c rage
In Figure 15, 800% of energy is consumed when 8 nodes with maximum node transmit power levels are used. However, whenan extra node is added, energy consumption is reduced to 727%. Resulting in energy consumption savings of 9.1%. In es ncethe comparison of results shown in Figure 14 and Figur 15 indicates that the proposed approach has energy consumptionbenefits in a conventional system with a high density of nodes.
To evaluate the effect of transmit power on interference, measurements were conducted at the Meraka Institute in CSIR,Pretoria. The setup was similar to sub-section 1. However, the measurements were conducted in an indoor interference proneenvironment with a maximum single hop distance of 100m. The sults are shown in table 10.
Table 10: Transmit power vs. Interference
2 64mW 75% 100m3 8mW 0% 50m
The results shown in table 10 indicate that in an interference prone environment, optimized transmit power levels can evenrevive an apparently “dead” link. In a single hop link 75% of packets were lost. In a multi-hop link, the transmit power level of
3. Interference
No ofNodes
Node TxPower
Packet Loss NodeRadius

GESTS Int’l Trans. Computer Science and Engr., Vol.60, No.1 17
ⓒGESTS-Jun.2010
nodes was significantly reduced and the link was revived. Thus, the use of power-efficient multi-hop communication systemsnot only saves power and energy, but can also be used s an interference minimization mechanism for the congested 2.4GHzISM spectrum.
From the achieved results, we can deduce that the PMCA algorithm provides the following benefits:
1. It offers a mechanism that enables range extension of WLANs with optimized transmit power consumption. The use ofoptimized transmit power levels provides significant energy consumption savings as shown in the achieved results.Furthermore, optimized transmit power levels contribut significantly in the reduction or minimization of interferencewithin the congested IEEE 802.11 2.4GHz ISM spectrum.
2. It provides a solid framework for the development of IEEE 802.11 RF planning tools such as ATOLL (from FORSK)used for the GSM technology. Such planning tools are r e or non-existent in IEEE 802.11. Thus, the PMCA algorithmis provided as a simple RF planning mechanism that facilitates the analysis, planning and implementation of op imizedIEEE 802.11 multi-hop networks.
In this paper, we presented an algorithm that ensures plementation of IEEE 802.11b multi-hop networks with optimizedpower consumption. Simulation results have shown that power c sumption is significantly optimized in PMCAbased multi-hop systems as compared to conventional multi-hop system. We have also shown through the conducted practical experimentsthat power optimization can lead to energy savings in multi-hop networks with a higher density of nodes (long rangecoverage). Furthermore, it was shown that lower levels of transmit power result in lower probabilities of interference withinthe interference prone ISM band such that “apparently dead” links can even be revived. Thus, the algorithm delivers asignificant framework for the implementation of IEEE 802.11 multi-hop communication networks. The IEEE 802.11WLAN’s are envisioned as providers of permeate and use seamless communication in future wireless broadbandtechnologies, hence, improving their performance is a ogical, significant and a future save concept. The work on this paperdoes not take into consideration the routing and signa propagation issues prevalent in multi-hop networks. Thus, furtherinvestigations needs to be carried out in relation to the above mentioned issues.
The authors would like to thank Telkom Centre of Excel nce Program and F’SATIE at Tshwane University of Technologyfor making this research possible.
[1] Hao Zhu, Guohong Cao, “On Improving the Performance of IEEE 802.11 with Relay-Enabled PCF,” Mobile Networks and Applications, vol. 9 , no. 4,pp. 423-434, 2004.
[2] Chan, A. H., "Benefits and Requirements of Interworking between WirelessLAN and 3G Wireless," Proceedings of Southern African TelecommunicationNetworks & Applications Conference (SATNAC2004), South Western Cape, SouthAfrica, 6 - 8 September 2004, Vol 1, pp. 149-153
[3] R. Pabst, B.H. Walke, D. C . Schultz, P. Herhold, H. Yanikomeroglu, S . Mukherjee, H. Viswanathan, M. Lott, W. Zirwas, M. Dohler, H. Aghvami, D. D.Falconer, and G. P. Fettweis, “Relay-based deployment concepts for wireless and mobile broadband radio”, IEEE Communications Magazine, September2004
[4] R. Ramanathan and R. Rosales-Hain, “ Topology Control of Multihop Wireless Networks using Transmit Power Adjustment,” Proceedings of the IEEEConference onComputer Communications (INFOCOM), pp. 404-413, Tel Aviv, Israel, March 2000
[5] Michael Fainberg, “A Performance Analysis of the IEEE 802.11b Local Area work in the Presence of Bluetooth PersonalArea Network”, Master Thesis(TelecommunicationNetworks), Polytechnic University – Brooklyn, June 2001
[6] Jonas Linnell, Hans Torstensson, “Radio Resource Management in IEEE 802.11b WLAN:Aspects of System Planning”, Master Thesis, Chalmers University ofTechnology, Götenborg, Feb 2004.
[7] Javier del Prado Pavon, Sunghyun Choi, “Link Adaptatio Strategy for IEEE 802.11 WLAN via Received Signal Strength Measurement”, Proceedings ofICC’03, Vol. 2, pp. 1108-1113, Anchorage, Alaska, USA, May 2003
[8] Liljana Gravrilovska, Vladimir Atanasovski, “Influence of Packet Length on IEEE 802.11b Throughput Performance in Noisy Channels”,MAGNET , Shangai, China, 11-12 November 2004, ISBN 87-91696-36-4.
[9] Qian Wu, Carey Williamson, “Dynamic Channel Rate Assignment for Multi-Radio WLAN’s” Proceedings of the IASTED conference onwireless networks andemerging technologies (WNET), pp. 149-154, Banff, Alberta, Canada, July 2005.
[10] T.S . Rappaport, Wireless Communications:Principlesand Practice, Second Edition, (Upper Saddle River:Prentice HallPTR, 2002).
[11] http://www.cisco.com/en/US/products/hw/wireless/ps4570 products_data_sheet09186a00800f9ea7.html.[12] Matlab, language for technical computing, information available at http://www.mathworks.com[13] A technical report CU-CS-934-02, on the
implementation of transmit power control in
VI CONCLUSION AND FUTUREWORK
ACKNOWLEDGEMENTS
REFERENCES
Proceedings of 1st
International Work shop D6.2.5
18 Power-Optimization Method for the Implementation of IEEE …
ⓒGESTS-Jun.2010
802.11b wireless networks,http://mantis.cs.colorado.edu/media/CU_CS_934_0 2 _Transmit_Power.pdf
[14] Bright Chu, “Improving IEEE Performance with Power Con and Distance-based Contention Window Selection”, Master Thesis, University of Illinois,Urbana, 2004.
[15] E.-S Jung and N.H Vaidya, “ A Power Control Mac Protocol for Ad Hoc Networks,”, September 2002, pp. 36-47.
[16] F . Abdesslem, M. Dias De Amorim, K. Kabassanov and S. Fdida, “ On the feasibility of power control in current IEEE 802.11 devices,”. Pisa (Italy), March 2006.
[17] Y. Kim, S. Choi, K. Jang, H. Hwang, “Throughput enhancement of IEEE 802.11 WLAN via Frame Aggregation,”, September 2004, pp. 3030-3034. ISBN :0-7803-8521-7.
In proceedings of the 8th annual ACM/IEEE InternationalConference on Mobile Computing and Networking (MOBICOM)
In proceedings ofsecond IEEE Percom Work shop on Pervasiv e Wireless Network ing (PWN’06)
In proceedings of Vehicular TechnologyConference (VTC’04-Fall)