Power Line Communication for Low-Bandwidth Control and ...
10
1 Power Line Communication for Low-Bandwidth Control and Sensing Adedayo O. Aderibole, Erik K. Saathoff, Kevin J. Kircher, Steven B. Leeb, and Leslie K. Norford Abstract—While not designed with communication applica- tions in mind, power lines have been attractive targets for providing ancillary communication services for decades. Unfor- tunately, loads and switchgear can easily interfere with reliable communication in both direct and subtle ways. Power line communication (PLC) is therefore often relegated to non-critical control tasks like home lighting or appliance control, where communication difficulties or failure simply result in a walk to the light switch. For control applications that require low data rates, unexploited opportunities exist for increasing the reliability of PLC within governing regulatory rules. Reliable, low-bandwidth PLC facilitates new, inexpensive opportunities for demand-side management of the loads in a building or facility. This paper presents approaches for tailoring PLC for reliable low-bandwidth communication, and presents experimental demonstrations in a 24-floor high-rise building with challenging channel conditions. Index Terms—Binary orthogonal keying, chirp spread spec- trum, low-bandwidth communication, power line communication, quasi-peak. I. BACKGROUND E NERGY conservation and management schemes based on demand response typically require a communication channel [1]. Communication requirements often add expense, and may limit the penetration and efficacy of demand response or load control schemes. Effective communication is necessary not only to save energy and shave peak demand, but also to ensure the reliability of essential services such as hot water, air conditioning, and vehicle charging. Existing power lines already connect loads to utility control centers and to each other. For this reason, power lines are a potentially attractive communication channel for demand response applications. While power lines were not designed for communication [2], attempts have been made for decades. Power-line communication (PLC) was originally employed by power utility companies in the 1920s for long distance communication, remote monitoring, protection, and control of equipment on the utility grid [3]. Smart grids demand bi-directional communication, inter-connectivity, and the in- telligent automation of components on the electrical power network [4]. PLC systems suitable for smart-grid applications such as load and peak demand management are frequently proposed [5], and PLC may also provide a route to protect against cyberattacks and extreme environmental concerns [6]. This work was supported by the Exelon Corporation and The Grainger Foundation. A. O. Aderibole, E. K. Saathoff, K. J. Kircher, and S. B. Leeb are with the Electrical Engineering and Computer Science Department, Mas- sachusetts Institute of Technology, Cambridge, MA 02139 USA (e-mail: [email protected], [email protected], [email protected], [email protected]). L. K. Norford is with the Department of Architecture, Massachusetts Insti- tute of Technology, Cambridge, MA 02139 USA (e-mail: [email protected]). Time-varying noise levels and poorly characterized line impedance, especially as loads connect and disconnect from the line, are major issues that affect the practical application of PLC. Power line noise may be synchronous or asynchronous with respect to the line-cycle, and may include colored back- ground and impulse noise [7], [8]. Power line noise is difficult to characterize and is not easily approximated as additive white Gaussian noise [7]. Unpredictable signal attenuation, depen- dent on the time of day, frequency, distance, and electrical phase, deteriorates the received signal power in PLC systems [9]. Network topology, multipath fading, and circuit loading also influence attenuation [10]. The achievable performance of PLC systems is limited by impedance, bandwidth and elec- tromagnetic compatibility (EMC) constraints [11] enforced by regulatory bodies such as the Federal Communications Commission (FCC) in the United States and Comit´ e Europ´ een de Normalisation ´ Electrotechnique (CENELEC) in Europe [7]. Smart grid and demand response applications may have relatively unique communication requirements that can be exploited to improve the utility of PLC for control and monitoring. Specifically, many demand response and control applications require far lower bandwidths than other consumer applications of PLC like internet or land-line phone extenders. Communication bandwidths of a few Hertz or less may be adequate for many control applications. This paper presents a suite of techniques that can substantially enhance PLC communication reliability by taking advantage of the unique requirements imposed by low-bandwidth communication. The proposed techniques leverage the “quasi-peak” (QP) regula- tions to improve the reliability of low-bandwidth PLC using chirp signals. This paper also proposes methods and hardware to take advantage of this opportunity and substantially improve PLC reliability in low-bandwidth applications. Section III presents a review of relevant PLC regulatory requirements, followed by an opportunity to leverage the so-called QP regulations to improve communication in low-bandwidth ap- plications. Section IV discusses the modulation and demodu- lation schemes required to utilize the QP opportunity. These techniques are then applied to the design and implementation of new PLC modem hardware to exploit the opportunity in Section V. Section VI describes a 24-floor high-rise building used as a test environment to evaluate the proposed techniques and hardware. The experimental results obtained in the test building are presented in Section VII. II. PLC SYSTEMS PLC systems are usually classified according to the fre- quency band in which they operate. Ultra-narrowband (UNB- PLC), narrowband (NB-PLC) and broadband (BB-PLC) op- erate in the 125 Hz-3-kHz, 3-500-kHz, and 1.8-100-MHz
-
Upload
khangminh22 -
Category
Documents
-
view
1 -
download
0
Transcript of Power Line Communication for Low-Bandwidth Control and ...

1
Power Line Communication for Low-BandwidthControl and Sensing
Adedayo O. Aderibole, Erik K. Saathoff, Kevin J. Kircher, Steven B. Leeb, and Leslie K. Norford
Abstract—While not designed with communication applica-tions in mind, power lines have been attractive targets forproviding ancillary communication services for decades. Unfor-tunately, loads and switchgear can easily interfere with reliablecommunication in both direct and subtle ways. Power linecommunication (PLC) is therefore often relegated to non-criticalcontrol tasks like home lighting or appliance control, wherecommunication difficulties or failure simply result in a walk to thelight switch. For control applications that require low data rates,unexploited opportunities exist for increasing the reliability ofPLC within governing regulatory rules. Reliable, low-bandwidthPLC facilitates new, inexpensive opportunities for demand-sidemanagement of the loads in a building or facility. This paperpresents approaches for tailoring PLC for reliable low-bandwidthcommunication, and presents experimental demonstrations in a24-floor high-rise building with challenging channel conditions.
Index Terms—Binary orthogonal keying, chirp spread spec-trum, low-bandwidth communication, power line communication,quasi-peak.
I. BACKGROUND
ENERGY conservation and management schemes basedon demand response typically require a communication
channel [1]. Communication requirements often add expense,and may limit the penetration and efficacy of demand responseor load control schemes. Effective communication is necessarynot only to save energy and shave peak demand, but also toensure the reliability of essential services such as hot water,air conditioning, and vehicle charging.
Existing power lines already connect loads to utility controlcenters and to each other. For this reason, power lines area potentially attractive communication channel for demandresponse applications. While power lines were not designedfor communication [2], attempts have been made for decades.Power-line communication (PLC) was originally employedby power utility companies in the 1920s for long distancecommunication, remote monitoring, protection, and controlof equipment on the utility grid [3]. Smart grids demandbi-directional communication, inter-connectivity, and the in-telligent automation of components on the electrical powernetwork [4]. PLC systems suitable for smart-grid applicationssuch as load and peak demand management are frequentlyproposed [5], and PLC may also provide a route to protectagainst cyberattacks and extreme environmental concerns [6].
This work was supported by the Exelon Corporation and The GraingerFoundation.
A. O. Aderibole, E. K. Saathoff, K. J. Kircher, and S. B. Leeb arewith the Electrical Engineering and Computer Science Department, Mas-sachusetts Institute of Technology, Cambridge, MA 02139 USA (e-mail:[email protected], [email protected], [email protected], [email protected]).
L. K. Norford is with the Department of Architecture, Massachusetts Insti-tute of Technology, Cambridge, MA 02139 USA (e-mail: [email protected]).
Time-varying noise levels and poorly characterized lineimpedance, especially as loads connect and disconnect fromthe line, are major issues that affect the practical application ofPLC. Power line noise may be synchronous or asynchronouswith respect to the line-cycle, and may include colored back-ground and impulse noise [7], [8]. Power line noise is difficultto characterize and is not easily approximated as additive whiteGaussian noise [7]. Unpredictable signal attenuation, depen-dent on the time of day, frequency, distance, and electricalphase, deteriorates the received signal power in PLC systems[9]. Network topology, multipath fading, and circuit loadingalso influence attenuation [10]. The achievable performanceof PLC systems is limited by impedance, bandwidth and elec-tromagnetic compatibility (EMC) constraints [11] enforcedby regulatory bodies such as the Federal CommunicationsCommission (FCC) in the United States and Comite Europeende Normalisation Electrotechnique (CENELEC) in Europe [7].
Smart grid and demand response applications may haverelatively unique communication requirements that can beexploited to improve the utility of PLC for control andmonitoring. Specifically, many demand response and controlapplications require far lower bandwidths than other consumerapplications of PLC like internet or land-line phone extenders.Communication bandwidths of a few Hertz or less may beadequate for many control applications. This paper presentsa suite of techniques that can substantially enhance PLCcommunication reliability by taking advantage of the uniquerequirements imposed by low-bandwidth communication. Theproposed techniques leverage the “quasi-peak” (QP) regula-tions to improve the reliability of low-bandwidth PLC usingchirp signals. This paper also proposes methods and hardwareto take advantage of this opportunity and substantially improvePLC reliability in low-bandwidth applications. Section IIIpresents a review of relevant PLC regulatory requirements,followed by an opportunity to leverage the so-called QPregulations to improve communication in low-bandwidth ap-plications. Section IV discusses the modulation and demodu-lation schemes required to utilize the QP opportunity. Thesetechniques are then applied to the design and implementationof new PLC modem hardware to exploit the opportunity inSection V. Section VI describes a 24-floor high-rise buildingused as a test environment to evaluate the proposed techniquesand hardware. The experimental results obtained in the testbuilding are presented in Section VII.
II. PLC SYSTEMS
PLC systems are usually classified according to the fre-quency band in which they operate. Ultra-narrowband (UNB-PLC), narrowband (NB-PLC) and broadband (BB-PLC) op-erate in the 125 Hz-3-kHz, 3-500-kHz, and 1.8-100-MHz
2
spectrum, respectively [5]. NB-PLC is attractive for smart gridapplications where reliability, coverage and robustness are themain concern, while BB-PLC is mainly employed in internetaccess applications for home and building area networks withlimited range [12]. Electromagnetic interference (EMI) regu-lations set the conducted and radiated emissions limits whichdetermine the maximum transmitted communication signalpower level for UNB-PLC, NB-PLC and BB-PLC systems.CENELEC defines the 3-148.5-kHz spectrum only for NB-PLC with conducted emissions constraints provided in Euro-pean Norms (EN) 50065-1 [13] in the form of peak, quasi-peakand average limits. EN 50065-1 does not provide radiationemissions limits for NB-PLC. In the United States, the FCCPart 15 [14] specifies the 9-490-kHz spectrum for NB-PLCapplications. However, no in-band conducted emissions limitsare provided. Radiated emissions limits for NB-PLC are pro-vided by the FCC in [14]. In addition, non-regulatory bodiessuch as the Comite International Special des PerturbationsRadioelectriques (CISPR) and IEEE have proposed emissionlimits for NB-PLC in the 9-500-kHz spectrum in the CISPR22 [15] and IEEE 1901.2 [16] standards, respectively.
In addition to EMI, PLC signals should be below certainlimits to ensure the safety of equipment on the utility gridand operators. IEEE Standard (Std.) 519-2014 states thatthe voltage harmonics content at the interface between usersin a system should be below the limits provided in [17].Consequently, the total conducted emissions of PLC devicesin a network should be such that the recommended voltageharmonics levels at the point of common coupling are notviolated. Furthermore, periodic PLC signals can cause voltageor current surges that lead to equipment damage as stated inIEEE C62.41 [18]. The lower voltage limit surge protectionequipment is able to withstand is 500 V [18]. PLC signalsshould thus be kept far below this limit for safety. Finally,residual current devices at service panels activate in the pres-ence of excessive common-mode current. To avoid trippingthese devices, common-mode currents from PLC modemsshould respect the 30-mA limit specified in IEC 60755 [19].
Despite the many challenges facing PLC, many researchershave highlighted the benefits of PLC in smart grid applications.In [20], PLC was employed to create a network in a smarthome for Internet of Things (IoT) applications. In [20], aBB-PLC system provided internet access to the IoT network.Advanced metering infrastructure that enables two-way infor-mation exchange using PLC between utilities and consumersfor improved energy consumption monitoring and customerbilling was also reported in [21]. A reliable PLC system wasdesigned in [22] to relay price and energy information tocustomers, enabling energy conservation benefits such as peakload shifting, shedding and automatic load controls. Reference[23] also achieves energy conservation via NB-PLC by broad-casting control commands to intelligent air conditioners. To theknowledge of the authors, most of the existing literature on theapplication of PLC in smart grids focuses on achieving high-data-rate communication. As a result, insufficient attention hasbeen paid to exploring effective communication strategies forsmart grid applications where reliability and coverage at lowdata rates are the primary concerns, especially in buildingswith harmful attenuation levels.
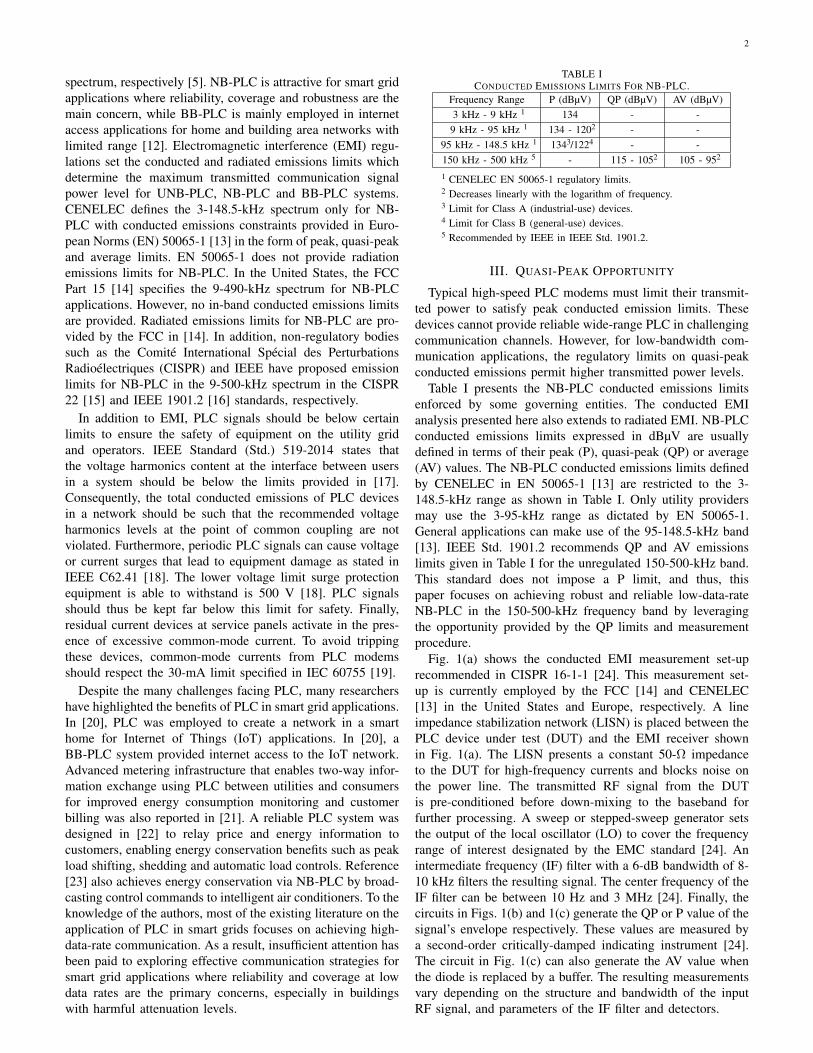
TABLE ICONDUCTED EMISSIONS LIMITS FOR NB-PLC.
Frequency Range P (dBµV) QP (dBµV) AV (dBµV)3 kHz - 9 kHz 1 134 - -9 kHz - 95 kHz 1 134 - 1202 - -
95 kHz - 148.5 kHz 1 1343/1224 - -150 kHz - 500 kHz 5 - 115 - 1052 105 - 952
1 CENELEC EN 50065-1 regulatory limits.2 Decreases linearly with the logarithm of frequency.3 Limit for Class A (industrial-use) devices.4 Limit for Class B (general-use) devices.5 Recommended by IEEE in IEEE Std. 1901.2.
III. QUASI-PEAK OPPORTUNITY
Typical high-speed PLC modems must limit their transmit-ted power to satisfy peak conducted emission limits. Thesedevices cannot provide reliable wide-range PLC in challengingcommunication channels. However, for low-bandwidth com-munication applications, the regulatory limits on quasi-peakconducted emissions permit higher transmitted power levels.
Table I presents the NB-PLC conducted emissions limitsenforced by some governing entities. The conducted EMIanalysis presented here also extends to radiated EMI. NB-PLCconducted emissions limits expressed in dBµV are usuallydefined in terms of their peak (P), quasi-peak (QP) or average(AV) values. The NB-PLC conducted emissions limits definedby CENELEC in EN 50065-1 [13] are restricted to the 3-148.5-kHz range as shown in Table I. Only utility providersmay use the 3-95-kHz range as dictated by EN 50065-1.General applications can make use of the 95-148.5-kHz band[13]. IEEE Std. 1901.2 recommends QP and AV emissionslimits given in Table I for the unregulated 150-500-kHz band.This standard does not impose a P limit, and thus, thispaper focuses on achieving robust and reliable low-data-rateNB-PLC in the 150-500-kHz frequency band by leveragingthe opportunity provided by the QP limits and measurementprocedure.
Fig. 1(a) shows the conducted EMI measurement set-uprecommended in CISPR 16-1-1 [24]. This measurement set-up is currently employed by the FCC [14] and CENELEC[13] in the United States and Europe, respectively. A lineimpedance stabilization network (LISN) is placed between thePLC device under test (DUT) and the EMI receiver shownin Fig. 1(a). The LISN presents a constant 50-Ω impedanceto the DUT for high-frequency currents and blocks noise onthe power line. The transmitted RF signal from the DUTis pre-conditioned before down-mixing to the baseband forfurther processing. A sweep or stepped-sweep generator setsthe output of the local oscillator (LO) to cover the frequencyrange of interest designated by the EMC standard [24]. Anintermediate frequency (IF) filter with a 6-dB bandwidth of 8-10 kHz filters the resulting signal. The center frequency of theIF filter can be between 10 Hz and 3 MHz [24]. Finally, thecircuits in Figs. 1(b) and 1(c) generate the QP or P value of thesignal’s envelope respectively. These values are measured bya second-order critically-damped indicating instrument [24].The circuit in Fig. 1(c) can also generate the AV value whenthe diode is replaced by a buffer. The resulting measurementsvary depending on the structure and bandwidth of the inputRF signal, and parameters of the IF filter and detectors.

3
(b)
RF
Attenuator
Loudspeaker
(a)
Preselection Preamplifier Mixer
LO
IF
Filter
IF
e.g. 10 Hz-
3 MHz
Envelope
Detector Detectors
Quasi-
peak
Display Sweep/
Stepped-Sweep
Generator
(c)
Fig. 1. (a) Recommended CISPR conducted emissions measurement set-up. (b) Quasi-peak detector circuit. (c) Peak detector circuit.
Fig. 2. Impact of pulse width and period on the output of the QP and AVdetectors.
Leveraging the QP regulatory limits to achieve high reli-ability in low-bandwidth PLC systems starts with examiningthe QP detector in more detail. The QP detector given in Fig.1(b) is consistent with EMI testing standards defined by CISPR[15]. The QP detector circuit consists of a diode, a capacitorand two resistors as shown in Fig. 1. The capacitor voltage,VQP , is the output of the QP detector and the diode preventsthe capacitor from charging when VQP is higher than Vin.When the envelope detector generates a pulse at Vin, it chargesthe capacitor through resistor Rc. When Vin is below VQP ,the capacitor discharges through resistor Rd. CISPR providesthe necessary charging and discharging time constants [24].Given various RF input signals with equal amplitude, theQP detector will generate a lower QP value as either the
signal’s pulse width or pulse frequency decreases. Fig. 2demonstrates this phenomenon by varying the pulse width andpulse frequency of a potential transmitted signal. PLC systemsgenerally encode a data symbol in each transmission pulse, sothe QP value will increase as the symbol rate increases. TheAV value of a short pulse is usually significantly lower thanthe QP value as shown in Fig. 2. Thus, the QP value is mostoften the limiting factor in maximum transmitted power.
The IF filter only allows the EMI receiver in Fig. 1(a)to capture energy within its pass band. Signals with largerbandwidths than the IF filter have a lower QP value thansignals with a single carrier frequency. A chirp signal isone way to spread the spectral content partially outside thebandwidth of the IF filter. Instantaneously, the chirp signal isa single frequency that can pass through the IF filter duringsome part of the frequency sweep. The rate of the frequencysweep, combined with the bandwidth of the IF filter, sets thewidth of the pulse on the envelope detector output. Thus, afaster sweep rate reduces both the effective pulse width andthe resulting QP value as shown in Fig. 2. When comparedwith a single carrier frequency signal, this wide-bandwidthchirp can achieve a lower QP value at frequencies common toboth signals.
The EMI measurement procedure was simulated in MAT-LAB to determine the maximum allowable transmitted powerfor various NB-PLC carriers. Figs. 3 and 4 illustrate theimpact of symbol rate, symbol width, and carrier type onthe maximum achievable transmitted power. Fig. 3 shows thatthe maximum transmitted power per symbol increases as thesymbol rate decreases, as long as the symbol width is heldconstant and the QP value is always at the limit. This effect ismainly driven by the discharge time of the QP detector. Fig.4 demonstrates that maximum transmitted power per symbol

4
0 10 20 30 40 50
-25
-20
-15
-10
-5
0
Fig. 3. Impact of quasi-peak limits on maximum transmitted power of variouscarrier signals when varying symbol rate.
0 2 4 6 8 10
-12
-10
-8
-6
-4
-2
0
Fig. 4. Impact of quasi-peak limits on maximum transmitted power of variouscarrier signals when varying pulse width.
increases as the width of the carrier pulse decreases. Thenature of the QP detector creates this effect, and chargingtime determines what range of pulse widths permit higherpower levels. Low-data-rate NB-PLC can utilize significantlyhigher transmitted power, and thus provides the best chanceto achieve wide coverage and high reliability for smart gridPLC applications. The control of slow-switching heating,ventilation, and air-conditioning (HVAC) loads for demand-side management does not require high data throughput, andis an ideal application for low-data-rate NB-PLC.
The structure of the symbol carrier also impacts the trans-mitted symbol power. Frequency modulated carriers, withspectral content wider than the IF filter pass band, can transmitmore power as shown in Figs. 3 and 4. The chirp signal is aneasily customizable signal which leverages the characteristicsof the EMI setup to operate at higher signal power. Thus, NB-PLC systems that encode data using signals similar to chirpsignals can transmit more power per symbol than systemsthat employ single frequency carriers, such as binary phaseshift keying or frequency shift keying (FSK). Although the
injected signals used for Figs. 3 and 4 do not violate conductedemissions limits, safety limits such as surge voltage should beconsidered during system design.
IV. CHIRP SPREAD SPECTRUM
By spreading the carrier spectrum to occupy a wide range ofthe allocated frequency band, spread-spectrum communicationcan combat narrowband frequency-selective attenuation andmultipath fading in PLC channels [25]. Direct-sequence [26],frequency-hopping [27], and chirp [28] are the most commonspread-spectrum techniques. Chirp spread spectrum does notrequire accurate synchronization between the receiver andtransmitter, which reduces the complexity of receiver circuits[29]. Chirp signals can encode each symbol into a widefrequency range. As discussed in Section III, this propertyallows for higher transmitted power and thus higher receivedpower due to the properties of the EMI measurement setup.
A. Chirp Signal Theory
The time-domain representation of a chirp pulse waveformis
x(t) = A(t)cos[θ(t)] (1)
where θ(t) is the phase and A(t) is the amplitude in the inter-val 0 ≤ t ≤ T . T is the symbol duration. The instantaneousfrequency, f(t) is
f(t) =1
2π
dθ(t)
dt(2)
while the chirp rate, µ(t) is
µ(t) =df(t)
dt=
1
2π
d2θ(t)
dt2. (3)
Chirp spread spectrum is achieved by spreading the instanta-neous frequency, f(t), across the frequency band of interestthroughout the symbol duration. For linear chirps, f(t) varieslinearly with time and the chirp rate is constant.
This paper employs linear chirp signals that occupy part ofthe 150-500-kHz NB-PLC spectrum. The transmitted powerincreases as the bandwidth of the signal increases, and thisproperty heavily affects the careful selection of chirp signalbandwidth. However, the higher frequency components of thecarrier signal are more susceptible to PLC channel attenuation,and this effect limits the practical chirp signal bandwidth.This effect will be discussed in Section VI. When setting thebandwidth, the level of power transmitted and the fraction ofpower exposed to high levels of attenuation create a trade-off.
B. Proposed Modulation Scheme
This paper employs binary orthogonal keying (BOK) as thepreferred modulation scheme. A digital bit “1” is encoded bya linear chirp signal with a positive chirp rate, +|µ|. This isknown as an “up-chirp”. A “down-chirp” has a negative chirprate, −|µ|, and represents a digital bit “0”. A “down-chirp” isrepresented by
x0(t) = A0(t)cos[2πf0t− π|µ|t2 + θ0] (4)

5
while an “up-chirp” is represented by
x1(t) = A1(t)cos[2πf1t+ π|µ|t2 + θ1]. (5)
In (4) and (5), f0 and f1 are the frequencies at t = 0, θ0 andθ1 are the initial phases.
C. Proposed Receiver
The conventional receiver required to demodulate knownsignals in the presence of noise is discussed in chapter 6 of[30]. The receiver contains matched filters, envelope detectors,and threshold detectors. The proposed receiver’s matchedfilters employed in this work are given by
gi(t) =
∫ T
0
hi(t− τ)r(τ)dτ, 0 < t < T (6)
where i = 0, 1 corresponds to the received “down-chirp” and“up-chirp” signals respectively. The impulse responses of the“down-chirp” and “up-chirp” are, respectively, given by
h0(t) = x0(T − t) = x1(t) (7)
and
h1(t) = x1(T − t) = x0(t). (8)
The received signal, r(t), is
r(t) = α(t)xi(t) + n(t) (9)
if a transmitted symbol is present or
r(t) = n(t) (10)
if absent, where n(t) is band-limited noise and α(t) is thechannel gain. Due to the infrequent transmission of carriersignals required in low-bandwidth control and sensing appli-cations, the absent-signal case must be considered.
This paper proposes a pseudo-binary receiver to determinethe presence of xi(t) in r(t). The envelope peaks of g0(t) andg1(t) are computed and compared to thresholds derived inReference [30] to completely demodulate the received signal.Assuming equal energy in x0(t) and x1(t), the received bit isdetermined by the proposed receiver to be “1” if
g1(t)− g0(t) >N0
2ln(
P0
P1) (11)
and
g1(t) >1
2
∫ T
0
x21(t) +N0
2ln(
P2
P1) (12)
are satisfied. In these conditions, gi(t) denotes the peak ofthe i-th matched filter’s output envelope and N0 is the noisepower. Pi is the a priori probability corresponding to (9) andP2 is the a priori probability corresponding to (10).
Conversely, the received bit is determined to be “0” if
g0(t)− g1(t) >N0
2ln(
P1
P0) (13)
and
g0(t) >1
2
∫ T
0
x20(t) +N0
2ln(
P2
P0) (14)
are satisfied. Otherwise, r(t) = n(t) is said to be correct.
V. PROPOSED HARDWARE DESCRIPTION
The proposed PLC modem consists of both a transmitterand receiver, which interface with the electric utility through ashared multi-input and multi-output (MIMO) coupler. The de-sign utilizes a Cypress PSoC 5LP microcontroller (MCU). TheMCU is a mixed-domain chip that can implement configurablefilters and mixers, in addition to performing analog-to-digitaland digital-to-analog conversions. Fig. 5 presents the blockdiagram of the proposed PLC transmitter. A Tx stack bufferin the MCU stores the bit to be transmitted. The utility voltageprovides a global clock to improve synchronization betweendifferent PLC modems. A zero-crossing detector implementedwith an optoisolator converts the line voltage to a digitalvoltage-polarity signal. A monostable multivibrator in theMCU triggers on the rising edge of the zero-crossing detector’soutput, signaling the Tx stack buffer to “pop” the next bitfor transmission. A switch temporarily blocks the signal fromthe monostable multivibrator after each transmission, limitingthe data rate to 1/TD. The MCU modulates the bit fromthe Tx buffer into an 8-bit discrete-time chirp signal, andthen performs digital-to-analog conversion (DAC). A switchin the MCU and the MIMO coupler’s configuration determinethe physical PLC channel. The chirp signal is conditionedin the analog front end by the programmable-gain amplifier(PGA), low-pass filter (LPF), and power amplifier (PA) beforeit reaches the coupler. The transformers and capacitors isolatethe low-voltage circuitry from the high-voltage power line.Solid-state relays (SSRs) change the connection of the couplerto the electric utility, affecting the physical PLC channel. Forinstance, when only SSR1 and SSR2 are ON, the line-neutralchannel is being used. These circuit elements work together toinject a chirp signal current, which encodes a single bit, intothe electric utility. After signal attenuation and corruption bynoise, the receiver demodulates the received signal.
The receiver section of the proposed PLC modem is shownin Fig. 6. The corrupted signal passes through the MIMOcoupler and into the analog front end. This front end condtionsthe received signal using PGAs and a band-pass filter. Similarto the transmitter, a switch in the MCU and the SSRs inthe MIMO coupler determine the physical PLC channel. Theresulting signal is down-mixed to baseband in the MCU.The LO frequency is determined by the maximum frequencyof the chirp carrier signal. An LPF prevents aliasing in thesampling stage, and the cut-off frequency depends on thebandwidth of the chirp signal. An analog-to-digital converter(ADC), triggered by the same multivibrator in the transmitter,converts the received signal to its discrete-time form. Thisdiscrete-time received signal is the input to the two matchedfilters presented in Section IV, which are implemented indiscrete time. The envelope detectors and threshold comparatorperform the operations given in (11)-(14) to determine thereceived bit. The Rx buffer stores the received bit to completethe demodulation process.
VI. EXPERIMENTAL TEST SYSTEM
To demonstrate the effectiveness of the proposed chirpspread-spectrum technique and PLC modem, a difficult electri-cal environment for PLC is selected. Here, a 24-floor high-rise

6
Serial
Data
Input
Modulator
Bit 1
Bit 2
Bit N
.
.
.
DACPGA PA
PGA PA
Line
Neutral
Earth
LPF
LPF
Monostable
Multivibrator
Switch
Zero-Crossing
Detector
Circuit
PSOC 5LP
Microcontroller
MIMO
Coupler
SSR1
SSR2
SSR3Tx
Buffer
Port 1
Port 2
Analog Front End 2
Analog Front End 1
Fig. 5. Block diagram of the PLC modem transmitter.
Serial Data
Output
BPF
Switch
PSOC 5LP
Microcontroller
PGA 1Port
1
Multivibrator
Output
ADCMatched
Filters
Envelope
Detectors &
Threshold
Comparator
PGA 2
BPF
PGA 1Port
2PGA 2
Analog Front End 2
Analog Front End 1 LPF
Mixer
LO
Bit 1
Bit 2
Bit N
.
.
.
Rx
Buffer
Fig. 6. Block diagram of the PLC modem receiver.
building in the Massachusetts Institute of Technology (MIT)campus is used. The building has challenging attenuationcharacteristics and provides an excellent testing ground forthe proposed PLC technique and hardware.
The electrical system of the test building is shown in Fig.7. Power is delivered from the grid through a three-phasedelta-wye grounded transformer located in the basement ofthe building. The main service panel consists of an air circuitbreaker fed from the transformer by three-phase four-wirecabling. The neutral and earth are bonded together at node1 in Fig. 7. The out-going three-phase five-wire cabling splitsat node 2 to supply the two main circuits in the building. Thebuilding is electrically divided into two groups. Floors oneto thirteen are supplied from one main circuit, while fourteenthrough twenty-four are supplied from the other as indicatedin Fig. 7. The main circuits branch out at nodes 3 and 4.Each floor is protected by two circuit breakers in addition todistribution breakers for each main circuit. The three-phase,five-wire supply cables are divided at each floor’s branchcircuit to carry single-phase power to the numerous single-phase power outlets on each floor. The only exceptions arethe 208V phase-phase power outlets for electric ovens in theresidences. As a result, some single-phase power outlets onthe same floor are supplied from different phases of the three-
phase distribution circuits. In general, results published in [9]show that PLC performance does not degrade significantlywhen communicating from one phase to another.
Consider a building automation/smart-grid application rely-ing on PLC installed in this building. Controllable loads, suchas HVACs and dishwashers, are fitted with PLC modems andconnect to different branch circuits located on various floors inthe high-rise building. The array of utility connections formsa local communication network. The size and structure ofthe building’s power distribution network increases networkcomplexity and places varying electrical distance betweendifferent modems. Depending on the location of two com-municating PLC modems, signals must pass through multiplecircuit breakers, EMI chokes, and filters. These elementsintroduce extra obstacles that are not usually present in smallerresidential buildings. This typically translates to higher signalattenuation between transmitting and receiving nodes [9].
To evaluate the attenuation characteristics of the test build-ing, a receiver is placed on the 24th floor, and a transmitteris placed on the 2nd, 13th, 14th, or 24th floor. Fig. 8 presentsthe attenuation results for the various transmitter locationsand utility connections. The results in Fig. 8 are employed toselect appropriate physical and spectral PLC channels in thiswork. A more sophisticated channel selection process that uses

7
MEDIUM VOLTAGE POWER LINE
FLOORS' 1-13
BRANCH CIRCUITS
1
DISTRIBUTION
TRANSFORMER
2
3 4
FLOORS' 14-24
BRANCH CIRCUITS
MAIN AIR CIRCUIT
BREAKER
DISTRIBUTION CIRCUIT 2
BREAKER
DISTRIBUTION CIRCUIT 1
BREAKER
i ELECTRICAL NODE i
P/BD
L1A/B
P/BD
L14A/B
P/BD
L13A/B
P/BD
L24A/B
Fig. 7. Electrical circuit diagram of a 24-floor high-rise apartment buildingon MIT campus.
-80
-60
-40
-20
-80
-60
-40
-20
150 200 250 300 350 400
-80
-60
-40
-20
Fig. 8. Channel gain of key communication links in the test building withPLC receiver on 24th floor. (a) line-neutral channel. (b) neutral-earth channel.(c) line-earth channel.
impedance information at the transmitter, noise information atthe receiver and attenuation will be presented in a future paper.The MIMO coupler of the PLC modem transmitter shownin Fig. 5 is configured as discussed in Section V to probethe individual physical channels. The main components ofthe MIMO coupler are one center-tapped and one non-center-tapped PLC transformers manufactured by Wurth Electronics.It also consists of three 0.15µF metalized polypropylenecapacitors rated at 300VAC and three solid-state relays already
mentioned in Section V.The attenuation of the 24th to 24th floor line-neutral channel
is shown in Fig. 8(a). The attenuation varies from about 20dB at 150 kHz to 56 dB at 375 kHz. Due to excessivesignal attenuation on the line-neutral channel, the attenuationcould not be accurately estimated for the other transmitterlocations. Signal attenuation on the neutral-earth and line-earthchannels are presented in Figs. 8(b) and 8(c) respectively. Theattenuation on the 2nd to 24th and 13th to 24th floor linkscould not be accurately estimated at frequencies greater than250 kHz and is not reported. Figs. 8(b) and (c) show thatthe neutral-earth and line-earth channel attenuation is lowerthan the line-neutral channel attenuation. The presence ofpower electronics EMI filters introduces a significantly highercapacitive load on the line to neutral channel. This is themajor reason the attenuation on the line to neutral channel issignificantly larger than the attenuation on the other channels.Figs. 8(b) and (c) also reveal that moving the transmitter fromthe 24th to the 14th floor increases the attenuation by about15 dB on average. However, when the transmitter is movedby one more floor (14th to 13th), the average attenuationincreases by an additional 25 dB. The 13th floor is on adifferent distribution circuit than the 14th and 24th floors,resulting in the rapid increase in attenuation. Communicationsignals experience more attenuation in this case because theytravel a longer distance and through more breakers as indicatedin Fig. 7. The attenuation in the 2nd and 13th to 24th floorlinks are very similar because both transmitting floors areon the same circuit and signal degradation is dominated bycrossing from one circuit to the other. NB-PLC attenuation inthe test building is about 10-50 dB greater than the attenuationrecorded in other buildings presented in [6] and [9]. Despitethe above-average challenges of this building’s PLC channels,the proposed technique and hardware can achieve reliable low-data-rate PLC.
VII. EXPERIMENTAL RESULTS AND DISCUSSION
Now that the test environment has been characterized,the data transmission performance of the proposed low-data-rate PLC technique and hardware can be evaluated. Othermodulation schemes, including chirp-BOK and FSK, are alsoevaluated to show the benefit of the chirp technique whenoperating at the QP regulatory limit.
In these tests, a transmitting PLC modem is connectedto the electric utility on various floors of the test building.The modem’s Tx buffer is loaded with a known symbol (bit)sequence to evaluate the detection probability. The receivermodem is connected to the electric utility on the 24th floorand will attempt to decode the transmitted bit sequence. Therates and power levels of various symbols are used to measurethe transmitted symbol detection probability as a function ofsymbol rate or signal-to-noise ratio (SNR). To minimize atten-uation as shown in Fig. 8, the line-earth physical channel and170-200-kHz spectral channel are used. Consequently, linearchirps with 30-kHz bandwidth and 4 ms duration are employedto modulate the digital data. The receiver’s ADC samplingfrequency is set to 1 MSps, the receiver LO frequency is 210kHz, and the anti-aliasing filter cut-off frequency is 45 kHz.

8
0 2 4 6 8 10
0
0.2
0.4
0.6
0.8
1
Fig. 9. Impact of chirp-BOK modulation at the QP regulatory limit on PLCperformance in the test building.
A. Performance of the Proposed Communication Scheme
Fig. 9 provides an overview of communication performanceusing BOK modulation at the QP regulatory limit. The prob-ability of successfully detecting a symbol is plotted againstsymbol rate with the transmitter placed on either the 2nd, 9th,13th, 14th, or 24th floor. The PLC modems maintain highfidelity communication when the transmitter and receiver areon the same distribution circuit, i.e., when the transmitter isplaced on the 14th or 24th floor. One-hundred percent reliablecommunication is possible at up to 8 symbols-per-second. Incontrast, the PLC modems placed on the 2nd, 9th, and 13thfloors drop below 50% reliability at 2 symbols-per-second.As Fig. 8 demonstrated, communication between the twomain distribution circuits in the test building results in heavyattenuation, leading to weak performance PLC. However, thereliability typically remains above 0%, allowing techniques atthe data transport layer to make use of the PLC link for low-data-rate applications.
Smart grid applications, such as load control and demandresponse, depend on coverage and reliability rather than com-munication bandwidth. The proposed technique and hardwaremeet this challenge by enabling low-data-rate PLC in ex-tremely harsh electrical environments.
B. Impact of Leveraging QP Regulation Opportunity
The QP opportunity permits higher transmission power, butonly in the absence of a P limit. The QP technique presented inSection III leverages the measurement circuit to maximize thesignal energy for each symbol. Without a P limit, the QP limitvalues may be used as a substitute, leading a designer to reducethe power level unnecessarily. The resulting PLC modems willhave lower reliability and coverage. Fig. 10 demonstrates thiseffect by displaying new 2nd and 14th floor tests with thethe transmitter peak power equal to the QP limit. Fig. 10shows the reduced communication reliability resulting fromlower transmission power. The detection probability from the14th floor drops by 40-50% across the measured symbol-raterange. In the 2nd floor case, the probability drops by as muchas 90%. Thus, leveraging the QP opportunity is necessary to
0 2 4 6 8 10
0
0.2
0.4
0.6
0.8
1
Fig. 10. Effect of leveraging QP regulations on chirp-BOK modulationscheme performance.
0 2 4 6 8 10
0
0.2
0.4
0.6
0.8
1
Fig. 11. Performance comparison between chirp-BOK and FSK modulationschemes.
maximize the coverage and reliability of low-data-rate PLCmodems.
C. Modulation Scheme Comparison
The chirp signal better utilizes the QP opportunity byinteracting with the IF filter to shorten the measured pulsewidth. A single frequency carrier scheme, such as FSK, doesnot have this advantage and must transmit at lower power forthe same pulse width. Fig. 11 demonstrates the disadvantageposed by FSK. Here, 170-kHz and 180-kHz sinusoidal carriersrepresent “1” and “0” respectively. Again, the transmitteris placed on either the 2nd or 14th floor for these tests.In either case, the FSK performance is dramatically lowerthan the proposed chirp-BOK technique. In the 2nd floorcase, the reliability drops by as much as 95%. Further, aFSK-based PLC link cannot be established at or above 2symbols-per-second. This test demonstrates that the proposedBOK modulation scheme improves communication fidelitycompared to FSK by permitting higher transmitted powerlevels.

9
1 1.5 2 2.5 3 3.5
0
0.2
0.4
0.6
0.8
1
Fig. 12. Proposed receiver operating characteristics showing the impact ofmatched filter’s output SNR on symbol detection rate.
D. Proposed Receiver Operating Characteristics
The receiver operating characteristics (ROC) indicate thereliability of a receiver with respect to SNR. Fig. 12 gives theROC of the proposed PLC modem when utilizing the full QPopportunity with chirp-BOK modulation. The curve utilizesthe data collected for various transmitter locations. The SNRis calculated from the output of the matched filter. The plotalso gives a curve fit with an exponential function. The ROCallows a PLC system designer to estimate the performanceof PLC modems based on known channel characteristics andtransmission power. The ROC permits estimation of perfor-mance when error-correction codes (ECC) are employed.
VIII. CONCLUSION
The proposed leveraging of the QP measurement technique,combined with chirp-BOK modulation, permits dramaticallyimproved reliability and coverage for PLC modems. Smart-grid applications, such as load control and demand response,can take advantage of the enhanced coverage without beinglimited by the low data rate. This article presents an exper-imental case study in a high-rise building with challengingPLC channel characteristics to demonstrate the performanceof the proposed PLC modem. Experiments also demonstratethe benefit of chirp-BOK modulation in comparison to FSKto better utilize the QP regulatory limit.
REFERENCES
[1] S. C. Shabshab, P. A. Lindahl, J. K. Nowocin, J. Donnal, D. Blum,L. Norford, and S. B. Leeb, “Demand smoothing in military microgridsthrough coordinated direct load control,” in IEEE Transactions on SmartGrid, vol. 11, no. 3, pp. 1917–1927, 2020.
[2] M. Nassar, J. Lin, Y. Mortazavi, A. Dabak, I. H. Kim, and B. L. Evans,“Local Utility Power Line Communications in the 3–500 kHz Band:Channel Impairments, Noise, and Standards,” in IEEE Signal ProcessingMagazine, vol. 29, no. 5, pp. 116–127, Sept. 2012.
[3] S. Galli, A. Scaglione, and Z. Wang, “For the Grid and Through theGrid: The Role of Power Line Communications in the Smart Grid,” inProceedings of the IEEE, vol. 99, no. 6, pp. 998–1027, June 2011.
[4] H. Farhangi, “The path of the smart grid,” in IEEE Power and EnergyMagazine, vol. 8, no. 1, pp. 18–28, 2009.
[5] C. Cano, A. Pittolo, D. Malone, L. Lampe, A. M. Tonello, and A. G.Dabak, “State of the Art in Power Line Communications: From theApplications to the Medium,” in IEEE Journal on Selected Areas inCommunications, vol. 34, no. 7, pp. 1935–1952, July 2016.
[6] K. Sharma and L. M. Saini, “Power Line Communications for SmartGrid: Progress, Challenges, Opportunities and Status,” Renewable andSustainable Energy Reviews, vol. 67, pp. 704–751, 2017.
[7] N. Pavlidou, A. J. Han Vinck, J. Yazdani, and B. Honary, “Powerline communications: state of the art and future trends,” in IEEECommunications Magazine, vol. 41, no. 4, pp. 34–40, April 2003.
[8] R. M. Vines, H. J. Trissell, L. J. Gale, and J. B. O’neal, “Noiseon Residential Power Distribution Circuits,” in IEEE Transactions onElectromagnetic Compatibility, vol. EMC-26, no. 4, pp. 161–168, Nov.1984.
[9] M. H. L. Chan and R. W. Donaldson, “Attenuation of CommunicationSignals on Residential and Commercial Intrabuilding Power-DistributionCircuits,” in IEEE Transactions on Electromagnetic Compatibility,vol. 28, no. 4, pp. 220–230, Nov. 1986.
[10] M. Zimmermann and K. Dostert, “A multipath model for the powerlinechannel,” in IEEE Transactions on communications, vol. 50, no. 4, pp.553–559, April 2002.
[11] R. M. Vines, H. J. Trussell, K. C. Shuey, and J. B. O’Neal, “Impedanceof the Residential Power-Distribution Circuit,” in IEEE Transactions onElectromagnetic Compatibility, vol. EMC-27, no. 1, pp. 6–12, Feb. 1985.
[12] M. Girotto and A. M. Tonello, “EMC Regulations and Spectral Con-straints for Multicarrier Modulation in PLC,” in IEEE Access, vol. 5,pp. 4954–4966, 2017.
[13] CENELEC, “EN50065-1: Signaling on Low Voltage Electrical Installa-tions in the Frequency Range 3 kHz to 148.5 khz,”,” Part 1: Generalrequirements, frequency bands and electromagnetic disturbances, Euro-pean Committee for Electrotechnical Standardization, 2001.
[14] FCC, “Part 15:Regulations July 10, 2008 from Federal Communica-tions Commission Internet site http://www.fcc.gov/oet/info/rules/part15,”PART15 07-10-08. pdf, Tech. Rep., 15.
[15] CISPR, “22: Information technology equipment radio disturbance char-acteristics limits and methods of measurement IEC,” 2005.
[16] “IEEE Standard for Low-Frequency (less than 500 khz) NarrowbandPower Line Communications for Smart Grid Applications,” IEEE Std1901.2-2013, pp. 1–269, 2013.
[17] “IEEE Recommended Practice and Requirements for Harmonic Controlin Electric Power Systems,” IEEE Std 519-2014 (Revision of IEEE Std519-1992), pp. 1–29, 2014.
[18] “IEEE Recommended Practice on Characterization of Surges in Low-Voltage (1000 v and Less) AC Power Circuits,” IEEE Std C62.41.2-2002,pp. 1–53, 2003.
[19] T. IEC, “60755: Residual current protective device dependent or inde-pendent in line voltage,” 2008.
[20] D. P. F. Moller and H. Vakilzadian, “Ubiquitous Networks: Power LineCommunication and Internet of Things in Smart Home Environments,”in IEEE International Conference on Electro/Information Technology,2014, pp. 596–601.
[21] J. Matanza, S. Alexandres, and C. Rodrıguez-Morcillo, “Advancedmetering infrastructure performance using european low-voltage powerline communication networks,” in IET Communications, vol. 8, no. 7,pp. 1041–1047, May 2014.
[22] Yute Chen and Jeng Kuang Hwang, “A reliable energy informationsystem for promoting voluntary energy conservation benefits,” in IEEETransactions on Power Delivery, vol. 21, no. 1, pp. 102–107, Jan. 2006.
[23] S. Hsieh, T. Ku, C. Chen, C. Lin, and J. Tsai, “Broadcasting Control ofIntelligent Air Conditioners Using Power-Line-Carrier Technology,” inIEEE Transactions on Industry Applications, vol. 51, no. 2, pp. 1890–1896, 2015.
[24] CISPR, “16-1-1: Specification for radio disturbance and immunity mea-suring apparatus and methods-part 1-1: Radio disturbance and immunitymeasuring apparatus-measuring apparatus,” 2015.
[25] Huaiyu Dai and H. V. Poor, “Advanced signal processing for power linecommunications,” in IEEE Communications Magazine, vol. 41, no. 5,pp. 100–107, May 2003.
[26] P. van der Gracht and R. Donaldson, “Communication UsingPseudonoise Modulation on Electric Power Distribution Circuits,” inIEEE Transactions on Communications, vol. 33, no. 9, pp. 964–974,Sept. 1985.
[27] K. M. Dostert, “Frequency-hopping spread-spectrum modulation fordigital communications over electrical power lines,” in IEEE Journalon Selected Areas in Communications, vol. 8, no. 4, pp. 700–710, May1990.
[28] D. Kim, S. Lee, K. Wang, J. Choi, and D. Chung, “A Power LineCommunication Modem Based on Adaptively Received Signal Detectionfor Networked Home Appliances,” in IEEE Transactions on ConsumerElectronics, vol. 53, no. 3, pp. 864–870, Aug. 2007.
[29] D. Radford, “Spread spectrum data leap through AC power wiring,” inIEEE spectrum, vol. 33, no. 11, pp. 48–53, Nov. 1996.

10
[30] A. D. Whalen, Detection of signals in noise. Academic press, 2013.
Adedayo O. Aderibole received the B.Sc. degreein electronic/electrical engineering from ObafemiAwolowo University, Ile-Ife, Nigeria, and the M.Sc.degree in electrical power engineering from theMasdar Institute, Khalifa University of Science andTechnology, Abu Dhabi, UAE, in 2013 and 2017,respectively. He is currently pursuing a Ph.D. degreein electrical engineering and computer science inMassachusetts Institute of Technology, Cambridge,MA, USA. His research interests include commu-nication theory, signal processing, power system
modeling and control.
Erik K. Saathoff received the B.S. degree in elec-trical engineering with a minor in physics from theUniversity of Illinois at Urbana-Champaign, Urbana,IL, USA, in 2018, and the M.S. degree in elec-trical engineering and computer science from theMassachusetts Institute of Technology, Cambridge,MA, USA, in 2021, where he is currently pursuingthe Ph.D. degree in electrical engineering and com-puter science. His research interests include high-performance power electronics, switched-capacitorconverters, and system identification.
Kevin J. Kircher received his doctoral degree inMechanical Engineering from Cornell University in2019. He is currently a postdoctoral researcher inElectrical Engineering and Computer Science at theMassachusetts Institute of Technology. His researchapplies learning, optimization and control methodsto smart buildings, focusing on their interaction withthe electrical grid.
Steven B. Leeb received his doctoral degree fromthe Massachusetts Institute of Technology in 1993.He has served as a commissioned officer in theUSAF reserves, and he has been a member ofthe M.I.T. faculty in the Department of ElectricalEngineering and Computer Science since 1993. Healso holds a joint appointment in MIT’s Departmentof Mechanical Engineering. He is the author or co-author of over 200 publications and 20 US Patents inthe fields of electromechanics and power electronics.
Leslie K. Norford received his doctoral degree inmechanical and aerospace engineering from Prince-ton University in 1984, after five years of activeduty as a nuclear power officer in the US Navy. Hehas been a member of the faculty of the Depart-ment of Architecture at the Massachusetts Instituteof Technology since 1988. His research interestsinclude design, operation and fault detection of spaceconditioning systems for low-carbon buildings andinteractions of buildings with the electrical grid andwith urban environments.