geographic information system (gis) spatial analyst techniques ...
Upload
khangminh22Category
view
7download
0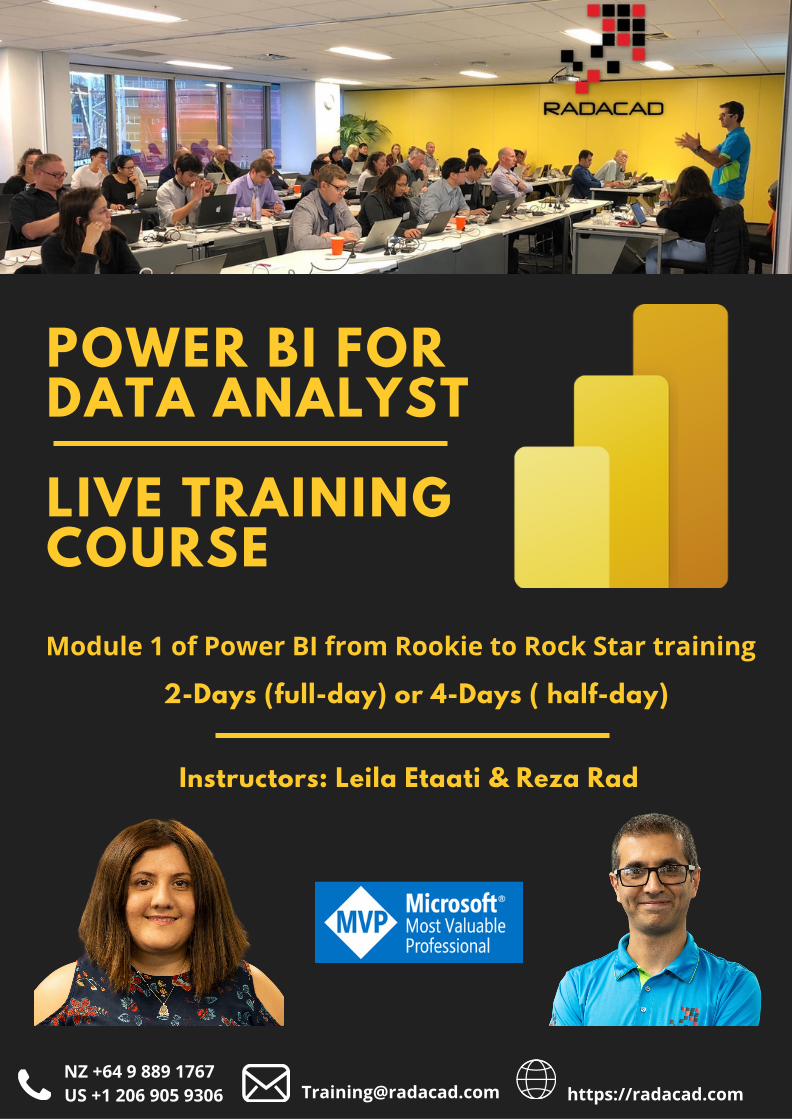
POWER BI FOR DATA ANALYST
LIVE TRAININGCOURSE
2-Days (full-day) or 4-Days ( half-day)
Instructors: Leila Etaati & Reza Rad
NZ +64 9 889 1767 US +1 206 905 9306 [email protected] https://radacad.com
Module 1 of Power BI from Rookie to Rock Star training

This training is designed for data analysts, who have the datamodeled and ready for them to visualize. In this training, you will learndetailed visualization practices of Power BI.In this two days training, you will learn all components of Power BIneeded for building Power BI reports and dashboards. You will learnabout components such as Get Data (Power Query), Modeling andDAX, and Visualization. You will also learn about the Power BI service(website), and components that are needed to share your reportswith others.The training continues with more focus on Visualization componentssuch as different types of charts and visuals and scenarios to usethem. You will also learn about advanced visualization techniquessuch as designing mobile reports, changing the interactivity of visuals,detailed learning of slicers and filters, creating parent-child reports,etc.At the end of this training, you will be able to do all visualizationrequirements for Power BI and will understand all other componentsof Power BI and how these are all working together.
NZ +64 9 889 1767 US +1 206 905 9306 [email protected] https://radacad.com

ABOUT THE INSTRUCTORS
Reza Rad is a Microsoft Regional Director, an Author, Trainer, Speaker, andConsultant. He has a BSc in Computer engineering; he has more than 20 years ofexperience in data analysis, BI, databases, programming, and developmentmostly on Microsoft technologies. He is a Microsoft Data Platform MVP for 11continuous years (from 2011 till now) for his dedication in Microsoft BI. Reza is anactive blogger and co-founder of RADACAD. Reza is also co-founder and co-organizer of Difinity conference in New Zealand, and the Power BI Summit (thebiggest Power BI conference)
Dr. Leila Etaati is the first Microsoft AI MVP in New Zealand and Australia, Shehas a Ph.D. in Information Systems from the University Of Auckland. And she hasbeen working with information systems since 20 years ago. She is the Co-directorand data scientist in RADACAD She is the co-organizer of Power BI and Analyticsuser group (meetup) in Auckland with more than 2500 members,.She is the co-director of conferences such as the Difinity Conference (2017 tillnow) and the Power BI Summit (the biggest Power BI conference). She is a DataScientist, BI Consultant, Trainer, and international Speaker. She is one of the veryfew AI and Data Platform Dual Microsoft MVPs in the world. Leila is an activeTechnical Microsoft AI blogger for RADACAD.
Our trainers, Reza and Leila, are the world’s well-known names in the Microsoft BI field. They are best-selling authors of more than ten Power BI books, invited speakers to the world’s best and largest PowerBI conferences, and they are both consultants dealing with Power BI challenges on real-world projects.They designed the course content themselves and delivered it to thousands of users worldwide.
https://radacad.comNZ +64 9 889 1767
US +1 206 905 9306

FORMAT OF THE COURSE:
NZ +64 9 889 1767 US +1 206 905 9306 [email protected]
09:00 – 10:30: course, lecture, and lab10:30 – 11:00: break11:00 – 12:30: course, lecture, and lab12:30 – 13:30: lunch break13:30 – 15:00: course, lecture, and lab15:00 – 15:30: break15:30 – 17:00: course, lecture, and lab
We run the courses either full-days or in half-days. If it runs Full-day. There will be four sessions of 1.5 hours each with thetiming below;
We also run it as half-days when we deliver it online/remote. Wefound this is more useful for attendees for remote training. Halfday trainings are two sessions of 1.5 hours with a 30 minutesbreak in between, which runs in four days.
https://radacad.com

AGENDA:
NZ +64 9 889 1767 US +1 206 905 9306 [email protected]
Introduction to Power BI: What is Power BI?Power BI Desktop; The First ExperiencePower BI Website; You’ll Need Just a Web BrowserIntroduction to Power BI Components: Power Query, Power Pivot, Power View, and PowerQ&A.
What is Power Query: Introduction to Data Mash-Up Engine of Power BIDifferent versions of Power QueryPower Query IntroductionQuery EditorTransformation GUIGet Started with Power Query: Movies Data Mash-UpPower BI Get Data from Excel: Everything You Need to KnowWhat is the Role of Power Query in a Power BI Solution
The training includes but is not limited to the topics below:
1.1: Introduction to Power BIPower BI is the newest Microsoft Business Intelligence and Data Analysis tool. In this module,we will go through the basics of this product and introduce all components of Power BI (PowerQuery, Power Pivot, Power View, and Power Q&A). You will see some demos and introductionsabout Power BI desktop, Office 365 Power BI subscription, and Power BI website, and mobileapps. You will see some basic demos of how easy it to use is Power BI in some scenarios.
1.2: Getting Data and TransformationGetting Data is the first experience of working with Power BI. You can connect to many datasources on-premises or on the cloud. In this section, you will learn how the Get dataexperience in Power BI is and how you can transform the data in a way to get it ready formodeling
https://radacad.com

NZ +64 9 889 1767 US +1 206 905 9306 [email protected]
Power BI xVelocity engine basics and conceptsRelationships in Power BIHierarchies and FormattingSorting by other columnsDate TableIntroduction to DAXCalculated Columns, Measures, and Calculated Tables
Power BI Desktop VisualizationFormatting Visuals in Power BI DesktopBasic Charts and Visuals in Power BISorting, Filtering, and categorizationCustom Visuals in Power BI DesktopMaps and Geo-Spatial Visualization
1.3: Data Modelling and DAXData Modelling in Power BI is an in-memory-based technology. You will learn about the structureof modeling in Power BI, and you will learn the importance of relationships and their direction.You will also learn about calculations in Power BI and how to write them. DAX is the DataAnalytical eXpression language. DAX has a similar structure to excel functions, but it is different.In this module, you will learn DAX about DAX too.The content that you will learn in this module includes but is not limited to;
1.4: Data VisualizationData Visualization is the front end of any BI application; this is the user viewpoint of your system.It is critical to visualize measures, and dimensions effectively so the BI system could tell the storyof the data. In this module, you will learn conceptual best practices of data visualizations whichare valid through all data visualization tools. You will learn Power BI visualization skills. You willlearn how to create effective charts, and dashboards using these tools as well as best practicesfor working with Power BI Desktop.The content that you will learn in this module includes but is not limited to;
https://radacad.com

NZ +64 9 889 1767 US +1 206 905 9306
Basic Sharing and using workspaces in Power BI web siteDashboard vs. ReportPower Q&AMobile Dashboard DesignRow Level SecuritySchedule Refresh vs. Other types of connectionsGateway’s Role in the Service
Importance of VisualizationBasic Charts; Bar and Column ChartsClustered vs. Stacked ChartsQ&A for ReportsQuick Measures in Power BIDrill Down and Up using visuals and hierarchiesPages
1.5: Power BI ServicePower BI components can be deployed into different environments such as the Power BIwebsite, Office 365 subscription, or even SharePoint on-premises. In this module, we will gothrough deployment options, Configurations, and requirements required for eachenvironment. You will learn how to deploy your Power BI files into the Power BI website. Youwill also learn how to build dashboards on the website, and how to work with Mobile Apps forApple, Android, and Windows Phone.The content that you will learn in this module includes but is not limited to;
1.6: Visualization BasicsVisualization is an important part of any BI system. In Power BI, Visualization plays a criticalpart. In this section, you will learn about why visualization is important, with few basics ofvisualizations such as comparing stacked vs. clustered charts. You will also learn in this sectionabout data exploration techniques such as drill down/up, using pages, etc.
[email protected] https://radacad.com
NZ +64 9 889 1767 US +1 206 905 9306 [email protected]
FiltersScopes of Filters: Visual Level, Page Level, Report LevelModes of Filtering: Basic, Advanced, Relative, Top NDrill through Page Filter: Creating master-details page scenario in Power BISlicersTypes of Slicers; Date, Text, NumberSlicer FormattingSyncing Slicer between Pages
Report Page TooltipControlling the interaction of Visuals in a pageDesigning Power BI reports for MobileGrouping and BinningBookmark; saving the state of a pageButtons; action itemsSelection pane; visibility control in Power BIGolden triangle; Bookmark, button, and selection paneColour theme or pallets in Power BI
1.7: Slicing and DicingThe importance of slicing and dicing data in Power BI is critical. Power BI is not a visualizationtool only, but it is also a data exploration tool. There are several ways you can filter the data.In this section, you will learn the difference between filters and slicers. You also learn aboutdifferent scopes of filtering, as well as filtering modes. For slicers, you will learn different typesof slicers and some advanced features such as syncing slicers through different pages.
1.8: Advanced Visualization in Power BIKnow that you know about visualizations and slicing and dicing, it is a good time to talk aboutsome advanced techniques which will take your visualizations to the next level in Power BI.You will learn about techniques such as changing the interaction of visuals, report pagetooltips, Bookmarks, and dynamic visualizations in this section.
https://radacad.com

NZ +64 9 889 1767 US +1 206 905 9306
Line Chart; Trend AnalysisCombo Charts; Different Scales in one graphRibbon Chart; RankingWaterfall Chart; CashflowScatter Chart; Storytelling with the dataGrouping charts: Pie, Donut chart, and Treemap chartsKPI visualGaugeCard VisualTable and Matrix; showing the numbers with conditional formatting
Map Visual; Using Bing to find spotsFine Tuning Address DetailsMap Visual; Using Latitude and LongitudeFilled Map; Regions and PolygonsData Category importance for the filled mapShape Map; Having custom map visualArcGIS Map; Map visual which can do everything
1.9: Best Practice Scenarios of Using VisualsIt is a good time to learn about all built-in visuals in Power BI now. It is important to know whichvisual should be used in what scenario. You will also learn in this section about the pros and consof each visual. You will learn specific features of the visual that can help to solve real-worldscenarios. All the examples will be hands-on.
1.10: Geo Location Visualization: Map VisualsIn Power BI, there are multiple ways of visualizing items on the map. In this section, you will learnabout all the built-in ways of using map visuals in Power BI, the pros, and cons of each method,and special considerations for some of the visuals.
[email protected] https://radacad.com

NZ +64 9 889 1767 US +1 206 905 9306
Adding and using a custom visualInfographic DesignerTachometer GaugeMap custom visualsCertified custom visualsHierarchy SlicerPlay AxisR Custom Visuals
1.11: Custom VisualsIn addition to the built-in list of Power BI visuals, you can leverage some of the third-partyvisuals created by other companies called Custom Visuals. Creating custom visuals is adeveloper topic, which we won’t discuss in this training, but you will learn about how to usecustom visuals. You will learn about the most useful custom visuals in Power BI through manydemos.
[email protected] https://radacad.com

WHAT ATTENDEES WILL RECEIVE AFTER THIS TRAINING?
NZ +64 9 889 1767 US +1 206 905 9306
All data files and Power BI files related to demos andexamplesthe Handout of the trainingaccess to the video training version of this course recordedseparately. To be watched at your own pace. This worth $260USD per module per user, but available complimentary to ourlive course attendees.Certificate of completion
[email protected] https://radacad.com

WHY IS THIS THE BEST TRAINING AVAILABLE FOR POWER BI?
NZ +64 9 889 1767 US +1 206 905 9306
The content is created and updated directly by Reza Rad and Leila Etaati withyears of experience with Microsoft BI and Power BI products. They areauthors of more than 10 best-selling books on Power BI.The sample of list of companies who have purchased our training programThe amazing 5-star feedback from attendees of our training shows the levelof learning.This is the only Power BI training program in the world covering 7 modulesand all aspects of Power BI learning for up to 10 days of training.
[email protected] https://radacad.com

POWER BI FROM ROOKIE
TO ROCK STAR
NZ +64 9 889 1767 US +1 206 905 9306
Module 1: Power BI for Data Analysts (2 days)Module 2: Data Modeling with Power BI (1 day)Module 3: Power Query: Get data and transform (2 days)Module 4: DAX and Calculations in Power BI (2 days)Module 5: Power BI Design Patterns (1 day)Module 6: Power BI Architecture (1 day)Module 7: Power BI for AI and Data Scientists (2 days)
This is the most comprehensive course for Power BI on the planet whichis split into modules. You can enroll in any of these modules separatelyor take the whole course.
Modules are designed independently, which means each module can betaken regardless of the order of modules. Here are a list and detailedagenda of each module:
Training for a big group? Contact us for Corporate Training
Upcoming public courses:https://learn.radacad.com/events/
Contact us with any questions https://radacad.com
Copyright © 2022 FDOKUMEN