Cochlear Implantation Improves Both Speech Perception and ...
Upload
khangminh22Category
view
1download
0
HAL Id: tel-01124129https://tel.archives-ouvertes.fr/tel-01124129
Submitted on 6 Mar 2015
HAL is a multi-disciplinary open accessarchive for the deposit and dissemination of sci-entific research documents, whether they are pub-lished or not. The documents may come fromteaching and research institutions in France orabroad, or from public or private research centers.
L’archive ouverte pluridisciplinaire HAL, estdestinée au dépôt et à la diffusion de documentsscientifiques de niveau recherche, publiés ou non,émanant des établissements d’enseignement et derecherche français ou étrangers, des laboratoirespublics ou privés.
Potential roles of TFPI in both thrombotic andhemorrhagic diseases
Brigitte Tardy-Poncet
To cite this version:Brigitte Tardy-Poncet. Potential roles of TFPI in both thrombotic and hemorrhagic diseases. Hu-man health and pathology. Université Jean Monnet - Saint-Etienne, 2012. English. �NNT :2012STET007T�. �tel-01124129�

Université Jean Monnet – Saint Etienne
Thèse
Présentée
Pour l’obtention du grade de Docteur en Sciences
Ingénierie, Santé ; ED SIS 488
par
Madame Brigitte Tardy-Poncet
Née le 30 mars 1961 à Saint Etienne (Loire)
Titre
Potential roles of TFPI
in both thrombotic and hemorrhagic diseases
Directeur de thèse
Professeur Bernard Tardy
Soutenue publiquement le 26 Novembre 2012
Jury
Professeur Per Morten Sandset (rapporteur)
Docteur Véronique Regnault (rapporteur)
Professeur Ismail Elalamy
Professeur Pierre Morange
Professeur Patrick Mismetti

To Professor Bernard Tardy,
I greatly esteem his boundless energy, his creativity, his well-known generosity towards patients and students, and his unfailing readiness to help. He has been (and is still) at the head of numerous projects that he has unfailingly led to the end. He is always very enthusiastic about new projects. He has the ability to unite many people around a single project and help them achieve the goal set. His positive spirit is of inestimable value to our research group, in which he plays a major role.
I appreciate his confidence in my work, which has been of great help.
To Professor Patrick Mismetti, I have a great admiration for his gift for teaching: whenever he presents a scientific
study, even its most complicated aspects become easy to understand. He has played a major part in the development of many new antithrombotic drugs. His extensive knowledge of these has made him an international reference in this domain. He is always keen to work on new projects. I am very happy and proud to belong to his research group. I thank him for accepting to judge my work.
To Professor Per Morten Sandset, who is the worldwide reference on TFPI. I am really impressed by all the papers he
has written on this topic and greatly admire his work. He is indeed “one of the main Kunitz domains” in knowledge of the TFPI molecule. Just as Rapaport saw the TFPI molecule as a “prima ballerina “ I see Professor Sandset as the ”chef d’orchestre” with regard to knowledge of this molecule. He and his team received me very kindly in their laboratory and I would have enjoyed working in his group. I would be happy to work with him in the future. It is really a great honour for me to have my research assessed by him. I sincerely thank him for accepting to judge my thesis and to be a “rapporteur”.
To Doctor Véronique Regnault, I very much admire her work and her conscientiousness.
It was a great pleasure to learn about thrombin generation with her and I spent many happy days in her laboratory. She is a passionate woman and inspires passion in others. She has unlimited energy, has extensive knowledge of haemostasis and is also well versed in many assay techniques. I would be very happy to have the opportunity to work with her. I greatly appreciate her acceptance to judge my thesis and to be a “rapporteur”.
To Professor Pierre Morange, who is the head of a big group that he manages with great skill.
He is widely appreciated in the world of haemostasis for his considerable competence in this field and also for his kindness; this probably explains why he is invited to participate in so many national and international studies. He has always been ready to cooperate with our group and it is really a great pleasure to work with him and his team. I thank him for accepting to judge my thesis.

To Professeur Ismail Elalami, who makes haemostasis entertaining and easy to understand.
Everybody likes to listen to his well-constructed demonstrations and everybody enjoys his “shows”. He has conducted many valuable studies enhancing the understanding of heparin-induced thrombocytopenia and has always been ready to take part in the HIT studies conducted by our group. He has become a friend in this wonderful world of science. I thank him for accepting to judge my thesis.
To Professeur Decousus, whom I will always regard as “the big boss”. I decided to learn about haemostasis because he once said, “we need someone to work on this topic”. He has a gift for bringing out the best in people without ever asking for anything.I thank him for having supported me in my research projects and to have actively contributed to the inclusion of patients in our studies. I assure him of my profound admiration and gratitude.
To Michèle Piot, with whom I have worked for many years, like “cycling in tandem”. She is my best
friend at work. We share our successes and also our disappointments. She has been very generous in helping me to finalise my thesis and also throughout our work together during all these years. I cannot imagine working without her. I assure her of my most sincere gratitude.
To Céline, Emilie, Sara and Silvy, for their help with statistics and also for their
kindness towards me. To Edith, who has always been so ready to help me. To Béatrice, for all the advice she has given me from an ethical point of view and for
her help in writing various documents. To Florence, for her professional conscientiousness with regard to the haemophilia study. To Celine and Corinne, for their help in ordering numerous articles for the bibliography. To Philippe, Andrea and Laurent, who good naturedly helped me to improve my English. To Paula, who has often corrected the poor English in my articles. To all the members of the group, for their continuous support and kindness that have
made all the time I have spent in the laboratory so pleasant and happy.
Résumé
L’Inhibiteur de la Voie du Facteur Tissulaire (TFPI) est une protéine régulatrice des
phénomènes de coagulation intervenant à la phase initiale de la cascade. Il inhibe tout
d’abord le facteur Xa puis ce complexe TFPI-Xa vient ensuite inactiver le complexe FT- VIIa.
Récemment il a été montré que la Protéine S a aussi une fonction de cofacteur dans l’activité
du TFPI.
Un déficit homozygote en TFPI n’est pas compatible avec la vie et l’importance
physiologique de cet inhibiteur a été montrée sur des modèles animaux. Cependant, il n’a
pas été rapporté de cas de patient présentant un déficit constitutionnel en TFPI responsable
de thrombose. Il n’a pas non plus été identifié de polymorphismes sur le gêne du TFPI
pouvant être responsables d’une augmentation du risque de thrombose. Le TFPI étant en
grande partie fixé sur l’endothélium vasculaire, il avait été émis l’hypothèse que cette fraction
pourrait être pour certains patients impliquée dans l’augmentation du risque de thrombose.
Trois études, dont une conduite par notre équipe, ont étudié cette fraction de TFPI
après avoir induit son « relargage » par une injection d’héparine. Il n’a pas pu être établi de
manière formelle de lien entre un défaut de « relargage » de TFPI et le risque de thrombose
veineuse.
Nous avons émis l’hypothèse que cette voie pourrait être mise en défaut non pas à
cause d’une anomalie sur la molécule de TFPI elle-même mais plutôt sur une des protéines
qu’il doit inhiber (VIIa ou Xa). Suivant le même raisonnement que celui qui avait été mené
pour la résistance à la protéine C activée liée à la présence d’une anomalie sur le facteur V
(V Leiden), nous avons émis l’hypothèse qu’il pourrait exister une résistance au TFPI liée à
une anomalie moléculaire sur le VIIa ou le Xa.
1) Résistance au TFPI et thrombose veineuse
Nous avons donc mis au point une technique de mesure de la sensibilité du plasma à
l’activité anticoagulante du TFPI basée sur un temps de prothrombine dilué (dPT). Ce temps
est mesuré sur du plasma en présence ou en l’absence d’une quantité fixe de TFPI. Le ratio
dPT + TFPI / dPT est mesuré sur les plasmas patients et sur les plasmas contrôles ainsi que
sur un plasma de référence inclus dans chaque série de dosage. Un ratio dit normalisé (ratio
patient ou contrôle /ratio de référence) est ensuite calculé et appelé TFPI Ratio Normalisé
(TFPI NR).

Dans une première étude, cette technique était réalisée en un temps. Les résultats
avaient permis de suspecter la présence d’une résistance constitutionnelle au TFPI. En effet,
le TFPI NR était inférieur à 0.85 chez 13/118 patients et chez seulement 5/107 contrôles.
L’Odd Ratio (OR) pour une faible réponse au TFPI (95 % Intervalle de confiance) était à 2.9
(1.18 – 7.8) ; p= 0.025). Cependant cette technique manquait de pouvoir discriminant entre
normal et pathologique. En effet lors des contrôles, les patients étaient tantôt trouvés
résistants tantôt non résistants.
Nous avons alors modifié cette technique, dans une deuxième étude, en faisant une
mesure en 2 temps et en utilisant 2 concentrations de TFPI, partant du principe qu’un
plasma résistant à une faible concentration de TFPI (62ng/ml) devrait rester résistant à une
plus forte concentration de TFPI (125 ng/ml).
Nous avons donc appliqué cette technique sur une nouvelle série de 131 patients et
de 219 contrôles appariés en âge et sur le sexe. En présence de 62 ng/ml de TFPI, douze
patients et neuf contrôles présentaient une résistance au TFPI définie par un TFPI NR 62
inférieur à 0.75. En présence de 125 ng/ml de TFPI, treize patients et trois contrôles
présentaient une résistance au TFPI définie par un TFPI NR 125 inférieur à 0.65. Les OR
pour une faible réponse au TFPI NR 125 étaient meilleurs (9.7 (2.7-35.0) p ≤0.0001) que les
OR pour une faible réponse au TFPI NR 62 (2.9 (1.2- 7.1) p = 0.02). A ce stade de la
recherche nous pensions avoir mis en évidence une nouvelle anomalie biologique
responsable de thrombose veineuse.
Tous les patients qui présentaient un ratio normalisé en dessous des seuils par une
des 2 techniques mais aussi les patients qui présentaient un ratio proche de la valeur cut-off
ont été recontactés pour un deuxième prélèvement. Dans cette série 29 patients ont été
contrôlés en même temps que 29 contrôles appariés sur l’âge et le sexe. Sur les premiers
OR, le TFPI NR 125 étant considéré comme plus sensible pour le dépistage d’une résistance
au TFPI, c’est ce ratio qui a été mesuré sur le deuxième prélèvement. Hormis 2 patientes
pour lesquelles nous avons retrouvé un TFPI RN 125 à la limite du cut-off (et qui avaient une
PS activité à la limite inférieure de la normale), toutes autres valeurs contrôles du TFPI NR
125 étaient supérieures à 0.65. Les valeurs anormales de NR TFPI 125 obtenues sur le
premier prélèvement étaient très probablement liées au non respect des conditions pré-
analytiques très rigoureuses pour cette technique. Nous nous sommes assurés que ces
conditions ont été très strictement respectées sur le deuxième échantillon. Ce sont donc ces
valeurs contrôles obtenues dans le même temps chez les patients et les sujets contrôles qui
ont été gardées. En clair, cette pseudo résistance au TFPI ne correspondait pas à une
anomalie constitutionnelle du VII ou du X mais plutôt à un artéfact lié au non respect des

conditions pré-analytiques très strictes pour cette technique (un plasma dépourvu de
plaquettes et de FT étant nécessaire à la fiabilité des résultats).
Une fois encore ces résultats plutôt décevants viennent mettre en doute la
responsabilité du TFPI dans la thrombose veineuse.
Plusieurs travaux ont récemment montré in vitro le lien étroit entre protéine S (PS) et
TFPI. Leur taux varie dans le même sens mais surtout la PS joue un rôle de cofacteur dans
l’activité TFPI ; cela a très bien été démontré avec le test de génération de thrombine.
2) Déficit en protéine S et résistance au TFPI
Nous avons voulu montré in vivo que la PS avait bien une activité cofacteur de
l’activité TFPI par le test de résistance au TFPI. Trente et un patients qui présentaient un
déficit héréditaires en protéine S et 7 patientes qui présentaient un déficit acquis en PS (en
rapport avec la grossesse) ont été inclus dans cette étude. Tous les patients déficitaires en
PS avaient un TFPI NR en dessous de la valeur seuil déterminé chez un groupe contrôle
correspondant donc à une résistance à la protéine S. Cette résistance qui était mise en
évidence pour les femmes enceintes disparaissait après l’accouchement en même temps
que se normalisait la protéine S. Nous avons montré une très bonne corrélation (R2= 0.264 ;
p= 0.003) entre les taux de protéine S en dessous des valeurs normales et le TFPI NR
démontrant ex vivo que l’activité TFPI dépend des valeurs de l’activité protéine S lorsqu’elle
est inférieure à 60 %. En effet, lorsque la PS est normale, cette corrélation n’existe plus (R2=
0.005 ; p= 0.66). Cette corrélation PS et TFPI NR a aussi été montrée in vitro pour des
valeurs de PS inférieures à 60 %.
La grossesse représente un état d’hypercoagulabilité au cours duquel, entre autres
modifications, on peut observer une augmentation du facteur tissulaire et une diminution de
la protéine S. Les grossesses peuvent se compliquer de pathologies vasculaires placentaires
et aussi de thrombose veineuse. Nous avons voulu étudier si le degré de résistance au TFPI
ou si le TFPI lui-même pouvaient être utilisés pour identifier les patientes à risques de
développer ce type de complications.
3) Implication du TFPI dans les pathologies vasculaires de la grossesse.
Cette étude est une étude ancillaire de l’étude ANGIOPRED dans laquelle ont été
inclues des femmes à la 20 ème semaine d’aménnorhée. Ces femmes avaient soit un
antécédent de pathologies foeto-placentaires, soit un antécédent de thrombose veineuse,
soit un facteur de risque biologique ou clinique de ces deux pathologies.
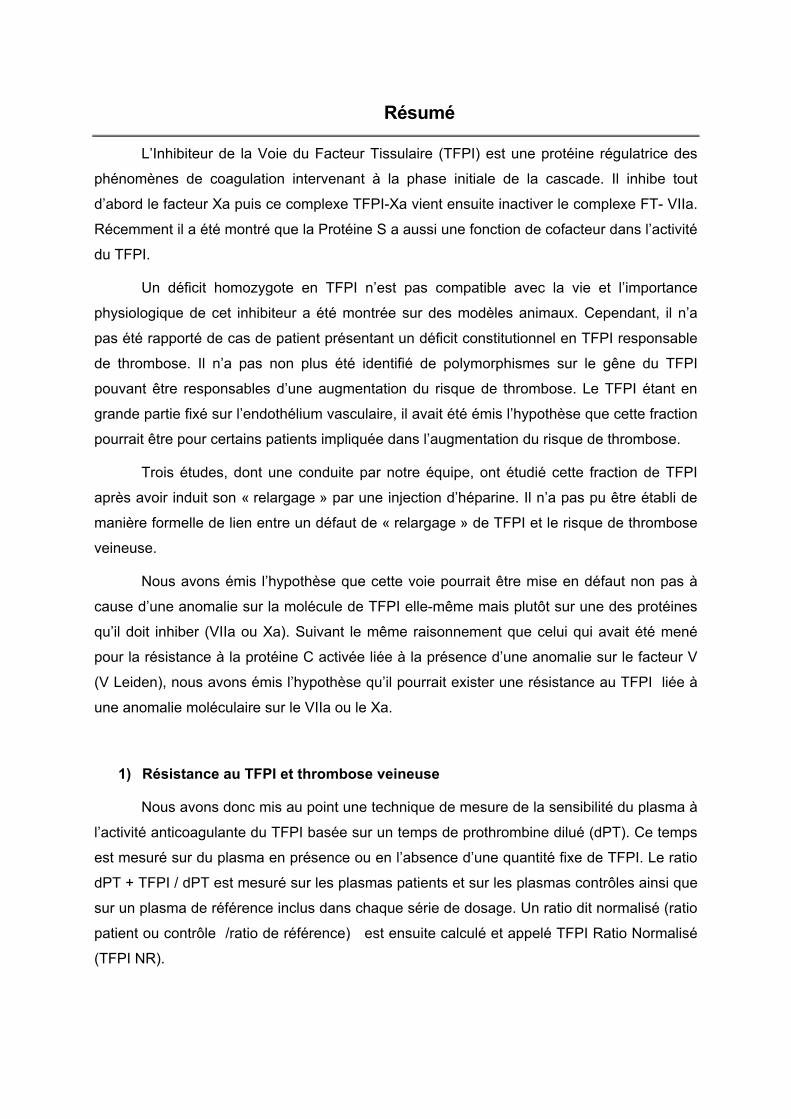
Les patientes inclues (n = 72) dans notre étude étaient celles pour lesquelles avaient
été réalisés tous les prélèvements prévus pendant la grossesse (20 SA, 24 SA, 28 SA, 32,
36 SA ) et 6 semaines (au moins) après l’accouchement.
Quinze patientes ont présenté une complication vasculaire de la grossesse.
Cinquante sept patientes n’ont présenté aucune complication.
Dès la 20ème SA et pendant toute la grossesse les patientes gardent un TFPI NR
inférieur à la valeur cut-off définie chez des contrôles et inférieur aux valeurs obtenues à
distance de l’accouchement. Nous confirmons ainsi une résistance au TFPI dès la 20ème
semaine de grossesse qui persiste pendant toute la grossesse et disparait après
l’accouchement confirmant ainsi les résultats de la précédente étude. Nous n’avons
cependant pas mis en évidence de différence de TFPI NR entre les patientes ayant présenté
une complication vasculaire et les autres sans complication. Le TFPI NR ne peut donc pas
être utilisé comme marqueur de risque de survenue d’une pathologie vasculaire pendant la
grossesse.
Les patientes, qui ont présenté une complication vasculaire, avaient des taux de TFPI
activité statistiquement plus élevés que les patientes sans complications vasculaires et ceci
à partir de la 24ème semaine d’aménorrhée et pendant toute la grossesse ; cela confirme les
résultats déjà décrits dans la littérature.
4) Relation entre Lp(a) et TFPI
Il a été monté que des taux élevés de Lp(a) étaient un facteur de risque indépendant
de maladies cardio-vasculaires et qu’il existait une corrélation entre le taux de Lp(a) et la
sévérité de ces maladies. Un taux de Lp(a) élevé est défini comme étant supérieur à 0.3 g/l.
Ni les traitements hypolipémiants, ni l’exercice physique ne semble pouvoir faire diminuer
les taux de Lp(a). Compte tenu de l’homologie de structure qu’il y a entre l’apo (a) et le
plasminogène, une Lp(a) élevée pourrait être responsable d’une altération de la fribrinolyse.
Par ailleurs il a été montré in vitro que la Lp(a) pourrait inhiber l’activité TFPI. Deux études
cliniques ont rapporté une efficacité de l’aspirine dans la réduction des taux de Lp(a) tout
particulièrement pour des taux de Lp(a) élevés. Il a été montré in vitro sur des cultures
d’hépatocytes humains que cet effet de l’aspirine pourrait être expliqué par une diminution
de la synthèse d’Apo (a) par suppressionde la transcription du gene de l’Apo (a).
L’objectif de notre étude était de rechercher chez des patients coronariens obèses
un effet inhibiteur de la Lp(a) sur l’activité TFPI in vivo et de vérifier l’effet de l’aspirine sur la
diminution des taux de Lp(a). L’effet de l’aspirine ,s’il existait, pouvant alors s’accompagner
d’une restauration de l’activité TFPI par l’intermédiaire d’une normalisation du taux de Lp(a).

Dans cette étude 28 patients obèses ayant présenté une douleur angineuse ont été
inclus. Tous les patients ont eu soit une coronarographie soit un angio-scanner coronaire.
Pour chaque patient une mesure de Lp(a), de TFPI activité et de TFPI libre était réalisée à
l’inclusion et 1 mois après un traitement par aspirine (100 à 150 mg/jour).
Sept patients avaient des coronaires saines et quatre d’entre eux avaient une Lp(a)
normale. Ces quatre patients ont donc été sortis de l’étude. Parmi les 21 patients qui
présentaient des lésions coronaires, quinze avaient une Lp(a) inférieure à 0.3 g/L et cinq une
Lp(a) supérieur à 0.3 g/L, un patient a été perdu de vue.
Les patients avec Lp(a) ≥0.3g/L ont lors la première visite des taux de TFPI libre plus
bas (median : 13.3 ± 2.6 ng/L) que les patients qui ont une Lp(a) ≤ 0.3 g/L( median :18.0
±4.5 ng/mL), cette différence étant statistiquement significative (p= 0.04). Quand toutes les
valeurs de Lp(a) étaient prises en compte il y avait seulement une corrélation faible entre le
taux de TFPI libre et le taux de Lp(a). Cependant, lorsque l’on prenait en compte seulement
les valeurs de Lp(a) ≥0.3g/)L, on mettait en évidence une relation statistiquement
significative entre TFPI libre et Lp(a) (R2 = 0.34 ; p = 0.018). Cependant nous n’avons pas
mis en évidence de différence d’activité TFPI entre les patients avec Lp(a) ≥0.3g/L et les
patients avec Lp(a) ≤ 0.3 g/L. Par ailleurs nous n’avons pas mis en évidence de diminution
des taux de Lp(a) sous aspirine que ce soit sur l’ensemble des patients traités par aspirine
ou sur le groupe de patients qui avaient un Lp(a) élevée ( ≥0.3g/L).
Entre la première et la deuxième visite on ne retrouve pas non plus de différence
entre les taux de TFPI libre. Une différence statistiquement significative est retrouvée entre
ces 2 prélèvements pour l’activité TFPI (visite 1 : médiane TFPI activité : 107 % ± 16% ;
visite 2: médiane TFPI activité : 98% ±18 %, p = 0.006), cette différence n’ayant cependant
aucune pertinence clinique.
En conclusion, cette étude montre que, pour les patients qui ont des taux de Lp(a)
≥0.3g/L, les taux de TFPI libre sont plus bas que pour les patients qui ont des taux de Lp(a)
≤ 0.3 g/L. Nous ne trouvons cependant pas de diminution de l’activité TFPI dans ces 2
groupes de patients. Par ailleurs nous n’avons pas mis en évidence de diminution de la Lp(a)
sous aspirine ni sur l’ensemble des patients ni sur le groupe de patients avec Lp(a) ≥0.3g/L.
Nous n’avons pas fait la preuve de la responsabilité du TFPI dans la survenue des
thromboses veineuses et artérielles que nous avons étudiées. Tout au plus, une anomalie
sur l’activité TFPI ou sur la résistance au TFPI pourraient être utilisée comme marqueur de
risque de thrombose.
L’importance du TFPI ne devrait elle donc pas être plutôt évaluée sur le versant de
l’hémorragie ?

5) TFPI et hémorragie
Il a été monté que les manifestations hémorragiques chez les hémophiles sont liées
d’une part au déficit en facteur VIII ou IX mais aussi à la présence du TFPI qui d’une part
inhibe le Xa et d’autre part la production de Xa en inhibant le complexe FT-VIIA.
L’importance du TFPI dans les manifestations hémorragiques a été démontrée depuis
longtemps chez les lapins hémophiles. Plus récemment, l’importance du TFPI intra-
plaquettaire dans les manifestations hémorragiques des souris hémophiles a été démontrée.
Il est par ailleurs admis que les hémophiles B saignent moins que les hémophiles A.
Taux de TFPI libre chez les patients hémophiles A et B
Trente patients hémophiles A et 21 patients hémophiles B ont été inclus dans
cette étude. Age moyen : 29 ans pour les hémophiles A, 34 ans pour les hémophiles B.
Le taux de TFPI libre était plus bas chez les hémophiles B (8.84 ng/mL) que chez les
hémophiles A (12.0 ng/ mL ; p = 0.0001) tous niveaux de gravité confondus. Cette
différence était aussi retrouvée en fonction de stades de gravité différents. C'est-à-dire :
dans le groupe d’hémophiles sévères le TFPI libre était plus bas pour hémophiles B que
pour hémophiles A et les mêmes résultats étaient obtenus dans le groupe hémophiles
modérés et mineurs. Nos résultats montrent que la différence des manifestations
hémorragiques entre hémophiles A et B pourrait bien être liée à une différence du taux
de TFPI libre entre les deux types d’hémophilie.
Nous conduisons actuellement une étude nationale multicentrique dont le but est
de préciser le rôle du TFPI dans les manifestations hémorragiques des patients
hémophiles et d’évaluer l’influence du TFPI sur les différents paramètres de la génération
de thrombine.
TFPI et génération de thrombine chez les hémophiles.
Les résultats de cette étude en cours ne sont donnés que pour les 21 patients inclus
au CHU de St etienne.
Nous avons montré lorsque la génération de thrombine est mesurée en présence
d’une faible concentration de FT et en plasma riche en plaquettes (PRP) que chez les
hémophiles A il existe une forte corrélation entre les différents paramètres de la génération
de thrombine et le TFPI libre. Nous avons aussi montré que le temps de latence est très
sensible au TFPI libre quelque soit le type d’hémophilie et quelque soit la sévérité de la
maladie. Nous avons par ailleurs étudié l’effet d’un anticorps anti TFPI humain (à usage in
vitro seulement) sur la correction de la génération de thrombine . Cette correction est dose

dépendante et complète à la concentration de l’anti TFPI de 1.0 à 1.5 µg/ml et atteint ensuite
un plateau.
Plus la génération de thrombine est altérée, meilleur est l’effet de l’anticorps sur sa
correction, laissant penser que ce traitement pourrait avoir un intérêt tout particulier pour les
hémophiles sévères. Nous avons aussi montré que, compte tenu de l’importance du TFPI
intra plaquettaire, il est d’une importance capitale chez les hémophiles d’évaluer la
génération de thrombine et sa correction par l’anticorps sur du plasma riche en plaquettes et
non pas sur du plasma pauvre en plaquettes.
En conclusion : les études visant à rechercher une implication du TFPI dans la
thrombose veineuse sont plutôt décevantes. Par contre, le TFPI semble jouer un rôle non
négligeable dan les manifestations hémorragiques chez les patients hémophiles. La
neutralisation du TFPI représente une approche thérapeutique très séduisante pour le
traitement (prophylactique au moins) des patients hémophiles.

Potential roles of TFPI in both thrombotic and hemorrhagic diseases
Abstract
TFPI is a multivalent Kunitz-type proteinase inhibitor that directly inhibits FXa and produces FXa-dependent feedback inhibition of the FVIIa–TF complex. It was recently demonstrated that Protein S (PS) plays the role of TFPI cofactor by enhancing the TFPI inhibition of factor Xa in vivo. Approximately 80% of plasma TFPI circulates as a complex with plasma lipoproteins, about 5–20% circulating as free TFPI. Under quiescent conditions, approximately 50–80% of intravascular TFPI is stored in association with the endothelium. Full-length TFPI α carried in platelets constitutes 8-10% of the total amount of TFPI in the blood, corresponding to a quantity comparable to that of soluble full-length TFPI α in the plasma. We searched for resistance to TFPI activity in patients who presented idiopathic venous thrombosis at a young age. Plasma sensitivity to TFPI was evaluated on the basis of diluted prothrombin time (dPT) measured in patients and in control plasma in the presence (W) and absence (Wo) of exogenous TFPI. At the same time, dPT was measured on a reference plasma to establish a normalized ratio termed TFPI NR and defined as (dPT wTFPI/ dPT Wo TFPI) patient or control / (dPT wTFPI/ dPT Wo TFPI) reference plasma. In an initial study, we found that TFPI resistance could be considered as a new coagulation abnormality that could be related to unexplained thrombosis. In a second study, we failed to demonstrate a role of TFPI resistance in patients with venous thrombosis, abnormal TFPI NR being more likely related to the non-respect of preanalytical conditions rather than to an inherited trait. However, in another study, we showed that inherited or acquired PS deficiency was responsible for a TFPI resistance, providing an ex vivo demonstration that PS is the cofactor of TFPI activity. We showed that this TFPI resistance existed throughout pregnancy and that it disappeared when PS returned to normal values after delivery. We evaluated this TFPI resistance as a possible marker of the risk of a gestational vascular complication (GVC) in 72 patients at risk of developing a GVC. TFPI NR did not differ between GVC+ patients (n =15) and GVC– patients (n = 57). High levels of Lipoprotein(a) (Lp(a) have been shown to be an independent risk factor for cardiovascular disease, lowering of these levels not being achievable by any treatment except possibly aspirin. An in vitro study showed that TFPI activity could be inhibited by Lp(a). We did not confirm this TFPI inhibition in vivo in 20 obese patients with coronary insufficiency who had either normal Lp(a) levels (≤ 0.3 g/L; n = 15) or high Lp(a) levels (≥ 0.3 g/L; n = 5) . Moreover, we found no effect of aspirin treatment on Lp(a) whatever the initial level of Lp(a). Haemophilia B patients bleed less than haemophilia A patients. We showed that this difference in bleeding profile could be explained by lower free TFPI levels in haemophilia B patients compared to haemophilia A patients. In an ongoing study, we showed that in haemophilia A patients there was a strong correlation between the different parameters of thrombin generation (TG) and free TFPI. We also showed, in a TG assay performed in platelet-rich plasma (PRP) with a low TF concentration, that LT was sensitive to free TFPI levels whatever the type of haemophilia and whatever the severity of the disease. We demonstrated that blocking TFPI by an anti-TFPI Antibody (Ab) allows complete correction of the TG profile in PRP. We showed that it is of major importance to perform a TG assay in PRP in order to evaluate the efficacy of anti-TFPI Ab in correcting TG parameters in haemophilia patients.
Mots clés
TFPI, Inhibiteur de la voie du facteur tissulaire, thrombose veineuse, hémorragie,
résistance au TFPI, déficit en protéine S, génération de thrombine, obésité, Lp(a).
Keywords
Tissue factor pathway inhibitor, venous and arterial thrombosis, bleeding, TFPI
resistance, protein S deficiency, haemophilia, thrombin generation, obesity,
lipoprotein (a), gestational vascular complications.
Cette thèse a été préparée au laboratoire d’hémostase du Groupe de Recherche sur
la Thrombose, EA 3065, INSERM CI E3, Université de Saint-Etienne, Jean Monnet, F-42023,
Saint-Etienne, France, sous la direction du Professeur Bernard Tardy.

SUMMARY
Introduction ...................................................................................................................2
I) TFPI and deep venous thrombosis..........................................................................13 1) Antithrombotic effect of TFPI in animal models ............................................................... 13 2) TFPI gene polymorphisms ............................................................................................... 13 3) TFPI antigenic or activity levels and risk of DVT.............................................................. 14 4) Role of heparin releasable TFPI in venous thrombosis ................................................... 17 5) Could VTE be related to a resistance to the anticoagulant activity of TFPI?................... 18 6) TFPI could rather be considered as an additional risk factor only . ................................. 38
II) Inherited or acquired Protein S deficiency and TFPI resistance.............................45 1) Patients, Materials and Methods...................................................................................... 45 2) Results ............................................................................................................................. 47 3) Discussion........................................................................................................................ 51 4) References....................................................................................................................... 54
III) Implication of TFPI on gestational vascular complications ....................................56 1) Patients, material and methods........................................................................................ 57 2) Results ............................................................................................................................. 58 3) Discussion........................................................................................................................ 64 4) References....................................................................................................................... 66
IV) Relation between Lipoprotein(a) (Lp(a)) and TFPI................................................69 1) Background ...................................................................................................................... 69 2) Objectives of the study..................................................................................................... 70 3) Patients material and methods......................................................................................... 70 4) Results ............................................................................................................................. 73 5) Discussion........................................................................................................................ 80 6) Conclusion........................................................................................................................ 82 7) References....................................................................................................................... 83
V) TFPI as a primary physiological regulator of bleeding in haemophilia ...................86 1) Free TFPI levels in haemophilia patients......................................................................... 87 2) Free TFPI levels and thrombin generation in haemophilia patients................................. 90
ANNEXES.................................................................................................................112 Annexe 0 : Tissue factor pathway inhibitor structure ......................................................... 113 Annexe 1: Determination of fibrinogen, factor VIII and free TFPI levels ............................ 115 Annexe 2: Anticoagulant response to exogenous TFPI..................................................... 116 Annexe 3: TFPI activity assay ............................................................................................ 117 Annexe 4: Normal values of thrombin generation in Platelet rich plasma (PRP)............... 126 Annexe 5: Thrombin generation assays............................................................................. 127 Annexe 6 : Comparison of the different TFPI resistance assays ....................................... 131 Annexe 7 : Clinical data for establishing the haemorrhagic score ..................................... 132
Conclusion ................................................................................................................136
Publications ..............................................................................................................137
1
Abbreviations
AD : After delivery
AW : Amenorrhea week
CI : Confidence interval
CPP: Comité de Protection des Personnes
CAD : coronary artery disease
CVD: Cardio vascular disease
dPT :diluted prothrombin time
DVT : Deep Venous Thrombosis
GVC : Gestational vascular complications
IC: ischemic stroke
LMWH : Low molecular weight heparin
Lp(a) : Lipoprotein (a)
ND : Not determined
OR : Odd ratio
PE : Pulmonary Embolism
PS: Protein S
SNPs: Single nucleotide polymorphism
SVT: superficial venous thrombosis
TFPI : Tissue Factor Pathway Inhibitor
TFPI NR : TFPI Normalized Ratio
UFH : Unfractionated heparin
VTE: venous thrombo-embolism

2
Introduction
Although the presence of the inhibitor at the initiation of the extrinsic blood
coagulation pathway in plasma has long been known, Broze isolated the inhibitor from a
hepatoma cell line in 1987. The determination of the amino acid sequence of this inhibitor
was finally reported in 1988 by Broze and his group, who designated it a lipoprotein-
associated coagulation inhibitor (LACI). Rapaport and his group have published many
articles on the inhibitor, which was named an extrinsic pathway inhibitor (EPI). To resolve the
confusing situation in which reports from many laboratories used two different names for the
same entity, a meeting at the International Society on Thrombosis and Haemostasis held at
Amsterdam in 1991 recommended the name tissue factor pathway inhibitor (TFPI). After the
discovery of TFPI, another inhibitor with three tandem Kunitz-type inhibitor domains was
isolated and named TFPI-2. The first TFPI was then renamed TFPI-1. However,TFPI-2 is not
an inhibitor of the initiation of the tissue factor pathway. Currently, TFPI-2 is thought most
likely to have completely different functions from those of TFPI-1.
In this study, we have been interested in TFPI 1 that we will call TFPI.
TFPI gene expression: The human TFPI gene (TFPI) consists of 9 exons and 8
introns that span 70 kb on the long arm of chromosome 2 (q32) (Girard et al 1991; van der
Logt et al 1991). Upregulators of TFPI expression in vitro that might be of physiological
significance include endotoxin, interleukin, tumor necrosis factor, platelet-derived growth
factor, basic fibroblast growth factor, and elevated shear stress (Caplice 1998; Ameri 1992;
Westmuckett 2000).
Structure: Three alternatively transcribed isoforms of TFPI have been identified
(Broze et al 2012). TFPI α is the originally isolated form of TFPI. It contains three Kunitz-type
proteinase inhibitor domains. After a 24 or 28 amino acid signal peptide, the mature protein
has 276 residues (32 KDa) and contains an acidic aminoterminal region followed by 3
tandem Kunitz-type protease inhibitory domains and a basic carboxyterminal region. TFPI β
lacks the Kunitz 3 and basic carboxyterminal domains of TFPI α and in their place contains a
42 amino acid carboxyterminal sequence inserted following residue 181 of TFPI α (Piro et al
2005). The kunitz 3 domain lacks proteinase inhibitory activity (Petersen et al 1996). TFPI δ
lacks the Kunitz 3. It corresponds to a truncated form of TFPI with the insertion of a new 12
amino acid C- terminus at residue 151following the Kunitz 2 domain of TFPIα

3
The anticoagulant role of TFPI: TFPI is a multivalent Kunitz-type proteinase inhibitor
that directly inhibits FXa and produces FXa-dependent feedback inhibition of the FVIIa–TF
complex. In the final quaternary inhibitory complex containing FXa, TFPI, FVIIa and TF, the
Kunitz-2 domain of TFPI interacts with FXa and the Kunitz-1 domain interacts with FVIIa. The
formation of this complex is frequently described as a two-step process in which TFPI binds
to FXa, and the FXa–TFPI complex subsequently binds to FVIIa–TF (Baugh RJ 1998).
Recently it has been demonstrated that Protein S (PS) plays the role of TFPI cofactor by
enhancing the TFPI inhibition of factor Xa (Hackeng et al 2006; Ndonwi et al 2010). The
anticoagulant activity of the TFPI/protein S system on thrombin generation is particularly
observed at low tissue factor concentrations (Seré et al 2004). When thrombin generation is
initiated with 1 pM TF in TFPI-depleted plasma, thrombin generation is increased and lag
time decreased because of the lack of TFPI. However, anti-protein S antibodies had no effect
on thrombin generation, indicating that the expression of APC-independent anticoagulant
activity of protein S in plasma requires the presence of full length TFPI. TFPI cofactor activity
is restricted to full length TFPI only, as protein S fails to stimulate truncated TFPI that lacks
the K3 domain and the C-terminus (Hackeng et al 2006). Protein S binds to the K3 domain of
TFPI (Ndonwi et al 2010). The identification of protein S as a cofactor for TFPI explains why
TFPI is such an important inhibitor despite its low physiological concentration of 0.25 nM in
plasma (Sandset et al 1991).
When TF-concentrations are high (at 14 pM TF), the TFPI/protein S system is unable
to inhibit thrombin generation (Castoldi et al 2008).The fact that TFPI is unable to regulate
thrombin generation at high TF concentrations is likely caused by TFPI slow acting inhibitory
mechanism. At high TF concentrations the rate of FXa formation occurs at such a rapid rate
that before appreciable inhibition of TF-FVIIa-FXa by TFPI occurs, the amounts of FXa
formed are already sufficient for optimal thrombin generation (Broze et al 1990). However,
when coagulation is slowed down at high TF concentration by APC, TFPI/protein S is able to
regulate FX activation, very effectively inhibiting the residual thrombin generation
(Peraramelli et al 2012). As TFPI/protein S regulates thrombin generation only at low
procoagulant stimuli, TFPI/protein S is most effective as a first barrier against procoagulant
events induced by low tissue factor exposure to the circulation. Protein S and TFPI levels
covariate in normal individuals and in hereditary as well as acquired states of protein S
deficiency (Dahm et al 2008; Castoldi et al 2010).TFPI and protein S form a complex in
plasma (Castoldi et al 2010). It was proposed that binding to protein S protects TFPI against
proteolysis in the lysine-rich C-terminus of TFPI, preventing truncation and inactivation of
TFPI.

4
Plasma TFPI: The mean plasma TFPI concentration in normal individuals is 70
ng/mL (1,6 nM) Dahm et al 2003. In vivo, approximately 80% of plasma TFPI circulates as a
complex with plasma lipoproteins, low density lipoprotein (LDL), high-density lipoprotein
(HDL) and very low-density lipoprotein (VLDL) (Broze et al 1995).About 5–20% of plasma
TFPI circulates free, uncomplexed (Sandset et al 1991) containing both full-length and C-
terminal truncated forms [Broze et al 1994]. The most predominant forms of plasma TFPI
have a molecular weight of 34–41 kDa; [Broze et al 1995]. These predominant forms appear
to afford protection against thrombosis (Day et al 1990; Holst et al 1993). Lipoprotein-
associated TFPI has less anticoagulant effect than the free TFPI (Lindahl et al 1992).
Différent cellular pools: The vascular endothelium is the dominant source of
circulating TFPI (Bajaj et al 1990; Novotny et al 1991). TFPI is also expressed in
megakaryocytes and platelets (Novotny et al 1988, Maroney el al 2007), in vascular smooth
muscle (Caplice et al 1998), in monocytes/macrophages (van der Logt et al 1994) and in
cardiomyocytes (Kereveur et al 2001). In addition, TFPI has been detected in macrophages
and T cells in atherosclerotic lesions (Crawley et al 2000).
TFPI bound to the endothelial surface: Under quiescent conditions, approximately
50–80% of intravascular TFPI is stored in association with the endothelium (Sandset 1996)
and it has been localized to the cell surface, the Golgi apparatus, and to the endocytic
compartment of the endothelial cells (Hansen 1997). TFPI associated with the cell surface of
the endothelial cells may act as a direct vessel-wall anticoagulant (Grabowski et al
1993).Surface-bound TFPI may also have an indirect anticoagulant impact by promoting
internalization and degradation of activated coagulation factors such as factor Xa (Ho et al
1996) and TF/factor VIIa complexes (Sevinsky et al 1996). TFPI is bound to the endothelial
surface through an electrostatic interaction between the positively charged carboxy terminus
of the TFPI molecule and negatively charged glycosaminoglycans (GAGs), i.e. heparan
sulphate, at the endothelial surface (Valentin 1994). Simultaneous addition of heparin with
full-length TFPI inhibits the binding of TFPI to the cell surface in a dose dependent manner
(Iversen et al 1996).
Release of TFPI Heparin, administration in vivo is known to cause a several-fold
increase in plasma TFPI (Sandset et al 1988). The form of TFPI that is released appears to
be full length TFPI α (Novotny et al 1991). Since the ex vivo addition of heparin to blood or
plasma does not change the TFPI concentration, the in vivo effect of heparin appears to be

5
mediated by the releaseof TFPI from intracellular or extracellular storage sites. The source of
this additional TFPIis thought to be the endothelium, where TFPI binds to heparan sulfate or
to other glycosaminoglycans at the endothelial surface (Golino et al 2002). In cells culture the
release of TFPI induced acutely by heparin, thrombin or shear stress appears to involve the
redistribution of TFPI from stores located near the plasma membrane to the cell surface with
subsequent release into the media of a portion of the total cellular TFPI. During this process,
the TFPI available at the surface of the cells remains unchanged or increases (Broze et al
2012).
Platelets TFPI corresponds to the α isoform. Novotny and al first showed that
stimulation with thrombin or the calcium ionophore A23187 caused human platelets to
release TFPI (Novotny et al 1988). TFPI is produced by megakaryocytes but retained
intracellulerly in quiescent platelets; TFPI is then expressed on the platelet surface following
dual activation (for example convulxin plus thrombin) to produce coated platelets (Maroney et
al 2007). In these “coated“ platelets produced by dual agonists stimulation, a proportion of
the released TFPI α remains bound and functional at the activated platelet surface. The full-
length TFPI α carried in platelets is 8-10 % of the total TFPI in blood which is comparable to
the quantity of soluble full-length TFPI α in plasma (Novotny et al 1988; Maroney et al 2007).
Thus it is likely that platelets are a major source of full-length TFPI α, the most anticoagulant
active form of TFPI at local sites of coagulation where platelets aggregate. A physiological
activity of platelet TFPI is the inhibition of blood-borne TF procoagulant activity accumulating
within a growing thrombus (Maroney ey al 2011) The importance of platelet TFPI has been
recently elegantly demonstrated in mouse (Maroney et al 2012 ): The results from these
studies further suggest that the absence of platelet TFPI may improve hemostasis in
hemophilia by increasing the functional blood-borne TF activity at the site of vascular injury.
Physiological importance of TFPI: No known human homozygotic deficiencies of
TFPI have been reported. Homozygotic deletion of exon 4 in mice (which encodes the Kunitz
1 domain) resulted in embryonic lethality (Huang et al 1997). Immunodepletion of TFPI
dramatically lowers the threshold at which TF may trigger coagulation (Sandset 1991 a,
Sandset 1991). Exogenous supplementation with different types of recombinant TFPI
protects against the effects of exposure of TF to circulating blood (Bajaj et al 1997). TFPI
plays an important role in the anticoagulant and antithrombotic effect of heparins (Sandset et
al 2000).

6
Physiological variations of TFPI: There is a positive association of total TFPI levels
with levels of procoagulant factors (II, V, VII, VIII, IX, X, XI) and D-dimer. (Dahm et al 2003;
Zakai et al 2010). This positive association between TFPI and many procoagulant factors
could suggest a physiologic feedback loop where high levels of procoagulants are countered
in vivo by high levels of coagulation inhibitors. Alternatively, there could be common
regulation of transcription of multiple coagulation factors including TFPI. In a normal
population, plasma TFPI levels increase with age and healthy newborns have about 40–50%
of normal adult levels. A slight increase in plasma TFPI levels has been reported in older
men (Sakkinen et al 1998), with mean levels lower in women (Ariens et al 1995). Pregnant
women in the third trimester showed slightly increased plasma TFPI levels compared to non-
pregnant women (Warr et al 1989).
TFPI and hormones: Oestrogen (both oral contraception and hormone replacement
therapy) lowers total TFPI antigen levels (Harris et al 1999; Dahm et al 2003; Hoibraaten et
al 2001)
Variations of TFPI in pathology: TFPI levels were significantly raised in patients
with ischaemic heart disease (IHD) compared to normal subjects and a positive correlation
was observed between TF and TFPI levels in these patients (Falciani et al 1998; Morange et
al 2001, Morange et al 2006). Higher concentrations of plasma TFPI were observed in
postmyocardial infarction patients compared to age-matched controls. This was associated
with an elevated procoagulant state that might in fact exacerbate the disease process and
increase the risk of subsequent acute ischaemic events (Freeburn et al 1998).
Hyperactivation of the coagulation system in IHD patients may, in part, be compensated for
by TFPI, which may not be sufficient to attenuate the elevation of circulating TF (Falciani et al
1998). It has also been shown in postmenopausal women that free TFPI increases as
vascular wall function deteriorates ans pulse pressure increases (Regnault et al 2011). TFPI
levels were higher in Type 1 diabetic patients compared to age and gender-matched controls.
TFPI levels were also high in Type 2 diabetic patients and those with impaired glucose
tolerance (Leurs et al 2002; Vambergue et al 2001). TFPI levels increased significantly
before or after heparin administrations in patients with cancer and levels correlated with
disease progression (Lindahl et al 1991; Lindahl et al 1993).
The link between TFPI and deep venous thrombosis (DVT) remains to be
demonstrated. The first part of this work will be dedicated to the topic.
7
References
Ameri A, Kuppuswamy MN, Basu S, Bajaj SP. Expression of tissue factor pathway inhibitor by cultured endothelial cells in response to inflammatory mediators. Blood. 1992;79:3219 –3226. Ariens RA, Coppola R, Potenza I, Mannucci PM. The increase with age of the components of the tissue factor coagulation pathway is gender-dependent. Blood Coagul Fibrinolys 1995;6:433–437. Bajaj MS, Kuppuswamy MN, Saito H, Spitzer SG, Bajaj SP. Cultured normal human hepatocytes do not synthesize lipoprotein-associated coagulation inhibitor: Evidence that endothelium is the principal site of its synthesis. Proc Natl Acad Sci USA 1990; 87(22): 8869-8873. Bajaj MS, Bajaj SP. Tissue factor pathway inhibitor: Potential therapeutic applications. Thromb Haemost 1997;78:471–47 Baugh RJ, Broze GJ Jr, Krishnaswamy S. Regulation of extrinsic pathway factor Xa formation by tissue factor pathway inhibitor. J Biol Chem 1998; 273: 4378–86. Broze GJ J r, Miletich JP. Isolation of the tissue factor inhibitor produced by Hep Gé hepatoma cells. Proc Natl Sci USA 1987; 84(7): 1886-1890 Broze GJ, Girard TJ, Novotny WF. Regulation of Coagulation by a Multivalent Kunitz-Type Inhibitor. Biochemistry 1990;29(33):7539–46. Broze GJ Jr, Lange GW, Duffin KL, MacPhail L. Heterogeneity of plasma tissue factor pathway inhibitor. Blood Coagul Fibrinolys 1994;5:441–559 Broze, G J, Jr Tissue factor pathway inhibitor Thrombosis and haemostasis 74, no. 1 (juillet 1995): 90-93. Broze GJ, Girard TJ. Tissue factor pathway inhibitor : structure-function. Frontiers in Bioscience 2012; 17: 262-280. Caplice NM, Mueske CS, Kleppe LS, Peterson TE, Broze GJ Jr, Simari RD. Expression of tissue factor pathway inhibitor in vascular smooth muscle cells and its regulation by growth factors. Circ res 1998; 83(12): 1264-1270. Castoldi E, Hackeng TM. Regulation of coagulation by protein S. Curr Opin Hematol 2008;15(5):529–36.

8
Castoldi E, Simioni P, Tormene D, Rosing J, Hackeng TM. Hereditary and acquired protein S deficiencies are associated with low TFPI levels in plasma. J Thromb Haemost 2010;8(2):294–300 Crawley J, Lupu F, Westmuckett AD, Severs NJ, Kakkar VV, Lupu C. Expression, localization, and activity of tissue factor pathway inhibitor in normal and atherosclerotic human vessels. Arterioscler Thromb Vasc Biol. 2000; 20:1362–1373 Dahm A, Van Hylckama A, Bendz F, Rosendaal R, Bertina M, Sandset PM. Low levels of tissue factor pathway inhibitor (TFPI) increase the risk of venous thrombosis. Blood 2003; 101: 4387-4392 Dahm AE, Sandset PM, Rosendaal FR. The association between protein S levels and anticoagulant activity of tissue factor pathway inhibitor type 1. J Thromb Haemost 2008;6(2):393–5. Day, K C, L C Hoffman, M O Palmier, K K Kretzmer, M D Huang, E Y Pyla, E Spokas, G J Broze Jr, T G Warren, et T C Wun. Recombinant lipoprotein-associated coagulation inhibitor inhibits tissue thromboplastin-induced intravascular coagulation in the rabbit Blood 76, no. 8 (octobre 15, 1990): 1538-1545 Falciani M, Gori AM, Fedi S, Chiarugi L, Simonetti I, Dabizzi RP, Prisco D, Pepe G, Abbate R, Gensini GF, Neri Serneri GG Elevated tissue factor and tissue factor pathway inhibitor circulating levels in ischaemic heart disease patients. Thromb Haemost 1998;79:495–499 Freeburn JC, Wallace JM, Strain JJ, Sinnamon DG, Craig BM, Johnson D, Gilmore WS. Monocyte tissue factor-like activity in post myocardial infarction patients. Br J Haematol 1998;102:605–608. Grabowski EF, Zuckerman DB, Nemerson Y. The functional expression of tissue factor by fibroblasts and endothelial cells under flow conditions. Blood 1993;81:3265–3270. Girard TJ, Eddy R, Wesselschmidt RL, MacPhail LA, Likert KM, Byers MG, Shows TB, Broze GJ Jr. Structure of the human lipoproteinassociated coagulation inhibitor gene. Intro/exon gene organization and localization of the gene to chromosome 2. J Biol Chem. 1991;266: 5036–5041. Golino P, Ragni M, Cimmino G, Forte L. Role of tissue factor pathway ibhibitor in the regulation of tissue factor dependent blood coagulation. Cardiovascular Drug reviews; 2002: (20) 67-80 Hackeng TM, Seré KM, Tans G, Rosing J. Protein S stimulates inhibition of the tissue factor pathway by tissue factor pathway inhibitor. Proc Natl Acad Sci 2006;103(9):3106–11

9
Hansen JB, Olsen R, Webster P. Association of tissue factor pathway inhibitor with human umbilical vein endothelial cells. Blood 1997;90: 3568–3578 Harris GM, Stendt CL, Vollenhoven BJ, Gan TE, Tipping PG. Decreased plasma tissue factor pathway inhibitor in women taking combined oral contraceptives. Am J Hematol 1999;60:175–180 Ho G, Toomey JR, Broze GJ Jr, Schwartz AL. Receptor-mediated endocytosis of coagulation factor Xa requires cell surface-bound tissue factor pathway inhibitor. J Biol Chem 1996;271:9497–9502 Høibraaten, E, E Qvigstad, T O Andersen, M C Mowinckel, et P M Sandset The effects of hormone replacement therapy (HRT) on hemostatic variables in women with previous venous thromboembolism--results from a randomized, double-blind, clinical trial Thrombosis and haemostasis 85, no. 5 (mai 2001): 775-781 Holst J, Lindblad B, Bergqvist D, Nordfang O, Ostergaard PB, Petersen JL, Nielsen G, Hedner U. Antithrombotic properties of a truncated recombinant tissue factor pathway inhibitor in an experimental venous thrombosis model. Haemostasis 1993;23:112–117 Huang ZF, Higuchi D, Lasky N, Broze GJ Jr. Tissue factor pathway inhibitor gene disruption produces intrauterine lethality in mice. Blood 1997; 90(3): 944-951. Iversen N, Sandset PM, Abildgaard U, Torjesen PA. Binding of tissue factor pathway inhibitor to cultured endothelial cells – influence of glycosaminoglycans. Thromb Res 1996;84:267–278. Kereveur A, Enjyoji K, Masuda K, Yutani C, Kato H. Production of tissue factor pathway inhibitor in cardiomyocytes and its upregulation by interleukin-1. Thromb Haemost. 2001;86:1314 –1319 Leurs PB, Stolk RP, Hamulyak K, Van Oerle R, Grobbee DE, Wolffenbuttel BH. Tissue factor pathway inhibitor and other endothelium-dependent hemostatic factors in elderly individuals with normal or impaired glucose tolerance and type 2 diabetes. Diabet Care 2002;25:1340–1345. Lindahl AK, Jacobsen PB, Sandset PM, Abildgaard U. Tissue factor pathway inhibitor with high anticoagulant activity is increased in post-heparin plasma and in plasma from cancer patients. Blood Coagul Fibrinolys 1991;2:713–721. Lindahl AK, Sandset PM, Abildgaard U. The present status of tissue factor pathway inhibitor. Blood Coagul Fibrinolys 1992;3:439–449 Lindahl AK, Boffa MC, Abildgaard U.
10
Increased plasma thrombomodulin in cancer patient. Thromb Haemost 1993;69:112–114. Maroney SA, Haberichter SL, Friese P, Collins ML, Ferrel JP, AE Mast Active tissue factor pathway inhibitor is expressed on the surface of coated platelets. Blood 2007; (109) 1931-37. Maroney SA, Cooley BC, Ferrel JP, Bonesho CE, Mast AE . Murine hematopoietic cell tissue factor pathway inhibitor limits thrombus growth. Arterioscler Thromb Vasc Biol 2011 ; (31):821–826 Maroney, Susan A, Brian C Cooley, Josephine P Ferrel, Catherine E Bonesho, Lone V Nielsen, Peter B Johansen, Mette B Hermit, Lars C Petersen, et Alan E Mast. Absence of hematopoietic tissue factor pathway inhibitor mitigates bleeding in mice with hemophilia Proceedings of the National Academy of Sciences of the United States of America (février 21, 2012). Morange PE, Renucci JF, Charles MA, Aillaud MF, Giraud F, Grimaux M, Juhan-Vague I. Plasma levels of free and total TFPI, relationship with cardiovascular risk factors and endothelial cell markers. Thromb. Haemos, 2001; 85: 999-1003. Morange, P E, C Bickel, V Nicaud, R Schnabel, H J Rupprecht, D Peetz, K J Lackner, F Cambien, S Blankenberg, et L Tiret Haemostatic factors and the risk of cardiovascular death in patients with coronary artery disease: the AtheroGene study Arteriosclerosis, thrombosis, and vascular biology 26, no. 12 (décembre 2006): 2793-2799. Ndonwi M, Tuley EA, Broze Jr GJ. The Kunitz-3 domain of TFPI-alpha is required for protein S-dependent enhancement of factor Xa inhibition. Blood 2010;116(8):1344–51. Novotny WF, Girard TJ, Miletich JP, Broze GJ Jr. Platelets secrete a coagulation inhibitor functionally and antigenically similar to the lipoprotein associated coagulation inhibitor Blood 1988; 72(6): 2020-2025 Novotny WF, Palmier M, Wun TC, Broze GJ Jr, Miletich JP. Purification and properties of heparin releasable lipoprotein-associated coagulation inhibitor. Blood 1991; 78 (2): 394-400 Ostergaard P, Nordfang O, Petersen LC, Valentin S, Kristensen H. Is tissue factor pathway inhibitor involved in the antithrombotic effect of heparins? Biochemical considerations Haemostasis 1993;23:107–111 Peraramelli S, Rosing J, Hackeng TM. TFPI –dependent activities of protein S. Thromb Research 2012; 129: 523-526. Petersen LC, Bjorn SE, Olsen OH, Nordfang O, Norris F, Norris K. Inhibitory properties of separate Kuntitz-type-protease-inhibitor domains from tissue factor pathway inhibitor. Eur J Biochem 1996; 235: 310-316

11
Piro O, Broze GJ, Jr. Comparison of cell-surface TFPIalpha and beta. J Thromb Haemost. 2005;3:2677–2683. Rapaport, S I, et L V Rao The tissue factor pathway: how it has become a “prima ballerina” Thrombosis and haemostasis 74, no. 1 (juillet 1995): 7-17 Regnault V, Perret-Guillaume C, Kearney-Schwartz A, Max JP, Labat C, Louis H, Wahl D, Pannier B, Lecompte T, Weryha G, Challande P, Safar ME, Benetos A, Lacolley P. Tissue factor pathway inhibitor: a new link among arterial stiffness, pulse pressure and coagulation in postmenopausal women. Arterioscler Thromb Vasc Biol 2011; 31: 1226-32 Sakkinen PA, Cushman M, Psaty BM, Kuller LH, Bajaj SP, Sabharwal AK, Boineau R, Macy E, Tracy RP. Correlates of antithrombin, protein C,protein S, and TFPI in a healthy elderly cohort. Thromb Haemost 1998;80:134–139. Sandset PM, Abildgaard U, Larsen ML. Heparin induces release of extrinsic coagulation pathway inhibitor (EPI). Thromb Res 1988;50: 803–813. Sandset PM, Warn-Cramer BJ, Maki SL, Rapaport SI. Immunodepletion of extrinsic pathway inhibitor sensitizes rabbits to endotoxin– induced intravascular coagulation and the generalized Shwartzman reaction. Blood 1991;78:1496–1502. Sandset PM, Abildgaard U. Extrinsic pathway inhibitor–the key to feedback control of blood coagulation initiated by tissue thromboplastin. Haemostasis 1991;21(4):219–39 Sandset PM. Tissue factor pathway inhibitor (TFPI) – an update. Haemostasis 1996;26(suppl 4):154–165. Sandset PM, Bendz B, Hansen JB. Physiological Function of Tissue Factor Pathway Inhibitor and Interaction with Heparins. Haemostasis 2000; 30 (2): 48-56 Sandset, Per Morten, Bjørn Bendz, et John-Bjarne Hansen Physiological Function of Tissue Factor Pathway Inhibitor and Interaction with Heparins Pathophysiology of Haemostasis and Thrombosis 30, no. Suppl. 2 (2000): 48-56. Seré KM, Rosing J,Hackeng TM. Inhibition of thrombin generation by protein S at low procoagulant stimuli: implications formaintenance of the hemostatic balance. Blood 2004;104(12):3624–30. Sevinsky JR, Rao LV, Ruf W. Ligand-induced protease receptor translocation into caveolae: A mechanism for regulating cell surface proteolysis of the tissue factor-dependent coagulation pathway. J Cell Biol 1996;133:293–304

12
Vambergue, A, L Rugeri, V Gaveriaux, P Devos, A Martin, C Fermon, P Fontaine, et B Jude. Factor VII, tissue factor pathway inhibitor, and monocyte tissue factor in diabetes mellitus: influence of type of diabetes, obesity index, and age Thrombosis research 101, no. 5 (mars 1, 2001): 367-375. Valentin S, Larnkjer A, Ostergaard P, Nielsen JI, Nordfang O. Characterization of the binding between tissue factor pathway inhibitor and glycosaminoglycans. Thromb Res 1994;75:173–183. van der Logt, C P, P H Reitsma, et R M Bertina Intron-exon organization of the human gene coding for the lipoprotein-associated coagulation inhibitor: the factor Xa dependent inhibitor of the extrinsic pathway of coagulation Biochemistry 30, no. 6 (février 12, 1991): 1571-1577. van der Logt CP, Dirven RJ, Reitsma PH, Bertina RM. Expression of tissue factor and tissue factor pathway inhibitor in monocytes in response to bacterial lipopolysaccharide and phorbol ester. Blood Coagul Fibrinolysis 1994; 5 (2): 211-220 Warr TA, Warn-Cramer BJ, Rao LV, Rapaport SI. Human plasma extrinsic pathway inhibitor activity: I. Standardization of assay and evaluation of physiologic variables. Blood 1989;74:201–206 Westmuckett AD, Lupu C, Roquefeuil S, Krausz T, Kakkar VV, Lupu F. Fluid flow induces upregulation of synthesis and release of tissue factor pathway inhibitor in vitro. Arterioscler Thromb Vasc Biol. 2000;20: 2474–2482 Wun, T C, K K Kretzmer, T J Girard, J P Miletich, et G J Broze Jr. Cloning and characterization of a cDNA coding for the lipoprotein-associated coagulation inhibitor shows that it consists of three tandem Kunitz-type inhibitory domains The Journal of biological chemistry 263, no. 13 (mai 5, 1988): 6001-6004. Zakai NA, Lutsey PL, Folsom AR, Heckbert SR, Cushman M. Total tissue factor pathway inhibitor and venous thrombosis. Thromb and Haemost 2010; 104: 207-212.

13
I) TFPI and deep venous thrombosis
1) Antithrombotic effect of TFPI in animal models
Immunodepletion of TFPI in rabbits lowers the threshold by which tissue factor may
trigger coagulation supporting the physiologic role for TFPI as a natural anticoagulant
(Sandset et al 1991). Animal models of thrombosis suggested a critical role for TFPI in
regulating thrombosis and that exogenous TFPI exerts an anticoagulant effect (Holst and al
1994). Recently a randomized study evaluated the efficacy of recombinant human TFPI
(rhTFPI) using a rat model of micro-venous thrombosis and showed that the use of topical
rhTFPI increased venous anastomotic patency rates in vivo (Ezzat et al 2010).
Because TFPI seemed to play an antithrombotic role of a primary importance as a
“prima ballerina” it was expected to find TFPI defects in patients with deep venous
thrombosis (Rapaport et al 1995).
2) TFPI gene polymorphisms
2a) TFPI gene mutations enhancing or not the thrombotic risk:
A few polymorphism sites in the TFPI gene have been described in the normal
population or in patients with venous thrombosis.
A TFPI-C536T mutation has been statistically associated with a higher risk of venous
thrombosis (Kleesiek et al 1999; Paciaroni et al 2001). However this result has not been
confirmed by other studies (Evans et al 2000; Gonzalez Conejero et al 2000; Junker et al
2002). TFPI-V264M mutation is not linked to venous thromboembolism disease (Arnaud et al
1999; Amini-Nekoo et al 2001). C-399T polymorphism in the promoter region of human TFPI
gene does not change the plasma TFPI antigen level and does not cause venous thrombosis
(Miyata et al 1998). On an other study, this mutation has been shown to be associated to
decreased level of TFPI activity, but still not related to venous thrombosis (Opstad and al
2010).
The Asn221Ser mutation was significantly associated with total TFPI levels but not
with free TFPI levels and not with DVT (Ishikawa and al 2099).

14
2b) TFPI gene mutations decreasing the thrombotic risk
Indeed, some TFPI gene mutations seem to protect from thrombosis.
It has been reported that single nucleotide polymorphism (SNPs) in the regulatory
regions of the gene such as the T-287C and the T-33C could be associated with lowered risk
of thrombosis (Skretting et al 2010). These 2 polymorphisms have been associated with
slightly higher levels of free TFPI (Opstad and al 2010, Segers et al 2010). Moreover these
two mutations have been shown to decrease the endogenous thrombin potential in presence
of activated Protein C. In Segers’s study, carriership of the –287C allele was associated with
decreased thrombin generation, both in the absence and presence of APC. In the same
study, TFPI T-33C profoundly affected thrombin generation under all experimental conditions.
In particular, the –33C allele was associated with a prolonged lag time and decreased
thrombin peak and endogenous thrombin potential (ETP). The effect on lag time was most
pronounced at low TF with thrombomodulin.
3) TFPI antigenic or activity levels and risk of DVT
The Leiden Thrombophilia study (Dahm et al 2003) determined the effect of low TFPI
as a risk factor for DVT. Ten percent (n = 39) of healthy controls (474) had free TFPI levels
below 9.0 ng/mL (10th percentile = 9 ng/mL). Nineteen percent of the patients (474) with
DVT had free TFPI levels below this cut-off, which means that individuals with a free TFPI
levels below 9 ng/mL had an approximately 2-fold increased risk of developing DVT
compared with individuals having TFPI levels above this cut-off value. Similar results were
obtained for TFPI total antigen and TFPI activity. Further analysis revealed that lower TFPI
levels, (eg, cut-off at the 5th and 2nd percentiles) were associated with higher ORs for DVT
(Table I-1). This dose-response relationship of higher risk with slightly lower TFPI levels
suggests a threshold level for the protective effect of TFPI against DVT. However when the
authors completely eliminated the effect of OC use by excluding all women who used OC
either at the index date (time of thrombosis) or at veni puncture, the power of the study was
reduced: they ended up with 336 patients (90 exclusions) and 387 controls (10 exclusions)
and the ORs for thrombosis at low levels of TFPI were attenuated. For low TFPI-free antigen,
for example, the OR was 1.2 (95% CI, 0.8-2.0) for cut-off at the 10th percentile, increasing to
2.1 (95% CI, 0.8-5.9) for cut-off at the 2nd percentile.
Low TFPI anticoagulant activity measured using a dPT-based assay on the same
population of controls and patients gave an OR of 1.5 (0.97–2.4) for DVT, similar to the ORs
obtained with the chromogenic TFPI assays (Dahm et al 2005).
15
An other study showed that the total and free TFPI levels were significantly lower in
patients with DVT than in controls (Amini-Nekoo et al 2001).
Zakai and al studied the impact of pre VTE TFPI levels on VTE occurrence in patients
included in the LITE (The Longitudinal Investigation of Thromboembolism Etilology); they
showed that when total TFPI levels are below the 5th percentile (< 18.8ng/ml), there is a
moderately increased risk of VTE with an OR of 1.35 (05 % CI : 0.86-2.12) demonstrating
that there is no association between total TFPI and VTE (Zakai et al 2010).
However, it has been shown that low total TFPI is an independent risk factor for
symptomatic venous thromboembolism and stroke in children (Duering C et al 2004). Total
TFPI concentrations were measured along with established prothrombotic risk factors 6 to 12
months after the acute thrombotic event in 144 causasian children aged 0.6 to 18 years
(venous thrombosis: n = 80; ischaemic stroke n= 64). The cut-off values defined as age-
dependent 10 th percentile were obtained from 244 healthy controls. We can observe once
again as in other studies that the range of normal values of TFPI measured on healthy
controls is very large: 25.4 to 117.4 also depending on age. In this study, 42 of the 144
patients (29.2%) compared with 25 of the 244 controls (10.2%) showed TFPI concentrations
below the 10th age dependent percentiles. Multivariate analysis adjusted for the presence of
established prothrombotic factors showed a significantly increased odds ratio [ 95 %
confidence interval (CI)] for patients with a thrombotic event [OR (CI): 3.8 (2.2 – 6.6); p <
0.0001].

16
Table I-1: Studies that explored the role of TFPI in venous thrombosis
Reference Design of the study TFPI
measured Population
Parameter evaluated
Odd Ratio
Dahm et al 2003 Leiden Thrombophilia Study (LETS)
474 Patients with DVT 474 controls
F TFPI T TFPI TFPI A (chromogenic assay)
Adults < 10 th perc F TFPI TTFPI A TFPI
< 5th perc F TFPI TTFPI TFPI A
1.7 (CI: 1.1- 2.6) 1.5 (CI: 0.98- 2.3) 1.1 (CI: 0.73- 1.8) 2.1 (CI: 1.1-4.1) 2.1 (CI: 1.1 – 4.1) 1.6 (CI: 0.87- 2.8)
Dahm 2005 LETS
474 patients (DVT) 474 controls
TFPI A (dPT assay)
Adults < 10 th perc
TFPI A
1,5 (0,97- 2, 4)
Amini-Nekoo 2001
122 DVT patients 126 controls
Total TFPI Adults
TTFPI patients: 66.1 ng.mL-1;
TTFPI controls : 77.6 ng.mL-1
P= 0.0001
ND
Zakai 2010
21680 patients 457 with DVT
Total TFPI
Adults (from 45 years old)
< 5th perc TTFPI
1.35 (0.86-2.12)
Duering 2004
Case control study VT (n = 80); IS (n = 64) Controls (244)
Total TFPI Children (0.6 to 18 years )
TTFPI Ag < 10 (th) percentiles
3.8 (CI: 2.2; 6.6)
VT: venous thrombosis; IS ischemic stroke; F TFPI: free TFPI; T TFPI: total TFPI;
TFPI a: TFPI activity. No familial study was performed in all these studies.
In conclusion, these studies provided non convincing results on the responsibility of
TFPI deficiency in the occurrence of DVT excepting in children in whom TFPI could have a
greater importance compared to adults.
Actually, a fundamental question could be whether circulating TFPI plays any
significant role in venous thrombosis in vivo. The hypothesis emerged that the most
important pool of TFPI in vivo could be the much larger pool of TFPI bound to the
endothelium.

17
4) Role of heparin releasable TFPI in venous thrombosis
Because the link between TFPI deficiency and thrombosis had not been clearly
demonstrated in humans the hypothesis emerged that this absence of link was related to the
fact that previous studies had focused on the measurement of plasma TFPI, which is only a
small part of the total body TFPI. The major fraction of TFPI that is linked to endothelial cells
can be measured in plasma after release by heparin injection (Sandset et al 1988). To
investigate if deficiency of heparin-releasable TFPI is associated with thrombosis, TFPI
activity has been measured in plasma before and 10 min after intravenous injection of 7500
IU unfractionated heparin in 64 young patients with venous thrombosis and in 38 healthy
individuals (Ariens et al 1999). Post-heparin TFPI activity levels were significantly lower in
the group of patients with venous thrombosis than in controls (mean ± SD: 230% ± 39 vs
260% ± 34, p = 0.0002). Defining the normal range as the mean ± 2 SD of TFPI activity in
controls, seven patients with venous thrombosis had low post-heparin TFPI activity levels.
Low levels of TFPI were confirmed by immunoassay in six of the seven patients with venous
thrombosis, and were present also in at least one first degree relative of three patients,
suggesting that the defect might be inheritable. However, the causative role of low heparin-
releasable TFPI remained uncertain, because co-segregation of the defect with thrombotic
symptoms could not be demonstrated in the small number of families studied. All nine exons
of the TFPI gene were screened for mutations in the 7 patients with low levels of heparin-
releasable TFPI (Amini-Nekoo et al 2001).
Only a transition of G to A coding for Valine264Methionine in the heparin-binding
domain was found in one out of the eight patients. However the same study did not show any
association between Val264Met mutation and thrombosis in 317 patients with DVT and 292
controls. Our group performed a very similar study to investigate if venous thrombosis could
be related to deficiency of TFPI vascular pool (Tardy-Poncet and al 1999). We measured
TFPI in plasma before and 10 min after an intravenous injection of 5000 IU unfractionated
heparin in 68 young patients with idiopathic venous thrombosis and 37 healthy individuals.
The mean pre-heparin TFPI total antigen, TFPI free antigen, and TFPI activity levels in the
group of patients with venous thrombosis were not different from those in controls. The same
results were found for the total and free post heparin TFPI mean levels, and post heparin
TFPI activity. However, based on the optimal cut-off value of 1.80 U/ml for post heparin TFPI
activity, 2.8 % of controls (1/36) and 12.3 % of patients (7/57) presented low levels of
heparin-releasable TFPI. Of these 7 patients, three also had low pre-heparin TFPI activity
levels, but none of them had low pre- or post-heparin TFPI total or free levels. The measure

18
of post heparin TFPI activity appeared to be important to detect critically low activity of this
inhibitor, which was not always below the normal range at baseline. Because, the low post
heparin TFPI activity in these 7 patients did not correspond to a low post heparin free TFPI
levels, we hypothesised that this discrepancy could be related to a qualitative abnormality of
the heparin-releasable TFPI; whether this abnormality was inherited was not studied.
Moreover an other study performed in children (Duering et al 2004) showed that, compared
to baseline values, 78.6 % of children with total TFPI Ag < 10 th percentiles showed a low
response to enoxaparin administration whereas, in children with normal baseline TFPI values,
only 30 % of them showed a low TFPI release (p = 0.007).
In clinical practice, post heparin TFPI level is not really easy to explore and
until now still does not belong to a routine exploration.
Because it had already been shown that thrombosis may also resulted from
resistance to coagulation inhibitors (Dahlback et al 1994) we hypothesized that a
resistance to TFPI activity could be responsible of VTE.
5) Could VTE be related to a resistance to the anticoagulant
activity of TFPI?
We compared the response to the anticoagulant activity of purified TFPI added to the
plasma of patients with the response to the anticoagulant activity of purified TFPI added to
the plasma of healthy controls.
5 a) In a one step assay
Patients and methods
Patients and controls
A total of 118 patients consecutively referred to our thombosis center for a recent
episode or history of venous thrombosis were studied between October 1997 and May 2000,
provided they met the pre-established criteria. All patients had presented an objectively
confirmed deep venous thrombosis (DVT) or a superficial venous thrombosis (SVT) and/or
an objectively confirmed pulmonary embolism (PE), before the age of 60 years. SVT and
DVT were diagnosed by compression ultrasonography and/or contrast venography,
pulmonary embolism being confirmed by high-probability ventilation-perfusion lung scanning
19
and/or pulmonary angiography. All patients were examined after the end of the acute phase
of the venous thromboembolic episode when they were no longer taking any anticoagulant
treatment. None of them had a deficiency in antithrombin III, protein C or protein S, activated
protein C resistance, or lupus-type anticoagulant. They also had no known malignant or
connective tissue disease. A total of 107 members of the hospital staff, having no personal or
family history of venous thrombosis, were selected as controls.
Methods
Blood samples: they were collected in the morning in tubes containing 0.129 mol /L
trisodium citrate. After a double centrifugation (15 min; 2000g) 500 µl aliquots of plasma were
collected and stored at -70°C until analysis. Pooled normal plasma from 50 healthy
volunteers was used as the reference plasma.
Tissue factor (Thromborel) was purchased from Behring Siemens, full-length
recombinant human TFPI from American Diagnostica, Andresy France), and bovine serum
albumin (BSA) from Sigma.
Description of the assay based on dPT: To evaluate the plasma response to
anticoagulant activity of exogenous TFPI, two modified diluted prothrombin times (dPT) were
determined, one with and one without exogenous TFPI. For this purpose, two reagents were
prepared: R1 and R2. R1 comprised a Tris bovine serum albumin (BSA) buffer (50 mmol L-1
Tris/HCl, 100 mmol L-1 NaCl and 1 g L-1 of BSA, pH 7.5) containing 25 mmol L-1 CaCl2 and
tissue factor (Thromborel S, Behring, Paris, France) diluted to a final concentration of 1/450.
R2 had the same composition as R1, except that it additionally contained purified human
TFPI to a final concentration of 200 ng.mL-1. After a 15-s incubation of 50 µL undiluted
patient and control plasma samples at 37°C, clotting was initiated by adding 50 µL solution
R1 and the “dPT without TFPI” was recorded. Identical plasma samples were then incubated
with solution R2 to determine the “dPT with TFPI”. Clot formation was recorded for 240 s on
a coagulometer (BCT Behring). All measurements were performed in duplicate and the final
result was the mean of the two measurements. TFPI sensitivity ratios were obtained by
dividing the “dPTwith TFPI” by the “dPTwithout TFPI”. In each serie, we also measured the
TFPI sensitivity ratios of the reference plasma. The mean TFPI sensitivity ratio of the
reference plasma was 2.01 (mean value of 30 measurements). The normalized ratio was
then calculated by dividing the TFPI sensitivity ratio obtained for patient and control plasma
samples by the TFPI sensitivity ratio obtained for the reference plasma in each serie. Plasma
levels of factor VIII and fibrinogen were measured by a clotting assay (Annexe 1).

20
Statistical analysis
Quantitative data were reported as mean standard deviation (SD), using the median
and interquartile range to express 50% of the central value. When the distribution of the
values was not normal, the median test was performed. Qualitative data were expressed as
percentages. Qualitative and quantitative data were compared between patients and controls
using Fisher’s exact test and Student’s t-test, respectively. For the other comparisons, the
same tests were used when the size of the groups was sufficiently large. In other cases, the
Wilcoxon signed-rank test was used for quantitative data. The correlation between “dPT
without TFPI” and TFPI normalized ratio was assessed by linear regression and the R-
square value was calculated. We calculated crude matched OR as estimates of the relative
risk by simple cross-tabulation. The OR reflected the risk of thrombosis when the TFPI
normalized ratio was low (under the fifth percentile) relative to the risk when this ratio was
within the normal range. The odds ratio for a low “dPT without TFPI” was also calculated.
Results
The characteristics of the controls and patients are given in Table I-2. The mean age
and the male/female ratio were similar in the control and patient groups.
Table I-2: Characteristics of controls and patients
Controls
n = 107
Patients
n = 118
P value
Age (years) Mean ± SD
Median [q1-q3]
37.2 ± 9.5
36 [29-44]
37.2 ± 10.6
37 [29-45]
NS
NS
Sex Women
< 45 years
> 45 years
Men
75%
57%
18%
25%
81%
59%
22%
19%
NS
NS
NS
NS
TFPI normalized
ratio
Median [q1 - q3]
0.96 [0.92 – 1.02] 0.94 [0.89 – 1.02] 0.08
NS: non-significant

21
The intra- (n=38) and inter-assay (n= 30) variations of the TFPI sensitivity ratio
measured in the reference plasma were, respectively, 2.0% and 2.9%. Preliminary in vitro
studies showed that fibrinogen levels (from 2.4 to 5.4 g / L) and FVIII levels (from 100% to
180%) did not influence the TFPI normalized ratio. Interestingly, when FVIII plasma
concentration was over 180%, the TFPI normalized ratio increased with FVIII plasma
concentration. Thus, in the eight patients with a plasma FVIII level above 180% (seven
between 180% and 215% and one at 270%), the TFPI normalized ratio was above 0.85. Sex
and age also did not affect the TFPI normalized ratio.
The median of the TFPI normalized ratios was not statistically different between the
control and patient groups. The distribution of TFPI normalized ratio for controls and patients
is shown in Figure I-1. The calculated cut-off value (fifth percentile) under which the
normalized ratio was considered as low was 0.85. Values of “dPT without TFPI” were
significantly lower in individuals with a low TFPI normalized ratio (<0.85) than in individuals
with a higher (≥ 0.85) TFPI normalized ratio (79.5 ± 10.3 and 93.8 ± 10.1, respectively;
Wilcoxon test, p< 0.0001). Thus, a positive correlation was found between “dPT without
TFPI” and TFPI normalized ratio (R2 = 0.37, p< 0.0001). However, a low “dPT without TFPI”
was not always associated with a low TFPI normalized ratio and, conversely, a TFPI
normalized ratio under 0.85 did not always correspond to a “low dPT without TFPI”. A low
normalized ratio (<0.85) corresponding to a poor anticoagulant response to TFPI was
observed in five controls (4.7%) and 13 patients (11%).
Fig I-1: Anticoagulant response to exogenous TFPI in patients and controls plasma.
The characteristics of the 13 patients who had a normalized TFPI ratio under 0.85 are
given in Table I-3.

22
Table I-3 : Characteristics of patients with a TFPI normalized ratio under 0.85
P Age/ Sex
TFPI NR
Fib (g/l)
Age (yrs) at first
thrombosis episode
Type of event Circumstance of thrombosis
Thrombosis Particularity
Family history of thrombosis
1 25 / F 0.84 2.5 21 DVT + PE OC Extension during UFH treatment
Sister: DVT
2 49 / F 0.80 2.9 47 DVT OC - Mother: DVT
3 40 / F 0.83 2.4 37 DVT + PE OC - Mother: SVT
4 45 / F 0.84 3.6 42 PE Post-surgery Occurrence during LMWH prophylaxis
Father :Sudden Death
5 22 / F 0.79 2.7 19 DVT Idiopathic - Mother: 2 DVT episodes
6 52 / F 0.85 2 25 DVT Post-partum Recurrence during UFH treatment
Son: DVT
7 47 / F 0.84 2.5 36 2 X DVT 1 idiopathic, 1post-surgery
- Occurrence during UFH prophylaxis
Mother: DVT recurrences
8 32 / F 0.84 2.9 26 DVT + PE OC - None
9 40 / F 0.80 2.5 40 DVT + PE Post-partum - None
10 33 / F 0.79 5 23 DVT Postpartum - Sister: SVT
11 28 / F 0.83 3.5 22 3 X SVT OC - None
12 49 / F 0.84 2.7 48 SVT OC - Mother: DVT
13 38 / M 0.79 2.6 38 SVT Idiopathic - Father: PE
Fib : Fibrinogen ; DVT : Deep Vein Thrombosis ; SVT ; Superficial Venous Thrombosis ;
PE : Pulmonary Embolism ; OC : Oral Contraception ; UFH : Unfractionated Heparin,
LMWH : Low-Molecular-Weight Heparin ; TFPI NR : TFPI normalized ratio ; P : patient.
Three of these patients had a fibrinogen level above 3.0 g / L. Eleven presented a risk
factor for thrombosis at the time of DVT. Nine had a family history of thrombosis. Interestingly,
in four patients, DVT occurred or recurred during unfractionated heparin or low-molecular-
weight heparin therapy.

23
Table I-4 gives the OR as a function of TFPI normalized ratio. The OR for a poor
response to TFPI (defined as a TFPI normalized ratio under 0.85) was 2.91 (95% CI: 1.18–
7.8), i.e. a poor response to TFPI was associated with an almost three fold increase in the
risk of venous thrombosis. Importantly, a low ‘dPT without TFPI’ was not associated with an
increase in the risk of venous thrombosis. Six controls and seven patients had a low (<75 s)
“dPT without TFPI”. The OR for a low “dPT without TFPI” was 0.78 (95% CI: 0.24–2.42, p =
0.66).
Table I-4: Odds ratios as a function of TFPI-normalized ratio
TFPI normalized
Ratio
Controls
Patients
Odds ratio
(95%CI)
P value
> 0.90 n = 91 n = 86 1
0.85 – 0.90 n = 11 n = 19 1.71(1.08 to 2.79)
< 0.85 n = 5 n = 13 2.91(1.18 to 7.80) 0.025
Discussion
In the present study, we described a new test assessing the plasma anticoagulant
response to exogenous TFPI. A poor anticoagulant response to TFPI, corresponding to a
normalized ratio under 0.85 defined as a resistance to the anticoagulant activity of TFPI, was
found in 11% of patients with venous thrombosis (vs. 4.7% of healthy controls). The finding
that four out of the 13 patients with TFPI resistance developed a venous thrombosis under
heparin treatment supports the hypothesis that TFPI released from the endothelium after
heparin injection may play a significant role in the antithrombotic activity of this molecule
(Sandset et al 1988, Lindahl et al 1991).
TFPI resistance could be related to the presence of an inflammatory syndrome. Even
though all the patients were investigated after the end of the acute phase of the venous
thrombo-embolism episode and none presented any malignant or connective tissue disease,
it is noteworthy that three out of the 13 patients with TFPI resistance had a fibrinogen level
above 3.0 g/L. However, the TFPI normalized ratio was not affected by the fibrinogen level
within the range tested (from 2.4 to 5.4 g/L). As there was a positive correlation between
FVIII plasma level above 180% and TFPI normalized ratio, it was possible that TFPI

24
resistance may have been misdiagnosed for patients with FVIII plasma level above 180%
(eight in the present study). The TFPI resistance observed could also be related to an
inactivation of exogenous TFPI by an excess of lipoprotein (a) [Lp(a)] in the plasma of both
patients and controls. A study established that in vitro Lp(a) binds and also inhibits, in a
concentration-dependent manner, recombinant TFPI activity and endothelial cell-surface
TFPI activity (Caplice et al 2001). However, whereas in this study, TFPI was incubated in the
presence of Lp(a) for 30 min, in our study, exogenous TFPI was incubated with plasma for
less than 4 min, a time possibly too short for Lp(a) binding to TFPI. Nevertheless, as the
lipoprotein status of both patients and controls was not taken into account in our study, we
could not exclude a relationship between TFPI resistance and high plasma levels of Lp(a).
TFPI resistance could also correspond to an inherited molecular defect as well.
However, the TFPI resistance described in this study could not be related to congenital
abnormalities in the TFPI molecule since the anticoagulant activity was measured in the
presence of exogenous TFPI. We rather hypothesized that the molecular basis of TFPI
resistance concerned TF–FVIIa–TFPI–FXa complex formation. The mechanism of inhibition
by TFPI involves its binding first to FXa and then to the FVIIa–TF complex (Broze et al 1988;
Warn-Cramer et al 1988; Baugh et al 1998), resulting in the formation of an inactive
quaternary TF–FVIIa–TFPI–FXa complex. Site-directed mutagenesis experiments indicated
that domain 1 (K1) of TFPI binds to the active site of FVIIa and domain 2 (K2) to the active
site of FXa (Girard et al 1989). The defect could involve factor VIIa since functional defects in
TFPI interactions of VIIa mutants have already been demonstrated (Chang et al 1999,
Neuenschwander et al 1995). A study (Lakhiaev et al 2001) also showed that VIIa protease
domain residues Q176, T239 and E296 are involved in the formation of a stable inhibitor
complex with free TFPI. FXa could additionally be implicated. The light chain of FXa has
been identified as critical in mediating the interaction of TFPI–FXa with TF–FVIIa complex
(Girard et al 1990). The crucial importance of FXa Gla–domain interactions in stabilizing the
quaternary TF–FVIIa–FXa TFPI complex is also recognized (Lakhiaev et al 2001). It was
possible that the low TFPI normalized ratios in the identified plasmas may also have nothing
to do with their response to interaction with TFPI but rather reflected an apparent pro-
coagulant tendency that could be due to a variety of unidentified mechanisms. However,
although a positive correlation was found between “dPT without TFPI” and TFPI normalized
ratio, a low “dPT without TFPI” was neither specific of, nor predictive for, TFPI resistance.
Furthermore, a low “dPT without TFPI” was not associated with an increase in the risk of
venous thrombosis.
We described in this study a novel haemostatic disorder defined as TFPI resistance
and present in 11% of patients with venous thrombosis. The defect underlying this poor

25
anticoagulant response to TFPI was unknown and remained to be explored. However, as
69% (nine of 13) of the patients with TFPI resistance presented a family history of venous
thrombosis we thought as this time that TFPI resistance might correspond to a novel
haemostatic genetic risk factor for DVT.
An other study evaluated the anticoagulant response to exogenously added
recombinant TFPI using a dPT assay that differs from ours in that the plasma was mixed in
FVII-deficient plasma at a ratio of 2 to 3 (Bombeli et al 2003). The response to TFPI was
expressed as the ratio of the clotting time with and without TFPI measured in 118 healthy
controls and 120 patients with a history of venous thrombo-embolism but no evidence of
hereditary or acquired thrombophilia. This study confirmed that levels of coagulant factors II,
V, VII, VIII, IX, X did not correlate significantly with the TFPI sensitivity ratio. However, there
was a tendency for high levels of FVII or FX to be more often associated with a low TFPI
sensitivity ratio.
The patients had significantly lower TFPI sensitivity ratios than the controls. Thirty two
percent of patients had a TFPI sensitivity ratio below the 10th percentile of the controls,
compared with 9.3% of the healthy controls. The crude odds ratio for venous thrombosis for
subjects with a TFPI sensitivity ratio below the 10th percentile was 13 (95% CI; range, 3.1 to
54.9) compared with those with a ratio above the 90th percentile. Patients with idiopathic
thromboembolism did not have a decreased TFPI sensitivity ratio more often than patients
with thrombosis with a circumstantial risk factor. Their results confirmed ours in that a
reduced response to TFPI may lead to an increased risk of venous thrombosis.
5 b) In a two step assay
Because the two assays previously described (Tardy-poncet et al 2003, Bombeli et al
2003) were not able to give precisely a cut off value to define TFPI resistance, we tried to
describe a new assay based on a two-step dPT. We performed this new assay in patients
with venous thrombosis and in healthy controls.
The main objective of this study was to evaluate the ability of the two step assay to
demonstrate a difference in exogenous TFPI sensitivity of plasma between patients and
controls.
The secondary objectives were:
to compare the TFPI activity between patients and controls
to compare free TFPI levels between patients and controls

26
Patients and methods
Patients and controls
One hundred and thirty one patients with deep venous thrombosis without any
prothrombic biological disorder were included in this study. All patients had presented an
objectively confirmed DVT and/or a PE, before the age of 60. Plasma was taken outside the
acute phase of the venous thromboembolic episode when the patients were no longer on
anticoagulant treatment. None of them had an antithrombin , protein C or protein S deficiency
or a Leiden factor V, or a 20210 G/A mutation in prothrombin gene or a lupus-type
anticoagulant. They also had no known malignant or connective tissue disease. A total of
219 sex and age matched controls, having no personal or family history of venous
thrombosis, were enrolled into the study. All these patients and controls had been examined
in the Haemostasis units of St Etienne, Marseille and Lyon University Hospitals. Patients and
controls who presented an abnormal response to TFPI on the first sample were asked by
letter to come back to hospital for a control. This study has been approved by the Ethical
Comitte (Comité de Protection des Personnes: CPP SUD-EST I). All patients and controls
signed an informed consent.
Methods
Blood samples were collected in tubes containing 0.129 mol.L-1 trisodium citrate
anticoagulant. After a double centrifugation (15 min at 2500 g), aliquots of plasma were
stored at -70°C until analysis. Pooled normal plasma from 55 blood donors was used as the
reference plasma.
Anticoagulant response to exogenous TFPI:
To evaluate the anticoagulant response of plasma to exogenous TFPI, we used a
diluted prothombin time (dPT) assay with and without exogenous TFPI. Recombinant tissue
factor (Innovin®) was purchased from Behring Siemens, full-length recombinant human TFPI
from American Diagnostica, and BSA from Sigma.
* For the two-step dPT assay, 50 µL of undiluted patient or control plasma samples
were incubated during 60-second at 37°C with 50 µL of recombinant diluted tissue factor
(1/450 final dilution) in tris (50 mM), NaCl (100 mM) buffer, pH 7.5. Coagulation was initiated
by adding CaCl2 (50 mM) BSA (10 g/L) buffer with or without TFPI. We previously showed
that there was a linear response of dPT to different TFPI concentrations (Annexe 2).
Because we hypothesized that a TFPI resistance at low TFPI concentration should persist at

27
a higher TFPI concentration, it had been decided to use two TFPI concentrations (final
concentrations: 62 and 125 ng/mL) to ensure the reality of the resistance.
* The one-step dPT assay was performed as previously described. Briefly, clotting
was initiated by adding CaCl2 (50 mM) mixed with recombinant tissue factor (Innovin
Siemens France) (1/450 final dilution), in [ tris (50 mM), NaCl (100 mM) and BSA (10 g/L)
buffer, pH 7.5] at 37°C, with or without TFPI at a final concentration of 150 ng/ml. The TFPI
concentration was somewhat different from that used in the first study. This was related to
the fact that TFPI badges were different between the 2 studies. The TFPI concentration was
defined on the time prolongation with obtained on the reference plasma that has to be
around three (2.7 to 3.10) times the basal dPT.
For both assays, initial dPT and dPT + TFPI were recorded by an automated
coagulation analyser (BCS, Siemens, St Denis, France) for patients, controls and reference
plasmas. All assays were performed in duplicate. TFPI sensitivity ratios were obtained by
dividing the “dPT with TFPI” by the “dPT without TFPI”. We also measured the sensitivity
ratio of the reference plasma. The TFPI normalized ratio (TFPI NR) was then calculated by
dividing the TFPI sensitivity ratio obtained for patient and control plasma samples by the
TFPI sensitivity ratio obtained for the reference plasma.
Chromogenic measure of TFPI activity
To evaluate the anticoagulant activity of endogenous TFPI, we used the chromogenic
assay described by Sandset and slightly modified. This assay is based on the ability of TFPI
to inhibit TF/FVIIa catalytic activity, in presence of FXa. Briefly, 25 µL of diluted plasma (1/80)
was incubated for 30 min, allowing the formation of inactive TF/FVIIa/TFPI/FXa complexes.
Fibrin polymerization inhibitor, Pefabloc FG 50 mg (Pentapharm, Cryopep, France), was
added to prevent formation of cross-linked fibrin. After this first incubation, residual TF/FVIIa
catalytic activity was determined by the addition of FX and its selective chromogenic
substrate, CS-11(32), 2.5 mg.mL-1 (Hyphen BioMed, Neville sur Oise, France).
Because some of the reagents were not any more supplied by some manufacturers
we had to search for the best analytic conditions with the new reagents. The data concerning
the choice of reagent concentrations and the details of the assay are provided in annexe 3.
Measure of free TFPI
Free TFPI level was determined by ELISA method using a commercial assay
(Asserachrom® Free TFPI, Diagnostica Stago, Asnières, France) according to the
manufacturer’s recommendations. See annexe 1.

28
Factor VIII and fibrinogen plasma levels were measured by a clotting assay as part of a
routine biological check up. See annexe 1.
Statistical analysis
Quantitative data are reported as mean ± standard deviation (SD), using the median
and interquartile range to express 50% of the central value. When the distribution of the
values was not normal, the median test was performed. Qualitative data are expressed as
percentages. Qualitative and quantitative data were compared between patients and controls
using Fisher’s exact test and Student’s t-test, respectively. For the other comparisons, the
same tests were used when the size of the groups was sufficiently large. In other cases, the
Wilcoxon signed-rank test was used for quantitative data. The correlation between “dPT
without TFPI” and TFPI NR was assessed by linear regression and the R-square value was
calculated. We calculated crude matched OR as estimates of the relative risk by simple
cross-tabulation. The OR reflects the risk of thrombosis when the TFPI NR is low relative to
the risk when this ratio is within the normal range.
Results
Characteristics of the assay
The response of the reference plasma to added TFPI is based on the TFPI sensitivity
ratio that is defined as follow “dPT with TFPI” divided by “dPT without TFPI”. For the two-step
assay, TFPI concentration of 62 ng.mL-1 gives a TFPI sensitivity ratio of 2.9 ± 0.18 and TFPI
concentration 125 ng.mL-1 a TFPI sensitivity ratio of 4.9 ± 0.41. For the one-step assay, TFPI
concentration of 150 ng.mL-1 gives a TFPI sensitivity ratio of 2.8 ± 0.1. For the one-step
assay, TFPI concentration is twice the concentration needed in the two-step assay to obtain
the same TFPI sensitivity ratio.
For the two step assay, intra assay variation coefficient (established on 30
measurements) was 2.2 % and inter assay variation coefficient (established on 30
measurements) was 5.5 %. For the one step assay, inter assay variation coefficient
(established on 18 measurements) was 3.4 %.
In the two step assay, TFPI normalised ratio was not correlated to initial dPT (R2 =
0.0135), fibrinogen level (R2 = 0.0146) or FVIII level (R2 = 0.0079). Moreover, no statistically
difference in normalised ratios was found between FVIII > 150% patients group and
FVIII<150% patients group. There was no correlation between TFPI NR and normal free PS

29
values neither in the one step assay (R2 = 0. 03) nor in the two step assay (R2 0.06). There
was no correlation between TFPI activity and free protein S (R2 = 0. 0004).
Characteristics of the patients
In all, 131 patients and 219 matched controls have been enrolled into the study.
Controls and patients biological characteristics are given in Table I-5. The male/female ratio
was similar in the controls and patients groups. Factor VIII level is slightly higher in the
patient group. Fibrinogen and protein S values are similar in the two groups and none of the
patients has a protein S value under 60% which is the lower limit of the normal range that
has been defined in our laboratory.
Tableau I-5: Characteristics of patients and controls
Patients Controls
(n=131) (n=219)
Sex (%)
Men 32.8 % 30.6 %
Women 67.2 % 69.4 %
VIII Factor (%)
Mean ± SD 121.0 ± 32.9 95.3 ± 18.6
Median (min : max) 118.0 (51.0 : 216.0) 92.0 (57.0 : 156.0)
Fibrinogene (g.L 1 )
Mean ± SD 3.1 ± 0.6 3.0 ± 0.6
Median (min : max) 3.0 (2.0 : 4.5) 3.0 (1.1 : 5.4)
Protein S (%)
Mean ± SD 99.2 ± 21.9 106 ± 18.4
Median (min : max) 97.0 (62.0 : 151.0) 104.0 (73.0 : 143.0)
The mean age was similar in the controls and patients groups (45.1±11.1 vs
46.5±12.8 respectively). The average age of the first thrombotic episode is 37.8 year. In all,
83 patients presented an isolated DVT, 29 a DVT associated to a PE and 19 presented a PE
without any DVT identified. At the time thrombosis occurred, 16% of patients were on DVT
prophylactic treatment (LMWHs, UFH). Seventy three percent of patients presented at least
one trigger factor: oral contraceptives or menopause replacement therapy (27%), surgery
(19%), traumatism (17%), immobilization (15%), travel (12%), pregnancy (5%), post-partum
(5%), and/or another trigger factor (2%) (overweight, sclerotherapy, crouched work). Twenty
two percent of patients presented venous insufficiencies. Forty percent presented a venous
thromboembolic recurrence; no difference in TFPI NR was found between patients with and
without venous thromboembolic recurrence (mean TFPI 125 NR: 0.86±0.15 vs mean TFPI
125 NR: 0.87±0.14 respectively)

30
Differences in exogenous TFPI sensitivity
Patient and control plasma response to added TFPI was based on the measure of
dPT without (Wo) and dPT with added TFPI and characterized by the TFPI NR (dPT with
TFPI/ dPT Wo TFPI)
The basal dPT were not different between patients and controls whatever the assay
that was used. The median TFPI NR was statistically lower in patients than in controls
whatever the assay that was used. Table I-6
Table I-6: Basal dPT and TFPI NR at different TFPI concentration
Two step assay
TFPI 62 ng/ml
Two step assay
TFPI 125 ng/ml
One step assay
TFPI 150 ng/ml
Controls
Basal dPT (median)
TFPI NR (median)
59.4 sec
0.96
59.4
0.92
69.7
0.97
Patients
Basal dPT (median) (sec)
TFPI NR (median)
60.8 sec
0.91 (p=0.004)
60.8
0.82 (p=0.0004)
72.6
0.91 (p=0.002)
dPT: diluted Prothrombin Time; TFPI NR: TFPI normalized ratio;
TFPI NR125 between women and men were also compared in the whole group
(controls + patients). The mean TFPI NR 125 is statistically lower in women (0.89±0.19) than
in men (0.96±0.18), p = 0.0002.
In controls, the mean TFPI NR125 was 0.98 ± 0.17 for men and 0.92 ± 0.20 for
women. In patients, the mean TFPI NR125 was 0.91 ± 0.18 for men and 0.84 ± 0.13 for
women.
.
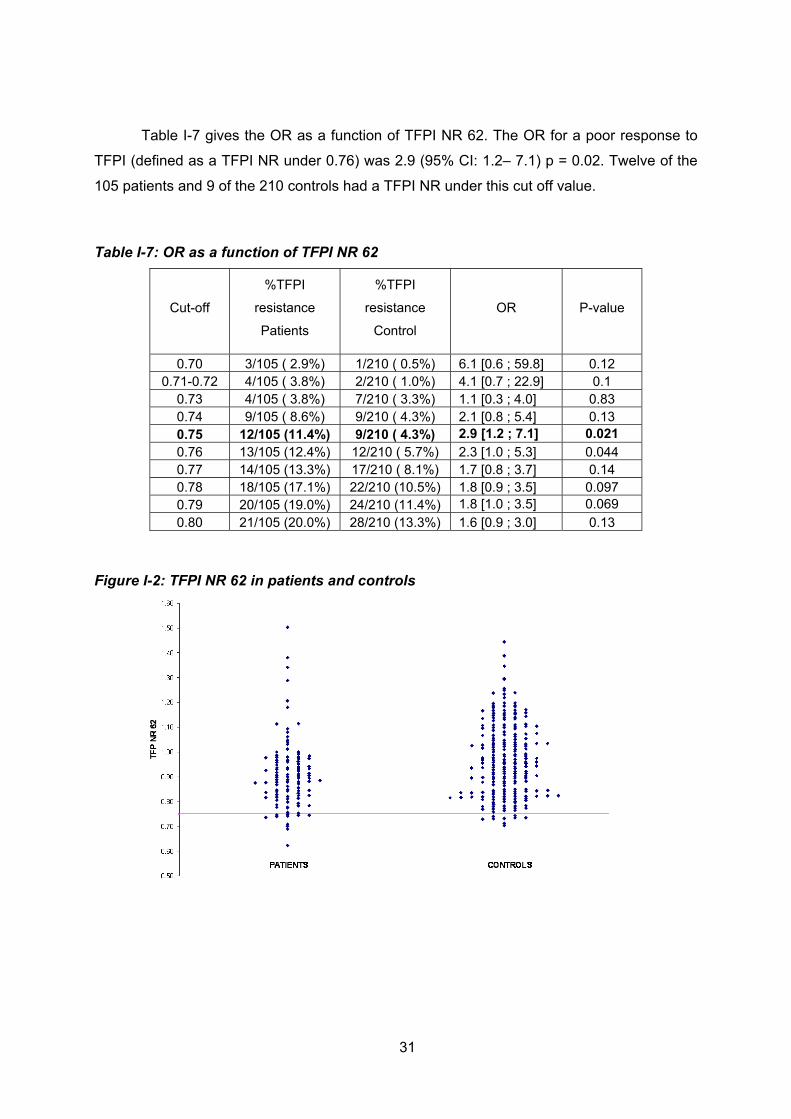
31
Table I-7 gives the OR as a function of TFPI NR 62. The OR for a poor response to
TFPI (defined as a TFPI NR under 0.76) was 2.9 (95% CI: 1.2– 7.1) p = 0.02. Twelve of the
105 patients and 9 of the 210 controls had a TFPI NR under this cut off value.
Table I-7: OR as a function of TFPI NR 62
Cut-off
%TFPI
resistance
Patients
%TFPI
resistance
Control
OR P-value
0.70 3/105 ( 2.9%) 1/210 ( 0.5%) 6.1 [0.6 ; 59.8] 0.12 0.71-0.72 4/105 ( 3.8%) 2/210 ( 1.0%) 4.1 [0.7 ; 22.9] 0.1
0.73 4/105 ( 3.8%) 7/210 ( 3.3%) 1.1 [0.3 ; 4.0] 0.83 0.74 9/105 ( 8.6%) 9/210 ( 4.3%) 2.1 [0.8 ; 5.4] 0.13 0.75 12/105 (11.4%) 9/210 ( 4.3%) 2.9 [1.2 ; 7.1] 0.021 0.76 13/105 (12.4%) 12/210 ( 5.7%) 2.3 [1.0 ; 5.3] 0.044 0.77 14/105 (13.3%) 17/210 ( 8.1%) 1.7 [0.8 ; 3.7] 0.14 0.78 18/105 (17.1%) 22/210 (10.5%) 1.8 [0.9 ; 3.5] 0.097 0.79 20/105 (19.0%) 24/210 (11.4%) 1.8 [1.0 ; 3.5] 0.069 0.80 21/105 (20.0%) 28/210 (13.3%) 1.6 [0.9 ; 3.0] 0.13
Figure I-2: TFPI NR 62 in patients and controls

32
Table I-8 gives the OR as a function of TFPI NR 125. The OR for a poor response to
TFPI (defined as a TFPI NR under 0.65) was 9.7 (95% CI: 2.7– 35) p <0.0001. Thirteen of
the 105 patients and three of the 210 controls had a TFPI NR 125 under this cut off value.
Table I-8: OR as a function of TFPI NR 125
Cut-off %TFPI
resistance Patients
%TFPI resistance Control
OR P-value
0.57 3/105 ( 2.9%) 1/210 ( 0.5%) 6.1 [0.6 ; 59.8] 0.12 0.58-0.59 4/105 ( 3.8%) 1/210 ( 0.5%) 8.3 [0.9 ; 75.0] 0.06
0.60 5/105 ( 4.8%) 1/210 ( 0.5%) 10.4 [1.2 ; 90.6] 0.033 0.61 7/105 ( 6.7%) 2/210 ( 0.9%) 7.4 [1.5 ; 36.4] 0.013 0.62 8/105 ( 7.6%) 2/210 ( 0.9%) 8.6 [1.8 ; 41.1] 0.007 0.63 12/105 (11.4%) 2/210 ( 0.9%) 13.4 [2.9 ; 61.2] 0.001 0.64 13/105 (12.4%) 3/210 ( 1.4%) 9.7 [2.7 ; 35.0] <0.0001 0.65 13/105 (12.4%) 8/210 ( 3.8%) 3.6 [1.4 ; 8.9] 0.006 0.66 15/105 (14.3%) 11/210 ( 5.2%) 3.0 [1.3 ; 6.8] 0.008 0.67 20/105 (19.0%) 12/210 ( 5.7%) 3.9 [1.8 ; 8.3] <0.0001 0.68 22/105 (20.9%) 14/210 ( 6.7%) 3.7 [1.8 ; 7.6] <0.0001 0.69 25/105 (23.8%) 20/210 ( 9.5%) 3.0 [1.6 ; 5.6] 0.001 0.70 29/105 (27.6%) 23/210 (10.9%) 3.1 [1.7 ; 5.7] <0.0001
Figure I-3: TFPI NR 125 in patients and controls
TFPI resistance defined as a TFPI NR 125 lower than 0.65 was not related to more
severe DVT; indeed, 85% of patients with TFPI resistance only suffered a distal venous
thrombosis. Moreover, TFPI resistance was not related to a higher rate of DVT recurrence.
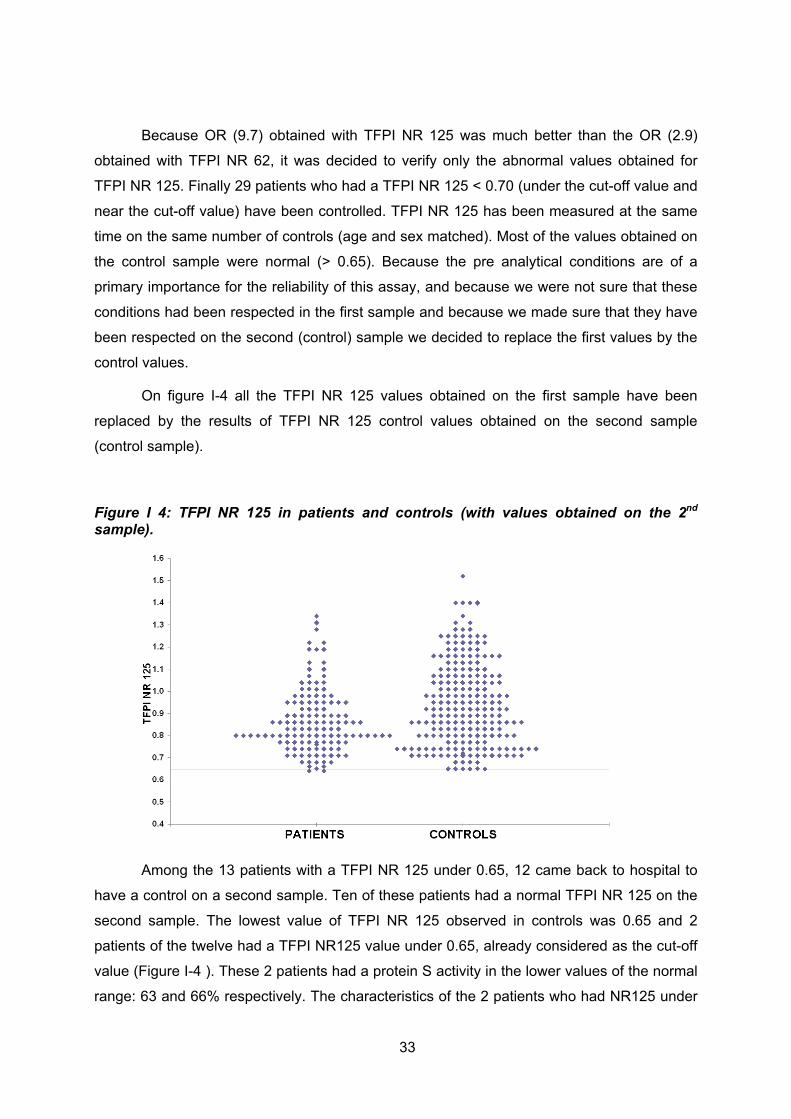
33
Because OR (9.7) obtained with TFPI NR 125 was much better than the OR (2.9)
obtained with TFPI NR 62, it was decided to verify only the abnormal values obtained for
TFPI NR 125. Finally 29 patients who had a TFPI NR 125 < 0.70 (under the cut-off value and
near the cut-off value) have been controlled. TFPI NR 125 has been measured at the same
time on the same number of controls (age and sex matched). Most of the values obtained on
the control sample were normal (> 0.65). Because the pre analytical conditions are of a
primary importance for the reliability of this assay, and because we were not sure that these
conditions had been respected in the first sample and because we made sure that they have
been respected on the second (control) sample we decided to replace the first values by the
control values.
On figure I-4 all the TFPI NR 125 values obtained on the first sample have been
replaced by the results of TFPI NR 125 control values obtained on the second sample
(control sample).
Figure I 4: TFPI NR 125 in patients and controls (with values obtained on the 2nd sample).
Among the 13 patients with a TFPI NR 125 under 0.65, 12 came back to hospital to
have a control on a second sample. Ten of these patients had a normal TFPI NR 125 on the
second sample. The lowest value of TFPI NR 125 observed in controls was 0.65 and 2
patients of the twelve had a TFPI NR125 value under 0.65, already considered as the cut-off
value (Figure I-4 ). These 2 patients had a protein S activity in the lower values of the normal
range: 63 and 66% respectively. The characteristics of the 2 patients who had NR125 under

34
0.65 in the two-step assay are given in Table I-9. Patient 1 presented a distal DVT after a calf
traumatism, associated with a PE. She had a personal history of venous insufficiency and 3
DVT recurrences, one associated with a PE. Her mother presented two PE and her father
presented one PE, both before the age of 60 years. Patient 2 presented a spontaneous distal
DVT. She had a personal history of sarcoidosis (stage I). She had a family history of
thrombosis (SVT during pregnancy for her mother and stroke for her father). None of these
two patients was on DVT prophylactic treatment when thrombosis occurred. It has not been
possible to measure TFPI NR 125 for the relatives of theses 2 patients.
As the results obtained with the 2 step assay were rather disappointing, it was
decided to come back to the one step assay to compare TFPI NR between patients and
controls. TFPI NR 150 was determined on all patients and controls but only on the second
sample for patients who came for control. The cut off value can be considered to be 0.70.
None of the patients had a TFPI NR under this value.
Figure I 5: TFPI NR 150 in patients and controls
35
TFPI activity and free TFPI
The mean of TFPI activity was 101.2% ± 24.1 in patients and 99.0% ± 20.5 in controls.
Three patients and one control have a TFPI activity value under the normal range. The
normal range (58-140 %) (Mean ± 2 SD) had been previously defined in 36 volunteers
(Annexe 3). The clinical characteristics of these 3 patients are given in Table I-9.
The mean of free TFPI level was11.9 ± 3.7 ng.mL-1 in patients and 13.7 ± 4.2 ng.mL-1
in controls (p= 0.07). Women had lower free TFPI levels than men whatever the group: mean
free TFPI for men: 14.4±3.9ng/mL and for women 11.3±3.9ng/mL (p< 0.0001). For control
women, the mean level of free TFPI is 11.5 ng/ mL-1 and the normal range defined as mean
± 2 SD is 4.9-18.1 ng.mL-1. None of the patient women had a free TFPI level outside the
normal range. For control men, the mean level of free TFPI is 15.8 ng/ mL-1 and the normal
range defined as mean ± 2 SD is 7.6-24.0 ng.mL-1. One of men patient had a free TFPI level
(6.2 ng.mL-1) under the normal range (table I-9). The two women with a TFPI NR 125 under
0.64 had protein S values in the lower limit of the normal range. But at the same time three
others women with protein S values betaween 63 and 65 % had normal TFPI NR 125.
Neither low protein S activity values nor low free TFPI levels are associated with a low TFPI
NR (whatever the assay) (table I-9). For two patients we observed at the same time a low
TFPI activity and a low TFPI NR 125.
In table I-9 are listed 9 patients who had one or more abnormal studied parameter
There was no correlation between TFPI activity measured by chromogenic assay and
protein S normal values in the present study (R2 = 0.0004).
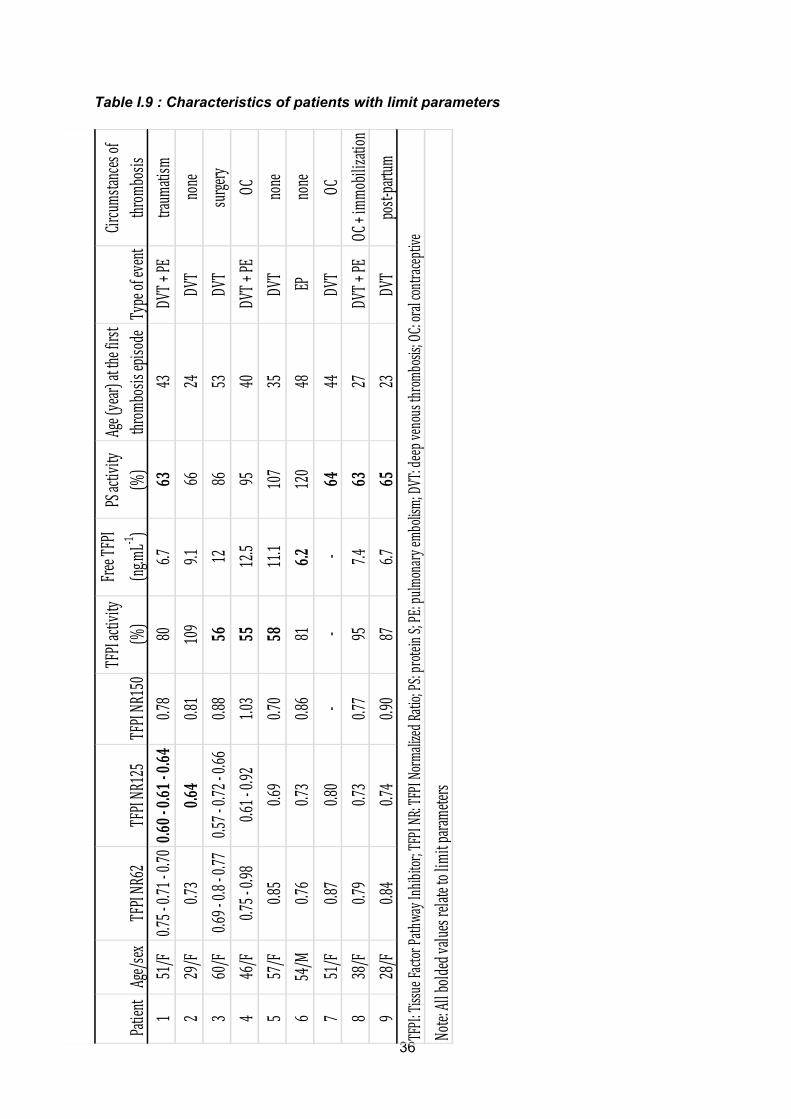
36
Patient
Age/sex
TFPI NR
62TFPI NR
125
TFPI NR
150TFPI activity
(%)
Free TF
PI
(ng.m
L‐1 )PS activity
(%)
Age (year) at the first
throm
bosis episo
deType of event
Circums
tances of
throm
bosis
151/F
0.75 ‐ 0.71 ‐ 0
.700.6
0 0.61 0
.640.7
880
6.763
43DV
T + PE
traum
atism
229/F
0.73
0.64
0.81
109
9.166
24DV
Tnone
360/F
0.69 ‐ 0.8 ‐ 0.77
0.57 ‐ 0.72 ‐ 0
.660.8
856
1286
53DV
Tsurge
ry4
46/F
0.75 ‐ 0.98
0.61 ‐ 0.92
1.03
5512.5
9540
DVT +
PEOC
557/F
0.85
0.69
0.70
5811.1
107
35DV
Tnone
654/M
0.76
0.73
0.86
816.2
120
48EP
none
751/F
0.87
0.80
‐‐
‐64
44DV
TOC
838/F
0.79
0.73
0.77
957.4
6327
DVT +
PEOC + immo
bilization
928/F
0.84
0.74
0.90
876.7
6523
DVT
post‐partum
TFPI: Tissue Fa
ctor P
athway Inhibitor; TFPI N
R: TFPI Norma
lized Ra
tio; PS: prote
in S; PE: pulm
onary e
mbolism
; DVT: deep v
enous throm
bosis; OC: oral contraceptive
Note: All bold
ed value
s relate to lim
it para
meters
Table I.9 : Characteristics of patients with limit parameters

37
Discussion
We had hypothesized that venous thrombosis could be related to a poor response of
tissue factor pathway to the anticoagulant activity of TFPI. In a previous study [Tardy-Poncet
et al 2003], we described a one-step dPT assay assessing the plasma anticoagulant
response to exogenous TFPI, a poor plasmatic response to added TFPI corresponding to a
lower normalized ratio. A significant resistance to the anticoagulant activity of TFPI had been
demonstrated in some patients with a deep venous thrombosis. This assay did not have
enough discriminating power to differentiate clearly the resistant patients from the non-
resistant ones. In the present study, we described a new assay for assessing the plasma
anticoagulant response to exogenous TFPI. This assay was supposed to have an improved
discriminatory potential over the one-step assay to separate patients with a low response to
TFPI from those with a normal response to TFPI. The reagents used in this study for the one-
step and the two-step assay were identical to those applied in the first study, except for the
thromboplastin (Thromborel S® in the first study, Innovin® for the present study). Our results
showed a difference of sensitivity between the one-step and the two-step assays.
With a TFPI concentration of 150 ng.mL-1 in the one-step assay, the lengthening of
dPT was the same as in the two-step assay with a TFPI concentration of 62 ng.mL-1,
indicating that the two-step assay was much more sensitive than the one-step assay.
Contrary to the one-step assay, the two-step assay was sensitive to protein S levels; indeed
low PS levels lead to a lower response to TFPI in the two step assay (Tardy et al 2012).
Women had lower NR125 than men reflecting the fact that they were less sensitive to TFPI
activity. This can be explained by protein S values, slightly lower for women than for men
[Boerger et al 1987]. In our study, all patients had a protein S level in the normal range
(>60% for women and >65% for men). It is noteworthy that the 2 women with TFPI NR125
under 0.65 had protein S in the lower values (63 % and 66 %) of the normal range. But at the
same time 3 three other women had low PS activity (63 % to 65 %) that was not associated
with a low TFPI NR 125. So the low TFPI NR 125 can not be surely related to a lower PS
value.
All patients were investigated after the end of the acute phase of the venous
thromboembolism episode and none presented any malignant or connective disease. They
had FVIII and fibrinogen levels all included in values that did not influence the TFPI
normalized ratio (Tardy-Poncet et al 2003). So two patients were identified with a TFPI NR
125 under 0.65; none of them had been identified neither with the one step TFPI NR 150 nor
with the two steps TFPI NR 62 confirming the fact that TFPI NR 125 had a better sensitivity.
However, as it is so far unknown whether a decreased response to TFPI is due to a
38
genetically altered FVII or FX, it is therefore not possible (whatever the assay used) to
determine an exact cut-off value that would allow the safe discrimination between pathologic
and normal TFPI sensitivity ratios.
However we demonstrated a statistically significant difference in TFPI NR 125
between patients and controls groups. This TFPI resistance appeared to be an overall trend
among patients and might be considered as a marker of thrombosis risk. Indeed, it is
conceivable that, independent of a specific mutation in one of the substrates of TFPI, a
decreased response to TFPI could still be associated with an increased risk of thrombosis,
as has been shown in patients with APC resistance.
Women had lower free TFPI values than men and that could be related to lower
values of protein S as already shown (Dahm et al 2008). Protein S being a cofactor of TFPI,
a decrease in protein S concentration leads to a decrease in TFPI activity measured using a
thrombin generation assay ( Rosing et al 200; Hackeng et al 2009). In our study, this sex-
related difference did not apply to TFPI activity measured by a chromogenic assay. Moreover,
the basal dPT (before adding recombinant human TFPI) in controls were the same as basal
dPT in patients (at the dilution of tissue factor we used) demonstrating that basal dPTwas not
sensitive enough to identify an endogenous TFPI resistance in patients. We identified 3
women who had TFPI activity values at the lower limit of the normal range but normal free
PS values at the same time and inversely 3 patients with free TFPI values at the lower limit
of the normal range with normal TFPI activity values at the same time.
A part of these results have been presented at ISTH congress in Boston in 2009.
In conclusion, no studies have clearly shown the role of TFPI alone in venous
thrombosis. Could TFPI rather be considered as an additional risk factor only .
6) TFPI could rather be considered as an additional risk factor
only .
It has been shown that low levels of TFPI could be a risk factor for thrombosis when
combined with FV Leiden mutation (FVQ506) (Van Dreden et al 1999), (Eitzman et al 2002).
Moreover the combination of low TFPI levels (below 10th percentile) and high FV levels
(above the 75th percentile) increases the risk for VT with OR of 3,9 for free TFPI and 10 for
total TFPI (Dahm et al 2010). It has also been shown that women with low normal levels of
TFPI may be at greater risk of oestrogen induced VTE; that could in particular explain the
enhanced association observed between TFPI and VTE in LETS study that included a large

39
number of women with thrombosis associated with oral oestrogens (26 % of VTE events)
(Dahm et al 2003).
Moreover it has also been shown concerning the thrombosis recurrence that low free
TFPI antigen could be a risk factor for VTE recurrence even higher when associated to factor
V Leiden (Hoke et al 2005). In this study TFPI–free antigen was measured in 611 patients
with a first spontaneous VTE, and who were prospectively followed after withdrawal of
anticoagulation. The relative risk of recurrence increased from 1.0 (95% CI 0.4–2.6) in
patients with TFPI levels ≤ 5th percentile to 2.7 (95% CI 1.0–7.4) in patients with levels ≤ 2nd
percentile as compared with higher levels. At five years, the probability of recurrence was
48.6% (95th CI 19.0–78.1) among patients with TFPI ≤ 2nd percentile and 16.8% (95th CI
13.8–19.8) among those with higher levels (p=0.04). Compared to patients with wild type
factor V and high TFPI, the RR of recurrence was 1.1 (95% CI 0.7–1.7) in patients with factor
V Leiden and high TFPI, 2.3 (95% CI 0.6–9.5) in patients with wild type factor V and low
TFPI and 3.5 (95% CI 0.9–14.3) in patients with factor V Leiden and low TFPI.
A more recent study showed that TFPI antigen levels did not differ between patients
with and without recurrence of DVT (Winckers et al 2012).
In this observational study including 74 patients with a first episode of unprovoked
DVT, they also evaluated the TF-regulatory activity of TFPI using a TG-based TFPI activity
assay with respect to the development of recurrent venous thromboembolism. The overall
activity of the TFPI/ protein S system was determined by the ratio of TG peak heights
obtained in the absence and presence of anti-TFPI antibodies. The activity of the
TFPI/protein S pathway was impaired in patients with VTE recurrence, as was indicated by
increased TFPI ratios in patients with VTE recurrence compared with recurrence-free
patients). They demonstrated that an impaired TFPI activity (indicated by a TFPI ratio above
the 80th percentile) was associated with a 10-fold increased risk in VTE recurrence, although
the 95% confidence interval was wide due to the relatively small sample size (95%CI 2.6 -
44.3). This impaired TFPI activity observed in patients with VTE recurrence was independent
of TFPI and protein S antigen levels, as they were similar in patients with and without VTE
recurrence. This increased potential of plasma to generate thrombin was reflected in the TG
assay as an intermediate phenotype; that could let to propose the TG based TFPI activity as
a sensitive test for the prediction of VTE.
.
40
REFERENCES
Ameziane N, Seguin C, Borgel D, Fumeron F, Moatti D, Alhenc-Gelas M, Grandchamp B, Aiach M, Emmerich J, de Prost D The –33T-->C polymorphism in intron 7 of the TFPI gene influences the risk of venous thromboembolism, independently of the factor V Leiden and prothrombin mutations. Thromb Haemost 2002; 88: 195–199.
Amini-Nekoo A, Futers TS, Moia M, Mannucci PM, Grant PJ, Ariëns PA. Analysis of the tissue factor pathway inhibitor gene and antigen levels in relation to venous thrombosis. Br J Haematol 2001; 113: 537-543. Ariëns RA, Alberio G, Moia M, Mannucci PM; Low Levels of Heparin-releasable Tissue Factor Pathway Inhibitor in Young Patients with Thrombosis. Thromb Haemost 1999; 81: 203-207. Arnaud E, Moatti D, Emmerich J, Aiach M, de Prost D. No link between the TFPI V264M mutation and venous thromboembolic disease. Thromb Haemost 1999; 82: 159-160 Baugh RJ, Broze GJ, Krishnaswamy S. Regulation of extrinsic pathway factor Xa formation by tissue factor pathway inhibitor. J Biol Chem 1998; 273: 4378–86. Boerger LM, Morris PC, Thurnau GR, Esmon CT, Comp PC. Oral contraceptives and gender affect protein S status. Blood 1987; 69: 692-694 Bombeli T, Piccapietra B, Boersma J, Fehr J. Decreased anticiagulant response to tissue factor pathway inhibitor in patients with venous thromboembolism and otherwise no evidence of hereditary or acquired thrombophilia. Thromb Haemost 2004; 91: 80-6. Broze GJ. Tissue factor pathway inhibitor gene disruption . Blood Coagul. Fibrinolysis 1998; 9 Suppl 1: S89-92. Broze GJ,Warren LA, NovotnyWF, Higuchi DA, Girard JJ, Miletich JP. The lipoprotein-associated coagulation inhibitor that inhibits factor Xa: insight into its possible mechanism of action. Blood 1988; 71: 335–43. Caplice NM, Panetta C, Peterson TE, Kleppe LS, Mueske CS, Kostner GM, Broze GJ, Simari RD. Lipoprotein (a) binds and inactivates tissue factor pathway inhibitor. a novel link between lipoproteins and thrombosis. Blood 2001; 98: 980–987. Chang YJ, Hamaguchi N, Chang SC, Ruf W, Lin SW. Engineered recombinant factor VII, Q217 variants with altered inhibitor specificities. Biochemistry 1999; 38: 10940–8.

41
Dahm A, Van Hylckama Vlieg A, Bendz B, Rosendaal F, Bertina RM, Sandset PM. Low levels of tissue factor pathway inhibitor (TFPI) increase the risk of venous thrombosis. Blood 2003;101: 4387-4392 Dahm A, Rosendaal FR, Andersen TO, Sandset PM. Tissue factor pathway inhibitor anticoagulant activity: risk for venous thrombosis and effect of hormonal state. Br J Haematol 2006; 132: 333-338. Dahm AEA, Sandset PM, Rosendaal FR. The association between protein S levels and anticoagulant activity of tissue factor pathway inhibitor type 1. J Thromb Haemost 2008; 6: 393-395. Dahlback B. Physiological anticoagulation.Resistance to activated protein C and venous thromboembolism. J Clin Invest 1994; 94:923–927. Duering C, Kosch A, Langer C, Thedieck S, Nowak-Göttl U. Total tissue factor pathway inhibitor is an independent risk factor for symptomatic paediatric venous thromboembolism and stroke; Thromb Haemost 2004; 92: 707-712 Eitzman DT, Westrick RJ, Bi X, Manning SL, Wilkinson JE, Broze GJ, Ginsburg D. Lethal perinatal thrombosis in mice resulting from the interaction of tissue factor pathway inhibitor deficiency and factor V Leiden. Circulation 2002;105: 2139–2142 Evans GD, Langdown J, Brown K, Baglin TP. The C536T transition in the tissue factor pathway inhibitor gene is not a common cause of venous thromboembolic disease in the UK population Thromb Haemost 2000; 83: 511 Ezzat WH, Dahl JP, Luginbuhl A, Gordin E, Krein H, Heffelfinger RN. Recombinant human tissue factor pathway inhibitor prevents thrombosis in a venous tuck model. Laryngoscope 2010; 120: 2172-2176 Girard TJ, Warren LA, Novotny WF, Likert KM, Brown SG, Miletich JP, Broze GJ. Functional significance of the Kunitz-type inhibitory domains of lipoprotein-associated coagulation inhibitor. Nature 1989; 338: 518–20 Girard TJ, MacPhail LA, Likert KM, Novotny WF, Miletich JP, Broze GJ. Inhibition of factor VIIa-tissue factor coagulation activity by a hybrid protein. Science 1990; 248: 1421–4 Golino P , Ragni M, Cimmino G, Forte L. Role of tissue factor pathway inhibitor in the regulation of tissue factor-dependent blood coagulation.

42
Cardiovasc Drug Rev 2002; 20: 67-80 Gomez K, McVey JH, Tuddenham E. Inhibition of coagulation by macromolecular complexes. Haematologica 2005; 90: 1570-1576 González-Conejero R, Lozano ML, Corral J, Martínez C, Vicente V. The TFPI 536C-->T mutation is not associated with increased risk for venous or arterial thrombosis. Thromb Haemost 2000; 83: 787-788 Hackeng TM, Maurissen LFA, Castoldi E, Rosing J. Regulation of TFPI function by protein S. J Thromb Haemost 2009; 7: 165-168. Hoke M, Kyrle PA, Minar E, Bialonzcyk C, Hirschl M, Schneider B, Kollars M, Weltermann A, Eichinger S. Tissue factor pathway inhibitor and the risk of recurrent venous thromboembolism. Thromb Haemost 2005; 94: 787-790 Holst J, Lindblad B, Bergqvist D, Nordfang O, Ostergaard PB, Petersen JL, Nielsen G, Hedner U. Antithrombotic effect of recombinant truncated tissue factor pathway inhibitor (TFPI-161) in experimental venous thrombosis: a comparison with low molecular weight heparin. Thromb Haemost 1994; 71: 214-219. Huang ZF, Higuchi D, Lasky N, Broze GJ. Tissue factor pathway inhibitor gene disruption produces intrauterine lethality in mice. Blood 1997; 90: 944-951 Ishikawa J, Okada H, Kato H, Takeshita S, Honda S, Kawasaki T, Suehisa E, Tsuji H, Madoiwa S, Sakata Y, Kojima T, Murata M, Ikeda Y, Kokubo Y, Okamura T, Tomoike H, Miyata T. Association of Asn221Ser mutation in tissue factor pathway inhibitor-beta with plasma total tissue factor pathway inhibitor level. Blood Coagul Fibrinolysis 2009; 20 (1): 22-26. Junker R, Glahn J, Tidow N, Brinkmann T, Nabavi DG. The tissue factor pathway inhibitor C536T mutation is not associated with the risk of stroke in young adults. Thromb Haemost 2002; 87: 920-921. Kleesiek K, Schmidt M, Götting C, Schwenz B, Lange S, Müller-Berghaus G, Brinkmann T, et Prohaska W. The 536C-->T transition in the human tissue factor pathway inhibitor (TFPI) gene is statistically associated with a higher risk for venous thrombosis. Thromb Haemost 1999; 82: 1-5 Lakhiaev A, Ruf W, Mohan Rao LV. The role of catalytic cleft and exosite residues of factor VIIa for complex formation with tissue factor pathway inhibitor. Thromb Haemost 2001; 85: 458–63. Lindahl AK, Jacobsen PB, Sandset PM, Abildgaard U. Tissue factor pathway inhibitor with high anticoagulant activity is increased in post

43
heparin plasma and in plasma from cancer patients. Blood Coagul Fibrinolysis 1991; 2: 713–21. Lwaleed BA, Bass PS. Tissue factor pathway inhibitor: structure, biology and involvement in disease. J Pathol 2006; 3: 327-339 Miyata T, Sakata T, Kumeda K, Uchida K, Tsushima M, Fujimura H, Kawasaki T, Kato H. C-399T polymorphism in the promoter region of human tissue factor pathway inhibitor (TFPI) gene does not change the plasma TFPI antigen level and does not cause venous thrombosis. Thromb Haemost 1998; 80: 345-346, Monroe DM, Key NS. The tissue factor-factor VIIa complex: procoagulant activity, regulation, and multitasking. J Thromb Haemost 2007; 5: 1097-1105 Morange PE, Renucci JF, Charles MA, Aillaud MF, Giraud F, Grimaux M, Juhan-Vague I. Plasma levels of free and total TFPI, relationship with cardiovascular risk factors and endothelial cell markers. Thromb Haemost 2001; 85: 999-1003 Neuenschwander PF, Morrissey JH. Alteration of the substrate and inhibitor specificities of blood coagulation factor VIIa: importance of amino acid residue K 192. Biochemistry 1995; 34: 8701–7. Opstad TB, Eilertsen AL, Hoibraaten E, Skretting G, Sandset PM Tissue factor pathway inhibitor polymorphisms in women with and without a history of venous thrombosis and the effects of postmenopausal hormone therapy. Blood Coagul Fibrinolysis 2010; 21: 516-52 Paciaroni K, Rossi E, Bazzan M, Ireland H, De Stefano V. Prevalence of the C536T mutation in the tissue factor pathway inhibitor (TFPI) gene among patients with venous thromboembolic disease. Thromb Haemost 2001; 85: 938-939. Rapaport, S I, et L V Rao The tissue factor pathway: how it has become a “prima ballerina” Thrombosis and haemostasis 74, no. 1 (juillet 1995): 7-17 Rosing J, Maurissen LFA, Tchaikovski SN, Tans G, Hackeng TM. Protein S is a cofactor for tissue factor pathway inhibitor. Thromb Res 2008; 122 Suppl 1: S60-63 Sandset P, Abildgaard U, Larsen M. Heparin induces release of extrinsic coagulation pathway inhibitor (EPI). Thromb Res 1988; 50: 803–13. Sandset PM, Warn-Cramer BJ, Rao LV, Maki SL, Rapaport SI. Depletion of extrinsic pathway inhibitor (EPI) sensitizes rabbits to disseminated intravascular coagulation induced with tissue factor: evidence supporting a physiologic role for EPI as a natural anticoagulant. Proc Natl Acad Sci U S A.1991;88:708-712.

44
Segers O, van Oerle R, ten Cate H, Rosing J, Castoldi E. Thrombin generation as an intermediate phenotype for venous thrombosis. Thromb Haemost 2010; 103: 114-22. Skretting G, Stavik B, Landvik NE, Myklebust CF, Iversen N, Zienolddiny S, Sandset PM. Functional characterization of polymorphisms in the human TFPI gene. Biochem Biophys Res Commun 2010 397: 106-111. Tardy-Poncet B, Tardy B, Mismetti P, Laporte-Simitsidis S, Guyotat D, Decousus H. Heparin releasable tissue factor pathway inhibitor in young patients with venous thrombosis. Thromb Haemost 1999; 82: 2372 [abstr]. Tardy-Poncet B, Tardy B, Laporte S, Mismetti P, Amiral J, Piot M, Reynaud J, Campos L, . Decousus H Poor anticoagulant response to tissue factor pathway inhibitor in patients with venous thrombosis. J Thromb Haemost 2003; 1: 507-510 Van Den Boogaard FE, Brands X, Schultz MJ, Levi M, Roelofs JTH, Van’t Veer C, Van Der Poll T. Recombinant human tissue factor pathway inhibitor exerts anticoagulant, anti-inflammatory and antimicrobial effects in murine pneumococcal pneumonia. J Thromb Haemost 2011; 9:122-132 Van Dreden P, Grosley M, Cost H. Total and free levels of tissue factor pathway inhibitor: a risk factor in patients with factor V Leiden? Blood Coagul Fibrinolys 1999; 10: 115–116. Warn-Cramer BJ, Rao LVM, Maki SL, Rapaport S. Modifications of extrinsic pathway inhibitor (EPI) and factor Xa that affect their ability to interact and to inhibit factor VIIa/ tissue factor: evidence for a two-step model of inhibition. Thromb Haemost 1988; 60: 453–6 Winckers K, Ten Cate-Hoek AJ, Beekers KCMM, Erkens P, Hamulyák K, Ten Cate H, Hackeng TM. Impaired tissue factor pathway inhibitor function is associated with recurrent venous thromboembolism in patients with first unprovoked deep venous thrombosis. J Thromb Haemost 2012; 10 : 2208-11 Zakai NA, Lutsey PL, Folsom AR, Heckbert SR, Cushman M. Total tissue factor pathway inhibitor and venous thrombosis. Thromb Haemost 2010; 104: 207-212
45
II) Inherited or acquired Protein S deficiency and TFPI resistance
Protein S (PS) is an essential component of the protein C pathway that
downregulates thrombin formation by inactivating coagulation factors Va and VIIIa (Esmon et
al 1989). It has recently been shown that PS also acts as a TFPI cofactor, in the context of
weak pro-coagulant stimuli, by enhancing the interaction of TFPI with FXa in the presence of
Ca2+ and phospholipids (Hackeng et al 2006) without increasing inhibition of FVIIa-TF by
TFPI [Ndonwi et al 2008].
Functional PS deficiency can explain a poor response to activated Protein C (aPC)
(Dalhlback et al 1993).
The objective of our study was to ascertain whether PS deficiency might be
responsible for a poor response to the anticoagulant activity of TFPI.
Plasma sensitivity to TFPI was explored using a slightly modified version of the two-
step diluted prothrombin time (dPT) assay already described (Tardy-Poncet et al 2003).
1) Patients, Materials and Methods
Patients
Thirty-one patients from 18 families with inherited PS deficiency were included in the
study. All these patients had been examined in the Haemostasis units of St Etienne and
Marseille University Hospitals because of a personal and/or family history of thrombosis.
None of the patients was taking an oral anticoagulant. TFPI resistance was explored on
residual plasma from samples taken at the time of diagnosis of PS deficiency. Patients were
matched for sex and age with controls enrolled in a previous study which had defined the
normal values of the plasma anticoagulant response to TFPI. This previous study was
approved by the Ethics Committee of the St Etienne University Hospital prior to initiation and
informed consent was obtained from all controls.
Seven pregnant women were also included in the study. They had personal and/or
family history of thrombosis and had undergone a biological exploration of coagulation
inhibitors during pregnancy and 3 months after delivery. In these pregnant women, most PS
activity values corresponded to those generally observed. Free PS was measured (and was
27%) in only one patient who had a very low PS activity (18%). After delivery, two patients
had PS activity values near the lower limit of the normal range and free PS was measured in
both. None of the pregnant women was on anticoagulant treatment. The residual plasma
frozen at the time of their routine explorations was tested in this study. Patients (including

46
pregnant women) were informed that the residual plasma from their blood samples taken for
diagnosis of PS deficiency could be used to investigate other thrombosis parameters.
Materials and Methods
Blood samples were collected in tubes containing 0.129 mol L-1 trisodium citrate.
After a double centrifugation (15 min at 2500 g) platelet-poor plasma (PPP) was stored at –
70°C until analysis. Free and total PS, as well as PS activity, had been previously measured
in the patients included because of their personal and/or family history of thrombosis. Free
PS, total PS and PS activity levels were determined on a routine exploration basis using
commercial assays (Asserachrom® Free Protein S, Liatest® Total Protein S, and STA
Staclot® Protein S; Diagnostica Stago, Asnières, France) according to the manufacturer’s
recommendations. Protein S deficient plasma was purchased from Diagnostica Stago.
Normal values of free and total PS had been previously defined on the basis of data from 30
male and 30 female healthy volunteers (lower limit 60% for free and total PS and PS activity
in women; 70% for free and total PS and 65 % for PS activity in men). PS deficiency was
established on the basis of free PS levels, the type of deficiency (I or III) being defined
according to the total PS level.
TFPI resistance assays were performed on residual plasma frozen at the time of
diagnosis of PS deficiency. To explore the tissue factor pathway, we used a diluted
prothrombin time assay (dPT) (Dahm et al 2004). Recombinant Tissue Factor (Dade®
Innovin®;Behring) was diluted (1/450) in Tris (50 mM), NaCl (100 mM) buffer, pH 7.5 in order
to obtain a dPT of 58 sec (range: 54-63 sec). Full-length recombinant human TFPI (American
Diagnostica) was mixed in a CaCl2 50 mM - BSA 10 g.L-1 buffer to a final concentration of
125 ng.mL-1. This represents more than 10 times the physiological basal concentration of full-
length TFPI and corresponds to the concentration obtained after a bolus dose of
unfractionated heparin (Hansen et al 1998). All assays were performed in duplicate on an
automated coagulation analyser (BCS®, Siemens, St Denis, France). Pooled normal plasma
from 30 blood donors was used as the reference plasma. The plasma anticoagulant
response to added TFPI was measured using a two-step dPT assay. After a 60-second
incubation of the plasma with tissue factor at 37°C, coagulation was initiated by adding the
CaCl2 BSA buffer, with or without TFPI. Initial dPT and dPT + TFPI were recorded on the
BCS® analyser for patient, control and reference plasmas. The response to TFPI
anticoagulant activity was defined as the TFPI normalised ratio (TFPI NR) =
[(dPT+TFPI)/(dPT)] patient or control plasma / [(dPT+TFPI)/(dPT)] reference plasma. The
TFPI NR cut-off value (0.65) had been previously defined on 210 controls with no personal or
family history of thrombosis, and taking no oral contraceptive in the case of women. PS-

47
deficient plasma was mixed with a pooled normal plasma in different ratios in order to obtain
a range of plasma concentrations of PS. A dose response-curve was established by adding
TFPI (125 ng.mL-1) to these different mixtures.
Statistical analysis
Quantitative data are reported as median values with the first quartile (Q1) and third
quartile (Q3). To compare the parameters studied in patients and controls, as well as in
patients with and without thrombosis, we used the non-parametric rank test in view of the
small number of patients and the fact that the distribution was not normal. Correlation
coefficients were calculated by the least squares method. To compare the parameters
studied during pregnancy and 3 months after delivery, we used the non-parametric sign test
for matched data. A p-value of 0.05 or less was considered to denote a significant difference
between groups. Data were processed and analysed using SAS-WINDOWSTM software
(version 9.2).
2) Results
In all, 22 patients presented type I inherited PS deficiency (i.e. deficiencies in both
total PS and free PS). Nine patients had type III inherited PS deficiency (i.e. normal total PS
with free PS deficiency). No patient had a type II PS deficiency. One patient had a severe PS
deficiency (7% free PS). Molecular analyses were not systematically performed. A molecular
abnormality was identified for only eight families. The mean fibrinogen level was 3.0 g.L-1.
Two patients had a fibrinogen level higher than 4.0 g.L-1 (4.2 g.L-1 and 5.2 g.L-1,
respectively.) Only one asymptomatic patient was taking an oral contraceptive at the time of
blood collection; this patient, with a Herleen mutation, had lower PS levels than those
generally observed in patients with this mutation. Among these 31 PS-deficient patients, 9
patients developed venous thrombosis at a median age of 30 years (range: 19 to 69). Two of
the patients who developed venous thrombosis also had a heterozygous prothrombin gene
G20210A polymorphism. One patient presented portal vein thrombosis. Two patients
suffered arterial thrombosis at a median age of 48 years (range: 46 to 50). One of these
patients, presenting a Heerlen PS polymorphism, experienced a myocardial infarction when
he was 50 years old and once again a few years later. Coronary angiography showed normal
coronary arteries.The results obtained for patients with inherited PS deficiency and for
controls are presented in Table II.1.
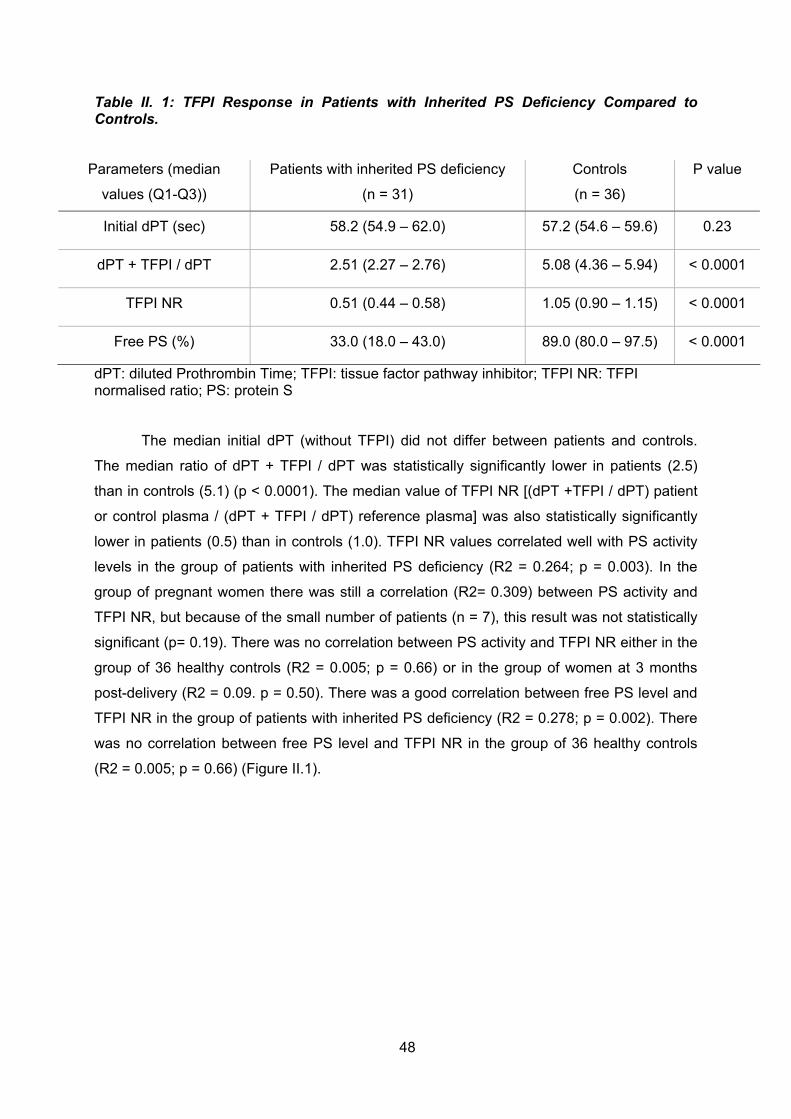
48
Table II. 1: TFPI Response in Patients with Inherited PS Deficiency Compared to Controls.
Parameters (median
values (Q1-Q3))
Patients with inherited PS deficiency
(n = 31)
Controls
(n = 36)
P value
Initial dPT (sec) 58.2 (54.9 – 62.0) 57.2 (54.6 – 59.6) 0.23
dPT + TFPI / dPT 2.51 (2.27 – 2.76) 5.08 (4.36 – 5.94) < 0.0001
TFPI NR 0.51 (0.44 – 0.58) 1.05 (0.90 – 1.15) < 0.0001
Free PS (%) 33.0 (18.0 – 43.0) 89.0 (80.0 – 97.5) < 0.0001
dPT: diluted Prothrombin Time; TFPI: tissue factor pathway inhibitor; TFPI NR: TFPI normalised ratio; PS: protein S
The median initial dPT (without TFPI) did not differ between patients and controls.
The median ratio of dPT + TFPI / dPT was statistically significantly lower in patients (2.5)
than in controls (5.1) (p < 0.0001). The median value of TFPI NR [(dPT +TFPI / dPT) patient
or control plasma / (dPT + TFPI / dPT) reference plasma] was also statistically significantly
lower in patients (0.5) than in controls (1.0). TFPI NR values correlated well with PS activity
levels in the group of patients with inherited PS deficiency (R2 = 0.264; p = 0.003). In the
group of pregnant women there was still a correlation (R2= 0.309) between PS activity and
TFPI NR, but because of the small number of patients (n = 7), this result was not statistically
significant (p= 0.19). There was no correlation between PS activity and TFPI NR either in the
group of 36 healthy controls (R2 = 0.005; p = 0.66) or in the group of women at 3 months
post-delivery (R2 = 0.09. p = 0.50). There was a good correlation between free PS level and
TFPI NR in the group of patients with inherited PS deficiency (R2 = 0.278; p = 0.002). There
was no correlation between free PS level and TFPI NR in the group of 36 healthy controls
(R2 = 0.005; p = 0.66) (Figure II.1).

49
Figure II.1: Relationship between PS activity and Tissue Factor Pathway Inhibitor Normalised Ratio (TFPI NR).
Points represent 31 patients with inherited PS deficiency (crosses) R2: 0.264; p = 0.003, 36 healthy controls (same age and sex, open circles) R2: 0.005; p = 0.66, and 7 women during pregnancy (closed triangles) R2: 0.309; p = 0.19 and 3 months after delivery (open triangles) R2:0.09; p = 0.05
We showed in vitro the PS-dependent effect in this TFPI resistance assay (Figure
II.2). In the absence of PS, there is still a plasma response to TFPI even though this is very
low (dPT + TFPI / dPT = 1.9) compared to the response obtained with a concentration of
60% PS (dPT + TFPI / dPT = 4.9). TFPI response is closely related to PS levels up to a
concentration of 60 %, when a plateau is reached.
Figure II.2: Response of pooled normal plasma to 125 ng.mL-1 of TFPI in presence of different concentrations of protein S (PS).
The response is expressed as the ratio of diluted prothrombin time (dPT) with TFPI upon basal dPT. PS-deficient plasma was mixed with pooled normal plasma in different ratios in order to obtain a range of plasma concentrations of PS. A dose response-curve was established by adding TFPI (125 ng.mL-1) to these different mixtures and drawn by using a polynomial regression curve.

50
All patients had a TFPI NR below the cut-off value (0.65). In other words, all patients
with inherited PS deficiency showed a decreased response to the anticoagulant activity of
TFPI. It is interesting to note that even the three patients with a Heerlen PS polymorphism
showed a decreased response to the anticoagulant activity of TFPI. The median TFPI NR
was lower in patients with type I inherited PS deficiency (TFPI NR: 0.47) than in patients with
type III inherited PS deficiency (NR: 0.58) (p=0.018). However, at the same time, free PS
levels were lower in patients with type I inherited PS deficiency (median free PS: 26 %) than
in patients with type III inherited PS deficiency (median free PS: 47%) (p=0.022). No
difference was detected between patients with and without thrombosis in terms of median
values of free PS and PS activity, median ratio of dPT + TFPI/dPT or median TFPI NR. PS
activity values and sensitivity of the plasma to TFPI were statistically significantly different
during pregnancy and at three months after delivery (Table II.2). PS activity levels were
decreased during pregnancy (ranging from 18 to 52%) with a TFPI NR under the cutoff value
(TFPI NR: 0.39 to 0.59). In contrast, at three months after delivery, all PS activity values
could be considered normal, excluding a hereditary PS deficiency, for all the women tested.
TFPI NR similarly returned to higher values after delivery, with the normalisation of PS levels,
although TFPI NR remained under the cut-off value in three patients. Two of these patients,
who had only a family history of thrombosis, presented a TFPI NR of 0.62 with PS activity
values in the lower part of the normal range (61% and 64%, respectively) corresponding to
free PS values of 57% and 68% respectively. The third patient had a family history of
thrombosis and had also suffered a late foetal loss in the past. Her PS activity value after
delivery was normal (94%), whereas her TFPI NR remained low (0.58).
Table II.2: PS Activity Values and TFPI Response during Pregnancy and 3 Months after Delivery
Parameters
median (Q1-Q3))
During pregnancy
(n=7)
3 Months after Delivery.
(n=7)
P value
Initial dPT (sec) 59.4 (56.7 – 62.8) 63.1 (56.3 – 63.9) 0.45
dPT + TFPI / dPT 2.28 (2.21 – 2.57) 3.41 (2.80 – 3.57) 0.016
TFPI NR 0.54 (0.44 – 0.56) 0.71 (0.62 – 0.86) 0.016
PS activity (%) 38.0 (36.0 – 48.0) 87.0 (64.0 – 98.0) 0.016
dPT: diluted Prothrombin Time; TFPI: tissue factor pathway inhibitor; TFPI NR: TFPI
normalised ratio; PS: protein S
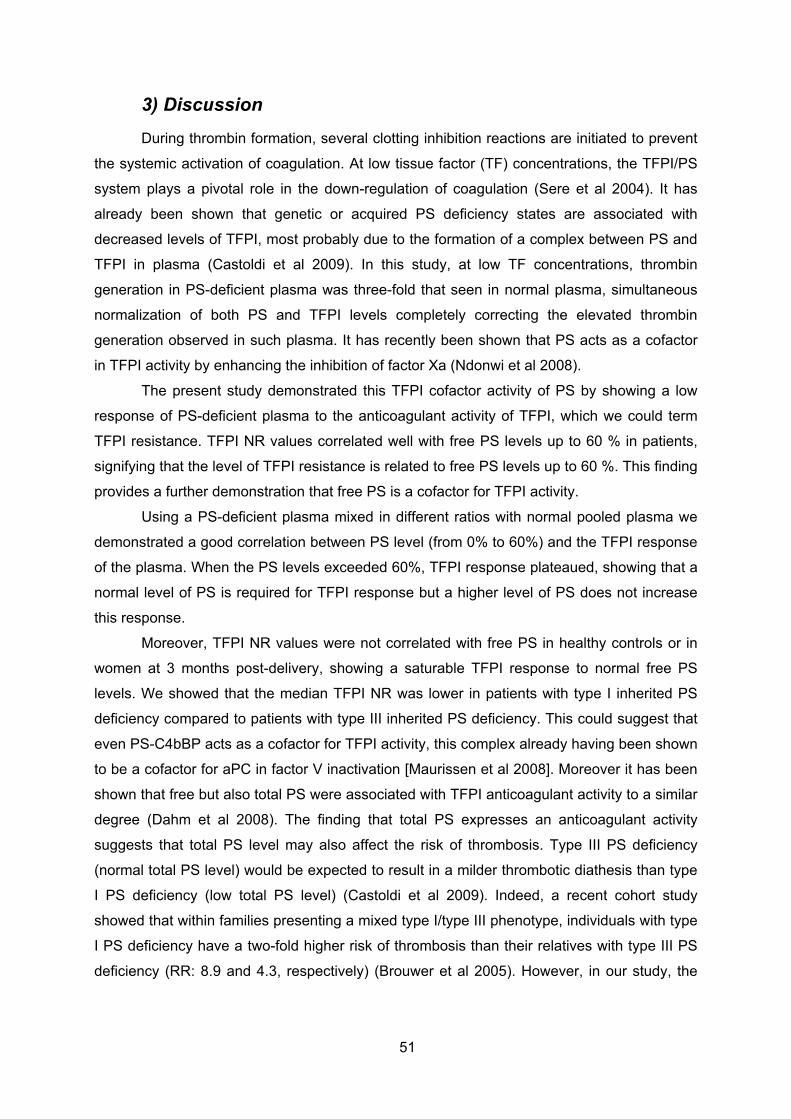
51
3) Discussion
During thrombin formation, several clotting inhibition reactions are initiated to prevent
the systemic activation of coagulation. At low tissue factor (TF) concentrations, the TFPI/PS
system plays a pivotal role in the down-regulation of coagulation (Sere et al 2004). It has
already been shown that genetic or acquired PS deficiency states are associated with
decreased levels of TFPI, most probably due to the formation of a complex between PS and
TFPI in plasma (Castoldi et al 2009). In this study, at low TF concentrations, thrombin
generation in PS-deficient plasma was three-fold that seen in normal plasma, simultaneous
normalization of both PS and TFPI levels completely correcting the elevated thrombin
generation observed in such plasma. It has recently been shown that PS acts as a cofactor
in TFPI activity by enhancing the inhibition of factor Xa (Ndonwi et al 2008).
The present study demonstrated this TFPI cofactor activity of PS by showing a low
response of PS-deficient plasma to the anticoagulant activity of TFPI, which we could term
TFPI resistance. TFPI NR values correlated well with free PS levels up to 60 % in patients,
signifying that the level of TFPI resistance is related to free PS levels up to 60 %. This finding
provides a further demonstration that free PS is a cofactor for TFPI activity.
Using a PS-deficient plasma mixed in different ratios with normal pooled plasma we
demonstrated a good correlation between PS level (from 0% to 60%) and the TFPI response
of the plasma. When the PS levels exceeded 60%, TFPI response plateaued, showing that a
normal level of PS is required for TFPI response but a higher level of PS does not increase
this response.
Moreover, TFPI NR values were not correlated with free PS in healthy controls or in
women at 3 months post-delivery, showing a saturable TFPI response to normal free PS
levels. We showed that the median TFPI NR was lower in patients with type I inherited PS
deficiency compared to patients with type III inherited PS deficiency. This could suggest that
even PS-C4bBP acts as a cofactor for TFPI activity, this complex already having been shown
to be a cofactor for aPC in factor V inactivation [Maurissen et al 2008]. Moreover it has been
shown that free but also total PS were associated with TFPI anticoagulant activity to a similar
degree (Dahm et al 2008). The finding that total PS expresses an anticoagulant activity
suggests that total PS level may also affect the risk of thrombosis. Type III PS deficiency
(normal total PS level) would be expected to result in a milder thrombotic diathesis than type
I PS deficiency (low total PS level) (Castoldi et al 2009). Indeed, a recent cohort study
showed that within families presenting a mixed type I/type III phenotype, individuals with type
I PS deficiency have a two-fold higher risk of thrombosis than their relatives with type III PS
deficiency (RR: 8.9 and 4.3, respectively) (Brouwer et al 2005). However, in our study, the

52
lower TFPI NR observed in type I PS deficiency could be related to the lower levels of free
PS observed at the same time.
A role of total PS in TFPI activity is supported by the case of the patient in our study
who presented a very low free PS level (7%) with only a slight decrease in total PS (42%),
resulting in a mild (rather than severe) TFPI resistance (TFPI NR=0.37). Basal dPT values
are an accurate indicator of TF-VIIa and Xa activities and also of endogenous TFPI activity.
However, as basal dPT values did not differ between patients and controls, it seems that a
basal dPT assay (at least using a TF dilution of 1/450) is not sensitive enough to detect a
decrease in endogenous TFPI activity caused by PS deficiency. The same result is obtained
for aPC resistance that can not be demonstrated on basal aPTT but that needs the addition
of aPC. It has been shown that PS Heerlen binds normally to the C4bBP and retains full aPC
cofactor activity (Bertina et al 1990). Our study indicates that PS Heerlen leads to a low
response of plasma to the anticoagulant effect of TFPI and it is interesting to note that one of
the four patients who presented this polymorphism experienced myocardial infarction on two
occasions despite having normal coronary arteries.
Our study included a high proportion of patients with thrombosis, as might be
expected on the basis of previous family studies on selected individuals [Simmonds et al
1998]. The median value of TFPI NR did not differ between patients with and without
thrombosis, suggesting that assay of TFPI NR based on dPT is not sensitive enough to
distinguish between these two groups of patients. A study that used an aPTT-based method
to evaluate aPC resistance similarly failed to show a difference in aPC ratios between
patients with and without thrombosis. In contrast, studies that used Calibrated Automated
Thrombography (CAT) to determine sensitivity to aPC showed that normalised aPC
sensitivity ratios differed between patients with and without thrombosis (Tans et al 2003;
Bergrem et al 2011). Moreover, the endogenous thrombin potential (ETP)-based test has
been shown to be greatly influenced by free TFPI and free PS levels [De Visser et al 2005].
An ETP-based assay could have a better sensitivity with regard to showing a difference in
TFPI NR between patients with and without thrombosis.
The pregnant women included in our study had low TFPI NR values due to the low
PS levels associated with pregnancy. This means that TFPI resistance also exists in patients
with an acquired PS deficiency. After delivery, a complete correction of TFPI NR was
achieved when PS values were high, whereas TFPI NR remained slightly below the cut-off
value (0.62) when PS values were lower (61% and 64%). This TFPI resistance can be
reversed after PS normalisation, again demonstrating the cofactor role of PS in TFPI activity.
In one woman, TFPI resistance persisted after delivery, in spite of PS normalisation. This
patient, with a family history of thrombosis and a past experience of late foetal loss, might
have had an inherited TFPI resistance, possibly related to factor X or factor VII mutations.

53
Such inherited TFPI resistance has already been described in patients with a personal
history of unexplained thrombosis (Tardy-Poncet et al 2003).
In conclusion, we showed in this study that PS deficiency leads to a poor
anticoagulant response to TFPI, with a definite effect of free PS (the role of total PS
remaining to be demonstrated). However, the dPT-based assay employed was not sensitive
enough to distinguish patients with and without thrombosis. An ETP-based assay of TFPI NR
might have proved more sensitive in terms of differentiating these two groups of patients.
This work has been accepted for publication in Thrombosis Research

54
4) References
Bergrem A, Dahm AEA, Jacobsen AF, Mowinckel MC, Sandvik L, Sandset PM. Resistance to activated protein C is a risk factor for pregnancy-related thrombosis in the absence of the F5 rs6025 (factor V Leiden) polymorphism. Br J Haematol 2011; 154:241-47 Bertina RM, Ploos van Amstel HK, Van Wijngaarden A, Coenen J, Leemhuis MP, Deutz-Terlouw PP, Van der Linden IK, Reitsma PH. Heerlen polymorphism of protein S, an immunologic polymorphism due to dimorphism of residue 460. Blood 1990;76:538-48 Brouwer JL, Veeger NJ, van der Schaaf W, Kluin-Nelemans HC, van der Meer J; Difference in absolute risk of venous and arterial thrombosis between familial protein S deficiency type I and type III. Results from a family cohort study to assess the clinical impact of a laboratory test-based classification. Br J Haematol 2005;128:703-10. Castoldi E, Simioni P, Tormene D, Rosing J, Hackeng M. Hereditary and acquired protein S deficiencies are associated with low TFPI levels in plasma. J Thromb Haemost 2009;8:294-300 Dahlback B, Carlsson M, Svensson PJ. Familial thrombophilia due to a previous unrecognized mechanism characterized by poor anticoagulant response to activated protein C. Prediction of a cofactor to activated protein C. Proc Natl Acad Sci USA. 1993;90:1004-8. Dahm AEA, Andersen TO, Rosendaal F, Sandset PM. A novel anticoagulant activity assay of tissue factor pathway inhibitor. J Thromb Haemost 2004;3:651-8. Dahm AEA, Sandset PM, Rosendaal FR. The association between protein S levels and anticoagulant activity of tissue factor pathway inhibitor type 1. J Thromb Haemost 2008;6:393-5 De Visser MCH, van hylckama Vlieg A, Tans G, Rosing J, Dahm AEA, Sandset PM, Rosendaal R, Bertina RM. Determinants of the APTT- and ETP-based APC sensitivity tests. J Thromb Haemost 2005;3:1488-94. Esmon CT. The Roles of Protein C and Thrombomodulin in the Regulation of Blood Coagulation. J Biol Chem 1989;264:4743-46. Hackeng TM, Seré KM, Tans G, Rosing J. Protein S stimulates inhibition of the tissue factor pathway by tissue factor pathway inhibitor. Proc Natl Acad Sci USA. 2006;103:3106-11. Hansen JB, Sandset PM, Huseby KR, Huseby NE, Bendz B, Ostergaard P, Nordoy A.

55
Differential effect of unfractionated heparin and low molecular weight heparin on intravascular tissue factor pathway inhibitor: evidence for a difference in antithrombotic action. Br J Haematol 1998;101 (4):638-46. Heinemann LA, Assmann A, Spannagl M, Schramm W, Dick A, Kluft C, de Maat MP. Normalized activated protein C ratio itself is not associated with increased risk of venous thromboembolism. Contraception 1998;58:321-2. Maurissen LF, Thomassen MC, Nicolaes GA, Dalback B, Tans G, Rosing J, Hackeng TM. Re-evaluation of the role of the protein S-C4b binding protein complex in activated protein C-catalyzed factor Va-inactivation. Blood 2088;111:3034-41. Ndonwi M, Broze G. Protein S enhances the tissue factor pathway inhibitor inhibition of factor Xa but not its inhibition of factor VIIa-tissue factor. J Thromb Haemost 2008;6:1044-6. Seré KM, Rosing J, Hackeng TM. Inhibition of thrombin generation by protein S at low procoagulant stimuli: implications for maintenance of the hemostatic balance. Blood 2004;104:3624-30 Simmonds RE, Ireland H, Lane DA, Zoller B, Garcia de Frutos P, Dalback B. Clarification of the risk for venous thrombosis associated with hereditary protein S deficiency by investigation of a large kindred with a characterized gene defect. Ann Inter Med 1998;128:8-14 Tans G, van Hylckama VA, Thomassen MC, Curvers J, Bertina RM, Rosing J, Rosendaal FR. Activated protein C resistance determined with a thrombin generation-based test predicts for venous thrombosis in men and women. Br J Haematol 2003;122:465-70. Tardy-Poncet B, Tardy B, Laporte S, Mismetti P, Amiral J, Piot M, Reynaud J, Campos L, Decousus H. Poor anticoagulant response to tissue factor pathway inhibitor in patients with venous thrombosis. J Thromb Haemost 2003;1:507-10.

56
III) Implication of TFPI on gestational vascular complications
Pregnancy corresponds to an acquired hypercoagulable state that is related to an
increase of coagulation factors and a decrease of inhibitor factors. Among these variations it
is noteworthy that there is an over expression of tissue factor (TF) and an important
decrease of Protein S (PS) (Comp et al 1986). Because TF initiates plasmatic coagulation by
activating FVII, it gives to TFPI a big importance each time TF is over expressed. TFPI and
PS levels are closely linked (Castoldi et al 2009); however during pregnancy free PS levels
decrease while free TFPI levels remain rather stable (Sarig et al 2005).
Pre eclampsia is one of the great obstetrical syndromes that complicate pregnancy; it
has been shown to be associated to very high TF plasma concentration compared to normal
pregnancy. Similarly, TFPI concentrations were higher in pre eclampsia than in normal
pregnancy (Abdel Gader et al 2006, Erez et al 2008). They also demonstrated that the ratio
of TFPI/TF in patients with pre-eclampsia was lower than normal pregnancy suggesting that
the increase in TFPI plasma concentrations observed in pre-eclampsia may not be sufficient
to compensate for the higher plasma TF concentration observed in these patients and the
overall balance is a procoagulant state (Erez et al 2008). This TFPI/TF ratio may represent a
good indicator for the severity of a procoagulant state in the context of gestational vascular
complications (GVC).
The main objective of this study was to evaluate TFPI activity during pregnancy and
to compare this parameter between patients with and without GVC.
The second objective of this study was to evaluate the degree of plasma resistance to
exogenous TFPI as an indicator of the risk of GVC during pregnancy and to compare the
degree of TFPI resistance between patients with and without GVC.
This study is an ancillary study of the prospective multicentric study named
ANGIOPRED conducted by Prof C. Chauleur (Prediction of the risk of placental vascular
pathology and venous thromboembolic disease: role of angiogenic factors, hemostasis and
uterine artery Doppler; NCT 00695942).
This study has been approved by the Ethical Committee of St Etienne Sud Est I and
all the patients had signed an informed consent. Patients from CHU St Etienne and from
CHU of Nîmes were enrolled into the study.

57
1) Patients, material and methods
1a) Patients and controls:
Were included in ANGIOPRED study, all the patients who already had GVC in the
past or who had a risk factor of developing GVC. Morover all patients who had a risk factor of
DVT or who already had a DVT were included into the study.Inclusion and exclusion criteria
are listed below:
Inclusion criteria:
- Previous history of one or more GVC episodes (preeclampsia, HELLPs,
retroplacental hematoma, vascular in utero growth retardation <10th percentile, recurrence
miscarriage > 2, unexplained in utero foetal death (IUFD) or IUFD after abruption placentae,
eclampsia)
- Previous history of personal venous thromboembolism
- Diabetes
- chronic hypertension
- Chronic renal pathology
- Lupus
- Obesity
- Antiphospholipid syndrome
- Early and late pregnancy (<18 years; > 38 years)
-Family history of cardiovascular disease or venous thromboembolim
- Known biological thrombophilia
Exclusion criteria
- Multiple pregnancy
- Past history of in utero fetal death due to congenital malformations, rhesus
incompatibility or an infection
- Previous history of IUGR related with a chromosomal or infectious anomaly
In this ancillary study, we included only the ANGIOPRED patients for whom all
samples (during pregnancy and after delivery) were available. Controls were 34 women in a
good health without any past of GVC during pregnancy and without any past of DVT who did
not take any contraception at the time of sampling.

58
1b) Material
Blood samples had been collected at different stage of pregnancy: 20, 24, 28, 32, 36
weeks of amenorrhoea (AW) and 6 weeks at least after the delivery (AD)
Blood samples were collected in tubes containing 0.129 mol.L-1 trisodium citrate
anticoagulant. After a simple centrifugation (15 min at 2500xg), aliquots of plasma were
stored at -70°C until analysis.
1c) Anticoagulant response to exogenous TFPI:
To evaluate the anticoagulant response of plasma to exogenous TFPI, we used a
diluted prothombin time (dPT) assay with and without exogenous TFPI as described in
annexe 3. Recombinant tissue factor (Innovin®) was purchased from Behring Siemens. Full-
length recombinant human TFPI from American Diagnostica was used at the final
concentration of 83ng.ml-1.
1d) Chromogenic measure of TFPI activity
To evaluate the anticoagulant activity of endogenous TFPI, we used the chromogenic
assay described by Sandset and slightly modified as described in Annexe 3.
1e) Stastitical analysis
Quantitative data are reported as mean ± standard deviation, median and interquartile
range, minimum and maximum. Qualitative data are expressed as percentages. Quantitative
data were compared between groups using the Student’s t test or the median test. Chi 2 test
or Fisher’s exact test were used to compare qualitative data between groups. The software
“Sigma Plot 10” was used for drawing the box plots.
2) Results
Seventy two patients have been included in this ancillary study. Fifteen patients
presented a gestational vascular complication (GVC + group). Fifty seven patients did not
have any gestational vascular complication (GVC – group)
2a) TFPI activity
TFPI activity normal values have been defined in the control group (N=34), mean
TFPI activity: 92.5±18.5%. The lower limit (defined as mean -2 SD) of the normal range for
TFPI activity was 55 %. TFPI activity has been measured for the 72 patients at risk of GVC
during pregnancy and after delivery.
TFPI activity at 20 AW was significantly decreased compared to TFPI activity after
delivery (p< 0.0001). TFPI activity at 24 AW was significantly decreased compared to TFPI
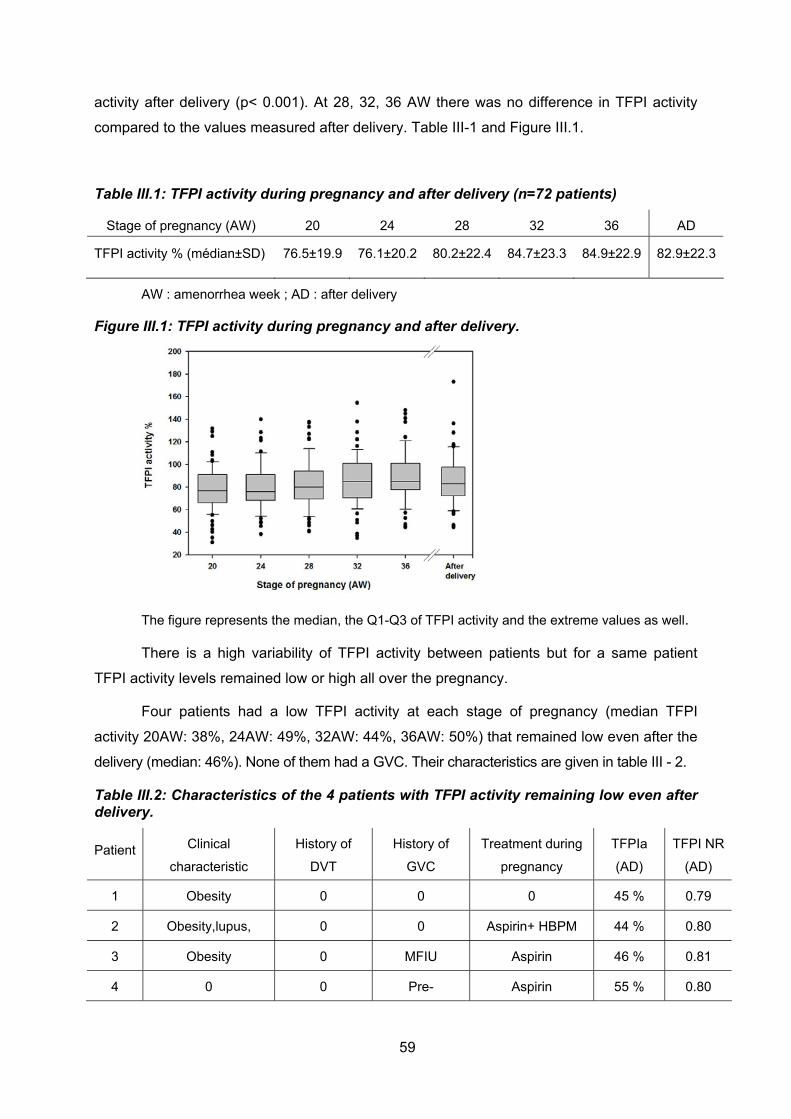
59
activity after delivery (p< 0.001). At 28, 32, 36 AW there was no difference in TFPI activity
compared to the values measured after delivery. Table III-1 and Figure III.1.
Table III.1: TFPI activity during pregnancy and after delivery (n=72 patients)
Stage of pregnancy (AW) 20 24 28 32 36 AD
TFPI activity % (médian±SD) 76.5±19.9 76.1±20.2 80.2±22.4 84.7±23.3 84.9±22.9 82.9±22.3
AW : amenorrhea week ; AD : after delivery
Figure III.1: TFPI activity during pregnancy and after delivery.
The figure represents the median, the Q1-Q3 of TFPI activity and the extreme values as well.
There is a high variability of TFPI activity between patients but for a same patient
TFPI activity levels remained low or high all over the pregnancy.
Four patients had a low TFPI activity at each stage of pregnancy (median TFPI
activity 20AW: 38%, 24AW: 49%, 32AW: 44%, 36AW: 50%) that remained low even after the
delivery (median: 46%). None of them had a GVC. Their characteristics are given in table III - 2.
Table III.2: Characteristics of the 4 patients with TFPI activity remaining low even after delivery.
Patient Clinical
characteristic
History of
DVT
History of
GVC
Treatment during
pregnancy
TFPIa
(AD)
TFPI NR
(AD)
1 Obesity 0 0 0 45 % 0.79
2 Obesity,lupus, 0 0 Aspirin+ HBPM 44 % 0.80
3 Obesity 0 MFIU Aspirin 46 % 0.81
4 0 0 Pre- Aspirin 55 % 0.80
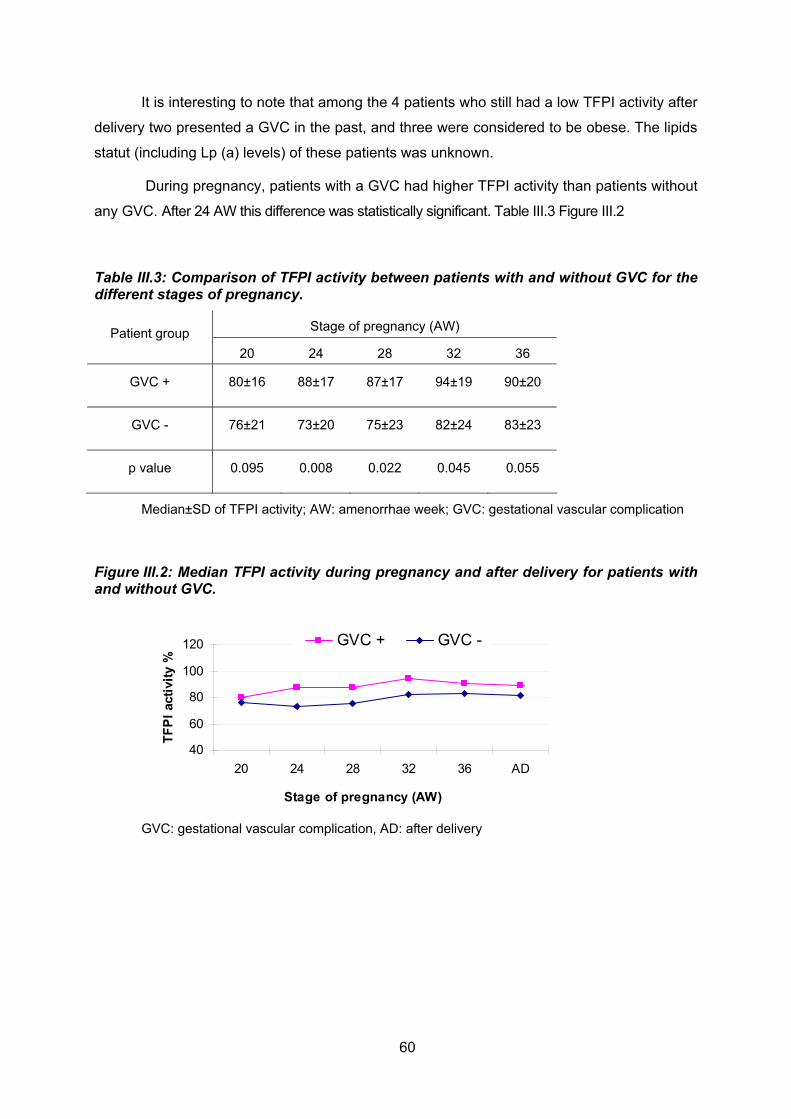
60
It is interesting to note that among the 4 patients who still had a low TFPI activity after
delivery two presented a GVC in the past, and three were considered to be obese. The lipids
statut (including Lp (a) levels) of these patients was unknown.
During pregnancy, patients with a GVC had higher TFPI activity than patients without
any GVC. After 24 AW this difference was statistically significant. Table III.3 Figure III.2
Table III.3: Comparison of TFPI activity between patients with and without GVC for the different stages of pregnancy.
Stage of pregnancy (AW) Patient group
20 24 28 32 36
GVC + 80±16 88±17 87±17 94±19 90±20
GVC - 76±21 73±20 75±23 82±24 83±23
p value 0.095 0.008 0.022 0.045 0.055
Median±SD of TFPI activity; AW: amenorrhae week; GVC: gestational vascular complication
Figure III.2: Median TFPI activity during pregnancy and after delivery for patients with and without GVC.
40
60
80
100
120
20 24 28 32 36 AD
Stage of pregnancy (AW)
TF
PI
acti
vity
%
GVC + GVC -
GVC: gestational vascular complication, AD: after delivery

61
It is noteworthy that among the 15 patients who suffered a GVC four did not receive
any prophylactic treatment. Eight patients were treated: six received aspirin, one LMWH at
prophylactic dose, one was on aspirin and LMWH at prophylactic dose and then at curative
dose because of an eclampsia. For three patients included in a randomized blinded study
(Prefix study: LMWH/Placebo) we still do not know if these 3 patients received a LMWH or
not.
After delivery TFPI activity levels remained higher in the group of patients with GVC
(n=15) compared to the group of patients without GVC (n= 57) (median 89.0± 27.8% and
81.2±19.6 respectively; p=0,018)
However outside pregnancy there was no difference in median values of TFPI activity
between patients with a GVC (median 89.1± 27.7) and controls (median 89.6 ±18.5) Figure
III.3.
Figure III.3: TFPI activity in patients outside pregnancy and in paired-controls.
GVC: gestational vascular complication

62
2b) TFPI resistance
Diluted prothrombin time (dPT) was stable during all pregnancy and is not shorter
during pregnancy compared to dPT measured after delivery (Table II-6)
TFPI NR normal values have been defined in the control group (N=34), mean TFPI
NR 0.88 ± 0.09. The lower limit, defined as mean – 2SD, was found at 0.70. This value was
defined as the cut off under which the plasma was considered to be resistant to TFPI. None
of the 34 controls had a TFPI NR under 0.70.
For all pregnant patients, the response of the plasma to TFPI during pregnancy was
out of the normal values and was stable at all stages of pregnancy (from 20 AW to 36 AW).
Their plasmatic response to TFPI during pregnancy was also statistically lower than the
response to TFPI after delivery in the same patients (whatever the stage of pregnancy
p<0,0001) (Table III.4 and figure III.4).
Table III.4: TFPI sensitivity at different stages of pregnancy (n=72 patients)
Stage of pregnancy (AW) 20 24 28 32 36 AD
dPT initial (sec.)
(median±SD) 57.1±10.2 57.9±7.6 57.1±10.9 58.3±10.4 57.1±9.2 57.7±8.0
TFPI NR (médian±SD) 0.68±0.06 0.67±0.06 0.67±0.07 0.66±0.05 0.65±0.05 0.81±0.08
dPT: Diluted Prothrombin Time; TFPI NR: TFPI Normalised Ratio
Figure III.4: TFPI resistance during pregnancy and 6 weeks after delivery.
The figure represents the median and the Q1-Q3 of TFPI NR at each stage of pregnancy for
the 72 patients; the extreme points are also presented.

63
We compared TFPI NR between patients with GVC (n =15) and patients without GVC (n
= 57).There was no TFPI NR difference between the 2 groups of patients all along the
pregnancy (Figure III.5)
Figure III.5: median TFPI resistance during pregnancy and after delivery for the patients with and without GVC.
0.50
0.60
0.70
0.80
0.90
1.00
20 24 28 32 36 AD
Stage of pregnancy (AW)
TF
PI
NR
GVC + GVC -
TFPI NR median values are given at each stage of pregnancy for the patients with GVC and
for patients without GVC; GVC: gestational vascular complication
We compared TFPI NR values after delivery between patients GVC-, patients GVC+
and controls: Mean TFPI NR was lower in patients (GVC- and GVC +) (0.83±0.09) than in
controls (0.88±0.09), (p = 0.04). Moreover TFPI NR was lower in patients GVC + (mean TFPI
NR 0.80 ±0.05) compared to patients GVC– (mean TFPI NR 0.84 ±0.09), but this difference
was not statistically significant (p= 0.078). TFPI NR was lower in patients GVC+ compared to
controls and this difference was statistically significant (p= 0.002). TFPI NR was also lower in
patients GVC- compared to controls and this difference was statistically significant (p= 0.02)
Fig III.6.
Figure III.6: TFPI normalised ratios after delivery
The figure represents the median and the Q1-Q3 of TFPI NR for GVC – and GVC + patients after
delivery and for controls.

64
Four patients had a TFPI resistance (TFPI NR < 0.70) after delivery. None of them
was on oral contraception. The characteristics of these 4 patients are summarized in table
III.5. Two of them were obese, one had a lupus anticoagulant and one had a 20210 G/A
mutation. Two of these patients already had more than 2 miscarriages.
Tableau III.5: Characteristics of the 4 patients with TFPI normalised ratio remaining low even after delivery.
Patient Treatment during
pregnancy
Biological
Thrombophilia
History of
DVT/GVC
Risk factor for
GVC
GVC TFPI
NR
TFPI
activity %
1 0 ND 5
miscarriages Obesity+diabetes + 0,68 100
2 0 ND 0 Obesity - 0,69 75
3 Aspirin+prophyl.LMWH LA 0 0 - 0,69 80
4 Aspirin 20210G/A
mutation
2
miscarriages 0 - 0,68 87
LA: lupus anticoagulant
The 4 patients who presented a low TFPI activity after delivery were not the same
patients who presented a low TFPI NR
3) Discussion
As soon as 20 weeks gestation, TFPI activity is higher in patients with GVC compared
to patients without GVC and this difference remained after delivery. It has been well
demonstrated that LMWH induces the release of TFPI from the endothelial cells (Sandset et
al 2000). The higher value of TFPI activity observed in patients with GVC was probably not
related to the release of TFPI by a prophylactic treatment with LMWH since only 2 patients
with GVC received LMWH. Moreover a higher TFPI activity in patients with preeclampsia had
already been described (Schjetlein et al 1999). An other study demonstrated that at 20
weeks gestation TFPI activity levels were significantly higher in those patients that developed
preeclampsia when compared to matched controls (Hillman et al 2009). It has been
postulated that TFPI activity could behave as a coagulation inhibitory mechanism attenuating
hypercoagulability in pre-eclampsia very early in the disease process. Because TFPI
increases before clinical signs of preeclampsia it raised the possibility of using measurement
of TFPI activity as a clinical predictor of preeclampsia. After delivery, patients who suffered
GVC had the same TFPI activity than controls excluding an inherited TFPI abnormality in

65
these patients. Six patients at risk of GVC (but who did not develop GVC) had low TFPI
values. In other gestational complications (other than pre-eclampsia) TFPI was significantly
lower compared with normally pregnant women (Aharon et al 2005).
Our results are in accordance with other studies that showed a higher maternal
plasma concentration of free TFPI in women with pre-eclampsia that should balance the high
plasmatic levels of TF in these women (Schjetlein et al 1999). However it has been shown in
these patients that the ratio of TFPI/TF was significantly lower and could be considered as a
marker for the presence of a hypercoagulable state in these patients (Erez at al 2008).
Recently it has been shown that protein S acts as a cofactor for full length TFPI in the
inhibition of free FXa by stimulating the initial interaction with TFPI (Hackeng et al 2006;
Ndonwi et al 2008). We demonstrated that acquired PS deficiency that is observed during
pregnancy is responsible for a TFPI resistance (Tardy-Poncet et al 2012). We speculated
that the response of the plasma to exogenous TFPI could be a good marker for the presence
of a hypercoagulable state related to a higher level of TF. We confirmed the presence of a
TFPI resistance during the pregnancy and we demonstrated that it already exists at 20
weeks of gestation. This TFPI resistance remains stable all along the pregnancy and does
not become more severe at the end of pregnancy. In this study, the resistance to TFPI does
not exist any more 6 weeks after delivery demonstrating again that it is an acquired in
relation with pregnancy itself. We can speculate that the TFPI resistance during pregnancy is
related to the combined effect of PS deficiency and high levels of TF. However, the TFPI
normalised ratio was not different between patients with and patients without GVC. This TFPI
resistance assay was indeed not able to predict GVC in women at risk of developing this kind
of pregnancy complications.
We will send an abstract to the next congress of Thrombosis and Haemostasis.
We will submit this work as a letter to the International Journal of Gynecology and
Obstetric .
66
4) References
Abdel Gader AM, Al-Mishari AA, Awadalla SA, Buyuomi NM, Khashoggi T, Al-Hakeem M. Total and free tissue factor pathway inhibitor in pregnancy hypertension. Int J Gynaecol Obstet 2006; 95: 248-53 Adams M, Breckler L, Stevens P, Thom J, Baker R, Oostryck R. Anti tissue factor pathway inhibitor activity in subjects with anti phospholipids syndrome is associated with increased thrombin generation. Haematologica 2004; 89: 985-90 Aharon A, Lanir N, Grugani A, Brenner B, Placenta TFPI is decreased in gestational vascular complications and can be restored by maternal enoxaparin treatment . J Thromb Haemost 2005; 3: 2355-2357. Aharon A, Katzenell S, Tamari T, Brenner B. Microparticles bearing tissue factor and tissue factor pathway inhibitor in gestational vascular complications. J. Thromb Haemost 2009 ; 6 : 1047-1050. Ariëns R.A.S, Alberio G, Moia M, Mannucci PM. Low levels of Heparin-releasable Tissue Factor Pathway Inhibitor in young patients with thrombosis. Thromb Haemost 1999; 81: 203-7 Bendz B, Andersen TO, Sandset PM. A new sensitive chromogenic substrate assay of tissue factor pathway inhibitor type 1. Thromb Res 2000; 97: 463-72 Bergrem A, Dahm AE, Jacobsen AF, Mowinckel MC, Sandvik L, Sandset PM. Resistance to activated protein C is a risk for pregnancy-related venous thrombosis in the absence of the F5 rs6025 (factor V Leyden) polymorphism. Brit J Haematol 2011; 154: 241-7 Castoldi E, Simioni P, Tormene D, Rosing J, Hackeng TM. Hereditary and acquired protein S deficiencies are associated with low TFPI levels in plasma. J Thromb Haemost 2010; 8: 294-300 Comp P C, Thurnau GR, Welsh J, Esmon CT. Functional and immunologic protein S levels are decreased during pregnancy Blood 1986; 68: 881-5. Dahm A, Hylckama Vlieg A, Bendz B, Rosendaal F, Bertina RM, Sandset PM. Low levels of tissue factor pathway inhibitor (TFPI) increase the risk of venous thrombosis. Blood 2003; 101: 4387-92 Dahm A, Rosendaal FR, Andersen TO, Sandset PM. Tissue factor pathway inhibitor anticoagulant activity: risk for venous thrombosis and effect of hormonal state. Brit J Haematol 2006; 132: 343-8 Erez O, Romero R, Hoppensteadt D, Than NG, Fareed j, Mazaki-Tovi S, Espinoza J, et al.

67
Tissue factor and its natural inhibitor in pre eclampsia and SGA. J Matern Fetal Neonatal Med, 2008; 21: 855-69 Erez O, Romero R, Vaisbuch E, Kusanovic JP, Mazaki-Tovi S, et al. High tissue factor activity and low tissue factor pathway inhibitor concentrations in patients with preterm labor. T J Mater Fetal Neonatal Med 2010; 23: 23-33 Godoi LC, Gomes KB, Alpoim PN, Carvalho MD, Lwaleed BA, Sant’Ana Dusse LM. Pre eclampsia : the role of tissue factor and tissue pathway inhibitor. J Thromb Thrombolysis 2012; 34: 1-6 Hackeng TM, Sere KM,Tans G, Rosing J. Protein S stimulates inhibition of the tissue factor pathway by tissue factor pathway inhibitor Proc Natl Acad Sci 2006; 103 (9) : 3106-11. Hackeng TM, Rosing J. Protein S as cofactor for TFPI Arterioscler Thromb Vasc Biol 2009; 29: 2015-20 Hansen JB, Sandset PM, Huseby KR, Huseby NE, Bendz B, Ostergaard P, Nordoy A. Differential effect of unfractionned heparin and low molecular weight heparin on intravascular tissue factor pathway inhibitor: evidence for a difference in antithrombotic action. Brit J Haematol1998; 101: 638-46 Harris GM,. Stendt CL, Vollenhoven BJ, Gan TE, Tipping PG. Decreased plasma tissue factor pathway inhibitor in women taking oral contraceptives. Am J Haematol 1999; 60: 175-80 Hillman S, Chant I, Gu M, Rose P, Vatish M. Tissue factor pathway inhibitor (TFPI) activity is elevated in pregnant patients at 20 weeks gestation who subsequently develop preeclampsia. Thromb Haemost 2009; 101: 778-780. Ittel A, Bretelle f, Gris JC, Chau C, Sébahoun G, Boubli L, Arnoux D. Increased risk of gestational vascular complications in womn with low free tissue factor pathway inhibitor plasma levels out of pregnancy. Thromb Heamost 2011; 105: 66-11. Lwaleed BA, Bass PS. Tissue factor pathway inhibitor : structure, biology and involvement in disease. J Pathol 2006; 208: 327-39 Maurissen LFA, Castoldi E, Simioni P, Rosing J, Hackeng TM. Thrombin generation based assays to measure the activity of the TFPI-protein S pathway in plasma from normal and protein S-deficient individuals. J Thromb Haemost 2010; 8: 750-8 Ndonwi M, Broze GJ Jr. Protein S enhances the tissue factor pathway inhibitor inhibition of factor Xa but not its inhibition of factor VIIa–tissue factor J Thromb Haemost 2008; 6: 1044-46. Sandset PM, Bendz B, Hansen JB. Physiological function of tissue factor pathway inhibitor and interaction with heparins.
68
Haemostasis 2000; 30: 48-56 Sarig G, Blumenfeld Z, Leiba R, Lanir n, Brenner B. Modulation of systemic hemostatic parameters by enoxaparin during gestation in women with thrombophilia and pregnancy loss. Thromb Haemost 2005; 94: 980-5 Schjetlein R, Abdelnoor M, Haugen G, Husby H, Sandset PM, Wisloff F. Hemostatic variables as independent predictors for fetal growth retardation in pre eclampsia. Acta Obstet Gynecol Scand 1999; 78:191-197. Smrtka MP, Thames B, Beckman M, Rajgor D, Gandhi M, James AH. Obesity related coagulation changes in pregnancy. Thromb Res 2012; 129: 204-6 Tardy Poncet B, Tardy B, Laporte S, Mismetti P, Amiral J, Piot M, Reynaud J, Campos L, Decousus H. Poor anticoagulant response to tissue factor pathway inhibitor in patients with venous thrombosis. J Thromb Haemost 2003; 1: 507-10
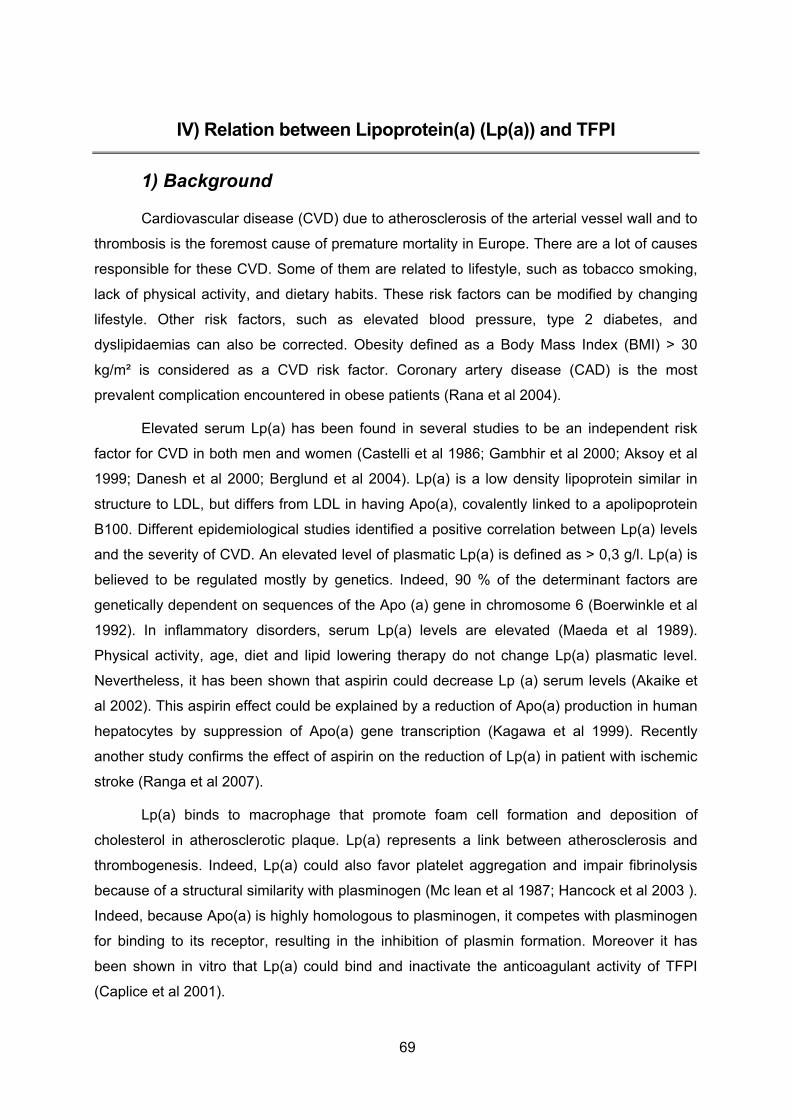
69
IV) Relation between Lipoprotein(a) (Lp(a)) and TFPI
1) Background
Cardiovascular disease (CVD) due to atherosclerosis of the arterial vessel wall and to
thrombosis is the foremost cause of premature mortality in Europe. There are a lot of causes
responsible for these CVD. Some of them are related to lifestyle, such as tobacco smoking,
lack of physical activity, and dietary habits. These risk factors can be modified by changing
lifestyle. Other risk factors, such as elevated blood pressure, type 2 diabetes, and
dyslipidaemias can also be corrected. Obesity defined as a Body Mass Index (BMI) > 30
kg/m² is considered as a CVD risk factor. Coronary artery disease (CAD) is the most
prevalent complication encountered in obese patients (Rana et al 2004).
Elevated serum Lp(a) has been found in several studies to be an independent risk
factor for CVD in both men and women (Castelli et al 1986; Gambhir et al 2000; Aksoy et al
1999; Danesh et al 2000; Berglund et al 2004). Lp(a) is a low density lipoprotein similar in
structure to LDL, but differs from LDL in having Apo(a), covalently linked to a apolipoprotein
B100. Different epidemiological studies identified a positive correlation between Lp(a) levels
and the severity of CVD. An elevated level of plasmatic Lp(a) is defined as > 0,3 g/l. Lp(a) is
believed to be regulated mostly by genetics. Indeed, 90 % of the determinant factors are
genetically dependent on sequences of the Apo (a) gene in chromosome 6 (Boerwinkle et al
1992). In inflammatory disorders, serum Lp(a) levels are elevated (Maeda et al 1989).
Physical activity, age, diet and lipid lowering therapy do not change Lp(a) plasmatic level.
Nevertheless, it has been shown that aspirin could decrease Lp (a) serum levels (Akaike et
al 2002). This aspirin effect could be explained by a reduction of Apo(a) production in human
hepatocytes by suppression of Apo(a) gene transcription (Kagawa et al 1999). Recently
another study confirms the effect of aspirin on the reduction of Lp(a) in patient with ischemic
stroke (Ranga et al 2007).
Lp(a) binds to macrophage that promote foam cell formation and deposition of
cholesterol in atherosclerotic plaque. Lp(a) represents a link between atherosclerosis and
thrombogenesis. Indeed, Lp(a) could also favor platelet aggregation and impair fibrinolysis
because of a structural similarity with plasminogen (Mc lean et al 1987; Hancock et al 2003 ).
Indeed, because Apo(a) is highly homologous to plasminogen, it competes with plasminogen
for binding to its receptor, resulting in the inhibition of plasmin formation. Moreover it has
been shown in vitro that Lp(a) could bind and inactivate the anticoagulant activity of TFPI
(Caplice et al 2001).

70
Whether high Lp(a) levels could be responsible in vivo of a decrease of TFPI activity
remains to be demonstrated.
2) Objectives of the study
The main objective of this study was to demonstrate in obese patients with a high
plasmatic Lp(a) level and who suffer a CAD an in vivo inhibitory effect of high Lp(a) levels on
free TFPI and on TFPI activity.
The second objective of the study was to confirm that aspirin was able to decrease
the Lp(a) plasmatic levels and to evaluate the correction of TFPI activity at the same time.
3) Patients material and methods
3a) Patients
The study was conducted in the academia hospital of Saint Etienne. The study has
been approved by the ethical committee of St Etienne (CPP Sud Est I). All patients signed an
informed consent to entry into the study.
Patients who matched the including criteria were included at their first visit in
cardiology. The typical clinical presentation of stable angina pectoris is retrosternal pressure
or heaviness (‘angina’) radiating to the left arm, neck, or jaw due to ischemia of the heart
muscle precipitated by some activity (running, walking, etc.) with minimal or non-existent
symptoms at rest.
Including and excluding criteria are noticed in Table IV.1.
Table IV.1: Including and excluding criteria
Including criteria Excluding criteria
Male older than 18 years old Hepatic failure or neoplasia
Stable angina pectoris Heparin therapy
BMI>30 kg/m² Oral anticoagulants therapy
Planned coronary imaging Protein S deficiency
Aspirin treatment
BMI=Body Mass Index

71
All the patients of the study had a coronary imaging either invasive by
coronarography or non invasive by multi-sliced tomography computed (Siemens Somatom
Germany).
3b) Materials and methods
For TFPI exploration blood samples were collected in tubes containing 0.129 mol/L
trisodium citrate. After a double centrifugation (15 min; 2000g) plasma was collected and
stored at -70 °C until analysis. For Lp(a) exploration blood samples were collected in dry tube
for Lp(a) measure. After a simple centrifugation (15 min; 2000g) plasma was collected and
stored at -70°C.
Free TFPI level was determined by ELISA method using a commercial assay
(Asserachrom® Free TFPI, Diagnostica Stago, Asnières, France) according to the
manufacturer’s recommendations. See Annexe 1.
TFPI activity was measured using the chromogenic assay described by Sandset
(2000) See Annexe 3.
Lp(a) quantitative determination was done by means of particle-enhanced immuno-
nephelometry using the BN* Systems.
Briefly, polystyrene particles coated with specific antibodies to human Lp(a) are
aggregated when mixed with samples containing Lp(a). These aggregates scatter a beam of
light passed through the sample. The intensity of the scattered light is proportional to the
concentration of the respective protein in the sample. The result is evaluated by comparison
with a standard of known concentration.
3c) Design of the study
The design of the study is described in the following figure IV.1. Briefly:
1. At the day of the visit: blood samples were collected for the determination of free TFPI,
TFPI activity and Lp(a) levels. Then, aspirin treatment 100 mg per day was introduced
for the patients. Because the results obtained on the first 8 patients showed that
aspirin 100 mg/day did not seem to have any effect on Lp(a) levels we changed one
inclusion criteria in that patients already on aspirin treatment (generally 75 to 100 mg
/day) could be enrolled into the study. For these patients already treated by aspirin
(100 mg per day) aspirin dose was increased to 160 mg. An amendement to the
protocole was proposed to and accepted by the CPP of St Etienne Sud Est I. It
allowed to increase the number of inclusions and enhanced the chance of finding an
aspirin effect on Lp(a) levels (by increasing the dose of Aspirin) .

72
2. A coronary imaging was planned.
3. The patients who had no coronary artery disease and Lp(a) low level (<0,3 g/l) were
excluded from the study.
4. The patients who had no coronary artery disease and Lp(a) level> 0,3 g/l did not
receive aspirin and had a second consultation. They will correspond to the control
group to evaluate the effect of aspirin on Lp(a) levels.
5. Patients with CAD and Lp(a) < 0,3 g/l were kept into the study to evaluate aspirin
effect on normal levels of Lp(a).
6. All the patients had a second consultation at one month at least (+ 2 weeks). Blood
samples were collected to measure Lp(a), free TFPI and TFPI activity levels.
Figure IV.1: Design of the study

73
3d) Statistical analysis
The relation between free TFPI and Lp(a) was studied using a Pearson’s correlation
curve and an unpaired T-test. A paired t-test was used to compare Lp(a), free TFPI and TFPI
activity levels between 1st and 2nd visit . Graphs were done using the Sigma-Plot 10 graphing
Software.
4) Results
Twenty eight patients were included into the study. Out of the 28 patients enrolled, 7
had no coronaries lesion. Out of these 7 patients, 4 had normal Lp(a) level and as planned in
the study scheme they went out of the study. One patient didn’t come to the second visit; his
Lp(a) level was 0,02 g/l and his coronary angiogram revealed a significant coronary stenosis.
This patient was also excluded. So, the total number of patients with both biological
evaluation and complete follow-up is 23.
The baselines characteristics of patients and the repartition of patients in each group
are given in Table IV.2 and figure IV.2.
Median age of our population was 59.2 (±10,9). All the patients were obese as
defined by a BMI>30 kg/m². The risk factors for CVD were: arterial hypertension, diabetis,
dyslipidemia and smoking. Only one patient had no risk factor, 7 patients had only one risk
factor, 13 patients had 2 risks factors, 5 patients had 3 risk factors and 2 patients had the
four risk factors. One patient already suffered a stroke in the past. None of the patient had
presented a venous thrombosis in the past. Seven patients had a familial history of CAD.
Among the 23 patients studied, 14 needed only a medical treatment, 4 needed a
surgical therapy by coronary artery bypass graft, 5 had a percutaneous coronary intervention
using bar metal stent or drug eluting stent (these 5 patients needed Clopidogrel in addition to
aspirin).

74
Figure IV.2: Flow Chart of included patients
N = 28
N = 7 N = 21
N = 4 N = 3 N = 15 N = 5
Lost of follow
up : N= 1
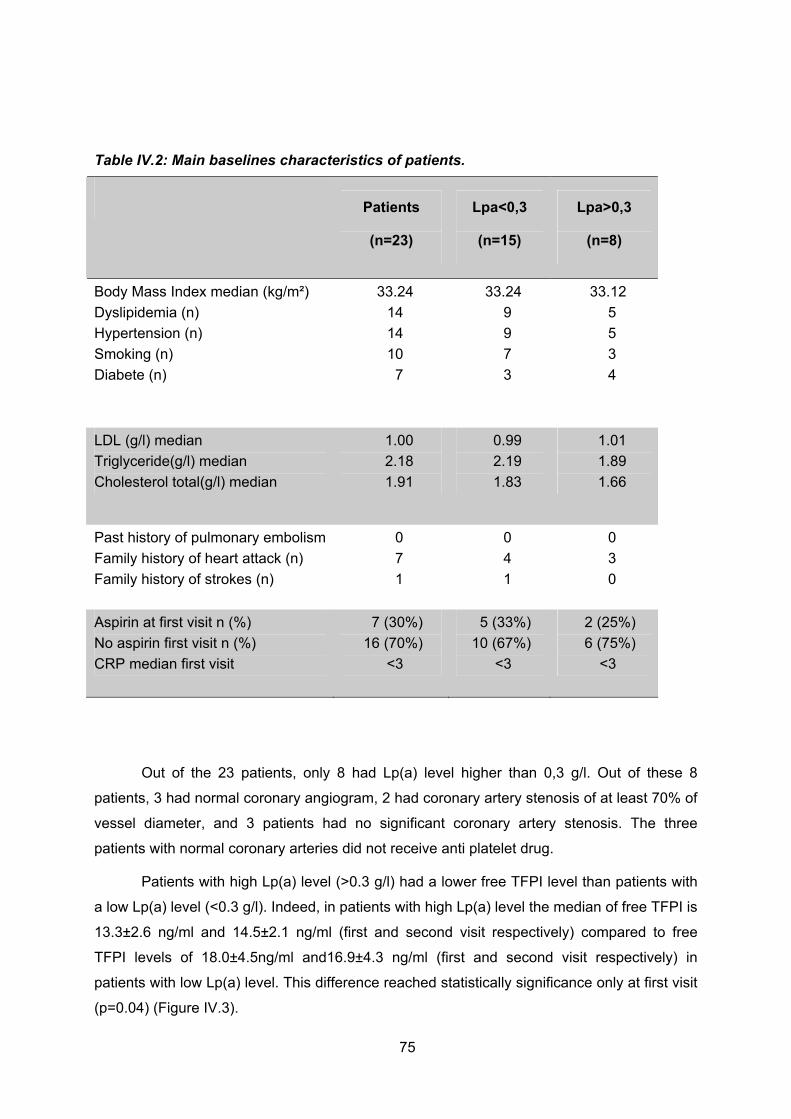
75
Table IV.2: Main baselines characteristics of patients.
Patients
(n=23)
Lpa<0,3
(n=15)
Lpa>0,3
(n=8)
Body Mass Index median (kg/m²)
Dyslipidemia (n)
Hypertension (n)
Smoking (n)
Diabete (n)
33.24
14
14
10
7
33.24
9
9
7
3
33.12
5
5
3
4
LDL (g/l) median
Triglyceride(g/l) median
Cholesterol total(g/l) median
1.00
2.18
1.91
0.99
2.19
1.83
1.01
1.89
1.66
Past history of pulmonary embolism
Family history of heart attack (n)
Family history of strokes (n)
0
7
1
0
4
1
0
3
0
Aspirin at first visit n (%)
No aspirin first visit n (%)
CRP median first visit
7 (30%)
16 (70%)
<3
5 (33%)
10 (67%)
<3
2 (25%)
6 (75%)
<3
Out of the 23 patients, only 8 had Lp(a) level higher than 0,3 g/l. Out of these 8
patients, 3 had normal coronary angiogram, 2 had coronary artery stenosis of at least 70% of
vessel diameter, and 3 patients had no significant coronary artery stenosis. The three
patients with normal coronary arteries did not receive anti platelet drug.
Patients with high Lp(a) level (>0.3 g/l) had a lower free TFPI level than patients with
a low Lp(a) level (<0.3 g/l). Indeed, in patients with high Lp(a) level the median of free TFPI is
13.3±2.6 ng/ml and 14.5±2.1 ng/ml (first and second visit respectively) compared to free
TFPI levels of 18.0±4.5ng/ml and16.9±4.3 ng/ml (first and second visit respectively) in
patients with low Lp(a) level. This difference reached statistically significance only at first visit
(p=0.04) (Figure IV.3).

76
Figure IV.3: Comparison of the level of free TFPI between the group with normal levels of Lp(a) (< 0.3 g/L) and the group with elevated levels of Lp(a) ( ≥ 0.3 g/L)
A) : visit 1, p=0.04;
B): visit 2 ( after one month of aspirin treatment), p=0.144
One of the patients had a low free TFPI level (8.7 g/L on the first visit and even lower
at the second visit 6.7g/L) with a low Lp(a) value (0.08 g/L and 0.07g/L first and second visit
respectively). This defect could correspond to an inherited TFPI deficiency; however this
patient didn’t have any personal or family history of venous or arterial thrombosis.
When all Lp(a) values were taken into account there was only a weak correlation
between TFPI and Lp(a) level (R²=0.177 p=0.053) (Figure IV.4a). However when only high (>
0.3 g/L) levels of Lp(a) were taken into account the correlation between Lp(a) levels and free
TFPI was better (R2 = 0.34, p=0.018) (Figure IV.4b).
Figure IV.4a: Correlation curve between free TFPI levels and Lp(a) levels.
R2 = 0.18
R2 = 0.170
5
10
15
20
25
30
0.0 0.2 0.4 0.6 0.8 1.0 1.2
Lp(a) g.L-1
free
TF
PI n
g.m
l-1
1st visit
2nd visit
A ) B )

77
Figure IV.4b: Correlation curve between free TFPI and high Lp(a) levels (> 0.3g/L) (taking into account the values obtained at the first and second visit).
R2 = 0.34
0
5
10
15
20
0.0 0.2 0.4 0.6 0.8 1.0 1.2
Lp(a) g.L-1
free
TF
PI n
g.m
L-1
In patients with low Lp(a) levels, TFPI activity levels were the same as in patients with
high Lp(a) levels: median TFPI a: 110 ±17.8% and 95 ±20.9% (first and second visit
respectively) in patients with Lp(a) < 0.3 g/L; median TFPI a: 103±17% and 101 ±10.3% (first
and second visit respectively) in patients with Lp(a) level ≥ 0.3 g/ (Figure IV.5).
Figure IV.5: Comparison of the level of TFPI activity between the group with normal levels of Lp(a) (< 0.3 g/L) and the group with elevated levels of Lp(a) ( ≥ 0.3 g/L)
A: visit 1, p= 0.59
B: visit 2 (after one month of aspirin treatment), p=0.98
B)A)

78
At the first visit 8 patients already received an anti platelet agent (7 patients received
aspirin 75 to 100 mg + clopidogrel; 1 patient received clopidogrel alone). There was no
difference of Lp(a) levels between patients with (n = 7) or without aspirin (n = 16) at the
inclusion into the study: median Lp(a)= 0.11±0.28 g/L with aspirin vs 0.08±0.37 g/L without
aspirin. For the 7 patients who already received aspirin (75 to 100 mg) at the entry into the
study, aspirin doses were increased to 160 mg and, for 1 patient, clopidogrel was switched to
aspirin 100 mg. For these patients, Lp(a) median at the first visit was 0.11 g/l (±0.283).
Increasing the aspirin dose to 160 mg per day did not modified the Lp(a) median at the
second visit: 0.10 g/l (±-0.240). For patients without aspirin at the first visit (n=16), Lp(a)
median was 0.08 g/L (±0.37). The introduction of low dose of aspirin (75 to 100 mg per day)
after the first visit did not modify the Lp(a) medians at the second visit: 0.06 g/l (±0.25)
whatever the aspirin dose prescribed. Even when all Lp(a) values were taken all together, we
did not observe any Lp(a) decrease between the first and the second visit: median Lp(a)
0.09±0.24 g/L vs 0.09±0.24 g/L (p=0.28, paired t-test) (Figure IV.6)
Figure IV.6: Effect of aspirin treatment on Lp(a) levels between visit 1 and 2 (p=0.28)
Even for the high basal level of Lp(a) (≥ 0,3 g/l) there was no decrease of Lp(a) after
aspirin treatment, median Lp(a) 0.58±0.23 vs 0.65±0.17 (1st and 2nd visit respectively) (table
IV.3) .
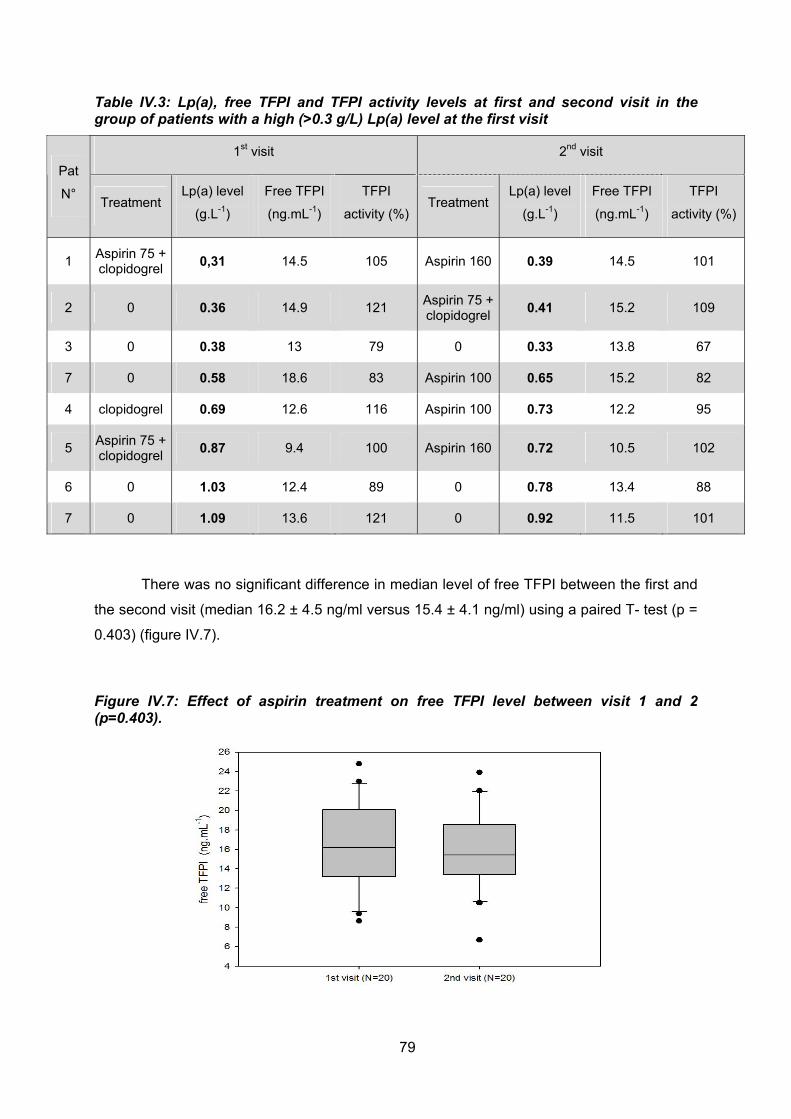
79
Table IV.3: Lp(a), free TFPI and TFPI activity levels at first and second visit in the group of patients with a high (>0.3 g/L) Lp(a) level at the first visit
1st visit 2nd visit
Pat
N° Treatment
Lp(a) level
(g.L-1)
Free TFPI
(ng.mL-1)
TFPI
activity (%) Treatment
Lp(a) level
(g.L-1)
Free TFPI
(ng.mL-1)
TFPI
activity (%)
1 Aspirin 75 + clopidogrel
0,31 14.5 105 Aspirin 160 0.39 14.5 101
2 0 0.36 14.9 121 Aspirin 75 + clopidogrel
0.41 15.2 109
3 0 0.38 13 79 0 0.33 13.8 67
7 0 0.58 18.6 83 Aspirin 100 0.65 15.2 82
4 clopidogrel 0.69 12.6 116 Aspirin 100 0.73 12.2 95
5 Aspirin 75 + clopidogrel
0.87 9.4 100 Aspirin 160 0.72 10.5 102
6 0 1.03 12.4 89 0 0.78 13.4 88
7 0 1.09 13.6 121 0 0.92 11.5 101
There was no significant difference in median level of free TFPI between the first and
the second visit (median 16.2 ± 4.5 ng/ml versus 15.4 ± 4.1 ng/ml) using a paired T- test (p =
0.403) (figure IV.7).
Figure IV.7: Effect of aspirin treatment on free TFPI level between visit 1 and 2 (p=0.403).
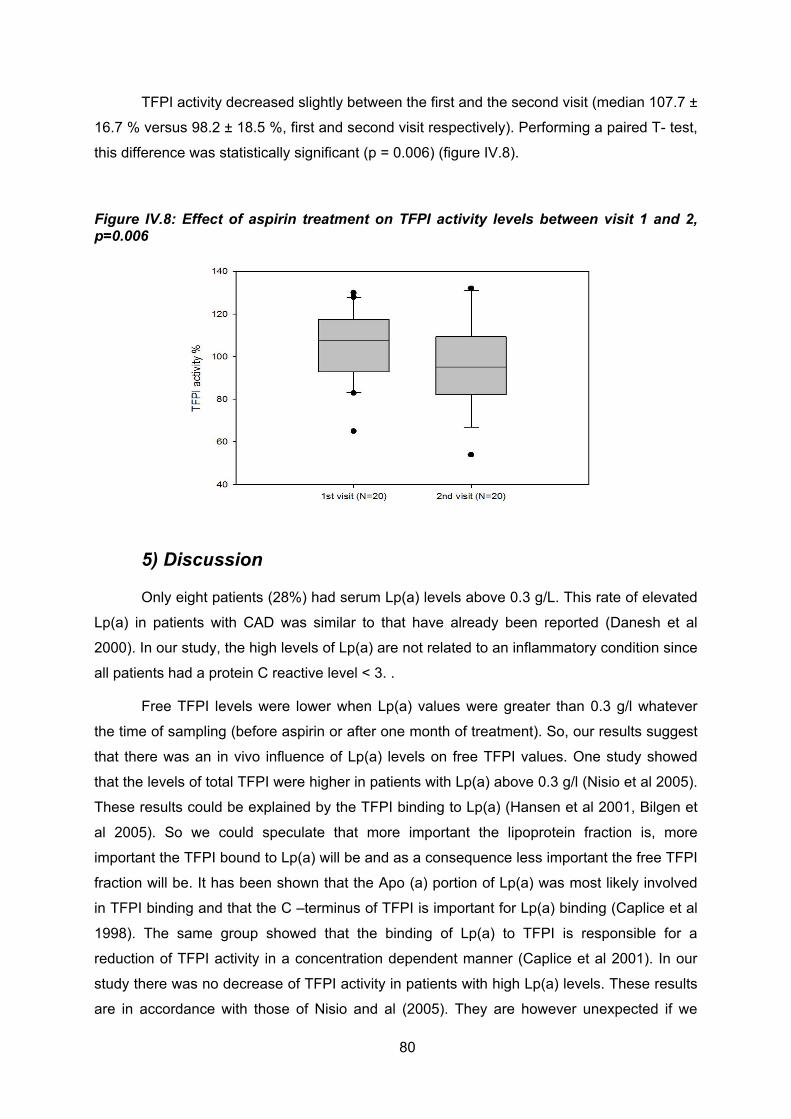
80
TFPI activity decreased slightly between the first and the second visit (median 107.7 ±
16.7 % versus 98.2 ± 18.5 %, first and second visit respectively). Performing a paired T- test,
this difference was statistically significant (p = 0.006) (figure IV.8).
Figure IV.8: Effect of aspirin treatment on TFPI activity levels between visit 1 and 2, p=0.006
5) Discussion
Only eight patients (28%) had serum Lp(a) levels above 0.3 g/L. This rate of elevated
Lp(a) in patients with CAD was similar to that have already been reported (Danesh et al
2000). In our study, the high levels of Lp(a) are not related to an inflammatory condition since
all patients had a protein C reactive level < 3. .
Free TFPI levels were lower when Lp(a) values were greater than 0.3 g/l whatever
the time of sampling (before aspirin or after one month of treatment). So, our results suggest
that there was an in vivo influence of Lp(a) levels on free TFPI values. One study showed
that the levels of total TFPI were higher in patients with Lp(a) above 0.3 g/l (Nisio et al 2005).
These results could be explained by the TFPI binding to Lp(a) (Hansen et al 2001, Bilgen et
al 2005). So we could speculate that more important the lipoprotein fraction is, more
important the TFPI bound to Lp(a) will be and as a consequence less important the free TFPI
fraction will be. It has been shown that the Apo (a) portion of Lp(a) was most likely involved
in TFPI binding and that the C –terminus of TFPI is important for Lp(a) binding (Caplice et al
1998). The same group showed that the binding of Lp(a) to TFPI is responsible for a
reduction of TFPI activity in a concentration dependent manner (Caplice et al 2001). In our
study there was no decrease of TFPI activity in patients with high Lp(a) levels. These results
are in accordance with those of Nisio and al (2005). They are however unexpected if we
81
consider that the free fraction of TFPI supports the TFPI activity. In our study aspirin
treatment did not lead to a decrease of Lp(a) even in case of high baseline levels of Lp(a)
(>0.3 g/L).
In Kagawa study (1999) it had been shown in vitro that aspirin could reduce Lp(a)
levels. In this study, the results were obtained in vitro with aspirin dose dramatically higher
than the aspirin plasmatic concentration obtained in vivo; they demonstrated that
therapeutically relevant concentrations of aspirin could effectively reduce the production of
Apo(a) from cultured normal human hepatocytes by suppressing the apo(a) mRNA
expression and gene transcription. In addition, aspirin also reduced the enhanced apo(a)
gene transcription and mRNA expression along with the elevated apo(a) production from
hepatocytes induced by IL-6. Therefore it was conceivable that aspirin could lower serum
Lp(a) through reduction of apo(a) gene transcription in patients with high serum Lp(a), in
whom the transcriptional activity of the apo(a) gene was considered to be high. The same
group demonstrated that in patients with CAD or cerebral infarction low-dose aspirin
treatment weakly lowered serum Lp(a) levels (to 80–85% of the baseline values) but only for
high (>0.3 g/l) serum Lp(a) levels (Akaike et al 2002): indeed, no significant changes in
serum Lp(a) concentrations in patients with low (< 0.3g/L) Lp(a) level were observed during 6
months of aspirin treatment. In this study they also showed that the percentage of decrease
in serum Lp(a) was larger in patients with a specific Apo(a) isogroup. They suggested that
aspirin lowers serum Lp(a) through reduction of apo (a) gene transcription in patients with
high serum Lp(a) in whom the transcriptional activity of the apo (a) gene is considered to be
high. Because we didn’t find a reduction of Lp(a) with aspirin treatment, we could suggest
that it is related to the presence of different polymorphism of Apo(a) gene that give to Apo(a)
a different sensitivity to aspirin. Indeed, our study was conducted in Caucasian patients, as
the study who showed a Lp(a) reduction with aspirin was conducted in Japanese patients. It
seems conceivable to think that as there is an influence of apolipoprotein A gene
polymorphisms on lipoprotein (a) concentration (Park et al 1999), there could be at the same
time an influence of apolipoprotein A gene polymorphisms on Apo (a) gene sensitivity to
aspirin. The study of Ranga and al (2007) evaluated in 25 patients with a first ischemic stroke
the effect of aspirin on Lp(a) levels after 4 weeks of daily treatment with 150 mg of aspirin.
Lp(a) levels in patients were (27.40 ± 22.30 mg/dL). Eighty percent of patients had serum
Lp(a) levels of more than 0.1g/ L. After 4 weeks of treatment with aspirin, Lp(a) levels
declined significantly (46.24%) from baseline. Patients with baseline levels greater than 0.25
g/ L showed greater decline (55.63%) compared with those with levels less than 0.25 g/ L
(26.63%) (p = 0 .008). It is noteworthy that the lowering effect is better in this study in which
the aspirin dose was twice the dose prescribed in Akaike study. The Lp(a) increase has been

82
hypothesized as a result of its increased rate of production as it is accompanied by increased
levels of other acute phase reactants such as C-reactive protein and IL-6 (Zakai et al 2007,
Woodward et al 2007). In Ranga study, if we consider the high erythrocyte sedimentation
rate (ESR) (41.7 ± 10.6), the high level of Lp(a) measured at the acute phase could be
considered to be related to the presence of an inflammatory syndrome. In this study, we can
speculate that the decrease of Lp(a) one month later could rather be related to the
disappearance of the inflammation rather than to the aspirin effect. Our study showed a
statistically significant difference in TFPI activity (and not in free TFPI) after aspirin treatment;
however this is a low difference that has probably no clinical significance.
6) Conclusion
Finally, in obese patients with stable angina pectoris, Lp(a) levels might be associated
to lower free TFPI levels but not to lower TFPI activity. No effect of aspirin treatment was
observed on Lp(a) level. These results have to be taken with caution because of the low
number of patients with high Lp(a) levels. The study is still running on to verify theses results
on a bigger number of patients.
83
7) References Akaike M, Azuma H, Kagawa A, Matsumoto K, Hayashi I, Tamura K, Nishiuchi T, Iuchi T, Takamori N, Aihara K, Yoshida T, Kanagawa Y, Matsumoto T. Effect of aspirin treatment on serum concentrations of lipoprotein(a) in patients with atherosclerotic diseases. Clin Chem. 2002; (9):1454-9. Aksoy M, Kepekçi Y, Göktekin O, Akdemir I, Gürsürer M, Emre A, Bilge M, Yesilçimen K, Ersek B. Relation of plasma lipoprotein(a) with myocardial viability and left ventricular performance in survivors of myocardial infarction. Jpn Heart J. 1999; 40(6):703-13. Armstrong VW, Cremer P, Eberle E. The association between Lp(a) concentrations and angiographically assessed coronary atherosclerosis. Dependance on serum LDL levels. Atherosclerosis 1986; 63(3):249-57. Bendz B, Andersen TO and Sandset PM. A New Sensitive Chromogenic Substrate Assay of Tissue Factor Pathway Inhibitor Type 1 Thromb Res 2000 (97): 463-472. Berglund L, Ramakrishnan R. Lipoprotein(a): an elusive cardiovascular risk factor. Arterioscler Thromb Vasc Biol. 2004; (12):2219-26. Bilgen D, Sonmez H, Elmekci H, Ulutin T, Ozturk Z, Kokoglu E, Bayram C, Soner A, Domanic N. The relation ship of TFPI, Lp(a), and oxidized LDL antibody levels in patients with coronaty artery disease. Clin Biochem 2005; 38: 92-96. Bjorn B, Trine OA, Sandset PM. A new sensitive chromatogenic substrate assay of tissue factor pathway inhibitor type 1. Thrombosis research. 2000 Mar 15;97(6):463-72. Boerwinkle E, Leffert CC, Lin J, Lackner C, Chiesa G, Hobbs HH. Apolipoprotein(a) gene accounts for greater than 90% of the variation in plasma lipoprotein(a) concentrations. J Clin Invest. 1992;90(1):52-60. Caplice NM, Mueske CS, Kleppe LS, Simari RD. Presence of tissue factor pathway inhibitor in human atherosclerotic plaques is associated with reduced tissue factor activity. Circulation. 1998; 98(11):1051-7. Caplice NM, Panetta C, Peterson TE, Kleppe LS, Mueske CS, Kostner GM, Broze GJ Jr, Simari RD. Lipoprotein (a) binds and inactivates tissue factor pathway inhibitor: a novel link between lipoproteins and thrombosis. Blood. 2001; 98(10):2980

84
Castelli, W P, R J Garrison, P W Wilson, R D Abbott, S Kalousdian, et W B Kannel. Incidence of coronary heart disease and lipoprotein cholesterol levels. The Framingham Study . JAMA: 1986; 256 (20): 2835-2838 Corsetti JP, Ryan D, Rainwater DL, Moss AJ, Zareba W, Block RC, Sparks CE. Lp(a) and risk of recurrent cardiac events in obese postinfarction patients. Obesity 2008;16(12):27:17-22. Danesh J, Collins R, Peto R. Lipoprotein(a) and coronary heart disease. Meta-analysis of prospective studies. Circulation. 2000 ;102(10):1082-5 Gambhir, J K, H Kaur, D S Gambhir, et K M Prabhu. Lipoprotein(a) as an independent risk factor for coronary artery disease in patients below 40 years of age Indian heart journal 52, no. 4 (août 2000): 411-415 Hancock MA, Boffa MB, Marcovina SM, Nesheim ME, Koschinsky ML. Inhibition of plasminogen activation by lipoprotein(a): critical domains in apolipoprotein(a) and mechanism of inhibition on fibrin and degraded fibrin surfaces. J Biol Chem. 2003; 278(26):23260-9. Kagawa A, Azuma H, Akaike M, Kanagawa Y, Matsumoto T. Aspirin reduces apolipoprotein(a) (apo(a)) production in human hepatocytes by suppression of apo(a) gene transcription. J Biol Chem. 1999; 26;274(48):34111-5. Maeda, S, Abe A, Seishima M, Makino k, Noma A, Kawade M. Transient changes of serum lipoprotein(a) as an acute phase protein Atherosclerosis 1989 ; 78, no. 2-3: 145-150. McLean JW, Tomlinson JE, Kuang WJ, Eaton DL, Chen EY, Fless GM, Scanu AM, Lawn RM. cDNA sequence of human apolipoprotein(a) is homologous to plasminogen Nature. 1987;330(6144):132-7. Marcovina SM, Albers JJ, Scanu AM, Kennedy H, Giaculli F, Berg K, Couderc R, Dati F, Rifai N, Sakurabayashi I, Tate JR, Steinmetz A. Use of a reference material proposed by the international federation of Clinical Chemistry and Laboratory Medicine to evaluate anatycal methods for the determination of plasma lipoprotein(a). Clin Chem.2000 Dec;46(12):1956-67 Nisio MD, ten Wolde M, Meijers JCM, Buller HR. Effects of high plasma lipoprotein (a) levels on tissue factor pathway inhibitor and the protein C pathway. J Thromb Haemost. 2005; (9):2123-5. Noma A, Abe A, Maeda S et al. Lp(a):An acute-phase reactant? Chem Phys Lipids 1994;67/68:411_417. Park HY, Nabita T, Natsu Y, Kobayashi S, Masuda J Effects of apolipoprotein A gene polymorphisms on lipoprotein (a) concentrations in Japanese.

85
Clin Exp Pharmacol Physiol 1999; 26: 304-8. Rana JS, Mukamal KJ, Morgan JP, Muller JE, Mittleman MA. Obesity and the risk of death after acute myocardial infarction. Am Heart J. 2004 ;147(5):841-6. Ranga GS, Kalra OP, Tandon H, Gambhir JK, Mehrotra G. Effect of aspirin olipoprotein(a) in patients with ischemic stroke. J Stroke Cerebrovasc Dis. 2007 16(5):220-4. Woodward M, Rumley A, Welsh P, MacMahon S, Lowe G. A comparison of the associations between seven hemostatic or inflammatory variables and coronary heart disease J Thromb Haemost. 2007 ; 5:1795-800 Zakai NA, Katz R, Jenny NS, Psaty BM, Reiner AP, Schwartz SM, Cushman M Inflammation and hemostasis biomarkers and cardiovascular risk in the elderly : the Cardiovascular Health Study. J Thromb Haemost. 2007; 5:1128-35
86
V) TFPI as a primary physiological regulator of bleeding in haemophilia
Haemophilia A and B are severe bleeding disorders caused by deficiency of blood
coagulation factors VIII and IX (FVIII and FIX), respectively. Patients with haemophilia often
suffer from spontaneous bleeding within the musculoskeletal system, such as haemarthrosis,
that can result in disability at a young age if not treated with i.v. infusions of the missing
coagulation factor. Because FVIII and FIX are proteins of the intrinsic pathway, a classical
question in blood coagulation has raised; why do haemophilia patients bleed despite having
a fully functional extrinsic blood coagulation pathway (Broze et al 1992). TFPI (tissue factor
pathway inhibitor) is a potent direct inhibitor of factor Xa and Xa-dependent inhibitor of the
factor VII/tissue factor (TF) complex. With the generation of factor Xa, the inhibitory effect of
TFPI becomes manifest as the factor Xa/TFPI complex prevents further production of factor
Xa and factor IXa by inhibiting the factor VIIa/TF complex (Baugh et al 1998). Under these
circumstances additional factor Xa can only be produced via the alternative pathway,
involving factor IXa and factor VIIIa, factor IXa being generated initially by the action of factor
VIIa/TF and then additionally by the action of factor XIa. Thus, TFPI feedback inhibition of
factor VIIa/TF can explain the clinical need for both extrinsic and intrinsic coagulation
pathways and a deficiency in factor Xa production in haemophiliac plasma. However, the
FXa generated during initiation of coagulation promotes inhibition of TF–VIIa by tissue factor
pathway inhibitor (TFPI), making propagation of the coagulation cascade dependent on the
activity of the FIXa–FVIIIa complex (Broze et al 1992).
Shortly after the discovery of TFPI, in vitro biochemical studies using purified proteins
demonstrated that FXa generation in TF-initiated reactions was significantly reduced by TFPI
when performed in the absence of FVIII and FIX but to a much lesser degree in their
presence, suggesting a central role for TFPI inhibitory activity in the pathogenesis of bleeding
in haemophilia (Nordfang 1991; Welsch 1991; Van’t Verr 1994). Lack of TFPI inhibition of
TF–FVIIa might consequently compensate for FIX or FVIII deficiency and mitigate bleeding in
patients with haemophilia. It has been shown that anti-TFPI antibodies shortened diluted
tissue factor clotting time and activated partial thromboplastin time (aPTT) in plasma samples
drawn 15 min after anti-TFPI antibody infusion into haemophiliac rabbits, suggesting that
blocking TFPI at least partly normalizes the bleeding disorder (Erhardtsen et al 1995). To
further investigate the physiological mechanisms through which TFPI modulates bleeding in
hemophilia, Maroney and al (2012) undertook studies of genetically altered mice with
combined FVIII deficiency and TFPI deficiency. The presence of FVIII deficiency did not
rescue the embryonic lethal phenotype of TFPI null (TFPI-/-) mice, and decreased TFPI
87
plasma levels in TFPI+/- mice did not alter the bleeding phenotype of Factor VIII null (F8-/-)
mice as assessed using whole-blood TEG and tail bleeding assays. Thus, a 50% reduction in
TFPI activity is not sufficient to alter haemophilia bleeding in this mouse model (Maroney
2012). When F8-/- mice were transplanted with fetal liver cells from Tfpi-/- embryos, they had
significantly less blood loss in tail bleeding assays and significantly larger clot volume
following vascular injury than mice transplanted with fetal liver cells from Tfpi+/+ embryos.
These data suggest that TFPI present within the platelets accumulating at the site of vascular
injury, is a physiological modulator of bleeding in mice with haemophilia A. The same group
demonstrated that mice lacking hematopoietic TFPI have increased thrombus growth
following electrolytic vascular injury (Maroney et al 2011). Based on these findings, they
suggested that a physiological activity of platelet TFPI is the inhibition of blood-borne TF
procoagulant activity accumulating within a growing thrombus (Maroney et al 2011).
1) Free TFPI levels in haemophilia patients
Are the differences of haemorragic manifestations between haemophilia patients A and B
related to different TFPI levels in these 2 groups of patients?
1a) Background
A lower incidence of bleeding in haemophilia B patients than in haemophilia A
patients has been consistently reported (Shulman et al 2008, Pai et al 2005, Ludlam et al
2000). Overall admission rates for patients with haemophilia B are two to three times lower
than for those with haemophilia A at all levels of severity (Ludlam et al 2000). Moreover, the
haemophilia severity score has been shown to be higher in patients with severe haemophilia
A than in those with severe haemophilia B (Shulman et al 2008). This finding is consistent
with the report that patients with haemophilia A bled more often and appeared to make more
frequent use of factor concentrate than those with haemophilia B (Pai et al 2005). The
reason for this difference in haemorrhagic manifestation was not identified.
We had hypothesized that a potential scientific basis for the phenotypic variations
observed between haemophilia A and B patients could be related to a difference in TFPI
levels
The aim of our study was to compare TFPI levels in haemophilia A and B patients
irrespective of the severity of factor VIII or factor IX deficiency.
1b) Patients and Methods
The plasma samples analysed had been collected from 30 haemophilia A patients (13
with minor or moderate and 17 with severe haemophilia) and from 21 haemophilia B patients
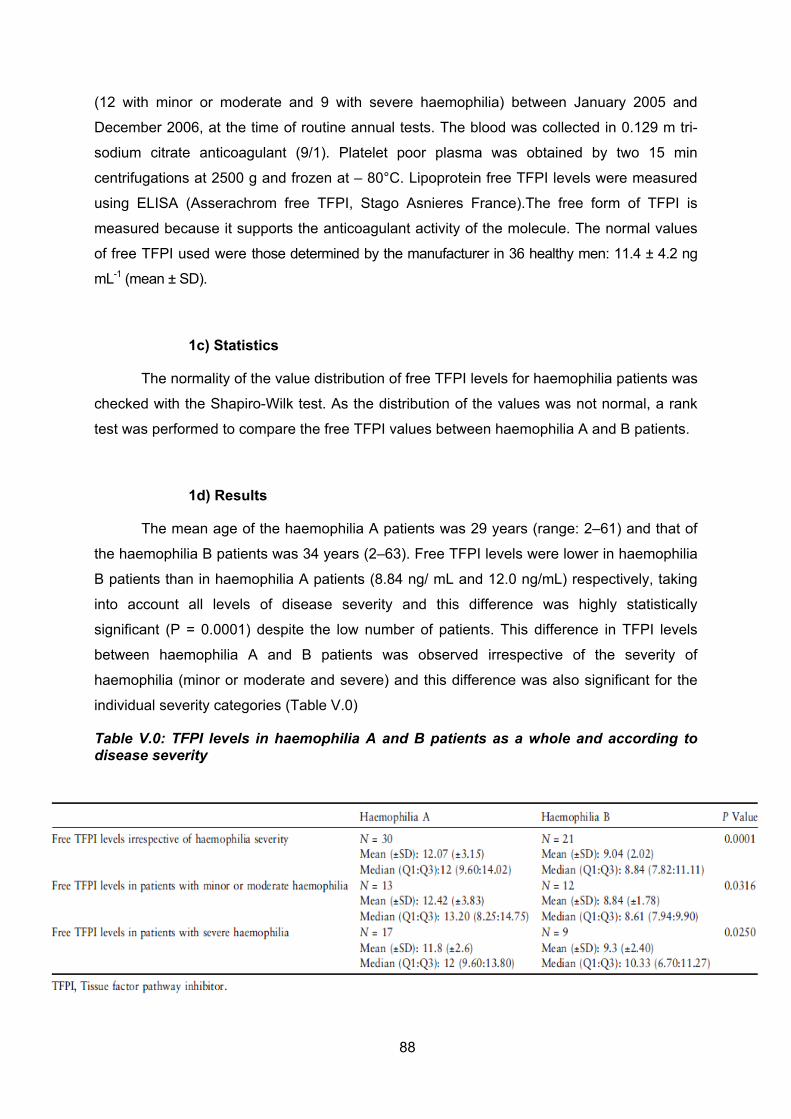
88
(12 with minor or moderate and 9 with severe haemophilia) between January 2005 and
December 2006, at the time of routine annual tests. The blood was collected in 0.129 m tri-
sodium citrate anticoagulant (9/1). Platelet poor plasma was obtained by two 15 min
centrifugations at 2500 g and frozen at – 80°C. Lipoprotein free TFPI levels were measured
using ELISA (Asserachrom free TFPI, Stago Asnieres France).The free form of TFPI is
measured because it supports the anticoagulant activity of the molecule. The normal values
of free TFPI used were those determined by the manufacturer in 36 healthy men: 11.4 ± 4.2 ng
mL-1 (mean ± SD).
1c) Statistics
The normality of the value distribution of free TFPI levels for haemophilia patients was
checked with the Shapiro-Wilk test. As the distribution of the values was not normal, a rank
test was performed to compare the free TFPI values between haemophilia A and B patients.
1d) Results
The mean age of the haemophilia A patients was 29 years (range: 2–61) and that of
the haemophilia B patients was 34 years (2–63). Free TFPI levels were lower in haemophilia
B patients than in haemophilia A patients (8.84 ng/ mL and 12.0 ng/mL) respectively, taking
into account all levels of disease severity and this difference was highly statistically
significant (P = 0.0001) despite the low number of patients. This difference in TFPI levels
between haemophilia A and B patients was observed irrespective of the severity of
haemophilia (minor or moderate and severe) and this difference was also significant for the
individual severity categories (Table V.0)
Table V.0: TFPI levels in haemophilia A and B patients as a whole and according to disease severity

89
1e) Discussion
This study therefore indicates that haemophilia B patients have lower free TFPI levels
than haemophilia A patients. As blocking TFPI facilitates haemostasis initiated by FVIIa/TF,
thereby compensating for impaired FIX/FVIII-dependent coagulation and reducing bleeding
(Erhardtsen E et al 1995), the fact that haemophilia B patients bleed less often than
haemophilia A patients could be related to the lower level of free TFPI measured in these
patients. The decrease of free TFPI levels in haemophilia B patients could compensate the
lower level of FVIIa because of the lack of FIX, FIXa being the principal in vivo activator of
FVII [Wildgoose et al 1992]. Not all haemophilia patients with the same FVIII or FIX levels
present similar clinical signs. Moreover, it has also been shown that thrombin generation is
not always related to FVIII or FIX levels in haemophilia patients (Dargaud Y et al 2005). This
thrombin generation difference might be related to a difference in TFPI levels as well.
1f) Conclusion
We showed in this study that a potential scientific basis for the phenotype variations
observed between haemophilia A and B patients could be related to a difference in TFPI
levels, which are lower in haemophilia B patients than in haemophilia A patients, regardless
of the severity of factor VIII or IX deficiency.
These results have been published (Haemophilia 2011).
90
2) Free TFPI levels and thrombin generation in haemophilia
patients
Is there in haemophilia patients:
- A relation between TFPI levels and thrombin generation parameters?
- A relation between TFPI levels and haemorrhagic manifestations?
- A correction of thrombin generation registered in PRP in presence of an anti TFPI antibody?
We know that, for a same level of anti-haemophilic factor, the haemorrhagic manifestations
vary from one patient to another (van den Berg at al 2007, Shetty et al 2007, Van Dijk et al
2007); and it has already been shown in haemophiliac patients that thrombin generation is
not always related to factor VIII or IX levels (Dargaud et al 2005, Santagostino et al 2010).
We would like to answer the following questions:
Is the difference in thrombin generation profile observed from one patient to an other (in
each group of haemophilia A and B severe, moderate and minor) related to a difference
in TFPI levels? In other words is there a correlation between free TFPI levels and the
different parameters of thrombin generation?
Is there a relation between free TFPI levels and the clinical severity (estimated with
clinical haemorrhage score) of haemophilia (in each group of haemophilia A and B
severe, moderate and minor)?
Is TFPI neutralization by an anti TFPI antibody responsible for a correction of thrombin
generation in PRP of haemophilia patients?
To answer these questions we are currently conducting a study that has been approved by
the Ethical Comittee (CPP St Etienne Sud Est I). Four haemophilia centers take part to the
study: University Hospitals of St Etienne, Lyon, Marseille and Dijon.
The objectives of this study are:
- Looking for a relation between free TFPI levels and the different parameters of
thrombin generation assay.
- Looking for a relation between thrombin generation parameters and the
haemorrhage score of haemophilia patients.
- Looking for a relation between TFPI levels and haemorrhage score in haemophilia A
patients.
91
- Looking for a relation between TFPI levels and haemorrhage score in haemophilia B
patients.
- Comparing the correction of thrombin generation between PPP and PRP when
neutralising TFPI with a TFPI antibody and define for each patient the concentration of
antibody needed to obtain an ETP (endogenous thrombin potential) greater than 1300 on
PRP (this value being considered as the lower value of the normal range).
2a) Patients and methods
Patients
The following patients are included:
- Haemophila A and B patients between 18 and 65 years old, whatever the severity of their
disease, who have signed the informed consent form.
- On-demand therapy patients or on prophylaxis patients. Patients can be included if the last
factor VIII infusion occurred more than 72 hours before blood collection or if the last factor IX
infusion occurred more than 96 hours before blood collection. The following patients are not
included into the study:
- Haemophilia patients under 18, patients with data over the last 5 years at least unavailable,
- Patients with an inhibitor at any time before or during the study period,
- Patients on prophylaxis who received factor VIII concentrate less than 72 hours or factor IX
concentrate less than 96 hours before blood collection.
Material and Methods
Blood is collected when patients come for a routine visit at the Haemophilia Center.
Three S-Monovette tubes (Sarstedt) containing 0.106 Mol/l trisodium citrate and CTI (Corn
Trypsin Inhibitor) and 2 tubes containing 0.129 M tri- sodium citrate are taken.
Platelet-rich plasma is obtained by centrifugation of the 3 S-Monovette at 150 G for 10
minutes at room temperature, with collection from the upper half of the PRP fraction.
Because there is no variation of thrombin generation when platelet count is above 150 g/L,
the platelet count is not adjusted to 150 G/L (Hemker et al 2003).
Platelet-poor plasma is obtained by a double centrifugation of the 3 S-Monovette and of the 2
citrate tubes at 2500 G for 15 minutes at room temperature and frozen at -80° C.
Free TFPI levels are measured by ELISA (Asserachrom free TFPI, Stago Asnières France)
according to the manufacturer’s recommendations and as described in the techniques
92
section (annexe 1). Free TFPI normal values have already been determined in normal
controls in a previous study (annexe 1).
Thrombin generation is registered in PRP in a Fluoroscan Ascent fluorometer (Thermolab
systems OY, Helsinki, Finland) less within two hours after blood collecting.
Thrombin generation is registered in frozen PPP in a Fluoroscan Ascent fluorometer
(Thermolab systems OY, Helsinki, Finland).
Thrombin generation is measured using the CAT system (Hemker et al 2003).
Increasing amounts of anti human TFPI antibody were added to PRP and to PPP in order to
obtain anti TFPI Ab concentrations ranging from 0.25 to 4.0 µg.mL-1.
Thrombin generation assays in PPP and in PRP are detailed in Annexe 5.
All the clinical data that are collected are listed in annexe 7
In severe haemophilia patients we will use a composite scoring system designed to reflect
the clinical severity of haemophilia and named HSS for Haemophilia Severity Score
(Schulman et al 2008). It consists in the sum of three components: annual incidence of joint
bleeds, orthopaedic joint score and annual factor utilization (annexe 8).
Statistical analysis
Spearman coefficients were calculated to evaluate the correlations between Free
TFPI levels and the thrombin generation parameters. A p-value less than 0.05 was
considered as statistically significant. Correlation of basal ETP level / ETP correction and
correlation of basal LT / LT correction were made using R square.
We will also search for a correlation between thrombin generation parameters and
haemorrhage scores for severe haemophilia patients using either R-square or Spearman
coefficients (depending on the normality of values distribution)
We will search for a correlation between TFPI levels and haemorrhagic score for severe
haemophilia A patients and for severe haemophilia B patients using the least squares
method .All analyses will be performed on the available data from the patients included in the
study.
All analyses will be performed using SAS software (SAS Institute, Cary, NC, USA).

93
2b) Results
We had previously looked at the influence of TFPI on the different parameters of
thrombin generation assay. When TFPI was added in platelet poor plasma at a concentration
of 80 ng/ mL, ETP and peak were decreased. At the same time the lag time was highly
prolonged and the velocity of thrombin generation was slowed down. (annexe 5)
Lag time in PPP was not prolonged in haemophilia patients; however lag time in PRP
was much prolonged in haemophilia patients at it is well illustrated in figures V.1 and V.2.
Figure V.2: Comparison of thrombogram profiles between PRP and PPP in a severe hemophilia A patient. ( )
0
50
100
0 20 40 60 80
1-02_PPP
1-02_PRP
Figure V.2: Comparison of thrombogram profiles between PRP and PPP in a severe hemophilia B patient.
0
50
100
0 20 40 60 80
1-03_PPP
1-03_PRP
48 patients have been enrolled into the study until now. Only the results from St
Etienne CHU laboratory will be given here.
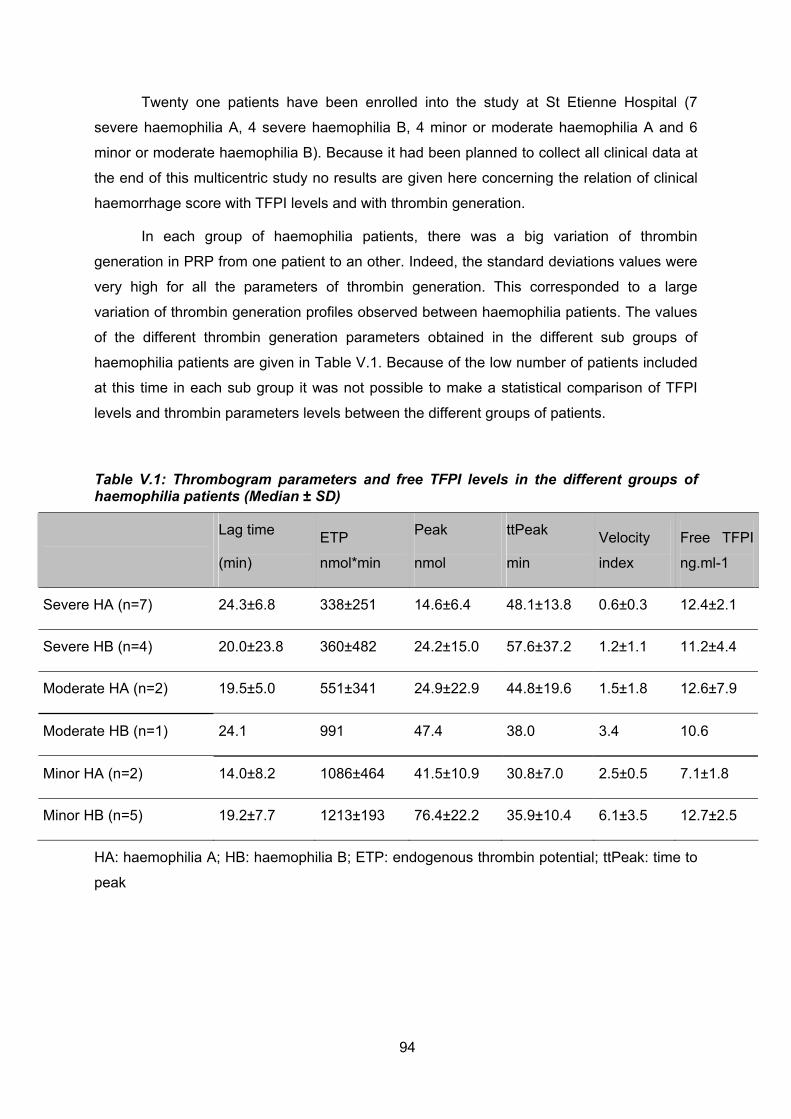
94
Twenty one patients have been enrolled into the study at St Etienne Hospital (7
severe haemophilia A, 4 severe haemophilia B, 4 minor or moderate haemophilia A and 6
minor or moderate haemophilia B). Because it had been planned to collect all clinical data at
the end of this multicentric study no results are given here concerning the relation of clinical
haemorrhage score with TFPI levels and with thrombin generation.
In each group of haemophilia patients, there was a big variation of thrombin
generation in PRP from one patient to an other. Indeed, the standard deviations values were
very high for all the parameters of thrombin generation. This corresponded to a large
variation of thrombin generation profiles observed between haemophilia patients. The values
of the different thrombin generation parameters obtained in the different sub groups of
haemophilia patients are given in Table V.1. Because of the low number of patients included
at this time in each sub group it was not possible to make a statistical comparison of TFPI
levels and thrombin parameters levels between the different groups of patients.
Table V.1: Thrombogram parameters and free TFPI levels in the different groups of haemophilia patients (Median ± SD)
Lag time
(min)
ETP
nmol*min
Peak
nmol
ttPeak
min
Velocity
index
Free TFPI
ng.ml-1
Severe HA (n=7) 24.3±6.8 338±251 14.6±6.4 48.1±13.8 0.6±0.3 12.4±2.1
Severe HB (n=4) 20.0±23.8 360±482 24.2±15.0 57.6±37.2 1.2±1.1 11.2±4.4
Moderate HA (n=2) 19.5±5.0 551±341 24.9±22.9 44.8±19.6 1.5±1.8 12.6±7.9
Moderate HB (n=1) 24.1 991 47.4 38.0 3.4 10.6
Minor HA (n=2) 14.0±8.2 1086±464 41.5±10.9 30.8±7.0 2.5±0.5 7.1±1.8
Minor HB (n=5) 19.2±7.7 1213±193 76.4±22.2 35.9±10.4 6.1±3.5 12.7±2.5
HA: haemophilia A; HB: haemophilia B; ETP: endogenous thrombin potential; ttPeak: time to
peak

95
In a first time we studied the relation between free TFPI and the different thrombin
generation parameters in the different groups of haemophilia patients (Table V.2).
Table V.2: Relation between free TFPI levels and thrombogram’s parameters in the different groups of haemophilia patients
Patients group Thrombogram parameters
Rhô2 Spearman
f
p-value
ETP 0.114 0.134
Thrombin peak 0.076 0.227
Velocity index 0.117 0.129 All hemophilic patients (n=21)
Lag time 0.263 0.017
ETP 0.556 0.0085
Thrombin peak 0.529 0.011
Velocity index 0.640 0.003 HA patients, all severity (n=11)
Lag time 0.529 0.011
ETP 0.004 0.867
Thrombin peak 0.027 0.651
Velocity index 0.050 0.533 HB patients, all severity (n=10
Lag time 0.304 0.098
ETP 0.412 0.033
Thrombin peak 0.167 0.211
Velocity index 0.278 0.095 Severe HA+HB patients (n=11)
Lag time 0.64 0.003
ETP 0.016 0.726
Thrombin peak 0.00004 0.986
Velocity index 0.0003 0.960
Minor, moderate HA+HB patients (n=10)
Lag time 0.155 0.260

96
We found no relation between ETP and free TFPI (R2 = 0.114; p = 0.134) in all 21
haemophilia patients. However when we studied this relation into haemophilia A and B
separately we found a statistically significant relation between free TFPI and ETP in
haemophila A patients (R2 = 0.556; p = 0.0085) (Figure V.3); this relationship does not exist
in haemophilia B patients (R2 = 0.004; p= 0.867). When haemophila A and B are mixed
together, there is a good correlation between free TFPI and ETP in severe haemophilia (R2 =
0.412; p = 0.033) (Figure V.4), that we did not find any more in minor and moderate
haemophilia (R2 = 0.016; p = 0.726);
Figure V.3: Relationship between free TFPI and ETP in haemophilia A patients (n= 11)
R2 = 0.556p= 0.0085
0200400600800
1000120014001600
0 5 10 15 20
Free TFPI ng.mL-1
ET
P n
mo
l*m
in
Figure V.4: Relationship between free TFPI and ETP in severe haemophilia (A and B) (n = 11)
R2 = 0.412p= 0.033
0
200
400
600
800
1000
0 5 10 15 20
Free TFPI ng.mL-1
ET
P n
mo
l*m
in

97
We found no relation between peak of thrombin and free TFPI (R2 = 0.076. p = 0.227) in all
21 haemophilia patients. However when we studied this relation into haemophilia A and B
separately we found a relation between free TFPI and Peak in haemophila A patients (R2 =
0.529; p = 0.011) (Figure V.5); this relationship does not exist in haemophilia B patients (R2 =
0.027; p = 0.651). When haemophilia A and B are mixed together, there is no correlation
between free TFPI and Peak of thrombin neither in the group of severe haemophilia patients
(R2 = 0.167; p= 0.211) nor in the group of minor and moderate haemophilia patients (R2 =
0.00004; p = 0.986).
Figure V.5: Relationship between free TFPI and thrombin peak in haemophilia A patients (n= 11).
R2 = 0.529p= 0.011
0
20
40
60
0 5 10 15 20
Free TFPI ng.mL-1
Th
rom
bin
pea
k n
mo
l
We found no relation between the velocity index and free TFPI (R2 = 0.117; p= 0.129)
in all 21 haemophilia patients taken together whatever the type and the severity of the
disease. However when we studied this relation into haemophilia A and B separately we
found a relation between free TFPI and velocity index in haemophila A patients (R2 = 0.640;
p= 0.003) (Figure V.6); this relationship does not exist in haemophilia B patients (R2 = 0.050;
p= 0.533). When haemophilia A and B are mixed together, there is a low correlation between
free TFPI and the velocity index in severe haemophilia (R2 = 0.278; p = 0.095) that we did
not find any more in minor and moderate haemophilia (R2 = 0.0003; p = 0.960).
Figure V.6: Correlation between free TFPI and velocity index in haemophilia A (n = 11)
R2 = 0.640p= 0.003
0.0
1.0
2.0
3.0
4.0
0 5 10 15 20
Free TFPI ng.mL-1
Vel
oci
ty i
nd
ex
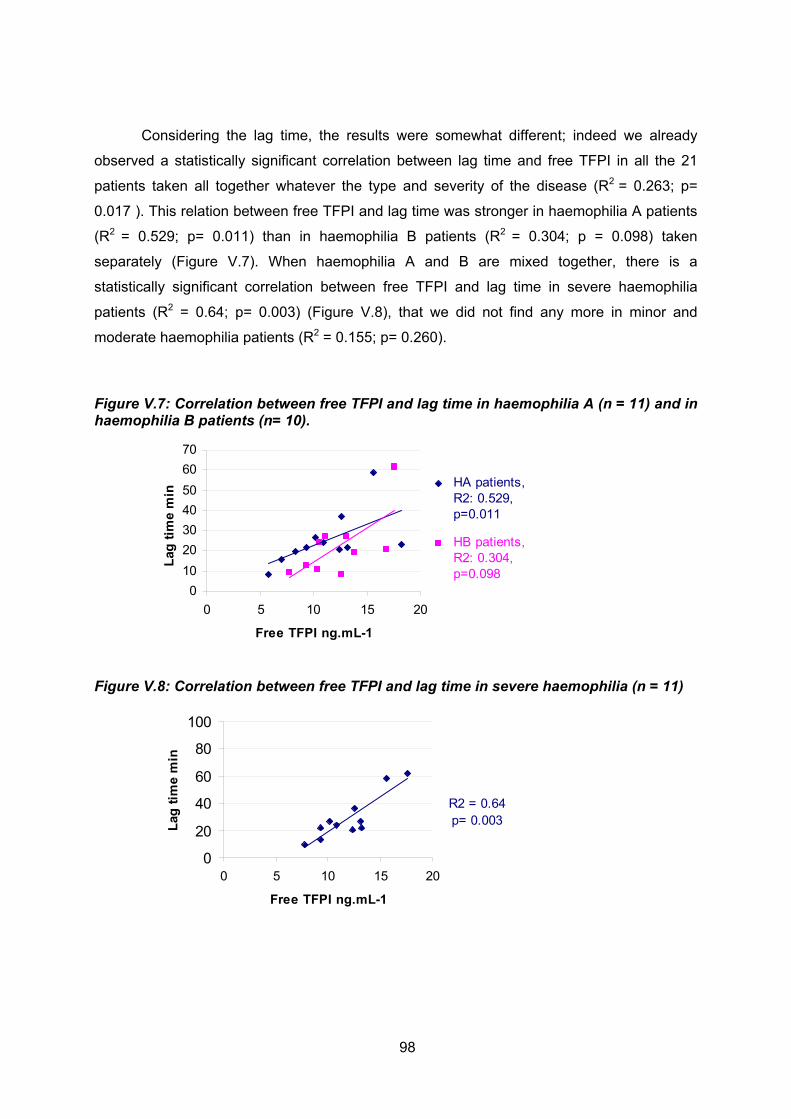
98
Considering the lag time, the results were somewhat different; indeed we already
observed a statistically significant correlation between lag time and free TFPI in all the 21
patients taken all together whatever the type and severity of the disease (R2 = 0.263; p=
0.017 ). This relation between free TFPI and lag time was stronger in haemophilia A patients
(R2 = 0.529; p= 0.011) than in haemophilia B patients (R2 = 0.304; p = 0.098) taken
separately (Figure V.7). When haemophilia A and B are mixed together, there is a
statistically significant correlation between free TFPI and lag time in severe haemophilia
patients (R2 = 0.64; p= 0.003) (Figure V.8), that we did not find any more in minor and
moderate haemophilia patients (R2 = 0.155; p= 0.260).
Figure V.7: Correlation between free TFPI and lag time in haemophilia A (n = 11) and in haemophilia B patients (n= 10).
0
10
20
30
40
50
60
70
0 5 10 15 20
Free TFPI ng.mL-1
Lag
tim
e m
in
HA patients,R2: 0.529,p=0.011
HB patients,R2: 0.304,p=0.098
Figure V.8: Correlation between free TFPI and lag time in severe haemophilia (n = 11)
R2 = 0.64p= 0.003
0
20
40
60
80
100
0 5 10 15 20
Free TFPI ng.mL-1
Lag
tim
e m
in

99
Effect of anti TFPI antibody on thrombin generation in haemophilia patients
In a second time we studied the effect of an anti TFPI antibody in PRP on the
different parameters of thrombin generation. Figures 9 and 10 shows the correction of the
thrombin generation as a function of the anti TFPI antibody concentration in severe
haemophilia A patients (Figure V.9) and in severe haemophilia B patients (Figure V.10).
Figure V.9: Effect of anti TFPI antibody on thrombin generation (in PRP) in a severe hemophilia A patient.
0
40
80
120
160
0 20 40 60 80
Time min
nm
ol
Th
rom
bin
1-19_Ab4.0
1-19_Ab2.0
1-19_Ab1.5
1-19_Ab1.0
1-19_Ab0.5
1-19_Ab0.25
1-19 CAC
Figure V.10: Effect of anti TFPI antibody on thrombin generation (in PRP) in a severe hemophilia B patient
0
40
80
120
160
0 20 40 60 80
Time, min
nm
ol
Th
rom
bin
1-13_Ab4.0
1-13_Ab1.5
1-13_Ab1.0
1-13_Ab0.5
1-13_Ab0.25
1-13 DOC

100
At a concentration of 1 µg/ mL to 1.5 µg/ mL the anti TFPI antibody reached a
maximum effect on the correction of the different parameters of thrombin generation
whatever the severity of the disease in haemophilia A patients (Tables V.3a and V.3b).
Indeed for these patients we observed a kind of plateau with anti TFPI antibody
concentrations between 1.5 and 4µg/mL
Table V.3: Correction of thrombin generation in haemophilia A patients as a function of the anti TFPI concentrations (median ± SD)
3a) In severe HA patients group (n=7)
Anti H TFPI µg.mL-1 0 0.25 0.5 1.0 1.5 2.0 4.0
ETP (nmol*min) 338±251 891±348 1446±392 1837±402 1848±415 2005±439 2099±495
Peak (nmol) 14.6±6.4 36.4±16.0 72.1±24.7 120.3±27.1 143.3±29.6 145.6±30.8 155.1±32.7
Velocity index 0.6±0.3 1.7±0.8 4.0±1.5 8.5±2.0 11.2±2.7 11.4±2.9 12.1±3.3
Lag time (min) 24.3±6.8 11.2±2.7 8.7±1.9 6.6±1.1 5.9±1.1 5.8±1.2 5.8±1.1
3b) In minor and moderate HA patients group (n=4)
Anti H TFPI µg.mL-1 0 0.25 0.5 1.0 1.5 2.0 4.0
ETP (nmol*min) 775±454 1290±299 1512±118 1712±106 1725±98 1711±182 1822±160
Peak (nmol) 37.5±17.5 70.3±21.9 91.1±18.4 112.1±14.1 118.7±14.0 113.3±15.1 123.2±13.8
Velocity index 2.4±1.2 4.9±1.9 7.0±2.2 9.7±2.2 11.1±2.0 10.6±2.3 11.3±2.2
Lag time (min) 17.9±6.4 9.3±2.3 7.4±0.7 6.0±0.5 5.7±0.6 5.8±0.4 5.8±0.2

101
In severe haemophilia B patients peak and velocity index did not reach a plateau and
continued to increase with increasing concentrations of anti TFPI antibody. In minor and
moderate Haemophilia B patients no plateau was observed for index velocity when using
increased anti TFPI antibody concentrations (table V.4a and V.4b).
Table V.4: Correction of thrombin generation in haemophilia B patients as a function of the anti TFPI concentrations (median ± SD)
4a) In severe HB patients group (n=7)
Anti H TFPI µg.mL-1 0 0.25 0.5 1.0 1.5 2.0 4.0
ETP (nmol*min) 360±482 829±565 933±619 1157±372 1246±319 1282±293 1374±322
Peak (nmol) 24.2±15.0 41.1±34.3 54.1±44.4 75.9±38.3 93.2±33.6 104.7±27.8 123.6±31.3
Velocity index 1.2±1.1 2.8±2.7 4.5±4.5 7.2±5.7 9.4±5.4 10.7±4.5 13.9±5.5
Lag time (min) 20.0±23.8 10.4±11.7 9.4±9.1 8.3±4.3 7.7±3.4 7.1±2.8 6.8±2.4
4b) In minor and moderate HB patients group (n=6)
Anti H TFPI µg.mL-1
0 0.25 0.5 1.0 1.5 2.0 4.0
ETP (nmol*min) 1188±198 1452±171 1652±162 1822±245 1797±185 1831±228 1942±214
Peak (nmol) 71.0±23.0 106.7±21.4 122.0±20.8 149.8±25.6 148.2±24.7 138.5±23.5 159.1±24.4
Velocity index 5.5±3.4 9.3±4.6 10.2±5.8 16.9±6.9 19.0±7.7 18.3±7.6 22.2±7.0
Lag time (min) 19.8±7.5 12.7±3.7 8.5±2.4 6.2±1.6 5.4±1.4 6.2±1.4 5.6±1.3

102
The effect of the anti TFPI antibody on the correction of thrombin generation seemed
to be better in severe haemophilia A patients compared to severe haemophilia B patients
especially on the correction of ETP and peak (figures V.11 and V.12).
Figure V.11: Difference in ETP correction between severe haemophilia A and B patients as a function of anti TFPI antibody concentrations (0 to 2.0 µg/ mL)
0
500
1000
1500
2000
2500
0 0.5 1 1.5 2
anti Human TFPI (µg.ml-1)
ET
P n
mo
l th
rom
bin
median severe HA (n=7)
median severe HB (n=4)
Figure V.12: Difference in peak correction between severe haemophilia A and B patients as a function of anti TFPI antibody concentrations (0 to 2.0 µg/ mL)
0
50
100
150
200
0 0.5 1 1.5 2
anti Human TFPI (µg.ml-1)
Pea
k (n
mo
l th
rom
bin
)
median severe HA (n=7)
median severe HB (n=4)

103
There was an inverse correlation between the basal levels of ETP and the importance
of ETP correction (R2 = 0.524, p = 0.001); indeed lower is the ETP basal value, higher is the
delta ETP defined as ETP with anti TFPI antibody – Basal ETP( figure V.13).
Figure V.13: Relation between basal ETP and ETP increase (delta ETP) when 1µg.mL-1 anti TFPI Ab was added.
There was also a good correlation between basal LT and LT obtained when anti TFPI
anti body (1µg/ml) was applied (R2 = 0.463; p= 0.0005) . We could observe an important
effect of anti TFPI antibody on the correction of LT: indeed as the majority of basal LT values
were between 10 and 30 minutes, the majority of LT values obtained when anti TFPI
antibody (1µg/ml) was added were between 5 and 10 minutes (figure V.14).
Figure V.14: Relation between basal LT and LT measured when anti TFPI antibody (1µg.mL-1) was added.

104
We could observe the same important effect of anti TFPI antibody on the correction of the
velocity index: indeed the majority of basal velocity index values were between 0.2 and 3.0,
while the majority of velocity index values obtained when anti TFPI antibody (1µg/ml) was
applied were between 3 and 15 (figure V.15).
Figure V.15: Relation between basal velocity index and velocity index measured when anti TFPI antibody (1µg.mL-1) was added.
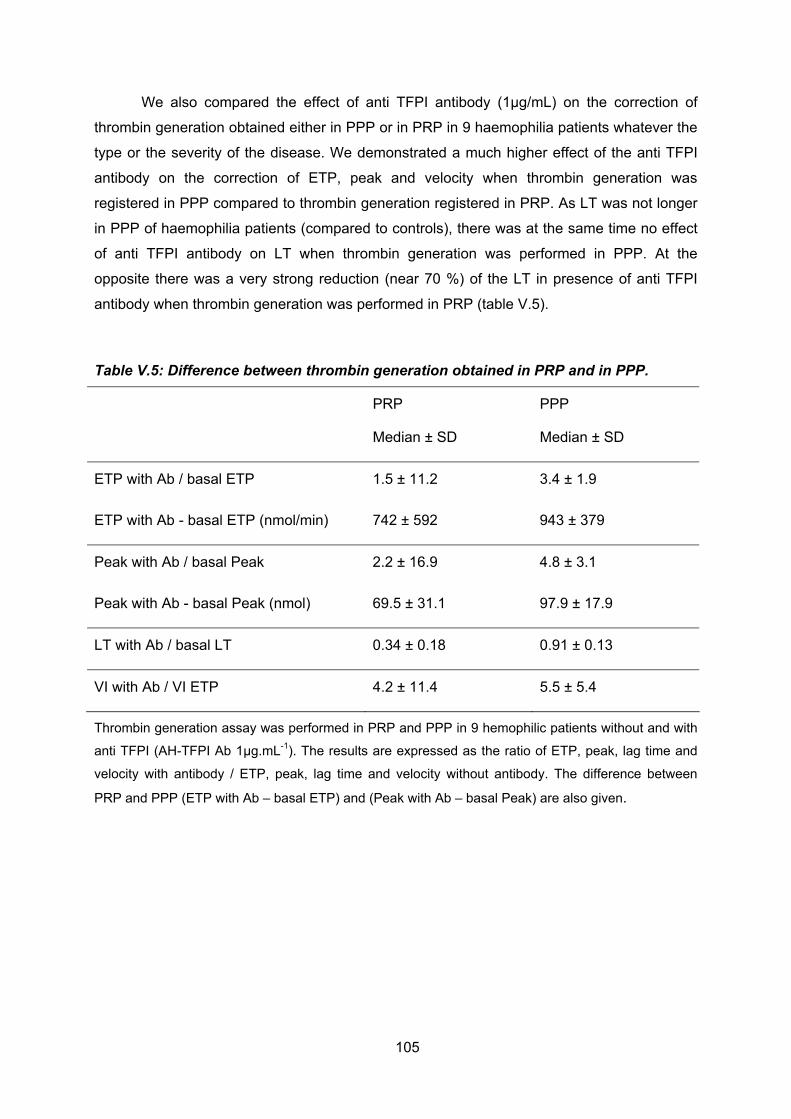
105
We also compared the effect of anti TFPI antibody (1µg/mL) on the correction of
thrombin generation obtained either in PPP or in PRP in 9 haemophilia patients whatever the
type or the severity of the disease. We demonstrated a much higher effect of the anti TFPI
antibody on the correction of ETP, peak and velocity when thrombin generation was
registered in PPP compared to thrombin generation registered in PRP. As LT was not longer
in PPP of haemophilia patients (compared to controls), there was at the same time no effect
of anti TFPI antibody on LT when thrombin generation was performed in PPP. At the
opposite there was a very strong reduction (near 70 %) of the LT in presence of anti TFPI
antibody when thrombin generation was performed in PRP (table V.5).
Table V.5: Difference between thrombin generation obtained in PRP and in PPP.
PRP
Median ± SD
PPP
Median ± SD
ETP with Ab / basal ETP 1.5 ± 11.2 3.4 ± 1.9
ETP with Ab - basal ETP (nmol/min) 742 ± 592 943 ± 379
Peak with Ab / basal Peak 2.2 ± 16.9 4.8 ± 3.1
Peak with Ab - basal Peak (nmol) 69.5 ± 31.1 97.9 ± 17.9
LT with Ab / basal LT 0.34 ± 0.18 0.91 ± 0.13
VI with Ab / VI ETP 4.2 ± 11.4 5.5 ± 5.4
Thrombin generation assay was performed in PRP and PPP in 9 hemophilic patients without and with
anti TFPI (AH-TFPI Ab 1µg.mL-1). The results are expressed as the ratio of ETP, peak, lag time and
velocity with antibody / ETP, peak, lag time and velocity without antibody. The difference between
PRP and PPP (ETP with Ab – basal ETP) and (Peak with Ab – basal Peak) are also given.

106
0
50
100
150
200
0 20 40 60
Time, min
Th
rom
bin
, n
mo
l
1-06 PRP
1-06_Ab 0.25
1-06_Ab 0.5
1-06_Ab 1.0
1-06_Ab 2.0
1-06_Ab 4.0
0
50
100
150
200
0 10 20 30 40
Time, min
Th
rom
bin
, n
mo
l
1-06_PPP
1-06_Ab 0.25
1-06_Ab 0.5
1-06_Ab 1.0
1-06_Ab 2.0
1-06_Ab 4.0
On figure V.16 we have a nice illustration of the difference in correction of thrombin
generation with different concentrations of anti TFPI Ab obtained either in PRP or in PPP in
an severe haemophilia A patient especially if we consider the LT (figure 17).
Figure V.16: Comparative effect of anti TFPI antibody on thrombin generation obtained either in PRP (a) or in PPP (b) in a severe haemophilia A patient
Thrombograms registered in presence of different concentrations of anti TFPI Ab (final
concentrations: 0.25 to 4.0 µg.mL-1) for the same severe haemophilia A patient.
Figure V.17 : Comparative effect of anti TFPI Ab on the LT between PRP and PPP in a severe haemophilia A patient .
0
5
10
15
20
25
30
0 1 2 3 4
AH TFPI, ng.ml-1
Lag
tim
e, m
in
PRP
PPP

107
2c) Discussion
In severe haemophilia A and B patients thrombin generation can be very different
from one patient to an other. Considering the fact that in every cases, factor VIII or IX is less
than 1% and, because, in severe haemophilia patients, LT and ETP are related to free TFPI
levels, we could speculate that this difference in thrombin generation might be related to
different free TFPI levels among these patients.
We showed that in haemophilia A patients there was a strong correlation between the
different thrombin generation parameters and free TFPI that did not exist in haemophilia B
patients (except perhaps for the lag time). These results are in accordance with our previous
study that showed a higher TFPI level in haemophilia A patients compared to the
haemophilia B patients (Tardy-Poncet et al 2011). We also showed in thrombin generation
assay performed in PRP with low TF concentration that LT was sensitive to free TFPI levels
whatever the type of haemophilia and whatever the severity of the disease. The sensitivity of
LT to TFPI has already been reported (Hackeng et al 2009). In severe haemophilia when
thrombin generation is measured in PPP, the lag time is not so much prolonged compared to
the lag time measured in controls (Duchemin et al 2008). In this study we found that when
thrombin generation was measured in PRP in haemophilia patients the lag time was much
prolonged. That is in accordance with the results of a recent study that implicated platelet
TFPI in mouse as a primary physiological regulator of bleeding in haemophilia (Maroney et al
2012).
The full-length TFPI α carried in platelets is 8-10 % of the total TFPI in blood which is
comparable to the quantity of soluble full-length TFPI α in plasma (Novotny et al 1988). They
showed that stimulation with thrombin or the calcium ionophore A23187 caused human
platelets to release TFPI (Novotny et al 1988). In our assay, when thrombin generation
begins, it probably activates platelets that can release active TFPI. We demonstrated that in
severe haemophilia patients there was a good correlation between free TFPI and all the
parameters of thrombin generation especially with the lag time. Therefore, it is of major
importance to measure thrombin generation in PRP for exploring the role of TFPI in
haemophilia patients.
We studied the effect of an anti human TFPI antibody (for in vitro use only) on
thrombin generation in PRP. We demonstrated that blocking TFPI by an anti TFPI antibody
allows the complete correction of the thrombin generation profile. We found a dose relation
ship between the anti TFPI antibody concentration and the degree of correction of thrombin
generation; indeed at a concentration of 1.0 or 1.5 µg/ mL there was a complete correction of

108
thrombin generation parameters as the values measured were above the normal values
defined in controls (Dargaud et al 2006). Most of the values of thrombin generation
parameters reached a plateau. The presence of this plateau in the dose response curves
was rather reassuring regarding the question on an eventual risk of thrombosis that could be
related to an anti TFPI antibody. We also showed that more severe was the alteration of
basal thrombin generation, more important was the effect of anti TFPI antibody on the ETP
correction. In other words we can speculate that the effect of an anti TFPI antibody will be of
particular interest in severe haemophilia patients. These results are in accordance with the
fact that TFPI was much highly related to thrombin generation parameters in severe
haemophilia patients than in minor or moderate haemophilia patients. We found that the
effect of anti TFPI was much stronger in PPP compared to PRP. These results underlined
again the major influence of TFPI levels in haemophilia patients on the lag time values
obtained in PRP and highlighted the importance of evaluating the efficacy of anti TFPI
antibodies on thrombin generation in haemophilia patients in PRP only.
Numerous anti TFPI molecules are currently in development; they are expected to
enhance and prolong FXa generation in the initiation phase and thereby bypass and
compensate for an inadequate FVIIIa /IXa tenase activity. The monoclonal antibody mAb
2021 by blocking the interaction between FXa and Kunitz- type protease inhibitor domain of
TFPI in a rabbit hemophilia model could constitute a novel haemophilia treatment that has
now entered clinical trials (Hilden et al 2012; Petersen et al 2012). An other TFPI antagonist
aptamer BAX499 (ARC19499) is a polyethylene glycol (PEG)-conjugated aptamer that binds
to TFPI and effectively neutralizes TFPI inhibition of FXa and FXa dependent inhibition of
TF/VIIa. Its efficacy has been demonstrated in vitro in 40 haemophilia patients by rotational
thromboelastometry and by thrombin generation assay performed in PPP that showed a
complete normalization of thrombin generation parameters (Gorczyca et al 2010; Gissel et al
2012). Considering the difference of results that we obtained between PPP and PRP when
evaluating the effect of an anti TFPI antibody we think that it would be more accurate for the
next in vitro evaluation of all these new molecules in the future to perform thrombin
generation in PRP rather than in PPP.
In conclusion: TFPI is an important inhibitor of thrombin generation initiated in
presence of low tissue factor concentration and neutralizing the activity of TFPI represents a
promising treatment concept in patients with hemophilia.

109
References
Baugh RJ, Broze GJ, Krishnaswamy S. Regulation of extrinsic pathway factor Xa formation by tissue factor pathway inhibitor. J Biol Chem 1998; 273: 4378- 4386 Bjorn B, Trine OA, Sandset PM. A new sensitive chromatogenic substrate assay of tissue factor pathway inhibitor type 1. Thromb Res 2000; 15; 97 (6) 463- 72. Broze GJ, Jr. The role of tissue factor pathway inhibitor in a revised coagulation cascade. Semin Hematol 1992; 29(3):159–169. Dargaud Y, Béguin S, Lienhart A, Al Dieri R, Trzeciak C, Bordet JC, Hemker HC, Negrier C. Evaluation of thrombin generating capacity in plasma from patients with haemophilia A and B. Thromb Haemost 2005; 93: 475-480. Dargaud, Yesim, Roger Luddington, et Trevor Baglin Platelet-dependent thrombography: a method for diagnostic laboratories British journal of haematology 134, no. 3 (août 2006): 323-325. Duchemin, J., B. Pan-Petesch, B. Arnaud, M.T. Blouch, et J.F Abgrall. Influence of coagulation factors and tissue factor concentration on the thrombin generation test in plasma . Thromb Haemost 2008; 99:767-73. Erhardtsen E, Ezban M, Madsen MT, Diness V, Glazer S, Hedner U, Nordfang O. Blocking of tissue factor pathway inhibitor (TFPI) shortens the bleeding time in rabbits with antibody induced haemoplilia A. Blood Coagul Fibrinolysis 1995; 6: 388-394. Gorczyca ME, Jilma B, Male C, Reitter S, Gilbert JC, Pabinger I. Inhibition of tissue factor pathway inhibitor (TFPI) by ARC 19499 improves clotting of haemophiliac blood. Pharmacology 2010; 10 (supp) A44 Gissel M, Orfeo T, Foley JH, Butenas S. Effect of Bax499 aptamer on tissue factor pathway inhibitor function and thrombin generation in models of hemophilia. Thromb Res 2012 Aug 27. Epub ahead of print. Hackeng, Tilman M, et Jan Rosing. Protein S as cofactor for TFPI Arteriosclerosis, Thrombosis, and Vascular Biology 29, no. 12 (décembre 2009): 2015-2020. Hemker HC, Giesen P, Dieri RA, Regnault V, de Smedt E, Wagenvoord R, Lecompte T, Beguin S. Calibrated automated thrombin generation measurement in clotting plasma. Pathophysiol Haemost Thromb 2003; 33: 4-15. Hilden I, Lauritzen B, Sorensen BB, Clausen JT, Jespersgaard C, Krogh OK, Breinholt J, Gruhler A, Svensson LA, Petersen HH, Petersen LC, Balling KW, Hansen L, Hermit MB, Egebjerg TE, Friederichsen B, Ezban M, Bjorn SE.

110
Hemostatic effect of a monoclonal antibody mAb2021 blocking the interaction between FXa and TFPI in a rabbit hemophilia model. Blood 2012; 119: 5871-78. Ludlam CA, Lee RJ, Prescott RJ, Andrews J, Kirke E, Thomas AE, Chalmers E, Lowe GDO. Haemophilia care in central Scotland 1980-94. Demographic characteristics, hospital admissions and causes of death. Haemophilia 2000; 6: 494-503. Maroney SA, Cooley BC, Ferrel JP, Bonesho CE, Mast AE. Murine hematopoietic cell tissue factor pathway inhibitor limits thrombus growth. Arterioscler Thromb Vasc Biol 2011; 31:821–826. Maroney SA, Cooley BC, Ferrel JP, Bonesho CE, Nielsen LV, Johansen PB, Hermit MB, Petersen LC and Mast AE. Absence of hematopoietic tissue factor pathway inhibitor mitigates bleeding in mice with hemophilia. Proc Natl Acad Sci 2012;109:3927-31 Nordfang O, Valentin S, Beck TC, Hedner U. Inhibition of extrinsic pathway inhibitor shortens the coagulation time of normal plasma and of hemophilia plasma. Thromb Haemost 1991; 66: 464–467. Novotny WF, Girard TJ, Miletich JP, Broze GJ Jr. Platelets secrete a coagulation inhibitor functionally and antigenically similar to the lipoprotein associated coagulation inhibitor. Blood 1988; 72: 2020-2025. Pai KM, Walker I, Almonte T, Chan AK. Sek J, Decker K. Comparing bleed frequency and factor concentrate use between haemophilia A and haemophilia B. J Thromb Haemost 2005; 3: Abstrs P0807. Petersen LC. Hemostatic properties of a TFPI antibody. Thromb Res 2012; 129: 44-5. Santagostino E, Mancuso ME, Tripodi A, Chantarangkul V, Clerici M, Garagiola I Mannucci PM. Severe haemophilia with mild bleeding phenotype: molecular characterization and global coagulation profile. J Thromb Haemost 2010; 8: 737-43. Shetty, Shrimati, Sonal Vora, Bipin Kulkarni, Leenam Mota, Manasi Vijapurkar, Leera Quadros, et Kanjaksha Ghosh Contribution of natural anticoagulant and fibrinolytic factors in modulating the clinical severity of haemophilia patients British journal of haematology 138, no. 4 (août 2007): 541-544. Shulman S, Eelde A, Holmstrom M, Stahlberg G, Odeberg J, Blombacks M. Validation of a composite score for clinical severity of hemophilia. J Thromb Haemost 2008; 6: 1113-1121.
111
Tardy-Poncet B, Piot M, Chapelle C, Berger C, Tardy B. Difference in TFPI levels between haemophilia A and B patients. Haemophilia 2011; 17: 312-3 van den Berg, H M, P H G De Groot, et K Fischer Phenotypic heterogeneity in severe hemophilia Journal of thrombosis and haemostasis: JTH 5 Suppl 1 (juillet 2007): 151-156. van Dijk, K, J G van der Bom, K Fischer, P G de Groot, et H M van den Berg. « Phenotype of severe hemophilia A and plasma levels of risk factors for thrombosis ». Journal of thrombosis and haemostasis: JTH 5, no. 5 (mai 2007): 1062-1064. van ’t Veer C, Hackeng TM, Delahaye C, Sixma JJ, Bouma BN. Activated factor Xand thrombin formation triggered by tissue factor on endothelial cell matrix in a flow model: Effect of the tissue factor pathway inhibitor. Blood 1994; 84:1132–1142. Wildgoose P, Nemerson Y, Hansen LL, Nielsen FE, Glazer S, Hedner U. Measurement of basal factor VIIa in Hemophilia A and B patients. Blood, 1992; 1: 25–8. Welsch DJ, Novotny WF, Wun TC. Effect of lipoprotein-associated coagulation inhibitor (LACI) on thromboplastin-induced coagulation of normal and haemophiliac plasmas. Thromb Res 1991; 64:213–222.

112
ANNEXES

113
Annexe 0 : Tissue factor pathway inhibitor structure
Figure 1: Structure of TFPI alpha
Figure 2: Structure of TFPI beta

114
Figure 3: Structure of TFPI delta
Figure 3: Inhibition of the initiating complex by tissue factor pathway inhibitor.
References Broze, George J, Jr, et Thomas J Girard Tissue factor pathway inhibitor: structure-function Frontiers in bioscience: a journal and virtual library 17 (2012): 262-280.
Gomez, Keith, John H McVey, et Edward Tuddenham Inhibition of coagulation by macromolecular complexes Haematologica 90, no. 11 (novembre 2005): 1570-1576

115
Annexe 1: Determination of fibrinogen, factor VIII and free TFPI
levels
Fibrinogen assay:
Quantitative determination of fibrinogen in plasma was realised using an automated
assay based on the Clauss method. Citrated plasma is brought to coagulation with a large
excess of thrombin. Here the coagulation time depends largely on the fibrinogen content of
the specimen.
Fibrinogen level assays were performed on a BCS coagulation analyser (Dade
Behring Siemens, Saint-Denis, France) with the specific reagent Multifibren*U (Dade Behring,
France). A calibration curve was made using the Fibrinogen calibrator kit according to the
manufacturer’s recommendations. Two controls (Plasma control N and Plasma control P)
from Siemens were performed for each analysis run.
FVIII assay:
The one-stage FVIII:C assay was performed with activated partial thromboplastin time
reagents (Pathromtin*SL) and FVIII-deficient plasma obtained from Dade Behring Siemens
(Saint-Denis, France) on a BCS coagulation analyser. The assays were calibrated with
Standard Human Plasma from Siemens. Two controls (Plasma control N and Plasma control
P) from Siemens were performed for each analysis run.
Free TFPI (ELISA):
The internal wall of a plastic microwell is precoated with the first monoclonal antibody
to TFPI. The second anti-Free TFPI monoclonal antibody that is coupled with peroxidase is
added to the precoated microwell at the same time as the plasma whose Free TFPI is to be
determined. The Free TFPI of the plasma being tested is simultaneously captured on the one
hand by the first monoclonal antibody that is precoated on the microwell wall, and on the
other by the second monoclonal antibody-peroxidase conjugate, i.e., the "sandwich" is
formed in a one-step reaction. Next, the bound peroxidase is revealed by its activity in a
predetermined time on the substrate ortho-Phenylenediamine in the presence of urea
peroxide. After stopping the reaction with a strong acid, the intensity of the color produced
bears a direct relationship with the Free TFPI concentration initially present in the plasma
sample.
Normal values for women (n=25): mean 11.5 ng/mL, mean ± 2SD: 4.9 -18.1 ng/mL
Normal values for men (n=17): mean 15.8 ng/mL, mean ± 2SD: 7.6 - 24.0 ng/mL

116
1.0
1.52.0
2.5
3.03.5
4.0
4.55.0
5.5
0 20 40 60 80 100 120 140
TFPI concentration (ng.mL-1)
TF
PI
sen
siti
vity
rat
ioAnnexe 2: Anticoagulant response to exogenous TFPI
To evaluate the anticoagulant response of plasma to exogenous TFPI, we used a
diluted prothombin time (dPT) assay with and without exogenous TFPI. Thromborel ® and
Innovin®) (recombinant tissue factor) were purchased from Behring Siemens, full-length
recombinant human TFPI from American Diagnostica, and BSA from Sigma.
- two step assay
In a two-step dPT assay, 50 µL of undiluted patient or control plasma samples were
incubated during 60-second at 37°C with 50 µL of recombinant diluted tissue factor (1/450
final dilution) in tris (50 mM), NaCl (100 mM) buffer, pH 7.5. Coagulation was initiated by
adding CaCl2 (50 mM) BSA (10 g/L) buffer without or with TFPI (62 and 125 ng/ml final
concentration).
- one step assay
In a one-step dPT assay, 50 µL of undiluted patient or control plasma samples were
prewarmed during 30-second at 37°C. Coagulation was initiated by adding 100 µL of a
mixture of recombinant diluted tissue factor (1/450 final dilution) in tris (50 mM), NaCl (100
mM) buffer, pH 7.5, CaCl2 (25 mM), BSA (1 g/L) without or with TFPI (150 or 200 ng/ml final
concentration, depending on the TFPI activity that is different from one to an other batch).
Initial dPT and dPT + TFPI were recorded by an automated coagulation analyser
(BCS, Siemens, St Denis, France) for patients, controls and reference plasmas. All assays
were performed in duplicate. TFPI sensitivity ratios were obtained by dividing the ‘dPT with
TFPI’ by the ‘dPT without TFPI’. We also measured the sensitivity ratio of the reference
plasma. The TFPI normalized ratio (TFPI NR) was then calculated by dividing the TFPI
sensitivity ratio obtained for patient and control plasma samples by the TFPI sensitivity ratio
obtained for the reference plasma.
Response of the reference plasma (expressed as TFPI sensitivity ratio) to
different TFPI concentrations
Plots= Median ± SD (measurements made on 15 volunteers)

117
Annexe 3: TFPI activity assay
based on the chromogenic assay described by Sandset (Thrombosis Research 2000)
Determination of the reagent concentrations for the measure of TFPI
activity: step by step
Tissue factor (Innovin, Dade Behring) concentration:
Innovin:
finale dil
Bov.F
Xa:
Substrate:
type
Substrat
e Conc. OD max
delta
OD R2
TFPI
control Conclusion
1:400 0,133 CS 11(22) 1 mg/ml 0.479 0.153 0.948 121 OD max too low
1:200 0,133 CS 11(22) 1 mg/ml 0.647 0.258 0.887 104 OD max too low
1:100 0,133 CS 11(22) 1 mg/ml 0.957 0.488 0.996 105 OD max better, low delta OD
1:50 0,133 CS 11(22) 1 mg/ml 1.123 0.408 0.985 ND
0
0.2
0.4
0.6
0.8
1
1.2
0 20 40 60 80 100
TFPI activity %
od
(40
5nm
) 1:50
1:100
1:200
1:400
It was decided to work with a TF dilution of 1/100

118
Bovine Factor Xa concentration :
In the assay described by Sandset, FXa concentration is 0.133 nkat/mL
In the assay supplied by Diapharma, FXa concentration is 0.089 nkat/mL
Bov.F Xa:
(nkat/mL)
Innovin:
final
dilution Substrate
Substrate
concentration OD max delta OD R2
TFPI %
control
Conclusion
0,133 1:100 CS 11(22) 1 mg/ml 0.957 0.488 0.996 105
0,089 1:100 CS 11(22) 1 mg/ml 0.889 0.507 0.987 97
No difference between
0.089 and 0.133
concentrations
0
0.2
0.4
0.6
0.8
1
1.2
0 20 40 60 80 100
TFPI activity %
od
(40
5nm
)
0.089 nkat/mL
0.133 nkat/mL
There was no difference between the curves obtained with these two factor Xa
concentrations. The concentration used by Sandset was choosen (0.133 nkat/mL)
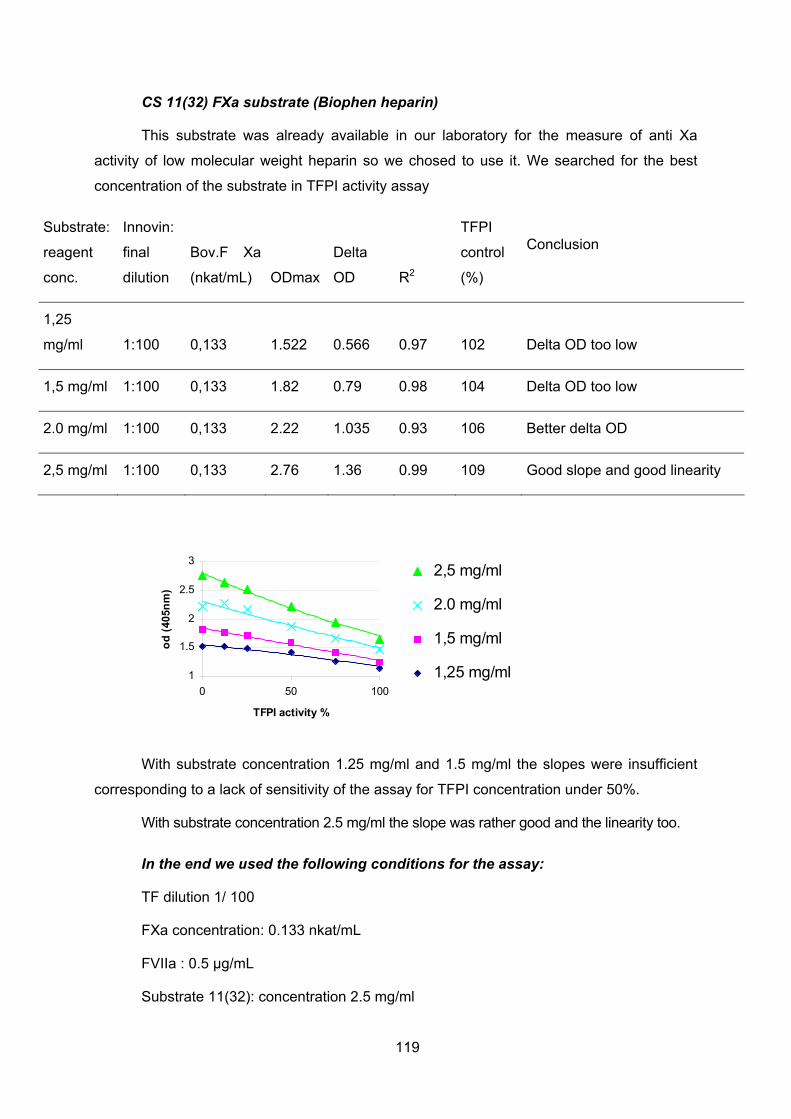
119
CS 11(32) FXa substrate (Biophen heparin)
This substrate was already available in our laboratory for the measure of anti Xa
activity of low molecular weight heparin so we chosed to use it. We searched for the best
concentration of the substrate in TFPI activity assay
Substrate:
reagent
conc.
Innovin:
final
dilution
Bov.F Xa
(nkat/mL) ODmax
Delta
OD R2
TFPI
control
(%)
Conclusion
1,25
mg/ml 1:100 0,133 1.522 0.566 0.97 102 Delta OD too low
1,5 mg/ml 1:100 0,133 1.82 0.79 0.98 104 Delta OD too low
2.0 mg/ml 1:100 0,133 2.22 1.035 0.93 106 Better delta OD
2,5 mg/ml 1:100 0,133 2.76 1.36 0.99 109 Good slope and good linearity
1
1.5
2
2.5
3
0 50 100
TFPI activity %
od
(40
5nm
)
2,5 mg/ml
2.0 mg/ml
1,5 mg/ml
1,25 mg/ml
With substrate concentration 1.25 mg/ml and 1.5 mg/ml the slopes were insufficient
corresponding to a lack of sensitivity of the assay for TFPI concentration under 50%.
With substrate concentration 2.5 mg/ml the slope was rather good and the linearity too.
In the end we used the following conditions for the assay:
TF dilution 1/ 100
FXa concentration: 0.133 nkat/mL
FVIIa : 0.5 µg/mL
Substrate 11(32): concentration 2.5 mg/ml

120
TFPI activity assay as described by PM Sandset (2000)
REAGENTS
Buffers TBS(Tris Buffered Saline)/BSA(Bovine Serum Albumin): 0,05mol/L Tris-HCl, 0,15 mol/L NaCl pH 7,50: Prepare a 0,05 mol/L Tris, 0,15 mol/L NaCl stock solution, adjust pH with 1M HCl, eventually with 5M HCl. Store at 4°C. TBS/BSA 2 mg/mL: Add BSA to a final concentration of 2 mg/mL ( 0,2 g BSA is added to 100 mL TBS buffer). Store up to a week at 4°C. TBS/BSA 2 mg/mL + Polybrene 2 µg/mL: Prepare a Polybrene 1% stock solution, store at 4°C. Add Polybrene 1% to a final concentration of 2 µg/mL( 20 µL Polybrene 1% is added to 100 mL TBS/BSA buffer). Store up to a week at 4°C. Tris: from Sigma 7-9: T-1378 BSA: from Sigma A-3294 Polybrene(Hexadimethrin bromide): from Fluka 52495
Recombinant Tissue Factor(TF): Innovin : Innovin from Dade Behring Ref. B4212-50, 10x10mL Delivered in glass vials. Reconstitute with 10 mL distilled water, can be stored resuspended for about 10 days at 4°C. Can not be frozen. Recombinant Factor VIIa NB! Work on ice! Delivered in a glass vial, 1,2 mg powder. Reconstitute with 1,0 mL sterile water (included in the package) which gives a concentration of 1,2 mg/mL. Divide the total volume in 3 aliquotes à 330 µL and freeze immediately at -70°C. All further dilutions must be done using TBS/BSA buffer. Dilute further to a concentration of 120 µg/mL and store immediately at -70°C. Then finally dilute to a concentration of 12,0 µg/mL and aliquote in tubes at 310 µL (for analysis of half a 96-well plate) and/or 610 µL (for analysis of a whole 96-well plate). Can be stored for many months at -70°C. Recombinant Factor VIIa: from NovoSeven, 1,2 mg (60 kIE) includes one vial with powder and one vial with sterile water. Bovine Factor Xa NB! Work on ice! Delivered in vials containing 30 µg/vial. Reconstitute with 10 mL distilled water which gives a concentration of 3 µg/mL equivalent to 0.3 U/mL. Dilute further with TBS/BSA buffer to a final concentration of 0.25 U/mL (2 mL iced TBS/BSA added to 10 mL reconstituted vial). Aliquote at 300 µL. Store at -70°C. Bovine factor Xa: from Hyphen BioMed, ref BE101D
Fibrin polymerisation inhibitor: Pefabloc FG (H-Gly-Pro-Arg-Pro-OH·AcOH) NB! Work on ice!

121
Delivered in vials containing 50 mg/vial. Reconstitute with 5,0 mL distilled water which gives a concentration of 10 mg/mL. Dilute further with TBS buffer pH 7,50 to a final concentration of 1,0 mg/mL. Aliquote at 1600 µL. Store at -70°C. Pefabloc FG: from Pentapharm, product code number (099-11)/(099-01) Calcium chloride 500 mmol/L 500 mmol/L stock solution CaCl2 Store at 4°C, long shelf-life. Bovine Factor X Delivered in vials containing 100 µg (10 U)/vial. Reconstitute with 1 mL distilled water which gives a concentration of 10 U/mL. Dilute further with TBS/BSA buffer to a final concentration of 0,4 U/mL (24 mL TBS/BSA added to 1 mL FX), aliquote at 1800 µL and stored at -70°C Bovine Factor X: from Hyphen BioMed, ref BP102A Chromogenic substrate: BIOPHEN CS-11(32) Delivered in a vial containing 15 mg. Reconstitute it with 3 mL of sterile water, for a final working concentration of 5,0 mg/mL. It must be protected from light. Stable for 3 months at 2-8°C. Must not be frozen. BIOPHEN CS-11(32): from HYPHEN BioMed, ref 221006 Acetic acid 50% Prepare a 50% acetic acid solution which can be used to stop the chromogenic reaction.
CALIBRATION CURVE
Normal pooled plasma:
Citrated blood was taken from 30 healthy donors. After double centrifugation (2500g,
15min), platelet poor plasma (PPP) was pooled then aliquoted at 300 µL and stored at -70°C.
One aliquot was rapidly defrosted in a water bath at 37°C before each run of
experiment. Dilute normal pool plasma in TBS/BSA/polybrene buffer: prepare 7 standards
allowing concentrations from 0 to 150% (100 % concentration obtained by 1:40 dilution).
No. Pool Plasma TBS/BSA+Polybrene buffer TFPI Activity %
1 50 µL 1285 µL 150
2 50 µL 1950 µL 100
3 300 µL no.1 300 µL 75
4 300 µL no. 2 300 µL 50
5 300 µL no. 4 300 µL 25
6 300 µL no. 5 300 µL 12.5
7 - 300 µL 0

122
PLASMA SAMPLES
Plasma samples must be rapidly defrosted in a water bath at 37°C and used within 2
hours after thawing. Plasma samples are diluted to 1:80 with TBS/BSA + Polybrene buffer. If
the plasma samples contain heparin, they must be diluted to 1:160 and Polybrene is
essential in the dilution buffer.
COMBINED REAGENT (CR)
NB! Work on ice!
CR (6000 µL) Volume
added
Concentration stock solution Final concentration
TBS/BSA buffer 4503
µL
0,05mol/L Tris-HCl, 0,15 mol/L NaCl pH
7,50; BSA 2 mg/mL
TF (Innovin) 75 µL Ready to use 1:100
CaCl2 150 µL 500 mmol/L 10 mM
Pefabloc 750 µL 1 mg/mL 100 µg/mL
Factor Xa 240 µL 0,25 U/mL 0,008 U/mL
Factor V11a 282 µL 12,0 µg/mL 0,5 µg/mL
All components should be added in the same order as in the above table. All frozen
components must be thawed very carefully in a waterbath at 37°C. The Combined Reagent
must be kept on ice until the analysis is performed. Prepare 6,0 mL CR for a half 96-well
plate.
Stability: 30-60 minutes at 4°C.
SUBSTRATE REAGENT
The substrate reagent should be prepared towards the end of the first 30 minutes
incubation. It must be mixed carefully (do not whirlmix) and kept protected from light until use.
Factor X (0,4 U/mL) + Substrate BIOPHEN CS-11(32) (5,0 mg/mL) in a 1:1 proportion
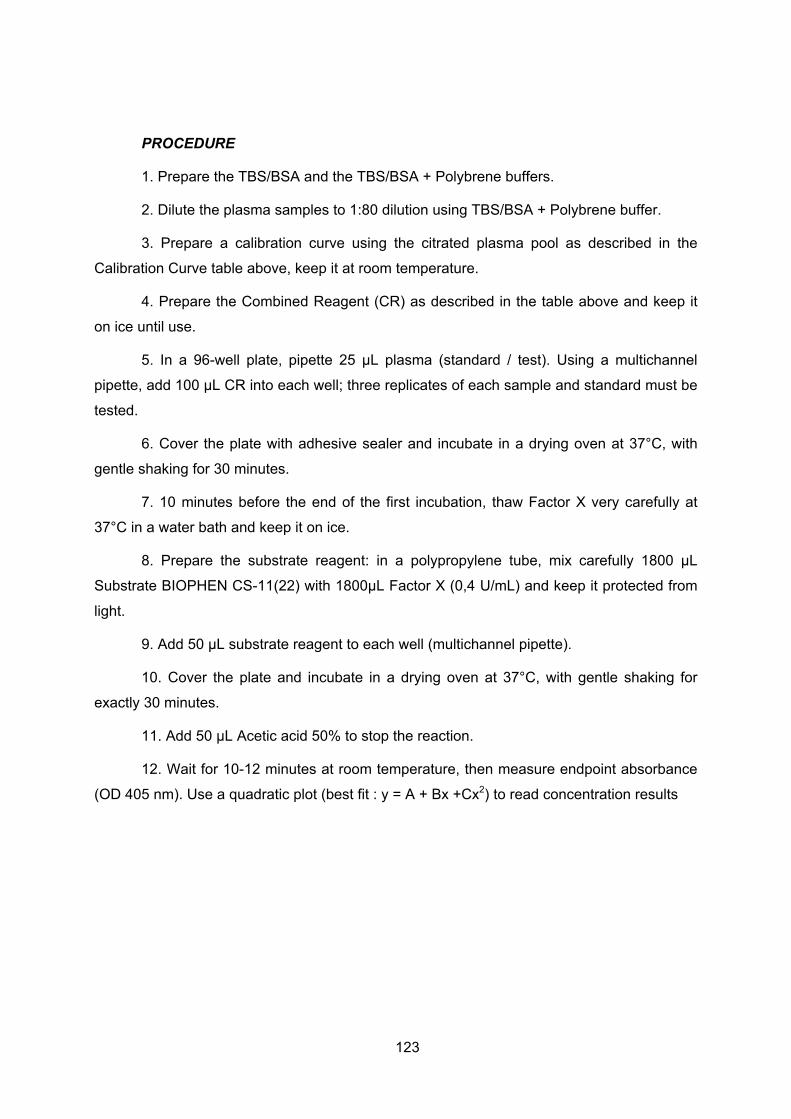
123
PROCEDURE
1. Prepare the TBS/BSA and the TBS/BSA + Polybrene buffers.
2. Dilute the plasma samples to 1:80 dilution using TBS/BSA + Polybrene buffer.
3. Prepare a calibration curve using the citrated plasma pool as described in the
Calibration Curve table above, keep it at room temperature.
4. Prepare the Combined Reagent (CR) as described in the table above and keep it
on ice until use.
5. In a 96-well plate, pipette 25 µL plasma (standard / test). Using a multichannel
pipette, add 100 µL CR into each well; three replicates of each sample and standard must be
tested.
6. Cover the plate with adhesive sealer and incubate in a drying oven at 37°C, with
gentle shaking for 30 minutes.
7. 10 minutes before the end of the first incubation, thaw Factor X very carefully at
37°C in a water bath and keep it on ice.
8. Prepare the substrate reagent: in a polypropylene tube, mix carefully 1800 µL
Substrate BIOPHEN CS-11(22) with 1800µL Factor X (0,4 U/mL) and keep it protected from
light.
9. Add 50 µL substrate reagent to each well (multichannel pipette).
10. Cover the plate and incubate in a drying oven at 37°C, with gentle shaking for
exactly 30 minutes.
11. Add 50 µL Acetic acid 50% to stop the reaction.
12. Wait for 10-12 minutes at room temperature, then measure endpoint absorbance
(OD 405 nm). Use a quadratic plot (best fit : y = A + Bx +Cx2) to read concentration results

124
.CALIBRATION CURVE EXAMPLE
Concentration OD Measure
Cal 1 150 1.172
Cal 2 100 1.347
Cal 3 75 1.465
Cal 4 50 1.658
Cal 5 25 1.901
Cal 6 12.5 2.051
Cal 7 0 2.212
Fit type: Quadratic polynomial: y=a+b*x+c*x^2
Meas.transformation: Linear
Conc.transformation: Linear
Parameters: a b c
2.202 -0.013 3.89E-05
Corr.coeff. R2 0.998
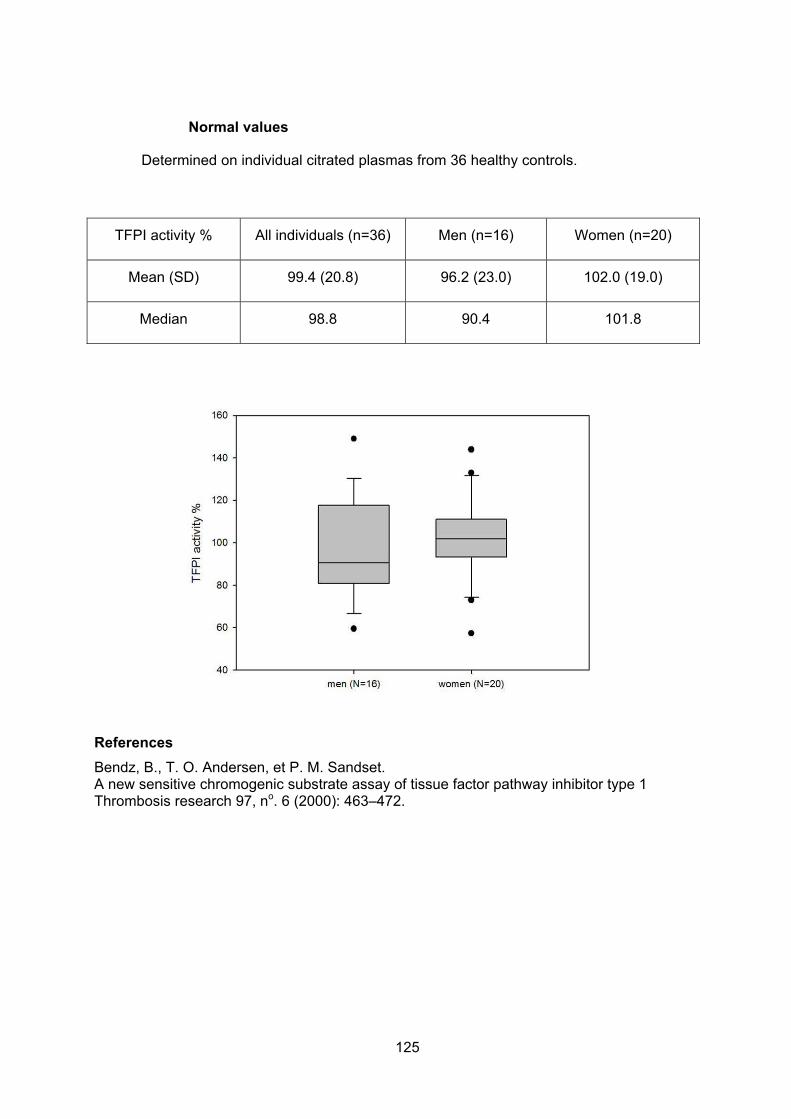
125
Normal values
Determined on individual citrated plasmas from 36 healthy controls.
TFPI activity % All individuals (n=36) Men (n=16) Women (n=20)
Mean (SD) 99.4 (20.8) 96.2 (23.0) 102.0 (19.0)
Median 98.8 90.4 101.8
References
Bendz, B., T. O. Andersen, et P. M. Sandset. A new sensitive chromogenic substrate assay of tissue factor pathway inhibitor type 1 Thrombosis research 97, no. 6 (2000): 463–472.

126
Annexe 4: Normal values of thrombin generation in Platelet
rich plasma (PRP)
Mean SD
ETP (nmol*min) 1614 329
Peak (nmol) 66 22
Lag Time (min) 10 2
Time to P (min) 25 4.56
References
Dargaud, Yesim, Roger Luddington, et Trevor Baglin Platelet-dependent thrombography: a method for diagnostic laboratories British journal of haematology 134, no. 3 (août 2006): 323-325.

127
Annexe 5: Thrombin generation assays
Thrombin generation tests were performed in platelet rich (PRP) and platelet poor
(PPP) plasma according to the Calibrated Automated Thrombography (CAT) method
described by HC Hemker (Pathophysiology of haemostasis and thrombosis 2003)
Reagents
Hepes and bovine albumin were obtained from Sigma Aldrich (St Quentin fallavier,
France). HBS buffer (Hepes 20mM, NaCl 140 mM, pH 7.35) containing 5 g.L-1 BSA was
prepared, aliquoted in sterile 5 mL tubes and stored in a freezer until analyses.
Recombinant relipidated tissue factor (rTF), PRP Reagent (1pM TF) for PRP assays
and PPP LOW Reagent (1pM TF, 4µM phospholipids) for PPP assays were ordered to
Diagnostica Stago (Asnières, France). Each vial was reconstituted in 1 mL deionized water
30 min before use.
Thrombin calibrator was purchased from Diagnostica Stago (Asnières, France). Each
vial was reconstituted in 1 mL deionized water 5 min before use. Thrombin activity allowing
thrombin measurement is given for each kit by the manufacturer.
Fluorogenic substrate, FluCa-kit was obtained from Diagnostica Stago (Asnières,
France). A fresh mixture of Fluo buffer (with Calcium) and Fluo substrate (ratio 40:1) was
prepared just before use in order to obtain finale concentration of 100 mM CaCl2 and 2.5 nM
fluorogenic substrate.
Human full length recombinant TFPI (ref 4900PC).was obtained from American
Diagnostica (USA) and stored at -80°C, in 20µL fractions (equivalent 500 ng TFPI). For the
analysis, one aliquot was defrosted quickly, and then 190 µL of HBS buffer was added in
order to obtain a TFPI concentration of 2.4 µg.mL-1.
Human TFPI antibody (ref AF2974) was obtained from RαD Systems. One 100µg vial
was reconstituted with 500µL of PBS buffer, aliquoted into cryotubes (20µL) and stored at -
80°C until analysis. For the analysis, one aliquot was defrosted quickly, and then 80 µL of
HBS buffer was added in order to obtain a concentration of 40 µg.mL-1.
Blood and plasma
Peripheral venous blood was collected into S-Monovette (Sarstedt, Orsay, France)
containing 0.106mol/L trisodium citrate. For hemophilic patients, in order to inhibit contact
activation, corn trypsin inhibitor (CTI, 1.45 µmol.L-1, finale concentration in whole blood) was
added into S-monovette before use. After a first centrifugation at 200xg for 10 minutes, 500

128
µL of platelet rich plasma (PRP) were delicately collected from the upper volume of plasma
supernatant.
The resting blood was centrifuged at 2500xg for 15 minutes; platelet poor plasma
(PPP) was collected from the upper ½ volume of plasma supernatant, transferred into a
conical tube and centrifuged a second time at 2500xg for 15 minutes. PPP was collected,
transferred into cryotubes (800µL), quick-frozen and stored at –80°C until analysis.
PRP and PPP were always prepared within 2 hours after venipuncture.
TG assays in PRP were immediately performed.
For TG assays in PPP, the plasma was quickly defrosted in a water-bath at 37°C and
essays were performed within 30 minutes.
Automated measurement of thrombin generation
Thrombin generation was measured in a Fluoroscan Ascent fluorometer
(Thermolabsystems, Thermo Fischer, France) equipped with a dispenser. Fluorescence
intensity was detected at wavelengths of 390nm (excitation filter) and 460nm (emission filter).
Each experiment needs two sets of readings, one from a well in which thrombin
generation takes place (TG well) and a second one from a well to which the calibrator has
been added (CL well).
80μL of PRP or PPP were dispensed into the wells of a round-bottom 96 well-
microtiter plate (Immulon 2HB, Diagnostica Stago, France).
For PRP analysis, 20μL of PRP reagent were added to the plasma sample to obtain a
final concentration of 1pM tissue factor.
For PPP analysis, 20μL of PPP LOW reagent were added to the plasma sample to
obtain a final concentration of 1pM tissue factor, 4µM phospholipids.
20 µL of Thrombin calibrator were added into the calibrator wells
The plate was placed in the fluorometer and allowed to warm to 37° C for 10 minutes.
The dispenser of the fluorometer was flushed with warm 100 mM CaCl2 solution, emptied,
and then flushed with warm fresh FluCa mixture. At the start of the experiment, the
instrument dispenses 20 µL of FluCa to all the wells to be measured, registers this as zero
time, shakes them for 10 s and starts reading.
During the measurement, a dedicated software program, Thrombinoscope (Synapse
Bv, Maastricht, The Netherlands) compares the readings from the TG and the CL wells,
calculates thrombin concentration and displays the thrombin concentration in time. All

129
experiments were carried out in triplicate. Thrombin generation was registered for 60 minutes
(90 min in case of hemophilia patients).
Thrombin generation assay in response to anti-TFPI antibody
Anti-TFPI antibody response was evaluated in PRP and PPP. In serial microtubes,
increasing amounts of Human TFPI Ab were added to PRP or to PPP in order to obtain
concentrations ranging from 0.25 to 4.0 µg.mL-1. Tubes were delicately mixed and kept at
ambient temperature for 30 minutes. 80 µL of each mixture were then added into the TG
wells (in triplicate) and the assay was performed according to the procedure firstly described.
Anticoagulant response to exogenous TFPI
Anticoagulant response to exogenous TFPI was evaluated in PPP. In a polypropylene
tube, human full-length recombinant TFPI (2.4 µg.mL-1) was added to defrosted PPP in order
to obtain a TFPI concentration of 80 ng.mL-1 in plasma. In a second tube, saline solution was
added to PPP in the same proportion. The tubes were delicately mixed and kept at ambient
temperature for 30 minutes. 80 µL of plasma with saline or with exogenous TFPI were then
added into the TG wells (in triplicate) and the assay was performed according to the
procedure firstly described.
Results
The analysis program allows calculating automatically the parameters of thrombin
generation:
- Lag time (LT), in minutes
- Endogenous thrombin potential (ETP): molar thrombin concentration multiplied by time (nmol*min)
- Peak height (P), in nanomolar thrombin
- Time to peak (TTP), in minutes
- Velocity index, Peak height divided by (TTP-LT).
Results were exported to Excel sheet in order to overlap graphs from different assays
(with and without TFPI or anti-TFPI Ab).
References
Hemker, H Coenraad, Peter Giesen, Raed Al Dieri, Véronique Regnault, Eric de Smedt, Rob Wagenvoord, Thomas Lecompte, et Suzette Béguin. « Calibrated automated thrombin generation measurement in clotting plasma ». Pathophysiology of haemostasis and thrombosis 33, no. 1 (2003): 4-15.
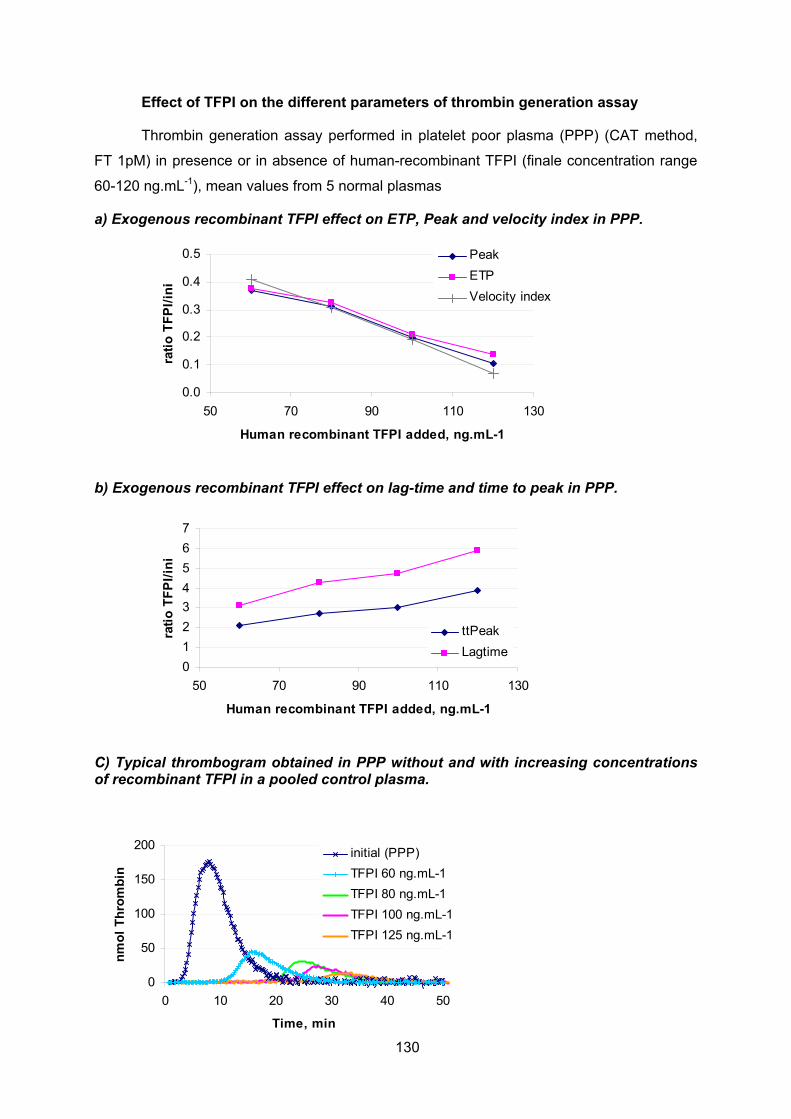
130
0
50
100
150
200
0 10 20 30 40 50
Time, min
nm
ol
Th
rom
bin
initial (PPP)
TFPI 60 ng.mL-1
TFPI 80 ng.mL-1
TFPI 100 ng.mL-1
TFPI 125 ng.mL-1
Effect of TFPI on the different parameters of thrombin generation assay
Thrombin generation assay performed in platelet poor plasma (PPP) (CAT method,
FT 1pM) in presence or in absence of human-recombinant TFPI (finale concentration range
60-120 ng.mL-1), mean values from 5 normal plasmas
a) Exogenous recombinant TFPI effect on ETP, Peak and velocity index in PPP.
0.0
0.1
0.2
0.3
0.4
0.5
50 70 90 110 130
Human recombinant TFPI added, ng.mL-1
rati
o T
FP
I/in
i
Peak
ETP
Velocity index
b) Exogenous recombinant TFPI effect on lag-time and time to peak in PPP.
0
1
2
3
4
5
6
7
50 70 90 110 130
Human recombinant TFPI added, ng.mL-1
rati
o T
FP
I/in
i
ttPeak
Lagtime
C) Typical thrombogram obtained in PPP without and with increasing concentrations of recombinant TFPI in a pooled control plasma.

131
Annexe 6 : Comparison of the different TFPI resistance assays
Assay B Tardy-Poncet, 2001 Bombeli, Thromb Haemost 2003 B Tardy-Poncet, 2008
Pre analytic conditions
citrate 0,129M, 2 centrifugations 15mn, 2500g
citrate 0,106M, 1 centrifugation 10mn 2000g
citrate 0,129M, 2 centrifugations 15mn, 2500g
Tissue factor -(TF)
Thromborel S Thromborel S Innovin
TF dilution
1/300 -> 1/450 final dilution 1/30 -> 1/45 final dilution 1/150 -> 1/450 final dilution
CaCl2 concentration
25mM / 16,6 mM final concent 5 mM/ 3,33 mM final concent 50mM / 16,6 mM final concent
Dilution Buffer
Tris-HCl 50mM, NaCl 100mM, BSA 1 g/l, pH 7,5
Tris-HCl 50mM, NaCl 175mM, BSA 0,5g/l, pH 7,9
FT: Tris-HCl 50mM, NaCl 100mM, pH 7,5 - CACl2-TFPI: Tamp Tris + BSA 10g/l
BSA final concentration
0,66g/l
0,33 g/l
3,33 g/l
TFPI : final concentration
RH TFPI (Am Diagostica) 0,2 µg/ml
RH TFPI (Am Diagnostica), 0,3 µg/ml (8,6nM)
RH TFPI (Am Diagnostica) 0,062 et 0,125 µg/ml
Samples
Undiluted platelet poor plasma
Platelet poor plasma diluted in VII deficient plasma (2/5)
Undiluted platelet poor plasma
Running assay
dPT One step BCT (Behring): 50 µl PPP + 100 µl TF+/- TFPI
dPT One step STA4 (Stago) 50 µl PPP + 100 µl TF +/- TFPI
dPT Two steps BCS (Siemens): 50 µl PPP+ 50 µl TF incubation 60 sec + 50 µl CaCl2 +/- TFPI
Results expression
TFPI normalised ratio (patient TFPI ratio/ control TFPI ratio)
TFPI sensitivity ratio ( W TFPI/ Wo TFPI)
TFPI normalised ratio (patient TFPI ratio/ control TFPI ratio)
Initial dPT initial control values
94 sec
130 sec (PPP diluted in factor VII deficient plasma)
58 sec
Median of ratio cont
Ratio of ref plasma: 2,01 Normalised ratio: 0,96
TFPI ratio of controls 1,62 (SD 0,16)
r TFPI= 4,6, nr = 0,94
mean ratio patients
n ratio median: 0,94 1,49 (SD 0,15) r TFPI= 4,1, nr = 0,84
cut-off NR < 0,85 TR < 1,31 (moy-2SD) NR <= 0,63

132
Annexe 7 : Clinical data for establishing the haemorrhagic score
Table 1: Clinical and demographic data
Renseignement patient Oui Non
1. Date de la visite : ......................................................................................... |__|__| |__|__| |2|0|1|__|
2. Date de naissance : ...................................................................................... |__|__| |__|__| |1|9|__|__|
3. Sexe : ........................................................................................................... M 1 F 2
4. Taille : ......................................................................................................... |__|__|__| cm
5. Poids : |__|__|__| kg
6. Type d’hémophilie : ................................................................................... A 1 B 2
7. Sévérité de l’hémophilie : ............................................................................ 1 mineure
1. 2 modérée
2. 3 grave
8. Mutation précise........................................................................................... 1 VIII
3. 2 IX
9. Taux de base du facteur manquant (%) : .................................................... |__|__|__|
10. Taux de facteur manquant à la date de la visite (%) : ................................. |__|__|__|
11. Âge de survenue du premier épisode hémorragique .................................. |__|__| ans
12. Date de la dernière injection de facteurs anti-hémophiliques ................... |__|__| |__|__| |2|0||__|__|
13. Heure de la dernière injection de facteurs anti-hémophiliques .................. |__|__| hh |__|__|mm

133
Table 2: Data collected for establishing haemorrhagic score in severe haemophilia patients
1. Période d’évaluation (5 à 10 ans)................................................................ |__|__|__|__| à |2|0|__|__|
4. = |__|__| années
5. Hémarthroses
2. Nombre total d’hémarthroses pendant cette période .................................. |__|__|__|
3. Incidence annuelle des hémarthroses 6. (= nb tot. des hémarthroses/nb d’années évaluées) divisé par 20
SH = |__|,|__|__|
7. Score articulaire
4. Date de calcul du score |__|__| |__|__| |2|0||__|__|
5. Score orthopédique du genou droit (1 à 15) .............................................. |__|__|
6. Score orthopédique du genou gauche (1 à 15) ........................................... |__|__|
7. Score orthopédique de la cheville droite (1 à 15) ...................................... |__|__|
8. Score orthopédique de la cheville gauche (1 à 15) .................................... |__|__|
9. Score orthopédique du coude droit (1 à 13) ............................................... |__|__|
10. Score orthopédique du coude gauche (1 à 13) ........................................... |__|__|
11. Score articulaire (somme des scores orthopédiques divisée par 86) SA = |__|,|__|__|
8. Consommation annuelle de facteurs (kIU.kg-1)
12. Moyenne annuelle de la quantité totale de facteur consommée en KUI sur la période d’évaluation ..........................................................................
|__|__|__|__|
13. Poids moyen du patient pendant la période d’évaluation ........................... |__|__|__| kg
14. Consommation annuelle de facteur (moyenne annuelle de la quantité de facteur consommé/Poids moyen) divisé par 6 .............................................
CF = |__|,|__|__|
15. Score hémorragique total = SH + SA + CF ........................................... |__|,|__|__|

134
Table 3: Data collected for establishing haemorrhagic score in minor or moderate haemophilia patients
1. Préciser la période d’évaluation ............................................................ |__|__|__|__| à |2|0|__|__|
9. = |__|__| années
2. Le patient a-t-il eu des chirurgies pendant la période d’évaluation ? ... 1 0
10. Si oui,
2.1. Nombre de chirurgie : ................................................................... |__|__|
2.2. Nombres d’extractions dentaires ? ................................................ |__|__|
2.3. Le patient a-t-il présenté une hémorragie suite à une chirurgie pendant la période d’évaluation ? ..................................................
1 0
11. ...............................................................................................i oui,
2.3.1. Nombre d’hémorragie ........................................................ |__|__|__|
2.3.2. Substitution par facteur ?.................................................... 1 0
12............................................................................................i oui,
2.3.2.1. Nombre de substitution................................................ |__|__|
2.3.2.2. Quantité de facteur consommé ................................... |__|__|__|__|
2.3.3. Hémorragie suite à une extraction dentaire ....................... 1 0
13. Si oui,
2.3.3.1. Nombre ....................................................................... |__|__|
2.3.3.2. Substitution par facteur ............................................... 1 0
14. Si oui,
2.3.3.2.1. Nombre de substitutions ................................ |__|__|
2.3.3.2.2. Quantité de facteur consommé ...................... |__|__|__|__|
3. Facteurs consommés pendant la période d’évaluation hors interventions chirurgicales ? 1 0
3.1. Si oui, quantité de facteur consommé ............................................ |__|__|__|__|
4. Le patient a-t-il présenté une hémorragie hors chirurgie pendant la période d’évaluation ? 1 0
4.1. Si oui, nombre : |__|__|

135
Table 4: Orthopaedic joint scoring system (Löfqvist, 1997)
References
Shulman S, Eelde A, Holmstrom M, Stahlberg G, Odeberg J, Blombacks M. Validation of a composite score for clinical severity of hemophilia. J Thromb Haemost 2008; 6: 1113-1121
Löfqvist, T, I M Nilsson, E Berntorp, et H Pettersson Haemophilia prophylaxis in young patients--a long-term follow-up Journal of internal medicine 241, no. 5 (mai 1997): 395-400.

136
Conclusion
In conclusion, the studies that tried to demonstrate a responsibility of TFPI in venous
or arterial thrombosis are rather disappointing.
TFPI seems to play a very important role in the hemorrhagic manifestations in
haemophilia patients. Neutralizing the activity of TFPI represents a promising treatment
concept in these patients.

137
.
Publications
Publications
Tardy-Poncet, B, B Tardy, S Laporte, P Mismetti, J Amiral, M Piot, J Reynaud, L Campos, et H Decousus. Poor anticoagulant response to tissue factor pathway inhibitor in patients with venous thrombosis ». Journal of thrombosis and haemostasis: JTH 1, no. 3 (mars 2003): 507-510. Tardy-Poncet, B, M Piot, C Chapelle, C Berger, et B Tardy Difference in TFPI levels between haemophilia A and B patients Haemophilia: the official journal of the World Federation of Hemophilia 17, no. 2 (mars 2011): 312-313. Brigitte Tardy-Poncet, Michèle Piot, Dominique Brunet, Céline Chapelle, Morgane Bonardel, Patrick Mismetti, Pierre Morange, Bernard Tardy TFPI resistance related to inherited or acquired protein S deficiency Thromb Research: (2012) in press,
Presentations in International Congresses
PP-WE-165 VENOUS THROMBOSIS RELATED TO RESISTANCE TO TISSUE FACTOR PATHWAY INHIBITOR B. Tardy- Poncet, M. Piot, C. Chapelle, P. Morange, J. Reynaud, K. Rivron-Guillot, O. Garraud, L. Campos, H. Decousus, P. Mismetti, B. Tardy
XXII ISTH congress, Boston 2009 P-TH-143 Poor anticoagulant response to TFPI in patients with acquired or inherited Protein S deficiency. B Tardy-Poncet, M Piot, D Brunet, C Chapelle, P Morange, P Mismetti, B Tardy. XXIII Congress of the International Society on Thrombosis and Haemostasis 57th Annual SSC Meeting, July 23-28 2011, ICC Kyoto, Kyoto, Japan Journal of Thrombosis and Haemostasis 9 (2011): 814
Copyright © 2022 FDOKUMEN