Ecology and geography of hemorrhagic fever with renal syndrome in Changsha, China
11
RESEARCH ARTICLE Open Access Ecology and geography of hemorrhagic fever with renal syndrome in Changsha, China Hong Xiao 1*† , Xiaoling Lin 1† , Lidong Gao 2† , Cunrui Huang 3 , Huaiyu Tian 1* , Na Li 4 , Jianxin Qin 1 , Peijuan Zhu 1 , Biyun Chen 2 , Xixing Zhang 5 and Jian Zhao 6 Abstract Background: Hemorrhagic fever with renal syndrome (HFRS) is an important public health problem in mainland China. HFRS is particularly endemic in Changsha, the capital city of Hunan Province, with one of the highest incidences in China. The occurrence of HFRS is influenced by environmental factors. However, few studies have examined the relationship between environmental variation (such as land use changes and climate variations), rodents and HFRS occurrence. The purpose of this study is to predict the distribution of HFRS and identify the risk factors and relationship between HFRS occurrence and rodent hosts, combining ecological modeling with the Markov chain Monte Carlo approach. Methods: Ecological niche models (ENMs) were used to evaluate potential geographic distributions of rodent species by reconstructing details of their ecological niches in ecological dimensions, and projecting the results onto geography. The Genetic Algorithm for Rule-set Production was used to produce ENMs. Data were collected on HFRS cases in Changsha from 2005 to 2009, as well as national land survey data, surveillance data of rodents, meteorological data and normalized difference vegetation index (NDVI). Results: The highest occurrence of HFRS was in districts with strong temperature seasonality, where elevation is below 200 m, mean annual temperature is around 17.5°C, and annual precipitation is below 1600 mm. Cultivated and urban lands in particular are associated with HFRS occurrence. Monthly NDVI values of areas predicted present is lower than areas predicted absent, with high seasonal variation. The number of HFRS cases was correlated with rodent density, and the incidence of HFRS cases in urban and forest areas was mainly associated with the density of Rattus norvegicus and Apodemus agrarius, respectively. Conclusions: Heterogeneity between different areas shows that HFRS occurrence is affected by the intensity of human activity, climate conditions, and landscape elements. Rodent density and species composition have significant impacts on the number of HFRS cases and their distribution. Background Hemorrhagic fever with renal syndrome (HFRS) is a group of rodent-borne diseases caused by hantaviruses (HV). It is an important public health problem in China, with 30,000 to 60,000 cases reported annually, accounting for 90% of human cases reported globally over the last 10 years [1]. In China, HFRS is caused mainly by two types of hanta- virus, Hantaan virus (HTNV) and Seoul virus (SEOV), each of which has co-evolved with a distinct rodent host [2]. HTNV is carried by Apodemus agrarius, and SEOV by Rattus norvegicus. Humans usually become infected with hantaviruses through contact with or inhalation of aerosols and secretions from infected rodent hosts. Hunan Province has become one of the most severely endemic areas in China since the first case was discov- ered in 1963. It is a traditional and mixed epidemic area, with SEOV the main hantavirus type and Mus musculus, R. norvegicus and A. agrarius the dominant rodent spe- cies. The incidence rate of HFRS peaked at 101.68/100,000 in 1994, and it has become a great threat to the health of the local population. Previous studies have found that precipitation, temperature, humidity, normalized difference * Correspondence: [email protected]; [email protected] † Equal contributors 1 College of Resources and Environment Science, Hunan Normal University, Changsha 410081, China Full list of author information is available at the end of the article © 2013 Xiao et al.; licensee BioMed Central Ltd. This is an Open Access article distributed under the terms of the Creative Commons Attribution License (http://creativecommons.org/licenses/by/2.0), which permits unrestricted use, distribution, and reproduction in any medium, provided the original work is properly cited. Xiao et al. BMC Infectious Diseases 2013, 13:305 http://www.biomedcentral.com/1471-2334/13/305
-
Upload
independent -
Category
Documents
-
view
4 -
download
0
Transcript of Ecology and geography of hemorrhagic fever with renal syndrome in Changsha, China

RESEARCH ARTICLE Open Access
Ecology and geography of hemorrhagic feverwith renal syndrome in Changsha, ChinaHong Xiao1*†, Xiaoling Lin1†, Lidong Gao2†, Cunrui Huang3, Huaiyu Tian1*, Na Li4, Jianxin Qin1, Peijuan Zhu1,Biyun Chen2, Xixing Zhang5 and Jian Zhao6
Abstract
Background: Hemorrhagic fever with renal syndrome (HFRS) is an important public health problem in mainlandChina. HFRS is particularly endemic in Changsha, the capital city of Hunan Province, with one of the highestincidences in China. The occurrence of HFRS is influenced by environmental factors. However, few studies haveexamined the relationship between environmental variation (such as land use changes and climate variations),rodents and HFRS occurrence. The purpose of this study is to predict the distribution of HFRS and identify the riskfactors and relationship between HFRS occurrence and rodent hosts, combining ecological modeling with theMarkov chain Monte Carlo approach.
Methods: Ecological niche models (ENMs) were used to evaluate potential geographic distributions of rodentspecies by reconstructing details of their ecological niches in ecological dimensions, and projecting the results ontogeography. The Genetic Algorithm for Rule-set Production was used to produce ENMs. Data were collected onHFRS cases in Changsha from 2005 to 2009, as well as national land survey data, surveillance data of rodents,meteorological data and normalized difference vegetation index (NDVI).
Results: The highest occurrence of HFRS was in districts with strong temperature seasonality, where elevation isbelow 200 m, mean annual temperature is around 17.5°C, and annual precipitation is below 1600 mm. Cultivatedand urban lands in particular are associated with HFRS occurrence. Monthly NDVI values of areas predicted presentis lower than areas predicted absent, with high seasonal variation. The number of HFRS cases was correlated withrodent density, and the incidence of HFRS cases in urban and forest areas was mainly associated with the densityof Rattus norvegicus and Apodemus agrarius, respectively.
Conclusions: Heterogeneity between different areas shows that HFRS occurrence is affected by the intensity ofhuman activity, climate conditions, and landscape elements. Rodent density and species composition havesignificant impacts on the number of HFRS cases and their distribution.
BackgroundHemorrhagic fever with renal syndrome (HFRS) is a groupof rodent-borne diseases caused by hantaviruses (HV). Itis an important public health problem in China, with30,000 to 60,000 cases reported annually, accounting for90% of human cases reported globally over the last 10 years[1]. In China, HFRS is caused mainly by two types of hanta-virus, Hantaan virus (HTNV) and Seoul virus (SEOV),each of which has co-evolved with a distinct rodent host
[2]. HTNV is carried by Apodemus agrarius, and SEOV byRattus norvegicus. Humans usually become infected withhantaviruses through contact with or inhalation of aerosolsand secretions from infected rodent hosts.Hunan Province has become one of the most severely
endemic areas in China since the first case was discov-ered in 1963. It is a traditional and mixed epidemic area,with SEOV the main hantavirus type and Mus musculus,R. norvegicus and A. agrarius the dominant rodent spe-cies. The incidence rate of HFRS peaked at 101.68/100,000in 1994, and it has become a great threat to the healthof the local population. Previous studies have found thatprecipitation, temperature, humidity, normalized difference
* Correspondence: [email protected]; [email protected]†Equal contributors1College of Resources and Environment Science, Hunan Normal University,Changsha 410081, ChinaFull list of author information is available at the end of the article
© 2013 Xiao et al.; licensee BioMed Central Ltd. This is an Open Access article distributed under the terms of the CreativeCommons Attribution License (http://creativecommons.org/licenses/by/2.0), which permits unrestricted use, distribution, andreproduction in any medium, provided the original work is properly cited.
Xiao et al. BMC Infectious Diseases 2013, 13:305http://www.biomedcentral.com/1471-2334/13/305

vegetation index (NDVI), and land use types are importantrisk factors for HFRS incidence [3-6].In recent years, ecological niche models (ENMs) have
been developed and used to examine associations betweenspatial risk factors and ecological niches in disease trans-mission [7]. Species distributions are constrained by aseries of evolutionary adaptations that are generally con-ceptualized as the ecological niche. Disease transmissioninvolves interacting species (pathogens, vectors and hosts),and the conjunction of their individual ecological nichesdetermines patterns of transmission. ENMs can be usedto analyze geographic and ecological information, andthen quantify potential risks based on vector, host andpathogen data [8,9]. To characterize geographic patternsof disease transmission, traditional methods usuallysummarize overall patterns and trends in the form of asmoothed surface, at some level of generalization oraveraging. This may involve loss of resolution and maynot take into account the fine-scale ecological variationthat underlies transmission patterns. However, ENMs per-mit fine-scale characterization of geographic patterns with-out loss of resolution [7,10].The characteristics of HFRS vary with locality, owing
to the vast and complex topography, intricate ecologicalenvironments, and varied climates of China. It is import-ant to identify the risk factors of HFRS and predict highrisk areas, thereby facilitating application of preventionstrategies to avoid or decrease loss of life. Since rodentpopulation density and species composition have signifi-cant impacts on HFRS occurrence, it is of great import-ance to analyze the relationship between rodent hostand HFRS incidence. In this study, we investigated the
effects of ecological and geographic factors on HFRSoccurrence using ENMs, and explored the relationshipbetween HFRS cases and rodent hosts by the Markovchain Monte Carlo (MCMC) method, using data fromChangsha, China.
MethodsStudy areaChangsha is the capital city of Hunan Province in centralChina, between 27°51'– 28°40'N and 111°53'– 114°5'E(Figure 1). Changsha is about 233 km long and 90 kmwide, with a total land area of 118,000 km2 and popula-tion of 6 million. Changsha is composed of the alluvialplain of the Xiangjiang River, which is a part of theCentral China Plain. The Xiangjiang and its branchesflow throughout the city, and cultivated land is widelydistributed along the rivers. Subtropical double-harvestrice is the main crop, and most farmers reside less than50 m from their farmlands. Traditional farming methodsprovide an opportunity for wild rodent propagation, offer-ing suitable living conditions and sufficient food resourcesto increase transmission of HFRS between rodents andfrom rodents to humans. Furthermore, HFRS rodent hostsare widely distributed in Changsha, including A. agrarius,R. norvegicus, M. musculus, Rattus flavipectus and Rattusrattoides. The infection rate of hantaviruses in some rodentspecies is relatively high; e.g., the rates of R. norvegicus andA. agrarius in 2005 were 3.17% and 2.80%, respectively.Meanwhile, a dense human population resulting from rapidurbanization in the Changsha-Zhuzhou-Xiangtan metrop-olis has increased interaction between people infected withhantavirus and those susceptible to infection. These factors
Figure 1 Location of study area, showing city of Changsha in mainland China.
Xiao et al. BMC Infectious Diseases 2013, 13:305 Page 2 of 11http://www.biomedcentral.com/1471-2334/13/305

provide an opportunity for HFRS to persist and spreadin Changsha. Since 2005, Ningxiang County has beenestablished as a national surveillance site to monitor therelationship between humans and HFRS host animals.
Ethical reviewThe study protocol was reviewed by the institutional re-view board of the Hunan CDC and ethics approval wasnot required.
Data collection and managementData on reported HFRS cases in Changsha from 2005 to2009 (Figure 2) were obtained from the Hunan NotifiableDisease Surveillance System (HNDSS) [11]. There were atotal of 327 case reports, which included the sex, ageand residential address of each patient, plus onset dateof symptoms for each case. The HNDSS HFRS data donot differentiate HTNV from SEOV infections. All caseswere geocoded by residential address at town or villagelevel using Google Earth. First, the city of Changsha wasentered, and then the name of the county or district.Finally, a more specific address, the name of town orvillage, was added. To ensure accuracy of the geocodingresults, Google Maps was also used in the same way.Surveillance on hantavirus infections among rodent
hosts was carried out in Ningxiang County, according tothe protocol established by Chinese Centers for DiseaseControl and Prevention. Representative villages were se-lected for rodent surveillance, according to the distribu-tion of HFRS epidemics and landscape elements. Indoorand outdoor rodent traps with peanuts were set at night,and recovered in the morning. The traps were placedabout 1 km away from villages in locations where ro-dents were most likely found, such as the edges of rivers
and roads, on ridges and in yards. Traps were set in spring(March to April) and autumn (September to October).More than 100 traps per patch were placed indoors at ap-proximately 12–15-meter intervals for three consecutivenights, and more than 200 traps per patch were placedoutdoors (every 5 meters in each row, with 50 metersbetween rows). A total of 22,060 traps were set, and 728rodents were captured from 2005 to 2009. Relative popu-lation density of rodents was used as an indicator ofabundance. This is calculated as the number of rodentscaptured, divided by the number of traps.Data on eco-geographical variables (possibly contribut-
ing to hantavirus transmission among rodent hosts) werecollected and processed in ArcGIS 9.3 (ESRI Inc., Redlands,CA, USA) (Table 1). Data for each variable were convertedto the same geographic projection (Gauss-Kruger-Xian1980) and clipped to the study area. Data on elevation,precipitation, temperature, precipitation seasonality andtemperature seasonality were obtained from WorldClim(http://www.worldclim.org/). Slope and aspect valueswere calculated from elevation in ArcGIS 9.3. Land usedata were obtained from the Second National Land Survey(http://www.mlr.gov.cn/zt/dierciquanguotudidiaocha/index.htm). The compound topographic index (CTI, also calledtopographic wetness index), a function of both slope andupstream contributing area per unit width orthogonal tothe flow direction, was obtained from the United StatesGeological Survey (http://eros.usgs.gov). The Human Foot-print Index was obtained from the Center for InternationalEarth Science Information (http://www.ciesin.columbia.edu/). Population in 2005 was obtained from the ChangshaStatistical Yearbook, and population density calculatedat the district and county level. The NDVI value from2005 to 2009 was obtained from the National Aeronautics
Figure 2 Monthly HFRS incidence in Changsha, from 2005 through 2009.
Xiao et al. BMC Infectious Diseases 2013, 13:305 Page 3 of 11http://www.biomedcentral.com/1471-2334/13/305
and Space Administration (http://ladsweb.nascom.nasa.gov/data/), and then average monthly values were calculated.All environmental variables were resampled to raster datawith a spatial resolution of 0.00833° (nearly 1 km).
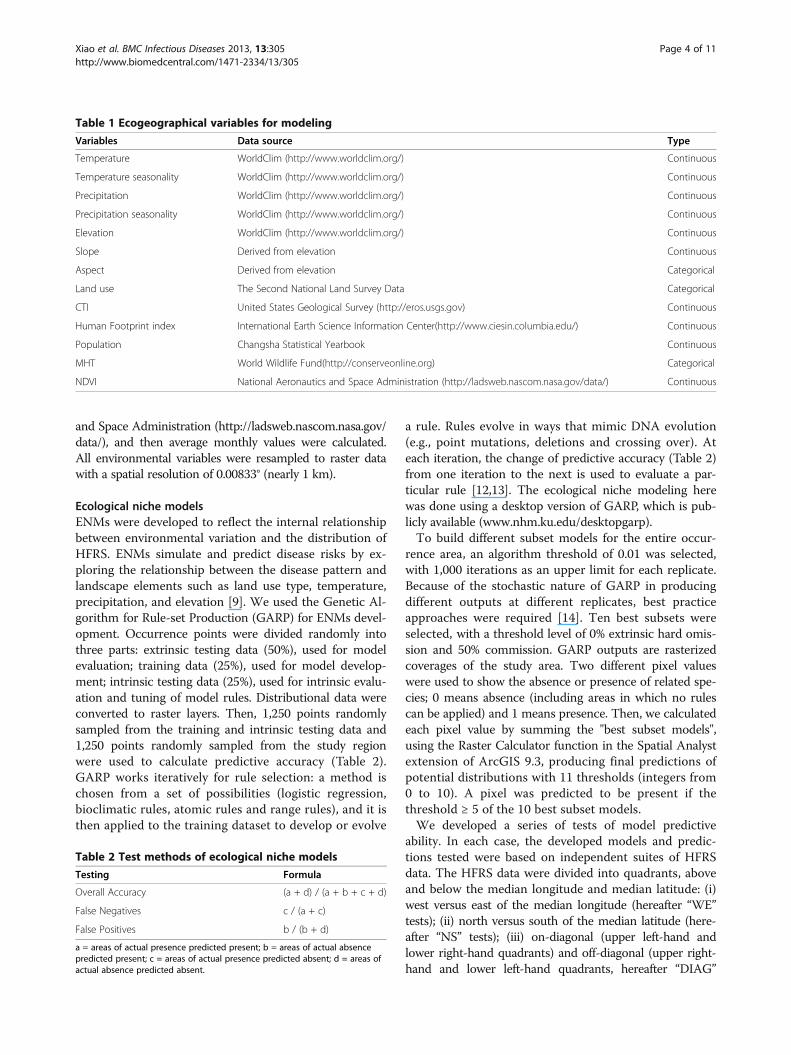
Ecological niche modelsENMs were developed to reflect the internal relationshipbetween environmental variation and the distribution ofHFRS. ENMs simulate and predict disease risks by ex-ploring the relationship between the disease pattern andlandscape elements such as land use type, temperature,precipitation, and elevation [9]. We used the Genetic Al-gorithm for Rule-set Production (GARP) for ENMs devel-opment. Occurrence points were divided randomly intothree parts: extrinsic testing data (50%), used for modelevaluation; training data (25%), used for model develop-ment; intrinsic testing data (25%), used for intrinsic evalu-ation and tuning of model rules. Distributional data wereconverted to raster layers. Then, 1,250 points randomlysampled from the training and intrinsic testing data and1,250 points randomly sampled from the study regionwere used to calculate predictive accuracy (Table 2).GARP works iteratively for rule selection: a method ischosen from a set of possibilities (logistic regression,bioclimatic rules, atomic rules and range rules), and it isthen applied to the training dataset to develop or evolve
a rule. Rules evolve in ways that mimic DNA evolution(e.g., point mutations, deletions and crossing over). Ateach iteration, the change of predictive accuracy (Table 2)from one iteration to the next is used to evaluate a par-ticular rule [12,13]. The ecological niche modeling herewas done using a desktop version of GARP, which is pub-licly available (www.nhm.ku.edu/desktopgarp).To build different subset models for the entire occur-
rence area, an algorithm threshold of 0.01 was selected,with 1,000 iterations as an upper limit for each replicate.Because of the stochastic nature of GARP in producingdifferent outputs at different replicates, best practiceapproaches were required [14]. Ten best subsets wereselected, with a threshold level of 0% extrinsic hard omis-sion and 50% commission. GARP outputs are rasterizedcoverages of the study area. Two different pixel valueswere used to show the absence or presence of related spe-cies; 0 means absence (including areas in which no rulescan be applied) and 1 means presence. Then, we calculatedeach pixel value by summing the "best subset models",using the Raster Calculator function in the Spatial Analystextension of ArcGIS 9.3, producing final predictions ofpotential distributions with 11 thresholds (integers from0 to 10). A pixel was predicted to be present if thethreshold ≥ 5 of the 10 best subset models.We developed a series of tests of model predictive
ability. In each case, the developed models and predic-tions tested were based on independent suites of HFRSdata. The HFRS data were divided into quadrants, aboveand below the median longitude and median latitude: (i)west versus east of the median longitude (hereafter “WE”tests); (ii) north versus south of the median latitude (here-after “NS” tests); (iii) on-diagonal (upper left-hand andlower right-hand quadrants) and off-diagonal (upper right-hand and lower left-hand quadrants, hereafter “DIAG”
Table 1 Ecogeographical variables for modeling
Variables Data source Type
Temperature WorldClim (http://www.worldclim.org/) Continuous
Temperature seasonality WorldClim (http://www.worldclim.org/) Continuous
Precipitation WorldClim (http://www.worldclim.org/) Continuous
Precipitation seasonality WorldClim (http://www.worldclim.org/) Continuous
Elevation WorldClim (http://www.worldclim.org/) Continuous
Slope Derived from elevation Continuous
Aspect Derived from elevation Categorical
Land use The Second National Land Survey Data Categorical
CTI United States Geological Survey (http://eros.usgs.gov) Continuous
Human Footprint index International Earth Science Information Center(http://www.ciesin.columbia.edu/) Continuous
Population Changsha Statistical Yearbook Continuous
MHT World Wildlife Fund(http://conserveonline.org) Categorical
NDVI National Aeronautics and Space Administration (http://ladsweb.nascom.nasa.gov/data/) Continuous
Table 2 Test methods of ecological niche models
Testing Formula
Overall Accuracy (a + d) / (a + b + c + d)
False Negatives c / (a + c)
False Positives b / (b + d)
a = areas of actual presence predicted present; b = areas of actual absencepredicted present; c = areas of actual presence predicted absent; d = areas ofactual absence predicted absent.
Xiao et al. BMC Infectious Diseases 2013, 13:305 Page 4 of 11http://www.biomedcentral.com/1471-2334/13/305

tests). In each case, we developed both reciprocal predic-tions, testing the ability of ENMs to predict the distributionof HFRS in regions where no sampling was available.Finally, data from 2005 through 2008 were used to de-velop the ENMs, and 2009 data were used to validatethe prediction (hereafter “Time” tests).To investigate relative contributions of the 25 environ-
mental variables, a jackknife procedure was used, whichwas performed by fitting the model with n-1 variablesand successively omitting one variable. Then, we com-pared the predictive accuracy of the subset models withthe comprehensive model (based on n variables), toeliminate variables that lead to over-fitting and to selectkey risk factors. Occurrence data from 2005 through 2008were used to perform the jackknife procedure, and theaverage area under the receiver operating characteristic(ROC)[15] curve (AUC) was used to evaluate predictiveaccuracy of the model. After the jackknife procedure, thefinal HFRS prediction was executed again by GARP, usingavailable variables.
Rodent species composition and HFRS occurrenceThe relative population density of rodents has importanteffects on HFRS occurrence. Rodent species compositionvaries with land use type. Since a certain land cover type isoften associated with the presence of hantavirus-infectedrodents, hantaviruses are usually associated with distinctrodent species. The annual proportion of HFRS caseswas based on five main land use types (cultivated land,orchard, forest, urban and water). We calculated theannual density of various types of rodents (A. agrarius,R. norvegicus, M. musculus, R. flavipectus and other spe-cies) and annual total rodent density from 2005 through2009 (Figure 3). Then, we used a Markov chain Monte Carlo(MCMC) method [16] to investigate the relationship be-tween rodent density and HFRS incidence. Matrix R
represents HFRS cases in different land use types; rowscorrespond to years, and columns to HFRS risks. MatrixC represents the density of different types of rodents;rows correspond to years, and columns to rodent dens-ity. Then, we calculated the coefficient matrix (Formula1). Next, the relationship between annual HFRS casesand total rodent density was analyzed using Formula 2.Related environmental variables and rodent monitoringdata were used to analyze potential associations betweenrodent species composition and HFRS incidence in dif-ferent land use types. The MCMC method was carriedout using Matlab software (vR2009b) (MathWorks Inc.,Natick, MA, USA)[16].
R11 R21 … Ri1
R12 R22
⋮ ⋱ ⋮R1j … Rij
0BB@
1CCA ¼ β⋅
C11 C21 ⋯ Ci1
C12 C22
⋮ ⋱ ⋮C1u ⋯ Ciu
0BB@
1CCA
ð1Þ
ψk ¼ θ1⋅γk þ θ2; ð2Þ
where Rij is the proportion of HFRS incidence in riskarea j in year i; β is the coefficient matrix; Ciu is the pro-portion of relative population density of rodents u inyear i; γk is the density of rodents in year k; ψk is thenumber of predicted HFRS cases.
ResultsModeling and testing approachesAll tests in this study found that independent sets of testpoints coincided with ENMs predictions, which weresignificantly better than random expectations (Table 3).Results of model testing showed that test points werewell predicted (at threshold levels of 5–10) in all subsets,
Figure 3 Composition of rodent species and HFRS cases in Changsha. (a) Proportion of each rodent species, from monitoring data; (b) proportionof HFRS cases in different risk areas.
Xiao et al. BMC Infectious Diseases 2013, 13:305 Page 5 of 11http://www.biomedcentral.com/1471-2334/13/305

except those of the WE testing. In these tests (especially"east predicts west"), fewer test points were correctlypredicted, with fewer areas predicted present (Table 3).However, results of all spatial calibration tests (Figure 4)correctly predicted the independent test points, as evi-dent from the significant level of binomial probability
(P< 0.01). Prediction of the overall study area at onetime scale also implied a good model fit (Figure 4 andTable 3).Results of the jackknife procedure showed that all envir-
onmental variables, except CTI and human populationdensity, contributed to model predictive ability. Exclusion
Table 3 Summary of model predictions and tests for Changsha
Model testing Sample size No. of successes Proportion ofpredicted area
Cumulative bino-mialprobabilityTrain Test
NS
North predicts south 162 165 131 0.3544 <0.01
South predicts north 165 162 151 0.5303 <0.01
WE
West predicts east 246 81 42 0.1806 <0.01
East predicts west 81 246 6 0.0582 <0.01
DIAG
On predicts off 157 170 121 0.3001 <0.01
Off predicts on 170 157 137 0.4576 <0.01
Time
05-08 predicts 09 262 65 62 0.3792 <0.01
Figure 4 Examples of spatially stratified tests of ENMs predictions of HFRS distributions in Changsha. (a) Occurrences in westernquadrants were used to predict distributions of cases in eastern quadrants; (b) occurrences in eastern quadrants were used to predict distributions ofcases in western quadrants; (c) occurrences in northern quadrants were used to predict distributions of cases in southern quadrants; (d) occurrences insouthern quadrants were used to predict distributions of cases in northern quadrants; (e) occurrences in off-diagonal quadrants were used to predictdistributions of cases in on-diagonal quadrants; (f) occurrences in on-diagonal quadrants were used to predict distributions of cases in off-diagonalquadrants; and (g) occurrences from 2005 through 2008 were used to predict distributions of cases in 2009.
Xiao et al. BMC Infectious Diseases 2013, 13:305 Page 6 of 11http://www.biomedcentral.com/1471-2334/13/305

of temperature seasonality, land use, elevation and NDVI(mainly in November, January and June) resulted in thegreatest deviations (Table 4).Data from 2005 through 2008 were then used to de-
velop the final prediction model, and 65 HFRS cases in2009 were used to validate the prediction. Populationdensity and CTI were excluded, and 10 best subset modelswere calculated for a prediction map (Figure 5). The re-sults show that ENMs independently predicted 58 of 65cases in high risk areas (45 cases were predicted by all 10subset models) in 2009. Evaluation data were merged with10,000 randomly selected background points and enteredinto a ROC analysis, to derive the AUC. The average AUCwas 0.855 (95% CI: 0.821–0.886, SD = 0.017, P< 0.01), in-dicating that model performance was satisfactory.
Ecological characteristics of predicted resultsThe exploratory visualizations describe ecological charac-teristics of the predicted results of HFRS occurrence in
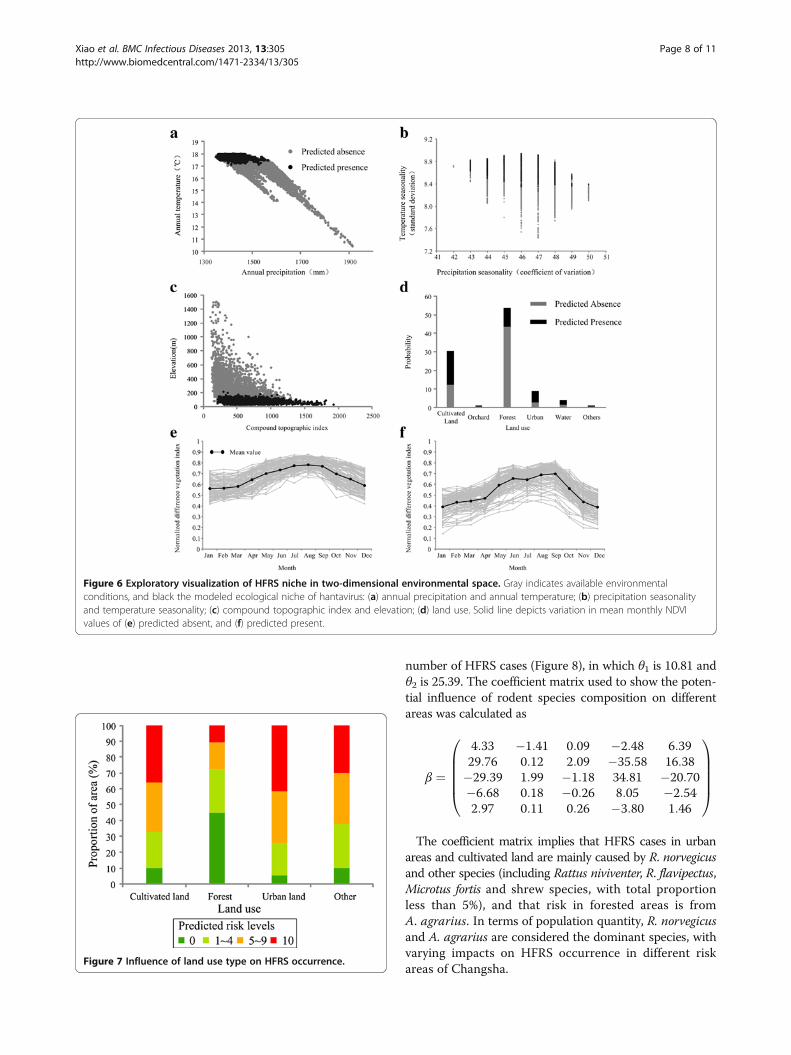
Changsha, with the 10,000 randomly selected points inareas predicted absent versus present (Figure 6). The re-sults show that HFRS occurrence was restricted to areas ofstrong temperature seasonality (Figure 6b), with mean an-nual temperature around 17.5°C (Figure 6a), precipitationbelow 1600 mm (Figure 6a), and elevation below 200 m(Figure 6c). Risk was concentrated in cultivated and urbanland (Figure 6d). The risk level of HFRS is correlated withan increase in area of cultivated and urban land, and adecrease in forested areas (Figure 7). The NDVI value inareas predicted present is lower than in areas predictedabsent, but with substantial seasonal variation (Figure 6eand Figure 6f ).
Rodent host and HFRS occurrenceCorrelation analysis showed that the number of HFRS caseswas remarkably associated with rodent density (r = 0.84,P = 0.07). The prediction model provided reasonably goodfits of the relationship between rodent density and
Table 4 Summary of statistical analysis of jackknife procedure
Variables excluded AUC# Std Dev Variables excluded AUC# Std Dev
Aspect 0.827 .017 NDVI(Jan) 0.806 .018
CTI* 0.860 .016 NDVI(Feb) 0.822 .021
elevation 0.817 .018 NDVI(Mar) 0.830 .021
Ecology 0.821 .016 NDVI(Apr) 0.827 .016
Land use 0.813 .016 NDVI(May) 0.839 .017
MHT 0.841 .017 NDVI(Jun) 0.814 .017
Population density* 0.855 .016 NDVI(Jul) 0.830 .020
Precipitation 0.821 .017 NDVI(Aug) 0.838 .019
Precipitation seasonality 0.831 .017 NDVI(Sep) 0.824 .017
Human footprint index 0.823 .017 NDVI(Oct) 0.819 .019
Slope 0.833 .018 NDVI(Nov) 0.788 .018
Temperature 0.831 .017 NDVI(Dec) 0.832 .017
Temperature seasonality 0.810 .017# AUC value of ENMs when variables were excluded.* Indicates exclusion of this variable from the model to improve its accuracy.
Figure 5 Predicted risk map for HFRS in 2009, overlaid with HFRS case localities in 2009.
Xiao et al. BMC Infectious Diseases 2013, 13:305 Page 7 of 11http://www.biomedcentral.com/1471-2334/13/305
number of HFRS cases (Figure 8), in which θ1 is 10.81 andθ2 is 25.39. The coefficient matrix used to show the poten-tial influence of rodent species composition on differentareas was calculated as
β ¼
4:33 �1:41 0:09 �2:48 6:3929:76 0:12 2:09 �35:58 16:38�29:39 1:99 �1:18 34:81 �20:70�6:68 0:18 �0:26 8:05 �2:542:97 0:11 0:26 �3:80 1:46
0BBBB@
1CCCCA
The coefficient matrix implies that HFRS cases in urbanareas and cultivated land are mainly caused by R. norvegicusand other species (including Rattus niviventer, R. flavipectus,Microtus fortis and shrew species, with total proportionless than 5%), and that risk in forested areas is fromA. agrarius. In terms of population quantity, R. norvegicusand A. agrarius are considered the dominant species, withvarying impacts on HFRS occurrence in different riskareas of Changsha.
Figure 6 Exploratory visualization of HFRS niche in two-dimensional environmental space. Gray indicates available environmentalconditions, and black the modeled ecological niche of hantavirus: (a) annual precipitation and annual temperature; (b) precipitation seasonalityand temperature seasonality; (c) compound topographic index and elevation; (d) land use. Solid line depicts variation in mean monthly NDVIvalues of (e) predicted absent, and (f) predicted present.
Figure 7 Influence of land use type on HFRS occurrence.
Xiao et al. BMC Infectious Diseases 2013, 13:305 Page 8 of 11http://www.biomedcentral.com/1471-2334/13/305

DiscussionWith rapid development of the economy and urbanization,the environment in China has changed greatly. Continuoushabitat changes for rodent hosts are believed to influencethe spatial distribution of HFRS, extending the main epi-demic areas from rural to urban areas. This study improvesour understanding of the transmission patterns of HFRS.The correlation between rodent species composition andHFRS occurrence also provides a valuable approach forpredicting HFRS risk.Human activities including rapid urbanization, defor-
estation, agricultural invasion, land use change, pollutionand population migration are considered important fac-tors for the outbreak and reemergence of various infec-tious diseases, and for heterogeneity in the incidenceand spatial distribution of these diseases [17-19]. Forestis the most extensive land cover type in Changsha, butthe risk level there is low. However, risk levels in culti-vated land and urban areas are relatively high.NDVI is correlated with amount and productivity of
vegetation and crops, which are the main food sourcesfor rodents. The NDVI is higher in thick vegetative areas,such as forests and orchards, and lower in cultivated landareas, with significant seasonal variations. HFRS occur-rence is closely associated with NDVI. HFRS risk is alsoaffected by differences in local climates. Meteorologicalfactors, including humidity, temperature and precipitation,
influence not only the infectivity and vitality of hantavirusbut also the distribution of rodent hosts [3]. Moist envi-ronments are conducive to the vitality and infectivity ofHantaan virus and to the existence and distribution ofrodents. However, too much precipitation destroys therodent habitat, decreasing the population [4]. HFRS casesare rarely reported in very dry or very wet areas [20]. InChangsha, the high risk areas mostly concentrate in loca-tions with annual temperature around 17.5°C and annualprecipitation between 1,300 and 1,600 mm.The density and species composition of rodent hosts
are closely associated with HFRS occurrence. Usually, HFRSincidence escalates with rodent density, and vice versa.Each hantavirus species is predominately associated with adistinct or a few related rodents as its host. Since differentrodent species adapt to various environments and habi-tats, rodent impacts vary by area. This study showed thatA. agrarius and R. norvegicus are the two predominantanimal hosts; A. agrarius is abundant in forested areas,and R. norvegicus is predominant in urban and cultivatedareas. Correlation analysis between HFRS incidence androdent species composition indicates that the main HFRSrisks are concentrated in urban and cultivated land andforests, which is consistent with ENMs prediction.ENMs were used to identify the relationship between
HFRS cases and the environment. This was done to ex-plore non-random association between environmental
Figure 8 Association between HFRS cases and relative population density of rodents predicted by MCMC. (a) Kernel density estimates ofposterior distributions; (b) pairwise scatterplots of columns of the chain; (c) histogram of error standard deviation; (d) predictive envelopes of the model.
Xiao et al. BMC Infectious Diseases 2013, 13:305 Page 9 of 11http://www.biomedcentral.com/1471-2334/13/305

characteristics and known epidemic areas and the entirestudy area, and to predict potential risks based on thebasic ecological demands of HFRS. The MCMC methodwas used to predict HFRS cases in various areas basedon surveillance data of rodent hosts, and cases in diverseland use types. The MCMC results further validated thepredictive results of the ENMs. Therefore, this study offersa valuable approach to predict HFRS risk and to analyzetransmission patterns in cases when “absence” data areunavailable. The results have important implications forthe prevention and control of HFRS. The final predictionmodel can be used as a guide map for possible futureoutbreaks in Changsha, and related risk factors may beused as predictors of HFRS occurrence. For the largecentral area of the map (Changsha County), a predictedhigh risk area, special measures may needed to preventthe spread of HFRS. Since A. agrarius is abundant inforests, and R. norvegicus is predominant in urban andcultivated areas, different preventive measures are neededin different areas. All this information provides guidancefor public health action.
ConclusionsThe results of temporal testing based on the entire re-gion are clearly better than other spatial calibration tests,and only a few test points were correctly predicted in theWE tests (especially the "east predicts west" test). Moreapplications may be required to investigate ecological dif-ferences between HFRS occurrence in the eastern andwestern areas of Changsha. For optimal performance oftemporal testing, time-specific ENMs are suggested forobtaining more specific and detailed disease occurrenceinformation. Limitations of this study should also be ac-knowledged. The data are from a passive surveillancesystem, so their quality is not as high as those collectedfrom active surveillance. The environmental variablesused in the models are nearly abiotic factors, but in fact,biotic factors are important in disease occurrence. Pre-vious studies have indicated that varying modeling ap-proaches can yield substantially different predictions [21,22];therefore, selection of modeling methods and environ-mental variables should be taken into careful consider-ation. Future work is required to address these issues.
Competing interestsAll authors declare that they have no competing interests.
Authors' contributionsHX, XL, JQ, LG, HT were involved in the conceptualization, research design,execution and write-up of the first draft of the manuscript. NL, CH and JZcontributed to database design and data analysis. BC and PZ advised on thestudy design and the analysis and interpretation of results. All authors wereinvolved in preparation of the manuscript.All authors read and approved thefinal manuscript.
AcknowledgmentsThe authors extend their appreciation to Ruchun Liu and Tianmu Chen forproviding the data. This work was supported by the Key DisciplineConstruction Project in Hunan Province (2008001), National Natural ScienceFoundation (40971038), Scientific Research Fund of the Hunan ProvincialEducation Department (11K037), Hunan Provincial Natural ScienceFoundation of China (11JJ3119), Science and Technology Planning Project ofHunan Province, China (2010SK3007), and Key Subject Construction Projectof Hunan Normal University (geographic information systems).
Author details1College of Resources and Environment Science, Hunan Normal University,Changsha 410081, China. 2Hunan Provincial Center for Disease Control andPrevention, Changsha 410002, China. 3Centre for Environment andPopulation Health, School of Environment, Griffith University, Brisbane,Queensland 4111, Australia. 4West China School of Public Health, SichuanUniversity, Chengdu 610041, China. 5Changsha Municipal Center for DiseaseControl and Prevention, Changsha 410001, China. 6Peking University HealthScience Center, Beijing 100191, China.
Received: 24 February 2012 Accepted: 17 June 2013Published: 3 July 2013
References1. Luo CW, Chen HX: Study on the factors influenced epidemic of
hemorrhagic fever with renal syndrome [in Chinese]. Chin J Vector Bio &Control 2003, 14:451–454.
2. Papa A, Bojovic B, Antoniadis A: Hantaviruses in Serbia and Montenegro.Emerg Infect Dis 2006, 12:1015–1018.
3. Zhang WY, Guo WD, Fang LQ, Li CP, Bi P, Glass GE, Jiang JF, Sun SH, Qian Q,Liu W, et al: Climate variability and hemorrhagic fever with renalsyndrome transmission in northeastern China. Environ Health Persp 2010,118:915–920.
4. Fang LQ, Wang XJ, Liang S, Li YL, Song SX, Zhang WY, Qian Q, Li YP, Wei L,Wang ZQ, et al: Spatiotemporal trends and climatic factors ofhemorrhagic fever with renal syndrome epidemic in Shandong Province.China. PLoS Negl Trop Dis 2010, 4:e789.
5. Viel JF, Lefebvre A, Marianneau P, Joly D, Giraudoux P, Upegui E, Tordo N, HoenB: Environmental risk factors for haemorrhagic fever with renal syndrome ina French new epidemic area. Epidemiol Infect 2011, 139:867–874.
6. Yan L, Fang LQ, Huang HG, Zhang LQ, Feng D, Zhao WJ, Zhang WY, Li XW,Cao WC: Landscape elements and Hantaan virus-related hemorrhagicfever with renal syndrome, People's Republic of China. Emerg Infect Dis2007, 13:1301–1306.
7. Peterson AT: Ecologic niche modeling and spatial patterns of diseasetransmission. Emerg Infect Dis 2006, 12:1822–1826.
8. Guisan A, Zimmermann NE: Predictive habitat distribution models inecology. Ecol Model 2000, 135:147–186.
9. Wei L, Qian Q, Wang ZQ, Glass GE, Song SX, Zhang WY, Li XJ, Yang H, Wang XJ,Fang LQ, et al: Using Geographic Information System-based Ecologic NicheModels to Forecast the Risk of Hantavirus Infection in Shandong Province,China. Am J Trop Med Hyg 2011, 84:497–503.
10. Peterson AT: Ecological niche modelling and understanding thegeography of disease transmission. Vet Ital 2007, 43:393–400.
11. Ministry of Health: Handbook of Epidemic Hemorrhagic Fever Prevention andControl. Beijing: China People's Health Publishing House; 1998.
12. Stockman AK, Beamer DA, Bond JE: An evaluation of a GARP model as anapproach to predicting the spatial distribution of non‐vagileinvertebrate species. Divers Distrib 2006, 12:81–89.
13. Stockwell D, Peters D: The GARP modelling system: problems and solutionsto automated spatial prediction. Int J Geogr Inf Sci 1999, 13:143–158.
14. Anderson RP, Lew D, Peterson AT: Evaluating predictive models ofspecies' distributions: criteria for selecting optimal models. Ecol Model2003, 162:211–232.
15. Phillips SJ, Anderson RP, Schapire RE: Maximum entropy modeling ofspecies geographic distributions. Ecol Model 2006, 190:231–259.
16. Haario H, Laine M, Mira A, Saksman E: DRAM: efficient adaptive MCMC.Stat Comput 2006, 16:339–354.
17. Pimentel D, Cooperstein S, Randell H, Filiberto D, Sorrentino S, Kaye B,Nicklin C, Yagi J, Brian J, O’hern J, et al: Ecology of increasing diseases:
Xiao et al. BMC Infectious Diseases 2013, 13:305 Page 10 of 11http://www.biomedcentral.com/1471-2334/13/305

population growth and environmental degradation. Hum Ecol 2007,35:653–668.
18. Patz JA, Daszak P, Tabor GM, Aguirre AA, Pearl M, Epstein J, Wolfe ND,Kilpatrick AM, Foufopoulos J, Molyneux D, et al: Unhealthy landscapes:policy recommendations on land use change and infectious diseaseemergence. Environ Health Persp 2004, 112:1092–1098.
19. Fang LQ, Yan L, Liang S, De Vlas SJ, Feng D, Han X, Zhao W, Xu B, Bian L,Yang H, et al: Spatial analysis of hemorrhagic fever with renal syndromein China. BMC Infect Dis 2006, 6:77.
20. Bi P, Wu X, Zhang F, Parton KA, Tong S: Seasonal rainfall variability, theincidence of hemorrhagic fever with renal syndrome, and prediction ofthe disease in low-lying areas of China. Am J Epidemiol 1998, 148:276–281.
21. Elith J, Graham CH, Anderson RP, Dudik M, Ferrier S, Guisan A, Hijmans RJ,Huettmann F, Leathwick JR, Lehmann A, et al: Novel methods improveprediction of species' distributions from occurrence data. Ecography 2006,29:129–151.
22. Tsoar A, Allouche O, Steinitz O, Rotem D, Kadmon R: A comparativeevaluation of presence-only methods for modelling species distribution.Divers Distrib 2007, 13:397–405.
doi:10.1186/1471-2334-13-305Cite this article as: Xiao et al.: Ecology and geography of hemorrhagicfever with renal syndrome in Changsha, China. BMC Infectious Diseases2013 13:305.
Submit your next manuscript to BioMed Centraland take full advantage of:
• Convenient online submission
• Thorough peer review
• No space constraints or color figure charges
• Immediate publication on acceptance
• Inclusion in PubMed, CAS, Scopus and Google Scholar
• Research which is freely available for redistribution
Submit your manuscript at www.biomedcentral.com/submit
Xiao et al. BMC Infectious Diseases 2013, 13:305 Page 11 of 11http://www.biomedcentral.com/1471-2334/13/305