Potential Impacts of Climate Change on Agriculture: A Case of Study of Coffee Production in...
30
POTENTIAL IMPACTS OF CLIMATE CHANGE ON AGRICULTURE: A CASE OF STUDY OF COFFEE PRODUCTION IN VERACRUZ, MEXICO C. GAY, F. ESTRADA, C. CONDE, H. EAKIN and L. VILLERS Centro de Ciencias de la Atm´ osfera, UNAM, Ciudad Universitaria, Circuito Exterior, 04510, Mexico, DF, Mexico E-mail: [email protected] Abstract. This paper explores the relation between coffee production and climatic and economic variables in Veracruz in order to estimate the potential impacts of climate change. For this purpose, an econometric model is developed in terms of those variables. The model is validated by means of statistical analysis, and then used to project coffee production under different climatic conditions. Climate change scenarios are produced considering that the observed trends of climate variables will continue to prevail until the year 2020. An approach for constructing simple probability scenarios for future climate variability is presented and used to assess possible impacts of climate change beyond what is expected from changes in mean values. The model shows that temperature is the most relevant climatic factor for coffee production, since production responds significantly to seasonal temperature patterns. The results for the projected climate change conditions for year 2020 indicate that coffee production might not be economically viable for producers, since the model indicates a reduction of 34% of the current production. Although different economic variables (the state and international coffee prices, a producer price index for raw materials for coffee benefit, the national and the USA coffee stocks) were considered as potentially relevant, our model suggests that the state real minimum wage could be regarded as the most important economic variable. Real minimum wage is interpreted here as a proxy for the price of labor employed for coffee production. This activity in Mexico is very labor intensive representing up to 80% of coffee production costs. As expected, increments in the price of such an important production factor increase production costs and have strong negative effects on production. Different assumptions on how real minimum wage could evolve for the year 2020 are considered for developing future production scenarios. 1. Introduction The Working Group II of the Intergovernmental Panel on Climate Change (IPCC, WGII, 2001), concluded in its Third Assessment Report with “high confi- dence” (90 to 99% of confidence) that Latin America is highly vulnerable to climate change, given its current low adaptive capacity, particularly to extreme events. In this context, it is also highly probable that the crop yields will diminish significantly, that pests will expand their range and that biodiversity will be highly threatened. Previous climate change studies for Mexico (Gay et al., 1995, 1996; Gay, 2000) concluded that the country would be likely to experience higher temperatures and hence higher evaporation rates with a doubling of CO 2 . Statistical downscaling methods also indicate that summer rainfall might decrease in most of the coun- try and increase during winter in the northern region, similar to those conditions Climatic Change (2006) 79: 259–288 DOI: 10.1007/s10584-006-9066-x c Springer 2006
Transcript of Potential Impacts of Climate Change on Agriculture: A Case of Study of Coffee Production in...
POTENTIAL IMPACTS OF CLIMATE CHANGE ON AGRICULTURE: ACASE OF STUDY OF COFFEE PRODUCTION IN VERACRUZ, MEXICO
C. GAY, F. ESTRADA, C. CONDE, H. EAKIN and L. VILLERS
Centro de Ciencias de la Atmosfera, UNAM, Ciudad Universitaria, Circuito Exterior, 04510,Mexico, DF, Mexico
E-mail: [email protected]
Abstract. This paper explores the relation between coffee production and climatic and economic
variables in Veracruz in order to estimate the potential impacts of climate change. For this purpose,
an econometric model is developed in terms of those variables. The model is validated by means of
statistical analysis, and then used to project coffee production under different climatic conditions.
Climate change scenarios are produced considering that the observed trends of climate variables will
continue to prevail until the year 2020. An approach for constructing simple probability scenarios for
future climate variability is presented and used to assess possible impacts of climate change beyond
what is expected from changes in mean values.
The model shows that temperature is the most relevant climatic factor for coffee production, since
production responds significantly to seasonal temperature patterns. The results for the projected
climate change conditions for year 2020 indicate that coffee production might not be economically
viable for producers, since the model indicates a reduction of 34% of the current production.
Although different economic variables (the state and international coffee prices, a producer price
index for raw materials for coffee benefit, the national and the USA coffee stocks) were considered
as potentially relevant, our model suggests that the state real minimum wage could be regarded as the
most important economic variable. Real minimum wage is interpreted here as a proxy for the price
of labor employed for coffee production. This activity in Mexico is very labor intensive representing
up to 80% of coffee production costs. As expected, increments in the price of such an important
production factor increase production costs and have strong negative effects on production. Different
assumptions on how real minimum wage could evolve for the year 2020 are considered for developing
future production scenarios.
1. Introduction
The Working Group II of the Intergovernmental Panel on Climate Change(IPCC, WGII, 2001), concluded in its Third Assessment Report with “high confi-dence” (90 to 99% of confidence) that Latin America is highly vulnerable to climatechange, given its current low adaptive capacity, particularly to extreme events. Inthis context, it is also highly probable that the crop yields will diminish significantly,that pests will expand their range and that biodiversity will be highly threatened.
Previous climate change studies for Mexico (Gay et al., 1995, 1996; Gay, 2000)concluded that the country would be likely to experience higher temperatures andhence higher evaporation rates with a doubling of CO2. Statistical downscalingmethods also indicate that summer rainfall might decrease in most of the coun-try and increase during winter in the northern region, similar to those conditions
Climatic Change (2006) 79: 259–288
DOI: 10.1007/s10584-006-9066-x c© Springer 2006
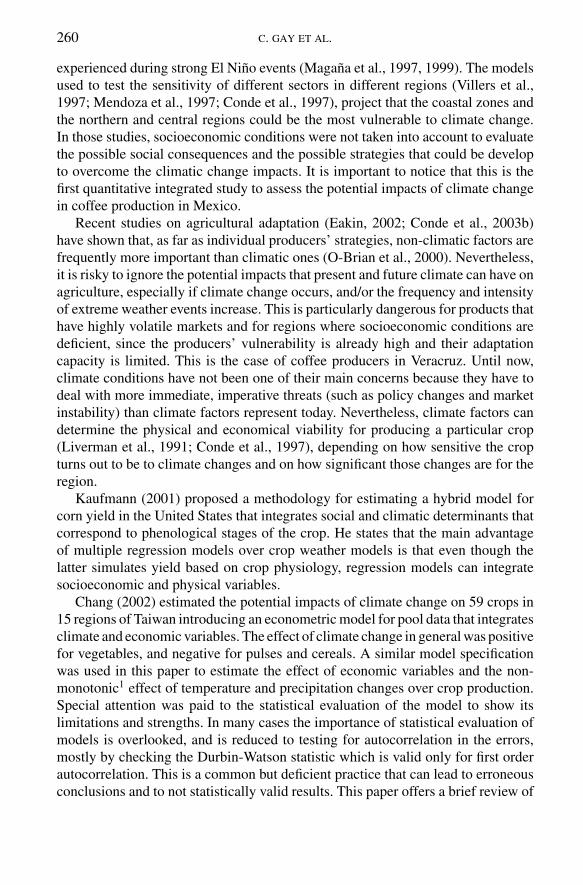
260 C. GAY ET AL.
experienced during strong El Nino events (Magana et al., 1997, 1999). The modelsused to test the sensitivity of different sectors in different regions (Villers et al.,1997; Mendoza et al., 1997; Conde et al., 1997), project that the coastal zones andthe northern and central regions could be the most vulnerable to climate change.In those studies, socioeconomic conditions were not taken into account to evaluatethe possible social consequences and the possible strategies that could be developto overcome the climatic change impacts. It is important to notice that this is thefirst quantitative integrated study to assess the potential impacts of climate changein coffee production in Mexico.
Recent studies on agricultural adaptation (Eakin, 2002; Conde et al., 2003b)have shown that, as far as individual producers’ strategies, non-climatic factors arefrequently more important than climatic ones (O-Brian et al., 2000). Nevertheless,it is risky to ignore the potential impacts that present and future climate can have onagriculture, especially if climate change occurs, and/or the frequency and intensityof extreme weather events increase. This is particularly dangerous for products thathave highly volatile markets and for regions where socioeconomic conditions aredeficient, since the producers’ vulnerability is already high and their adaptationcapacity is limited. This is the case of coffee producers in Veracruz. Until now,climate conditions have not been one of their main concerns because they have todeal with more immediate, imperative threats (such as policy changes and marketinstability) than climate factors represent today. Nevertheless, climate factors candetermine the physical and economical viability for producing a particular crop(Liverman et al., 1991; Conde et al., 1997), depending on how sensitive the cropturns out to be to climate changes and on how significant those changes are for theregion.
Kaufmann (2001) proposed a methodology for estimating a hybrid model forcorn yield in the United States that integrates social and climatic determinants thatcorrespond to phenological stages of the crop. He states that the main advantageof multiple regression models over crop weather models is that even though thelatter simulates yield based on crop physiology, regression models can integratesocioeconomic and physical variables.
Chang (2002) estimated the potential impacts of climate change on 59 crops in15 regions of Taiwan introducing an econometric model for pool data that integratesclimate and economic variables. The effect of climate change in general was positivefor vegetables, and negative for pulses and cereals. A similar model specificationwas used in this paper to estimate the effect of economic variables and the non-monotonic1 effect of temperature and precipitation changes over crop production.Special attention was paid to the statistical evaluation of the model to show itslimitations and strengths. In many cases the importance of statistical evaluation ofmodels is overlooked, and is reduced to testing for autocorrelation in the errors,mostly by checking the Durbin-Watson statistic which is valid only for first orderautocorrelation. This is a common but deficient practice that can lead to erroneousconclusions and to not statistically valid results. This paper offers a brief review of

POTENTIAL IMPACTS OF CLIMATE CHANGE ON AGRICULTURE 261
some of the tests that are used in econometrics for assessing the statistical qualityof models. The issue of multicollineality and its implications is also discussed.The adjusted R squared is proposed as an alternative criterion to infer if regressorsshould be excluded from the model when the t-statistic becomes unreliable.
This study focuses on the sensitivity of coffee production in Veracruz to changesin temperature and precipitation as well as to changes in economic variables. After-ward, trends and variability of climate variables are analyzed and climate changescenarios are used to asses the potential impact on coffee production. Some possiblesocioeconomic implications are discussed under these varying conditions.
The results presented here are part of an investigation that is taking place underthe AIACC2 project, which main objective is to make an integrated assessmentof social vulnerability and adaptation to climate variability and change. For thatpurpose, a case study is being developed in the state of Veracruz, Mexico, with aninterdisciplinary approach (meteorology, climatology, sociology, economics andbiology). For this project key regional stakeholders (producers, decision makers,NGOs leaders) were involved, collecting their opinions during several workshops.Also, several interviews and surveys were conducted during 2002 and 2003, tounderstand the perceptions and strategies applied by producers (Castellanos et al.,2003; Conde et al., 2003b).
Veracruz is located in the eastern part of Mexico, between latitudes 17◦09′
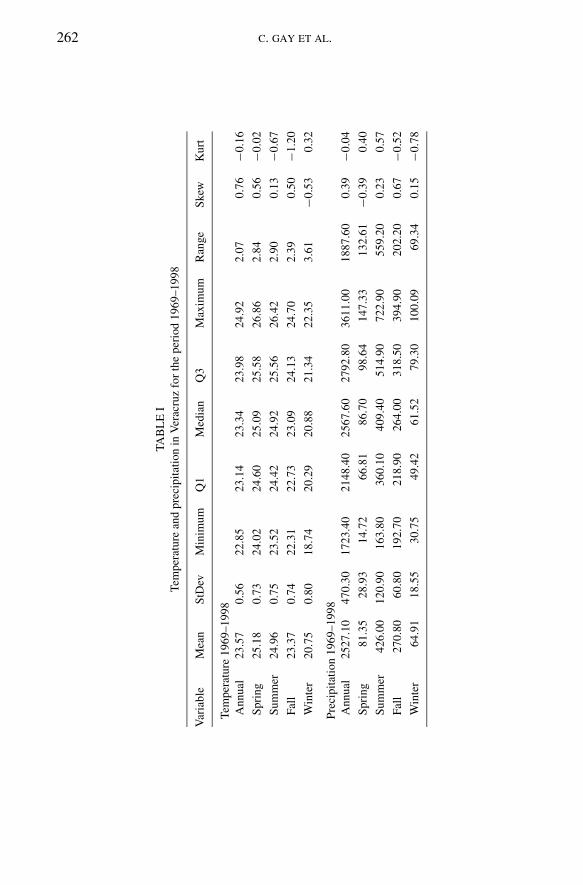
and 22◦28′ North and longitudes 93◦36′ and 98◦39′ West, and borders the Gulf ofMexico. The state accounts for 3.7% of Mexico’s total surface. Veracruz has largealtitude variations: lands near the coast are flat and low, but, as distance increasesfrom the coast, it rises up to 3,000 meters over sea level at its highest point. Thesealtitude differences produce great diversity of climates, although most of the state(about 84%) has a warm, humid and sub-humid climate. As it is shown in Table I,both annual temperature and precipitation in Veracruz have a fairly symmetricaldistribution with an average value of 23.56 ◦C and a standard deviation of 0.55 ◦C,and average of 2,527.07 mm with a standard deviation of 470.3 respectively. Theseclimatic conditions are favorable for agriculture, especially for coffee production.In the same table it can be seen that as for seasonal temperature winter is the mostvariable season with a standard deviation of 0.8 ◦C and a range of 3.6 ◦C. In the caseof seasonal precipitation the wet (summer, fall) and dry seasons (spring, winter)are clearly differentiated.
Douglas (1993) defined 18 climatological regions for Mexico according to sim-ilarities in slope aspect, station elevation, the amount of data on temperature andprecipitation available for the period 1947–1988. Veracruz corresponds to Douglas’region number 15. According to this classification, climate conditions for differentareas within the state can be well approximated using data for the whole region,including the municipalities of Coatepec, Xico and Huatusco where 90% of thestate’s coffee production comes from.3
Agriculture in Veracruz is very important. It generates 7.9% of the state’s GDPand provides jobs for 31.7% of the state’s labor force (Gobierno del Estado de
262 C. GAY ET AL.
TA
BL
EI
Tem
per
atu
rean
dp
reci
pit
atio
nin
Ver
acru
zfo
rth
ep
erio
d1
96
9–
19
98
Var
iab
leM
ean
StD
evM
inim
um
Q1
Med
ian
Q3
Max
imu
mR
ang
eS
kew
Ku
rt
Tem
per
atu
re1
96
9–
19
98
An
nu
al2
3.5
70
.56
22
.85
23
.14
23
.34
23
.98
24
.92
2.0
70
.76
−0.1
6
Sp
rin
g2
5.1
80
.73
24
.02
24
.60
25
.09
25
.58
26
.86
2.8
40
.56
−0.0
2
Su
mm
er2
4.9
60
.75
23
.52
24
.42
24
.92
25
.56
26
.42
2.9
00
.13
−0.6
7
Fal
l2
3.3
70
.74
22
.31
22
.73
23
.09
24
.13
24
.70
2.3
90
.50
−1.2
0
Win
ter
20
.75
0.8
01
8.7
42
0.2
92
0.8
82
1.3
42
2.3
53
.61
−0.5
30
.32
Pre
cip
itat
ion
19
69
–1
99
8
An
nu
al2
52
7.1
04
70
.30
17
23
.40
21
48
.40
25
67
.60
27
92
.80
36
11
.00
18
87
.60
0.3
9−0
.04
Sp
rin
g8
1.3
52
8.9
31
4.7
26
6.8
18
6.7
09
8.6
41
47
.33
13
2.6
1−0
.39
0.4
0
Su
mm
er4
26
.00
12
0.9
01
63
.80
36
0.1
04
09
.40
51
4.9
07
22
.90
55
9.2
00
.23
0.5
7
Fal
l2
70
.80
60
.80
19
2.7
02
18
.90
26
4.0
03
18
.50
39
4.9
02
02
.20
0.6
7−0
.52
Win
ter
64
.91
18
.55
30
.75
49
.42
61
.52
79
.30
10
0.0
96
9.3
40
.15
−0.7
8
POTENTIAL IMPACTS OF CLIMATE CHANGE ON AGRICULTURE 263
Veracruz, 2001). Coffee production contributes notably to these numbers. Veracruzranks as Mexico’s second largest coffee producer although coffee plantations(Coffea arabica) in the state are relatively recent, becoming an important agri-cultural activity after the ‘50s decade, particularly due to the good prices after theSecond World War (Bartra, 1999). According to the state government4 the typesof Coffea arabica cultivated are Typica (22%), Bourbon (19%), Caturra (19%),Garnica (19%) and Mundo Novo and others (22%). Until the eighties, governmen-tal policies favored an increase of nearly 75% of the production and a duplicationof the number of coffee producers in the country, with plantations of less than10 Ha. However, since the nineties there has been a combination of national andinternational factors that have put coffee producers in Mexico in a critical situa-tion. In “Perspectives of coffee production in Mexico”, the Consejo Mexicano delCafe (2001) states that the main international factors affecting coffee productionin Mexico are the international prices of coffee that have been decreasing, thatthe coffee market is saturated because world’s production has increased notably,specially with low quality coffee from Asian countries such as Vietnam and India5
while coffee demand has remained almost constant. At the national level, since theINMECAFE (Mexican Coffee Institute) disappeared in the early 1990’s, there hasnot been a coordinating institution to help designing and implementing productionand market strategies (and policies) to cope with the price crisis. National and in-ternational coffee prices are so low that in many cases producers are not able tocover their production costs and are now facing strong competition from low-pricedcoffee . Even though the quality of that coffee is very low compared to the Mexicanproduct, it is preferred by industries of processed coffee.
What it is now an apparent national coping strategy in the rural areas in Mexico,particularly in Veracruz, is rural migration to urban areas or, preferably, to the UnitedStates of America, where 50,000 Mexicans migrate every year (Perez, 2005).
Climatic extreme events, such as droughts, floods, frosts and heat waves affectcoffee production in Veracruz (Conde et al., 2005). Drought conditions or heatwaves during summer diminish the quality of the production or can even implyimportant losses in the overall production. Also, frosts events during winter haveaffected coffee plantations in Veracruz, leading to the almost total loss of coffeeplants in 1970 (La Red, 2004).
As discussed in detail in Conde (2003), observed trends in spring precipitationand in summer temperature in Veracruz result in climatic conditions similar tothose during El Nino events: important decreases in precipitation and increases intemperature, which may explain why producers in the region are concerned withdrought (Castellanos et al., 2003; Conde et al., 2003c).
Coffee development also requires a “relative drought” during the onset of thespring season (Nolasco, 1985; Castillo et al., 2003). However, a persistent dry spellor, on the contrary, heavy rains during this season can spoil the flowering stage.
Adaptation measures to climatic extreme conditions are not simple and neitherwill be to adapt to future changes, even if they are gradual. Coffee producers
264 C. GAY ET AL.
in Mexico have a resistance to change and have never radically modified theiragricultural strategies (Castellanos et al., 2003).
The 1992 Coffee Census (Consejo Mexicano del Cafe, 1996) reveals that inVeracruz 153,000 hectares are devoted to coffee production, involving 67,000 pro-ducers from 82 municipalities and generating around 300,000 permanent jobs and30 million daily wages6 each year. Socioeconomic conditions in the state are defi-cient: in the year 2000 about half of the municipalities were classified as under veryhigh and high poverty levels.7 Resource limitations and lack of income flexibilityof small-scale producers limit their adaptation options to climate variability (Eakin,2000) and thus their vulnerability could be exacerbated in the future.
2. Econometric Model
This paper adopts a multiple regression model that integrates climatic and economicdeterminants of coffee production in Veracruz. The objective was to construct aproduction function that could give information on how this activity responds tochanges in economic and climatic variables.
The general regression model (Equation 1) includes the economic variablesdescribed below, a linear and a quadratic term for seasonal climatic means, and aterm for the seasonal variance of climatic variables to capture how extreme eventscan affect coffee production.
PCoffee = f(Ti , T 2
i , Pi , P2i , Vi j , ECONOMIC
)(1)
where:
Ti = mean seasonal temperature.Pi = mean seasonal precipitation.Vi j = variance.i = Spring, Summer, Fall, Winter.j = temperature, precipitation.ECONOMIC = real minimum wage paid in Veracruz, state coffee prices,international coffee prices, state population, coffee stocks in Mexico, coffeestocks in USA and producer index price for raw materials for coffee benefit.
According to literature on coffee production in Mexico, labor is the main inputfor coffee production, representing about 80% of total production costs (ConsejoMexicano del Cafe, 2001). Two economic variables were considered for the laborcomponent that serve as proxies for costs and availability of labor. Real mini-mum wage8 in Veracruz was used as a proxy for the wage paid to coffee workers.There are no data about the wage that is actually paid to coffee workers in thestate but considering real minimum wage as a reference price and an opportunitycost for unqualified labor in the state, it is reasonable to assume that both wages

POTENTIAL IMPACTS OF CLIMATE CHANGE ON AGRICULTURE 265
will be closely related. The state population series9 was included as an approxi-mation for labor availability. Given the high percentage of total production coststhat labor represents, other production costs could be considered irrelevant. Nev-ertheless, a producer index price for raw materials for coffee benefit10 was alsoincluded.
Within the AIACC LA29 project, workshops were held with coffee producers inVeracruz and a survey to find out what factors they consider more threatening wasconducted. Results show that their main concerns are coffee prices and agriculturalpolicy changes. For the econometric model, state and international coffee prices11
were considered.Coffee prices have dramatically fallen and since 1990 they have reached their
lowest level for the period of study. As will be shown latter, prices might be theirmain preoccupation but apparently these have not been such an important factorin their production decisions. One of the main reasons for this is that in order tomaintain a coffee tree healthy, it has to be harvested every season, regardless ofthe market price (TecnoServe, 2003). When prices fall, producers absorb part ofthe losses and are partly compensated by government subsides12 resulting in thatcoffee production is quite inelastic and production level does not seem to respond,or it responds very slowly, to changes in prices. An example of this is that in thelast decade prices have been very low, and production has not decreased. Besides,there is a widespread belief among producers that the current market conditions aretransitory and prices will rise in the short term.
The producer’s decision when choosing the production level could be also in-fluenced by how saturated is the market of the product. Although this is closelyrelated to international prices, coffee stocks in Mexico and USA were regarded aspotentially relevant to model coffee production.13
For the climatic component, the average and variance of temperature and precip-itation were considered as the main climatic factors. Data on this component wasobtained from the Tropical Meteorology research group of the Centro de Ciencias dela Atmosfera (UNAM). According to literature on coffee phenology, seasonal meanvalues are more important than yearly average values14 (Nolasco, 1985; Castilloet al., 2003). This allows to relate weather and plant phenology in a more directway. Seasonal averages and variances were defined as follows: Spring correspondsto March, April and May; Summer to June, July and August; Fall to September,October and November; and Winter to December and next year’s January andFebruary.
A quadratic functional form was chosen to capture the effect of temperatureand precipitation on coffee plants. Even though this functional form generatesmulticollineality problems, it works better for modeling the plant’s response tochanges in climatic variables than a linear specification because the latter wouldimply that there are no optimum values and that the effect of these variables overproduction is monotonic. On the other hand, the quadratic functional form permits to

266 C. GAY ET AL.
find optimum climatic values for coffee production and to calculate how productionwill be affected as we get farther from these optimum values.
Multicollineality in this case arises because of the inclusion of linear andquadratic terms of the same variable. In this case the determinant of the matrixx′x is very small (close to zero), which causes the estimator variance to increase.
Var(β) = σ 2u (x ′x)−1 = σ 2
u
coef (x ′x)
|x ′x | (2)
As the estimator variance increases the t-statistic value must necessarily decrease.This makes the t-statistic value unreliable to conclude whether the estimated coeffi-cients are significant or not. Therefore, we propose the use of the adjusted R-squaredstatistic to decide if it is worth to add a regressor to the model. Even though theadjusted R-squared statistic is not a measure of significance, it penalizes the ad-dition of regressors that do not contribute to the explanatory power of the model.If a regressor does not contribute to the latter, the adjusted R-squared value willdecrease.
The model specification used in this paper is similar to the one used by Chang(2002). The explanatory variables used by Chang are seasonal averages of precip-itation and temperature (linear and quadratic) and their variations from a 20 yearsmean value, the percentage of full-time farm households, land slope and a time trendto account for technology changes. The statistical significance of the independentvariables is not tested because of the presence of multicollineality, resulting in thatthe proposed variables are taken to be relevant from the start. No statistical diag-nosis tests are presented either. In this study the relevance of regressors is deducedusing the adjusted R-squared as an alternative criterion to decide whether to keepa variable in the model when multicollineality problems are present and t-statisticbecomes unreliable. A thorough statistical diagnosis is performed in order to val-idate our model. In addition, simple future climate scenarios are generated whichinclude changes in the frequency of occurrence of certain values. This is generallynot considered (in similar studies) and ignoring these changes, as will be shownbelow, can produce an important bias to underestimate possible impacts of climatechange.
Due to the limited number of available production data15 it was not convenientto include all explanatory variables at the same time, so different models were con-structed using the same modeling approach for different combinations of variablesand then diagnostic tests were applied to assess their statistical quality. These testincluded omitted-variables tests for evaluating if variables not included in a spe-cific model were not relevant. The model with best statistical quality and highestadjusted R-squared was chosen. The methodology for arriving at the best model isillustrated in what follows.
A reductive approach was followed including all climatic variables (linear andquadratic for all seasons), real minimum wage, state population and state coffeeprices. Regressors with higher p-values (smaller t-statistic value) were excluded one
POTENTIAL IMPACTS OF CLIMATE CHANGE ON AGRICULTURE 267
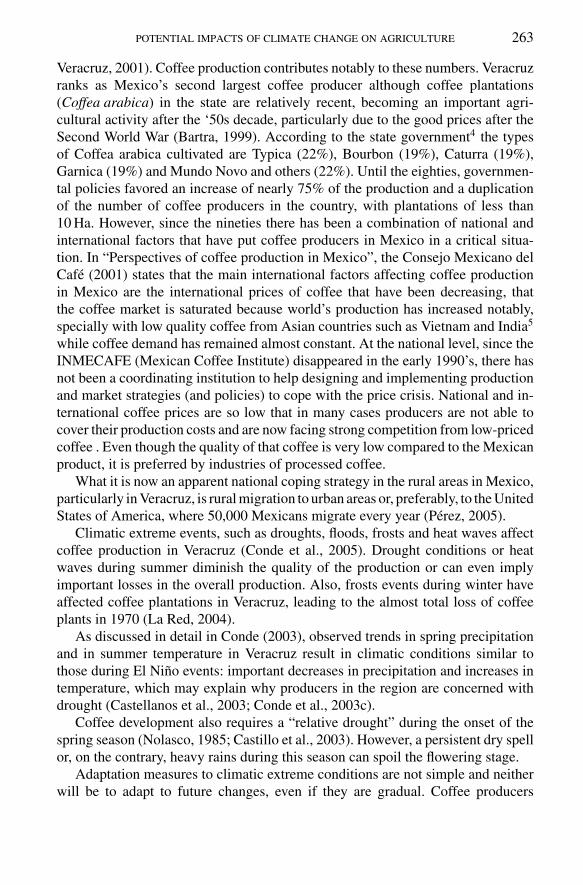
by one. If the exclusion of a regressor produced a positive change in the adjusted R-squared value, it was left out and subsequently tried with the next regressor that hadthe highest p-value. Regressors with the highest p-values were excluded until thechange in the adjusted R-squared was negative, which was the case of precipitationduring Spring. This process produced the following model:
Pcoffee = −35965262 + 2296270(Tsumm) − 46298.67(Tsumm)2
+658.01618(Pspr) + 813976.3(Twin) − 20318.27(Twin)2
−3549.71(MINWAGE) (3)
where:
Tsumm is the average temperature during Summer.Pspr is the average precipitation during Spring.Twin is the average temperature during WinterMINWAGE is real minimum wage.
The model (Equation 3) has an adjusted R-squared value of 0.692, so 69.2% ofthe variance of the dependant variable is explained by the independent variables.Figure 1 shows fitted and actual series.
The tests that were carried out to assess the statistical quality of the modelwere: multicollineality, functional form, structural change, serial correlation, het-eroskedasticity, normality and omitted variables test.
As expected, strong multicollineality exists between linear and quadratic termsused to model the effect of temperature over coffee production as reflected by the
0
100000
200000
300000
400000
500000
600000
700000
1969 1970 1971 1972 1973 1974 1975 1976 1977 1978 1979 1980 1981 1982 1983 1984 1985 1986 1987 1988 1989 1990 1991 1992 1993 1994 1995 1996 1997 1998
Actual Fitted
Figure 1. Actual and fitted series for coffee production in Veracruz.
268 C. GAY ET AL.
high correlation between linear and quadratic terms of the same variable. Since thecorrelation value of these regressors is higher than the R-squared value, we can inferthat multicollineality is present. Auxiliary regressions were performed to confirmthe presence of multicollineality. Their R-squared value of 0.999, led us to concludethat there is a multicollineality problem. Based on the Ramsey RESET test, it wasconsidered that the quadratic functional form chosen for the model was correct.Structural change tests were used to find parameter instability. The CUSUM andCUSUMQ tests were performed and confirmed that there was no structural changeand regression coefficients remain constant during the sample period. Recursivecoefficients estimates tests results revealed that coefficients achieve convergencequickly giving a strong indication of stability.
Serial correlation tests evaluates whether the residuals are correlated with theirown lagged values. Using Durbin Watson statistic (DW value = 2.020532) and thethe Breusch Pagan tests, it was found that no serial correlation existed for 1st to 4thorders.
For heteroskedasticity, the White and ARCH tests were performed to evaluate ifthe variance of residuals was constant. Results showed that the estimators where notinefficient, and no autoregressive conditional heteroskedasticity was found. Finally,the Jarque Bera test was applied for normality evaluation (value = 1.0083) whichrevealed that residuals were normally distributed.
In order to infer how climate change can affect production it is necessary topreserve trends in data, because we are trying to see the effect (if any) of long runvariations in climatic variables over coffee production. This raises the problem ofspurious regressions, when a regression between two or more non-stationary seriesthat have no real relation between them, appear to have good explanatory power .Cointegration tests were conducted in order to determine if there is a real long termrelation between the variables in the model. These tests confirmed that the seriesare cointegrated and that a long run relation between them exists, so it is correct topreserve trends in our model.
Once it was verified that these regression assumptions hold, omitted variablestests were performed. For climate variables other seasons’ precipitation and temper-ature averages and variances were tested, while for economic variables we includedinternational coffee prices, coffee stocks in Mexico and USA and the producer in-dex price for raw materials for coffee benefit. None of these variables contributedto the model explanatory power or were significative. Tests results show that thesevariables were correctly omitted.
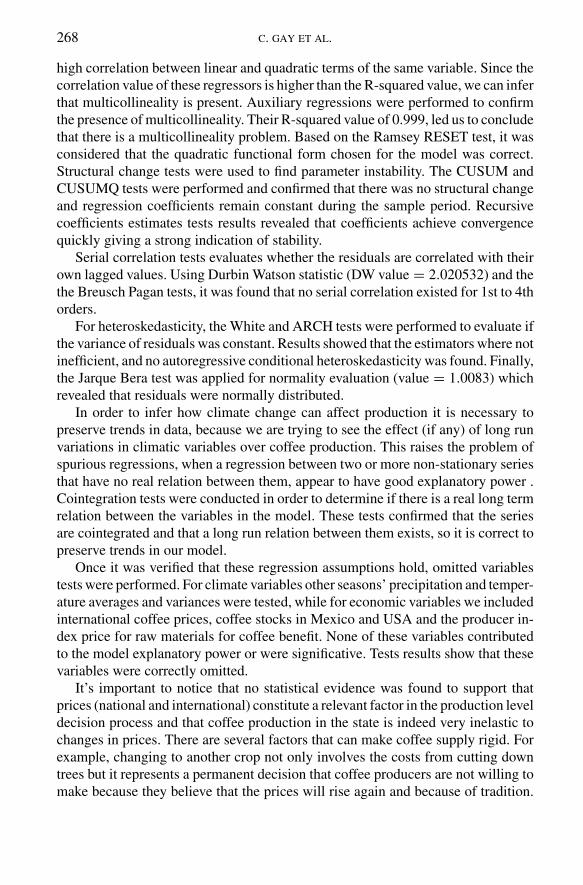
It’s important to notice that no statistical evidence was found to support thatprices (national and international) constitute a relevant factor in the production leveldecision process and that coffee production in the state is indeed very inelastic tochanges in prices. There are several factors that can make coffee supply rigid. Forexample, changing to another crop not only involves the costs from cutting downtrees but it represents a permanent decision that coffee producers are not willing tomake because they believe that the prices will rise again and because of tradition.
POTENTIAL IMPACTS OF CLIMATE CHANGE ON AGRICULTURE 269
On the other hand, it has to be considered that coffee production has been severelydistorted by government subsides, and coffee production has not necessarily beendetermined by market forces, although since the disappearing of INMECAFE therehas been a reduction in government support.
3. Empirical Results
3.1. MODEL INTERPRETATION
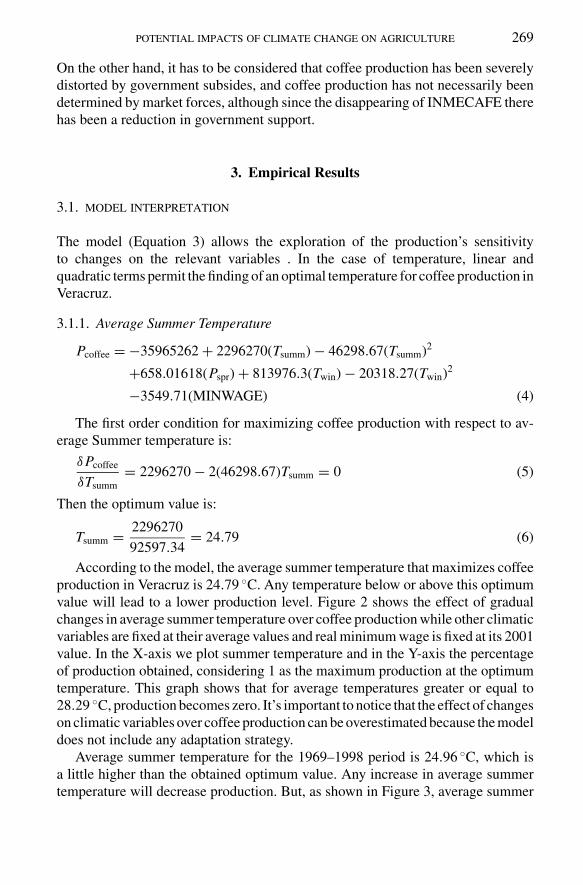
The model (Equation 3) allows the exploration of the production’s sensitivityto changes on the relevant variables . In the case of temperature, linear andquadratic terms permit the finding of an optimal temperature for coffee production inVeracruz.
3.1.1. Average Summer Temperature
Pcoffee = −35965262 + 2296270(Tsumm) − 46298.67(Tsumm)2
+658.01618(Pspr) + 813976.3(Twin) − 20318.27(Twin)2
−3549.71(MINWAGE) (4)
The first order condition for maximizing coffee production with respect to av-erage Summer temperature is:
δPcoffee
δTsumm
= 2296270 − 2(46298.67)Tsumm = 0 (5)
Then the optimum value is:
Tsumm = 2296270
92597.34= 24.79 (6)
According to the model, the average summer temperature that maximizes coffeeproduction in Veracruz is 24.79 ◦C. Any temperature below or above this optimumvalue will lead to a lower production level. Figure 2 shows the effect of gradualchanges in average summer temperature over coffee production while other climaticvariables are fixed at their average values and real minimum wage is fixed at its 2001value. In the X-axis we plot summer temperature and in the Y-axis the percentageof production obtained, considering 1 as the maximum production at the optimumtemperature. This graph shows that for average temperatures greater or equal to28.29 ◦C, production becomes zero. It’s important to notice that the effect of changeson climatic variables over coffee production can be overestimated because the modeldoes not include any adaptation strategy.
Average summer temperature for the 1969–1998 period is 24.96 ◦C, which isa little higher than the obtained optimum value. Any increase in average summertemperature will decrease production. But, as shown in Figure 3, average summer

270 C. GAY ET AL.
-0.2
0
0.2
0.4
0.6
0.8
1
1.2
23.30 23.55 23.80 24.05 24.30 24.55 24.80 25.05 25.30 25.55 25.80 26.05 26.30 26.55 26.80 27.05 27.30 27.55 27.80 28.05 28.30
Figure 2. Effect of gradual changes on average summer temperature over coffee production.
22
22.5
23
23.5
24
24.5
25
25.5
26
26.5
27
1969
1970
1971
1972
1973
1974
1975
1976
1977
1978
1979
1980
1981
1982
1983
1984
1985
1986
1987
1988
1989
1990
1991
1992
1993
1994
1995
1996
1997
1998
Figure 3. Average summer temperature from 1969 to 1998.
temperature for the 1969–1998 period does not show a tendency to increase ordecrease. If this trend continues in the future, relatively small effects from thisvariable could be expected over production, although effects caused by its variabilitycould be important.
POTENTIAL IMPACTS OF CLIMATE CHANGE ON AGRICULTURE 271
3.1.2. Average Winter TemperatureThe first order condition for maximizing coffee production with respect to averagewinter temperature is:
δPcoffee
δTwin
= 813976.3 − 2(20318.27)Twin = 0 (7)
Twin = 813976.3
40636.54= 20.03 (8)
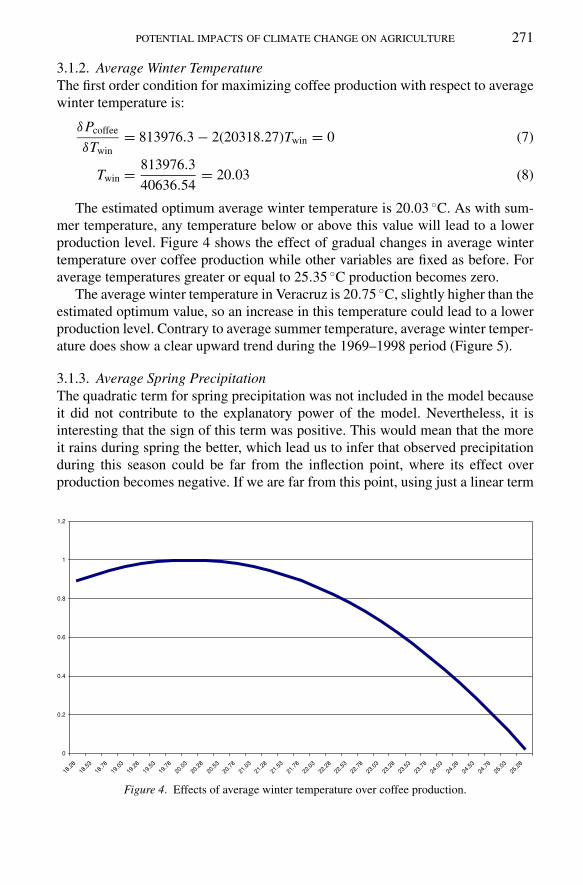
The estimated optimum average winter temperature is 20.03 ◦C. As with sum-mer temperature, any temperature below or above this value will lead to a lowerproduction level. Figure 4 shows the effect of gradual changes in average wintertemperature over coffee production while other variables are fixed as before. Foraverage temperatures greater or equal to 25.35 ◦C production becomes zero.
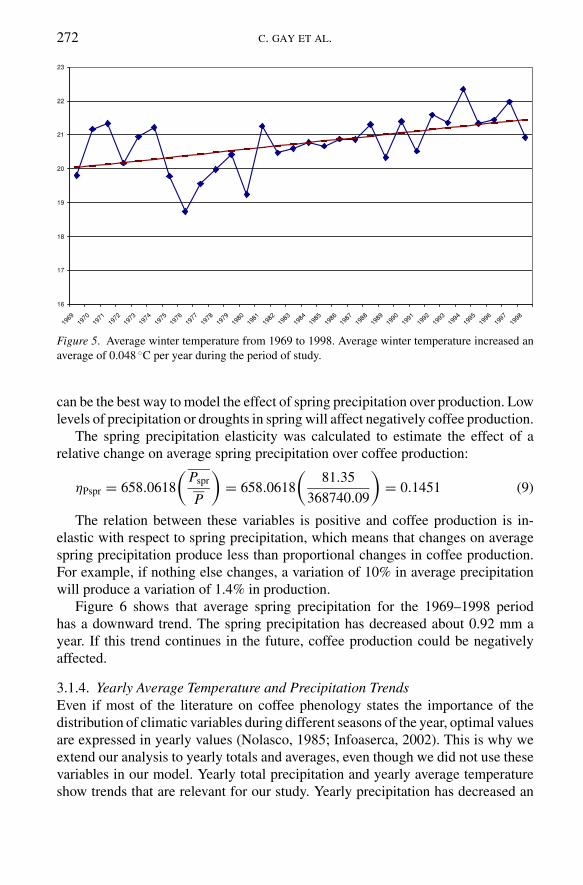
The average winter temperature in Veracruz is 20.75 ◦C, slightly higher than theestimated optimum value, so an increase in this temperature could lead to a lowerproduction level. Contrary to average summer temperature, average winter temper-ature does show a clear upward trend during the 1969–1998 period (Figure 5).
3.1.3. Average Spring PrecipitationThe quadratic term for spring precipitation was not included in the model becauseit did not contribute to the explanatory power of the model. Nevertheless, it isinteresting that the sign of this term was positive. This would mean that the moreit rains during spring the better, which lead us to infer that observed precipitationduring this season could be far from the inflection point, where its effect overproduction becomes negative. If we are far from this point, using just a linear term
0
0.2
0.4
0.6
0.8
1
1.2
18.2
8
18.5
3
18.7
8
19.0
3
19.2
8
19.5
3
19.7
8
20.0
3
20.2
8
20.5
3
20.7
8
21.0
3
21.2
8
21.5
3
21.7
8
22.0
3
22.2
8
22.5
3
22.7
8
23.0
3
23.2
8
23.5
3
23.7
8
24.0
3
24.2
8
24.5
3
24.7
8
25.0
3
25.2
8
Figure 4. Effects of average winter temperature over coffee production.
272 C. GAY ET AL.
16
17
18
19
20
21
22
23
1969
1970
1971
1972
1973
1974
1975
1976
1977
1978
1979
1980
1981
1982
1983
1984
1985
1986
1987
1988
1989
1990
1991
1992
1993
1994
1995
1996
1997
1998
Figure 5. Average winter temperature from 1969 to 1998. Average winter temperature increased an
average of 0.048 ◦C per year during the period of study.
can be the best way to model the effect of spring precipitation over production. Lowlevels of precipitation or droughts in spring will affect negatively coffee production.
The spring precipitation elasticity was calculated to estimate the effect of arelative change on average spring precipitation over coffee production:
ηPspr = 658.0618
(Pspr
P
)= 658.0618
(81.35
368740.09
)= 0.1451 (9)
The relation between these variables is positive and coffee production is in-elastic with respect to spring precipitation, which means that changes on averagespring precipitation produce less than proportional changes in coffee production.For example, if nothing else changes, a variation of 10% in average precipitationwill produce a variation of 1.4% in production.
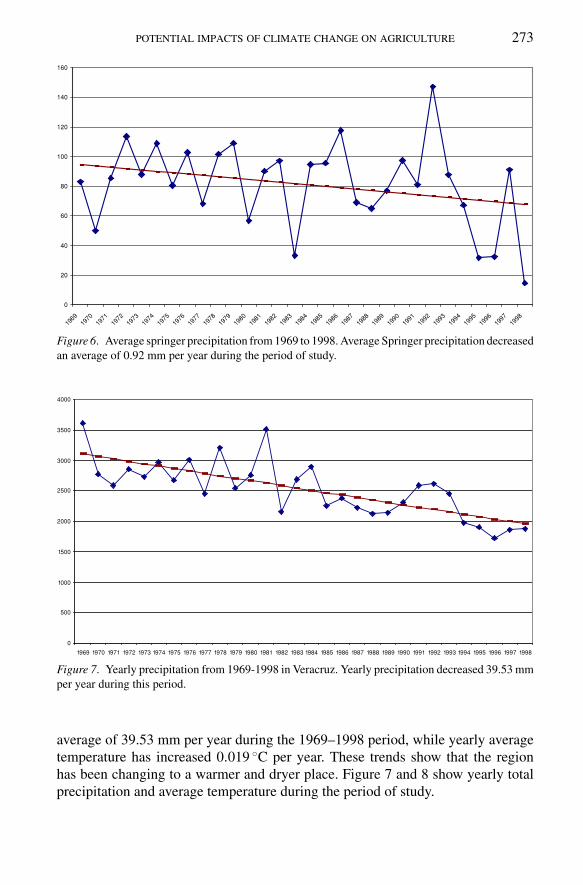
Figure 6 shows that average spring precipitation for the 1969–1998 periodhas a downward trend. The spring precipitation has decreased about 0.92 mm ayear. If this trend continues in the future, coffee production could be negativelyaffected.
3.1.4. Yearly Average Temperature and Precipitation TrendsEven if most of the literature on coffee phenology states the importance of thedistribution of climatic variables during different seasons of the year, optimal valuesare expressed in yearly values (Nolasco, 1985; Infoaserca, 2002). This is why weextend our analysis to yearly totals and averages, even though we did not use thesevariables in our model. Yearly total precipitation and yearly average temperatureshow trends that are relevant for our study. Yearly precipitation has decreased an
POTENTIAL IMPACTS OF CLIMATE CHANGE ON AGRICULTURE 273
0
20
40
60
80
100
120
140
160
1969
1970
1971
1972
1973
1974
1975
1976
1977
1978
1979
1980
1981
1982
1983
1984
1985
1986
1987
1988
1989
1990
1991
1992
1993
1994
1995
1996
1997
1998
Figure 6. Average springer precipitation from 1969 to 1998. Average Springer precipitation decreased
an average of 0.92 mm per year during the period of study.
0
500
1000
1500
2000
2500
3000
3500
4000
1969 1970 1971 1972 1973 1974 1975 1976 1977 1978 1979 1980 1981 1982 1983 1984 1985 1986 1987 1988 1989 1990 1991 1992 1993 1994 1995 1996 1997 1998
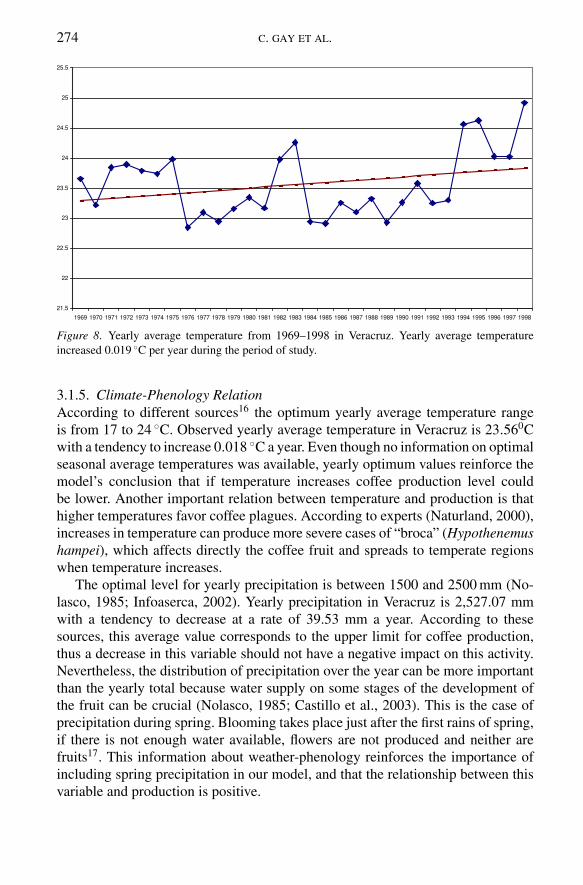
Figure 7. Yearly precipitation from 1969-1998 in Veracruz. Yearly precipitation decreased 39.53 mm
per year during this period.
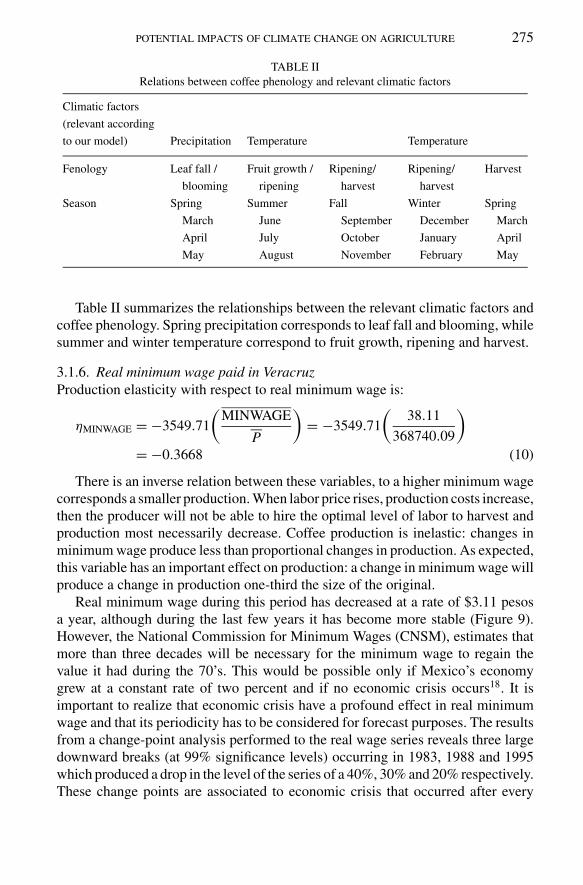
average of 39.53 mm per year during the 1969–1998 period, while yearly averagetemperature has increased 0.019 ◦C per year. These trends show that the regionhas been changing to a warmer and dryer place. Figure 7 and 8 show yearly totalprecipitation and average temperature during the period of study.
274 C. GAY ET AL.
21.5
22
22.5
23
23.5
24
24.5
25
25.5
1969 1970 1971 1972 1973 1974 1975 1976 1977 1978 1979 1980 1981 1982 1983 1984 1985 1986 1987 1988 1989 1990 1991 1992 1993 1994 1995 1996 1997 1998
Figure 8. Yearly average temperature from 1969–1998 in Veracruz. Yearly average temperature
increased 0.019 ◦C per year during the period of study.
3.1.5. Climate-Phenology RelationAccording to different sources16 the optimum yearly average temperature rangeis from 17 to 24 ◦C. Observed yearly average temperature in Veracruz is 23.560Cwith a tendency to increase 0.018 ◦C a year. Even though no information on optimalseasonal average temperatures was available, yearly optimum values reinforce themodel’s conclusion that if temperature increases coffee production level couldbe lower. Another important relation between temperature and production is thathigher temperatures favor coffee plagues. According to experts (Naturland, 2000),increases in temperature can produce more severe cases of “broca” (Hypothenemushampei), which affects directly the coffee fruit and spreads to temperate regionswhen temperature increases.
The optimal level for yearly precipitation is between 1500 and 2500 mm (No-lasco, 1985; Infoaserca, 2002). Yearly precipitation in Veracruz is 2,527.07 mmwith a tendency to decrease at a rate of 39.53 mm a year. According to thesesources, this average value corresponds to the upper limit for coffee production,thus a decrease in this variable should not have a negative impact on this activity.Nevertheless, the distribution of precipitation over the year can be more importantthan the yearly total because water supply on some stages of the development ofthe fruit can be crucial (Nolasco, 1985; Castillo et al., 2003). This is the case ofprecipitation during spring. Blooming takes place just after the first rains of spring,if there is not enough water available, flowers are not produced and neither arefruits17. This information about weather-phenology reinforces the importance ofincluding spring precipitation in our model, and that the relationship between thisvariable and production is positive.
POTENTIAL IMPACTS OF CLIMATE CHANGE ON AGRICULTURE 275
TABLE II
Relations between coffee phenology and relevant climatic factors
Climatic factors
(relevant according
to our model) Precipitation Temperature Temperature
Fenology Leaf fall / Fruit growth / Ripening/ Ripening/ Harvest
blooming ripening harvest harvest
Season Spring Summer Fall Winter Spring
March June September December March
April July October January April
May August November February May
Table II summarizes the relationships between the relevant climatic factors andcoffee phenology. Spring precipitation corresponds to leaf fall and blooming, whilesummer and winter temperature correspond to fruit growth, ripening and harvest.
3.1.6. Real minimum wage paid in VeracruzProduction elasticity with respect to real minimum wage is:
ηMINWAGE = −3549.71
(MINWAGE
P
)= −3549.71
(38.11
368740.09
)= −0.3668 (10)
There is an inverse relation between these variables, to a higher minimum wagecorresponds a smaller production. When labor price rises, production costs increase,then the producer will not be able to hire the optimal level of labor to harvest andproduction most necessarily decrease. Coffee production is inelastic: changes inminimum wage produce less than proportional changes in production. As expected,this variable has an important effect on production: a change in minimum wage willproduce a change in production one-third the size of the original.
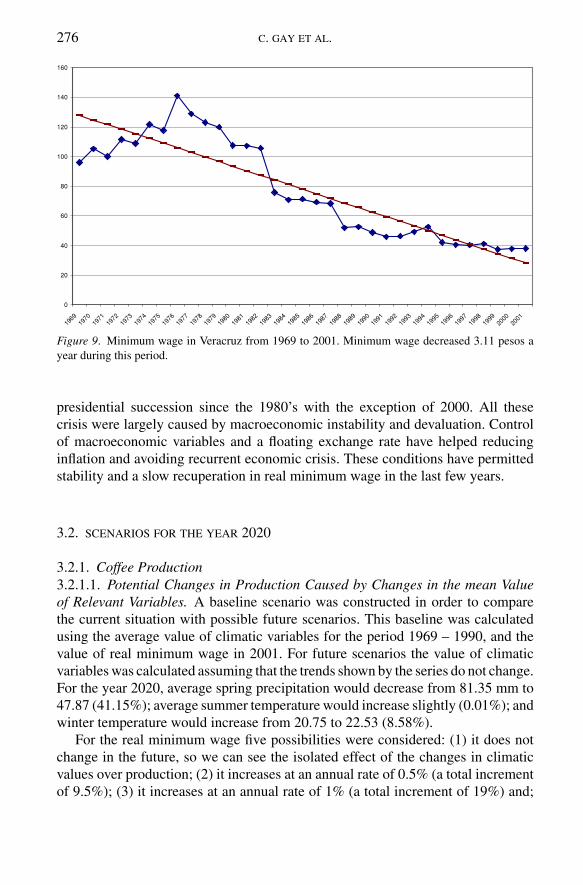
Real minimum wage during this period has decreased at a rate of $3.11 pesosa year, although during the last few years it has become more stable (Figure 9).However, the National Commission for Minimum Wages (CNSM), estimates thatmore than three decades will be necessary for the minimum wage to regain thevalue it had during the 70’s. This would be possible only if Mexico’s economygrew at a constant rate of two percent and if no economic crisis occurs18. It isimportant to realize that economic crisis have a profound effect in real minimumwage and that its periodicity has to be considered for forecast purposes. The resultsfrom a change-point analysis performed to the real wage series reveals three largedownward breaks (at 99% significance levels) occurring in 1983, 1988 and 1995which produced a drop in the level of the series of a 40%, 30% and 20% respectively.These change points are associated to economic crisis that occurred after every
276 C. GAY ET AL.
0
20
40
60
80
100
120
140
160
1969
1970
1971
1972
1973
1974
1975
1976
1977
1978
1979
1980
1981
1982
1983
1984
1985
1986
1987
1988
1989
1990
1991
1992
1993
1994
1995
1996
1997
1998
1999
2000
2001
Figure 9. Minimum wage in Veracruz from 1969 to 2001. Minimum wage decreased 3.11 pesos a
year during this period.
presidential succession since the 1980’s with the exception of 2000. All thesecrisis were largely caused by macroeconomic instability and devaluation. Controlof macroeconomic variables and a floating exchange rate have helped reducinginflation and avoiding recurrent economic crisis. These conditions have permittedstability and a slow recuperation in real minimum wage in the last few years.
3.2. SCENARIOS FOR THE YEAR 2020
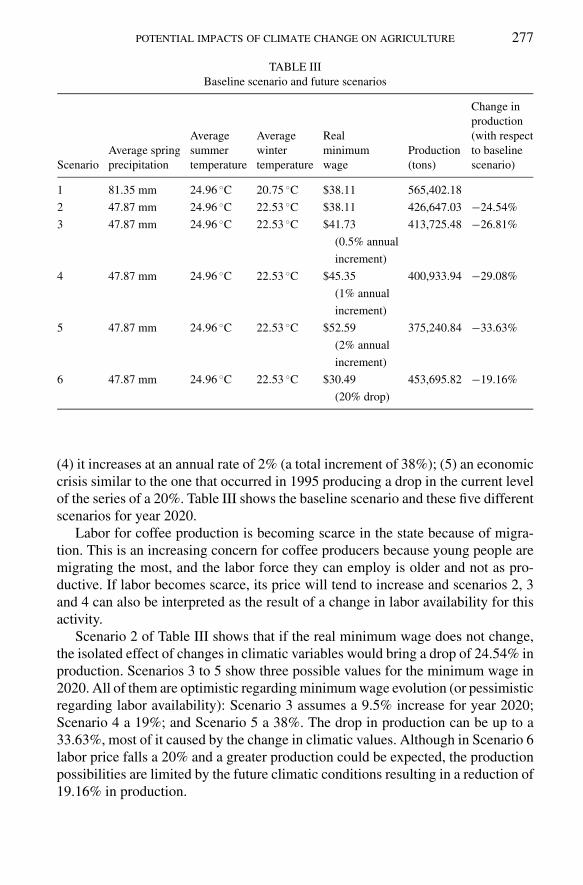
3.2.1. Coffee Production3.2.1.1. Potential Changes in Production Caused by Changes in the mean Valueof Relevant Variables. A baseline scenario was constructed in order to comparethe current situation with possible future scenarios. This baseline was calculatedusing the average value of climatic variables for the period 1969 – 1990, and thevalue of real minimum wage in 2001. For future scenarios the value of climaticvariables was calculated assuming that the trends shown by the series do not change.For the year 2020, average spring precipitation would decrease from 81.35 mm to47.87 (41.15%); average summer temperature would increase slightly (0.01%); andwinter temperature would increase from 20.75 to 22.53 (8.58%).
For the real minimum wage five possibilities were considered: (1) it does notchange in the future, so we can see the isolated effect of the changes in climaticvalues over production; (2) it increases at an annual rate of 0.5% (a total incrementof 9.5%); (3) it increases at an annual rate of 1% (a total increment of 19%) and;
POTENTIAL IMPACTS OF CLIMATE CHANGE ON AGRICULTURE 277
TABLE III
Baseline scenario and future scenarios
Change in
production
Average Average Real (with respect
Average spring summer winter minimum Production to baseline
Scenario precipitation temperature temperature wage (tons) scenario)
1 81.35 mm 24.96 ◦C 20.75 ◦C $38.11 565,402.18
2 47.87 mm 24.96 ◦C 22.53 ◦C $38.11 426,647.03 −24.54%
3 47.87 mm 24.96 ◦C 22.53 ◦C $41.73 413,725.48 −26.81%
(0.5% annual
increment)
4 47.87 mm 24.96 ◦C 22.53 ◦C $45.35 400,933.94 −29.08%
(1% annual
increment)
5 47.87 mm 24.96 ◦C 22.53 ◦C $52.59 375,240.84 −33.63%
(2% annual
increment)
6 47.87 mm 24.96 ◦C 22.53 ◦C $30.49 453,695.82 −19.16%
(20% drop)
(4) it increases at an annual rate of 2% (a total increment of 38%); (5) an economiccrisis similar to the one that occurred in 1995 producing a drop in the current levelof the series of a 20%. Table III shows the baseline scenario and these five differentscenarios for year 2020.
Labor for coffee production is becoming scarce in the state because of migra-tion. This is an increasing concern for coffee producers because young people aremigrating the most, and the labor force they can employ is older and not as pro-ductive. If labor becomes scarce, its price will tend to increase and scenarios 2, 3and 4 can also be interpreted as the result of a change in labor availability for thisactivity.
Scenario 2 of Table III shows that if the real minimum wage does not change,the isolated effect of changes in climatic variables would bring a drop of 24.54% inproduction. Scenarios 3 to 5 show three possible values for the minimum wage in2020. All of them are optimistic regarding minimum wage evolution (or pessimisticregarding labor availability): Scenario 3 assumes a 9.5% increase for year 2020;Scenario 4 a 19%; and Scenario 5 a 38%. The drop in production can be up to a33.63%, most of it caused by the change in climatic values. Although in Scenario 6labor price falls a 20% and a greater production could be expected, the productionpossibilities are limited by the future climatic conditions resulting in a reduction of19.16% in production.
278 C. GAY ET AL.
TABLE IV
Potential impacts of one and two current standard deviations in winter and summer temperatures
Change in
Average summer production
temperature in year Production (with respect to baseline
Variation Value 2020 plus variation (Tons) scenario)
Plus one standard 0.75 ◦C 25.71 ◦C 389,053.75 −8.81%
deviation
Plus two standard 1.5 ◦C 26.46 ◦C 299,374.47 −29.83%
deviations
Minus one standard −0.75 ◦C 24.21 ◦C 412,154.30 −3.39%
deviation
Minus two standard −1.5 ◦C 23.46 ◦C 345,575.57 −19.00%
deviations
Average winter
temperature in year Production Change in
Variation Value 2020 plus variation (Tons) production
Plus one standard 0.80 ◦C 23.33 ◦C 331,808.92 −22.22%
deviation
Plus two standard 1.60 ◦C 24.14 ◦C 210,728.84 −50.60%
deviations
Minus one standard −0.80 ◦C 21.72 ◦C 495,243.16 16.07%
deviation
Minus two standard −1.60 ◦C 20.92 ◦C 537,597.31 26.00%
deviations
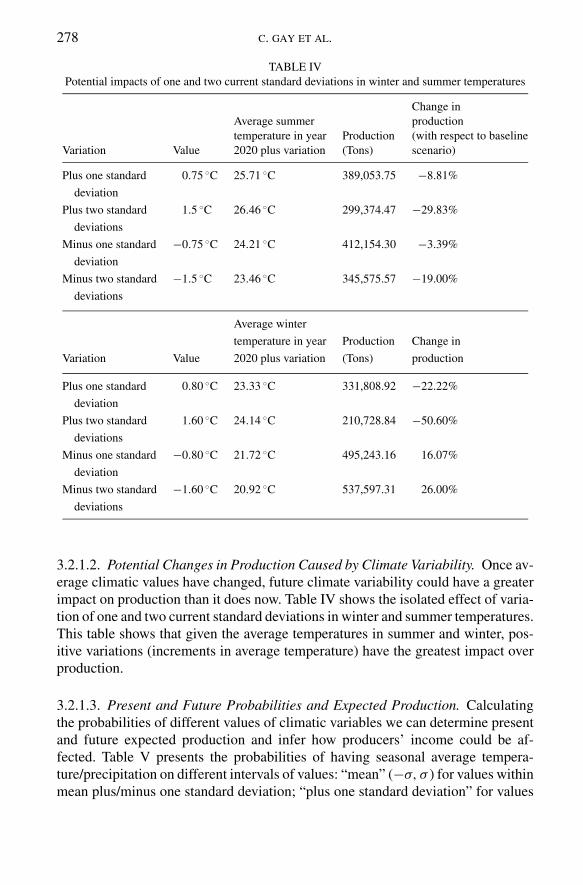
3.2.1.2. Potential Changes in Production Caused by Climate Variability. Once av-erage climatic values have changed, future climate variability could have a greaterimpact on production than it does now. Table IV shows the isolated effect of varia-tion of one and two current standard deviations in winter and summer temperatures.This table shows that given the average temperatures in summer and winter, pos-itive variations (increments in average temperature) have the greatest impact overproduction.
3.2.1.3. Present and Future Probabilities and Expected Production. Calculatingthe probabilities of different values of climatic variables we can determine presentand future expected production and infer how producers’ income could be af-fected. Table V presents the probabilities of having seasonal average tempera-ture/precipitation on different intervals of values: “mean” (−σ, σ ) for values withinmean plus/minus one standard deviation; “plus one standard deviation” for values

POTENTIAL IMPACTS OF CLIMATE CHANGE ON AGRICULTURE 279
TABLE V
Present probabilities of mean, one and two standard deviations intervals for climatic variables
Minus one Minus two
Plus one standard Plus two standard standard standard
Mean deviation deviations deviation deviations
(−σ, σ ) (σ, 2σ ) ≥2σ (−σ, −2σ ) ≤2σ
Twin 0.73 0.07 0.03 0.13 0.03
Tsumm 0.60 0.20 0.00 0.20 0.00
Pspr 0.73 0.07 0.03 0.13 0.03
falling into the interval [σ, 2σ ); “plus two standard deviations” for values greaterthan 2σ . Intervals for minus one and minus two standard deviations are defined inthe same way.
At the present time, the probability of climatic variations reaching two currentstandard deviations above/below their mean values is very small, but if the trendsshown by climatic variables do not change, reaching these values can become morefrequent. Studies on the future climate conditions suggest that the incidence ofextreme climate values will increase. The IPCC’s Third Assessment Report (Smitand Pilifosova, 2001) states that there is enough evidence to conclude that climatechange is already occurring and that there will be an increment in the frequency(and sometimes intensity) of extreme weather events.
Time analogs were used for estimating the probabilities of future climatic varia-tions reaching the different intervals defined above. This concept uses past variabil-ity shown by the series as an approximation of its future variability. In other words,past variability is added to the trend of climatic variables. Future probabilities areshown in Table VI.
Under these assumptions the future probability of variables falling in the interval(−σ, σ ) decreases, as in the case of average winter temperature which falls by 21%.Accordingly, variations reaching one and two current standard deviations will bemore frequent in the future.
TABLE VI
Future probabilities of current mean, one and two current standard deviations intervals for climatic
variables
Minus one
Plus one standard Plus two standard standard Minus two
Mean deviation deviations deviation standard deviations
(−σ, σ ) (σ, 2σ ) ≥2σ (−σ, −2σ ) ≤2σ
Twin 0.52 0.21 0.17 0.08 0.02
Tsumm 0.56 0.21 0.00 0.23 0.00
Pspr 0.69 0.06 0.02 0.17 0.06
280 C. GAY ET AL.
Present and future joint probabilities of all possible combinations of the intervals(−σ, σ ), [σ, 2σ ), ≥2σ, [−σ, −2σ ), ≤ − 2σ of temperature and precipitation in ayear were calculated as follows:
P(Sspri , T summi , T wini ) (11)
Where i refers to the intervals: (−σ, σ ), [σ, 2σ ), ≥2σ, [−σ, −2σ ), ≤ − 2σ
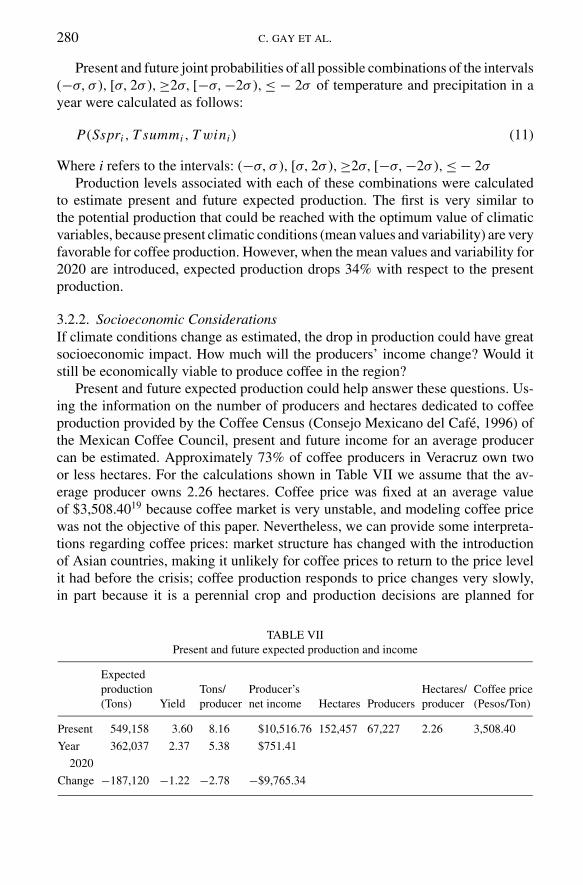
Production levels associated with each of these combinations were calculatedto estimate present and future expected production. The first is very similar tothe potential production that could be reached with the optimum value of climaticvariables, because present climatic conditions (mean values and variability) are veryfavorable for coffee production. However, when the mean values and variability for2020 are introduced, expected production drops 34% with respect to the presentproduction.
3.2.2. Socioeconomic ConsiderationsIf climate conditions change as estimated, the drop in production could have greatsocioeconomic impact. How much will the producers’ income change? Would itstill be economically viable to produce coffee in the region?
Present and future expected production could help answer these questions. Us-ing the information on the number of producers and hectares dedicated to coffeeproduction provided by the Coffee Census (Consejo Mexicano del Cafe, 1996) ofthe Mexican Coffee Council, present and future income for an average producercan be estimated. Approximately 73% of coffee producers in Veracruz own twoor less hectares. For the calculations shown in Table VII we assume that the av-erage producer owns 2.26 hectares. Coffee price was fixed at an average valueof $3,508.4019 because coffee market is very unstable, and modeling coffee pricewas not the objective of this paper. Nevertheless, we can provide some interpreta-tions regarding coffee prices: market structure has changed with the introductionof Asian countries, making it unlikely for coffee prices to return to the price levelit had before the crisis; coffee production responds to price changes very slowly,in part because it is a perennial crop and production decisions are planned for
TABLE VII
Present and future expected production and income
Expected
production Tons/ Producer’s Hectares/ Coffee price
(Tons) Yield producer net income Hectares Producers producer (Pesos/Ton)
Present 549,158 3.60 8.16 $10,516.76 152,457 67,227 2.26 3,508.40
Year 362,037 2.37 5.38 $751.41
2020
Change −187,120 −1.22 −2.78 −$9,765.34

POTENTIAL IMPACTS OF CLIMATE CHANGE ON AGRICULTURE 281
long term; coffee market is distorted internally by government subsidies and theinternational coffee market saturated by excess supply and high coffee stocks inproducer countries and mostly in consumer countries. The coffee market does notbehave as a competitive market; prices paid to producers are a very small frac-tion of what consumers pay for the final product, giving a great benefit margin tointermediaries.
According to a report by TechnoServe (in collaboration with McKinsey & Com-pany) the current crisis is different from all the previous coffee price crisis becausenot only the price is volatile, but in the last 10 years the coffee industry structurehas changed with the entrance of cost-efficient competitors, innovations20 and theincreasing demand for Robusta coffee (that has lower production costs than Ara-bica). This means that while coffee prices will recover from their current historiclow, the long term coffee price level will remain below its historical averages andwill make this activity unprofitable for many producers. Most of the world’s 25million coffee producers have been facing coffee prices lower than their productioncosts during the last three years, and in Central America more that 500,000 coffeeworkers have been displaced.
In a case study (Eakin, 2003) conducted in one of the municipalities of Veracruz,Ursulo Galvan, costs for producing coffee for small scale producers were estimatedat an average of $8,000 per hectare. Assuming that costs are approximately the samefor all the state, the average producer with 2.26 hectares faces total annual costsof $18,142.40 pesos. As it is shown in Table VI, this represents a net profit of$10,516.76 which corresponds to a monthly income of $876.40 pesos (less than $3USD a day). On the other hand, in the last few years coffee prices have been solow that if we do the same calculation using the average price of 2001 ($1,390.84pesos/ton, instead of the 13 years average price of $3,508.40), the producer faces aloss of $6,871 pesos. It is important to notice that this calculation does not take intoaccount subsidies nor reductions in production costs (using less fertilizer, pruning,clearing, etc.).
Given the expected drop in productivity by year 2020 due to changes in climaticvariables, the production of a ton of coffee becomes relatively more expensive(same costs, less production per hectare) and the average producer will have lossesof $751.41 pesos a year.21. This evidently would affect the economic viability ofcoffee production in Veracruz, the average producer would not be able to coverproduction costs. If market conditions do not improve, this will probably makeproducers rely more on subsidies and government policies, to change crop selectionor land use, and drive out people to other productive activities.
4. Discussion and Model Limitations
The econometric model developed for this paper presents high multicollineal-ity. This problem is generated by the quadratic functional form chosen for the
282 C. GAY ET AL.
model, which includes a linear and quadratic terms for temperature. This doesnot necessarily affect the predictive power of the model but it makes esti-mators less accurate (Gujarati, 2003). In spite of this, the quadratic form of-fers important advantages. On the one hand, the model’s quadratic functionalform provides a better way to capture the non-monotonic effect of temperatureover coffee production: for temperatures lower than the optimum value, an in-crease on temperature will be positive for production; for temperatures higherthan the optimum value an increase on temperature will be negative for pro-duction. And on the other hand, according to literature on coffee phenology,current temperature observed in Veracruz is close to the inflection point whereincrements in temperature begin to have a negative effect on production. In ad-dition, results of other recent studies (UNEP22, Aggarwal (downloaded fromhttp://www.unep.org/dpdl/indiaworkshop/documents/TS1 2 1.doc)) conducted inother parts of the world using different modeling techniques (GIS, crop models)to assess coffee production response to climate change have also found that if thetemperatures increase coffee production will decrease.
The statistical quality of the model was thoroughly examined performing allthe relevant econometric tests. Cointegration tests were performed to exclude thepossibility of spurious regression. The model’s explanatory power is quite good(69% of the observations).
The model shows that coffee production responds significantly to seasonaltemperature patterns and to changes in minimum wage. Furthermore, changesin climatic variables expected for year 2020 could make coffee production noteconomically viable for producers. Temperature is shown as the most relevantclimatic factor. The model reveals that present temperature is already slightlyhigher than the optimum value for coffee production. This implies that any in-crement in temperature would cause a drop in the productivity of current coffeeproduction areas. According to the simple climate model used in this paper, av-erage winter temperature is particularly important because it shows an upwardtrend, greater variance, and its mean interval has a smaller probability. These fac-tors make average winter temperature potentially more harmful than any otherclimatic variable included in the model. In contrast, average summer tempera-ture would not be as harmful because the expected change in this variable ismarginal.
In the estimation process of the econometric model, the quadratic term proposedfor spring precipitation was removed because it did not contribute to the explana-tory power of the model. Nevertheless, it is interesting that the sign of the estimatedparameter for this term was positive, because it implies that present spring precip-itation is far from its optimum value and from the value where production beginsto be negatively affected. Consequently, for the values contained in the series, therelation between precipitation and production appears to be monotonic, and usinga linear term should be the best way to model this relation. The latter should holdfor future values of spring precipitation given that the downward trend shown by
POTENTIAL IMPACTS OF CLIMATE CHANGE ON AGRICULTURE 283
the series implies future reductions in precipitation. It is important to express thateven if our climate model is very simple, based only on trends and time analogies,predictions for the region are similar to the ones obtained using more complicatedmodels.
The model shows that production is inelastic with respect to real minimumwage, but as expected, it has a significant effect over coffee production. Someproduction scenarios built using different assumptions on how real minimum wagecould evolve for the year 2020 are provided.
The result of comparing present and future expected coffee productions suggeststhat the changes on temperatures and precipitation could cause a reduction of up to34% in coffee production in Veracruz for year 2020. The expected fall in productionwould have important repercussions on producers’ income and on coffee productioneconomic viability. If we keep coffee price constant, the income of the averageproducer in year 2020 would not be enough to cover production costs. This situationcould lead to government intervention increasing subsidies, crop change and landuse change. At the present time, coffee production already relies heavily on subsidiesand thus producers are very vulnerable to policy changes (Aguirre Saharrea, 2003;Avila, 2001). Expected future production could make them rely even more ona subsidy that will be increasingly expensive and inefficient, and that will notcontribute to solve the economic situation faced by coffee producers and workers.Adding the international market situation to this picture, makes the vulnerabilityof the producers more serious. It is important to note that adaptation measures toreduce the effect of climate change are not considered, but it is also important tonotice that given the size and instability of producers’ income, their adaptationpossibilities are very slim.
Forest and ecosystem preservation as well as other environmental services arebeing explored to make coffee production in the state more economically viable.Nevertheless, the relation between coffee production and forest preservation maynot be so clear under climate change. In the previously cited study supported byUNEP, a change in climatic variables similar to the one presented in this paper,would make the areas where now coffee is produced too hot to grow coffee, andmake producers move to higher, cooler areas where there are forests today. Thisadaptation strategy would generate deforestation and land use change in higherlands and probably changes of crops or land uses to more profitable ones, not soenvironmental friendly, on areas where coffee was grown.
In order to adapt to market conditions TechnoServe (2003) suggests two mainlines of action: support high-quality producers to move to specialty coffee and helpin-crisis coffee producers and regions to diversify into other livelihoods. While thelow production costs of Brasil and Vietnam will make it very difficult for othercountries to be competitive, there is an opportunity for high-quality producers toenter more profitable markets such as specialty coffee. In the case of producers andregions that cannot compete in costs or differentiation, the recommended strategyis to search for alternative economic opportunities to diversify their income.

284 C. GAY ET AL.
Nevertheless, in the past, coffee producers in Veracruz have shown a limitedcapacity to adapt to climatic and economic stressors, and this capacity will probablydecrease in the future if governmental policies and international market conditionsprevail. There are five main reasons the AIACC LA29 has identified to limit themost their adaptation capacity: First, money and access to credit. Most of the coffeeproducers in Veracruz are small producers and have been seriously affected by thedrop in prices, so they have very limited resources (if any) to invest. In addition,access to credit for small producers in Mexico is virtually null. It’s possible that someproducers can implement some adaptation strategies such as migrating to higheraltitudes in case of a warmer climate, or changing to specialty coffee in order tohave access to higher prices (probably not small producers but some larger-scaleproducers that have more economic resources and access to credit) but it is not avery feasible option for most of them.
Second, coffee plantations are a long term investment. For a coffee plant toby productive it has to reach its productive stage (about 3 to 6 years). Takinginto account that most of the coffee producers in Veracruz are small scale withvery limited resources, moving to another area, changing to specialty coffee orto another crop represents a long term investment that not many of them canafford.
Third, land availability. In Mexico most of the land with agricultural potentialalready has a owner. The land at higher elevations could be occupied.
Fourth, government support. While there are some palliative government pro-grams like the Fondo de Estabilizacion del Cafe (Coffee Stabilizing Fund) that havehad a relative success on partially reducing the impact of the coffee price crisis onthe livelihood of producers, there is little government support on developing longterm solutions, planning and in technical issues.
Fifth, tradition. There is a high component of tradition in coffee productionin Mexico. Most of the coffee production developed in the state is denomi-nated “rustic”, that is grown inside the forests and in small plantations, inher-ited from one generation to another. It is almost impossible to conceive thatcoffee producers will accept radical changes. An example of this is the fail-ure of an institutional effort to limit coffee production and to improve its qual-ity, by reconverting productive lands below 700 meters to crops other than cof-fee. This has not been accepted by producers and one of their main reasons istradition.
As is shown in this paper, the potential impacts of climate change on agriculturecould be very large. Unfortunately, until now Mexican agriculture institutions donot consider climate change when designing policies, which could turn out to be avery expensive mistake. In the mid-term climate conditions could seriously affectthe economic viability for some crops and regions. Further research on adaptationand on exploring new alternatives for producers is required for decision makers todevelop effective strategies and policies to overcome future climate impacts and itssocioeconomic consequences.
POTENTIAL IMPACTS OF CLIMATE CHANGE ON AGRICULTURE 285
Acknowledgements
We acknowledge the support of AIACC during the preparation of this paper. Wethank Vıctor Magana and Juan Matıas Mendez from the Department of TropicalMeteorology of the Centro de Ciencias de la Atmosfera, UNAM for providingclimatic data, and Francisco Calderon from the Department of Economics of theUniversidad Iberoamericana for his help in econometrics.
Notes
1A non-monotonic function has a second derivative different from zero. That is, the ratio of the
change in the dependent variable to changes in the independent variable is not constant for the domain
of the independent variable.2Assessments of Impacts and Adaptation to Climate Change in Multiple Regions (AIACC).The
Group of Climate Change and Radiation of the Center for Atmospheric Sciencies, UNAM coordi-
nates the research project “Integrated Assessment of Social Vulnerability and Adaptation to Climate
Variability and Change Among Farmers in Mexico and Argentina” supported by the Global System
for Analysis, Research and Training (START), the Third World Academy of Sciences (TWAS), and
the United Nations Environment Programme (UNEP).3Climate data used for this study corresponds to Douglas’ region because it was considered more
reliable than the data from meteorological stations located in these municipalities due to their poor
quality (Bravo et al., 2005).4Source: http://www.veracruz.gob.mx/secciones.html?seccion=cafe@cafe en ver5Coffee production in Vietnam increased from representing a 5% of the world’s production in
1991 to the 13% in 2000. Source: http://www.ico.org/frameset/priset.htm.6A daily wage is the economic retribution paid to a temporary worker for a day’s work.7Consejo Estatal de Poblacion, Xalapa, Veracruz (http://coespo.ver.gob.mx/boletin11dejulio.
htm).8Minimum wage is the lowest legal remuneration for a day’s work. Source: INEGI and the Comision
Nacional de Salarios Mınimos.9Source: INEGI and Consejo Nacional de Poblacion.
10Obained from the Banco Nacional de Mexico.11Source: SAGARPA and International Coffee Organization.12For example, in 2002 the Mexican Agriculture Ministry instrumented the Fondo de Estabilizacion
del Cafe (Coffee Stabilization Fund) for partially compensating the producers’ income up to $20
USD when the prices are below $70 USD per 100 pounds (source: http://www.sagarpa.gob.mx/
sdr/progs2002/fe cafe.pdf). According to a survey conducted by the Institute for Rural Development
of Veracruz (INVEDER), in 2001 a coffee producer received an average of $73 USD per hectare per
year from government subsidies.13Coffee stocks in the USA was selected as a potentially relevant variable for the model because the
country is the world’s largest coffee importer followed by Germany and Japan. Source: International
Coffee Organization.14Source: Instituto Mexicano de la Propiedad Industrial, http://www.impi.gob.mx/impi/jsp/
indice all.jsp?OpenFile=docs/marco j/ext cafe veracruz.html15Reliable coffee production statistics for Veracruz were available from SAGARPA for the period
1969–2002. Production data was standardized to tons of arabica cherry coffee.16International Coffee Organization (http://www.ico.org/), the National Federation of Coffee
Producers of Colombia (http://www.cafedecolombia.com/), the Coffee Research Institute (http://
www.coffeeresearch.com), Naturland 2000, Nolasco 1985.
286 C. GAY ET AL.
17Infoagro, 2003 (http://www.infoagro.com/).18Instituto para el Desarrollo Tecnico de las Haciendas Publicas. http://www.indetec.gob.mx/
Coyunturas/Aspectos.asp?start=351.19This is the last 13 years average price in pesos per ton.20In the case of Brasil innovations include cultivating in areas less prone to frosts, improved
mechanical harvesting, increased use of irrigation and fetilization and increased use of financial and
risk management tools. These innovations have helped to achieve labor productivity levels ten times
higher than other producing countries and have allowed lowering production costs.21Considering the fixed average price from the last 13 years. If prices are fixed at their 2001 value,
the loss amounts to $10,652.34.22http://www.grida.no/db/maps/prod/level3/id 1243.htm, http://www.useu.be/Categories/Climate
Change/Nov0801UNEPCropyields.html
References
Aguirre Saharrea, F.: 2003, (N.D.). El Cafe de Mexico.
Aggarwal, P. K., Nagarajan, S., Shibu, M. E., and Ramakrishna, Y. S.: 2005, ‘Impact of climate
change scenarios on Indian agriculture’, Indian Agricultural Research Institute, New Delhi-
110012. http://www.unep.org/dpdl/indiaworkshop/documents/TS1 2 1.doc.
ASERCA: 2002, ‘Cafe de Mexico en Revista Claridades Agropecuarias’, Secretaria de Agricultura
Ganaderıa y Desarrollo Rural. March 2002 num. 103.
Avila, J., A.: 2001, ‘El mercado de los fertilizantes en Mexico: Situacion actual y perspectivas,’
Problemas Del Desarrollo 32(127), 189–207.
Bartra, A.: 1999, ‘El aroma de la historia social del cafe. La Jornada’, La Jornada Del Campo, 1–4.
Bravo, J. L., Gay, C., Conde, C. and Estrada, F.: 2005, ‘Comportamiento de la temperatura en algunas
estaciones del Estado de Veracruz’, Centro de Ciencias de la Atmosfera, UNAM. Unpublished
manuscript.
Castellanos, E., Conde, C., Eakin, H. and Tucker, C.: 2003, ‘Adapting to market shocks and climate
variability in mesoamerica’, The Coffee Crisis in Mexico, Guatemala and Honduras. Final Report
Draft. pp. 20.
Castillo, G., Contreras, A., Zamarripa, A., Mendez I., Vazquez M., Holguın, F. and Fernandez, A.:
1997, ‘Tecnologıa para la produccion del cafe en mexico’, Instituto Nacional de Investigaciones
Forestales, Agrıcolas y Pecuarias (INIFAP). Folleto Tecnico No. 8. Div. Agrıcola. pp. 90.
Chang, C. C.: 2002, ‘The potential impact of climate change on Taiwan’s agriculture’, Agric. Econ.27, 51–64.
Conde, C.: 2003, ‘Cambio y variabilidad climaticos, dos estudios de caso en Mexico. Ph. D. thesis,’
UNAM.
Conde, C. and Ferrer, R. M.: 2003b, ‘Perceptions of climate change among different sectors in the
mexican population’, Trabajo aceptado en la reunion Open Meeting of the Human Dimensions
of Global Environmental Change Research Community. Montreal, Canada.
Conde, C. and Eakin, H.: 2003c, ‘Adaptation to climatic variability and change in Tlaxcala, Mexico’,
in Smith, J., Klein, R., Huq, (eds.), climate Change, Adaptive Capacity and Development, Imperial
College Press, London.
Conde, C., Ferrer, R., Gay, C., Magana, V., Perez, J. L., Morales, T. and Orozco, S.: 1999, ‘El Nino
y la agricultura’, in Magana, V. (ed.), Los Impactos de El Nino en Mexico, Mexico, pp. 103–
135.
Conde, C., Vinocur, M., Gay, C., Seiler, R. and Estradam, F.: 2005, ‘Climatic threat spaces as a tool to
assess current and future climatic risk in Mexico and Argentina’ Two Case Studies’, In: AIACCSynthesis of Vulnerability to Climate Change in the Developing World (in revision).

POTENTIAL IMPACTS OF CLIMATE CHANGE ON AGRICULTURE 287
Conde, C., Liverman, D., Flores, M., Ferrer, R., Araujo, R., Betancourt, E., Villarreal, G. and Gay,
C.: 1997, ‘Vulnerability of rainfed maize crops in Mexico to climate change’, Climate Research9(1), 17–23.
Consejo Mexicano del Cafe–Secretarıa de Agricultura, Ganaderıa y Desarrollo Rural: 1996, Mexico
Cafetalero Estadısticas Basicas. Mexico.
Consejo Mexicano del Cafe–Secretarıa de Agricultura, Ganaderıa y Desarrollo Rural:
2001, Perspectivas de la cafeticultura en Mexico. Available at www.cmcafe.org.mx,
Mexico.
Douglas, A.: 1993, ‘Mexican temperature, precipitation and Drought data base documentation’, ftp:
hurricane.ncdc.noaa.gov. pp. 13.
Eakin, H.: 2000, ‘Smallholder maize production and climatic risk: A case study from central mexico’,
Climatic Change 45(1), 19–36.
Eakin, H.: 2003, ‘Workshop Report. Integrated Assessment of Social Vulnerability and Adaptation
to Climate Variability and Change Among Farmers in Mexico and Argentina’, Project supported
by UNDP-GEF, 2002–2004.
Gay, C., Seiler, R., Conde, C., Eakin, H., Vinocur, M. et al.: 2002, ‘Integrated assessment of social
vulnerability and adaptation to climate variability and change among farmers in Mexico and
Argentina’, Project supported by UNDP-GEF, 2002–2004.
Gay, C., Ruiz, L. G., Imaz, M. and Conde, C. (eds.): 1995, Memorias del Primer Taller del Estudio
del Paıs: Mexico ante el Cambio Climatico. Cuernavaca, Mor. 1994. INE, CCA, UNAM, USCSP.
Mexico.
Gay, C., Ruız Suarez, L. G., Imaz, M., Conde y, C. and Mar, B. (eds.): 1996, Memorias del Segundo
Taller del Estudio del Paıs Mexico ante el Cambio Climatico. Cuernavaca, Mor. 1995. INE, CCA,
UNAM, USCSP, Mexico.
Gay, C. (Compilador): 2000, Mexico: Una Vision hacia el siglo XXI. El Cambio Climatico en Mexico,
Resultados de los Estudios de Vulnerabilidad del Paıs Coordinados por el INE con el Apoyo del
U.S. Country Studies Program. SEMARNAP, UNAM, USCSP, pp. 220.
Gobierno del Estado de Veracruz: 2001, ‘Tercer informe de gobierno de miguel aleman velasco’,
http://www.veracruz.gob.mx.
Gujarati, D.: 2003, Basic Econometrics. 4 edition. McGraw-Hill/Irwin.
IPCC, WGII (Intergovernanmental Panel on Climate Change Working Group II): 2001, ‘Impacts,
adaptation and vulnerability’, in McCarthy, J. J., Canziani, O. F., Leary, N. A., Dokken, F. J., and
White, K.S., (eds.), Climate Change 2001, Cambridge University Press, pp. 1032.
Kaufmann, R. and Snell, S.: 1997, ‘A biophysical model of corn yield: Integrating climatic and social
determinants’, American Journal of Agricultural Economics 79, 178–190
La Red. Social Studies Network for Disaster Prevention in Latin America. Accessed 20/11/04 at
http://www.desinventar.org/desinventar.html
Liverman, D. and O’Brian, K.: 1991, ‘Global warming and climate change in Mexico’, Global Envi-ronmental Change 1(4), 351–364.
Magana, V., Conde, C., Sanchez, O. and Gay, C.: 1997, ‘Assessment of current and future regional
climate scenarios for Mexico’, Climate Research 9(2), 107–114.
Magana, V. (ed.): 1999, Los Impactos de El Nino en Mexico .Mexico. UNAM, IAI; SG. pp. 228,
http://ccaunam.atmosfcu.unam.mx/cambio/nino.htm.
Magana, Amador, J. and Medina, S.: 1999b, ‘The midsummer drought over Mexico and central
America’, Am. Met. Soc 12(6), 1577–2588.
Mendoza, V. M., Villanueva, E. E. and Adem, J.: 1997, ‘Vulnerability of basins and watersheds in
Mexico to global climate change’, Clim. Res. (2), 139–145.
Morales, T. and Magana, V.: 1999, Unexpected Frosts in Central Mexico during Summer. 11th Con-
ference on Applied Meteorology, American Meteorological Society. Dallas, Texas, Preprints, pp.
262–263.

288 C. GAY ET AL.
Naturland: 2000, Agricultura organica en el tropico y subtropico, Cafe, Asociacion Naturland, pp.
25, http://www.naturland.de
Nolasco, M.: 1985, Cafe y Sociedad en Mexico Centro de Ecodesarrollo, Mexico, pp. 455.
O’Brian, K. L. and Leichenko R. M.: 2000, ‘Double Exposure: assessing the impacts of climate
change within the context of economic globalization’, Global Environ. Change. Elsevier Science10, 221–232.
Perez, M.: 2005, Polıticas oficiales provocan que 50 mil productores dejen el agro cada ano. LaJornada, 6.
Smit, B. and Pilifosova, O.: 2001, ‘Adaptation to climate change in the context of sustainable de-
velopment and equity’, in McCarthy, J. J., Canzianni, O. F., Leary, N. A., Dokken, D. J. and
White, K. S. (eds.), Climate Change 2001: Impacts, Adaptation, and Vulnerability – Contributionof Working Group II to the Third Assessment Report of the Intergovernmental Panel on ClimateChange. Cambridge University Press.
TechnoServe :2003, Developing solutions to challenges in the coffee industry,
http://www.technoserve.org/McKinseyAnalysis.pdf
Villers, L. and Trejo, I.: 1997, ‘Assessment of the vulnerability of forest ecosystems to climate change
in Mexico’, Clim. Res. 9, 87–93.
(Received 7 July 2004; Accepted 15 December 2005)