Potential difference methods for measuring crack growth_ A ...
17
Contents lists available at ScienceDirect International Journal of Fatigue journal homepage: www.elsevier.com/locate/ijfatigue Review Potential difference methods for measuring crack growth: A review Y. Si, J.P. Rouse, C.J. Hyde ⁎ Gas Turbines & Transmissions Research Centre, Faculty of Engineering, University of Nottingham, United Kingdom ARTICLEINFO Keywords: Crack detection & monitoring Potential difference Non-destructive testing Review ABSTRACT Non-destructive testing techniques are widely applied in industry for the evaluation of quantities of interest without inflicting additional damage accumulation. Crack detection and monitoring is a prime example of where non-destructive testing is valuable. Among the variety of non-destructive testing techniques, the direct current and alternating current potential difference methods, which are based on the principle that an electrical po- tential field around a conductive specimen is disturbed by the presence of geometric irregularities (or “fea- tures”), have received a great deal of attention in the literature. This is mainly due to the high levels of accuracy associated with these techniques and good estimations of crack initiation and propagation having been achieved. A critical review of the evolution and applications of potential difference methods is presented in this paper. Potential difference methods are capable of providing accurate and continuous measurements with simple in- stallation and exclude the requirement of visual access under harsh service conditions. Alternating current potential difference methods require lower current input than direct current equivalents and hence provide higher sensitivity and offer better noise rejection but are vulnerable to capacitance effects and are more ex- pensive. Calibration curves can be determined analytically, numerically, or by direct or analogue experimental techniques with each method offering strengths and limitations. Application of these should be determined in accordance with the specific scenario. The performance of electric probes (of voltage measurements and current injection) on top- and side-face of C(T) and SEN(B) specimens are reviewed in detail as case examples. Specific guidance in normalising measurements and eliminating errors from thermoelectric effects can be implemented in order to improve the accuracy of PD methods. Abundant results have been obtained by applying PD methods in monitoring cracks geometries under aggressive conditions such as corrosion, high temperature, creep and cycled loading. 1. Introduction Technology in several industries, notably power generation, aero- space,andenergystorage,israpidlyevolvingdueinresponsetovarious societal pressures. There continues to be a necessity for a greater un- derstanding of how components behave and fail in service, in order to achieve optimal design, and higher mechanical demand. The determi- nation of crack geometry is a complicated task and due to limitations in current capabilities, measurements and predictions are usually asso- ciated with considerable levels of uncertainty. As a result, if a compo- nent, is predicted to be serviceable for a life, it is not inconceivable that a 50% safety factor will be applied to this, in order to compensate for the uncertainty. The capability of accurate, in-situ, non-destructive determination of crack geometry is therefore an important challenge faced by engineers today and is the subject of significant ongoing re- search activity [1–20]. There are several non-destructive testing (NDT) methods available, including optical [21], compliance [22,23], ultrasonic [24,25], acoustic emission [26–28], eddy current [27–29], alternating current field [30–33], and potential difference (PD) methods. All have associated advantages and disadvantages. PD methods possess many benefits as well as much potential for future development and it is for this reason that the current review focusses on the current status and use of such technologies. Based on the principle that the electric field around a conductive specimen is disturbed by discontinuities (e.g. cracks) inside, PD methods measure the voltage drop across part of the conductor and figure out information of such features through using calibration curves or formulas. The electric field is usually generated by the injection of direct/alternating current (DC/AC) hence PD methods are divided into DCPD and ACPD. The review paper first presents comparisons between PD methods and other NTD methods and between the above two PD methods with respect to their features and concepts of experimental sets-up. Afterwards, results, merit and demerit of three calibration methods, which are analytical solutions, numerical simulations, and https://doi.org/10.1016/j.ijfatigue.2020.105624 Received 6 December 2019; Received in revised form 19 March 2020; Accepted 23 March 2020 ⁎ Corresponding author at: Faculty of Engineering, University of Nottingham, NG9 3GU, United Kingdom. E-mail address: [email protected] (C.J. Hyde). International Journal of Fatigue 136 (2020) 105624 Available online 28 March 2020 0142-1123/ © 2020 Elsevier Ltd. All rights reserved. T
-
Upload
khangminh22 -
Category
Documents
-
view
0 -
download
0
Transcript of Potential difference methods for measuring crack growth_ A ...

Contents lists available at ScienceDirect
International Journal of Fatigue
journal homepage: www.elsevier.com/locate/ijfatigue
Review
Potential difference methods for measuring crack growth: A reviewY. Si, J.P. Rouse, C.J. Hyde⁎
Gas Turbines & Transmissions Research Centre, Faculty of Engineering, University of Nottingham, United Kingdom
A R T I C L E I N F O
Keywords:Crack detection & monitoringPotential differenceNon-destructive testingReview
A B S T R A C T
Non-destructive testing techniques are widely applied in industry for the evaluation of quantities of interestwithout inflicting additional damage accumulation. Crack detection and monitoring is a prime example of wherenon-destructive testing is valuable. Among the variety of non-destructive testing techniques, the direct currentand alternating current potential difference methods, which are based on the principle that an electrical po-tential field around a conductive specimen is disturbed by the presence of geometric irregularities (or “fea-tures”), have received a great deal of attention in the literature. This is mainly due to the high levels of accuracyassociated with these techniques and good estimations of crack initiation and propagation having been achieved.
A critical review of the evolution and applications of potential difference methods is presented in this paper.Potential difference methods are capable of providing accurate and continuous measurements with simple in-stallation and exclude the requirement of visual access under harsh service conditions. Alternating currentpotential difference methods require lower current input than direct current equivalents and hence providehigher sensitivity and offer better noise rejection but are vulnerable to capacitance effects and are more ex-pensive. Calibration curves can be determined analytically, numerically, or by direct or analogue experimentaltechniques with each method offering strengths and limitations. Application of these should be determined inaccordance with the specific scenario. The performance of electric probes (of voltage measurements and currentinjection) on top- and side-face of C(T) and SEN(B) specimens are reviewed in detail as case examples. Specificguidance in normalising measurements and eliminating errors from thermoelectric effects can be implementedin order to improve the accuracy of PD methods. Abundant results have been obtained by applying PD methodsin monitoring cracks geometries under aggressive conditions such as corrosion, high temperature, creep andcycled loading.
1. Introduction
Technology in several industries, notably power generation, aero-space, and energy storage, is rapidly evolving due in response to varioussocietal pressures. There continues to be a necessity for a greater un-derstanding of how components behave and fail in service, in order toachieve optimal design, and higher mechanical demand. The determi-nation of crack geometry is a complicated task and due to limitations incurrent capabilities, measurements and predictions are usually asso-ciated with considerable levels of uncertainty. As a result, if a compo-nent, is predicted to be serviceable for a life, it is not inconceivable thata 50% safety factor will be applied to this, in order to compensate forthe uncertainty. The capability of accurate, in-situ, non-destructivedetermination of crack geometry is therefore an important challengefaced by engineers today and is the subject of significant ongoing re-search activity [1–20].
There are several non-destructive testing (NDT) methods available,
including optical [21], compliance [22,23], ultrasonic [24,25], acousticemission [26–28], eddy current [27–29], alternating current field[30–33], and potential difference (PD) methods. All have associatedadvantages and disadvantages. PD methods possess many benefits aswell as much potential for future development and it is for this reasonthat the current review focusses on the current status and use of suchtechnologies. Based on the principle that the electric field around aconductive specimen is disturbed by discontinuities (e.g. cracks) inside,PD methods measure the voltage drop across part of the conductor andfigure out information of such features through using calibration curvesor formulas. The electric field is usually generated by the injection ofdirect/alternating current (DC/AC) hence PD methods are divided intoDCPD and ACPD. The review paper first presents comparisons betweenPD methods and other NTD methods and between the above two PDmethods with respect to their features and concepts of experimentalsets-up. Afterwards, results, merit and demerit of three calibrationmethods, which are analytical solutions, numerical simulations, and
https://doi.org/10.1016/j.ijfatigue.2020.105624Received 6 December 2019; Received in revised form 19 March 2020; Accepted 23 March 2020
⁎ Corresponding author at: Faculty of Engineering, University of Nottingham, NG9 3GU, United Kingdom.E-mail address: [email protected] (C.J. Hyde).
International Journal of Fatigue 136 (2020) 105624
Available online 28 March 20200142-1123/ © 2020 Elsevier Ltd. All rights reserved.
T
direct and analogue experimental methods, are concluded in great de-tails. In order to lead readers to better perform PD methods, some op-timisation guidance including recommended positions of electricprobes are reviewed. The final section concluded the performance of PDmethods in different service conditions, e.g. fatigue, creep, and sus-tained load.
Review papers have been produced by leaders in the field whichextol the merits and the state-of-the-art of non-destructive testing(NDT) techniques, including PD systems development and usage. Anearly comparison of DCPD and ACPD was given by Wei and Brazil [34]who described the how electrical signals could be used for monitoringsubcritical crack growth and the calibration of the signals generatedwith crack length. Some benefits and drawbacks of the use of DC or ACwere also discussed. This was followed by more comprehensive reviewsof the use of DCPD and ACPD for monitoring the growth of defects incomponents [35,36] and reviews specifically relating to the modellingaspects of NDT, including PD [27,28]. Later, a further review for the useof specifically ultrasonic and PD techniques for monitoring secondaryand tertiary stages of creep damage was given [37]. The latest of thesetopic specific reviews was published almost a decade ago, highlightingthe need for this review. Given here is a comprehensive review, in-cluding updates since previous reviews, of the use of PD across allloading types (creep, fatigue, for example), including both experimentaland modelling aspects.
Several laboratory specimen types are referred to throughout thisreview. These specimen types are summarised in Fig. 1 and will bereferred to in the subsequent sections of the review.
2. Non-destructive testing techniques for crack measurement
Within many industrial sectors (examples include energy genera-tion, aerospace, automotive, etc.), the accurate prediction of lifetime ofdamaged components has been recognised as an important issue.Modelling efforts require experimental data for calibration/validationand, in this field, this typically requires the detection of crack initiation(in both spatial and temporal dimensions) and measurements of crackgrowth. Several non-destructive testing (NDT) methods are currentlyavailable for crack growth monitoring, including optical observation,compliance methods, sonic methods (involving ultrasonic and acousticemission), eddy current methods, ACFM methods and PD methods. Inthe interest of completeness, a brief review of several NDT methods arepresented as alternatives of PD methods.
2.1. Optical
Optical observation methods, in which the fracture surface ismarked or the crack tip extension is tracked by a travelling telescope[21], provide accurate predictions of crack lengths but are restricted by
visual access [21,38–44]. Continuous monitoring is unfeasible[38–41,44] and the accuracy is highly dependent on operator skill[15,21,40] and image quality [15].
2.2. Compliance
Compliance methods, based on the relationship between cracklength and the resulting strain, have been widely used for monitoringlong cracks but lose sensitivity for small cracks [21–23]. When usingcompliance methods, periodic unloading at regular crack growth in-tervals is applied to the specimen and measurements are recordeddiscretely. For this reason, these methods are not applicable for testingunder dynamic or rapid loading [4,45,46]. Moreover, the methods arelimited for applications of aggressive environments such as creep,corrosion and high temperature (higher than 175 °C according to [45])[4,45,47,48]. The infeasibility at high temperature is presumably due tothe lack of available displacement gauges and the potential influence ofstress relaxation at crack tip during unloading [4]. Simultaneous ap-plications of compliance methods and PD methods to crack growthmeasurement under fatigue have been reported in several studies, withpoorer reproducibility and resolution found for compliance methods[11,23,49].
2.3. Ultrasonic
In ultrasonic testing an ultrasound wave is transmitted by a trans-ducer placed on the test-piece with part of this wave being reflected dueto discontinuities within the material. This part of the wave is collectedby a receiver and analysed in order to interpret the flaw [24,25]. Dif-ficulties in applications of ultrasonic methods arise in high temperatureenvironments [21,37] (or high temperature transducers must be used[50]), crack curvatures, and certain specimen geometries such as single-edge notched bend (SEN(B)) and double-cantilever bend specimens[21] (schematics of specimens are shown in Fig. 1).
2.4. Acoustic emission
In applications of acoustic emission methods, release of elasticstrain energy in the form of sound waves due to crack extension ismeasured and related to crack growth behaviour [26–28]. The methodsare suitable for continuous monitoring such as in manufacturing and inservice [27,28] but disadvantages lie within the difficulties of calibra-tion and interpretation [44], noise rejection and obtaining detectablesignals from low strength materials [26].
2.5. Eddy currents
Eddy current methods entail a current-carrying coil being placed onthe surface of a conductive specimen, consequently inducing eddycurrents in the specimen beneath the surface that will affect the im-pedance of the exciting coil. Defects in the specimen are interpreted bymeasuring variations in this impedance [27–29]. Eddy current methodshave received wide acceptance and are well suitable for surface defectdetection [29,44,51] but are limited to conductive materials and in-applicable to large crack lengths (due to the limited penetrating depthof eddy current, i.e. skin effect, that will be explained in Section 3.1)[27,28]. Moreover, eddy current methods suffer incapability to ferrousmetals due to their dependence on magnetic permeability [52].
2.6. Alternating current field measurement
In order to overcome some of disadvantages of the ACPD method(e.g. such as stray PD signals due to impedance of the electrical circuit),the alternating current field measurement (ACFM) method has beendeveloped. Within ACFM, an AC-field distribution (above the surface ofthe specimen) containing perturbations due to defects is measured with
Fig. 1. Schematics of standard fracture specimens: (a) C-shaped tension; (b)Compact tension; (c) Disc-shaped compact tension; (d) Double edge notched;(e) Middle tension; (f) Single edge notched; (g) Wedge opening loaded; (f)Double-cantilever bending [21].
Y. Si, et al. International Journal of Fatigue 136 (2020) 105624
2

effectively eliminated spurious voltages by the use of a CrackMicrogauge and the crack size is derived by comparing the results tonumerical models of the electromagnetic field [30–32,53]. The togetheruse of physical measurement and filed modelling allows the exclusionof calibration procedure, which minimises possible errors occurringduring calibration activities applied by other NTD methods [30–32,35].Inverse problems associated with crack profile determination have beensolved with numerical iterative procedures [54]. With respect to smallcrack sizing ability, it has been reported that ACPD was preferred inmonitoring long shallow surface cracks but lost accuracy in cases ofdeep surface cracks that could be accurately predicted by ACFM [30].
2.7. Potential difference
According to [29,55,56], Gille [57] has pointed out that the DCPDmethod was first applied to detect surface cracks by Trost in 1944 [58]but the concept was first mentioned several years earlier by B. M.Thornton and W. M. Thornton in 1938 [59]. Barnett and Troiano [60]first used this technique for laboratory research to measure crackgrowth kinetics in a study of hydrogen embrittlement in notched tensilespecimens. Electrical PD methods, which were also named as electricalresistance methods, have been used with success of detection crackclosure in fatigue crack studies [61–70], crack initiation in crack-opening displacement and fatigue tests [23,45,46,71–77], measurementof crack growth under various of loading conditions (including fatigue[9,21,55,78–81], creep [19,21,37,42,81–85], stress corrosion[21,86–88], sustained loading [89–91], fretting fatigue [12], and hy-drogen embrittlement [21,60]), determination of J curves[45,46,72–74,87], and evaluation of material properties [92–99]. Ap-plications of crack identification by PD methods have been extended toasymmetric cracks [100–102], angled cracks [103,104], and multiplecracks [105–114]. In additional to the wide application of PD methodon open cracks propagated under tension (Mode I), the method hasbeen used to Mode III (out-of-plane shear) [115], Mode II (in-planeshear) [116], and mixed Mode conditions (tension and in-plane shear)[15].
Several advantages of PD methods enable the wide application ofthe technique. The relatively cheap instrumentation and simple op-eration contribute to the preference [40,42,44,51,117–121]. Moreover,PD methods are believed to provide reliable and accurate predictions[11,42,122,123] yet continuous detection of cracks thereby allowsstable automation [42,44,51,117,118,120,122–124]. As reported in anearly work by Johnson and Willner in 1965 [86], an increment in cracklength of 0.004 in/0.10 mm is detectable by PD methods. Then ac-cording to a work by Soboyejo et al. in 1990 [123], the resolution hasbeen improved that a crack increase of µ10 m in a 10 mm thick bodywas measureable. Because visual accessibility is not required, PDmethods are capable to monitor through cracks and other applicationsin enclosed environmental, which are excluded by optical methods[11,42,77,122,125]. PD methods are applicable for testing various ex-treme environments such as corrosive, high pressure, high radiation,elevated and variable temperature conditions[11,14,40,44,51,117,119,120,123,124]. In particular, superior beha-viour has been noticed in creep damage monitoring [126] and crackclosure detection [75]. On the other hand, some limitations in PDmethods have been noted in the literature. Calibration for each testpiece geometry and load is required as the accuracy of calibrationsseriously affects the capability measurement [42,127]. PD methods arelimited to conductive materials [128] because a conducting patharound cracks inside the test piece is necessary. Moreover, there isvulnerability of PD methods to spurious potential signals during mea-surement (this is discussed in greater detail later in the paper).
PD methods fundamentally rely on the principle that an electricalpotential field will be disturbed by any discontinuity inside a current-carrying body. The location, shape and size of the discontinuity aredetectable by analysing this potential field and comparing it to a
“clean” signal (i.e. a potential field in a discontinuity free body). Forthis purpose, a constant current is supplied to a cracked or flawedconductive body and the PD is measured across the growing feature. Anincrease in the measured PD is associated with the decreased cross-section area caused by crack propagation. The measured PDs are thencorrelated with crack lengths by using appropriate calibrations curves.Calibration curves and PD measurements are sensitive to several factorswhich include the crack/notch geometry [2,3,43,55,129–131], thespecimen geometry [3,43,47], the arrangement of current injection[2,3,47,55,130], and the location for potential measurements [3,43,47](the latter two factors have been covered in Section 3.4.1). Moreover, inseveral studies involving multi-frequency ACPD method[22,124,132,133], calibration curves were found to be affected by op-erating frequency. However, an opposite argument has been reportedthat a linear slope of calibration established in WOL specimens wasindependent of operating frequency [134]. Error signals in calibrationmeasurement may be introduced by plastic deformation[11,47,56,60,72,79,80,134], crack closure [34,48,100,135,136], andtemperature fluctuation (which is related to temperature dependentresistivity) [2,76]. With respect to the last point, constant currentsupply and controlled temperature conditions, such as an immersion inan ice bath [21], is desirable [39].
Depending on the type of operating current, PD methods can berecognized as DCPD and ACPD. PD methods possess some advantagesover the other NTD techniques and will be discussed in detail in thisreview paper.
3. Electrical potential difference methods
3.1. Comparison between DCPD & ACPD
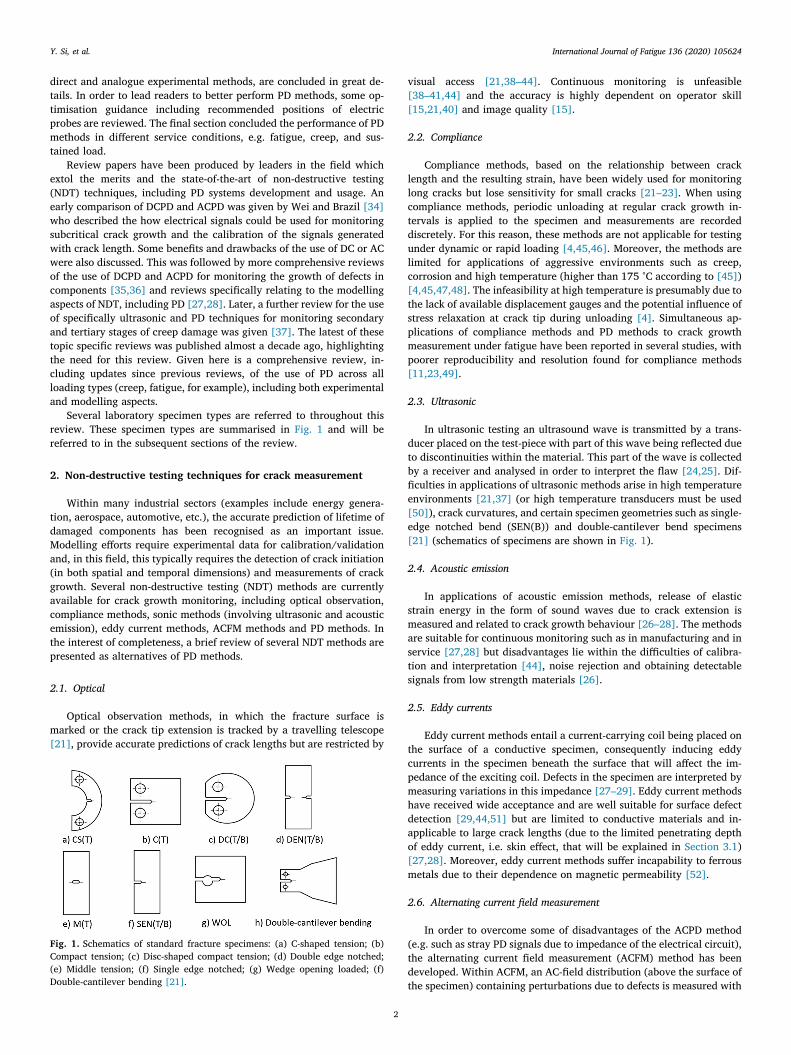
The DCPD method has been widely accepted due to its easy appli-cation and hence relative cheap cost [41,131,134,137]. Because of thenature of DC, DCPD is independent of magnetic permeability of con-ductive specimens hence the capacitance problem (the capacitance ofconductive specimen which is usually ignored actually exerts an effecton measurement of PD) concerned in ACPD is eliminated[13,52,121,131,137]. The wide use of DCPD offers another advantage,in that previous results and guidance are available for certain specimengeometries [41]. However, in DCPD tests the whole specimen is testedin terms of the current path, and so the specimen geometry itself (ratherthan just some flaw geometry) influences the calibration [13]. More-over, a relatively high current level is required in order to achievemeasurable potential outputs [41,76,137,138]. According to [134], aDC of 30-50A is necessary for a steel specimen in normal size. There-fore, it is less suitable for detecting small cracks (due to a small crackextension or electrical resistance) and less applicable in large structures(since a high current input is required to maintain a certain currentdensity in a large range). Furthermore, high current input may lead toundesired localised heating [76,139], which influences the materialconductivity and aggravates the effect of thermal electromotive forces(emf) on potential measurements. Another major concern in applyingDCPD occurs in the sensitivity to emf that is attributed to temperaturedifferences at connections between the specimen and measurementleads [29,34,41,137,139,140]. It should be noted that ACPD is immuneto the DC emf noise [29,34,40,48,125,127,138–140]. Effective actionsagainst emf effects are discussed later. To overcome some of the lim-itations of DCPD systems, the ACPD method has been developed as analternate. ACPD takes advantage of skin effect, as illustrated in Fig. 2,which refers to a confined current region beneath the specimen surfacecaused by interaction of original AC and induced eddy current.
Compared with the whole body affected in DCPD, in ACPD thecurrent field concentrates in a narrower layer near the material surface,thus a lower excitation current is sufficient to supply easily measurablepotentials [10,13,29,40,41,74,76,84,96,124,125,127,131,137,139],thereby minimising the risk of localised heating [13,96,139]. Hence,
Y. Si, et al. International Journal of Fatigue 136 (2020) 105624
3
ACPD is able to achieve higher sensitivity than DCPD, especially forsmall crack lengths near the surface of materials [13,34,40,41,132,141]and the effect of specimen geometries is reduced [13]. Verpoest et al.[132] have applied high frequency ACPD to detect and monitor surfacecracks in un-notched steel rods and gave the conclusions that a kHz40current frequency would allow detection of cracks in an area of 0.05% ofthe specimen cross-section, which was unachievable by the other NDTtechniques. Proper choice of coating materials, such as nanocompositecoatings which provides adjustable electric conductivity and magneticpermeability [142], could protect components from serve conditionsyet enhance the detecting ability of ACPD. Another important ad-vantage of ACPD is that the technique has higher noise rejection cap-abilities when lock-in amplifiers (which extracts and amplifies signalsat certain frequency) are used [10,29,34,124,140]. ACPD also performsbetter than DCPD in corrosive environments, since by changing polarityany unwanted electrochemical processes are eliminated[34,41,139,140].The depth of current penetration, known as the skindepth, is governed by [143,144]:
=µ2
(1)
where µ and are of magnetic permeability and electrical conductivity,respectively, and is the AC frequency. Hence by applying multi-fre-quency AC in ACPD tests, specific inspection can be conducted in dif-ferent depths of the specimen [10,84,141,145]. Conversely, in cases ofdeep cracks and crack tunneling, particular attention should be paid toensure the AC covers the whole inspection region [20,40]. Dis-advantages of ACPD include higher investment due to the amplificationand filtering equipment [48,76,137], and disturbance on calibrationcaused by capacitance effect such as change in permeability and con-ductivity [20,31,32,131,137]. In order to minimise spurious effectscaused by magnetic properties, low frequency ACPD measurementswere proposed in which some of the advantages of ACPD were con-served, yet the noise rejection was improved by suppressing the skineffect [84,85,146–148].
3.2. Experimental system designs
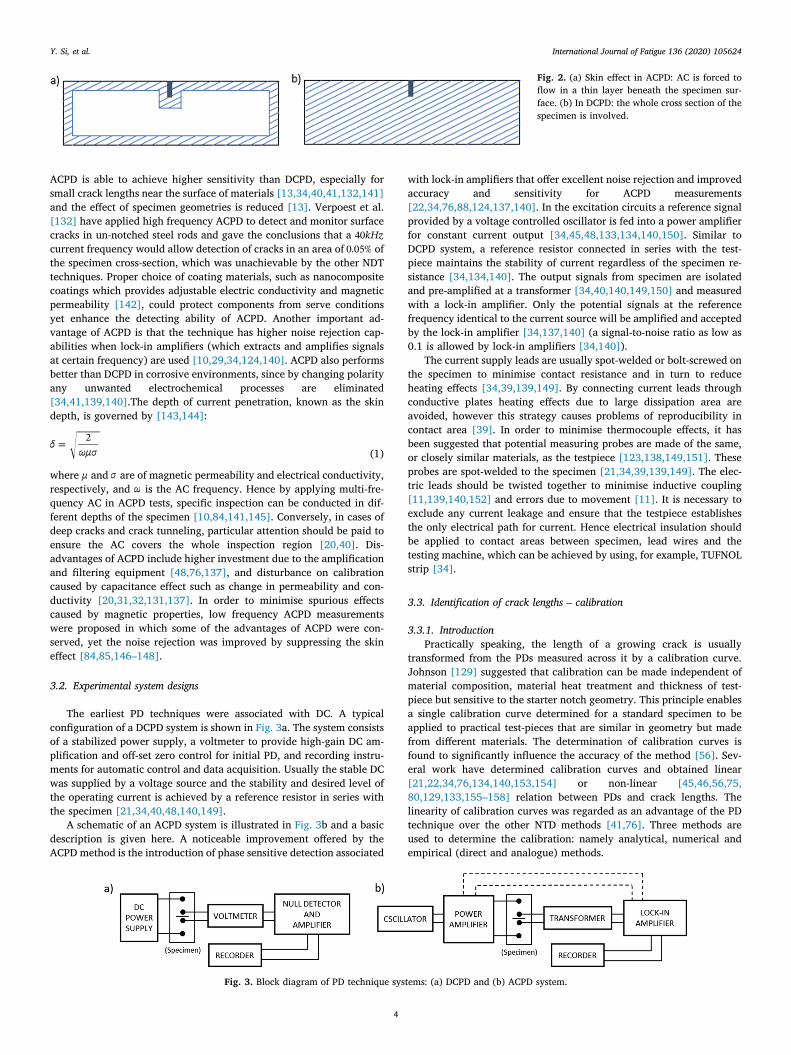
The earliest PD techniques were associated with DC. A typicalconfiguration of a DCPD system is shown in Fig. 3a. The system consistsof a stabilized power supply, a voltmeter to provide high-gain DC am-plification and off-set zero control for initial PD, and recording instru-ments for automatic control and data acquisition. Usually the stable DCwas supplied by a voltage source and the stability and desired level ofthe operating current is achieved by a reference resistor in series withthe specimen [21,34,40,48,140,149].
A schematic of an ACPD system is illustrated in Fig. 3b and a basicdescription is given here. A noticeable improvement offered by theACPD method is the introduction of phase sensitive detection associated
with lock-in amplifiers that offer excellent noise rejection and improvedaccuracy and sensitivity for ACPD measurements[22,34,76,88,124,137,140]. In the excitation circuits a reference signalprovided by a voltage controlled oscillator is fed into a power amplifierfor constant current output [34,45,48,133,134,140,150]. Similar toDCPD system, a reference resistor connected in series with the test-piece maintains the stability of current regardless of the specimen re-sistance [34,134,140]. The output signals from specimen are isolatedand pre-amplified at a transformer [34,40,140,149,150] and measuredwith a lock-in amplifier. Only the potential signals at the referencefrequency identical to the current source will be amplified and acceptedby the lock-in amplifier [34,137,140] (a signal-to-noise ratio as low as0.1 is allowed by lock-in amplifiers [34,140]).
The current supply leads are usually spot-welded or bolt-screwed onthe specimen to minimise contact resistance and in turn to reduceheating effects [34,39,139,149]. By connecting current leads throughconductive plates heating effects due to large dissipation area areavoided, however this strategy causes problems of reproducibility incontact area [39]. In order to minimise thermocouple effects, it hasbeen suggested that potential measuring probes are made of the same,or closely similar materials, as the testpiece [123,138,149,151]. Theseprobes are spot-welded to the specimen [21,34,39,139,149]. The elec-tric leads should be twisted together to minimise inductive coupling[11,139,140,152] and errors due to movement [11]. It is necessary toexclude any current leakage and ensure that the testpiece establishesthe only electrical path for current. Hence electrical insulation shouldbe applied to contact areas between specimen, lead wires and thetesting machine, which can be achieved by using, for example, TUFNOLstrip [34].
3.3. Identification of crack lengths – calibration
3.3.1. IntroductionPractically speaking, the length of a growing crack is usually
transformed from the PDs measured across it by a calibration curve.Johnson [129] suggested that calibration can be made independent ofmaterial composition, material heat treatment and thickness of test-piece but sensitive to the starter notch geometry. This principle enablesa single calibration curve determined for a standard specimen to beapplied to practical test-pieces that are similar in geometry but madefrom different materials. The determination of calibration curves isfound to significantly influence the accuracy of the method [56]. Sev-eral work have determined calibration curves and obtained linear[21,22,34,76,134,140,153,154] or non-linear [45,46,56,75,80,129,133,155–158] relation between PDs and crack lengths. Thelinearity of calibration curves was regarded as an advantage of the PDtechnique over the other NTD methods [41,76]. Three methods areused to determine the calibration: namely analytical, numerical andempirical (direct and analogue) methods.
Fig. 2. (a) Skin effect in ACPD: AC is forced toflow in a thin layer beneath the specimen sur-face. (b) In DCPD: the whole cross section of thespecimen is involved.
Fig. 3. Block diagram of PD technique systems: (a) DCPD and (b) ACPD system.
Y. Si, et al. International Journal of Fatigue 136 (2020) 105624
4

Attempts at analytical solutions consist of finding the solution toLaplace’s equation within the boundary conditions of a given specimengeometry, where the steady electrical potential field around a crackin a specimen is given by [55,56,117,127]:
=( ) 02 (2)
Several analytical solutions to the Laplace’s equation are availablefor simple specimen geometries by using conformal mapping methods[80,129,159], which offers a useful guide in experimental work. Ana-lytical methods are difficult to develop for geometries such as C(T)specimens due to the complicated solution domain[5,42,55,56,77,153], however it is precisely these type of specimensthat are commonly used for crack growth monitoring. When analyticalcalibration is not possible attention should instead be focused on nu-merical or experimental methods.
Numerical methods enable precise control of different parameters,such as geometries of crack and specimen, probe position for currentinjection and potential measurements. Hence these methods are sui-table for optimising probe configurations in isolation [3,18], estimatingeffects on calibration caused by specimen and crack geometry andplastic deformation [2,3,5,56] and simply determining multiple cali-bration curves for specimens with different aspect ratios [5]. Numericaltechniques are reported to be accurate and fast tools to derive cali-bration curves at relatively small cost compared with labour-intensiveand time-consuming experimental methods [18,56]. It should be noted,however, that a great deal of work is necessary in order to obtain highconfidence in numerical models before calibration curves can be gen-erated [34].
Through the use of experimental data, straightforward calibrationcurves are accessible for complex specimen geometries under anycombined conditions such as thermo-mechanical fatigue (TMF)[5,34,42]. Empirical solutions almost always suffer poor accuracy forsmall crack lengths [55,56,160] and measurements are vulnerable toerrors likely caused by variations in locations of current leads and po-tential probes [160]. Moreover, additional tests are required to de-termine calibration curves for other specimen geometries and probeconfigurations, which is costly and cumbersome [5,160]. Alternatively,analogue techniques, in which the cracked specimen is modelled byconductive materials and potential and crack length are measured onthe analogue models, has been widely applied to determine empiricalcalibrations for various specimen types. Available analogue modelsinclude graphitised paper, aluminium foil, wax, and rheoelectric tank.In the following sections, progress in calibration curves determined bythe three methods are presented separately in more detail. Whilst ca-libration process for specific conditions (e.g. specimen geometries,loading types, and service environment) are not given as re-commendations in this paper, due to the abundance of the possiblepermutations of situations, specific examples are demonstrated for theestablished C(T) and SEN(B) samples as shown in Fig. 4.
3.3.2. Analytical solutionsOne of the most widely used analytical calibration methods for
centre cracked specimens is Johnson’s formula [129] in which the po-tential is measured along the centreline and across the crack, and auniform current distribution is assumed, as illustrated in the subfigureof Fig. 5a.
By applying the method of conjugate functions with appropriateboundary conditions of a M(T) specimen, Johnson put forward a cali-bration equation for slit-type centre-cracks for finite-width plate, whichwas given by the ratio of PD corresponding to half of the slit length a,V ,and to half of an initial length a0, V0, as given by
=VV
cosh
cosh
cosh
cos
cosh
cos
0
1
1
yWa
Wy
Wa
W0
(3)
where W is the specimen width. Eq. (3) was then modified for an in-finite-width plate by simply changing boundary conditions. As shown inFig. 5a, the analogue calibration curve for a razor-shape (or slit-like)centre-crack [127] reasonably located between the curves for finite-and infinite-width plates. Eq. (3) was further developed for ellipticalcentre-cracks by modifying the boundary conditions and employingelliptical co-ordinates defined by
==
x c u vy c u v
cosh cossinh sin (4)
where c refers to the coordinate proportionality factor,>u v0, 0 2 . The PD ratio of elliptical centre-cracks is
= × ++
VV
cc
sinhu a exp u a u a u asinhu a exp u a u a u a
{ ( ) [ ( ) ( )]cosh ( )}{ ( ) [ ( ) ( )]cosh ( )}0 0
1 0 1 0
1 0 0 0 1 0 0 0 (5)
where u a( )1 and u a( )0 are the elliptic coordinate at the measuring po-sition and slot boundary respectively. The comparison for calibrationcurves derived by Johnson’s formula for slit and elliptical-centre cracksand experimental work for real elliptical cracks is given in Fig. 5b. Eq.(5) showed reasonable agreement with experimental results up to
=a a/ 1.60 , suggesting that elliptical centre-cracks are more re-presentative of cracks observed in real experimental test-pieces.
Johnson’s formula has been experimentally validated for slit centre-notched specimens, which by independent studies [162], concludedthat by taking a0 at a position remote from the starter slit rather thanhalf-length of it, the solutions given by Johnson’s formula furtheragreed with experimental results up to =a a/ 3.00 . Additionally, theanalytical calibrations presented by Johnson [129] have been success-fully applied to SEN(B) and C(T) specimens which benefited from thegeometrical similarity between M(T) specimens and SEN(B). C(T) spe-cimens in which a SEN(B) specimen was assumed to be half of a M(T)specimen and a C(T) specimen was regarded as a short SEN(B) spe-cimen [163]. Good agreement with experimental results were achieved
Fig. 4. Comparison of calibrations given by 2D FEA simulation [56], conformal mapping [80], analogue results [80] and direct experimental data [79,161] for C(T)and SEN specimens [56].
Y. Si, et al. International Journal of Fatigue 136 (2020) 105624
5

for the three types of fracture specimens in a range of =a W/ 1 (Fig. 6).Johnson’s formula has also been considered as applicable to SEN
and DEN specimens due to the symmetry features proposed by Bakker[73]. In a recent paper [2], the idea of geometric equivalence betweenspecimen types was extended to C-shaped tension (CS(T)), disc-shapedcompact tension (DC(T)) and double edge notched tension (DEN(T))specimens (as shown in Fig. 1 a, c, d respectively). By the use of two-dimensional (2D) finite element models for all the specimen types,Johnson’ formula has predicted the crack lengths based on numericallymeasured PDs and gave maximum errors <6%, suggesting that John-son’s formula could be used as a unified calibration function for all theseven fracture specimen types (M(T), SEN(B), SEN(T), C(T), CS(T), DEN(T) and DC(T)) (schematics of specimens are shown in Fig. 1). More-over, the accuracy of Johnson’s formula has been validated by wideapplications [20,23,42,47,102,136,164,165]. After first being pre-sented in 1965, the application of Johnson’s formula was first validatedusing M(T) specimens, then extended to various types of specimens andconsequently approved as a reliable and general analytical solution forPD methods. However, some studies have shown a disagreement withthis solution according to some applications. In Fig. 7 poor correlationbetween calibrations derived by Johnson’s formula and experimentaldata for C(T) specimens was observed by Vassilaros and Hackett [46],which was likely explained by the change in specimen geometry andelectric wire configuration, and variations in what is ideally uniformcurrent field. It has been suggested that Johnson’ formula is incapableof predicting open-hole single-crack specimens [5], and instead a seriesof finite element analysis (FEA) based calibration polynomials for dif-ferent centre hole diameters to specimen width ratios should be used.Based on an acceptable error < ± 10%, Schwalbe et al. [23] claimedthat Johnson’s formula was capable of predicting average lengths of
curved front cracks. Nevertheless, Kolitsch [8] noticed that for cases ofcracks growing from a semi-elliptical front, Johnson’s formula wouldunderestimate the crack depth since a straight through-thickness profilewas assumed.
In addition, Johnson’s solution has been developed by within otherworks for better applications. For example, it has been modified toevaluate the potential field around asymmetric M(T) specimen [101],2D cracks which is perpendicular to specimen surface and off centre[106], and multiple semi-elliptical surface cracks [110]. A comparisonof six calibration methods including several derivational functions ofJohnson’s formula has been reported by McKeighan and Smith [166] todetermine the optimum calibration techniques for M(T) and SEN(B)specimens under fatigue with limited experimental data. The two-pointmodified Johnson’s equation and post-test corrected Johnson’s equation
Fig. 5. (a) Comparison of Calibration curves given by Johnson’s formula (for finite and infinite plates) and experimental data [127] for M(T) specimens. Thesubfigure is the s Schematic of the M(T) specimen and probe configurations used in [129] (b) Calibrations for slit and elliptical-shaped centre notches [129].
Fig. 6. Calibrations given by Johnson’ s formula and experimental data for (a) M(T), (b) SEN(B) and (c) C(T) specimens [163].
Fig. 7. Poor comparison of empirical [46] and theoretical (Johnson’s formula)[129] calibrations for C(T) specimens [46].
Y. Si, et al. International Journal of Fatigue 136 (2020) 105624
6
have been reported as the optimum calibration equations. The two-point modified Johnson’s equation accounted for possible error attrib-uted to probe mislocation by introducing unknown factors and intoJohnson’s formula (Eq. (3)) and gave
=VV
cosh
cosh
cosh
cos
cosh
cos
0
1
1
yWa
Wy
Wa
W0
(6)
where and are solved by a nonlinear equation solver (FORRANcode). In the post-test corrected Johnson’s equation, the differencebetween crack lengths predicted by Eq. (3) and optical results was as-sumed to vary linearly from initiation to end, thus a correction wasdetermined from initial and final measurements (differences in cracklengths and PDs) and added the predicted crack lengths calculated byEq. (3).
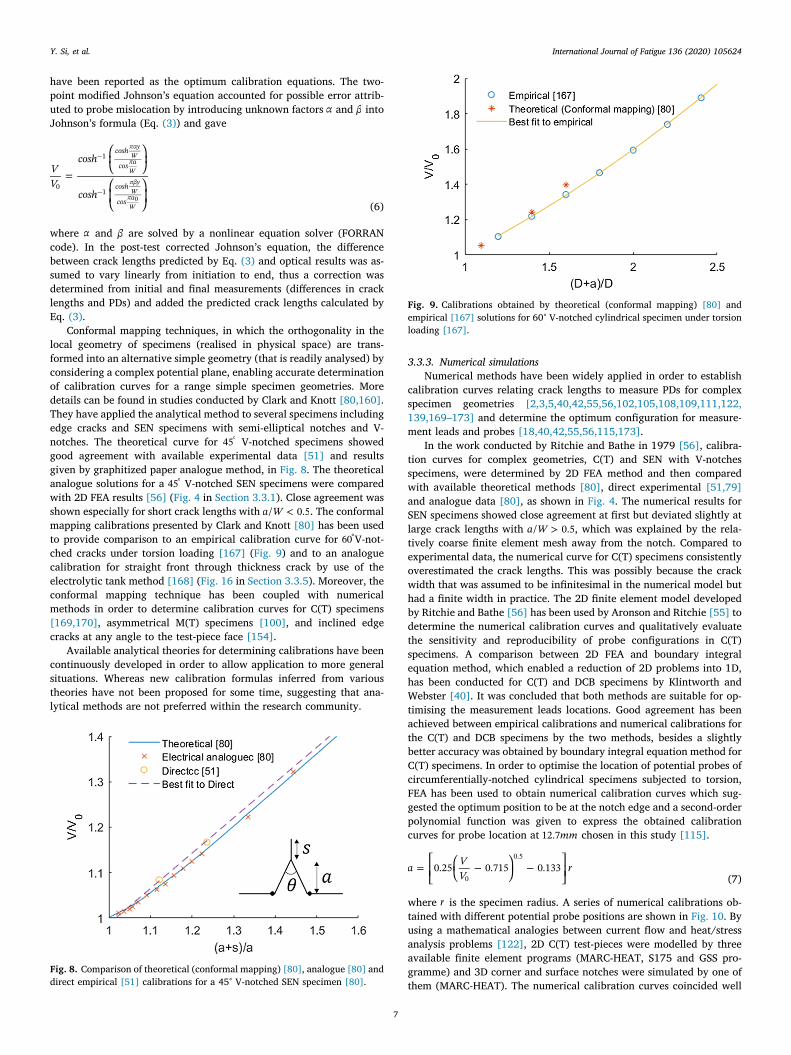
Conformal mapping techniques, in which the orthogonality in thelocal geometry of specimens (realised in physical space) are trans-formed into an alternative simple geometry (that is readily analysed) byconsidering a complex potential plane, enabling accurate determinationof calibration curves for a range simple specimen geometries. Moredetails can be found in studies conducted by Clark and Knott [80,160].They have applied the analytical method to several specimens includingedge cracks and SEN specimens with semi-elliptical notches and V-notches. The theoretical curve for °45 V-notched specimens showedgood agreement with available experimental data [51] and resultsgiven by graphitized paper analogue method, in Fig. 8. The theoreticalanalogue solutions for a °45 V-notched SEN specimens were comparedwith 2D FEA results [56] (Fig. 4 in Section 3.3.1). Close agreement wasshown especially for short crack lengths with <a W/ 0.5. The conformalmapping calibrations presented by Clark and Knott [80] has been usedto provide comparison to an empirical calibration curve for °60 V-not-ched cracks under torsion loading [167] (Fig. 9) and to an analoguecalibration for straight front through thickness crack by use of theelectrolytic tank method [168] (Fig. 16 in Section 3.3.5). Moreover, theconformal mapping technique has been coupled with numericalmethods in order to determine calibration curves for C(T) specimens[169,170], asymmetrical M(T) specimens [100], and inclined edgecracks at any angle to the test-piece face [154].
Available analytical theories for determining calibrations have beencontinuously developed in order to allow application to more generalsituations. Whereas new calibration formulas inferred from varioustheories have not been proposed for some time, suggesting that ana-lytical methods are not preferred within the research community.
3.3.3. Numerical simulationsNumerical methods have been widely applied in order to establish
calibration curves relating crack lengths to measure PDs for complexspecimen geometries [2,3,5,40,42,55,56,102,105,108,109,111,122,139,169–173] and determine the optimum configuration for measure-ment leads and probes [18,40,42,55,56,115,173].
In the work conducted by Ritchie and Bathe in 1979 [56], calibra-tion curves for complex geometries, C(T) and SEN with V-notchesspecimens, were determined by 2D FEA method and then comparedwith available theoretical methods [80], direct experimental [51,79]and analogue data [80], as shown in Fig. 4. The numerical results forSEN specimens showed close agreement at first but deviated slightly atlarge crack lengths with >a W/ 0.5, which was explained by the rela-tively coarse finite element mesh away from the notch. Compared toexperimental data, the numerical curve for C(T) specimens consistentlyoverestimated the crack lengths. This was possibly because the crackwidth that was assumed to be infinitesimal in the numerical model buthad a finite width in practice. The 2D finite element model developedby Ritchie and Bathe [56] has been used by Aronson and Ritchie [55] todetermine the numerical calibration curves and qualitatively evaluatethe sensitivity and reproducibility of probe configurations in C(T)specimens. A comparison between 2D FEA and boundary integralequation method, which enabled a reduction of 2D problems into 1D,has been conducted for C(T) and DCB specimens by Klintworth andWebster [40]. It was concluded that both methods are suitable for op-timising the measurement leads locations. Good agreement has beenachieved between empirical calibrations and numerical calibrations forthe C(T) and DCB specimens by the two methods, besides a slightlybetter accuracy was obtained by boundary integral equation method forC(T) specimens. In order to optimise the location of potential probes ofcircumferentially-notched cylindrical specimens subjected to torsion,FEA has been used to obtain numerical calibration curves which sug-gested the optimum position to be at the notch edge and a second-orderpolynomial function was given to express the obtained calibrationcurves for probe location at mm12.7 chosen in this study [115].
=a VV
r0.25 0.715 0.1330
0.5
(7)
where r is the specimen radius. A series of numerical calibrations ob-tained with different potential probe positions are shown in Fig. 10. Byusing a mathematical analogies between current flow and heat/stressanalysis problems [122], 2D C(T) test-pieces were modelled by threeavailable finite element programs (MARC-HEAT, S175 and GSS pro-gramme) and 3D corner and surface notches were simulated by one ofthem (MARC-HEAT). The numerical calibration curves coincided well
Fig. 8. Comparison of theoretical (conformal mapping) [80], analogue [80] anddirect empirical [51] calibrations for a 45° V-notched SEN specimen [80].
Fig. 9. Calibrations obtained by theoretical (conformal mapping) [80] andempirical [167] solutions for 60° V-notched cylindrical specimen under torsionloading [167].
Y. Si, et al. International Journal of Fatigue 136 (2020) 105624
7

with aluminium foil analogue results, experimental readings frombeach marking and an analytical solution for semi-circular crack. Theeffect of notch width and height in C(T) specimens and the currentapplication, concentrated or distributed, have been analysed by 2D FEAby Wilson [130]. Moreover, the paper observed insignificant differ-ences in calibration curves by using a fine mesh size (containing 3598nodes) compared with that obtained by employing a coarse mesh (961nodes), as shown in Fig. 11. The use of singular crack tip (collapsed)elements rather than conventional element could improve limited ac-curacy in calibration curves. A comparison between the behaviour of2D and 3D FEA in determining the length of a circumferential crack,based on measured DCPD under TMF conditions has been reported byGandossi et al. [42]. By comparing with crack lengths measured beforethe experiments, it was concluded that 3D FEA gave accurate calibra-tion curves whereas the curve obtained by 2D FEA tended to over-estimate the crack lengths.
The calibration curves for semi-elliptical and “ear-shaped” cracks(Fig. 12), were numerically determined by 3D FEA analysis by Doremuset al. [3]. The author proposed that by inserting experimental beach
markings into the numerical calculation, the accuracy of coupled nu-merical and experimental calibrations would be efficiently improved. Ina recent paper [2], the effect of crack geometries and temperaturedifference on calibration curves were evaluated by employing 3D finiteelement models on circumferential and semi-elliptical surface cracks.Additionally, a comparison between applying 2D axisymmetric modelsand 3D full model on circumferential cracks was conducted. The use ofa DC numerical model with modified geometries to approximate full 3DAC problems has been proposed for the sake of reducing computationalexpense [16].
In a study conducted by Hiroshi et al. [171], the boundary elementmethod was used to determine the depth of a semi-elliptical surfacecrack in ACPD tests and an empirical calibration function was devel-oped based on the numerical results. Due to the insufficient con-sideration of effects on potential field caused by the AC, and the high-frequency thin-skin mode assumed by the numerical model, the func-tion was suggested to offer a reliable calibration method, althoughactual coefficient values were not determined with a great deal ofconfidence. A 3D boundary element method was applied to a pair ofcoplanar coalescing surface cracks by Harrington et al. [172], using twocalibration equations which revealed the crack depth and profile. Pre-dicted and estimated crack shapes showed reasonable agreement withbeach marking results.
Moreover, several literatures [1,10,119,145,174–180] have identi-fied the shapes and locations of cracks without pre-established cali-bration curves, i.e. by using non-calibration methods, through numer-ical simulations. Numerical simulations are not limited by complexgeometries of specimens and cracks or affected by multiple environ-mental conditions but realise isolation analyses of multi-parameters. Byconsidering these advantages, numerical methods are suggested as themost potential solution in deciding calibrations and will gain more at-tention in the future.
3.3.4. Direct experimental methodsEmpirical calibration determination usually is associated with the
use of one of two methods for increasing crack lengths. The first in-volves increasing crack length by sequentially cutting the sample andmeasuring the corresponding potential values across the machinedcracks. This method has been applied to centre-notched [44], C(T)[21,46,51,56,115,134] and SEN [51,56] specimens. However, em-pirical calibrations determined from cutting cracks in this way werefound to give underestimation in crack length [44,71,117]. The secondmethod involves extending the crack by fatigue loading and the in-creasing crack length measured by optical microscopy and/or the beachmarking method.
Optical measurements can be conducted directly. In M(T) speci-mens, for example, the centre-crack propagates on the specimen sur-face. Alternatively, specimens may be broken after the test. This de-pends on the visual accessibility offered by a particular specimen type.Empirical calibration curves based on optical observation are availablefor DCB [40], C(T) [16], M(T) [100,129,162], CC [139], SEN [133],centre-circular hole [81], and circumferential cracked [3,167] speci-mens.
Fig. 10. Calibrations for circular notched cylindrical specimens under torsionwith different potential probe position [115].
Fig. 11. Effect of element mesh refinement on numerical calibrations for C(T)specimens [130].
Fig. 12. Semi-elliptical and ear-shaped cracks [3].
Y. Si, et al. International Journal of Fatigue 136 (2020) 105624
8
When applying the beach marking technique, crack profiles weremarked periodically on the fracture surface by changing the loadingfrequency [47], mean load [22,47,55,122,123,140,151,153,155,156,164,172], or by heat tinting [3,60,132,157]. The specimens werethen broken open after the tests and the crack lengths/depths measuredoptically. Beach marking enables curvature or irregular growth in crackshapes to be determined, thus necessary corrections can be applied tocalibration procures. Empirical calibration curves have been estab-lished this way for C(T) [47,55,122,140], DC(T) [156], M(T) [47,151],SEN [22] and semi-circular crack [3,123,150,155,164,172], circularexternal crack [164], corner crack (CC) [122,157], and fin notched[122] specimens. Some of the empirical calibration curves have beenshown Section 3.3.2–3.3.3 for comparison.
3.3.5. Analogue experimental methods3.3.5.1. Conducting paper. The conducting paper analogue method isapplicable for any 2D problem involving field or flow that obeys theLaplace equation [117]. With respect to the calibration of PDtechniques, the profile of a specimen is modelled by conductingpaper, such as graphitised electrical paper and a sheet of aluminiumfoil, which benefits from a relatively high resistivity and ease ofgenerating an artificial crack. The conducting paper is cut to conformprecisely with the geometry of the test-piece and the accuracy can beimproved by scaling up the analogue model (of the specimen)[102,122]. The crack is manufactured using a razor-blade[40,117,127] or scalpel [102,122]. Current injection is modelled bypainting the paper with silver conducting ink [117,160] and potentialdistribution is measured by electric wire and a potentiometer.
The graphite electrical paper analogue method has been widelyapplied to determine calibration curves for various types of cracks andspecimens such as V-notched SEN(B) [80,117,154], C(T) [40,117], DCB[40], and centre-notched specimens [44,117]. Analogue calibrations forV-notched SEN(B), C(T) and centre-notched specimens developed bySmith [117] is shown in Fig. 13 as examples.
The accuracy of the resulting calibration has been validated by theconformal mapping [80,117,154], direct experimental [40] and nu-merical [40,56] methods. Beside the determination of calibration, thegraphite paper analogue method has been used to reveal the PD dis-tribution on specimens and thus determine the optimum configurationof current and potential probes (the effect of probe positions on PDmeasurement was indicated by variations of equi-potential lines and theconsequent sensitivity was related to potential gradient) [79]. More-over, the analogue method has been utilised to study the influence ofthe relative crack closure area, with respect to the crack tip, on themeasured PDs in C(T) specimens [61].
For aluminium foil the analogue method has been applied to M(T)specimen with symmetrical [127] and asymmetrical M(T) [102] spe-cimens, C(T) specimens [122] and specimens with a central hole [77].
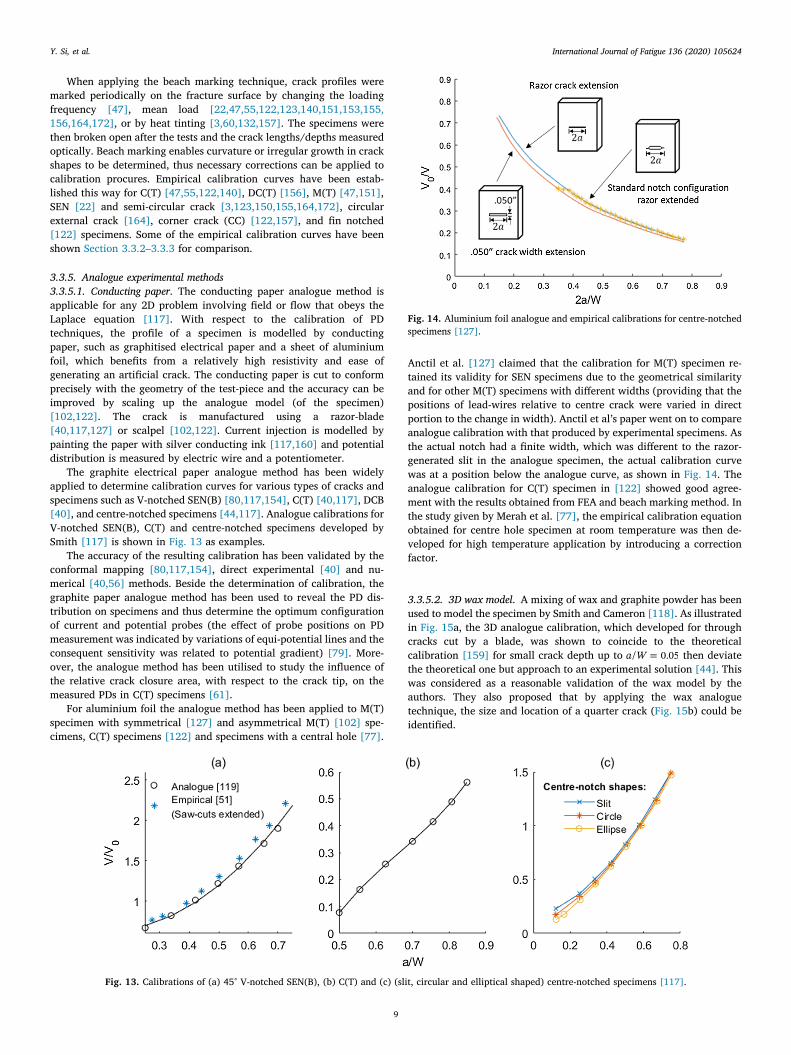
Anctil et al. [127] claimed that the calibration for M(T) specimen re-tained its validity for SEN specimens due to the geometrical similarityand for other M(T) specimens with different widths (providing that thepositions of lead-wires relative to centre crack were varied in directportion to the change in width). Anctil et al’s paper went on to compareanalogue calibration with that produced by experimental specimens. Asthe actual notch had a finite width, which was different to the razor-generated slit in the analogue specimen, the actual calibration curvewas at a position below the analogue curve, as shown in Fig. 14. Theanalogue calibration for C(T) specimen in [122] showed good agree-ment with the results obtained from FEA and beach marking method. Inthe study given by Merah et al. [77], the empirical calibration equationobtained for centre hole specimen at room temperature was then de-veloped for high temperature application by introducing a correctionfactor.
3.3.5.2. 3D wax model. A mixing of wax and graphite powder has beenused to model the specimen by Smith and Cameron [118]. As illustratedin Fig. 15a, the 3D analogue calibration, which developed for throughcracks cut by a blade, was shown to coincide to the theoreticalcalibration [159] for small crack depth up to =a W/ 0.05 then deviatethe theoretical one but approach to an experimental solution [44]. Thiswas considered as a reasonable validation of the wax model by theauthors. They also proposed that by applying the wax analoguetechnique, the size and location of a quarter crack (Fig. 15b) could beidentified.
Fig. 13. Calibrations of (a) 45° V-notched SEN(B), (b) C(T) and (c) (slit, circular and elliptical shaped) centre-notched specimens [117].
Fig. 14. Aluminium foil analogue and empirical calibrations for centre-notchedspecimens [127].
Y. Si, et al. International Journal of Fatigue 136 (2020) 105624
9

3.3.5.3. 3D rheoelectric tank. 3D rheoelectric tank technique involvesthe use of a conductive electrolyte, such as potassium chloride[123,160,168], mercury [67] and water [164], to simulate theconductive test-piece (an example is given in Fig. 16). Because theinsulating insert that represents the crack can be modified to anyarbitrary geometry, this method allows the evaluation of any chosencrack profile [164,168]. The method has been used to generatecalibration curves for different crack geometries including straight-fronted cracks [164,168], semi-circular/thumbnail cracks[123,164,168] and circular cracks [164]. The confidence of therheoelectric tank tests has been confirmed by the reasonablecomparison with theoretical results [123,164,168], beach markingreadings [123,164], graphitised electrical paper analogue method[168], and FEA results [168]. A comparison given by You and Knott[168] is shown as an example in Fig. 16b.
Additionally, Ward-Close [67] applied a scaled perspex model toestablish a series of calibration curves which indexes the extent of crackclosure based on the relation between two PDs measured near and re-mote the crack in a C(T) specimen.
3.4. Optimisation
3.4.1. Probe configurationA compromise between sensitivity and reproducibility of measure-
ment should be taken into consideration when choosing the positionsfor current injection leads and potential measurement probes[79,115,139]. In an early study by Ritchie, Garrett and Knott [79], thegraphitised electrical analogue paper method was used to determine the
optimised positions of electrical probes. As illustrated by equi-potentiallines in Fig. 17, the uniform current injection introduced from the endsurfaces of the specimen was recommended for SEN(B) specimens,while for C(T) specimens the contact area of current injection on the topface was suggested. For C(T) specimens made of aluminium a pointcontact by screwing was preferred because reproducible area contact,brazing employed in steel, for example, was inapplicable and other areacontact methods such as bolts and glues resulted in poor reproduci-bility. The most suitable positions for potential probes was suggested tobe on the top face and close to the notch ends (see V1 in Fig. 17c). In thesame year, McIntyre and Priest [21] proposed the same arrangement ofpotential probes as the optimum, but reported that the position of po-tential probes on opposite sides of the specimen could average thelength of curved cracks (also in [45], see V2 in Fig. 17c). The authorsrecommended current leads to be attached on the notched face andclose to the notch for WOL, C(T), SEN(B) specimens with only con-sideration of sensitivity but without reproducibility.
Clark and Knott [80] identified the optimum position of potentialprobes for SEN specimens by moving the probes along the specimenedge until reaching the notch feature, upon which the probe travelsperpendicular to the specimen edge (i.e. along the feature length). Arelatively constant sensitivity was observed near the notch end, com-pared with high sensitivity at the notch tip, indicating a low density ofequipotential lines and thus a high reproducibility. The good reprodu-cibility for potential measurement near the notch end was also observedin C(T) specimens by Aronson and Ritchie [55]. They continuouslyinvestigated the results given by Ritchie, Garrett and Knott [79] forC(T) specimens based on a FEA program and experimental work. Withcurrent applied from the top face, they agreed with the standard
Fig. 15. (a) Comparison of calibrations obtained by the wax analogue model[118], theoretical [159] and empirical [44] calibrations. (b) The quarter crack[118].
Fig. 16. (a) Schematic of 3D rheoelectric tanks. (b) Comparison of the analogue calibration curve simulated by electrolytic tank [168] with theoretical [80], direct[79], analogue [79] and numerical solutions [56 168].
Fig. 17. The optimum configuration of (a) current leads in SEN(B) specimens,(b) current leads in C(T) specimens, (c) potential probes in SEN(B) and C(T)specimens [79].
Y. Si, et al. International Journal of Fatigue 136 (2020) 105624
10

configuration presented in [79], that the potential probes attachedclose to the notch on the top face was optimum. They also presented analternative configuration for C(T) specimens made of high resistivitymaterials (note that the magnitude of measurable PD V| | dropped to 40%of that generated by the standard configuration) that could offer asteeper calibration curve and better reproducibility. In this case, currentleads were placed on the midpoints of side surfaces and the potentialprobes were positioned as before, as shown in Fig. 18. The same con-figuration was suggested by Klintworth and Webster [40] from thesame considerations of proportional increase in PD with crack lengthand less vulnerability to probes location. Via FEA simulations, steepcalibration curves have also been obtained by moving current injectionfrom the top to the side [130]. But differ to preceding studies in whichcurrent was applied by point contact [40,55], in this paper, a uniformdistribution offered by area contact was employed on the side surfaces.The alternative configuration for C(T) specimens with current suppliedat the side faces was employed by a number of studies, such as[73,163,165,170]. As for centre-notched specimens, generally, thecurrent is supplied at two ends, away from the centre crack and thepotential probes are placed across the crack[44,47,100,127,129,151,162,163]. The configuration of M(T) used in[129] is given in Fig. 5a. When a M(T) specimen contains an asym-metrical crack, as reported by Pulle [100], increasing the proximity ofpotential probes offers better sensitivity but also results in a vulner-ability to asymmetrical crack growth and thereby leads to under-estimation in crack length prediction. In a study of monitoring Mode IIIfatigue cracks under torsion (involving application of FEA) [115], theauthor determined the optimum potential probes of circumferentialnotch cylinder specimens to be at the notch edge with both con-siderations of sensitivity and reproducibility.
In addition to a single pair of potential probes used in conventionalconfigurations, a dual pair of potential probes, which would provide areference potential signals measured in a crack-free region, is widelyused as it allows for the normalisation of the measured potential signalsand compensates for variations in current and temperature, in additionto improving reproducibility [20,102]. Multiple potential probes havebeen applied to identify multiple crack parameters including curvedprofile [120,136,155,178,180], inclined crack angle and location[120,180,181], and to detect crack initiation and monitor crack growthin ceramic composites [14]. For the purpose of revealing surface crackprofiles, Harrington and Bell [182] developed a mobile probe ar-rangement in which a moveable single pair of potential probes insteadof multiple fixed probes was employed. The sensitivity of crack depth/length identification for small cracks (< mm5 ) has been further im-proved by a simultaneous application of a standard and a staggeredprobe configuration. A directional square-electrode sensor has beendeveloped for creep monitoring in which creep behaviour was relatedto the variation of the ratio of two resistances measured in orthogonal
directions [84,146,147].
3.4.2. NormalisationNormalising the PD (against a reference potential) and the crack
length (against a specimen dimension) helps to compensate the varia-tion of injecting current, test temperature, material properties (in-cluding time- or temperature-dependent resistivity changes) and spe-cimen thickness. If this point is taken to its conclusion, calibrationbecomes a function only dependent on specimen geometry and theprobe arrangement, meaning that geometrically similar test-piecesshare identical calibrations. There are several methods to determine areference potential value; measuring across a specified crack lengthsuch as the initial notch [6,40,42,55,117,140,153,155,170], measuringon the initially un-cracked test-piece [117,119,164], measuring on aseparate reference specimen placed in the same condition as the test-piece [11,45,127,134] and measuring in a region remote from the crackso that the current field is independent of the crack and remainshomogenous (as mentioned for the dual pair potential probes)[3,48,51,76,77,81,82,102,183,184]. Normalisations using a singularreference value allows the elimination of the effects of inherent mate-rial properties but excludes sustaining errors due to the variations oftemperature and current during testing [151]. These errors can be ac-counted for by on-line normalisations that involves the measurement ofa reference specimen or in an unaffected part of the test-piece. Addi-tional error is likely introduced by using a second specimen (due toslight variations in geometry and properties specimen to specimen).Difficulties in determining the location of a second pair of potentialprobes arise from limited uniform current regions in some specimenssuch as C(T) [39], M(T) [151] and through crack [155] specimens.
A normalisation method that accounts for thermal emf and initialcrack lengths has been applied to generate empirical calibration curvesby Saxena [47]. In this study, the potential increase caused by emf wasadded into the potential normalisation and the size of the initial crackwas covered by the crack length normalisation. The resulting empiricalcalibration curves were shown to be independent of material andtemperature (similar calibration curves were obtained for A470 steel at
°538 C and 304SS at °594 C) and provided accurate predictions of crackextension with error of less than 10% under creep.
3.4.3. Thermoelectric effectThe thermal electromotive force (emf) is generated due to a tem-
perature difference at connections between the test-piece and theelectric probes and produces an error in the PDs superposed on mea-sured signals. The effect of emf can be reduced by using electrodesmade of the same, or closely similar, material as the test-piece[123,138,149,151] because of similar thermal material parameters.Potential signals can be measured by periodically switching on and offthe operating current [3,47,48,77,81,100,102,126,151,183] or alteringthe current direction [126,151,177], then the PD between two readingsare calculated as the real output signal caused by crack extension with aminimised emf effect.
3.5. Application
3.5.1. High Temperature: Fatigue and creep loadingThe capability of PD methods to detect crack initiation and measure
crack propagation at elevated temperatures has been investigated inseveral studies [7,47,75–77,185]. The greatest challenge for the ap-plication of PD techniques at high temperature lies in ambiguous po-tential signals, which mask the potential increase caused by crack ex-tension, attributed to creep deformation, microstructural changes, andbridging between crack surfaces [38]. Errors in crack extensions duringcreep (under static loading at °500 C) obtained between measured va-lues and those predicted by calibrations predefined under fatigueloading were supposed to be due to changes in geometries of the spe-cimen and crack tip caused by high temperature behaviour deformation
Fig. 18. The alternative configuration for C(T) specimens with current injectedfrom the midpoints of side surfaces [55].
Y. Si, et al. International Journal of Fatigue 136 (2020) 105624
11

[47]. Moreover, crack propagation is faster under elevated tempera-ture, which was observed on powder metallurgical nickel-based su-peralloy by Na et al. [158].
PD methods offer reliable tools to detect crack initiation andmonitor crack propagation under fatigue loading at elevated tempera-ture. Usually as the cycles of fatigue load accumulate, PD remainsconstant at first, then begins to increase gradually after the onset ofcrack initiation or propagation from notch root [75,77]. Note thatwhether the noticeable increase of PD should be regarded as indicationof crack initiation or propagation remains as an open question, whichdepends on the resolution of the technique applied. Clear transitionfrom seemingly constant to increasing DC potential signal has beenobserved on circular 304SS notched specimens in both strain and stresscontrolled fatigue tests at °500 C [75]. A similar transition in AC signalsdue to crack initiation and growth has been obtained on SEN specimensof Ti64 in isothermal fatigue test at °400 C (while in TMF of Ti6246,potential signals increased continuously at increasing growth rateswithout the initial constant region) [76]. Pure fatigue tests under sus-tained loading were conducted on 304SS centre-circular notched spe-cimens (Fig. 19) at °600 C by Merah et al. [77]. As displayed byFig. 19b, a sudden jump in DC potential signal, due to notch openingand notch induced plastic deformation was followed by a constantperiod until the end of the crack initiation stage, then a gradual increaseand some subsequent step changes indicated crack propagation. In thiscase, the crack initiation stage was suggested to be determined as a 1%increase in normalised PD. The step changes occurring at elevatedtemperature in Fig. 19 were explained by the contact of multiple cracksand secondary cracks. The behaviour of the same specimen undercreep-fatigue tests were investigated in a sequent work given by Merah[81]. Different to pure-fatigue testing reported in [77], during sustainedloading the potential starts increase immediately after the initial jumpwithout a stable region (Fig. 19c), hence the initiation was suggested tobe determined by a deviation from linearity in DCPD-COD curves (seedetails in the Section 3.5.3).
Empirical calibrations, established under fatigue loading at over°500 C, for C(T) and CC(T) specimens made of 304SS and A470 steels,
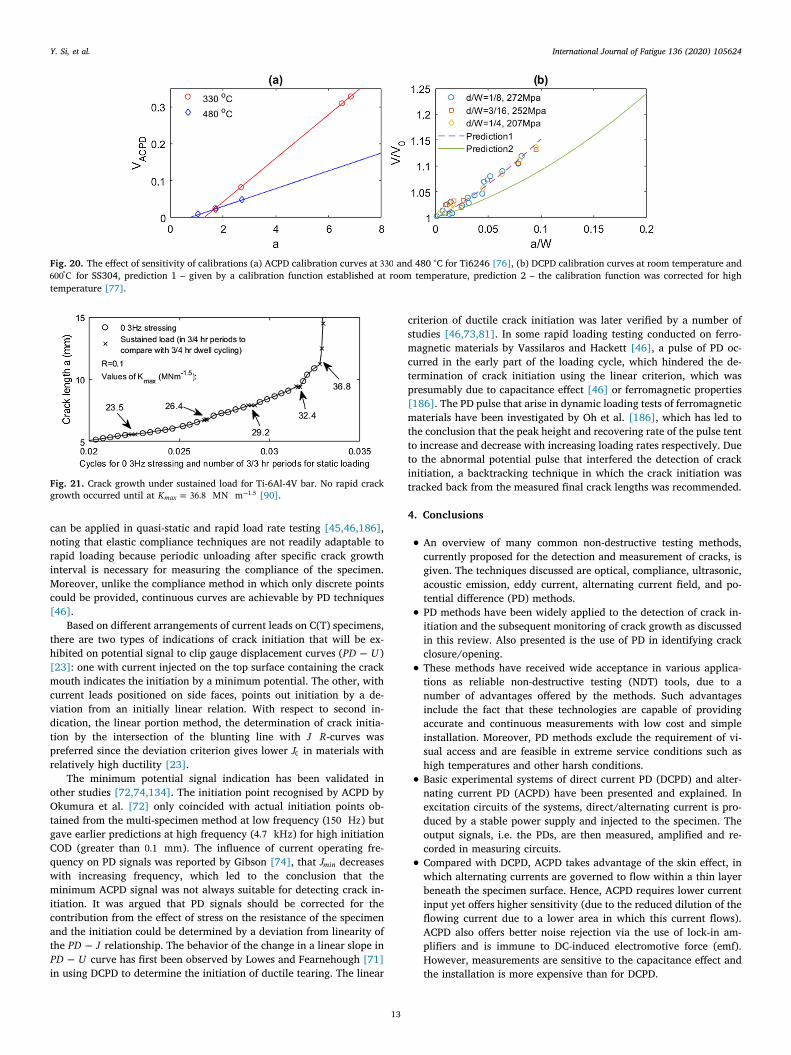
have been used to predict crack extensions during creep under staticloading with and reasonable accuracy (maximum error of less than 10%compared with results measured by beach marking) by Saxena [47].Linear empirical calibrations under isothermal and TMF testing condi-tions have been established by ACPD by Dai et al. [69], in which thelinear slopes were shown to decrease with increasing temperature andbe independent to TMF cycle type, i.e. similar slopes were given by out-of-phase and in-phase conditions. However, it was noticed by Merahet al. [77] that higher sensitivity in calibrations was exhibited at 600 °Cthan at room temperature. This was rationalised by the increase ofcrack tip plastic zone radius at high temperature. The disagreement inregard to the dependency of calibration sensitivity on temperature isshown in Fig. 20. To enable the determination of crack length under
high temperature and creep conditions, two corrections were suggestedto extend the calibration curve obtained at room temperature (“Pred. 1”in Fig. 20b) into a pure-fatigue equivalent at high temperature (“Pred.2” in Fig. 20b) [77] and also then into a creep-fatigue equivalent [81].
3.5.2. Sustained loadElectrical PD methods have been used under dwell time and sus-
tained conditions [17,82,89,90], for example, to monitor subcriticalcrack growth in AM350 SS with effects of environmental factors [89],and to study creep crack initiation and propagation in IN-X750 [82]. Ina study of fatigue crack growth with an introduction of dwell-time atmaximum load [90], DCPD was unable to detect crack growth during a45 min dwell, due to low crack growth rates (less than10 m per cycle4 ). In following sustained load tests for periods of170 hrs, no crack increase was recorded until the maximum stress in-tensity factor was increased up to 36.8 MN m 3/2, as illustrated inFig. 21.
The infeasibility of DCPD has been agreed by Gardiner [91], inwhich DCPD failed to indicate crack growth that was been clearly re-vealed by a heat tint. Nevertheless, crack growth rates for sustainedload conditions have been successfully obtained by PD methods[17,82], particularly for high growth rate cases.
3.5.3. In crack opening displacement tests, R-curves and crack initiationdetermination
As a further application of monitoring crack growth, PD techniqueshave been widely applied to crack opening testing for the determinationof crack initiation and crack growth resistance curves in terms ofJ -integral or crack tip opening displacement (COD), [49].
An increase in PD signals has been observed as a response to crackinitiation and in turn the feasibility of DCPD in detecting crack exten-sion has been validated [138]. The determination of R-curves by PDtechniques is achieved in three steps. Firstly, PD signals are measuredby DCPD/ACPD while load-line displacements/crack mouth openingdisplacement can be recorded (e.g. by means of a clip gauge). Next, themeasured PDs are transferred into crack length based on an appropriatecalibration. Lastly, the J or at all data points were calculated usingavailable standard definitions, and henceJ or resistance curvesagainst crack growth are established. The validity of R-curves resultedfrom the PD technique has been validated by the agreement betweencurves obtained from the regular multi-specimen technique[23,72–74,186], the unloading compliance method [23,45,46,71], andother methods, such as the key [45] and normalisation methods[4,186].
There are several advantages of PD techniques in terms of de-termining R-curves. The determination of R-curves using these techni-ques can be completed with a single specimen, which liberates the useof multiple specimens as for other methods and thus reduces experi-mental cost and the influence of material scatter [72,74]. PD techniques
Fig. 19. PD variations with the number of applied cycles (a) At room temperature, (b) At high temperature (600 °C) and (c) At high temperature ( °600 C with holdhour th of 5 min. (d) The SS304 centre-circular specimen [77,81].
Y. Si, et al. International Journal of Fatigue 136 (2020) 105624
12
can be applied in quasi-static and rapid load rate testing [45,46,186],noting that elastic compliance techniques are not readily adaptable torapid loading because periodic unloading after specific crack growthinterval is necessary for measuring the compliance of the specimen.Moreover, unlike the compliance method in which only discrete pointscould be provided, continuous curves are achievable by PD techniques[46].
Based on different arrangements of current leads on C(T) specimens,there are two types of indications of crack initiation that will be ex-hibited on potential signal to clip gauge displacement curves (PD U )[23]: one with current injected on the top surface containing the crackmouth indicates the initiation by a minimum potential. The other, withcurrent leads positioned on side faces, points out initiation by a de-viation from an initially linear relation. With respect to second in-dication, the linear portion method, the determination of crack initia-tion by the intersection of the blunting line with J R-curves waspreferred since the deviation criterion gives lower J0 in materials withrelatively high ductility [23].
The minimum potential signal indication has been validated inother studies [72,74,134]. The initiation point recognised by ACPD byOkumura et al. [72] only coincided with actual initiation points ob-tained from the multi-specimen method at low frequency (150 Hz) butgave earlier predictions at high frequency (4.7 kHz) for high initiationCOD (greater than 0.1 mm). The influence of current operating fre-quency on PD signals was reported by Gibson [74], that Jmin decreaseswith increasing frequency, which led to the conclusion that theminimum ACPD signal was not always suitable for detecting crack in-itiation. It was argued that PD signals should be corrected for thecontribution from the effect of stress on the resistance of the specimenand the initiation could be determined by a deviation from linearity ofthe PD J relationship. The behavior of the change in a linear slope inPD U curve has first been observed by Lowes and Fearnehough [71]in using DCPD to determine the initiation of ductile tearing. The linear
criterion of ductile crack initiation was later verified by a number ofstudies [46,73,81]. In some rapid loading testing conducted on ferro-magnetic materials by Vassilaros and Hackett [46], a pulse of PD oc-curred in the early part of the loading cycle, which hindered the de-termination of crack initiation using the linear criterion, which waspresumably due to capacitance effect [46] or ferromagnetic properties[186]. The PD pulse that arise in dynamic loading tests of ferromagneticmaterials have been investigated by Oh et al. [186], which has led tothe conclusion that the peak height and recovering rate of the pulse tentto increase and decrease with increasing loading rates respectively. Dueto the abnormal potential pulse that interfered the detection of crackinitiation, a backtracking technique in which the crack initiation wastracked back from the measured final crack lengths was recommended.
4. Conclusions
• An overview of many common non-destructive testing methods,currently proposed for the detection and measurement of cracks, isgiven. The techniques discussed are optical, compliance, ultrasonic,acoustic emission, eddy current, alternating current field, and po-tential difference (PD) methods.• PD methods have been widely applied to the detection of crack in-itiation and the subsequent monitoring of crack growth as discussedin this review. Also presented is the use of PD in identifying crackclosure/opening.• These methods have received wide acceptance in various applica-tions as reliable non-destructive testing (NDT) tools, due to anumber of advantages offered by the methods. Such advantagesinclude the fact that these technologies are capable of providingaccurate and continuous measurements with low cost and simpleinstallation. Moreover, PD methods exclude the requirement of vi-sual access and are feasible in extreme service conditions such ashigh temperatures and other harsh conditions.• Basic experimental systems of direct current PD (DCPD) and alter-nating current PD (ACPD) have been presented and explained. Inexcitation circuits of the systems, direct/alternating current is pro-duced by a stable power supply and injected to the specimen. Theoutput signals, i.e. the PDs, are then measured, amplified and re-corded in measuring circuits.• Compared with DCPD, ACPD takes advantage of the skin effect, inwhich alternating currents are governed to flow within a thin layerbeneath the specimen surface. Hence, ACPD requires lower currentinput yet offers higher sensitivity (due to the reduced dilution of theflowing current due to a lower area in which this current flows).ACPD also offers better noise rejection via the use of lock-in am-plifiers and is immune to DC-induced electromotive force (emf).However, measurements are sensitive to the capacitance effect andthe installation is more expensive than for DCPD.
Fig. 20. The effect of sensitivity of calibrations (a) ACPD calibration curves at 330 and 480 °C for Ti6246 [76], (b) DCPD calibration curves at room temperature and°600 C for SS304, prediction 1 – given by a calibration function established at room temperature, prediction 2 – the calibration function was corrected for high
temperature [77].
Fig. 21. Crack growth under sustained load for Ti-6Al-4V bar. No rapid crackgrowth occurred until at =K 36.8 MN mmax
1.5 [90].
Y. Si, et al. International Journal of Fatigue 136 (2020) 105624
13
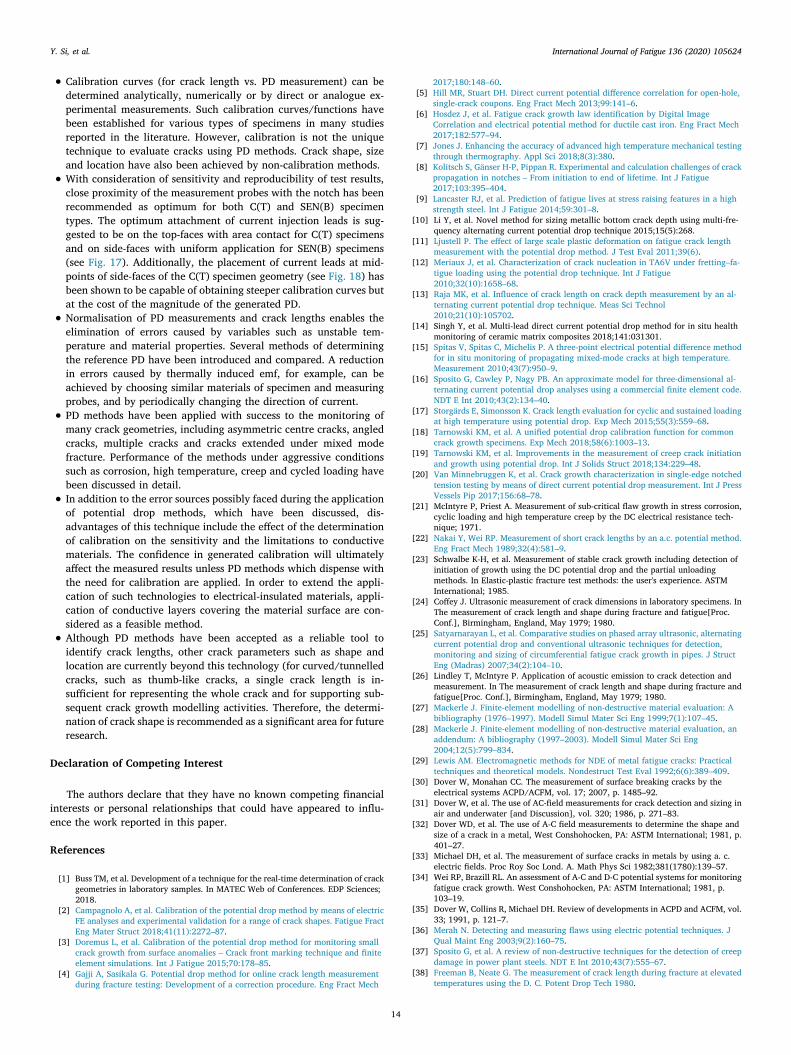
• Calibration curves (for crack length vs. PD measurement) can bedetermined analytically, numerically or by direct or analogue ex-perimental measurements. Such calibration curves/functions havebeen established for various types of specimens in many studiesreported in the literature. However, calibration is not the uniquetechnique to evaluate cracks using PD methods. Crack shape, sizeand location have also been achieved by non-calibration methods.• With consideration of sensitivity and reproducibility of test results,close proximity of the measurement probes with the notch has beenrecommended as optimum for both C(T) and SEN(B) specimentypes. The optimum attachment of current injection leads is sug-gested to be on the top-faces with area contact for C(T) specimensand on side-faces with uniform application for SEN(B) specimens(see Fig. 17). Additionally, the placement of current leads at mid-points of side-faces of the C(T) specimen geometry (see Fig. 18) hasbeen shown to be capable of obtaining steeper calibration curves butat the cost of the magnitude of the generated PD.• Normalisation of PD measurements and crack lengths enables theelimination of errors caused by variables such as unstable tem-perature and material properties. Several methods of determiningthe reference PD have been introduced and compared. A reductionin errors caused by thermally induced emf, for example, can beachieved by choosing similar materials of specimen and measuringprobes, and by periodically changing the direction of current.• PD methods have been applied with success to the monitoring ofmany crack geometries, including asymmetric centre cracks, angledcracks, multiple cracks and cracks extended under mixed modefracture. Performance of the methods under aggressive conditionssuch as corrosion, high temperature, creep and cycled loading havebeen discussed in detail.• In addition to the error sources possibly faced during the applicationof potential drop methods, which have been discussed, dis-advantages of this technique include the effect of the determinationof calibration on the sensitivity and the limitations to conductivematerials. The confidence in generated calibration will ultimatelyaffect the measured results unless PD methods which dispense withthe need for calibration are applied. In order to extend the appli-cation of such technologies to electrical-insulated materials, appli-cation of conductive layers covering the material surface are con-sidered as a feasible method.• Although PD methods have been accepted as a reliable tool toidentify crack lengths, other crack parameters such as shape andlocation are currently beyond this technology (for curved/tunnelledcracks, such as thumb-like cracks, a single crack length is in-sufficient for representing the whole crack and for supporting sub-sequent crack growth modelling activities. Therefore, the determi-nation of crack shape is recommended as a significant area for futureresearch.
Declaration of Competing Interest
The authors declare that they have no known competing financialinterests or personal relationships that could have appeared to influ-ence the work reported in this paper.
References
[1] Buss TM, et al. Development of a technique for the real-time determination of crackgeometries in laboratory samples. In MATEC Web of Conferences. EDP Sciences;2018.
[2] Campagnolo A, et al. Calibration of the potential drop method by means of electricFE analyses and experimental validation for a range of crack shapes. Fatigue FractEng Mater Struct 2018;41(11):2272–87.
[3] Doremus L, et al. Calibration of the potential drop method for monitoring smallcrack growth from surface anomalies – Crack front marking technique and finiteelement simulations. Int J Fatigue 2015;70:178–85.
[4] Gajji A, Sasikala G. Potential drop method for online crack length measurementduring fracture testing: Development of a correction procedure. Eng Fract Mech
2017;180:148–60.[5] Hill MR, Stuart DH. Direct current potential difference correlation for open-hole,
single-crack coupons. Eng Fract Mech 2013;99:141–6.[6] Hosdez J, et al. Fatigue crack growth law identification by Digital Image
Correlation and electrical potential method for ductile cast iron. Eng Fract Mech2017;182:577–94.
[7] Jones J. Enhancing the accuracy of advanced high temperature mechanical testingthrough thermography. Appl Sci 2018;8(3):380.
[8] Kolitsch S, Gänser H-P, Pippan R. Experimental and calculation challenges of crackpropagation in notches – From initiation to end of lifetime. Int J Fatigue2017;103:395–404.
[9] Lancaster RJ, et al. Prediction of fatigue lives at stress raising features in a highstrength steel. Int J Fatigue 2014;59:301–8.
[10] Li Y, et al. Novel method for sizing metallic bottom crack depth using multi-fre-quency alternating current potential drop technique 2015;15(5):268.
[11] Ljustell P. The effect of large scale plastic deformation on fatigue crack lengthmeasurement with the potential drop method. J Test Eval 2011;39(6).
[12] Meriaux J, et al. Characterization of crack nucleation in TA6V under fretting–fa-tigue loading using the potential drop technique. Int J Fatigue2010;32(10):1658–68.
[13] Raja MK, et al. Influence of crack length on crack depth measurement by an al-ternating current potential drop technique. Meas Sci Technol2010;21(10):105702.
[14] Singh Y, et al. Multi-lead direct current potential drop method for in situ healthmonitoring of ceramic matrix composites 2018;141:031301.
[15] Spitas V, Spitas C, Michelis P. A three-point electrical potential difference methodfor in situ monitoring of propagating mixed-mode cracks at high temperature.Measurement 2010;43(7):950–9.
[16] Sposito G, Cawley P, Nagy PB. An approximate model for three-dimensional al-ternating current potential drop analyses using a commercial finite element code.NDT E Int 2010;43(2):134–40.
[17] Storgärds E, Simonsson K. Crack length evaluation for cyclic and sustained loadingat high temperature using potential drop. Exp Mech 2015;55(3):559–68.
[18] Tarnowski KM, et al. A unified potential drop calibration function for commoncrack growth specimens. Exp Mech 2018;58(6):1003–13.
[19] Tarnowski KM, et al. Improvements in the measurement of creep crack initiationand growth using potential drop. Int J Solids Struct 2018;134:229–48.
[20] Van Minnebruggen K, et al. Crack growth characterization in single-edge notchedtension testing by means of direct current potential drop measurement. Int J PressVessels Pip 2017;156:68–78.
[21] McIntyre P, Priest A. Measurement of sub-critical flaw growth in stress corrosion,cyclic loading and high temperature creep by the DC electrical resistance tech-nique; 1971.
[22] Nakai Y, Wei RP. Measurement of short crack lengths by an a.c. potential method.Eng Fract Mech 1989;32(4):581–9.
[23] Schwalbe K-H, et al. Measurement of stable crack growth including detection ofinitiation of growth using the DC potential drop and the partial unloadingmethods. In Elastic-plastic fracture test methods: the user's experience. ASTMInternational; 1985.
[24] Coffey J. Ultrasonic measurement of crack dimensions in laboratory specimens. InThe measurement of crack length and shape during fracture and fatigue[Proc.Conf.], Birmingham, England, May 1979; 1980.
[25] Satyarnarayan L, et al. Comparative studies on phased array ultrasonic, alternatingcurrent potential drop and conventional ultrasonic techniques for detection,monitoring and sizing of circumferential fatigue crack growth in pipes. J StructEng (Madras) 2007;34(2):104–10.
[26] Lindley T, McIntyre P. Application of acoustic emission to crack detection andmeasurement. In The measurement of crack length and shape during fracture andfatigue[Proc. Conf.], Birmingham, England, May 1979; 1980.
[27] Mackerle J. Finite-element modelling of non-destructive material evaluation: Abibliography (1976–1997). Modell Simul Mater Sci Eng 1999;7(1):107–45.
[28] Mackerle J. Finite-element modelling of non-destructive material evaluation, anaddendum: A bibliography (1997–2003). Modell Simul Mater Sci Eng2004;12(5):799–834.
[29] Lewis AM. Electromagnetic methods for NDE of metal fatigue cracks: Practicaltechniques and theoretical models. Nondestruct Test Eval 1992;6(6):389–409.
[30] Dover W, Monahan CC. The measurement of surface breaking cracks by theelectrical systems ACPD/ACFM, vol. 17; 2007, p. 1485–92.
[31] Dover W, et al. The use of AC-field measurements for crack detection and sizing inair and underwater [and Discussion], vol. 320; 1986, p. 271–83.
[32] Dover WD, et al. The use of A-C field measurements to determine the shape andsize of a crack in a metal, West Conshohocken, PA: ASTM International; 1981, p.401–27.
[33] Michael DH, et al. The measurement of surface cracks in metals by using a. c.electric fields. Proc Roy Soc Lond. A. Math Phys Sci 1982;381(1780):139–57.
[34] Wei RP, Brazill RL. An assessment of A-C and D-C potential systems for monitoringfatigue crack growth. West Conshohocken, PA: ASTM International; 1981, p.103–19.
[35] Dover W, Collins R, Michael DH. Review of developments in ACPD and ACFM, vol.33; 1991, p. 121–7.
[36] Merah N. Detecting and measuring flaws using electric potential techniques. JQual Maint Eng 2003;9(2):160–75.
[37] Sposito G, et al. A review of non-destructive techniques for the detection of creepdamage in power plant steels. NDT E Int 2010;43(7):555–67.
[38] Freeman B, Neate G. The measurement of crack length during fracture at elevatedtemperatures using the D. C. Potent Drop Tech 1980.
Y. Si, et al. International Journal of Fatigue 136 (2020) 105624
14
[39] Halliday M, Beevers C. The D. C. electrical potential method for crack lengthmeasurement. In The measurement of crack length and shape during fracture andfatigue[Proc. Conf.], Birmingham, England, May 1979; 1980.
[40] Klintworth G, Webster G. Optimization of electrical-potential methods of mea-suring crack growth. J Strain Anal Eng Des 1979;14(4):187–92.
[41] Watt K. A consideration of an A. C. potential drop method for crack length mea-surement. In The measurement of crack length and shape during fracture and fa-tigue[Proc. Conf.], Birmingham, England, May 1979; 1980.
[42] Gandossi L, et al. The potential drop method for monitoring crack growth in realcomponents subjected to combined fatigue and creep conditions: application of FEtechniques for deriving calibration curves. Int J Press Vessels Pip2001;78(11–12):881–91.
[43] Antonarulrajah A, et al. Evaluation of the electrical potential drop technique in thedetermination of crack growth resistance-curves of Carbon/Carbon composites andcarbon bonded refractories. J Mater Sci 2005;40(2):373–80.
[44] Sidey D. The measurement of crack growth in metals by the electrical potentialmethod. Univ. Engineering Department; 1973.
[45] Tregoning RL. Feasibility study of alternating current potential drop techniques forelastic-plastic fracture toughness testing. ASTM Spec Tech Publ 1997;1303:43–65.
[46] Vassilaros MG, Hackett EM. J-integral R-curve testing of high strength steels uti-lizing the direct-current potential drop method. In ASTM Special TechnicalPublication; 1984.
[47] Saxena A. Electrical potential technique for monitoring subcritical crack growth atelevated temperatures. Eng Fract Mech 1980;13(4):741–50.
[48] Hartman GA, Johnson DA. D-c electric-potential method applied to thermal/me-chanical fatigue crack growth. Exp Mech 1987;27(1):106–12.
[49] Schwalbe K, Sets W. Application of the potential method and the compliancemethod for the measurement of R curve. In The measurement of crack length andshape during fracture and fatigue[Proc. Conf.], Birmingham, England, May 1979;1980.
[50] Kazys R, Voleisis A, Voleisiene B. High temperature ultrasonic transducers.Review. 2008;63:7–17.
[51] Ritchie R, Crack growth monitoring: some considerations on the electrical po-tential method. Univ., Engineering Department; 1972.
[52] Lu Y, Bowler JR. Four-point probe measurements of a direct current potential dropon layered conductive cylinders. Meas Sci Technol 2012;23(11).
[53] Michael DH, Waechter RT, Collins R. The measurement of surface cracks in metalsby using a.c. electric fields, vol. 381; 1982, p. 139–57.
[54] Connolly M, MIchael D, Collins R. The inversion of surface potential measurementsto determine crack size and shape. J Appl Phys 1988;64(5):2638–47.
[55] Aronson G, Ritchie R. Optimization of the electrical potential technique for crackgrowth monitoring in compact test pieces using finite element analysis. J Test Eval1979;7(4):208–15.
[56] Ritchie RO, Bathe KJ. On the calibration of the electrical potential technique formonitoring crack growth using finite element methods. Int J Fract1979;15(1):47–55.
[57] Gille G. Die Potentialsondenmethode und ihre Anwendung auf diezerstOrungsfreie Priifung grosset Werst (icke. 1956, Maschinenschaden.
[58] Trost A. Ermittlung von Rissen and Messung der Risstiefen in metallischenWerkstoffen durch elektrische Spannungsmessung. Metallwirtschaft1944;23:308–9.
[59] Thornton B, Thornton W. The measurement of the thickness of metal walls fromone surface only, by an electrical method. Proc Instit Mech Eng1938;140(1):349–98.
[60] Barnett WJ, Troiano AR. Crack propagation in the hydrogen-induced brittle frac-ture of steel. JOM 1957;9(4):486–94.
[61] Irving PE, Robinson JL, Beevers CJ. Fatigue crack closure in titanium and titaniumalloys. Int J Fract 1973;9(1):105–8.
[62] Shih TT, Wei RP. A study of crack closure in fatigue. Eng Fract Mech1974;6(1):19–32.
[63] Irving PE, Robinson JL, Beevers CJ. A study of the effects of mechanical and en-vironmental variables on fatigue crack closure. Eng Fract Mech 1975;7(4):619–30.
[64] Clarke CK, Cassatt GC. A study of fatigue crack closure using electric potential andcompliance techniques. Eng Fract Mech 1977;9(3):675–88.
[65] Bachmann V, Munz D. Fatigue crack closure evaluation with the potential method.Eng Fract Mech 1979;11(1):61–71.
[66] Lafarie-Frenot M, Gasc C. On the evaluation of crack closure using the potentialdrop method. Int J Fract 1979;15(3):R121–3.
[67] Ward-Close C. A new potential-drop method for the measurement of crack closure.Int J Fract 1980;16(4):R211–3.
[68] Pippan R, Haas G, Stüwe HP. Comparison of two methods to measure crack closurein ultra-high vacuum. Eng Fract Mech 1989;34(5):1075–84.
[69] Andersson M, et al. Fatigue crack propagation in Ti–6Al–4V subjected to highstrain amplitudes. Fatigue Fract Eng Mater Struct 2005;28(3):301–8.
[70] Andersson M, Persson C, Melin S. Experimental and numerical investigation ofcrack closure measurements with electrical potential drop technique. Int J Fatigue2006;28(9):1059–68.
[71] Lowes JM, Featnehough GD. The detection of slow crack growth in crack openingdisplacement specimens using an electrical potential method. Eng Fract Mech1971;3(2):103–4.
[72] Okumura N, et al. Application of the ac potential drop technique to the determi-nation of R curves of tough ferritic steels. Eng Fract Mech 1981;14(3):617–25.
[73] Bakker A. A DC potential drop procedure for crack initiation and R-curve mea-surements during ductile fracture tests. West Conshohocken, PA: ASTMInternational; 1985, p. 394–410.
[74] Gibson GP. The use of alternating current potential drop for determining J-crack
resistance curves. Eng Fract Mech 1987;26(2):213–22.[75] Sakane M, Ohnami M. Electrical potential drop and notch opening displacement
methods for detecting high temperature low cycle fatigue cracks of circumferentialnotched specimens. J Eng Mater Technol 1988;110(3):247–52.
[76] Dai Y, Marchand NJ, Hongoh M. Fatigue crack growth measurements in TMFtesting of titanium alloys using an ACPD technique. West Conshohocken, PA:ASTM International; 1995, p. 17–32.
[77] Merah N, Bui-Quoc T, Bernard M. Calibration of DC potential technique using anoptical image processing system in LCF testing. J Test Eval 1995;23(3):160–7.
[78] Whittaker MT, et al. The effect of microstructure and texture on mechanicalproperties of Ti6-4. Int J Fatigue 2009;31(11):2022–30.
[79] Ritchie R, Garrett G, Knott J. Crack-growth monitoring: optimisation of the elec-trical potential technique using an analogue method. Int J Fract 1971;7(4):462.
[80] Clark G, Knott JF. Measurement of fatigue cracks in notched specimens by meansof theoretical electrical potential calibrations. J Mech Phys Solids1975;23(4):265–76.
[81] Merah N. DC potential drop calibration in creep-fatigue loading conditions. J TestEval 2000;28(4):301–6.
[82] Vasatis IP, Pelloix R. Application of the dc potential drop technique in in-vestigating crack initiation and propagation under sustained load in notchedrupture tests, vol. 19; 1988, p. 863–71.
[83] Tada N, et al. Evolution of creep-fatigue damage in type 304stainless steel and itsdetection by electricalpotential method. 金属学报英文版 1998;11(6):463–9.
[84] Madhi E, Nagy PB. Sensitivity analysis of a directional potential drop sensor forcreep monitoring. NDT E Int 2011;44(8):708–17.
[85] Corcoran J, Nagy PB, Cawley P. Monitoring creep damage at a weld using a po-tential drop technique. Int J Press Vessels Pip 2017;153:15–25.
[86] Johnson HH, Willner AM. Moisture and stable crack growth in a high strengthsteel. Appl Mater Res 1965:34–40.
[87] Hackett EM, et al. Evaluation of environmentally assisted cracking of a highstrength steel using elastic-plastic fracture mechanics techniques. WestConshohocken, PA: ASTM International; 1986, p. 512–541.
[88] Santos-Leal E, Lopez RJ. Simultaneous measurement of acoustic emission andelectrical resistance variation in stress-corrosion cracking. Meas Sci Technol1995;6(2):188–95.
[89] Hancock G, Johnson H. Subcritical crack growth in AM350 steel, vol. 6; 1966.[90] Stubbington CA, Pearson S. Effect of dwell on the growth of fatigue cracks in Ti-
6Al-4V alloy bar. Eng Fract Mech 1978;10(4):723–56.[91] Gardiner RW. The detection of crack growth during sustained load cracking of Ti-
6Al-4V alloy bar. In The measurement of crack length and shape during fractureand fatigue[Proc. Conf.], Birmingham, England, May 1979; 1980.
[92] Lee JH, Saka M, Abé H. Loading effect on ACPD of a crack in ferromagnetic ma-terial. Exp Mech 1997;37(2):132–6.
[93] Bowler N. Electric field due to alternating current injected at the surface of a metalplate. J Appl Phys 2004;96(8):4607–13.
[94] Bowler N. Analytical solution for the electric field in a half space conductor due toalternating current injected at the surface. J Appl Phys 2004;95(1):344–8.
[95] Bowler N, Yongqiang H. Model-based characterization of homogeneous metalplates by four-point alternating current potential drop measurements. IEEE TransMagn 2005;41(6):2102–10.
[96] Bowler N. Theory of four-point alternating current potential drop measurementson a metal half-space. J Phys D Appl Phys 2006;39(3):584–9.
[97] Bowler JR, Bowler N. Theory of four-point alternating current potential dropmeasurements on conductive plates. Proc Roy Soc A: Math Phys Eng Sci2007;463(2079):817–36.
[98] Bowler JR, et al. Alternating current potential-drop measurement of the depth ofcase hardening in steel rods. Meas Sci Technol 2008;19(7):075204.
[99] Lu Y, et al. Edge effects in four-point direct current potential drop measurementson metal plates. J Phys D Appl Phys 2009;42(13):135004.
[100] Pulle D. Crack length measurement: Analysis of the electropotential method usinga finite element method. J Strain Anal Eng Des 1986;21(3):127–34.
[101] Read DT, Pfuff M. Potential drop in the center-cracked panel with asymmetriccrack extension. Int J Fract 1991;48(3):219–29.
[102] Link RE, et al. A Full Field DC Potential Drop Calibration for an AsymmetricallyCracked M(T) Specimen, vol. 23; 1995.
[103] Ohji K, Kubo S, Sakagami T. Electric Potential CT Method for Measuring Locationand Size of Two-and Three-Dimensional Cracks: Development of BoundaryElement Inverse Analysis Method for Electric Potential Problems and ItsApplication to Non-Destructive Crack Measurement. Trans Jpn Soc Mech EngSeries A 1985;51(467):1818–27.
[104] Sakagami T, et al. Quantitative Measurement of Two-Dimensional Inclined Cracksby the Electric-Potential CT Method with Multiple Current Applications. JSME IntJ. Ser. 1, Solid Mech Streng Mater 1988;31(1):76–86.
[105] Tada N. Monitoring of a surface crack in a finite body by means of electrical po-tential technique. Int J Fract 1992;57(3):199–220.
[106] Ghajarieh R, et al. NDE of multiple cracks on the surface of materials by means ofthe potential drop technique. NDT and E Int 1994;27(3):143–50.
[107] Ghajarieh R, et al. Simplified NDE of multiple cracks by means of the potentialdrop technique. NDT and E Int 1995;28(1):23–8.
[108] Tada N, et al. Analysis of direct current potential field around multiple randomcracks. Int J Fract 1996;75(1):69–84.
[109] Tada N, et al. Analysis on the applicability of direct current electrical potentialmethod to the detection of damage by multiple small internal cracks. Int J Fract1997;85(1):1–9.
[110] Liu H, et al. Analysis of Interaction of Multiple Cracks in a Direct Current Field andNondestructive Evaluation. J Appl Mech 1999;66(2):468–75.
Y. Si, et al. International Journal of Fatigue 136 (2020) 105624
15

[111] Tada N, et al. Analysis of Direct Current Potential Field around Multiple SphericalDefects. JSME Int J Series A 2000;43(2):109–16.
[112] Ghajar R. Crack interaction in NDE of multiple cracks by means of potential droptechnique. NDT and E Int 2003;36(8):581–5.
[113] Ghajar R. An alternative method for crack interaction in NDE of multiple cracks bymeans of potential drop technique. NDT and E Int 2004;37(7):539–44.
[114] Tada N. Evaluation of the distribution of multiple circular cracks with randomradii and angles by direct current electrical potential difference method. Int J Fract2006;141(1):49–62.
[115] Ritter MA, Ritchie RO, On the calibration, optimization and use of d.c. electricalpotential methods for monitoring mode III crack growth in torsionally-loadedsamples. Fatigue Fract Eng Mater Struct 1982;5(1):91–9.
[116] Spitas V, Spitas C, Michelis P. Real-time measurement of shear fatigue crackpropagation at high-temperature using the potential drop technique. Measurement2008;41(4):424–32.
[117] Smith RA. Calibrations for the electrical potential method of crack growth mea-surement by a direct electrical analogy. Strain 1974;10(4):183–7.
[118] Smith RA, Cameron AD. A three dimensional wax analogue for the calibration ofthe electrical potential technique of crack growth monitoring. In Valluri SR, et al.,editors, Fracture 84. Pergamon; 1984, p. 3371–6.
[119] Chen W-H, Chen J-S, Fang H-L. A theoretical procedure for detection of simulatedcracks in a pipe by the direct current–potential drop technique. Nucl Eng Des2002;216(1):203–11.
[120] Tada N, et al. Experimental study of three-dimensional identification of semi-el-liptical crack on the back surface by means of direct-current electrical potentialdifference method of multiple-point measurement type. J Press Vessel Technol2011;133(1):014502–014502-5.
[121] Tarnowski KM, et al. Predicting the influence of strain on crack length measure-ments performed using the potential drop method. Eng Fract Mech2017;182:635–57.
[122] Hicks MA, Pickard AC. A comparison of theoretical and experimental methods ofcalibrating the electrical potential drop technique for crack length determination.Int J Fract 1982;20(2):91–101.
[123] Soboyejo WO, Reed RC, Knott JF. On the calibration of the direct current potentialdifference method for the determination of semi-elliptical crack lengths. Int J Fract1990;44(1):27–41.
[124] Hwang IS. A multi-frequency AC potential drop technique for the detection ofsmall cracks. Meas Sci Technol 1992;3(1):62–74.
[125] Belloni G, et al. On the Experimental Calibration of a Potential Drop System forCrack Length Measurements in a Compact Tension Specimen. J Test Eval2002;30(6):461–9.
[126] Yu KM, Nahm SH, Kim YI. Toughness degradation evaluation of 1Cr–1Mo–0.25Vsteel by electrical resistivity. J Mater Sci Lett 1999;18(14):1175–6.
[127] Anctil AA, Kula EB, DiCesare E. Electrical Potential Technique for DeterminingSlow Crack Growth, vol. 63; 1963, p. 19.
[128] Micone N, De Waele W. On the Application of Infrared Thermography andPotential Drop for the Accelerated Determination of an S-N Curve. Exp Mech2017;57(1):143–53.
[129] Johnson HH. Calibrating the Electric Potential Method for Studying Slow CrackGrowth, vol. 5; 1965.
[130] Wilson WK. On the electrical potential analysis of a cracked fracture mechanicstest specimen using the finite element method. Eng Fract Mech1983;18(2):349–58.
[131] Gu J, Yu LY. The influence of geometric factors on crack depth measurement usingthe potential drop technique. NDT Int 1990;23(3):161–4.
[132] Verpoest I, et al. An improved A.C. potential drop method for detecting surfacemicrocracks during fatigue tests of unnotched specimens. Fatigue Fract Eng MaterStruct 1980;3(3):203–17.
[133] Tiku S, Marchand NJ, Unvala B. An Advanced Multiple Frequency ACPD Systemfor Crack Detection and Calibration. West Conshohocken, PA: ASTM International;1997, p. 56–70.
[134] Venkatsubramanian TV, Unvala BA. An AC potential drop system for monitoringcrack length. J Phys E: Sci Instrum 1984;17(9):765–71.
[135] Bachmann V, Munz D. Unusual potential drop during the application of theelectrical potential method in a fracture mechanics test. J Test Eval1976;4(4):257–60.
[136] Cerny I, Kneifl M, Linhart V. Measurement of crack length and profile in thickspecimens and components using modified DCPD method. WIT Trans Eng Sci1998;19.
[137] Kluttig B, et al. Crack growth measurements on components under cyclic loading:comparison of different methods. Nucl Eng Des 1994;151(2):523–30.
[138] Davies J, Cannon DF, Allen RJ. Measurements of Electrical Potential for detectingCrack Extension in COD Tests. Nature 1970;225(5239):1240–2.
[139] Lu Z-J, Nicholas P, Evans W. Calibration of an ACPD monitoring system for smallcrack growth in corner crack specimens. Eng Fract Mech 1995;50(4):443–56.
[140] Wei R, Brazill R. An A. C. Potential System for Crack Length Measurement. In TheMeasurement of Crack Length and Shape During Fracture and Fatigue[Proc. Conf.], Birmingham, England, May 1979; 1980.
[141] Persvik Ø, Bowler JR. Evaluation of four-point transient potential drop on con-ductive plates. Appl Phys Lett 2017;110(8):084102.
[142] Rao SS, et al. Signal sensitivity of alternating current potential drop measurementfor crack detection of conductive substrate with tunable coating materials throughfinite element modeling. Meas Sci Technol 2016;27(12):125004.
[143] Jordan EC, Balmain KG. Electromagnetic waves and radiating systems. 2nd ed.Prentice-Hall of India; 2008.
[144] Grant IS, Phillips WR. Electromagnetism. John Wiley & Sons; 2013.
[145] Saguy H, Rittel D. Alternating current flow in internally flawed conductors: Atomographic analysis. Appl Phys Lett 2006;89(9):094102.
[146] Madhi E, et al. In-situ creep monitoring using the potential drop method. AIP ConfProc 2011;1335(1):1631–8.
[147] Prajapati S, Nagy PB, Cawley P. Potential drop detection of creep damage in thevicinity of welds. NDT and E Int 2012;47:56–65.
[148] Corcoran J, et al. Creep strain measurement using a potential drop technique. Int JMech Sci 2016;110:190–200.
[149] Loveday MS, et al. Measurement of high temperature mechanical properties ofmaterials: based on the edited proceedings of a symposium held from 3–5 June1981 at the National Physical Laboratory, Teddington, England. H.M.S.O; 1982.
[150] Ikeda K, Yoshimi M, Miki C. Electrical potential drop method for evaluating crackdepth. Int J Fract 1991;47(1):25–38.
[151] Bauschke H-M, Schwalbe K-H. Measurement of the depth of surface cracks usingthe Direct Current Potential Drop Method. Materialwiss Werkstofftech1985;16(5):156–65.
[152] Saguy H, Rittel D. Flaw detection in metals by the ACPD technique: Theory andexperiments. NDT and E Int 2007;40(7):505–9.
[153] Austen IM, Walker EF. Calibration of the electrical resistance technique for crackgrowth monitoring in CKS type test pieces. BSC Tech. Rep.; 1976, p. PMC/6795/6/76/B.
[154] Green D, Kendall J, Knott J. Analytic and analogue techniques for determiningpotential distributions around angled cracks. Int J Fract 1988;37(1):R3–12.
[155] Enmark M, Lucas G, Odette GR. An electric potential drop technique for char-acterizing part-through surface cracks. J Nucl Mater 1992;191–194:1038–41.
[156] Gilbert C, et al. Back-Face Strain Compliance and Electrical-Potential Crack LengthCalibrations for the Disk-Shaped Compact-Tension DC(T) Specimen. J Test Eval1994;22(2):117–20.
[157] Liu J, Bowen P. DC potential drop calibration in matrix-cladded Ti MMC speci-mens with a corner notch. Int J Fatigue 2003;25(7):671–6.
[158] Na S, et al. An evaluation of the fatigue crack propagation rate for powder me-tallurgical nickel-based superalloys using the DCPD method at elevated tempera-tures. Int J Fatigue 2017;101:27–35.
[159] Gilbey DM, Pearson S. Measurement of the Length of a Central or Edge Crack in aSheet of Metal by an Electrical Resistance Method; 1966, p. 17.
[160] Knott JF. The Use of Analogue and Mapping Techniques with Particular Referenceto Detection of Short Cracks in The Measurement of Crack Length and ShapeDuring Fracture and Fatigue[Proc. Conf.], Birmingham, England, May 1979; 1980.
[161] Garrett GG. Ph.D. Thesis. University of Cambridge; 1973.[162] Li C-Y, Wei R. Calibrating the electrical potential method for studying slow crack
growth(Electric potential method used to study slow crack growth in center-not-ched plate specimens). Mater Res Stand 1966;6:392–4.
[163] Schwalbe K, Hellmann D. Application of the Electrical Potential Method to CrackLength Measurements Using Johnson's Formula. J Test Eval 1981;9(3):218–20.
[164] Baudin G, Policella H. Progress in potential drop technique. Application to threedimensional crack fronts. In ICF5, Cannes (France) 1981; 1981.
[165] Riemelmoser F, et al. The Influence of Irregularities in the Crack Shape on theCrack Extension Measurement by Means of the Direct-Current-Potential-DropMethod. J Test Eval 1999;27(1):42–6.
[166] McKeighan P, Smith D. Determining the Potential Drop Calibration of a FatigueCrack Growth Specimen Subject to Limited Experimental Observations. J Test Eval1994;22(4):291–301.
[167] Hay E, Brown MW, A D.C. potential drop method to monitor crack growth innotches subjected to torsion. Fatigue Fract Eng Mater Struct 1981;4(3):287–90.
[168] You CP, Knott JF. Electrolytic tank simulation of the potential drop technique forcrack length determinations. Int J Fract 1983;23(4):R139–41.
[169] Orazem ME. Calculation of the Electrical Resistance of a Compact TensionSpecimen for Crack-Propagation Measurements. J Electrochem Soc1985;132(9):2071–6.
[170] Orazem ME, Ruch W. An improved analysis of the potential drop method formeasuring crack lengths in compact tension specimens. Int J Fract1986;31(4):245–58.
[171] Hiroshi O, et al. A computational approach to determining the depth of surfaceflaws by the ACPD technique. Eng Fract Mech 1992;43(6):911–21.
[172] Harrington DS, Bell R, Tan CL. Calibration of the localized DCPD method for crackshape measurement using the boundary element method. Fatigue Fract Eng MaterStruct 1995;18(7–8):875–84.
[173] Aliberti C, Fokas N, Lee Y. Multi-Parametric Sensitivity Analysis of an ElectricalPotential Difference Gear Crack Sensor Using Finite Elements, vol. 6; 2017, p.272–8.
[174] Abé H, et al. An Inverse Problem in Non-Destructive Inspection of a Crack in aHollow Cylinder by Means of Electrical Potential Method. Berlin, Heidelberg:Springer Berlin Heidelberg; 1988.
[175] Abé H, Kanoh Y. An Inverse Problem in Nondestructive Inspection of a Crack in aPlate with an Inhomogeneity by Means of the Electrical Potential Method. In WengGJ, Taya M, Abé H, editors, Micromechanics and Inhomogeneity: The Toshio Mura65th Anniversary Volume. New York, NY: Springer New York; 1990. p. 1–15.
[176] Iwamura Y, Miya K. Numerical approach to inverse problem of crack shape re-cognition based on the electrical potential method (of NDT). IEEE Trans Magn1990;26(2):618–21.
[177] Hashimoto Y, et al. Procedure of crack shape determination by reversing DC po-tential method. Nucl Eng Des 1992;138(3):259–68.
[178] Tada N, Okada M, Iwamoto J. Three-Dimensional Identification of Semi-EllipticalSurface Crack by Means of Direct-Current Electrical Potential Difference MethodWith Multiple-Probe Sensor. J Press Vessel Technol 2006;129(3):441–8.
[179] Sato Y, Atsumi T, Shoji T. Application of induced current potential drop technique
Y. Si, et al. International Journal of Fatigue 136 (2020) 105624
16

for measurements of cracks on internal wall of tube-shaped specimens. NDT and EInt 2007;40(7):497–504.
[180] Tada N, Funakoshi A. Three-Dimensional Identification of Semi-Elliptical Crack onthe Back Surface by Means of Direct-Current Electrical Potential DifferenceMethod With Multiple-Probe Sensor (PVP2006-ICPVT-11-93359), vol. 131; 2009.
[181] Tada N, Okada M, Iwamoto J. Three-Dimensional Identification of Semi-EllipticalSurface Crack by Means of Direct-Current Electrical Potential Difference MethodWith Multiple-Probe Sensor, vol. 129; 2007.
[182] Harrington D, Bell R. A mobile DCPD probe arrangement for improved crackprofile measurements. Brit J Non-Destruct Test 1993;35(9):497–501.
[183] Černý I. The use of DCPD method for measurement of growth of cracks in largecomponents at normal and elevated temperatures. Eng Fract Mech2004;71(4):837–48.
[184] Takeo F, et al. Selecting Suitable Probes Distances for Sizing Deep Surface CracksUsing the DCPD Technique. J Press Vessel Technol 2006;129(1):205–10.
[185] Dai Y, Marchand N, Hongoh M. Study of fatigue crack initiation and growth intitanium alloys using an ACPD technique, vol. 39; 1993, p. 35–44.
[186] Oh Y, Kim J, Hwang I. Dynamic Loading Fracture Tests of Ferritic Steel Using theDirect Current Potential Drop Method. J Test Eval 2002;30(3):221–7.
Y. Si, et al. International Journal of Fatigue 136 (2020) 105624
17