Potential biogeochemical impacts of heat rejection in the Mullaloo aquifer, Western Australia
17
Geothermics 53 (2015) 429–445 Contents lists available at ScienceDirect Geothermics jo ur nal home p ag e: www .elsevier.com/locate/geothermics Potential biogeochemical impacts of heat rejection in the Mullaloo aquifer, Western Australia G.B. Douglas a,∗ , M.G. Trefry a , J.T. Wylie a , P.G. Wilkes b , G.J. Puzon a , A.H. Kaksonen a a CSIRO Land and Water, Private Bag 5, Floreat, WA 6913, Australia b CSIRO Mineral Resources, 26 Dick Perry Avenue, Kensington, WA 6151, Australia a r t i c l e i n f o Article history: Received 29 May 2012 Accepted 4 August 2014 Keywords: Heat rejection Groundwater Biogeochemical protocol Geochemistry Microbiology Modelling a b s t r a c t A rapid biogeochemical assessment protocol has been developed to assess the potential effects of retur- ning heated groundwater to the Mullaloo aquifer in Perth, Western Australia. A multi-disciplinary study encompassed geochemical analysis of the aquifer sediment, and microbiological, organic contaminant and major ion surveys of the groundwater. Geochemical modelling indicates few, if any adverse impli- cations of a proposed 10 ◦ C temperature increase. A potential exists for chemical and biological clogging but this will be minimised by a closed loop design to avoid the introduction of atmospheric oxygen. Nev- ertheless, the need for regular monitoring of scheme performance and environmental impacts remains. Crown Copyright © 2014 Published by Elsevier Ltd. All rights reserved. 1. Introduction Efficient operation of high net heat-producing infrastructure common in major industry and in urban centres generally requires the efficient harvesting and disposal of excess heat energy (e.g. Tawney et al., 2005). Typically in industry, heat exchangers are employed to capture excess energy for utilisation elsewhere in plant operations, or alternatively, heat loss is facilitated by direct venting of steam/water vapour to the atmosphere, often via cooling towers. It is possible to avoid this loss of heat and water by utilising the thermal and hydraulic properties of the terrestrial subsur- face to store heated waste waters underground for later recycling. This kind of energy and fluid engineering is well developed in the geothermal sector. Within the geothermal industry, surplus hot water previously abstracted and utilised in power generation or in heat exchange applications is often disposed of by re-injection to local aquifers (Horne, 1982; Panichi, 2004). The re-injection of the surplus hot water provides pressure support to the geothermal resource (to maintain pumping performance) and also conserves water which is increasingly becoming a valued resource in its own right. Sustainability of geothermal systems is an important fac- tor in the economic and engineering feasibility of geothermal ∗ Corresponding author. Fax: +61 8 9333 6499. E-mail address: [email protected] (G.B. Douglas). applications. Assessments of sustainability must integrate diverse disciplines, including: • hydrogeology, hydraulics and reservoir engineering; • geophysics and geomechanics; • biogeochemistry (geochemistry and microbiology); • environmental engineering, hydrology, ecotoxicology and ecosystems science; • economics, geothermics, engineering and facilities management; and • together with the interests of stakeholder groups as diverse as community residents, government authorities, regulators, indus- try, finance and environmental groups. Sustainability studies have been undertaken over the past few decades to assess the economic feasibility and potential envi- ronmental impact of thermal energy in groundwater including potential thermal breakthrough (e.g. Papadopulos and Larson, 1978; Holm, 1986; Perlinger et al., 1987; Brons et al., 1991; Griffioen and Appelo, 1993; Kuhn et al., 2002; Banks, 2009; Brielmann et al., 2009, 2011; Bonte et al., 2010, 2011), impact on pathogens (Winters, 1992), and in particular for seasonal aquifer thermal energy storage and recovery (e.g. Dincer, 2002; Ferguson, 2007; Kim et al., 2010; Li et al., 2011; Yu et al., 2011) and long-term impacts on groundwater temperature (Ferguson and Woodbury, 2006). Locally, the Perth Basin has become a focus for geothermal exploration with the first land release in 2008 (Ghori, 2008). A http://dx.doi.org/10.1016/j.geothermics.2014.08.004 0375-6505/Crown Copyright © 2014 Published by Elsevier Ltd. All rights reserved.
Transcript of Potential biogeochemical impacts of heat rejection in the Mullaloo aquifer, Western Australia

Pa
Ga
b
a
ARA
KHGBGMM
1
ctTepvttfTg
aa(wmi
t
h0
Geothermics 53 (2015) 429–445
Contents lists available at ScienceDirect
Geothermics
jo ur nal home p ag e: www .e lsev ier .com/ locate /geothermics
otential biogeochemical impacts of heat rejection in the Mullalooquifer, Western Australia
.B. Douglasa,∗, M.G. Trefrya, J.T. Wyliea, P.G. Wilkesb, G.J. Puzona, A.H. Kaksonena
CSIRO Land and Water, Private Bag 5, Floreat, WA 6913, AustraliaCSIRO Mineral Resources, 26 Dick Perry Avenue, Kensington, WA 6151, Australia
r t i c l e i n f o
rticle history:eceived 29 May 2012ccepted 4 August 2014
a b s t r a c t
A rapid biogeochemical assessment protocol has been developed to assess the potential effects of retur-ning heated groundwater to the Mullaloo aquifer in Perth, Western Australia. A multi-disciplinary studyencompassed geochemical analysis of the aquifer sediment, and microbiological, organic contaminantand major ion surveys of the groundwater. Geochemical modelling indicates few, if any adverse impli-
eywords:eat rejectionroundwateriogeochemical protocoleochemistryicrobiology
cations of a proposed 10 ◦C temperature increase. A potential exists for chemical and biological cloggingbut this will be minimised by a closed loop design to avoid the introduction of atmospheric oxygen. Nev-ertheless, the need for regular monitoring of scheme performance and environmental impacts remains.
Crown Copyright © 2014 Published by Elsevier Ltd. All rights reserved.
odelling. Introduction
Efficient operation of high net heat-producing infrastructureommon in major industry and in urban centres generally requireshe efficient harvesting and disposal of excess heat energy (e.g.awney et al., 2005). Typically in industry, heat exchangers aremployed to capture excess energy for utilisation elsewhere inlant operations, or alternatively, heat loss is facilitated by directenting of steam/water vapour to the atmosphere, often via coolingowers. It is possible to avoid this loss of heat and water by utilisinghe thermal and hydraulic properties of the terrestrial subsur-ace to store heated waste waters underground for later recycling.his kind of energy and fluid engineering is well developed in theeothermal sector.
Within the geothermal industry, surplus hot water previouslybstracted and utilised in power generation or in heat exchangepplications is often disposed of by re-injection to local aquifersHorne, 1982; Panichi, 2004). The re-injection of the surplus hotater provides pressure support to the geothermal resource (toaintain pumping performance) and also conserves water which
s increasingly becoming a valued resource in its own right.
Sustainability of geothermal systems is an important fac-or in the economic and engineering feasibility of geothermal
∗ Corresponding author. Fax: +61 8 9333 6499.E-mail address: [email protected] (G.B. Douglas).
ttp://dx.doi.org/10.1016/j.geothermics.2014.08.004375-6505/Crown Copyright © 2014 Published by Elsevier Ltd. All rights reserved.
applications. Assessments of sustainability must integrate diversedisciplines, including:
• hydrogeology, hydraulics and reservoir engineering;• geophysics and geomechanics;• biogeochemistry (geochemistry and microbiology);• environmental engineering, hydrology, ecotoxicology and
ecosystems science;• economics, geothermics, engineering and facilities management;
and• together with the interests of stakeholder groups as diverse as
community residents, government authorities, regulators, indus-try, finance and environmental groups.
Sustainability studies have been undertaken over the past fewdecades to assess the economic feasibility and potential envi-ronmental impact of thermal energy in groundwater includingpotential thermal breakthrough (e.g. Papadopulos and Larson,1978; Holm, 1986; Perlinger et al., 1987; Brons et al., 1991; Griffioenand Appelo, 1993; Kuhn et al., 2002; Banks, 2009; Brielmannet al., 2009, 2011; Bonte et al., 2010, 2011), impact on pathogens(Winters, 1992), and in particular for seasonal aquifer thermalenergy storage and recovery (e.g. Dincer, 2002; Ferguson, 2007;Kim et al., 2010; Li et al., 2011; Yu et al., 2011) and long-term
impacts on groundwater temperature (Ferguson and Woodbury,2006).Locally, the Perth Basin has become a focus for geothermalexploration with the first land release in 2008 (Ghori, 2008). A

4 therm
ne(
aotrc2cuptawtthrwo
cwll1pwi(tp
merCaolt2Ptbagmt
kbtmkieovptiAfi
30 G.B. Douglas et al. / Geo
umber of studies have examined the potential for exploitation ofnergy from geothermal reservoirs, some of which are up to 200 ◦CChopra and Holgate, 2007; Regenauer-Lieb and Horowitz, 2007).
The present study is motivated by the need to explore efficientnd sustainable technologies to manage the waste heat budgetf the Pawsey Supercomputer Centre, now under constructiono support Australia’s bid for the Square Kilometre Array (SKA)adiotelescope (iVEC, 2010). The Pawsey Centre will house a petas-ale supercomputing system with an anticipated heat load of.4 Megawatt thermal (MWth). Critically, heat disposal options areonstrained by the location of the supercomputer within an existingrban environment in addition to that of the proposed supercom-uter research facility. Application of conventional cooling towerso directly cool the computer in-rack cooling system would result in
projected water loss, also potentially sourced from local ground-ater, of ca. 28–36.5 ML/annum. An alternative option for cooling
he supercomputer is the use of local groundwater abstracted fromhe underlying Mullaloo aquifer, to be passed through a plateeat exchanger in a closed loop with the heated groundwater ande-injected into the aquifer, resulting in minimal net loss of ground-ater. The Mullaloo aquifer has a relatively uniform thermal profile
ver its thickness at the Pawsey site.The proposed 2.4 MWth heat rejection load of the Pawsey Super-
omputer could be met by elevating Mullaloo water temperatureithin the heat exchanger by an amount �T. The higher �T, the
ower the flow rate of water required to meet the heat rejectionoad. It has been calculated that for �T = 5 ◦C, a water supply of.51 GL/annum/MWth would be required to cool the supercom-uter, equating to about 115 L s−1. For �T = 10 ◦C, the requiredater supply is reduced to 0.75 GL/annum/MWth and the flow rate
s halved to approximately 57.5 L s−1. The return of heated waterwhich will not be reused) to the aquifer may potentially impacthe biogeochemistry of the local formation, and hence affect theerformance and sustainability of the heat rejection system.
To further investigate the suitability and long-term environ-ental sustainability of the local groundwater abstraction/heat
xchange/re-injection option, we have developed and applied aapid biogeochemical assessment protocol for the Mullaloo aquifer.ritically, groundwater-dependent ecosystems such as wetlandsnd native vegetation are directly linked to and partially dependentn the superficial aquifer situated immediately above the Mul-aloo aquifer and thus, an increase in temperature has the potentialo influence ecosystem function. Furthermore, the proximity (ca.00 m downgradient) of residential and other urban land uses to theawsey site with an extensive local shallow bore network meanshat there is a range of simultaneous water demands that must alsoe supported by any subsurface activity. In this way, the Mullalooquifer characterisation case study acts as a useful analogue foreothermal applications and resultant temperature fluctuations inany shallow aquifer systems within urban environments around
he world.The biogeochemical effects of increased temperatures are well
nown for a range of systems and include changes in the solu-ility of salts and gases, changes in mineral solubility, and hence,he degree of water–rock interaction, and a potential for enhanced
icrobial productivity. There is currently, however, little specificnowledge of the biogeochemistry of the Mullaloo aquifer, andn particular, its sensitivity to changes in the prevailing thermalnvironment. In this study, the major biogeochemical elementsf the Mullaloo groundwater/aquifer system, specifically the pre-ailing groundwater and sediment composition and the microbialopulation, have been studied using a rapid assessment protocol
o discern possible environmental effects, if any, of sustained re-njection of groundwater at higher than ambient temperatures.n additional benefit of the assessment protocol is quick identi-cation of knowledge gaps that subsequent studies can focus onics 53 (2015) 429–445
to improve project monitoring and management plans and hencereduce overall geothermal implementation risks.
Key elements of the proposed protocol include thermal, geo-chemical and microbiological assessment (using depth-dependentsampling), and thermal biogeochemical modelling. Togetherresults of the sampling and subsequent analyses and interpreta-tions may be used as input to environmental impact assessmentstudies required by regulatory authorities and as a baseline forfuture monitoring and assessment.
The structure of the paper includes first a brief summary of theknown hydrogeology of the Pawsey site and the Mullaloo aquifer.Then the rapid assessment protocol is stepped through by applica-tion of its elements to the Mullaloo aquifer in following sections.We proceed now to a summary of the findings of prior hydrogeolog-ical characterisation studies (Rockwater, 2011a,b,c) which provideuseful context and input for the rapid assessment protocol.
2. Pawsey Centre site characteristics
A description of the site characteristics and hydrogeologyoutlined below are principally derived from previous studies(Rockwater, 2011a,b,c) and references contained therein. The Aus-tralian Resources Research Centre (ARRC) precinct is located on theSwan Coastal Plain, about 4.5 km south-east of Perth in WesternAustralia (Fig. 1). The land allocated for the Pawsey Centre coversan area of about 2 ha adjacent to the existing ARRC building.
2.1. Local geology
The two uppermost aquifers present at the Pawsey site are theunconfined superficial aquifer and the underlying semi-confinedMullaloo aquifer (Fig. 2). The Mullaloo aquifer occurs within apaleochannel deeply incised into the Kings Park formation (Quilty,1974). Further detailed descriptions of the aquifers are provided byDavidson (1995) and Davidson and Yu (2006). A brief description ofthe regional setting for the early Tertiary Mullaloo sandstone mem-ber (MSM), the target heat rejection zone, based on Davidson andYu (2006) and previous work undertaken (Rockwater, 2011a,b), isgiven below. The superficial and Mullaloo aquifers are separatedby a confining unit composed of cemented sand and shale. TheMullaloo aquifer is underlain by confining units in the Kings ParkFormation which is principally composed of shale and siltstone.The MSM has been identified within the footprint of the Kings ParkFormation but its extent has not been accurately defined. Previ-ous studies undertaken by Davidson (1995) and Davidson and Yu(2006) and data from the drilling programme carried out duringAugust and September 2011 at the ARRC (Rockwater, 2011b), werealso assessed for this study. At the site, the MSM unconformablyoverlies shale of the Kings Park Formation, and unconsolidatedBassendean Sand unconformably overlies the MSM. The revisedinterpretation is based on comparison between lithological andgeophysical data from Mullaloo production bore MPB 01, Mullaloomonitoring bores MB 04a, AM40B, AM40D and local productionbores.
2.2. Hydrogeology
2.2.1. Superficial aquiferThe superficial aquifer at the site consists of medium grained
leached Bassendean Sand. Aquifer hydraulic conductivity is high,ranging from 10 to 50 m d−1 (Davidson and Yu, 2008). The pumping
test results from nearby superficial bores, CSIRO 1 and DEC 1, indi-cate that the superficial aquifer hydraulic conductivity is likely tobe greater than 60 md−1 at the site. Assuming a saturated thicknessof about 30 m as inferred from hydrogeological sections, the aquifer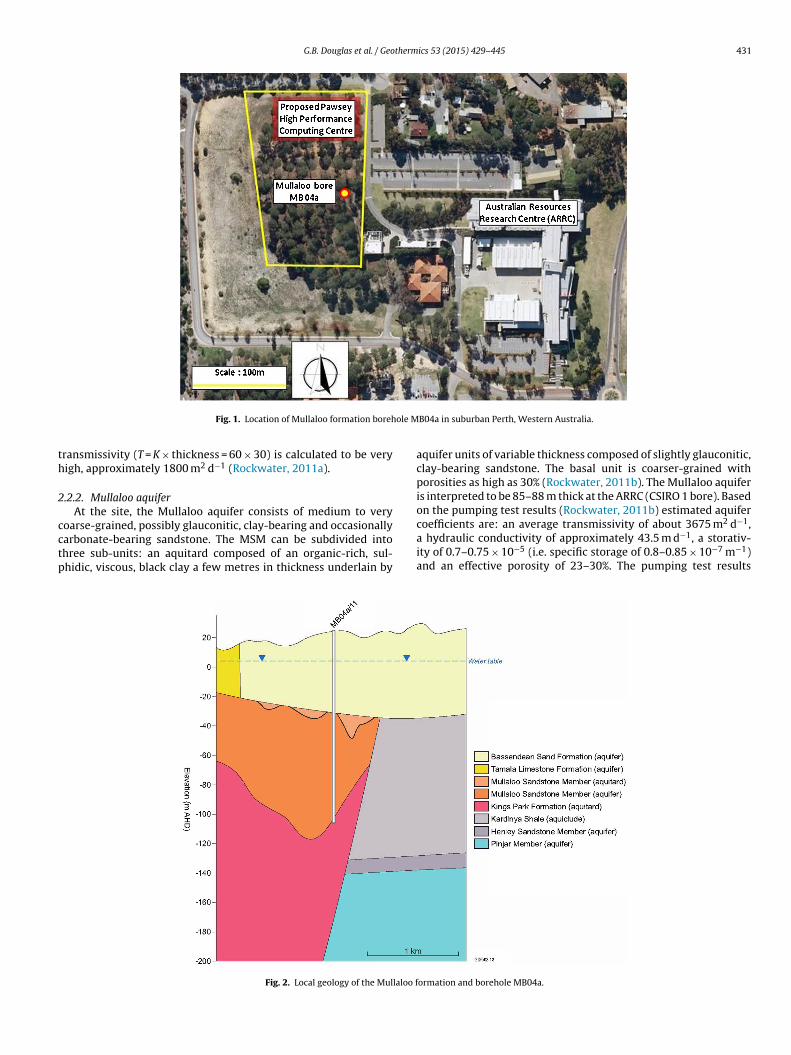
G.B. Douglas et al. / Geothermics 53 (2015) 429–445 431
ole M
th
2
cctp
Fig. 1. Location of Mullaloo formation boreh
ransmissivity (T = K × thickness = 60 × 30) is calculated to be veryigh, approximately 1800 m2 d−1 (Rockwater, 2011a).
.2.2. Mullaloo aquiferAt the site, the Mullaloo aquifer consists of medium to very
oarse-grained, possibly glauconitic, clay-bearing and occasionallyarbonate-bearing sandstone. The MSM can be subdivided intohree sub-units: an aquitard composed of an organic-rich, sul-hidic, viscous, black clay a few metres in thickness underlain by
Fig. 2. Local geology of the Mullaloo f
B04a in suburban Perth, Western Australia.
aquifer units of variable thickness composed of slightly glauconitic,clay-bearing sandstone. The basal unit is coarser-grained withporosities as high as 30% (Rockwater, 2011b). The Mullaloo aquiferis interpreted to be 85–88 m thick at the ARRC (CSIRO 1 bore). Basedon the pumping test results (Rockwater, 2011b) estimated aquifer
coefficients are: an average transmissivity of about 3675 m2 d−1,a hydraulic conductivity of approximately 43.5 m d−1, a storativ-ity of 0.7–0.75 × 10⁻⁵ (i.e. specific storage of 0.8–0.85 × 10⁻⁷ m−1)and an effective porosity of 23–30%. The pumping test resultsormation and borehole MB04a.

4 thermics 53 (2015) 429–445
iutdtbdTof
rhtRosAtiith
2
tsovocwrffsdmMaB(aao
2
Rlct(wtmt2faasvli
Fig. 3. Thermal profile measured in borehole MB04a. The Mullaloo formation
aquifer, with minimal impact on the nearby shallow groundwater
32 G.B. Douglas et al. / Geo
ndicate that the Mullaloo aquifer is semi-confined. The aquitardnit at the top of the MSM, which separates the MSM fromhe overlying superficial formations is extensive but allows someownward leakage from the superficial aquifer. A constant rateest indicated the average bulk transmissivity of the aquitard toe approximately 2.7 m2 d−1 which may be used in place of airect measurement of the vertical conductivity of the aquitard.he aquitard transmissivity is thus seen to be approximately threerders of magnitude smaller than the transmissivity of the Mullalooormation.
The hydraulic conductivity of the Mullaloo aquifer from theecent field investigation (August–September, 2011) is relativelyigh when compared to the average regional hydraulic conduc-ivity derived from the previous studies (Davidson and Yu, 2006;ockwater, 2011a). However, it should be considered in the contextf a heterogeneous palaeochannel aquifer, where highly transmis-ive lenticular sandstone beds occur within less permeable strata.ssumptions associated with the standard analytical methods are
herefore not always met and the results should be viewed asndicative and suitable for use as starting parameters for a numer-cal model. The average regional hydraulic conductivity is likelyo be lower with the effective mean dominated by areas of lowydraulic conductivity.
.2.3. Recharge and storageThe superficial aquifer is recharged directly by rainfall infiltra-
ion, with groundwater levels strongly influenced by annual andeasonal variations in rainfall. Recharge to the superficial aquifern the Swan Coastal Plain is also influenced by land use, withalues ranging from 20 to 50% of rainfall or more, dependingn vegetation type and urban cover. Discharge from the superfi-ial aquifer is predominantly into the Swan-Canning River systemith some downward leakage into the Mullaloo aquifer. Additional
echarge into the Mullaloo aquifer is likely to occur by lateral flowrom the Mirrabooka aquifer to the north of the study area, androm other transmissive intervals to the south and east of thetudy area. Groundwater from the Mullaloo aquifer is likely to beischarged westward towards the coast into the superficial for-ations offshore (Davidson and Yu, 2006). Net recharge to theullaloo aquifer has not been quantified due to uncertainty in
quifer extent and also in the extent of the overlying aquitard.ased on the drilling and testing investigation in August 2011Rockwater, 2011b), the approximate volume of groundwater stor-ge is calculated to be about 1.25 × 10⁸ m3 assuming an aquiferrea of 12.5 km2, an average thickness of 50 m and a specific yieldf 0.2.
.2.4. Groundwater conditionsLimited studies of local groundwater quality conducted by
ockwater (2011a,b,c) indicate that both the superficial and under-ying Mullaloo aquifers are of near neutral pH, low electricalonductivity (EC), and of an Na-Cl type with slightly higher Eh inhe superficial aquifer and temperatures typically around 20–21 ◦Cbased on the temperature of water produced at the surface fromell fully screened within the Mullaloo formation). Subsequent
hermal profiling performed by the Western Australian Geother-al Centre of Excellence (WAGCOE) in November 2011 shows that
he water temperature within the Mullaloo formation varied from0.3 to 20.7 ◦C over the depth interval 44–132 m below ground sur-ace (Fig. 3). Shallow temperature departures within the superficialquifer (Bassendean Sand, upper portion of the profile in Fig. 3)re due to seasonal mechanisms, including variation of the land
urface temperature (warm in summer and cool in winter) andariation of the water table elevation (high in winter-spring andow in summer-autumn). Together with diurnal solar cycles andntermittent precipitation events which infiltrate cool rainwatersextends between 43 and 130 m depth below ground surface.
through the vadose zone to the water table, these mechanismsoften render the near-surface portions of shallow temperatureprofiles into complex and time-dependent shapes. These climaticperturbations decline with depth. Fig. 2 shows a slight increaseof temperature with depth from the ground surface to the watertable, then a rapid decline in temperature within the superficialBassendean Sand unit. Above 30 m below ground surface, the pro-file will vary significantly with time throughout the annual cycle,but the temperature within the Mullaloo formation is consistentyear-round.
2.2.5. Regional flow and thermal breakthroughInformation on the natural head gradient within the Mullaloo
aquifer is scarce. The gradient is thought to flow predominantlyto the west and estimates of the gradient magnitude are approx-imately 0.001 m/m with high uncertainty. Assuming hydraulicconductivity of 60 m d−1 and a porosity of 30%, this yields anapproximate flow velocity of 0.2 m d−1. Thermal breakthroughbetween extraction and injection wells has been analysed byGringarten and Sauty (1975). Where the regional flow outweighsthe gradient induced by pumping it is possible to avoid ther-mal breakthrough. The borefield system at the Pawsey Centre sitehas been designed in order to minimise the potential for thermalbreakthrough. Discussion on the engineering design features formitigating the risk of thermal breakthrough is beyond the scope ofthis paper.
The heat plume created by injection of warmed water into theMullaloo will migrate and disperse with regional groundwater flowtowards the aquifer discharge boundary. The local head gradientestimates indicate that the discharge boundary is approximately2.5 km to the west at the Swan-Canning Estuary. Due to the con-fining shales most of the heat will be contained in the Mullaloo
users. Discharge rates to the estuary will be slow in comparisonto surface water mixing processes, so impacts of any dischargingwarm water plume on the surface water ecosystem are likely to benegligible.

therm
3
3
s9ad(licppfmw
slNprvhswtCwaaa
3
tatnf
3
augficiidtmvAt
3
mb
G.B. Douglas et al. / Geo
. Methods
.1. Groundwater sampling and analysis
Three sets of groundwater samples were collected in threetages, at sampling depths (below ground surface) of 51, 70 and0 m (stage 1 average depth 70 m), 99, 105 and 111 m (stage 2verage depth 105 m), and 114, 120 and 126 m (stage 3 averageepth 120 m) using an electrically actuated snap sampler systemSnap Sampler, 2011). After deployment, the snap samplers wereeft in situ for three days to allow for sample flushing and equil-bration. For each sampling depth, the sampling apparatus wereomprised of five collection containers; 3 × 40 mL glass snap sam-les for collection of samples for organics analysis, and 2 × 350 mLlastic samples for major and trace ion analysis. Samples obtainedrom each of the three depths in each stage were aggregated for
ajor and trace ion analysis to comprise a single sample whichas then subdivided.
Upon retrieval, the glass snap sampler vials were removed first,nap sampler tabs cut from each end and capped before beingabelled and stored on ice in darkness before being transported toational Measurement Institute (NMI) for organics analysis. Thelastic snap sampling bottle contents were transferred into sepa-ate acid washed plastic bottles. These were pre-rinsed with a smallolume of the sample water, and then 500 mL was collected withouteadspace for analysis of major elements and alkalinity. A 250 mLub-sample was collected for trace element analysis and acidifiedith a few drops of concentrated high purity nitric acid. Both of
hese bottles were stored on ice in darkness and transported to thehemCentre (Western Australia) for analysis. An additional 40 mLater sample was transferred into autoclaved sterile plastic bottles
nd stored on ice for flow cytometry and DAPI microbial countingt CSIRO. The remaining sample was retained for analysis of pH, Ehnd electrical conductivity with a field kit.
.2. Major and trace element analysis
The major and trace element water samples were submitted tohe ChemCentre within 2 h of collection for major and trace elementnalysis. All water samples were filtered through 0.2 �m syringe fil-ers prior to sample submission. All analytical methods (e.g. pH, ECutrient species, alkalinity) were based on APHA Standard Methods
or the Examination of Water and Wastewater (2005).
.3. Organics analysis
Groundwater BTEX (benzene, toluene, ethylbenzene, xylene)nd C6-C9 total petroleum hydrocarbons (TPH) were determinedsing a vapour extraction technique followed by separation on aas chromatography (GC) column and detected using a HP 6980 GCtted with a 5973 Mass Selective Detector. Total petroleum hydro-arbons (TPH C10–C36) were extracted with dichloromethane andnjected into a non-polar GC (Varian 3800 GC) for separation ofndividual TPH components and detected with a flame ionisationetector. Dissolved organic carbon (DOC) was measured after filtra-ion through a 0.45 �m filter using a high temperature combustion
ethod (850 ◦C for Ce or 650 ◦C for Pt reactor). The DOC was con-erted to CO2 and was measured by an infrared detector at 4200 nm.
second injection of the sample acidified with 30% H3PO4 was usedo correct for inorganic carbon.
.4. Petrographic analysis
Thin sections of epoxy grain mounts of Mullaloo aquifer sedi-ents samples from 51, 54, 111, and 120 m depth were prepared
y CSIRO. Thin sections were examined using a Nikon geological
ics 53 (2015) 429–445 433
microscope under plane-polarised and cross-polarised light fieldsand saved as digital images.
3.5. Microbial analysis
3.5.1. Flow cytometry (FCM)An aliquot of each sample was mixed well, diluted 1:10 with
tap water filter sterilised with a 0.8/0.2 �m Acrodisc PF Supor Mem-brane filter (Pall Life Sciences) and the cells were stained with greenfluorescent nucleic acid stain SYTO-9 (Invitrogen Live/Dead BacLight Bacterial Viability Kit, final concentration 2.7 �M). This bindsto the DNA of both live and dead cells after an incubation period of15 min at room temperature in the dark for FCM. After incubation,samples were further diluted 1:10 in the filter sterilised tap watergiving a final dilution of 1:100. As a control, aliquots of each samplewere also filtered through a 0.8/0.2 �m filter and thereafter stainedas described above for FCM.
All FCM experiments were performed using a Cell Lab QuantaTM
SC Beckman Coulter flow cytometer equipped with an air-cooled15 MW argon ion laser, emitting at a fixed wavelength of 488 nm.Fluorescent filters and detectors were all standard with greenfluorescence collected in the FL1 channel (530 ± 30 nm), orangefluorescence collected in the FL2 channel (585 ± 42 nm) and redfluorescence collected in the FL3 channel (>670 nm). All parame-ters were collected as logarithmic signals (Hoefel et al., 2003). Datawere analysed using Cell Lab Quanta® SC MPL Analysis software.
3.5.2. Epifluorescence microscopyFor epifluorescence microscopy, 1 mL of sample was stained
with DNA-binding dye 4′,6-diamidino-2-phenylindole, dihy-drochloride (DAPI) (100 �g mL−1) for 1 min and the cells werecollected onto a 0.2 �m Isopore membrane filter. The filter was thenmounted onto a microscope slide with immersion oil and a coverslip and viewed with 100× objective under fluorescence using aZeiss microscope fitted with an Axio Imager M.1. At least 20 fieldsof view were counted on the computer screen for each sample.
3.6. Geochemical modelling
Mineral saturation indices (SI) of an average groundwater chem-istry from the three samples collected in this study from 20 to 50 ◦Cwere calculated using PHREEQC for Windows version 2.18.00 (Post,2011). Minerals identified in mineralogical (XRD) analysis wereused as equilibrium phases.
A pe-pH speciation (Pourbaix) diagram for Fe using an averagegroundwater chemistry from the three samples collected in thisstudy was calculated using The Geochemists Workbench Release5.0 (Bethke, 2004).
3.7. Sediment sampling and analysis
Subsamples of aquifer sediments from depths of 51 m, 90 m,111 m, and 120 m from borehole MB04a were collected from Rock-water who had previously gently washed and sieved the samplesto remove remnant drilling mud. The samples were then driedovernight in open trays at 80 ◦C in a laboratory oven prior to anal-ysis.
3.8. Major and trace element analysis
3.8.1. X-ray fluorescence (XRF) analysis – fusionAquifer sediment samples were analysed by X-ray fluorescence
(XRF) for major elements (wt% oxides): SiO2, Al2O3, Fe2O3, MnO,MgO, CaO, Na2O, K2O, TiO2, P2O5, and trace elements (�g/g): Ba,Ce, Cl, Cr, Co, Cu, Ga, La, Ni, Nb, Pb, Rb, S, Sr, V, Y, Zn, and Zr usingfused glass discs using the methods of Norrish and Chappell (1977).

434 G.B. Douglas et al. / Geothermics 53 (2015) 429–445
Table 1Summary of mineralogy of Mullaloo aquifer sediment samples from borehole MB04a.
Sample Quartz Calcite Dolomite K-feldspar Rutile Pyrite Kaolinite Fe oxidea
MB04a 51 m 90.1 8.9 <0.5 <0.5 <0.5 0.1 <0.5MB04a 90 m >99 <1MB04a 111 m >99 <0.5
wfawdXC
3
etGT
LawX5
3
1iDmat0H
MB04a 120 m 98.4
a Poorly crystalline phase.
One gram of each oven dried sample (105 ◦C) was accuratelyeighed with 4 g of 12–22 lithium borate flux. The mixtures were
used for 20 min at 1050 ◦C in a Pt/Au crucible then poured into 32 mm Pt/Au mould heated to a similar temperature. The meltas cooled quickly over compressed air and the resulting glassisks were analysed on a Philips PW1480 wavelength dispersiveRF using a dual anode Sc/Mo tube and algorithms developed bySIRO.
.8.2. X-ray fluorescence (XRF) analysis – pressed powdersAquifer sediment samples were also analysed by XRF for major
lements (wt% element): Si, Al, Fe, Mn, Mg, Ca, Na, K, Ti, P, S, andrace elements (�g/g): Ag, As, Ba, Bi, Br, Cd, Ce, Co, Cr, Cs, Cu, Ga,e, Hf, Hg, I, In, La, Mo, Ni, Nb, Nd, Pb, Pr, Rb, Sb, Se, Sm, Sn, Sr, Ta,e, Th, Tl, U, V, W, Y, Yb, Zn, Zr using pressed powders.
Four grams of each sample was accurately weighed with 1 g oficowax binder. The mixtures were shaken vigorously for 30 s using
laboratory test tube shaker and pressed with 10 tonnes pressureith a boric acid backing into pellets and then analysed on a Spectro-Lab 2000 energy dispersive XRF system using a Pd X-ray tube and
secondary excitation targets.
.9. Mineralogy
Aquifer sediment samples were ground (micronized) for0 min under ethanol, oven dried at 60 ◦C and lightly pressed
nto stainless steel holders for X-ray diffraction (XRD) analysis.iffraction patterns were recorded with a PANalytical X’Pert Proicroprocessor-controlled diffractometer using Co K� radiation,
utomatic divergence slit, graphite post-diffraction monochroma-or and X’Celerator fast Si strip detector. Data were recorded in.05◦ steps 2� with a 0.5 s count time per step, and analysed usingighScore Plus and XPLOT.
Fig. 4. Stacked X-ray diffraction (XRD) patterns from Mullaloo aquifer se
1.0 0.6
A fraction of magnetic minerals within the Mullaloo aquifer sed-iment sample from 51 m depth was collected using a rare earthsuper magnet which was then sieved to collect the −200 �m frac-tion to further concentrate the magnetic mineral fraction. An XRDanalysis was then undertaken on this fraction using the methodsdescribed above.
4. Results
4.1. Mullaloo aquifer sediment mineralogy
4.1.1. Unfractionated sedimentA summary of quantitative mineralogical analysis of unfrac-
tionated Mullaloo sediment samples from 51, 90, 111, and 120 mdepth from borehole MB04a is shown in Table 1. Stacked XRD pat-terns for the four Mullaloo aquifer samples are shown in Fig. 4.The results indicate a predominance of quartz (90 to >99%) at alldepths sampled within the Mullaloo aquifer. The greatest miner-alogical variability occurs within the uppermost sample at 51 mwith carbonates, principally calcite and minor dolomite, K-feldspar,rutile, pyrite and kaolinite also present. Within the deepest sampleat 120 m, 1% pyrite and minor kaolinite was also present.
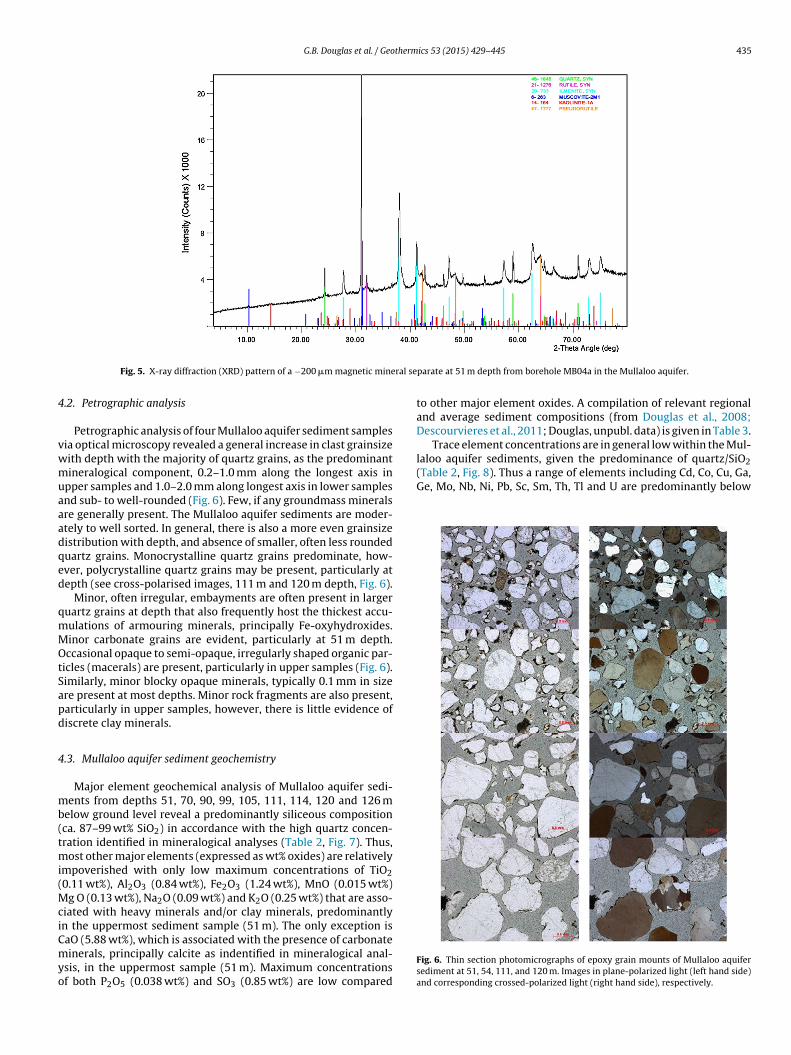
4.1.2. Fractionated magnetic mineral separateThe Mullaloo magnetic mineral separate from 51 m depth
(Fig. 5) shows the presence of quartz (suggesting the presence ofmagnetic inclusions therein), ilmenite, rutile and pseudorutile with
minor peaks indicating muscovite and kaolinite. A qualitative XRFscan performed on this sample showed a small Cr peak, and in theabsence of a Cr-spinel, indicating possible substitution of Cr for Fein ilmenite or possibly pseudorutile.diments from 51, 90, 111, and 120 m depth form borehole MB04a.
G.B. Douglas et al. / Geothermics 53 (2015) 429–445 435
ral se
4
vwmuaaadqed
qmMOtSapd
4
mb(tmi(MciCmyo
laloo aquifer sediments, given the predominance of quartz/SiO2(Table 2, Fig. 8). Thus a range of elements including Cd, Co, Cu, Ga,Ge, Mo, Nb, Ni, Pb, Sc, Sm, Th, Tl and U are predominantly below
Fig. 5. X-ray diffraction (XRD) pattern of a −200 �m magnetic mine
.2. Petrographic analysis
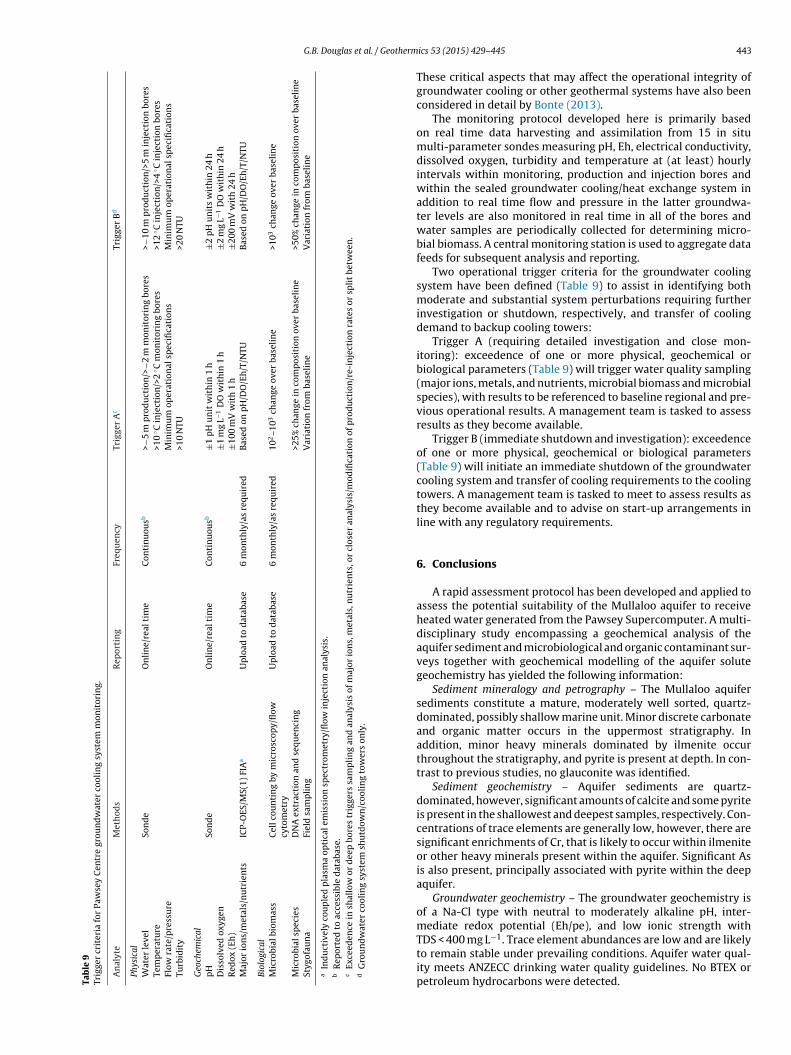
Petrographic analysis of four Mullaloo aquifer sediment samplesia optical microscopy revealed a general increase in clast grainsizeith depth with the majority of quartz grains, as the predominantineralogical component, 0.2–1.0 mm along the longest axis in
pper samples and 1.0–2.0 mm along longest axis in lower samplesnd sub- to well-rounded (Fig. 6). Few, if any groundmass mineralsre generally present. The Mullaloo aquifer sediments are moder-tely to well sorted. In general, there is also a more even grainsizeistribution with depth, and absence of smaller, often less roundeduartz grains. Monocrystalline quartz grains predominate, how-ver, polycrystalline quartz grains may be present, particularly atepth (see cross-polarised images, 111 m and 120 m depth, Fig. 6).
Minor, often irregular, embayments are often present in largeruartz grains at depth that also frequently host the thickest accu-ulations of armouring minerals, principally Fe-oxyhydroxides.inor carbonate grains are evident, particularly at 51 m depth.ccasional opaque to semi-opaque, irregularly shaped organic par-
icles (macerals) are present, particularly in upper samples (Fig. 6).imilarly, minor blocky opaque minerals, typically 0.1 mm in sizere present at most depths. Minor rock fragments are also present,articularly in upper samples, however, there is little evidence ofiscrete clay minerals.
.3. Mullaloo aquifer sediment geochemistry
Major element geochemical analysis of Mullaloo aquifer sedi-ents from depths 51, 70, 90, 99, 105, 111, 114, 120 and 126 m
elow ground level reveal a predominantly siliceous compositionca. 87–99 wt% SiO2) in accordance with the high quartz concen-ration identified in mineralogical analyses (Table 2, Fig. 7). Thus,
ost other major elements (expressed as wt% oxides) are relativelympoverished with only low maximum concentrations of TiO20.11 wt%), Al2O3 (0.84 wt%), Fe2O3 (1.24 wt%), MnO (0.015 wt%)
g O (0.13 wt%), Na2O (0.09 wt%) and K2O (0.25 wt%) that are asso-iated with heavy minerals and/or clay minerals, predominantlyn the uppermost sediment sample (51 m). The only exception is
aO (5.88 wt%), which is associated with the presence of carbonateinerals, principally calcite as indentified in mineralogical anal-sis, in the uppermost sample (51 m). Maximum concentrationsf both P2O5 (0.038 wt%) and SO3 (0.85 wt%) are low compared
parate at 51 m depth from borehole MB04a in the Mullaloo aquifer.
to other major element oxides. A compilation of relevant regionaland average sediment compositions (from Douglas et al., 2008;Descourvieres et al., 2011; Douglas, unpubl. data) is given in Table 3.
Trace element concentrations are in general low within the Mul-
Fig. 6. Thin section photomicrographs of epoxy grain mounts of Mullaloo aquifersediment at 51, 54, 111, and 120 m. Images in plane-polarized light (left hand side)and corresponding crossed-polarized light (right hand side), respectively.

436 G.B. Douglas et al. / Geothermics 53 (2015) 429–445
Fig. 7. Variation of major element oxides (wt%) and selected trace elements (�g/g) with depth in the Mullaloo aquifer. Also shown is the relationship between Cr and Fe2O3.
Fig. 8. Piper diagram of Mullaloo aquifer composition collected during the present CSIRO study (1 – 3), by Rockwater (MBP01, Mullaloo aquifer and MB01, superficial aquifer)and by the Western Australian Department of Water (AM40B, Mullaloo aquifer). Also plotted are average Perth superficial groundwater (Perth SGW), Perth rainwater (PerthRW), and seawater (SW) compositions.

G.B.
Douglas
et al.
/ G
eothermics
53 (2015)
429–445
437
Table 2Major and trace element geochemistry of Mullaloo aquifer sediments.
Sample/element oxide (wt%) SiO2 TiO2 Al2O3 Fe2O3 MnO MgO CaO Na2O K2O P2O5 SO3 Sum
MB04a 51 m 87.31 0.11 0.84 0.58 0.015 0.13 5.88 0.09 0.25 0.038 0.17 95.41MB04a 70 m 98.80 0.06 0.19 0.52 0.013 0.05 0.10 0.05 0.05 0.007 0.05 99.90MB04a 90 m 98.75 0.06 0.15 0.87 0.013 0.05 0.05 0.05 0.03 0.009 0.01 100.05MB04a 99 m 98.66 0.04 0.13 0.66 0.012 0.05 0.03 0.05 0.02 0.014 0.03 99.69MB04a 105 m 98.83 0.03 0.14 0.33 0.011 0.05 0.03 0.04 0.00 0.014 0.02 99.51MB04a 111 m 98.94 0.04 0.24 0.48 0.011 0.05 0.02 0.04 0.01 0.011 0.10 99.93MB04a 114 m 98.94 0.04 0.23 0.26 0.011 0.05 0.02 0.04 0.01 0.007 0.07 99.67MB04a 120 m 97.07 0.06 0.52 1.24 0.011 0.05 0.02 0.05 0.02 0.007 0.85 99.89MB04a 126 m 99.13 0.04 0.19 0.56 0.012 0.05 0.02 0.04 0.01 0.005 0.43 100.48Mullaloo average (n = 9) 97.38 0.05 0.29 0.61 0.01 0.06 0.69 0.05 0.04 0.012 0.19 99.39
Sample trace element (�g/g) As Ba Cd Ce Co Cr Cs Cu Ga Ge La Mo Nb Nd Ni Pb Rb Sc Sm Sr Th Tl U V Y Zn Zr
MB04a 51 m 6 74 1.5 6.5 1.5 144 7 5 4 0.5 6 1 3 3.5 0.5 1 9 1.5 4 32 1.5 2 1 14 2 5 53MB04a 70 m 4 26 1.5 6.5 1.5 306 14 6 0.5 0.5 6 4 3 3.5 0.5 1 2 1.5 4 3 1.5 1 1 9 0.5 1 36MB04a 90 m 7 16 1.5 6.5 1.5 398 3.5 7 2 1 6 5 3 3.5 0.5 1 2 1.5 4 2 1.5 1 1 12 0.5 3 33MB04a 99 m 9 17 1.5 6.5 1.5 227 3.5 5 1 0.5 6 2 2 3.5 0.5 1 2 1.5 4 2 1.5 1 1 19 2 5 34MB04a 105 m 5 24 1.5 37 1.5 256 8 5 0.5 0.5 22 2 2 3.5 0.5 1 1 1.5 4 10 1.5 1 1 19 0.5 5 38MB04a 111 m 8 14 1.5 18 1.5 273 3.5 5 0.5 0.5 6 2 2 3.5 0.5 1 2 1.5 4 6 1.5 4 1 27 1 10 37MB04a 114 m 7 17 1.5 6.5 1.5 186 3.5 5 0.5 0.5 6 1 2 3.5 0.5 1 1 1.5 4 2 1.5 4 1 18 0.5 7 32MB04a 120 m 27 17 1.5 15 1.5 513 10 7 2 1 6 3 3 3.5 3 1 2 3 4 2 1.5 1 1 56 0.5 20 47MB04a 126 m 26 11 1.5 6.5 1.5 223 3.5 5 0.5 0.5 13 2 3 3.5 0.5 1 1 1.5 4 1 1.5 1 1 16 0.5 6 35Mullaloo average (n = 9) 11 24 1.5 12 1.5 281 6 6 1.3 0.6 9 2 3 3.5 1 1 2 1.7 4 7 1.5 2 1 21 0.9 7 38
Table 3Average major and trace element geochemistry of Mullaloo aquifer sediments compared with other local aquifer sediments, Baigup soils, Swan River sediment from Maylands and the Post-Archaean Australian Shale (PAAS).
Sample/element oxide (wt%) SiO2 TiO2 Al2O3 Fe2O3 MnO MgO CaO Na2O K2O P2O5 SO3 Sum
Mullaloo average (n = 9) 97.38 0.05 0.29 0.61 0.01 0.06 0.69 0.05 0.04 0.012 0.19 99.39Bassendean Sand (n = 32) 98.17 0.08 0.14 0.41 0.002 0.07 0.06 0.00 0.08 0.003 0.02 98.89Osborne Formation (n = 9) 76.47 0.48 10.39 3.78 0.026 0.45 0.28 0.29 4.61 0.041 0.52 97.34Leederville Formation (n = 175) 77.08 0.54 10.09 2.78 0.020 0.36 0.23 0.34 4.30 0.056 0.46 96.24South Perth Shale (n = 18) 58.38 0.91 17.60 5.29 0.024 1.00 0.77 0.50 3.42 0.224 0.70 88.83Baigup sub/surface soil (n = 140) 63.84 0.46 8.46 4.79 0.019 0.49 1.95 1.25 0.75 0.296 0.40 82.71Swan River Sediment (Maylands) 66.68 0.51 6.02 3.29 0.026 0.60 1.40 2.18 1.01 0.109 2.06 83.89Post-Archaean Australian Shale 62.80 1.00 18.90 7.22 2.200 1.30 1.20 3.70 0.16 0.110 n/a 98.59
Sample trace element (�g/g) As Ba Cd Ce Co Cr Cs Cu Ga Ge La Mo Nb Nd Ni Pb Rb Sc Sm Sr Th Tl U V Y Zn Zr
Mullaloo average (n = 9) 11 24 1.5 12 1.5 281 6 6 1.3 0.6 9 2 3 3.5 1 1 2 1.7 4 7 1.5 2 1 21 0.9 7 38Bassendean Sand (n = 32) 1 23 1.5 40 1.5 287 4 3 1 0.5 32 16 9 3.5 16 4 3 1 4 8 8 3 1 9 6 3 71Osborne Formation (n = 9) 4 552 3 52 35 38 7 8 9 2 23 1 7 18 14 15 90 6 6 83 15 10 4 41 10 24 156Leederville Formation (n = 175) 4 546 2 67 41 40 7 8 11 1 35 1 8 24 14 18 102 7 6 69 17 6 4 51 14 37 209South Perth Shale (n = 18) 17 458 3 109 18 93 10 22 23 3 55 1 16 46 40 22 105 12 8 183 32 11 8 87 25 87 273Baigup sub/surface soil (n = 140) 11 178 1.5 46 8 129 6 32 10 2 25 6 9 18 15 62 57 7 5 81 17 11 7 62 12 106 153Swan River Sediment (Maylands) n/a 203 n/a 43 7 129 n/a 39 9 n/a 19 n/a 6 n/a 16 76 28 n/a n/a 88 n/a n/a n/a 43 15 475 329Post-Archaean Australian Shale n/a 650 n/a 80 23 110 15 50 20 n/a 38 1 19 n/a 55 20 160 n/a n/a 200 14 n/a 3 150 27 85 210
n/a = not analysed.

438 G.B. Douglas et al. / Geotherm
Table 4Compilation of water quality parameters, major, trace element and nutrient concentratiomg L−1 except Eh (mV), EC (�S/cm) and pH.
Sample dataBore MBP 01 MBP 01 MBP 01
Sampled 15/12/2011 12/12/2011 8/12/2011
Sampled by CSIRO CSIRO CSIRO
Ave depth (m) 70 105 120
In-field water quality parametersField pH 6.58 6.99 6.82
Field Eh 392 275 192
EC �S/cm no data 441 604
Major ionsNa 58.5 55.3 103
K 4.1 3.9 6.3
Ca 24.6 25.8 27.1
Mg 11.2 11.7 9.5
Cl 92 115 109
HCO3 82 83 167
SO4 34.1 33.5 22.2
TDS 300 300 380
Trace elementsAg <0.0001 <0.0001 <0.0001
Al 0.094 0.39 0.049
As <0.001 0.003 0.004
B 0.03 0.04 0.03
Ba 0.089 0.081 0.021
Cd <0.0001 <0.0001 <0.0001
Co <0.005 <0.005 <0.005
Cr 0.023 0.027 0.003
Cu 0.005 0.018 <0.002
Fe 0.96 2.7 1.4
Ga 0.0001 0.0003 <0.0001
Hg <0.0001 <0.0001 <0.0001
La <0.005 <0.005 <0.005
Mn 0.02 0.19 0.37
Mo <0.001 0.002 0.01
Ni 0.005 0.01 0.009
Pb 0.0012 0.0048 0.0011
Se <0.001 <0.001 <0.001
Si 9.7 9.8 8.1
Sr 0.054 0.098 0.15
Th <0.0001 0.0003 0.0002
Ti 0.004 0.017 0.004
U 0.0002 0.0006 0.0002
V <0.005 0.006 <0.005
Zn <0.005 0.016 0.021
NutrientsNO3 12 11 2.9
NH3 <0.01 <0.01 <0.01
c ined.
oi(ust
4
wagswTcMH
P 0.1 <0.1 1.5
– insufficient information to set ANZECC Water Quality guideline, nd – not determ
r near analytical detection limits for most, if not all, aquifer sed-ment samples. The highest concentrations of Ba (74 �g/g), and Sr32 �g/g) are both associated with clay and/or carbonates in theppermost two sediment samples. Noteworthy, however, are con-istently elevated concentrations of Cr (144–513 �g/g) and otherrace elements including V (9–56 �g/g) and Zr (32–53 �g/g).
.4. Mullaloo aquifer water quality
Mullaloo aquifer groundwater chemistry is presented in Table 4ith major ion chemistry for CSIRO samples collected in this study
nd previous Rockwater and DoW samples plotted in a Piper dia-ram (Fig. 8). Mullaloo groundwater pH collected in the presenttudy is generally neutral to slightly acidic, however previous Rock-ater samples were moderately alkaline (Rockwater, 2011a,b,c).
he aquifer waters are predominantly of a Na-Cl type with majorations dominated by Na with lower concentrations of Ca and Mg.ajor anions are dominated by Cl with lower concentrations ofCO3
− and SO42−. The aquifer waters are of low ionic strength
ics 53 (2015) 429–445
ns for Mullaloo aquifer (MBP 01) and superficial aquifer (MB 01) samples. All units
MBP 01 MB 01 AM40B23/09/2011 23/09/2011 1989 ANZECC WQRockwater Rockwater WA DoWnd nd nd –
nd nd nd 6.5–8.5nd nd nd430 512 489
51 46 64 n/a3 4 710 24 1711 12 685 78 97 25023 34 7826 52 9 500318 380 nd n/a
nd nd nd 0.1nd nd nd cnd nd nd 0.01nd nd nd 4nd nd nd 2nd nd nd 0.002nd nd ndnd nd nd 0.05nd nd nd 20.1 15 1.7 cnd nd ndnd nd nd 0.001nd nd ndnd nd nd 0.50nd nd nd 0.05nd nd nd 0.02nd nd nd 0.01nd nd nd 0.0112.1 6 16nd nd ndnd nd ndnd nd ndnd nd nd 0.017nd nd ndnd nd nd c
17.1 26.1 <4 50nd nd nd cnd nd nd
with TDS < 400 mg L−1 (Table 4). These results are similar to thatobtained by both Rockwater in 2011 and the Western AustralianDepartment of Water in 1989.
Trace element concentrations are generally low, and dependingon the sample, 6–11 of the 25 analytes were below detection lim-its (Table 4). No trace elements exceed the ANZECC Water QualityGuidelines (ANZECC, 2000). Nutrient concentrations were elevated,particularly for nitrate (2.9–12 mg L−1). Filterable P in one sam-ple from 120 m depth was also elevated (1.5 mg L−1). The nutrientconcentrations are sufficient to support microbial growth.
4.5. Organic contaminants and dissolved organic carbon (DOC)
An analysis of the three groundwater samples collected in thispresent study indicate that all classes of organic contaminants
including BTEX and TPH are below detection limits (Table 5). Dis-solved organic carbon, expressed as non-purgeable organic carbonshowed considerable variability of between 10 and 34 mg L−1 forreplicate samples from the deepest sample from 114, 120 and
G.B. Douglas et al. / Geothermics 53 (2015) 429–445 439
Table 5Summary of organic contaminant (BTEX, TPH, �g L−1) and dissolved organic carbon (mg L−1) concentrations for the Mullaloo aquifer.
Class Sampled 15-12-11 12-12-11 08-12-11Depth 68, 89 m 97, 108 m 114, 120, 126 m
BTEX Benzene <1.0 <1.0 <1.0 nd nd <1.0 <1.0Toluene <1.0 <1.0 <1.0 nd nd <1.0 <1.0Ethylbenzene <1.0 <1.0 <1.0 nd nd <1.0 <1.0Xylene <2.0 <2.0 <2.0 nd nd <2.0 <2.0Total BTEX <5.0 <5.0 <5.0 nd nd <5.0 <5.0
Total petroleum hydrocarbons TPH C6–C9 <25 <25 <25 <25 <25TPH C10–C14 <75 <25 <25 <25 <25 <25 <25TPH C15–C28 <300 <100 <100 <100 <100 <100 <100TPH C29–C36 <300 <100 <100 <100 <100 <100 <100Total TPH <700 <250 <250 <250 <250 <250 <250
3
1f
4
4
atstcc(wpc
4
tTerwB2(CrtteD
TCD
separation, notably the likely presence of Cr-bearing ilmenite, andalthough not identified, possibly chromite, and other heavy min-erals such as ilmenite (FeTiO3) and zircon (ZrSiO4). The latter two
Dissolved organic C NPOCa 10
a Non-purgable organic carbon.
26 m. An intermediate sample from 97 m and 108 m also variedrom <1 to 12 mg L−1.
.6. Microbial biomass
.6.1. Flow cytometryThe cell counts obtained by FCM for the deep and intermedi-
te samples were lower than the background values obtained forhe filtered control samples (data not shown) indicating that theamples contained large amounts of particulate matter that bindshe dye, has a size of <0.2 �m and prevents the reliable quantifi-ation of microbial cells by FCM. Only the shallow sample gave aell count 3 × 10⁵ cells mL−1 that was above the background value2 × 105 cells mL−1) of that sample. Since the results from the FCMere inconclusive for the deep and intermediate samples, the sam-les were also analysed by epifluorescence microscopy for total cellounts.
.6.2. Epifluorescence microscopyThe cell counts obtained by epifluorescence microscopy for
he aquifer samples were 1.4 × 10⁵–5.2 × 10⁵ cells mL−1 (Table 6).he cell counts were highest in the deepest sample and low-st in the shallowest sample. The cell counts were in the sameange as observed by epifluorescence microscopy for the ground-ater in the deep geothermal aquifer of the Great Artesianasin (GAB), in Australia (105–106 cells mL−1) (Kimura et al.,005) and the deep coal seam groundwaters of northern Japan3.08 × 105 cells mL−1–9.88 × 10⁵ cells mL−1) (Shimizu et al., 2007).ell counts reported for groundwaters in Virginia have been in theange of 4 × 10⁴–1.2 × 10⁵ cells mL−1 (King and Parker, 1988) andhose in the groundwaters of ultraoligotrophic alpine springs inhe range of 104–105 cells mL−1 (Farnleitner et al., 2005; Wilhartitzt al., 2007). Examples of epifluorescence microscope images of
API stained cells from the deep aquifer sample are shown in Fig. 9.able 6ell counts in the aquifer samples as determined by epifluorescence microscopy ofAPI-stained cells.
Sample Cells mL−1 (ave ± std)
Sample A – deep sample, collected 8/12/11 5.2 × 10⁵ ± 2.2 × 10⁵
Sample B – intermediate sample, collected 12/12/11 4.4 × 10⁵ ± 1.9 × 10⁵
Sample C – shallow sample, collected 15/12/11 1.4 × 10⁵ ± 0.9 × 10⁵
4 21 12 <1 1 <1
5. Discussion
5.1. Stratigraphic variation
The limited down hole major and trace element and mineralog-ical variation (Fig. 7) reflects the uniformity of the stratigraphywithin the sampled horizons of the Mullaloo aquifer sediments. Itis only within the uppermost two horizons that the presence of cal-cite and minor dolomite increases the CaO concentration and a claypresence that increases the Al2O3 and Fe2O3, and to a lesser extentMgO, Na2O and K2O concentrations. These major element enrich-ments result in a dilution of quartz abundance, and hence, SiO2.Similar major element concentration variations also occur due tomineralogical changes, albeit to a lesser extent, further downholeat 120 m, notably due to the presence of minor pyrite contributions(Table 1, Fig. 4). It is noteworthy that no glauconite was identifiedin the Mullaloo aquifer samples despite it being noted in a previousstudy (Davidson, 1995).
Trace element concentrations also occur within the Mullalooaquifer with a remarkably consistent pattern of stratigraphic (downhole) variation for V, Ti, Zr, Mn and Cr (Fig. 7). In the absence of theuppermost carbonate and most clay-rich sample, a similar strati-graphic relationship is present between Cr and Fe (r2 = 0.82), Ti(r2 = 0.54), Zr (r2 = 0.55) and V (r2 = 0.43). This attests to a generalrelationship between these elements and the intermittent pres-ence of a heavy mineral fraction as identified during heavy mineral
Fig. 9. Epifluorescence microscope image of DAPI-stained aquifer cells from thedeep sampling point.

440 G.B. Douglas et al. / Geotherm
Fig. 10. Geochemical relationships between Fe/S (molar) and S (wt%), depth andA
mSooq
ptmem1sba1i(
FrpBtCparmpbdo
with the predominantly circum-neutral pH and the presence ofabundant Fe-oxyhydroxides as coatings on the majority of quartz
s/Fe (molar) and Fe/S (molar).
inerals in particular are known to be common in sands of thewan Coastal Plain (Gozzard, 2007). Interestingly, the abundancef quartz within the magnetic mineral separates suggests that manyf the magnetic minerals are present as inclusions within discreteuartz grains.
Extensive, long-term weathering within the Yilgarn Craton,articularly since the Tertiary, has resulted in the concentra-ion of a range of heavy minerals derived predominantly from
afic/ultramafic lithologies (Anand and Paine, 2002; Corneliust al., 2008). The heavy minerals then accumulated in sandy sedi-ents of the Swan Coastal Plain (Bastian, 1996; Collins and Baxter,
984). Heavy minerals such as chromite, magnetite and ilmenite,ometimes present as intergrowths (Groves et al., 1977) have longeen recognised as abundant in the Western Australian regolith,nd in particular mafic/ultramafic regions of the Yilgarn (Simpson,912), while chromium-bearing ilmenites in beach sand deposits
n south western, Western Australia have also been observedO’Shaughnessy, 1973).
Within the Mullaloo aquifer sediments, intermittently enrichede in the absence of a significant clay component, and a cor-esponding enrichment of S indicate the possible presence ofyrite, a common accessory mineral in both superficial (e.g.assendean Sand, Yesertener, 2010) and deep (Leederville Forma-ion, Descourvieres et al., 2011) aquifer sediments of the Swanoastal Plain. The specific presence of pyrite within the deeperortion of the Mullaloo aquifer has also been confirmed by XRDnalysis (Table 1). An analysis of the variation of the Fe/S molaratios with S (wt%) indicates that as the latter increases, the Fe/Solar ratio approaches unity in accordance with the presence of
yrite (Fig. 10). In situ down hole measurements of Eh withinorehole MB04a indicate increasingly reducing conditions with
epth (Rockwater, 2011a,b,c), again consistent with the presencef pyrite.ics 53 (2015) 429–445
The presence of significant pyrite at 120 m depth in the Mul-laloo aquifer also corresponds to an increase in As concentrations(Fig. 10). The presence of As-bearing pyrite is common acrossthe Swan Coastal Plain (e.g. Appleyard et al., 2006; Yesertener,2010), particularly within the superficial aquifer dominated by theBassendean Sands.
A compilation of Mullaloo aquifer sediments and other regionalaquifer sediments, Baigup soils, Swan River sediment from May-lands and the Post-Archaean Australian Shale (PAAS) is given inTable 3. In terms of major, and to a lesser extent, trace elementgeochemistry, the average Mullaloo aquifer sediment most closelyresembles the Bassendean Sand which forms the superficial aquiferat borehole MB04a. Given the mutually high average SiO2 concen-trations, the majority of other elements are impoverished, but forminor CaO and Al2O3 enrichment in the average Mullaloo com-position due to carbonate and clay enrichment in the uppermostsamples. Similarly, most trace elements, including average Cr con-centrations, are similar between the Mullaloo aquifer sedimentsand those of the Bassendean Sand.
By comparison to average Mullaloo aquifer sediments, regionalaquifer sediments from the Osborne and Leederville Formationsand South Perth Shale, Baigup soils and Swan River sedimentencompass a range of major and trace element concentrations that,due to their relatively low SiO2 concentrations are also substantiallyenriched (Table 3). In particular these regional aquifer and riverinesoils and sediments are more clay-rich, and hence, also enrichedoften by one- to two-orders of magnitude in both alkali and alka-line earth element oxides/elements such as CaO, MgO, Na2O, K2O,Ba, Rb, Sr, in addition to transition metals (Cd, Cu, Ni, Pb, V, Zn) rareearth elements (e.g. La, Ce and Nd), and actinides (Th, U).
Comparison to the Post-Archaean Australian Shale, an estimateof average crustal abundances (Taylor and McLennan, 1985), alsosuggests Cr enrichment in the Mullaloo aquifer sediments. In addi-tion, the average Mullaloo aquifer sediments are, by virtue ofSiO2 (quartz) enrichment, with its inherent purity, comparativelyimpoverished for a range of major and trace elements.
5.2. Mullaloo aquifer groundwater composition
The major composition of the Mullaloo aquifer groundwateris consistent with derivation from a seawater-Perth rainwatersignature (Fig. 8) with minor modification due to water–rock inter-action (e.g. carbonate or clay mineral equilibration) as evidencedby variable concentrations of bicarbonate and silica respectively.The Mullaloo aquifer major ion composition is also similar to thatof average Perth shallow groundwater (Perth SGW − n = 103, afterYesertener, 2010) and that of the superficial aquifer.
Speciation modelling of Fe in the Mullaloo aquifer samplescollected in this study is in general agreement with results ofmineral stability modelling (as saturation indices) confirmingthat the majority of Fe is present as Fe-oxyhydroxide minerals(Table 1, Figs. 11 and 12). Groundwater samples previously col-lected by Rockwater also suggest the possible presence of sideritein more alkaline samples. While pyrite formation is not immedi-ately suggested on the basis of recent Mullaloo aquifer groundwatersampling and Eh–pH monitoring, only a small decline in Eh/peis nonetheless required to produce conditions conducive to pyri-tisation, particularly in the presence of sulfate-reducing bacteriaknown to occur in Swan Coastal Plain sediments (e.g. Robertsonet al., 2000, 2001).
Trace element concentrations are often low and are consistent
grains which would be likely to act as sinks for metals. Nutrientconcentrations are within ranges commonly encountered in Perth

G.B. Douglas et al. / Geothermics 53 (2015) 429–445 441
Table 7Recommended values for water quality parameters and observed range in Mullaloo aquifer.
Concept Parameter Limitations Range in Mullaloo aquifer
Biological clogging Deep systems pH >7.2 (iron bacteria) 6.58–6.99DOC <2 mg L−1 <1–34 mg L−1
Eh >10 mV 192–392Surface systems TOC TOC < 10 mg L−1 <1–34 mg L−1 (DOC)
Chemical clogging [Fe2+] <11.2 mg L−1 0.1–15 mg L−1
pH <7.5 6.58–6.99TDS <150 mg L−1 300–380[Cl−]
Source: Adapted from Pérez-Paricio (2000).
Fig. 11. Pourbaix (pe-pH) diagram of Fe-S-C-O-H system at 20 ◦C and 1 atmospherefor Mullaloo aquifer groundwater from borehole MB04a. Activities of the major ionsare: Fe3+ × 10−5, SO4
2− × 10−4, Cl × 10−3, HCO3− × 10−3 M based on mean composi-
tion of Mullaloo groundwater. Solid mineral fields are in yellow and solutes in blue.The three groundwater samples collected in this study and an approximate pe-pHfield derived from CSIRO (solid circles) and Rockwater data (open circles) are alsoplotted.
Fig. 12. Saturation indices of Mullaloo aquifer minerals and groundwater pH as afunction of temperature from 20 to 50 ◦C. An average groundwater composition fromthe three CSIRO samples was used in the model. The forecast range of temperatureincrease in the Mullaloo aquifer due to the return of heated groundwater (�T = 10 ◦C)is shaded.
<500 mg L−1 78–250
superficial aquifers (e.g. Bennett et al., 2007; Yesertener, 2010;Sarukkalige, 2011).
5.3. Microbial substrate and nutrient concentrations
A set of threshold values for biological and chemical clogging areshown in Tables 7 and 8 shows guidelines for clogging and rede-velopment of aquifers (adapted from Pérez-Paricio, 2000). Apartfrom the deepest aquifer samples obtained from 114 to 126 m ofthe Mullaloo aquifer, DOC concentrations were above the thresh-old value for bioclogging in deep systems (<2 mg L−1) (Table 7). TheTDS was above the threshold limit for chemical clogging in all sam-ples. Ferrous iron concentrations were below the threshold in mostsamples, except for one sample obtained by Rockwater (2011c).According to the TOC-based guidelines presented in Table 8 and theobserved DOC results for Mullaloo Aquifer, the water quality in thedeepest samples indicate a slight tendency for bioclogging, whereas the shallowest samples indicate a notable or strong tendency forbioclogging. However, it is to be noted that the transformation ofnatural organic matter (NOM) and microbial growth during artifi-cial groundwater recharge is dependent on a number of site specificand operational factors as shown in Fig. 13. Guidelines for the rede-velopment of aquifers to prevent clogging are given in Table 8.
5.4. Effect of increased temperature on Mullaloo aquifergeochemistry
Geochemical modelling of the groundwater geochemistry indi-cates that subtle changes in mineral solubility occur as a functionof increasing temperature (Fig. 12). Similarly, groundwater pH onlymarginally declines from ca. 6.75 to 6.65 over the 30 ◦C tempera-ture increment modelled in this study. This potential pH change islikely to be well within the natural pH variation of fluids within thegreater Mullaloo aquifer. Lower temperature changes are predictedto result in even smaller perturbations to the solubilities of dom-inant mineral phases and the pH (see the shaded zone in Fig. 12corresponding to a �T of 10 ◦C).
Mineral dissolution rates may be both enhanced and sup-pressed with changes in ambient temperature (e.g. Aargard andHelgeson, 1982). Within the Mullaloo aquifer, modelled mineralsolubilities only display small changes in solubility as a func-tion of temperature. In particular, quartz, which is at equilibriumwith the prevailing groundwater, and amorphous silica, albeit thelatter already undersaturated, display a small increase in pre-dicted solubility (as saturation index), particularly at temperaturesgreater than ca. 35 ◦C (Fig. 12). Given that predicted tempera-tures of returned water are unlikely to exceed 30 ◦C, it is unlikelythat any discernible change would occur in terms of quartz dis-
solution or concomitant groundwater composition. Furthermore,the modelling conducted here only considers thermodynamics interms of the saturation index, and does not include a kinetic term.Many studies conducted on quartz dissolution, however, indicate
442 G.B. Douglas et al. / Geothermics 53 (2015) 429–445
Table 8Guidelines for clogging and redevelopment based on TOC.
Clogging Recharge water Redevelopment
Surface systems Slight TOC < 10 mg L−1 Natural drying and crackingOnce a year mechanical
Notable TOC = 10–25 mg L−1 Frequent drying and crackingTwice a year mechanical
Strong TOC > 25 mg L−1 Prefiltration recommended
Deep systems Slight TOC < 10 mg L−1 Frequent pumpingOnce a month surging/jetting
Notable TOC = 10–25 mg L−1 Pumping once a dayOnce a week surging/jetting
Strong TOC > 25 mg L−1 Daily pumping
S
t(f4Sidmacatpid
wsetru
hr
FL
S
ource: Adapted from Pérez-Paricio (2000).
hat rates of crystalline quartz dissolution are exceedingly slowca. 10−16 mol cm−2 s−1, Brady and Walther, 1990), particularly inreshwaters, with minimum dissolution rates at solution pH of ca.–6, similar to that of the prevailing Mullaloo aquifer groundwater.imilarly a temperature increase from ca. 20 to 30 ◦C as envisagedn the Mullaloo aquifer will be unlikely to significantly enhanceissolution rates of ambient dissolved Si concentrations. Similarly,ixing with incumbent groundwater upon return to the Mullaloo
quifer is likely to quickly decrease the temperature such thathanges to solute composition from mineral dissolution, which islready small, will be negligible on a more widespread basis. A fur-her barrier to any potential quartz dissolution is the armouring ofart of, or entire quartz grains, by Fe-oxyhydroxides. This armour-
ng is likely to provide an additional physico-chemical barrier toissolution.
In contrast, calcite, present as a minor mineral, particularlyithin the upper Mullaloo aquifer displays a small decrease in
olubility similar to that observed in other studies (e.g. Kuhnt al., 2002). Nonetheless, calcite remains over an order of magni-ude undersaturated and thus, the groundwater composition willemain essentially unaffected. Gypsum remains strongly undersat-
rated over the entire temperature range.Both ferrihydrite (as a proxy for a range of Fe-ydroxides/oxyhydroxides) and kaolinite (partially obscured) bothemain in equilibrium (SI = 0) with the prevailing groundwater
ig. 13. Transformation of natural organic matter (NOM) and the factors affecting the proMW – low molecular weight.
ource: Adapted from Kolehmainen (2008).
Adapted protocol
over the entire temperature range. Thus, it is unlikely that traceelements associated with these minerals will be mobilised duringany increase in groundwater temperature.
5.5. Development of an operational protocol for the PawseyCentre groundwater cooling system
Based on the characterisation of the aquifer sediments, ground-water chemistry and microbiology, a monitoring protocol has beendeveloped for the operation of the Pawsey Centre GroundwaterCooling system. This protocol has been designed to ensure the safeand efficient operation of the groundwater cooling system by com-paring baseline aquifer biogeochemistry with indicators measuredthroughout the operational lifetime of the heat rejection system.
Monitoring of a range of physical, geochemical and microbiolog-ical parameters is critical to ensure that changes in groundwater donot result in compositional changes detrimental to ecosystem func-tion or system operation. For instance, increased oxygen ingressmay potentially result in increased acidity and trace element mobil-isation due to sulfide oxidation or alternatively, Fe precipitation andscaling. Similarly, changes in oxygen status, whether increased or
decreased may influence nutrient speciation such as P release fromreductive dissolution of Fe-oxyhydroxides, nutrient transformation(e.g. microbial oxidation of NH3 to NO3−) or rates of mineralisa-tion, and possible changes in microbial biomass or composition.
cess in an artificial groundwater recharge aquifer. HMW – high molecular weight,
G.B. Douglas et al. / Geotherm
Tab
le
9Tr
igge
r
crit
eria
for
Paw
sey
Cen
tre
grou
nd
wat
er
cool
ing
syst
em
mon
itor
ing.
An
alyt
e
Met
hod
s
Rep
orti
ng
Freq
uen
cy
Trig
ger
Ac
Trig
ger
Bd
Phys
ical
Wat
er
leve
l
Son
de
On
lin
e/re
al
tim
e
Con
tin
uou
sb>−
5
m
pro
du
ctio
n/>
−2
m
mon
itor
ing
bore
s
>−10
m
pro
du
ctio
n/>
5
m
inje
ctio
n
bore
sTe
mp
erat
ure
>10
◦ C
inje
ctio
n/>
2◦ C
mon
itor
ing
bore
s>1
2◦ C
inje
ctio
n/>
4◦ C
inje
ctio
n
bore
sFl
ow
rate
/pre
ssu
re
Min
imu
m
oper
atio
nal
spec
ifica
tion
s
Min
imu
m
oper
atio
nal
spec
ifica
tion
sTu
rbid
ity
>10
NTU
>20
NTU
Geo
chem
ical
pH
Son
de
On
lin
e/re
al
tim
eC
onti
nu
ousb
±1
pH
un
it
wit
hin
1
h±2
pH
un
its
wit
hin
24
hD
isso
lved
oxyg
en
±1
mg
L−1D
O
wit
hin
1
h
±2
mg
L−1D
O
wit
hin
24
hR
edox
(Eh
)±1
00
mV
wit
h
1
h±2
00
mV
wit
h
24
hM
ajor
ion
s/m
etal
s/n
utr
ien
ts
ICP-
OES
/MS(
1)
FIA
aU
plo
ad
to
dat
abas
e
6
mon
thly
/as
requ
ired
Bas
ed
on
pH
/DO
/Eh
/T/N
TU
Bas
ed
on
pH
/DO
/Eh
/T/N
TU
Biol
ogic
alM
icro
bial
biom
ass
Cel
l cou
nti
ng
by
mic
rosc
opy/
flow
cyto
met
ryU
plo
ad
to
dat
abas
e6
mon
thly
/as
requ
ired
102–1
03ch
ange
over
base
lin
e
>103
chan
ge
over
base
lin
e
Mic
robi
al
spec
ies
DN
A
extr
acti
on
and
sequ
enci
ng
>25%
chan
ge
in
com
pos
itio
n
over
base
lin
e
>50%
chan
ge
in
com
pos
itio
n
over
base
lin
eSt
ygof
aun
a
Fiel
d
sam
pli
ng
Var
iati
on
from
base
lin
eV
aria
tion
from
base
lin
e
aIn
du
ctiv
ely
cou
ple
d
pla
sma
opti
cal e
mis
sion
spec
trom
etry
/flow
inje
ctio
n
anal
ysis
.b
Rep
orte
d
to
acce
ssib
le
dat
abas
e.c
Exce
eden
ce
in
shal
low
or
dee
p
bore
s
trig
gers
sam
pli
ng
and
anal
ysis
of
maj
or
ion
s,
met
als,
nu
trie
nts
, or
clos
er
anal
ysis
/mod
ifica
tion
of
pro
du
ctio
n/r
e-in
ject
ion
rate
s
or
spli
t
betw
een
.d
Gro
un
dw
ater
cool
ing
syst
em
shu
tdow
n/c
ooli
ng
tow
ers
only
.
ics 53 (2015) 429–445 443
These critical aspects that may affect the operational integrity ofgroundwater cooling or other geothermal systems have also beenconsidered in detail by Bonte (2013).
The monitoring protocol developed here is primarily basedon real time data harvesting and assimilation from 15 in situmulti-parameter sondes measuring pH, Eh, electrical conductivity,dissolved oxygen, turbidity and temperature at (at least) hourlyintervals within monitoring, production and injection bores andwithin the sealed groundwater cooling/heat exchange system inaddition to real time flow and pressure in the latter groundwa-ter levels are also monitored in real time in all of the bores andwater samples are periodically collected for determining micro-bial biomass. A central monitoring station is used to aggregate datafeeds for subsequent analysis and reporting.
Two operational trigger criteria for the groundwater coolingsystem have been defined (Table 9) to assist in identifying bothmoderate and substantial system perturbations requiring furtherinvestigation or shutdown, respectively, and transfer of coolingdemand to backup cooling towers:
Trigger A (requiring detailed investigation and close mon-itoring): exceedence of one or more physical, geochemical orbiological parameters (Table 9) will trigger water quality sampling(major ions, metals, and nutrients, microbial biomass and microbialspecies), with results to be referenced to baseline regional and pre-vious operational results. A management team is tasked to assessresults as they become available.
Trigger B (immediate shutdown and investigation): exceedenceof one or more physical, geochemical or biological parameters(Table 9) will initiate an immediate shutdown of the groundwatercooling system and transfer of cooling requirements to the coolingtowers. A management team is tasked to meet to assess results asthey become available and to advise on start-up arrangements inline with any regulatory requirements.
6. Conclusions
A rapid assessment protocol has been developed and applied toassess the potential suitability of the Mullaloo aquifer to receiveheated water generated from the Pawsey Supercomputer. A multi-disciplinary study encompassing a geochemical analysis of theaquifer sediment and microbiological and organic contaminant sur-veys together with geochemical modelling of the aquifer solutegeochemistry has yielded the following information:
Sediment mineralogy and petrography – The Mullaloo aquifersediments constitute a mature, moderately well sorted, quartz-dominated, possibly shallow marine unit. Minor discrete carbonateand organic matter occurs in the uppermost stratigraphy. Inaddition, minor heavy minerals dominated by ilmenite occurthroughout the stratigraphy, and pyrite is present at depth. In con-trast to previous studies, no glauconite was identified.
Sediment geochemistry – Aquifer sediments are quartz-dominated, however, significant amounts of calcite and some pyriteis present in the shallowest and deepest samples, respectively. Con-centrations of trace elements are generally low, however, there aresignificant enrichments of Cr, that is likely to occur within ilmeniteor other heavy minerals present within the aquifer. Significant Asis also present, principally associated with pyrite within the deepaquifer.
Groundwater geochemistry – The groundwater geochemistry isof a Na-Cl type with neutral to moderately alkaline pH, inter-mediate redox potential (Eh/pe), and low ionic strength with
TDS < 400 mg L−1. Trace element abundances are low and are likelyto remain stable under prevailing conditions. Aquifer water qual-ity meets ANZECC drinking water quality guidelines. No BTEX orpetroleum hydrocarbons were detected.
4 therm
5ewftcwaDesgsccal
aojIio
sa
(
cgoeatiooaotsgruc
44 G.B. Douglas et al. / Geo
Microbiology – Microbial cell counts varied from 1.4 × 10⁵ to.2 × 105 cells mL−1 (Table 1) with abundances highest in the deep-st sample and lowest in the shallowest sample. The cell countsere in the same range as observed by epifluorescence microscopy
or the groundwater in a range of local and international loca-ions corresponding to oligotrophic conditions. Dissolved organicarbon, nitrogen and phosphorus are present in the groundwater,hich may promote population growth in the presence of electron
cceptors. According to the TOC-based guidelines and the observedOC results for Mullaloo Aquifer, the water quality in the deep-st samples indicate slight tendency for bioclogging, where as thehallowest samples indicate notable or strong tendency for bioclog-ing. As long as electron acceptors are prevented from entering theystem, it is likely that microbial numbers will not significantlyhange, although abundances of the various microbial speciesomprising the community may vary. Additional sampling andnalysis would be required to predict such changes at the speciesevel.
Geochemical modelling – Geochemical modelling indicates therere few, if any adverse implications of increased temperaturesn the geochemistry of the Mullaloo aquifer, assuming the rein-ected water does not introduce external reagents (e.g. oxygen).f temperature increases are limited to ca. 10 ◦C as proposed, its unlikely that any material change to aquifer geochemistry willccur.
Recommendations – Based on the information obtained in thistudy three recommendations can be made for heat rejection oper-tions at the Pawsey site:
(i) The presence of pyrite within the deeper aquifer in par-ticular signifies the potential for oxidation, acid generationand release of As and potentially other metal/metalloidcontaminants. Thus, it is recommended that a closed loopconfiguration be utilised such that anthropogenic oxygen isnot introduced into the Mullaloo aquifer. In addition, it isrecommended that withdrawal and return of water be con-fined to a zone sufficiently above pyrite-bearing stratigraphyif ingress of anthropogenic oxygen occurs during abstractionor re-injection.
(ii) Additional analysis of aquifer sediments be undertaken toconfirm the absence of pyrite-bearing stratigraphy prior tooperation of any wells.
iii) Groundwater sampling and analysis should occur monthlyduring the first year of operation, and at appropriate inter-vals thereafter, to monitor changes, if any, in groundwatergeochemistry and microbiology.
The rapid assessment protocol developed for this study is spe-ific to gaining an environmental baseline prior to impacts ofeothermic operations in a shallow aquifer and to make predictionsf potential impacts resulting from geothermic operations. In gen-ral, due to subsurface geochemical and hydraulic heterogeneitynd data scarcity, it is unlikely that all potential impacts can be iden-ified and properly characterised before operations commence. Its always prudent to check performance predictions against actualperation. Therefore upon commissioning of the heat rejectionperations it is advisable that a comprehensive aquifer monitoringnd sampling schedule be established and run simultaneously withperations along with a monitoring protocol with trigger criteriahat facilitate sampling and analysis as supporting evidence for pos-ible modification or shutdown of system operation. The data thus
ained would then support assessment of performance of the heatejection system, regular compliance reporting of the system to reg-lators and stakeholders, and early identification of any unexpectedhanges in aquifer status or geochemical state.ics 53 (2015) 429–445
Acknowledgements
This work was supported by the Sustainable Energy for theSquare Kilometre Array (SESKA) Project. The assistance of Rockwa-ter Pty Ltd in making available drill cutting sediments from MB04is gratefully acknowledged. Two anonymous reviewers providedexcellent comments on this manuscript.
References
Aargard, P., Helgeson, H.C., 1982. Thermodynamic and kinetic constraints on reac-tion rates among minerals and aqueous solutions. I. Theoretical considerations.Am. J. Sci. 282, 237–285.
Anand, R.R., Paine, M., 2002. Regolith geology of the Yilgarn Craton, WesternAustralia: implications for exploration. Aust. J. Earth Sci. 49, 3–162.
ANZECC, 2000. Australian and New Zealand Guidelines for Fresh and MarineWater Quality 2000. http://www.mincos.gov.au/publications/australianand new zealand guidelines for fresh nnd marine water quality
Appleyard, S.J., Angeloni, J., Watkins, R., 2006. Arsenic-rich groundwater in an urbanarea experiencing drought and increasing population density, Perth, Australia.Appl. Geochem. 21, 83–97.
Banks, D., 2009. Thermogeological assessment of open-loop well-doublet schemes:a review and synthesis of analytical approaches. Hydrogeol. J. 17, 1149–1155.
Bastian, L.V., 1996. Residual soil mineralogy and dune subdivision, Swan CoastalPlain, Western Australia. Aust. J. Earth Sci. 43, 31–44.
Bennett, D., Donnelly, P., Tille, P., 2007. Assessment of the impact of intensificationof grazing agriculture on nitrogen and phosphorus levels in the shallow aquifersof the Southern Perth Basin. Dept. Agricult. Food Res. Mgmt., Tech. Rpt., pp. 323.
Bethke, C.M., 2004. The Geochemists Workbench. Release 5.0.Bonte, M., Stuyfzand, P.J., Hulsmann, A., Van Beelen, P., 2011. Underground ther-
mal energy storage: environmental risks and policy developments in theNetherlands and the EU. Ecol. Soc. 1, 22.
Bonte, M., Stuyfzand, P.J., Van Den Berg, G., 2010. The effects of aquifer thermalenergy storage on groundwater quality and the consequences for drinkingwater production: a case study from the Netherlands. Water Sci. Technol. 63,1922–1931.
Bonte, M., (PhD Thesis) 2013. Impacts of shallow geothermal energy on groundwaterquality. KWR Watercycle Research Institute and VU University Amsterdam, pp.175.
Brady, P.V., Walther, J.V., 1990. Kinetics of quartz dissolution at low temperatures.Chem. Geol. 82, 253–264.
Brielmann, H., Griebler, C., Schmidt, S.I., Michel, R., Lueders, T., 2009. Effects of ther-mal energy discharge on shallow groundwater ecosystems. FEMS Microbiol.Ecol. 68, 273–286.
Brielmann, H., Lueders, T., Schreglmann, K., Ferraro, F., Avramov, M., Hammerl, V.,Blum, P., Bayer, P., Griebler, C., 2011. Oberflächennahe Geothermie und ihrepotenziellen Auswirkungen auf Grundwasserökosysteme. Grundwasser, 1–15.
Brons, H.J., Griffioen, J., Appelo, C.A.J., Zehnder, A.J.B., 1991. (Bio)geochemical reac-tions in aquifer material from a thermal energy storage site. Water Res. 25,729–736.
Chopra, P.N., Holgate, F., 2007. Geothermal Energy Potential in Selected Areas ofWestern Australia: A Consultancy Report by Earthinsite.com Pty Ltd for Geolog-ical Survey of Western Australia. Geol. Surv. West. Aust., Statutory PetroleumExploration Report, G31888 A1 (unpublished).
Collins, L.B., Baxter, J.L., 1984. Heavy mineral-bearing strandline deposits associatedwith high-energy beach environments, southern Perth Basin, Western Australia.Aust. J. Earth Sci. 31, 287–292.
Cornelius, M., Robertson, I.D.M., Cornelius, A.J., Morris, P.A., 2008. Geochemical map-ping of the deeply weathered western Yilgarn Craton of Western Australia, usinglaterite geochemistry. Geochem. Explor. Environ. Anal. 8, 241–254.
Davidson, W.A., 1995. Hydrogeology and groundwater resources of the Perth Region,Western Australia. West. Aust. Geol. Surv. Bull., 142.
Davidson, W.A., Yu, X., 2006. Perth Regional Aquifer Modelling System PRAMS ModelDevelopment: Hydrogeology and Groundwater Modelling. Dept. Water, Hydro-geological Record Series HG 20.
Descourvieres, C., Douglas, G., Leyland, L., Hartog, N., Prommer, H., 2011. Composi-tional variation and chemical provenance signature of post-rift passive marginsediments of the early Cretaceous Leederville Formation in the Perth Basin,Western Australia. Sediment. Geol. 226, 62–76.
Douglas, G.B., Patterson, B.M., Davis, G.B., Wendling, L.A., Coleman, S., Furness, A.J.,2008. Assessment of Acid Sulfate Soils and Surface Water and GroundwaterQuality at Baigup Reserve, Western Australia. CSIRO Water for a Healthy CountryFlagship Report, August 2008, 51 pp.
Dincer, I., 2002. Thermal energy storage systems as a key technology in energyconservation. Int. J. Energy Res. 26, 567–588.
Farnleitner, A.H., Wilhartitz, I., Ryzinska, G., Kirschner, A.K.T., Stadler, H., Burtscher,M.M., Hornek, R., Szewzyk, U., Herndl, G., Mach, R.L., 2005. Bacterial dynamics
in spring water of alpine karst aquifers indicates the presence of sta-ble autochthonous microbial endokarst communities. Environ. Microbiol. 7,1248–1259.Ferguson, G., 2007. Heterogeneity and thermal modelling of ground water. Ground-water 45, 485–490.

therm
F
G
G
G
G
G
H
H
H
i
K
K
K
K
K
L
N
O
P
P
P
P
P
Q
G.B. Douglas et al. / Geo
erguson, G., Woodbury, A.D., 2006. Observed thermal pollution and post-development simulations of low-temperature geothermal systems in Winnipeg,Canada. Hydrogeol. J. 14, 1206–1215.
hori, K.A.R., 2008. The search for Western Australia’s geothermal resources. Geol.Surv. West. Aust. Ann. Rev., 25–31, 2006-07.
ozzard, J.R., 2007. Geology and landforms of the Perth Region. West. Aust. Geol.Surv., 126.
riffioen, J., Appelo, C.A.J., 1993. Nature and extent of carbonate precipitation duringaquifer thermal energy storage. Appl. Geochem. 8, 161–176.
ringarten, A.C., Sauty, J.P., 1975. Theoretical study of heat extraction from aquiferswith uniform regional flow. J. Geophys. Res. 80, 4956–4962.
roves, D.I., Barrett, F.M., Binns, R.A., McQueen, K.G., 1977. Spinel phases associ-ated with metamorphosed volcanic-type iron-nickel sulfide ores from WesternAustralia. Econ. Geol. 72, 1224–1244.
oefel, D., Grooby, W.L., Monis, P.T., Andrews, S., Saint, C.P., 2003. Enumeration ofwater-borne bacteria using viability assays and flow cytometry: a comparisonto culture-based techniques. J. Microbiol. Methods 55, 585–597.
olm, T.R., 1986. Groundwater geochemistry of aquifer thermal-energy storage.Abstr. Pap. Am. Chem. Soc. 192 (77-GEOC).
orne, R.N., 1982. Geothermal reinjection experience in Japan. J. Petrol. Technol. 34,495–503.
VEC, 2010. The Pawsey Centre. http://www.ivec.org/sites/default/files/PAWSEY%20INFO%20SHEET%20SEPT2010.pdf
im, J., Lee, Y., Yoon, W.S., Jeon, J.S., Koo, M.-H., Keehm, Y., 2010. Numerical modellingof aquifer thermal energy storage system. Energy 35, 4955–4965.
imura, H., Sugihara, M., Yamamoto, H., Patel, B.K.C., Kato, K., Hanada, S., 2005.Microbial community in a geothermal aquifer associated with the subsurfaceof the Great Artesian Basin, Australia. Extremophiles 9, 407–414.
ing, L.K., Parker, B.C., 1988. A simple, rapid method for enumerating total viableand metabolically active bacteria in groundwater. Appl. Environ. Microbiol. 54,1630–1631.
olehmainen, R., (Thesis for the Degree of Doctor of Technology) 2008. NaturalOrganic Matter Biodegradation and Microbial Community Dynamics in ArtificialGroundwater Recharge. Tampere Univ. Technol., Tampere, Finland, pp. 11.
uhn, M., Bartels, J., Iffland, J., 2002. Predicting reservoir property trends under heatexploitation: interaction between flow, heat transfer, transport, and chemicalreactions in a deep aquifer at Strausland, Germany. Geothermics 31, 725–749.
i, S., Liu, S., Shang, Y., Du, G., 2011. Numerical study of distribution characteristicsand influencing factors on geo-temperature field of groundwater heat pump.Adv. Mater. Res. 320, 536–541.
orrish, K., Chappell, B.W., 1977. X-ray fluorescence spectrometry. In: Zussman, J.(Ed.), Physical Methods in Determinative Mineralogy. Academic Press, London,pp. 201–272.
’Shaughnessy, P.T., 1973. Determination of trace levels of chromium in ilmenite byatomic absorption spectrometry. Anal. Chem. 45, 1946–1947.
anichi, C., 2004. Geochemical impact of re-injecting geothermal waste waters;example, Larderello, Italy in Energy, waste and the environment; a geochemicalperspective. Geol. Soc. Spec. Publ. 236, 337–354.
apadopulos, S.S., Larson, S.P., 1978. Aquifer storage of heated water: Part II. Numer-ical simulation of field results. Groundwater 16, 242–248.
érez-Paricio, A., (PhD Thesis) 2000. Integrated Modelling of Clogging Processesin Artificial Groundwater Recharge. Department of Geotechnical Engineering& GeoSciences Tech. Univ., Catalonia UCP, Barcelona, Spain.
erlinger, J.A., Almendinger, J.E., Urban, N.R., Eisenreich, S.J., 1987. Groundwatergeochemistry of aquifer thermal-energy storage – long-term test cycle. WaterResour. Res. 23, 2215–2226.
ost, V.E.A., 2011. PHREEQC for Windows Version 2.18.00. A HydrogeochemicalTransport Model by D.L. Parkhurst and C.A.J. Appelo. Graphical User Interfaceby V.E.A. Post. http://pfw.antipodes.nl/index.html
uilty, P.G., 1974. Cainozoic stratigraphy in the Perth area. West. Aust. R. Soc. J. 57,16–31.
ics 53 (2015) 429–445 445
Regenauer-Lieb, K., Horowitz, F., 2007. The Perth Basin geothermal opportunity:September 2007 Petroleum in Western Australia, Western Australia’s Digestof Petroleum Exploration, Development and Production. Dept. Indust. Resour.,Perth, pp. 42–44.
Robertson, W.J., Franzmann, P.D., Mee, B.J., 2000. Spore-forming, desulfosporosinus-like sulfate-reducing bacteria from a shallow aquifer contaminated withgasoline. J. Appl. Microbiol. 88, 248–259.
Robertson, W.J., Franzmann, P.D., Mee, B.J., 2001. Desulfosporosinus meridiei sp. nov., aspore-forming sulfate-reducing bacterium isolated from gasoline-contaminatedgroundwater. Int. J. Syst. Evol. Microbiol. 51, 133–140.
Rockwater Pty Ltd, (Unpublish. Rpt. for CSIRO) 2011a. Aquifer Heat Rejection forCooling the Proposed Pawsey Centre. H2 Level Hydrogeological Assessment.
Rockwater Pty Ltd, (Unpublish. Rpt. for CSIRO) 2011b. Bore Completion and TestPumping Report.
Rockwater Pty Ltd, (Unpublish. Rpt. for CSIRO) 2011c. Preliminary H3 Level Hydro-gelological Assessment for Groundwater Supply and Injection for the ProposedPawsey Supercomputer.
Sarukkalige, P.R., 2011. Assessment of spatial variation of groundwater quality andits relationship with land use in metropolitan Perth. J. Water Resour. Protect. 3,311–317.
Shimizu, S., Akiyama, M., Naganuma, T., Fujioka, M., Nako, M., Ishijima, Y., 2007.Molecular characterization of microbial communities in deep coal seam ground-water of northern Japan. Geobiology 5, 423–433.
Simpson III, E.S., 1912. Notes on laterite in Western Australia. Geol. Mag. (Decade V)9, 399–406.
Snap Sampler, 2011. ProHydro, Inc., USA, www.snapsampler.comTawney, R., Khan, Z., Zachary, J., 2005. Economic and performance evaluation of
heat sink options in combined cycle applications. J. Eng. Gas Turbines Power127, 397–403.
Taylor, S.R., McLennan, S.M., 1985. The Continental Crust: Its Composition and Evo-lution. Blackwell, Oxford, pp. 312.
Wilhartitz, I., Mach, R.L., Teira, E., Reinthaler, T., Herndl, G.J., Farnleitner, A.H., 2007.Prokaryotic community analysis with CARD-FISH in comparison to FISH in ultra-oligotrophic ground- and drinking water. J. Appl. Microbiol. 103, 871–881.
Winters, A.L., 1992. Summary of Research on Microbiological Processes. Interna-tional Energy Agency Subtask D Final Report 64. Dept. Biol. Sci. Univ. of Alabama.
Yesertener, C., 2010. Hydrogeochemical Assessment of the Superficial Aquifer. PerthMetropolitan Area. Dept. Water Hydrogeological Rec. Ser. Rpt. No HG37, August2010, 174 pp.
Yu, Z., Zhang, Y., Wang, C., 2011. Hydro-thermal coupled numerical simulation forgroundwater storage energy and its application. In: Intl. Conf. Electric Tech-nology and Civil Engineering ICETCE, April 22–24, 2011, Lushan, China, pp.3202–3206 http://www.icetce.org
Glossary
Megawatt thermal: 106 watts of thermal powerPetrographic analysis: microscopic analysis of rock thin sectionsFlow cytometry: is a technique for counting and examining microscopic particles,
such as cells, by suspending them in a stream of fluid and passing them by anelectronic detection apparatus.
DAPI or 4′ ,6-diamidino-2-phenylindole: is a fluorescent stain that binds strongly toDNA in both live and dead cells and which is used extensively in fluorescencemicroscopy.
Epifluorescence microscopy: is a method of fluorescence where excitatory light ispassed from above, through the objective and then onto the specimen instead
of passing it first through the specimen.Ultraoligotrophic: extremely low concentrations of plant nutrients, nitrogen andphosphorus