
PORTADA TESIS 2.psd
281
-
Upload
khangminh22 -
Category
Documents
-
view
1 -
download
0
Transcript of PORTADA TESIS 2.psd

UNIVERSIDAD POLITÉCNICA DE CARTAGENA
DEPARTAMENTO DE INGENIERÍA DE ALIMENTOS Y
DEL EQUIPAMIENTO AGRÍCOLA
EFFECT OF RELEVANT ENVIRONMENTAL
FACTORS FOR FOOD PRESERVATION AND
MOLECULAR IDENTIFICATION (HIGH RESOLUTION
MELTING) OF
VERA ANTOLINOS LÓPEZ
UNIVERSIDAD POLITÉCNICA DE CARTAGENA
DEPARTAMENTO DE INGENIERÍA DE ALIMENTOS Y
DEL EQUIPAMIENTO AGRÍCOLA
EFFECT OF RELEVANT ENVIRONMENTAL
FACTORS FOR FOOD PRESERVATION AND
MOLECULAR IDENTIFICATION (HIGH RESOLUTION
MELTING) OF Bacillus cereus GROUP.
VERA ANTOLINOS LÓPEZ
2012
UNIVERSIDAD POLITÉCNICA DE CARTAGENA
DEPARTAMENTO DE INGENIERÍA DE ALIMENTOS Y
EFFECT OF RELEVANT ENVIRONMENTAL
FACTORS FOR FOOD PRESERVATION AND
MOLECULAR IDENTIFICATION (HIGH RESOLUTION
GROUP.
UNIVERSIDAD POLITÉCNICA DE CARTAGENA
DEPARTAMENTO DE INGENIERÍA DE ALIMENTOS Y DEL
EQUIPAMIENTO AGRÍCOLA
EFFECT OF RELEVANT ENVIRONMENTAL FACTORS
FOR FOOD PRESERVATION AND MOLECULAR
IDENTIFICATION (HIGH RESOLUTION MELTING) OF
Bacillus cereus GROUP.
Tesis Doctoral
Trabajo presentado por VERA ANTOLINOS LÓPEZ para aspirar al Grado de Doctor por la Universidad Politécnica de
Cartagena
Dirigida por
DR. PABLO S. FERNÁNDEZ ESCÁMEZ DRA. PAULA M. PERIAGO BAYONAS
Cartagena, 2012.

A mis padres y mi hermano
A mi abuela Paca
A Fernando

AGRADECIMIENTOS
Me gustaría comenzar agradeciendo a mis directores de tesis, Pablo y Paula, por
estos estupendos cuatro años, por su gran calidad humana y científica y por el apoyo y
la ayuda prestada.
A Julia Weiss, Alfredo Palop, Yvan Le Marc y Jullien Brillard por su
inestimable y enriquecedora colaboración.
A Marcos Egea, Mariano Otón, Perla Gómez y José Fermín Moreno por su
profesionalidad e interés.
A Carmen Pin y Frederick Carlin por ayudarme a conocer la investigación y la
cultura de otros países europeos.
Al Ministerio de Educación y Ciencia que ha financiado esta investigación a
través del proyecto AGL2006-13320-C03-02/ALI, así como a la Escuela Técnica
Superior de Ingenieros Agrónomos y al Instituto de Biotecnología Vegetal por el
equipamiento y los medios materiales prestados.
A Dolo por sus buenas ideas. Gracias, sin ti no existiría esta tesis.
A Mª Jesús Periago Castón y Mamen Matínez Gracia por su amabilidad y ayuda
desinteresada.
A May, por montones de horas de laboratorio codo a codo. A Izaskun por tantas
respuestas a tantas preguntas. A Steph, por haber conseguido que creyera más en mí.
Gracias chicas, estáis presentes en las páginas de esta tesis.
A Mª Dolores, Juan Pablo, Leymaya, Raquel, Marina, Marta y María por los
inóculos en domingo, por los buenos consejos y los buenos ratos, por ser los mejores
compañeros del mundo.
A todos mis amigos por hacer un poquito mejor cada día. A la Comunidad del
añillo, a Micol, Alicia, Ana y Nuria por los buenos ratos, los pasados y los que vendrán.
A los Garrandos, los Antonios y las Perinas por toda una vida. A mis medias naranjas,
Trini, Olga, Diana, Fuen, Ana Gil, Sol y María por su fuerza, por ser tan especiales cada
una a su manera, por estar siempre ahí, siempre juntas.
A Eva, Sole, Luis, Antoñita y a toda mi familia por su calor.
A mi abuela Paca, por su cocido y su arroz con conejo, por ilusionarse con “el
libro” de una manera tan conmovedora y sobre todo por su fe incondicional en mí.
A mi Dani, mi pequeño, por estar convirtiéndose en un hombre estupendo.
A Fernando por mirar de frente la vida, con valentía y determinación, por su
honestidad y su libertad, por elegir caminar a mi lado. No sueltes nunca mi mano.
A MIS PADRES, por su dedicación y apoyo, por su generosidad. Por ser como
son. Os admiro. Gracias, mil gracias por haberme ayudado a llegar hasta aquí, POR
TODO. Esta tesis también es vuestra.
Summary
i
Bacillus cereus group species range high in economical and medical
importance. Among all of them, Bacillus cereus sensu stricto is the causative agent of
gastrointestinal diseases and Bacillus weihenstephanensis is a psychrotrophic species
able to grow in the range of 4-7ºC. Both species are also recognized as spoilage
bacteria causing economic losses.
Due to their ability to form highly resistant spores, these microorganisms may
persist in the food environment and contaminate mildly heat treated products.
Moreover, psychrotrophic and some mesophilic strains have been isolated from
chilled foodstuffs.
On this ground, to contribute to improve food preservation systems that ensure
microbiological quality, the major aim of the present thesis was to study the impact of
relevant environmental factors, commonly referred to as hurdles, on the ability to
survive and grow of different species of B. cereus group and to assess novel methods
for fast and reliable identification of these microorganisms as well as to test the
feasibility of techniques used in viability studies at single cell level.
Ready to eat vegetable foods are widely consumed in industrialized countries
due to their tasty, healthy and wholesome attributes. However, B. cereus strains have
been previously isolated from these mildly preserved foods. To contribute to the
optimization of ready to eat vegetable foods processing, in Chapter 3 the effect of
heating medium on B. cereus spores heat resistance was assessed in sterile distilled
water and different vegetable substrates. It was shown that at higher (105ºC) and
lower temperatures (90ºC) the heating medium had a stronger influence on B. cereus
heat resistance, indicating that there was not a clear trend in this respect. This effect
appeared to be more correlated with the pH of the menstruum than with food
composition. Besides, the presence and extension of shoulders, and their impact on
pasteurization processes were analyzed by fitting isothermal survival curves to two

Summary
ii
different non log-linear models (Weibull and Geeraerd) to compare them with the
classical log-linear regression. Root mean square error values revealed that heat
inactivation of B. cereus spores was more accurately characterized by Weibulls’ and
Geeraerds’ methods. Therefore, we proposed that non log-linear models should be
implemented to prevent overlay conservative heat treatments and subsequent
decrease of food quality, as well as to reduce energy requirements.
After characterization of B. cereus spores heat resistance, the effect of
modified atmospheres in combination with mild and severe heat treatments was also
studied in Chapter 3. For this purpose, additionally to anaerobic environments,
oxygen limitation conditions, obtained by using two different packaging films with
different oxygen transfer rates (35cm3/m2/24h and 10-3 cm3/m2/24h), were used to
assess the growth of B. cereus spores in broth and in a vegetable substrate. We
observed that although this microorganism efficiently adapts to oxygen limitation, the
extent of lag phase increased. Besides, a faster growth was observed in broth than in
vegetable products. Likewise, samples exposed to low oxygen restriction
(35cm3/m2/24h) also showed a faster growth. Notably, no significant differences on
the time to reach 106 CFU/mL were found between food samples subjected to
anaerobic environment and to the lowest oxygen transfer rates (10-3 cm3/m2/24h).
Chapter 4 focused on the relevance of B. cereus in the egg industry. Spores
and vegetative cells of this microorganism have been isolated from eggs and their
products. To avoid coagulation, liquid egg undergoes mild heat treatments and
subsequently is stored under refrigeration. Recent studies pointed to mildly treated
products stored at low temperature as an appropriate niche for B. cereus
psychrotrophic and mesophilic strains able to grow below 10ºC. With the major aim
to contribute to liquid egg preservation and risk management levels, the effect of
antimicrobial compounds, nisin and lysozyme, combined with mild heat treatments
on growth of B. cereus vegetative cells was evaluated in culture medium and liquid
Summary
iii
egg, at different incubation temperatures. Growth of B. cereus cells subjected to these
conditions was measured using an individual-based approach of growth through
optical density measurements. From growth curves obtained, lag phase and maximum
specific growth rate (μmax) were determined, histograms of the lag phase were
generated and distributions were fitted. Normal and Weibull distributions were
ranked as the best fit distributions in experiments performed at 25 and 16ºC. Finally,
a Monte Carlo simulation was carried out to predict the time of growth to a certain
microbial concentration in order to generate probabilistic information that allows to
compare the growth curves obtained with the food model. These probabilistic
predictions can be considered as an initial indication to establish the level of risk
associated to liquid egg. Nevertheless, as with any predictive model, we need further
tests in real conditions before transferring these results to the industry.
Another relevant environmental factor for food preservation is water activity.
In Chapter 5 of this thesis the effects of temperature and water activity downshifts on
the lag time of B. weihenstephanensis and the dependence of μmax on the growth
conditions (temperature and water activity) were modelled through the dependence of
the parameter h0 (“work to be done” prior to growth), on the magnitude of the shift
and the stringency of the new environmental conditions evaluated. We observed that
temperature shifts were able to induce considerable lag times (up to 20 days) near
boundary growth. Meanwhile, water activity shifts within the range studied had less
significant effects. Furthermore, the predictive ability of the combined model (h0 and
μmax) was assessed in carrot soup and ready meal products and was found to correctly
predict B. weihenstephanensis growth in broth and creamed pasta (rich substrates).
On the grounds of our results, we suggest that this model can be used to improve
predictions of B. weihenstephanensis growth in dynamic conditions, which can be
useful for Hazard Analysis and Critical Control Points (HACCP) and Microbial Risk
assessment purposes.
Summary
iv
Chapter 6 addresses the effect of acid stress on cell viability of B. cereus and
B. weihenstephanensis using flow cytometry combined with fluorescent labelling.
Flow cytometry is a cell analysis technology which provides multi-information about
cell cultures at single cell level by multiparametric analysis of intrinsic and/or
extrinsic cell parameters based on light-scattering and fluorescent signals. Suitability
of differential staining of both strains with propidium iodide, for membrane
evaluation, and carboxyfluorescein diacetate, for esterase activity detection, was
assessed. The pH values, selected on the basis of previous screening tests, were in the
boundary of growth and in the range of acid levels in gastrointestinal tract. Flow
cytometry results showed it clearly discriminates between different populations,
viable and damaged cells, leading to successful assessment of acid stress effect on B.
cereus and B. weihenstephanensis vegetative cells viability. Feasibility of flow
cytometry analysis for detection of B. cereus and B. weihenstephanensis vegetative
cells was compared with viable plate count. We showed that results obtained were not
comparable and classical analytical methods showed higher reliability. However, it is
important to note that flow cytometry analysis provides information of individual
microorganisms at real time accomplishing the need for development of valid
methods that allow the integration of physiological and molecular data at the single-
cell level to predict, accurately, the behavior of microorganisms.
A multivariable approach was performed in Chapter 7 to classify further B.
cereus group species and strains. Previous studies, based on phenotypic and genetic
characteristics such as the ribosomal genes sequences and the pantothenate β-alanine
ligase (panC) gene sequence, have reported the existence of an ecotypic structure
within B. cereus group populations. This structure, which consists of seven major
phylogenetic groups (I-VII) that show specifics “thermotypes” and virulence
potentials, presents practical interest for food industry as a valid tool for process
optimization through establishing appropriate environmental conditions along
production lines depending on the risk level associated to contamination with specific
Summary
v
strains of this taxonomic cluster. For this purpose different B. cereus sensu stricto
strains related to food poisoning from the Spanish Type Culture Collection (Valencia)
were selected. Homology studies of panC gene sequence revealed that all
microorganisms tested belonged to the same phylogenetic cluster, group IV, which
includes mesophilic bacteria considered cytotoxic or highly cytotoxic. To assess the
ability of this classification as a valuable tool to manage and classify B. cereus group
isolates in food processing environments, heat resistance experiments were
performed. Results showed variability among all the B. cereus strains tested.
On the basis of these results, and given that there is a need for a reliable
method to successfully identify B. cereus group isolates, sensitive and fast techniques
to differentiate these microorganisms at species or even strain level were assessed. In
this sense, single nucleotide polymorphisms (SNP), one of the most common genetic
variations, may be useful. Thus, from B. cereus genomic sequences previously
reported by different authors and using bioinformatics tools, three different
polymorphic regions related with the RNAr operon were identified. The feasibility of
genotyping by single nucleotide polymorphisms detection via high resolution melting
analysis was examined. High resolution melting analysis of amplified polymorphic
16S-23 intergenic spacer region proved to be discriminatory for B. cereus sensu
stricto strain typing, while two other polymorphic regions within the bacterial rRNA
operon allowed differentiation between B. cereus, B. weihenstephanensis and
Bacillus thuringiensis, demonstrating its applicability for discrimination on the
species and strain level within B. cereus group.
Finally, in Chapter 8, the involvement of the YhcYZ two-component system
during growth at low temperature in various B. cereus group isolates was studied. As
we commented previously, the adaptation of B. cereus group species to cold
temperatures nowadays is a major concern in order to prevent spoilage and health risk
for consumers. On the basis of previous transcriptomics studies of B. cereus ATCC
Summary
vi
14579 grown at different temperatures, BC2216 and BC2217 genes encoding the
sensor and the regulatory domain of YhcYZ two-component system were found to be
overexpressed at low temperature and therefore have been related with B. cereus cold
phenotypes. This chapter provides a preliminary approach by performing isogenic
mutants of the BC2216 and BC2217 genes of B. cereus ATCC 14579, B. cereus AH
187 and B. thuringiensis Bt407. Phenotypic characterization revealed that at 12ºC B.
cereus ATCC 14759 BC2216-17 knockout strains showed a slight but highly
reproducible impaired growth, meanwhile B. thuringiensis Bt407 and B. cereus AH
187 BC2216-17 null mutants did not show a clear cold phenotype. This
heterogeneous response to BC2216-17 mutation may suggest that cold response
varies among B. cereus group isolates. Nevertheless, more strains should be tested
before obtaining a reliable conclusion. In parallel, different protocols to improve
transformation efficiency of B. cereus group species were tested. Previously, it has
been proposed that strain-specific in vitro methylation is a valid method to protect
plasmidic DNA from bacterial DNA restriction and modification mechanisms. Unlike
previous studies, in vitro method for strain-specific methylation of plasmid DNA did
not enhance transformation of these microorganisms. However, it is noteworthy that,
besides different B. cereus and B. thuringiensis mesophilic strains, two
psychrotrophic strains, Bacillus weihenstephanensis WSBC 10688 and Bacillus
mycoides DSM 2048, were successfully transformed.
Resumen
vii
Los microorganismos pertenecientes al grupo Bacillus cereus poseen
importancia económica y para la salud pública. De entre todos ellos, Bacillus cereus
sensu stricto es el agente causal de enfermedades gastrointestinales y Bacillus
weihenstephanensis es una especie psicrótrofa capaz de crecer a temperaturas entre 4
y 7ºC. Además, ambos son responsables de pérdidas económicas relevantes derivadas
del deterioro de alimentos.
Debido a su habilidad para formar endosporos altamente resistentes, estas
especies son capaces de persistir en ambientes de producción de alimentos,
contaminando aquellos productos que han sufrido un tratamiento térmico moderado.
Además, se han aislado cepas psicrótrofas y algunas mesófílas a partir de alimentos
refrigerados.
En este contexto y con el fin de contribuir a la mejora de los sistemas de
conservación de alimentos, lo que asegura la calidad microbiológica de los mismos,
el objetivo principal de la presente tesis ha sido el estudio del impacto de factores
ambientales relevantes, comúnmente denominados como barreras, en la
supervivencia y el crecimiento de diferentes especies del grupo B. cereus. Así mismo,
se han realizado estudios centrados en la evaluación de la idoneidad de métodos de
identificación rápida de dichos microorganismos y de la fiabilidad de técnicas que
permitan estudios de viabilidad bacteriana a nivel de células individuales.
Los alimentos vegetales listos para consumir son altamente demandados en
los países industrializados ya que, debido a su conservación mediante tratamientos
térmicos moderados, mantienen una alta calidad sensorial y nutricional. Sin embargo,
este procesado facilita la persistencia de los microorganismos esporulados y se han
aislado diversas cepas de B. cereus a partir de estos productos. Con el fin de
contribuir a la optimización de los métodos de conservación de dichos alimentos
vegetales, en el Capítulo 3 se evaluó el efecto del medio de calentamiento en la
Resumen
viii
termorresistencia de los esporos de B. cereus en agua destilada y en diferentes
sustratos vegetales. Se observó que a altas (105ºC) y bajas (90ºC) temperaturas, el
medio de calentamiento poseía una mayor influencia en la resistencia térmica de B.
cereus. Este efecto parecía estar más correlacionado con el pH del medio que con la
composición del alimento. Además, se analizó la presencia y longitud de los hombros
de activación, así como su impacto en la evaluación del proceso de pasteurización
mediante el ajuste de las curvas isotérmicas de supervivencia a dos tipos de modelos
no lineales (Weibull y Geeraerd) para, posteriormente compararlo con el modelo de
regresión lineal clásico. Los valores de la raíz cuadrada del error cuadrático medio
(RSME) revelaron que la inactivación de esporos de B. cereus se caracterizó de un
modo más exacto mediante los modelos de Weibull y Geeraerd. En virtud de estos
resultados, proponemos que dichos modelos no lineales debieran ser implementados
en la industria con el fin de prevenir tratamientos térmicos excesivamente
conservativos que disminuyen la calidad de los alimentos y generan un gasto
innecesario de energía.
Seguidamente, como parte concluyente del Capítulo 3, se estudió el efecto de
las atmósferas modificadas en combinación con tratamientos térmicos (moderados y
severos) con el fin de evaluar su impacto en la conservación de alimentos de origen
vegetal. Para tal fin, además de investigar el efecto de ambientes anaeróbicos en el
crecimiento de B. cereus en medio de cultivo y en substrato vegetal, los
microorganismos se expusieron a condiciones con presencia de oxígeno controlada
mediante el uso de dos films de embalaje que presentaban diferentes tasas de
transferencia de oxígeno (35cm3/m2/24h y 10-3 cm3/m2/24h). Los resultados
mostraron que, aunque los esporos bacterianos se adaptaban eficientemente a
ambientes con presencia de oxígeno limitada, la longitud de la fase de latencia
aumentaba en algunos casos. Además, se observó que B. cereus crecía más rápido en
caldo de cultivo que en el sustrato vegetal. Finalmente, los microorganismos
expuestos a menores restricciones de oxígeno (35cm3/m2/24h) mostraron un
Resumen
ix
crecimiento más rápido. Es de interés resaltar que no se encontraron diferencias en el
tiempo necesario para alcanzar 106 CFU/mL entre las muestras de alimentos sujetas a
ambientes anaeróbicos y aquellas expuestas a la tasa de transferencias de oxígeno
más baja (10-3 cm3/m2/24h).
Por otra parte, la presencia de células vegetativas y esporos de B. cereus en el
huevo y sus derivados es un hecho conocido. Para evitar que coagule durante su
procesado, el huevo líquido es sometido a tratamientos térmicos moderados y,
posteriormente, se almacena y distribuye en refrigeración. Estudios recientes han
señalado a los productos tratados con calor moderado y conservados a bajas
temperaturas como un posible nicho para cepas psicrótrofas y mesófílas del grupo B.
cereus capaces de crecer por debajo de10ºC. Con el fin de contribuir a la mejora de
los sistemas de conservación de estos alimentos y a la Evaluación de Riesgos
asociada a su producción, en el Capítulo 4 se estudió en medio de cultivo y en huevo
líquido el efecto de dos compuestos antimicrobianos (nisina y lisozima) combinados
con tratamientos térmicos moderados sobre el crecimiento de células vegetativas de
B. cereus incubadas a diferentes temperaturas. El crecimiento bacteriano se evaluó a
nivel de células individuales mediante métodos basados en diluciones seriadas y
mediciones automatizadas por densidad óptica. A partir de las curvas de crecimiento
obtenidas se determinó la fase de latencia (λ) y la máxima tasa específica de
crecimiento (μmax). Así mismo, se realizaron histogramas de la fase de latencia para el
estudio de su distribución de frecuencias utilizando distintos modelos. Los resultados
mostraron que las distribuciones de Weibull y Normal presentaron un mejor ajuste
para los datos obtenidos a 25 y 16ºC. Finalmente, con el fin de generar información
probabilística que permitiera comparar las curvas de crecimiento obtenidas con el
modelo en alimento, se realizó una simulación de Monte Carlo capaz de predecir el
tiempo necesario para alcanzar una determinada concentración microbiana. Estas
predicciones resultaron ser orientativas a la hora de establecer el nivel de riesgo
asociado al consumo de huevo líquido. No obstante, y como sucede con cualquier

Resumen
x
modelo predictivo, es necesario realizar nuevos ensayos en condiciones reales antes
de trasladar los resultados a la industria.
Otro factor ambiental relevante para la conservación de alimentos es la
actividad de agua. En el Capítulo 5 de la presente tesis, se modelizaron los efectos de
los cambios de temperatura y de la actividad de agua en la duración de la fase de
latencia de B. weihenstephanensis, así como la dependencia de μmax de las
condiciones de crecimiento (temperatura y actividad de agua) a partir del parámetro
h0 (“trabajo por hacer”) inducido por la magnitud del cambio y el rigor de las nuevas
condiciones ambientales. Los resultados de los experimentos llevados a cabo en
medio de cultivo indicaron que cuando los cambios de temperatura sucedían cerca del
límite de crecimiento, la duración de la fase de latencia aumentaba considerablemente
(más de 20 días). Mientras tanto, modificaciones de los valores de actividad de agua
del medio de crecimiento presentaron efectos menos significativos en el crecimiento
de B. weihenstephanensis. Así mismo, se propuso un modelo dinámico capaz de
realizar una adecuada descripción de los datos experimentales. Finalmente, la
habilidad predictiva del modelo en condiciones reales (h0 and μmax) se evaluó en puré
de zanahoria y en productos listos para consumir. Se observó que el modelo predecía
correctamente el crecimiento de B. weihenstephanensis en caldo de cultivo y en salsa
realizada a base de nata (sustratos ricos en nutrientes), mientras que dio lugar a una
predicción errónea segura (fail safe) en zanahoria, un sustrato más pobre. A partir de
estas observaciones, se sugirió que dicho modelo podía emplearse para mejorar las
predicciones sobre el crecimiento de B. weihenestephanesis en condiciones
dinámicas, y en consecuencia ser de utilidad en la implantación del Análisis de
Peligros y Puntos de Control Crítico (APPCC) así como para su integración en la
Evaluación de Riesgos microbianos (Risk assessment).
Por otro lado, el Capítulo 6 se ocupó del estudio del efecto de medios ácidos
en la viabilidad de células vegetativas de B. cereus y B. weihenstephanensis mediante

Resumen
xi
el uso de citometría de flujo combinada con marcaje celular fluorescente. La
citometría de flujo es una tecnología ampliamente conocida que permite obtener
información a nivel de células individuales a partir de cultivos celulares mediante un
análisis multiparamétrico basado en la dispersión de señales luminosas y
fluorescentes. Para tal fin, y basándose en estudios previos, se realizó una selección
de diversos valores de pH que revelaron ser capaces de alterar e incluso inhibir el
crecimiento de ambas bacterias. Posteriormente, las células microbianas expuestas a
pHs ácidos fueron teñidas diferencialmente con yoduro de propidio, un agente
intercalante que permite evaluar daños en la membrana plasmática, y diacetato de
carboxifluoresceína, un compuesto capaz de difundir hasta el interior celular y emitir
fluorescencia verde indicando la existencia de actividad esterasa inespecífica en
células viables. Los resultados mostraron que esta metodología era adecuada para
discriminar entre poblaciones de células dañadas y viables de B. cereus y B.
weihenstephanensis, permitiendo el estudio del efecto del estrés ácido en la viabilidad
de células vegetativas de estas especies. Adicionalmente, se analizó en profundidad la
robustez de dicha metodología realizando paralelamente recuentos en placa de células
viables. En concordancia con estudios previos se observó que los resultados
obtenidos mediante ambas técnicas no eran comparables y que pueden proporcionar
información complementaria. Así mismo, el método clásico mostró una mayor
exactitud y fiabilidad. Sin embargo, es importante tener en cuenta que la citometría
de flujo permite obtener información en tiempo real y a nivel de células individuales,
dando respuesta a la necesidad de desarrollar nuevos métodos válidos para la
integración de datos fisiológicos y moleculares que permitan predecir de un modo
más exacto el comportamiento de los microorganismos.
Seguidamente, en el Capítulo 7 se realizó un enfoque multivariable cuyo
principal objetivo consistió en evaluar la idoneidad y robustez de diversos métodos
para la tipificación de microorganismos pertenecientes al grupo B. cereus. Estudios
Resumen
xii
previos han demostrado la existencia de una estructura ecotípica en las poblaciones
del grupo B. cereus en base a características fenotípicas y genéticas tales como la
secuencia de los genes ribosomales y la secuencia del gen pantotenato β-alanina
ligasa (panC). Dicha estructura se compone de siete grupos filogenéticos (I-VII)
principales. Los microorganismos pertenecientes a cada uno de ellos poseen un
termotipo y virulencia común. En consecuencia, resulta de gran interés evaluar la
aplicabilidad de dicha clasificación filogenética como una herramienta válida para la
optimización de procesos en la industria alimentaria. Para tal fin, se seleccionó un
conjunto de cepas de B. cereus sensu stricto pertenecientes a la Colección Española
de Cultivos Tipo (Valencia) y se realizaron estudios de homología de la secuencia del
gen panC. Los resultados revelaron que todos los microorganismos analizados
pertenecían al clúster filogenético IV, el cual incluye a bacterias mesófilas capaces de
producir brotes alimentarios que cursan principalmente con diarrea. La
termorresistencia de dichos microorganismos fue evaluada, y los resultados
mostraron variabilidad entre las cepas.
A partir de estas observaciones y teniendo en cuenta la carencia de métodos
efectivos para la correcta identificación de las cepas y especies pertenecientes al
grupo B. cereus, se evidencia la necesidad de estudiar nuevas técnicas rápidas y
robustas que permitan tipificar dichos microorganismos. En este sentido, los
polimorfismos de nucleótido simple (SNP), que constituyen una de los tipos de
variaciones genéticas más comunes, pueden ser de gran utilidad. Así pues, mediante
herramientas informáticas y a partir de la secuencia genómica de diversas cepas de B.
cereus, se identificaron zonas polimórficas en el operón de ARNr susceptibles de ser
utilizadas para el genotipado de los microorganismos de interés. Finalmente, se
evaluó la idoneidad de la detección de dichos SNPs mediante análisis de curvas de
fusión de alta resolución (HRM). El análisis de HRM de los productos de
amplificación de las zonas polimórficas localizadas en la región intergénica 16S-23S
ARNr resultó ser capaz de discriminar entre cepas de B. cereus sensu stricto.
Resumen
xiii
Mientras tanto, el análisis de los productos de amplificación de otras dos regiones
polimórficas localizadas en el operon de ARNr permitieron la diferenciación entre B.
cereus, B. weihenstephaneneis and Bacillus thuringiensis, demostrando la
aplicabilidad de esta técnica para la discriminación entre especies y cepas dentro del
grupo B. cereus.
Como ya hemos mencionado con anterioridad en diversos capítulos de esta
tesis, la adaptación al frío de los microorganismos pertenecientes al grupo B. cereus
es de gran interés. Recientemente, análisis transcriptómicos de células de B. cereus
ATCC 14579 sometidas a diferentes temperaturas han permitido identificar genes
involucrados en la adaptación de esta bacteria al frío. Los resultados indicaron que el
sistema de dos componentes YhcYZ era sobreexpresado a bajas temperaturas. Dicho
sistema, compuesto por una proteína sensora (YhcY) y un regulador de la
transcripción (YhcZ), está codificado por los genes BC2216 y BC2217,
respectivamente. Por ello, finalmente, en el Capítulo 8 se realizó un estudio
preliminar de la participación del sistema de dos componentes YhcYZ en la
capacidad de crecimiento a bajas temperaturas de varias cepas del grupo B. cereus.
Así pues, se llevó a cabo la construcción de mutantes isogénicos para los genes
BC2216 y BC2217 de B. cereus ATCC 14579, B. cereus AH 187 y B. thuringiensis
Bt407. Su caracterización fenotípica reveló que a 12ºC los mutantes de B. cereus
ATCC 14579 mostraban un leve retraso en su crecimiento respecto a la cepa salvaje,
que resultó ser altamente reproducible, mientras que los mutantes BC2216-17 de B.
thuringiensis Bt407 y B. cereus AH 187 no presentaron un fenotipo claramente
afectado por las bajas temperaturas. Esta heterogénea respuesta a la mutanción de los
genes BC2216 y BC2217 sugiere que la respuesta al frío varía entre las cepas
pertenecientes al grupo B. cereus. En cualquier caso, es necesario estudiar un número
mayor de cepas para obtener resultados concluyentes. Además y en paralelo, en el
Capítulo 8 se llevó a cabo la evaluación de distintos protocolos destinados a mejorar
la eficiencia de la transformación de especies pertenecientes al grupo B. cereus. La

Resumen
xiv
metilación in vitro específica de cepa ha demostrado proteger el DNA plasmídico de
la acción de los mecanismos bacterianos de restricción y modificación del DNA. A
diferencia de estudios previos, los métodos de metilación in vitro de ADN plasmídico
no mostraron potenciar las tasas de transformación de estos microorganismos. Sin
embargo, es interesante destacar que, aparte de diversas cepas mesofílicas (B. cereus
y B. thuringiensis), dos cepas psicrófilas, Bacillus weihenstephanensis WSBC 10688
y Bacillus mycoides DSM 2048, pudieron ser transformadas exitosamente.

Contents
xv
Page
SUMMARY i
RESUME vii
COTETS xv
CHAPTER 1. Aim and impact of the thesis
Abstract 1
1.1. Relevance and appropriateness of the research 3
1.2. Objetives 5
1.3. Thesis outline 8
CHAPTER 2. Introduction
Abstract 9
2.1. Bacillus cereus group 11
2.1.1.Taxonomy 12
2.1.2. Foodborne disease and nongastrointestinal infections 14
2.1.3. Pathogenicity factors 16
2.1.3.1. Cytotoxins associated to diarrhoeal syndrome 16
2.1.3.2. Emetic toxin 19
2.1.4. Ecological diversification of B. cereus group 20
2.1.5. B. cereus group importance in food processing
environments
24
2.1.6. Epidemiology 26
Contents
xvi
2.2. Stress response in B. cereus group microorganisms 30
2.2.1. General stress response 30
2.2.2. Two-component systems 34
2.2.3. SOS response and adaptive mutagenesis 36
2.3. Predictive microbiology 38
2.3.1. Lag phase and exponential growth 38
2.3.2. Modelling 40
2.3.3. HACCP and Risk assessment 44
2.4. Food preservation 46
2.4.1. Hurdle technology and gamma hypothesis 47
2.4.2. Relevant factors for food preservation 48
2.4.2.1. Temperature 49
2.4.2.2. pH 50
2.4.2.3. Water activity 51
2.4.2.4. Oxygen availability 52
2.5. Method for B. cereus group identification 53
2.6. Flow cytometry analysis 55
CHAPTER 3. Survival of heat treated Bacillus cereus spores in
vegetable puree under oxygen limitation conditions
Abstract 59
3.1. Introduction 61
3.2. Materials and methods 64
3.2.1. Microorganisms 64
3.2.2. Food substrates for heat resistance studies 65
3.2.3. Heat treatments 66

Contents
xvii
3.2.4. Incubation and enumeration of survivors after heat
treatments
68
3.2.5. Data analysis 68
3.2.6. Heat treatment before exposure to modified atmosphere 71
3.2.7. Anaerobic packaging 71
3.2.8. Assessment of oxygen availability impact during
incubation
74
3.3. Results and disscusion 74
3.3.1. Effect of heating medium on heat resistance of B. cereus
under isothermal conditions
74
3.3.2. Comparison of log-linear vs. non-log-linear kinetics to
describe survivor curves
77
3.3.3. Combined effect of heat treatment and modified
atmosphere on B. cereus growth
78
CHAPTER 4. Combined effect of lysozyme and nisin at different
incubation temperatures and mild heat treatment on the probability
of time to growth of Bacillus cereus
Abstract 85
4.1. Introduction 87
4.2. Materials and methods 92
4.2.1. Bacterial strain 92
4.2.2. Food product preparation 92
4.2.3. Chemicals 93
4.2.4. Optical density calibration curves 93
4.2.5. Growth curves and determination of the lag phase 93
Contents
xviii
4.2.6. Heat resistance determination of vegetative cells B. cereus
in liquid egg
94
4.2.7. Combined effect of heat, nisin and lysozyme on B. cereus
in liquid egg
95
4.2.8. Statistical data processing, distribution fitting and Monte
Carlo Analysis
95
4.3. Results and disscusion 96
4.3.1. Effect of individual and combined stress on the biological
parameters
96
4.3.2. Effect on distribution fitting 99
4.3.3. Heat resistance of B. cereus vegetative cells in
liquid egg
101
4.3.4. Effect of antimicrobial compounds on the viability of
B. cereus in liquid egg
101
4.3.5. Monte Carlo simulation to estimate time to a
certain growth
103
CHAPTER 5. Modelling the effects of temperature and osmotic shifts
on the growth kinetics of Bacillus weihenstephanensis in broth and
food products
Abstract 105
5.1. Introduction 107
5.2. Materials and methods 110
5.2.1. Bacterial strain and inoculum preparation 110
5.2.2. Previous growth conditions and shifts to final growth
conditions
110
5.2.3. Measurement methods of exponentially populations growth
after aw and temperature shifts
111

Contents
xix
5.2.4. Determination of growth parameters during final conditions 112
5.2.5. Growth rate and h0 model 113
5.2.6. Validation of the experimental model for bacterial
population subjected to sudden temperature shifts.
113
5.3. Results and disscusion 115
5.3.1. Effects of shifts on the growth model parameters 115
5.3.2. Model validation 119
CHAPTER 6. Determination of the effect of acid stress on growth and
viability of Bacillus cereus and Bacillus weihenstephanensis using flow
cytometry
Abstract 125
6.1. Introduction 127
6.2. Materials and methods 130
6.2.1. Bacterial strains 130
6.2.2. Study of low pH effect on B. cereus and
B. weihenstephanensis grown
131
6.2.3. Acid stress treatment 131
6.2.4. Culturability evaluation by plate counts 131
6.2.5. Flourescent reported dyes 132
6.2.6. Flow cytometry measurement 132
6.2.7. Flow cytometry controls 133
6.2.8. Data analysis of flow cytometry 133
6.3. Results and disscusion 133
6.3.1. Effect of acid environment on B. cereus and
B. weihenstephanensis growth
133
Contents
xx
6.3.2. Effect of acid environment on B. cereus and
B. weihenstephanensis viability
136
CHAPTER 7. Development of a high resolution melting-based
approach for efficient differentiation among Bacillus cereus group
isolates
Abstract 149
7.1. Introduction 151
7.2. Materials and methods 154
7.2.1. Bacterial strains and growth conditions 154
7.2.2. DNA extraction 155
7.2.3. panC amplification and sequencing 155
7.2.4. Phylogenetic analysis and affiliation to B. cereus group 156
7.2.5. Heat resistance determination of B. cereus sensu stricto
spores
157
7.2.6. Identification of highly polymorphic genomic regions and
primer design
158
7.2.7. Amplification of polymorphic region by conventional and
real-time PCR
158
7.2.8. High resolution melting of polymorphic regions 159
7.3. Results and disscusion 160
7.3.1. panC gene sequence affiliation 160
7.3.2. Heat inactivation of B. cereus strains affiliated to group IV 160
7.3.3. Phylogenetic analysis of panC gene 164
7.3.4. Primer design for single nucleotide polymorphism analysis 166
7.3.5. 16S-23S intergenic spacer region PCR and in silico PCR 170

Contents
xxi
7.3.6. Evaluation of Tm profiles for strain and species
discrimination
172
7.3.7. Evaluation of high resolution melting analysis for species
genotyping
172
7.3.8. Evaluation of high resolution melting analysis for strain
genotyping
175
CHAPTER 8. Involvement of the YhcYZ two-component system
during growth at low temperature in various Bacillus cereus strains
Abstract 177
8.1. Introduction 179
8.2. Materials and methods 182
8.2.1. Strains and plasmids 182
8.2.2. Bacterial extract preparation 184
8.2.3. Treatment of plasmid DNA with CFE of the corresponding
recipient B. cereus group strain
185
8.2.4. Transformation of B. cereus group strains 186
8.2.5. DNA manipulation 187
8.2.6. Gene disruption in B. cereus group strains using pMAD
∆2216-17
187
8.2.7. Phenotypic characterization of knockout mutants 190
8.3. Results and disscusion 190
8.3.1. Effect of in vitro plasmid methylation on the
efficiency of B. cereus group strains transformation
190
8.3.2. Construction and characterization of BC2216 and
BC2217 knockout mutants
193

Contents
xxii
8.3.3. Phenotypic characterization of the BC2216 and BC2217
knockout mutants
196
CHAPTER 9. Main scientific conclusions of the work 203
CHAPTER 10. References 209

Aim and impact
1
CHAPTER 1
Aim and impact of the thesis
Abstract
Bacteria are present in almost all foodstuffs determining their safety and shelf life.
Depending on several factors such as processing, preservation techniques and storage
conditions different microorganisms can be present in food. Among all of them,
Bacillus cereus group species, which may cause spoilage and gastrointestinal diseases,
are commonly isolated from different products due to their metabolic diversity and their
ability to form highly resistant endospores. Members of this group have been reported
to contaminate a large number of sources including raw, manufactured, refrigerated and
dehydrated foods as well as from hot dairy equipment and industrial surfaces. In recent
years, the development and implementation of consumer driven mild preservation
techniques have become more popular in order to minimize the damage of the sensorial
and nutritional properties of the food. However, this may further enhance the spore
survival, and thus the persistence of spore formers in food production environments.
Besides, recent studies pointed to mildly treated products stored at low temperature as
an appropriate niche for B. cereus psychrotrophic strains and mesophilic strains able to
grow below 10ºC. On this ground, and with the major aim to contribute to improve food
preservation systems that ensure microbiological quality and avoid economical losses
derived from spoilage, the present thesis deals with the study of the impact of relevant
environmental factors, commonly referred as hurdles, on the survival and grow of
different species of B. cereus group, as well as with the assessment of feasibility of
novel methods for genotyping and for viability studies at single cell level.
1
11110000
9
8
7
6
5
4
3
2
1

Aim and impact
2
10
9
8
7
6
5
4
3
2

Aim and impact
3
1.1. Relevance and appropriateness of the research
Microorganisms belonging to B. cereus group show a great metabolic diversity
and are able to form adhesive endospores highly resistant to heat, dehydration,
chemicals and other environmental stresses. In consequence, these bacteria can colonize
a wide variety of habitats with growth temperatures ranging from 4º to 50ºC
(Guinebretière et al., 2008).
Due to their physiological and ecological characteristics, B. cereus group strains
are commonly present in food production environments causing food-borne diseases
and food spoilage (Kotiranta et al., 2000; Stenfors Arnesen et al., 2008; Jan et al.,
2011). Notably, two species of the group are of main concern in this thesis due to their
particular relevance in the food microbiology field. On one hand, Bacillus cereus sensu
stricto, which has been identified as causative agent of two foodborne diseases, the
emetic and the diarrheal syndromes (Kotiranta et al., 2000), and on the other hand,
Bacillus weihenstephanensis, a common and ubiquitous spoilage microorganism
characterized by its ability to grow below 7ºC but not at 43ºC and whose pathogenic
potential remains uncertain (Lechner et al., 1998; Stenfors Arnesen et al., 2008).
In the last decades, in order to overcome changing needs and consumer
preferences, ready to eat foods as well as those processed or cooked chilled or
refrigerated processed foods of extended durability (REPFEDs) have been incorporated
to our daily life (Nissen et al., 2002) because, despite to be safe, these products show
high organoleptic and nutritional quality. A rapid rise in the demand of these products
has been observed in industrialized countries. These modern trends in food consumption
have been linked to social changes such as the consumers' perception of food quality
and nutrition (Rajkovic et al., 2010).
To minimize degradation of the sensorial, textural and nutritional quality,
REPFEDs undergo relatively mild heat processing (typically pasteurization)
(Samapundo et al., 2011). These treatments can lead to the persistence of bacterial
spores in food environments due to incomplete inactivation and sub-lethal damage of
the target microorganisms (Kotiranta et al., 2000). In addition, “modern large-scale food
production technology that relies on refrigeration as a means of conservation, has
Aim and impact
4
selected bacteria that are not very competitive, but that can survive heat treatment and
also grow at low temperatures” (Stenfors Arnesen et al., 2008).
The adaptive faculty of B. cereus group together with the creation of new
ecologic niches derived from changing environment should be taken into account since
new evolutionary lines of these species might develop and contribute to the survival and
pathogenicity of these microorganisms. In fact, changing lifestyles and eating habits
have been associated to the increasing number of foodborne illness caused by B. cereus
in industrial world (Ehling-Schulz et al., 2004). In the reports of food-borne outbreaks
in the European Union (EU) of 2007 and 2009 (EFSA, 2009; EFSA, 2011), the
European Food Safety Authority (EFSA) and European Centre for Disease Control and
Prevention (ECDC) indicated that during this period the total number of outbreaks and
hospitalizations caused by bacterial toxins produced by Bacillus spp had notably
increased.
In addition to health risks, the deterioration of food due to contamination by
microorganisms belonging to the B. cereus group shortens the life of the products and
generates economic losses (Te Giffel, 2001).
In this context it is a major objective for the food industry, and therefore for this
thesis, to achieve a deep knowledge of relevant environmental factors affecting B.
cereus group growth, either alone or in combination, in order to contribute to the
development and improvement of preservation systems. This will allow to cope with
consumer demands without compromising the microbiological safety and quality of the
food.
Thus, the effect of temperature, oxygen limited environment, natural
antimicrobial compounds, water activity and pH on B. cereus group stress response was
investigated. Likewise, mechanistic studies were performed to determine the role of the
two-component signal transduction systems on adaptation of these microorganisms to
low temperatures.
Besides, the integration of physiological data through mathematical models able
to be implemented in Hazard Analysis and Critical Control Points (HACCP) and risk
Aim and impact
5
assessment analysis may be of benefit for scientists, competent authorities and industry
since it will allow to better estimate bacterial behavior in food environments and
implement it in food safety policies.
An essential part of this thesis was to contribute to the development of novel
detection methods for simple, fast, and robust identification of B. cereus group species,
avoiding classical culture techniques which are tedious and time consuming. For
identification purposes it is important to note that B. cereus group typing at strain and
species level remains being a challenge due to their high genetic similarity (Schmidt et
al., 2011). To address this point highly sensitive techniques able to detect significant
genomic polymorphisms for typing might be used. For this purpose, reliability
assessment of single nucleotide polymorphisms (SNP) genotyping via high-resolution
melting analysis (HRM), a novel technique successfully used for specific species
identification of clinically relevant bacterial species (Yang et al., 2009) appears to be
interesting for implementation in food microbiology.
Finally, flow cytometry analysis (FCM) was considered in this work as a
technique of great interest to accomplish physiological studies of B. cereus group
species. As major advantages, FCM provides real time acquisition of multiparametric
data from thousands of individual cells within a sample (Veal et al., 2000). On this
basis, this technique could address the need of development of valid methods that allow
the integration of the physiological and molecular data at the single-cell level for
predictive modelling-based approaches of practical use for the food industry (Hornstra
et al., 2009; Ter Beek and Brul, 2010).
1.2. Objectives
The objective of this thesis is to deepen in the understanding of relevant
environmental factors that affect the growth of microorganisms belonging to B. cereus
group, either alone or in combination, in order to contribute to the development of new
preservation strategies that ensure an adequate microbiological quality of foods and to
develop predictive models that can be useful for HACCP programs and for microbial
risk assessment purposes. Likewise, another major goal of this work was to evaluate
novel methods for rapid identification of these microorganisms as well as to test reliable
Aim and impact
6
techniques for viability studies at single cell level so that subpopulations of, for
example, high heat resistant or psychrotrophic spores of B. cereus could be identified.
From a global perspective, we aim to contribute to the improvement of food processing
with the purpose of preventing economic losses and health risks caused by members of
the B. cereus group. To this end, we have performed a multidisciplinary study that
includes the following partial objectives:
1) To contribute to the development of novel preservation methods for ready to eat
vegetable foods:
• By characterizing B. cereus spores heat resistance in sterile distilled water
and vegetable substrate and the influence of heating medium on it.
• Studying the presence and extension of shoulders and their impact on
evaluation of sterilization processes.
• By assessing modified atmospheres in combination with mild and severe
heat treatments for preservation of foods based on vegetables.
2) To develop novel preservation methods for liquid egg employing stochastic
models useful to predict the risk of foodborne illness associated to this food:
• By investigating the effect of lysozyme and nisin combined with mild heat
treatment at different incubation temperatures and analyzing this effect on
the distributions of individual lag times.
• Performing a Monte Carlo simulation to estimate the time to a certain growth
of heat treated B. cereus cells in liquid egg with antimicrobial compounds
added.
3) To improve predictions of growth of B. weihestephanensis in dynamic
conditions:
• By modelling the effects of temperature and water activity (aw) downshifts
on the lag time of B. weihenstephanensis and the dependency of specific
growth rate (µmax) on the growth conditions (temperature and aw).
Aim and impact
7
4) To test FCM feasibility for viability studies of acid stressed B. cereus and B.
weihenstephanensis cells at single level:
• By testing differential fluorescent labelling to discriminate vegetative cell
viability.
• By comparing classical techniques, viable plate counts (VPC), and FCM
analysis for evaluation of acid stress effects on vegetative cells.
5) To contribute to a reliability assessment of major phylogenetic groups (I-VII)
affiliation for practical applications in heat processing:
• By panC gene sequence affiliation of strains tested.
• By characterizing heat resistance in sterile distilled water of B. cereus spores
affiliated to group IV.
6) To identify B. cereus group isolates at species and strain level:
• Through identification of highly polymorphic genomic regions and
subsequent primer design.
• By assessing feasibility of genotyping by SNPs detection via HRM analysis.
7) To characterize the mechanistic basis of B. cereus group cold adaptation:
• By testing in vitro methods feasibility for strain specific methylation of
plasmid DNA to improve transformation efficiency of B. cereus group
species.
• By studying the effect of the deletion of BC2216 and BC2217 genes on the
ability of various B. cereus group strains to grow at low temperatures
Aim and impact
8
1.3. Thesis outline
General principles about B. cereus group, bacterial stress response, predictive
microbiology, food preservation, bacterial identification and flow cytometry are
described in Chapter 2, the introduction of this thesis.
The experimental results obtained during the development of this work are
organized in Chapters 3, 4, 5, 6, 7 and 8 of this document. Each is written in the form of
a scientific paper and consists of the following sections: introduction, materials and
methods, and results and discussion.
Additionally, Chapter 9 includes the main scientific conclusions of the work and
Chapter 10 lists the references used in this thesis.

Introduction
9
CHAPTER 2
Introduction
Abstract
To cover relevant background aspects for the work present in this thesis, this
introduction deals with Bacillus cereus group taxonomy, ecology, pathogenicity and
epidemiology, as well as with its importance in food processing environments. On the
other hand, main characteristics of general stress response, bacterial SOS response and
two component signal systems are detailed in this chapter to understand, from a
molecular point of view, B. cereus group behavior during food processing, preservation
and storage. Likewise, a general description of bacterial life cycle is given here to
understand predictive microbiology basis. Besides, a brief description of predictive
microbiology development and its importance in risk assessment and HACCP are
discussed. As an essential part of this introduction, hurdle technology, gamma
hypothesis and relevant factors for food preservation are detailed. Finally, we
summarized importance, requirements and methods for B. cereus group identification
and revised flow cytometry principles and applications.
10101010
9
8
7
6
5
4
3
2
19

Introduction
10
10
9
8
7
6
5
4
3
1

Introduction
11
2.1. Bacillus cereus group
The Bacillus cereus group, also known as Bacillus cereus sensu lato, is a widely
used term describing a genetically highly homogeneous subdivision of the genus
Bacillus comprising six recognized species: Bacillus cereus sensu stricto, Bacillus
mycoides, Bacillus pseudomycoides, Bacillus thuringiensis, Bacillus
weihenstephanensis and Bacillus anthracis.
These species range high in economic, medical and biodefense importance.
Spore and crystal toxins preparations from B. thuringiensis are used as biological
insecticides to control a variety of foliage lepidopterans such as moths and budworms,
dipterans such as mosquitoes and blackflies and coleopterans such as Colorado potato
beetles (Bourque et al., 1995). B. anthracis is the causative agent of the fatal animal and
human disease anthrax, whose use as biological weapon has been discussed in the latest
years (Jernigan et al., 2002; Read et al., 2003). B. cereus sensu stricto strains are
commonly present in food causing spoilage and food-borne diseases, generally mild and
of short duration. This microorganism is also an opportunistic pathogen able to
contaminate mammalian tissues resulting in systemic and local infections (Kotiranta et
al., 2000) and is used as animal probiotics (Klein, 2011) or as a plant symbiont (Stabb et
al., 1994). B. mycoides, B. pseudomycoides and the phychrotolerant species B.
weihenstephanensis, are common and ubiquitous soil organisms whose pathogenic
potential remains uncertain (Guinebretière et al., 2008). B. mycoides, B.
pseudomycoides are differentiated from B. cereus sensu stricto by rhizoidal colony
shape and fatty acid composition (Stenfors Arnesen et al., 2008), meanwhile B.
weihenstephanensis is characterized by its ability to grow below 7ºC but not at 43ºC
(Lechner et al., 1998).
Due to their metabolic diversity and their ability to form endospores highly
resistant to heat, chemical and other environmental stresses (Carlin et al., 2010), these
ubiquitous microorganisms are able to colonize a wide variety of habitats in a very
broad thermal range of growth temperature ranging from 4°C to 50°C (Guinebretière et
al., 2008). In consequence, these species have important implications in Food Industry
leading to spoilage on raw and processed foods as well as human pathogens involved in
food-borne outbreaks.

Introduction
12
In recent years, the development and implementation of consumer driven mild
preservation techniques have become more popular in order to minimize the damage of
the organoleptic and nutritional properties of the food. However, this may further
enhance the spore survival, and thus the persistence of spore formers in food production
environments. In addition, mesophilic strains subjected to suboptimal refrigeration
conditions as well as psychrotrophic strains present in chilled food products can grow at
refrigerated temperatures and cause food-borne outbreaks. It is extensively reported that
strains of B. cereus group have been isolated from raw and processed foodstuff, food
stored at refrigerator temperatures, dehydrated foods, hot dairy equipment, industrial
surfaces, infected humans, dead animals or insect bodies and soil (Becker et al., 1994;
Dufrenne et al., 1995; Helgason et al., 1998; Lechner et al., 1998; Margulis et al., 1998;
Kotiranta et al., 2000; Svensson et al., 2000; Guinebretière and Nguyen-The, 2003).
2.1.1. Taxonomy
Previous studies have reported high similarity in B. cereus sensu lato DNA
sequences, up to 95% of the basic chromosomal genes composition was identical
(Periago et al., 2002b). B. anthracis, B. cereus and B. thuringiensis genome sequences
are closely related in gene content, and their 16S rRNA gene sequences share more than
99% similarity (Ash et al., 1991; Helgason et al., 2000b).
Phylogenetic studies based on chromosomal markers showed the absence of
taxonomic basis to assign to B. cereus and B. thuringiensis the separate species status,
and considered B. anthracis as a clone of B. cereus (Stenfors Arnesen et al., 2008).
However, the organisms belonging to this group show different functional properties
which are thought to be caused by genes carried on plasmids or by altered gene
expression among strains (Jensen et al., 2003; Read et al., 2003; Helgason et al., 2000b,
2004). In fact, B. thuringiensis is defined by the presence of cry genes encoding δ-
endotoxins located in plasmids, B. anthracis contains two large plasmids (pXO1 and
pXO2) encoding the two main virulence factors of this species, and B. cereus also
presents a large plasmid containing ces gene which encodes the emetic toxin (Hoton et
al., 2005; Leppla, 2006; Stenfors Arnesen et al., 2008).

Introduction
13
However, although virulence plasmids pXO1 and pXO2 have significant impact
on the pathogenic phenotype of B. anthracis and represent 52% of the unique coding
capacity found in the genome of this species, this plasmid gene content comprises only
176 genes, representing a small fraction of the total coding capacity of the B. anthracis
genome (Schmidt et al., 2011). To attempt understand the genomic similarity of these
phenotypically diverse microbes, Schmidt et al. (2011) suggested that “subtler genome
alterations within the B. cereus group isolates, such as gene duplication, divergence and
point mutations probably have contributed as much or more than horizontal gene
transfer and genome reduction”.
It is important to note that the most evolutionarily flexible portions of the
bacterial genome are regulatory sequences and transcriptional networks (Huynen &
Bork, 1998; Lozada-Chavez et al., 2006, 2008). In this context, Schmidt et al. (2011)
reported that major differences between B. cereus group microorganisms reside in the
regulation of gene expression rather than gene content. This divergence is evidenced by
the fact that papR locus, which encodes a quorum-sensing signal (a secreted peptide)
that is internalized and binds to PlcR, a transcriptional activator that controls gene
expression and is important for B. cereus group virulence, presents point mutations that
differentiate group members from one another (Mignot et al., 2001; Slamti & Lereclus,
2005).
In addition, Martin et al. (2010) reported that genome reduction has played a
moderate role in divergence of the B. cereus group, likely being responsible for the
reduced genome size of Bacillus cereus subsp. cytotoxis NVH391-98, a new cluster
involving strains able to grow at temperatures 6-8ºC higher than mesophilic B. cereus
strains (Guinebretière et al., 2008). These microorganisms are considered as a new
species informally termed Bacillus cytotoxicus (Lapidus et al., 2008). Few data are
available from these rarely isolated microorganisms whose ecological niche remains
uncertain. The first isolate was NVH391/98 strain, causative agent of fatal cases of
necrotic diarrhea (Lund et al., 2000). Subsequent studies have revealed that these strains
have the σB RNA polymerase subunit absent (Lapidus et al., 2008).
Finally, it is noteworthy that gene-duplication and gene-loss process are the
main responsible ones of the wide heterogeneity of the sigma factor content in B. cereus

Introduction
14
group species (Schmidt et al., 2011). Indeed, it has been suggested that, as consequence
of sigma factor expansion and divergence among sigma factor regulons, these
microorganisms display a wide variety of phenotypic characteristics that allow to
adaptation to different ecological niches (Anderson et al., 2005).
While both the gene content and extent of divergence suggest that B. cereus
subsp. cytotoxis and perhaps B. weihenstephanensis may warrant specific recognition,
the lack of correlation between phylogenetic studies and virulence factor which
distinguish B. anthracis, B. cereus and B. thuringiensis species generates a discussion
about taxonomic classification of these B. cereus group strains, but also concerning
public health (Stenfors Arnesen et al., 2008). Recently, Schmidt et al. (2011) have
reported phylogenetic assessment consistent with other suggestions which point that B.
cereus group exhibits sufficiently high genetic similarity that these organisms could be
members of a single species.
2.1.2. Foodborne disease and nongastrointestinal infections
Besides B. anthracis, which is the causative agent of anthrax disease,
microorganisms belonging to this group can induce two types of foodborne syndromes,
emetic and diarrheal. Both gastrointestinal diseases are normally mild, symptoms do last
not more than 24 hours and are very similar to others food-borne illnesses, because of
these the true incidence of this disease may be underestimated (Table 1). In contrast,
non-gastrointestinal disease has been reported as local and systemic infections
frequently associated to immunologically compromised patients (Kotiranta et al., 2000).
Among all B. cereus members, B. cereus sensu stricto is the main causative agent of
gastrointestinal infection through the production of a range of virulence factors. Generally,
emetic and diarrheal processes are mild and shelf-limiting, but few severe or even fatal cases
have been described, specially related to the emetic type (Table 1). Besides, B. cereus is
responsible of local and system infection, including keratitis, endophtalmmitis, panophtalmitis,
periodontitis, meningitis, pneumonia, urinary tract infections and fatal fulminate liver failure
(Beecher et al., 2000; Kotiranta et al., 2000) which are specially associated to immunologically
compromised patients, neonates, drug addicts and traumatic or surgical wounds and catheters
(Drobniewski, 1993; Kotiranta et al., 2000; Hilliard et al., 2003;).
Introduction
15
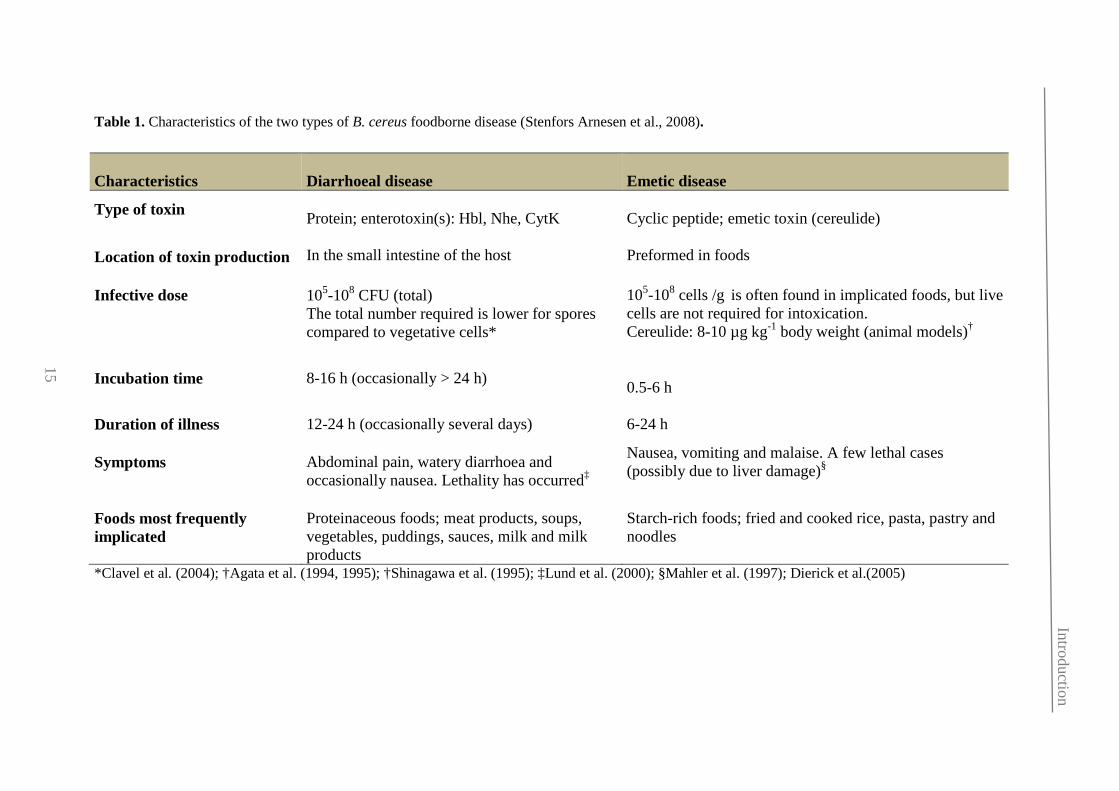
Table 1. Characteristics of the two types of B. cereus foodborne disease (Stenfors Arnesen et al., 2008).
*Clavel et al. (2004); †Agata et al. (1994, 1995); †Shinagawa et al. (1995); ‡Lund et al. (2000); §Mahler et al. (1997); Dierick et al.(2005)
Characteristics
Diarrhoeal disease
Emetic disease
Type of toxin Protein; enterotoxin(s): Hbl, Nhe, CytK
Cyclic peptide; emetic toxin (cereulide)
Location of toxin production
In the small intestine of the host
Preformed in foods
Infective dose 105-108 CFU (total)
The total number required is lower for spores compared to vegetative cells*
105-108 cells /g is often found in implicated foods, but live cells are not required for intoxication. Cereulide: 8-10 µg kg-1 body weight (animal models)†
Incubation time 8-16 h (occasionally > 24 h) 0.5-6 h
Duration of illness
12-24 h (occasionally several days)
6-24 h
Symptoms Abdominal pain, watery diarrhoea and occasionally nausea. Lethality has occurred‡
Nausea, vomiting and malaise. A few lethal cases (possibly due to liver damage)§
Foods most frequently implicated
Proteinaceous foods; meat products, soups, vegetables, puddings, sauces, milk and milk products
Starch-rich foods; fried and cooked rice, pasta, pastry and noodles
15
Introduction

Introduction
16
On the other hand, B. thuringiensis has been reported to cause food poisoning
outbreaks similar to those caused by B. cereus (Jackson et al., 1995), and also has been
responsible of non-gastrointestinal infections affecting cornea, burn wounds and lungs
(Samples & Buettner, 1983; Damgaard et al., 1997; Ghelardi et al., 2007).
2.1.3. Pathogenicity factors
The pathogenic potential of a particular B. cereus group strains appear to be
highly determined by the level of toxin gene expression, which is temporally controlled
in response to cell density, nutrient availability, metabolic state of the cell and
environmental conditions such as pH, temperature, glucose concentration and oxygen
tension in addition to being coordinately regulated with motility genes.
2.1.3.1. Cytotoxins associated to diarrheal syndrome
The diarrheal type is currently considered to be caused by a single protein,
cytotoxin K (CytK1 or CytK2) and by two enterotoxin complexes, haemolysin BL (Hbl)
and non-haemolytic enterotoxin (Nhe) (Beecher and MacMillan, 1991; Lund and
Granum, 1996; Lund et al., 2000). These heat labile cytotoxins are produced during
vegetative growth of the microorganism in the small intestine. The highest specific
production of Nhe occurs early during exponential growth, while Hbl was produced
later, early in the stationary phase of growth (Zigha et al., 2006).
Besides, others virulence factors have been also investigated including
cytotoxins, haemolysins and degradative enzymes such as cereolysin O (Kreft et al.,
1983), haemolysin II (HlyII) (Baida et al., 1999), haemolysin III (Baida & Kuzmin,
1995), InhA2 (Fedhila et al., 2003), phosphatidylinositol and phosphatidylcoline
specific phospholipases C (PI-PCL and PC-PCL) (Kuppe et al., 1989),
sphingomyelinase (SMase) and enterotoxin FM (EntFM) (Granum, 2002).
Hbl and Nhe are related three-component toxins, while the single-component
CytK belongs to the family of β-barrel pore-forming toxins. Proteins L2, L1 and B
compose Hbl and are encoded by hblC, hblD and hblA genes, respectively, which are
cotranscribed from the hblCDAB operon (Beecher & MacMillan, 1991; Heinrichs et al.,

Introduction
17
1993; Ryan et al., 1997; Lindbäck et al., 1999). Two different types of this
chromosomally encoded operon with a conserved genomic location appear to exist in B.
cereus group members (Stenfors Arnesen et al., 2008). On the other hand, Nhe consists
of the proteins NheA, NheB and NheC, encoded by the nheABC operon (Granum et al.,
1999). A single copy of this operon is present in all B. cereus group strains.
Exceptionally, B. weihenstephanensis KBAB4 contains two copies, one chromosomally
encoded and the other located in the megaplasmid pBWB401 (Lapidus et al., 2008).
Besides, B. cereus NVH 391/98 nhe operon shows low identity towards nhe operons in
B. cereus group (Lapidus et al., 2008). CytK could have two different forms either
CytK-1 or CytK-2, according to the B. cereus group strain, which are encoded by cytK-
1 and cytK-2 genes (Fagerlund et al., 2004).
The nhe operon has been found to be present in all known B. cereus group
strains to the date, suggesting that could be also involved in cell viability roles (Stenfors
Arnesen et al., 2008). Otherwise, hbl and cytK genes are present in less than 50% of
randomly sampled strains (Ehling-Schulz et al., 2005a, 2006a; Moravek et al., 2006).
Notably, this percentage increases in food associated isolates (Guinebretière et al., 2002;
Swiecicka et al., 2006). Similarities of nhe and hbl genes suggest that they have
originated from a common gene (Stenfors Arnesen et al., 2008).
In B. cereus group isolates, the transcriptional regulator Phospholipase C
Regulator (PlcR) controls most known virulence factors such as several enterotoxins
(Nhe, Hbl and CytK), haemolysins, phospholipases and proteases by integrating at least
two classes of signals: cell growth state through Spo0A and self cell density through
PapR (Gohar et al., 2008). plcR transcription starts short time before the onset of the
stationary phase and reaches a plateau two hours later (Lereclus et al., 1996).
It has been shown that PlcR transcription is autoinduced by its binding to DNA
on a specific sequence called the ‘PlcR box’ meanwhile is repressed by the sporulation
factor Spo0A (Lereclus et al., 1996, 2000). Furthermore, to be active, PlcR needs the
pentapeptide PapR which is expressed as a propeptide under the control of PlcR,
transformed in active in the extracellular medium and reintroduced in the cell by the
oligopeptide permease system OppABCDF (Gohar et al., 2008). Together, PlcR,
OppABCDF and PapR function as a quorum-sensing system which is present in all B.
Introduction
18
cereus group organisms and harbors mutations points that result in four distinct
phylogenetic groups of the PapR peptide which exclusively bind to its cognate PlcR
sensor indicating a specific activation of plcR transcription within B. cereus group
strains (Slamti and Lereclus, 2005).
Phylogenetic analyses based on PlcR peptide sequences clearly show that strains
belonging to a given species (e.g., B. thuringiensis) may be more related to strains
belonging to another species (e.g., B. cereus or B. weihenstephanensis) (Slamti and
Lereclus, 2005). In addition, B. anthracis and a low percentage of B. cereus strains,
shown a unique nonsense mutation in PlcR that inactivates the quorum-sensing function
entirely, what appears to be necessary for full virulence of these microorganisms.
Besides to PlcR regulation, expression of Hbl and Nhe is also regulated by the
redox-sensitive two-component regulatory system ResDE and the redox regulator Fnr
(Duport et al., 2006; Esbelin et al., 2008, 2009).
Additionally, B. cereus shynthesized HlyII, a single-component protein toxin
member of the family of β-barrel poreforming toxin (Baida et al., 1999) with
independent expression of PlcR, shows haemolytic and cytotoxic activity towards
human cell lines (Andreeva et al., 2006) but it has never been involved in diarrheal
syndrome.
Hbl and Nhe are spore-forming toxins which produce diarrhea by disrupting the
integrity of the plasma membrane of epithelial cells during growth in the small intestine.
However, it remains uncertain how the three components in each complex interact or to
what extent they oligomerize in the process of forming a transmembrane pore. For both
Nhe and Hbl, all three components are necessary for maximal biological activity
(Beecher & MacMillan, 1991; Beecher et al., 1995; Lindbäck et al., 2004). To date, no
host cell receptor for Nhe or Hbl has been identified. Besides, Cytk and HIyII are also
involved in transmembrane pore formation by association into oligomeric prepores at
the target cell surface (Bhakdi and Tranum-Jensen, 1991). Notably, Nhe, Hbl and Cytk
have haemolityc activity and Hbl and Cytk necrotic activity too (Beecher and Wong,
1994, 2000; Lund et al., 2000; Fagerlund et al., 2008).
Introduction
19
To cause disease the most important toxin may vary between B. cereus strains.
However, meanwhile different authors have suggested Nhe as the major cytotoxic
membrane-damaging factor secreted by most B. cereus strains, others have proposed
that foodborne diseases are caused by multiple toxins that act together, probably in a
strain-dependent manner, or even synergistically (Stenfors Arnesen et al., 2008).
2.1.3.2. Emetic toxin
The toxin termed cereulide is the causative agent of the emetic disease. This
cyclic dodecadepsipeptide is synthesized by a nonribosomal peptide synthetases
(NRPSs) encoded by the cereulide synthetase (ces) gene cluster which is present in
clonal lineage of B. cereus strains that carry a pXO1-like megaplasmid, termed pBCE
(Ehling-Schulz et al., 2005b, 2006b). The ces gene cluster is polycistronically
transcribed from a central promoter in a strict temporally regulated way (Frenzel et al.,
2011). Notably, Thorsen et al. (2006) reported that psychrotolerant species B.
weihenstephanensis was able to produce cereulide at 8ºC.
This emetic toxin is synthesized during vegetative growth, at the end of
logarithmic phase, usually in improperly refrigerated foods and reheating foods that
have been stored at room temperature after a first heating. Production levels of cereulide
vary among strains and differences in ces genes regulation have been pointed as
responsible of this phenomenon (Häggblom et al., 2002; Ehling-Schulz et al., 2005b;
Rajkovic et al., 2006b). Likewise, oxygen levels, pH, temperature, the presence of
specific amino acids and food composition affect toxin production (Stenfors Arnesen et
al., 2008).
Upon ingestion, cereulide moves through gastrointestinal tract until it reaches
small intestine without being destroyed by gastric acid and proteolytic enzymes due to
its resistant nature to acid environments, proteolysis and heat (Johnson, 1984; Agata et
al., 1994; Shinagawa et al., 1996). As has been shown in Suncus murinus, an animal
model, when toxin reaches duodenum binds to the 5-HT3 receptor and stimulates the
vagus nerve causing vomiting (Agata et al., 1995).

Introduction
20
In addition, this toxin can inhibit mitochondrial activity by acting as a cation
ionopore, like valinomycin (Mikkola et al., 1999). Likewise, has been reported that
cereulide is responsible of cellular damage (Shinagawa et al., 1996) and inhibit human
natural killer cells of the immune system (Paananen et al., 2002).
2.1.4. Ecological diversification of B. cereus group
Temperature is one of the most important environmental factors to which
microorganisms have to respond. Guinebretière et al. (2008) have reported within B.
cereus sensu lato distinct genetic groups which posses their own growth ranges
specificities showing an “ecotypic” structure of populations (Table 2 and 3). Seven
major phylogenetic groups were identified (I to VII) by using phenotypic and genetic
criteria including AFLP patterns, partial panC sequence, ribosomal gene sequences as
well as “psychrotolerant” DNA sequences signatures such as rrs signature (Pruss et al.,
1999) and cspA signature (Francis et al., 1998).
Every group (I to VII) shows a specific “thermotype” and different virulence
potentials. Phylogenetic branching order of the differential thermal lineages indicates an
evolutionary transition towards psychrotolerance and show how B. cereus group
evolution seems to be strongly determined by ecological adaptations (Guinebretière et
al., 2008). Notably, temperature tolerance limits may acts as an important mechanism
by which these microorganisms have adapted to new or different environments. In fact,
relative abundance of the “psychrotolerant” rrs signature and the cspA signature in B.
cereus group strains (Table 3) reflect different strategies set up by all groups to adapt to
a wide variety of ecological niches with diverse thermal conditions (Carlin et al., 2010).
This rich adaptive ability supports the development of new evolutionary lines and long-
term persistence of B. cereus group (Guinebretière et al., 2008). Nowadays, global
warming may be linked to changes in B. cereus sensu lato strains ecology towards a
thermotolerant status as indicate the fact that many strains isolated from food poisoning
cases have a tendency rather to belong to more thermotolerant phylogenetic groups
(groups III, IV and VII) (Carlin et al., 2010). Notably, group VII illustrates the relation
between ability to grow at elevated temperatures and the pathogenic potential (Carlin et
al., 2010).

Introduction
21
Recently, Guinebretière et al. (2010) have reported that nhe genes are constant
part of the B. cereus group strains, whilst cytK-1, cytK-2 and hbl genes distribution was
disrupted. Percentage of strains carrying hbl gene varied from 40% to 97% between
phylogenetic groups I, II, IV, V and VI, and this operon was seldom carried by strains
of phylogenetic group III. cytK-1 form was specific for group VII, and cytK-2 was
particularly frequent in mesophilic groups III and IV, except for B. anthracis strains
tested, and was rare or absent in the psychrotolerant or moderately psychrotolerant
groups (II, V and VI). To get a global measure of the activity of B. cereus group
enterotoxins cytotoxic activity assays were performed in Caco2 cells (Guinebretière et
al., 2010). Results revealed that food poisoning risk should be highest for group III
which include emetic strains previously related with fatal foodborne cases (Mahler et
al., 1997; Dierick et al., 2005) and the dangerous pathogen B. anthracis. This food
poisoning risk is high for groups VII, IV and II, decreased with group V and is very low
for group VI isolates.
Augustin (2011) has stated that three different clusters of B. cereus group
isolates linked to food poisoning can be defined:
i) diarrheal, psychrotrophic, heat sensitive strains belonging to the
genetic group II,
ii) diarrhoeal, mesophilic, heat resistant strains belonging to the genetic
groups III, IV, V, and VII,
iii) emetic, mesophilic, heat resistant strains belonging to the genetic
group III.

Introduction
22
Table 2. Characteristic of major phylogenetic groups (I-VII) a
Ranking obtained from Carlin et al., 2010 bNovel species B. cytotoxicus (Fagerlund et al., 2007; Lapidus et al., 2008) c Ranges stated in Afchain et al., 2008.
Phylogenetic
group Species
Growth
temperature
range (ºC)
Thermal niche
Heat
resistance of
sporesa
Temperature range compatible
with spore germination
(ºC)c
I B. pseudomycoides 10-43 Mesophilic ? ?
II B. cereus II
B. thuringiensis II 7-40
25% intermediate to
mesophilic
75% of psychrotolerant
+ + <42
III B. cereus III (emetic strains included)
B. thuringiensis III
B. anthracis
15-45 Mesophilic + + + <45
IV B. cereus IV
B. thuringiensis IV 10-45 Mesophilic + + <45
V B. cereus V
B. thuringiensis V 8-40 Intermediate + + <45
VI B. weihenstephanensis
B. mycoides
B. thuringiensis VI
5-37 Psychrotolerant + <37
VII B. cytotoxicusb 20-50 Thermotolerant + + + <45
22
Introduction
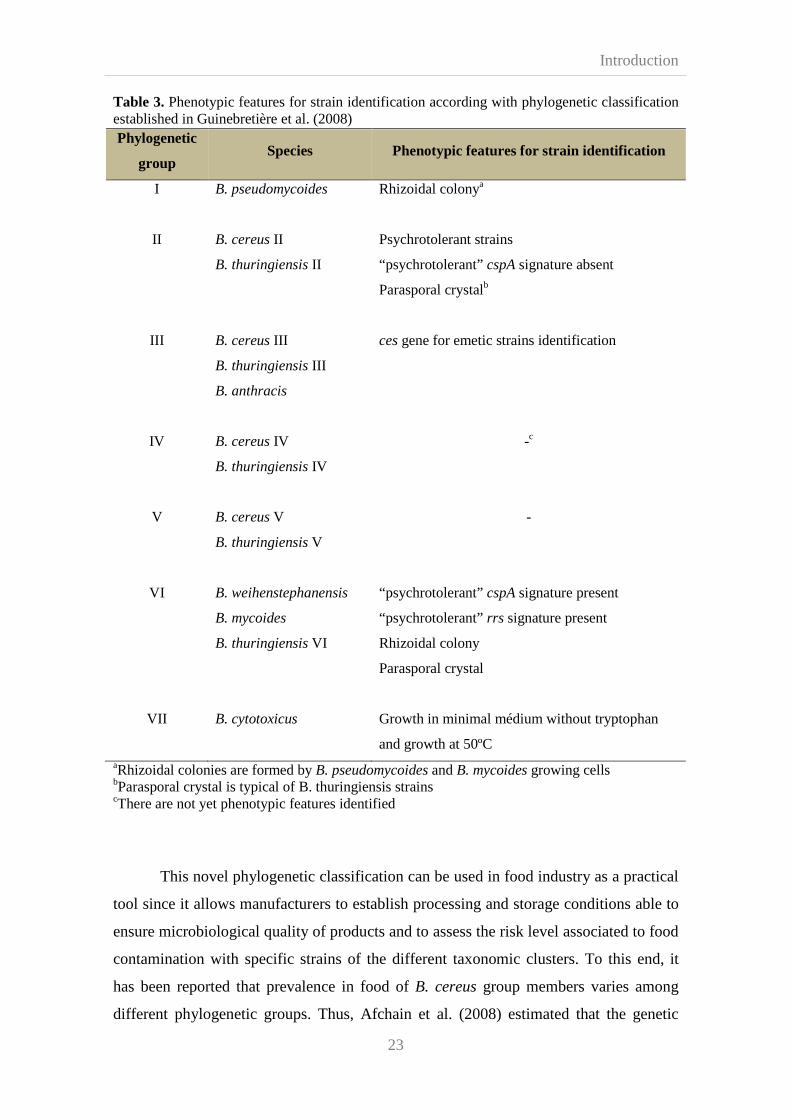
Introduction
23
Table 3. Phenotypic features for strain identification according with phylogenetic classification established in Guinebretière et al. (2008)
aRhizoidal colonies are formed by B. pseudomycoides and B. mycoides growing cells bParasporal crystal is typical of B. thuringiensis strains cThere are not yet phenotypic features identified
This novel phylogenetic classification can be used in food industry as a practical
tool since it allows manufacturers to establish processing and storage conditions able to
ensure microbiological quality of products and to assess the risk level associated to food
contamination with specific strains of the different taxonomic clusters. To this end, it
has been reported that prevalence in food of B. cereus group members varies among
different phylogenetic groups. Thus, Afchain et al. (2008) estimated that the genetic
Phylogenetic
group Species Phenotypic features for strain identification
I B. pseudomycoides Rhizoidal colonya
II
B. cereus II
B. thuringiensis II
Psychrotolerant strains
“psychrotolerant” cspA signature absent
Parasporal crystalb
III
B. cereus III
B. thuringiensis III
B. anthracis
ces gene for emetic strains identification
IV
B. cereus IV
B. thuringiensis IV
-c
V
B. cereus V
B. thuringiensis V
-
VI
B. weihenstephanensis
B. mycoides
B. thuringiensis VI
“psychrotolerant” cspA signature present
“psychrotolerant” rrs signature present
Rhizoidal colony
Parasporal crystal
VII
B. cytotoxicus
Growth in minimal médium without tryptophan
and growth at 50ºC

Introduction
24
group II strains are more frequently isolated of contaminate raw vegetables, meanwhile
genetic group III was prevailing in milk proteins, and group IV prevailed in milk
proteins and starch. Besides, lightly heat-treated foods with extended refrigerated
storage are a favorable environment for B. cereus group species, especially for those
belonging to groups II and VI.
2.1.5. B. cereus group importance in food processing environments
Soil is the natural reservoir of spores of B. cereus group. When this spores come
in contact with organic matter or an insect or animal host germination and growth occur
(Stenfors Arnesen et al., 2008).
Among B. cereus group, B. cereus sensu stricto can be found in different soils,
plants, sediments and dust, and then spores are passively spread to new environments
(Stenfors Arnesen et al., 2008). From this state different life cycles can take place. It has
been reported a saprophytic cycle in which spores can germinate, grow and sporulate in
soil (Vilain et al., 2006). Margulis et al. (1998) described a symbiont cycle when B.
cereus colonizes insects gut. Besides, there is a pathogenic life cycle in which
microorganisms are present in mammalian intestine, and to a lesser extent, in other
tissues, causing disease (Drobniewski, 1993).
B. cereus sensu stricto spores and vegetative cells have been isolated of different
food products: spaghetti, pasta, rice, diary and dried milk products, spices and other
dried foodstuff, meat, chicken, vegetables, fruits, grain and seafood (Kotiranta et al.,
2000), as well as eggs (Kramer and Gilbert, 1989) and infant formulas (Becker et al.,
1994). Besides, previous studies appear to indicate that B. cereus could be present in
water sources (Østensvik et al., 2004).
This microorganism is implicated in an increasingly number of food-borne
outbreaks, limiting products shelf life and generating economic losses. Many factors are
responsible of the great incidence of B. cereus in food and processing environments on
the basis of the absence of complex nutrient requirements and the production of highly
resistant spores to physic and chemical treatments with special ability to adhere to

Introduction
25
surfaces. Spores hydrophobicity, and the presence of appendages are strongly associated
to B. cereus adherence and may enhance their attachment to epithelial cells of the small
intestine and resistance to regular cleaning of industrial surfaces (Anderson et al., 1995;
Kotiranta et al., 2000). Furthermore, this microorganism forms thick biofilms at the air-
liquid interface and also weak biofilms on immersed glass or steel surfaces in static
culture conditions (Oosthuizen et al., 2001; Auger et al., 2006; Wijman et al., 2007).
Ryu and Beuchat (2005), reported that biofilms may protect vegetative cells against
inactivation by sanitizers.
This microorganism is able to colonize industrial environments and even food-
processing equipment from spores and cells which remain in plant material after
harvest, or contaminating dairy products through contact of udders with grass and
bedding material or feed (Stenfors Arnesen et al., 2008). Moreover, cross-contamination
elicits B. cereus to be present in different food such as meat (Stenfors Arnesen et al.,
2008). In addition, B. cereus can be easily isolated from food stored at ambient
temperature or subjected to long heat-keeping below 60ºC as well as from food with pH
higher than 4.8 (Gilbert and Kramer, 1986; Stenfors Arnesen et al., 2008).
Notably, most of the B. cereus strains are mesophilic, but some of them can
grow at low temperatures, between 4 and 7ºC (Kotiranta et al., 2000). Therefore,
processed chilled foods of extended durability, which are increasingly being produced
and consumed in Europe, are susceptible to represent a risk of foods spoilage and
foodborne illness. Nauta et al. (2003) and others authors (Membré et al., 2006; Afchain
et al., 2008) reported that refrigerated processed foods of extended durability at the end
of domestic storage were colonized by an heterogeneous population of B. cereus
conformed by mesophilic heat resistant strains mainly dependent on the initial
contamination of raw ingredients, and by psychrotrophic heat sensitive strains
dependent on the storage conditions.
In 1998, on the basis of sequence differences of 16S rRNA gene and cold shock
proteins, Lechner et al. proposed Bacillus weihenstephanensis sp. nov. as a new species
comprising psychrotolerant B. cereus strains which were able to grow at 4-7ºC but not
at 43ºC. Further studies (Stenfors and Granum, 2001) showed that intermediate forms

Introduction
26
between the two species exits and not all the psychrotolerant B. cereus strains were
necessary B. weihenstephanensis.
At present, this new specie is a well know spoilage microorganism previously
isolated from spoiled egg products (Heyndrickx and Scheldeman, 2002; Svensson et al.,
2004; Baron et al., 2007; Jan et al., 2011;) dairy products (Bartosewicz et al., 2008), and
vegetable products (Valero et al., 2002).
Different authors have reported the presence in B. weihenstephanensis strains of
the genetic makeup for producing essential pathogenicity factors. Stenfors et al. (2002)
reported that out of 50 B. weihenstephanensis strains studied, the majority of them
(72%) were not cytotoxic in a Vero cell assay, although all of the strains had part of at
least one of the B. cereus enterotoxins Hbl, Nhe or CytK. Besides, one psychrotolerant
emetic B. cereus strain (Altayar and Sutherland, 2006) and several B.
weihenstephanensis strains were identified as being cereulide producers (Thorsen et al.,
2006; Hoton et al., 2009). In 2011, Stenfors Arnesen et al. reported for first time
virulence in an in vivo model (Galleria mellonella) at low temperature. Since cytotoxins
produced by B. weihenstephanensis might not be very relevant due to higher
mammalian body temperature, the possibility of cereulide formation at refrigeration
temperatures in food products before consumption may pose a risk of food poisoning
(Stenfors Arnesen et al., 2011). Notably, on the basis of previous studies a high level of
genetic exchange has been suggested among B. weihenstephanensis strains compared
with other species of the B. cereus group (Sorokin et al., 2006). This fact is remarkable
since may facilitate horizontal transmission of plasmid encoding virulence factors.
On the other hand, it should be take into account that B. thuringiensis strains,
widely used as bioinsecticides in agriculture, are able to cause foodborne illness
(Jackson et al., 1995). Thus, this species, which is closely related to B. cereus, deserves
to be taken into account by microbiologist and food producers.
2.1.6. Epidemiology
Recent changes on eating habits have enhanced consumption of refrigerated
processed foods increasing the probability of spoilage incidents and outbreaks caused

Introduction
27
by B. cereus group strains. In fact, the latest Community Summary Report on Food-
borne Outbreaks in the European Union of 2009 (EFSA, 2011), the European Food
Safety Authority (EFSA) and the European Centre for Disease Prevention and Control
(ECDC) reported that Bacillus species, among which all of them the main etiological
agent is B. cereus, registered an upward trend in the number of outbreaks, as well as in
the number of affecting people and of hospitalization cases (Table 4)
Table 4. Relevant epidemiological parameters of Bacillus spp outbreaks reported by EFSA (2009 and 2011).
EFSA report Total outbreak number
Number of verified
outbreaks
Number of people afected
Number of hospitalizations
2007 105 102 1,062 29 2009 124 59 1,132 93
Notably, the total number of outbreaks in 2007 was reported to be increased in
41.9% over 2006 (EFSA, 2009). Although to a lesser extent (approximately 18%), this
growing trend, has been also observed in the period between 2007 and 2009 years
(EFSA, 2011). However, it is important to take in account that the number of
hospitalizations was considerably higher in 2009, 8.2 %, compared to 3.6 % in 2008,
and noteworthy, three time bigger compared with hospitalizations (29 cases) declared
by EFSA report in 2007 (EFSA, 2009, 2011).
Among European Union countries, France presents the major incidence of
Bacillus outbreaks (approximately 67%), followed by Netherlands (approximately 11%)
and Spain (approximately 5%) (Table 5). However, verified cases in France were just
the third part of the total of reported outbreaks.
Its widely known that B. cereus foodborbe illness are underreported. In fact,
emetic and diarrheal syndromes are normally mild, shelf-limiting and of short duration,
and because of this medical care is often not needed. Besides, differential diagnosis is
problematic since emetic syndrome symptoms are similar to those observed in
Staphylococcus aureus intoxications (Seo and Bohach, 2007), and diarrheal syndrome
symptoms are similar to those observed in Clostridium perfringens foodborne illness
(Granum, 1990).
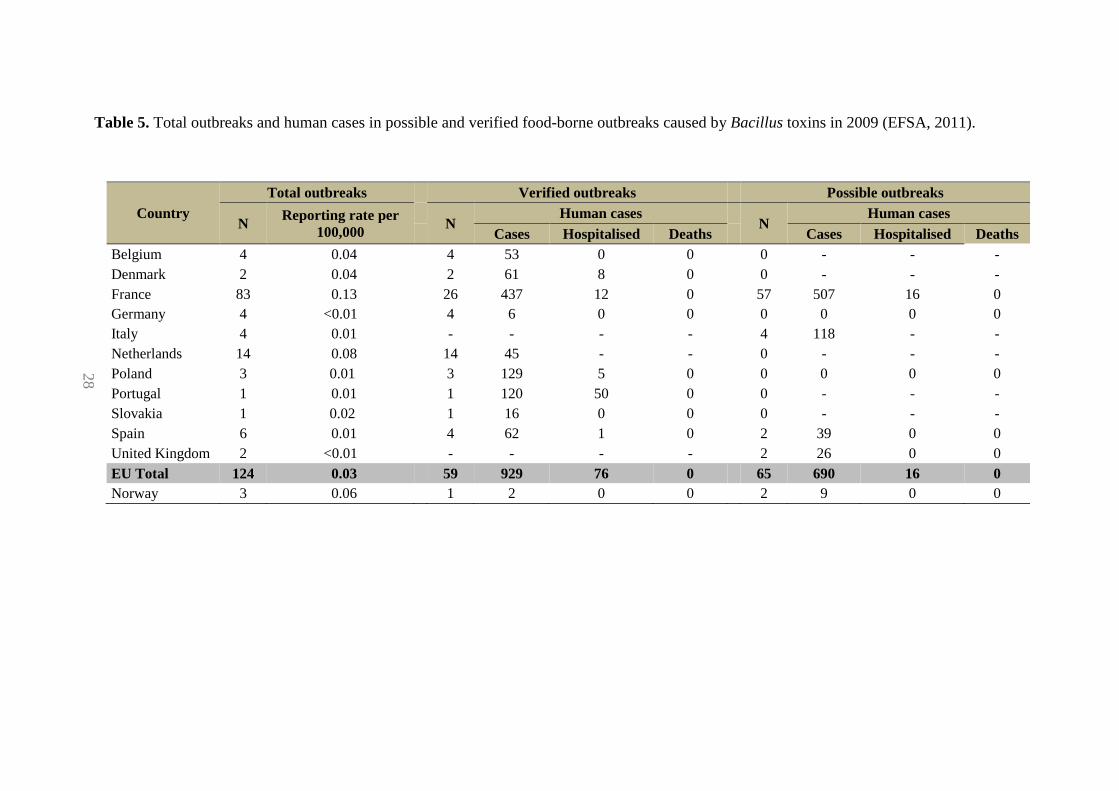
Introduction
28
Table 5. Total outbreaks and human cases in possible and verified food-borne outbreaks caused by Bacillus toxins in 2009 (EFSA, 2011).
Country Total outbreaks Verified outbreaks Possible outbreaks
N Reporting rate per 100,000
N
Human cases N
Human cases Cases Hospitalised Deaths Cases Hospitalised Deaths
Belgium 4 0.04 4 53 0 0 0 - - - Denmark 2 0.04 2 61 8 0 0 - - - France 83 0.13 26 437 12 0 57 507 16 0 Germany 4 <0.01 4 6 0 0 0 0 0 0 Italy 4 0.01 - - - - 4 118 - - Netherlands 14 0.08 14 45 - - 0 - - - Poland 3 0.01 3 129 5 0 0 0 0 0 Portugal 1 0.01 1 120 50 0 0 - - - Slovakia 1 0.02 1 16 0 0 0 - - - Spain 6 0.01 4 62 1 0 2 39 0 0 United Kingdom 2 <0.01 - - - - 2 26 0 0 EU Total 124 0.03 59 929 76 0 65 690 16 0 Norway 3 0.06 1 2 0 0 2 9 0 0
28
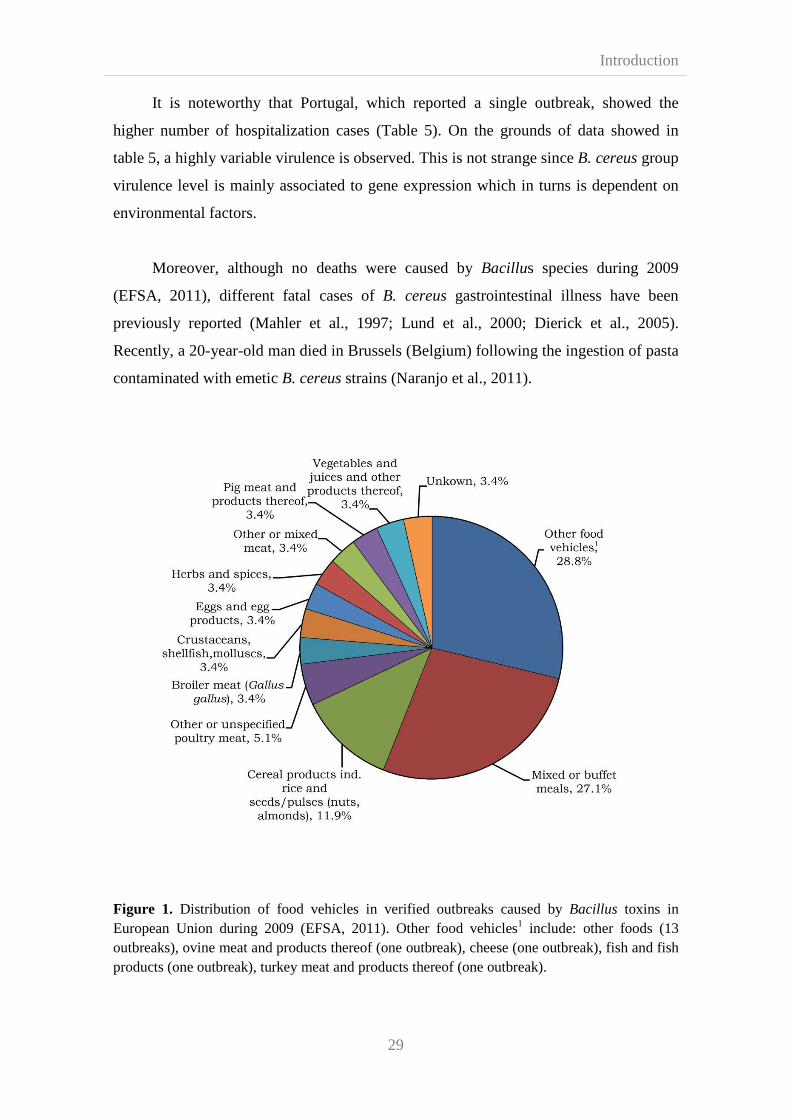
Introduction
29
It is noteworthy that Portugal, which reported a single outbreak, showed the
higher number of hospitalization cases (Table 5). On the grounds of data showed in
table 5, a highly variable virulence is observed. This is not strange since B. cereus group
virulence level is mainly associated to gene expression which in turns is dependent on
environmental factors.
Moreover, although no deaths were caused by Bacillus species during 2009
(EFSA, 2011), different fatal cases of B. cereus gastrointestinal illness have been
previously reported (Mahler et al., 1997; Lund et al., 2000; Dierick et al., 2005).
Recently, a 20-year-old man died in Brussels (Belgium) following the ingestion of pasta
contaminated with emetic B. cereus strains (Naranjo et al., 2011).
Figure 1. Distribution of food vehicles in verified outbreaks caused by Bacillus toxins in European Union during 2009 (EFSA, 2011). Other food vehicles1 include: other foods (13 outbreaks), ovine meat and products thereof (one outbreak), cheese (one outbreak), fish and fish products (one outbreak), turkey meat and products thereof (one outbreak).

Introduction
30
On the other hand, attending to the distribution of food vehicle involved in
Bacillus species outbreaks (Figure 1), it was shown that out of 59 verified outbreaks,
28.8% were caused by the consumption of ovine and turkey meat, fish and cheese,
27.1% by mixed or buffet meals and 11.9% by cereal products including rice. Agata et
al. (2002), reported that boiled rice and farinaceous food could sustain production of
high levels of cereulide, although this toxin have been also detected in infant formulas
and at low level in egg, meat and liquid foods such as milk and soy milk (Stenfors
Arnesen et al., 2008). Otherwise, diarrheal disease is often associated with protein-rich
foods, such as meat, vegetables, puddings and milk products (Abee et al., 2011).
Additionally, depending on habits of consumption, food vehicles appear to be
associated with the global distribution of the B. cereus foodborne disease. Thus, in
Japan and UK the emetic type is prevalent, whilst in North Europe and North America
the diarrheal syndrome is more frequent (Kotiranta et al., 2000; Stenfors Arnesen et al.,
2008).
2.2. Stress response in B. cereus group microorganisms
2.2.1. General stress response
Bacteria are exposed to changing environmental stresses such as temperature, pH
osmolarity and nutrient availability fluctuations. To cope with these adversities, bacteria
can use flagellum to move to more favorable locations or adapt by changes in the
pattern of gene expression whose products are required to combat the deleterious nature
of stress (Marles-Wright and Lewis, 2007). The transcription of these genes is tightly
controlled through activation of transcription factors which interact with RNA
polymerase (RNAP).
Sigma factors (σ) are a family of transcription factors with a role in stress
resistance. Upon exposure to stress, sigma factor binds to the core of RNAP (composed
of five subunits (α2ββ’ω)) forming the RNAP holoenzyme able to recognize promoters
and melt DNA (van Schaik and Abee, 2005). In exponentially growing cells
transcription is mediated by RNAP holoenzyme which carries a “house-keeping” sigma
factor that is similar to σ70 in Escherichia coli and σA in Bacillus subtilis (van Schaik
and Abee, 2005). In addition, during stress conditions and cellular differentiation in

Introduction
31
most of bacteria other sigma factors, termed alternative sigma factors, can be present in
the cell. Among Gram-positive bacteria with low GC content, genera Bacilli,
Staphylococcus and Listeria have been shown to increase their resistance to stress
through the activation of the alternative sigma factor σB.
The stress that activates σB and the organization of the σB operon are different for
B. cereus group in comparison to other Gram-positive species (van Schaik et al., 2004).
In B. cereus ATCC 14579 a gene cluster encodes σB consisted of five open reading
frames which encodes regulators of σB activity, the structural σB gene, and a protein
stress-Inducible Dps-Like Bacterioferritin (Ivanova et al., 2003; Wang et al., 2009). The
products of all this open reading frames exhibit high amino acid identity with
homologues encoded in B. anthracis Ames e, B. cereus ATCC 10897 and B.
thuringiensis subsp. Israelensis ATCC 35646 genome, highlighting the close
relationship among the different members of the B. cereus group (van Schaik et al.,
2004).
σB operon is transcribed as a 2.1-Kb transcript including rsbV, rsbW, sigB and
orf4. orf4 is under control of an additional σB-dependent promoter. Transcription start
upstream rsbV and ends downstream orf4 where is a loop that was suggested to acts as
a terminator. rsbY gene is located downstream of the σB operon encoding a protein with
a C-terminal PP2C phosphatase (van Schaik et al., 2004).
σB activation involves RsbV and RsbW regulators which are conserved in all the
Gram-positive bacteria that have σB. However, RsbY regulator is only crucial for σB
activity in B. cereus (van Schaik et al., 2005a). Figure 2 shows the proposed model for
regulation of σB activity in B. cereus. Under unstressed conditions σB is bound to its
anti-sigma factor, RsbW, in this form σB cannot bind to RNAP and remains in inactive
state. Under stress conditions the sigma factor antagonist, RsbV, binds RsbW forming
the RsbV-RsbW complex, relased σB alternative factor that now can bind to RNAP and
start transcription of σB-dependent genes. RsbW can also acts as a kinase and
phosphorylate a serine residue of RsbV making impossible complex formation in non-
stressed cells. Under environmental stress, RsbV is desphophorilated by the action of
RsbY phosphatase and then RsbV can bind to RsbW (van Schaik et al., 2005a).
Recently, de Been et al. (2010) have proposed that PP2C-type phophatase RsbY
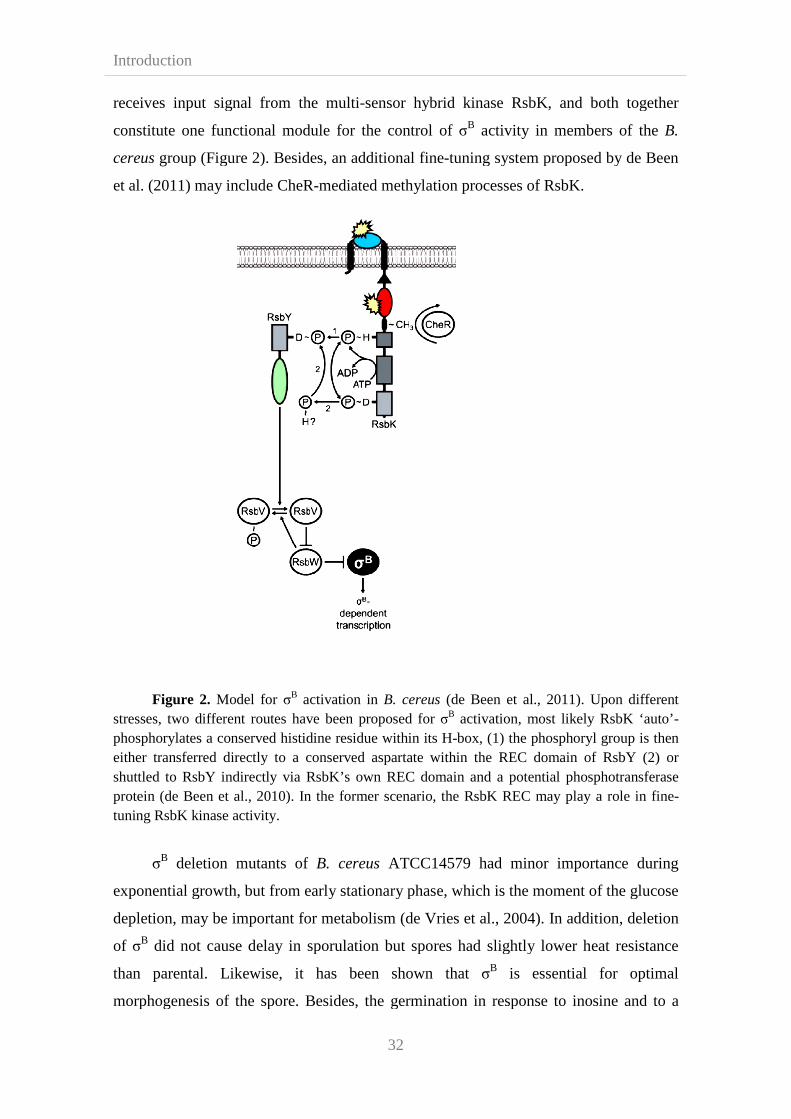
Introduction
receives input signal from the multi
constitute one functional module for the control of
cereus group (Figure 2). Besides, an additional fine
et al. (2011) may include CheR
Figure 2. Model for σ
stresses, two different routes have been proposed for phosphorylates a conserved histidine residue within its Heither transferred directly to a conserved aspartatshuttled to RsbY indirectly via RsbK’s own REC domain and a potential phosphotransferase protein (de Been et al., 2010). In the former scenario, the RsbK REtuning RsbK kinase activity.
σB deletion mutants of
exponential growth, but from early stationary phase, which is the moment of the glucose
depletion, may be important for metabolism (de Vries et al., 2004). In addition, deletion
of σB did not cause delay in sporulation but spores had slightly lower heat resistance
than parental. Likewise, it has been shown that
morphogenesis of the spore. Besides, the germination in response to inosine and to a
32
receives input signal from the multi-sensor hybrid kinase RsbK, and both together
constitute one functional module for the control of σB activity in members of the
up (Figure 2). Besides, an additional fine-tuning system proposed by de Been
et al. (2011) may include CheR-mediated methylation processes of RsbK.
Model for σB activation in B. cereus (de Been et al., 2011).stresses, two different routes have been proposed for σB activation, most likely RsbK ‘auto’phosphorylates a conserved histidine residue within its H-box, (1) the phosphoryl group is then either transferred directly to a conserved aspartate within the REC domain of RsbY (2) or shuttled to RsbY indirectly via RsbK’s own REC domain and a potential phosphotransferase
). In the former scenario, the RsbK REC may play a role in fine
eletion mutants of B. cereus ATCC14579 had minor importance during
exponential growth, but from early stationary phase, which is the moment of the glucose
depletion, may be important for metabolism (de Vries et al., 2004). In addition, deletion
ot cause delay in sporulation but spores had slightly lower heat resistance
than parental. Likewise, it has been shown that σB is essential for optimal
morphogenesis of the spore. Besides, the germination in response to inosine and to a
sensor hybrid kinase RsbK, and both together
activity in members of the B.
tuning system proposed by de Been
mediated methylation processes of RsbK.
(de Been et al., 2011). Upon different activation, most likely RsbK ‘auto’-box, (1) the phosphoryl group is then
e within the REC domain of RsbY (2) or shuttled to RsbY indirectly via RsbK’s own REC domain and a potential phosphotransferase
C may play a role in fine-
ATCC14579 had minor importance during
exponential growth, but from early stationary phase, which is the moment of the glucose
depletion, may be important for metabolism (de Vries et al., 2004). In addition, deletion
ot cause delay in sporulation but spores had slightly lower heat resistance
is essential for optimal
morphogenesis of the spore. Besides, the germination in response to inosine and to a
Introduction
33
combination of inosine and L-alanine was delayed after a σB delection (de Vries et al.,
2004) suggesting that probably, important metabolic pathways that contribute to the
process of sporulation are affected in the σB null mutant.
On the other hand, was not unexpected that σB does not play a role in the
production of virulence factors and enterotoxin Nhe since in the B. cereus group the
production of these factors is governed by the pleiotropic regulator PlcR and σB did not
seem to be involved in transcription of the plcR gene (van Schaik et al., 2004).
However, B. anthracis σB deletion mutants showed 1 log difference in the 50% lethal
dose (LD50) with the parental strains (Fouet et al., 2000).
Besides, σB is activated under several stress conditions, particularly during heat
shock but also during other stresses such as high osmolarity, high ethanol
concentrations, high and low pH and oxidizing agents (van Schaik et al., 2005b). σB
deletion mutants of B. cereus ATCC14579 subjected to heat shock from 30 to 42ºC
leads to 20.1-fold activation of σB and is by far the most powerful trigger leading to σB
activation in B. cereus (van Schaik et al., 2004). Addition of 4% of ethanol or 2.5%
NaCl or an acid shock at pH 5.2 led to 4.6-4.2 and 1.8-fold induction of σB respectively
(van Schaik et al., 2004).
Conversely to expected results, deletion of σB in B. cereus ATCC 14579 leads to
hyperresistance to hydrogen peroxide, in fact, catalase activity is threefold higher during
the mid-exponential growth phase than in parental strain (van Schaik et al., 2005b).
Finally, σB shows to be related with growth and survival under low temperatures
of L. monocytogenes and B. subtilis, in resistance against antibiotics of B. subtilis and
Staphylococcus. Aureus and has a role in biofilm formation of Staphylococcus
epidermidis (Becker et al., 2000; Bandow et al., 2002; Brigulla et al., 2003; Singh and
Moskovitz, 2003; Knobloch et al., 2004).
On this ground, fundamental knowledge about σB activation is essential to
understand the behavior of stressed bacteria and therefore to successfully design
sequential preservation steps.
Introduction
34
2.2.2. Two component systems
Two-component systems (TCS) are involved in signal transduction across the
cell membrane. This signaling pathways are the most widely used by bacteria (including
archaebacteria) to sense and transduce environmental signals in order to overcome
external stress and adapt to changing conditions (Stock et al., 1989; Abee et al., 2011).
Indeed, TCS are linked to cell response, nutrient deprivation, cold and heat shock,
antimicrobial compounds, osmotic stress, low pH and many other factors (Sun et al.,
1996; Bearson et al., 1998; Aguilar et al., 2001; Jung and Altendorf, 2002; Jordan et al.,
2008). Besides, they participate in the control of motility, chemotaxis, sporulation,
biofilm formation and quorum sensing (Jiang et al., 2000; Lyon & Novick, 2004;
Szurmant and Ordal, 2004; Lopez et al., 2009).
TCS consist of an input-sensing domain composed of a trans-membrane sensor
histidine kinase (HK) and an output effect or domain, a response regulator (RR) which
generally functions as a transcription factor, able to modify expression of genes
involved in stress responses (Hoch, 2000). For signal transduction by TCS, a phosphate
is transferred from a conserved histidine located in the HK to an aspartate residue in the
phosphotransferase and RR receiver domain (Hoch, 2000).
Ubiquitous B. cereus and close species display a wide variety of TCS that allow
rapid and robust responses which contribute to the problematic presence of these
microorganisms in Food Industry (Abee et al., 2011). Various studies (de Been et al.,
2006, 2008, 2010) have reported that TCS of B. cereus strains are involved in numerous
cellular functions such as sporulation, biofilm formation, host-microbe interactions,
chemotaxis, nutrient uptake and antibiotic resistance (Figure 3).
Probably due to a major genome size, B. cereus group isolates possess a
relatively large number of TCS in comparison with other low-GC Gram-positives
bacteria (Abee et al., 2011). In each member of this taxonomic cluster, around 40 HK-
RR gene pairs and many HKs and RRs genes not encoded in pairs (‘orphans’) were
detected by applying a bidirectional best-hits method combined with gene
neighbourhood analysis to a set of HKs and RRS recovered through in silico techniques
from eight sequences of B. cereus group genomes (Figure 3) (de Been et al., 2006).

Introduction
35
Besides, B. anthracis lacks specific HKs and RRs and contains a major number of
truncated and HK and RR genes, possibly because of a reduced exposition to
environmental stimuli as consequence of the pathogenic specialization of this
microorganism (de Been et al., 2006).
Figure 3. Overview of TCSs in B. cereus. HKs are indicated in red (sensory) and ecru (phosphotransferase) and RRs are indicated in grey (receiver) and green (DNA-binding domain). Blue domains indicate protein-protein interaction domains. White and light (red, green, blue) domains indicate the absence/truncation of the respective domain in at least two of the B. cereus group members analyzed. Incoming arrows indicate predicted or established HK-specific stimuli. Inside the cell, black and grey arrows represent predicted phosphotransfers between paired and “orphan” HKs and RRs, respectively. RRs for which specific operators have been predicted are “connected” to the DNA. Other connection lines illustrate protein-protein interactions. Specific stimuli are numbered as follows: 1, general stress response (heat and NaCl), 2, antibiotics, 3, antimicrobials, 4, heme, 5, calcium, 6, metals, 7, oxidoreduction potential, 8, phosphate limitation, 9, chemotactic signals, 10, amino acids (glutamine), 11, antimicrobial (cationic antimicrobial peptide), 12, tricarboxylic acid cycle intermediates, 13, ComX-like auto-inducing peptide, 14, antimicrobials, 15, antibiotics, 16, ComC- or ArgD-like auto-inducing peptide, 17, general stress response (proton motive force), 18, antimicrobials. A corresponds to protein CheA, B to protein CheV, C to protein CheY, all participating in B. cereus chemotactic response. Besides, D corresponds to Spo0F, E to Spo0B, F to Spo0A which are involved in B. cereus sporulation. Furthermore, G corresponds to RsbK, H to RsbY and I to alternative sigma factor σB. Finally, J corresponds to LytS which is a sensor histidine kinase and K to the transcriptional regulator LytR. Each TCS depicted has been numbered by de Been et al. (2006) (Modified from Abee et al., 2011).
Introduction
36
2.2.3. SOS response and adaptive mutagenesis
SOS is widespread bacterial response induced after exposure to various stresses
and agents that cause damage to DNA or the collapse of the replication forks (van der
Veen and Abee, 2011). This conserved adaptive mechanism, with an active role in stress
resistance and in the induction of genetic diversity, is regulated by the repressor LexA
(Butala et al., 2009) and the activator RecA (Cox, 2007) and generally consists of
proteins involved in DNA repair and in translesion DNA systems (Lusetti and Cox,
2002). Recent studies have shown alternative genetic pathways to activate SOS
response in E. coli cells subjected to high pressure, to acid environments and to high salt
concentrations (DiCapua et al, 1990; Aertsen and Michiels, 2005; Sousa et al., 2006)
As a natural consequence of the SOS response, mutagenesis processes can occur.
In fact, translesion DNA polymerase due to its low specificity is able to introduce
mutations giving rise to “adaptive mutagenesis”. “Adaptive mutagenesis” is defined as a
process that produces advantageous mutations during exposure to nonlethal stress, even
when non-beneficial mutations may occur simultaneously (van der Veen and Abee,
2011). It has been shown that food preservation stresses, starvation periods, stationary
phase, aging colonies, resting organisms and exposure to antibiotics may induce genetic
changes and subsequent “adaptive mutagenesis” through mechanisms which require one
or more factors of the SOS response (Galhardo et al., 2007; van der Veen and Abee,
2011). Otherwise, factors and mechanism involved in various stress responses
independent of SOS response are also involved in “adaptive mutagenesis” (Goldfless et
al., 2006).
During food preservation, especially in minimally processed foods, to reduce
negative influence of overprocessing and maintain nutritional and microbiological
quality, different mild simultaneous stresses or successive exposure to mild treatment
are widely used. However, this food preservation technology together with factors such
as the specific composition of the raw materials, the storage conditions and the cleaning
regimes may trigger SOS response (van der Veen and Abee, 2011). As previously
reported, contaminated food exposed to nonlethal doses of ultraviolet light (Clerch et
al., 1996), to industrial oxidative disinfectants (Goerlich et al., 1989), to heat treatments
(van der Veen et al., 2007), to high pressures (Aertsen and Michiels, 2005), to

Introduction
37
preservative compounds such as acids (Sousa et al., 2006) and to high salt concentration
(DiCapua et al., 1990), result in the activation of the SOS response which may
subsequently lead to adapted pathogenic and spoilage bacteria that are more difficult to
eradicate from food production chain (Figure 4). In addition, SOS response is
specifically associated to the production of phenotypic variants generally associated
with biofilms and even in the formation of some types of this structured communities
(Boles et al., 2004; Boles and Singh, 2008; Nuryastuti et al., 2008; van der Veen and
Abee, 2010).
Figure 4. Overview of environmental stresses involved in SOS response trigger and
mechanisms of SOS response in bacteria. At different steps of the food chain different stresses such as composition of raw materials, storage conditions of final products, processing steps, addition of specific preservatives and/or cleaning regimes (heat, high pressure, UV-radiation, oxidative compounds, acids, and/or antimicrobial compounds) may trigger SOS response through DNA damage (D), replication fork inhibition (referred as I), blockage of origin of replication (referred as B) and activation of Mrr (referred as Mrr), a restriction endonuclease which digest DNA resulting in double-stranted DNA fragments.(van der Veen and Abee, 2011).

Introduction
38
Is it noteworthy that this mechanism may induce diversity, stress resistant
subpopulations and cross-protection phenomena, as for instance E. coli recA knockout
mutants, which are more sensitive to heat inactivation (Duwat et al., 1995; van der Veen
et al., 2010). Therefore, SOS response should be taken into account for successful
design of novel preservative methods based on combined treatments.
2.3. Predictive microbiology
As it is widely know, predictive microbiology is the field of study that combines
microbiology elements, mathematics and statistic, to develop models that
mathematically describe and predict the growth or death of the microorganism when
they undergo some specific environmental conditions (Whiting, 1995).
In 1949, Monod reported that “…the growth of the bacterial cultures, despite the
immense complexity of the phenomena to which it testifies, generally obeys relatively
simple laws…The accuracy, the ease, the reproducibility of bacterial growth constant
determinations is remarkable and probably unparalleled, so far as biological quantitative
characteristics are concerned”. Few decades later, and on the premise that the responses
of population of microorganisms to environmental factors are reproducible, modelling
techniques are fully implemented in Food Sciences for estimating the shelf life and
safety of many food products allowing reliable, fast and accurate predictions of
microbiological food quality.
2.3.1. Lag phase and exponential growth
Viable cells of different bacterial species have a comparable life cycle (Figure
5). When microorganisms are subjected to growth promoting environments there is a
time elapsed until the onset of growth which is the so-called lag phase. During this
period, cells adjust their metabolism to the new environment. The duration of this phase
depends on the magnitude of the change between previous and current environmental
conditions.
When lag phase ends, microorganisms start to grow exponentially giving place
to the exponential growth phase. The speed of growth is expressed as the maximum
specific growth rate. Métris et al. (2005) reported that the time to first division is
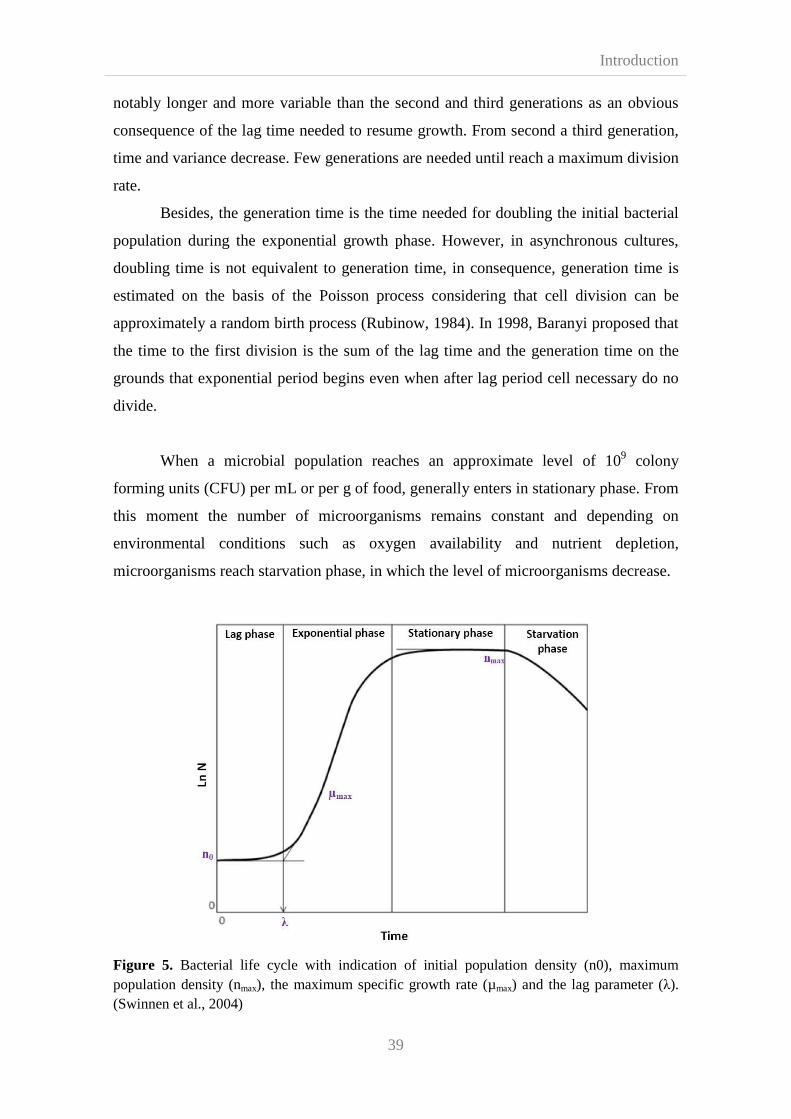
Introduction
39
notably longer and more variable than the second and third generations as an obvious
consequence of the lag time needed to resume growth. From second a third generation,
time and variance decrease. Few generations are needed until reach a maximum division
rate.
Besides, the generation time is the time needed for doubling the initial bacterial
population during the exponential growth phase. However, in asynchronous cultures,
doubling time is not equivalent to generation time, in consequence, generation time is
estimated on the basis of the Poisson process considering that cell division can be
approximately a random birth process (Rubinow, 1984). In 1998, Baranyi proposed that
the time to the first division is the sum of the lag time and the generation time on the
grounds that exponential period begins even when after lag period cell necessary do no
divide.
When a microbial population reaches an approximate level of 109 colony
forming units (CFU) per mL or per g of food, generally enters in stationary phase. From
this moment the number of microorganisms remains constant and depending on
environmental conditions such as oxygen availability and nutrient depletion,
microorganisms reach starvation phase, in which the level of microorganisms decrease.
Figure 5. Bacterial life cycle with indication of initial population density (n0), maximum population density (nmax), the maximum specific growth rate (µmax) and the lag parameter (λ). (Swinnen et al., 2004)
Introduction
40
As is depicted in Figure 5, maximum specific growth rate, denoted by µmax, is
estimated from the slope of the tangent drawn to the inflexion of the sigmoid curve
which is fitted to the data representing the natural logarithm of the cell concentration
against time. On the other hand, the lag period (λ) is usually interpreted as the time from
the inoculation to the intercept of the tangent with the level of inoculums (Baranyi and
Pin, 1999).
In food microbiology, lag phase occurs after food contamination with external
sources or when contaminated food products undergo environmental fluctuations
(Delignette-Muller et al., 2005). Despite genotypic and phenotypic characteristics and
the physiological history of the population, other factors such as inoculum size and
changes in physicochemical environments pose a great impact in lag phase duration.
Thus, modification of pH, water activity, nutrient availability, temperature and gaseous
content of food products are a common tool to obtain longer shelf-life by increasing lag
phase extent. Likewise, environmental conditions inside and outside a food product
have a major impact in the maximum specific growth rate of microorganisms.
Finally, is it remarkable that lag and stationary phases are regions of zero growth
rates with important physiological and practical implications since present a minimal
metabolism and therefore are extremely difficult to inactivate. This trait is termed
“Persisters” cells and has been described for E. coli isolates (Shah et al., 2006).
2.3.2. Modelling
Predictive microbiology began over 1920, when Bigelow and Esty published a
work which enabled to calculate the time of thermal death (Rodrigo et al., 2005). Thus,
from survivor curves, the value of the primary parameter DT (decimal reduction time)
was calculated using a first order model based on the assumption that survivor rate of
microorganisms subjected to heat treatment at a constant temperature undergoes an
exponential decrease depending on time. At a given temperature, population decreases
in the same proportion for a given time interval. Later, the great incidence of non-linear
inactivation kinetics promoted the creation of alternative primary models to describe
survival curves (Rodrigo et al., 2005). Thus, Logistic and Weibull models (Peleg and
Cole, 1998) were proposed. Besides, during the 80’s and linked to computational
Introduction
41
improvements, the attention on application of mathematical modelling to the growth
and survival of microorganisms in food increased (Ross and McMeekin, 1994; Rodrigo
et al., 2005). To overcome this new needs Logistic, Gompertz (Zwietering et al., 1990)
and Baranyi (Baranyi and Roberts, 1994) primary models were developed.
On the other hand, changes in food formulation spurred the development of
secondary models. These models describe the effect of some environmental factors such
as temperature and pH on growth parameters (Delignette-Muller, 1998). The first model
of secondary level was the curve of thermal die that provides the change of DT within
the heating temperature. The inverse negative of the slope of the regression line is the
parameter z (Rodrigo et al., 2005). Subsequently, different secondary predictive models
were enounced to describe inactivation rate and model growth. Thus, Arrhenius-type
models, developed on the basis of the “classical Arrhenius equation, and Square-root
type models, including Ratkowsky model (Ratkowsky et al., 1982) and other derived
from this one, were developed to describe the rate of microbial growth as a function of
temperature (Davey et al., 1978 ; Ross and McMeekin, 1994).Otherwise, Modified
Arrhenius models, introduced by Davey (1989), were used to model effects of
temperature and water activity on microbial growth kinetic parameters (Rodrigo et al.,
2005). Likewise, other authors have developed models based on Bigelow equation
(Mafart and Legerinel, 1998) to describe the effect of temperature and pH on D value.
In addition, Polynomial or Response surface models, which consist in regression
equations that are fitted by using standard of regression techniques and can contain
quadratic, cubic or reciprocal terms including also the interactions among the
considered factors (Buchanan and Bagi, 1994), were proposed as an empirical approach
to the problem of summarizing growth rate responses (Ross and McMeekin, 1994) and
are among the most used secondary predictive models.
However, secondary models do not always take lag phase into account.
Polynomial-type models more commonly are independent of generation time and lag
time. Conversely, square root-type models are generally developed assuming that lag
time is proportional to the generation time (Delignette-Muller, 1998). Furthermore, it
has been shown that unlike generation time, lag time depend not only on current growth
conditions, but also on previous conditions.

Introduction
42
Most of deterministic models traditionally described lag phase based on a
geometrical interpretation (Metris et al., 2005). To accurately calculate lag time, new
models were developed taking into account inoculum history. Thus, Baranyi et al.
(1993), Baranyi and Roberts (1994) and Hills et al. (1994, 1995) proposed the first
mechanistic models to estimate the lag phase. In the model of Baranyi and Roberts
(1994) “work to be done” parameter (h0) was proposed, and corresponds with the time
required for cells to adapt to a new environment, and is defined as the product of the
exponential growth rate and the lag time when the rate at which the work is carried out
is equal to the maximum specific growth rate. Meanwhile, Hills et al. proposed that lag
phase extent depends on the time required to reach a maximum value of cell biomass for
a particular environment.
Subsequent studies analyzed relationship between lag phase duration and growth
rate. Robison et al. (1998) reported that environmental factors differently affect this
relationship. Numerous authors have studied the dependence of h0 on the inoculum
history (Le marc et al., 2010; Muñoz-Cuevas et al., 2010). Mellefont and Ross (2003)
defined the relative lag time (RLT) as the ratio of the lag time to the doubling time, to
quantify the effect of the environment on h0 and the rate at which this work is done
during lag phase.
One step further, different authors studied the dependence of both parameters on
the previous and current conditions in fluctuating environments. Indeed, microbial
quality and safety may be characterized by a high level of variation (Poschet et al.,
2004). Notably, dynamic approaches are of great interest since foodstuffs are subjected
to changing conditions during their shelf-life. Temperature, pH, gaseous atmospheres
and water activity fluctuations affect bacterial life-cycle and growth parameters and
should be take into account for modelling purposes. On the basis of the dynamic model
for growth of bacterial population described by Baranyi and Roberts (1994), Muñoz et
al., (2010) proposed that a population of cells in lag phase which are subjected to
environmental fluctuations restart a new lag phase and therefore, the work to be done in
the new lag phase also include the uncompleted workload from the previous lag phase.
On the other hand, taking into account that some foodborne pathogens can be
infective at very low concentrations and deterministic models are not suitable for
Introduction
43
situations when the bacterial population consists of less than 102 CFU/mL (Metris et al.,
2005), stochastic models have been developed to avoid inaccurate results that could be
obtained from the extrapolation of population growth parameters to low-level
contaminated food (D’Arrigo et al., 2006).
Stochastic models have been applied for long time in biotechnology and medical
studies, and besides allow predicting probabilities of survival and growth at low cell
numbers, are able to accomplish the increasing demand of robust predictions for
quantitative risk assessment application (Baranyi et al., 2002).
Unlike deterministic models which are able to predict a single value for the
microbial load at a certain time instant, stochastic models use random variables to
obtain uncertain results. To perform stochastic models numerical methods are needed.
Numerical methods are algorithms that rely on random number generators, for each trial
the sequence of these numbers will be different so the result will also be different, and
to draw conclusions is needed to perform statistics of many trials. Thus, stochastic
predictive microbiology is a key element that encompasses model type incorporating
uncertainty at the level of measurements and models parameters and predicts the
microbial load by a probability mass function (Nicolaï and Van Impe, 1996).
In 2002, Baranyi described a model to accurately estimate probability of survival
and growth based on the analysis of the distribution of the individual cell lag times. It
has been shown that changes in substrate or sublethal injury results in different
distributions of the individual lag times indicating a certain history effect. Therefore,
this information could be of major interest for optimization of food processing
procedures (Baranyi et al., 2000).
Novel predictive models, classified as Tertiary models, are algorithms
incorporated into devices that record and integrate the effect of environmental variables.
Microbial Resources Viewer (MRV) (Koseki, 2009), a web-tool for application of these
predictive models, provides information concerning growth/no growth boundary
conditions and the specific growth rates of required microorganisms allowing the
identification of minimum processing condition for a required log reduction to
successfully determine appropriate food design and processing.

Introduction
44
Future challenges for predictive microbiology is to generate mechanistic models
able to describe cellular heterogeneity in genetically homogeneous populations on the
basis of molecular physiology studies performed at single cell/spore level. Likewise,
development of mathematical models able to describe bi-stable signaling networks
might be relevant for food microbiology, however, previous studies under relevant
physiological (food) conditions are needed an as much as possible using the relevant
food isolates (Havelaar et al., 2010).
Finally, it is essential to bear in mind that to accurately understand the reliability
of models it is not sufficient to observe that a particular method or model appears to
work, but is essential to know why it works to understand and judge their results and
improve them (Bratchell et al., 1989).
2.3.3. HACCP and Risk assessment
Hazard analysis and critical control points (HACCP) were developed as an
alternative method for time-consuming and laborious analysis used to determine
microbiological quality of the food product. This safety analysis system is focused on
“the identification and real-time monitoring of physical and chemical attributes at
critical control points as a means of controlling foodborne pathogens“ (Buchanan,
1995). Together with good manufacturing practice (GMP), HACCP has been
extensively applied showing effective results (Van Der Spiegel et al., 2004).
To reach public health objectives, microbial risk assessment (MRA) plays a key
role in HACCP. MRA aims to evaluate the probabilities and severities for consumers’
health derived from the exposure to pathogenic microorganisms present in foods for
further implementation of appropriate management options. Usually, these evaluations
consist in quantitative estimations obtained from mathematical models which describe
the evolution of bacterial populations (Augustin, 2011). Thus, predictive microbiology
is essential for HACCP implementation in Food Industries (Elliot, 1996). Indeed,
stochastic models are used to characterize microbial quality and safety taking into
account microbial variability.
Introduction
45
Appropriate implementation of microbial risk management requires a deep
understanding of the whole food production chain (Havelaar et al., 2010) and is
composed of the following four steps (Augustin, 2011):
• Hazard identification, which consists of identifying and describing the
pathogenic microorganisms. Notably, correct identification of sporulated
bacteria remains being a challenge because of their diversity and the absence of
specific markers.
• Exposure assessment, which consists in evaluating the quantity of foodborne
pathogens or toxins ingested by consumers. In this regard, it has been shown that
final contamination of spore-forming microorganisms is hardly affected by
bacterial biodiversity and physiological variability.
• Hazard characterization, generally consisting of dose-response relationships
allowing estimating the probability and severity of adverse effects knowing the
ingested dose. At this point, is it remarkable that pathogenicity of sporulated
bacteria is greatly affected by biodiversity resulting in highly variable responses
to an ingested dose of these microorganisms.
• Risk characterization, allowing the estimation of risk from exposure and dose-
response modelling.
As consequence, many difficulties have been described to successfully
implement quantitative microbial risk assessment for spore-forming bacteria such as B.
cereus group (Carlin et al., 2000). As described above, this is due to the extreme intra-
species biodiversity of these microorganisms, but also because of the lack of an
appropriate model to predict spore germination and outgrowth processes (Augustin,
2011). Notably, intra-species biodiversity of sporulated bacteria cause an extremely
variable individual poisoning risk for consumers and therefore, has a great impact on
hazard identification, exposure assessment and hazard characterization. However, risk
assessment still constitutes a valuable tool to justify the implementation of management
options (Augustin, 2011).
Introduction
46
Finally, mildly preserved foods, which are based on the principle of hurdle
technology, represent a great challenge for risk managers and producers since they
require a well controlled food processing through adequate product and process design
and proper implementation and monitoring through HACCP (Havelaar et al., 2010).
2.4. Food preservation
Food preservation techniques depend largely on increasing the lag phase,
decreasing the rate of growth in the exponential phase and reducing the maximum
population density.
In the latest decades, consumers’ perception of food quality and nutrition has
changed. Great number of alternative methods and technologies are replacing traditional
heat based treatments to satisfy modern trends in food consumption and obtain fresh-
looking food, ready to eat, with high nutritional and organoleptical quality. To ensure
microbiology safety minimizing impacts on food quality, is required from industry to
implement different techniques such as mild heat treatments, non-thermal treatments
and natural preservatives that allow avoiding classical sterilization and pasteurization
methods (Havelaar et al., 2010). Usually, these techniques are used in combination,
known as “hurdle technology”, to achieve an overall microbiological food safety
(Leistner and Gorris, 1995).
In 2005, Raso et al. defined the attributes of ideal processing technologies for the
food producers as follows:
• Improvement of the shelf life and safety by inactivating enzymes, spoilage and
pathogenic microorganisms
• No changes in organoleptic and nutritional attributes
• No residues left on food
• Convenient to apply
• Cheap
• No objections from consumers and legislators

Introduction
47
Nowadays, many mildly technologies have shown to ensure food quality and
safety within the extended shelf-life. However, to control all parameters involved in
food preservation such as relevant environmental factors, food product and
microorganism, new investigation are needed, maximum when B. cereus group isolates
are ubiquitous and endospore forming bacteria with a high adaptability.
2.4.1. Hurdle technology and gamma hypothesis
In 1995, Leistner and Gorris proposed to reduce the negative influence of severe
heat treatments, the combination of various antimicrobial factors, hurdles, to guarantee
microbial safety with an acceptable shelf-life. This combined process for food
preservation is commonly known as “hurdle technology” and it is especially important
for those microorganisms and bacterial spores which are highly resistant to inactivation
technologies and are a limiting factor for the application of mild treatments (Rajkovic et
al., 2010).
This preservation technology is based in the biological fact that bacterial cells
exposed to combined methods undergo different homeostasis injuries and to resume
growth should active complex and varied stress responses (Raso et al., 2005). Aertsen
and Michiels (2004) reported that under mildly lethal stress, the ultimate cause of
bacterial inactivation is the extra effort involved in cellular response to overcome
environmental adversities. Results showed that inactivation levels and the percentage of
sub-lethal injured cells obtained depended on strain and type preservation technique
used (Rajkovic et al., 2010).
Nowadays, the concept of hurdle technology is well established. However, the
quantification of the combined impact of hurdles is still being under study Besides,
there are opposite views about how antimicrobial factors combine when are used
together in a combined approach. On one hand, one view states that synergy phenomena
occur when several antimicrobial factors are used together. Synergy can be defined as
the effect observed when hurdles are applied together and give a significantly greater
protection. An opposite view considers that combined effects are complex but there are
no interactive effects resulting in just an apparent synergy (Biesta-Peters, 2011). The
Introduction
48
alternative option, called gamma hypothesis, states that inhibitory environmental factors
combine in a multiplicative manner to produce the observed overall microbial inhibition
(Zwietering et al., 1993).
Gamma hypothesis is based on gamma factor (γ) parameter which is the ratio
between the growth rate of a microorganism when growing whit one hurdle (µmax) and
the optimal growth rate when no hurdles are present (µopt). “When multiple hurdles have
been applied, the growth rate of a microorganism can be calculated by multiplying all
gamma factors for the single hurdles and multiplying this again with µopt” (Biesta-
Peters, 2011).
It is noteworthy that, most of treatments that do not cause complete inactivation
of microorganisms induce sub-lethal injury to the present bacterial cells, and depending
on environmental conditions microorganism are able to readjust their metabolism and
resume growth (Smigic et al., 2009; Rajkovic et al., .2010;). Sub-lethal injury recovery
is determined by food intrinsic factors (water activity, pH and nutrients) and by
extrinsic factors (modified atmosphere, temperature and humidity). In addition, food is
a dynamic system and in consequence, intrinsic factors changes during the period
extending from processing to consumption playing a role of a different magnitude
depending on the time (Raso et al., 2005).
2.4.2. Relevant factors for food preservation
Several environmental factors such as pH, mild and severe heat treatment, water
activity, atmosphere packaging and chilling can be used to ensure food safety and
stability by limiting bacterial growth. The application of this factors, the hurdles, results
on slowing down or blocking growth rather than killing microorganism present, and
their effectiveness, mainly depended on the intensity of the hurdle and on the possible
resistance of the particular microorganism to this hurdle.
Is it noteworthy that, to apply principles of food preservation by combined
processes correctly, is needed a thoroughly knowledge of the antimicrobial activity of
these environmental factors alone and in combination.
Introduction
49
2.4.2.1. Temperature
Heat as a food preservation method has been used by mankind for ages. When
heat treatments are properly applied can eliminate spoilage or pathogenic biological
agents present on food ensuring microbiological quality. However, sensory and
nutritional attributed of the food are also affected. Undesirable odors, flavors and
textures cause consumers’ rejection of these foods. Besides, nutritional components of
great importance for health or even essential, such as vitamins, may be destroyed or
modified by heating.
Depending on time of exposure and temperature regime, microbial load decrease
or even is eliminated obtaining a complete sterilization. Microbial inactivation by
means of heat treatments is commonly characterized using a DT value (decimal
reduction time) which is defined as the time of the heat treatment in minutes which
gives an expected microbial inactivation of 90%. From DT data a z value, which is the
temperature change required for a 10-fold change in D value, is derived. Otherwise, F
value is a classical parameter used in sterilization processes which consists in time in
minutes at the reference temperature of 121 °C to obtain desired sterilization effect.
Vegetative cells of B. cereus group isolates growth in a temperature range
between 5and 50ºC (Guinebretière et al., 2008). In bacterial cells heat causes damage to
macromolecular cell components such as proteins and DNA. Denatured proteins lose
their specific structure and in consequence are unable to perform their function. To cope
with these adverse conditions, response to heat stress involves protein chaperones that
assist in folding and assembly of heat damaged proteins (Yousef and Courtney, 2003).
Besides, some microorganisms modify their cell membrane composition by increasing
the ratio of trans to cis fatty acids, decreasing fluidity caused by high temperatures
(Cronan, 2002).
Bacterial spores are characterized by higher heat resistance in comparison to
vegetative cells, e.g. vegetative cells of B. cereus will be destroyed by a heat treatment
of 20 min at 70°C, while spores will mainly remain unharmed (Faille et al., 1997).
Introduction
50
Among the most important spores in terms of public health are psychrotrophic and
mesophilic strains of B. cereus group.
On the other hand, low temperatures are commonly used for raw and processed
food preservation. Cells subjected to cold environment undergo a reduction in
biochemical reaction rates (Brillard et al., 2010). Besides, membrane fluidity decrease
and inefficient folding of proteins and secondary structures of RNA and DNA occur
(Schumann, 2009).
B. cereus group strains, mesophilic and psychrotrophic, are able to grow below
10ºC. This represents a major challenge for microbiologists since low levels of B.
cereus in foods can easily increase under commonly reported suboptimal refrigeration
products (EFSA, 2007). Additionally, these strains are able to resist heat treatment and
resume growth in refrigerated processed foods of extended durability (REPFED) which
are processed at a lower temperature, with maximum within the range of 65–95 °C
(Peck, 1997), to maximize their nutritional and sensory qualities
2.4.2.2. pH
The pH is a measure for the acidity or the basicity of a solution, and is defined as
the negative logarithm (p) of the molar concentration of the hydrogen ion ([H+]) (Atkins
and de Paula, 2002). It has been reported that B. cereus, depending on the acidulant
used, is able to grow at pH values as low as 5 or 6 (Adams and Moss, 2000).
Strong acids added to non-satured solution are completely dissociates into the
hydrogen ion and the anion part. A drop in the pH of medium or a food product may
cause changes in microorganisms’ internal pH or in its membrane fatty acid profile
(Biesta-Peters, 2011). On the other hand, molecules of weak acids in solution are in
equilibrium between the dissociated and the undissociated form. In low pH environment
this equilibrium is shifted to the undissociated state. In this state and depending on the
lipophilic nature of these compounds, neutral acids are able to dissolve and diffuse
across plasma membrane (Ter Beek and Brul, 2010). Once inside the cell, due to the
higher cytoplasm pH, equilibrium is shifted to dissociate state releasing protons and
anions.
Introduction
51
These charged molecules are unable to back across plasma membrane generating
a cytoplasmic pH decline and concentration of toxic anions that should be metabolized
or transported outside the cell expending ATP (Mols and Abee, 2011). In this conditions
growth declines and lag phase increases. Mols and Abee (2011) reported that after acid
shock, general stress response and secondary oxidative response are triggered in B.
cereus isolates. Likewise, pH homeostasis mechanisms and metabolic rearrangements
occur therefore eventually eliminating growth.
2.4.2.3. Water activity
The definition of water activity (aw) is the ratio of the vapor pressure (fugacity)
of water in the system at a given temperature and the vapor pressure of pure liquid water
at the same temperature. From a practical point of view, this parameter, which measures
the tendency of the water to escape from the food product, is important during food
processing and storage not only at microbiological level, but also for chemical and
physical stability of the product (Reid, 2007).
Water is present in all foods and food ingredients at different levels and
depending on its content and mobility prevents or limits microbial growth. Previous
studies indicate that B. cereus can grow at aw values as low as 0.95 (Adams and Moss,
2000). Besides, Tapia et al. (2007) reported that spore production and toxin formation
of bacteria also depend on aw.
Salt and sugar are widely used as additives in order to control bacterial growth
by decreasing aw of foods. Thus, less “free” water is available to accomplish metabolic
needs of microorganisms. Besides, hiperosmolar solutions triggers in bacterial cells
water efflux. To recover and maintain cellular turgor, B. cereus cell uptake ions using
different osmoprotectant transporters (den Besten et al., 2009). Moreover,
transcriptomic analysis of mildly and severely salt-stressed B. cereus showed
upregulation of sigB and σB-dependent genes and also of genes encoding enzymes of
central metabolism and others involved in chemotaxis and motility (den Besten et al.,
2009).
Introduction
52
2.4.2.4. Oxygen availability
B. cereus group are facultative anaerobic microorganisms. Therefore, in
presence of oxygen these bacteria obtain energy from nutrient through cellular
respiration. The energy obtained is used to synthesize adenosine triphosphate (ATP).
Most of the ATP (approximately 90%) is produced by the oxidative phosphorylation.
This metabolic pathway comprises the electron transport chain that establishes across
the membrane a chemiosmotic gradient able to drive the phosphorylation of ADP.
Finally, exogenous oxygen acts as acceptor of electrons and together with two protons,
water is formed. In oxygen deprived environment, B. cereus isolates use nitrate as an
electron acceptor (ammonification). In the absence of electron acceptors, these
microorganisms perform a mixed-acid fermentation (Rosenfeld et al., 2005) to
shyntesize ATP. In this case, electrons are transferred from reduced equivalent to an
internal electron acceptor such as pyruvate or acetyl coenzyme (Carlin et al., 2010).
Notably, it has been shown that B. cereus subjected to anaerobic atmospheres
needs for proper growth carbohydrates in addition to amino acids. Besides, many
authors have reported that nutritional adaptation to oxygen deprived environments is
reflected in the expression of the pathogenicity of bacteria. Indeed, a lower Hbl
enterotoxin production was observed during anaerobic growth on glucose that on
fructose or sucrose (Carlin et al., 2010).
Samapundo et al. (2011), reported that in general, at lower initial dissolved O2
levels slower maximum growth rate, longer lag phase duration and smaller maximum
population density. Atmosphere packaging consists in obtain lowered amount of oxygen
to limit bacterial growth of aerobic organism and to decrease oxidative reaction rates.
Removed oxygen is commonly replaced by different gases such as nitrogen, an inert
gas, or carbon dioxide. On this basis, this technology appears like an interesting option
for food preservation in combination with other environmental factors such as heat
treatments and refrigeration. Nevertheless, the application of limited oxygen
atmospheres to control B. cereus group growth emerges a challenge due to the ability of
these bacteria to adapt even to free-oxygen environments.
Introduction
53
2.5. Methods for B. cereus group identification
“Reliable methods to detect pathogens in foods are required by government
authorities, industry and researchers for trade, and for public health protection and
surveillance …In all cases the test methods must produce accurate, repeatable and
reproducible (or at least consistent) and reliable results” (McMeekin et al., 2010).
Betts (2002) considered that requirements for detecting a target organism should
be:
• Provision of a result with an acceptable time frame, perhaps even in real-
time.
• Ease of use characteristics that allow routine application in industry,
including being amenable to automation.
• To have undergone rigorous validation to allow comparison with “standard”
methods.
• To meet the requirements of laboratory accreditation authorities and
standards agencies.
• Cost-effectiveness in terms of both capital outlay and running costs.
• To provide a quantitative estimate of levels of the organism of concern.
B. cereus group identification usually include traditional culture-based
techniques by using selective media, biochemical confirmations and other parameters
such as spore morphology or presence of crystal protein. Nowadays, two international
standards, ISO 7932:2004 and ISO 21871:2006, are recommended for the isolation,
identification and enumeration of B. cereus in food. Both methods are based on
polymyxin B resistance, on the inability to ferment mannitol and on the lack of
lecithinase activity (Martínez-Blanch et al., 2009).The identification process is usually
completed by using API strips, which are not sufficiently discriminative among the
members of group B. cereus
These classical techniques are expensive, time consuming and may lead to
misidentifications (Martínez-Blanch et al., 2009). On the other hand, microorganisms
from complex food matrices, such as cheese or processed meat, are more difficult to
Introduction
54
detect or quantify, even if enrichments are used. Likewise, still being a challenge direct
extraction of low numbers of bacteria from food matrices (McMeekin et al., 2010).
Since the latest years, molecular techniques are being developed as an
alternative to these traditional methods. Methods for phylogenetic analysis and isolate
typing include multi-locus variable number of tandem repeat analysis (MLVA) (Keim et
al., 2000; Ciammaruconi et al., 2008), microarrays (Doran et al., 2007; Zwick et al.,
2008), whole-genome sequencing (Read et al., 2002), multilocus enzyme
electrophoresis (MLEE) (Carlson et al., 1994; Helgason et al., 1998; Helgason et al.,
2000a; Helgason et al., 2000b; Vilas-Boas et al., 2002), AFLP (Keim et al., 1997;
Jackson et al., 1999; Ticknor et al., 2001; Radnedge et al., 2003; Hill et al., 2004;
Guinebretiere et al., 2008) and multilocus sequence typing (MLST) (Helgason et al.,
2004; Ko et al., 2004; Priest et al., 2004; Candelon et al., 2004; Sorokin et al., 2006;
Tourasse et al., 2006; Tourasse and Kolstø, 2008; Cardazzo et al., 2008; Dielot et al.,
2009; Hoffmaster et al., 2008) have been used. Recently, Tourasse et al. (2011) have
developed an updated global snapshot of the B. cereus group population based on data
of MLST and/or AFLP of closely related species profiles compiled on HyperCAT data
base (Tourasse et al., 2010). Besides, Polymerase chain reaction-based fingerprinting
methods have been applied including restrictive fragment length polymorphism (PCR-
RFLP), repetitive sequence-based PCR (REP-PCR), enterobacterial repetitive intergenic
consensus-PCR analysis (ERIC-PCR), randomly amplified fragment length
polymorphism (RAPD) and PCR analysis of internal spacer region between 16S-23S
rRNAgenes (PCR-ISR) (Martinez Blanch et al., 2010).
These techniques have not proved to adequately identify all B. cereus group
species due to the lack of species specific markers (Martinez Blanch et al., 2010). In
addition, phylogenetic analysis highlights taxonomical complexity of B. cereus group
species revealing high intraespecific diversity, especially in B. cereus and B.
thuringiensis. Therefore, as discussed previously, on the basis of gene content and
phylogenetic studies, identification of B. cereus species and strains remains a challenge
and new techniques should be assessed.

Introduction
55
2.6. Flow cytometry analysis
“The term ecophysiology suggests that a natural connection exists between
microbial ecology and microbial physiology, the former being concerned with the
responses of microbial populations to environmental influences, and the latter with
activities within individual cells” (McMeekin et al., 2010).
In the latest decades, many data of microbial ecology have been obtained
through the use of predictive models and have been stored in enormous databases.
Nowadays, ecophysiology of food pathogens is considered as an essential knowledge to
improve safety, and therefore there is a needed of link this quantitative data to those
obtained at single-cell level (McMeekin et al., 2010).
“Besides, rapid detection of microorganisms in samples is one of the key
questions to obtain real-time data for the development of more accurate quality control
programs, more efficient and less time-consuming methods. Likewise, cell viability
evaluation constitutes an issue of great importance in industrial microbiology since
often, the industrial activity involves decision making of high economical impact, which
is normally determined by the results obtained from cell viability tests” (Díaz et al.,
2010).
In this regard, flow cytometry appears as an interesting technique since allow
both the measurement of heterogeneity within a population and the analysis of
individual microorganisms of the cell. Besides, it has proved to be more rapid than
growth based methods providing real-time information on physiological status.
FCM quantitatively measures the optical characteristics of cells (or other
particles) as they are presented in single file in front of a focused light (Veal et al.,
2000). Many thousands of cells per second can be analyzed whilst are transported in the
centre of the sheath flow where is a laminar flow of cells moving in single file. When
samples are illuminated using high-pressure mercury vapour lamp or laser devices the
light beam passes through the cell stream and at this point different detectors, one on
line with the light beam, several perpendicular to it and one or more fluorescent
detectors are used to measure three parameters: forward scatter (FSC), side scatter
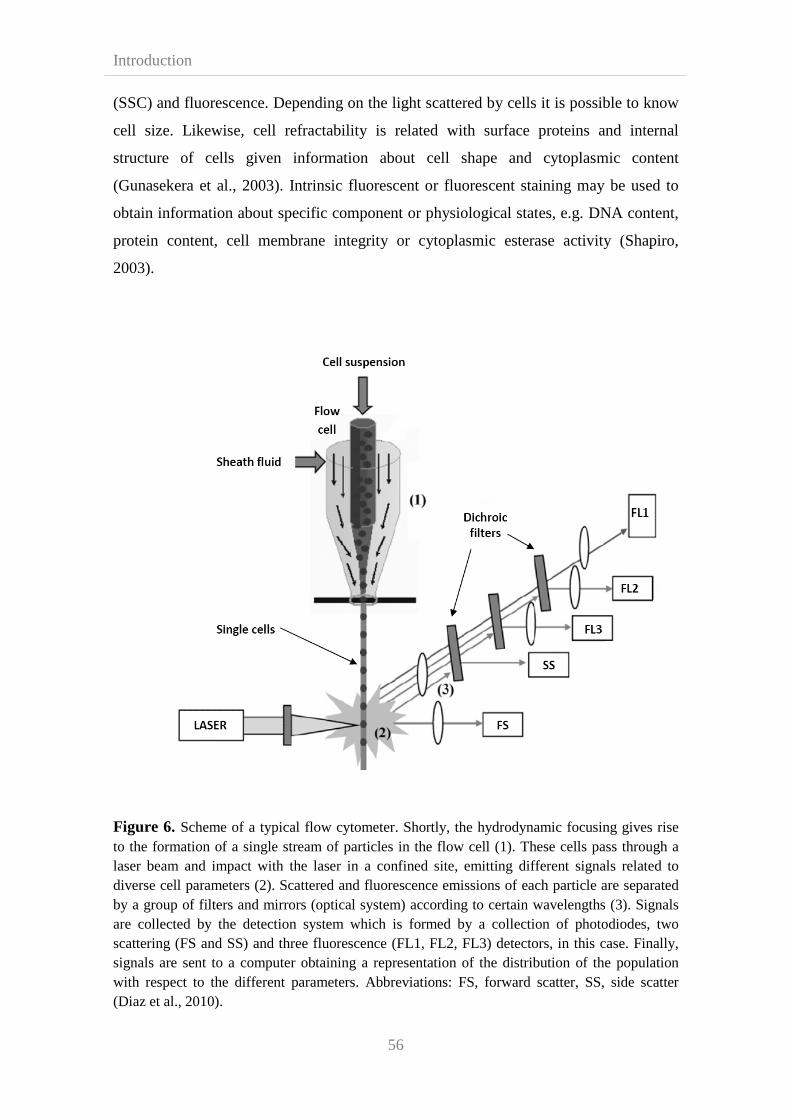
Introduction
56
(SSC) and fluorescence. Depending on the light scattered by cells it is possible to know
cell size. Likewise, cell refractability is related with surface proteins and internal
structure of cells given information about cell shape and cytoplasmic content
(Gunasekera et al., 2003). Intrinsic fluorescent or fluorescent staining may be used to
obtain information about specific component or physiological states, e.g. DNA content,
protein content, cell membrane integrity or cytoplasmic esterase activity (Shapiro,
2003).
Figure 6. Scheme of a typical flow cytometer. Shortly, the hydrodynamic focusing gives rise to the formation of a single stream of particles in the flow cell (1). These cells pass through a laser beam and impact with the laser in a confined site, emitting different signals related to diverse cell parameters (2). Scattered and fluorescence emissions of each particle are separated by a group of filters and mirrors (optical system) according to certain wavelengths (3). Signals are collected by the detection system which is formed by a collection of photodiodes, two scattering (FS and SS) and three fluorescence (FL1, FL2, FL3) detectors, in this case. Finally, signals are sent to a computer obtaining a representation of the distribution of the population with respect to the different parameters. Abbreviations: FS, forward scatter, SS, side scatter (Diaz et al., 2010).
Introduction
57
FCM has been used as a powerful, reliable and fast tool to assess the resistance
and survival of B. cereus vegetative cells to acid and osmotic stress, antibiotics, food
processing treatments, process equipment sanitation regimes (Cronin and Wilkinson,
2010), supercritical extracts (Muñoz et al., 2009) and essential oils (Paparella et al.,
2008). Moreover, previous studies reveal this technique as an effective method of
verifying the viability of microorganisms present in milk, wine and water (Porter et al.,
1995; Gunasekera et al., 2000; Malacrinò et al., 2001).

Chapter 3
59
CHAPTER 3
Survival of heat treated Bacillus cereus spores in
vegetable puree under oxygen limitation conditions.
Abstract
Bacillus cereus spores may survive pasteurization and heat resulting in
contaminated food production or processing systems, therefore causing a potential risk
for foodborne disease. To increase knowledge of B. cereus spores heat resistance, the
effect of heating medium was tested in sterile distilled water and vegetable purees at 90,
95, 100 and 105ºC. Results showed that the heating medium tested had higher influence
on bacterial heat resistance at higher temperatures and at lower ones. This effect
appeared to be more correlated with pH of the menstruum than with food composition.
As previously described, the presence of shoulders appeared frequently in the survival
curves obtained. Shoulder length increased in vegetable purees. To study the presence
and extension of shoulders and its impact on evaluation of sterilization processes,
survival curves were fitted to two different non-log linear models (Weibull and
Geeraerd) in order to compare them with the classical, log-linear regression. Root Mean
Sum of Squared Errors (RSME) values revealed that heat inactivation of B. cereus
spores was better characterized by Weibulls’ and Geeraerds’. Finally, the effect of
modified atmospheres in combination with mild (1D) and severe (4D) heat treatments
was studied in broth and vegetable substrates. Besides anaerobic environment, two
different packaging films with different oxygen transfer rates (OTR) (35cm3/m2/24h and
10-3 cm3/m2/24h) were used to obtain oxygen limitation conditions. Results revealed that
B. cereus vegetative cells efficiently adapt to oxygen limitation although a faster growth
was observed in broth. Likewise, B. cereus spores exposed to air or film with higher
OTR showed major growth rate. Notably, no significant differences on the time to reach
106 CFU/mL were found between food samples subjected to anaerobic environment and
to lowest OTR (10-3 cm3/m2/24h). 59
11110000
9
8
7
6
5
4
3
2
1

Chapter 3
60
10
9
8
7
6
5
4
2
1

Chapter 3
61
3.1. Introduction
“At present, thermal processing is still the most widely used method to preserve
food” (van Zuijlen et al., 2010). Traditionally, it is supposed that during heat treatments,
such as pasteurization, the rate of survivors decreases exponentially as a function of
heating time when a bacterial population is subjected to the action of heat at a stable
temperature. Based on this assumption, heat inactivation obeys a log linear law, from
which decimal reduction time (DT) can be derived. Official methods to calculate sterility
use DT values as measures of the organisms’ or the spores’ heat resistance at a given
temperature (Periago et al., 2004).
Frequently, survival curves show deviations from the log linear behavior,
resulting in shoulder and tail phenomena (Fernandez et al., 2001; van Zuijlen et al.,
2010). Different factors have been pointed out as causative agents of this phenomenon.
In 1990, Teixeira and Rodríguez reported that cell heat damage after treatments can
restore their structures and metabolism under favorable conditions causing variations on
survival curves. Fernandez and Peck (1999) observed that a subpopulation of non
proteolytic Clostridium botulinum with a higher heat resistance in the presence of
lysozyme caused curves with tailing. Recently, mechanistic details of bacterial spore
resistance are being investigated as a major key to understand heat resistance
heterogeneity. Coleman et al. (2007) reported that shoulder length seemed to be
associated with a lethal damage to one or more key spore proteins.
Due to the presence of these “non log linear phenomena” the classical concept of
inactivation modelling fails to assess accurately most of these survival curves (Geeraerd
et al., 2005). In this context, overprocessing is often applied to products that have a
prolonged shelf life to ensure food safety and prevent spoilage. This, in one hand, is
unfavorable for the product quality, and in the other hand, increases energy
consumption and CO2 emission (van Zuijlen et al., 2010).
To model non-linear survival curves different mathematical solutions have been
proposed. The “y intercept” concept proposed by Pflug (1982), takes into account only
the linear portion of the survival curve, whilst Moats (1971) fitted survival curves using
a multi-parameter description. Later, mathematical models based on frequency

Chapter 3
62
distributions have been used to describe concave and convex survival curves based on
the fact that survival graph is the result of the cumulative mortality over time and the
shape of the curve depend on how heat resistance is distributed in the population
(Mafart et al., 2002; Van Boekel, 2002).
B. cereus strains have important implications for the food industry causing
spoilage and foodborne outbreaks. Due to their metabolic diversity and their ability to
form highly resistant endospores these microorganisms are able to colonize a wide
variety of habitats at a very broad range of growth temperatures. Members of this specie
have been isolated from a large number of sources including ready to eat food products,
such as vegetable purees (Carlin et al., 2000; Rajkovic et al., 2006a; Turner at al., 2006),
causing emetic and diarrheal foodborne illnesses after consumption (Samapundo et al.,
2011).
The molecular genetics of heat stress response of B. cereus involve a wide range
of heat shock proteins (HSPs) among which are molecular chaperones such as DnaK,
GroEL, CSpB and CspE and ATP-dependent proteases (ClpP) (Periago et al., 2002a).
These HSPs mediate in folding, assembly, and repair and prevention of aggregation
under stress and nonstress conditions maintaining quality control of cellular proteins
(Periago et al., 2002a). Likewise, anti-sigma factor antagonist RsbV is also induced by
heat shock indicating the activation of σB in B. cereus under these conditions (Periago et
al., 2002a; van Schaik et al., 2004). In addition, HSPs homolog to stress proteins and
other related with sporulation as well as proteins involved in metabolic process and rod
shape-determining protein MreB are induced upon heat stress (Periago et al., 2002a).
Thus, bacterial heat resistance is partially determined by their genetic makeup
but also by environmental factors (Stumbo, 1973). A relevant parameter for process
evaluation is food composition, since it may influence microbial heat resistance
(Condon and Sala, 1992). Mineral salts, pH, presence of organic acids, carbohydrates,
proteins and fats should be taken into account to obtain realistic data of thermal
inactivation in the food substrate.
On the other hand, ready-to-eat, cooked chilled or refrigerated processed foods
of extended durability (REPFEDs) (Nissen et al., 2002) are subjected to mild heat
Chapter 3
63
processing in order to minimize the damage of the organoleptic and nutritional
properties of the food. However, this may further enhance the spore survival, and thus
the persistence of spore formers in food production environments.
Combining hurdles can be used to achieve an overall level of protection in food
stability and safety while minimizing impacts in food quality (Leistner and Gorris,
1995). In this regard, it is largely known that bacteria are more demanding with
environmental conditions after heat treatment (Adams, 1978) and therefore, recovery of
damaged cells is strongly influenced by physico-chemical factors such as pH, water
activity or anaerobic atmospheres (Feeherry et al., 1987).
Modified atmospheres are extensively utilized in the food industry to ensure
quality and extend the shelf-stability of food products on the basis that oxygen
availability affects redox-dependent bacterial functions such as growth, metabolic
pathways, radical formation and virulence gene transcription (Duport et al., 2004, 2006;
Rosenfeld et al., 2005; Zigha et al., 2006, 2007; Esbelin et al., 2008, 2009; Mols et al.,
2009). Nevertheless, Carlin et al. (2000) reported that growth of both obligate and
facultative anaerobes may occur in presence of residual oxygen in vacuum packages or
modified atmospheres. In fact, B. cereus is a facultative anaerobic organism which
grows in oxygen-deprived environments by two different pathways, respiration using
nitrate as an electron acceptor (ammonification) and mixed-acid fermentation in the
absence of electron acceptors with lactate, acetate, formate, ethanol, succinate, pyruvate
and traces of 2,3-butanediol as major products (Rosenfeld et al., 2005; Zigha et al.,
2007). Anaerobic growth under nitrate respiratory conditions with either glucose or
glycerol as carbon source is preferred over fermentation in B. cereus (Zigha et al.,
2007).
Regulatory metabolic mechanisms in response to oxygen limitation involve the
two-component system ResDE, composed of a membrane-bound histidine sensor kinase
(ResE) and a cytoplasmic response regulator (ResD), and the conserved Fnr protein
among B. cereus group microorganisms, member of the Crp/Fnr (cyclic AMP-binding
protein/fumarate nitrate reduction regulatory protein) family of helix-turn-helix
transcriptional regulators. B. cereus Fnr plays a moderate role in anaerobic nitrate
respiration meanwhile is essential for anaerobic fermentation conditions (Zigha et al.,

Chapter 3
64
2007). Besides, fnr expression is also essential for Hbl and Nhe production with or
without presence of oxygen (Zigha et al., 2007). For its part, ResDE is not essential for
enterotoxin expression (Esbelin et al., 2008) and was found to play a major role in B.
cereus growth under low oxidoreduction conditions (Duport et al., 2006). Recent
studies (Esbelin et al., 2009) have reported that ResDE acts as a sentinel system capable
of sensing redox changes and coordinate a response that modulates B. cereus virulence
through a signaling-transduction process in which phosphorylated ResD may act as a
coactivator of Fnr forming transcriptionally active complexes (ResD~P-Fnr-pnhe-phbl),
meanwhile unphosphorylated ResD could interact with Fnr to form inactive complexes
(ResD-Fnr-pnhe-phbl). This finding suggests that the regulatory pathway controlling the
catabolic genes expression under anaerobic conditions in B. cereus could be similar to
this one due to the interplay between fermentative growth and virulence in B. cereus
with Fnr as major regulatory protein.
Most of the previous studies on stress response have been conducted in the
presence of oxygen, and up to date, the lack of data on B. cereus growth under oxygen
limited conditions, such as modified atmospheres, highlights the need of novel studies
on this matter, maximum if they are performed on real foods and taking into account
that such conditions enhance bacterial virulence.
In this paper, we carried out a dual work that focused on B. cereus heat
resistance studies and assessment of the combined effect of heat treatment and modified
atmosphere on B. cereus growth. In order to establish the effect of food substrate on the
heat resistance of spores, two commercial purees with different nutritional composition,
courgette and vegetable purees, were tested as heating media.
3.2. Materials and methods
3.2.1. Microorganism
The strain used in the experiment was B. cereus INRA-AVZ421, kindly
provided by the National Institute of Agronomic Research (INRA, Avignon, France).
This microorganism was isolated from refrigerated processed foods of extended
durability based on vegetables.

Chapter 3
65
B. cereus spores were activated at 80ºC during 10 minutes (Fernández et al.,
2001) to ensure that subsequent vegetative cells grown would have the same
physiological state. Next, an overnight culture was performed in Brain Heart Infusion
broth (BHI; Scharlau, Barcelona, Spain) at 30°C. Aliquots of this culture were plated
onto Brain Heart Infusion agar (BHIA; Scharlau, Barcelona, Spain) to test the absence
of bacterial contaminations.
Following the procedure described by Mazas et al. (1995), sporulation was
carried out in Fortified Nutrient agar (FNA) containing (per liter) 20 g of agar, 13 g of
nutrient broth, 3 g of NaCl, 0.1g of glucose, 0.08 g of (NH4)2SO4, 0.06 g of CaCl2, 0.05
g of MnSO4.H2O, 0.008 g MnCl2.4H2O, 0.005 g of CuSO4.5H2O and 0.005 g
ZnSO4.7H2O; pH 7.
Four B. cereus INRA-AVZ421 colonies were selected and resuspended in 100
mL of sterile saline solution 0.85%. Aliquots of 2 mL of this dilution were spread on
FNA plates and incubated face up at 37ºC for 3-5 days.
After that time, 90% of sporulation was obtained as assessed by phase contrast
microscopy (Leica DMLS, Mc Bain instruments, Wetzlar). Spores were collected by
flooding the surface of the plate with sterile distilled water. After harvesting, spores
were washed three times by centrifugation and resuspended in sterile distilled water.
The spore suspension (108-109 spores/mL, assessed by microscopic count with a
Neubauer counting chamber) was stored at -20ºC in sterile distilled water. Heat
resistance of the stored spore suspension remained unchanged during the time that the
experiment was performed.
3.2.2. Food substrates for heat resistance studies
To study the effect of heating medium on B. cereus heat resistance two
commercial vegetable purees were selected on the basis of their composition (Table 1).
Courgette puree (CP) had the following composition: water, courgette 17%,
potato, onion, extra virgin olive oil, corn starch, milk protein, salt and aromas.

Chapter 3
66
Mixed vegetables puree (MVP) had the following composition: water,
vegetables 45% (potato, celery, leek, broccoli, carrots, spinach, onion, green beans,
watercress, peas, chervil and dock), butter, modified starch, salt, sugar, yeast extract,
aroma and vitamins (C, B6 y B9).
The products were stored refrigerated at 4ºC until use.
The average pH values of these products was measured in triplicate using a pH
and ion-Meter GLP22 equipment (Crison, Barcelona, Spain), at room temperature.
3.2.3. Heat treatments
Heat resistance of sporulated B. cereus cells was determined with a
thermorresistometer Mastia (Universidad Politécnica de Cartagena, Cartagena, Spain)
(Figure 1A.) (Conesa et al., 2009), both in sterile distilled water and in the food matrices
tested, in isothermal conditions.
This equipment consists of a main vessel made of stainless steel in which heat
treatments are applied (Figure 1B.). The caliber of this container is 400 mL and its
external measurements are 8.5 cm in diameter × 12 cm height, with a screw cap, closed
through an o-ring seal. The cap features a tube that guides the stirring shaft, which is
equipped with a propeller at its lower end and is driven by a motor. The lid also houses
seven ports: two are for the arms of the electrical resistance, two for the arms of the
cooling coil, one for a Pt-100 temperature sensor which determines the temperature
during treatment, one for injection of microorganisms and a final for the sampling tube.
Finally, the lid is equipped with a rapid pressure connector through which the
instrument is connected to the external pressure source (cylinder of dry nitrogen).
The motor speed is regulated by a variable-frequency drive (VFD) through a
programmable logic controller (PLC). The homogeneity is favored by the presence
inside of the instrument of a baffle screen that enhances turbulence. The sampling tube
is stainless steel, and is prolonged in its end by a silicone tube. The latter is closed by a
pinch solenoid valve. The opening can be operated via a switch on the main control
unit. The solenoid valve, normally closed, held closed extraction tube, even when the
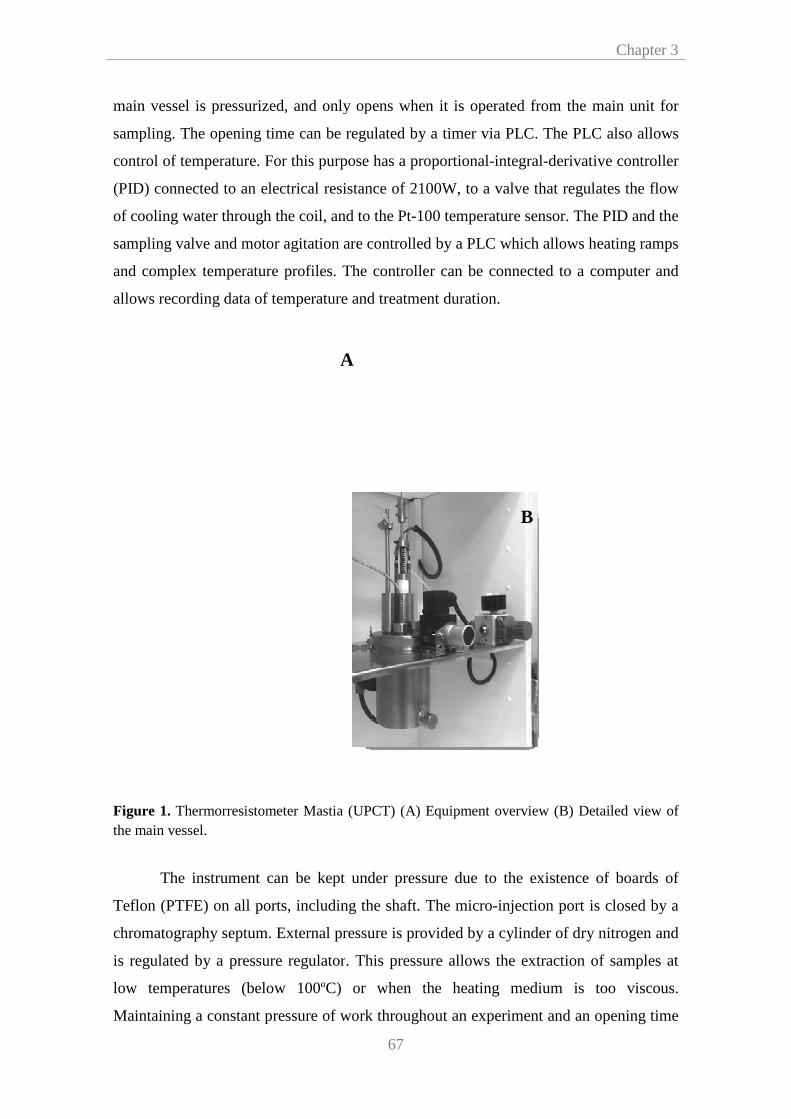
main vessel is pressurized, and only opens when it is operated from the
sampling. The opening time can be regulated by a timer via PLC. The PLC also allows
control of temperature. For this purpose has a
(PID) connected to an electrical resistance of 2100W, to a valve t
of cooling water through the coil, and to the Pt
sampling valve and motor agitation are
and complex temperature profiles
allows recording data of temperature and
Figure 1. Thermorresistometer Mastia (UPCT) (A) Equipment overview (B) Detailed viewthe main vessel.
The instrument can be kept under
Teflon (PTFE) on all ports
chromatography septum. External pressure
is regulated by a pressure regulator
low temperatures (below 100º
Maintaining a constant pressure of
67
main vessel is pressurized, and only opens when it is operated from the
sampling. The opening time can be regulated by a timer via PLC. The PLC also allows
control of temperature. For this purpose has a proportional-integral-derivative controller
connected to an electrical resistance of 2100W, to a valve that regulates the flow
of cooling water through the coil, and to the Pt-100 temperature sensor. The
agitation are controlled by a PLC which allows
temperature profiles. The controller can be connected to
of temperature and treatment duration.
Thermorresistometer Mastia (UPCT) (A) Equipment overview (B) Detailed view
can be kept under pressure due to the existence of
on all ports, including the shaft. The micro-injection port
xternal pressure is provided by a cylinder of dry nitrogen and
pressure regulator. This pressure allows the extraction of
below 100ºC) or when the heating medium
a constant pressure of work throughout an experiment and
A
B
Chapter 3
main vessel is pressurized, and only opens when it is operated from the main unit for
sampling. The opening time can be regulated by a timer via PLC. The PLC also allows
derivative controller
hat regulates the flow
. The PID and the
which allows heating ramps
a computer and
Thermorresistometer Mastia (UPCT) (A) Equipment overview (B) Detailed view of
the existence of boards of
injection port is closed by a
of dry nitrogen and
allows the extraction of samples at
is too viscous.
an opening time
Chapter 3
68
of the solenoid valve also constant, allows to obtain samples of the same volume
throughout the experiment. The sample injection can be performed using sterile medical
syringe or using a Hamilton syringe (Hamilton Company, Nevada, USA) when the
instrument has been under pressure.
The heating of micro-organisms is almost instantaneous and substrates can be
liquid, or viscous fluids, or liquids containing particles. Its design allows working at
temperatures up to 140ºC, simulating heating and cooling ramps and sterilized within
the substrate used.
Heat resistance studies were performed in distilled sterile water and vegetable
purees. Once the medium was sterilized inside the main vessel and operating
temperature was stabilized, 0.2 mL of B. cereus spores suspension (108-109 spores/mL)
activated at 80ºC during 10 min were injected by using Hamilton syringe. At specific
time intervals, which depended on the treatment temperature (90, 95, 100 and 105ºC),
samples were collected into sterile tubes, immediately diluted and plated onto BHIA.
3.2.4. Incubation and enumeration of survivors after heat treatments
Incubation of plates for survivor counting was carried out at 37ºC for 24 h.
Previous experiments showed that longer incubation times did not modify significantly
the profile of survival curves (Palop et al., 1999).
After incubation, Petri dishes with a microbial concentration in the range of 30
and 300 colonies were selected for survival counting.
3.2.5. Data analysis
To obtain an accurate assessment which allows us to design safety processing
treatments avoiding those which are overly conservative, survival curves were fitted
using Geeraerd and Van Impe Inactivation Model Fitting Tool (GInaFIT; Geeraerd et
al., 2005). Through traditional log-linear model (Bigelow and Esty, 1920), log-linear
model with shoulder (Geeraerd et al., 2000) and Weibull model (Mafart et al., 2002) B.
cereus spore heat resistance was described.
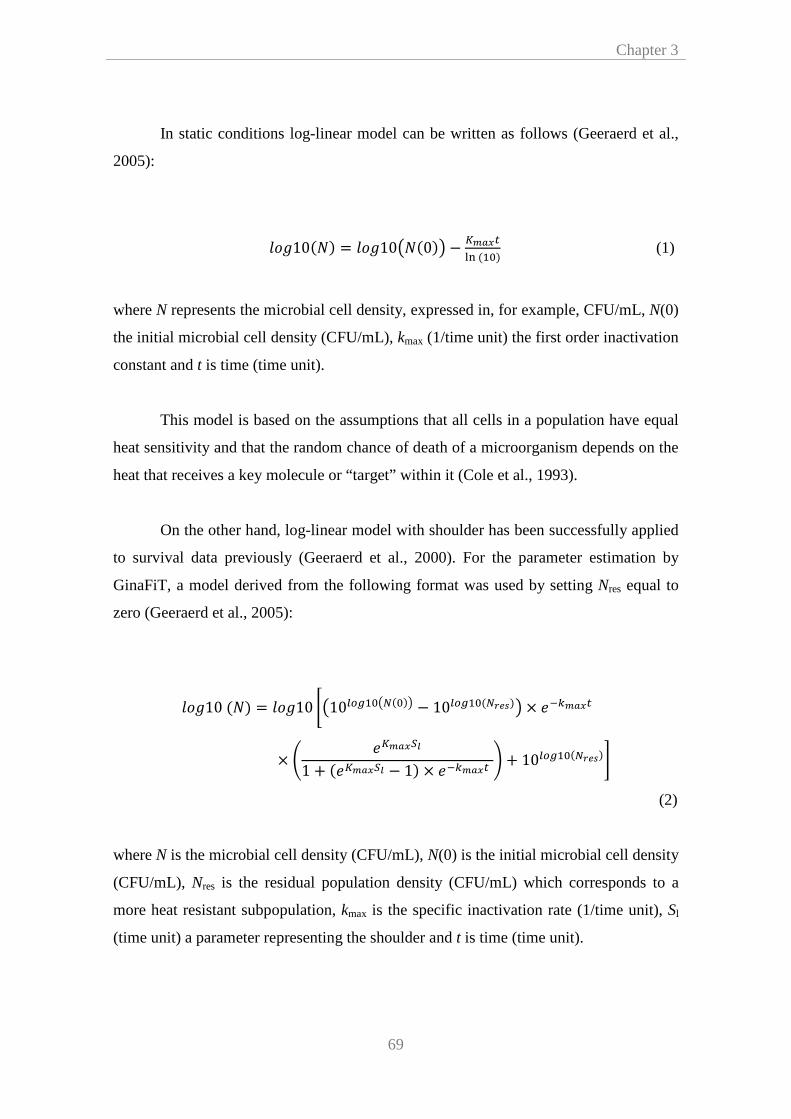
Chapter 3
69
In static conditions log-linear model can be written as follows (Geeraerd et al.,
2005):
10 = 100 − (1)
where N represents the microbial cell density, expressed in, for example, CFU/mL, N(0)
the initial microbial cell density (CFU/mL), kmax (1/time unit) the first order inactivation
constant and t is time (time unit).
This model is based on the assumptions that all cells in a population have equal
heat sensitivity and that the random chance of death of a microorganism depends on the
heat that receives a key molecule or “target” within it (Cole et al., 1993).
On the other hand, log-linear model with shoulder has been successfully applied
to survival data previously (Geeraerd et al., 2000). For the parameter estimation by
GinaFiT, a model derived from the following format was used by setting Nres equal to
zero (Geeraerd et al., 2005):
10 = 10 10 − 10 × !"
× # $%1 + $% − 1 × !" ' + 10(
(2)
where N is the microbial cell density (CFU/mL), N(0) is the initial microbial cell density
(CFU/mL), Nres is the residual population density (CFU/mL) which corresponds to a
more heat resistant subpopulation, kmax is the specific inactivation rate (1/time unit), Sl
(time unit) a parameter representing the shoulder and t is time (time unit).
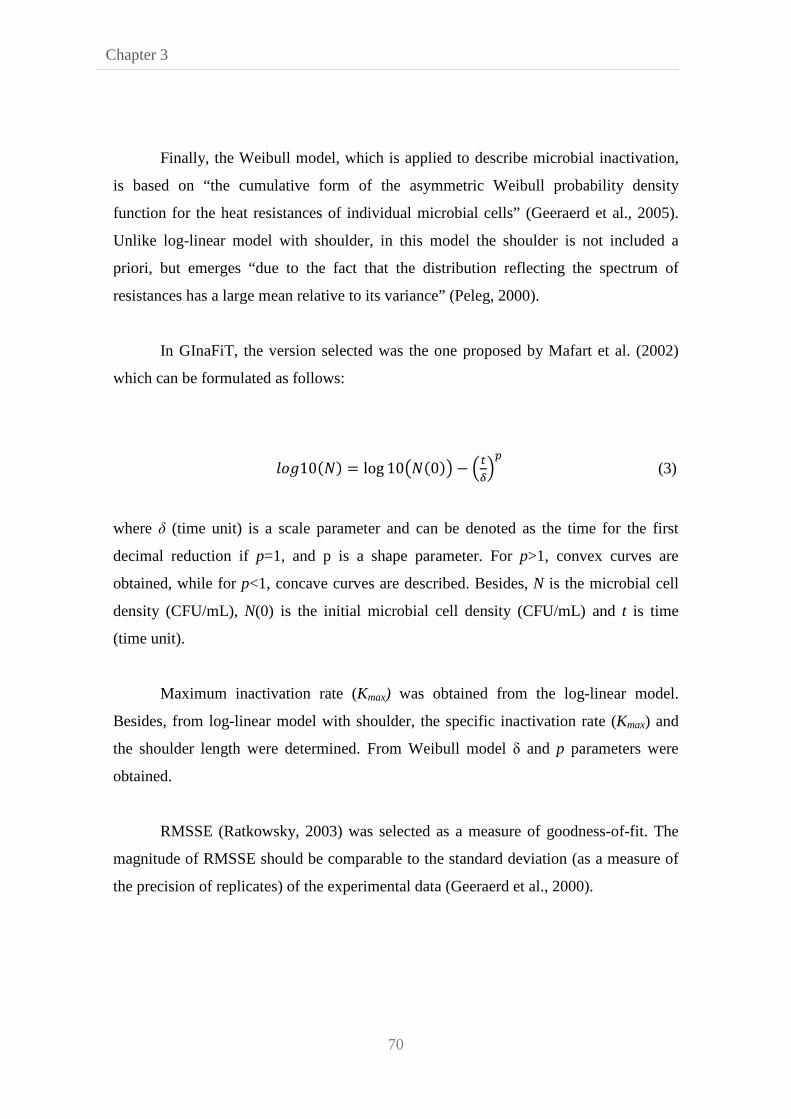
Chapter 3
70
Finally, the Weibull model, which is applied to describe microbial inactivation,
is based on “the cumulative form of the asymmetric Weibull probability density
function for the heat resistances of individual microbial cells” (Geeraerd et al., 2005).
Unlike log-linear model with shoulder, in this model the shoulder is not included a
priori, but emerges “due to the fact that the distribution reflecting the spectrum of
resistances has a large mean relative to its variance” (Peleg, 2000).
In GInaFiT, the version selected was the one proposed by Mafart et al. (2002)
which can be formulated as follows:
10 = log 100 − ,-./
(3)
where δ (time unit) is a scale parameter and can be denoted as the time for the first
decimal reduction if p=1, and p is a shape parameter. For p>1, convex curves are
obtained, while for p<1, concave curves are described. Besides, N is the microbial cell
density (CFU/mL), N(0) is the initial microbial cell density (CFU/mL) and t is time
(time unit).
Maximum inactivation rate (Kmax) was obtained from the log-linear model.
Besides, from log-linear model with shoulder, the specific inactivation rate (Kmax) and
the shoulder length were determined. From Weibull model δ and p parameters were
obtained.
RMSSE (Ratkowsky, 2003) was selected as a measure of goodness-of-fit. The
magnitude of RMSSE should be comparable to the standard deviation (as a measure of
the precision of replicates) of the experimental data (Geeraerd et al., 2000).
Chapter 3
71
3.2.6. Heat treatment before exposure to modified atmosphere
All heat treatments were conducted in sterile distilled water at 100ºC in a
thermoresistometer Mastia. As described above, once the heat treatment temperature
had reach 100ºC, a 0.2 mL volume of the spore suspension was injected into the
medium. Samples were exposed to heat temperature, 100ºC, for 3 minutes to obtain a
1D reduction (mild treatment) and for 14 minutes to obtain a 4D reduction.
3.2.7. Anaerobic packaging
Packaging was carried out inside of an anaerobic cabinet Whitley VA500
Workstation (D.W. Scientific, West Yorkshire, UK). To obtain atmospheres of 0%
oxygen, air was withdrawn and replaced by pure N2. Anoxicity was checked
periodically using a Check Point PBI Dansensor (PBI Dansensor, Ringsted, Denmark).
Besides, resarzurin strips were used as an additional method to test atmosphere inside
cabinet.
Two packaging films, laminated aluminium oxide coated PET (AlOx) and a four
layer PA/PE-foil with an EVOH barrier (EVOH) (Figure 2), were used to make plastic
bags with different oxygen permeability. The combination of hybrid polymer coatings
with thin inorganic oxidic layers made of AlOx (Figure 2A) was very effective to
achieve extremely low OTR values below 10-3 cm3/m2/24h (Amberg-Schwab et al.,
2006). To obtain higher oxygen permeation, approximately 35 cm3/m2/24h (Vicik,
1995), four layer PA/PE-foil with an EVOH barrier was used (Figure 2B).
The two packaging films evaluated were commercially available multilayer
laminates (Figure 2) currently used in different heat treated products. The film depicted
in Figure 2A is used for packaging of low and high acid ambient stable s/sauces. The
film shown in Figure 2B is used for packaging different products such as pasteurised
sausages.
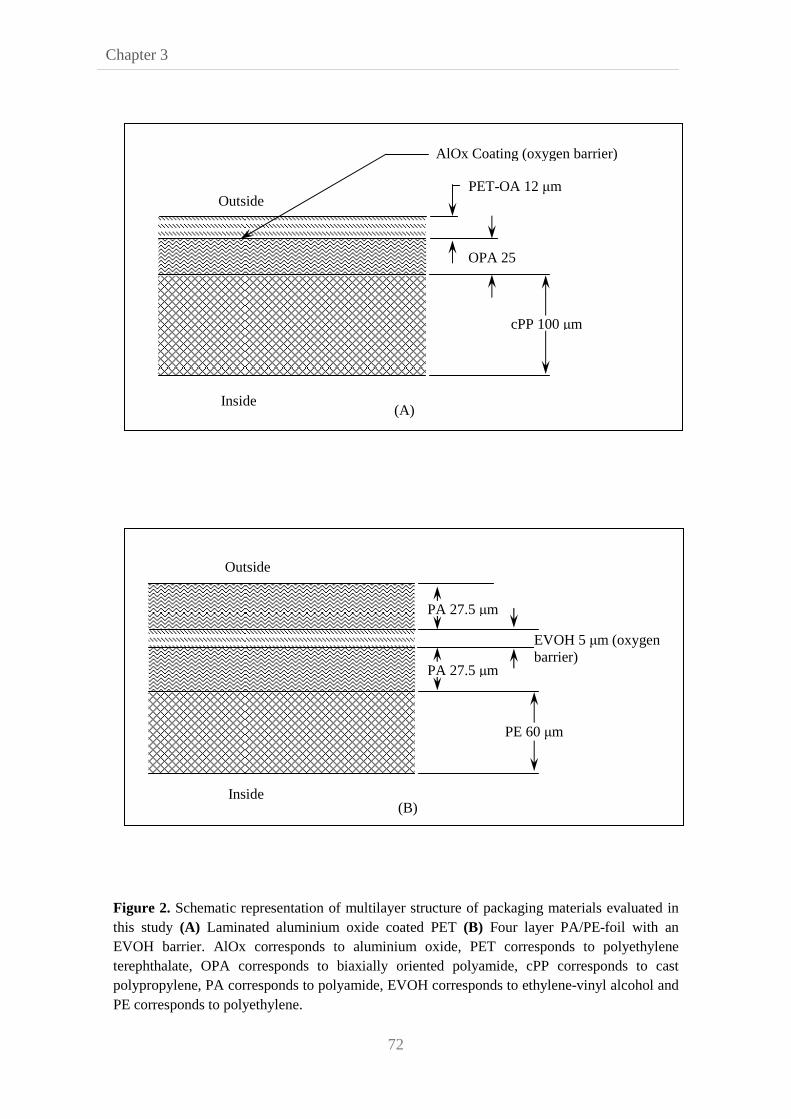
Chapter 3
72
Figure 2. Schematic representation of multilayer structure of packaging materials evaluated in this study (A) Laminated aluminium oxide coated PET (B) Four layer PA/PE-foil with an EVOH barrier. AlOx corresponds to aluminium oxide, PET corresponds to polyethylene terephthalate, OPA corresponds to biaxially oriented polyamide, cPP corresponds to cast polypropylene, PA corresponds to polyamide, EVOH corresponds to ethylene-vinyl alcohol and PE corresponds to polyethylene.
(A) )
cPP 100 µm
OPA 25
PET-OA 12 µm
AlOx Coating (oxygen barrier)
Inside
Outside
(B)
PE 60 µm
PA 27.5 µm
PA 27.5 µm
EVOH 5 µm (oxygen barrier)
Outside
Inside
Polymers were sealed to obtain bags with the following measures: 8 cm wide x
6.5 cm high (Figure 3).
Figure 3. Example of EVOH plastic bag used arrows indicate bag measures.
Depending on atmosphere composition and packaging, three different limited
oxygen conditions were tested:
• Anaerobiosis: ALOx bag
• Impermeable: ALOx bag.
• Permeable: EVOH bag
Besides, two controls were established, one in the absence of heat treatment
(indicated as control) and a positive control for the atmosphere (indicated as air), which
consists in an aerobic culture incubated in a flask sealed with leaky parafilm.
B. cereus growth in all conditions (anaerobiosis, impermeable, permeable and
air) was tested in culture medium and food. Aliquots of 15 mL of BHI and courgette
puree were transferred into plastic bags and flask, depending on the condition tested,
inoculated with 0.1 mL of spore suspension 1D and 4D and sealed. Impermeable
condition samples were introduced in an anaerobic jar during incubation period and
resarzurine strips were used to test reduced atmosphere.
73
Polymers were sealed to obtain bags with the following measures: 8 cm wide x
xample of EVOH plastic bag used to obtain oxygen limited conditionsarrows indicate bag measures.
Depending on atmosphere composition and packaging, three different limited
oxygen conditions were tested:
Anaerobiosis: ALOx bag incubated into an anaerobic jar.
Impermeable: ALOx bag.
Permeable: EVOH bag
Besides, two controls were established, one in the absence of heat treatment
(indicated as control) and a positive control for the atmosphere (indicated as air), which
aerobic culture incubated in a flask sealed with leaky parafilm.
growth in all conditions (anaerobiosis, impermeable, permeable and
air) was tested in culture medium and food. Aliquots of 15 mL of BHI and courgette
were transferred into plastic bags and flask, depending on the condition tested,
with 0.1 mL of spore suspension 1D and 4D and sealed. Impermeable
condition samples were introduced in an anaerobic jar during incubation period and
resarzurine strips were used to test reduced atmosphere.
Chapter 3
Polymers were sealed to obtain bags with the following measures: 8 cm wide x
to obtain oxygen limited conditions. Black
Depending on atmosphere composition and packaging, three different limited
incubated into an anaerobic jar.
Besides, two controls were established, one in the absence of heat treatment
(indicated as control) and a positive control for the atmosphere (indicated as air), which
aerobic culture incubated in a flask sealed with leaky parafilm.
growth in all conditions (anaerobiosis, impermeable, permeable and
air) was tested in culture medium and food. Aliquots of 15 mL of BHI and courgette
were transferred into plastic bags and flask, depending on the condition tested,
with 0.1 mL of spore suspension 1D and 4D and sealed. Impermeable
condition samples were introduced in an anaerobic jar during incubation period and

Chapter 3
74
3.2.8. Assessment of oxygen availability impact during incubation
BHI and CP samples were incubated at 30ºC. At appropriate time intervals
viable counts and pH were measured.
Modifications on pH values during incubation period were checked using a pH
Meter Basic 20 (Crison, Barcelona, Spain). Measurements were performed in triplicate.
To estimate bacterial growth viable plate count method (VPC) was applied.
Periodically, aliquots of samples were plated onto BHIA from 10-fold dilutions in
buffered peptone water (Scharlau, Barcelona, Spain). After incubation at 37ºC for 24
hours, colonies were counted. Given that B. cereus minimum infective dose is 105
UFC/mL (Samapundo et al., 2011), samples were spread at appropriate intervals until
counts reached 105-106 UFC/mL.
3.3. Results and discussion
3.3.1. Effect of heating medium on heat resistance of B. cereus under
isothermal conditions
To study the effect of the food composition on heat resistance of B. cereus,
different isothermal treatments at 90, 95, 100 and 105ºC were tested in sterile distilled
water (SDW), CP and MVP. Heat treatments were performed at least in triplicate. The
isothermal curves are presented in Figure 4. Each value in plot is the arithmetic mean of
three counts.
Table 1. Nutritional information of vegetable food substrates (values per 100 g of products) and pH values.
Food substrates Food energy
(Kcal)
Proteins
(g)
Carbohydrates
(g)
Fats
(g) pH
Courgette puree
42
1.5
3.5
2.5
5.85
Mixed vegetables puree 32 1.0 5 0.9 5.3
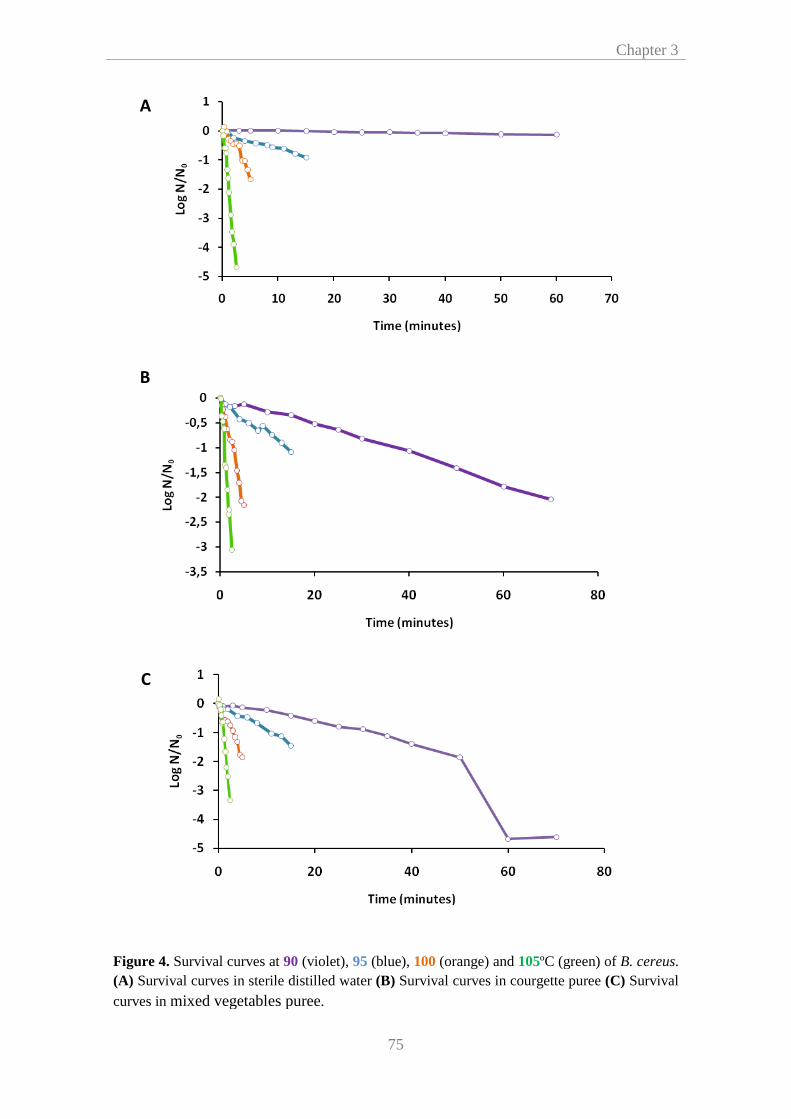
Figure 4. Survival curves at 90(A) Survival curves in sterile distilled water
curves in mixed vegetables puree
A
C
B
75
90 (violet), 95 (blue), 100 (orange) and 105ºC (green) of Survival curves in sterile distilled water (B) Survival curves in courgette puree
mixed vegetables puree.
Chapter 3
(green) of B. cereus. Survival curves in courgette puree (C) Survival

Chapter 3
76
As shown in figure 4, for the same temperature heating medium had bigger
influence on spores heat resistance at higher (105ºC) and lower (90ºC) temperatures. At
90ºC food samples showed lower heat resistance in comparison with SDW, especially
samples tested in MVP. However, at 105ºC heat resistance of B. cereus in CP and MVP
was approximately 2 folds higher related to SDW samples. At 95 and 100ºC there were
no significant differences on B. cereus spores heat resistance in the substrates tested.
During heat treatments at 90ºC there is a long exposition period (1 hour) of
bacterial spores to the physicochemical factors of the heating medium. Different authors
have reported that the pH of the heating substrate has a strong influence on Bacillus spp
survival subjected to thermal treatments causing a decrease on heat resistance the more
acid the pH (Palop et al., 1996). As was described above (Table 1) CP and MVP
showed lower pH values compared to SDW (5.85 and 5.3, respectively). According to
this, pH effect may explain this effect at 90ºC. However, at 105ºC, heat treatment
duration is too short (2.5 minutes) to allow the heating medium with pH values in a
range between 5 and 6 cause significant effects on B. cereus spores. Accordingly, Palop
et al. (1996) reported that the decrease in Bacillus licheniformis heat resistance at acid
pHs became smaller the higher the temperature of treatment. In this context, the results
suggest that differences in resistance may be due to heating medium properties other
than pH. In 1992, Condón and Sala reported that the composition of the heating medium
can influence the heat resistance of microorganisms. They found that heat resistance of
Bacillus subtilis in food at its natural pH was somewhat different than that in buffer of
the same pH. Likewise, other properties such as viscosity affect heat transfer within the
heating menstrum and can exercise a protector effect of bacterial spores when viscosity
increases, especially in short treatments. On the other hand, no significant differences
between courgette and mixed vegetables purees were observed. So we cannot conclude
that composition (proteins, carbohydrates and fats) affects heat resistance.
Survival curves corresponding to heat treatments at 90, 100 and 105ºC showed
shoulders in every heating medium (Tables 2, 3 and 4). At 95ºC only in mixed
vegetables puree shoulder were showed (Tables 2, 3 and 4). Shoulder length increase
when B. cereus spore heat resistance was tested on vegetable purees (particularly upon
heating spores in courgette pure). In 2010, van Zuijlen et al. reported that when spores

Chapter 3
77
were heated in different commercial s as food substrates the effect of heating
menstruum on the extent of shoulder length was evident.
3.3.2. Comparison of log-linear vs. non-log-linear kinetics to describe survivor
curves
In this study, the phenomenon of the presence of shoulders in the thermal
inactivation of B. cereus spores was described. Different models were used to fit
survivor curves. Both the non-log-linear models adapted from Weibulls’ and Geeraerds’
models describe data points satisfactory in most cases (Figure 4).
Table 2. Comparison of log linear vs. non-log-linear kinetics to describe survivor curves obtained in sterile distilled water.
Model Parameter Temperature (ºC)
90 95 100 105 Log linear Kmax 0.06 0.14 0.69 4.07 RMSE 0.1 0.066 0.18 0.27 Geeraerd
Kmax 0.07
-a 1.19 4.61 SL 7.42 2.09 0.38 RMSE 0.097 0.14 0.22
Weibull
δ 39 16.69 3.97 0.74 p 1.16 0.93 1.86 1.22 RMSE 0.097 0.07 0.13 0.247
-a No shoulder present Table 3. Comparison of log linear vs. non-log-linear kinetics to describe survivor curves obtained in courgette puree.
Model Parameter Temperature (ºC)
90 95 100 105 Log linear Kmax 0.07 0.16 0.69 4.18 RMSE 0.18 0.05 0.17 0.12 Geeraerd
Kmax
0.10
-a
1.27
5.03
SL 18.57 2.25 0.22 RMSE 0.1100 0.09 0.08
Weibull
δ
41.40
13.61
4.01
0.66
p 1.5 0.86 2.01 1.31 RMSE 0.12 0.04 0.09 0.08
-a No shoulder present

Chapter 3
78
Table 4. Comparison of log linear vs. non-log-linear kinetics to describe survivor curves obtained in mixed vegetable puree.
Model Parameter Temperature (ºC)
90 95 100 105 Log linear Kmax 0.07 0.23 0.84 3.05 RMSE 0.133 0.12 0.18 0.2848 Geeraerd
Kmax
0.08
0.29
1.23
4.29
SL 11.5 3.33 1.65 0.77 RMSE 0.1151 0.117 0.16 0.14
Weibull
δ
39.02
11.18
3.52
1.22
p 1.27 1.28 1.74 1.7 RMSE 0.1151 0.12 0.15 0.15
In sterile distilled water and in both vegetable purees, Geeraerds’ and Weibulls’
models gave consistently slightly lower RSME values when compared with the log-
linear model (Tables 2, 3 and 4). The models of Weibull and Geeraerd better
characterized the heat inactivation of spores of B. cereus than the conventional log-
linear model. This is in agreement with van Zuijlen et al. (2010). On the basis of these
results and in accordance with Geeraerd et al. (2005) it is clear that the log-linear
inactivation models fails to asses accurately the majority of these survival curves. In this
regard non-log-linear models should be implemented to prevent overlay conservative
heat treatments which affect food quality, and to reduce energy requirements and
subsequent emission of contaminants such as CO2. In this context, as previously suggest
van Zuijlen et al. (2010), we propose to that take into account systematically shoulder
effect to establish safe.
Kmax values did not show significance differences between different heating
media and between different models.
3.3.3. Combined effect of heat treatment and modified atmosphere on B.
cereus growth
Here, the B. cereus growth response to different oxygen limitation conditions
combined with mild (1D) and severe (4D) heat treatments was studied in BHI and
courgette pure. As described above, samples were packaged after heat treatments and
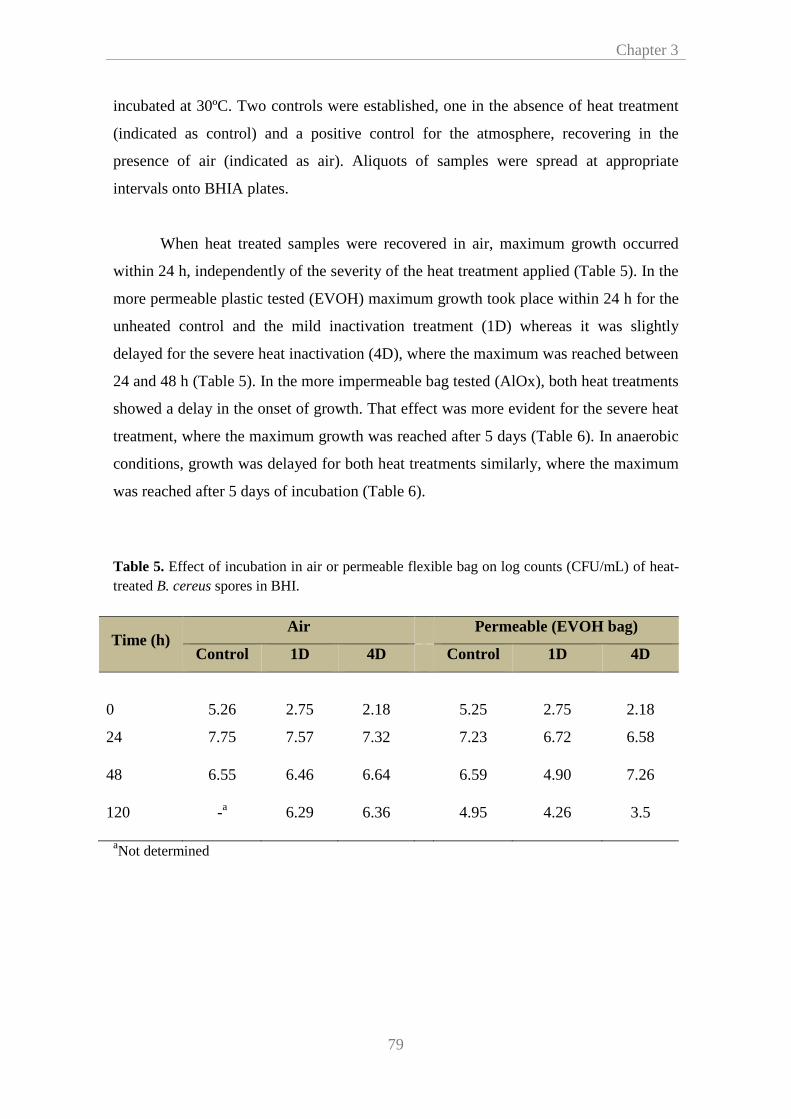
Chapter 3
79
incubated at 30ºC. Two controls were established, one in the absence of heat treatment
(indicated as control) and a positive control for the atmosphere, recovering in the
presence of air (indicated as air). Aliquots of samples were spread at appropriate
intervals onto BHIA plates.
When heat treated samples were recovered in air, maximum growth occurred
within 24 h, independently of the severity of the heat treatment applied (Table 5). In the
more permeable plastic tested (EVOH) maximum growth took place within 24 h for the
unheated control and the mild inactivation treatment (1D) whereas it was slightly
delayed for the severe heat inactivation (4D), where the maximum was reached between
24 and 48 h (Table 5). In the more impermeable bag tested (AlOx), both heat treatments
showed a delay in the onset of growth. That effect was more evident for the severe heat
treatment, where the maximum growth was reached after 5 days (Table 6). In anaerobic
conditions, growth was delayed for both heat treatments similarly, where the maximum
was reached after 5 days of incubation (Table 6).
Table 5. Effect of incubation in air or permeable flexible bag on log counts (CFU/mL) of heat-treated B. cereus spores in BHI.
Time (h) Air Permeable (EVOH bag)
Control 1D 4D Control 1D 4D
0
5.26
2.75
2.18
5.25
2.75
2.18
24 7.75 7.57 7.32 7.23 6.72 6.58
48 6.55 6.46 6.64 6.59 4.90 7.26
120 -a 6.29 6.36 4.95 4.26 3.5
aNot determined
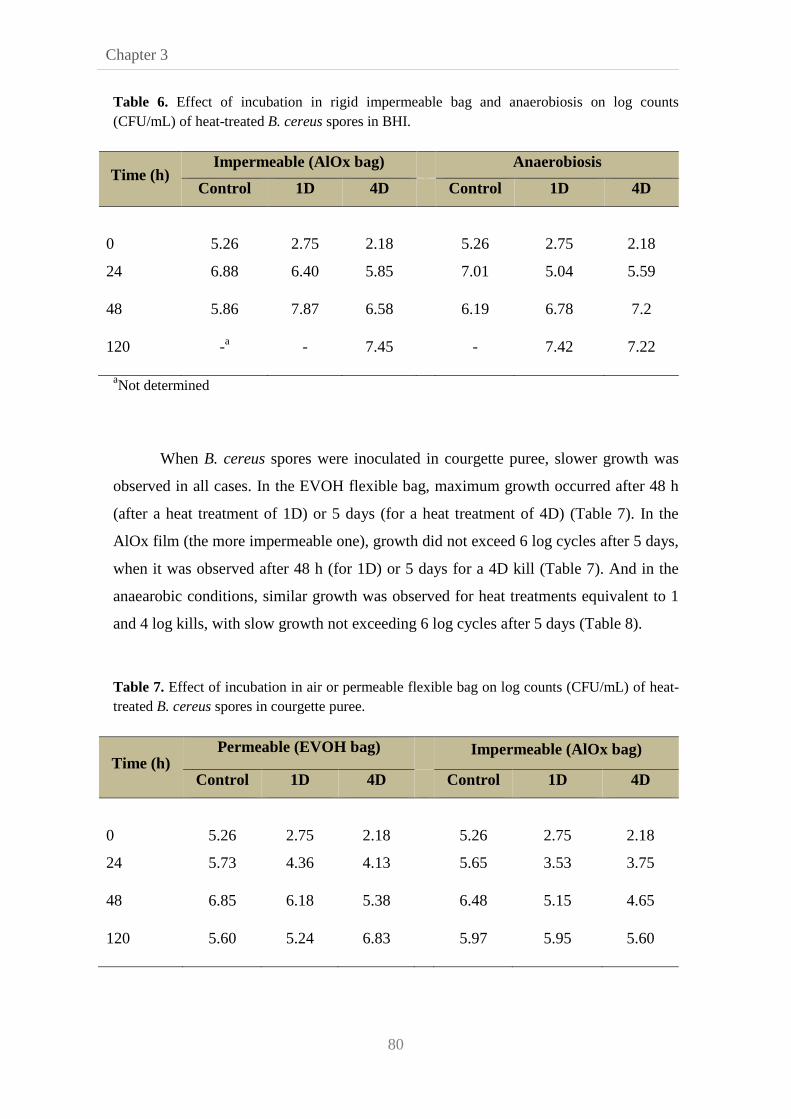
Chapter 3
80
Table 6. Effect of incubation in rigid impermeable bag and anaerobiosis on log counts (CFU/mL) of heat-treated B. cereus spores in BHI.
Time (h) Impermeable (AlOx bag) Anaerobiosis
Control 1D 4D Control 1D 4D
0
5.26
2.75
2.18
5.26
2.75
2.18
24 6.88 6.40 5.85 7.01 5.04 5.59
48 5.86 7.87 6.58 6.19 6.78 7.2
120 -a - 7.45 - 7.42 7.22
aNot determined
When B. cereus spores were inoculated in courgette puree, slower growth was
observed in all cases. In the EVOH flexible bag, maximum growth occurred after 48 h
(after a heat treatment of 1D) or 5 days (for a heat treatment of 4D) (Table 7). In the
AlOx film (the more impermeable one), growth did not exceed 6 log cycles after 5 days,
when it was observed after 48 h (for 1D) or 5 days for a 4D kill (Table 7). And in the
anaearobic conditions, similar growth was observed for heat treatments equivalent to 1
and 4 log kills, with slow growth not exceeding 6 log cycles after 5 days (Table 8).
Table 7. Effect of incubation in air or permeable flexible bag on log counts (CFU/mL) of heat-treated B. cereus spores in courgette puree.
Time (h) Permeable (EVOH bag)
Impermeable (AlOx bag)
Control 1D 4D Control 1D 4D
0
5.26
2.75
2.18
5.26
2.75
2.18
24 5.73 4.36 4.13 5.65 3.53 3.75
48 6.85 6.18 5.38 6.48 5.15 4.65
120 5.60 5.24 6.83 5.97 5.95 5.60
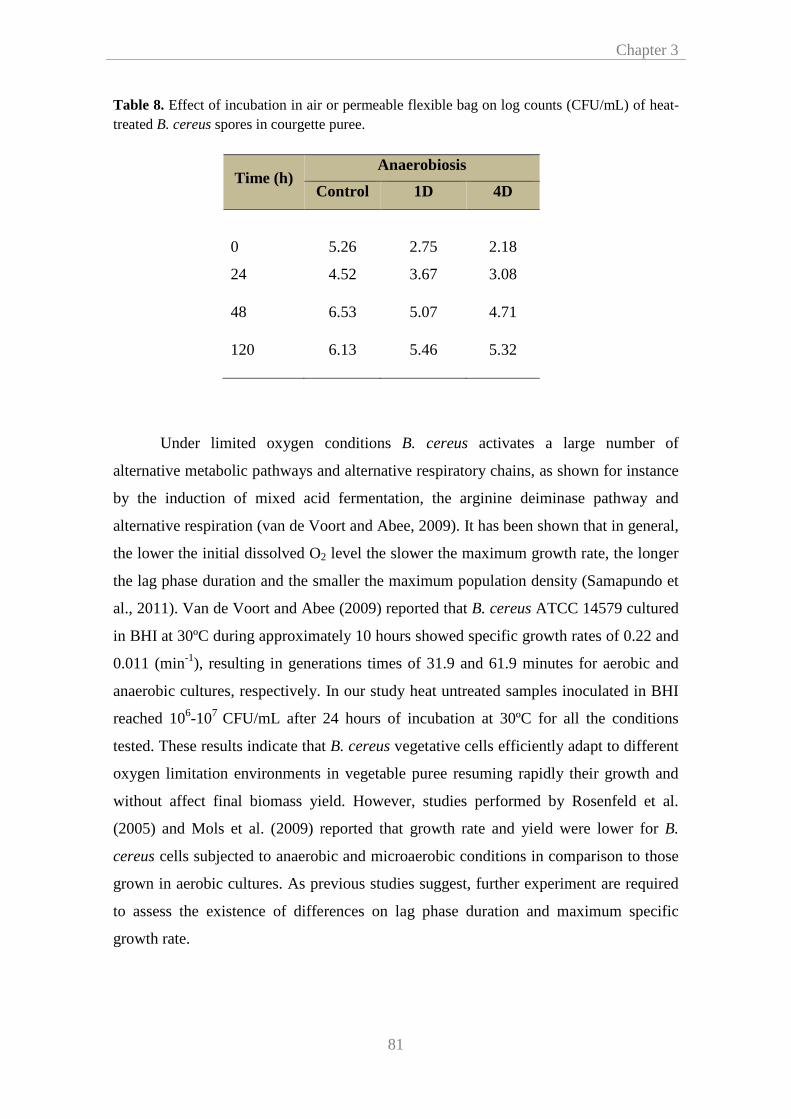
Chapter 3
81
Table 8. Effect of incubation in air or permeable flexible bag on log counts (CFU/mL) of heat-treated B. cereus spores in courgette puree.
Time (h) Anaerobiosis
Control 1D 4D
0
5.26
2.75
2.18
24 4.52 3.67 3.08
48 6.53 5.07 4.71
120 6.13 5.46 5.32
Under limited oxygen conditions B. cereus activates a large number of
alternative metabolic pathways and alternative respiratory chains, as shown for instance
by the induction of mixed acid fermentation, the arginine deiminase pathway and
alternative respiration (van de Voort and Abee, 2009). It has been shown that in general,
the lower the initial dissolved O2 level the slower the maximum growth rate, the longer
the lag phase duration and the smaller the maximum population density (Samapundo et
al., 2011). Van de Voort and Abee (2009) reported that B. cereus ATCC 14579 cultured
in BHI at 30ºC during approximately 10 hours showed specific growth rates of 0.22 and
0.011 (min-1), resulting in generations times of 31.9 and 61.9 minutes for aerobic and
anaerobic cultures, respectively. In our study heat untreated samples inoculated in BHI
reached 106-107 CFU/mL after 24 hours of incubation at 30ºC for all the conditions
tested. These results indicate that B. cereus vegetative cells efficiently adapt to different
oxygen limitation environments in vegetable puree resuming rapidly their growth and
without affect final biomass yield. However, studies performed by Rosenfeld et al.
(2005) and Mols et al. (2009) reported that growth rate and yield were lower for B.
cereus cells subjected to anaerobic and microaerobic conditions in comparison to those
grown in aerobic cultures. As previous studies suggest, further experiment are required
to assess the existence of differences on lag phase duration and maximum specific
growth rate.

Chapter 3
82
The dissolved O2 level combined with severe heat treatments can play a very
important role in the growth of B. cereus on vegetable puree products packaged under
modified atmospheres. As we expected, more restrictive atmospheres combined with
severe heat treatments showed the greatest delay on the time to reach 105-106 CFU/mL.
When samples were incubated in bags made with EVOH polymer which has a high
OTR (35cm3/m2/24h), faster growth was observed in comparison with more oxygen
limiting conditions. This implies that heat treated products packaged in atmospheres
which allow high dissolved O2 level have shorter shelf-stabilities as B. cereus growth
would take a shorter time to reach the minimum infective dose. Moreover, bacterial
growth observed in AlOx bag which has a very low OTR (below 10-3 cm3/m2/24h) did
not show significant differences with growth observed under anaerobic conditions,
which is in agreement with different studies (Nakano et al., 1996; Reents et al., 2006;
Mol et al., 2009b). Mols et al. (2009) reported that the growth of B. cereus in
microaerobic conditions was shown not to be significantly different from anaerobic
culturing possibly due to the rapid depletion of oxygen by the metabolism of the
bacteria and the absence of oxygen influx during growth. On the basis of these results,
film packaging containing AlOx coating may be used as an alternative to anaerobic
packaging in order to prevent B. cereus growth in heat treated vegetable products
avoiding health risks associated to anaerobic microflora although other risks should be
also considered.
The observation that B. cereus growth in courgette puree was slower than in BHI
was not unexpected since high viscosity of the vegetables product limit the mobility of
the O2 at gas-puree interface and in the purees themselves (Samapundo et al., 2011).
Notably, food samples packaged by using EVOH film showed a significant delay on the
time to reach 105-106 CFU/mL respect to BHI samples incubated in the same
conditions.
Despite this study shows how combination of oxygen limitation and deprivation
and heat treatments delay B. cereus growth at 30ºC up to five days, further experiments
are needed to assess aluminium oxide coated PET and four layer PA/PE-foil with an
EVOH barrier as packaging films able to generate appropriate conditions to extent
vegetable puree shelf-life. In addition, to get and overall overview of this preservative
technique, cross-protection phenomena and induction of virulent status concomitant to

Chapter 3
83
limited oxygen environments should take into account. Recently, Mols et al. (2009)
have reported that B. cereus vegetative cells become more resistant to heat and acid
when grown under these conditions. Besides, a previous study performed by George et
al. (1998) using Escherichia coli, Listeria monocytogenes, and Salmonella enteritidis
showed how oxygen limitation have a positive effect on the recovery of sub-lethally
injured cells.

Chapter 4
85
CHAPTER 4
Combined effect of lysozyme and nisin at different incubation
temperatures and mild heat treatment on the probability of
time to growth of Bacillus cereus
Abstract
Stochastic models can be useful to predict the risk of foodborne illness. The presence of
Bacillus cereus in liquid egg can pose a serious hazard to the food industry, since a mild
heat treatment cannot guarantee its complete inactivation. However, most of the
information available in the scientific literature is deterministic, including growth of B.
cereus. In this chapter, a stochastic approach to evaluate growth of B. cereus cells
influenced by different stresses (presence of nisin and lysozyme separately or in
combination) was performed, using an individual-based approach of growth through
optical density measurements. Lag phase duration was derived from the growth curves
obtained. From results obtained, histograms of the lag phase were generated and
distributions were fitted. Normal and Weibull distributions were ranked as the best fit
distribution in experiments performed at 25ºC. At 16ºC, lag values (obtained in
presence of combinations of both antimicrobials) were also fitted by Gamma
distribution. Predictions were compared with growth curves obtained in liquid egg
exposed to mild heat, nisin and/or lysozyme to assess their validity.
85
10101010
9
8
7
6
5
4
3
2
1

Chapter 4
86
10
9
8
7
6
5
3
2
1
Chapter 4
87
4.1. Introduction
Among Bacillus cereus group, B. cereus is an ubiquitous sporulated bacteria
able to grow at 7ºC or below (Carlin et al., 2006). Besides, spores of this microorganism
are strongly adhesive and may survive to sanitizing and heat treatments such as gamma-
ray and pasteurization (Kotiranta et al., 2000). Previous studies reported that B. cereus
spores were highly resistant to temperatures in the range of 90-100ºC with D90ºC values
of, f. e.g. 3-5 minutes (Fernández et al., 2001). As consequence, after food processing,
germination can occur resulting in spoilage and foodborne outbreaks even in
refrigerated products (Valero et al., 2003). Indeed, B. cereus has been easily isolated
from many types of foods, especially of plant origin, but also from meat, eggs and dairy
products (Kramer and Gilbert, 1989).
A recent study reveals that whole egg appears to be a good medium for the
development of psychrotrophic strains of the B. cereus group (Jan et al., 2011). Unlike
in the dairy industry, only a limited number of studies have been focused on the
relevance of these microorganisms in the egg product industry (Baron et al., 2007; Pina-
Pérez et al., 2009; Jan et al., 2011) even when are commonly consumed by food
manufacturers and caterings due to a wide variety of advantages among which are
bacteriological safety, versatility, easy to use and dosing, saving time and labor, easy
storage and control of sell-by date, as well as easy distribution and international trade
(Instituto de Estudios del Huevo, 2006).
Because of the higher thermo-sensitivity of constitutive proteins, heat treatment
for liquid egg preservation should be mild. Spanish egg product industry, following
European regulations, exposes egg products to treatments comprised between 64-65ºC
for 120-240 seconds or 70ºC for 90 seconds (Instituto de Estudios del Huevo, 2006).
However, these sanitizing treatments that ensure the destruction of major vegetative
cells, including microorganisms of public health importance such as Salmonella, may
enhance the spore forming bacteria survival, and thus their persistence in food
production environments. Besides, the storage period at refrigeration temperatures may
lead to the selection of a psychrotrophic flora able to survive to thermal processing
giving rise to vegetative cells that can grow at low temperatures (Jan et al., 2011).
Chapter 4
88
In this context, egg product industry requires suitable food preservative systems
to prevent health risks and economical problems derived from food spoilage. A
combination of factors can be efficient to ensure microbial safety and maintain
sensorial, functional and technological properties of this mildly processed food. It is
widely known that hurdle technology advocates the combination of various antibacterial
techniques in order to drastically limit the growth of spoilage and pathogenic bacteria
(Leistner, 1999). Some food preservation systems can be used in combination with heat
treatments to reduce the risk of outbreaks of B. cereus food poisoning. However, these
systems may have undesired effects which are against manufacturers’ and consumers’
demands, who prefer additive-free, fresher and more natural tasty food products (Dillon
and Board, 1994) while maintaining microbiological safety (Periago and Moezelaar,
2001). On this ground, the use of natural antimicrobial compounds, such as hen egg
white lysozyme (HEWL) and nisin, can answer technological needs for egg products
preservation.
HEWL is a natural protein present in egg (30 g/kg albumen). This antimicrobial
compound, with specificity for bacterial cell walls, is used in food and pharmaceutical
industries and is Generally Recognised As Safe (GRAS). According to the general norm
of Codex Alimentarius for Food Aditives (Codex General Standard for Food Aditives,
2011) established by the World Health Organization (WHO) and the Food and
Agriculture Organization of the United Nations (FAO), HEWL can be used as
preservative agent in wine and cider and pear cider with a maximum dose of 500 mg/L
as well as in ripened cheese following good manufacturing practices. Different studies
have reported that HEWL is effective as a preservative of cheeses, cow’s milk, beer,
fresh fruits, vegetables, fish, meat and wine (Makki and Durance, 1996; Gill and
Holley, 2000; Nattress et al., 2001; Nattress and Baker, 2003; Tribst et al., 2008).
“Lysozymes (EC 3.2.1.17) are 1,4-β-N-acetylmuramidases, cleaving the
glycosidic bond between the C-1 of N-acetylmuramic acid (NAM) and the C-4 of N-
acetylglucosamine (NAG) in the bacterial peptidoglycan (PG)” (Nakimbugwe et al.,
2006). As PG of Gram-positive bacteria are directly exposed, most of them are sensitive
to HEWL. However, it has been reported that some modifications of PG structure, such
as N-acetylation of glucosamine (Zipperle et al., 1984) and O-acetylation of the C-6
hydroxyl group of NAM residues (Clarke and Dupont, 1992) may occur driving to
Chapter 4
89
resistant bacteria. Besides, different authors have proposed a mechanism of action
independent of muramidase activity and reported the existence of antimicrobial peptides
derived from HEWL with a wide-spectrum of microbicidal activity (Abdou et al.,
2007). Notably, most of Gram-negative bacteria are resistant to lysozymes due to the
presence of the outer membrane which acts as a physical barrier protecting PG.
Nevertheless, some compounds and treatments can damage their outer membranes and
extend the range of action of lysozyme to Gram-negative bacteria (Nakimbugwe et al.,
2006).
On the other hand, nisin, classified as GRAS since over 20 years (US Food and
Drug Administrtion, 1998), is a well known heat-stable bacteriocin produced by
Lactococcus lactis ssp. Lactis which is used as a natural food preservative in processed
cheese, milk, dairy products, canned foods, hot baked flour products (crumpets) and
pasteurized liquid egg (Ray, 1992; Delves-Broughton and Gasson, 1994; Delves-
Broughton et al., 1996). The general norm of Codex Alimentarius for Food Aditives
(Codex General Standard for Food Aditives, 2011), established by the WHO and the
FAO, allow utilization of nisin in cream and curd (10 mg/Kg), ripened cheese (12.5
mg/Kg), cheese analogues (12.5 mg/Kg), cheese made of whey protein (12.5 mg/Kg)
and dessert based on cereal and starch (3 mg/Kg).
Numerous studies have proved nisin antimicrobial activity against many Gram-
positive bacteria such as Listeria monocytogenes and Staphylococcus aureus. Likewise,
this compound has been shown to prevent the outgrowth of sporeformers like
Clostridium and Bacillus spp. (Ray, 1992; Delves-Broughton and Gasson, 1994; Jack et
al., 1995). Antibacterial effectiveness of nisin depends on growth and environmental
conditions (Abee et al., 1994; Thomas and Wimpenny, 1996; Beuchat et al., 1997;
Jaquette and Beuchat, 1998; Pol and Smid, 1999). Thus, it has been shown that nisin is
usually more active when is exposed to acid pH whilst temperature influence is still
controversial (Periago and Moezelaar, 2001). Mechanism of action of this bacteriocin is
based on the fact that nisin binds to the cytoplasmic membrane of vegetative cells
through its C-terminal region and penetrates into the lipid bilayer (Breukink et al.,
1997). As consequence, pores that allow the efflux of potassium ions, ATP, and amino
acids are formed (Ray, 1992; Abee et al., 1994; Delves-Broughton and Gasson, 1994;
Jack et al., 1995; Crandall and Montville, 1998) causing proton motive force dissipation
Chapter 4
90
and eventually cell death (Gao et al., 1991; Bruno and Montville, 1993; Breukink et al.,
1999).
It is noteworthy that synergistic antibacterial activity between nisin and
lysozyme has been observed by various researchers (Chung and Hancock, 2000; Gill
and Holley, 2000; Nattress et al., 2001; Nattress and Baker, 2003).
Predictive microbiology is applied to estimate the growth of microorganisms
under a given set of conditions. Microbiologists classically use four main parameters to
characterize the bacterial growth curve: the initial cell density (0), the maximum cell
density (max), the specific growth rate (µ) and the lag phase (λ). As long as exponential
growth can be predicted with high accuracy as a response to current growth
environmental conditions, lag is inherently more difficult to predict than growth rate
because it depends on the previous and current environmental conditions of the bacterial
cells. In order to improve lag estimations, some authors have described lag phase as an
adjustment process whose duration correspond with the time required for cells to carry
out the work necessary to get ready to divide (Baranyi and Roberts, 1994; Hills and
Wright, 1994; Hills and Mackey, 1995).
Deterministic growth models describe the behaviour of bacterial populations at a
certain time instant while ignoring measurement uncertainty, inoculum history,
variation among strains and individual cell variability (Poschet et al., 2004). In 1998,
Baranyi reported that the mean of the lag times of the individual cells can be much
bigger than the commonly perceived lag time of the whole culture. Besides, Renshaw
(1991) pointed that deterministic models are not appropriate to predict population
dynamics at low counts. Different authors have shown that duration and variability of
lag time increases with lower inoculum size, specially, when severe stress conditions
are applied (Robinson et al., 2001; Metris et al., 2002). In consequence, it is becoming
clear that to develop a more complete understanding of the lag phase process, the
behaviour of single cells has to be taken into account through the development of
stochastic models (Baranyi and Pin, 2003). Such models are used to establish the
connection between the traditional food microbiology concept of bacterial lag period,
before the exponential growth, and the distribution of the lag times of individual cells
(Baranyi and Pin, 2001) and are able to predict probabilities of survival and growth at
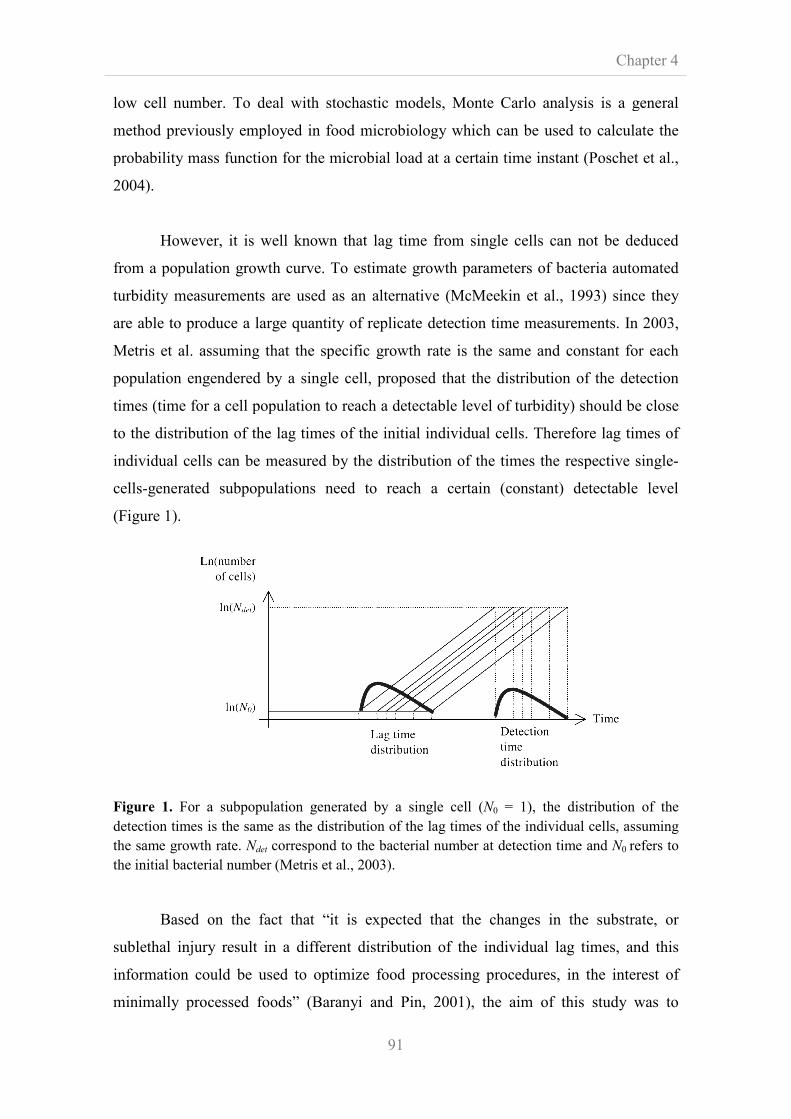
low cell number. To deal with stochastic models, Monte Carlo analysis is a general
method previously employed in food microbiology which can be used to calculate the
probability mass function for the microbial load at a certain time instant (Poschet et al.,
2004).
However, it is well known that lag time from single cells can not be deduced
from a population growth curve. To estimate growth parameters of bacteria automated
turbidity measurements are used as an alternative (McMeekin et al., 1993) since they
are able to produce a large quantity of replicate detection time measurements. In 2003,
Metris et al. assuming that the specific growth rate is the same and constant for each
population engendered by a single cell, proposed that the distribution of the detection
times (time for a cell population to reach a detectable level of turbidity) should be close
to the distribution of the lag times of the initial individual cells. Therefore lag times of
individual cells can be measured by the distribution of the times the respe
cells-generated subpopulations need to reach a certain (constant) detectable level
(Figure 1).
Figure 1. For a subpopulation generated by a single cell (
detection times is the same as the distribution of the lag times of the individual cells, assuming
the same growth rate. det correspond to
the initial bacterial number (Metris et al., 2003).
Based on the fact that “it is expected that the changes in the substrate, or
sublethal injury result in a different distribution of the individual lag times, and this
information could be used to optimize food processing
minimally processed foods” (Baranyi and Pin, 2001), the aim of this study was to
91
ber. To deal with stochastic models, Monte Carlo analysis is a general
method previously employed in food microbiology which can be used to calculate the
probability mass function for the microbial load at a certain time instant (Poschet et al.,
owever, it is well known that lag time from single cells can not be deduced
from a population growth curve. To estimate growth parameters of bacteria automated
turbidity measurements are used as an alternative (McMeekin et al., 1993) since they
produce a large quantity of replicate detection time measurements. In 2003,
Metris et al. assuming that the specific growth rate is the same and constant for each
population engendered by a single cell, proposed that the distribution of the detection
s (time for a cell population to reach a detectable level of turbidity) should be close
to the distribution of the lag times of the initial individual cells. Therefore lag times of
individual cells can be measured by the distribution of the times the respe
generated subpopulations need to reach a certain (constant) detectable level
For a subpopulation generated by a single cell (0 = 1), the distribution of the
detection times is the same as the distribution of the lag times of the individual cells, assuming
correspond to the bacterial number at detection time
(Metris et al., 2003).
Based on the fact that “it is expected that the changes in the substrate, or
sublethal injury result in a different distribution of the individual lag times, and this
information could be used to optimize food processing procedures, in the interest of
minimally processed foods” (Baranyi and Pin, 2001), the aim of this study was to
Chapter 4
ber. To deal with stochastic models, Monte Carlo analysis is a general
method previously employed in food microbiology which can be used to calculate the
probability mass function for the microbial load at a certain time instant (Poschet et al.,
owever, it is well known that lag time from single cells can not be deduced
from a population growth curve. To estimate growth parameters of bacteria automated
turbidity measurements are used as an alternative (McMeekin et al., 1993) since they
produce a large quantity of replicate detection time measurements. In 2003,
Metris et al. assuming that the specific growth rate is the same and constant for each
population engendered by a single cell, proposed that the distribution of the detection
s (time for a cell population to reach a detectable level of turbidity) should be close
to the distribution of the lag times of the initial individual cells. Therefore lag times of
individual cells can be measured by the distribution of the times the respective single-
generated subpopulations need to reach a certain (constant) detectable level
= 1), the distribution of the
detection times is the same as the distribution of the lag times of the individual cells, assuming
detection time and 0 refers to
Based on the fact that “it is expected that the changes in the substrate, or
sublethal injury result in a different distribution of the individual lag times, and this
procedures, in the interest of
minimally processed foods” (Baranyi and Pin, 2001), the aim of this study was to

Chapter 4
92
compare the inhibitory effects of combined treatments of heat, nisin and lysozyme
concentrations on the distributions of the lag times of B. cereus. Using the distributions
adjusted, predictions of time to growth (106
CFU mL-1
) of B. cereus were established by
a Monte Carlo simulation and they were compared with deterministic predictions and
observations in liquid egg.
4.2. Materials and methods
4.2.1. Bacterial strain
The strain used in the experiment was B. cereus INRA-AVZ421, kindly
provided by the National Institute of Agronomic Research (INRA, Avignon, France). B.
cereus was isolated from refrigerated processed foods of extended durability based on
vegetables. The microorganism was sporulated in Fortified Nutrient agar (FNA) at 37ºC
(Mazas et al., 1995) and stored at 4ºC until use (Fernández et al., 2001).
A 100 µL volume of spores were diluted in 0.5 mL of sterile distilled water
suspension and heated at 80ºC for 10 min to ensure that subsequent vegetative cells
grown would have the same physiological state. A 100 µL volume of this culture was
grown at 30ºC in 100 mL Brain Heart Infusion broth (BHI; Scharlau, Barcelona, Spain)
overnight. After incubation, the culture was centrifugated at 2,500 g for 15 min. Pellets
were resuspended in 2.5 mL of peptone water (Scharlau, Barcelona, Spain) and these
vegetative cells were used as inoculum. The proportion of spores was found to be lower
than 0.001% and it was not taken into consideration further.
4.2.2. Food product preparation
Fresh eggs, stored at refrigeration temperature until use, were used for the
experiments. Liquid egg was made in our laboratory in a domestic blender (Turbomix
Plus 300, Moulinex, Lyon, France). Homogenized liquid egg samples were heated at
60ºC for 10 min to inactivate background microflora before inoculation studies.
Chapter 4
93
4.2.3. Chemicals
Lysozyme was obtained from Sigma-Aldrich Chemie, (Steinheim, Germany). It
was dissolved in sterile bidistilled water and sterilized by filtration (0.45 µm Millex-
HV, Millipore, Bedford, USA). Lysozyme working solution was prepared to give a final
concentration of 100 mg/mL and stored refrigerated until use.
Nisin was obtained from Sigma-Aldrich Chemie, (Steinheim, Germany). It was
dissolved in ethanol 50% (v/v) (Panreac, Barcelona, Spain). Nisin working solution was
prepared to give a final concentration of 0.13 µM and stored refrigerated until use.
4.2.4. Optical density calibration curves
From an overnight culture of B. cereus in order to obtain vegetative cells,
dilution series were made in BHI and BHI supplemented with different amounts of
antimicrobial compounds: lysozyme (0.34 mmol/L), nisin (0.13 µmol/L), or
combination of both compounds (lysozyme 0.34 mmol/L + nisin 0.13 µmol/L and
lysozyme 0.34 mmol/L + nisin 0.065 µmol/L). Microwell plates were filled with 400 µL
of diluted culture per well and incubated in the Bioscreen C automatic reader
(Labsystems, Helsinki, Finland) at 16 and 25ºC and the optical density (OD) was
measured at 600 nm. At time intervals, samples were removed from the wells, diluted
and plated onto BHI agar (BHIA; Scharlau, Barcelona, Spain) for viable counts.
The OD of the well was recorded immediately before the sample was taken. OD
values were plotted against viable counts.
4.2.5. Growth curves and determination of the lag phase
Growth curves were made in BHI with the addition of lysozyme and nisin
concentrations described above and combinations of both of them. The dilution
procedure of Francois et al. (2003) was applied to obtain single B. cereus cells in the
wells of the microwell plate. Serial ten and two fold dilutions of control or stressed cells
were made in the corresponding modified medium and aliquots (400 µL) were added
into the wells of a microwell plate to achieve a cell concentration of 1x10³ to 1x10
0. The

Chapter 4
94
plates were incubated in the Bioscreen C automatic reader at 16 and 25ºC and OD was
determined at 15 minutes intervals.
The kinetic parameters of the single-cell lag times were estimated by the method
described by Metris et al. (2006). The lag times of B. cereus cells were obtained through
the time of detection (Td), which is the time required for the microbial population to
generate a 0.2 increase in optical density from the start of the incubation. When Td
values are plotted against the corresponding inoculum size (calculated as ln CFU/mL), µ
can be calculated as the negative reciprocal of the slope of the regression line (Cuppers
and Smelt, 1993). Assuming an exponential bacterial growth at a constant specific
growth rate (µ) until the detection time, Td is related to the lag time of the culture (λ) by
the following formula proposed by Baranyi and Pin (1999):
Td = λ + (ln(d)- ln(0))/µ (1)
where d is the bacterial number at Td, obtained by means of calibration curves, and 0
the number of cells initiating growth in the considered well.
4.2.6. Heat resistance determination of vegetative cells B. cereus in liquid egg
Heat resistance determinations of vegetative cells were carried out in capillary
tubes (Hirschmann Laboratory, Germany) that were exposed to different temperatures
using a thermostated water bath. Capillary tubes were filled with 20 µL of liquid egg
inoculated with an overnight culture of B. cereus at a concentration of 109
CFU/mL. At
time intervals, chosen depending on the temperature of treatment (52.5-57.5ºC),
capillaries were removed from the water bath and cooled in ice water. Dilutions were
made and plated onto BHIA. Plates were incubated at 37ºC for 24 h. DT values (minutes
of heat treatment at temperature T for the number of survivors to drop one log cycle)
were calculated from the slope of the regression line obtained plotting logarithmic
counts versus their corresponding heating times. The z values (degrees of temperature
increase for the DT value to drop a log cycle) were determined from the regression line
obtained plotting log DT values versus heating temperatures.
Chapter 4
95
4.2.7. Combined effect of heat, nisin and lysozyme on B. cereus in liquid egg
Successive individual stresses were applied to cells in early stationary phase of
B. cereus. Volumes of 5 mL of liquid egg were inoculated with vegetative cells of B.
cereus (approximately 108-10
9 CFU/mL) and mild heat treatment was applied (55ºC for
3 minutes) in order to achieve between 2 and 3 log reductions. Aliquots were taken (0.1
mL) and they were then inoculated in 2 mL of liquid egg which contained antimicrobial
compounds at the following concentrations: lysozyme (0.34 mmol/L), nisin (0.13
µmol/L), or in combination of both compounds (lysozyme 0.34 mmol/L + nisin 0.13
µmol/L and lysozyme 0.34 mmol/L + 0.065 µmol/L). Then, they were incubated at 16
and 25ºC. Samples were taken at different time intervals during incubation, dilutions
were made and plated into BHIA. Plates were incubated at 37ºC for 24 h.
4.2.8. Statistical data processing, distribution fitting and Monte Carlo Analysis
Statistical data processing was performed using Statgraphics Plus 5.1 software
(Statistical Graphics Corp., Rockville, MD). Histograms were made from every set of
conditions showing the distribution of the lag phases. From each histogram, the most
common statistical parameters (mean value, standard deviation, etc.) were determined.
The most appropriate distribution to lag data was investigated using the Best fit
tool of @RISK 4.5.2 Professional Edition (Palisade Corporation, Newfield, New York,
USA). Distributions were ranked using the χ2 goodness of fit statistics (BestFit Users
Guide, Palisade Corporation, 2002). The test value is expressed as a p value, indicating
the probability that a dataset randomly sampled from the hypothetical distribution
would be equally or even more extreme than the observed dataset. The lower is p the
better is the fitting of the hypothetical distribution to our experimental data (Francois et
al., 2005).
Monte Carlo simulation was performed to predict the time to growth to a certain
microbial concentration (106
CFU/mL, in this case). Eq. (1) was used to analyse the
dependence of 0 and λ on the time to reach 106
CFU/mL. The individual cell lag times
were assumed to follow a Gamma distribution of shape parameter β and scale parameter

Chapter 4
96
α. The parameters of the Gamma distribution and the growth rate, µ, in each
environmental condition were calculated from the detection times. On the other hand,
the initial number of cells in a well followed a Poisson distribution with an average of 1
cell per well according to Metris et al. (2006). The simulation was performed using the
parameters and calculations presented and the model run for 10,000 iterations.
This generated probabilistic information which was compared with growth
curves obtained in liquid egg as model food.
4.3. Results and discussion
4.3.1. Effect of individual and combined stress on the biological parameters
The effect of different stress conditions on the biological parameters, individual
cell lag phase (λ) and maximum specific growth rate (µmax) was investigated for B.
cereus on BHI (Table 1).
The mean lag phase duration increased when antimicrobial compounds were
applied and the increase was higher when the incubation temperature was 16 ºC. Nisin
(0.13 µmol/L) and lysozyme plus nisin (0.13 µmol/L) were the most effective
conditions, reaching lag values of 15.0 and 15.7 h, respectively at 16ºC. Therefore, nisin
(alone or in combination) presented a more pronounced antimicrobial effect than
lysozyme at the levels tested in this study. This antimicrobial effect was more evident at
lower incubation temperatures (16ºC) and differences between antimicrobials and their
combinations increased.
From results, histograms of the lag phase were generated. Histograms showed
that controls presented lower lag times and a relatively narrow distribution. The
combination of lysozyme and nisin at high dose delayed the average onset of growth
(Figure 2) and distributions were much wider, indicating a dispersion of the lag phase,
due to the presence of damage. Cells have to go through a repair and adaptation phase
before they can start to grow. Distributions of lag time of B. cereus grown in presence
of nisin at 25ºC were similar to the ones obtained in the presence of both antimicrobials,
as it can be observed from standard deviation in Table 1 or from histograms in Figure

Chapter 4
97
2A. More dispersion was observed when cells were exposed to a lower temperature
although no differences between both antimicrobials were found (Figure 2B and Table
1). This indicates that in the presence of more stringent conditions (lower temperature
and both antimicrobials) cells need longer time to recover. This effect was not
evidenced at higher temperatures.
Table 1. Growth parameters of B. cereus as a function of lysozyme and nisin concentrations.
Treatment Incubation
temperature
(ºC)
Growth conditions Growth parameters
Lysozyme
(mmol/L)
,isin
(µmol/L)
µmax(h
-1) λ(h)
Control 25 - - 1.34 1.11±0.30
L 25 0.34 - 1.08 1.75±0.47
N 25 - 0.13 0.95 3.03±0.38
L+N 25 0.34 0.065 1.28 4.08±0.33
L+N* 25 0.34 0.13 0.95 4.59±0.47
Control 16 - - 0.37 3.41±0.8
L 16 0.34 - 0.46 7.71±2.15
N 16 - 0.13 0.20 15.00±1.37
L+N 16 0.34 0.065 0.31 8.67±0.95
L+N* 16 0.34 0.13 0.20 15.67±1.25
L: Lysozyme; N: Nisin; L+N: Low concentration of nisin; L+N*: High concentration of nisin.

Chapter 4
98
C
0
0.1
0.2
0.3
0.4
0.5
0.6
0.7
0.8
0.9
1
1.1
1.2
1.3
0 0.5 1 1.5 2 2.5 3 3.5 4 4.5 5 5.5 6 6.5
Lag
Fre
qu
ency
Control Nisin 0.13µmol/L
Lysozyme 0.34mmol/L +
Figure 2. Individual cell lag phases expressed in hours of B. cereus grown in presence of
antimicrobial compounds at different incubation temperatures. (A) Samples incubated at 25ºC
(B) Samples incubated at 16ºC. Each histogram was based on 50-100 individual observations.
B
0
0.05
0.1
0.15
0.2
0.25
0.3
0.35
0.4
0.45
0.5
0.55
0 2 4 6 8 10 12 14 1 6 18 20 22 24 26
L ag
Frr
equ
ency
nisin 0.13 µmol/L
A
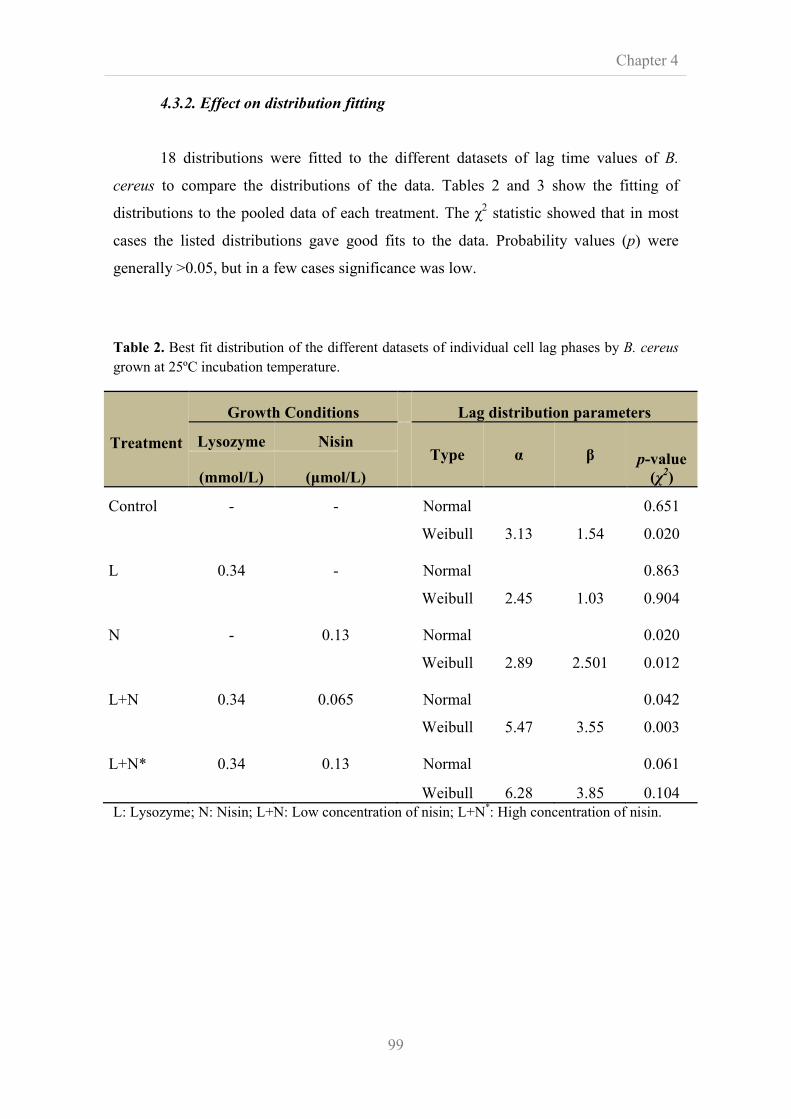
Chapter 4
99
4.3.2. Effect on distribution fitting
18 distributions were fitted to the different datasets of lag time values of B.
cereus to compare the distributions of the data. Tables 2 and 3 show the fitting of
distributions to the pooled data of each treatment. The χ2 statistic showed that in most
cases the listed distributions gave good fits to the data. Probability values (p) were
generally >0.05, but in a few cases significance was low.
Table 2. Best fit distribution of the different datasets of individual cell lag phases by B. cereus
grown at 25ºC incubation temperature.
Treatment
Growth Conditions
Lag distribution parameters
Lysozyme ,isin
Type α β p-value
(χ2) (mmol/L) (µmol/L)
Control - -
Normal 0.651
Weibull 3.13 1.54 0.020
L 0.34 -
Normal 0.863
Weibull 2.45 1.03 0.904
N - 0.13
Normal 0.020
Weibull 2.89 2.501 0.012
L+N 0.34 0.065
Normal 0.042
Weibull 5.47 3.55 0.003
L+N* 0.34 0.13
Normal 0.061
Weibull 6.28 3.85 0.104
L: Lysozyme; N: Nisin; L+N: Low concentration of nisin; L+N*: High concentration of nisin.
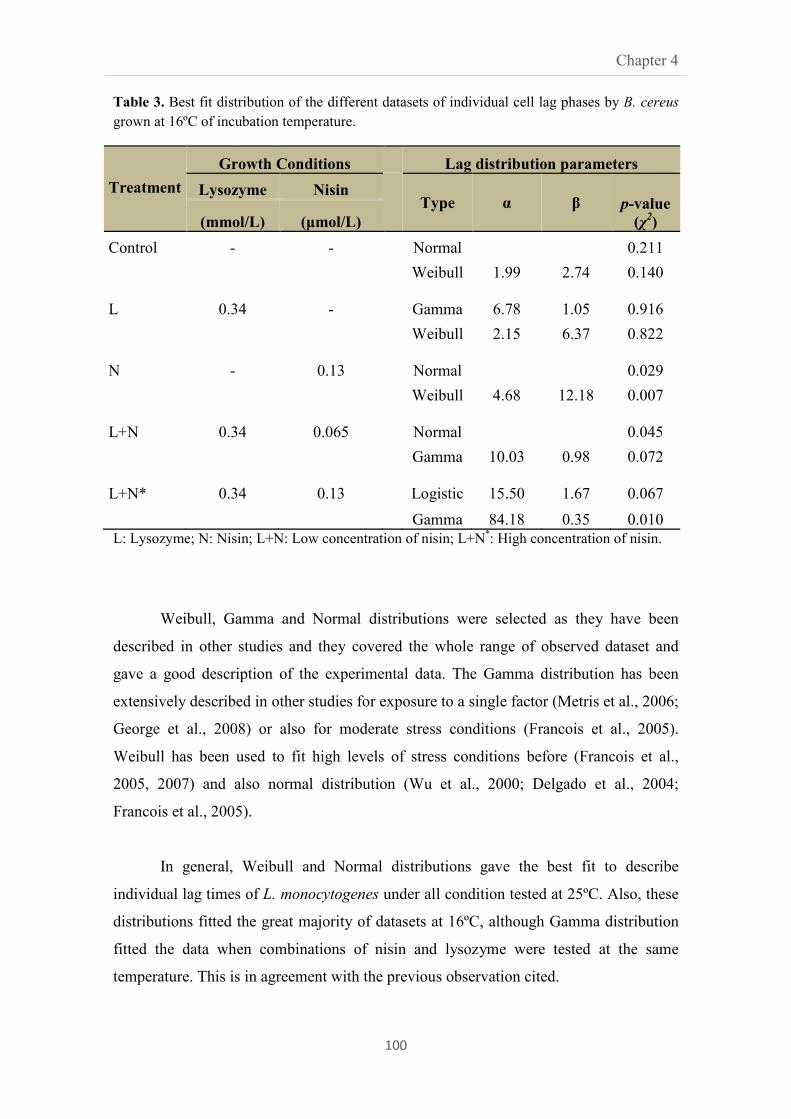
Chapter 4
100
Table 3. Best fit distribution of the different datasets of individual cell lag phases by B. cereus
grown at 16ºC of incubation temperature.
Treatment
Growth Conditions
Lag distribution parameters
Lysozyme ,isin
Type α β p-value
(χ2) (mmol/L) (µmol/L)
Control - - Normal 0.211
Weibull 1.99 2.74 0.140
L 0.34 -
Gamma 6.78 1.05 0.916
Weibull 2.15 6.37 0.822
N - 0.13
Normal 0.029
Weibull 4.68 12.18 0.007
L+N 0.34 0.065
Normal 0.045
Gamma 10.03 0.98 0.072
L+N* 0.34 0.13
Logistic 15.50 1.67 0.067
Gamma 84.18 0.35 0.010
L: Lysozyme; N: Nisin; L+N: Low concentration of nisin; L+N*: High concentration of nisin.
Weibull, Gamma and Normal distributions were selected as they have been
described in other studies and they covered the whole range of observed dataset and
gave a good description of the experimental data. The Gamma distribution has been
extensively described in other studies for exposure to a single factor (Metris et al., 2006;
George et al., 2008) or also for moderate stress conditions (Francois et al., 2005).
Weibull has been used to fit high levels of stress conditions before (Francois et al.,
2005, 2007) and also normal distribution (Wu et al., 2000; Delgado et al., 2004;
Francois et al., 2005).
In general, Weibull and Normal distributions gave the best fit to describe
individual lag times of L. monocytogenes under all condition tested at 25ºC. Also, these
distributions fitted the great majority of datasets at 16ºC, although Gamma distribution
fitted the data when combinations of nisin and lysozyme were tested at the same
temperature. This is in agreement with the previous observation cited.

Chapter 4
101
4.3.3. Heat resistance of B. cereus vegetative cells in liquid egg
The survivor curves of B. cereus followed first-order kinetics showing that when
the microbial population was heated at a specific temperature, the bacteria were
inactivated at a constant rate. This was evidenced by a high correlation coefficient,
equal or higher than 0.98 in all cases.
DT values were found to be between 2.12 min at 52.5°C and 0.40 min at 57.5°C.
The z value for B. cereus was 6.44. Values obtained in our study can be considered
comparable to those described in the scientific literature (Delgado et al., 2004).
4.3.4. Effect of antimicrobial compounds on the viability of B. cereus in liquid
egg
In order to evaluate the antibacterial activity of lysozyme and nisin, individually
or combined, samples of homogenized egg containing concentrations of lysozyme (0.34
mmol/L) or/and nisin (0.13 µmol/L, 0.065 µmol/L) were inoculated with heat damaged
B. cereus. The effect of antimicrobials depended on the incubation temperature (Figures
3 and 4). At 25ºC, only the combination of lysozyme and the highest concentration of
nisin delayed slightly bacterial growth until 10 hours of incubation. The same delay was
observed in liquid egg added with nisin or with lysozyme plus nisin (0.13 µmol/L) at
16ºC. However, the bacterial growth was delayed approximatemaly 30 h when the
combination of lysozyme and nisin (0.065 µmol/L) was applied at 16ºC. When B.
cereus was exposed to lysozyme no significant delay in the onset of growth was
observed (Figures 3 and 4). It was reported that B. cereus strains were among the least
sensitive Bacilli against different antimicrobial including nisin, lysozyme and nisin-
monolaurin combination (Mansour and Milliere, 2001; Pirttijarvi et al., 2001). In
agreement with our study, López-Pedemonte et al. (2003) reported that the low
sensitivity of B. cereus would be due to the use of high initial loads (around 6 log
CFU/mL) although in our case inoculums size was low (3-4 log CFU/mL).
When B. cereus was grown in presence of nisin (0.13 µmol/L) and lysozyme
(0.34 mmol/L) plus nisin (0.13 µmol/L) the antibacterial effect was higher (Figures 2
and 3). At 16ºC, the onset of growth was 15.3 and 27.8 h respectively. Periago and
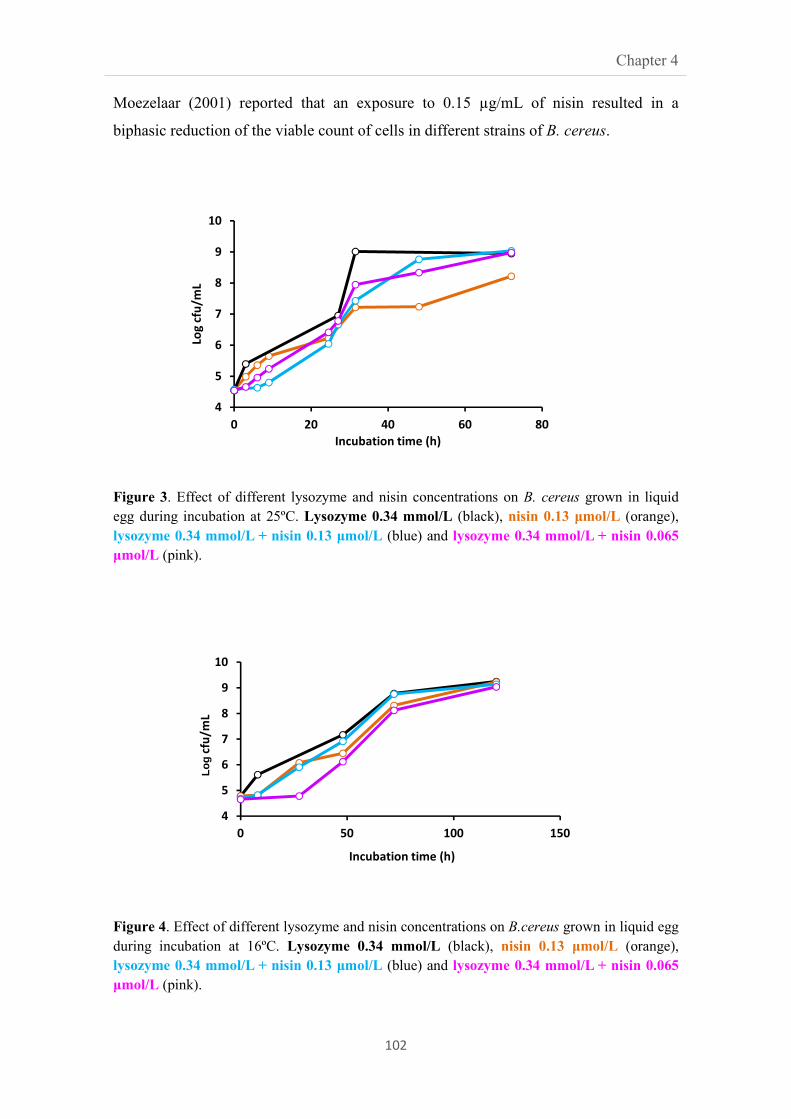
Chapter 4
102
Moezelaar (2001) reported that an exposure to 0.15 µg/mL of nisin resulted in a
biphasic reduction of the viable count of cells in different strains of B. cereus.
Figure 3. Effect of different lysozyme and nisin concentrations on B. cereus grown in liquid
egg during incubation at 25ºC. Lysozyme 0.34 mmol/L (black), nisin 0.13 µmol/L (orange),
lysozyme 0.34 mmol/L + nisin 0.13 µmol/L (blue) and lysozyme 0.34 mmol/L
+ nisin 0.065
µmol/L (pink).
Figure 4. Effect of different lysozyme and nisin concentrations on B.cereus grown in liquid egg
during incubation at 16ºC. Lysozyme 0.34 mmol/L (black), nisin 0.13 µmol/L (orange),
lysozyme 0.34 mmol/L + nisin 0.13 µmol/L (blue) and lysozyme 0.34 mmol/L
+ nisin 0.065
µmol/L (pink).
4
5
6
7
8
9
10
0 50 100 150
Lo
g c
fu/m
L
Incubation time (h)
4
5
6
7
8
9
10
0 20 40 60 80
Log
cfu
/mL
Incubation time (h)
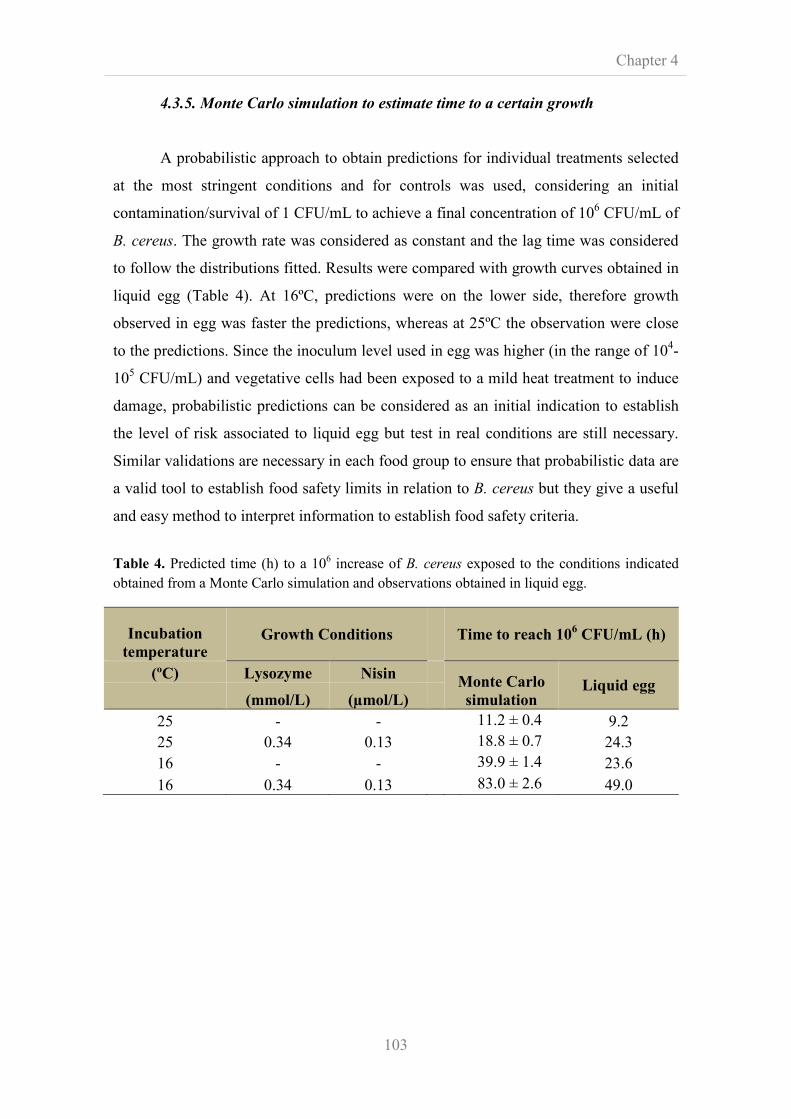
Chapter 4
103
4.3.5. Monte Carlo simulation to estimate time to a certain growth
A probabilistic approach to obtain predictions for individual treatments selected
at the most stringent conditions and for controls was used, considering an initial
contamination/survival of 1 CFU/mL to achieve a final concentration of 106 CFU/mL of
B. cereus. The growth rate was considered as constant and the lag time was considered
to follow the distributions fitted. Results were compared with growth curves obtained in
liquid egg (Table 4). At 16ºC, predictions were on the lower side, therefore growth
observed in egg was faster the predictions, whereas at 25ºC the observation were close
to the predictions. Since the inoculum level used in egg was higher (in the range of 104-
105 CFU/mL) and vegetative cells had been exposed to a mild heat treatment to induce
damage, probabilistic predictions can be considered as an initial indication to establish
the level of risk associated to liquid egg but test in real conditions are still necessary.
Similar validations are necessary in each food group to ensure that probabilistic data are
a valid tool to establish food safety limits in relation to B. cereus but they give a useful
and easy method to interpret information to establish food safety criteria.
Table 4. Predicted time (h) to a 106 increase of B. cereus exposed to the conditions indicated
obtained from a Monte Carlo simulation and observations obtained in liquid egg.
Incubation
temperature Growth Conditions Time to reach 10
6 CFU/mL (h)
(ºC) Lysozyme ,isin Monte Carlo
simulation Liquid egg
(mmol/L) (µmol/L)
25 - - 11.2 ± 0.4 9.2
25 0.34 0.13 18.8 ± 0.7 24.3
16 - - 39.9 ± 1.4 23.6
16 0.34 0.13 83.0 ± 2.6 49.0
Chapter 5
105
CHAPTER 5
Modelling the effects of temperature and osmotic shifts on the
growth kinetics of Bacillus weihenstephanensis in broth and
food products
Abstract
This study aims to model the effects of temperature and water activity (aw) shifts on the
lag time of Bacillus weihenstephanensis KBAB4 and the dependence of maximum
specific growth rate (µmax) on the growth conditions (temperature and aw). The effects of
shifts were modeled through the dependence of the parameter h0 (“work to be done”
prior to growth) induced on the magnitude of the shift and the stringency of the new
environmental conditions. Effects of temperature downshifts were studied on 30
experimental conditions (shifts magnitude ranging from 12 to 30°C, temperature after
shift from 10 to 20°C and aw ranging from 0.997 to 0.977). Osmotic shifts were studied
for 13 conditions (shift magnitude ranging from 0.997 to 0.989 aw values, temperature
from 10 to 30°C, aw after shift from 0.989 to 0.977). Experimental results show that
temperature downshifts were able to induce considerable lag times (up to 20 days) when
occurring near the growth limits. In comparison, osmotic shifts within the range studied
have less significant effects. Validation experiments in food showed that the model
provide valid predictions in creamed pasta but overestimate bacterial growth in carrot
soup (fail safe predictions).
105
11110000
9
8
7
6
5
4
3
2
1

Chapter 5
106
10
9
8
7
6
4
3
2
1
Chapter 5
107
5.1. Introduction
B. weihenstephanensis strains, proposed as a new species on the basis of
sequence differences of 16S rRNA gene and cold shock proteins (Lechner et al., 1998),
are psychrotrophic bacteria closely related to Bacillus cereus. Due to its ability to grow
at low temperature and to form heat-resistant spores, these microorganisms can
contaminate chilled and minimally processed foods constituting a potential hazard for
consumers’ health, limiting products shelf life and generating economic losses (Priest,
1993; Abee and Wouters, 1999; Anderson Borge et al., 2001). Indeed, B.
weihenstephanensis is a frequent contaminant of dairy products (Christiansson et al.,
1999; Heyndrickx and Scheldeman, 2002; Svensson et al., 2004; Bartoszewicz et al.,
2008) and can be found in a number of vegetable products (Valero et al., 2002) and
spoiled egg products (Baron et al., 2007; Jan et al., 2011).
In order to improve effective control of psychrotrophic bacterial growth,
especially in minimally processed foods, combination of physical and chemical
environmental factors with low temperatures are widely used. Preservative stresses such
as aw, pH and low temperature are typical examples.
Salt is a common additive widely used in food industry to control bacterial
growth (Abee and Wouters, 1999). Bacterial cells exposed to salt stress generate a water
efflux. In B. cereus, to recover and maintain cellular turgor, there is an induction of
osmoprotectant transporters. den Besten et al. (2009) reported that ion-dependent
symporters encoded by genes opuD and opuE, a gene encoding a proton-dependent di-
and tripeptide transporter and a gene encoding a proline/betaine transporter, were all
highly induced upon exposure to salt stress. Likewise, upregulation of Na+/H+
antiporters and other cation transporters were also induced. Besides, upregulation of
sigB and σB-dependent genes was observed after mild and severe salt stresses. However,
sigB and rsbY deletion mutant did not show impaired growth in comparison with
parental strains indicating that the role of σB and its regulon is limited under these
conditions (den Besten et al., 2009). Moreover, Browne and Dowds (2001) reported that
glycolytic enzymes were regulated by osmotic shocks. Further studies (den Besten et
al., 2009) reveal that severe salt stress increases expression of tricarboxylic acid cycle
Chapter 5
108
proteins and components of electron transport chain after resumption of growth,
meanwhile expression of genes involved in nucleotide and amino acid transport were
repressed. Likewise, genes involved in chemotaxis and motility were downregulated
resulting in filamentous cells with affected chemotaxis behavior after long exposition
periods (den Besten et al., 2009). In addition, genes involved in oxidative response were
upregulated upon exposure to osmotic shock (den Besten et al., 2009). This increased
catalase activity in salt-adapted cells resulting in a cross-protection against H2O2.
Besides, activation of this general salt stress response has been shown to increase
bacterial heat and chilling resistance through the induction of the transcription of
osmoprotectant transporters (Holtmann and Bremer, 2004; Wemekamp-Kamphuis et al.,
2004).
On the other hand, temperature is one of the most important environmental
factors to which bacteria have to respond. Depending on its thermal niche, each
microorganism shows an optimal growth temperature. When bacteria are challenged by
increased or decreased temperature in their environment they undergo modifications in
cellular physiology which show substantial differences. At low temperatures, reduction
of biochemical reaction rates is observed resulting in cold shock and acclimation
response (for further information see Chapter 7). Moreover, bacteria subjected to high
temperatures develop a heat shock response which includes increased synthesis of a set
of conserved heat-shock proteins (HSPs) and ATP-dependent proteases such as ClpP
(Periago et al., 2002a) (for further information see Chapter 2).
Lag phase corresponds with the delay before exponential growth, during which
microbial cells do no divide and adjust their metabolism to environment. In food
microbiology, a lag phase might occur just after food product contamination with
environment, or when a contaminated food product undergoes important environmental
fluctuations (Delignette-Muller et al., 2005). Lag phase duration varies, depending on
the phenotype of the bacteria (Buchanan and Cygnarowicz, 1990), physiological history
of the population (McMeekin et al., 1993) and changes in the physicochemical
environment (Zwietering et al., 1994).
The duration of the lag phase depends on the amount of work to be carried out
by cells prior to exponential growth and the rate at which this work is undertaken

Chapter 5
109
(Robinson et al., 1998; Ross, 1999). According to Baranyi and Roberts (1994), the
“work to be done” is proportional to h0, the product of the lag time (λ) and the µmax at
which the work is carried out. Robinson et al. (1998) pointed out that there is no direct
way to measure this rate. In the commonly used version of the model of Baranyi and
Roberts, it is assumed to be the same as the cells’ specific maximum growth rate.
Numerous studies have shown the influence of the magnitude of the change in the
environmental factors on the “work to be done” prior to growth (Mellefont et al., 2003;
Mellefont and Ross, 2003; Delignette-Muller et al., 2005). Further studies (Le Marc et
al., 2010; Muñoz-Cuevas et al., 2010) found that h0 depends not only on the magnitude
of the change between the previous and the current conditions but also on the
conditions prevailing after shifts. In most of these studies, the models developed for h0
were not validated in food products. An attempt to apply a model for the intermediate
lag time of Listeria monocytogenes developed in culture medium to experiments in
milk was made by Le Marc et al. (2010). In their study on the effects of osmotic stress
on the lag time of Salmonella enterica, Zhou et al. (2011) found that for the same
osmotic stress, the parameter h0 was significantly different in minimum and rich media.
Therefore, the direct use of h0 models developed in rich laboratory medium to describe
the bacterial lag time in some food products lacking the essential elements for bacterial
adaptation is questionable.
In this study, we developed a model for the effects of water activity (aw) and
temperature on the specific growth rate and lag phase duration of B.
weihenstephanensis. The lag time was modelled through the effects of magnitude shifts
of change between pre-incubatory conditions and the stringency of the new
environmental conditions on the parameter h0 (“work to be done” prior to growth). The
model was used to predict both initial and intermediate lag times. The predictive ability
of the developed model under fluctuation temperature conditions was tested in culture
medium as well as in cream pasta and carrot soup. Those two products are also
representative of the product categories in which B. weihenstephanensis can be found.
Besides, pasta cream is an example of a product rich in nutrients whereas carrot soup
composition is not as favorable for bacterial growth (Hernández-Herrero et al., 2008)

Chapter 5
110
5.2. Material and methods
5.2.1. Bacterial strain and inoculum preparation
The bacterial strain used in this study was B. weihenstephanensis KBAB4,
kindly provided by the National Institute of Agronomic Research (INRA, Avignon,
France). This microorganism was sporulated in Fortified Nutrient Agar (FNA) (Mazas
et al., 1995) and stored at -20°C until use. Spores were activated 10 minutes at 80°C
before every experiment to ensure that subsequent vegetative cells growth would have
the same physiological state. Next, two consecutive overnight subcultures were
performed in Brain Heart Infusion broth (BHI; Scharlau, Barcelona, Spain) at 30°C for
experimental model and at 20ºC for validation procedure.
5.2.2. Previous growth conditions and shifts to final growth conditions
To assess the effect of environmental shifts on the amount of work to be done
(h0) bacterial cultures were grown in different previous conditions and transferred to
different final growth conditions as is indicated in Tables 1 and 2. Depending on
incubation temperature and aw, 43 combinations of previous and final environments
were studied. Growth curves were performed in modified BHI by adding NaCl
(Panreac, Barcelona, Spain).
The aw value was calculated from the concentration of NaCl using the following
equation (Resnik and Chirife, 1988):
000,1
1221.02471.51
xNaClNaClaw
+−=
(1)
where NaCl is the concentration of NaCl (% w/w).
Tubes filled with 9 mL of BHI adjusted to aw values of 0.997, 0.989 and 0.977
and pre-incubated at the target temperature were inoculated with 103 CFU/mL
approximately of bacterial culture and incubated at 10, 12, 16, 20 and 30°C depending
on the condition tested (Tables 1 and 2). When optical density (OD) of the culture
Chapter 5
111
reached a value between 0.17 and 0.2, exponentially growing population was subject to
different final growth conditions (Tables 1 and 2).
5.2.3. Measurement methods of exponential populations growth after aw and
temperature shifts
Estimation of bacterial growth during final conditions was carried out by using
either viable plate count (VPC) or OD measurements. To perform VPC estimations, 9
mL of modified BHI (added with NaCl) already at the target temperature were
inoculated with 103 CFU/mL and incubated at target temperature. At appropriate time
intervals, samples were plated onto BHI agar (BHIA; Scharlau, Barcelona, Spain)
previous 10-folds dilutions in buffered peptone water (Scharlau, Barcelona, Spain).
After incubation at 30ºC for 24 hours, colonies were counted. Growth curves were
determined in duplicate.
To determine bacterial growth after shift by using OD measurements, calibration
curves to relate OD and bacterial concentration were constructed. From a culture
growing exponentially in BHI at 30ºC, serial two fold dilutions were performed as
described by Cuppers and Smelt (1993) in BHI and BHI supplemented with 4% NaCl.
Microwell plates were filled with 400 µl of diluted culture per well and incubated at
30°C in the Bioscreen C automatic reader (Labsystems, Helsinki, Finland). At
appropriate time intervals, samples were removed from the wells, diluted and plated
onto BHI agar for VPC. The plates were incubated at 30ºC for 24 h. The OD of the
wells was recorded immediately before the sample was taken. OD values were plotted
against viable counts.
The relationship between the bacterial concentration and OD values was not
found to be affected by temperature and aw and showed to be linear in the range that is
described as follows:
77 100.1109.5/ −×= ODmlCFU (2)
Chapter 5
112
To carry out growth curves by using OD measurements, serial ten and two fold
dilutions of exponentially growth bacteria were carried out in modified BHI already at
the target temperature. Ten dilutions were obtained with concentrations ranging from
101-106 CFU/mL approximately. Aliquots of 400 µl of each dilution were added into 10
wells of a sterile microwell plate. Depending on the condition tested (Tables 1 and 2)
plates were incubated at 16, 20 and 30ºC in the Bioescreen C automatic reader and
optical density was measured at appropriate time intervals.
5.2.4. Determination of growth parameters during final conditions
The kinetic parameters of the population subjected to temperature and aw shifts
were estimated by the method described by Métris et al. (2006). The detection time (Td),
was determined to be the required time for the microbial population to generate a 0.2
increase in optical density from the start of the incubation in each microwell plate.
When Td values are plotted against the corresponding inoculum size (calculated as Ln
CFU/mL), µmax can be calculated as the negative reciprocal of the slope of the
regression line (Cuppers and Smelt, 1993). Assuming an exponential bacterial growth at
a constant specific growth rate (µ) until the detection time, Td is related to the lag time
of the culture as follows (see e.g. Baranyi and Pin, 1999):
max
0 )ln()ln(
µλ NN
Td d −+= (3)
where Nd is the bacterial number at Td, obtained by means of calibration curves, and N0
the number of cells initiating growth in the well considered.
When growth after shifts was determined by using VPC measurements, growth
rates and h0 values were calculated by fitting the growth curves obtained after shifts
with the model of Baranyi and Roberts (1994).

Chapter 5
113
5.2.5. Growth rate and h0 model
To describe the dependence of µmax on the specific growth rate, we used the
square root model proposed by Muñoz-Cuevas et al. (2010):
( ) bwbwTTb −−= maxmin0maxµ (4)
where ww ab −= 1100 , Tmin is the theoretical minimum temperature for growth, bwmax is
the maximum bw value supporting growth and b0 another model parameter.
The models for h0 developed by Muñoz-Cuevas et al. (2010) for L.
monocytogenes were modified to allow the description of the high values of the
parameter h0 observed after downshifts near growth limiting conditions for B.
weihenstephanensis. The equations proposed for temperature shifts and osmotic shifts
are as follows:
( ) ( ) 321
min0a
ca
ca
cp bwTTTTh −−= (5)
where the subscripts p and c indicate the conditions before and after shifts, respectively,
and Tmin, a1, a2 and a3 are the model parameters.
( ) ( ) ( ) 321
max0c
cc
cc
cp bwbwTbwbwh −−= (6)
where bwmax, c1, c2 and c3 are the model parameters identified by non linear regression.
5.2.6. Validation of the experimental model for bacterial population subjected
to sudden temperature shifts
The predictive ability of the combined model (h0 and µmax) was assessed by
comparing model predictions and observed growth curves of B. weihenstephanensis in
broth medium, carrot soup and creamed pasta under changing conditions of
temperature. The BHI medium was prepared according to the manufacturer indications.
Chapter 5
114
To elaborate the soup, carrots were washed and peeled before being homogenized in a
commercial blender (Moulinex, Lyon, France) and partially sieved. Creamed pasta was
made in our laboratory in a food processor (Thermomix TM 31, Vorwerk, Germany)
using olive oil, bacon, cream, cheese, water and macaroni. In order to ensure
appropriate homogenization of bacterial population within the food matrix, creamed
pasta was diluted ten folds in sterile distilled water for validation experiments. NaCl
was added to carrot soup and diluted creamed pasta until reaching a concentration of
0.5% and pH was adjusted to 6.5. Aliquots of 9 mL of homogenized food products were
added into tubes and heated at 100ºC for 10 min during three consecutive days to
inactivate background microflora before inoculation studies. Samples were stored in
refrigeration until use.
Inoculum was prepared as described above. After pre-incubation at 20°C,
bacterial cultures were inoculated in 9 mL of sterilized food and broth medium to give a
final concentration between 102 -103 CFU/mL. Temperature shifts were setting resulting
in two different profiles. Samples were incubated at target temperatures during 240
hours subjected to the following temperature shifts, Profile 1: 84 hours at 12ºC,
followed by 84 hours at 10ºC and finally 72ºC hours at 15ºC. Profile 2: 96 hours at
10ºC, next 29 hours at 16ºC and to conclude, 115 hours at 10ºC. At appropriate time
intervals, samples were removed from the tubes, diluted and plated onto BHIA for VPC.
The plates were incubated at 30ºC for 24 h. Growth curves were determined in
duplicate.
Reference curves were obtained in BHI and in the studied foods to evaluate the
difference between the µmax in food products and in BHI. Predictions were performed by
solving the system consisting of the model of Baranyi and Roberts (1994) and equations
4 to 6 by a Runge-Kutta method (ODE23, Matalab 2007b, TheMathWorks). The
parameter ymax in the model of Baranyi and Roberts was fixed to the maximum
concentration observed in BHI: ymax= 1010 CFU/mL. Two criteria were used to assess
model performance: the Mean Deviation (MD) and the Mean Absolute Difference
(MAD) which are, respectively, the mean of the difference and the mean of the absolute
difference between the observed and the predicted bacterial concentration.

Chapter 5
115
5.3. Results and discussion
5.3.1. Effects of shifts on the growth model parameters
Tables 1 and 2 show the observed maximum specific growth rates, lag times and
h0 values after the temperature and the water activity downshifts applied in this study.
Our results support the hypothesis that the maximum specific growth rate depended
only on the current growth conditions and was not affected by the previous
environment. F-tests (p=0.05) performed did not highlight significant differences
between growth rates obtained at the same growth conditions but after different
previous environment.
The observed maximum growth rates after downshifts were used to fit equation
3. Fitted parameters and their standard errors are proposed in Table 3. The good
correspondence between fitted and observed maximum specific growth rates is shown
in Figure 1 where all the datapoints were very close to the line of unity, indicating a
very good prediction of the observed values. This indicates that once adaptation to the
new conditions was reached, maximum growth rate was only dependent on the
conditions of the recovery medium as previously reported Muñoz-Cuevas et al. (2010).
The observed values of lag times and h0 show that B. weihenstephanensis is
more sensitive to temperature shifts than other microorganisms, such as L.
monocytogenes. Whereas the h0 values observed by Muñoz-Cuevas et al. (2010) for L.
monocytogenes did not exceed ca. 3.0, the maximum h0 values observed in this study
reached a level of ca. 20 (Table 1). The results also show that the parameter h0 depends
not only on the magnitude of the shifts but also on the conditions prevailing after shift.
At 0.5% NaCl a downshift of 10°C (from 30 to 20°C) induces a workload h0=0.6
(corresponding to a lag time of 0.9 h) whereas a downshift from the same magnitude
applied from 20 to 10°C results in a h0 value of 4.86 (corresponding to a lag time of 109
h).
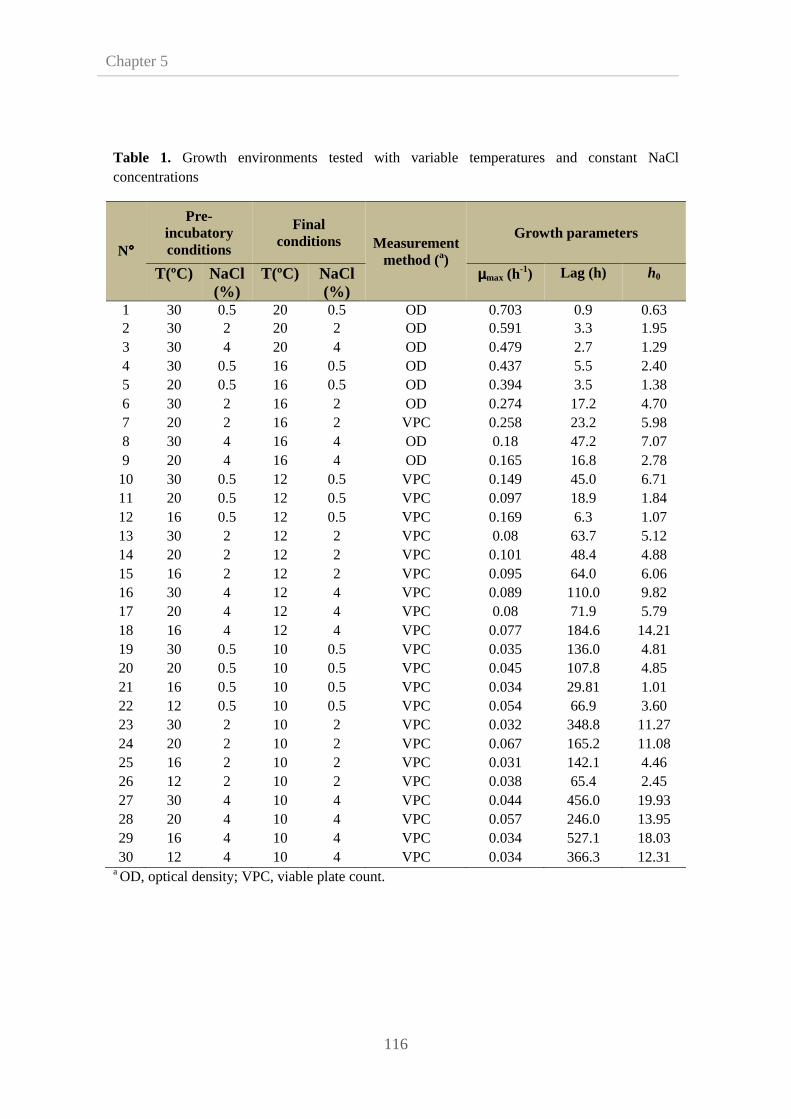
Chapter 5
116
Table 1. Growth environments tested with variable temperatures and constant NaCl concentrations
N°°°°
Pre-incubatory conditions
Final conditions Measurement
method (a)
Growth parameters
T(ºC) NaCl (%)
T(ºC) NaCl (%)
µµµµmax (h-1) Lag (h) h0
1 30 0.5 20 0.5 OD 0.703 0.9 0.63 2 30 2 20 2 OD 0.591 3.3 1.95 3 30 4 20 4 OD 0.479 2.7 1.29 4 30 0.5 16 0.5 OD 0.437 5.5 2.40 5 20 0.5 16 0.5 OD 0.394 3.5 1.38 6 30 2 16 2 OD 0.274 17.2 4.70 7 20 2 16 2 VPC 0.258 23.2 5.98 8 30 4 16 4 OD 0.18 47.2 7.07 9 20 4 16 4 OD 0.165 16.8 2.78 10 30 0.5 12 0.5 VPC 0.149 45.0 6.71 11 20 0.5 12 0.5 VPC 0.097 18.9 1.84 12 16 0.5 12 0.5 VPC 0.169 6.3 1.07 13 30 2 12 2 VPC 0.08 63.7 5.12 14 20 2 12 2 VPC 0.101 48.4 4.88 15 16 2 12 2 VPC 0.095 64.0 6.06 16 30 4 12 4 VPC 0.089 110.0 9.82 17 20 4 12 4 VPC 0.08 71.9 5.79 18 16 4 12 4 VPC 0.077 184.6 14.21 19 30 0.5 10 0.5 VPC 0.035 136.0 4.81 20 20 0.5 10 0.5 VPC 0.045 107.8 4.85 21 16 0.5 10 0.5 VPC 0.034 29.81 1.01 22 12 0.5 10 0.5 VPC 0.054 66.9 3.60 23 30 2 10 2 VPC 0.032 348.8 11.27 24 20 2 10 2 VPC 0.067 165.2 11.08 25 16 2 10 2 VPC 0.031 142.1 4.46 26 12 2 10 2 VPC 0.038 65.4 2.45 27 30 4 10 4 VPC 0.044 456.0 19.93 28 20 4 10 4 VPC 0.057 246.0 13.95 29 16 4 10 4 VPC 0.034 527.1 18.03 30 12 4 10 4 VPC 0.034 366.3 12.31
a OD, optical density; VPC, viable plate count.
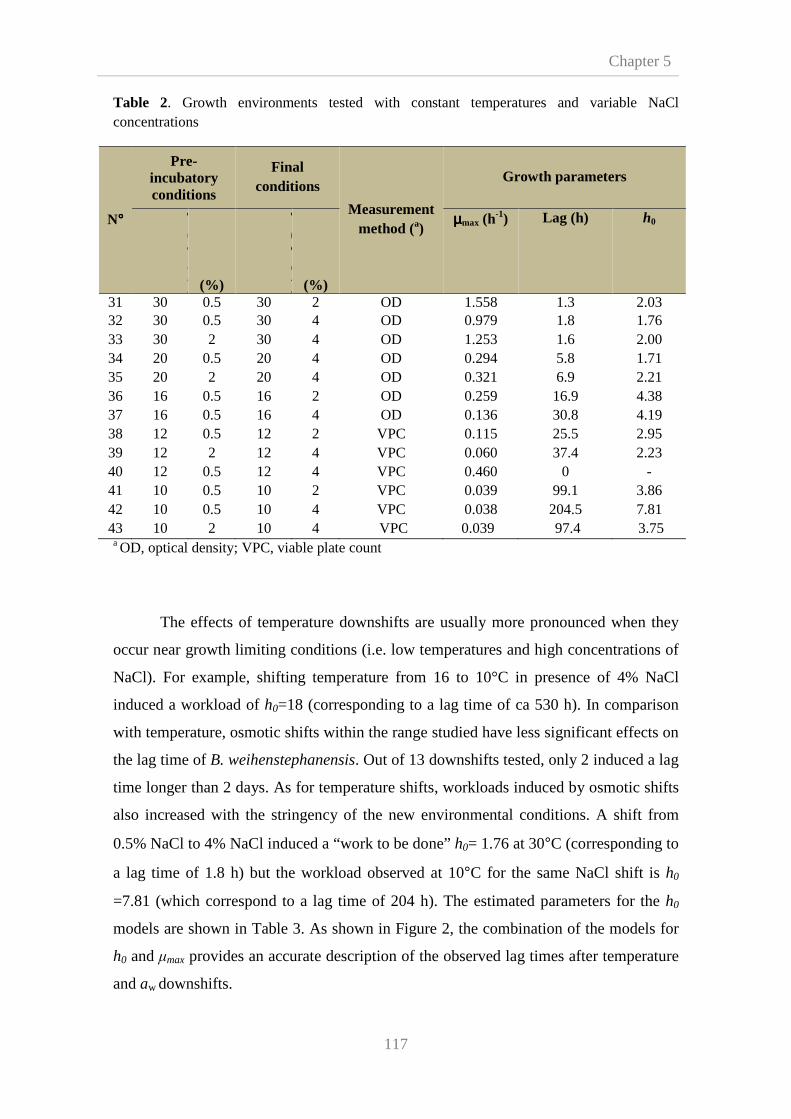
Chapter 5
117
Table 2. Growth environments tested with constant temperatures and variable NaCl concentrations
N°°°°
Pre-incubatory conditions
Final conditions
Measurement method (a)
Growth parameters
T(ºC) (%)
T(ºC) (%)
µµµµmax (h-1) Lag (h) h0
31 30 0.5 30 2 OD 1.558 1.3 2.03 32 30 0.5 30 4 OD 0.979 1.8 1.76 33 30 2 30 4 OD 1.253 1.6 2.00 34 20 0.5 20 4 OD 0.294 5.8 1.71 35 20 2 20 4 OD 0.321 6.9 2.21 36 16 0.5 16 2 OD 0.259 16.9 4.38 37 16 0.5 16 4 OD 0.136 30.8 4.19 38 12 0.5 12 2 VPC 0.115 25.5 2.95 39 12 2 12 4 VPC 0.060 37.4 2.23 40 12 0.5 12 4 VPC 0.460 0 - 41 10 0.5 10 2 VPC 0.039 99.1 3.86 42 10 0.5 10 4 VPC 0.038 204.5 7.81 43 10 2 10 4 VPC 0.039 97.4 3.75 a OD, optical density; VPC, viable plate count
The effects of temperature downshifts are usually more pronounced when they
occur near growth limiting conditions (i.e. low temperatures and high concentrations of
NaCl). For example, shifting temperature from 16 to 10°C in presence of 4% NaCl
induced a workload of h0=18 (corresponding to a lag time of ca 530 h). In comparison
with temperature, osmotic shifts within the range studied have less significant effects on
the lag time of B. weihenstephanensis. Out of 13 downshifts tested, only 2 induced a lag
time longer than 2 days. As for temperature shifts, workloads induced by osmotic shifts
also increased with the stringency of the new environmental conditions. A shift from
0.5% NaCl to 4% NaCl induced a “work to be done” h0= 1.76 at 30°C (corresponding to
a lag time of 1.8 h) but the workload observed at 10°C for the same NaCl shift is h0
=7.81 (which correspond to a lag time of 204 h). The estimated parameters for the h0
models are shown in Table 3. As shown in Figure 2, the combination of the models for
h0 and µmax provides an accurate description of the observed lag times after temperature
and aw downshifts.

Chapter 5
118
Table 3.Estimated parameters of the maximum specific growth rate and h0 models
Model Parameter Estimate 95% Confidence Interval
R2 Inf Sup
Sqrt(µmax) b0 0.0148 0.012 0.016 0.98
Tmin 6.10 5.65 6.56
bwmax 25.3 22.5 28.0
Sqrt(h0)
(temperature) a1 0.13 0.03 0.24 0.76
a2 -0.55 -0.74 -0.36
a3 0.66 0.53 0.80
Sqrt(h0)
(NaCl) c1 0.39 0.10 0.69 0.61
c2 -0.41 -0.69 -0.14
c3 0.40 0.11 0.68
Figure 1. Square root of the observed and fitted specific growth rates of B. weihenstephanensis.
0
0.2
0.4
0.6
0.8
1
1.2
1.4
0 0.2 0.4 0.6 0.8 1 1.2 1.4
Sqrt (µmax) (h-0.5) observed
Sq
rt (µ
max
) (h
-0.5 ) f
itted
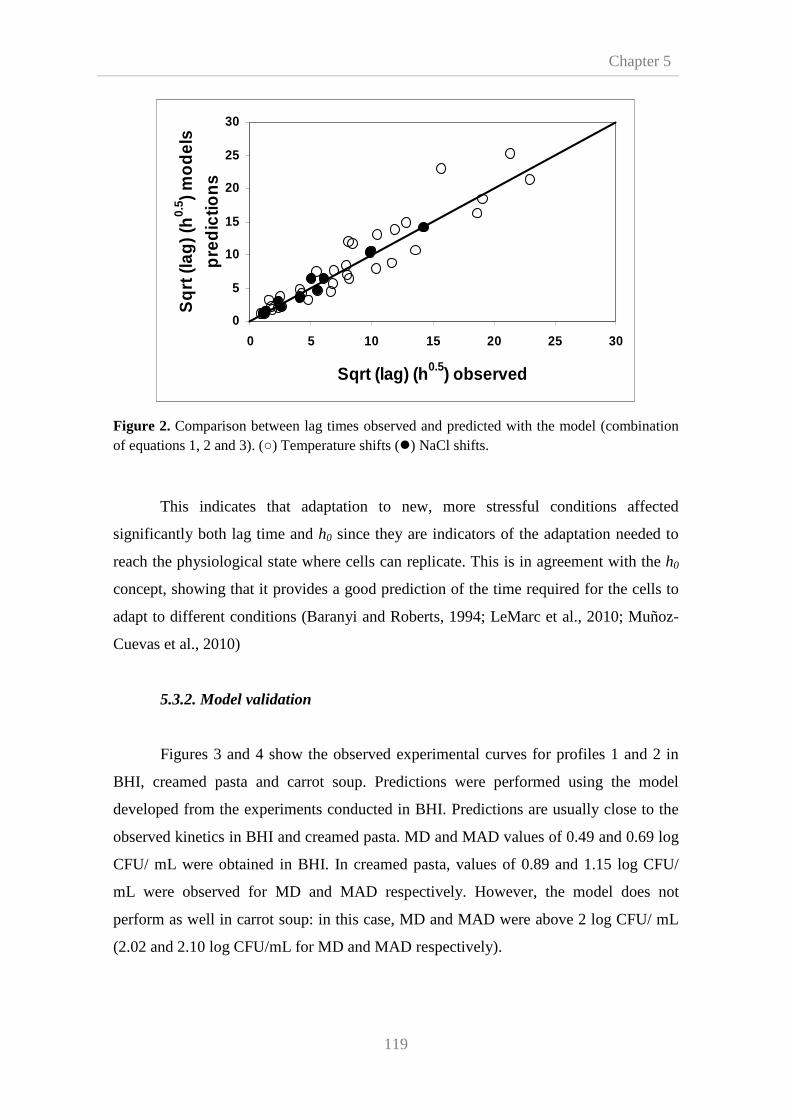
Chapter 5
119
Figure 2. Comparison between lag times observed and predicted with the model (combination of equations 1, 2 and 3). () Temperature shifts () NaCl shifts.
This indicates that adaptation to new, more stressful conditions affected
significantly both lag time and h0 since they are indicators of the adaptation needed to
reach the physiological state where cells can replicate. This is in agreement with the h0
concept, showing that it provides a good prediction of the time required for the cells to
adapt to different conditions (Baranyi and Roberts, 1994; LeMarc et al., 2010; Muñoz-
Cuevas et al., 2010)
5.3.2. Model validation
Figures 3 and 4 show the observed experimental curves for profiles 1 and 2 in
BHI, creamed pasta and carrot soup. Predictions were performed using the model
developed from the experiments conducted in BHI. Predictions are usually close to the
observed kinetics in BHI and creamed pasta. MD and MAD values of 0.49 and 0.69 log
CFU/ mL were obtained in BHI. In creamed pasta, values of 0.89 and 1.15 log CFU/
mL were observed for MD and MAD respectively. However, the model does not
perform as well in carrot soup: in this case, MD and MAD were above 2 log CFU/ mL
(2.02 and 2.10 log CFU/mL for MD and MAD respectively).
0
5
10
15
20
25
30
0 5 10 15 20 25 30
Sqrt (lag) (h0.5) observed
Sq
rt (l
ag) (
h0.
5 ) mo
del
s p
red
ictio
ns

Chapter 5
120
Figure 3. Growth of B. weihenstephanensis subjected to temperature profile 1 (dashed line). Shown is a comparison between the model prediction (straight line) with BHI (), pasta () and carrot (◊).
For profile 1, the predictions are in agreement with the observed bacterial
concentrations in BHI until 168 h. The initial lag time induced by the shift from 20°C to
12°C was correctly predicted by the model. The temperature downshift from 12 to 10°C
induced the growing population into a lag period. However, the temperature upshift
from 10 to 15°C did not resume the bacterial growth as it is predicted by the model. The
bacterial growth kinetics in creamed pasta are very close to those observed in BHI.
However, in carrot soup the initial lag phase duration of B. weihenstephanensis is
considerably longer than in BHI and creamed pasta (between 72 and 96 h in carrot soup
against ca. 15 h in BHI and cream). The downshift from 12 to 10°C applied when B.
weihenstephanensis was at concentration of 3.8 log CFU/mL induced an intermediate
lag time. Contrarily to the experiments in BHI and creamed pasta, growth resumed after
the downshift and the temperature upshift applied accelerated bacterial growth until the
bacterial concentration reached ca. 10 log CFU/mL.
0
2
4
6
8
10
12
0 50 100 150 200 250
Time (h)
Lo
g C
FU
/ g
4
6
8
10
12
14
16
18
20
Tem
per
atu
re (C
)
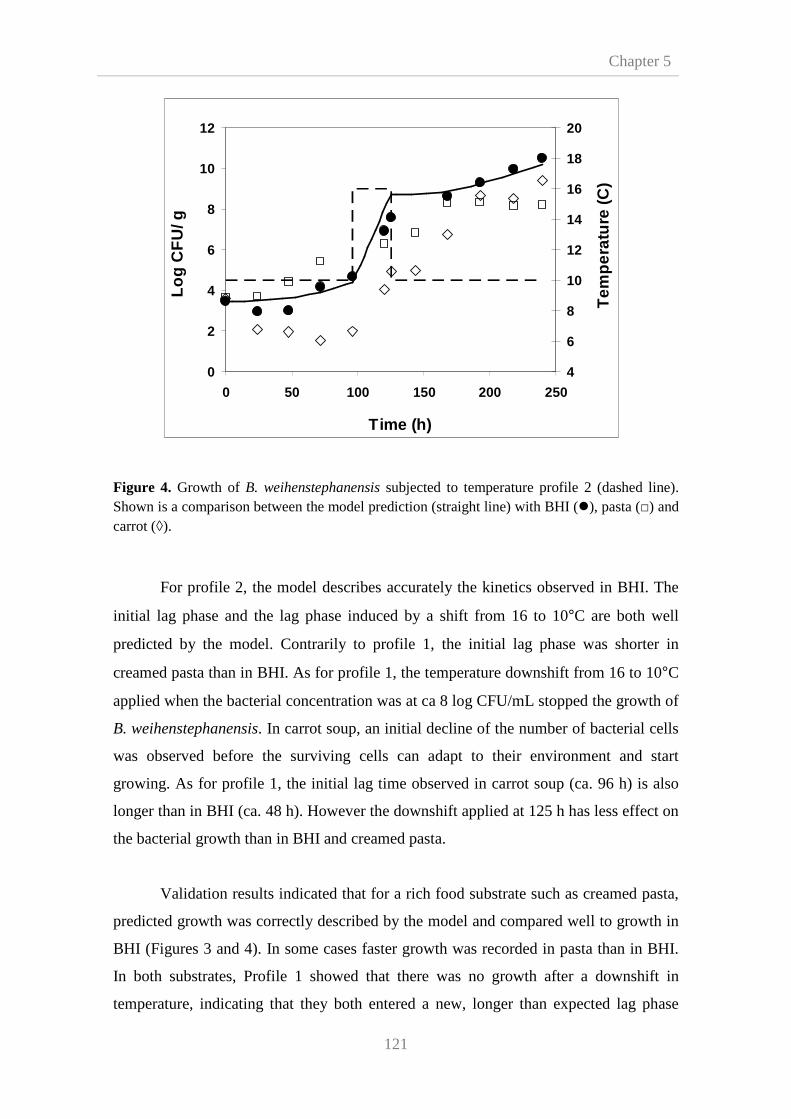
Chapter 5
121
Figure 4. Growth of B. weihenstephanensis subjected to temperature profile 2 (dashed line). Shown is a comparison between the model prediction (straight line) with BHI (), pasta () and carrot (◊).
For profile 2, the model describes accurately the kinetics observed in BHI. The
initial lag phase and the lag phase induced by a shift from 16 to 10°C are both well
predicted by the model. Contrarily to profile 1, the initial lag phase was shorter in
creamed pasta than in BHI. As for profile 1, the temperature downshift from 16 to 10°C
applied when the bacterial concentration was at ca 8 log CFU/mL stopped the growth of
B. weihenstephanensis. In carrot soup, an initial decline of the number of bacterial cells
was observed before the surviving cells can adapt to their environment and start
growing. As for profile 1, the initial lag time observed in carrot soup (ca. 96 h) is also
longer than in BHI (ca. 48 h). However the downshift applied at 125 h has less effect on
the bacterial growth than in BHI and creamed pasta.
Validation results indicated that for a rich food substrate such as creamed pasta,
predicted growth was correctly described by the model and compared well to growth in
BHI (Figures 3 and 4). In some cases faster growth was recorded in pasta than in BHI.
In both substrates, Profile 1 showed that there was no growth after a downshift in
temperature, indicating that they both entered a new, longer than expected lag phase
0
2
4
6
8
10
12
0 50 100 150 200 250
Time (h)
Lo
g C
FU
/ g
4
6
8
10
12
14
16
18
20
Tem
per
atu
re (C
)

Chapter 5
122
after a change from 12 to 10ºC when active growth was taking place. A downshift has
been reported to have bigger effects at high cell concentrations (Le Marc et al., 2010)
which would be in agreement with our results. For Profile 2, there was a different
behavior between both substrates, since a short upshift was correctly predicted in BHI
with a slight delay in the growth rate. However in creamed pasta the same behavior as
in Profile 1 was found (a delay in the onset of growth after the shift), indicating that B.
weihenstephanensis adapted faster after the changes in the laboratory medium (BHI)
than in the food (pasta).
In the carrot soup, a longer lag time was recorded for both profiles (Figures 3
and 4) as it was expected, since a transfer from a rich medium such as BHI to poorer
and new nutrient conditions requires a longer adaptation period (Zhou et al., 2010). In
Profile 1, however, since this longer lag time included the first temperature downshift,
once cells were adapted and started to grow, there was no second lag phase, as it was
observed in BHI and creamed pasta, were higher cell concentrations were registered in
the carrot soup. This is in agreement with observations that, once cells have been
adapted, their growth rate only depends on the present environmental conditions
(Muñoz et al., 2009; Muñoz-Cuevas et al., 2010). For Profile 2 in carrot soup an initial
decline was observed, which could correspond to a selection of a subpopulation
resistant to low temperature and a poorer substrate in combination. It has also been
described an initial decline when current conditions are near the growth limits as would
be a temperature of 10ºC (Zhou et al., 2010). Again, as in Profile 1, since the
temperature shift happened at the early stages of the onset of growth, no delay in growth
rate or new lag phase were observed.
These results show that the model proposed can describe correctly growth under
dynamic conditions in refrigerated foods of B. weihenstephanensis, which can be
considered as a worst case scenario for B. cereus group. However, the composition of
the food can induce deviations from the predictions, more notably for poor growth
substrates, therefore it is important to validate predictions in conditions close to the real
scenario.
Predictions from the dynamic model can be useful to simulate the behavior of
the microbial evolution in the real conditions of the refrigeration chain and with shifts in

Chapter 5
123
aw that can happen when an ingredient is used to prepare a final product. They can be an
useful tool for risk assessment purposes in foods where B. weihenstephanensis can be
considered as a suitable indicator.

Chapter 6
125
CHAPTER 6
Determination of the effect of acid stress on growth and
viability of Bacillus cereus and Bacillus
weihenstephanensis using flow cytometry.
Abstract
The present work studies the effect of acid stress on cell viability and growth of Bacillus
cereus and Bacillus weihenstephanensis. Experiments were performed by means of flow
cytometry (FCM) combined with fluorescent labeling. Propidium iodide, for membrane
evaluation, and carboxyfluorescein diacetate, for esterase activity assessment were used
to obtain differential staining of both strains. pH values of 3.4, 3.8 and 4.2 were selected
on the basis of previous screening tests. FCM analysis showed to clearly discriminate
between different populations, viable and damaged cells, leading to successfully study
acid stress effect on B. cereus and B. weihenstephanensis vegetative cells’ viability.
Reliability of FCM analysis for detection of B. cereus and B. weihenstephanensis
vegetative cells was compared with classical viable plate count techniques (VPC). FCM
and VPC results were not comparable and classical analytical methods showed higher
reliability.
125
11110000
9
8
7
6
5
4
3
2
1

Chapter 6
126
10
9
8
7
5
4
3
2
1
Chapter 6
127
6.1. Introduction
It is well known that acid resistance is a key parameter to control bacterial
growth. Low-pH foods are widely used to ensure microbiological quality and stability
by adding organics acids. Besides, the risk of B. cereus food poisoning is strongly
determined by their resistance to low pH since the diarrheal syndrome is caused by
vegetative cells ingested with food which subsequently produce enterotoxins in the
small intestine after surviving to the acid environment of human stomach (Kotiranta et
al., 2000).
It has been shown that B. cereus response to acid stress involves general stress
response, metabolic rearrangements, pH omeostasis and secondary oxidative response
(Figure 1) (Mols and Abee, 2011). Besides, Bacilli exposed to low pH undergo a cell
envelopes adaptation which involves elongation, branching and desaturation of
membrane as well as changes in the lipid composition and charge of the membrane (Ter
Beek and Brul, 2010). Likewise, Hornbaek et al. (2004) reported that Bacillus
licheniformis tries to control the permeability of the cell membrane to protons by
changing the fatty acid structure corresponding to a more rigid membrane at low
external pH values.
Protein repair chaperones Dnak and GroELS (Mols and Abee, 2011) and
transcriptional regulator alternative σB factor (van Schaik et al., 2004) mediate general
stress response upon acid stress. The clp genes showed to be upregulated at low pH as
ctsR and hrcA genes (van de Guchte et al., 2002) which encode heat stress regulators
indicating cross-protection of B. cereus exposed to various stress conditions.
On the other hand, metabolic rearrangements conducing to consume intracellular
protons or to restore NAD+/NADH balance are induced by B. cereus upon acid stress. In
2010(a), Mols et al. reported that metabolic rearrangements were found specifically
correlated with lactic acid or acetic acid stress. In fact, after acid shock there is an
induction of genes encoding enzymes involved in fermentative pathways such as
acetoin production, alcohol and lactate dehydrogenases and rerouting of pyruvate
metabolism (Mols and Abee, 2011).

Chapter 6
128
To achieve pH homeostasis upon acid stress, cells should avoid proton inward
flux and favor their transport out of the cell. For this purpose under mild acid stress
F1F0-ATPase genes are repressed (Mols et al., 2010a) and proton-dependant transporters
genes such as napA and nhaC are downregulated. However, at lethal pH values napA
and nhaC are highly induced and F1F0-ATPase protein can be synthesized (Mols and
Abee, 2011). Likewise, to contribute to pH homeostasis alkaline compounds are
produced in order to counteract cytoplasmic acidification through the arginine
deiminase pathway which is moderately upregulated upon exposure to acid in aerobic
conditions and highly upregulated under mild acid anaerobic conditions (van der Voort
and Abee, 2009). In addition, arginase was induced under low pH by B. cereus cells
(Mols and Abee, 2011).
Finally, after exposure to low pH a secondary oxidative stress response has been
described. In 2010(a), through comparative phenotype and transcriptome analyses of B.
cereus strains subject to acid conditions, Mols et al. reported growth rate reduction,
growth arrest and loss of viability due to metabolic shifts and to the induction of general
stress response mechanisms with a major oxidative component including upregulation
of catalases and superoxide dismutases associated to reactive oxygen species formation.
Further studies showed the induction of oxidative stress associated genes encoding
thioredoxins, catalases, superoxide dismutase and the major stress regulator PerR upon
acid shock (Mols and Abee, 2011).
Besides, acid shock may affect electron transfer chain (ETC) activity because
alternative ETC associated genes are induced. Notably, the most prominent induction by
B. cereus ATCC 14579 upon acid shock was nitrate and nitrite reductases (Nar/Nas)
(Mols et al., 2010a) may be because they form an alternative ETC and are involved in
proton consuming reactions. In addition, cytochrome bd oxidase genes such as
cytochrome d ubiquinol oxidase (CydAB), were highly induced upon organic acid
shock and are part of alternative ECT together with NAD(P)H-dependent
dehydrogenases such as lactate and alcohol dehydrogenase (Mols and Abee, 2011).
Expression of cytochrome bd oxidase and lactate dehydrogenase genes is coordinated
and controlled by other genes which are part of the anaerobic Fnr regulon (Reents et al.,
2006). In fact, in 2009 Mols reported that B. cereus is more resistant to acid stress when
is grown under oxygen limitation conditions.
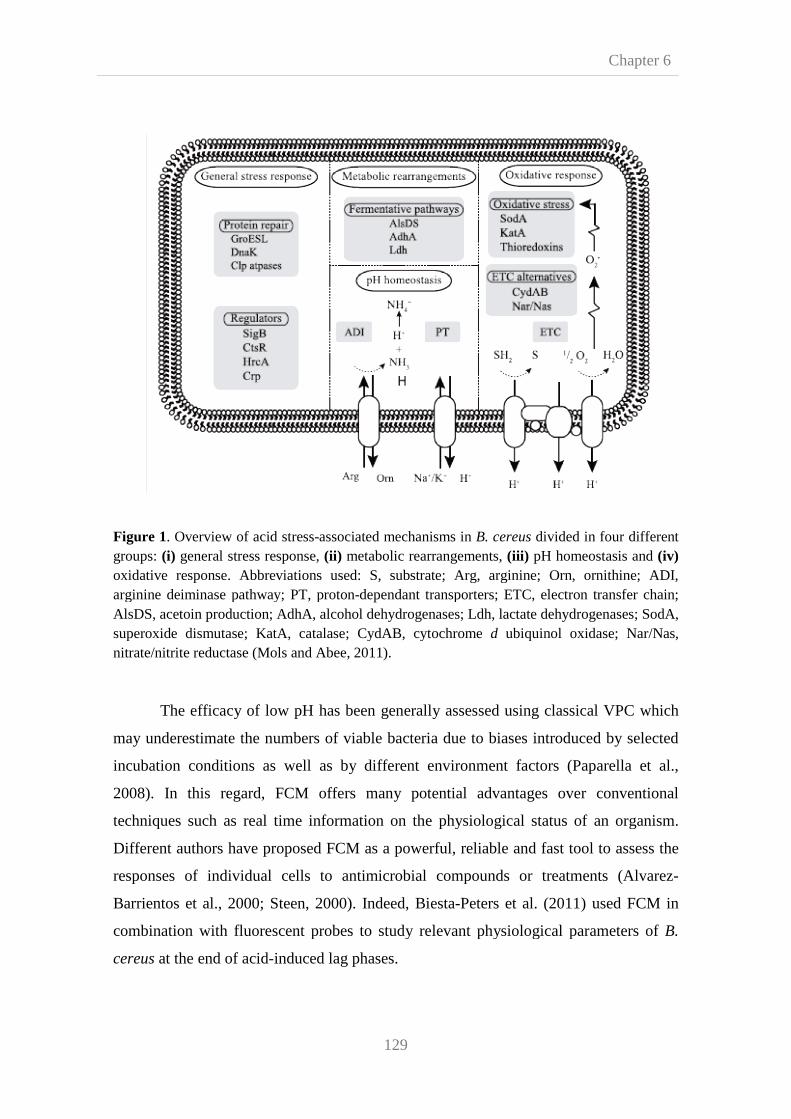
Figure 1. Overview of acid stressgroups: (i) general stress response, oxidative response. Abbreviations used: S, substrate; Arg, arginine; Orn, ornithine; ADI, arginine deiminase pathway; PT, protonAlsDS, acetoin production; AdhA, alcohol dehydrogenases; Ldh, lactate dehydrogenases; SodA, superoxide dismutase; KatA, catalase; CydAB, cytochrome nitrate/nitrite reductase (Mols and Abee, 2011).
The efficacy of low pH has been generally assessed using classical VPC which
may underestimate the numbers of viable bacteria due to biases introduced by selected
incubation conditions as well as by different environment factors (
2008). In this regard, FCM offers many potential advantages over conventional
techniques such as real time information on the physiological status of an organism.
Different authors have proposed FCM as a powerful, reliable and fast tool t
responses of individual cells to antimicrobial compounds or treatments (Alvarez
Barrientos et al., 2000; Steen, 2000). Indeed, Biesta
combination with fluorescent probes to study relevant physiological paramete
cereus at the end of acid-induced lag phases.
129
. Overview of acid stress-associated mechanisms in B. cereus divided in four different general stress response, (ii) metabolic rearrangements, (iii) pH homeostasis and
oxidative response. Abbreviations used: S, substrate; Arg, arginine; Orn, ornithine; ADI, arginine deiminase pathway; PT, proton-dependant transporters; ETC, electron transfer chain; AlsDS, acetoin production; AdhA, alcohol dehydrogenases; Ldh, lactate dehydrogenases; SodA, superoxide dismutase; KatA, catalase; CydAB, cytochrome d ubiquinol oxidase; Nar/Nas,
Mols and Abee, 2011).
The efficacy of low pH has been generally assessed using classical VPC which
may underestimate the numbers of viable bacteria due to biases introduced by selected
incubation conditions as well as by different environment factors (
2008). In this regard, FCM offers many potential advantages over conventional
techniques such as real time information on the physiological status of an organism.
Different authors have proposed FCM as a powerful, reliable and fast tool t
responses of individual cells to antimicrobial compounds or treatments (Alvarez
Barrientos et al., 2000; Steen, 2000). Indeed, Biesta-Peters et al. (2011) used FCM in
combination with fluorescent probes to study relevant physiological paramete
induced lag phases.
Chapter 6
divided in four different pH homeostasis and (iv)
oxidative response. Abbreviations used: S, substrate; Arg, arginine; Orn, ornithine; ADI, endant transporters; ETC, electron transfer chain;
AlsDS, acetoin production; AdhA, alcohol dehydrogenases; Ldh, lactate dehydrogenases; SodA, ubiquinol oxidase; Nar/Nas,
The efficacy of low pH has been generally assessed using classical VPC which
may underestimate the numbers of viable bacteria due to biases introduced by selected
Paparella et al.,
2008). In this regard, FCM offers many potential advantages over conventional
techniques such as real time information on the physiological status of an organism.
Different authors have proposed FCM as a powerful, reliable and fast tool to assess the
responses of individual cells to antimicrobial compounds or treatments (Alvarez-
Peters et al. (2011) used FCM in
combination with fluorescent probes to study relevant physiological parameters of B.

Chapter 6
130
B. weihenstephanensis and B. cereus adaptation and survival in low pH
environments are factors of particular interest in food safety and health since these
microorganisms encounter such conditions in acidified foods and during transit through
the stomach (Jobin et al., 2002). Besides, knowledge of acid stress resistance can be
useful to design probiotic Bacilli (Ter Beek and Brul, 2010). In addition, development
of new methods is needed “for resolution at single cell level to make the data applicable
for predictive modelling based approaches of practical use to the food industry” (Ter
Beek and Brul, 2010). On this basis, the present research aims to characterize the
physiological behavior of B. weihenstephanensis vegetative cells compared to B. cereus
strain type populations after exposure to low pH environments by using FCM analysis
in combination with fluorescent techniques. To discriminate cells in different
physiological states, two specific labels, propidium iodide (PI) and carboxyfluorescein
diacetate (cFDA), were successfully used in concordance with previous studies of
Paparella et al. (2008) and Biesta-Peters et al. (2011). Likewise, reliability of FCM
analysis for detection of B. cereus and B. weihenstephanensis vegetative cells was
assessed in comparison with classical techniques (VPC).
6.2. Materials and methods
6.2.1. Bacterial strains
Two bacterial strains were used in this study, B. weihenstephanensis KBAB4
kindly provided by the National Institute of Agronomical Research (INRA, Avignon,
France) and B. cereus CECT 148 (which corresponds to the type strain B. cereus ATCC
14579) selected from Spanish Type Culture Collection (CECT, Valencia, Spain).
Aliquots of each microorganism were resuspended in sterile NaCl 0.85%, then spread
onto plates of Fortified Nutrient Agar (FNA) (Mazas et al., 1995) and incubated at 30°C
for 3-5 days. Plates were checked daily by phase contrast microscopy (Leica DMLS,
Mc Bain instruments, Wetzlar, Germany) examination, and sporulations were harvested
when at least 90% of the cells had produced spores. The biomass was removed from
agar surface by flooding twice with distilled sterile water, washed three times with
distilled sterile water and stored at -20°C until use. Immediately before use, spore
suspension was heat shocked at 80ºC for 10 minutes to ensure that subsequent cells
grown would have the same physiological state.
Chapter 6
131
6.2.2. Study of low pH effect on B. cereus and B. weihenstephanensis grown
To test acid resistance of B.weihenstephanensis KBAB4 and B. cereus CECT
148, growth curves were made in Brain Heart Infusion broth (BHI, Scharlau, Barcelona,
Spain) acidified to pH 3, 3.4, 3.8, 4.2, 4.6 and 5 with HCl 1M (Panreac, Barcelona,
Spain). A positive control was performed in BHI pH 7. Two consecutives subcultures of
B. weihenstepanensis KBAB4 and B. cereus CECT 148 were carried out in BHI at 30ºC
with shaking (200 rpm) up to stationary phase. Bacterial cultures were inoculated in the
corresponding modified medium and serial dilutions were done to obtain approximately
a population of 103 CFU/mL. Microwells plates were filled with 400 µL of diluted
culture per well and incubated in Bioescreen C automatic reader (Labsystems, Helsinki,
Finland) at 30ºC. Optical density was measured at 600 nm every 10 minutes during 25
hours and plates were shaken periodically. Each condition was tested by triplicate.
6.2.3. Acid stress treatment
B. weihenstephanensis KBAB4 and B. cereus CECT 148 were revitalized by two
consecutive subcultures in BHI at 30ºC with shaking (200 rpm) up to stationary phase.
Next, 50 mL of each bacterial suspension was concentrated by centrifugation at 2,500
rpm for 10 minutes and pellets were resuspended in 10 mL of BHI to obtain a final
concentration of 108 CFU/mL. To study the effect of pH on viability of cells, 1 mL of
concentrated bacterial culture was inoculated in 4 mL of BHI acidified with HCl 1 M to
pHs 3.4, 3.8 and 4.2 and incubated for 5 minutes at 30ºC. At designed time points (30
minutes, 2 hours and 24 hours), samples were taken for FCM analysis and bacterial
growth was measured by VPC.
6.2.4. Culturability evaluation by plate counts
All the conditions tested for B. weihenstephanensis and B. cereus strains (both
controls and pH treatments) were plated onto BHI agar (BHIA, Scharlau, Barcelona,
Spain) once 10-folds dilutions were performed in buffered peptone water (Scharlau,
Barcelona, Spain). After incubation at 30ºC for 24 hours, colonies were counted.
Chapter 6
132
6.2.5. Fluorescent reported dyes
cFDA and PI were used to evaluate cell viability. Both of them selectively stain
different structures allowing differentiation of viable and damaged cells. As long as PI
is a membrane impermeant dye which binds to DNA by intercalating between the bases
when membrane integrity is lost (Ananta et al., 2004), cFDA is a lipophilic dye able to
diffuse inside the cells where is cleaved by unspecific esterases converting in a
membrane-impermeant fluorescent compound, carboxyfluorescein (cF), which is
retained in viable cells with intact cytoplasmic membrane (Petit and Ratinaud, 1993).
Viable cells stained with cFDA emitted green fluorescence, whereas DNA of
damaged cells labeled with PI emitting red fluorescence. Green fluorescence was
collected at 530 nm bandpass filter in the FL1 channel (FL1) and red fluorescence at
580 nm in the channel FL3 (FL3). For this experiment we used a commercial solution
of PI 1mM (Molecular Probes, Oregon, USA). A stock solution 1 mM of cFDA (Sigma
Aldrich Chemie) was performed in phosphate buffered saline to stain Bacillus cells.
Both fluorescent dyes were stored at -20°C until use.
6.2.6. Flow cytometry measurement
Flow cytometry was performed using a FACSCalibur Flow cytometer (BD
Biosciences, San Jose, CA, USA) equipped with a 15 mW air-cooled 488 nm argon-ion
laser. The software used for data acquisition was BD CellQuest Pro (BD Biosciences).
The sheath fluid used for all experiments was FacsflowTM (BD Biosciences), filtered
through a 0.2 µm Millipore Millex-GN filter (Millipore Corporation, Bedford, USA).
Fluorescent beads (CalibriteTM three colors calibration beads, BD Biosciences) were
used as an internal standard for scatter and fluorescence. The FCM analyses were
performed with the following detector settings: forward scatter (FSC), E00; side scatter
(SSC), 400; FL1, 400; FL3, 500 using logarithmic gains. FCM samples were adjusted to
an event rate of 200-700 cells per second and a total of 10,000 events were registered
per sample.
To study viability and damage of vegetative cells of B. weihenstephanensis
KBAB4 and B. cereus CECT 148 incubated at different pH (3.4, 3.8 and 4.2) 10 µL of
Chapter 6
133
each condition were added to 990 µL of prefiltered FascFlow to obtain an approximate
concentration of 106 CFU/mL and stained with 1 µL of fluorescent dye, cFDA or PI.
Samples were vigorously mixed and incubated in the dark at 30ºC temperature for 15
min prior to analysis.
6.2.7. Flow cytometry controls
Positive and negative controls were performed to discriminate Bacillus
population in dot-plot. To test cFDA and PI as fluorescent dye of viable cells aliquots of
1 mL of bacterial culture were inoculated in 5 mL of BHI and stained independently
with 1 µL of each fluorochrome. To assess cFDA and PI as fluorescent dyes of
damaged cells, aliquots of 1 mL of bacterial culture were inoculated in 5 mL of BHI and
then heated at 80°C during 4 minutes before adding independently 1 µL of
fluorochromes to assess loss of cell membrane integrity.
6.2.8. Data analysis of flow cytometry
Data were analyzed with the software package BD CellQuest Pro (BD
Biosciences). Fluoresce collected in channels FL1 and FL3 was analyzed using FCM-
derived dot plots of green or red fluorescence versus SSC. To discriminate bacteria from
artifacts a gate in the dot-plot of FSC vs. SSC was determined. Quantitative assessment
of each bacterial subpopulation was performed by counting the number of events
included inside the corresponding gate (Paparella et al., 2008). Data were displayed as
dual parameter fluorescence density plots.
6.3. Results and discussion
6.3.1. Effect of acid environment on B. cereus and B. weihenstephanensis
growth
The acid responses of B. cereus and B. weihenstephanensis populations on
stationary phase were studied in BHI medium adjusted at different pH values ranging
between 3 and 5. Growth experiments were performed with an automated turbidity
meter, Bioscreen C microbiology reader, and OD measurements were taken every 10
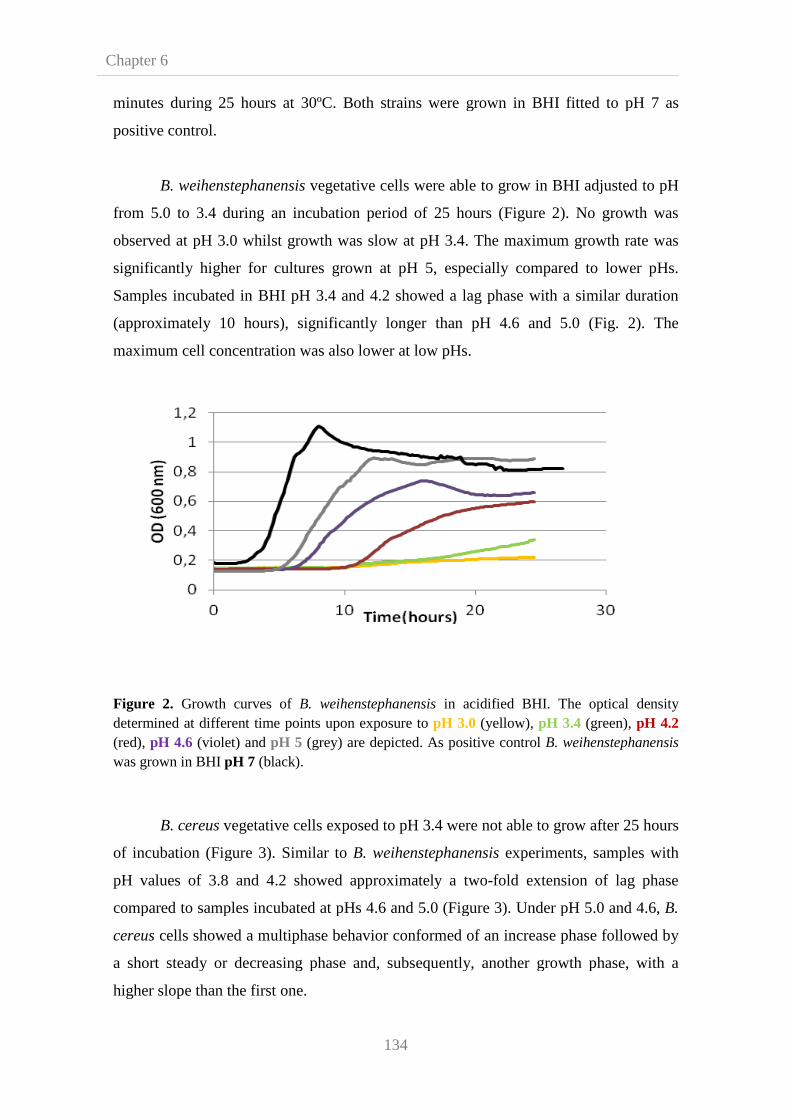
Chapter 6
minutes during 25 hours at 30ºC. Both strains were grown in BHI fitted to pH 7 as
positive control.
B. weihenstephanensis
from 5.0 to 3.4 during an incubation period of 25 hours (Figure 2). No growth was
observed at pH 3.0 whilst growth was slow at pH 3.4. The maximum growth rate was
significantly higher for cultures g
Samples incubated in BHI pH 3.4 and 4.2 showed a lag phase with a similar duration
(approximately 10 hours), significantly longer than pH 4.6 and 5.0 (Fig. 2). The
maximum cell concentration was also lower at
Figure 2. Growth curves of determined at different time points upon exposure (red), pH 4.6 (violet) and pH 5was grown in BHI pH 7 (black).
B. cereus vegetative cells exposed to pH 3.4 were not able to grow after 25 hours
of incubation (Figure 3). Similar to
pH values of 3.8 and 4.2 showed approximately a two
compared to samples incubated at pHs 4.6 and 5.0 (Figure 3). Under pH 5.0 and 4.6,
cereus cells showed a multiphase behavior conformed of an incre
a short steady or decreasing phase and, subsequently, another growth phase, with a
higher slope than the first one.
134
minutes during 25 hours at 30ºC. Both strains were grown in BHI fitted to pH 7 as
B. weihenstephanensis vegetative cells were able to grow in BHI adjusted to pH
from 5.0 to 3.4 during an incubation period of 25 hours (Figure 2). No growth was
observed at pH 3.0 whilst growth was slow at pH 3.4. The maximum growth rate was
significantly higher for cultures grown at pH 5, especially compared to lower pHs.
Samples incubated in BHI pH 3.4 and 4.2 showed a lag phase with a similar duration
(approximately 10 hours), significantly longer than pH 4.6 and 5.0 (Fig. 2). The
maximum cell concentration was also lower at low pHs.
Growth curves of B. weihenstephanensis in acidified BHI. The optical density determined at different time points upon exposure to pH 3.0 (yellow), pH 3.4
pH 5 (grey) are depicted. As positive control B. weihenstephanensis (black).
vegetative cells exposed to pH 3.4 were not able to grow after 25 hours
of incubation (Figure 3). Similar to B. weihenstephanensis experiments, samples with
pH values of 3.8 and 4.2 showed approximately a two-fold extension of lag phase
compared to samples incubated at pHs 4.6 and 5.0 (Figure 3). Under pH 5.0 and 4.6,
cells showed a multiphase behavior conformed of an increase phase followed by
a short steady or decreasing phase and, subsequently, another growth phase, with a
higher slope than the first one.
minutes during 25 hours at 30ºC. Both strains were grown in BHI fitted to pH 7 as
vegetative cells were able to grow in BHI adjusted to pH
from 5.0 to 3.4 during an incubation period of 25 hours (Figure 2). No growth was
observed at pH 3.0 whilst growth was slow at pH 3.4. The maximum growth rate was
rown at pH 5, especially compared to lower pHs.
Samples incubated in BHI pH 3.4 and 4.2 showed a lag phase with a similar duration
(approximately 10 hours), significantly longer than pH 4.6 and 5.0 (Fig. 2). The
in acidified BHI. The optical density pH 3.4 (green), pH 4.2 B. weihenstephanensis
vegetative cells exposed to pH 3.4 were not able to grow after 25 hours
experiments, samples with
fold extension of lag phase
compared to samples incubated at pHs 4.6 and 5.0 (Figure 3). Under pH 5.0 and 4.6, B.
ase phase followed by
a short steady or decreasing phase and, subsequently, another growth phase, with a

Figure 3. Growth curves of different time points upon exposure to (violet) and pH 5.0 (grey) are depicted.
Results revealed that upon acid stress
weihenstephanensis KBAB4 growth was readily affected as it has been reported
previously (Biesta-Peters et al., 2010; Mols et al., 2010a,b),
lower pHs. Specifically, in response to acid environment
population appeared to be more resistant to low pH than
fact, B. weihenstephanensis
significantly higher growth at all pH values tested in comparison with
microorganisms (Figures 2 and 3).
Furthermore, for both strains growth rate decreased and lag phase increased
when the pH was reduced
(2010). To what extent these growth parameters are affected depends on initial growth
rate, strain and acidulant used (Mols and Abee, 2011). It has been reported that
cereus lag phase increases upon acid exposure because cells are repairi
buffering internal pH and increasing ATP concentration (Mols and Abee, 2011).
Notably, pH 4.6 is normally assumed as a lethal pH value for
However, late stationary cells of strains tested in these experiments were able to grow at
pH 4.2 and 3.8. B. weihenstephanensis
et al. reported that acid tolerance response (ATR) in
135
Growth curves of B. cereus in acidified BHI. The optical density determined at different time points upon exposure to pH 3.4 (green), pH 3.8 (blue), pH 4.2
(grey) are depicted.
Results revealed that upon acid stress B. cereus CECT 148 and
KBAB4 growth was readily affected as it has been reported
Peters et al., 2010; Mols et al., 2010a,b), showing greater effect at
. Specifically, in response to acid environment B. weihenstephanensis
appeared to be more resistant to low pH than B. cereus CECT 148 strain. In
B. weihenstephanensis was able to grow at lower pH (pH 3.4) and showed a
significantly higher growth at all pH values tested in comparison with
2 and 3).
Furthermore, for both strains growth rate decreased and lag phase increased
when the pH was reduced (Figures 2 and 3) in agreement with Biesta
(2010). To what extent these growth parameters are affected depends on initial growth
rate, strain and acidulant used (Mols and Abee, 2011). It has been reported that
lag phase increases upon acid exposure because cells are repairi
buffering internal pH and increasing ATP concentration (Mols and Abee, 2011).
Notably, pH 4.6 is normally assumed as a lethal pH value for
However, late stationary cells of strains tested in these experiments were able to grow at
B. weihenstephanensis was also able to grow at pH 3.4. In 2002, Jobin
et al. reported that acid tolerance response (ATR) in B. cereus was clearly i
Chapter 6
in acidified BHI. The optical density determined at pH 4.2 (red), pH 4.6
CECT 148 and B.
KBAB4 growth was readily affected as it has been reported
showing greater effect at
B. weihenstephanensis
CECT 148 strain. In
was able to grow at lower pH (pH 3.4) and showed a
significantly higher growth at all pH values tested in comparison with B. cereus
Furthermore, for both strains growth rate decreased and lag phase increased
2 and 3) in agreement with Biesta-Peters et al.
(2010). To what extent these growth parameters are affected depends on initial growth
rate, strain and acidulant used (Mols and Abee, 2011). It has been reported that B.
lag phase increases upon acid exposure because cells are repairing damage,
buffering internal pH and increasing ATP concentration (Mols and Abee, 2011).
Notably, pH 4.6 is normally assumed as a lethal pH value for B. cereus.
However, late stationary cells of strains tested in these experiments were able to grow at
was also able to grow at pH 3.4. In 2002, Jobin
learly induced at

Chapter 6
136
late stationary growth phase possibly due to the exponential phase metabolism which
results in medium acidification, oxygen depletion and energy starvation. Thus, “B.
cereus ATR appears to be a complex system involving both pH-dependent, and/or
growth-phase-dependent mechanisms” (Jobin et al., 2002).
6.3.2. Effect of acid environment on B. cereus and B. weihenstephanensis
viability
Flow cytometry analysis based on SSC, FSC and fluorescence detection was
used to estimate the impact of acid stress on B. weihenstephanensis and B.cereus
viability. For this purpose vegetative cells were stained with two fluorescent dyes, PI
and, cFDA. Green fluorescent emission by cells stained with cFDA was detected by
receptor FL1 (530nm ± 15 nm), and red fluoresce emitted by cells stained with PI by the
receptor FL3 (650 nm). Data obtained were used to get scatter graphics by plotting red
or green fluorescent signals vs. SSC (Figures 4 to 9).
In order to test PI as B. cereus and B. weihenstephanensis dye of damaged cells,
controls were performed as described in the materials and methods section. To test PI
positive control, cells were subjected to heat treatments for 10 min at 80ºC. To confirm
cell damage samples were plated onto BHIA. Counts revealed a decrease of bacterial
population of several log cycles for both B. cereus strain and B. weihenstephanensis
isolate. Comparison of heat treated cells with those untreated showed red fluorescence
in treated cells indicating that inactivation of bacterial cells by heat treatment was
coincident with physical compromise of the plasmatic membrane and consequently with
electron transfer chain activity. For its part, cFDA positive control (non-treated cells)
showed green fluorescence, indicating the maintenance of esterase activity and intact
cytoplasmic membranes. There is a dependency between pH and cF signal since this
compound shows high fluorescence at intracellular pH values of 7 and up (Biesta-Peters
et al., 2011). It is noteworthy that induced acid stress response may result in increase of
cytosolic pH through activation of pH homeostasis mechanisms (Foster, 1995). In
addition, it should be taken into account that a fluorescence decrease at later phases of
growth may be due to the active transport of cF out of the cells (Breeuwer et al., 1996).

Chapter 6
137
Based on previous studies (epigraph 3.1), three pH values were selected for B.
weihenstephanensis viability experiments. Thus, pH 3.4 and 4.2 were selected because
both caused lag phases of similar duration meanwhile exponential growth rates were
different. To test an intermediate condition pH 3.8 was selected. To perform a
comparative study of B. weihenstephanensis and B. cereus acid resistance, the same pH
values were used for both of them. In addition, these pH values are closer to those
present in stomach allowing us to evaluate the pathogenic potential of these
microorganisms. Effects of acid media were tested at 30 minutes, 2 and 24 hours of
exposure.
Samples incubated in BHI acidified to pH 3.4 showed a sharp effect on B. cereus
and B. weihenstephanensis populations (Figures 4 and 7). The percentage of viable cell
as measured by cFDA staining after 30 minutes was 1.36% for B. cereus (Table 3) and
1.38% for B. weihenstephanensis (Table 1), indicating that most of the cells did have
damaged membranes and therefore electron transport was suspended (Tables 2 and 4).
After 24 hours, results were very similar to those obtained at time 30 minutes, however,
at time 2 hours viable cells percentage slightly increased compared with results obtained
after (Tables 1 and 3).
At time 30 minutes samples exposed to pH 3.8 showed a decrease of green
fluorescence of 30% approximately both for B. weihenestephanesis and B. cereus
populations (Tables 1 and 3). However, the major effect was observed at time 2 hours
(Figure 5 and 8). Percentage of damaged cells increased approximately 96% for B.
weihenestephanesis population and 86% for B. cereus (Tables 2 and 4). From 2 to 24
hours of incubation just a slight decrease of viable cells percentage was observed for
both species (Tables 1 and 3).
The effect of pH 4.2 showed the lowest overall activity against B.
weihenstephanesis and B. cereus during the first two hours of exposure to acid stress
(Tables 1 to 4). At time 2 hours only a slight decrease on viable cell percentage was
observed, however after 24 hours most of the population showed damaged membranes
(Figures 6 and 9). In fact, after one day of incubation at pH 4.2 damaged cell percentage
increased approximately 95% for B weihenestephanesis vegetative cells and 82% for B.
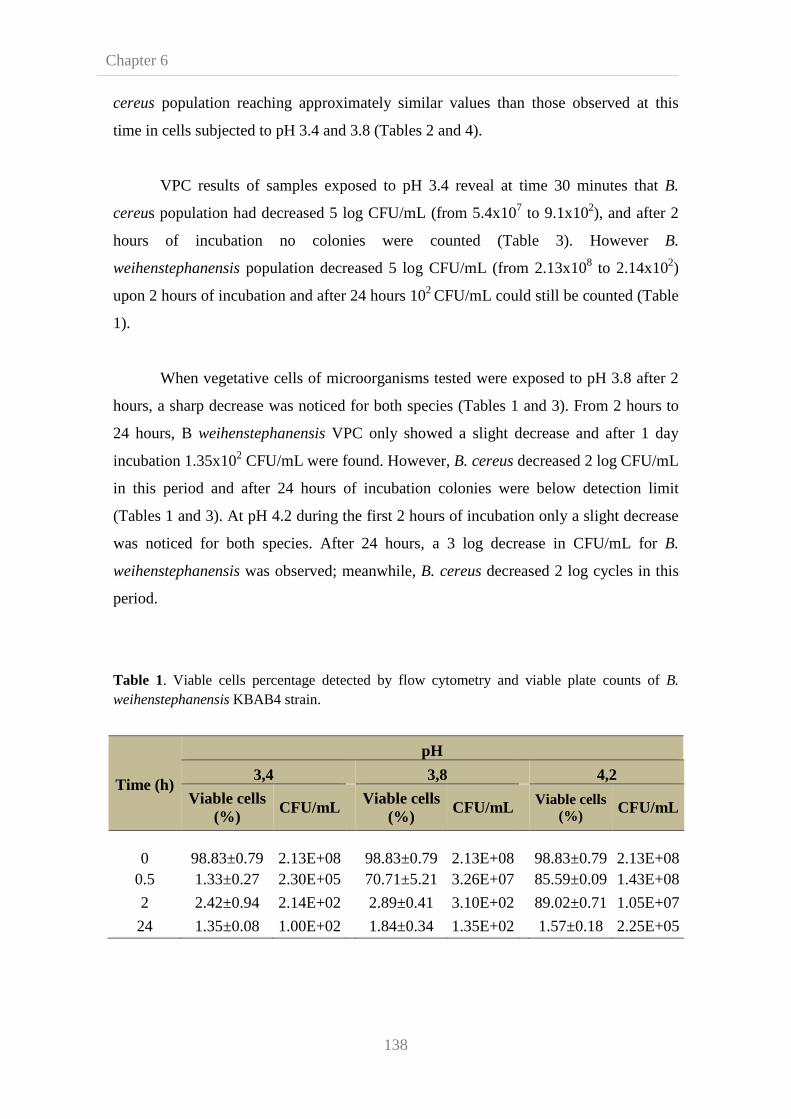
Chapter 6
138
cereus population reaching approximately similar values than those observed at this
time in cells subjected to pH 3.4 and 3.8 (Tables 2 and 4).
VPC results of samples exposed to pH 3.4 reveal at time 30 minutes that B.
cereus population had decreased 5 log CFU/mL (from 5.4x10⁷ to 9.1x10²), and after 2
hours of incubation no colonies were counted (Table 3). However B.
weihenstephanensis population decreased 5 log CFU/mL (from 2.13x10⁸ to 2.14x10²)
upon 2 hours of incubation and after 24 hours 102 CFU/mL could still be counted (Table
1).
When vegetative cells of microorganisms tested were exposed to pH 3.8 after 2
hours, a sharp decrease was noticed for both species (Tables 1 and 3). From 2 hours to
24 hours, B weihenstephanensis VPC only showed a slight decrease and after 1 day
incubation 1.35x10² CFU/mL were found. However, B. cereus decreased 2 log CFU/mL
in this period and after 24 hours of incubation colonies were below detection limit
(Tables 1 and 3). At pH 4.2 during the first 2 hours of incubation only a slight decrease
was noticed for both species. After 24 hours, a 3 log decrease in CFU/mL for B.
weihenstephanensis was observed; meanwhile, B. cereus decreased 2 log cycles in this
period.
Table 1. Viable cells percentage detected by flow cytometry and viable plate counts of B. weihenstephanensis KBAB4 strain.
Time (h)
pH
3,4 3,8 4,2
Viable cells (%)
CFU/mL Viable cells (%)
CFU/mL Viable cells (%) CFU/mL
0
98.83±0.79
2.13E+08
98.83±0.79
2.13E+08
98.83±0.79
2.13E+08
0.5 1.33±0.27 2.30E+05 70.71±5.21 3.26E+07 85.59±0.09 1.43E+08
2 2.42±0.94 2.14E+02 2.89±0.41 3.10E+02 89.02±0.71 1.05E+07
24 1.35±0.08 1.00E+02 1.84±0.34 1.35E+02 1.57±0.18 2.25E+05
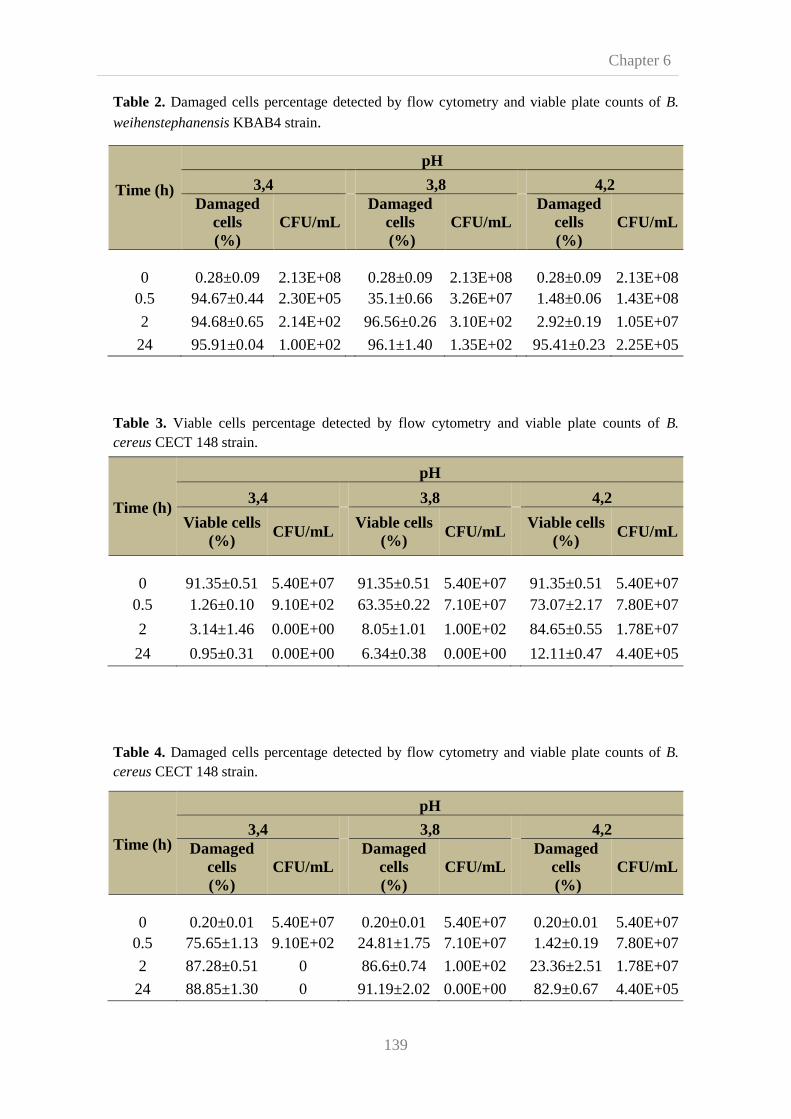
Chapter 6
139
Table 2. Damaged cells percentage detected by flow cytometry and viable plate counts of B.
weihenstephanensis KBAB4 strain.
Table 3. Viable cells percentage detected by flow cytometry and viable plate counts of B. cereus CECT 148 strain.
Table 4. Damaged cells percentage detected by flow cytometry and viable plate counts of B. cereus CECT 148 strain.
Time (h)
pH
3,4 3,8 4,2 Damaged
cells (%)
CFU/mL Damaged
cells (%)
CFU/mL Damaged
cells (%)
CFU/mL
0
0.28±0.09
2.13E+08
0.28±0.09
2.13E+08
0.28±0.09
2.13E+08
0.5 94.67±0.44 2.30E+05 35.1±0.66 3.26E+07 1.48±0.06 1.43E+08
2 94.68±0.65 2.14E+02 96.56±0.26 3.10E+02 2.92±0.19 1.05E+07
24 95.91±0.04 1.00E+02 96.1±1.40 1.35E+02 95.41±0.23 2.25E+05
Time (h)
pH
3,4 3,8 4,2
Viable cells (%)
CFU/mL Viable cells (%)
CFU/mL Viable cells (%)
CFU/mL
0
91.35±0.51
5.40E+07
91.35±0.51
5.40E+07
91.35±0.51
5.40E+07
0.5 1.26±0.10 9.10E+02 63.35±0.22 7.10E+07 73.07±2.17 7.80E+07
2 3.14±1.46 0.00E+00 8.05±1.01 1.00E+02 84.65±0.55 1.78E+07
24 0.95±0.31 0.00E+00 6.34±0.38 0.00E+00 12.11±0.47 4.40E+05
Time (h)
pH
3,4 3,8 4,2 Damaged
cells (%)
CFU/mL Damaged
cells (%)
CFU/mL Damaged
cells (%)
CFU/mL
0
0.20±0.01
5.40E+07
0.20±0.01
5.40E+07
0.20±0.01
5.40E+07
0.5 75.65±1.13 9.10E+02 24.81±1.75 7.10E+07 1.42±0.19 7.80E+07
2 87.28±0.51 0 86.6±0.74 1.00E+02 23.36±2.51 1.78E+07
24 88.85±1.30 0 91.19±2.02 0.00E+00 82.9±0.67 4.40E+05

Chapter 6
Figure 4. Flow cytometry dot plots of FL1 (green fluorescent) vs. SSC and FL3 (Red fluorescence) vs. SSC of B. cereus(A) at time 0 (B) after 30 minutes of exposition to acid medium (C) after 2 hours of exposition to acid medium (D) after 24 hours of exposition to acid medium.
140
Flow cytometry dot plots of FL1 (green fluorescent) vs. SSC and FL3 (Red B. cereus CECT 148 vegetative cells grown in BHI fitted to
(A) at time 0 (B) after 30 minutes of exposition to acid medium (C) after 2 hours of exposition to acid medium (D) after 24 hours of exposition to acid medium.
Flow cytometry dot plots of FL1 (green fluorescent) vs. SSC and FL3 (Red vegetative cells grown in BHI fitted to pH 3.4
(A) at time 0 (B) after 30 minutes of exposition to acid medium (C) after 2 hours of exposition
Figure 5. Flow cytometry dot plots of FL1 (green fluorescent) vs. SSC and FL3 (Red fluorescence) vs. SSC of B. cereus(A) at time 0 (B) after 30 minutes of exposition to acid medium (C) after 2 hours of exposition to acid medium (D) after 24 hours of exposition to acid medium.
141
Flow cytometry dot plots of FL1 (green fluorescent) vs. SSC and FL3 (Red B. cereus CECT 148 vegetative cells grown in BHI fitted to
(A) at time 0 (B) after 30 minutes of exposition to acid medium (C) after 2 hours of exposition to acid medium (D) after 24 hours of exposition to acid medium.
Chapter 6
Flow cytometry dot plots of FL1 (green fluorescent) vs. SSC and FL3 (Red vegetative cells grown in BHI fitted to pH 3.8
(A) at time 0 (B) after 30 minutes of exposition to acid medium (C) after 2 hours of exposition

Chapter 6
Figure 6. Flow cytometry dot plots of FL1 (green fluorescent) vs. SSC and FL3 (Red fluorescence) vs. SSC of B. cereus(A) at time 0 (B) after 30 minutes of exposition to acid medium (C) after 2 hours of expositto acid medium (D) after 24 hours of exposition to acid medium.
142
Flow cytometry dot plots of FL1 (green fluorescent) vs. SSC and FL3 (Red B. cereus CECT 148 vegetative cells grown in BHI fitted to
(A) at time 0 (B) after 30 minutes of exposition to acid medium (C) after 2 hours of expositto acid medium (D) after 24 hours of exposition to acid medium.
Flow cytometry dot plots of FL1 (green fluorescent) vs. SSC and FL3 (Red in BHI fitted to pH 4.2
(A) at time 0 (B) after 30 minutes of exposition to acid medium (C) after 2 hours of exposition
Figure 7. Flow cytometry dot plots of FL1 (green fluorescent) vs. SSC and FL3 (Red fluorescence) vs. SSC of B. weihenstephanensis to pH 3.4 (A) at time 0 (B) after 30 minutes of exposition to acid medium (C) after 2 hours of exposition to acid medium (D) after 24 hours of exposition to acid medium.
143
Flow cytometry dot plots of FL1 (green fluorescent) vs. SSC and FL3 (Red B. weihenstephanensis KBAB4 vegetative cells grown
(A) at time 0 (B) after 30 minutes of exposition to acid medium (C) after 2 hours of exposition to acid medium (D) after 24 hours of exposition to acid medium.
Chapter 6
Flow cytometry dot plots of FL1 (green fluorescent) vs. SSC and FL3 (Red grown in BHI fitted
(A) at time 0 (B) after 30 minutes of exposition to acid medium (C) after 2 hours of

Chapter 6
Figure 8. Flow cytometry fluorescence) vs. SSC of B. weihenstephanensis to pH 3.8 (A) at time 0 (B) after 30 minutes of exposition to acid medium (C) after 2 hours of exposition to acid medium (D) after 24 hours of exposition to acid medium.
144
dot plots of FL1 (green fluorescent) vs. SSC and FL3 (Red B. weihenstephanensis KBAB4 vegetative cells grown in BHI fitted
(A) at time 0 (B) after 30 minutes of exposition to acid medium (C) after 2 hours of o acid medium (D) after 24 hours of exposition to acid medium.
dot plots of FL1 (green fluorescent) vs. SSC and FL3 (Red grown in BHI fitted
(A) at time 0 (B) after 30 minutes of exposition to acid medium (C) after 2 hours of

Figure 9. Flow cytometry dot plots of FL1 (green fluorescent) vs. SSC and FL3 (Red fluorescence) vs. SSC of B. weihenstephanensis to pH 4.2 (A) at time 0 (B) after 30 minutes of exposition to acid medium (C) after 2 hours of exposition to acid medium (D) after 24 hours of exposition to acid medium.
145
Flow cytometry dot plots of FL1 (green fluorescent) vs. SSC and FL3 (Red B. weihenstephanensis KBAB4 vegetative cells grown in BHI fitted
time 0 (B) after 30 minutes of exposition to acid medium (C) after 2 hours of exposition to acid medium (D) after 24 hours of exposition to acid medium.
Chapter 6
Flow cytometry dot plots of FL1 (green fluorescent) vs. SSC and FL3 (Red grown in BHI fitted
time 0 (B) after 30 minutes of exposition to acid medium (C) after 2 hours of
Chapter 6
146
As results showed, significant differences were observed in cell responses to the
different pH values studied. We showed that cellular viability decreases at lower pH
values. As we expected, the effect of pH 3.4 was the most effective one against these
microorganisms and pH 4.2 had the lowest overall activity. In any case, at all the pH
values tested, B. cereus and B. weihenstephanensis viable cell percentage decreased
when exposure time increases indicating the absence of growth. Both species showed
the strongest effect on cell viability at pH 4.2 between 2 and 24 hours, at pH 3.8 in the
period between 30 minutes and 2 hours, and at pH 3.4 in the first 30 minutes for B.
cereus and in the first 2 hours for B. weihenstephanesis.
On the other hand, 102 log CFU/mL of B. weihenstephanensis were counted
after 24 hours of incubation at pH 3.8 and 3.4. Likewise, both microorganisms were
rather resistant to pH 4.2 and upon 24 hours of exposure to this acid environment VPC
showed that 5 log CFU/mL of vegetative cells had survived. A stomach pH higher than
4.5 is frequent in aged people, in patients with achlorhydria or even at the end of a
copious meal (Dressman et al., 1990; Russell et al., 1993; Clavel et al., 2004). Besides,
infective doses as low as 10-2-10-3 B. cereus CFU/g have been found in foods causing
disease, even lower numbers of spores compared with vegetative cells can probably
cause diarrheal syndrome due to their higher resistance to gastric acids (Gilbert and
Kramer, 1986; Granum, 1994; Clavel et al., 2004).
Microorganisms exposed to acid stress develop an ATR able to protect them
towards a subsequent exposure to a lethal pH. These mechanisms have been largely
reported in various bacteria such as Salmonella typhimurium, Lactococcus lactis and
Listeria monocytogenes (Jobin et al., 2002). As we described above, ATR was induced
in B. cereus cells at late stationary phase under low pH (Jobin et al., 2002). In this work,
at every pH tested, acid stress effects on late stationary phase cells were higher at longer
exposition periods (Tables 1 to 4). According to plate counts, pH 3.4 and 3.8 had
approximately the same effect on B. weihenstephanesis populations after 2 and 24 hours
of incubation. On the other hand, VPC of B. cereus populations incubated at pH 3.4 and
3.8 did not show VPC after a long incubation period (24 h). In this regard, ATR effect
on acid resistance of B. cereus did not seem to be observed at pH 3.4 and 3.8,
meanwhile it may protect B. weihenstephanensis cells at similar pHs.

Chapter 6
147
At all pH tested FCM data did not show significant differences between B.
cereus and B. weihenstephanensis vegetative cells acid resistance. However, on the
basis of VPC results, it appeared that B. weihenstephanesis is more resistant to acid
stress or able to recover faster, after 24 hours of exposition at lower pHs (pH 3.4 and pH
3.8) and less than B. cereus at pH 4.2. It is important to note that at present, the number
of VPC and the percentages of viable and damaged cells presented by the FCM, cannot
be related. Mathys et al. (2007) reported that “the comparison of different methods
within a 1 log10 (90%) detection range with the highly concentrated cell suspensions
will be subjected to sources of error making quantitative comparison of the FCM data
and VPC data more difficult”. Furthermore, cells stained with fluorescent dyes could
exist in a number of different functional states. Thus, viable cells are those which have
intact their metabolic activity and membrane integrity and in consequence are able to
divide (Nebe-von-Caron et al., 2000) and to grow on specific routine bacteriological
media and develop into colonies. Under exposition to detrimental nutrition conditions,
toxic chemicals and sub-optimal physical conditions we can differentiate “sublethally
stressed cells” (Neidhardt and VanBogelen, 2000) that present impaired growth due to
cellular damage without affecting their survival and “injured cells” which may recover
or dye (Yousef and Courtney, 2003). Biesta-Peters et al. (2011) reported that
compromised membranes after acid stress decrease during lag phase because cells are
able to repair membrane damage at pH 7, 5.3 and 4.9. In addition, some authors (Kell et
al., 1998) have reported the existence of physiological states of non-growing
microorganisms among which are “active but non culturable cells” (ABNC) and “viable
but non culturable cells” (VBNC) (Roszak et al., 1984; Kell et al., 1998). Both of them
are cells that do not form colonies on non-selective growth media and can remain in this
state for long periods. However, definition of these states is still controversial. On the
other hand, we can find dead or inactivated cells which are not able to growth when are
inoculated in growth medium. Therefore, in response to stress conditions different states
of vegetative cells occur. Thus, “sublethally injured cells” can be stained either with PI
or with cFDA depending on plasmatic membrane integrity. After, they can grow on
plate or die, which makes VPC and FCM data comparison inaccurate as they are
providing close, but different information. Additional factors explaining these
differences would help to understand microbial recovery mechanisms (or the interface
growth/no growth).
Chapter 6
148
On the basis of our results we can assert that fluorescent labeling by using PI and
cFDA in combination with FCM techniques can be used to successfully study
physiological response of B. weihenstephanensis vegetative cells to acid stress as
previously reported for B. cereus strains (Biesta-Peters et al., 2011). In addition, FCM
analysis was unable to reliably discriminate when population of vegetative cells stained
both PI and cFDA were lower than 105 CFU/mL as for example it has been shown by B.
weihenstephanensis vegetative cells exposed to pH 3.4 (Tables 1 and 2). This result is
not unexpected since the detection threshold of this technique is fixed in 105 CFU/mL.
However, although FCM and VPC results were not comparable and classical analytical
method shows higher reliability, it is important to note that FCM analysis provides
information at real time of damage at single cell level, whereas VPC only gives an
indication of cells able to grow at that time. In this context, FCM can respond to the
need of development of valid methods that allow the integration of the physiological
and molecular data at the single-cell level to predict, with the necessary confidence, the
behavior of microorganisms thus greatly improving efficiency of defining key
experimental conditions to be tested in food stability validation experiments (Hornstra
et al., 2009).

Chapter 7
149
CHAPTER 7
Development of a high resolution melting-based approach for
efficient differentiation among Bacillus cereus group isolates
Abstract
Strains belonging to Bacillus cereus group include six different species among which
are Bacillus thuringiensis, Bacillus weihenstephanensis and Bacillus cereus sensu
stricto, a causative agent of food poisoning. Sequence of panC-housekeeping gene is
used for B. cereus group affiliation to seven major phylogenetic groups (I-VII) with
different ecological niches. Thermal growth range and spore heat resistance of B. cereus
group microorganisms varies among phylogenetic groups. We assigned a selection of B.
cereus sensu stricto strains related to food poisoning from the Spanish cultivar
Collection (Valencia) to group IV strains based on panC gene sequence. To assess the
ability of this classification as a valuable tool to manage B. cereus group isolates in food
industry heat resistance experiments were performed. Thermal inactivation assays
revealed variability of spore heat resistance within these group IV strains. Adequate
food sanitizing treatments therefore require fast and reliable identification of particular
strains. In the present study, feasibility of genotyping by single nucleotide
polymorphisms (SNPs) detection via high resolution melting (HRM) analysis was
examined. HRM analysis of amplified polymorphic 16S-23 ISR region proved to be
discriminatory for B. cereus sensu stricto strain typing while two other polymorphic
regions within the bacterial rRNA operon allowed differentiation between Bacillus
species, demonstrating its applicability for discrimination on the species and strain level
within B. cereus group.
149
1098765432

Chapter 7
150
10 9 8
6 5 4 3 2

Chapter 7
151
7.1. Introduction The classification of B. cereus group microorganisms into seven major
phylogenetic groups (I to VII) (Guinebretière et al., 2008), which show specific
“thermotypes” and different virulence potentials, means a direct practical application for
the food industry since it allows manufacturers to establish appropriate environmental
conditions for processing, storage and distribution of food products depending on the
risk level associated to contamination with specific strains of this taxonomic cluster.
In this regard, this classification may lead on the one hand to improve shelf-life
and microbiological quality of refrigerated products by detecting psychrotrophic
microorganisms belonging to group II and VI, and on the other, to prevent health
hazards through discrimination among strains of different phylogenetic clusters,
especially for those belonging to group VII, III and IV which may present highest
pathogenic potential (Guinebretière et al., 2008).
For successful affiliation to phylogenetic groups (I to VII) a fast and effective
homology study of the pantoate-β-alanine ligase gene (panC) sequence has been
proposed (Candelon et al., 2004; Guinebretière et al., 2008). It offers a reliable
alternative to solve practical problems at industrial scale derived from the lack of typing
techniques able to discriminate between B. cereus group species and strains, and to
avoid the use of expensive and time-consuming classical microbiological and
biochemical probes used for bacterial identification.
In the present work, a preliminary study was carried out to characterize the
practical application in heat processing of major phylogenetic groups. For this purpose
we selected five B. cereus sensu stricto strains of diverse isolation origin and
virulence/enterotoxin genotype belonging to the Spanish Type Culture Collection
(CECT). Origins encompass animals, soil and unspecific contaminations. They were
classified by Martínez-Blanch et al. (2011) into three groups based on different
toxigenic profiles including a broad range of virulence factors involved in diarrheal
syndrome: CytK, Hbl, Nhe, PC-PCL, Clo, SMase, and EntFM. These strains are able to
colonize food products at any step during the processing chain from “farm to table”,
making thermal niche affiliation a necessity in order to minimize pathogen attack,
Chapter 7
152
improve food processing and thereby ensure consumers health. Accordingly, we
performed strain assignation to ecotype niches based on partial panC gene sequencing.
All strains included in this study belonged to group IV. Characterization of cardinal
parameters is a main concern to gain a profound understanding of the relationship
between physiology of B. cereus group strains and their phylogenetic affiliation. Our
microbiological analysis focused on spore heat resistance, thus establishing references
for food processing and B. cereus risk assessment. Results show that spore heat
resistance of B. cereus group IV isolates varies among the strains tested.
This variability shown by strains belonging to the same phylogenetic cluster is
not unexpected since “the high polyphyletic character of B. cereus sensu stricto and B.
thuringiensis will result in highly different characters for strains inside each species”
(Guinebretière et al., 2008). Considering these differences, and attending to the need of
an appropriate technique valid for B. cereus group strain and species typing, different
16S-23S rRNA intergenic spacer region PCR-based methods (ISR-PCR) were evaluated
in the present study.
All members of the B. cereus group show a very high similarity level (from 99.5
to 100%) of the 16S and 23S rRNA genes sequences (Daffonchio et al., 1998).
However, the intergenic spacer region (ISR) situated between 16S–23S rRNA genes are
the most variable regions of the ribosomal operon due to nucleotide substitutions,
insertions, deletions and presence of tRNA genes (Cherif et al., 2003). It has been
proposed that ISR sequences vary extensively more than conserved ribosomal genes
because they are under minimal selective pressure (Barry et al., 1991), leading to
species-specific or even strain-specific sequences useful for strain genotyping.
Ribosomal operons are present in multiple copies within prokaryote genomes
and most species of the B. cereus group posses 13 rRNA operons meanwhile
psychrotolerant strains usually contain 14 operons (Candelon et al., 2004).
Nevertheless, the number of operon copies is not a tool for phylogenetic studies among
B. cereus group due to existing exceptions. Studies on B. cereus ATCC 14579 strain
and Bacillus anthracis show that these operons can be divided into two different classes
based on polymorphisms present downstream of the 23S rRNA gene (Read et al., 2003;
Candelon et al., 2004).

Chapter 7
153
Until now, ISR characterization has allowed to discriminate species within the
Bacillus genus and B. cereus group, while differentiation of closely related species and
strains of the B. cereus group remains a challenge which could be addressed using high
resolution separation techniques.
In contrast to conventional DNA melting analysis, HRM is a sensitive analysis
method based on highly controlled temperature transitions and DNA binding dyes with
improved saturation properties, able to detect single base sequence variations, which
generate a melting behavior characteristic of a particular DNA sample. Furthermore, it
does not require laborious and time-consuming gel electrophoresis as in case of strain
discrimination based on RAPDs. HRM has been reported to obtain successful results in
specific species identification of clinically relevant bacterial species and in medical
diagnosis applications (Odell et al., 2005; Cheng et al., 2006; Montgomery et al., 2007;
Van Ert et al., 2007; Erali et al., 2008; Yang et al., 2009; Tuohy et al., 2010; Temesvári
et al., 2011). Besides, this technology has been used to genotype different Pseudomonas
aeruginosa strains isolated during an outbreak linked to mineral water bottles in a
neonatal intensive care unit (Naze et al., 2010).
HRM analysis begins when polymerase chain reaction (PCR) products,
previously stained with specific intercalating fluorescence dyes, are subjected to a
thermally-induced DNA dissociation. Under controlled temperature increase, DNA
samples are characterized as fluorescence decreases when DNA intercalating dye is
released from double-stranded DNA (dsDNA) consequence of its dissociation (melting)
into single strands. HRM fluorescent dyes have low toxicity in an amplification reaction
and can therefore be used at higher concentrations for greater saturation of the dsDNA
sample. “Greater dye saturation means measured fluorescent signals have higher
fidelity, apparently because there is less dynamic dye redistribution to non-denatured
regions of the nucleic strand during melting and because dyes do not favor higher
melting temperature products” (Wittwer et al., 2003). At a characteristic temperature,
melting temperature (Tm), fluorescence rapidly drops reflecting dsDNA dissociation. It
has been shown that, Tm it is characteristic for each dsDNA and depends on its GC
content and length and sequence (Reed et al., 2007). However, Tm reflects only one
point of the melting curve and more information is obtained from the complete curve.
Chapter 7
154
Indeed, it has been reported that the shape of the curve contains valuable information
for genotyping (Reed et al., 2007).
A rapid and cost efficient discrimination at the strain level is an important tool,
also valuable for discrimination on the species level. One of the most common types of
genetic variation are single nucleotide polymorphisms (SNP). SNPs occur in a given
region of the genome, such as 16S-23S ISR, when there is a single base substitution of
one nucleotide (A, T, C, or G) with another. This DNA sequences variants can be
efficiently used for genotyping through HRM analysis (White and Potts, 2006). We
therefore investigated the feasibility of HRM analysis for SNP genotyping of B. cereus,
B. weihenstephanensis and B. thuringiensis strains amplifying a 16S-23S ISR region as
well as two other polymorphic areas within rRNA gene operon.
Our study is a multivariable approach that combines strains and species
identification with phylogenetic affiliation of isolates and characterization of their spore
heat resistance.
7.2. Materials and methods
7.2.1. Bacterial strains and growth conditions B. cereus sensu stricto strains used in this study were selected from the Spanish
Type Culture Collection (CECT, Valencia, Spain). B. weihenstephanensis (KBAB4)
and B. thuringiensis (Bt407) strains were kindly provided by the National Institute of
Agronomy Research (INRA, Avignon, France). All the strains used in this study are
listed in Table 1.
Strains were grown on nutrient broth (Scharlau Microbiology, Barcelona, Spain)
at 30°C or 37°C for 18 hours and stored in growth liquid medium containing 20% (v/v)
glycerol at -80°C. For DNA extraction the cultures were grown overnight in Brain Heart
Infusion broth (BHI; Scharlau, Barcelona, Spain) at 30°C for 18 hours with agitation at
200 rpm. Strains were sporulated in Fortified Nutrient Agar at 30ºC (Mazas et al., 1995)
and stored at -20°C until use. To ensure that vegetative cells grown from spores would
have the same physiological state, spores were heated at 80°C for 10 minutes
(Fernández et al., 2001).
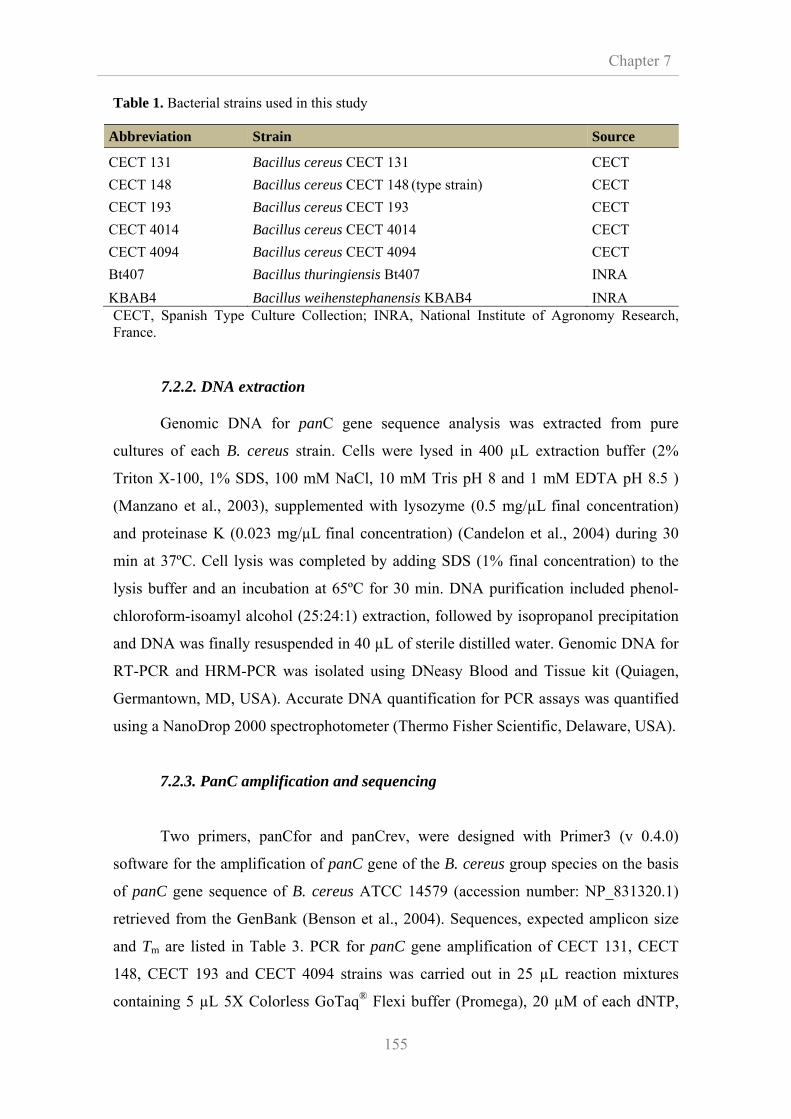
Chapter 7
155
Table 1. Bacterial strains used in this study
Abbreviation Strain Source CECT 131 Bacillus cereus CECT 131 CECT CECT 148 Bacillus cereus CECT 148 (type strain) CECT CECT 193 Bacillus cereus CECT 193 CECT CECT 4014 Bacillus cereus CECT 4014 CECT CECT 4094 Bacillus cereus CECT 4094 CECT Bt407 Bacillus thuringiensis Bt407 INRA KBAB4 Bacillus weihenstephanensis KBAB4 INRA CECT, Spanish Type Culture Collection; INRA, National Institute of Agronomy Research, France.
7.2.2. DNA extraction Genomic DNA for panC gene sequence analysis was extracted from pure
cultures of each B. cereus strain. Cells were lysed in 400 µL extraction buffer (2%
Triton X-100, 1% SDS, 100 mM NaCl, 10 mM Tris pH 8 and 1 mM EDTA pH 8.5 )
(Manzano et al., 2003), supplemented with lysozyme (0.5 mg/µL final concentration)
and proteinase K (0.023 mg/µL final concentration) (Candelon et al., 2004) during 30
min at 37ºC. Cell lysis was completed by adding SDS (1% final concentration) to the
lysis buffer and an incubation at 65ºC for 30 min. DNA purification included phenol-
chloroform-isoamyl alcohol (25:24:1) extraction, followed by isopropanol precipitation
and DNA was finally resuspended in 40 µL of sterile distilled water. Genomic DNA for
RT-PCR and HRM-PCR was isolated using DNeasy Blood and Tissue kit (Quiagen,
Germantown, MD, USA). Accurate DNA quantification for PCR assays was quantified
using a NanoDrop 2000 spectrophotometer (Thermo Fisher Scientific, Delaware, USA).
7.2.3. PanC amplification and sequencing
Two primers, panCfor and panCrev, were designed with Primer3 (v 0.4.0)
software for the amplification of panC gene of the B. cereus group species on the basis
of panC gene sequence of B. cereus ATCC 14579 (accession number: NP_831320.1)
retrieved from the GenBank (Benson et al., 2004). Sequences, expected amplicon size
and Tm are listed in Table 3. PCR for panC gene amplification of CECT 131, CECT
148, CECT 193 and CECT 4094 strains was carried out in 25 µL reaction mixtures
containing 5 µL 5X Colorless GoTaq® Flexi buffer (Promega), 20 µM of each dNTP,
Chapter 7
156
0.4 µM of the forward and the reverse primer, 2 mM MgCl2, 0.2 µL Taq polymerase
(GoTaq®DNA Polymerase [5 u/µL], Promega) and template DNA (50-100 ng/µL). The
amplification conditions were as followed: initial denaturation for 5 min (94°C), 35
cycles of denaturation at 94°C (15 s), annealing at 55°C (30 s) and extension at 72°C
(30 s) and final extension at 72°C (7 min). PCR was optimized for CECT 4014 strain
using Herculase®II Fusion Enzyme kit (Stratagene, La Jolla, CA). The final reaction
mixture volume (50 µL) contained 10 µL of 5X Herculase II Reaction Buffer, 250 µM
of each dNTP, 0.25 µM of each primer, 0.5 µL of Taq polymerase and template DNA
(100-300 ng/µL). The amplification protocol included one cycle at 95 °C for 2 min
followed by 35 cycles at 95°C for 20 s, 50°C for 20 s and 72 °C for 30 s, and 10 min of
final extension at 72°C. PCR amplifications were performed on Applied Biosystem
Thermal Cycler 9700 and aliquots of amplicons were visualized on 1 % agarose gels,
stained with ethidiumbromide. Automated sequencing of PCR products was performed
by Savia Biotech (Almería, España) using panCfor and panCrev primers.
7.2.4. Phylogenetic analysis and affiliation to B. cereus group
Nucleotide sequence alignement and phylogenetic analysis of panC gene
between microorganisms of the B. cereus group was performed with the ClustalX 2.1
program applying Neighbour-Joining method (Saitou and Nei, 1987). The analyzed data
set also included panC gene sequences of Bacillus species and strains available from the
GenBank (Benson et al., 2004) with the following NCBI accession numbers: B.
weihenstephanensis (5841679), B. cereus ATCC 10987 (2748449), B. cereus G9842
(7186600), B. cereus AH187 (7073679), B. cereus E33L (3024889), B. cereus AH820
(7191073), B. cereus Q1 (7376764), B. cereus 03BB102 (7689603), B. cereus B4264
(7097070). B. cereus subsp. cytotoxis NVH 391-98 (5346025), B. anthracis str. Ames
(1086855), B. anthracis str. A0248 (7853564), B. anthracis str. 'Ames Ancestor'
(2815431), B. anthracis str. Sterne (2849787), B. anthracis CI (9454079), B. anthracis
str. CDC 684 (7785245), B. thuringiensis str. Al Hakam (4546784), B. thuringiensis
BMB171 (9192413) and B. thuringiensis serovar konkukian str. 97-27 (2858358).
Applying the classification system proposed by Guinebretière et al. (2008),
panC gene sequences were used to assign the strains to phylogenetic groups I-VII
performing the homology search’ algorithm offered at
Chapter 7
157
https://www.tools.symprevius.org/Bcereus/english.php. Percentages of homology
calculation were done by using the following mathematical formula described in this
web tool:
% homology = (number of matched bases/alignment length) x 100 (1)
where, alignment length is the number of bases covering the alignment.
Identification to phylogenetic groups is considered as not significant and
rejected when % homology values are minor than 90%. Besides, when the highest %
homology is <75%, identification to the B. cereus group is considered as not significant
and rejected.
7.2.5. Heat resistance determination of B. cereus sensu stricto spores
Heat resistance determination of sporulated cells on sterile distilled water was
carried out using Mastia thermoresistometer (Conesa et al., 2009). At specific time
intervals, which depended on the treatment temperature (90, 95 and 100°C), samples
were collected into sterile tubes, diluted, plated onto BHI agar (BHIA; Scharlau,
Barcelona, Spain) and incubated at 37°C for 24 h. Survival curves were fitted using
Geeraerd and Van Impe Inactivation Model Fitting Tool (GInaFIT; Geeraerd et al.,
2005). Through traditional log-linear model (Bigelow and Esty, 1920) and log-linear
model with shoulder (Geeraerd et al., 2000), B. cereus spore heat resistance was
described to obtain an accurate assessment which allows us to design safety processing
treatments avoiding those which are overly conservative. Maximum inactivation rate
(Kmax) was obtained from log-linear model. Besides, from the log-linear model with
shoulder specific inactivation rate (Kmax) and shoulder length were determined. Root
Mean Sum of Squared Errors (RMSSE) (Ratkowsky, 2003) was selected as a measure
of goodness of fit. The magnitude of RMSSE should be comparable to the standard
deviation (as a measure of the precision of replicates) of the experimental data
(Geeraerd et al., 2000).

Chapter 7
158
7.2.6. Identification of highly polymorphic genomic regions and primer design
Genome sequences of B. cereus strains with the following accession numbers
were obtained from GenBank database and used for primer design: NC 004722 B.
cereus ATCC 14579 and NC 0011772 B. cereus G98421. Both sequences were aligned
using the multiple sequence alignment algorithm MUSCLE, version 3.8 freely available
at http://www.drive5.com/muscle. Conserved genome fragments flanking hypervariable
nucleotide regions were selected between both strains. The selected polymorphic
nucleotide sequences (Figures 3 and 4) were analyzed using Blast-N
(http://blast.ncbi.nlm.nih.gov/Blast.cgi). Primer3 (v 0.4.0) software was used to design
and pre-evaluate primers. Autofolding was studied using Oligo Calculator (v 3.6) and
probability of secondary fold using Quikfold tool available at DINAMelt Web server. In
silico PCR using Ipcress (In-silico PCR Experiment Simulation System) was performed
in order to assess the number of amplicons generated by the designed primer. Primer
names, primer sequences, expected size of amplification products and Tm are presented
in Table 3.
7.2.7. Amplification of polymorphic region by conventional and real-time PCR
Highly polymorphic 16S-23S ISR region were amplified by conventional PCR
using primers 16S-23SISRfor and 16S-23SISRrev (Table 3) from B. cereus CECT 131,
CECT 148, CECT 193, CECT 4014, CECT 4094, B. thuringiensis Bt407 and B.
weihenstephanensis KBAB4. The PCR was performed on Applied Biosystem Thermal
Cycler 9700 with Herculase®II Fusion Enzyme kit (Stratagene, La Jolla, CA) as
described above for panC gene amplification. PCR conditions were as followed: one
cycle at 95 °C for 2 min, 35 cycles at 95°C for 30 s, 55°C for 30 s and 72 °C for 30 s,
and 5 min of final extension at 72°C. PCR amplicons were analyzed on 2 % agarose
gels.
Real-time PCR for the region 16S-23S ISR and for polymorphic regions
flanking 5S and 16S rRNA genes was performed for the B. cereus group strains
described above as well as for B. thuringiensis Bt407 and B. weihenstephanensis
KBAB4. The 25 µL PCR reaction contained 12.5 µL of Brilliant II SYBR Green QPCR
master mix (Stratagene, La Joya, CA), 0.3 µM of forward and reverse primers 16S-

Chapter 7
159
23SISR, 5S-GT and 16S-ISR (Table 3) and template DNA (50-150 ng). Amplifications
were performed in triplicate using Rotor-gene Q thermal cycler (Quiagen, Germantown,
MD, USA).
PCR conditions consisted of one cycle at 95°C for 10 min, followed by 40 cycles
at 95°C for 30 s, 57°C (ISR) or 58ºC (5S-GT and 16S-ISR) for 30s and 72°C for 1 min.
Fluorescence was measured at the end of each extension step. Melting curve analysis
was performed in a temperature range from 57°C to 95°C increasing by 0.1°C each step.
Data were analyzed using the software Rotor-Gene 2.02.4.
7.2.8. High resolution melting of polymorphic regions
For the detection of gene mutations and SNPs, we performed HRM analysis of
16S-23S ISR region and of polymorphic regions flanking 5S and 16S rRNA genes from
B. cereus CECT 131, CECT 148, CECT 193, CECT 4014, CECT 4094, B. thuringiensis
Bt407 and B. weihenstephanensis KBAB4 using Type-it® HRM kit (Quiagen,
Germantown, MD, USA) according to the manufacturer’s instructions. This commercial
kit contains EvaGReen DNA binding dye with a 10-fold higher SNP detection
sensitivity compared to SYBER Green I. PCR runs prior to HRM analysis were
performed in triplicate using Rotor-gene Q thermal cycler and repeated three times.
16S-23S ISR region was amplified using oligonucleotides 16S-23SISRfor and 16S-
23SISRrev and polymorphic regions flanking 5S and 16S rRNA genes were amplified
using forward and reverse primers 5S-GT and 16S-ISR (Table 3). PCR conditions
consisted in one cycle at 95°C for 10 min, followed by 40 cycles at 95°C for 30 s, 57°C
(ISR) or 58ºC (5S-GT and 16S-ISR) for 30 s and 72°C for 1 min. Fluorescence was
measured at the end of each extension step. High resolution melting curve analysis was
performed in a temperature range from 57°C (ISR) or 58ºC (5S-GT and 16S-ISR) to
95°C increasing 0.1°C each step. Rotor-Gene 2.02.4 software was used to run HRM-
PCRs and analyze results. Raw data of HRM analysis were normalized by setting the
same start and ending fluorescent signal level for all the curves through adjusting two
normalization regions, one region for the start (trailing range) and other for the end
(leading range). Threshold values for genotyping confidence percentages were set.
Genotypes were determined automatically by the software establishing confidence

Chapter 7
160
values as an integrity check of obtained results. Samples bellow 90% threshold value
were considered as a genotypic variant.
7.3. Results and discussion
7.3.1. panC gene sequence affiliation
Affiliation of B. cereus strains CECT 131, CECT 148, CECT 193, CECT 4014
and CECT 4094 to the phylogenetic B. cereus groups I-VII was performed by
amplification and sequencing of panC gene (Candelon et al., 2004; Guinebretière et al.,
2008). Obtained sequences were submitted to the web tool link
‘https://www.tools.symprevius.org/Bcereus/english.php’ which performs comparison
with known sequences compiled in the database of UMR408, INRA-University of
Avignon (France). Percentages of homology calculation were done as described above.
Results revealed that B. cereus CECT strains tested in this study belong to group IV.
Microorganisms of group IV are generally cytotoxic, some of them even highly
cytotoxic. Concerning the toxygenic profile, 100% of tested strains form group IV
carried the nhe gene, whereas the genes hbl and cytK2 did not consistently appear in
group IV strains (Guinebretière et al., 2010).
On the other hand, this phylogenetic group, which includes B. thuringiensis and B.
cereus isolates, has a temperature growth range between 10-45°C which selectively
determines their prevalence in different food products. Afchain et al. (2008) estimated
that the genetic group IV prevailed in milk proteins and starch. Additionally, presence
and growth in refrigerated food therefore should not occur, even so growth of strains of
this mesophilic group in chilled pasteurized vegetables has been reported (Guinebretière
et al., 2008).
7.3.2. Heat inactivation of B. cereus strains affiliated to group IV
To broaden the understanding of B. cereus strains affiliated to group IV
concerning thermal processes, we characterized the heat resistance of strains CECT
131, CECT 148, CECT 193, CECT 4014 and CECT 4094 under isothermal conditions
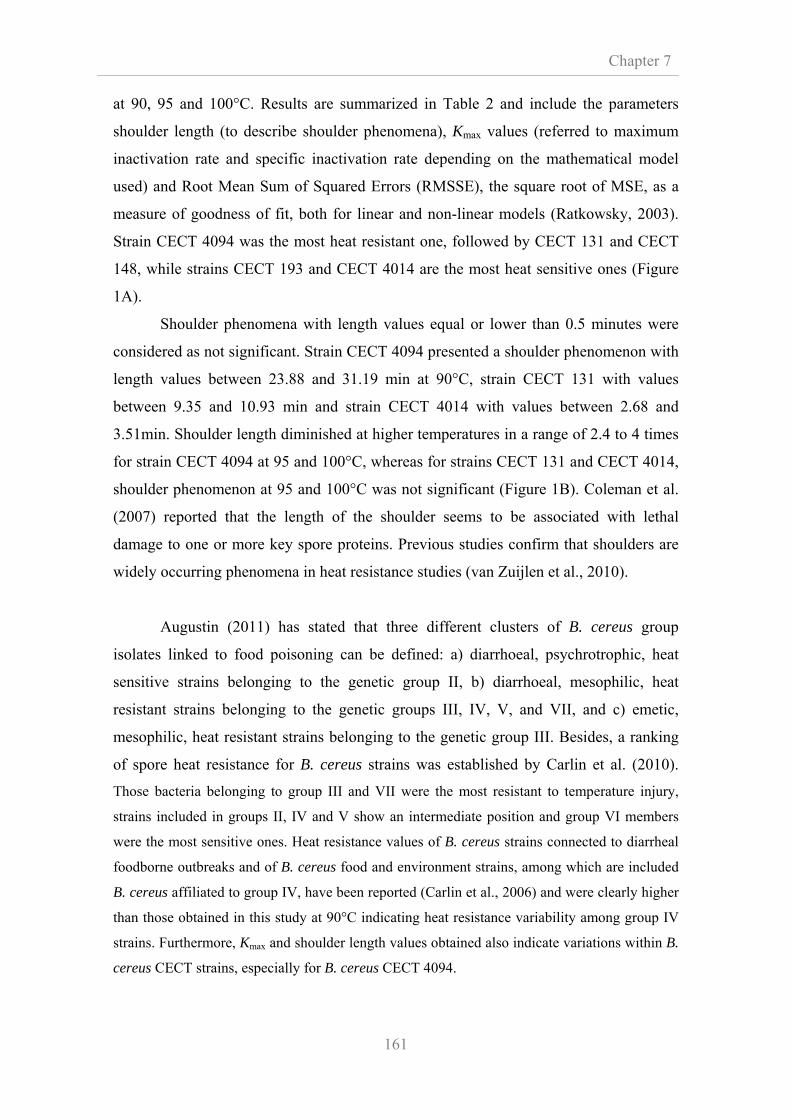
Chapter 7
161
at 90, 95 and 100°C. Results are summarized in Table 2 and include the parameters
shoulder length (to describe shoulder phenomena), Kmax values (referred to maximum
inactivation rate and specific inactivation rate depending on the mathematical model
used) and Root Mean Sum of Squared Errors (RMSSE), the square root of MSE, as a
measure of goodness of fit, both for linear and non-linear models (Ratkowsky, 2003).
Strain CECT 4094 was the most heat resistant one, followed by CECT 131 and CECT
148, while strains CECT 193 and CECT 4014 are the most heat sensitive ones (Figure
1A).
Shoulder phenomena with length values equal or lower than 0.5 minutes were
considered as not significant. Strain CECT 4094 presented a shoulder phenomenon with
length values between 23.88 and 31.19 min at 90°C, strain CECT 131 with values
between 9.35 and 10.93 min and strain CECT 4014 with values between 2.68 and
3.51min. Shoulder length diminished at higher temperatures in a range of 2.4 to 4 times
for strain CECT 4094 at 95 and 100°C, whereas for strains CECT 131 and CECT 4014,
shoulder phenomenon at 95 and 100°C was not significant (Figure 1B). Coleman et al.
(2007) reported that the length of the shoulder seems to be associated with lethal
damage to one or more key spore proteins. Previous studies confirm that shoulders are
widely occurring phenomena in heat resistance studies (van Zuijlen et al., 2010).
Augustin (2011) has stated that three different clusters of B. cereus group
isolates linked to food poisoning can be defined: a) diarrhoeal, psychrotrophic, heat
sensitive strains belonging to the genetic group II, b) diarrhoeal, mesophilic, heat
resistant strains belonging to the genetic groups III, IV, V, and VII, and c) emetic,
mesophilic, heat resistant strains belonging to the genetic group III. Besides, a ranking
of spore heat resistance for B. cereus strains was established by Carlin et al. (2010).
Those bacteria belonging to group III and VII were the most resistant to temperature injury,
strains included in groups II, IV and V show an intermediate position and group VI members
were the most sensitive ones. Heat resistance values of B. cereus strains connected to diarrheal
foodborne outbreaks and of B. cereus food and environment strains, among which are included
B. cereus affiliated to group IV, have been reported (Carlin et al., 2006) and were clearly higher
than those obtained in this study at 90°C indicating heat resistance variability among group IV
strains. Furthermore, Kmax and shoulder length values obtained also indicate variations within B.
cereus CECT strains, especially for B. cereus CECT 4094.
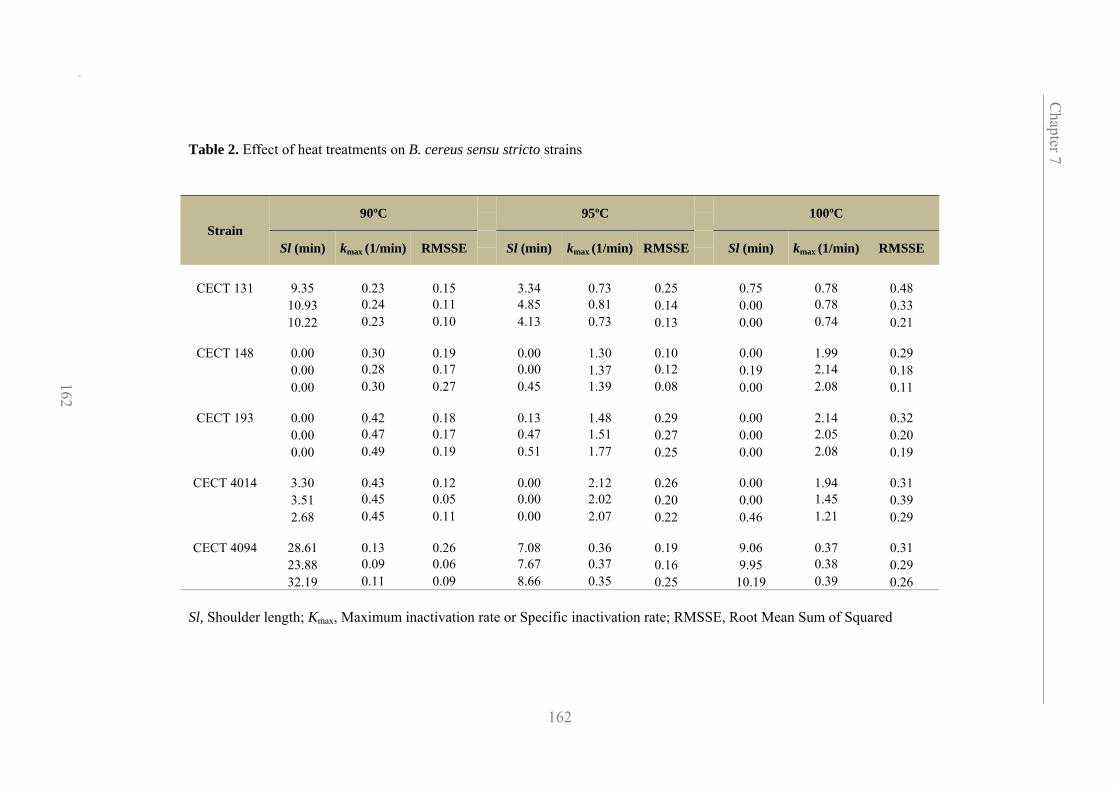
Chapter 7
162
Table 2. Effect of heat treatments on B. cereus sensu stricto strains
Sl, Shoulder length; Kmax, Maximum inactivation rate or Specific inactivation rate; RMSSE, Root Mean Sum of Squared
Strain 90ºC 95ºC 100ºC
Sl (min) kmax (1/min) RMSSE Sl (min) kmax (1/min) RMSSE Sl (min) kmax (1/min) RMSSE
CECT 131
9.35
0.23
0.15 3.34
0.73
0.25
0.75
0.78
0.48 10.93 0.24 0.11 4.85 0.81 0.14 0.00 0.78 0.33 10.22 0.23 0.10 4.13 0.73 0.13 0.00 0.74 0.21
CECT 148
0.00
0.30
0.19
0.00
1.30
0.10 0.00
1.99 0.29
0.00 0.28 0.17 0.00 1.37 0.12 0.19 2.14 0.18 0.00 0.30 0.27 0.45 1.39 0.08 0.00 2.08 0.11
CECT 193
0.00
0.42
0.18
0.13
1.48
0.29 0.00
2.14 0.32 0.00 0.47 0.17 0.47 1.51 0.27 0.00 2.05 0.20 0.00 0.49 0.19 0.51 1.77 0.25 0.00 2.08 0.19
CECT 4014
3.30
0.43
0.12
0.00
2.12 0.26 0.00
1.94 0.31 3.51 0.45 0.05 0.00 2.02 0.20 0.00 1.45 0.39 2.68 0.45 0.11 0.00 2.07 0.22 0.46 1.21 0.29
CECT 4094
28.61
0.13
0.26
7.08
0.36
0.19
9.06
0.37 0.31 23.88 0.09 0.06 7.67 0.37 0.16 9.95 0.38 0.29 32.19 0.11 0.09 8.66 0.35 0.25 10.19 0.39 0.26
162
Chapter 7

Chapter 7
163
Figure 1. Survival curves (A) at 90°C of B. cereus CECT 131 (orange), B. cereus CECT 148 (violet), B. cereus CECT 193 (black), B. cereus CECT 4014 (red) and B. cereus CECT 4094 (blue) and(B) of B. cereus CECT 131 at 90°C (yellow), 95°C (green) and 100°C (pink).

Chapter 7
164
Notably, this heterogeneous behavior of B. cereus strains heat resistance and the
presence of shoulders in their survival curves should be taken into account in order to
prevent fail-dangerous processing treatments. Therefore, accurate identification of B.
cereus strains could be a valuable tool to ensure consumer health and avoid spoilage.
7.3.3. Phylogenetic analysis of panC gene
We performed a phylogenetic analysis with tree construction in order to study
the phylogenetic relatedness of the panC gene sequences obtained in the present work
for B. cereus CECT strains with those available at the NCBI GenBank (accession
numbers are listed above (see 2.4)). We had previously submitted the corresponding
panC gene sequences to the web tool link mentioned above (see 3.1.1) for affiliation to
phylogenetic groups I-VII (Figure 2). Dendrogram construction was carried out using
ClustalX 2.1 program by the Neighbor-Joining method (Saitou and Nei, 1987).
Consistent with results of Guinebretière et al. (2008), the phylogenic tree shows
two main branches. One branch clusters members of group III, IV and VI and B. cereus
subsp. cytotoxis NVH 391-98 of group VII as a separate entity (Figure 2). Besides,
strains from group IV and VI are closer related than those affiliated to group III. CECT
B. cereus strains are closely related to other strains of the same species as well as B.
thuringiensis and B. weihenstephanensis strains. This phylogenetic assessment is
consistent with others previously performed. In 2011, Schmidt et al. reported that some
B. cereus strains were significantly more closely related to B. anthracis or B.
thuringiensis than they are to other strains of B. cereus. Thus, these results suggest high
genetic similarity among B. cereus group species making a challenge differentiation at
strain or species level.
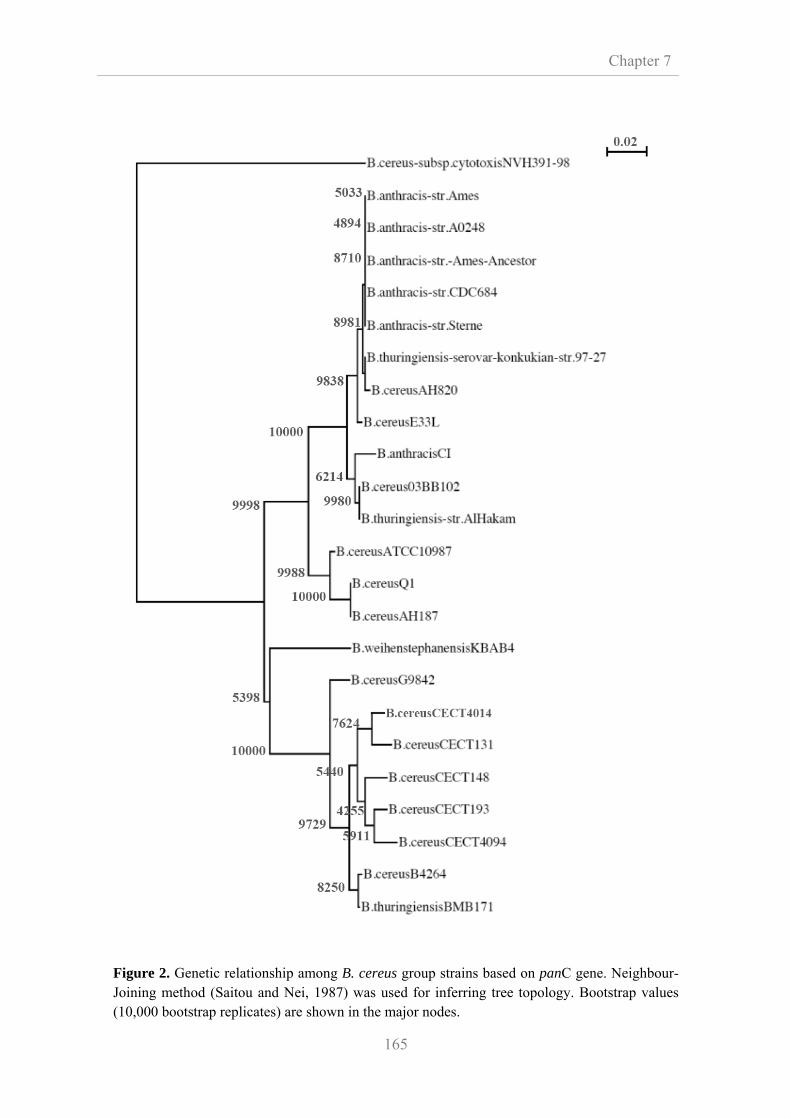
Chapter 7
165
Figure 2. Genetic relationship among B. cereus group strains based on panC gene. Neighbour-Joining method (Saitou and Nei, 1987) was used for inferring tree topology. Bootstrap values (10,000 bootstrap replicates) are shown in the major nodes.

Chapter 7
166
7.3.4. Primer design for single nucleotide polymorphism analysis
SNP analysis in combination with HRM analysis was found to be a rapid,
efficient and economic genotyping method for applications in clinical areas like
pharmacogenomics (Temesvári et al., 2011) as well as in plant genotyping (De Koeyer
et al., 2009). Our objective was to apply this technique in the area of food microbiology
for species and strain differentiation within B. cereus, which would then allow improve
food processing techniques such as thermal treatment procedures and to determine the
source of an outbreak and take effective control and preventing measures.
For amplification prior to HRM, we selected the 16S-23S ISR, which is widely
used for genotyping bacteria based on its high degree of sequence polymorphism.
Sequence alignment of rRNA operons between B. cereus G98421 (NC 0011772) and B.
cereus ATCC 14579 (NC 004722) verified sequence polymorphism in the ISR region.
Alignment information was used to design primers 16S-23SISRfor and 16S-23SISRrev
flanking the polymorphic 16S-23S ISR (Figure 3).
In order to find additional candidate regions for amplification and HRM
genotyping, we screened aligned sequences of B. cereus G98421 (NC 0011772) and B.
cereus ATCC 14579 (NC 004722) to select variable regions flanked by conserved
sequences. Candidate regions with a high probability of secondary fold and multiple
amplicons based on in silico PCR were discarded as well as primer combinations
resulting in more than a single peak in melting peak analysis of PCR products. Two
pairs of primer, 5S-GTfor and 5S-GTrev and 16S-ISRfor and 16S-ISRrev (Table 3),
fulfilled the necessary requirements and were used in our study. The corresponding
amplified nucleotide regions are detailed in Figures 4A and 4B. 5S-GT-PCR product
spans part of the 5S rRNA gene followed by a sequence highly homologous to
glycosiltransferase. 16S-ISR primers result in an amplicon encoding 16S rRNA gene
followed by a sequence highly homologous to ISR.
Chapter 7
167
Table 3. PCR primers used in this study
Target Primer Primer sequence Product size (bp)
Tm (°C)
panC gene panCfor CGTAAGGCAAGAGAAGAAAA
651 50/55panCrev TCCTTCGACTTTCTCTACCA
16S rRNA gene-23S rRNA gene ISR 16S-23SISRfor CGAAGCATATCGGCGTTAGT
560 55/5716S-23SISRrev CCCTTATGACCTGGGCTACA
5S rRNA gene and glutamiltransferase 5S-GTfor GAGAGTAGGACGTCGCCAAG
206 58 5S-GTrev TGAAACAGATTGGTGGTATGACTT
16S rRNA gene and 16S-23S ISR 16S-ISRfor AATAAGCGTCGTCAGGAACG
185 58 16S-ISRrev AGCCAGGATCAAACTCTCCA
167
Chapter 7

Chapter 7
168
Figure 3. Comparative nucleotide sequence analysis of 23S rRNA gene, 16S-23S ISR and 16S rRNA gene from B. cereus ATCC 14579 and B. cereus G9842. Nucleotide position for the primers 16S-23SISRfor and 16S-23SISRrev are indicated. The polymorphic ISR region is highlighted.
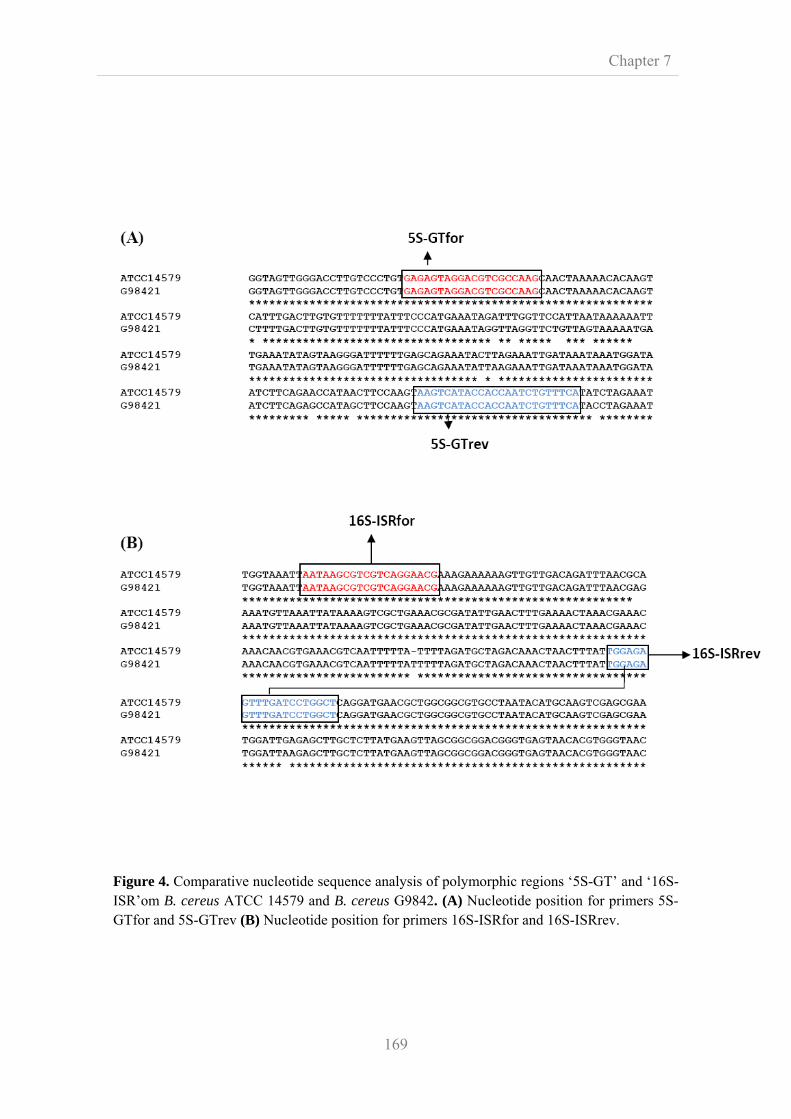
Chapter 7
169
Figure 4. Comparative nucleotide sequence analysis of polymorphic regions ‘5S-GT’ and ‘16S-ISR’om B. cereus ATCC 14579 and B. cereus G9842. (A) Nucleotide position for primers 5S-GTfor and 5S-GTrev (B) Nucleotide position for primers 16S-ISRfor and 16S-ISRrev.

Chapter 7
170
7.3.5. 16S-23S intergenic spacer region PCR and in silico PCR
PCR-based fingerprinting methods have been extensively used for B. cereus
group isolates identification. For amplification, we selected the 16S-23S ISR for
differentiation of closely related bacterial species, such as Bacillus genus isolates, based
on its high degree of sequence polymorphism (Jensen et al., 1993; Wunschel et al.,
1994; Daffonchio et al., 1998; Nagpal et al., 1998; Shaver et al., 2002; Cherif et al.,
2003). Sequence alignment of rRNA operons between B. cereus G98421 (NC 0011772)
and B. cereus ATCC 14579 (NC 004722) verified sequence polymorphism in the ISR.
We amplified the 16S-23S ISR of B. cereus CECT 131, CECT 148, CECT 193,
CECT 4014, CECT 4094, B. weihenstephanensis KBAB4 and B. thuringiensis Bt407
by conventional PCR. In accordance with Daffonchio et al. (1998, 2000) we observed
identical and reproducible patterns in all strains tested revealing that 16S-23S ISR-PCR
was unable to differentiate B. cereus CECT strains and those from B.
weihenstephanensis KBAB4 and B. thuringiensis Bt407 (Figure 5A). This may suggest
that length of 16S-23S ISR is conserved among B. cereus isolates and different
techniques should be used to discriminate between closely related isolates that have
essentially identical ISR sequences. Recently, Martínez-Blanch et al. (2011) reported
that ISR-PCR profiles can be used for rapid assignation of isolates to B. cereus group
meanwhile for typing at species level RAPD profiles were needed.
In silico PCR with our 16S-23SISRfor and 16S-23SISRrev primers applied to B.
cereus ATCC 14579 (NC 004722) genomic DNA yielded a total of 13 possible
matches, which possibly refer to the 13 rRNA operons mentioned by Candelon et al.
(2004). Differences between ISR-PCR band pattern and expected in silico profile might
partly be due to the presence of heteroduplex products formed during PCR between
amplicons from different ribosomal operons (Daffonchio et al., 2003).

Chapter 7
171
Figure 5. Amplification of 16S-23S ISR of B. cereus group strains with primers 16S-23SISRfor and 16S-23SISRrev (A) Agarose gel-PCR profiles (B) Major melting peaks obtained by real time PCR.

Chapter 7
172
7.3.6. Evaluation of Tm profiles for strain and species discrimination
Melting peak analysis of PCR products from diverse polymorphic regions has
been widely used as a reliable method for fast and sensitive discrimination between
Bacillus species and strains (De Clerck et al., 2004; Priha et al., 2004; Fricker et al.,
2007; Reekmans et al., 2009; Postollec et al., 2010). It was reported that differentiation
among B. cereus group strains could be achieved by real-time PCR based on SYBER
Green I (Martínez-Blanch et al., 2009; Wehrle et al., 2009).
Amplification products of three polymorphic regions, 16S-23S ISR, 5S-GT
and16S-ISR, all related to genes of the rRNA operon in the B. cereus group, were
analyzed using this technique. Melting peak analysis resulted in two main peaks for
16S-23S ISR PCR product and one peak for 5S-GT and 16S-ISR PCR products,
respectively. Tm values were very similar and did not allow consistent differentiation
among species and strains. It was reported that Tm variations between amplicons of at
least 1°C to 2°C can be differentiated using SYBER Green I, whereas Tm differences of
1°C or less are not valuable for genotyping and bacterial species identification (Odell et
al., 2005). Figure 5B exemplarily shows the major melting peak of 16S-23S ISR PCR
product for all B. cereus sensu stricto strains, B. thuringiensis and B.
weihenstephaniensis.
7.3.7. Evaluation of high resolution melting analysis for species genotyping
Genotyping of bacteria is a powerful tool for identification of bacteria (Towner
and Cockayne, 1993) and the detection of SNP can be easily and rapidly performed by
HRM, replacing other technologies like sequencing (Tesmevári et al., 2011). According
to Liew et al. (2004), 84% of SNPs result in Tm differences of about 1ºC, 12% cluster
around 0.25ºC and 4% are predicted to be identical by nearest neighbour
thermodynamics. In general, small insertions and deletions were shown to be more
difficult to detect than substitutions (Wittwer, 2009).
In HRM analysis, curve shapes are compared and variations in shapes are
usually easier to detect than Tm differences, even so different sequences might generate
Chapter 7
173
similar melt curves (Cheng et al., 2006). The Rotor-Gene 2.02.4 software performs an
automatic calling of clusters belonging to different genotypes, recognizing Tm
differences as low as 0.1°C between amplicons in addition of curve shape variants
among genotypes.
B. cereus CECT 148, B. thuringiensis Bt407 and B. weihenstephanensis KBAB4
strains were used to test species discrimination by SNP genotyping with HRM analysis,
following the amplification of polymorphic regions 16S-23S ISR, 5S-GT and 16S-ISR
(Table 3 and figures 3 and 4). 5S-GT and 16S-ISR amplicons gave derivative melting
curves with a single peak (Figures 6A and 6B), indicating the presence of one
amplification product only. 16S-23S ISR-PCR products showed two melting peaks
(data not shown). Normalized plots for genotyping were generated by selecting
appropriate areas from the melting curves (Figure 6C and 6D). Figures 6E and 6F show
difference plots which were generated by defining representative genotypes followed by
subtraction of average plots of the different genotypes from one selected genotype.
HRM results indicate that amplicons for regions 5S-GT and 16S-ISR can be applied for
discrimination among Bacillus species (Figures 6A to 6F), whereas the selected 16S-
23S ISR region was not valuable for species differentiation (data not shown).
In summary, we demonstrated that SNPs genotyping by HRM analysis for
amplicons 5S-GT and 16S-ISR had a high discriminatory power between B. cereus
CECT 148, B. thuringiensis Bt407 and B. weihenstephanensis KBAB4 and an excellent
typeability. Amplification of 16S rRNA gene followed by HRM analysis for genotyping
of bacterial species was also reported by Cheng et al. (2006), allowing to discriminate
between 25 clinically important species among which were Staphylococcus aureus,
Pseudomonas aeruginosa, Salmonella enteritidis, E.coli and Bacillus species. Of all the
bacterial species tested, 11 were discriminated via 1-step post-PCR HRM analysis and
the remaining, including Bacillus isolates, by heteroduplex formation between PCR
products of the tested and reference bacterial species or by a second real-time PCR
targeting a different region of the 16S rRNA gene.
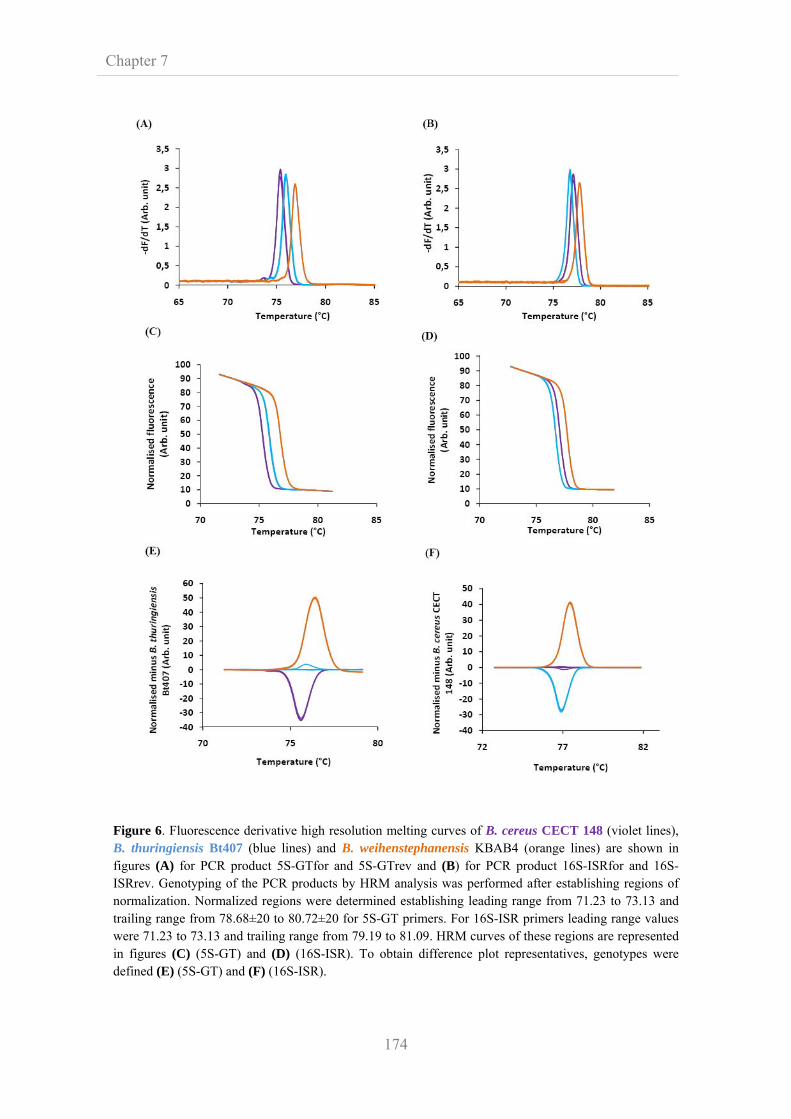
Chapter 7
174
Figure 6. Fluorescence derivative high resolution melting curves of B. cereus CECT 148 (violet lines), B. thuringiensis Bt407 (blue lines) and B. weihenstephanensis KBAB4 (orange lines) are shown in figures (A) for PCR product 5S-GTfor and 5S-GTrev and (B) for PCR product 16S-ISRfor and 16S-ISRrev. Genotyping of the PCR products by HRM analysis was performed after establishing regions of normalization. Normalized regions were determined establishing leading range from 71.23 to 73.13 and trailing range from 78.68±20 to 80.72±20 for 5S-GT primers. For 16S-ISR primers leading range values were 71.23 to 73.13 and trailing range from 79.19 to 81.09. HRM curves of these regions are represented in figures (C) (5S-GT) and (D) (16S-ISR). To obtain difference plot representatives, genotypes were defined (E) (5S-GT) and (F) (16S-ISR).
Chapter 7
175
7.3.8. Evaluation of high resolution melting analysis for strain genotyping
We evaluated the potential to discriminate among B. cereus strains based on
SNP detection through HRM analysis of amplicons 16S-23S ISR, 5S-GT and 16S-ISR.
Melting curves of the 16S-23S ISR for all the strains tested were characterized by two
variant domains, corresponding to the two melting peaks observable in the derivative
plot (Figure7A). The appearance of two clearly identifiable melting domains in the ISR
region might be related to the relative large amplicon size (Table 3) as was reported
already be Reed et al. (2007).
For genotyping with 16S-23S ISR amplicons, a combinatory approach was
applied, analyzing the two melting domains separately as well as in combination
because successful genotyping for a given domain varied among the biological replica
Fig. 7B and C exemplarily show the normalized high resolution melting curve and the
difference plot generated for the upper domain 1. Our results indicate that HRM
analysis detects polymorphisms in both melting domains, but resolution is borderline,
thus explaining the variation among biological repetitions.
PCR products 5S-GT and 16S-ISR of the various strains yielded a single peak
but HRM analysis did not discriminate between B. cereus strains and these polymorphic
regions were rejected for strain genotyping by HRM analysis.
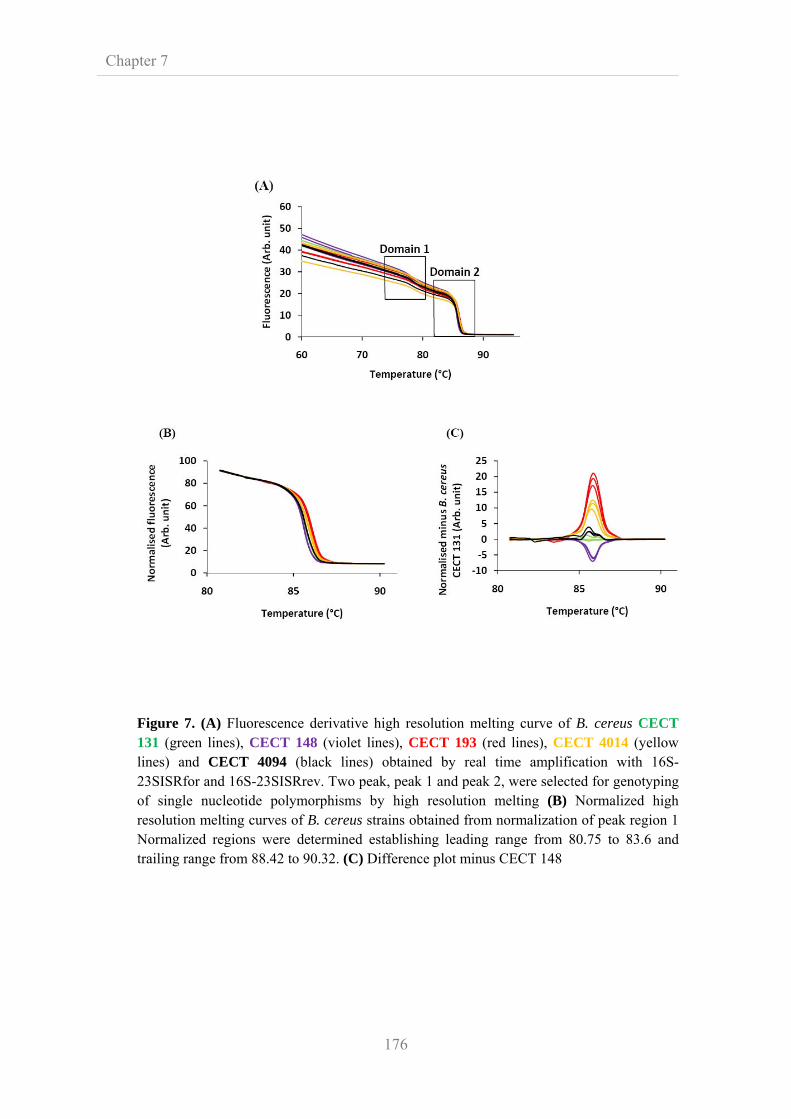
Chapter 7
176
Figure 7. (A) Fluorescence derivative high resolution melting curve of B. cereus CECT 131 (green lines), CECT 148 (violet lines), CECT 193 (red lines), CECT 4014 (yellow lines) and CECT 4094 (black lines) obtained by real time amplification with 16S-23SISRfor and 16S-23SISRrev. Two peak, peak 1 and peak 2, were selected for genotyping of single nucleotide polymorphisms by high resolution melting (B) Normalized high resolution melting curves of B. cereus strains obtained from normalization of peak region 1 Normalized regions were determined establishing leading range from 80.75 to 83.6 and trailing range from 88.42 to 90.32. (C) Difference plot minus CECT 148
Chapter 8
177
CHAPTER 8
Involvement of the YhcYZ two-component system during
growth at low temperature in various Bacillus cereus group
strains
Abstract
The high adaptability of Bacillus cereus group members to cold niches may be caused
by the fact that these species harbor a wide variety of signaling pathways that allow
rapid and robust responses. Recently, experiments performed in Bacillus cereus ATCC
14579 showed that BC2216 and BC2217 genes, encoding a sensor and a regulatory
domain of a two-component system, have been related to resistance to low
temperatures. BC2216-17 knockout mutants were performed to develop a preliminary
study of B. cereus group cold phenotypes. Isogenic mutants of the BC2216 and BC2217
genes of B. cereus ATCC 14579, B. cereus AH 187 and Bacillus thuringiensis Bt407
were obtained. Results revealed that at 12ºC B. cereus ATCC 14579 knockout strains
showed a slight but highly reproducible impaired growth, meanwhile B. thuringiensis
Bt407 and B. cereus AH 187 BC2216-17 knockout mutants did not show a clear cold
phenotype. This heterogeneous response to BC2216-17 mutation may suggest that cold
response varies among B. cereus group strains, although more strains should be tested
before obtaining a reliable conclusion. Besides, different protocols were tested in order
to improve B. cereus group transformation efficiency. Unlike previous studies, in vitro
method for strain-specific methylation of plasmid DNA did not enhance transformation
of B. cereus group species. However, it is noteworthy that, besides different B. cereus
and B. thuringiensis mesophilic strains, two psychrotrophic strains, Bacillus
weihenstephanensis WSBC 10688 and Bacillus mycoides DSM 2048, were successfully
transformed.
177
10101010
9
8
7
6
5
4
3
2
1

Chapter 8
178
10
9
7
6
5
4
3
2
1

Chapter 8
179
8.1. Introduction B. cereus group isolates are ubiquitous microorganisms able to survive and
prosper in a wide variety of environmental conditions mainly due to their ability to form
spores and to be able to growth in a broad range of temperature defined from 4 to 50ºC.
In 2008, based on genotypic and phenotypic criteria, Guinebretière et al. established an
“ecotypic structure” of B. cereus group consisting of seven thermal groups (I-VII). This
study provided evidence for a multiemergence of psychrotolerance among these species
and showed how modification of temperature tolerance limits has influenced their
evolution. Nowadays the adaptation of these microorganisms to numerous environments
is a major concern for food industry, especially during storage of refrigerated foods. In
fact, psychrotolerant and mesophilic strains able to grow at temperatures below 10ºC
can contaminate food products stored at refrigeration temperatures or under suboptimal
refrigeration conditions and multiply causing spoilage and health risk for consumers
(Stenfors Arnesen et al., 2008; Brillard et al., 2010). In this regard, delving into
mechanistic details involved in adaptation of B. cereus group isolates to low
temperatures is a major aim to ensure microbiological quality of chilled food products.
Under cold stress bacterial cells undergo physiological modifications affecting
membrane fluidity, protein synthesis and nucleic acid topology (Phadtare, 2004;
Pandiani et al., 2011). To cope with these adverse conditions microorganisms use a
genetically determined two-phase strategy composed of a cold shock response followed
by an acclimatization response (Horn et al., 2007; Carlin et al., 2010).
During conditions of a sudden decrease in temperature (cold shock), mRNA-
binding cold shock proteins (Csps) and cold induced RNA helicases (Cshs) appear to be
major players in the prevention of secondary mRNA structures which affect
transcription and translation mechanisms causing transient inhibition of protein
synthesis. Members of both protein families have been shown to interact suggesting a
two-step process (El-Sharoud and Graumann, 2007) where Csps mediate transcription
elongation and message stability (Brillard et al., 2010) and Cshs remove secondary
structures from RNA duplexes stabilized by cold conditions in presence of ATP
(Pandiani et al., 2011). In 1996, Mayr et al. reported that B. cereus microorganisms
harbor a cold stress protein family composed of six Csp with two of them highly cold
Chapter 8
180
induced. The most abundant of these cold-induced proteins was a small polypeptide of
7.5 kDa designated CspA. Further studies (Lechner et al., 1998), revealed that CspA
and 16S rRNA sequences display clear differences between psychrotolerant and
mesophilic B. cereus group strains and may constitute a signature of psychrotolerant
character (Francis et al., 1998; Pruss et al., 1999; Carlin et al., 2010). Later, upon acid
shock, Escherichia coli and Bacillus subtilis cells were found to synthesize cold-
acclimation proteins (CAPs) which are involved in cell metabolism, DNA and RNA
metabolism, in protein folding and degradation, as well as in gene expression or protein
synthesis (Carlin et al., 2010). Notably, σB factor which is involved in B. cereus
response to different stresses such as heat-shock and acid exposure did not show to play
a role in cold adaptation (van Schaik et al., 2004). In B. subtilis isolates, the induction of
the general stress response is essential for adaptation to low temperatures during
prolonged periods (Brigula et al., 2003) meanwhile cold shock response did not depend
on the induction of sigB operon suggesting the existence of an alternative pathway
(Beckering et al., 2002). Further studies (Wiegeshoff et al., 2006) revealed that σL factor
forms a complex with BkdR transcriptional regulator activating bkd operon which is
responsible of the conversion of isoleucine to α-keto acids, precursors molecules for
branched chain fatty acids. Additionally, σL factor have been shown to interact with
YplP transcriptional regulator resulting in the activation of an alternative pathway of
unknown function when cells are subjected to cold shock (Wiegeshoff et al., 2006).
Moreover, thermal control of fatty acid synthesis is a universal and conserved
regulatory mechanism designed to mitigate the effects of low temperature on the fluidity
of membrane through the adjustment of membrane lipid composition (Cronan and
Rock, 1996; Aguilar et al., 2001; Mansilla et al., 2004). It can be done, for example,
increasing the proportion of branched-chain fatty acids and decreasing their equivalent
chain length, and increasing the anteiso-/iso-branched ratio and the proportion of
unsaturated fatty acids, as described by Haque and Rusell (2004) for B. cereus cells.
Thus, when bacteria and most of poikilothermic organisms are subjected to a decrease
of ambient growth temperature, proportion of unsaturated fatty acids (UFAs) in the
membrane lipids increases (Aguilar et al., 2001). For this purpose Bacilli cells introduce
double bounds by specific fatty acid desaturase enzymes into pre-existing fatty acids of
their membrane phospholipids (Grau and de Mendoza, 1993; Aguilar et al., 1998).
Chapter 8
181
Previous studies revealed that B. subtilis contains a unique desaturase, ∆5-
desaturase, encoded by des gene whose transcription is induced upon cold shock
(Aguilar et al., 1998, 1999). In 2001, Aguilar et al. reported that temperature regulation
of UFAs was controlled in B. subtilis by a two-component signal transduction system
(TCS) composed of a sensor kinase, DesK, and a transcriptional regulator, DesR,
responsible of des gene expression at low temperature. Activated by a transmembrane-
signal transduction pathway, DesK assumes different signaling states in response to a
change in membrane fluidity induced by temperature variations. Upon temperature
downshifts proportion of ordered membrane lipids increase and phosphatase-dominant
state change to kinase-dominant state and phosphorylates DesR (DesR-P) which binds
specifically to the promoter region of des gene inducing ∆5-desaturase. Newly
synthesized UFAs inhibit des transcription by favoring DesK dephosphorylation of
DesR-P or by causing dissociation of DesR-P form its binding site.
Recently, transcriptome analysis of B. cereus ATCC 14579 grown at 37 and
10ºC were performed to identify genes involved in B. cereus adaptation to low
temperature (Brillard personal communication, Nierop-Groot et al., in preparation).
Results revealed that a two-component signal transduction system composed of sensor
protein YhcY and a transcriptional regulator YhcZ, encoded by BC2216 and BC2217
genes respectively, were overexpressed at low-temperature. Since the genes encoding
this two-component system are conserved in most genomes of the B. cereus group,
including psychrotrophic strains, but are absent in the most thermophilic strains, the
study of this TCS during B. cereus low-temperature adaptation may be a major key to
understand mechanistic basis of cold adaptation in these species.
To study the role of these two-component regulatory proteins during growth at
low temperature of B. cereus group, BC2216 and BC2217 null mutants were
constructed in B. cereus ATCC 14579 strain. It is well known that gene knockout
strategies depend on the ability to transform B. cereus group strains with plasmid DNA.
However, there is significant strain-dependent variation in transformation competence
and even some strains are completely resistant to transformation (Donahue et al., 2000).
To improve transformation efficiency a wide range of protocols have been described for
gram-positive bacteria including cell-weakening agents, various washing buffer
compositions and a variety of electric pulses without successful results for cold-tolerant
Chapter 8
182
food isolates (Groot et al., 2008). Different authors have proposed as causative factors
of variation in plasmid transformation frequency the presence of fortified cell walls that
prevent DNA uptake and/or the involvement of DNA restriction and modification (RM)
system (Groot et al., 2008). Recent studies developed by Groot et al. (2008) reported
that B. weihenstephanensis DSM 11821 was resistant to Sau3AI and BamHI digestion
due to the methylation of the cytosine residue of the GATC recognition site. This
behavior was also observed in other cold-tolerant and mesophilic strains suggesting the
existence of a Sau3AI-type RM system which appears to be widespread among B.
cereus and B. weihenstephanensis isolates. On this basis, in vitro methylation of
plasmid DNA could result in a major improvement of transformation efficiencies as
shown by previous studies performed in B. cereus, B. weihenstephanensis and
Helicobacter pylori (Donahue et al., 2000; Groot et al., 2008).
In the present work we studied the effect of the deletion of BC2216 and BC2217
on the ability of various B. cereus group strains to grow at low temperatures.
Previously, an in vitro method for strain-specific methylation of plasmid DNA isolated
from B. cereus ATCC 14579 was tested in order to improve B. cereus group
transformation efficiency.
8.2. Materials and methods 8.2.1. Strains and plasmids
Different B. cereus group strains of the National Institute of Agronomic
Research (INRA, Avignon, France) collection listed in Table 1 were compiled for the
development and validation of transformation and mutation methods presented in this
work. Special care was taken, to include B. cereus group strains belonging to different
phylogenetic groups and displaying different temperature growth ranges.
All B. cereus group strains were characterized in previous studies using
molecular data from Amplified Fragment Polymorphisms patterns, ribosomal gene
sequences, partial panC gene sequences, psychrotolerant DNA sequence signatures and
phenotypic and descriptive data from range of temperature, psychrotolerance and
thermal niches (Guinebretiere et al., 2008).
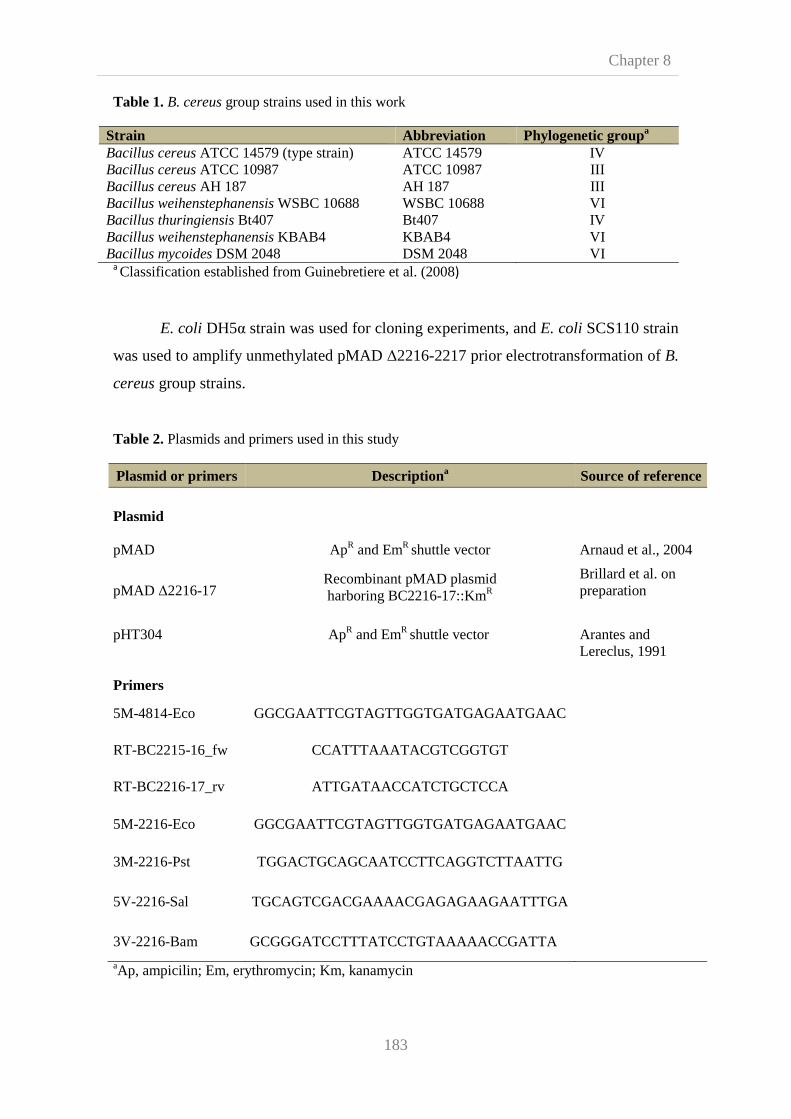
Chapter 8
183
Table 1. B. cereus group strains used in this work
Strain Abbreviation Phylogenetic groupa
Bacillus cereus ATCC 14579 (type strain) ATCC 14579 IV Bacillus cereus ATCC 10987 ATCC 10987 III Bacillus cereus AH 187 AH 187 III Bacillus weihenstephanensis WSBC 10688 WSBC 10688 VI Bacillus thuringiensis Bt407 Bt407 IV Bacillus weihenstephanensis KBAB4 KBAB4 VI Bacillus mycoides DSM 2048 DSM 2048 VI
a Classification established from Guinebretiere et al. (2008)
E. coli DH5α strain was used for cloning experiments, and E. coli SCS110 strain
was used to amplify unmethylated pMAD ∆2216-2217 prior electrotransformation of B.
cereus group strains.
Table 2. Plasmids and primers used in this study
aAp, ampicilin; Em, erythromycin; Km, kanamycin
Plasmid or primers Descriptiona Source of reference Plasmid pMAD ApR and EmR shuttle vector Arnaud et al., 2004
pMAD ∆2216-17
Recombinant pMAD plasmid harboring BC2216-17::KmR
Brillard et al. on preparation
pHT304
ApR and EmR shuttle vector
Arantes and Lereclus, 1991
Primers
5M-4814-Eco GGCGAATTCGTAGTTGGTGATGAGAATGAAC
RT-BC2215-16_fw CCATTTAAATACGTCGGTGT
RT-BC2216-17_rv ATTGATAACCATCTGCTCCA
5M-2216-Eco GGCGAATTCGTAGTTGGTGATGAGAATGAAC
3M-2216-Pst TGGACTGCAGCAATCCTTCAGGTCTTAATTG
5V-2216-Sal TGCAGTCGACGAAAACGAGAGAAGAATTTGA
3V-2216-Bam GCGGGATCCTTTATCCTGTAAAAACCGATTA

Chapter 8
184
Plasmids and primers used in the present work are detailed in Table 2. The
pMAD plasmid (Arnaud et al., 2004) was selected for generating gene inactivation
mutants in B. cereus group strains by a homologous recombination between a target
gene and homologous sequences carried on the plasmid. This vector contains a
thermosensitive pE194 replication vector origin and a constitutively expressed
transcriptional fusion with the bgaB gene encoding a thermostable β-galactosidase from
Bacillus stearothermophilus, allowing the easy screening of transformants on X-Gal (5-
bromo-4-chloro-3-indolyl-β-D-galactopyranoside) plates. In addition, it confers
erythromycin resistance to Gram-positive hosts.
8.2.2. Bacterial extract preparation
Cell-free extracts (CFE) of B. cereus ATCC 14579, B. cereus ATCC 10987, B.
cereus AH 187, B. thuringiensis Bt407, B. weihenstephanensis WSBC 10688, B.
weihenstephanensis KBAB4 and B. mycoides DSM 2048 were prepared from bacterial
cultures in the exponential phase of growth (A600=0.6-0.9), as previously described
(Groot et al., 2008). For this purpose two subsequent subcultures in Luria Bertani (LB)
broth (Maniatis et al., 1989) at 30ºC with shaking at 200 rpm were performed. To
recover Bacillus cells, inoculum were centrifuged at 9,000 rpm for 7 minutes and
bacterial pellets resuspended in five volumes (mL) of extraction buffer (Donahue et al.,
2000) composed of 20 mM Tris-acetate (pH 7.9) (Maniatis et al., 1989), 50 mM
potassium acetate (Sigma-Aldrich, Steinheim, Germany), 5 mM Na2EDTA (Sigma-
Aldrich, Steinheim, Germany), 1 mM dithiotreitol (DTT) (Amersham Biosciences,
Uppsala, Sweden) and buffer protease inhibitor cocktail Set-III EDTA-free, as
recommended by the supplier (Calbiochem, USA). Before use, buffer pH was fitted to
7.9 and sterilized by filtration using a 0.2 µm filter (Millipore, Bedford, USA). Next,
cell suspensions were lysed using Bio101 Thermo Savant Fastprep FP120 cell disrupted
system (Qbiogene, France) by performing three consecutive runs of 45 seconds between
which samples were chilled on ice during one minute. To recover supernant, bacterial
cell suspensions were centrifuged 5 minutes at 15,000 rpm at 4ºC. Supernatants were
removed and used immediately or after one freeze-thaw cycle (-80ºC) for in vitro
plasmid DNA modification reactions (see below).
Chapter 8
185
Bio-Rad protein assay based on the method of Bradford (Hercules, USA) was
used to determine the relative protein concentrations of extracts. Bovine serum albumin
was used as standard.
8.2.3. Treatment of plasmid DNA with CFE of the corresponding recipient B.
cereus group strain
The effect of pMAD ∆BC2216-17 methylation on transformation frequencies of
B. cereus group strains was assessed in the present work using the CFE of the
corresponding recipient microorganism. For this purpose plasmid DNA (12 µg),
prepared from E. coli DH5α was combined with Bacillus CFE (400-600 ηg of protein)
in a 50 µL reaction containing extraction buffer (see composition above). As a control,
plasmid DNA (12 µg) was mock treated in a reaction without extract. Reactions were
incubated at 30 or 37ºC for 1 hour and then dialyzed during 15 minutes to remove salts
by using MF-membranes filters (0.025 µm) (Millipore, Ireland). Failure to thoroughly
remove the growth media from the cells may result in the sample arcing during
electroporation at high fields strengths. Finally plasmid DNA was concentrated by using
Microcon YM-30 columns (Millipore, Bedford, USA) used as manufacturer indications
to a final concentration of 1.2 µg/µL and incubated at 65ºC during 15 minutes to
inactivate proteins.
The effect of plasmid size on transformation efficiency of recalcitrant strain B.
weihenstephanensis KBAB4 was tested. For this purpose pMAD ∆BC2216-17 plasmid
(approximately 12,200 bp) was replaced by plasmid pHT304 (approximately 6,500 bp)
and then subjected to methylation, dialysis, concentration and protein inactivation as
described above.
The effect of concentration and extraction techniques on transformation
efficiencies was tested in B. cereus ATCC 14579 (type strain). Thus, some samples
were extracted with phenol-chloroform as described previously (Maniatis et al., 1989),
concentrated by using Microcon YM-30 columns used as manufacturer indications to a
final concentration of 1.2 µg/µL, and finally dialyzed during 15 minutes to remove salts
by using MF-membranes filters (0.025 µm) (Millipore, Ireland).

Chapter 8
186
8.2.4. Transformation of B. cereus group strains
Two consecutive subcultures of B. cereus group strains were performed in Brain
Heart Infusion broth (BHI; Scharlau, Barcelona, Spain) at 30 or 37ºC (depending on the
temperature growth ability of the strain used) with shaking at 200 rpm. To carry out
transformation experiments cells were harvested during early exponential phase
(A600=0.3-0.5). Bacterial cell pellets obtained after centrifugation (at 4,000 rpm during
10 minutes in refrigeration) per triplicate were resuspended in cold polyethylene glycol
6000 (PEG 6000) 40% (Duchefa Biochemie, Haarlem, Netherlands).
Aliquots of 400 µL of bacterial suspension in PEG were pipetted in
electroporation cuvettes and supplemented with 10 to 20 µg of methylated plasmid
DNA prepared as described above. Settings for electroporation were 25 µF, 1,000 Ω and
2.5 KV.
Aditionally, a different transformation protocol was assessed for recalcitrant
strain B. weihenstephanensis KBAB4 by using an electroporation buffer (EP buffer)
composed of 0.5 mM KH2PO4-K2HPO4, 0.5 mM MgCl2 and 272 mM sucrose. For this
purpose non-treated pMAD ∆BC2216-17 plasmid (between 10 to 20 µg) was added to
400 µL of EP buffer. Transformation was performed by using the following
electroporation parameters: 25 µF, 400 Ω and 1.2 KV.
Immediately after electric pulses, bacteria were placed on ice and then
resuspended in 1 mL of SOC medium and incubated at 30 or 37ºC, depending on the
bacterial strain (psychrotrophic and mesophilic, respectively), at 200 rpm during 2
hours.
For selective growth of transformants, suspension of electroporated cells were
spread on LB agar plates supplemented with X-Gal (50 µg/mL) (Duchefa, Haarlem,
Netherlands) and with two different antibiotics separately, kanamycin sulfate from
Streptomyces kanamyceticus 100 mM (100 µg/mL) (Sigma-Aldrich, St. Louis, USA) or
erythromycin (5 µg/mL) (Duchefa, Haarlem, Netherlands). Plates were incubated at 30
or 37ºC depending on bacterial strains (psychrotrophic and mesophilic, respectively)
during several days. At regular intervals plates were examined to detect transformant
Chapter 8
187
colonies which were blue, kanamycin resistant (KmR) and erythromycin resistant
(EmR). Transformation efficiency (TE) was calculated by using the following
mathematical expression:
= ×
(1)
where cfu is the number of transformant colonies obtained, transformation volume
correspond with the sum of the volume of bacterial and plasmid suspension introduced
into electroporation cuvettes plus the volume of SOC medium used for recovering cell
purposes, and finally, plasmid DNA concentration is the concentration of plasmid DNA
added before electroporation.
8.2.5. DNA manipulation
Plasmid DNA was extracted from E. coli DH5α by a standard alkaline lysis
procedure using the Pure Yield plasmid Miniprep System (Promega, Charbonnières,
France) and the Plasmid Maxi kit procedure (Qiagen, Germantown, USA).
Chromosomal DNA was extracted from B. cereus group strains cells harvested in mid-
lag phase using the DNeasy Blood and Tissue kit (Qiagen, Germantown, USA).
Oligonucleotide primers (Table 2) were synthesized by Eurogentec (Seraing, Belgium).
PCR was performed in a GeneAmp PCR system 2400 thermal cycler (Perkin-Elmer,
Coutaboeuf, France). Amplified DNA fragments were purified using a PCR purification
kit (Roche) and separated on 0.7% agarose gels after digestion. Digested DNA
fragments were extracted from agarose gels with a centrifugal filter device (Montage
DNA gel extraction kit; Millipore, Molsheim, France). All constructions were
confirmed by DNA sequencing by Beckman Coulter Genomics, Essex, UK.
8.2.6. Gene disruption in B. cereus group strains using pMAD ∆2216-17
To assess the role of BC2216 and BC2217 genes on B. cereus group adaptation
at low temperatures a derivative pMAD vector was constructed (Brillard et al., in
preparation) (Figure 2) carrying the upstream region of BC2216 gene (Figure 1), a 1.5-
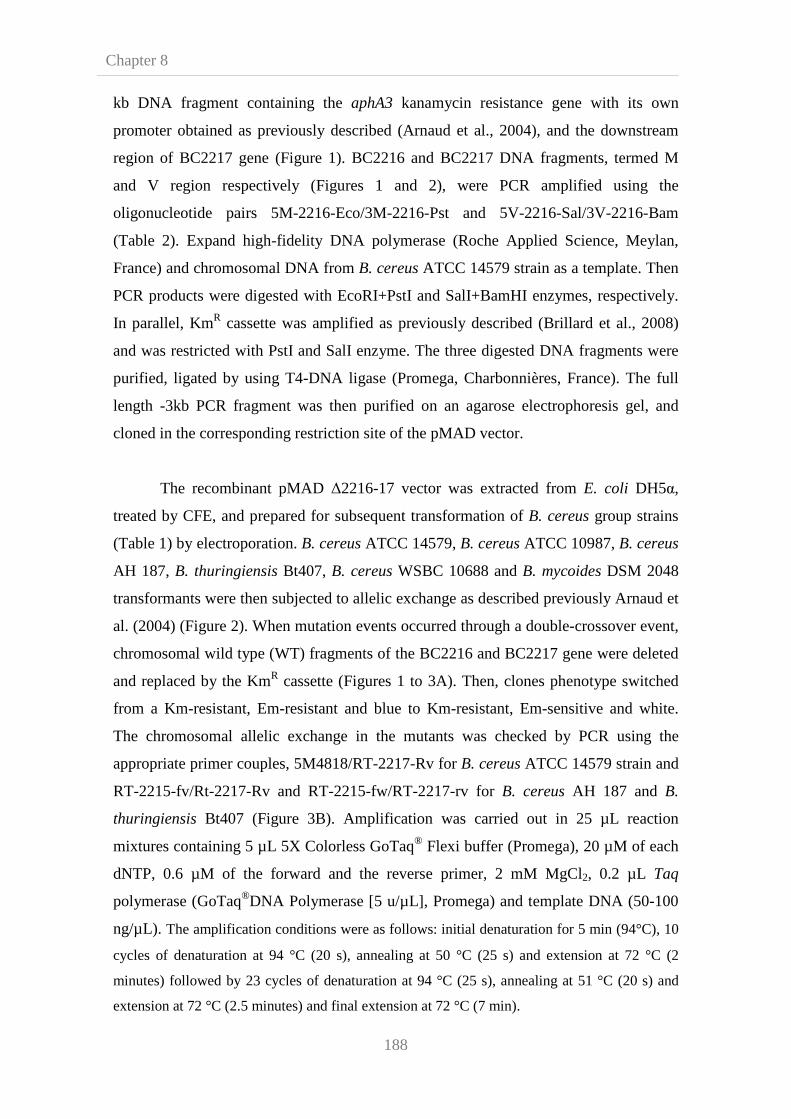
Chapter 8
188
kb DNA fragment containing the aphA3 kanamycin resistance gene with its own
promoter obtained as previously described (Arnaud et al., 2004), and the downstream
region of BC2217 gene (Figure 1). BC2216 and BC2217 DNA fragments, termed M
and V region respectively (Figures 1 and 2), were PCR amplified using the
oligonucleotide pairs 5M-2216-Eco/3M-2216-Pst and 5V-2216-Sal/3V-2216-Bam
(Table 2). Expand high-fidelity DNA polymerase (Roche Applied Science, Meylan,
France) and chromosomal DNA from B. cereus ATCC 14579 strain as a template. Then
PCR products were digested with EcoRI+PstI and SalI+BamHI enzymes, respectively.
In parallel, KmR cassette was amplified as previously described (Brillard et al., 2008)
and was restricted with PstI and SalI enzyme. The three digested DNA fragments were
purified, ligated by using T4-DNA ligase (Promega, Charbonnières, France). The full
length -3kb PCR fragment was then purified on an agarose electrophoresis gel, and
cloned in the corresponding restriction site of the pMAD vector.
The recombinant pMAD ∆2216-17 vector was extracted from E. coli DH5α,
treated by CFE, and prepared for subsequent transformation of B. cereus group strains
(Table 1) by electroporation. B. cereus ATCC 14579, B. cereus ATCC 10987, B. cereus
AH 187, B. thuringiensis Bt407, B. cereus WSBC 10688 and B. mycoides DSM 2048
transformants were then subjected to allelic exchange as described previously Arnaud et
al. (2004) (Figure 2). When mutation events occurred through a double-crossover event,
chromosomal wild type (WT) fragments of the BC2216 and BC2217 gene were deleted
and replaced by the KmR cassette (Figures 1 to 3A). Then, clones phenotype switched
from a Km-resistant, Em-resistant and blue to Km-resistant, Em-sensitive and white.
The chromosomal allelic exchange in the mutants was checked by PCR using the
appropriate primer couples, 5M4818/RT-2217-Rv for B. cereus ATCC 14579 strain and
RT-2215-fv/Rt-2217-Rv and RT-2215-fw/RT-2217-rv for B. cereus AH 187 and B.
thuringiensis Bt407 (Figure 3B). Amplification was carried out in 25 µL reaction
mixtures containing 5 µL 5X Colorless GoTaq® Flexi buffer (Promega), 20 µM of each
dNTP, 0.6 µM of the forward and the reverse primer, 2 mM MgCl2, 0.2 µL Taq
polymerase (GoTaq®DNA Polymerase [5 u/µL], Promega) and template DNA (50-100
ng/µL). The amplification conditions were as follows: initial denaturation for 5 min (94°C), 10
cycles of denaturation at 94 °C (20 s), annealing at 50 °C (25 s) and extension at 72 °C (2
minutes) followed by 23 cycles of denaturation at 94 °C (25 s), annealing at 51 °C (20 s) and
extension at 72 °C (2.5 minutes) and final extension at 72 °C (7 min).
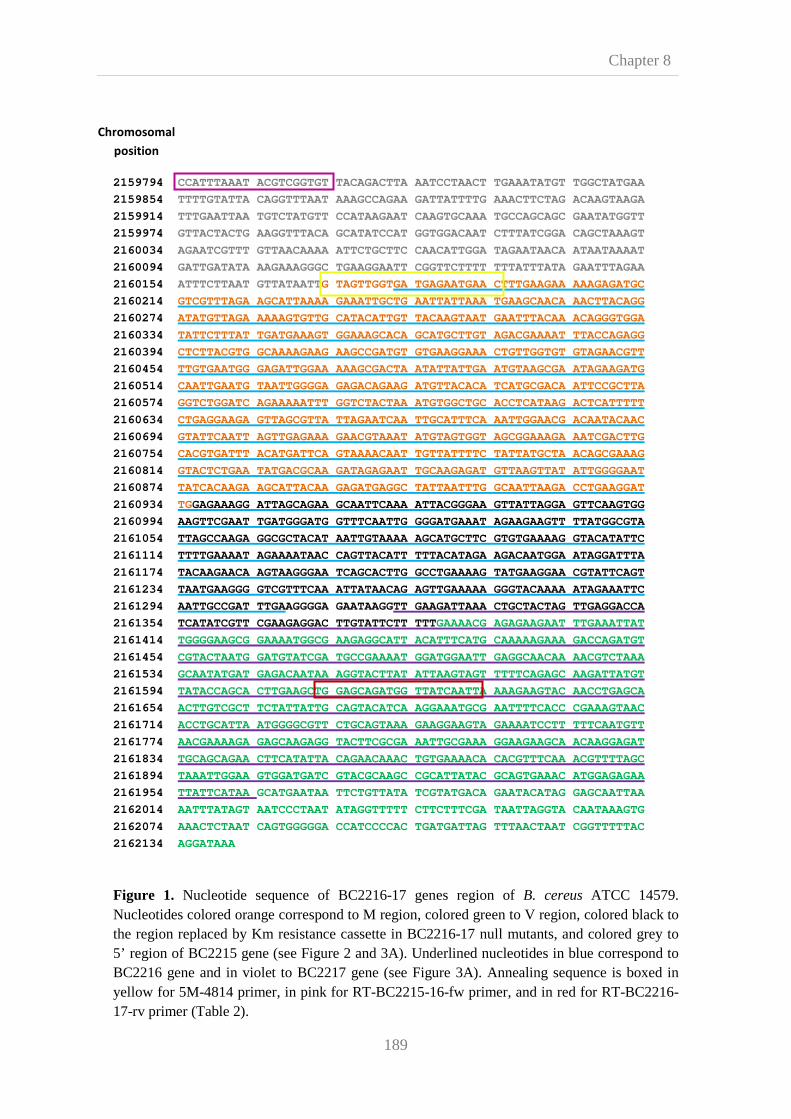
Chapter 8
189
2159794 CCATTTAAAT ACGTCGGTGT TACAGACTTA AATCCTAACT TGAAATATGT TGGCTATGAA
2159854 TTTTGTATTA CAGGTTTAAT AAAGCCAGAA GATTATTTTG AAACTTCTAG ACAAGTAAGA
2159914 TTTGAATTAA TGTCTATGTT CCATAAGAAT CAAGTGCAAA TGCCAGCAGC GAATATGGTT
2159974 GTTACTACTG AAGGTTTACA GCATATCCAT GGTGGACAAT CTTTATCGGA CAGCTAAAGT
2160034 AGAATCGTTT GTTAACAAAA ATTCTGCTTC CAACATTGGA TAGAATAACA ATAATAAAAT
2160094 GATTGATATA AAGAAAGGGC TGAAGGAATT CGGTTCTTTT TTTATTTATA GAATTTAGAA
2160154 ATTTCTTAAT GTTATAATTG TAGTTGGTGA TGAGAATGAA CTTTGAAGAA AAAGAGATGC
2160214 GTCGTTTAGA AGCATTAAAA GAAATTGCTG AATTATTAAA TGAAGCAACA AACTTACAGG
2160274 ATATGTTAGA AAAAGTGTTG CATACATTGT TACAAGTAAT GAATTTACAA ACAGGGTGGA
2160334 TATTCTTTAT TGATGAAAGT GGAAAGCACA GCATGCTTGT AGACGAAAAT TTACCAGAGG
2160394 CTCTTACGTG GCAAAAGAAG AAGCCGATGT GTGAAGGAAA CTGTTGGTGT GTAGAACGTT
2160454 TTGTGAATGG GAGATTGGAA AAAGCGACTA ATATTATTGA ATGTAAGCGA ATAGAAGATG
2160514 CAATTGAATG TAATTGGGGA GAGACAGAAG ATGTTACACA TCATGCGACA ATTCCGCTTA
2160574 GGTCTGGATC AGAAAAATTT GGTCTACTAA ATGTGGCTGC ACCTCATAAG ACTCATTTTT
2160634 CTGAGGAAGA GTTAGCGTTA TTAGAATCAA TTGCATTTCA AATTGGAACG ACAATACAAC
2160694 GTATTCAATT AGTTGAGAAA GAACGTAAAT ATGTAGTGGT AGCGGAAAGA AATCGACTTG
2160754 CACGTGATTT ACATGATTCA GTAAAACAAT TGTTATTTTC TATTATGCTA ACAGCGAAAG
2160814 GTACTCTGAA TATGACGCAA GATAGAGAAT TGCAAGAGAT GTTAAGTTAT ATTGGGGAAT
2160874 TATCACAAGA AGCATTACAA GAGATGAGGC TATTAATTTG GCAATTAAGA CCTGAAGGAT
2160934 TGGAGAAAGG ATTAGCAGAA GCAATTCAAA ATTACGGGAA GTTATTAGGA GTTCAAGTGG
2160994 AAGTTCGAAT TGATGGGATG GTTTCAATTG GGGATGAAAT AGAAGAAGTT TTATGGCGTA
2161054 TTAGCCAAGA GGCGCTACAT AATTGTAAAA AGCATGCTTC GTGTGAAAAG GTACATATTC
2161114 TTTTGAAAAT AGAAAATAAC CAGTTACATT TTTACATAGA AGACAATGGA ATAGGATTTA
2161174 TACAAGAACA AGTAAGGGAA TCAGCACTTG GCCTGAAAAG TATGAAGGAA CGTATTCAGT
2161234 TAATGAAGGG GTCGTTTCAA ATTATAACAG AGTTGAAAAA GGGTACAAAA ATAGAAATTC
2161294 AATTGCCGAT TTGAAGGGGA GAATAAGGTT GAAGATTAAA CTGCTACTAG TTGAGGACCA
2161354 TCATATCGTT CGAAGAGGAC TTGTATTCTT TTTGAAAACG AGAGAAGAAT TTGAAATTAT
2161414 TGGGGAAGCG GAAAATGGCG AAGAGGCATT ACATTTCATG CAAAAAGAAA GACCAGATGT
2161454 CGTACTAATG GATGTATCGA TGCCGAAAAT GGATGGAATT GAGGCAACAA AACGTCTAAA
2161534 GCAATATGAT GAGACAATAA AGGTACTTAT ATTAAGTAGT TTTTCAGAGC AAGATTATGT
2161594 TATACCAGCA CTTGAAGCTG GAGCAGATGG TTATCAATTA AAAGAAGTAC AACCTGAGCA
2161654 ACTTGTCGCT TCTATTATTG CAGTACATCA AGGAAATGCG AATTTTCACC CGAAAGTAAC
2161714 ACCTGCATTA ATGGGGCGTT CTGCAGTAAA GAAGGAAGTA GAAAATCCTT TTTCAATGTT
2161774 AACGAAAAGA GAGCAAGAGG TACTTCGCGA AATTGCGAAA GGAAGAAGCA ACAAGGAGAT
2161834 TGCAGCAGAA CTTCATATTA CAGAACAAAC TGTGAAAACA CACGTTTCAA ACGTTTTAGC
2161894 TAAATTGGAA GTGGATGATC GTACGCAAGC CGCATTATAC GCAGTGAAAC ATGGAGAGAA
2161954 TTATTCATAA GCATGAATAA TTCTGTTATA TCGTATGACA GAATACATAG GAGCAATTAA
2162014 AATTTATAGT AATCCCTAAT ATAGGTTTTT CTTCTTTCGA TAATTAGGTA CAATAAAGTG
2162074 AAACTCTAAT CAGTGGGGGA CCATCCCCAC TGATGATTAG TTTAACTAAT CGGTTTTTAC
2162134 AGGATAAA
Figure 1. Nucleotide sequence of BC2216-17 genes region of B. cereus ATCC 14579. Nucleotides colored orange correspond to M region, colored green to V region, colored black to the region replaced by Km resistance cassette in BC2216-17 null mutants, and colored grey to 5’ region of BC2215 gene (see Figure 2 and 3A). Underlined nucleotides in blue correspond to BC2216 gene and in violet to BC2217 gene (see Figure 3A). Annealing sequence is boxed in yellow for 5M-4814 primer, in pink for RT-BC2215-16-fw primer, and in red for RT-BC2216-17-rv primer (Table 2).
Chromosomal
position

Chapter 8
190
8.2.7. Phenotypic characterization of knockout mutants
To assess BC2216 and BC2217 gene disruption effect on mutant phenotype, B.
cereus ATCC 14579 and B. thurigiensis Bt407 WT and null mutant colonies were
grown at 37, 30, and 12ºC. B. thurigiensis Bt407 WT and null mutant colonies were
also grown at 15ºC. The temperature of 12ºC was used instead of 10ºC to avoid cell
flocculation (Brillard et al., 2010). B. cereus AH 187 WT and null mutants colonies
were incubated at 37, 30 and 15ºC as this microorganism was not found to be able to
growth at temperatures below 15ºC (Gunebretière et al., 2008). Experiments performed
at 37, 30, 15 and 12ºC were carried out by using an automated turbidometer, the
Bioscreen C microbiology reader (Labsystems, Uxbridge, United Kindom), in 100-well
sterile microplates.
Volumes of 40 µL of overnight cultures at 30ºC were inoculated into 4 mL of
fresh LB medium and incubated at 30ºC with shaking until an optical density (OD) at
600 nm (OD600) of 0.8 was obtained. To perform turbidometric experiments, 12 µL of
these cultures were inoculated in 300 µL of fresh LB to reach a concentration of
approximately104 CFU per well (depending on experiments). Three replicate wells of
the microplate were filled with this dilutions of inoculated medium to a final volume of
312 µL per well. A negative control consisting of uninoculated LB was prepared. The
cultures were incubated with vigorous constant shaking, and the OD was measured at
15-min intervals at 37 and 30ºC and at 30-min intervals at 12 and 15ºC. At least three
experiments of each growth condition were performed.
8.3. Results and discussion
8.3.1. Effect of in vitro plasmid methylation on the efficiency of B. cereus
group strains transformation
In vitro methylation of pMAD ∆BC2216-17 plasmid with cell extract of the
corresponding recipient strains of B. cereus group did not result in an improvement of
their transformation efficiency (Table 3). Unmethylated plasmids transformation
efficiency increased between log 1 and log 4 transformants per µg plasmid DNA in
comparison with treated samples for all the strains tested except for B. cereus ATCC
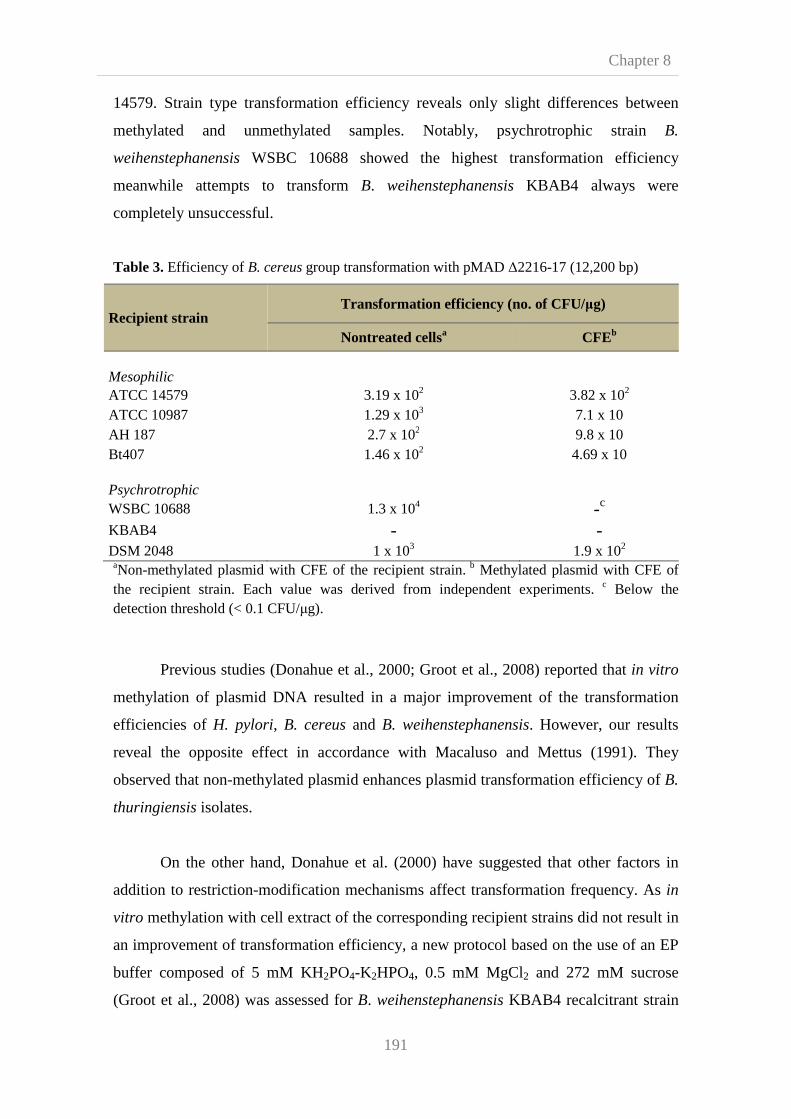
Chapter 8
191
14579. Strain type transformation efficiency reveals only slight differences between
methylated and unmethylated samples. Notably, psychrotrophic strain B.
weihenstephanensis WSBC 10688 showed the highest transformation efficiency
meanwhile attempts to transform B. weihenstephanensis KBAB4 always were
completely unsuccessful.
Table 3. Efficiency of B. cereus group transformation with pMAD ∆2216-17 (12,200 bp)
Recipient strain Transformation efficiency (no. of CFU/µg)
Nontreated cellsa CFEb
Mesophilic
ATCC 14579 3.19 x 10² 3.82 x 10² ATCC 10987 1.29 x 10³ 7.1 x 10 AH 187 2.7 x 10² 9.8 x 10 Bt407 1.46 x 10² 4.69 x 10 Psychrotrophic
WSBC 10688 1.3 x 10⁴ -c
KBAB4 - - DSM 2048 1 x 10³ 1.9 x 10² aNon-methylated plasmid with CFE of the recipient strain. b Methylated plasmid with CFE of the recipient strain. Each value was derived from independent experiments. c Below the detection threshold (< 0.1 CFU/µg).
Previous studies (Donahue et al., 2000; Groot et al., 2008) reported that in vitro
methylation of plasmid DNA resulted in a major improvement of the transformation
efficiencies of H. pylori, B. cereus and B. weihenstephanensis. However, our results
reveal the opposite effect in accordance with Macaluso and Mettus (1991). They
observed that non-methylated plasmid enhances plasmid transformation efficiency of B.
thuringiensis isolates.
On the other hand, Donahue et al. (2000) have suggested that other factors in
addition to restriction-modification mechanisms affect transformation frequency. As in
vitro methylation with cell extract of the corresponding recipient strains did not result in
an improvement of transformation efficiency, a new protocol based on the use of an EP
buffer composed of 5 mM KH2PO4-K2HPO4, 0.5 mM MgCl2 and 272 mM sucrose
(Groot et al., 2008) was assessed for B. weihenstephanensis KBAB4 recalcitrant strain
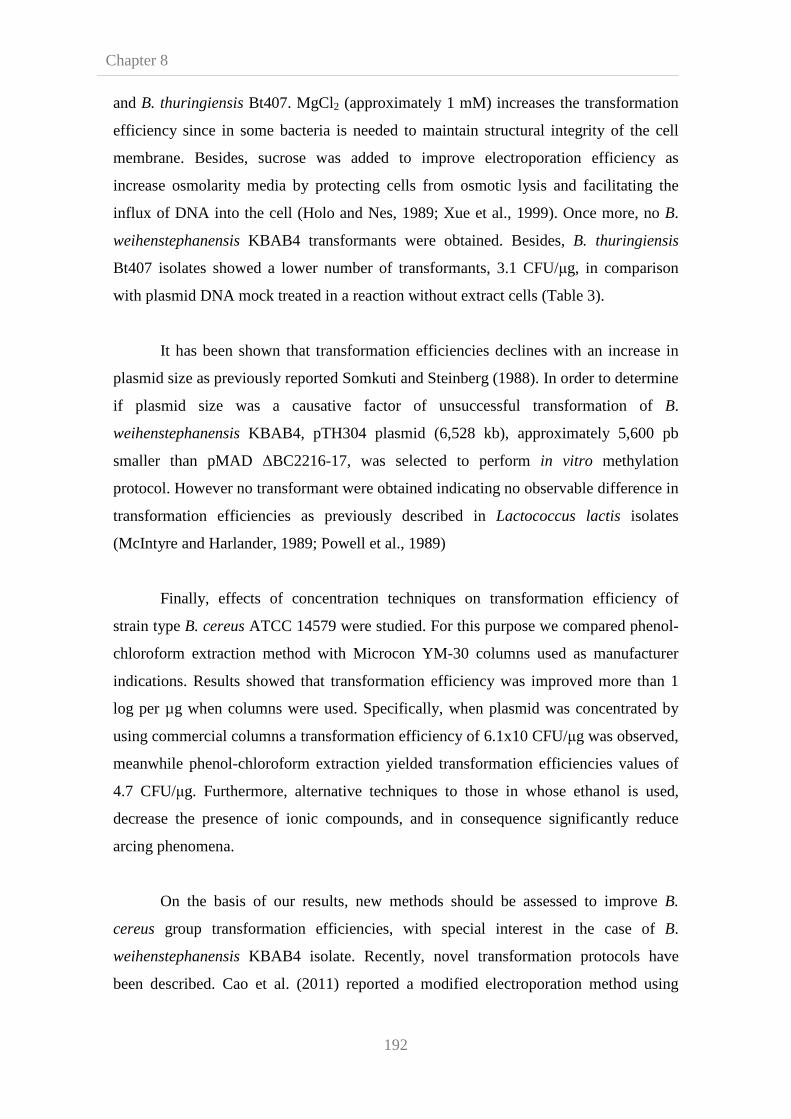
Chapter 8
192
and B. thuringiensis Bt407. MgCl2 (approximately 1 mM) increases the transformation
efficiency since in some bacteria is needed to maintain structural integrity of the cell
membrane. Besides, sucrose was added to improve electroporation efficiency as
increase osmolarity media by protecting cells from osmotic lysis and facilitating the
influx of DNA into the cell (Holo and Nes, 1989; Xue et al., 1999). Once more, no B.
weihenstephanensis KBAB4 transformants were obtained. Besides, B. thuringiensis
Bt407 isolates showed a lower number of transformants, 3.1 CFU/µg, in comparison
with plasmid DNA mock treated in a reaction without extract cells (Table 3).
It has been shown that transformation efficiencies declines with an increase in
plasmid size as previously reported Somkuti and Steinberg (1988). In order to determine
if plasmid size was a causative factor of unsuccessful transformation of B.
weihenstephanensis KBAB4, pTH304 plasmid (6,528 kb), approximately 5,600 pb
smaller than pMAD ∆BC2216-17, was selected to perform in vitro methylation
protocol. However no transformant were obtained indicating no observable difference in
transformation efficiencies as previously described in Lactococcus lactis isolates
(McIntyre and Harlander, 1989; Powell et al., 1989)
Finally, effects of concentration techniques on transformation efficiency of
strain type B. cereus ATCC 14579 were studied. For this purpose we compared phenol-
chloroform extraction method with Microcon YM-30 columns used as manufacturer
indications. Results showed that transformation efficiency was improved more than 1
log per µg when columns were used. Specifically, when plasmid was concentrated by
using commercial columns a transformation efficiency of 6.1x10 CFU/µg was observed,
meanwhile phenol-chloroform extraction yielded transformation efficiencies values of
4.7 CFU/µg. Furthermore, alternative techniques to those in whose ethanol is used,
decrease the presence of ionic compounds, and in consequence significantly reduce
arcing phenomena.
On the basis of our results, new methods should be assessed to improve B.
cereus group transformation efficiencies, with special interest in the case of B.
weihenstephanensis KBAB4 isolate. Recently, novel transformation protocols have
been described. Cao et al. (2011) reported a modified electroporation method using

Chapter 8
193
trehalose for the transformation of B. subtilis which was found to increase
transformation efficiency nearly 2,000-fold compared with the usual method. Likewise,
Mironczuk et al. (2008) revealed that expressing the B. subtilis ComK protein using an
IPTG-inducible system in B. cereus ATCC 14579, allow cells grown in minimal
medium displaying natural competence, as either genomic DNA or plasmid DNA was
shown to be taken up by the cells and integrated into the genome or stably maintained
respectively. Besides, Zhang et al. (2011) described a new method to enhance
transformation of Bacillus amyloliquefaciens strains combining cell weakening by
adding glycine and DL-threonine and cell-membrane fluidity disturbing by
supplementing Tween 80.
8.3.2. Construction and characterization of BC2216 and BC2217 knockout
mutants
Expression of BC2216 and BC2217 genes of the two-component signal
transduction system was found to be enhanced at low temperature (Brillard et al., in
preparation). To investigate the contribution of both genes to B. cereus group cold
resistance, mutagenesis experiments were performed. For this purpose, transformed
strains (Table 3) with pMAD ∆2216-17 (Table 2) were subjected to selective growth in
plates added with X-Gal and antibiotics. Isogenic mutants of the BC2216 and BC2217
genes of B. cereus ATCC 14579 (∆BC2216-17-M1-ATCC14579 and ∆BC2216-17-M2-
ATCC14579), B. cereus AH 187 (∆BC2216-17-M1-AH187) and B. thuringiensis Bt407
(∆BC2216-17-M1-Bt407 and ∆BC2216-17-M2-Bt407)) were obtained. Through
insertional inactivation, via double-crossover integration (Figure 2), mutation events
occurred switching clones phenotype from a Km-resistant, Em-resistant and blue to
Km-resistant, Em-sensitive and white. This variation in color and antibiotic resistance
allowed identification and isolation of null mutant bacteria. PCR was performed to
confirm that selected clones were real mutants (Figure 3B). Primers used are detailed in
Table 2 and depicted in Figure 1.

Chapter 8
194
Figure 2. Schematic diagram showing how BC2216-17 null mutants were obtained by allelic exchange. Target fragments, M and V region (see figure 1), and Km resistance cassette were amplified by PCR and cloned in pMAD. B. cereus group strains were transformed with pMAD ∆BC2216-17. Then, transformed strains (see Table 3) were subjected to mutation by double cross-over event in which recombination occurs twice. During cell division, homologous recombination (single recombinant event) occurs first (1) at one place, e.g. 5’region, and it leads to the insertion of a mutated copy, in addition to the wild copy, on the chromosome. In the following cell division a second homologous recombination (2) occurs in cointegrates, e.g. 3’ region, resulting in gene disruption by Km resistance cassette insertion and excision of pMAD plasmid containing deleted region of target genes. During bacterial multiplication at high temperature, the plasmid is lost (diluted in the population) because of its thermosensitive origin of replication. BC2216 and BC2217 correspond to BC2216 and BC2217 genes (see Figures 1 and 3A), Km correspond to Km resistance gene, V and M correspond to V and M regions (see figure 1) and DR corresponded to deleted region of BC2216 and BC2217 genes (see figure 1). Cross- over events are depicted by orange arrows and lines.
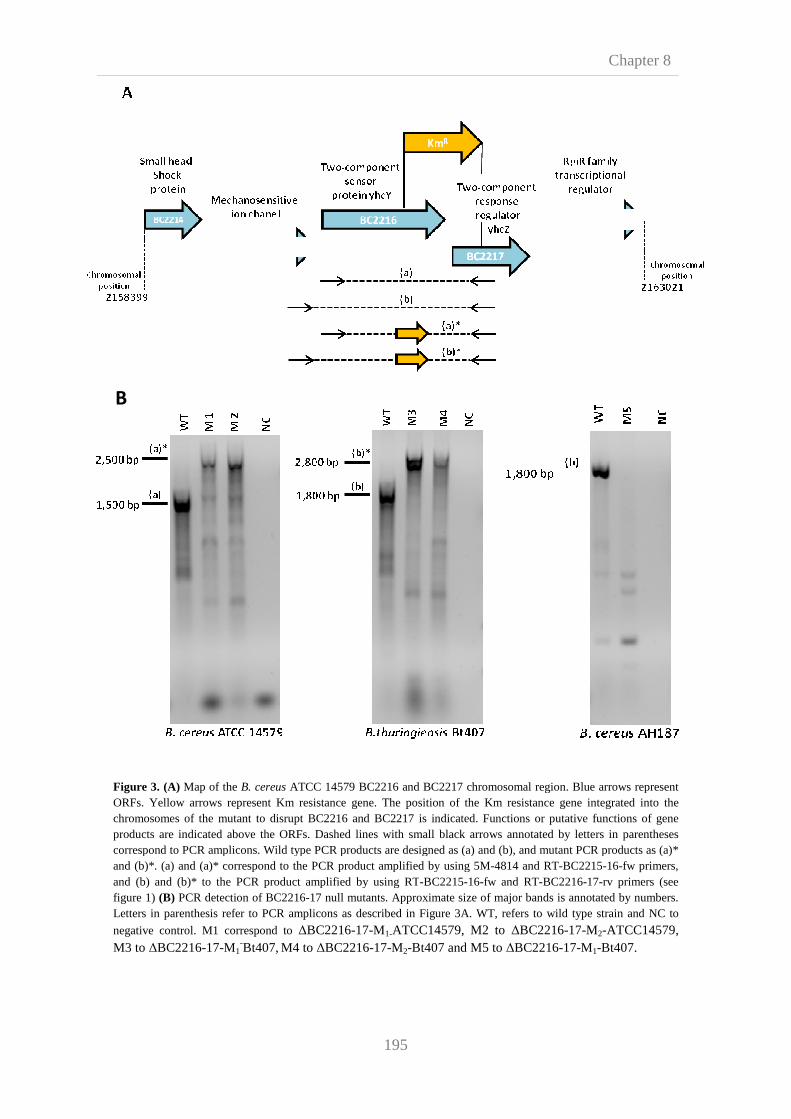
Figure 3. (A) Map of the B. cereus ORFs. Yellow arrows represent Km resistance gene. The position of the Km resistance gene integrated into the chromosomes of the mutant to disrupt BC2216 and BC2217 is indicated. Functiproducts are indicated above the ORFs. Dashed lines with small black arrows annotated by letters in parentheses correspond to PCR amplicons. Wild type PCR products are designed as (a) and (b), and mutant PCR products as (aand (b)*. (a) and (a)* correspond to the PCR product amplified by using 5Mand (b) and (b)* to the PCR product amplified by using RTfigure 1) (B) PCR detection of BC2216Letters in parenthesis refer to PCR amplicons as described in Figure 3A. WT, refers to wild type strain and NC to
negative control. M1 correspond to
M3 to ∆BC2216-17-M1-Bt407, M4 to
B
195
ATCC 14579 BC2216 and BC2217 chromosomal region. Blue arrows represent ORFs. Yellow arrows represent Km resistance gene. The position of the Km resistance gene integrated into the chromosomes of the mutant to disrupt BC2216 and BC2217 is indicated. Functions or putative functions of gene products are indicated above the ORFs. Dashed lines with small black arrows annotated by letters in parentheses correspond to PCR amplicons. Wild type PCR products are designed as (a) and (b), and mutant PCR products as (aand (b)*. (a) and (a)* correspond to the PCR product amplified by using 5M-4814 and RT-BC2215and (b) and (b)* to the PCR product amplified by using RT-BC2215-16-fw and RT-BC2216
PCR detection of BC2216-17 null mutants. Approximate size of major bands is annotated by numbers. to PCR amplicons as described in Figure 3A. WT, refers to wild type strain and NC to
negative control. M1 correspond to ∆BC2216-17-M1-ATCC14579, M2 to ∆BC2216-17M4 to ∆BC2216-17-M2-Bt407 and M5 to ∆BC2216-17
Chapter 8
ATCC 14579 BC2216 and BC2217 chromosomal region. Blue arrows represent ORFs. Yellow arrows represent Km resistance gene. The position of the Km resistance gene integrated into the
ons or putative functions of gene products are indicated above the ORFs. Dashed lines with small black arrows annotated by letters in parentheses correspond to PCR amplicons. Wild type PCR products are designed as (a) and (b), and mutant PCR products as (a)*
BC2215-16-fw primers, BC2216-17-rv primers (see
17 null mutants. Approximate size of major bands is annotated by numbers. to PCR amplicons as described in Figure 3A. WT, refers to wild type strain and NC to
17-M2-ATCC14579, 17-M1-Bt407.

Chapter 8
196
Agarose gel electrophoresis revealed the existence of longer PCR amplified
fragments for two B. cereus ATCC 14579 isolates and two B. thuringiensis Bt407
isolates that displayed a KmR, EmS and white phenotype, confirming that they were
genuine mutants (Figure 3B). However, PCR performed on DNA extracted from a B.
cereus AH 187 displaying a KmR, EmS and white phenotype (a probable mutant) did not
show an amplified DNA fragment of the expected size (2,800 bp). In fact, no
amplification was observed, despite a correct amplification obtained by PCR performed
on the wild type (WT) strain (Figure 3B). Because of the KmR phenotype, we could rule
out the possibility that this isolate was a WT isolate. Although we could not rule out that
the Km cassette was introduced elsewhere in the genome of this isolate, the fact that no
amplification was observed (neither "b" or "b*", figure 3A) suggested a problem with
the PCR conditions or with the quality of the DNA of this isolate. Despite several
attempts to optimize PCR conditions, by using different primers, varying MgCl2
concentration and testing various amplification conditions, no amplification could be
obtained. Therefore, we decided to consider this isolate as a probable mutant and
characterize its phenotype during growth at various temperatures.
8.3.3. Phenotypic characterization of the BC2216 and BC2217 knockout
mutants
B. cereus ATCC 14579, B. cereus AH 187 and B. thuringiensis Bt407 knockout
and WT strains were analyzed for the ability to grow at low temperatures, 12 or 15ºC, in
comparison with growth at 30 and 37ºC.
At 12ºC, both B. cereus ATCC 14579 knockout strains showed a slight but
highly reproducible delay on growth in comparison with WT strain (Figure 4C).
Besides, at 30 and 37ºC, no significance differences were observed (Figures 4B and
4A).This results are in accordance with previous studies (Brillard et al., on preparation)
in which B. cereus ATCC 14579 BC2216-17 null mutants were unable to grow at 10°C
after 21 days whilst WT clones grown and reached stationary phase in 7 days. These
results suggest that TCS mutation is responsible of impaired cold growth.

Figure 4. Growth of B. cereusmutants, ∆BC2216-17-M1-ATCC1457937ºC (B) at 30ºC and (C) 12ºC.
B
A
C
197
B. cereus ATCC 14579 wild type (blue) and BC2216ATCC14579 (red) and ∆BC2216-17-M2-ATCC14579
12ºC.
Chapter 8
BC2216-17 knockout ATCC14579 (green) (A) at
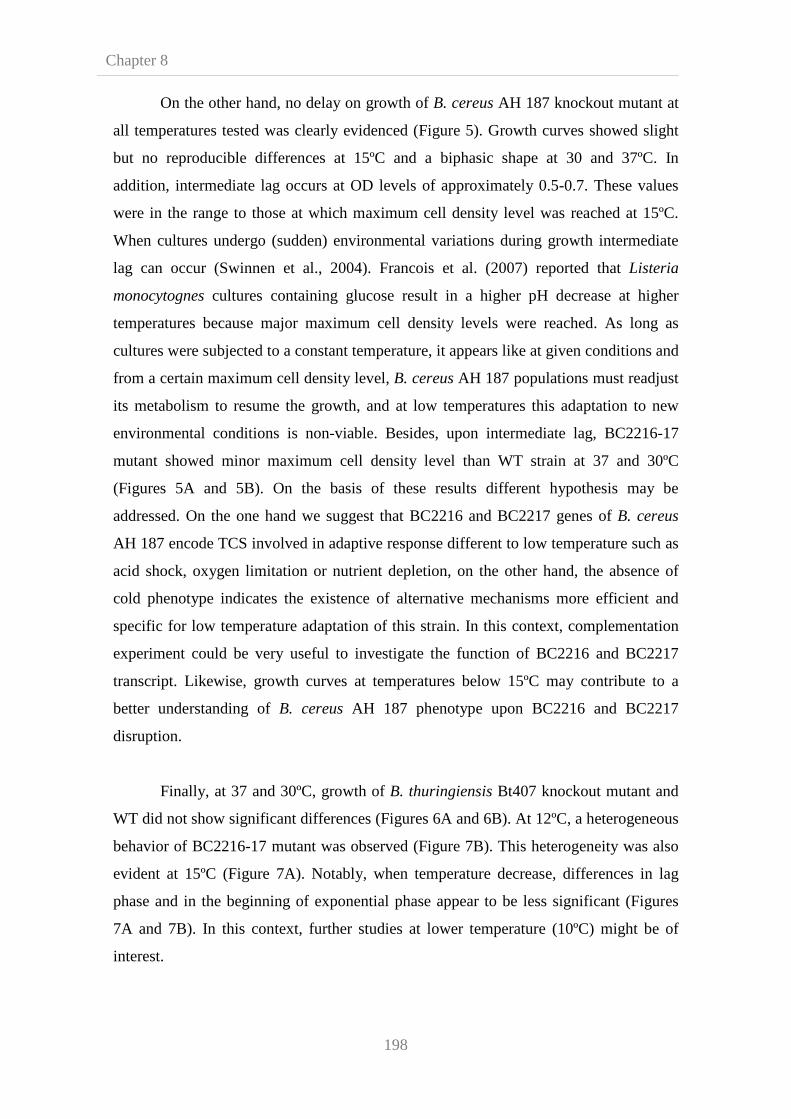
Chapter 8
198
On the other hand, no delay on growth of B. cereus AH 187 knockout mutant at
all temperatures tested was clearly evidenced (Figure 5). Growth curves showed slight
but no reproducible differences at 15ºC and a biphasic shape at 30 and 37ºC. In
addition, intermediate lag occurs at OD levels of approximately 0.5-0.7. These values
were in the range to those at which maximum cell density level was reached at 15ºC.
When cultures undergo (sudden) environmental variations during growth intermediate
lag can occur (Swinnen et al., 2004). Francois et al. (2007) reported that Listeria
monocytognes cultures containing glucose result in a higher pH decrease at higher
temperatures because major maximum cell density levels were reached. As long as
cultures were subjected to a constant temperature, it appears like at given conditions and
from a certain maximum cell density level, B. cereus AH 187 populations must readjust
its metabolism to resume the growth, and at low temperatures this adaptation to new
environmental conditions is non-viable. Besides, upon intermediate lag, BC2216-17
mutant showed minor maximum cell density level than WT strain at 37 and 30ºC
(Figures 5A and 5B). On the basis of these results different hypothesis may be
addressed. On the one hand we suggest that BC2216 and BC2217 genes of B. cereus
AH 187 encode TCS involved in adaptive response different to low temperature such as
acid shock, oxygen limitation or nutrient depletion, on the other hand, the absence of
cold phenotype indicates the existence of alternative mechanisms more efficient and
specific for low temperature adaptation of this strain. In this context, complementation
experiment could be very useful to investigate the function of BC2216 and BC2217
transcript. Likewise, growth curves at temperatures below 15ºC may contribute to a
better understanding of B. cereus AH 187 phenotype upon BC2216 and BC2217
disruption.
Finally, at 37 and 30ºC, growth of B. thuringiensis Bt407 knockout mutant and
WT did not show significant differences (Figures 6A and 6B). At 12ºC, a heterogeneous
behavior of BC2216-17 mutant was observed (Figure 7B). This heterogeneity was also
evident at 15ºC (Figure 7A). Notably, when temperature decrease, differences in lag
phase and in the beginning of exponential phase appear to be less significant (Figures
7A and 7B). In this context, further studies at lower temperature (10ºC) might be of
interest.

Figure 5. Growth of B. cereus∆BC2216-17-M1-AH187 (red)
B
A
C
199
B. cereus AH 187 wild type (blue) and BC2216-17 knockout mutants, (red) (A) at 37ºC (B) at 30ºC.and (C) 15ºC.
Chapter 8
17 knockout mutants,

Chapter 8
Figure 6. Growth of B. thuringiensis∆BC2216-17-M1-Bt407(red) and
A
B
200
B. thuringiensis Bt407 wild type (blue) and BC2216-17 knockout mutants, (red) and ∆BC2216-17-M2-Bt407 (green) (A) at 37ºC and
17 knockout mutants, at 37ºC and (B) at 30ºC.
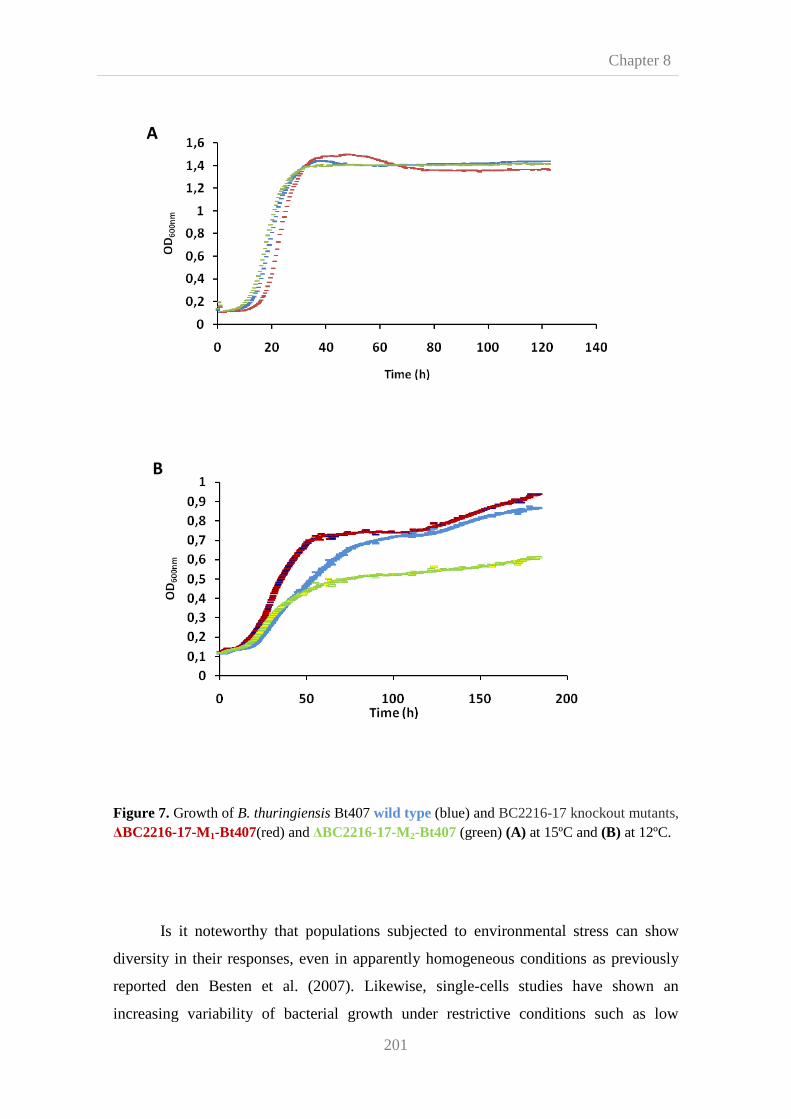
Figure 7. Growth of B. thuringiensis∆BC2216-17-M1-Bt407(red) and
Is it noteworthy that populations subjected to environmental stress can show
diversity in their responses, even in apparently homogeneous conditions as previously
reported den Besten et al. (2007
increasing variability of bacterial growth under restrictive conditions such as low
A
B
201
B. thuringiensis Bt407 wild type (blue) and BC2216-17 knockout mutants, (red) and ∆BC2216-17-M2-Bt407 (green) (A) at 15ºC and
Is it noteworthy that populations subjected to environmental stress can show
diversity in their responses, even in apparently homogeneous conditions as previously
n et al. (2007). Likewise, single-cells studies have shown an
increasing variability of bacterial growth under restrictive conditions such as low
Chapter 8
17 knockout mutants, at 15ºC and (B) at 12ºC.
Is it noteworthy that populations subjected to environmental stress can show
diversity in their responses, even in apparently homogeneous conditions as previously
cells studies have shown an
increasing variability of bacterial growth under restrictive conditions such as low
Chapter 8
202
temperatures. Indeed. den Besten et al. (2010) have reported that low temperatures
induced heterogeneity in growth of B. cereus populations, possibly due to the loss of
membrane integrity of individual cells.
Besides, lag phase is affected by current environment but also by previous
conditions. Thus, lag phase duration is readily affected by previous conditions such as
temperature and pH causing variability (Francois et al., 2007). Although in this study
previous and current conditions were tightly controlled, cell physiological states and
individual genetic makeup are a diversity source during bacterial growth (Buchanan and
Cygnarowicz, 1990; Muñoz-Cuevas et al., 2010).
On the other hand, turbidity measures follows Beer’s law, in consequence, valid
data are obtained at high cells density (between 106 and 107.5 CFU/mL), moment in
which turbidity is proportional to cell concentration. Furthermore, the range of
proportionality depends on shape and size of the bacteria, which can be affected by
environmental conditions (Métris et al., 2003). den Besten et al.(2010) have reported
that B. cereus colonies at 12ºC showed variance of size. Therefore, at low temperature
indirect measurements can lead inaccurate results which can be easily confused with
heterogeneous growth performance.
Results of this preliminary approach reveal that cold phenotype varies among
BC2216-17 knockout mutant tested. As long as B. cereus AH 187 null mutant did not
show impaired growth at low temperatures, growth curves of B. cereus ATCC 14759
and B. thuringiensis Bt407 mutants revealed significant differences with the WT strain.
However, only B. cereus ATCC 14759 knockout strains showed a clear and reliable
delay on growth at 12ºC. The lack of a homogeneous cold phenotype among strains
tested and the certain that TCS is found in these species and in most of the B. cereus
group members, suggest that TCS participation during growth at low temperature may
be restricted to a limited number of strains. Anyway, we have tested the effect of
BC2216 and BC2217 deletion just in three strains, so before drawing a clear conclusion,
similar experiments should be repeated on various strains, including psychrotrophic
bacteria, and determining growth kinetic parameters.

Conclusion summary
203
CHAPTER 9
Conclusion summary
1098765432
203

Conclusion summary
204
10
8 7 6 5 4 3 2

Conclusion summary
205
This chapter provides a detailed list of conclusions of all the research topics addressed
in this thesis:
• Ready to eat vegetable substrates (courgette puree and mixed vegetables puree)
tested did not have a clear trend on heat resistance of Bacillus cereus at the
temperatures tested (from 90 to 105ºC). Survivor curves that presented tailing
were better described by non linear models (Weibulls’ and Geeraerds’).
• At 30ºC, heat-treated B. cereus efficiently adapted to oxygen limitation and to
anaerobiosis without significantly affecting biomass production after 24 hours of
incubation, either in an anaerobic environment or packaged in containers of
laminated aluminium oxide coated PET (10-3 cm3/m2/24h).
• Combination of lysozime and nisin at the combinations tested was found to be
the most effective preservation method for liquid egg. The effect of both
antimicrobials was shown to increase at the lower temperature tested (16ºC).
• Normal and Weibull distributions were ranked as the ones that best described
lag phase distribution in experiments performed at 25ºC and 16ºC in presence of
both antimicrobials combined. At 25ºC, stochastic predictions observed in egg
were close to the actual data, which indicates that probabilistic predictions can
be considered as an effective indication to establish the level of risk associated
to liquid egg, although performing tests in real conditions is still necessary.
• A dynamic model has been obtained to describe the effect of water activity and
temperature shifts on growth of B. weihestephanensis. Growth was correctly
predicted in broth and creamed pasta (rich substrates), whereas significant
differences were observed between predictions and observations in a poor
nutrient substrate, carrot soup. This model can be used to predict growth of B.
weihenstephanensis in dynamic conditions, which can be useful for HACCP and
microbial risk assessment purposes.
• Viability studies of acid stress showed that B. cereus CECT 148 and B.
weihenstephanensis KBAB4 growth was readily affected in brain heart infusion

Conclusion summary
206
broth acidified at pH values of 3.0, 3.4, 3.8, 4.2, 4.6 and 5.0, showing greater
effect at the lower pHs. Meanwhile B. cereus was unable to grow at pH 3.4, B.
weihenstephanensis could grow at the pH level and showed significantly higher
growth at all the pH values tested. Cellular viability of both species tested was
found to decrease with lower pH values and longer exposure times to acid stress.
• Flow citometry (FCM) studies using as fluorescent labelling propidium iodide
and cFDA identified damaged B. cereus and B. weihenstephanensis vegetative
cells by exposure to acid, although they did not show significant differences
between both microorganisms. Results showed that this technique can be used to
successfully study their physiological response.
• The assessment of major phylogenetic groups (I-VII) affiliation for practical
applications in heat processing showed that B. cereus CECT 131, CECT 148,
CECT 193, CECT 4014 and CECT 4094 strains belong to group (IV) on the
basis of panC gene homologies studies. Thermal inactivation assays revealed
variability in spore heat resistance within these group IV strains indicating the
needed of further studies to state the feasibility of this classification for practical
application in food processing.
• The identification of B. cereus group isolates at species and strain level by
Single Nucleotide Polymorphisms (SNP) genotyping via High Resolution
Melting (HRM) analysis of amplified polymorphic intergenic spacer region
between 16S and 23S rRNA genes (IRS) proved to be discriminatory for B.
cereus sensu stricto strain typing. The analysis with this technique of
polymorphic regions within the bacterial rRNA operon, corresponding to 5S
rRNA gene followed by a sequence highly homologous to glycosiltransferase,
and 16S rRNA gene followed by a sequence highly homologous to ISR region,
allowed a robust differentiation between B. cereus ATCC 14579, B.
thuringiensis Bt407 and B. weihenstephanensis KBAB4. Therefore, SNP
genotyping via HRM analysis emerges as a powerful tool for discrimination at
species and strain level within B. cereus group members.
Conclusion summary
207
• To characterize the mechanistic basis of B. cereus group cold adaptation,
mesophilic strains (B. cereus ATCC 14579, B. cereus ATCC 10987, B. cereus
AH 187 and B. thuringiensis Bt407) and psychrotrophic strains (Bacillus
weihenstephanensis WSBC 10688 and Bacillus mycoides DSM 2048) were
successfully transformed with pMAD Δ2216-17. Conversely, B.
weihenstephanensis KBAB4 showed to be recalcitrant. In vitro method for
strain-specific methylation of pMAD Δ2216-17 did not enhance transformation
of B. cereus group species. Besides, phenol-chloroform extraction for plasmid
concentration was found to decrease transformation efficiencies in comparison
with commercial columns used for DNA concentration.
• Cold response changed among B. cereus group species. B. cereus ATCC 14759
BC2216-17 knockout strains showed a clear and reliable impaired growth at
12ºC. Growth of B. cereus AH 187 BC2216-17 knockout mutant and wild type
showed no significant differences at 15ºC and a biphasic shape at 30ºC and
37ºC. B. thuringiensis Bt407 BC2216-17 knockout mutants and wild type
showed a heterogeneous behavior at 12ºC and 15ºC. These mutants can
contribute to understand the mechanisms of psychrotolerance in B. cereus group,
which presents important processing implications.

References
209
CHAPTER 10
References
10101010
9
8
7
6
5
4
3
2
1
209

References
210
9
8
7
6
5
4
2
1

References
211
A Abdou, A.M., Higashiguchi, S., Aboueleinin, A.M., Kim, M. & Ibrahim, H.R. (2007).
Antimicrobial peptides derived from hen egg lysozyme with inhibitory effect against Bacillus species. Food Control, 18, 173-178.
Abee, T., Rombouts, F.M., Hugenholtz, J., Guihard, G. & Letellier, L. (1994). Mode of
action of nisin Z against Listeria monocytogenes Scott A grown at high and low temperatures. Applied and Environmental Microbiology, 60 (6), 1962–1968.
Abee, T, & Wouters, J.A. (1999). Microbial stress response in minimal processing.
International Journal of Food Microbiology, 15, 65-91. Abee, T., Wels, M., de Been, M. & den Besten, H. (2011). From transcriptional
landscapes to the identification of biomarkers for robustness. Microbial Cell. Factories, 10 Suppl 1:S9.
Adams, D.M. (1978). Heat injury of bacterial spores. Advances in Aplied Microbiology, 23, 245-261.
Adams, M.R. & Moss, M.O. (2000). Food Microbiology, 2ed. The Royal Society of
Chemistry. Aertsen, A. & Michiels, C.W. (2004). Stress and how bacteria cope with death and
survival. Critical Reviews in Microbiology, 30, 263–273. Aertsen, A. & Michiels, C.W. (2005). Mrr instigates the SOS response after high
pressure stress in Escherichia coli. Molecular Microbiology, 58, 1381-1391. Afchain, A.L., Carlin, F., Nguyen-the, C. & Albert, I. (2008). Improving quantitative
exposure assessment by considering genetic diversity of B. cereus in cooked, pasteurised and chilled foods. International Journal of Food Microbiology, 128, 165-173.
Agata, N., Mori, M., Ohta, M., Suwan, S., Ohtani, I. & Isobe, M. (1994). A novel
dodecadepsipeptide, cereulide, isolated from Bacillus cereus causes vacuole formation in HEp-2 cells. FEMS Microbiology Letters, 121, 31–34.
Agata, N., Ohta, M., Mori, M. & Isobe, M. (1995). A novel dodecadepsipeptide,
cereulide, is an emetic toxin of Bacillus cereus. FEMS Microbiology Letters, 129, 17–20.
References
212
Agata, N., Ohta, M. & Yokoyama, K. (2002). Production of Bacillus cereus emetic toxin (cereulide) in various foods. International Journal of Food Microbiology, 73, 23–27.
Aguilar, P.S., Cronan, J.E. Jr. & de Mendoza, D. (1998). A Bacillus subtilis gene
induced by cold shock encodes a membrane phospholipid desaturase. Journal of Bacteriology, 180(8), 2194-2200.
Aguilar, P.S., Lopez, P. & de Mendoza, D. (1999). Transcriptional control of the low-
temperature-inducible des gene, encoding the delta5 desaturase of Bacillus subtilis. Journal of Bacteriology, 181(22), 7028-7033.
Aguilar, P.S., Hernandez-Arriaga, A.M., Cybulski, L.E., Erazo, A.C. & de Mendoza, D.
(2001). Molecular basis of thermosensing: a two-component signal transduction thermometer in Bacillus subtilis. EMBO Journal, 20(7), 1681-1691.
Altayar, M. & Sutherland, A.D. (2006). Bacillus cereus is common in the environment
but emetic toxin producing isolates are rare. Journal of Applied Microbiology, 100(1), 7-14.
Alvarez-Barrientos, A., Arroyo, J., Cantón, R., Nombela, C. & Sánchez-Pérez, M.
(2000). Applications of flow cytometry to clinical microbiology. Clinical Microbiology Reviews, 13(2), 167-195.
Amberg-Schwab, S., Weber, U., Burger, A., Nique, S. & Xalter, R. (2006). Development of passive and active barrier coatings on the basis of inorganic–organic Polymers. Monatshefte für Chemie, 137, 657–666.
Ananta, E., Heinz, V. & Knorr, D. (2004). Assessment of high pressure induced damage
on Lactobacillus rhamnosus GG by flow cytometry. Food Microbiology, 21, 567-577.
Anderson, A., Rönner, U. & Granum, P.E. (1995). What problems does the food
industry have with the spore-forming pathogens Bacillus cereus and Clostridium perfringens? International Journal of Food Microbiology, 28, 145–155.
Anderson Borge, G.I., Skeie, M., Sorhaug, T., Langsrud, T. & Granum, P.E. (2001).
Growth and toxin profiles of Bacillus cereus isolated from different food sources. International Journal of Food Microbiology, 69, 237–246.
Anderson, I., Sorokin, A., Kapatral, V., Reznik, G., Bhattacharya, A., Mikhailova, N.,
Burd, H., Joukov, V., Kaznadzey, D., Walunas, T., et al (2005). Comparative genome analysis of Bacillus cereus group genomes with Bacillus subtilis. FEMS Microbiology Letters, 250(2), 175-184.

References
213
Andreeva, Z.I., Nesterenko, V.F., Yurkov, I.S., Budarina Z.I., Sineva, E.V. & Solonin, A.S. (2006). Purification and cytotoxic properties of Bacillus cereus hemolysin II. Protein Expression and Purification, 47, 186–193.
Arantes, O. & Lereclus, D. (1991). Construction of cloning vectors for Bacillus
thuringiensis. Gene, 108(1), 115-9. Arnaud, M., Chastanet, A. & Débarbouillé, M. (2004). New vector for efficient allelic
replacement in naturally nontransformable, low-GC-content, gram-positive bacteria. Applied and Environmental Microbiology, 70(11), 6887-91.
Ash, C., Farrow, J.A., Dorsch, M., Stackebrandt, E. & Collins, M.D. (1991).
Comparative analysis of Bacillus anthracis, Bacillus cereus, and related species on the basis of reverse transcriptase sequencing of 16S rRNA. International Journal of Systematic and Evolutionary Bacteriology, 41(3), 343-346.
Atkins, P. & de Paula, J. (2002). Physical Chemistry, 7th edition. Oxford University
Press. Auger, S., Krin, E., Aymerich, S. & Gohar, M. (2006). Autoinducer 2 affects biofilm
formation by Bacillus cereus. Applied and Environmental Microbiology, 72, 937–941.
Augustin, J.C. (2011). Challenges in risk assessment and predictive microbiology of
foodborne spore-forming bacteria. Food Microbiology, 28(2), 209-13.
B
Baida, G.E. & Kuzmin, N.P. (1995). Cloning and primary structure of a new hemolysin
gene from Bacillus cereus. Biochimica et Biophysica Acta, 1264, 151–154. Baida, G., Budarina, Z.I., Kuzmin, N.P. & Solonin, A.S. (1999). Complete nucleotide
sequence and molecular characterization of hemolysin II gene from Bacillus cereus. FEMS Microbiology Letters, 180, 7–14.
Bandow, J.E., Brötz, H. & Hecker, M. (2002). Bacillus subtilis tolerance of moderate
concentrations of rifampin involves the sigma(B)-dependent general and multiple stress response. Journal of Bacteriology, 184(2), 459-67.
Baranyi, J., Roberts, T. A. & McClure, P. (1993). A non-autonomous differential
equation to model bacterial growth. Food Microbiology, 10, 43-59.

References
214
Baranyi, J. & Roberts, T.A. (1994). A dynamic approach to predicting bacterial growth in food. International Journal of Food Microbiology, 23, 277– 294.
Baranyi, J. (1998). Comparison of Stochastic and Deterministic Concepts of Bacterial
Lag. Journal of Theoretical Biology, 192(3), 403-408. Baranyi, J. & Pin C. (1999). Estimating growth parameters by means of detection times.
Applied and Environmental Microbiology, 65, 732–736. Baranyi, J. (2000). Stochastic modelling of bacterial lag. In: Predictive Modelling in
Foods-Conference Proceedings. Van Impe, J.F.M., Bernaerts, K. (Eds.), pp.141-143.
Baranyi, J & Pin, C. (2001). A parallel study on modelling bacterial growth and survival
curves. Journal of Theoretical Biology, 210, 327-336. Baranyi, J. (2002). Stochastic modelling of bacterial lag phase. International Journal of
Food Microbiology, 73(2-3), 203-206. Baranyi, J. & Pin, C. (2003). Modelling the history effect on microbial growth and
survival. In: Modelling microbial responses in food. R. C. McKellar and X. Lu (ed.). Boca Raton, CRC Press, pp. 285–302.
Baron, F., Cochet, M.F., Grosset, N., Madec, M.N., Briandet, R., Dessaigne, S.,
Chevalier, S., Gautier, M. & Jan, S. (2007). Isolation and characterization of a psychrotolerant toxin producer, Bacillus weihenstephanensis, in liquid egg products. Journal of Food Protection, 70, 2782-2791.
Barry, T., Collerman, G., Glennon, M., Dunican, L.K. & Gannon, F. (1991). The
16S/23S ribosomal spacer region as a target for DNA probes to identify eubacteria. PCR Methods and Applications, 1, 51-56.
Bartoszewicz, M., Hansen, B.M. & Swiecicka, I. (2008). The members of the Bacillus
cereus group are commonly present contaminants of fresh and heat-treated milk. Food Microbiology, 25, 588–596.
Bearson, B. L., Wilson, L. & Foster, J. W. (1998). A low pH-inducible, PhoPQ-
dependent acid tolerance response protects Salmonella typhimurium against inorganic acid stress. Journal of Bacteriology, 180, 2409–2417.
Becker, H., Schaller, G., Von Wiese, W. & Terplan, G. (1994). Bacillus cereus in infant
foods and dried milk products. International Journal of Food Microbiology, 23, 1-15.

References
215
Becker, L.A., Evans, S.N., Hutkins, R.W. & Benson, A.K. (2000). Role of sigma(B) in adaptation of Listeria monocytogenes to growth at low temperature. Journal of Bacteriology, 182(24), 7083-7087.
Beckering, C. L., Steil, L., Weber, M. H., Völker, U. and Marahiel, M. A. (2002).
Genomewide transcriptional analysis of the cold shock response in Bacillus subtilis. Journal of Bacteriology, 184, 6395–6402.
Beecher, D.J. & MacMillan, J.D. (1991). Characterization of the components of
hemolysin BL from Bacillus cereus. Infection and Immunity, 59, 1778–1784. Beecher, D.J. & Wong, A.C. (1994). Identification of hemolysin BL-producing Bacillus
cereus isolates by a discontinuous hemolytic pattern in blood agar. Applied and Environmental Microbiology, 60, 1646–1651.
Beecher, D.J., Schoeni, J.L. & Wong, A.C. (1995). Enterotoxic activity of hemolysin
BL from Bacillus cereus. Infection and Immunity, 63, 4423–4428. Beecher, D.J., Olsen, T.W., Somers, E.B. & Wong, A.C. (2000a). Evidence for
contribution of tripartite hemolysin BL, phosphatidylcholine-preferring phospholipase C, and collagenase to virulence of Bacillus cereus endophthalmitis. Infection and Immunity, 68, 5269–5276.
Beecher, D.J. & Wong, A.C. (2000b). Cooperative, synergistic and antagonistic
haemolytic interactions between haemolysin BL, phosphatidylcholine phospholipase C and sphingomyelinase from Bacillus cereus. Microbiology, 146, 3033–3039.
Benson, D.A, Karsch-Mizrachi, I., Lipman, D.J., Ostell, J. & Wheeler, D.L. (2004).
GenBank: update. Nucleic Acids Research, 32, Database issue D23-D 26. Betts, R. (2002). Detecting pathogens in food. In: Foodborne Pathogens: Hazards, Risk
Analysis and Control. deWBlackburn, C., McClure, P.J. (Eds.). Cambridge Woodhead Publishing Ltd, pp. 13–45.
Beuchat, L.R., Rocelle, M., Clavero, S., & Jaquette, C.B. (1997). Effects of nisin and
temperature on survival, growth, and enterotoxin production characteristics of psychrotrophic Bacillus cereus in beef gravy. Applied and Environmental Microbiology, 63 (5), 1953–1958.
Bhakdi S & Tranum-Jensen, J. (1991). Alpha-toxin of Staphylococcus aureus.
Microbiological Reviews, 55, 733–751.

References
216
Biesta-Peters, E.G., Reij, M.W, Joosten, H., Gorris, L.G.M. & Zwietering, M.H. (2010). Comparison of two optical-density-based methods and a plate count method for estimation of growth parameters of Bacillus cereus. Applied and Environmental Micorbiology, 76, 1399-1405.
Biesta-Peters, E.G. (2011). Bacillus cereus: emetic toxin production and gamma
hypothesis for growth. Thesis Wageningen University, Wageningen, Netherlands. ISBN 978-90-8585-993-2.
Biesta-Peters, E.G., Mols, M., Reij, M.W. & Abee, T. (2011). Physiological parameters
of Bacillus cereus marking the end of acid-induced lag phases. International Journal of Food Microbiology, 148(1), 42-47.
Bigelow, W.D. & Esty, J.R. (1920). The thermal death point in relation to typical
thermophylic organisms. Journal of Infectious Diseases, 27, 602. Boles, B.R., Thoendel, M. & Singh, P.K. (2004). Self-generated diversity produces
"insurance effects" in biofilm communities. Proceedings of the National Academic of Sciences of the United States of America, 101(47), 16630-16635.
Boles, B.R. & Singh, P.K. (2008). Endogenous oxidative stress produces diversity and
adaptability in biofilm communities. Proceedings of the National Academic of Sciences of the United States of America, 105(34), 12503-12508.
Bourque, S.N., Valero, J.R., Lavoie, M.C. & Levesque, R.C. (1995). Comparative
analysis of the 16S to 23S ribosomal intergenic spacer sequences of Bacillus thuringiensis strains and subspecies and of closely related species. Applied and Environmental Microbiology, 61(4), 1623-1626.
Bratchell, N., Gibson, A.M., Truman, M., Kelly, T.M. & Roberts, T.A. (1989).
Predicting microbial growth: the consequences of quantity of data. International Journal of Food Microbiology, 8(1), 47-58.
Breeuwer, P., Drocourt, J., Rombouts, F.M. & Abee, T. (1996). A Novel method for
continuous determination of the intracellular pH in bacteria with the internally conjugated fluorescent probe 5 (and 6-)-Carboxyfluorescein Succinimidyl Ester. Applied and Environmental Microbiology, 62(1), 178-83.
Breukink, E., van Kraaij, C., Demel, R.A., Siezen, R.J., Kuipers, H.G. & de Kruijff, B.
(1997). The C-terminal region of nisin is responsible for the initial interaction of nisin with the target membrane. Biochemistry, 36, 6968–6976.
Breukink, E., Wiedemann, I., van Kraaij, C., Kuipers, O.P., Sahl, H.-G. & de Kruijff, B. (1999). Use of the cell wall precursor Lipid II by a pore-forming peptide antibiotic. Science, 286, 2361–2364.

References
217
Brigulla, M., Hoffmann, T., Krisp, A., Völker, A., Bremer, E. &Völker, U. (2003). Chill induction of the SigB-dependent general stress response in Bacillus subtilis and its contribution to low-temperature adaptation. Journal of Bacteriology, 185(15), 4305-4314.
Brillard, J., Susanna, K., Michaud, C., Dargaignaratz, C., Gohar, M., Nielsen-Leroux,
C., Ramarao, N., Kolstø, A.B., Nguyen-the, C., Lereclus, D. & Broussolle, V. (2008). The YvfTU two-component system is involved in plcR expression in Bacillus cereus. BMC Microbiology, 8, 183.
Brillard, J., Jéhanno, I., Dargaignaratz, C., Barbosa, I., Ginies, C., Carlin, F., Fedhila,
S., Nguyen-the, C., Broussolle, V. & Sanchis, V. (2010). Identification of Bacillus cereus genes specifically expressed during growth at low temperatures. Applied and Environmental Microbiology, 76(8), 2562-2573.
Browne, N. & Dowds, B.C. (2001). Heat and salt stress in the food pathogen Bacillus
cereus. Journal of Applied Microbiology, 91(6), 1085-94. Bruno, M.E.C. & Montville, T.J. (1993). Common mechanistic action of bacteriocins
from lactic acid bacteria. Applied and Environmental Microbiology, 59 (9), 3003–3010.
Buchanan, R.L. & Cygnarowicz, M.L. (1990). A mathematical approach toward
defining and calculating the duration of the lag phase. Food Microbiology, 7, 237–240.
Buchanan, R.L. & Bagi, L.K. (1994). Expansion of response surface models for the
growth of Escherichia coli O157:H7 to include sodium nitrite as a variable. International Journal of Food Microbiology, 23, 317-332.
Buchanan, R.L. (1995). The role of microbiological criteria and risk assessment in
HACCP. Food Microbiology, 12, 421-424. Butala, M., Zgur-Bertok, D. & Busby, S.J. (2009). The bacterial LexA transcriptional
repressor. Cell and Molecular Life Science, 66, 82-93.
C Candelon, B., Guilloux, K., Ehrlich, S.D. & Sorokin, A. (2004). Two distinct types of
rRNA operons in the Bacillus cereus group. Microbiology, 150, 601-611.

References
218
Cao, G., Zhang, X., Zhong, L. & Lu, Z. (2011). A modified electro-transformation method for Bacillus subtilis and its application in the production of antimicrobial lipopeptides. Biotechnology Letters, 33, 1047-1051.
Cardazzo, B., Negrisolo, E., Carraro, L., Alberghini, L., Patarnello, T. & Giaccone, V.
(2008). Multiple-locus sequence typing and analysis of toxin genes in Bacillus cereus food-borne isolates. Applied and Environmental Microbiology, 74, 850-60.
Carlin, F., Guinebretiere, M.H., Choma, C., Pasqualini, R., Braconnier, A. & Nguyen-
the, C. (2000). Spore-forming bacteria in commercial cooked, pasteurized and chilled vegetable purees. Food Microbiology, 17, 153-165.
Carlin, F., Fricker, M., Pielaat, A., Heisterkamp, S., Shaheen, R., Salonen, M.S.,
Svensson, B., Nguyen-the, C. & Ehling-Schulz, M. (2006). Emetic toxin-producing strains of Bacillus cereus show distinct characteristics within the Bacillus cereus group. International Journal of Food Microbiology, 109, 132-138.
Carlin, F., Brillard, J., Broussolle, V., Clavel, T., Duport, C., Jobin, M., Guinebretière,
M.H., Auger, S., Sorokine, A. & Nguyen-Thé, C. (2010). Adaptation of Bacillus cereus, an ubiquitous worldwide-distributed foodborne pathogen, to a changing environment. Food Research International, 43(7), 1885-1894.
Carlson, C.R., Caugant, D.A. & Kolstø, A.B. (1994). Genotypic Diversity among
Bacillus cereus and Bacillus thuringiensis Strains. Applied and Environmental Microbiology, 60, 1719-1725.
Cheng, J.C., Huang, C.L., Lin, C.C., Chen, C.C., Chang, Y.C., Chang, S.S. & Tseng,
C.P. (2006). Rapid detection and identification of clinically important bacteria by high-resolution melting analysis after broad-range ribosomal RNA real-time PCR. Clinical Chemistry, 529, 1997-2004.
Cherif, A., Borin, S., Rizzi, A., Ouzari, H., Boudabous, A. & Daffonchio, D. (2003).
Bacillus anthracis diverges from related clades of the Bacillus cereus group in 16S-23S ribosomal DNA intergenic transcribed spacers containing tRNA genes. Applied and Environmental Microbiology, 69, 33-40.
Christiannson, A., Bertilsson, J. & Svensson, B. (1999) Bacillus cereus spores in raw
milk: factors affecting the contamination of milk during the grazing period. Journal of Dairy Science, 82, 305–314.
Chung, W. & Hancock, R.E.W. (2000). Action of lysozyme and nisin mixtures against
lactic acid bacteria. International Journal Food Microbiology, 60, 25–32.

References
219
Ciammaruconi, A., Grassi, S., De Santis, R., Faggioni, G., Pittiglio, V., D'Amelio, R., Carattoli, A., Cassone, A., Vergnaud, G. & Lista, F. (2008). Fieldable genotyping of Bacillus anthracis and Yersinia pestis based on 25-loci Multi Locus VNTR Analysis. BMC Microbiology, 8, 21.
Clarke, A., & Dupont, C. (1992). O-acetylated peptidoglycan: its occurrence,
pathobiological significance and biosynthesis. Canadian Journal of Microbiology, 38, 85–91.
Clavel, T., Carlin, F., Lairon, D., Nguyen-The, C. & Schmitt, P. (2004). Survival of
Bacillus cereus spores and vegetative cells in acid media simulating human stomach. Journal of Applied Microbiology, 97, 214–219.
Clerch, B., Garriga, X., Torrents, E., Rosales, C.M. & Llagostera, M. (1996).
Construction and characterization of two lexA mutants of Salmonella typhimurium with different UV sensitivities and UV mutabilities. Journal of Bacteriology, 178, 2890-2896.
Codex Alimentarius: Codex General Standar for Food Aditives (CODEX STAN 192-
1995). Revised in 2011. Cole, M.B., Davies, K.W., Munro, G., Holyoak, C.D. & Kilsby, D.C.0 (1993). A
vitalistic model to describe the thermal inactivation of Listeria monocytogenes. Journal of Industrial Microbiology, 12, 232–239.
Coleman, W.H., Chen, D., Li, Y.Q., Cowan, A.E. & Setlow, P. (2007). How moist heat
kills spores of Bacillus subtilis. Journal of Bacteriology, 189(23), 8458-8466. Condon, S. & Sala, F.J. (1992). Heat resistance of Bacillus subtilis in buffer and foods
of different pH. Journal of Food Protection, 55, 605-608. Conesa, R., Andreu, S., Fernández, P.S., Esnoz, A. & Palop, A. (2009). Nonisothermal
heat resistance determinations with the thermoresistometer Mastia. Journal of Applied Microbiology, 107, 506-513.
Cox, M.M. (2007). Regulation of bacterial RecA protein function. Critical Reviews in Biochemical and Molecular Biology, 42, 41-63.
Crandall, A.D. & Montville, T.J. (1998). Nisin resistance in Listeria monocytogenes
ATCC 700302 is a complex phenotype. Applied and Environmental Microbiology, 64 (1), 231–237.
Cronan, J.E., Jr. & Rock, C.O. (1996). Biosynthesis of membrane lipids. In: Escherichia
coli and Salmonella typhimurium: Cellular and Molecular Biology, 2nd edn, Vol. 1. Neidhart, F.C. et al. (Eds.).

References
220
Cronan Jr., J.E. (2002). Phospholipid modifications in bacteria. Current Opinion in Microbiology, 5, 202–205.
Cronin, U.P. & Wilkinson, M.G. (2010). The potential of flow cytometry in the study of
Bacillus cereus. Journal of Applied Microbiology, 108(1), 1-16. Cuppers, H. G. A. M. & Smelt, J. P. P. M. (1993). Time to turbidity measurement as a
tool for modeling spoilage by Lactobacillus. Journal of Industrial Microbiology, 12, 168-171.
D Daffonchio, D., Borin, S., Frova, G., Luigi, Manachini, P.L. & Sorlini, C. (1998). PCR
fingerprinting of whole genomes: the spacers between the 16S and 23S rRNA genes and of intergenic tRNA gene regions reveal a different intraspecific genomic variability of Bacillus cereus and Bacillus licheniformis. International Journal of Systematic and Evolutionary Microbiology, 48, 107-116.
Daffonchio, D., Cherif, A. & Borin, S. (2000). Homoduplex and heteroduplex
polymorphisms of the amplified ribosomal 16S-23S internal transcribed spacers describe genetic relationships in the "Bacillus cereus group". Applied and Environmental Microbiology, 66(12), 5460-5468.
Daffonchio, D., Cherif, A., Brusetti, L., Rizzi, A., Mora, D., Boudabous, A. & Borin, S.
(2003). Nature of polymorphisms in 16S-23S rRNA gene intergenic transcribed spacer fingerprinting of Bacillus and related genera. Applied and Environmental Microbiology, 69, 5128-5137.
Damgaard, P.H., Granum, P.E., Bresciani, J., Torregrossa, M.V., Eilenberg, J. &
Valentino, L. (1997). Characterization of Bacillus thuringiensis isolated from infections in burn wounds. FEMS Immunology and Medical Microbiology, 18, 47–53.
D'Arrigo, M., García de Fernando, G.D., Velasco de Diego, R., Ordóñez, J.A., George,
S.M. & Pin, C. (2006). Indirect measurement of the lag time distribution of single cells of Listeria innocua in food. Applied and Environmental Microbiology, 72(4), 2533-2538.
References
221
Davey, K.R., Lin, S.H. & Wood, D.G. (1978). The effect of pH on continuous high temperature short time sterilization of liquids. Journal of American Institute of Chemical Engineering, 24, 537-540.
Davey, K.R. (1989). A predictive model for combined temperature and water activity on
microbial growth during the growth phase. Journal of Applied Bacteriology, 67(5), 483-488.
de Been, M, Francke, C., Moezelaar, R., Abee ,T. & Siezen, R.J. (2006). Comparative
analysis of two-component signal transduction systems of Bacillus cereus, Bacillus thuringiensis and Bacillus anthracis. Microbiology, 152, 3035-3048.
de Been, M., Bart, M.J., Abee, T., Siezen, R.J. & Francke, C. (2008). The identification
of response regulator-specific binding sites reveals new roles of two-component systems in Bacillus cereus and closely related low-GC Grampositives. Environmental Microbiology, 10, 2796-2809.
de Been, M., Tempelaars, M. H., van Schaik, W., Moezelaar, R., Siezen, R. J. & Abee,
T. (2010). A novel hybrid kinase is essential for regulating the sB-mediated stress response of Bacillus cereus. Environmental Microbiology, 12, 730–745.
de Been, M., Francke, C, Siezen, R.J. & Abee, T. (2011). Novel sigmaB regulation
modules of Gram-positive bacteria involve the use of complex hybrid histidine kinases. Microbiology, 157(1), 3-12.
De Clerck, E., Van Mol, K., Jannes, G., Rossau, R. & De Vos, P. (2004). Design of a 5'
exonuclease-based real-time PCR assay for simultaneous detection of Bacillus licheniformis, members of the 'B. cereus group' and B. fumarioli in gelatine. Letters in Applied Microbiology, 39(1), 109-15.
Delgado, B., Fernandez, P.S., Palop, A. & Periago, P.M. (2004). Effect of thymol and
cymene on Bacillus cereus vegetative cells evaluated through the use of frequency distributions. Food Microbiology, 21, 327-334.
De Koeyer, D.L., Douglass, K., Murphy, A.M., Whitney, S., Nolan, L., Song, Y. & De
Jong, W.S. (2009). Application of high-resolution DNA melting for genotyping and variant scanning of diploid and autotetraploid potato. Molecular Breeding, 25, 67-90.
Delignette-Muller, M.L. (1998). Relation between the generation time and the lag time
of bacterial growth kinetics. International Journal of Food Microbiology, 43(1-2), 97-104.

References
222
Delignette-Muller, M.L., Baty, F., Cornu, M. & Bergis, H. (2005). Modelling the effect of a temperature shift on the lag phase duration of Listeria monocytogenes. International Journal of Food Microbiology, 100, 77-84.
Delves-Broughton, J. & Gasson, M.J. (1994). Nisin. In: Natural Antimicrobial Systems
and Food Preservation. Dillon, V.M., Board, R.G. (Eds.). Wallingford, Cab International, pp. 99–131.
Delves-Broughton, J., Blackburn, P., Evans, R.J. & Hugenholtz, J. (1996). Applications
of the bacteriocin, nisin. Antonie van Leeuwenhoek, 69 (2), 193–202. den Besten, H. M. W., Ingham, C. J., van Hylckama Vlieg, J. E. T., Beerthuyzen, M.
M., Zwietering, M. H. & Abee, T. (2007). Quantitative analysis of population heterogeneity of the adaptive salt stress response and growth capacity of Bacillus cereus ATCC 14579. Applied and Environmental Microbiology, 73, 4797–4804.
den Besten, H.M., Mols, M., Moezelaar, R., Zwietering, M.H. & Abee, T. (2009).
Phenotypic and transcriptomic analyses of mildly and severely salt-stressed Bacillus cereus ATCC 14579 cells. Applied and Environmental Microbiology, 75(12), 4111-4119.
den Besten, H.M., Garcia, D., Moezelaar, R., Zwietering, M.H. & Abee, T. (2010).
Direct-imaging-based quantification of Bacillus cereus ATCC 14579 population heterogeneity at a low incubation temperature. Applied and Environmental Microbiology, 76(3), 927-930.
de Vries, Y.P., Hornstra, L.M., de Vos, W.M. & Abee, T. (2004). Growth and
sporulation of Bacillus cereus ATCC 14579 under defined conditions: temporal expression of genes for key sigma factors. Applied and Environmental Microbiology, 70(4), 2514-2519.
Díaz, M., Herrero, M., García, L.A. & Quirós, C. (2010). Application of flow cytometry
to industrial microbial bioprocesses. Biochemical Engineering Journal, 48, 385–340.
DiCapua, E., Ruigrok, R.W. & Timmins, P.A. (1990). Activation of RecA protein: the
salt-induced structural transition. Journal of Structural Biology, 104, 91-96. Didelot, X., Barker, M., Falush, D. & Priest, F.G. (2009). Evolution of pathogenicity in
the Bacillus cereus group. Systematic and Applied Microbiology, 32, 81-90.
References
223
Dierick, K., Van Coillie, E., Swiecicka, I., Meyfroidt, G., Devlieger, H., Meulemans, A., Hoedemaekers, G., Fourie, L., Heyndrickx, M. & Mahillon, J. (2005). Fatal family outbreak of Bacillus cereus-associated food poisoning. Journal of Clinical Microbiology, 43(8), 4277-4279.
Dillon, V.M. & Board, R.G. (1994). Future prospects for natural antimicrobial food
preservation systems. In: Natural Antimicrobial Systems and Food Preservation. Dillon, V.M., Board, R.G. (Eds.). Oxon, UK, Cab International, pp. 297–305.
Donahue, J.P., Israel, D.A., Peek, R.M., Blaser, M.J. & Miller, G.G. (2000).
Overcoming the restriction barrier to plasmid transformation of Helicobacter pylori. Molecular Microbiology, 37(5), 1066-1074.
Doran, M., Raicu, D.S., Furst, J.D., Settimi, R., Schipma, M. & Chandler, D.P. (2007).
Oligonucleotide microarray identification of Bacillus anthracis strains using support vector machines. Bioinformatics, 23, 487-492.
Dressman, J.B., Berardi, R.R., Dermentzoglou, L.C., Russel, T.L., Schmaltz, S.P.,
Barnett, J.L. & Jarvenpaa, K.M. (1990). Upper gastrointestinal (GI) pH in young, healthy men and women. Pharmaceutical Research, 7, 756–761.
Drobniewski, F.A. (1993). Bacillus cereus and related species. Clinical Microbiology
Reviews, 6, 324–338. Dufrenne, J., Bijwaard, M., te Giffel, M., Beumer, R. & Notermans, S. (1995).
Characteristics of some psychrotrophic Bacillus cereus isolates. Food Microbiology, 27, 175-183.
Duport, C., Thomassin, S., Bourel, G. & Schmitt, P. (2004). Anaerobiosis and low
specific growth rates enhance hemolysin BL production by Bacillus cereus F4430/73. Archives of Microbiology, 182(1), 90-95.
Duport, C., Zigha, A., Rosenfeld, E. & Schmitt, P. (2006). Control of enterotoxin gene
expression in Bacillus cereus F4430/73 involves the redox-sensitive ResDE signal transduction system. Journal of Bacteriology, 188, 6640–6651.
Duwat, P., Ehrlich, S.D. & Gruss, A. (1995). The recA gene of Lactococcus lactis:
characterization and involvement in oxidative and thermal stress. Molecular Microbiology, 17, 1121-1131.

References
224
E
EFSA. (2009). The Community Summary Report on Food-borne Outbreaks in the
European Union in 2007. The EFSA Journal, 271. EFSA (2011). The European Union Summary Report on Trends and Sources of
Zoonoses, Zoonotic Agents and Food-borne Outbreaks in 2009. The EFSA Journal, 9(3), 2090.
Ehling-Schulz, M., Fricker, M. & Scherer, S. (2004). Bacillus cereus, the causative
agent of an emetic type of food-borne illness. Molecular Nutrition and Food Research, 48(7), 479-487.
Ehling-Schulz, M., Svensson, B., Guinebretière, M.H. et al. (2005a). Emetic toxin
formation of Bacillus cereus is restricted to a single evolutionary lineage of closely related strains. Microbiology, 151, 183–197.
Ehling-Schulz, M. et al. (2005b). Identification and partial characterization of the
nonribosomal peptide synthetase gene responsible for cereulide production in emetic Bacillus cereus. Applied and Environmental Microbiology, 71, 105–113.
Ehling-Schulz, M., Guinebretière, M.H., Monthán, A., Berge, O., Fricker, M. &
Svensson, B. (2006a). Toxin gene profiling of enterotoxic and emetic Bacillus cereus. FEMS Microbiology Letters, 260, 232–240.
Ehling-Schulz, M., Fricker, M., Grallert, H, Rieck, P., Wagner, M. & Scherer, S.
(2006b). Cereulide synthetase gene cluster from emetic Bacillus cereus: structure and location on a mega virulence plasmid related to Bacillus anthracis toxin plasmid pXO1. BMC Microbiology, 6, 20.
Elliot, P.H. (1996). Predictive microbiology and HACCP. Journal of Food Protection
Supplement, 48-53. El-Sharoud, W.M. & Graumann, P.L. (2007). Cold shock proteins aid coupling of
transcription and translation in bacteria. Science Progress, 90, 15-27. Erali, M., Voelkerding, K.V. & Wittwer, C.T. (2008). High resolution melting
applications for clinical laboratory medicine. Experimental and Molecular Pathology, 85, 50–58.
References
225
Esbelin, J., Jouanneau, Y., Armengaud, J. & Duport, C. (2008). ApoFnr binds as a monomer to promoters regulating the expression of enterotoxin genes of Bacillus cereus. Journal of Bacteriology, 190, 4242–4251.
Esbelin, J., Armengaud, J., Zigha, A. & Duport, C. (2009). ResDE-dependent regulation of enterotoxin gene expression in Bacillus cereus: evidence for multiple modes of binding for ResD and interaction with Fnr. Journal of Bacteriology, 191(13), 4419-4426.
F Fagerlund, A., Ween, A., Lund, T., Hardy, S.P. & Granum, P.E. (2004). Genetic and
functional analysis of the cytK family of genes in Bacillus cereus. Microbiology, 150, 2689–2697.
Fagerlund, A., Brillard, J., Fürst, R., Guinebretière, M.H. & Granum, P.E. (2007). Toxin
production in a rare and genetically remote cluster of strains of the Bacillus cereus group. BMC Microbiology, 7, 43.
Fagerlund, A., Lindbäck, T., Storset, A.K., Granum, P.E. & Hardy, S.P. (2008). Bacillus
cereus Nhe is a pore-forming toxin with structural and functional properties similar to the ClyA (HlyE, SheA) family of haemolysins, able to induce osmotic lysis in epithelia. Microbiology, 154, 693–704.
Faille, C., Lebret, V., Gavini, F. & Maingonnati, J.F. (1997). Injury and lethality of heat
treatment of Bacillus cereus spores suspended in buffer and in poultry meat. Journal of Food Protection, 60, 544–547
Fedhila, S., Gohar, M., Slamti, L., Nel, P. & Lereclus, D. (2003). The Bacillus
thuringiensis PlcR-regulated gene inhA2 is necessary, but not sufficient, for virulence. Journal of Bacteriology, 185, 2820–2825.
Feeherry, F.E., Munsey, D.T. & Rowley, D.B. (1987). Thermal inactivation and injury
of Bacillus stearothermophilus spores. Applied and Environmental Microbiology, 53(2), 365-370.
Fernández, P.S. & Peck, M.W. (1999). A predictive model that describes the effect of
prolonged heat at 70ºC to 90ºC and subsequent incubation at refrigeration temperatures of growth from spores and toxigenesis by lisozyme. Applied and Environmental Microbiology, 65, 3449-3457.

References
226
Fernández A., Ocio, M.J., Fernández P. S. & Martinez, A. (2001). Effect of heat activation and inactivation conditions on germination and thermal resistance parameters of Bacillus cereus spores. Interantional Journal of Food Microbiology, 63, 257-264.
Foster, J.W. (1995). Low pH adaptation and the acid tolerance response of Salmonella
typhimurium. Critical Reviews in Microbiology, 21(4), 215-237. Fouet, A., Namy, O. & Lambert, G. (2000). Characterization of the operon encoding the
alternative sB factor from Bacillus anthracis and its role in virulence. Journal of. Bacteriology, 182, 5036–5045.
Francis, K. P., Mayr, R., von Stetten, F., Stewart, G. S. A. B. & Scherer, S. (1998).
Discrimination of psychrotrophic and mesophilic strains of the Bacillus cereus group by PCR targeting of major cold shock protein genes. Applied and Environmental Microbiology, 64, 3525–3529.
Francois, K., Devlieghere, F., Standaert, A.R., Geeraerd, A.H., Van Impe, J.F. &
Debevere, J. (2003). Modelling the individual cell lag phase. Isolating single cells: protocol development. Letter in Applied Microbiology, 37, 26–30.
Francois, K., Devlieghere, F., Smet, K., Standaert, A.R., Geeraerd, A.H., Van Impe, J.F.
& Debevere, J. (2005). Modeling the individual cell lag phase: effect of temperature and pH on the individual cell lag distribution of Listeria monocytogenes. International Journal of Food Microbiology, 100, 41–53.
Francois, K., Valero, A., Geeraerd, A.H., Van Impe J.F., Debevere, J., García-Gimeno,
R.M., Zurera, G. & Devlieghere, F. (2007). Effect of preincubation temperature and pH on the individual cell lag phase of Listeria monocytogenes, cultured at refrigeration temperatures. Food Microbiology, 24, 32-43.
Frenzel, E., Letzel, T., Scherer, S. & Ehling-Schulz, M. (2011). Inhibition of cereulide
toxin synthesis by emetic Bacillus cereus via long-chain polyphosphates. Applied and Environmental Microbiology, 77(4), 1475-1482.
Fricker, M., Messelhäusser, U., Busch, U., Scherer, S. & Ehling-Schulz, M. (2007).
Diagnostic real-time PCR assays for the detection of emetic Bacillus cereus strains in foods and recent food-borne outbreaks. Applied and Environmental Microbiology, 73(6), 1892-1898.
References
227
G Galhardo, R.S., Hastings, P.J. & Rosenberg, S.M. (2007). Mutation as a stress response
and the regulation of evolvability. Critical Reviews in Biochemistry and Molecular Biology, 42(5), 399-435.
Gao, F.H., Abee, T. & Konings, W.N. (1991). Mechanism of action of the peptide
antibiotic nisin in liposomes and cytochrome c-oxidase-containing proteoliposomes. Applied Environmental Microbiology, 57 (8), 2164–2170.
Geeraerd, A.H., Herremans, C.H. & Van Impe, J.F. (2000). Structural model
requirements to describe microbial inactivation during a mild heat treatment. International Journal of Food Microbiology, 59, 185–209.
Geeraerd, A.H., Valdramidis, V.P. & Van Impe, J.F., (2005). GInaFiT, a freeware tool
to assess non-log-linear microbial survivor curves. International Journal of Food Microbiology, 102(1), 95-105.
George, S.M., Richardson, L.C., Pol, I.E. & Peck, M.W. (1998). Effect of oxygen
concentration and redox potential on recovery of sublethally heat-damaged cells of Escherichia coli O157:H7, Salmonella enteritidis and Listeria monocytogenes. Journal of Applied Microbiology, 84, 903–909.
George, S.M., Metris, A. & Stringer, S.C. (2008). Physiological state of single cells of
Listeria innocua in organic acids. International Journal of Food Microbiology, 124, 204-210.
Ghelardi, E., Celandroni, F., Salvetti, S., Fiscarelli, E. & Senesi, S. (2007). Bacillus
thuringiensis pulmonary infection: critical role for bacterial membrane-damaging toxins and host neutrophils. Microbes and Infection, 9, 591–598.
Gilbert, R.J. & Kramer, J.M. (1986). Bacillus cereus food poisoning. In: Progress in
Food Safety (Proceedings of Symposium). Cliver DC & Cochrane BA (Eds.). Food Research Institute, University of Wisconsin-Madison, Madison, WI, pp. 85–93.
Gill, A. O. & Holley, R. A. (2000). Surface application of lysozyme, nisin, and EDTA
to inhibit spoilage and pathogenic bacteria on ham and bologna. Journal of Food Protection, 63(10), 1338−1346.

References
228
Goerlich, O., Quillardet, P. & Hofnung, M. (1989). Induction of the SOS response by hydrogen peroxide in various Escherichia coli mutants with altered protection against oxidative DNA damage. Journal of Bacteriology, 171, 6141-6147.
Gohar, M., Faegri, K., Perchat, S., Ravnum, S., Økstad, O.A., Gominet, M., Kolstø,
A.B. & Lereclus, D. (2008). The PlcR virulence regulon of Bacillus cereus. PLoS One., 3(7):e2793.
Goldfless, S.J., Morag, A.S., Belisle, K.A., Sutera V.A. Jr. & Lovett, S.T. (2006). DNA
repeat rearrangements mediated by DnaK-dependent replication fork repair. Molecular Cell, 21, 595-604.
Granum, P.E. (1990). Clostridium perfringens toxins involved in food poisoning.
International Journal of Food Microbiology, 10, 101–111. Granum, P.E. (1994). Bacillus cereus som næringsmiddelhygienisk problemorganisme.
Norsk Veterinærtidsk, 106, 911–915. Granum, P.E., O’Sullivan, K. & Lund, T. (1999). The sequence of the non-haemolytic
enterotoxin operon from Bacillus cereus. FEMS Microbiology Letters, 177, 225–229.
Granum, P.E. (2002). Bacillus cereus and food poisoning. In: Applications and
systematic of Bacillus and relatives. Berkeley, R., Heyndrickx, M., Logan, N. & De Vos, P. (Eds.). Oxford, Blackwell Science Ltd, pp 141-159.
Grau, R. & de Mendoza, D. (1993). Regulation of the shyntesis of unsaturated fatty
acids in Bacillus subtilis. Molecular Microbiology, 8, 535-542. Groot, M.N., Nieboer, F. & Abee, T. (2008). Enhanced transformation efficiency of
recalcitrant Bacillus cereus and Bacillus weihenstephanensis isolates upon in vitro methylation of plasmid DNA. Applied and Environmental Microbiology, 74(24), 7817-7820.
Guinebretière, M.H., Broussolle, V. & Nguyen-The, C. (2002). Enterotoxigenic profiles
of food-poisoning and food-borne Bacillus cereus strains. Journal of Clinical Microbiology, 40, 3053–3056.
Guinebretière, M.H. & Nguyen-The, C. (2003). Sources of Bacillus cereus
contamination in pasteurized zucchini puree processing line, differentiated by two PCR-based methods. FEMS Microbiology Ecology, 43, 207-215.

References
229
Guinebretière, M.H., Thompson, F.L., Sorokin, A., Normand, P., Dawyndt, P., Ehling-Schulz, M., Svensson, B., Sanchis, V., Nguyen-The, C., Heyndrickx, M. & De Vos, P. (2008). Ecological diversification in the Bacillus cereus Group. Environmental Microbiology, 10, 851-865.
Guinebretière, M.H., Velge, P., Couvert, O., Carlin, F., Debuyser, M.L. & Nguyen-The,
C. (2010). Ability of Bacillus cereus group strains to cause food poisoning varies according to phylogenetic affiliation (groups I to VII) rather than species affiliation. Journal of Clinical Microbiology, 48, 3388-3391.
Gunasekera, T.S., Attfield, P.V. & Veal, D.A. (2000). A flow cytometry method for
rapid detection and enumeration of total bacteria in milk. Applied and Environmental Microbiology, 66(3), 1228-1232.
Gunasekera, T.S., Veal, D.A. & Attfield, P.V. (2003). Potential for broad applications
of flow cytometry and fluorescence techniques in microbiological and somatic cell analyses of milk. International Journal of Food Microbiology, 85(3), 269-279.
H Häggblom, M.M., Apetroaie, C., Andersson, M.A. & Salkinoja-Salonen, M.S. (2002).
Quantitative analysis of cereulide, the emetic toxin of Bacillus cereus, produced under various conditions. Applied and Environmental Microbiology, 68, 2479–2483.
Haque, M.A. & Rusell, N.J. (2004). Strains of Bacillus cereus vary in the phenotypic
adaptation of their membrane lipid composition in response to low water activity, reduced temperature and growth in rice starch. Microbiology, 150, 1397-1404.
Havelaar, A.H., Brul, S., de Jong, A., de Jonge, R., Zwietering, M.H. & Ter Kuile, B.H.
(2010). Future challenges to microbial food safety. International Journal of Food Microbiology, 139 Suppl 1:S79-94.
Heinrichs, J.H., Beecher, D.J., MacMillan, J.D. & Zilinskas, B.A. (1993). Molecular
cloning and characterization of the hblA gene.encoding the B component of hemolysin BL from Bacillus cereus. Journal of Bacteriology, 175, 6760–6766.

References
230
Helgason, E., Caugant, D.A., Lecadet, M.M., Chen, Y., Mahillon, J., Lövgren, A., Hegna, I., Kvaløy, K. & Kolstø, A.B. (1998). Genetic diversity of Bacillus cereus/B. thuringiensis isolates from natural sources. Current Microbiology, 37, 80-87.
Helgason, E., Caugant, D.A., Olsen, I. & Kolstø, A.B. (2000a). Genetic structure of
population of Bacillus cereus and B. thuringiensis isolates associated with periodontitis and other human infections. Journal of Clinical Microbiology, 38, 1615-1622.
Helgason, E., Okstad, O.A., Caugant, D.A., Johansen, H.A., Fouet, A., Mock, M.,
Hegna, I. & Kolstø, A.B. (2000b). Bacillus anthracis, Bacillus cereus, and Bacillus thuringiensis-one species on the basis of genetic evidence. Applied and Environmental Microbiology, 66, 2627-2630.
Helgason, E., Tourasse, N.J., Meisal, R., Caugant, D.A. & Kolstø, A.B. (2004).
Multilocus sequence typing scheme for bacteria of the Bacillus cereus group. Applied and Environmental Microbiology, 70, 191-201.
Hernández-Herrero, L.A., Giner, M.J. & Valero, M. (2008). Effective chemical control
of psychrotrophic Bacillus cereus EPSO-35AS and INRA TZ415 spore outgrowth in carrot broth. Food Microbiology, 25(5), 714-721.
Heyndrickx, M., & Scheldeman, P. (2002). Bacilli associated with spoilage in dairy
products and other food. In: Applications and systematics of Bacillus and relatives. R. Berkeley, M.N. Heyndrickx, and P. de Vos (Eds.). Oxford, Blackwell Science Ltd., pp.64–82.
Hill, K.K., Ticknor, L.O., Okinaka, R.T., Asay, M., Blair, H., Bliss, K.A., Laker, M.,
Pardington, P.E., Richardson, A.P., Tonks, M., Beecher, D.J., Kemp, J.D., Kolstø, A.B., Wong, A.C., Keim, P. & Jackson, P.J. (2004). Fluorescent amplified fragment length polymorphism analysis of Bacillus anthracis, Bacillus cereus, and Bacillus thuringiensis isolates. Applied and Environmental Microbiology, 70, 1068-1080.
Hilliard, N.J., Schelonka, R.L. & Waites, K.B. (2003). Bacillus cereus bacteremia in a
preterm neonate. Journal of Clinical Microbiology, 41(7), 3441-3444. Hills, B. P. & K. M. Wright. (1994). A new model for bacterial growth in
heterogeneous systems. Journal of Theoretical Biology, 168, 31–41. Hills, B. P. & B. M. Mackey. (1995). Multi-compartment kinetic models for injury,
resuscitation, induced lag and growth in bacterial cell populations. Food Microbiology, 12, 333–346.

References
231
Hoch, J.A. (2000). Two-component and phosphorelay signal transduction. Current Opinion in Microbiology, 3, 165-170.
Hoffmaster, A.R., Novak, R.T., Marston, C.K., Gee, J.E., Helsel, L., Pruckler, J.M. &
Wilkins, P.P. (2008). Genetic diversity of clinical isolates of Bacillus cereus using multilocus sequence typing. BMC Microbiology, 8, 191.
Holo, H. & Nes, I.F. (1989). High-Frequency Transformation, by Electroporation, of
Lactococcus lactis subsp. cremoris Grown with Glycine in Osmotically Stabilized Media. Applied and Environmental Microbiology, 55(12), 3119-3123.
Holtmann, G. & Bremer, E. (2004). Thermoprotection of Bacillus subtilis by
exogenously provided glycine betaine and structurally related compatible solutes: involvement of Opu transporters. Journal of Bacteriology, 186(6), 1683-1693.
Horn, G., Hofweber, R., Kremer, W. & Kalbitzer, H.R. (2007). Structure and function
of bacterial cold shock proteins. Cellular and Molecular Life Sciences, 64(12), 1457-1470.
Hornbaek, T., Jakobsen, M., Dynesen, J., & Nielsen, A.K. (2004). Global transcription profiles and intracellular pH regulation measured in Bacillus licheniformis upon external pH upshifts. Archives of Microbiology, 182(6), 467-474.
Hornstra, L.M., Ter Beek, A., Smelt J.P.P.M., Kallemeijn, W. & Brul, S. (2009). On the
origin of heterogeneity in (preservation) resistance of Bacillus spores; input for a 'systems' analysis approach of bacterial spore outgrowth. International Journal of Food Microbiology, 134, 9-15
Hoton, F.M., Andrup, L., Swiecicka, I. & Mahillon, J. (2005). The cereulide genetic
determinants of emetic Bacillus cereus are plasmid-borne. Microbiology, 151, 2121–2124.
Hoton, F.M., Fornelos, N., N’Guessan, E., Hu, X., Swiecicka, I., Dierick, K.,
J¨a¨askel¨ainen, E.L., Salkinoja-Salonen, M. & Mahillon, J. (2009). Family portrait of Bacillus cereus and Bacillus weihenstephanensis cereulide-producing strains. Environmental Microbiology, 1, 177–183.
Huynen, M.A. & Bork, P. (1998). Measuring genome evolution. Proceedings of the
National Academy of Sciences of United States of America, 95(11), 5849-5856.

References
232
I Instituto de Estudios del Huevo. (2006). Seguridad Alimentaria en Huevo y
Ovoproductos, 2ª Edición. Instituto de Estudios del Huevo. Madrid, pp 34. Ivanova, N., Sorokin, A., Anderson, I., Galleron, N., Candelon, B., Kapatral, V.,
Bhattacharyya, A., Reznik, G., Mikhailova, N., Lapidus, A., Chu, L., Mazur, M., Goltsman, E., Larsen, N., D’Souza, M., Walunas, T., Grechkin, Y., Pusch, G., Haselkorn, R., Fonstein, M., Dusko, E.S., Overbeek, R. & Kyrpides, N. (2003). Genome sequence of Bacillus cereus and comparative analysis with Bacillus anthracis. Nature, 423, 87–91.
J Jack, R.W., Tagg, J.R. & Ray, B. (1995). Bacteriocins of Gram-positive bacteria.
Microbiological Reviews, 171–200. Jackson, S.G., Goodbrand, R.B., Ahmed, R. & Kasatiya, S. (1995). Bacillus cereus and
Bacillus thuringiensis isolated in a gastroenteritis outbreak investigation. Letters in Applied Microbiology, 21, 103–105.
Jackson, P.J., Hill, K.K., Laker, M.T., Ticknor, L.O. & Keim, P. (1999). Genetic
comparison of Bacillus anthracis and its close relatives using amplified fragment length polymorphism and polymerase chain reaction analysis. Journal of Applied Microbiology, 87, 263-269.
Jan. S., Brunet, N., Techer, C., Le Maréchal, C., Koné, A.Z., Grosset, N., Cochet, M.F.,
Gillard, A., Gautier, M., Puterflam, J. & Baron, F. (2011). Biodiversity of psychrotrophic bacteria of the Bacillus cereus group collected on farm and in egg product industry. Food Microbiology, 28(2), 261-265.
Jaquette, C.B. & Beuchat, L.R. (1998). Combined effects of pH, nisin, and temperature
on growth and survival of psychrotrophic Bacillus cereus. Journal of Food Protection, 61(5), 563–570.
Jensen, M.A., Webster, J.A. & Straus, N. (1993). Rapid identification of bacteria on the
basis of polymerase chain reaction-amplified ribosomal DNA spacer polymorphisms. Applied and Environmental. Microbiology, 59(4), 945–952.

References
233
Jensen, G.B., Hansen, B.M., Eilenberg, J. & Mahillon, J. (2003). The hidden lifestyles of Bacillus cereus and relatives. Environmental Microbiology, 5, 631–640.
Jernigan, D.B., Raghunathan, P.L., Bell, B.P. et al. (2002). Investigation of
bioterrorism-related anthrax, United States, 2001: epidemiologic findings. Emerging Infectious Diseases, 8, 1019–1028.
Jiang, M., Shao, W., Perego, M. & Hoch, J. A. (2000). Multiple histidine kinases
regulate entry into stationary phase and sporulation in Bacillus subtilis. Molecular Microbiology, 38, 535–542.
Jobin, M.P., Clavel, T., Carlin, F. & Schmitt, P. (2002). Acid tolerance response is low-
pH and late-stationary growth phase inducible in Bacillus cereus TZ415. International Journal of Food Microbiology, 79(1-2), 65-73.
Johnson, K.M. (1984). Bacillus cereus food-borne illness. An update. Journal of Food Protection, 47, 145–153.
Jordan, S, Hutchings, M.I. & Mascher, T. (2008). Cell envelope stress response in
Gram-positive bacteria. FEMS Microbiology Reviews, 32, 107-146. Jung, K. & Altendorf, K. (2002). Towards an understanding of the molecular
mechanisms of stimulus perception and signal transduction by the KdpD/KdpE system of Escherichia coli. Journal of Molecular Microbiology and Biotechnology, 4, 223–228.
K Keim, P., Kalif, A., Schupp, J., Hill, K., Travis, S.E., Richmond, K., Adair, D.M.,
Hugh-Jones, M., Kuske, C.R. & Jackson, P. (1997). Molecular evolution and diversity in Bacillus anthracis as detected by amplified fragment length polymorphism markers. Journal of Bacteriology, 179, 818-824.
Keim, P., Price, L.B., Klevytska, A.M., Smith, K.L., Schupp, J.M., Okinaka, R.,
Jackson, P.J. & Hugh-Jones, M.E. (2000). Multiple-locus variable-number tandem repeat analysis reveals genetic relationships within Bacillus anthracis. Journal of Bacteriology, 182, 2928-2936.
Kell, D.B., Kaprelyants, A.S., Weichart, D.H., Harwood, C.R. & Barer, M.R. (1998).
Viability and activity in readily culturable bacteria: a review and discussion of the practical issues. Antonie Van Leeuwenhoek., 73, 169-187.
References
234
Klein, G. (2011). Molecular characterization of the probiotic strain Bacillus cereus var. toyoi NCIMB 40112 and differentiation from food poisoning strains. Journal of Food Protection, 74(7), 1189-1193.
Knobloch, J.K., Jäger, S., Horstkotte, M.A., Rohde, H. & Mack, D. (2004). RsbU-
dependent regulation of Staphylococcus epidermidis biofilm formation is mediated via the alternative sigma factor sigmaB by repression of the negative regulator gene icaR. Infection and Immunity, 72(7), 3838-3848.
Ko, K.S., Kim, J.W., Kim, J.M., Kim, W., Chung, S.I., Kim, I.J. & Kook, Y.H. (2004).
Population structure of the Bacillus cereus group as determined by sequence analysis of six housekeeping genes and the plcR Gene. Infection and Immunity, 72, 5253-5261.
Koseki, S. (2009). Microbial Responses Viewer (MRV): a new ComBase-derived
database of microbial responses to food environments. International Journal of Food Microbiology, 134(1-2), 75-82.
Kotiranta, A., Lounatmaa, K. & Haapasalo, M. (2000). Epidemiology and pathogenesis
of Bacillus cereus infections. Microbes and Infection, 2(2), 189-198. Kramer, J.M. & Gilbert, R.J. (1989). Bacillus cereus and others Bacillus species. In:
Foodborne Bacterial Pathogens. Doyle, M.P., (Eds.). New York: Marcel Dekker, pp. 21-70.
Kreft, J, Berger, H., Härtlein, M., Müller, B, Weidinger, G. & Goebel, W. (1983)
Cloning and expression in Escherichia coli and Bacillus subtilis of the hemolysin (cereolysin) determinant from Bacillus cereus. Journal of Bacteriology, 155, 681–689.
Kuppe, A., Evans, L.M., McMillen, D.A. & Griffith, O.H. (1989). Phosphatidylinositol-
specific phospholipase C of Bacillus cereus: cloning, sequencing, and relationship to other phospholipases. Journal of Bacteriology, 171(11), 6077-6083.
References
235
L Lapidus, A., Goltsman, E., Auger, S., Galleron, N., Ségurens, B., Dossat, C., Land,
M.L., Broussolle, V, Brillard, J., Guinebretiere, M.H., Sanchis, V., Nguen-The, C., Lereclus, D., Richardson, P., Wincker, P., Weissenbach, J., Ehrlich, S.D. & Sorokin, A. (2008). Extending the Bacillus cereus group genomics to putative food-borne pathogens of different toxicity. Chemico-Biological Interactions, 171(2), 236-49.
Lechner, S., Mayr, R., Francis, K.P., Pruss, B.M., Kaplan, T., Wiessner-Gunkel, E.,
Stewart, G.S.A.B. & Scherer, S. (1998). Bacillus weihenstephanensis sp. nov. is a new psychrotolerant species of the Bacillus cereus group. International Journal of Systematic Bacteriology, 48, 1373–1382.
Leistner, L. & Gorris, L.G.M. (1995). Food preservation by hurdle technology. Trends in Food Science and Technology, 6(2), 41-46.
Leistner, L. (1999). Combined methods for food preservation. In: Handbook of Food
Preservation. Rahman, M.S. (Eds.). New York, Dekker, pp. 457-485. Le Marc, Y., Skandamis, P.N., Belessi, C.I., Merkouri, S.I., George, S.M., Gounadaki,
A.S., Schvartzman, S., Jordan, K., Drosinos, E.H. & Baranyi, J. (2010). Modeling the effect of abrupt acid and osmotic shifts within the growth region and across growth boundaries on adaptation and growth of Listeria monocytogenes. Applied and Environmental Microbiology, 76(19), 6555-6563.
Leppla, S.H. (2006). Bacillus anthracis toxins. In: The Comprehensive Sourcebook of
Bacterial Protein Toxins. Alouf JE and Popoff MR (Eds.), Burlington, Elsevier, pp. 323–347.
Lereclus, D., Agaisse, H., Gominet, M., Salamitou, S. & Sanchis, V. (1996).
Identification of a Bacillus thuringiensis gene that positively regulates transcription of the phosphatidylinositol-specific phospholipase C gene at the onset of the stationary phase. Journal of Bacteriology, 178, 2749–2756.
Lereclus, D., Agaisse, H., Grandvalet, C., Salamitou, S. & Gominet, M. (2000).
Regulation of toxin and virulence gene transcription in Bacillus thuringiensis. International Journal of Medical Microbiology, 290, 295–299.
Liew, M., Pryor, R., Palais, R., Meadows, C., Erali, M., Lyon, E. & Wittwer, C. (2004).
Genotyping of single-nucleotide polymorphisms by high-resolution melting of small amplicons. Clinical Chemistry, 50, 1156-1164.
References
236
Lindbäck, T., Økstad, O.A., Rishovd, A.L. & Kolstø, A.B. (1999). Insertional inactivation of hblC encoding the L2 component of Bacillus cereus ATCC 14579 haemolysin BL strongly reduces enterotoxigenic activity, but not the haemolytic activity against human erythrocytes. Microbiology, 145, 3139–3146.
Lindbäck, T., Fagerlund, A., Rødland, M.S. & Granum, P.E. (2004). Characterization of
the Bacillus cereus Nhe enterotoxin. Microbiology, 150, 3959–3967. Lopez, D., Vlamakis, H. & Kolter, R. (2009). Generation of multiple cell types in
Bacillus subtilis. FEMS Microbiology Reviews, 33, 152-163. López-Pedemonte, T. J., Roig-Sgués, A. X., Trujillo, A. J., Capellas, M. & Guamis, B.
(2003). Inactivation of spores of Bacillus cereus in cheese by high hydrostatic pressure with the addition of nisin or lysozyme. Journal of Dairy Science, 86, 3075–3081.
Lozada-Chavez, I., Janga, S.C. & Collado-Vides, J. (2006). Bacterial regulatory
networks are extremely flexible in evolution. Nucleic Acids Research., 34(12), 3434-3445.
Lozada-Chavez, I., Angarica, V.E., Collado-Vides, J. & Contreras-Moreira, B. (2008).
The role of DNA-binding specificity in the evolution of bacterial regulatory networks. Journal of Molecular Biology, 379(3), 627-643.
Lund, T. & Granum, P.E. (1996). Characterisation of a nonhaemolytic enterotoxin
complex from Bacillus cereus isolated after a foodborne outbreak. FEMS Microbiology Letters, 141, 151–156.
Lund, T., De Buyser, M.L. & Granum, P.E. (2000). A new cytotoxin from Bacillus
cereus that may cause necrotic enteritis. Molecular Microbiology, 38, 254–261. Lusetti, S.L. & Cox, M.M. (2002). The bacterial RecA protein and the recombinational
DNA repair of stalled replication forks. Annual Review of Biochemistry, 71, 71-100.
Lyon, G. J. & Novick, R. P. (2004). Peptide signaling in Staphylococcus aureus and
other Gram-positive bacteria. Peptides, 25, 1389–1403.
References
237
M Macaluso, A. & Mettus, A.M. (1991). Efficient transformation of Bacillus thuringiensis
requires nonmethylated plasmid DNA. Journal of Bacteriology, 173(3), 1353-1356.
Mafart, P. & Legerinel, I. (1998). Modeling combined effects of temperature and pH on
heat resistance of spores by liner-Bigelow equation. Journal of Food Science, 63, 6-8.
Mafart, P., Couvert, O., Gaillard, S. & Leguerinel, I. (2002). On calculating sterility in
thermal preservation methods: application of the Weibull frequency distribution model. International Journal of Food Microbiology, 72, 107-113.
Mahler, H., Pasi, A., Kramer, J.M., Schulte, P., Scoging, A.C., Bär, W. & Krähenbühl,
S. (1997). Fulminant liver failure in association with the emetic toxin of Bacillus cereus. The New England Journal of Medicin, 336(16), 1142-1148.
Makki, F. & Durance, T. D. (1996). Thermal inactivation of lysozyme as influenced by pH, sucrose and sodium chloride and inactivation and preservative effects in beer. Food Research International, 29(7), 635−645.
Malacrinò, P., Zapparoli, G., Torriani, S. & Dellaglio, F. (2001). Rapid detection of
viable yeasts and bacteria in wine by flow cytometry. Journal of Microbiological Methods, 45(2), 127-134.
Maniatis, T., Fritsch, E.F. & Sambrook, J. (1989). Molecular cloning; A Laboratory
Manual. Cold Spring Harbor. New York, Cold Spring Harbor Laboratory Press. Mansilla, M.C., Cybulski, L.E., Albanesi, D. & de Mendoza. D. (2004). Control of
membrane lipid fluidity by molecular thermosensors. Journal of Bacteriology, 186(20), 6681-6688.
Mansour, M. & Milliere, J. (2001). An inhibitory synergistic effect of a nisin-
monolaurin combination on Bacillus sp. vegetative cells in milk. Food Microbiology, 18, 87–94.
Manzano, M., Cocolin, L., Cantoni, C. & Comi, G. (2003). Bacillus cereus, Bacillus
thuringiensis and Bacillus mycoides differentiation using PCR-RE technique. International Journal of Food Microbiology, 81, 249-254.

References
238
Margulis, L., Jorgensen, J.Z., Dolan, S., Kolchinsky, R., Rainey, F.A. & Lo, S.C. (1998). The Arthromitus stage of Bacillus cereus: intestinal symbionts of animals. Proceedings of the National Academic of Science of the United Stated of America, 95, 1236–1241
Marles-Wright, J. & Lewis, RJ. (2007). Stress responses of bacteria. Current Opinion in
Structural Biology, 17(6), 755-760. Martin, J., Zhu, W., Passalacqua, K.D., Bergman, N. & Borodovsky, M. (2010).
Bacillus anthracis genome organization in light of whole transcriptome sequencing. BMC Bioinformatics, 11(Suppl 3):S10.
Martínez-Blanch, J.F., Sánchez, G., Garay, E. & Aznar, R. (2009). Development of a
real-time PCR assay for detection and quantification of enterotoxigenic members of Bacillus cereus group in food samples. International Journal of Food Microbiology, 30, 135(1), 15-21
Martínez-Blanch, J.F., Sánchez, G., Garay, E. & Aznar, R. (2011). Evaluation of
phenotypic and PCR-based approaches for routine analysis of Bacillus cereus group foodborne isolates. Antonie Van Leeuwenhoek, 99, 697-709.
Mathys, A., Heinz, V., Schwartz, F.H. & Knorr, D. (2007). Impact of agglomeration of
the quantitative assessment of Bacillus stearothermophilus heat inactivation. Journal of Food Engineering, 81, 380-387.
Mayr, B., Kaplan, T., Lechner, S. & Scherer, S. (1996). Identification and purification
of a family of dimeric major cold shock protein homologs from the psychrotrophic Bacillus cereus WSBC 10201. Journal of Bacteriology, 178, 2916-2925.
Mazas, M., González, I., López, M., González, J. & Martín-Sarmiento, R. (1995).
Effects of sporulation media and strain on thermal resistance of Bacillus cereus spores. International Journal of Food Science and Technology, 30, 71–78.
McIntyre, D.A. & Harlander, S.K. (1989). Genetic transformation of intact Lactococcus
lactis subsp. lactis by high-voltage electroporation. Applied and Environmental Microbiology, 55(3), 604-610.
McMeekin, T.A., Olley, J.N., Ross, T. & Ratkowsky, D.A. (1993). Optical density
methods. In:Predictive Microbiology. Wiley, Chichester, UK, pp 31-34.

References
239
McMeekin, T.A., Hill, C., Wagner, M., Dahl, A. & Ross, T. (2010). Ecophysiology of food-borne pathogens: Essential knowledge to improve food safety. International Journal of Food Microbiology, 139 Suppl 1, S64-78.
Mellefont, L.A. & Ross, T. (2003). The effect of abrupt shifts in temperature on the lag
phase duration of Escherichia coli and Klebsiella oxytoca. International Journal of Food Microbiology, 83(3), 295-305.
Mellefont, L. A., McMeekin, T.A. & Ross, T. (2003). The effect of abrupt osmotic
shifts on the lag phase duration of foodborne bacteria. International Journal of Food Microbiology, 83, 281–293.
Membré, J.M., Amézquita, A., Bassett, J., Giavedoni, P., Blackburn, C.W. & Gorris,
L.G.M. (2006). A probabilistic modeling approach in thermal inactivation: estimation of postprocess Bacillus cereus spore prevalence and concentration. Journal of Food Protection, 69, 118-129.
Métris, A., George, S., Peck, M. & Baranyi, J. (2002). Effect of sodium chloride and pH
on the distribution of the lag times of individual cells of Listeria innocua. Conference Proceedings: 7ème Journées Européennes. Agroindustrie et Methodes Statistiques, Lille 16-18 Janvier 2002, pp 61-66.
Métris, A., George, S.M., Peck, M.W. & Baranyi, J. (2003). Distribution of turbidity
detection times produced by single cell-generated bacterial populations. Journal of Microbiological Methods, 55(3), 821-827.
Métris , A., Le Marc, Y., Elfwing, A., Ballagi, A. & Baranyi, J. (2005). Modelling the
variability of lag times and the first generation times of single cells of E. coli. International Journal of Food Microbiology, 100(1-3), 13-19.
Métris, A., George, S.M. & Baranyi, J. (2006). Use of optical density detection times to
assess the effect of acetic acid on single-cell kinetics. Applied and Environmental Microbiology, 72, 6674–6679.
Mignot, T., Mock, M., Robichon, D., Landier, A., Lereclus, D. & Fouet, A (2001). The
incompatibility between the PlcR- and AtxA-controlled regulons may have selected a nonsense mutation in Bacillus anthracis. Molecular Microbiology, 42, 1189-1198.
Mikkola, R, Saris, N.E., Grigoriev, PA., Andersson, M.A. & Salkinoja-Salonen, M.S.
(1999). Ionophoretic properties and mitochondrial effects of cereulide: the emetic toxin of B. cereus. European Journal of Biochemistry, 263, 112–117.
References
240
Mirończuk, A.M., Kovács, Á.T. & Kuipers, O.P. (2008). Induction of natural competence in Bacillus cereus ATCC 14579. Microbial Biotechnology, 1(3), 226-235.
Moats, W.A. (1971). Kinetics of thermal death of bacteria. Journal of Bacteriology,
105, 165-171. Mols, M. (2009). Bacillus cereus Acid Stress Responses. Wageningen, the Netherlands:
Wageningen University. Mols, M., Pier, I., Zwietering, M.H. & Abee, T. (2009). The impact of oxygen
availability on stress survival and radical formation of Bacillus cereus. International Journal of Food Microbiology, 135, 303-311.
Mols, M., van Kranenburg, R., van Melis, C.C., Moezelaar, R. & Abee, T. (2010a).
Analysis of acid-stressed Bacillus cereus reveals a major oxidative response and inactivation-associated radical formation. Environmental Microbiology, 12, 873–885.
Mols, M., van Kranenburg, R., Tempelaars, M.H., van Schaik, W., Moezelaar, R. &
Abee, T. (2010b) Comparative analysis of transcriptional and physiological responses of Bacillus cereus to organic and inorganic acid shocks. International Journal of Food Microbiology. 137, 13–21.
Mols, M. & Abee, T. (2011). Bacillus cereus responses to acid stress. Environmental Microbiology, 13(11), 2835-2843.
Monod, J. (1949). The growth of bacterial cultures. Annual Review of Microbiology, 3,
371-394. Montgomery, J., Wittwer ,C.T., Palais, R. & Zhou, L. (2007). Simultaneous mutation
scanning and genotyping by high-resolution DNA melting analysis. Nature Protocols, 2, 59–66.
Moravek, M., Dietrich, R., Buerk, C., Broussolle, V., Guinebretière, M.H., Granum,
P.E., Nguyen-The, C. & Märtlbauer, E. (2006). Determination of the toxic potential of Bacillus cereus isolates by quantitative enterotoxin analyses. FEMS Microbiology Letters, 257, 293–298.
Muñoz, M., Guevara, L., Palop, A., Tabera, J. & Fernández, P.S. (2009) Determination
of the effect of plant essential oils obtained by supercritical fluid extraction on the growth and viability of Listeria monocytogenes in broth and food systems using flow cytometry. LWT-Food Science and Technology, 42, 220-227.

References
241
Muñoz-Cuevas, M., Fernández, P.S., George, S. & Pin C. (2010). Modeling the lag period and exponential growth of Listeria monocytogenes under conditions of fluctuating temperature and water activity values. Applied and Environmental Microbiology, 76, 2908-2915.
N Nagpal, M.L., Fox, K.F. & Fox, A. (1998). Utility of 16S–23S rRNA spacer region
methodology: how similar are interspace regions within a genome and between strains for closely related organisms? Journal of Micobiological Methods, 33, 211-219.
Nakano, M.M., Zuber, P., Glaser, P., Danchin, A. & Hulett, F.M. (1996). Two-
component regulatory proteins ResD-ResE are required for transcriptional activation of fnr upon oxygen limitation in Bacillus subtilis. Journal of Bacteriology, 178(13), 3796-3802.
Nakimbugwe, D., Masschalck, B., Atanassova, M., Zewdie-Bosüner, A. & Michiels,
C.W. (2006). Comparison of bactericidal activity of six lysozymes at atmospheric pressure and under high hydrostatic pressure. International Journal of Food Microbiology, 108(3), 355-363.
Naranjo, M., Denayer, S., Botteldoorn, N., Delbrassinne, L., Veys, J., Waegenaere, J.,
Sirtaine, N., Driesen, R.B., Sipido, K.R., Mahillon, J. & Dierick, K. (2011). Sudden death of a young adult associated with Bacillus cereus food poisoning. Journal of Clinical Microbiology, 49(12), 4379-4381
Nattress, F. M., Yost, C. K. & Baker, L. P. (2001). Evaluation of the ability of lysozyme
and nisin to control meat spoilage bacteria. International Journal of Food Microbiology, 70, 111−119.
Nattress, F.M. & Baker, L.P. (2003). Effects of treatment with lysozyme and nisin on
the microflora and sensory properties of commercial pork. International Journal of Food Micrbiology, 85, 259–267.
Nauta, M.J., Litman, S., Barker, G.C. & Carlin, F. (2003). A retail and consumer phase
model for exposure assessment of Bacillus cereus. International Journal of Food Microbiology, 83(2), 205-218.

References
242
Naze, F., Jouen, E., Randriamahazo, R.T., Simac, C., Laurent, P., Blériot, A., Chiroleu, F., Gagnevin, L., Pruvost, O. & Michault, A. (2010). Pseudomonas aeruginosa outbreak linked to mineral water bottles in a neonatal intensive care unit: fast typing by use of high-resolution melting analysis of a variable-number tandem-repeat locus. Journal of Clinical Microbiology, 48(9), 3146-3152.
Nebe-von-Caron, G., Stephens, P.J., Hewitt, C.J., Powell, J.R. & Badley, R.A. (2000).
Analysis of bacterial function by multi-colour fluorescence flow cytometry and single cell sorting. Journal of Microbiological Methods, 42, 97-114.
Neidhardt, F.C. & VanBogelen, R.A. (2000). Proteomic analysis of bacterial stress response. In: Bacterial stress responses. G. Storz & R. Hengge-Aronis (Eds.). Washington D.C., ASM Press, (pp. 445-452).
Nicolaï, B.M. & Van Impe, J.F. (1996). Predictive food microbiology: a probabilistic
approach. Mathemathics and Computer in Simlution, 42, 287-292. Nissen, H., Rosnes, J.T., Brendehaug, J. & Kleiberg, G.H. (2002). Safety evaluation of
sous vide-processed ready meals. Letters in Applied Microbiology, 35, 433-438. Nuryastuti, T., van der Mei, H.C., Busscher, H.J., Kuijer, R., Aman, A.T. & Krom, B.P.
(2008). recA mediated spontaneous deletions of the icaADBC operon of clinical Staphylococcus epidermidis isolates: a new mechanism of phenotypic variations. Antonie Van Leeuwenhoek, 94(2), 317-328.
O Odell, I.D., Cloud, J.L., Seipp, M. & Wittwer, C.T. (2005). Rapid species identification
within the Mycobacterium chelonae-abscessus group by high-resolution melting analysis of hsp65 PCR products. American Journal of Clinical Pathology, 123, 96-101.
Oosthuizen, M. C., Steyn, B., Lindsay, D., Brozel, V. S. & von Holy, A. (2001). Novel
method for the proteomic investigation of a dairyassociated Bacillus cereus biofilm. FEMS Microbiology Letters, 194, 47–51.
Østensvik, Ø., From, C., Heidenreich, B, O’Sullivan, K. & Granum, P.E. (2004).
Cytotoxic Bacillus spp. belonging to the B. cereus and B. subtilis groups in Norwegian surface waters. Journal of Applied Microbiology, 96, 987–993.

References
243
P
Paananen, A., Mikkola, R., Sareneva, T., Matikainen, S, Hess, M., Andersson, M., Julkunen, I., Salkinoja-Salonen, M.S. & Timonen, T. (2002). Inhibition of human natural killer cell activity by cereulide, an emetic toxin from Bacillus cereus. Clinical and Experimental Immunology, 129, 420–428.
Palop, A., Raso, J., Pagán, R., Condón, S. & Sala, F.J. (1996). Influence of pH on heat
resistance of Bacillus licheniformis in buffer and homogenised foods. International Journal of Food Microbiology, 29, 1-10.
Palop, A., Raso, J., Pagán, R., Condon, S. & Sala F. (1999). Influence of pH on heat
resistance of spores of Bacillus coagulans in buffer and homogenised foods. International Journal of Food Microbiology, 46, 243-249.
Pandiani, F., Chamot, S., Brillard, J., Carlin, F., Nguyen-the, C. & Broussolle, V. (2011). Role of the five RNA helicases in the adaptive response of Bacillus cereus ATCC 14579 cells to temperature, pH, and oxidative stresses. Applied and Environmental Microbiology, 77(16), 5604-5609.
Paparella, A., Taccogna, L., Aguzzi, I., Chaves-López, C., Serio, A., Marsilio, F. &
Suzzi, G. (2008). Flow cytometric assessment of the antimicrobial activity of essential oils against Listeria monocytogenes. Food Control, 19, 1174-1182.
Peck, M.W. (1997). Clostridium botulinum and the safety of refrigerated processed
foods of extended durability. Trends in Food Science & Technology, 8, 186–192. Peleg, M. & Cole, M.B. (1998). Reinterpretation of microbial survival curves. Critical
Reviews in Food Science and Nutrition, 38, 353-380. Peleg, M. (2000). Microbial survival curves-the reality of flat “shoulders” and absolute
thermal death times. Food Research International, 33, 531-538 Periago, P. & Moezelaar, R. (2001). Combined effect of nisin and carvacrol at different
pH and temperatures levels on the viability of different strains of Bacillus cereus. International Journal of Food Microbiology, 68, 141-148.
Periago, P.M., van Schaik, W., Abee, T. & Wouters, J.A. (2002a). Identification of
proteins involved in the heat stress response of Bacillus cereus ATCC 14579. Applied and Environmental Microbiology, 68(7), 3486-3495.

References
244
Periago, P.M., Abee, T. & Wouters, J.A. (2002b). Analysis of the heat-adaptive response of psychrotrophic Bacillus weihenstephanensis. International Journal of Food Microbiology, 79(1-2), 17-26.
Periago, P.M., van Zuijlen, A., Fernandez, P.S., Klapwijk, P.M., ter Steeg, P.F.,
Corradini, M.G. & Peleg, M. (2004). Estimation of the non-isothermal inactivation patterns of Bacillus sporothermodurans IC4 spores in soups from their isothermal survival data. International Journal of Food Microbiology, 95(2), 205-218.
Petit, J.M., Denis-Gay, M. & Ratinaud, M.H. (1993). Assessment of fluorochromes for
cellular structure and function studies by flow cytometry. Biology of the Cell, 78, 1-13.
Pflug, I.J. (1982). Introductory course in the microbiology and engineering of
sterilization processes. Saint Paul, Minesota: University of Minesota. Phadtare, S. (2004). Recent developments in bacterial cold-shock response. Current
Issues in Molecular Biology, 6(2), 125-136. Pina-Pérez, M.C., Silva-Angulo, A.B., Rodrigo, D. & Martinez-Lopez, A. (2009).
Synergistic effect of pulsed electric fields and cocoanOX 12% on the inactivation kinetics of Bacillus cereus in a mixed beverage of liquid whole egg and skim milk. International Journal Food Microbiology, 130, 196-204.
Pirttijärvi, T. S. M., Wahlström, G., Rainey, F. A., Saris, P. E. J., & Salkinoja-Salonen,
M. S. (2001). Inhibition of bacilli in industrial starches by nisin. Journal of Industrial Microbiology and Biotechnology, 26, 107–114.
Pol, I.E. & Smid, E.J. (1999). Combined action of nisin and carvacrol on Bacillus
cereus and Listeria monocytogenes. Letter in Applied Microbiology, 29 (3), 166–170.
Porter, J., Diaper, J., Edwards, C. & Pickup, R. (1995). Direct measurements of natural
planktonic bacterial community viability by flow cytometry. Applied and Environmental Microbiology, 61(7), 2783-2786.
Poschet, F., Bernaerts, K., Geeraerd, A.H., Scheerlinck, N., Nicolaï, B.M. & Van Impe,
J.F. (2004). Sensitivity analysis of microbial growth parameter distributions with respect to data quality and quantity by using Monte Carlo analysis. Mathematics and Computers in Simulation, 65, 231-243.

References
245
Postollec, F., Bonilla, S., Baron, F., Jan, S., Gautier, M., Mathot, A.G., Hallier-Soulier, S., Pavan, S. & Sohier, D. (2010). A multiparametric PCR-based tool for fast detection and identification of spore-forming bacteria in food. International Journal of Food Microbiology, 142(1-2), 78-88.
Powell, I. B., Achen, M. G., Hillier, A. J. & Davidson, B. E. (1988). A simple and rapid
method for genetic transformation of lactic streptococci by electroporation. Applied and Environmental Microbiology, 54, 655-660.
Priest, F.G. (1993) Systematics and ecology of Bacillus. In Bacillus subtilis and Other
Gram-Positive Bacteria. Biochemistry, Physiology, and Molecular Genetics ed. Sonenshein, A.L., Hoch, J.A. and Losick, R. Washington, D.C., ASM, pp. 3–16.
Priest, F.G., Barker, M., Baillie, L.W., Holmes, E.C. & Maiden, M.C. (2004).
Population structure and evolution of the Bacillus cereus group. Journal of Bacteriology, 186, 7959-7970.
Priha, O., Hallamaa, K., Saarela, M. & Raaska, L. (2004). Detection of Bacillus cereus
group bacteria from cardboard and paper with real-time PCR. Journal of Industrial Microbiology and Biotechnology, 31(4), 161-169.
Pruss, B. M., Francis, K. P., von Stetten, F. & Scherer, S. (1999). Correlation of 16S
ribosomal DNA signature sequences with temperature-dependent growth rates of mesophilic and psychrotolerant strains of the Bacillus cereus group. Journal of Bacteriology, 181, 2624–2630.
R Radnedge, L., Agron, P.G., Hill, K.K., Jackson, P,J., Ticknor, L.O., Keim, P. &
Andersen, G.L. (2003). Genome differences that distinguish Bacillus anthracis from Bacillus cereus and Bacillus thuringiensis. Applied and Environmental Microbiology, 69, 2755-2764.
Rajkovic, A., Uyttendaele, M., Courtens, T., Heyndrickx, M. & Debevere, J. (2006a).
Prevalence and characterisation of Bacillus cereus in vacuum packed potato puree. International Journal of Food Science Technology, 41, 878-884.
Rajkovic, A., Uyttendaele, M., Ombregt, S.A., Jääskeläinen, E., Salkinoja-Salonen, M.
& Debevere, J. (2006b). Influence of type of food on the kinetics and overall production of Bacillus cereus emetic toxin. Journal of Food Protection, 69, 847–852.

References
246
Rajkovic, A., Smigic, N. & Devlieghere, F. (2010). Contemporary strategies in combating microbial contamination in food chain. International Journal of Food Microbiology, 141 Suppl 1:S29-42.
Raso, J., Pagan, R. & Condon, S. (2005). Nonthermal technologies in combination with
other preservation factors. In: Novel food preocessing technologies. Barbosa-Cánovas, G.V., Tapia, M.S., Cano, M.P., Belloso, O.M., Martinez, A. (Eds.), New York, Marcel Dekker.
Ratkowsky, D., Olley, J., McMeekin, T.A. & Ball, A. (1982). Relationship between
temperature and growth rate of bacterial cultures. Journal of Bacteriology, 149, 1-5.
Ratkowsky, D.A., (2003). Model fitting and uncertainty. In: Modeling Microbial
Responses in Foods. McKellar, R., Lu, X. (Eds.). Boca Raton, CRC Press, pp. 151– 196.
Ray, B. (1992). Nisin of Lactococcus lactis ssp. lactis as a food biopreservative. In:
Food Biopreservatives of Microbial Origin. Ray, B., Daeschel, M.A. (Eds.). Boca Raton, CRC Press, pp. 207–264.
Read, T.D., Salzberg, S.L., Pop, M., Shumway, M., Umayam, L., Jiang, L., Holtzapple,
E., Busch, J.D., Smith, K.L., Schupp, J.M., Solomon, D., Keim, P. & Fraser, C.M. (2002). Comparative genome sequencing for discovery of novel polymorphisms in Bacillus anthracis. Science, 296, 2028-2033.
Read, T.D., Peterson, S.N., Tourasse, N. & 49 other authors (2003). The genome
sequence of Bacillus anthracis Ames and comparation to closely related bacteria. Nature, 423, 81-86.
Reed, G.H., Kent, J.O. & Wittwer, C.T. (2007). High-resolution DNA melting analysis
for simple and efficient molecular diagnostics. Pharmacogenomics, 8, 597–608. Reekmans, R., Van den Plas, C., Stevens, P., Vervust, T. & De Vos, P. (2009). An
alternative real-time PCR method for the detection of thermotolerant Bacillus sensu lato contaminants in naturally-contaminated gelatine. Letters in Applied Microbiology, 48(6), 763-769.
Reents, H., Munch, R., Dammeyer, T., Jahn, D. & Hartig, E. (2006). The Fnr regulon of
Bacillus subtilis. Journal of Bacteriology, 188, 1103–1112.

References
247
Reid, D.S. (2007). Water activity: fundamentals and relationships, p. 15-28. In:Water activity in foods: fundamentals and applications, 1st ed. G. V. Barbosa-Cánovas, Fontana Jr., A.J., Schmidt, S.J. & Labuza, T.P. (Eds.). Iowa, USA, Blackwell Publishing.
Renshaw, E. (1991). Modelling Biological Populations in Space and Time. Cambridge
University Press, Cambridge. Resnik, S. L. & J. Chirife. (1988). Proposed theoretical aw values at various
temperatures for selected solutions to be used as reference sources in the range of microbial growth. Journal of Food Protection, 51, 419–423.
Robinson, T.P., Ocio, M.J., Kaloti, A. & Mackey, B.M. (1998). The effect of growth
environment on the lag phase of Listeria monocytogenes. International Journal of Food Microbiology, 44, 83–92.
Robinson, T.P., Aboaba, O.O., Ocio, M.J., Baranyi, J. & Mackey, B.M. (2001). The
effect of inoculums size on the lag phase of Lysteria monocytogenes. International Journal of Food Microbiology, 70, 163-173.
Rodrigo, M., Martínez, A. & Rodrigo, D. (2005). Predicitve microbiology and its role in
food safety systems. In: Novel Food Processing Technologies. New York, Marcel Dekker.
Rosenfeld, E., Duport, C., Zigha, A. & Schmitt, P. (2005). Characterization of aerobic
and anaerobic vegetative growth of the food-borne pathogen Bacillus cereus F4430/73 strain. Canadian Journal of Microbiology, 51(2), 149-158.
Ross, T. & McMeekin, T.A. (1994). Predictive microbiology. International Journal of
Food Microbiology, 23(3-4), 241-264. Ross, T. (1999). Predictive Food Microbiology Models in the Meat Industry
(MSRC.003). Meat and Livestock, Australia. Roszack, D.B., Grimes, D.J. & Colwell, R.R. (1984).Viable but non-recoverable stage
of Salmonella enteriritdis in acquatic systems. Canadian Journal of Microbiology, 30, 334-338.
Rubinow, S.I. (1984). Cell kinetics. In: L.A. Segel (editor), Mathematical Models in
Molecular and Cell Biology. Cambridge University Press, Cambridge. Russel, T.L., Berardi, R.R. & Barnett, J.L. (1993) Upper gastrointestinal pH in seventy-
nine healthy, elderly, North American men and women. Pharmaceutical Research, 10, 187–196.
References
248
Ryan, P.A., MacMillan, J.D. & Zilinskas. B.A. (1997). Molecular cloning and characterization of the genes encoding the L1 and L2 components of hemolysin BL from Bacillus cereus. Journal of Bacteriology, 179, 2551–2556.
Ryu, J.H. & Beuchat, L.R. (2005). Biofilm formation and sporulation by Bacillus cereus
on a stainless steel surface and subsequent resistance of vegetative cells and spores to chlorine, chlorine dioxide, and a peroxyacetic acid-based sanitizer. Journal of Food Protection, 68, 2614–2622.
S
Saitou, N. & Nei, M. (1987). The neighbor-joining method: a new method for reconstructing phylogenetic trees. Molecular Biology and Evolution, 4, 406-425.
Samapundo, S., Everaert, H., Wandutu, J.N., Rajkovic, A., Uyttendaele, M. &
Devlieghere, F. (2011). The influence of headspace and dissolved oxygen level on growth and haemolytic BL enterotoxin production of a psychrotolerant Bacillus weihenstephanensis isolate on potato based ready-to-eat food products. Food Microbiology, 28(2), 298-304.
Samples, J.R. & Buettner, H. (1983). Corneal ulcer caused by a biologic insecticide
(Bacillus thuringiensis). American Journal of Ophthalmology, 95, 258–260. Schmidt, T.R., Scott, E.J. & Dyer, D.W. (2011). Whole-genome phylogenies of the
family Bacillaceae and expansion of the sigma factor gene family in the Bacillus cereus species-group. BMC Genomics, 12, 430.
Schumann, W. (2009). Temperature sensors of eubacteria. Advances in Applied
Microbiology, 67, 213-256. Seo, K.S & Bohach, G.A.(2007). Staphylococcus aureus. Washington, DC, ASM Press,
pp. 493–518. Shah, D., Zhang, Z., Khodursky, A., Kaldalu, N., Kurg, K. & Lewis, K. (2006).
Persisters: a distinct physiological state of E. coli. BMC Microbiology, 12, 6-53. Shapiro, H.M. (2003). Practical flow cytometry. New Jersey: John Wiley and Sons, Inc.

References
249
Shaver, Y.J., Nagpal, M.L., Rudner, R., Nakamura, L.K., Fox, K.F. & Fox, A. (2002). Restriction fragment length polymorphism of rRNA operons for discrimination and intergenic spacer sequences for cataloging of Bacillus subtilis sub-groups. Journal of Microbiological Methods, 50(2), 215-223.
Shinagawa, K., Konuma, H., Sekita, H. & Sugii, S. (1995). Emesis of rhesus monkeys
induced by intragastric administration with the HEp-2 vacuolation factor (cereulide) produced by Bacillus cereus. FEMS Microbiology Letters, 130(1), 87-90.
Shinagawa, K., Ueno, Y., Hu, D., Ueda, S. & Sugii, S. (1996). Mouse lethal activity of
a HEp-2 vacuolation factor, cereulide, produced by Bacillus cereus isolated from vomiting-type food poisoning. The Journal of Veterinary Medical Science, 58, 1027–1029.
Singh, V.K. & Moskovitz, J. (2003). Multiple methionine sulfoxide reductase genes in Staphylococcus aureus: expression of activity and roles in tolerance of oxidative stress. Microbiology, 149(10), 2739-2747.
Slamti, L. & Lereclus, D. (2005). Specificity and polymorphism of the PlcR-PapR
quorum-sensing system in the Bacillus cereus group. Journal of Bacteriology, 187(3), 1182-1187.
Smigic, N., Rajkovic, A., Antal, E., Medic, H., Lipnicka, B., Uyttendaele, M. &
Devlieghere, F. (2009). Treatment of Escherichia coli O157:H7 with lactic acid, neutralized electrolyzed oxidizingwater andchlorinedioxide followed by growth under sub-optimal conditions of temperature, pH and modified atmosphere. Food Microbiology, 26, 629–637.
Somkuti, G. A. & Steinberg, D. H. (1988). Genetic transformation of Streptococcus
thermophilus by electroporation. Biochimie, 70, 579-585.
Sorokin, A., Candelon, B., Guilloux, K., Galleron, N., Wackerow-Kouzova, N., Ehrlich, S.D., Bourguet, D. & Sanchis, V. (2006). Multiple-locus sequence typing analysis of Bacillus cereus and Bacillus thuringiensis reveals separate clustering and a distinct population structure of psychrotrophic strains. Applied and Environmental Microbiology, 72, 1569-1578.
Sousa, F.J., Lima, L.M., Pacheco, A.B., Oliveira, C.L., Torriani, I., Almeida, D.F.,
Foguel, D., Silva, J.L. & Mohana-Borge, R. (2006). Tetramerization of the LexA repressor in solution: implications for gene regulation of the E. coli SOS system at acidic pH. Journal of Molecular Biology, 359, 1059-1074.

References
250
Stabb, E.V., Jacobson, L.M. & Handelsman, J. (1994). Zwittermicin A-producing strains of Bacillus cereus from diverse soils. Applied and Environmental Microbiology, 60(12), 4404-4412.
Steen, H.B. (2000). Flow cytometry of bacteria: glimpses from the past with a view to
the future. Journal of Microbiological Methods, 42(1), 65-74. Stenfors, L.P. & Granum, P.E. (2001). Psychrotolerant species from the Bacillus cereus
group are not necessarily Bacillus weihenstephanensis. FEMS Microbiology Letters, 197, 223–228.
Stenfors, L.P., Mayr, R., Scherer, S. & Granum, P.E. (2002). Pathogenic potential of
fifty Bacillus weihenstephanensis strains. FEMS Microbiology Letters, 215(1), 47-51.
Stenfors Arnesen, L.P., Fagerlund, A. & Granum, P.E. (2008). From soil to gut:
Bacillus cereus and its food poisoning toxins. FEMS Microbiology Reviews, 32(4), 579-606.
Stenfors Arnesen, L., Granum, P.E., Buisson, C., Bohlin, J. & Nielsen-LeRoux, C.
(2011). Using an insect model to assess correlation between temperature and virulence in Bacillus weihenstephanensis and Bacillus cereus. FEMS Microbiology Letters, 317(2), 196-202.
Stock, J. B., Ninfa, A. J. & Stock, A. M. (1989). Protein phosphorylation and regulation
of adaptive responses in bacteria. Microbiol Reviews, 53, 450–490. Stumbo, C.R. (1973). Thermobacteriology in food processing. 2ª edición. Acadenic
Press. Food science and Technology. A series of Monographas. New York. Sun, G., Birkey, S. M. & Hulett, F. M. (1996). Three two-component signal-
transduction systems interact for Pho regulation in Bacillus subtilis. Molecular Microbiology, 19, 941–948.
Svensson, B., Eneroth, A., Brendehaug, J., Molin, G. & Chirstiansson, A. (2000). Involvement of a pasteurizer in the contamination of milk by Bacillus cereus in a commercial dairy plant. Journal of Dairy Research, 67, 455-460.
Svensson, B., Ekelund, K., Ogura, H. & Christiansson, A. (2004) Characterization of
Bacillus cereus isolated from milk silo tanks at eight different diary plants. International Diary Journal, 14, 17-27.
References
251
Swiecicka, I., Van der Auwera, G.A. & Mahillon, J. (2006). Hemolytic and nonhemolytic enterotoxin genes are broadly distributed among Bacillus thuringiensis isolated from wild mammals. Microbial Ecology, 52, 544–551.
Swinnen, I.A., Bernaerts, K., Dens, E.J., Geeraerd, A.H. & Van Impe, J.F. (2004).
Predictive modelling of the microbial lag phase: a review. International Journal of Food Microbiology, 94(2), 137-159.
Szurmant, H. & Ordal, G. W. (2004). Diversity in chemotaxis mechanisms among the
bacteria and archaea. Microbiology and Molecular Biology Reviews, 68, 301–319.
T Tapia, M.S., Alzamora, S.M. & Chirife, J. (2007). Effect of water activity (aw) on
microbial stability as a hurdle in food preservation. In: Water activity in foods: fundamentals and applications, 1st ed. G. V. Barbosa-Cánovas, Fontana Jr., A.J., Schmidt, S.J. & Labuza, T.P. (Eds.). Iowa, USA, Blackwell Publishing, pp. 239-271.
Te Giffel, M.C. (2001). Spore-formers in foods and the food processing chain.
Mededelingen Rijksuniversiteit te Gent. Fakulteit van de Landbouwkundige en Toegepaste Biologische Wetenschappen, 66, 517-522.
Teixeira, A.A. & Rodriguez, A.C. (1990). Microbial population dynamics in bioprocess
sterilization. Enzyme and Microbial Technology, 12, 469-476. Temesvári, M., Paulik, J., Kóbori, L. & Monostory, K. (2011). High-resolution melting
curve analysis to establish CYP2C19∗2 single nucleotide polymorphism: Comparison with hydrolysis SNP analysis. Molecular and Cellular Probes, 25, 130-133.
Ter Beek, A. &, Brul, S. (2010). To kill or not to kill Bacilli: opportunities for food
biotechnology. Current Opinion in Biotechnology, 21, 168-174.
Thomas, L.V. & Wimpenny, J.W.T. (1996). Investigation of the effect of combined variations in temperature, pH, and NaCl concentration on nisin inhibition of Listeria monocytogenes and Staphylococcus aureus. Applied and Environmental Microbiology, 62 (6), 2006–2012.

References
252
Thorsen, L., Hansen, B.M., Nielsen, K.F., Hendriksen, N.B., Phipps, R.K. & Budde, B.B. (2006). Characterization of emetic Bacillus weihenstephanensis, a new cereulide-producing bacterium. Applied and Environmental Microbiology, 72, 5118–5121.
Ticknor, L.O., Kolstø, A.B., Hill, K.K., Keim, P., Laker, M.T., Tonks, M. & Jackson,
P.J. (2001).Fluorescent amplified fragment length polymorphism analysis of norwegian Bacillus cereus and Bacillus thuringiensis soil isolates. Applied and Environmental Microbiology, 67, 4863-4873.
Tourasse, N.J., Helgason, E., Økstad, O.A., Hegna, I.K. & Kolstø, A.B. (2006). The
Bacillus cereus group: novel aspects of population structure and genome dynamics. Journal of Applied Microbiology, 101, 579-593.
Tourasse, N.J. & Kolstø, A.B. (2008). SuperCAT: a supertree database for combined
and integrative multilocus sequence typing analysis of the Bacillus cereus group of bacteria (including B. cereus, B. anthracis and B. thuringiensis). Nucleic Acids Research, 36 (Database issue), 461-468.
Tourasse, N.J., Okstad, O.A. & Kolstø, A.B. (2010). HyperCAT: an extension of the
SuperCAT database for global multi-scheme and multi-datatype phylogenetic analysis of the Bacillus cereus group population. Database (Oxford), 2010:baq017.
Tourasse, N.J., Helgason, E., Klevan, A., Sylvestre, P., Moya, M., Haustant, M.,
Økstad, O.A., Fouet, A., Mock, M. & Kolstø, A.B. (2011). Extended and global phylogenetic view of the Bacillus cereus group population by combination of MLST, AFLP, and MLEE genotyping data. Food Microbiology, 28, 236-244.
Towner, K.J. & Cockayne, A. (1993). Molecular methods for microbial identification
and typing (1st ed.). London: Chapman and Hall. Tribst, A.A.L., Franchi, M.A. & Cristianini, M. (2008). Ultra-high pressure
homogenization treatment combined with lysozyme for controlling Lactobacillus brevis contamination in model system. Innovative Food Science Emerging Technologies, 9, 265-271.
Tuohy, M.J., Reja, V., Park, S., Perlin, D.S., Wnek, M., Procop, G.W. & Yen-
Lieberman, B. (2010). Use of a high-resolution melt assay to characterize codon 54 of the cyp51A gene of Aspergillus fumigatus on a Rotor-Gene 6000 instrument. Antimicrobial Agents and Chemotherapy, 54(5), 2248-2251

References
253
Turner, N.J., Whyte, R., Hudson, J.A. & Kaltovei, S.L. (2006). Presence and growth of Bacillus cereus in dehydrated potato flakes and hot-held, ready-to-eat potato products purchased in New Zealand. Journal of Food Protection, 69(5), 1173-1177.
U US Food and Drug Administration. (1988). Nisin preparation: affirmation of GRAS
status as a direct human food ingredient. Federal Register, 5, 11247.
V Valero M., Hernández-Herrero, L.A., Fernández P.S. & M.C. Salmerón (2002)
Characterization of Bacillus cereus isolates from fresh vegetables and refrigerated minimally processed foods by biochemical and physiological tests. Food Microbiology, 19, 491–499.
Valero, M., Fernández, P.S. & Salmerón, M.C. (2003). Influence of pH and temperature
on growth of Bacillus cereus in vegetable substrates. International Journal of Food Microbiology, 82(1), 71-79.
van Boekel, M.A.J.S. (2002). On the use of the Weibull model to describe thermal
inactivation of microbial vegetative cells. International Journal of Food Microbiology, 74, 139–159.
van de Guchte, M., Serror, P., Chervaux, C., Smokvina, T., Ehrlich, S.D. & Maguin, E.
(2002). Stress responses in lactic acid bacteria. Antonie Van Leeuwenhoek, 82, 187-216.
van der Spiegel, M., Luning, P.A., Ziggers, G.W. & Jongen, W.M. (2004). Evaluation
of performance measurement instruments on their use for food quality systems. Critical Review in Food Science and Nutrition, 44(7-8), 501-512.
van der Veen, S., Hain, T., Wouters, J.A., Hossain, H., de Vos, W.M., Abee, T.,
Chakraborty, T. & Wells-Bennik, M.H. (2007). The heat-shock response of Listeria monocytogenes comprises genes involved in heat shock, cell division, cell wall synthesis, and the SOS response. Microbiology, 153, 3593-3607.

References
254
van der Veen, S. & Abee, T. (2010). Dependence of continuous-flow biofilm formation by Listeria monocytogenes EGD-e on SOS response factor YneA. Applied and Environmental Microbiology, 76, 1992-1995.
van der Veen, S., van Schalkwijk, S., Molenaar, D., de Vos, W.M., Abee, T. & Wells-Bennik, M.H. (2010). The SOS response of Listeria monocytogenes is involved in stress resistance and mutagenesis. Microbiology, 156, 374-384.
van der Veen, S. & Abee, T. (2011). Bacterial SOS response: a food safety perspective. Current Opinion in Biotechnology, 22(2), 136-142.
van der Voort, M. & Abee, T. (2009). Transcriptional regulation of metabolic pathways,
alternative respiration and enterotoxin genes in anaerobic growth of Bacillus cereus ATCC 14579. Journal of Applied Microbiology, 107, 795–804.
Van Ert, M.N., Easterday, W.R., Simonson, T.S., U'Ren, J.M., Pearson, T., Kenefic,
L.J., Busch, J.D., Huynh, L.Y., Dukerich, M., Trim, C.B., Beaudry, J., Welty-Bernard, A., Read, T., Fraser, C.M., Ravel, J. & Keim, P. (2007). Strain-specific single-nucleotide polymorphism assays for the Bacillus anthracis Ames strain. Journal of Clinical Microbiology, 45, 47-53.
van Schaik, W., Tempelaars, M.H., Wouters, J.A., de Vos, W.M. & Abee, T. (2004).
The alternative sigma factor sigmaB of Bacillus cereus: response to stress and role in heat adaptation. Journal of Bacteriology, 186(2), 316-325.
van Schaik, W. & Abee, T. (2005). The role of sigmaB in the stress response of Gram-
positive bacteria-targets for food preservation and safety. Current Opinion in Biotechnology, 16(2), 218-224.
van Schaik, W., Tempelaars, M.H., Zwietering, M.H., de Vos, W.M. & Abee, T.
(2005a). Analysis of the role of RsbV, RsbW, and RsbY in regulating sigmaB activity in Bacillus cereus. Journal of Bacteriology, 187(16), 5846-5851.
van Schaik, W., Zwietering, M.H., de Vos, W.M. & Abee, T. (2005b). Deletion of the
sigB gene in Bacillus cereus ATCC 14579 leads to hydrogen peroxide hyperresistance. Applied and Environmental Microbiology, 71(10), 6427-6430.
van Zuijlen, A., Periago, P.M., Amézquita, A., Palop, A., Brul, S. & Fernández, P.S.
(2010). Characterization of Bacillus sporothermodurans IC4 spores; putative indicator microorganism for optimisation of thermal processes in food sterilization. Food Research International, 43 (7), 1895-1901.

References
255
Veal, D.A., Deere, D., Ferrari, B., Piper, J. & Attfield, P.V. (2000). Fluorescence staining and flow cytometry for monitoring microbial cells. Journal of Immunological Methods, 243(1-2), 191-210.
Vicik, S.J. (1995). EVOH oxygen barrier stretched multilayer film. Unit State Patent.
Patent number 5,382,470. Vilain, S., Luo, Y., Hildreth, M.B. & Brözel, V.S. (2006). Analysis of the life cycle of
the soil saprophyte Bacillus cereus in liquid soil extract and in soil. Applied and Environmental Microbiology, 72, 4970–4977.
Vilas-Boas, G., Sanchis, V., Lereclus, D., Lemos, M.V. & Bourguet, D. (2002). Genetic
differentiation between sympatric populations of Bacillus cereus and Bacillus thuringiensis. Applied and Environmental Microbiology, 68, 1414-1424.
W Wang, S.W., Chen ,C.Y., Tseng, J.T., Liang, S.H., Chen, S.C., Hsieh, C., Chen, Y.H. &
Chen, C.C. (2009). orf4 of the Bacillus cereus sigB gene cluster encodes a general stress-inducible Dps-like bacterioferritin. Journal of Bacteriology, 191(14), 4522-4533.
Wehrle, E., Didier, A., Moravek, M., Dietrich, R. & Märtlbauer, E. (2009). Detection of
Bacillus cereus with enteropathogenic potential by multiplex real-time PCR based on SYBR Green I. Molecular and Cellular Probes, 24, 124-130.
Wemekamp-Kamphuis, H.H., Sleator, R.D., Wouters, J.A., Hill, C. & Abee, T. (2004).
Molecular and physiological analysis of the role of osmolyte transporters BetL, Gbu, and OpuC in growth of Listeria monocytogenes at low temperatures. Applied and Environmental Microbiology, 70(5), 2912-2918.
White, H. and Potts, G. (2006). Mutation scanning by high resolution melt analysis.
Evaluation of Rotor-Gene 6000 (Corbett Life Science), HR-1 and 384 well LightScanner (Idaho Technology). National Genetics Reference Laboratory, Wessex.
Whiting, R.C. (1995). Microbial Modelling in Foods. Critical Reviews in Food Science
and Nutrition, 35(6), 467-494.

References
256
Wiegeshoff, F., Beckering, C.L., Debarbouille, M. & Marahiel, M.A. (2006). Sigma L is important for cold shock adaptation of Bacillus subtilis. Journal of Bacteriology, 188(8), 3130-3133.
Wijman, J. G., de Leeuw, P. P., Moezelaar, R., Zwietering, M. H. & Abee, T. (2007). Air–liquid interface biofilms of Bacillus cereus:formation, sporulation, and dispersion. Applied and Environmental Microbiology, 73, 1481–1488.
Wittwer, C.T., Reed, G.H., Gundry, C.N., Vandersteen, J.G. & Pryor, R.J. (2003). High
resolution genotyping by amplicon melting analysis using LCGreen. Clinical Chemistry, 49, 853-860.
Wittwer, C.T. (2009). High-resolution DNA melting analysis: advancements and
limitations. Human Mutation, 30, 857-859. Wu, Y., Griffiths, M. W. & McKellar, R. C. (2000). A comparison of the Bioscreen
method and microscopy for the determination of lag times of individual cells of Listeria monocytogenes. Letters in Applied Microbiology, 30, 468–472.
Wunschel, D., Fox, K. F., Black, G. E. & Fox, A. (1994). Discrimination Among the B.
Cereus Group, in Comparison to B. Subtilis, by Structural Carbohydrate Profiles and Ribosomal RNA Spacer Region PCR. Systematic and Applied Microbiology, 17(4), 625-635.
X Xue, G.P., Johnson, J.S. & Dalrymple, B.P. (1999). High osmolarity improves the
electro-transformation efficiency of the gram-positive bacteria Bacillus subtilis and Bacillus licheniformis. Journal of Microbiological Methods, 34, 183-191.
Y Yang, S., Ramachandran, P., Rothman, R., Hsieh, Y.H., Hardick, A., Won, H.,
Kecojevic, A., Jackman, J. & Gaydos, C. (2009). Rapid identification of biothreat and other clinically relevant bacterial species by use of universal PCR coupled with high-resolution melting analysis. Journal of Clinical Microbiology, 47, 2252-2255.
References
257
Yousef, A.E. & Courtney, P.D. (2003). Basics of stress adaptation and implications in new generation foods. In: Microbial Stress Adaptation and Food Safety. Yousef, A.E., Juneja, V.K. (Eds.). Boca Raton, FL, USA, CRC Press LLC.
Z Zhang, G.Q., Bao, P., Zhang, Y., Deng, A.H., Chen, N. & Wen, T.Y. (2011). Enhancing
electro-transformation competency of recalcitrant Bacillus amyloliquefaciens by combining cell-wall weakening and cell-membrane fluidity disturbing. Analytical Biochemistry, 409, 130-137.
Zhou, K., George, S.M., Métris, A., Li, P.L. & Baranyi, J. (2011). Lag phase of
Salmonella enterica under osmotic stress conditions. Applied and Environmental Microbiology, 77(5), 1758-1762.
Zigha, A, Rosenfeld, E, Schmitt, P. & Duport, C. (2006). Anaerobic cells of Bacillus
cereus F4430/73 respond to low oxidoreduction potential by metabolic readjustments and activation of enterotoxin expression. Archives of Microbiology, 185, 222–233.
Zigha, A., Rosenfeld, E., Schmitt, P. & Duport, C. (2007). The redox regulator Fnr is
required for fermentative growth and enterotoxin synthesis in Bacillus cereus F4430/73. Journal of Bacteriology, 189(7), 2813-2824.
Zipperle, G.F., Ezzell, J.W. & Doyle, R.J. (1984). Glucosamine substitution and
muramidase susceptibility in Bacillus anthracis. Canadian Journal of Microbiology, 30, 553–559.
Zwick, M.E., Kiley, M.P., Stewart, A.C., Mateczun, A. & Read, T.D. (2008).
Genotyping of Bacillus cereus strains by microarray-based resequencing. PLoS One, 3, e2513.
Zwietering, M.H., Jongenburger, I., Rombouts, F.M. & van't Riet, K. (1990). Modeling
of the bacterial growth curve. Applied and Environmental Microbiology, 56(6), 1875-1881.
Zwietering, M.H., Wijtzes, T., Rombouts, F.M. & van't Riet, K. (1993).A decision support system for prediction of microbial spoilage in foods. Journal of Industrial Microbiology & Biotechnology, 12, 324-329.
References
258
Zwietering, M.H., de Wit, J.C., Cuppers, H.G.A.M. & van’t Riet, K. (1994). Modeling of bacterial growth with shifts in temperature. Applied and Environmental Microbiology, 60, 204–213.
Web references
http://www.drive5.com/muscle Last access 06/07/2011. DOI: 10.1186/1471-2105-5-113. Edgar, R.C. (2004). MUSCLE: a multiple sequence alignment method with reduced time and space complexity. BMC Bioinformatics,113, 1-19.
https://www.tools.symprevius.org/Bcereus/english.php. Last access 06/07/2011. Contact: Guinebretière, M.H (Institut national de la recherche agronomique, Avignon, France).
http://blast.ncbi.nlm.nih.gov/Blast.cgi Last access 06/07/2011. Altschul, S.F., Gish, W., Miller, W., Myers, E.W., & Lipman, D.J. (1990). Basic local alignment search tool. J Mol Biol., 215, 403-10.


![Duarte revisitado portada [imprenta] - Banco Central de la ...](https://static.fdokumen.com/doc/165x107/631bf509c2fddc481907c5d4/duarte-revisitado-portada-imprenta-banco-central-de-la-.jpg)