PRICING WEATHER DERIVATIVES USING THE INDIFFERENCE PRICING APPROACH
Upload
khangminh22Category
view
3download
0
Bemnathan and Walters Port Pricing and Investment Policy x
Pub
lic D
iscl
osur
e A
utho
rized
Pub
lic D
iscl
osur
e A
utho
rized
Pub
lic D
iscl
osur
e A
utho
rized
Pub
lic D
iscl
osur
e A
utho
rized

Other Oxford booksfrom the World Bank
REDISTRIBUTION WITHGROWTHHollis Chenery, Montek S. Ahluwalia,C. L. G. Bell, John H. Duloy, andRichard Jolly"A major contribution to the literature ofincome distribution in less developedcountries."
-Journal of Developing Areas
"A rich and instructive contribution foranyone teaching economic development andthe complex relations between distributionand growth."
-Political Science Quarterly
"Exceptionally valuable analysis of develop-ment policies . . . Redistribution withGrowth, a model handbook for planners, isalso an extremely useful guide to the state ofthe discipline of development economics."
-journal of Economic Literature
324 pages. Figures, tables, bibliography.Available in cloth and paper editions.
PATTERNS OFDEVELOPMENT, 1950-1970Hollif Chenery and Moises SyrquinOffers a uniform econometric framework forintercountry comparisons to provide a con-sistent picture of the process of developmentas a whole.
250 pages. Figures, tables, bibliography.Available in cloth and paper editions.

a1~ WaLA Port Pricing ana Ivestment Policyr


Port Pricingand Investment Policyor Developing Countries
A World Bank Research Publication


Port Pricingand Investment Policyor Developing Countriesf~~~
Esra Bennathan and A. A. Walters
Published for the World Bank
Oxford University Press

Oxford University PressNEW YORK OXFORD LONDON GLASGOW
TORONTO MELBOURNE WELLINGTON HONG KONG
TOKYO KUALA LUMPUR SINGAPORE JAKARTA
DELHI BOMBAY CALCUTTA MADRAS KARACHI
NAIROBI DAR ES SALAAM CAPE TOWN
© 1979 by the International Bankfor Reconstruction and Development THE WORLD BANK
i818 H Street, N.W., Washington, D.C. 20433 U.S.A.
All rights reserved. No part of this publicationmay be reproduced, stored in a retrieval system,
or transmitted in any form or by any means,electronic, mechanical, photocopying, recording,
or othenvise, without the prior permission ofOxford University Press. Manufactured in the
United States of America.
The views and interpretations in this book are theauthors' and should not be attributed to the World
Bank, to its affiliated organizations, or to anyindividual acting in their behalf.
Library of Congress Cataloging in Publication Data
Bennathan, Esra.Port pricing and investment policy for developing countries.
Bibliography: p. 220Includes index.
I. Harbors-Port charges. 2. Underdeveloped areas-Harbors-Finance. 3. Underdeveloped areas-Investments,
Foreign. I. Walters, A. A., joint author. II. Title.HE9 5 i.B4 6 387.1 78-26143
ISBN 0-19-520092-6ISBN 0-19-520093-4 pbk.

Contents
Preface xiii
Acknowledgments xv
Introduction and Summary 3The Shape of the Study 5Concluding Comments 14
Chapter i. Ports and Ships 15Port Activities i6Ship Size, Port Time, and Cost 17The Structure of Port Prices 21
The Cost of Using Ports 22
Elasticity of Demand for Port Services:The Case of the Single Port 26
Chapter 2. Marginal Cost 31Short-run Marginal Cost Pricing and the Consequences 31Marginal Cost Pricing Principles in a
Noncompetitive Environment 35Variations in Demand and the Cost of Changing the Tariffs 37Pricing in Ignorance of Cost 40
Chapter 3. Economies of Scale 43Theorv and Implications of Port Cost 43Port Cost in Practice 55
Chapter 4. Congestion Levies and Surcharges 63Theory of Congestion 65Disadvantages of Congestion Pricing 82
V

vi CONTENm S
Congestion in Practice 82Appendix. Bilateral Monopoly and Strategic Behavior 95
Chapter 5. Port Prices and the National Interest 97Port Profit Maximization Compared with Marginal Cost Pricing 97Nationally Optimal Pricing and Incidence 201
Bilateral Monopoly: Ships and Ports 105Optimal Pricing with Passive Shipowners 0o8
The Incidence of Port Charges on Traders and Consumers 112
Perfect Competition in Shipping 114
Shipping Monopoly 115National and Foreign Shipping Lines 118Relevance of the Model 119Appendix A. A Model of the Profit-maximizing Port 121
Appendix B. Maximizing the Benefits to Nationals 124
Chapter 6. Strategic Pricing 134Pricing to Promote Competition 134Discrimination and Counterdiscrimination 139Appendix A. The Classes of Dry Cargo Vessels in the Ports of
Developing Countries 145Appendix B. A Simple Model of Origin-Destination
Discrimination 146
Chapter 7. Competition among Ports 150Inland Competition l5oTransshipment Competition 153The Effect of Containerization 158Economic Causes and Implications 163Appendix A. Container Services: Mainline and Feeder i68Appendix B. Container Transshipment Differentials in the Port
Tariffs of Port Kelang and Singapore 172
Chapter 8. Multipart Tariffs 177General Problems of Design 177Possible Designs of Multipart Tariffs 179Port Charges as a Percentage Levy 290
Concluding Comments 194
Chapter 9. Port Pricing in Practice 196The Base of Port Charges 197Marginal-Cost Pricing: Charging for the Use of the Uncongested
Channel 202
Marginal-Cost Pricing and Congestion Pricing: The Case ofStorage Charges 204
Loading Port Charges 206

CONTENTS Vii
Price Discrimination in Port Tariffs 209
Allocation of Resources by Rule 213
Glossary 215
Port and Shipping Terms 215
Domestic Currency Rates in Terms of Special Drawing Rights 219
References 220
Index 225


Figures
i.'. Derived Demand for Shipping and for Port Services in theCase of Fixed Proportions 27
2.1. Cost and Output 332.2. Cost and Output with Discontinuities 342.3. Variations in Demand 393.1. Port Cost with Diseconomies of Scale 453.2. Average Occupancy Rate at Which Costs are Minimized for
a Specific Number of Berths 483.3. Total Cost of Two Identical Ports and a One-Port Altemative 493.4. Cost and Discontinuities of Ports 524.1. Port Congestion with Competitive Shipping 664.2. Port Congestion with Monopolized Shipowner (or Cartel) 754.3. Demand for Ocean Transport and Derived Demand for Port
Services 774.4. Ship Delay versus Berth Occupancy, Port of Chittagong,
1972-73 835.1. A Port and Its Hinterland 995.2. Demand Curve for Port Services 1015.3. Bilateral Monopoly io6
5.4. Linear Demand Curves: The Profit-maximizing MonopolistAbsorbs Part of the Cost Change 110
5.5. Interaction of Port Price and Freight: The Case of ConstantElasticity of Demand for Shipping iii
5.6. Demand for Shipping and Demand for Port 113
ix

X FIGURES
5.7. Increasing Marginal Shipping Cost and Incremental Loss 1286.1. Kinked Demand Curve and Changes in Cost 1367.1. Demand for the Services of a Regional Transshipment Port:
"Small" Home Traffic and "Large" Transshipment Market 1547.2. Average Cost and Transshipment Pricing in Containers 16o7.3. National Port versus Regional Port 162

Tables
1 .i.. Share of Port and Cargo Expenses in Voyage Cost 23
1.2. The Composition of Payments in a British Port: Cases I andII, 1974 25
3r. Composition of Annual Part Cost for the Expected AnnualThroughput of Three Planned Berths, Port Kelang, 1974 56
3.2. Total Container Traffic and Facilities, 1973 583.3. Port Charges to the Consignee on Container Traffic 593.4. Canadian Container Port Capacity, Annual Container
Handling, and Charges 6o3.5. Cost per Metric Ton of Multiberth Port (Alongside) Berths at
Henecon (1971 US$) 6i4.1. Indicators of Congestion at Two Major Indian Ports, 1969-70 854.2. Main Charges to a Simulated Standard Ship and Cargo at
the Wharf, Port Authority of Thailand, Port of Bangkok,1974 Rates 88
4.3. Congestion Surcharges on Shipments to Bombay andKarachi, 1973 93
6.1. Classes of Vessels in the Ports of Singapore and Bangkok,1966 and 1967 146
6.z. The Share of Conference Lines in the Cargo Tonnage ofRoutes into and out of Bangkok, 1966 to 1967 147
7.1. Port of Singapore Authority Tariff, 1973: TransshipmentDifferential per Ton of Conventional Cargo for aHypothetical Vessel 155
xi

Xii TABLES
US./Far East Container Ship Operators: Direct and FeederServices, October 1975 169
7.3. Shipping Freight Cost per Ton, Europe-Bangkok on theEurope-Japan Route, 1972 171
7.4. Port of Singapore Authority Tariff: Transshipment Differentialper Container and per Ton of Containered Cargo for aHypothetical Vessel, 9,ooo GRT, 1973 173
7.5. Transshipment Differentials for Containers: Port Kelang(1974 and Proposed 1975) and Port of Singapore (1972and 1973) 174
9.1. Four Ports in Developing Asia: Indicators of Output, 1974 198

Preface
SINCE WORLD WAR II, international trade has expanded at rates ofgrowth never before achieved. The reduction in the relative cost oftransport and particularly of ocean shipping has had much to dowith this progress. During the past two decades there have been dra-matic changes in the technology of shipping and in the associatedtechnologies of ports. Substantial capital expenditure on vessels hasbeen accompanied by large investments in ports. Unlike oceanshipping, the ports of developing countries are usually owned bygovernments; thus the cost of these large investments is part ofgovernment development programs. The surpluses or deficits of portauthorities become part of the government's budget, and the financialhealth of a port is a matter for general concern.
The main instrument by which port authorities can cover theircosts-or indeed earn a surplus-is the system of port tariffs. Butthese prices for port services are not merely instruments for ensuringbalanced accounts; the port tariffs have important effects in encourag-ing or discouraging the use of port services: the occupation of quaysand cranes and loading of warehouses and godowns. Variations inport charges can considerably affect the efficiency with which theport is used. And better use of existing assets is a desirable preliminaryto any expansion of assets. Similarly, for new ports it is best to ensurethat they are used as efficiently as possible.
In its operations in developing countries, the World Bank hasencountered a large variety of pricing practices and widely diverse
xiii

XiV PREFACE
effects on efficient port operation. In the belief that there must be asystematic set of principles that would much improve port pricing,professors Esra Bennathan (of the University of Bristol) and A. A.Walters (then of the London School of Economics) were asked toundertake this study.
The main conclusion of their sometimes involved discussion is thatthe main basis of port tariffs should be marginal cost. But within thisgeneral conclusion, certain rather surprising and unorthodox recom-mendations emerge, such as the proposal that ports should chargecongestion levies. I believe that these investigations represent a sub-stantial contribution to knowledge and have produced ideas thatthat could have wide practical utility. Thus, the World Bank ismaking the study available for general circulation. The World Bankis not necessarily endorsing the view of the authors, however, nor is itrecommending that such principles be invariably used in port pricingand planning. (Indeed, the authors themselves emphasize that theirprinciples have not been tested adequately in the hard school ofexperience.) And whatever the reader's final judgment on the issuesraised and explored in the following pages, I am sure that this volumewill be considered a stimulating contribution to the continuing debateon pricing and investment policy.
CMRISTOPHER R. WnLLoucGYDirector, Transportation Department
The World BankMay 1979

Acknowledgments
THE AUTHORS HAVE BENEFITED from criticism and discussion withmany colleagues. They would especially like to thank Edward V. K.Jaycox, Anthony A. Churchill, Clell G. Harral, A. J. Carmichael,Miguel E. Martinez, Benjamin B. King, Jenifer A. Wishart, and themany other members of the staff of the World Bank who gave muchtime and thought to the ideas advanced in this study. Trevor D.Heaver and C. Ruppenthal reviewed some of the ideas at an earlystage of the work. Stephen C. Littlechild and B. J. Abrahamssonprovided many detailed comments on the manuscript, which haveassisted the authors in improving the text. V. Kanapathy and RajaLope in Kuala Lumpur and Donald Blake and Danko Koludrovic ofthe United Nations Economic and Social Commission for Asia andthe Pacific in Bangkok made most useful contributions to the researchprogram. The research assistants, S. R. Hill, Georgina Brookfield, andAngela Edge, provided untiring support.
In addition, the authors have received the cooperation and assist-ance of many port authorities in Bangladesh, Seattle (United States),Bristol (England), Vancouver (Canada), India, Malaysia, Philippines,Singapore, and Thailand. Without such assistance, it would havebeen impossible to complete this study.
Virginia deHaven Orr edited the final manuscript. Brian J. Svikhartdirected design and production of the book, Harry Einhorn read andcorrected proofs, the Graphics Unit of the World Bank's Art andDesign Section prepared the charts, and Joan Culver indexed the text.
xv


Port Pricingand Investment Policyfor Developing Countries


Introduction and Summary
THE ORIGINS OF THIS STUDY lie in the widespread dissatisfaction withthe economics of ports in developing countries. In our first foraysinto the field, we tried to survey the existing principles of port eco-nomics in the hope that we could elucidate the foundations for portinvestment and tariff policies. We failed, however, to find any co-herent and widely accepted doctrine which provided a basis forpolicy.
Yet there is broadly the same motivation for all policies on ports-the promotion of the national interest. But such a general andamorphous idea has not prevented the development of widely differingprinciples which underlie the pricing policies and investment pro-grams of ports. Probably the two best-known principles may be con-veniently, if inaccurately, called the (continental) European andthe Anglo-Saxon doctrines. The European doctrine views the port aspart of the social infrastructure of a whole region. The value of aport should be assessed not in the accounts of the facilities butin terms of the progress of industry and trade in the hinter-land. Thus, the European doctrine holds that it is certainly notnecessary that the port break even, or perhaps eam a profit, either onexisting or proposed investment; justification is pursued and usuallyfound well outside the perimeter of the port. The Anglo-Saxon viewis that, notwithstanding the benefits to the hinterland, the port, likethe tub, should stand on its own bottom. At least it should not incur
3

4 INTRODUCTION
a loss and at best should earn a reasonable profit.' So the mainrationale for investment proposals and tariff policy is that they makemoney.
Whether the European or Anglo-Saxon view is embraced, thepolicymaker has still little to guide his hand. The national interestsNvhich are supposed to motivate the European are elusive and nebu-lous. Nevertheless, most people would agree that the term somehowexpresses the spirit which should guide port policy. Clearly it isnecessary to develop and give meaning to the concept of nationalinterests. So, in this study, we normally have defined national interestsas the greatest possible benefits accruing to the nationals or residentsof the country. To the developing countries this means that thebenefits accruing to the foreign shipowners or suppliers should not beconsidered; only domestic effects matter. This will then give content,form, and substance to the development of pricing and investmentpolicy.
Similarly, the Anglo-Saxon principle of balanced budgets provideslittle guidance on actual tariff policy. In practice, the gap has beenfilled by nostrums similar to those hallowed by use in railwayfreight tariffs. Perhaps the most famous of these is "charging whatthe traffic will bear" and its various adjuncts such as "pricing topromote traffic." These notions have a firm basis in theory and thevaluable characteristic of manv years of practical use and success. Butit is not clear that they can be made to satisfy a national interestobjective. Thus, there appears to be a real conflict between the Euro-pean and Anglo-Saxon traditions.
But the confusion of principles and confficts of policy are not themost important reasons for undertaking this study. More persuasivethan these inadequacies is the fact that, throughout the developingcountries, ports are often either the bottleneck or the white elephantof development programs. The contrast between the three-monthqueues at Lagos in 1975 and the gaunt underused container berths inmany countries should suggest that, at least, all is not well. It wouldbe arrogant and quite wrong to suppose that the only thing amisswith the ports of the world is their economic policies. Yet withoutthe right economics, ports will be plagued by problems of long queuesor empty berths. Worse still, benefits will leak away to foreign ship-
1. Over the years the labels European and Anglo-Saxon have been quite dis-credited by practice, but they are convenient and do refect underlying attitudesand principles.

INTRODUCTION 5
owners and traders. Economic analysis is by no means sufficient tosolve these problems and plug the leak, but it is a necessary part ofthe solution.
The Shape of the Study
In the following chapters, we concentrate on one important aspectof port economics-the pricing or tariff policy-and we generally giveshort shrift to investment problems. The two are closely related, butwe have pursued the issues of tariff policy largely because they applygenerally to all countries, whereas investment problems are usuallymore specific and sometimes unique. Furthermore, it may be sug-gested that a sensible tariff policy is a prerequisite of an appropriateinvestment program. Thus, we indicate only the outline and generaldirection of investment plans that would result from our suggestedprinciples of port pricing. The following sections summarize the find-ings of this study chapter by chapter.
Ports and ships
Since ports are the intermediaries between ships and domestictransport, they take on some of the technological and economic com-plexion of their customers. The size of ship and the time spent inport are important factors in determining the cost per ton of shipping,and the depth of the dredged channel and the speed of loading anddischarging cargo are usually dominant elements in the cost of ports.These relations are at the heart of much shipping and port economics.
Several conclusions are drawn from this analysis, many of whichare entirely consistent with common intuition. First, the optimumsize of vessel increases with the (square root of the) distance of thevoyage. Second, assuming that the port and shipowner fix chargeson the basis of the cost of providing services, the port authority canhave a dominant influence in securing least-cost shipping-and thegreatest national benefit-by an appropriate tariff and investmentpolicy. Port tariffs ought to reflect the relative cost of the servicesprovided so that the appropriate ship technology is chosen. Third,contrary to intuition, it is more efficient to have one capacity-ton ofa large ship idle and queueing in the roads than one capacity-tonof a small ship. This implies that an investment that reduces waitingtime will tend relatively to benefit the trade carried in the smaller

6 INTRODUCTION
vessels. However, investments that raise the rate of cargo workingtend to increase the size of the minimum-cost ship. The importantconclusion is that, by its capital program, a port can affect not merelythe cost of shipping services but also the competitive conditions theyare supplied under.
On the other hand, the main exogenous determinants of the pricingor tariff policy of a port are the conditions of demand. Assuming thatthere is no competition between ports and that port and ship servicesare required in fixed proportions, the elasticity of demand for portservices will be small-around 0.1 (absolute) is the appropriate orderof magnitude.2 If that were really the case, pricing policy would thenbe a matter of merely revenue collection. But it is not. There aremany opportunities for substitution in the short run and many morein the long run, which increase the elasticity considerably. The fixedproportions assumption is a serious travesty of the facts. And in manycases, there is vigorous competition between one port and another.Thus, there are many advantages to be obtained from appropriatepricing and tariff policies: demand can be induced to shy away fromthose facilities that are crowded and to settle on those that are under-used.
Marginal cost
The basis of all port tariffs should be short-run marginal cost,which measures the resources used up by supplying a unit of portservice. It is the appropriate basis for pricing even when the authori-ties have made mistakes with their investment policy or where theport has experienced large and unexpected changes in demand.But strictly setting price equal to marginal cost is best onlyin a perfectly competitive free economy or in an efficient socialisteconomy. In practice, the port is confronted with organized andlargely foreign-owned shipping cartels; thus, there is no reason tosuppose that fixing prices at marginal cost would be best for thecountry. It is at least possible to develop port pricing arrangementsthat take some, if not. all, of the surplus away from the foreigners.
Marginal cost is also required for efficient management. Althoughthere is often considerable and sometimes total ignorance about totalcost, the authorities should use marginal cost to set prices (or the
2. Elasticity of demand is the percent change in the quantity demanded inresponse to a 1 percent charge in the price.

INTRODUCTION 7
variable charge) so that the facilities are used efficiently. The portauthorities probably know the assigned variable cost of providing theservice; thus, the tariff should be checked to see that it at least coversthis variable cost.
Economies of scale
One of the abiding disadvantages of marginal cost pricing is thatthe policy will result in a financial deficit where there are economiesof scale. For a given country with a specified distribution of resources,economies of scale in ports are likely; the larger the port, the lowerthe cost. But ultimately the cost of internal transport will ensurethat diseconomies become dominant; where the population of acountry is sparse and widely dispersed, domestic distribution costparticularly will constrain port size.
The existence of economies of scale in ports suggests that there isindeed substantial, albeit theoretical, support for the European doc-trine of subsidized ports. But it is important to examine all the im-plications of such subsidies including the effects on efficiency andadministration as well as on the distribution of resources. Taxes thatmust be raised to finance the subsidies are usually expensive to collect,involve substantial distortion of effort, and are often imposed ontraded goods (in excise and import or export levies) -precisely thecommodities whose trade is supposedly promoted by the port subsidy.Such subsidies will tend to politicize the issue of port tariffs, andinterest groups will form to compete for and to bid up the subsidy.In particular port labor will be encouraged to exploit its bargainingpower on the soft featherbed of a state handout. And there will beno budgetary check, whether weak or strong, to inhibit the growthof the port bureaucracy. The general conclusion is that, despite thetheoretical case for subsidies, there are powerful practical argumentsagainst them.
Congestion levies and surcharges
In many developing countries the high demand for very limitedport services causes congestion. This suggests that there are goodreasons to eam high profits in the ports by raising congestion charges.If the demand for a service is very high, relative to normal conditions,the price of that service should be increased so that users have theincentive to economize on the scarce service. Port authorities rarely,if ever, respond in this way. Normally, they keep prices low. Thus

8 INTRODUCTION
large queues of vessels form in the roads, and shipowners are quickto add their queuing cost to the freight rates. The domestic producerand consumer pay for the real cost caused by scarce port capacity andthe fact that the port authority does not raise its tariffs.
The main issue is, however, a positive one: what would be theconsequences of the port raising a congestion levy? And more ger-mane still, would the residents of the country be better off thanunder the low port price and queuing regime? Generally the price ofthe overall shipping service (freight rates plus port charge) will riseabove the value which would apply if the port did not charge a con-gestion levy. The increase in price, however, is likely to be consider-ably less then the congestion levy. If the demand for port services isinelastic, the port will increase its revenue-even when shipping is amonopolized service-at the expense of domestic traders. Congestioncharges will give the authorities a source of finance to extend portfacilities. And they mav also increase the throughput of the portconsiderably if the congestion charges are levied only on those particu-lar facilities (such as transit sheds) that are congested.
From this survey of congestion, it is concluded that there is apowerful case for the ports charging congestion levies. However, thecase is based on our general understanding of economic forces andon a close study of the nature of the shipping business and its inter-action with the domestic economy; we cannot point to the experi-ence of any port which has introduced such charges. Until suchcrucial experiments have been made, the case for such charges cannotbe substantiated.3
Port prices and the national interest
Although, as defined, congestion clharges would add considerablyto the revenue of a port, they are unlikely to generate the maximumprofit that the port could earn. And it is worthwhile to consider theconsequences of profit maximization, largely because there are severalcases wvhere the ports have overexpanded or where conventional
3. An interesting analogue is the congestion levies for urban areas. The casefor such levies, argued in many studies (for example, A. A. Walters, Economicsof Road User Charges, World Bank Staff Occasional Papers, no. 5 (Baltimore:Johns Hopkins Press, 1968) ), remained speculative until the area licensing schemewas introduced in Singapore in 1974. Then, although many mistakes were made,the undoubted success of that scheme showed that the theoretical and empiricalstudies had predictive relevance. The same may be true of port congestion charges.

INTRODUCTION 9
facilities are in excess supply and where the port authority, followingan Anglo-Saxon policy, might resort to monopolistic restriction tocover its financial obligations. To explore the implications, a simplemodel of a hinterland to a monopolist port is used. Using profit-maximizing principles, the monopolist port authority would be in-duced to reduce traffic to a flow equal to four-ninths of its (marginalcost) potential. Although these results are derived from an idealizedmodel, they do suggest that the consequences of an unfetteredmonopolist port would not be felicitous.
Therefore, the more difficult criterion is pursued-national benefit.Assuming, for simplicity, that all ships are owned by foreigners, pricesand tariffs should be set so that the marginal gain to domestictraders and consumers is just equal to the marginal loss of the port.Although easy to state, this is very difficult to put into operation. Themain problem is to predict the relation between port tariff and freightrate.
Much depends, of course, on competitive conditions in the ship-ping industry that supplies the services. As a general rule, it willalways be advantageous for a country to be faced by many competitiveshipowners rather than by one cartel or monopoly. In the extremecase of a bilateral monopoly where the shipping company pursuescomplex interaction strategies, there are no rules for the port tofollow-except, of course, to abjure policies that get it into such asituation. With a passive shipping monopoly, however, the extent towhich a given increase in the port tariff is passed on to the traderdepends critically not merely on the elasticity of demand but on thechange in the elasticity as the quantity of throughput increases. Bothtechnological and economic conditions suggest powerful reasons forsupposing that the elasticity of demand for shipping services declinesas the quantity of throughput increases. Intuitively, it is unwise to sub-sidize port operations if the gain in traffic becomes rapidly smalleras the subsidy grows. In the case of competitive shipping, therefore,the port charge that will maximize the national benefit will exceedthe marginal cost of the port. Only if the elasticity of demand isconstant (an unlikely case) is the optimum port tariff equal to themarginal port cost.
Strategic pricing
To unravel some of the knotty issues of port pricing it is essentialto assume that the port cannot affect the competitive environment

10 TNTRODUCTION
of the shipping firms that use its facilities. But such an assumptionis often inappropriate. By their investment and pricing arrangements,ports can have a significant effect on the competitive structure oftheir shipping services. At first sight, the casual evidence of shippingfreight rates seems to discredit such a proposition. Certainly for linerconferences it appears that considerable variations in port charges orconditions do not appear in differences in freight rates. This isbecause conference rates do not reflect the niceties of changes incost but are determined mainly by the pressure of the competitiveshipping sector. The possibility of arranging portariffs and invest-ments so that they benefit -competitive shipping and so bring pressureto bear on the monopoly power of the conference is one that mightusefully be remembered in designing port policies; but again toomuch should not be expected. It is doubtful whether it is possible or,if feasible, whether it is desirable to attempt directly to use port pric-ing to offset geographical or commodity discrimination by confer-ences. However, there are good grounds for considering the develop-ment of ship charges or cargo levies and other forms of multipartpricing to encourage bulkers and tramps. Thus, port tariff policies maybe used strategically for the benefit of nationals.
Competition among ports
Ports often are considered to be simple but formidable monopolies.For many ports in developing countries, this has been and sometimesstill is a useful caricature. But increasingly, the monopoly prices whichports once enjoyed are being eroded. In part, this has been caused bythe development of internal transport links that enable ports to com-pete for similar catchment areas that may straddle national bound-aries. In recent years, the development of containerization hasprovided even more interport competition and has reversed the generaldecline in transshipment business. Main container terminals, whichmust be very large, will be able to serve efficiently a wide region, suchas a region larger than Southeast Asia. Consequently, there is keencompetition to be a main terminal and the entrepot of the rapidlyexpanding container business.
Naturally, the port will be tempted to discrirminate in its tariffsagainst the captive domestic traffic and in favor of boxes transshippedthrough the main terminal on route to other feeder ports. In Singa-pore, there is a sharp discrimination between domestic and trans-

INTRODUCTION 11
shipment traffic. Using certain assumptions about marginal cost forconventional traffic, the implied elasticities of demand for a profit-maximizing port can be calculated. For container traffic, the elasticitiesare probably much higher. This discrimination in tariffs may enablethe large container port to break even or perhaps to earn a profit andprovides vigorous competition for shipowners' calls. But correspond-ingly, container consortia can play off one port against another. Portsthat have sunk substantial funds in container facilities are not in acommanding position. In this event, the overbuilding of containerfacilities and discrimination against domestic shippers and in favor oftransshipment traffic may result in subsidization of shipowners by thenational exporters and importers and governments of developingcountries.
Multipart tariffs
The pattern of port cost as well as strategic reasons suggest thatport tariffs would be best developed as two-part or multipart systemsof pricing. But there are many obstacles. Perhaps the main impedi-ment is that, unlike electricity supply, ports do not always invest inspecific pieces of plant associated exclusively with the supply ofservices to a particular shipowner. Since much of the business iscasual, it is impossible to introduce multipart tariffs for all services.There always must be the option for a one-off call.
Nevertheless, there are many ways of introducing two-part tariffs.Lease-a-quay (LAQ) is perhaps the most obvious form. Although itis clearly efficient and profitable, because of the need for flexibilityand for the avoidance of tie-in arrangements, it should be adopted onlyon a limited range of specialized services. Since services such as bulkcarriage and container operation are likely to grow rapidly, however,the LAQ will have expanded applicability eventually. Another possi-ble arrangement is an annual fee to enter (AFTE) the port. The mostimportant purpose of this method of charging is to recover dredgingcost in a port where there is little or no congestion. The AFTEshould be set so that it encourages the large bulker and the non-conferenceer. Among the many variations of the AFTE is the quantitydiscount system. This would entail a reduced fee for each visit as thenumber of calls increases. Thus it would encourage greater efficiencyif the price charged for the final visit could be brought nearer to themarginal cost of the ship call. There appears to be considerable scopefor various forms of AFTE pricing in developing countries.

12 INTRODUCTION
Perhaps the most compelling argument for two-part tariffs can befound in container services. Containerization is expanding rapidly inworld trade. Yet in many developing countries there is existing orincipient excess capacity. It is also known that striking economies ofscale are ubiquitous in container operation. A system whereby a rentalcharge should be levied for the use of the port by a container ship issuggested; and a low tariff, not much above marginal cost, should beexacted for handling a container. This will encourage containerizationto be used instead of conventionally handled traffic, will increase therevenues of the port, and will use the vast sums of capital sunk incontainer quays more efficiently.
One of the abiding complaints of all tariffs is that they are toocomplicated. The plea is for simplicity and comprehension. Onesimple approach that has been used in rail charges is to levy the porttariff as a percentage of the freight charge. The administrative sim-plicity is not the only attraction of such a system. It would encouragegreater frequency and flexible freight rates, and it would discriminatein favor of the short-sea routes where there is least ability to pay. Theport charge would vary automatically with the oscillations in freightrates and with the general rate of inflation. There are, however, severalside effects that are likely to be undesirable; these would have to beweighed and judged in each case. Generally, there is some consider-able scope for the percent-of-freight charge, and it needs further prac-tical exploration.
Port pricing in practice
Recommendations for the various forms of two-part tariffs do notimply that a speedy reorganization of port charges on a grand scaleshould be pursued. On the contrary, a slow but steady reform is best.To illustrate the state of existing tariffs and to show what might bedone, tariffs in certain ports in South and Southeast Asia-Singapore,Kelang (Malaysia), Bangkok, and Chittagong (Bangladesh) -arediscussed.
A most important issue in planning port tariffs is to find an appro-priate base so that tariffs reflect relative cost. Present practices fixberth hire and channel dues according to the capacity (usually NRT)of the ship, or a berth is rented at a fee which does not vary with thesize of the vessel as in Hong Kong and Chittagong. However, theappropriate base is the length of the ship; this measures the amount

INTRODUCTION 13
of quay that is occupied. But it is also important for a port to chargemore for the more desirable and convenient berthspace; then the portwill appropriate the money value of the benefit conferred by thatadvantageous location.
Designing charges that encourage a quick turnaround of vessels isparticularly important for handling operations. This suggests thathandling labor charges should be based not merely on the quantity oftonnage but also on the rate of throughput. Singapore has a dockageremission coefficient that operates successfully along these lines, andit could be applied in other ports.
The application of the principle of marginal cost pricing seems tobe particularly appropriate in two cases, namely the charges for useof the dredged channel and for storage. Provided that there is nocongestion, once the channel is dredged to any given depth, thepassage of a vessel of any draft will impose only the small marginalcost of turbulence erosion. Yet in practice, dredging charges increasedramatically with the draft of the vessel. This penalizes the efficientlarge ship and inhibits large bulker competition with the conferencering. Although it is assumed generally that warehouse storage shouldbe charged at cost, there is a wide divergence between charge and costfor transit sheds. And there are many cases where the inability toclear transit sheds has determined the throughput of the port. Thecase for marginal cost pricing is a strong one.
The need for ports to load port tariffs to raise revenue has ledto various practices of discrimination with unintended side effects.Discrimination is also practiced in pursuit of wider economic ob-jectives, perhaps the most important of which is to favor exportagainst import cargo. To channel aid to exporters through port tariffsdoes not seem to be the ideal way to subsidize exports, and in prac-tice such subsidies tend to be offset by commodity export taxes. Theresult is confounded and confused. In discriminating by commodity,the ports generally tend to reproduce the same differentials as thoseused by the conference and thus reflect the ability to pay. But con-tainerization is eroding such differentials.
Port facilities that are not allocated by the pricing mechanism willbe distributed among competing users by some administrative rule.Although some allocation by rule always will be efficient, there isconsiderable scope for extending the port price system. Priorities willthen have to be paid for, and the port will receive the appropriatereward.

14 INTRODUCTION
Concluding Comments
The purpose of this study is to elucidate and to criticize principlesfor guiding policy. The consequences of various forms of port pricingpolicies and their effects are evaluated. But, of course, the main weak-ness of this study is the fact that there are few examples where themethods of pricing discussed have been put even partially into opera-tion. What would happen in practice can be inferred only indirectly.Unfortunately, there are no experimental results to provide the acidtest of these propositions.
But policy cannot await the long process of scientific methodology.Decisions have to be made on existing evidence, whether fragile orrobust. However, there are many aspects of port tariffs that cry outfor reform and for which there is no need to seek further justificationthan that of simple reasoning and, often, common sense. Decisionson these can proceed apace. But many of these proposals do requiremuch further thought and reflection before being inflicted on thepractitioner. Many a ghost has been laid to rest, many specters alsohave been raised.

Chapter 1
Ports and Ships
TuE RANGE OF ACTiVITIES in individual ports may differ greatly, butall ports have several activities in common. The basic activity con-sists of the ownership of land, quays, piers, and port surface. The porteither maintains and controls these facilities itself or rents them outto other parties. Many ports are also conservancy authorities, responsi-ble for maintaining and dredging the channel to the harbor and forthe control and safety of traffic in those channels, including theprovision and maintenance of navigational aids, pilotage, towage, andtugging. The port typically owns and operates or rents mechanicalequipment such as cranes, forklifts, and trailers. It owns and operatestransit sheds which form part of the standard general cargo berth andalso open or sheltered storage areas beyond the sheds. It frequentlyowns warehouses that it either operates itself as warehouseman orrents to shippers; ports are thus often landlords on a large scale.Finally, most ports employ at least some of the labor required formoving cargo, but the degree of control over cargo operations formsone of the chief differences between ports.
Some ports, for example, those of Singapore or Port Kelang, employdirectly all the labor required for moving cargo, whether on board(stevedores) or ashore (wharf labor). Elsewhere, for example, in Chit-tagong or Bangkok, stevedoring is carried out by licensed contractors,and private labor sometimes is employed for certain shore operationsalso. Labor in container freight stations may again be either privatelyemployed or port labor. The widespread trend toward decasualization
15

i6 CHAPTER 1. PORTS AND SHIPS
of port labor and the introduction of long-term wage contracts hasmeant that more and more ports have had to become the directemployers of all the labor normally working for them. In practice, ithas also meant that port employment is being extended to all thelabor working in the port's confines.
The port, however, may not be free to reduce its labor force at will.Its freedom to adapt its labor force to produce at minimum cost isoften circumscribed by law, by contract, or by political conditions. Inthat case, labor has to be considered an item of fixed cost Marginalcost of labor operations is zero until the force is employed fully onone shift, and only when overtime rates have to be paid will marginalcost become positive. But all this is merely a crude simplification ofa situation which is complicated through specialization, demarcationrules, and union arrangement.
Port Activities
The services produced by these activities fall into three major cate-gones:
Sea-related services: provision of access to the port by buoys andmoorings, berths, pliots, and tugs and lighters.
Land-related services: cargo handling by port labor, port's cranes,other equipment and vehicles, and storage (in sheds or open).
Delivery-related services: handling (for example, to customs orconsignee's vehicle), container freight station (stuffing/stripping),warehousing, and port's own transport.'
The list of services supplied in each category is far from exhaustive,but it indicates some of the main substitution possibilities that existin ports. Some users demand only the services of one department,such as vessels calling for bunkers or for shelter. The different cargosvstems-tankers, dry bulk transport, conventional break-bulk orunitized general cargo or container transport-each impose their ownpattern on port use. For most of the users, however, demand for portservices is joint, that is to say, most of them require a combination ofberth space, tug towing, cargo handling, warehousing, cranage, andso forth. But the proportions that they require the services in are not
1. Port and shipping terms used throughout this volume are defined in theGlossary following Chapter 9.

SHIP SIZE, PORT TIME, AND COST 17
fixed and vary considerably. This characteristic of the demand forport services has great importance for the effectiveness of port pricingand will be discussed later in this chapter.
Ship Size, Port Time, and Cost
In later chapters some of the effects that ports and ships exert oneach other through the prices they charge and through variations inthe shipowners' demand for port services and in the ports' supply areconsidered. In this section, the effect of port conditions, investments,and charges on the cost of shipping are analyzed in general terms withthe aid of a simple model. Each of the services involved is assumed tobe priced at long-run average (equal to marginal) cost. Thus it isassumed that there is perfect competition in the shipping industryand that the price for providing port services is set competitively.This competitive model is not meant to be a realistic representationof reality; in many respects it is not. But some sort of benchmark isneeded if the phenomena and the data available are to be disen-tangled, and the competitive model provides the easiest categories tointerpret.
Some choice is available in slanting the analysis; it can be workedeither through the cost conditions of the shipowner or through thecost decisions of the port authority. Experience shows that the mostinteresting problems are those relating to the choice of ship tech-nology, so the former approach has been chosen. The analysis con-centrates solely on the cost that is borne by the shipowner and thatis passed on to the shipper or customer as a consequence of differenttechnologies and vessel sizes.
To simplify the analysis, also suppose that the ship is full and thatthe total cargo is loaded or discharged in one operation. Thus, thetime that the ship spends in port during each ship call depends onthe rate at which it can unload cargo. For the same technology, thedaily tons moved for a ship of size C may be approximated as:L + mC, where L and m are constants. Thus, the time in portmeasured in days (T,) is:
(1) Tp, = C(L + mC)-t
The daily cost of operating a ship in port is:
(2) Kp A + gC [g -O; A 0],

18 CHAPTER 1. PORTS AD SHIPS
where A is the fixed cost and g the variable cost for each ton reflect-ing daily operating cost of the ship in port as well as the variouspayments in the port. A difficulty arises because certain costs of callingat ports, such as the cost of steaming into and out of a port, are notaffected by the number of days spent in port. But there is a consider-able indirect relation between the size of vessel and the cost of acall, which is reflected in the coefficient g. The analysis assumes thatthe call cost, which is independent of size and length of stay, is smallenough to be neglected.
Port charges, as distinct from port costs, are included in both theA and g; again, the linear approximation is taken for simplicity.
The cost of a port call for each ship is then:
(3) TAK =C(L+mC)-'(A+ gC).
The only other variable needed is the cost of operating a ship fora day at sea. Suppose this can be linearized as: B + hC, with B asthe fixed cost and h as the variable cost for each ton. Also assumethat speed is the same for all vessels so that the distance of the voyageis strictly proportional to the number of days for each voyage, D.The sea cost of a voyage is: D(B + hC). Thus, the cost of a com-plete voyage, including two port calls, is:
(4) V = D(B + hC) + 2C(L + mC)-'(A + gC).
Under competitive conditions, and even under monopoly conditions,if the monopolist is pursuing maximum profits, the technology chosenwill be that which minimizes voyage cost per ton: that is, min V/C.Equation (4) is divided by C, differentiated with respect to C,equated to zero, and solved for the minimum-cost size of vessel:
(5) C = mLDB - L [2(gL - mA)DBTh
[2(gL - mA) - m2DBI-1.
Although this result seems rather complicated, several basic con-clusions emerge. First, there is a basic tendency to a "square rootlaw," such as appears in the simple models of inventories and othermodels of economies of scale. The result can be seen most starklyby supposing that m = 0 and that L is strictly positive, so that what-ever the size of ship, it can unload only L tons a day. Then:
(6) C = +± \(DBL/2g)
(only the positive root is relevant). The greater the distance D, thelarger the vessel size.

SHIP SIZE, PORT TIME, AND COST 19
Second, the critical role played by port cost and by the efficiencywith which vessels can be loaded or discharged is shown in the gen-eral formula. The size of vessel varies according to the order(gL - mA) `h. In words the bracketed term is:[Port- 1 Tons Increase in _
cost unloaded tons unloaded Fixedfor each day, - each day for port
each irrespective additional costton _ of size - _DWT of ship_ _
In this term certain elements are controlled by the port directly;they are contained in ship's cost in port for each ton (which includesthe port's charges for each ton) and in its fixed port costs. But cer-tain others are clearly those over which the port authority has onlyan indirect effect, such as the tons unloaded each day irrespectiveof size and the fraction of cargo unloaded during an additional dayin port. The port controls directly the prices that are levied for itsservices, but it controls only indirectly the choice of technology ofthe shipping companies. But, of course, L and m are determined bythe shipping companies in association with the port conditions. Itmay be thought, however, that L is largely under the control of theport authority. The authority can choose the load-per-day (L) valueby most of its investment decisions made either in the past or to bemade in the future (including general facilities and cargo sheds).Assume that the port's control is greatest over g (which contains thebulk of port charges, including handling cost) and L (which isaffected by the port's general efficiency, layout, and equipment). Ifthat is so, the port influences the size of vessels and thus the extentto which its national shippers obtain the economies of shipping inlarge vessels.2 One may envision a minimization procedure in whichthe shipping company chooses a technology, as embodied in L, m,A, g, B, and h, such that V/C is minimized subject to specific re-
2. This conclusion holds for bulk shipments and, to a much lesser extent, forgeneral cargo traffic. An instructive illustration of the effect of port improvementon speed of cargo working and, through it, on vessel size was discovered in theWorld Bank's study on the port of La Goulette which was improved by theconstruction of a specialized berth and silo for cereals and by dredging. The speedof unloading rose in consequence from 600 tons/day/ship to 1,300 tons. Beforethe project, only about 12 percent of arriving ships had a draft of over 8 meters;after it, the share of the larger classes rose to 65 percent. Miguel Martinez, "Dis-tribution of Benefits of Port Improvements: Case Study of the Port of LaGoulette (Tunisia)" (study prepared for the World Bank, 1976; processed).

20 CHAPTER 1. PORTS AND SHIPS
actions on the part of the port authority in terms of the port chargecomponent of g and A and perhaps also of L. Stated as such, that isan intractable problem. It can be simplified by supposing (realisti-cally?) that the port authority's reaction is passive; that is to say, itpursues no deep tactical policy but simply offers its stipulated servicesat a specified rate. Then the question is what functional interde-pendencies exist between the L, m, A, g, and B and for differenttechnologies.
In comparing these parameters for the conventional and containerconditions much depends on the use of berths and particularly thesingle common berths. However, as a very rough approximation, itis assumed that the container ship and port technology imply thatm = 0. Thus the number of containers moved each day does notvary with the size of the ship. For large container ships, additionalcranes will be used; but in any case, container throughput is limitedlargely in the transit storage areas.8 For container operation, therefore,interest will center primarily on an element in the value of g-theport cost for each ton. This varies enormously with the size of ship.The provision of a short-sea (small ship) or feeder service berth canbe operated at about one-third to one-half the cost of a deep-sea largeship berth.4 A simple application of the formula above can be ob-tained by writing C = L. Suppose that B is constant and does notvary from small ship to large ship; that is, the cost of a ship-day at seacan be linearized as suggested. Then the resulting size of ship de-pends on port cost and distance. If the long distance voyage isassumed to be ten times the short voyage and the port cost for eachton for small ships to be roughly twice that for large ships, it can beseen that the large ships would be two-and-a-half times the size ofthe small ships.5
An interesting development of this model is possible by introducingidle time (I) to account for queuing or a minimum time in port.Thus, assume that each ship has to spend a full I days in port, butthat a fraction a of this time can be used for cargo working. Voyage
3. For accuracy, it should, however, be said that the assumption holds onlyfor relatively small numbers of containers on any one vessel. Thus the port's costfor each container may be assumed to be relatively insensitive to the number ofcontainers aboard for the range of 0 to 350 units which typically move duringeach vessel call in secondary Asian ports.
4. See H. K. Dally, "Containers-a Note on Berth Throughputs and TerminalHandling," National Ports Council Bulletin (London), no. 4, (April 1973),pp. 60-65.
5. C = DBL/2g, Di.., = IODbo,,t, C = L, gioLg = 2gshort.

THE STRUCTURE OF PORT PRICES 21
cost, corresponding to Equation (4) but with the additional assump-tion of an inescapable minimum stay in port, now becomes:
(7) V = D(hC + B) + 2I(A + gC)+ [ 2C _-2cI] (A + gC),
subject to [C/(L + mC)] > aI. Again the shipowner is relied uponto minimize voyage cost for each ton (V/C). After differentiatingwith respect to C, equating to zero, and solving for the minimumcost C, a moderately complicated result is obtained. This is againamenable to various simplifications. The feature of all solutions isthat the minimum cost size of ship increases with the days of idle-ness. For example, if m = 0 and L > 0:
(8) C = V(L[DB + 2AI(1 - a)]/2g).
The optimum size of vessel increases with idleness. This result seemsagainst intuition, but a little further thought shows that it is con-sistent with common sense. Larger ships are cheaper per DWT soit is better to keep a big-ship DWT in idleness than a small-shipDWT. The same result does not follow if the cost of the ship ratherthan the cost of a DWT is of concern.
Two important conclusions follow when idleness is identified withcongestion. First, the cost of shipping into a small congested portthat is unsuitable for large ships will be greater than for an equallycongested port that does not place the same constraints on ship size.Second, port developments that remove congestion will benefit smallvessels particularly. One of the barriers to shipowning is therebyreduced. This is the exact opposite of the result of increasing thespeed of cargo working in an uncongested port. Improvements thatraise the amount of cargo that can be worked in a day (L or m) actjust like lengthening the voyage distance (D). Other things beingequal, such improvements in port facilities or ship design will increasethe minimum-cost size of ship. By the same token, they will raise abarrier to entry into the shipping industry.
The Structure of Port Prices
The prices charged by ports, however great the differences in detail,fall broadly into two categories: user charges and service charges.User charges include dues levied on the ship for each call, which varycontinuously with one or more of the vessel's dimensions and dis-continuously with the length of stay; river conservancy dues; dues
22 CHAPTER 1. PORTS AND SHIPS
falling on cargo (for example, wharfage) levied usually on the quan-tity of cargo moved; and storage fees which cover sheds and ware-houses. Service charges include charges for the use of labor and an-cillary equipment, which vary with the amount of the service used inmoving the cargo; cranage charges, which vary with the amount ofcrane service consumed; mooring and berthing charges; pilotage,which varies normally with the dimensions of the vessel (such asCRT and draft); and towage and tugging.
For conventional break-bulk cargo, the general rule is that the shipis charged ship dues and stevedoring charges, and the shipper ischarged with the rest except for the use of port equipment such ascranes, the charge for which may be distributed between the twoparties. Liner terms usually include the entire cost of moving the cargofrom the ship to the transit shed or vice versa in the freight rate. Con-tainerization, if it involves through transport, normally changes thesystem by placing all port charges on the party which controls themovement, usually the sea carrier. In the case of chartered vessels, onthe other hand, the charterer (corresponding to the shipper) willnormally pay all that is due in the port.
The Cost of Using Ports
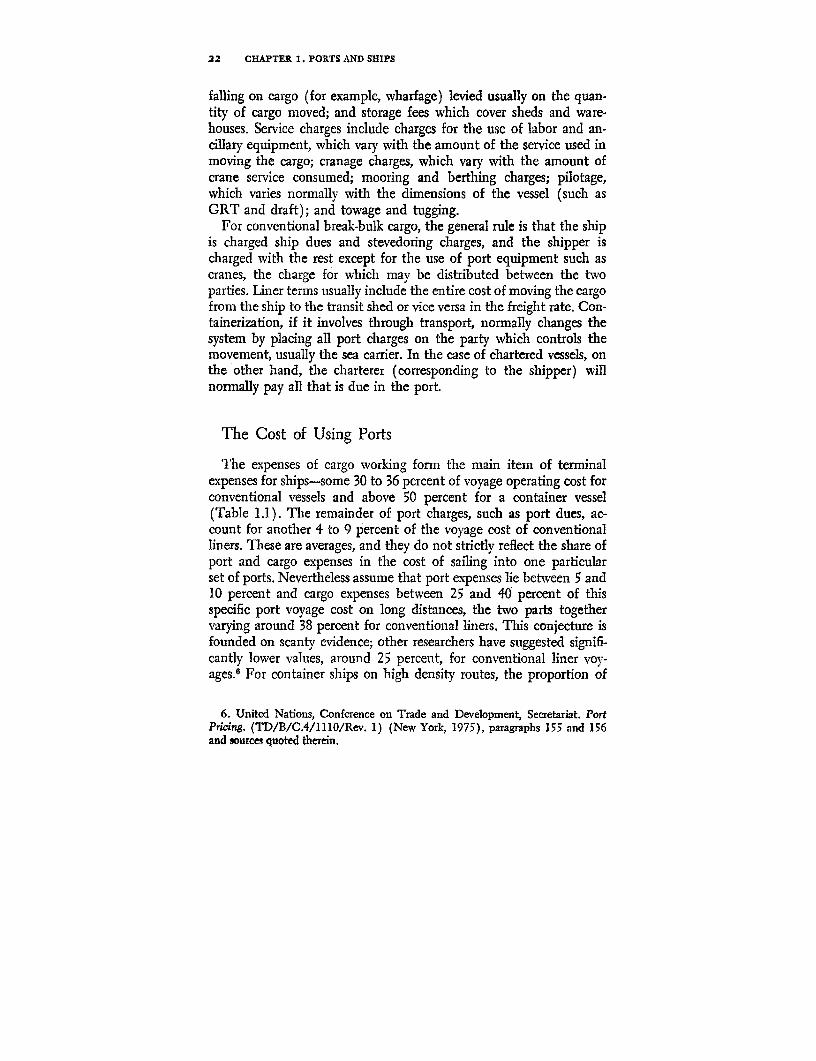
The expenses of cargo working form the main item of terminalexpenses for ships-some 30 to 36 percent of voyage operating cost forconventional vessels and above 50 percent for a container vessel(Table 1.1). The remainder of port charges, such as port dues, ac-count for another 4 to 9 percent of the voyage cost of conventionalliners. These are averages, and they do not strictly reflect the share ofport and cargo expenses in the cost of sailing into one particularset of ports. Nevertheless assume that port expenses lie between 5 and10 percent and cargo expenses between 25 and 40 percent of thisspecific port voyage cost on long distances, the two parts togethervarying around 38 percent for conventional liners. This conjecture isfounded on scanty evidence; other researchers have suggested signifi-cantly lower values, around 25 percent, for conventional liner voy-ages.6 For container ships on high density routes, the proportion of
6. United Nations, Conference on Trade and Development, Secretariat. PortPnicing. (TD/B/C.4/1110/Rev. 1) (New York, 1975), paragraphs 155 and 156and sources quoted therein.

THE COST OF USING PORTS 23
TABLE 1.1. SHARE OF PORT AND CARGO EXPENSES IN VOYAGE COST
Percentage of total costexcluding depreciation
Cargo Other portVessel and voyage expenses expenses
a. Single round voyageConventional liner, modern 560,000 cubic
feet (10,000 DWT); Europe-Far Eastround voyage; 1971; 143 days (14-30days in port); utilization: approximately90 percent 29 7.0
Conventional liner, 10 years old, 6,400DWT; Bangkok-Japan round voyage;1970; 56 days (23 days in port); utiliza-tion: approximnately 80 percent 37 9.5
b. Annual overall voyage cost, 1969 dataBreak-bulk, 3 years old, 711,000 cubic feet
(12,500 DWT), 20 knots; assumed daysat sea, 185; annual output capability,11.20 X 109 ton miles 36 9.0
Containership, built 1971, 1,210 TEU,23 knots; assumed days at sea, 253; annualoutput capability, 27.2 X 10⁹ ton miles 56 8.0
Note: Information in brackets supplied by authors as typical of the route.Sources:a. Data outside brackets from B. M. Deakin, Shipping Conferences, University
of Cambridge, Department of Applied Economics Occasional Papers, no. 37(Cambridge: Cambridge University Press, 1973), pp. 117-118.
b. Adapted from James R. McCaul, Robert B. Zubaly, and Edward V. Lewis,"Increasing the Productivity of U.S. Shipping" (paper read at the Spring Meeting,Williamsburg, Va., May 24-27, 1972, no. 3. New York: the Society of NavalArchitects and Marine Engineers, 1972).
cargo expenses appears to be rather higher (especially if the cost ofstuffing and stripping LCL containers is included), and the twocategories of ship's port expenses may amount to 60 percent ofspecific voyage cost.7
The share of port expenses in voyage cost is, however, only anincomplete measure of the cost of using ports. First, for the ship-owner there is also the cost of keeping the ship in port. Conventionalliners on long distance trades may spend approximately one-half of
7. Others have proposed significantly higher values.

24 CHAPTER 1. PORTS AND SHIPS
their annual voyage time in port.8 Port expenses plus the cost of timein port may then amount to about 60 percent of annual voyage cost.For container ships this proportion may be higher.
Second, the liner ship is normally charged only part of the portexpenses arising during a normal cargo call; the rest is charged to theshipper. From the economic point of view, this division is arbitrary,and it does not of course occur in the usual charter operation. If thecost of using the port is to be accurately established, the shipper's pay-ments should be added to the ship's expenses, and, since they formpart and parcel of the cost of transporting the goods, they will alsohave to be added to the voyage cost. The size of these payments maybe deduced from the figures in Table 1.2, which is derived from amedium-sized British port in 1975. If, therefore, it is assumed thatthe shipper pays to the port roughly as much as the ship and thatthe ship's port expenses are 38 percent of its voyage cost, then thecombined port expenses will be 56 percent of the augmented voyagecost.
So far, the port expenses have been compared with the total oper-ating cost of a voyage. That is the appropriate calculation to deter-mine the effect of changes in cost which affect all ports equally, thatis, to determine predominantly the effects of general changes in porttechnology or in intemational wage movements. But if the questionis narrowed down to the effect of changes in the costs or charges ofone port, then the fact that the voyage cost associated with one ship-ment includes two sets of cargo expenses must be allowed for. Thismay be dealt with (at the cost of a minor inaccuracy) by halvingthe ratio of the ship's aggregate port expenses to voyage cost, from25-38 percent to 13-19 percent.9 If liner companies used port servicesand other resources in strictly fixed proportions, it would follow from
8. B. M. Deakin. Shipping Conferences, University of Cambridge, Departmentof Applied Economics Occasional Papers no. 37 (Cambridge: Cambridge Uni-versity Press, 1973), p. 116 and Producers Boards' Shipping Utilization Com-mittee, New Zealand, New Zealand's Overseas Trade: Report on Shipping, Ports,Transport, and Other Services (New Zealand and London, February 1964), pp.39-41.
9. The higher percentage arises from the earlier conjecture that port expensesform 38 percent of voyage (operating) cost; the lower one corresponds to thelower estimates accepted by United Nations, Conference on Trade and Develop-ment, Secretariat. Port Pricing. (TD/B/C.4/1110/Rev. 1) (New York, 1975),paragraphs 155 and 156.

THE COST OF USING PORTS 25
TABLE 1.2. THIE COMPOSITION OF PAYMENTS IN A BRITSH PORT:
CASES I AND II, 1974
Percentage of totalJbayment in port
Total payment made in port = 100 percent I 11Dues
Ships dues 18.3 10.3Import dues (wharfage) 20.2 13.9
Cargo working; cases and bags, ex-ship to truck
Stevedoring (excluding cranage) 19.1 20.8(24.1)'
Port labor (excluding cranage) 32.3 54.9'(37.3)'
Cranage 10.1 n.a.Payments by ship = 100 percent
Dues 43 33Stevedoring (including cranage) 57 67
Payments by shipper = 100 percentDues 35 20Labor (including cranage) 65 80
Note: Case I: vessel of 6,400 NRT (1,200 DWT), long distance voyage,staying 1 day, discharging 532 metric tons, mixed cargo. Case I1: vessel of 4,359NRT (10,345 DWT), long distance voyage, staying 1½ days, discharging 545metric tons, mixed cargo.
a. Including cranage which could not be distinguished in Case II.n.a. = not available.
the numbers that a 10 percent across-the-board increase in portcharges would raise voyage cost by 1.3 to 1.9 percent. Whether freightrates also rise in a similar proportion will depend first on whetherdepreciation and profit, which was excluded from voyage cost, can thusbe neglected and on whether the liner industry is competitive. But ifthe increase in voyage cost is passed on fully to the shipper, insofaras he makes separate payments to the port, he will have to pay morethan this. Assume again that port charges are paid by the ship andthe shipper in equal amounts. Then, if liner companies pass on thefull increase in port cost, the shipper's total transport cost will rise by2 to 2.8 percent in response to a 10 percent increase in port charges.10
10. The higher percentage arises from the earlier conjecture that port expensesform 38 percent of voyage (operating) cost; the lower one corresponds to thelower estimates accepted by UNCTAD, Port Pricing.

26 CHAPTER 1. PORTS AND SHIPS
Elasticity of Demand for Port Services:The Case of the Single Port
The most obvious factor that determines the elasticity of demandfor the services of one port is the ease with which another port canbe used in its stead. Interport competition raises its own issues ofpolicy and pricing, and these are dealt with separately in Chapter 7.In this section, competition between ports is eliminated altogether.Thus it is assumed that there is no altemative port accessible to thecountry and that the only alternative to using the port is not to exportor import at all. Assume also that:
(a) There is perfect competition in the shipping industry (forexample, tramps);
(b) Port charges do not vary with the quantity of throughput;(c) The country exports a commodity which is a small part of a
large world market;(d) There is a rising supply curve of the export commodity at the
port gate (resulting from internal transport cost, limits of cultivation,or some other limiting factor); and
(e) It is not possible to substitute port services for shipping servicesor vice versa; port services and shipping services must be supplied infixed proportions.
These conditions are illustrated in Figure 1.1 where the supplyc.i.f. includes the steamship (tramp) cost of OS per unit and theport charges of SH per unit. Equilibrium is where the country ex-ports the quantity X.
The elasticity of demand for the services of the port is calculatedby making a small proportionate change ASH/SH and calculatingthe effect on the quantity AX/X. With the c.i.f. supply elasticitydenoted by c, the elasticity of demand for port services is clearlygiven by:
(9) (SHI/OP) Xeor in words: FThe fraction of port cost 1 Elasticity of su,pply
L in the c.i.f. ,srice j X with c.i.f. Price JThis is, of course, nothing more than Marshall's old law, and itdemonstrates that, in the absence of port competition and by the pre-sumption of fixed proportions, the elasticity of demand for portservices is likely to be very low.

ELASTICITY OF DEMAND FOR PORT SERVICES 27
FIGURE 1.1. DERIVED DEMAND FOR SHIPPING
AND FOR PORT SERVICES IN THE CASE OF FIXED PROPORTIONS
Price
Supply c.if.
p Demand c.i.f.
Port charge +H steamship cost
s Steamship cost
X Throughput
The share of port charges in the c.i.f. price of goods can be esti-mated either directly from samples of consignments in different portsor indirectly through the share of port charges in transport cost andthe proportion of freight cost to the c.i.f. price. A few direct estimatesfor liner cargo have been published.1' Those that appear to have been
11. Notably, D. Shoup, Ports and Economic Development (Washington, D.C.:Brookings Institution, 1967). Also, Organization for Economic Cooperation andDevelopment, "Ocean Freight Rates as Part of Total Transport Costs." (Paris,1968), pp. 15, 29. A certain amount of evidence can also be derived from UnitedNations, Economic and Social Council, Economic Commission for Latin America,ECLA/OAS Joint Transport Programme, Maritime Freight Rates in the ForeignTrade of Latin America, part I (E/CN.12/812/Rev. 1) and part II (E/CN.12/812/Add. 1) (New York, 1970; processed), appendixes VI and VII. Shipper'spayments to the port are not, however, included.

28 CIlAPTER 1. PORTS AND SHIPS
made on the inclusive basis which was adopted in the preceding sec-tion (including cargo expenses as well as payments by shippers orconsignees) show a wide range of values, but most of the observationsfall between 1.5 and 3 percent. Our own indirect estimates, usingdata from a variety of sources,12 lead to slightly higher estimates. Onbalance, however, the proportion of total port charges in c.i.f. pricewill lie below 5 percent of ci.f. value for most countries and mostcommodities.
It would be supposed then that the elasticity of demand for theport services is only 5 percent of the elasticity of supply of the com-modity. Such elasticities of supply as have been calculated suggestvalues of no more than five, and usually values of around unity aremore appropriate.18 Thus the elasticity of demand for port servicesclearly is likely to be less than 0.2 even under the most propitiouscircumstances, and probably 0.1 is the most sensible lower limit underthe assumptions listed above.
The assumption that the demand curve c.i.f. is perfectly elasticcan be changed easily. With a downward-sloping demand curve ofgiven elasticity, the increase in the port charge would raise the finalprice (c.i.f.) and so modify the seduction in throughput as the supplycurve is raised. The greater the inelasticity of demand, the greater theinelasticity of demand for port services, and of course this adds evenmore credibility to the presumption of a highly inelastic demand forport services. In the case of imports, this inelastic demand model maybe more useful than the inelastic supply model. It may be supposedthat imports are supplied on the world markets in perfectly elasticsupply (except for variations in port charges) and that the demandis not perfectly elastic but reflects the availability of possible homesubstitutes for the imported commodities. In this case, the simpleMarshall formula applies; the demand elasticity of the port servicesis equal to the demand elasticity for imports multiplied by the fraction
12. OECD, Ocean Freight Rates as Part of Total Transport Costs; ECLA,Maritime Freight Rates in the Foreign Trade of Latin America; our own studyof the cost of ocean transport in the regional and extra-regional trades of Bangkok(to be published); United States Congress, Subcommittee on Federal Procure-ment and Regulation of the Joint Economic Committee, Discriminatory OceanFreight Rates and the Balance of Payments, Hearing. 89 Cong., 1st sess., June 30,1965. (Washington, D.C.: U.S. Government Printing Office, 1965), pp. 414-441.
13. See A. A. Walters. "A Development Model of Transport," AmericanEconomic Review (Papers and Proceedings), vol. 58, no. 2. (May 1968), pp.360-377.

ELASTICITY OF DEMAND FOR PORT SERVICES 29
of port charges in total c.i.f. price.14 Again, many econometric studiessuggest that the elasticity of demand for imports may be well belowtwo.15 Even allowing for a considerable downward bias in these esti-mates, it is clear that the elasticity of demand for port services mustbe very low, assuming the rigidity of fixed proportions and the absenceof competitive ports.
If these low elasticities existed in practice, the issue of pricing theservices of the port would be largely irrelevant. Certainly variations inthe price of the port service would have little effect on the quantity.Then it would be important to plan the appropriate level of facilitiesof the port, and, as far as the distribution of resources is concemed,it would matter little what price was levied. However, the port wouldbe a most useful source of revenue for govemment.
In fact, these calculations of elasticities are entirely misleading.Their main fault is that they ignore the very large opportunities forsubstitution.
The port produces a wide variety of services, each with its ownunique competitive conditions. Consider first, for example, the dock-ing and quay facilities of a port. Clearly the substitutes for suchfacilities can only be docks and quays elsewhere, that is to say, acompeting port. The storage facilities that are provided by the porton the other hand can more or less equally well be provided by privateentrepreneurs or truckers. Thus there is great competition in thesupply of storage, and the port may be considerably constrained in itscharging practices. These constraints operate whether or not the portas a supplier of bonded storage is protected by the existence of cus-toms duties coupled with high interest rates. The elasticity of demandfor the services of the transit shed as such may, therefore, be veryhigh indeed. Even for quay occupancy there may be considerableopportunities for substitution. The most dramatic examples of theseeffects are in the use of palettes or other more advanced unitizedmethods of cargo handling. There is, furthermore, a high degree ofsubstitutability between ship's gear and port cranes. Similarly, thereis the choice between working cargo alongside the quay and loading
14. See E. Bennathan and A. A. Walters, The Economics of Ocean FreightRates, Praeger Special Studies in International Economics and Development(New York: Praeger, 1969), Technical Appendix, note 1.
15. Compare, for example, H. S. Houthakker and S. P. Magee, "Income andPrice Elasticities in World Trade," The Review of Economics and Statistics,vol. LI, no. 2. (May 1969), pp. 111-125.

30 CHAPTER 1. PORTS AND SHIPS
or unloading over the side into lighters that have access to shallowberths or that may distribute it directly to private wharves.
The substantive issue is that the port services consist of an a lacarte selection rather than a fixed menu. Even though a shipowneris compelled to patronize the port, there are many opportunities forcost-reducing substitutions.'6 These opportunities vary considerablyaccording to the time allowed for adjustments. Some may involve theadaptation of equipment of a vessel, and others may involve buildinga different type of vessel.
Therefore, the fixed proportions model is unlikely to be appropriatefor most ports and leads to a serious underestimation of the long-runelasticity of demand for the services of the seemingly monopolisticport.
16. If all the prices of port services are increased proportionately, the extent ofsubstitution will be different for each type of service.

Chapter 2
Marginal Cost
ONE OF THE MAIN THEMES of this study is that an appropriate basisfor pricing port services is the marginal cost of supplying the services.One of the first tasks is to develop the principles of marginal costpricing in their applications to ports. The background to marginalcost pricing has been described in some detail in its application tohighways, and this survey is restricted to the highlights.
Short-run Marginal Cost Pricingand the Consequences
The argument for marginal cost pricing is that, under conditionswhere the rest of the national economy behaves (or is planned tobehave) as if perfect competition existed, the price should be setequal to the cost of the resources absorbed in producing the service.If the price exceeds the cost, too little of the service will be produced,and resources will be used inefficiently to produce other commoditiesand services. Similarly, if the price is below the cost, too much of theservice will be produced relative to the quantity of other goods.
But what marginal cost is appropriate to be considered here-short,long, medium, or some combination? Only a conditional answer canbe given to this. If it is assumed that it costs very little to change theprice, then the short-run marginal cost is an appropriate basis forpricing. If, however, the price is costly to change (or administratively
31

32 CHAPTER 2. MARGINAL COST
difficult, which amounts to the same thing), then a somewhat longer-run marginal cost is the proper criterion. The constraints on the move-ment of prices (or the shadow price of such constraints) should bethe only reason to switch from the short-run basis of marginal cost tothe longer-run basis.
Whether short-run marginal cost is less than or exceeds the long-run marginal cost depends, among other things, on the existence ofreturns to scale in the port industry and on whether the capital stockand equipment is adjusted to the level of output to allow productionat least cost. First, suppose that the demand conditions for futuretraffic levels are known exactly and that the port authorities haveinvested wisely to ensure the best technology for their scale of opera-tions. This means that the port authorities are conducting their busi-ness at minimum cost and that the average long-run cost is the sameas the average short-run cost.
But short-run and long-run marginal cost (SRMC and LRMC)will be equal only if there are constant returns to scale for the levelsof traffic for which the facilities have been built, as can be seen inFigure 2.1. Pricing the services at short-run marginal cost will attractjust enough traffic to cover the port's cost. For traffic levels substan-tially lower, however, the port facilities would be underused and theshort-run marginal cost would fall below the long-run marginal cost.For these low levels of tonnage there would be economies of scale.The general result, therefore, is that with no economies of scale, ifthe port has the optimal level of traffic, the long- and short-runmarginal costs are equal. Furthermore, if there are economies of scale,levying a price of SRMC=LRMC will give rise to deficits.
Now assume that the port authorities are not perfect administratorsand that, being perhaps human, they make mistakes. Thus thewharves and equipment are not always appropriately adjusted to thelevel of traffic, perhaps because tonnage grew at an unanticipatedhigh (or low) rate. Suppose, for example, that the demand turnedout much larger than the authorities anticipated. Thus the short-runmarginal cost will be high, reflecting the scarcity of port capacity, andwell above the long-run marginal cost. If the port tariff were fixednear the value of long-run marginal cost, inefficient congestion wouldresult. The tariff should reflect the scarcity value of the port's facilitiesas measured in the short-run marginal cost; then congestion wouldbe virtually eliminated.
Suppose, on the other hand, that the authorities overbuild theirports. Then the short-run marginal cost is well below the long-run

SHORT-RUN MARGINAL COST PRICING 33
FIGURE 2.1. COST AND OUTPUT
Cost ($)
LRMC
SRAC, SRMC|
oXs X4 X. X¢ Output of servces
Note: SRMC, = short-run marginal cost associated with the ith plant and tech-nology; SRAC, = short-run average cost; LRMC, = long-run marginal cost;LRACi = curve associated with the ith plant and technology.
value. But if long-run cost was levied, the use of the underutilizedport would be discouraged; thus the short-run is the appropriate valuefor the tariff.
The overall result, therefore, is that the long-run marginal cost isa suitable basis for pricing only when it happens to be the same asthe short-run marginal cost, and this will occur only when the authori-ties predict their output and capacity correctly. However, the short-run marginal cost is always an appropriate base for pricing, irrespec-tive of the efficacy of the authorities' forecasts and planning andwhether or not they make mistakes. This seems to be a good reasonto concentrate solely on short-run values. If the tariff is set at short-run marginal cost when there are increasing returns to scale, a deficitis likely; there will be a surplus only when the authorities fail toexpand the plant by a fairly large margin and operate the port underhighly congested conditions.
So far the assumption has been that the port authorities could make

34 CHAPTER 2. MARGINAL COST
continuous adjustments in the size of plant and that, similarly, laborand other factors may be hired in small numbers. In practice theremay be rather large discontinuities in port construction and opera-tions. Such lumpiness does not change the substance of the aboveconclusions, but they may change the weight which should be ac-corded to them. For example, the argument that short-run marginalcost is always correct and long-run marginal cost only occasionallycorrect as a basis for pricing still stands, but when there are largelumps of plant involved and a few discontinuous jumps from one sizeto another, the long- and short-run marginal costs will coincide forwide ranges of output from the same size of plant. Long-run marginalcost would therefore be an appropriate guide for pricing policy for alloutputs if the authorities did not operate too small or too large aplant (Figure 2.2). Consider, for example an authority that producedoutput XH with plant 1. Clearly it would be inappropriate to charge
FIGURE 2.2. COST AND OUTPUT WITH DISCONTINUITIES
SRMCi
Cost ($) /
H SRMC,
//i ~~~~/
SRAC, I I /
0Xg Xl Output of services
Note: Definitions as in Figure 2.1.

MARGINAL COST PRICING PRINCIPLES 35
a low price shown by the SRMCZ (LRMC), and the proper price isHXH. As before, the long-run marginal cost is appropriate only if thesize of plant corresponding to the measure of long-run marginal costhas been constructed and is operating. If the value of long-run mar-ginal cost corresponds to a hypothetical correct plant which differsfrom the actual plant, then the LRMC is irrelevant.
Marginal Cost Pricing Principlesin a Noncompetitive Environment
The arguments for marginal cost pricing spring from the assump-tion that the price of a resource measures its marginal cost. This con-dition may arise in a capitalist economy if there is perfect competitionin other activities. Marginal cost pricing may be obtained in a socialistor dirigiste economy by fiat of the authorities who regulate prices.But both are ideal states-like perfect vacuums or perfectly accuratemeasures; in fact neither in a socialist nor in a market economy canmarginal cost pricing be precise. Mistakes will be made, monopolieswill arise, taxation will distort prices, political pressure will be broughtto bear, and so on. The question is whether a rule of pricing that isstrictly relevant only when ideal marginal-cost-equals-price conditionsare present can be used also in the mundane world of mistakes andimperfections.
To answer this question it is necessaiy to consider some alternativeprinciple. As substitute for marginal cost pricing the only really seriouscandidate is average cost pricing. (For this discussion the combinationsof the two which are characteristic of two-part tariffs are ignored.)It is true that when marginal cost and price differ in the rest of theeconomy, there is no simple rule for adjusting the marginal price ofthe port. In particular, even though prices are above marginal costin the rest of the economy, it is not known whether the port tariffshould be above or below marginal cost. Nevertheless, if the com-petitors for the specific resources used by the port (for example,capital) charge prices that are considerably above marginal cost, thenit may be wise to raise tariffs above marginal cost in the port; other-wise the port may expand too much and take too many of these scarceresources from the other industry. (However, this supposes that theresources are not producible, which is not true in the case of capital.)
As far as competition for resources is concerned, decisions can

36 CHAPTER 2. MARGINAL COST
only be made on the evidence presented by the particular circum-stances. Much depends on whether the competing demands for theresources used by the port come from commodities or services thatare competitive with or complementary to port services. In particular,if the competing buyer of capital produces complements to the port'soutput (for example, road transport to or from the port), the mostadvantageous pricing rule would be for the port to set its prices belowits marginal cost and vice versa for the case where the competitor forthe port's resources is the monopolistic producer of goods or servicesthat are substitutes for the port's output (for example, another na-tional port or import-competing production in general). As a prac-tical matter it seems that the main competitor for resources is prob-ably road transport, including the provision of highways. The outputof road services usually complements that of port services-but theyare often produced in conditions of energetic competition. Othercompetitors for resources may be domestic construction industries.Here again competitive conditions are usually observed. Therefore,it is deduced that there are no substantial arguments for pricing belowmarginal cost.'
Whether prices should be levied substantially above marginal costdepends, among other things, on the structure of competition amongthe customers of the port. The most interesting case here is the linerconference and its relation with the traders who, in turn, compriseits customers. These considerations involve many problems about thereaction of the shipping conferences to changes in their cost and willhave to be pursued at length elsewhere.
The alternative principle of average cost pricing is difficult to definein a unique way when there are many services performed by broadlythe same activities. The common cost of central activities must beallocated arbitrarily among the different services produced by theport. There is no unique measure of average cost for the multiproductfirm. In many costing studies common cost is allocated according toweight, or some other measure of volume, or perhaps according tosome measure of what the traffic will bear, or some combination ofthe two. But of course the allocations are not of interest for pricingpurposes except as approximations of the avoidable cost of providingthe services.
1. Where highway transport is a substitute for port services-that is to say,where there are land alternatives to sea transit-this follows directly from therule stated earlier.

VARIATIONS IN DEMAND AND THE COST OF CHANGING THE TARIFFS 37
Perhaps the most important aspect of noncompetitive behavior inthe shipping and port business is the practice of conferences. The portmay not compete with monopolies for its resources, but neither doesit sell all of its services in a perfectly competitive market. It is oftensensible to assume that the traders in a country and the traders of itstrading partners are in a competitive environment, although there areexceptions in state trading and marketing organizations. Since theport sells services directly to traders and since traders can decide moreor less freely how much they will buy (storage services seem to be acommon example), there is no problem of a monopsonistic purchaser.But with the charges levied against the ship for port services, theauthorities must deal with the monopsonistic conference.
The confrontation of monopoly and monopsony-the port and theconference-gives rise to many problems, few of which can be solvedin a deterministic way. The main issues are whether and to whatextent variations in port charges will be passed on by the conferenceto the competitive traders. This involves not merely questions ofanalysis but also of strategy, which are discussed in Chapter 6.
To put this discussion into perspective, it is urged that port pricingnever be used to right the wrongs or to eliminate the distortions thatarise elsewhere in the domestic economy. For example, it would beunwise to try to induce a domestic monopoly that buys port servicesto expand output by reducing the price of port services below theirmarginal cost.2 In economics, as in many aspects of life, two wrongsdo not make a right, and the port should not be the main agent usedto reform the economy.
Variations in Demandand the Cost of Changing the Tariffs
The cost of changing the price charged for port services varies con-siderably among ports according to the legal and administrative sys-tems. The supposition that the cost of changing prices is not trivialdoes mean that the authority should not vary the tariff to followevery little ripple of demand.
2. However, when the port deals with foreign-owned monopolies, such as theshipping conferences, any increase in the net income of the foreign monopoly atthe expense of domestic residents is a dead loss. The variations in pricing policywhich are designed to deal with these familiar cases are pursued in Chapter 5.

38 CIIAPTER 2. MARGINAL COST
There are two or even three dimensions to the concept of difficulty-of-adjustment-of-price; there is the simple cost in dollar terms ofinforming buyers, there is the goodwill or diplomatic cost, and thereis the fact that the change takes time. The authority must ensurethat the price does not follow transitory shifts in demand or costwhich are expected to disappear in a few weeks; the authority shouldbe concemed only about more or less permanent shifts which willpersist for months or years. It is important to distinguish betweenthose regular, predictable shifts-such as seasonal variation-and thosewhich are generated by unpredictable random forces, such as theweather. It may be sensible to vary the tariff to reflect the knownseasonal demand. But changing prices to respond to random effectsis likely to be uneconomic.
This suggests that in calculating price, these random variationsmust be considered when assessing the resources used up to producethe services. To see the problems involved consider a stylized examplewhere there are two demands-a high and a low demand as illustratedby Dh and DI in Figure 2.3. These demands must be specified for agiven quality of service produced by the port; they can be called theno-waiting demand curves, which assume that the ships are servicedimmediately (and take one week to clear) by the port authorities.Furthermore, suppose that the high demand curve occurs with prob-ability 0.10 and that the low demand curve has a 0.90 chance ofoccurring-both independent events in time.3 The short-run marginalcost is stylized so that it is constant up to capacity (X.) and thenrises vertically.
At price PO the low demand is for X2 which means that there isspare capacity of X2X, on nine out of ten occasions. On the otherhand, when demand is high, Xh ships turn up to be serviced, andthere are Xh minus X, which, chosen randomly from the arrivals, haveto wait. If XO - = X7- X, then the waiting ships can beserviced in a week (on the assumptions made above). But if these de-mand curves are for a given quality of service-for example, no wait-ing-then one of the conditions of the demand curve has beenviolated. Two artifices are possible. First the no-waiting demandcurves may be retained, with the port authority compensating the
3. The complication that the high demand may occur in successive periods andso produce a queue which cannot be cleared in the following week is ignored; itcould be imagined that the demand adjusts on information received of such acontingency.

VARIATIONS IN DEMAND AND THE COSI OF CHANGING THE TARIFFS 39
FIGURE 2.3. VARIATIONS IN DEMAND
Price, cost ($)
SRMC.
D. (w=A)
D, (w=O)
D, (w= \ \\
Da. (w=0)DiN I Ii Dax=
XI X, X. XI, XI' Throughputof services
Note: DT, (w=O) = high demand curve for port services when there is nowaiting; D, (W=A) = high demand curve for port services *vhen there is a one-in-ten chance of waiting for one week; De (iv=O) = low demand with no waiting;D, (w=A) = low demand with a one-in-ten chance of waiting for one week.
steamship owners for waiting; this, however, requires some additionaldoctoring of the cost curves, and it is not easy to do on the traditionalfigure.4 A second and more convenient approach considers that steam-ship owners will know that there is a one-in-ten chance that theywill have to wait one week in the roads, and so the amount thatthey are willing to pay for the services of the port is thereby reduced.This is shown in the figure as the demand curves D,(w = -) andDh(w = &) where w is the week's waiting time, and, of course, nocompensation is paid for waiting.5 The probability of uncompen-
4. In principle, costs must vary according to the excess of Xi over Xc multipliedby one-tenth of the cost of one week's wait for a ship in the roads.
5. Although the obvious symbolic representation of one week's waiting isw = 1, the average waiting time is only one-tenth of a week; thus the moregeneral symbol A has been used in the figure.

40 CHAPTER 2. MARGINAL COST
sated waiting reduces demand below what it would otherwise havebeen and so reduces the amount of waiting. There is a complexinteraction effect in the figure; for any given price there is a quantityof waiting which itself determines simultaneously the position ofthe demand curve. In other words, the vertical shift in the demandcurve from w = 0 to w = A must be consistent with the amountof waiting X7 - X,.
The contrast between a probabilistic demand and a known seasonalvariation can be illustrated easily. If the high demand curve were aconsequence of seasonal factors rather than of random events, theprice would be fixed at P7 for the high season and at P. for the offseason. This would ensure that there was no delay in dealing withships, and the appropriate demands would be those with zero waitingtime. But with random demands the position of the demand curvesdepends on the single price that must be chosen since that price inconjunction with the amount of capacity provided determines thefraction of ships that must wait in the roads.
Pricing in Ignorance of Cost
The final question in this discussion is the issue of imperfectknowledge and marginal cost pricing. One of the recurrent themes ofmany port studies is that the authorities do not know what their costis. And if they lack knowledge of their accounting cost, howeverdefined, it seems at least likely that they do not know their marginalcost. This is particularly important since marginal cost is a useful toolfor efficient management.
Some knowledge of cost is necessary for a port authority to dis-charge its most basic obligations. These include the efficient conductof the business such as buying properly, preventing and rooting outfraud, and adopting the best techniques and administrative practices.Knowledge of marginal cost, both in the short and long run, is veryuseful for making the appropriate decisions on investment to meetnew or growing demands for port services.
In practice many of the components of marginal cost can beadduced from the financial accounts of the port. But the financialaccounts of some port authorities contain an assortment of trans-actions which are difficult to disentangle, and in some cases the portaccounts are inextricably mixed up with other agencies. To determinemarginal cost it is then necessary to instigate specific surveys of port

PRICING IN IGNORANCE OF COST 41
activities. Only then can the alternative investment programs bejudged on their ability to meet future demands.
But the appropriate pricing for port services need not wait for suchtime-consuming and costly studies; the tariffs can be improved im-mediately. In practice the first step is to levy charges so that the useof the port is either increased or reduced to what is regarded in porteconomics as the efficient level. The efficient level of port use can bederived by observing ports, perhaps in other countries, where themanagement is efficient and where the port is operating at the "best"level. This comparative standard will provide a good enough firstapproximation for pricing purposes. Then the port authorities needto estimate the reaction of the demand for port services to changesin the price. Essentially, instead of calculating marginal costs, theproblem is reduced to estimating the elasticity of demand for portservices. The evidence which should be considered in this problem isdiscussed in Chapter 7, but at this stage it is not necessary to knowmarginal cost to pursue an appropriate pricing policy for existing portcomplexes.
This argument applies to the general level of port prices. In additionthe structure of port tariffs must be correct so that the price of eachservice reflects the cost involved in supplying it. This principle shouldbe applied to the separate services and activities of the port. Thus,the price of storage should be fixed so that the facility is used as nearto its physical capacity as is efficient, and similarly quay chargesshould be varied until the utilization of the quay is appropriate. (Thismay involve very high congestion charges on some facilities.)
Strictly speaking, the method outlined above is only appropriate forpricing facilities whose use does not incur avoidable cost. In that casethe rule of pricing for the full use of capacity is appropriate simply be-cause the definition of full capacity is likely to be that volume ofoutput at which marginal cost starts to rise rapidly. By extension,the rule may apply also to pricing facilities which incur little variablecost in their use. The rule is not appropriate, however, for serviceswhich have a substantial cost that varies with the amount of theservice produced.
But port authorities are never totally ignorant of cost. Usually, theyhave only hazy or erroneous notions about fixed cost, but they gen-erally can formulate much more accurately the magnitude of variable(or avoidable) cost. If the variable cost of a service can be guessedwith some confidence, marginal cost can be derived from it; in thatsense, marginal-cost pricing demands less information about cost than

42 CHAPTER 2. MARGINAL COST
does pricing according to average cost. Indeed, since marginal costcan be approximated as the change in variable cost as output changes,a clear idea about absolute variable cost is not required. To ascertainchanges in variable cost may require study, but less than a study ofthe full cost for the port.
Last, and perhaps most realistically, the port authorities may beable to quantify only part of the variable cost of a service. Such aport will then fix its prices substantially above that known element ofvariable cost to recoup unknown cost elements. If the authority mustcover its cost, it will seek a total revenue equal to or above totalvariable cost plus total assumed amortization of assets. So far as thecost of rendering a particular service is concerned, the port is mostlikely to know the direct variable cost and to feel ignorant aboutindirect items. These are frequently the costs of services or suppliesused in common by several activities.6 In that realistic case, again, partof the marginal cost of rendering the service can be estimated fromwhat is known. The marginal-cost pricing rule then yields the impor-tant principle that the price charged for the service must not be lessthan this ascertainable marginal cost.7
When investment criteria and the nature of the knowledge of costrequired for efficient decisions are examined, it is observed that his-torical costs are irrelevant. In the case of abandoning a port, anassessment of the value of the assets that would be released by closureis needed; this may exceed or be less than the historical valuation. Inthe case of expanding port facilities, the cost of the new facilitiesmust be known, and this can be ascertained usually from costing theplans. These considerations, however, should not be construed neces-sarily as an argument for replacement cost accounting systems forthe port. The case for such accounting methods must be founded ondemonstrations of the increased efficiency of port management, andthat subject lies beyond the scope of this study.
6. The port is thus expected to know the wage cost of 1 hour of crane ortrucking service but not necessarily the cost of the required petrol and lubricantsor maintenance services.
7. Always assuming that short-run marginal cost is not declining.

Chapter 3
Economies of Scale
IN DESIGNING TARIFF SYSTEMS one of the general questions is whetherthere are economies of scale in the provision of the services when theequipment and size of the port are just right for the level of traffic.If there are economies of scale in the production of a service and ifthe appropriate capital stock is available, the marginal cost pricingof that service will not generate enough revenue to cover the cost.There will be a deficit that must be financed either by raising tariffsabove marginal cost or by some other means. Similarly if there arediseconomies of scale, tariffs levied at marginal cost will produce asurplus over cost.
'Theory and Implications of Port Cost
It is first necessary to examine the general conditions-especiallythose of geography and indivisibility-that are important in deter-mining the patterns of cost. The hypotheses which arise from thesegeneral reflections have many implications for pricing policy.
Are there economies of scale in ports?
To answer this question, it is convenient to split it into two parts.First the economies of location of port facilities and then the appro-priate size of those facilities must be considered.
43

44 CIAPTER 3. ECONOMIES OF SCALE
At any given time, it is clear that there is an ordered list of pre-ferred sites for a port that reflects not merely the cost of the port butalso the demand for its services. For example, there is normally atrade-off between a port with good navigational access but remotefrom the internal origin or destination of cargoes and another that isnear to the center of population but more difficult navigationally orthat requires substantial dredging to accommodate vessels. As demandgrows, new facilities must be located in less desirable locations. Otherthings being equal, successive additions to port capacity will, there-fore, be associated with rising unit cost.
The presumption of optimal location can be applied only at theplanning stage of port construction but not at later dates in thehistory of an actual port. Most of the world's ports, including thosein the developing countries, were built quite a long time ago. Manyof them would not be situated in the same location if the decision tobuild were taken today; the demand for the port's services as well asthe technology of port construction or dredging have often changedsufficiently to render old locations inefficient. On the superior siteunit cost may well decline, but this does not constitute evidence ofincreasing returns to scale.'
This point can be demonstrated simply. Let demand for the port'sservices increase so that the port is led to expand from the existingsuboptimal to the optimal site. Unit cost will then decline for theport's entire output. Next, let demand fall to its original value. Theport will then reduce its output by scrapping and selling off thehighest-cost berths which lie in its original location, so that unit costwill once again decline. But this happens because of the resiting ofactivity. Analytically the port has moved on to lower cost curveswhich were not available when the port was originally built. Whatappears to be diminishing cost as output expands is thus merely theresult of conventional accounting methods.
Rational choice of location thus implies that unit cost will rise asoutput expands. Thus, the size effects on the cost of the port capacitymust be considered. This location disadvantage will be offset to some
1. Exactly similar results would follow from a mistake made at the planningstage of the port. If the planners propose to locate the port in a suboptimal site,expansion from this into a superior location would itself tend to reduce unit costof port services. If this is discovered in the course of planning, it will signal thata mistake was made and will lead to relocation of the planned port.

THEORY AND IMPLICATIONS OF PORT COST 45
FIGURE 3.1. PORT COST WITH DISECONOMIES OF SCALE
Total cost of port
(including inland transport) H2
Ts
H.zJ
K, rTK,~~~~~~~I
O /' I * ~~~~I I
XI X Xs 2X Annual tonnage
Note: K, =annual fixed cost for a small port; Ks = annual fixed cost for a largeport. KIH = annual total cost for a small port; KtHa = annual total cost for alarge port.

46 CHAPTER 3. ECONOMIES OF SCALE
extent by economies of scale in the provision of port services.2 Theseeconomies come from the use of large indivisible units of equipment,the provision of deep harbors, large ship facilities, and so on. Theoperation of more frequent services will make a port more attractivethan one that has only infrequent service: demand responds with afinite elasticity to the frequency of service.
The typical cost pattern of port development is illustrated in Figure3.1. The total cost of the first port is desenbed by the curve H1. Thisshows the cost of the most advantageous location and includes notmerely the port cost but also the inland transport cost.3 This givesrise to a low average cost at the volume X1 where minimum averagecost is shown by the ray T1. To accommodate tonnages larger than X,however, the port must be expanded by increasing quays and draftsand other facilities or by developing another location. Either of thesealternatives involves higher capital cost (K2 compared with K, in thefigure). The unit variable cost may be less with the larger facility butnot low enough to offset the higher capital cost, thus giving decreasingreturns to scale from X1 to X. In Figure 3.1, it has been assumed thatthere are discontinuities in the provision of port facilities-there canbe either a small port or the larger port complex, and there is no in-between. If this is indeed the case, then there will be periods ofincreasing cost and other periods of excess capacity when average costfalls.
The effects of economies of scale in port and associated inlandtransport operations would be to ensure that the minimum averagecost of the large port complex is lower than that of the small port(the ray T2 would be below T1 in Figure 3.1). The larger port cangenerally use more efficient equipment and deal with larger vesselsthan the small port. Alternatively the larger port may deal withapproximately the same size of vessel but can increase the frequencyof services.4
Diminishing average cost arises also from the typical pattern of ship
2. Large ports usually have more labor problems, although these are probablymainly pecuniary and redistributional in their effects. The dockers appropriatepart of the surplus of the port.
3. It is assumed that inland transport may be bought at a constant price (perton kilometer); thus capacity constraints are imposed only by port capacity.
4. Again the precise trade-off between frequency and price may be examinedin the context of a comparison of rates for regular, frequent services comparedwith the tramp service.

THEORY AND IMPLICATIONS OF PORT COST 47
arrivals and from the associated probability of ships having to waitfor berth. Port planners frequently calculate an optimal occupancyrate of berths by a method which involves minimizing the sum ofport cost and ship cost. The normal procedure is to approximateship arrivals by the Poisson frequency distribution where the prob-ability of a ship arrival in a time interval (for example, a day) isconstant and is independent of arrivals on previous days. Given thenumber of channels to the port, the size of the port, the expectedannual tonnage of cargo, and the pattern of ship arrivals, the totalnumber of days which ships would spend waiting for berths can becalculated. These ship-days spent in the queue involve costs. Similarlythe number of days when the berths are vacant may be estimated.The joint cost of idle berth and ship time is then minimized, andthis minimum defines the optimal number of berths and hence alsothe average annual occupancy rate of those berths. The relation be-tween these two variables can be generalized in the shape of curveG in Figure 3.2.
This curve shows that the minimum cost occupancy rate of berthsrises as the number of berths rises and that the optimal excess capacityin each berth falls as the capacity of the port increases. The output ofthe port can be measured approximately as the product of occupancyrate and number of berths. Thus output rises in greater proportionthan port size. Other things being equal and without any offsettingdiseconomies in inland transport, for example, a competitive marketfor shipping and port services would tend to produce large ports. Highoccupancy rates are therefore to be expected in private berths, financedand managed by shipping companies (as is the case of containerberths in some ports), or in a competitive port dealing mainly withbulk carriers and tramps.
An important practical case is where a port expands its capacity bydredging a deeper channel and by providing equipment for dealingwith larger ships and bulk carriers. Once the dredging is complete(and assuming a small annual maintenance dredge), these costs arepast, and there is no sure way of recovering the investment. The mar-ginal cost (including port operation and ocean freight but excluding,for the time being, inland transportation) per cargo ton will be lower
5. Compare, Carl H. Plumlee, "Optimum Size Seaport," journal of the Water-ways and Harbors Division (proceedings of the American Society of Civil Engi-neers) vol. 92, no. WW3 (August 1966), pp. 1-24.

48 CHAPTER 3. ECONOMIES OF SCALE
FIGURE 3.2. AVERAGE OCCUPANCY RATE AT WHICH
COSTS ARE MINIMIZED FOR A SPECIFIC NUMBER OF BERTHS
100 percent
G
0 /
Number of berths
Note: The curvature and intercept of C vary with the relative daily cost of idleship time and idle berth time.
than with the small-ship configuration, at least over the medium andhigher ranges of tonnage throughput.
The one-large-port solution, however, would normally involve higherinternal transport cost than the two-port option, ignoring for nowthe complicated question of different frequencies. The sample caseis illustrated in Figure 3.3. The curve HI describes the total cost of asmall port, with K1 measuring the fixed cost (dredging, constructionof quays, etc.) as before. The cost curve is stylized by supposing thatthere are constant average variable and marginal costs up to the levelof capacity of the port (X1). At that point no more traffic can be car-ried, so the cost curve becomes vertical. Now consider adding anothersmall port to the first; the port may be duplicated at another location,or the capacity of the existing port may be simply increased for the

THEORY AND IMPLICATIONS OF PORT COST 49
FIGURE 3.3 TOTAL COST OF Two IDENTICAL PORTS
AND A ONE-PORT ALTERNATIVE
Total annual cost H.
Hi 2H-
2K,
K1
Xi X6 2X, Xi Annual tonnage
Note: K, = annual cost of capital for a small port; K) = annual cost of capitalfor a large port.
same types of relatively small ships. Then if the new port is simply areplica of the old (at least two equally preferred locations are as-sumed), twice the capacity will imply double the fixed cost. Thus thepoints T1 and T2 will lie on a ray through the origin (not shown),that is to say, average cost at T1 and T2 is the same. Similarly themarginal cost conditions are the same.
The altemative large-scale deep-water port is represented by a muchlarger fixed cost than the two-port complex (that is, K, compared with2K1), but at first marginal cost is lower because of the low variablecost of the large port and because of the economies of the large vessel.But the concentration of traffic in one port does increase internal

50 CHAPTER 3. ECONOMIES OF SCALE
transport cost, and after a certain quantity these may more than offsetthe economies of the large port and large vessel system. Conse-quently marginal cost rises until the capacity of the port is reachedat Xj.6 It is not merely internal transport cost that accounts for therise in the marginal cost. Clearly the adoption of bulk-cargo orunitized techniques with generally larger consignment size will involvecosts of distribution such as break-bulk wholesale functions and alsothe additional cost of inventories.
The main point of this discussion is that, for a given country witha certain specified distribution of resources, there are economies ofscale in ports. The larger the port, other things being equal and forcertain quantity ranges, the lower the cost. But ultimately the addi-tional cost of internal transport and other distribution costs will en-sure that the diseconomies set in, illustrating the truth of the adagethat economies of scale are limited by the size of the market. Thediseconomies will occur at lower volumes the more dispersed thepopulation and resources of the country and the higher the naturalbarriers to internal transport.7
No doubt it would be possible to develop a theory of port size andlocation for an idealized population with specified (and very simple)transport requirements that would suggest the appropriate numberand distribution of ports. However, since circumstances vary so greatlyfrom one country to another, such a model is unlikely to be of anygeneral use.
Methodology of measuring port costs
It is always good practice to test theories of cost by confronting thehypotheses with the facts. In principle it should be possible to
6. It may be argued that even though the port investment is very large, themarginal cost for small quantities of traffic should be about the same as underthe small port conditions since small boats have to be used and since the elaborateequipment is not useful in these circumstances. There is much in this argument,and it should be reflected in a slope of the H, curve initially equal to that ofthe Hi curve but then falling as the quantity increases. This would give the tradi-tional textbook shape for the total cost function for a given plant size.
7. The cost curves of Figures 3.1 and 3.3 (above) have been drawn assumingthat internal transport cost has been included in the cost calculations of the port.This is not the traditional costing approach to ports. The additional internaltransport cost would normally be treated as the reduction in port charges requiredto penetrate more distant markets. This is only a matter of convenience of treat-ment and not of substance.

THEORY AND IMPLICATIONS OF PORT COST 51
examine various manifestations of port cost to see whether the theoryis relevant to reality. First, a cross section of different port sizes can beexamined to see how unit cost varies with the tonnage throughput.Some attempt has been made to carry out such an analysis for certainNorth American ports, and the general results are reported in thesecond half of this chapter. Second, the costs of a port could be tracedthrough time as it expands to cater to an increasing volume of traffic.No such time series analysis has been attempted in this study, partlybecause so many other factors change over time, and it is difficult todistill the effects of increased traffic from all other incidental variables.The third approach is to examine and to cost engineering and man-ning specifications for typical ports. The disadvantages of such anapproach are well known. But there is such a wealth of material onport plans that it is worthwhile to survey it to give a general view onthe appropriateness of the proposed cost model. The example of aCentral American port is pursued in the second half of this chapter.Here these results of examining cost conditions are summarized.
The general shape of the empirical curves is similar to thosederived from theoretical conjecture in Figure 3.3 above. For a par-ticular size port (in terns of facilities) unit cost falls up to full useand then rises quite rapidly as congestion sets in.8 Fixed costs (suchas dredging cost and provision of berths) tend to be relatively lowfor a small port, but this is compensated for by the high variable costof operation. Dredging a new channel, building more berths, andinstalling more moviing equipment will increase vastly the fixed costof the port, but it will also reduce the variable cost per unit as largerships are used and cheaper handling techniques become feasible.
There are clearly some discontinuities in port construction. Forexample, it would be inefficient to dredge a channel an inch deepereach month for 5 years to increase the depth of the channel by 5 feet;it is best done in one go. Similarly berths are expanded most effi-ciently by building in large, more-or-less-standardized units. Conse-quently in practice the choice may be between the two ports whosecost functions are illustrated in Figure 3.4.
If traffic expands gradually (and for simplicity, if traffic is notaffected by port charges), then it becomes efficient to convert thesmall port into a large one well before the small port has achieved
8. For example, handling costs of containers in one developing country's pro-jections fell from US$25 per movement to US$4 as container movements in-increased from 20,000 to 200,000.

52 CIIAPTER 3. ECONOMIES OF SCALE
FIGURE 3.4. CosT.AND DISCONTINUITIES OF PORTS
Total cost
H T1 Hs T,
X. X, X, Tonnage
Note: X, tonnage at which average costs are minimized with harbor sizerepresented by KH,Ff; X. = minimum cost tonnage with K2Ht; X. = output levelat wbich the authorities will build the large barbor, K,H.. Over the range O to X,average cost for the authority will decrease if the harbor is the appropriate size.
minimum unit cost. Furthermnore the large port wfi continue toexhibit apparent excess capacity for some time as traffic continues toexpand. This apparent overbuilding of ports is, however, quite ra-tional in the cost conditions of the figure. That is to say, to get thelower cost, too much capacity must be installed relative to the quan-tity of present traffic.
9. Many of the complications involved in the dynamics of adjustment havebeen ignored here; for example, the cost relations should all be in terms ofpresent values of the future discounted cost streams. Such additional embellish-ments, however, do not affect the substance of the argument.

THEORY AND IMPLICATIONS OF PORT COST 53
With a growing level of traffic through time, it may be best tooverbuild the port and suffer the excess cost at low traffic volumes tosecure the lower cost at later high traffic volumes. For example, sup-pose that in Figure 3.4 there is a choice between the port charac-terized by the cost curve K1H1 and that by K2H2. Furthermore,imagine that the life of these ports is very long, say 50 years, andthat it is very expensive to expand capacity once K 1H1 is built. Thenminimizing the discounted future cost streams, it may be best tobuild the large port even for the initial low traffic volumes-that isto say, for throughputs lower than X,-to enjoy the low cost on theincreased traffic in later years. Of course, the average throughput ofthe large port throughout its life must be considerably larger than X0.But this example illustrates that for ports with long lives, the problemis to find the best size and type of equipment that is adaptable tolarge variations of perhaps rapid growth of traffic.'0
Pricing implications of economies of scale
With economies of scale and marginal cost below average cost, theusual implication is that the price of the port service should be fixedat marginal cost and that the port should be subsidized. But ofcourse this argument assumes, among other things, that there is alwaysspare capacity in all port activities. Furthermore it assumes that portcapacity is always nicely adjusted; in particular there are no lags inport development and no unforeseen bursts of traffic. Perfect portplanning and adaptation to traffic flows are theoretical concepts onlyand are of little relevance for planning port charges systems."
Furthermore there are considerable objections to financing muchof the port cost out of the general budgetary revenues. The require-ment that the port recover its cost provides a valuable administrativeincentive to the port authority to control its cost and expansion plans.Without such discipline the port authorities are likely to overbuildports on one hand and run a somewhat inefficient port on the other.The open check book of the public authorities is a standing invitation
10. If the small port is built and later a larger port is considered to expandcapacity, then the capital cost of the existing port is irrelevant for such decisions.
11. The arguments to be pursued here are exactly analogous to those in A. A.Walters, Economics of Road User Charges, World Bank Staff Occasional Papers,no. 5 (Baltimore: Johns Hopkins Press, 1968) and will not be repeated here.

54 CHAPTER 3. ECONOmIES OF SCALE
to labor unions and other groups such as traders and shippers toexploit the situation.
This objection does not apply to government undertaking specificand very limited subsidies, such as central government provision of theland for the port, undertaking to keep the channel dredged, providinglight services, and so on. These activities can be separated adminis-tratively from the port accounts, just as the on-route navigationalaides may be separated from the accounts of airport authorities.Whether it is wise to load these items on to the general accounts ofthe Treasury or to levy specific user fees is another matter.'2 This willdepend on the elasticity of demand for the port services with respectto the price, on the cost of raising revenue in terms of the adminis-trative expense of the tax dollar and the inefficiencies caused by suchtaxes, on the degree of under- or over-valuation of the exchange rate,and on such difficult problems as the distributional effects of thesubsidy compared with distributional effects of the marginal taxes.
In this study the broad effects of these considerations are onlyoutlined. It is presumed that, except in the case of competitive ports,the elasticity of demand for port services is rather low on the usualargument that the port charge is a small element of the total trans-port charge that is itself a small element of the delivered price. Withno substitution possibilities, therefore, the elasticity of demand forport services would be expected to be a small fraction of the finalelasticity. If the elasticity of demand is very low, then ensuring thatthe port pays its way will not create substantial inefficiencies.
The cost of raising revenue varies from country to country, but asa general rule the less developed the country, the more inefficient thecollection of revenue. Finally there is some distributional presump-tion that the beneficiaries should pay for the services from which theyprofit; but the precise incidence of both cost and benefit is impossibleto determine with any certainty.
There is, however, one aspect of the distributional problem that isa central focus of this study-the extent to which variation of porteharges will be passed on or absorbed by the shipping companies orforeign traders. The question is whether the benefit of port invest-ment or the lowering of port charges is enjoyed by the steamshipowners or whether it is largely passed on to the residents of the coun-try. This will be discussed in detail in Chapter 5.
12. See, for example, R. H. Coase, "The Economics of the Iighthouse,"Journal of Law and Economics, vol. XVIII, no. I (April 1975), pp. 25-31.

PORT COST IN PRACTICE 55
Port Cost in Practice
Large variations in port cost arise because of the different factorproportions used in various cargo systems. But even with similar cargosystems, it is difficult to identify cross-section studies of different portsthat give clear evidence on economies of scale. In practice engineer-ing studies of synthesized cost must be relied upon heavily.
Factor proportions and port cost
Major variations in factor proportions are connected with differ-ences in the cargo system. These differences are illustrated in Table3.1 by the planned costs for three different berths at Port Kelang.In each case the full operating cost for the project has been calculatedfor the expected annual throughput of the berth, roughly equal tothe level of optimal use or full capacity.18 The range of services pro-vided in each of the three berths is rather different, but these differ-ences can be standardized by comparing the bulk berth with thegeneral cargo berth (omitting back-up facilities) and with the con-tainer berth (omitting the container freight station). The cost ofland reclamation, which is more a requirement of a particular portexpansion scheme than of berth construction as such, is ignored.Comparing rows a, b, and c, a common feature of all three berthsemerges: the high share of fixed cost in total annual cost. It rangesfrom about 50 percent for conventional general cargo berths to some80 percent for the container berth. The main source of differences inthe share of fixed cost, however, is the relative degree of mechaniza-tion of the three types of berths. The modem dry-bulk berth showsthe largest share of plant and equipment cost on an annual basis,followed by the container berth and by the relatively lightly mecha-nized general cargo berth. The relative labor intensity of port services,related to delivery is also confirmed; when the CFS is included in theproject, the share of fixed cost in the annual cost of the containerberth drops by one-eighth.
The fixed cost in Table 3.1 was computed as the replacement cost
13. The consultants' proposal for the construction of the three berths wasbased in each case on comparisons between the cost of delays to ships arrivingaccording to a Poisson distribution and the cost of providing new berths.

TABLE 3.1. COMPOSITION OF ANNUAL PORT COST FOR THE EXPECTED ANNUAL THROUGHPUT
OF THREE PLANNED BERTHIS, PORT KELANG, 1974
General cargo Containerberth berth
Dry bulk Excluding Includingberth back-up back-up Excluding Including
(fertilizer) facilityQ facility CFSd CFSAt expected annuala (percent) (percent) (percent) (percent) (percent)
throughput 1 2 3 4 5
Annual cost of fixed assetseas percent of total annual cost 78 52 57 82 71
Annual cost of fixed assets'as percent of total annual cost,omitting cost of land reclamation 77 52 57 81 70
Annual capital cost of land reclamation,capital dredging, and wharfas percent of total annual cost 43 47 40 59 45
Annual capital cost of plantas percent of total annual cost 35 3 4 23 19
a. Expected throughput per year: dry bulk berth, 215,000 tons; general cargo berth, 200,000 tons; container berth,100,000 containers (TEU).
b. The components of fixed assets are: for dry bulk berths-land reclamation, wharf, bridge, dolphins, conveyer, steel-woTk, dredging, cranes, conveyers, electrical works; for the additional general cargo berth-wharf and bridges, transitshed, services, dredging and back-up facilities (land, roads, godown, services), and plant for wharf and back-up facili-ties for the container berth-land reclamation, wharf and bridges, roads, stacking area, dredging, wharf cranes, straddlecarriers, prime movers and trailers, and CFS (station buildings, services, and forklifts).
c. The back-up facility has not been charged with any part of the annual labor cost of maintaining and operatingthe berth.
d. The CFS has not been charged with any part of the annual administration cost of the container berth.Source: Coopers and Lybrand Associates Limited in association with Sir Bruce White, Wolfe Barry, and Partners,
and Shankland Cox Partnership, "Lembaga Pelabohan Kelang. Port Development Feasibility Study," Final Report(August 1974), pp. 141, 149, 153, and various parts.

PORT COST IN PRACTICE 57
of plant and works. But most ports still compute fixed cost at his-torical values, and this leads normally (and patently so in times ofhigh inflation) to underestimation. The error introduced into costestimates by using out-of-date prices poses a particularly serious threatto cost recovery when it affects the fixed cost of the capital-intensiveport. It is an open invitation to charge too little and to invest toomuch.
The chief reason for this brief survey of port cost is to build up ageneral notion on the relation between cost and output. A high shareof fixed cost at full capacity operation does not, of course, constitutehard and fast evidence on the behavior of cost per unit for through-puts below that level. But with the indivisibilities that characterizeinvestment in infrastructure, the presumption is that the average costof port services will decline noticeably as output is increased towardfull capacity and that marginal cost is therefore below average cost.This question is discussed in Chapter 8, but at this stage more directinformation on the relation between unit cost and output in containerterminals is offered. Port planners assume that the cost of the berthand of operating it stay more or less constant up to high levels of use,and this means that the short-run average cost of container berthsdeclines over wide ranges of output. According to a summary ofBritish container port experience, an increase in berth throughputfrom 10,000 to 75,000 units (in a berth with maximum annual ca-pacity of 100,000 standard units) may be assumed to be associatedwith a decline of cost per unit from 7 to 1 in ratio terms.14
Short-run marginal cost thus lies below short-run average cost. If thesize of the berth is itself varied to cope with different volumes ofannual throughput, the cost per container will decline from £75 to
6165 as berth capacity is raised from 10,000 to 100,000 TEU per year.It follows then that long-run marginal cost also lies below long-runaverage cost.
14. National Ports Council. The estimate is based on 1972 prices and refersto a single-user berth. The decline in unit cost is much less-from 3 to 1 in ratioterms-in common user berths with similar maximum capacity. H. K. Dally,"Containers-a Note on Berth Throughputs and Terminal Handling," NationalPorts Council Bulletin (London), no. 4, (April 1973), pp. 60-65.
15. Exchange rates in terms of SDRs (special drawing rights) for the cur-rencies of the United Kingdom, Bangladesh, Thailand, Malaysia, Singapore, India,and the United States are given in the Glossary following Chapter 9.

58 CHAPTER 3. ECONOMIES OF SCALE
Evidence on port cost and economies of scale
It is extraordinarily difficult to accumulate comparable data on portcost to estimate the appropriate slopes of the cost functions. Thisarises not merely because of the shortage of statistics, although thatis common enough, but from the lack of comparable port situationsin respect of both traffic and geography. Cross-sectional analysis canbe very misleading and cannot be relied upon.
Consider the example of Seattle and Vancouver with respect totheir most standardized product service-the container trade.
TABLE 3.2. ToTAL CONTAmER TRALicAND FAcILITIES, 1973
Traffic No. of(TEU)a berths Cranes Acres
Vancouver 88,000 3 1 15Seattle 377,000 11 12 161
Source: Trevor D. Heaver, "The Routing of CanadianContainer Traffic through Vancouver and Seattle," astudy prepared for the Western Transportation Ad-visory Council and the Centre for Transportation Stud-ies of the University of British Columbia (Vancouver,B.C.: WESTAC, January 1975), pp. 11 and 75.
a. Includes inbound, outbound, loaded, and emptycontainers.
From the evidence of this table it may seem at first that there areeconomies of scale in container operations. With less than a four-foldincrease in the number of berths, Seattle carries more than four timesas many containers as Vancouver. But Seattle has much more equip-ment and greater acreage than Vancouver. Furthermore the trafficat Vancouver is much more balanced than that through Seattle, andthe containers are treated differently at the two ports.16 Little ornothing about the existence of economies of scale can be adducedfrom such statistics.
However, some light might be shed on the issue by the charges forcontainer traffic through the two ports. If it is assumed that normalprofits are being eamed in the two ports, then the port charges percontainer might approximate the average cost. Table 3.3 illustratesthe charges that accrue to port operations in Seattle and Vancouver.
16. See: "The Routing of Container Traffic Through Vancouver and Seattle"(WESTMAC: Vancouver, 1975).

PORT COST IN PRACTICE 59
TABLE 3.3. PORT CHARGES TO THE CONSIGNEEON CONTAINER TRAFFIC
Vancouver ($) Seattle ($)
Wharfage 23.63 33.75Handling and through port charge 81.27 40.00Vessel service and facilities charge 0 21.60Tailgate loading 22.28 0Total of port charges per container 127.18 95.35
This suggests that there are indeed economies of scale in the con-tainer business-approximately a fourfold increase in size reduces costby about one quarter. However, with this comparison even morecaveats apply. One of the most important is the problem of accountsreflecting historical cost and not the replacement cost of assets; simi-larly there are various arbitrary allocations of cost in the determina-tion of charges. The price charged for handling a container is deter-rnined largely by the competitive conditions of alternative handlingarrangements and not by the cost. It would be necessary to assumethat the markup of handling charge over cost was equal in bothSeattle and Vancouver, and there is no reason to suppose that is thecase. Another difficulty is that the services performed for the chargeset out in Table 3.3 are not identical in the two cases, and it isdifficult to standardize the figures for this effect.
Somewhat older Canadian data (1971-72) give no clear lead onthe question of economies of scale (Table 3.4). A comparison ofQuebec with Halifax points to the number of cranes (and perhapsalso to the amount of storage area) as the limiting factor in Quebec.But in comparing Vancouver and Halifax, output and capacity (interms of berths and cranes) seem to rise in the same proportionalthough there may be a saving in land area for storage as size andthroughput grow. Charges were somewhat higher per container (ac-count being taken of different charging systems) in the smallerfacility. If forces were at work to bring charges down to the level ofcost-as would be ensured by competition-a mild tendency to econo-mies of scale in container terminals could be inferred from thedifference in charges and perhaps also from the difference in storagecapacity. But the presumption of enough competition to makecharges equal to cost would be difficult to reconcile with markeddiscrepancies in charges for similar services. It may be concluded thatit is impossible to obtain reliable indications of the cost functionsfor ports from cross-section studies of different sized ports.

6o CHAPTER 3. ECONOMIES OF SCALE
TABLE 3.4. CANADIAN CONTAINER PORT CAPACITY, ANNUALCONTAINER HANDLING, AND CHARGES
Halifax Quebec Vancouver(Chalterm) (Wolfe's Cove) (Centennial "6")
CapacityNumber of berths 2 2 1Depth (feet) 40 37 40Cranes and capacity (1_40) 1-35 140
(tons) 1 1-45~ -514Storage (TEU) 3,100 2,000 2,0001972 capacity
(containers)" 100,000 50,000 50,000Output (1972)
Container handlings1972 97,453 51,990 48,294
Handling charges (1971)(Canadian $ percontainer)
Inward 59.00 n.a. 60.00V-77.50"Outward 59.00 n.a. 58.75'-66.875`
n.a. = not available.a. Total storage based on 20-foot container equivalents stacked two high.b. Assuming a capacity of 100,000 20-foot containers per year for a single
berth/two-crane facility. For a single-crane facility, it is assumed that the through-put is limited to a crane capacity of 50,000 20-foot containers per year.
c. Weight tons, 12.5; density, 40 cubic feet/ton (12.5 measurement tons).d. Weight tons, 12.5; density, 80 cubic feet/ton (25 measurement tons).Source: Canadian Transport Commission, Systems Analysis Branch, The Con-
tainer Study in Summary. Report 70 (principal authors, P. M. Bunting and L. M.O'Connell) (Ottawa, November 1973), pp. 42, 43, 71.
Planning and engineering studies
The other source of material about the cost functions of ports arethe engineering studies of port development. These are difficult tointerpret quantitatively in cost terms on a standardized basis. How-ever, certain general points emerge.
The most interesting study for the purposes of this discussion wasthe World Bank investigation into the investment programs ofCentral America'7 which explored the cost which would emerge ifcertain Central American ports were expanded and if traffic were
17. Anandarup Ray and James W. Loudon, "Central American Ports Study,"World Bank Economic Staff Working Paper, no. 117 (Washington, D.C.: TheWorld Bank, October 1971).

PORT COST IN PRACTICE 6
concentrated at these ports. The methodology forecasts the probablestructure of port investment and port cost for different levels oftraffic. Generally these showed that unit cost diminished as thecapacity throughput of the port was increased. Exceptions to thisgeneral rule occurred where there were expensive natural obstacles tobe overcome. These were usually specific to the site, as suggestedabove. In general there were substantial economies in port size forconventional general cargo operations. However, the study noted thatalthough these gains were real, they were not large enough to offsetthe increase in inland transport cost which a concentration on a fewports would entail.
For the purposes of this study, it is sufficient to illustrate the phe-nomenon of economies of scale in a conventional port. Table 3.5shows the calculated costs in 1971 U.S. dollars per metric tonof a two, three, four, and five berth port at Henecon in CentralAmerica. The economies of scale are reflected clearly in the markedreduction in capital and maintenance cost per metric ton as the sizeof port increases. The cost per ton for administration and for cargohandling was thought to be constant and so not affected by the sizeof the port. Operating the port below capacity, however, will causeunit cost to increase above that at capacity throughput. Thus thecost developed by port planners conforms to the pattern shown inFigure 3.4 and exhibits increasing returns to scale.'8
18. Additional examples of this typical shape of the cost curves are given inRay and Loudon, Central American Ports Study.
TABLE 3.5. COST PER METRIC TON OF MULTIBERTH PORT(ALONCsrDE) BERTEIS AT HENECON (1971 US$)
Mainte- Adminis- CargoBerths used Metric tons Capital nance trative handling Totalto capacity per year cost cost cost cost cost
2 200,000 4.96 4.56 0.70 1.64 11.863 340,000 3.91 2.81 0.70 1.64 9.064 460,000 2.99 2.14 0.70 1.64 7.475 580,000 3.00 1.74 0.70 1.64 7.08
Source: Anandarup Ray and James W. Loudon, "Central American PortsStudy," World Bank Economic Staff Working Paper, no. 117 (Washington,D.C.: World Bank, October 1971), Appendix 3.

62 CHAPTER 3. ECONOMIES OF SCALE
The conclusion of this section, therefore, is that the evidence seemsto be consistent with the suggested pattem of cost curves and thatmarked economies of scale exist for most port locations. Only wherethere are severe natural constraints would decreasing retums be found.

Chapter 4
Congestion Levies and Surcharges
CONGESTION IS A MARKED FEATURE of many transport facilities. Onland it takes the form of crawling traffic and occasional jams; in portsit is manifest in long queues of vessels waiting in the roads for berthspace or in transit sheds clogged with merchandise. The considerablecost involved suggests that some changes in the system might reducethese wastes and increase efficiency.
The existence of congestion indicates that the port authority pos-sesses a valuable scarce resource. If the port were owned by a privateparty unconstrained by government and custom, it would raise portcharges and profit from the scarcity. The long line of ships in theroads would be reduced to a few vessels as shipowners and shippersswitched to altemative facilities.
In practice, the port authority does not usually respond by raisingthe level of port tariffs, perhaps because the tariffs are regulated by
Note: After completing this study the authors became aware of an article byA. H. Vanags, first published in 1973 in the Proceedings of a Conference onMarine Traffic Engineering and recently republished under the title of "MaritimeCongestion, an Economic Analysis," in Advances in Maritime Economics, ed.R. 0. Goss (Cambridge: Cambridge University Press, 1977). Standard congestiontheory is applied to marine facilities, and the results are formally identical to thoseof the present study. Vanags developed the case where ships arrive at the port fol-lowing a Poisson distribution, whereas in this study the less formal substitutioneffects and their interaction with congestion levies have been developed. Vanags'prior claim to this extension of congestion analysis is acknowledged.
63

64 CHAPTER 4. CONGESTION LEVIES AND SURCHARGES
govemment or ossified by long custom. Tariffs are kept low in a con-gested port because of the belief-right or wrong-that a rise in portprices would be reflected, and perhaps even magnified, in increaseddomestic prices of imported and lowered domestic prices for ex-ported goods. Higher port tariffs, it mav be thought, would merelytake money from the pockets of domestic producers and consumersand transfer it to the coffers of the port authority.
The absence of high tariffs for congested ports, however, has notsaved domestic traders and consumers from the high cost of conges-tion. Both competitive tramp owner and cartelized liner operator willcharge at least for the time that their ships spend in the queue; theformer in the freight charges or charter contract and the latter in theform of congestion surcharges. Domestic prices and quantities mustreflect these congestion costs.
But suppose that the port authority were to impose its own conges-tion levy at a level which reduced the length of the queue to a normallength. What would be the consequences? This is the main questionof policy which is examined in this and the following chapters.
In discussing the policy of a port authority, an old problem promi-nent in international trade policy is encountered-what should be theobjective of policy? This aspect of the analysis is discussed in thefollowing chapter, but the main outlines are reviewed here so thatthe contribution of congestion charges can be seen in its propercontext.
First, the best congestion charges to be levied by the port can beconsidered from the point of view of all trading nations in the world.A system of port charges can be devised so that the world as a wholeis better off. For a particular port in a country, however, the portauthority can make the country better off by exploiting whatevermonopoly power it may have, thus raising port charges above themarginal cost (including the value of the scarce port resources) andincreasing the profit of the port. Some part of this additional revenue-but not normally all of it-will accrue to the port as a mere transferfrom other residents; higher port charges will raise freight rates,increase the domestic price of imports, and reduce the domestic priceof exports. Clearly, the rule is to find the port tariff (includingcongestion levies) that causes the marginal profit of the port to bejust equal to the additional money required to compensate domestictraders and consumers for the increase in port charges (the com-pensating variation).
Although simple to state, this policy objective is difficult to achieve.

THEORY OF CONGESTION 65
In part, this is because the reaction of the shipping cartels to differentlevels of port charges must be analyzed. Little is known in practiceabout the bargaining strategies of conferences and how they wouldrespond to congestion prices levied by the port.
This chapter is concerned primarily with the analysis of the broadeffects of port congestion levies. This description of the consequencesof the port levying congestion charges can be carried out largely with-out resorting to mathematics; simple diagrams (or figures) will carrythe argument. However, the literary or diagrammatic account isdeficient in two respects. First the detailed response of steamshipowners-in particular, the extent to which they pass on the port con-gestion levy-will be determined by the elasticity of demand for ship-ping services. Indeed, much will depend on the change in the elasticityas the quantity of traffic increases. Second, the detailed redistributionof profits and other incomes cannot be analyzed.
The analytical framework of this chapter will not, therefore, allowfirm conclusions to be reached about passing-on of congestion leviesand distributional consequences. Nevertheless, it reveals issues andproblems which are explored in considerable detail, although withsome mathematics, in Chapters 5 and 6.
Theory of Congestion
It is best to begin with a fiction. Suppose that the shipping indus-try is owned entirely by many domestic nationals who competevigorously to provide shipping services. No monopoly or cartel exists,and no foreigners intrude in this scenario. Consequently, the welfareof shipowners is part and parcel of the welfare of the country or of thenational interest, as defined in the Introduction. Similarly, assumethat the state is but a small part of the international market for boththe commodities which are exported and those which are imported;the price of exports and imports in foreign markets can be taken asgiven and are independent of the country's behavior. However, theport is assumed to have monopoly power since, for simplicity but notfrom necessity, it is designated to be the only port in the country,and alternative transport arrangements that use other ports or modeswill involve considerably greater cost. The port is owned by nationals,perhaps even by the govemment, but whatever its equity structure,it is certainly publicly controlled.

66 CHAPTER 4. CONGESTION LEVIES AND SURCHARGES
FIGuRE 4.1. PORT CONGESTION WITH COMPETITIVE SHIPPING
Marginal (ship and port) costs
Costs, charges ($) /
zAverage (shipand port) costs
C
T 77
X0 X1 X Tons off reight
Note: COST: OH = port variable cost and overhead =port charge (hereassumed constant);
IIS =ship cost when there is nO congestion;HlM =ship cost when there is normal congestion;TM = NP =the congestion levy charged by shipowners over the
normal freight rate.REVENUE: OHVX, = revenue accruing to the port authority;
IIMNV = normal revenue to shipowners;MTPN =congestion levy revenue to shipowners.
TRrAFFIC: Xo = optimum traffic;Xt= traffic with shipowners' congestion levy;
Xe=traffic with no congestion levy.

THEORY OF CONGESTION 67
The consequences of different policies on port tariffs can be ex-plored using Figure 4.1. The horizontal axis measures the total traffic,both exports and imports, of the port in tons. But since all exportsand imports have to pass through the port and since, by assumption,each ton requires a fixed amount of port service, the horizontal axisalso measures total trade flows. The demand for port services isderived in two stages-from the demand and supply conditions ofexport and import markets (which are assumed to remain constant),and from the all-in price (port charge and freight rate) of transport.This all-in price is the value recorded on the vertical axis of Figure4.1, and the derived demand for shipping as a function of the all-inprice is labeled demand. This demand curve represents the demandfor shipping, and, by earlier assumptions, the demand for port servicesis proportional to it.
To see the consequences of port policies, it is imagined that theport pursues a normal Anglo-Saxon policy and charges the variablecost per ton together with a markup for overheads as shown by OHper ton.' This tariff of OH is levied whatever the conditions in theport, whether it be underused or congested.2
The cost of the ship operation is shown as HS for low levels oftraffic where there is virtually no waiting for berths at all; but astraffic increases, this cost rises to R (at X.) and P (at X1) for eachshipowner.3 For convenience, assume that the shipowner supposesthat there will be a normal amount of congestion at any port andfixes his charge accordingly. Further, normal congestion is assumedto be that which would prevail if, with the demand curve as drawn,
1. Although this analysis is given in terms of cargo tons rather than of ships,many of the port charges relate to vessels rather than tons. This is unlikely tobe a crucial factor here and is taken up in a later discussion of practical problems.
2. If the objective is merely to cover cost or to earn some predetermined per-centage of profit on capital, port tariffs will be higher for an underused port thanfor a congested one. The perverseness of such a policy is obvious. For an exposi-tion of this argument, see A. A. Walters, Economics of Road User Charges,World Bank Staff Occasional Papers, no. S (Baltimore: Johns Hoplcins Press,1968), pp. 18, 146.
3. For convenience here, the inventory costs of cargo in transit are includedin the shipping costs. This could have been taken into account by reducing thedemand curve for shipping services. It is simpler, however, to treat inventory cost,which is related to the time in transit, as part of the cost of shipping. Thus byincluding inventory cost, just as congestion effects were included, on the costside, the demand price can be treated as though it refers to a uniform qualityof service.

68 CHAPTER 4. CONGESTION LEVIES AND SURCHARGES
services were sold at marginal cost (OC per ton). This will againsimplify the exposition.
With the demand in Figure 4.1, congestion is greater than normal,and there is considerable queuing in the roads. Each competitiveshipowner will add these additional expenses to the freight charge,and the average ship and port cost will be equal to the appropriatedemand price (intersection P in Figure 4.1). Each shipowner willbe levying a congestion surcharge of TM (or PN) a ton.
But this surcharge does not measure the true cost of increasingtraffic through the port by an additional ton. This is traced by themarginal cost curve SWQZ. Thus at the traffic level X1 tons, anadditional ton of cargo would cost ZX1, not PX1. This is becausean additional ship service provided by a competitive owner takes intoaccount only the waiting time that his ship spends in the roads; thisis the cost incurred in his accounts. But by joining the queue, hedelays all the ships that come after him. Their cost is increased, butthese additional expenses are not reflected in his accounts. This truecost (or marginal cost) exceeds the value of the service to the usersfor all traffic in excess of XO.
Clearly the congestion charge which is levied by competitive ship-ping is too low. The all-in price at P is less than the marginal costZX1 of providing the shipping service. Too many ships join the queue,and it would be better to reduce traffic to X.. It might be supposedthat, if there is an orderly queuing system, any entrant who causes apermanent lengthening of the queue (for example, by operating anadditional weekly service) bears all the cost of his decision. He willtake account of the additional queuing time when he calculates theexpected profitability of the service. But he does not take account ofthe additional queuing cost (PZ in Figure 4.1) caused to all othervessels supplying services to the port.
This analysis corresponds precisely to the theory of highway con-gestion. The policy of charging conventional prices for the services ofthe port generates the same sort of congestion that arises on urbanstreets and some intercity highways. And, of course, the solution isthe same. The port should raise its charges from OH per ton byRQ per ton, where the RQ per ton represents the congestion levy ofthe port. Clearly if the port levies RQ per ton, the shipowners willnot exact the congestion surcharge PN that they imposed under thecongested conditions at X1 and price P. With traffic at X0 tons, ship-owners' average cost (excluding the port congestion levy) will be OMper ton, and competition in the shipping industry will ensure that

THEORY OF CONGESTION 69
they charge no more than this for their freight services. By levying thecongestion toll of RQ per ton, the port authority will avoid the wasteof providing services at a price less than the cost of producing them;this waste of congestion at X1 is shown by the shaded area QPZ inFigure 4.1.
It might be thought that the port authority was behaving like amonopolistic exploiter of the domestic shippers and consumers. Butsuch an interpretation would be a travesty. For the port is not maxi-mizing its profits by charging RQ per ton for congestion. Indeed, aport authority that wished to capitalize on its monopoly would chargemuch higher tariffs and would reduce traffic well below X..4 In fact,levying a congestion fee of RQ per ton simulates what would occurif the port services were produced by a competitive process. Theoptimum port charge is simply the value that would emerge in acompetitive market-if it were possible to organize one.
The price of the overall shipping service (freight rate and portcharge) will normally rise above that which would exist if the portauthority did not charge a congestion levy.' But the increase in pricewill never be more than the port congestion levy, and it might beexpected to be considerably less. Figure 4.1 shows that when a con-gestion levy is imposed, the greater the elasticity of demand for theservices of the port, the smaller the rise in price and the larger thereduction in the quantity shipped through the port. Similarly, if arelatively small reduction in the quantity of tonnage causes a large fallin the cost of ship operations, then again, even though the elasticityof demand is not high, the increase in the overall charge for freight(including the port tariff) will be small.
The revenue accruing to the port authority will include its normalcharges OHAXO and the revenue from the congestion levy MCQR
4. The port authority would take into account the marginal revenue curve(not shown in Figure 4.1) for its services in deciding its most profitable through-put. And for a given demand curve, profit-maximizing behavior would give re-sults opposite from the optimizing policy; for example, the greater the (absolute)elasticity of demand, the larger the reduction of traffic from optimizing, but thesmaller the reduction from monopolistic exploitation.
5. The exception is where the congestion is so heavy that throughput actuallyis reduced. This is the familiar backward-bending case in highway congestion.See A. A. Walters, "The Theory and Measurement of the Private and SocialCosts of Highway Congestion," Econometrica, vol. 29 (1961), reprinted inReadings in Economics of Transport, ed. Dennis Munby (Penguin, 1969).

70 CHAPTER 4. CONGESTION LEVIES AND SURClARGES
(Figure 4.1). The total revenue from both normal charges and con-gestion levy probably will increase. Only a highly elastic marketdemand combined with a low congestion levy could possibly causeport revenues to fall when a congestion levy is imposed. This is amost unlikely set of circumstances which, in any case, would not bepropitious for imposing such a levy.
In this exposition so far certain important assumptions have beenmade. The transport process has been assumed to be rigidly pre-scribed, that is to say, the techniques are fixed and unalterable; thereis a fixed load per vessel; the vessels are all homogeneous; the com-position of cargo does not change; and port services per ship (and perton of cargo) are rigidly fixed. This implies that there is no possi-bility of substitution between cargoes, between vessel and cargo (suchas varying the load per ship), between vessel and port (such as portcranes and ship derricks), between one vessel and another, andbetween one part of the port and another (such as between berthsand moorings). Later this chapter explores the effects of these im-portant opportunities of making more efficient use of resources.On the present assumptions, however, the only possible adjustment isin the quantity of cargo (and so ships). If the port imposes the appro-priate congestion surcharge RQ, the quantity of cargo will shrinkfrom X1 to XO, and the queue of vessels contracts to its normal level.
With fixed proportions the difference between the marginal (shipand port) cost and the associated average cost can be measured. Forsimplicity, continue to assume that the port marginal cost is equal toits average cost (OH in Figure 4.1 and cp hereafter). The ship costincludes two parts: the inventory cost of the goods in the waitingships and the daily cost of the idle ships in the queue. Both of thesecan be measured by a constant single daily amount c per shipload.The length of the queue in terms of vessels (q) is an increasingfunction of the throughput of the port (X), where X is measured interms of shiploads per day. This can be interpreted in terms of the factthat the occupancy rates of berths can be increased only by having alonger queue of vessels. Total cost (K) then consists of two elements:LPort costl Port throughput:] + Daily [Length of queuel
per shiploads + ship and number ofshipload JL per day costs vessels in port
or in symbols:
(1) K(X) = cX + cq(X).

THEORLY OF CONGESTION 71
The total cost associated with a daily throughput of X shiploads thusis composed of the port's cost of handling these shiploads and theday's cost of the queue. Now it is clear that the delay per ship (D)or number of days the ship spends waiting or in port is then a func-tion of X and is related to q and X as:
(2) X = q(X)/D(X).
Thus:
K(X) = c,X + CXD(X).
The total cost of a particular daily level of throughput is now ex-pressed as the sum of the associated port cost and the cost of thetime which those shiploads had to wait before being discharged fromthe port.
To find the marginal cost of throughput, differentiate the lastexpression with respect to shiploads:
(3) dK(X) =_c+ CD(X)+X dD_X)
[ X dD (X)]_cp + cD(X) [1 + D(X) dX J
Thus the marginal cost of shiploads of cargo consists of the port cost(constant), plus the cost of time spent by an additional ship[cD (X) }, plus the delay cost which that additional shipload imposeson all other users of the port (the last term in the brackets). Or inwords: [ Marginal] F F _ _ Additional-
cost Port Owvn delay costs(Per = c + delay + caused to
vessel cost cost all other_ load) vessels
The last term is of particular interest since it measures the differ-ence between SWQZ and SWVRP in Figure 4.1. Thus for any par-ticular value of X, the required congestion surcharge can be calcu-lated. It consists of two components: the delay cost per ship (or pershipload), multiplied by the elasticity of delay with respect to thethroughput of the port.
The elasticity of delay-the percentage increase in ship delay

72 CHAPTER 4. CONGESTION LEVIES AND SURCHARGES
which would have to be incurred to increase throughput (and soberth use) by 1 percent-is the only unusual element in this formula.It corresponds closely, however, to a concept widely used in planningports and in calculating the optimal number of berths; an examplewas shown in Chapter 3.
In any congested port, it should be possible to calculate the con-gestion surcharge appropriate for the tons of throughput (X) actuallyobserved. In the simplest case, the elements would consist of the dailycost of operating a typical vessel in port or in the line, the daily in-ventory cost of a shipload of typical cargo, and the elasticity of delaywith respect to throughput. In a heavily congested port, the value ofthis surcharge might be very large because another ship joining theline will lengthen significantly the average waiting time suffered byall the vessels in the circular flow of vessels through this port. Thesurcharge may then amount to two or three (or more) times the newentrant's own cost of incremental delay. But this surcharge would notbe the right level for policy because as the surcharge is imposed, thequeue of ships (and shiploads) will contract and, as set out in theexample, the total tonnage presented to the port must shrink. Thesurcharge calculated for the level of throughput under heavy conges-tion would accordingly cause too great a contraction of the numberof vessels sailing to the port; if it were levied, it would have to belowered again. The surcharge that will lead to the desired level ofport use (or the target length of queue) can be calculated only if theelasticity of demand for the port is known. This can be calculatedoccasionally (Chapter 7 below presents an estimate for a particularport), but more often it will have to be guessed at.
Ownership and the competitive structure of steamship services
For the purpose of exposition, it was supposed that the steamshipowners were highly competitive. This may approximate closely condi-tions in some ports of the world. For example, a port catering moreor less exclusively to bulk transport of a standardized commodity,such as La Goulette, will find that there are many ships that competevigorously for the traffic. But for general cargo conveyed in conven-tional or unitized vessels, the shipping conferences probably will playan important role in providing services. Thus the next problem is toexamine the effects of such conferences on the consequences of theport levying a congestion charge. This carries the model one stepnearer reality, but nevertheless one important fiction is retained-

THEORY OF CONGESTION 73
namely that the vessels are all domestically owned. However, theownership of vessels as distinct from the degree of competition is notrelevant for the problem of forecasting what is likely to happen ifcongestion levies are imposed by the port. This is a question of posi-tive economics concerned with merely the consequences of a specifiedpolicy. However, there are also questions of whether the policy is goodor bad and these are issues of normative economics. In judging thedesirability of a policy of congestion levies, the nationality of theowner of the ships is most important. Clearly, apart from considera-tions of domestic distribution, it is important whether the profits of aforeign-owned shipping cartel are increased or decreased at the ex-pense of national residents.
In this chapter, however, even for normative purposes of judgingpolicies, the monopolist or cartel is considered to be domesticallyowned; this restriction will be removed in the next chapter. But theassumption is still useful for two reasons-one minor and the otherimportant. One reason is that the results will then approximate thosefor ports where there is a strict and dominant law whereby all tradedgoods must be carried by domestically owned ships. The main reason,however, is convenience; the problems of the distribution of incomecan be largely ignored, invoking the usual excuse that governmentcan, if it so wishes, redistribute income away from the monopolyshipping lines.6
The form of competition in the shipping industry and the effect onthe behavior of the firms must be considered next. There is little doubtthat the most common market structure of the shipping industryserving developing countries is that of a number of conferences sup-plying most of the services for a medium-sized port. (In Bangkok, forexample, most general cargo is dominated by four or five conferences.)Each of these conferences will normally behave almost entirely inde-pendently of the others, although there may be transitory combina-tions of port users committees to deal with any common threat to
6. As discussed in the introduction to this chapter, there is one other reasonfor ignoring the ownership of ships. This is the internationalist or one-worldattitude to economic policies. Essentially, this suggests that, for the averagehuman being, the world would be materially better off if all govemment policytreated foreigners as if they were nationals. This is the argument for universal freetrade, and its analogous argument applies in all commercial policies. Althoughsuch intemational idealism undoubtedly is praiseworthy, it will appear to be merelya fable to a poor developing country.

74 CHAPTER 4. CONGESTION LEVIES AND SURCHARGES
their profits from the port. Thus the port's proposal to levy conges-tion charges may generate a collusion of conferences to deal with themenace. Since the interests of each conference will be to secure thebest deal for its members, however, such collusions are likely to beephemeral and transitory. Nevertheless, this suggests that it is usefulto analyze the pure monopoly case in some detail before tuming tothe normal case of a group of cartels.
A monopolist steamship service
If there were just one shipowner (or one buying cartel) using theport, then more than the appropriate congestion charge of RQ wouldbe levied. The shipowner would charge the shippers at least a priceof OC, of which OH would go to the port authority, and HM wouldcomprise their average cost of operation. The balance of the chargeMC (RQ) represents the surplus which is appropriated by the mo-nopolist cartel. In other words the value RQ measures the rent perton which should properly accrue to the port because of the scarcecapacity of the port relative to the high demand for its services. Butsince the port is assumed to act passively in its pricing policy, thesurplus is extracted by the monopolist shipping line. Furthermore,with a monopoly shipping line, there will be another restriction ofthroughput since the monopolist will take account of the marginalrevenue curve of the demand from shippers. In other words, themonopolist conference or steamship company will extract not merelythe port surplus but also a monopoly rent from its exclusive positionas supplier of ocean services.
The implications of a high demand and the consequent congestionin the case of a monopoly or single cartel should be explored further.In Figure 4.2 a normal demand and high demand situation with asso-ciated marginal revenue curves are shown.
If the monopolist steamship owner produces more output in thehigh demand conditions, he will incur a higher marginal cost, andthis difference in cost will be in the form of increased congestion.The total price charged by the conference is higher in the highdemand situation. The conference would thus claim ph - pn as thepseudo-congestion surcharge in that port. This conference congestionsurcharge can be separated into two parts: the change in marginalcost (which is truly the increase in congestion cost) and the markupof price over marginal cost (which depends on the elasticity of de-mand). The whole of the price increase ( -p,) will be attributable

THEORY OF CONGESTION 75
FicuRE 4.2. PORT CONGESTION
WITH MONOPOLIZED SHIPOWNER (OR CARTEL)
Costs and freight rates ($)
MCMRhS,X
J~~~~~~~~~~~AC (including
port charges)
High demand
Normal demand
H - ~ - - - Port charge
O - | | b ThroughputX,1 Xh1
Note: MC = marginal cost; MRhi,h MR..-= marginal revenues correspond-ing to high and normal demand, respectively; Xh, X. = profit-maximizingthroughputs when demand is high and low, respectively; Ph, P. = freight rate forXh and X. throughputs, respectively. Conference congestion surcharge = P, -Pn.
to the increase in cost (that is to say, true congestion) if, for bothhigh and low demand curves, the elasticity of demand bears the sameconstant proportion to cost.7 In general, however, it is expected thatthe greater the demand, the greater the inelasticity of demand for agiven price and so the greater the markup over marginal cost; the
7. Since c' = p [(e + 1)/e], p - c' = (-c')/(e + 1).Thus, if (p - c')is constant, c' = (constant) (e + 1).

76 CIIAPTER 4. CONGESTION LEVIES AND SURCHARGES
monopolistic power of the shipowner will be the greater under con-gested conditions.8
It is important to realize that in the monopolist shipowner case,the port is being underused both under conditions of high and lowdemand; congestion is too little, not too much. The value of portservices still exceeds the marginal cost of supplying them, and itwould be better if there was additional congestion in the port.
This problem can be illuminated by considering the demand curvefor the services of the port (Figure 4.3). This can be derived bytaking the difference between the marginal revenue and the marginalcost of the monopolistic conference as the price which the monopolistis just willing to pay for an additional unit of port service over andabove the constant port charge actually levied (granted that he hasalready bought a specified quantity of port services). The equilibriumoutput of port services (assuming fixed proportions) is shown at Xwith the port charge of OH. But this is obviously less than optimal.The monopoly steamship owner should be induced to reduce freightrates and to expand his services and extend production to X1 wheremarginal cost is equal to price. One way of doing this would be tosubsidize port services per unit so that the new lower marginal costcurve for the monopolist shipowner intersects the marginal revenuecurve at the output level X1.9 This is, of course, the opposite of acongestion levy on the port services. Such cases are examined inChapter 5, but the implicit argument for subsidies must be treatedwith great caution because subsidies are likely to become the objectof strategic bargaining; if monopolies are being subsidized, monopolieswill be formed.
Independent competing steamship owners
The empirically more relevant case is where there are many groupsof independent shipowners using the port facilities. These groups
8. It is conceivable that, if the elasticity of demand increases sufficiently whendemand increases and when the rise in marginal costs is small, pi may be belowp., and the conference may more than absorb the increased congestion cost. Thisraises interesting theoretical issues, but they are not important in the present con-text; if congestion cost is small, why worry about it? It is the existence of conges-tion and the surcharges that constitute the problem for policy.
9. The assumption of fixed proportions is most crucial here, and it may not bepossible to lower the cost curve sufficiently by cutting port charges; shipownersmay actually have to be paid to use the port.

THEORY OF CONGESTION 77
FIGURE 4.3. DEMAND FOR OCEAN TRANSPORT
AND DERIVED DEMAND FOR PORT SERVICES
(A) Demand for Ocean Transport
MC
D ~~~< = <~~~ Demand
S __; ~~MR
H -I---Port charge
0 I Shipping services$ XXI X1 I (annual'tons)
Derived demand If port services I I
II
I Port charge (= marginala SD \ cost of port services)
+ I
0 - Port servicesX XI (annual tons)
(B) Derived Demand for Port Services
Note: OH = port variable cost and overhead = port charge (here assumedconstant); HS = ship cost per ton where there is no congestion.
may take the form of a number of conferences, each one of whichtakes into account only the rise in congestion caused to its ships byadding another port call. Thus, if a particular conference accountsfor 10 percent of the port calls, then it will only reckon 10 percent ofthe total marginal congestion cost of an additional call. Clearly as faras port behavior is concerned, this approximates the conditions of a

78 CHAPTER 4. CONGESTION LEVIES AND SURCHARGES
perfectly competitive industry.10 Consequently, in ports where thereis no dominant conference (that is to say, the largest conference takesonly about 15 to 20 percent of the total traffic), it is sensible to usethe competitive model developed in Chapter 1 to forecast the conse-quences of different port policies.
Reflecting back to Figure 4.1, it will be observed that under con-gested conditions at traffic level Xi, shipowners levy a congestion sur-charge of NP (MT) per ton to cover their cost. There will still betoo much congestion at the port, and it would be better to switchtraffic to other ports. Although the shipowners raise a total reve-nue of MTPN in congestion surcharges, this no more than com-pensates for the additional waiting time cost incurred. This costof congestion NP (MT) per ton is simply passed along to the con-signees. There is no way to avoid this cost being incurred by thecargo owners provided that attempts are made to ship OX1 throughthe port. A social loss measured by the shaded triangle is the mini-mum that will be incurred. Attempts to constrain demand by quotas,administrative edicts, or nonprice rules for priorities will only worsenthe loss." The inefficiencies of the nonprice allocation system wouldhave to be taken into account.
Now consider the policy of the port charging congestion levies ofRQ per ton.'2 Steamship owners will not now find it possible to levya congestion charge since congestion will drop back to normal, asshown by the cost OM. If any particular competitive steamshipowner tried to charge a congestion surcharge, his freight tariff wouldrise above cost, and other steamship companies would find it profitableto undercut him. Similarly, with a sufficiently large number of con-
10. The conditional clause is important. The conference may exert considerablemonopoly poweT over a particular trade, but that trade is merely one of manythat the port caters to.
11. Such nonprice methods of restricting traffic are taken usually either forpolitical reasons to protect certain groups or because of the mistaken belief thatincreases in the cost of imports will generate domestic inflation. It is importantto emphasize that inflation is not controlled by attempting to distort the symp-toms. Inflation is generated by excess demand in relation to the quantity of realoutput. First the nonprice controls will distort demand, not reduce it, andsecond, they will be likely to reduce useful output (as distinct from the use ofadditional regulators) below the value it would otherwise have been.
12. The RQ would apply to cargo or to ships depending on where the conges-tion is located.

THEORY OF CONGESTION 79
ferences, each would experience reduced cost (excluding the port'snew congestion levy) as traffic falls from X1 to XO. Thus marginalcost, including the port's congestion levy, will rise by less than thenew congestion levy.
The crucial question is how much of this rise in the marginal costis passed on to cargo owners. A critical role is played by the elasticityof demand and particularly by the change in the elasticity as trafficdeclines. The elasticity of demand that is relevant for this analysis isthat for the individual conference, and not the total demand for theservices of the port. It has been argued elsewhere that the primarydeterminant of the long-term elasticity of demand for the traffic ofan individual conference is the presence of tramp and bulk-carriercompetition.13
In the present context, the important issue is to determine whathappens to the demand curve and, in particular, to the elasticity ofdemand for the conference traffic when the port increases its tariffs.Of course, the main influence will be, as always, the cost of tramp andbulk-carrier competition. Later in this chapter, it is shown that, by theusual conference policy of adhering strictly to scheduled sailings, con-gestion will increase the cost of liners more than the cost of un-scheduled tramp and bulker services. Furthermore, if it can be shownthat port cost is a smaller fraction of total cost for tramps and bulkersthan for conventional liner operations, then the cost and so thefreight rates of competitive tramps will rise proportionately less thanthe cost of liners.14 Thus a congestion levy imposed by the port willbe absolutely and relatively injurious to the liner conference. It willincrease the effective competition to the liner conference and willgenerally increase the elasticity of demand facing the conference. Asa corollary, the monopolistic profit of the conference will be reduced.
This account of the effects on the conferences of congestion levy inthe port tariff suggests that there will be a more efficient use ofresources and a favorable effect on the distribution of income. If thecartels are owned by foreigners, the argument is reinforced. But clearlythe quantitative effects depend on the precise elasticities and costconditions involved, which are dealt with in Chapter 5.
13. E. Bennathan and A. A. Walters, The Economics of Ocean Freight Rates,Praeger Special Studies in International Economics and Development (NewYork: Praeger, 1969).
14. Evidence for the relative importance of port costs is given in Chapter 1.

80 CHAPTER 4. CONGESTION LEVIES AND SURCHAARGES
Units and intemal substitution
So far, the argument has been couched in terms of tons of cargogenerating the congestion. This may well be true in practice, forexample, if the congestion is primarily on the wharves and in thetransit sheds. But also congestion may result from lack of quay spaceto accommodate the ships that attempt to call, and there may beample shed space and wharf capacity. This suggests that while in thefirst case the congestion charge should be levied against the use ofwharves or transit sheds, in the second case the congestion chargeshould be levied against the occupancy of the quay. In the latter case,if the occupancy of a narrow channel causes the congestion, then theappropriate charge will be on the ship call and not on the occupancyof the quays.
It is important to ensure that the congestion levy is raised in theappropriate units and on the particularly congested facilities. Thiswill then permit the substitution of noncongested for congestedfacilities. Thus, if the wharves are overcrowded, the charge should beon the tons crossing the wharves, not on the ship occupancy or call.The extent of substitution between various activities in the portoperation and the extent to which use of congested particular facilitiescan be economized can be revealed only by detailed examination.
The importance of finding the proper unit and base for the con-gestion surcharge is related to the considerable scope that normallyexists for changing the structure of the transport process. The sametonnage of cargo may thus be carried to or from the port by differentnumbers of vessels; small loads per vessel may be converted into largeones. Some vessels will work cargo faster than others, either as aconsequence of different ship design and equipment or because ofdifferent stowage arrangements. The packaging of the cargo can beadapted to different handling techniques. In all these cases, a conges-tion surcharge of appropriate magnitude, levied by the port on theuse of its berths, should induce adaptations in the transport processwhich will lead to a more efficient use of the port's resources. Wheresuch adaptations are undertaken, the congestion surcharge may elimi-nate the abnormal queues of vessels without reducing the tonnage ofcargo passing through the port
The possibilities are considerable. Consider, for example, a casewhere the transit sheds are jammed full of merchandise. It is thetransit shed throughput that determines the turn-around of vesselsand the length of the queue waiting to discharge and load cargo. Itis not merely conceivable, but may even be likely, that a charge levied

THEORY OF CONGESTION 81
against occupancy of the transit shed would cause a much greaterthroughput. Thus the total traffic of the port would increase. Therewould be some cost to such a solution. Those cargo owners and agentswho had used the transit sheds as a relatively cheap form of storageuntil they could dispose of the goods would find that it was notworthwhile because they had to pay now for the true cost of thescarce transit facilities. But the policy would reduce the diversion oftraffic to other ports and may even generate new traffic.'5
Advantages of congestion pricing
One main advantage of congestion pricing is that the port authorityappropriates the surplus caused by the demand for its facilities. It isnot uncommon for ports, particularly in developing countries, to becongested and simultaneously to show large losses even on operatingaccount; levying congestion charges would avoid this undesirable stateof affairs. Secondly, the levies would provide funds to expand portservices. This automatic financing arrangement would make it morelikely that the port, like the tub, could stand on its own bottom.'6
If, on the other hand, the port is subsidized, then such funds mustbe raised by taxation; this not only incurs an administrative cost ofcollection (probably at least 5 percent), but also distorts otherdecisions on the allocation of resources and effort.
A third advantage is that congestion levies will encourage efficientuse of the port facilities. If the congestion charges are raised on theappropriate facilities, this may be associated with a larger throughputof traffic. Even if port throughput is reduced, however, the diversionto other ports or to other uses will be an efficient use of resources.
A fourth advantage of congestion pricing, as distinct from nonpriceallocative systems, is that the port authority receives the rent ratherthan the lucky recipient of the priority or other licensing authoriza-tion. Such distributions of wealth among agents, importers, andsteamship owners is unlikely to be consistent with the normal canonsof equity.
IS. This policv can be pursued only when the transit shed occupancy is sepa-rately controlled and costed. A port authority which operates an all-in chargesscheme would find it difficult or impossible to operate such a scheme. They mightthen have to resort to some administered rationing devices for the transit sheds.
16. For the tale of the tub, see A. A. Walters, Economics of Road UserCharges, World Bank Staff Occasional Papers, no. 5 (Baltimore: Johns HopkinsPress, 1968).

82 CHAPTER 4. CONGESTION LEVIES AND SURCHAIGES
Disadvantages of Congestion Pricing
Probably the main disadvantage is the administrative difficulty ofimposing the levy. In some cases, the handling and wharfage charges(and perhaps quay charges) are combined into one package. But evenif they are charged separately in the invoice, it is not easy to organizethe congestion levy. For example, demand may be largely seasonal,perhaps with a big random component determined by weather, sizeof crop, state of the world markets, or other factors. It may be diffi-cult to put on the congestion charge and then take it off again at theappropriate time. Clearly these levies are appropriate only if thecongestion is expected to persist for some time.
The second disadvantage is often alleged to be that the congestioncharge wvill be passed on and perhaps even marked up at some per-centage rate by the steamship companies. Although this possibilitycannot be shown to be analytically incorrect, it does depend eitheron an unusual combination of elasticities, which will be explored inChapter 5, or on the intractable strategic bargaining of bilateralmonopolists.17
Congestion in Practice
Congestion in ports arises from a variety of causes. These must beidentified if pricing is to contribute fully to the efficient allocation ofresources. Some of the causes are under the control of the partiesinvolved in the transport operations: bunching of ship arrivals whichcan be alleviated by scheduling voyages or by varying speeds, delaysin removing cargo which are partly the responsibility of cargo ownersand inland transport operators, and, similarly, the delays in presentingcargo for export. Even breakdowns in port facilities can be forestalledby inspection, maintenance, and stocking of spares. Other causes resultfrom forces outside the control of those in the transport process:storms and heavy rains which delay vessel movements, cargo workingand strikes, or procedural delays.
Congestion may affect only a part of a port such as a specializedberth or storage facility. In Chittagong, for example, grain deliveries
17. See the Appendix.

CONGESTION IN PRACTICE 83
FIGURE 4.4. SHiP DELAY VERSUS BERTH OCCUPANCY,
PORT OF CHITTAGONG, 1972-1973
k 150
50
Z 0
se July i September! November] January Marchi MayAugust October December February April June
Note: (-) = days of waiting for berth; (. - -) = percent occupancy ofberth; (.......) = number of ships at jetties 1-17.
Source: Louis Berger International, Inc., "Feasibility Study, Port of ChittagongF.xpansion, Bangladesh" (study prepared for the Asian'Development Bank andChittagong Port Trust, vol. 1, December 1974; processed), p. vii-9.
to the silo may be held up because of inadequate inland transport.But even if initially localized, congestion, like the plague, tends tospread. Grain may get bagged in the holds and be transferred tolighters or unloaded directly in other (general) berths. But this raisesthe cost of cargo transfer (although by less than the cost of idle shiptime which would be incurred if no such alternatives existed), andit slows down the rest of the port.
Congestion at the wharf is illustrated in its classic form by therecords of the number of ships on the berth, percentage berth occu-pancy, and ship-days of waiting for berth in the port of Chittagongin 1972-73 (Figure 4.4). If ship-days lost in waiting for berth areconsidered the index of congestion and if the actual number of vesselsat the jetties can be considered a measure of monthly output,'8 it
18. This would only be true if the ships are all of similar size, had similarloads for Chittagong, and worked at an equal rate per day. None of these areunreasonable assumptions for the time reviewed in the diagram.

84 CHAPTER 4. CONGESTION LEVIES AND SURCHARGES
follows that output actually declined as congestion reached its highpeaks (February and May 1973). This corresponds to the backward-bending section of the average cost curve in the classical congestiondiagram.' 9
There are two measures of congestion. The first focuses on cost,notably the time that ships spend waiting for berth. This delay, whenvalued in money, forms the upper limit of one major item of conges-tion cost.20 The shipper's cost of congestion is more difficult tomeasure since much of it is intemal to his firm. This measure ofcongestion cost falling on both shipowners and shippers is concernedwith the money cost of delay. Alternatively, congestion is measuredby the degree of capacity use, in other words, the occupancy rates ofberths or sheds. The interpretation of both measures, however, re-quires knowledge of what is the port's normal level of congestion.
Normal congestion
When a port has the appropriate number of berths and other facili-ties for the expected traffic, a vessel is likely to experience some delayin its visits to the port, just as a customer in the supermarket expectsto wait a few minutes in line before being served. It is efficient forthe vessel to wait a few hours or even a day or so on the averagebefore proceeding alongside. The port charge to the ship will reflectthe fact that there is this normal delay on the average.
Of course, the delay could be reduced below the normal level-perhaps even eliminated if additional berths and other equipmentwere built. But the additional cost of this superior no-waiting servicewill not be worthwhile; the shipowner would rather suffer the averagenormal delay than pay for the additional cost of immediate service.A balance between the incremental cost of providing more capacityand the consequential reduction in the cost of ship delays is thecriterion for defining normal congestion.
The operating techniques of ships and shippers are adapted to thisnormal level of congestion. This adaptation extends to such matters
19. See A. A. Walters, "The Theory and Measurement of Private and SocialCosts of Highway Congestion," Econometrica, vol. 29 (1961).
20. Ships can sometimes load or discharge while waiting for berth. If thisshortens their subsequent stay at the wharf, the saving has to be offset againstthe ful cost of days the ship is idle, taking account also of the excess cost ofworking cargo overside.

CONGESTION IN PRACTICE 85
as the number and functions of shippers' and ships' agents in theport, the amount of transshipment, the distribution of cargoes be-tween altemative ports, inventory policy, and the choice between roadand rail, barges and lighters. With a normal level of port congestion,shipowners determine the size of vessel, transshipment patterns, theextent of overside operations, and the cargo handling equipment onboard. Altemative techniques have different costs; lightering, for in-stance, tends to be more expensive than discharge at the wharf.
What matters to the ship is the total cost and time to move agiven quantity of cargo. This normal time cost is absorbed into thefreight rate. The contrast between normal and abnormal congestionis illustrated by data for two important Indian ports in Table 4.1.
TrABLE 4.1. INDICATORS OF CONGESTION AT Two MAJOR INDiANPORTS, 1969-70
Vessel class: "all others" Port I Port II
Ship delayed because berths unavailable(percentage of all ships calling) 12.5 8.6
Average delay (days) 5.2 1.7Expected delay to any ship entering port (days) 0.65 0.15Ships days lost per berth-day of pore 0.16 0.01Cargo worked per berth-day (tons)b 600-700 325Average turn-round (days) 5.4 8
a. Steamers, excluding tankers, bulkers, and tramps.b. Berth-day is the day in which the berth is occupied by a vessel.Source: Computed from Directorate of Transport Research, Ministry of Ship-
ping and Transport, Government of India, Port Transport Statistics of India(New Delhi, March 1971), Tables 5.3 and 12.1-12.7.
Port I had queues of waiting ships and longer expected entry delaysthan did Port II. But cargo was being worked appreciably faster inPort I so that the average turn-around was lower there than in Port II.Port II had markedly higher liner freight rates, whereas Port I hadcongestion surcharges imposed by liner conferences on its lower rates.
Liner tariffs allow for normal delays, and abnormal congestion isan argument frequently advanced in proposals to increase freightrates. When planning ports that have no close substitutes it is sensi-ble, therefore, to measure the cost of not expanding the port beyonda certain scale by the cost of idle ship time caused by a general excessof demand for berths over available capacity. As used by port planners,

86 CHAPTER 4. CONGESTION LEVIES AND SURCHARGES
the method yields an acceptable approximation.21 But such a criterionis appropriate only if the freight rates reflect fully the cost of ab-normal delays.
Liner conference freight tariffs tend to have uniform rates forranges of ports. The liner conference covering the trades from Europeto the Bay of Bengal thus sets identical rates for shipments to Cal-cutta, Chittagong, and Chalna. The Thailand-Europe Conference,again, has a wide range of uniform rating; the same rates apply tocargo carried to Aden and Gulf ports (4,475 to 5,772 nautical milesfrom Bangkok) and to cargo destined to Narvik (10,425 nauticalmiles). There are various technical justifications for this method ofpricing, including the need to adapt the shipping operation to theslowest moving port in a region. On the whole, however, the explana-tion has to be sought in the nature of shipping cartels; the practicereflects a rough compromise between different members of the car-tels.22 Its effect, however, is to introduce price discrimination betweenports and to blunt the price mechanism. In particular the uniformrates may not reflect the variety of normal congestion at differentports. The distortion is only avoided in those cases where conferencesimpose quasi-permanent congestion surcharges on particular ports.23Unlike the normal congestion element in freight rates, surcharges arespecific to individual ports.
Abnormal congestion
Ports use various working rules to diagnose the onset of congestionbeyond the normal level. A port authority sometimes defines conges-tion as the situation where a ship actually leaves the queue and sailsto another port. A shipowner, on the other hand, is likely to defineabnormal congestion as an excessive waiting time that he can avoidonly in the short run by incurring additional steaming and transship-
21. It is less acceptable if applied to special berths within a port. The rangeof possible substitutes for shipments through a particular berth or by specializedvessels requiring such a berth is necessarily much greater than for an entire port.See Coopers and Lybrand Associates Limited in association with Sir Bruce White,Wolfe Barry and Paitners, and Shankland Cox Partnership. "Lembaga PelabohanKelang. Port Development Feasibility Study." Final Report, 2 vols. (August1974).
22. See E. Bennathan and A. A. Walters, The Economics of Ocean FreightRates, chapter 5.
23. An example is the surcharge on Haifa and Ashdod.

CONGESTION IN PRACTICE 87
ment cost. Other rules of thumb are in terms of critical levels ofavailable capacity use. In the port of Chittagong, congestion is sig-naled when the volume of general cargo lying in the closed and openstorage areas reaches 100,000 to 120,000 tons. This level was exceededfrequently in 1973. But even 70,000 tons of cargo in storage increasesthe cost to cargo owners and their agents. Berth occupancy is anothercriterion adopted by port experts. For conventional general cargoberths it is considered to reach its critical level at 70 to 80 percent,depending on the number of the berths. The critical level for con-tainer ships is much lower; nearer 30 percent occupancy for a singlecommon user container berth or 60 percent for two. Container shipswill not wait.
The cost of congestion (including costs incurred by shippers, ports,and ships in their attempts to escape the consequences of congestion)are not reflected necessarily in prices charged by the port. Ports gen-erally maintain their charges at the normal level even though conges-tion affects their cost. The response to heightened congestion is fre-quently faster working which entails higher cost per unit of outputbut is usually uncompensated by an increase in the tariff.24 In times ofhigh congestion caused by heavier arrivals more stringent (and costly)maneuvering may give a faster turnaround of vessels.25
Revenues respond to congestion delays in that some port rates arecharged per unit of time. This is indeed the rule for rental chargesfor the use of fixed facilities; for example, charges for berth occu-pancy; for the use of tugs, cranes, and slings; and for the occupancyof sheds or warehouses. Revenues from such charges thus may risewith berth occupancy, and, similarly, congestion may raise the port'sincome from storage rent. Chittagong, with its chronically congestedsheds, thus estimates 1975-76 income from wharf rent at Taka 2.75crores against only Taka 1.98 crores from cargo handling. In 1973 theport derived 41 percent of its total revenue from storage charges-twice as much as from cargo handling charges, berth hire, and portdues on vessels.26
But revenues from charges related not to time but to throughputmay decline. The importance of this class of charges varies from port
24. Overtime working is often not charged to the port users. The port's cargohandling charges are typically just based on the tonnage of cargo worked.
25. This may explain the lengthening of ships' average stay in the Port ofChittagong between 1973, a year of high congestion, and 1974.
26. Chittagong Port Trust, Budget Estimates of Income and Expenditurefor 1975-76, with revised estimates for 1974-75 (Chittagong, 1975).

88 CHAPTER 4. CONGESTION LEVIES AND SURCHIARGES
TABLE 4.2. MAni CHARGES TO A SIMULATED STANDARD SHIP AND
CARGO AT THE WHARF, PORT AUTHORITY OF THULAND, PORT OF
BANGKOK, 1974 RATES
Revenues varying with time Charges not varying with time
Source of revenue Baht Source of charge Baht
Berth occupany 4,070 Channel dues 11,100Towage 2,400 Cargo dues0 109,820Storage (sheds and warehouse)b 39,000 Cargo handling 56,250
Total 45,470 Total 177,170
a. Assumptions on cargo: 2,550 metric tons discharged, of which 1,500 tonslanded to sheds (40 tons loaded); dimensions, 2 cubic meters per metric ton.Assumptions on vessel and operation: one vessel of 6,550 CRT; berthed for 65hours; tug time, 60 minutes. Major exclusion: hire of port's mechanical equip-ment.
b. Assumptions: 600 tons removed within free time. A further 600 tons re-moved from sheds after average stay of 2.5 days beyond end of free time. Afurther 300 tons removed from transit sheds after an average of 6 days' staybeyond end of free time, for a full 2 weeks' stay in bonded warehouse.
c. Landing charges and overside charges for imports; quay dues for exports.Sources: Data except for "storage" and "cargo handling" from Coopers and
Lybrand Associates Limited, Report on the Tariff Review (prepared for thePort Authority of Thailand) (London, January 8, 1975). Data for "storage" and"cargo handling" from Port Authority of Thailand, Tariff of Port Charges, Portof Bangkok, 4th ed. (Klongtoi, Bangkok, 1974).
to port, but since they include cargo handling charges as well as cargodues (or wharfage) and port (or channel) dues, they will formnormally the larger part of the payments to the port. This is shownby the calculation of the chief items of payment to the Port Authorityof Thailand for a simulated ship call at Bangkok in 1974 (Table 4.2).
The cost to cargo owners consists not just of the increased inventorycost, contractual fines, lost sales, or higher insurance premiums, butalso of the cost incurred in attempts to contain those losses bydiverting shipments or, in the case of shed congestion, by searchingfor cargo in various sheds and by incurring the expense of havingcargo carried to whichever shed has spare capacity. Frequently thisresults in additional inland transport and distribution cost.2 7
27. An interesting example of appropriation of scarcity rents appears in Bang-kok. The Port of Bangkok consists of the Port Authority of Thailand (PAT)wharves (Klong Toi) and the private wharves on the river. The private wharvesare considered part of the port. When there is congestion in the PAT wharves,waiting ships will try to obtain a higher place in the queue by moving into aprivate wharf, because they are then considered to be already in the port. For this,shipowners pay fees fixed by the owners of the private wharves.

CONGESTION IN PRACTICE 89
To limit the cost of delays the shipowners increase the amount ofcargo working in mid-stream which releases the ship but which mayincrease congestion in the port through a denser movement oflighters. Shippers may re-route and transship either to cheaper vesselsor for inland transport, and, in the longer run, they may vary thetechnique of shipping. The heavy congestion in Persian Gulf andArabian ports in 1974 and 1975 thus led to a highly competitive rushof roll-on/roll-off services to these ports to circumvent conventionalhandling delays and of transshipment services combining sea trans-port to less congested ports with overland transport into the hinter-land of congested ones.28
Shippers will try to pass on their congestion cost. The demand formany export products of developing countries is highly elastic withrespect to price, and the exporters will normally bear the cost. Butimporters will more often be able, in those countries, to raise pricesthroughout at least part of their market area; their position will bethe stronger, in this respect, the stronger is the port's monopoly.
In the charter market, many contracts impose the cost of delay onthe shipowner. Competition, however, will ensure that charter ratesare marked up to include the cost of delay. Pronounced congestionin an important trading area may thus prop up the demand for shipseven in a time of general international trade recession.29
Congestion surcharges
Liners and liner conferences, which fix their freight rates for aperiod and publish them in their tariffs, seek to pass on the cost ofabnormal congestion by congestion surcharges. Some fifty ports weresurcharged in early 1975. The surcharges are expressed normally as apercentage of the freight rate and are not subject to the various formsof loyalty rebate by which conferences seek to tie shippers. The rangeof surcharges reported in early 1975 was from 5 to 10 percent in
28. For instance, Europe to Iraq (with a heavily congested port at Basrah)through Aqaba.
29. The general firmness of the charter market and of prices for vessels of3,000 to 12,000 DWT in 1975, in a period of a general decline of demand forshipping space, is thus difficult to explain except by reference to the heavy con-gestion in Middle East and Arabian ports. Congestion in these and certain otherports may have tied down some 1,500 ships of that size class. Compare, IsraelShipping Research Institute, Freight Research Division, Information Paper, no.46 (Haifa: Israel Shipping Research Institute, April 1975).

90 CHAPTER 4. CONGESTION LEVIES AND SURCHARGES
Bombay to 130 percent in Tripoli or in Lattakia, where over ninetyships were waiting for berth and where the average delay was 40 days.
Conferences set uniform surcharges for all their members. Since thecost of normal congestion is absorbed in the freight rate and sincethe normal level is not a precise concept, conferences seem to think ofa threshold of congestion. Some U.S. conferences operating in south-east Asia define this threshold as 10 days' berthing delay; wherereached, this will provoke a 10 percent surcharge, rising by 1 percentper additional day's delay in steps of 5 percent. Typically, surchargesare applied after abnormal congestion has been experienced and thenonly after wamings and notifications. Attempts to impose surchargeson expected delays-for example, a surcharge conditional on a threat-ened strike-are rare.
Short and long abnormal delays
Liner congestion surcharges are usually imposed some time after theonset of abnormal congestion because of the organization of the linerbusiness and the nature of liner cartels. Shippers and conferences ina port are tied by contractual relations which may specify that wam-ings and notifications precede the actual imposition of the surcharge.The decision to impose a surcharge must be agreed between operatorswho differ in their interests, their costs, and their competitive posi-tions within the cartel. This takes time. Another explanation, how-ever, is current among shipping experts. According to this view, thecost of short delays (that is to say, congestion which does not lastlong) is less per unit of time than the cost of prolonged congestion.The reason given is that short delays on a multiport voyage can bemade up by faster working in other ports on the voyage at a lessercost than the cost of ship-days lost through delays when calculated atthe daily cost of running the vessel. In a study of Port Swettenham(Kelang) in 1967,31 shipowners were reported as valuing a day'sdelay to their ships at M$5,000-M$8,500, this being the sum ofoperating cost, depreciation allowance, and interest charge attrib-utable (in an accounting sense) to the vessel. Delays of two dayscould be coped with by working overtime in the next port of call,
30. Coode and Partners, Economist Intelligence Unit, and L. E. Taylor, PortSwettenham Improvement Scheme. 1968 Pre-Investment Feasibility Study, pre-pared for the Honourable Minister of Transport, Government of Malaysia (Lon-don, 1968), vol. 2, pp. 272-74.

CONGESTION IN PRACTICE 91
by working weekends if possible, by cutting several days off theship's maintenance period and servicing it at overtime rates, byrescheduling ports of call, or even by missing out a port of call. Thecost of these compensating actions was M$850 to M$2,550 per day'sdelay, depending on whether the corrective action had to be taken inFar Eastern, European, or Australian ports. Delays beyond a certainduration-perhaps 3 days on a round voyage of 30 days-could not bemade up by accelerating at other points of the voyage. Within thatlimit, the cost of a day's delay was less than the cost of a ship's day,the difference being 50 percent or more according to the figures inthe Port Swettenham study.
But if such savings are possible through tighter operations at differ-ent points of a voyage or at the time of maintenance or of servicing,why should they be realized only as a result of abnormal congestion?If this is indeed the case, it points to inefficiency in the shipowner'soperations which competition would eliminate quickly. In the absenceof competitive pressure, a shipowner, of course, can dissipate mo-nopoly profits in unnecessarily high cost. The more competitive theshipowner or the liner conference, the less inefficiency will be toler-ated in their operations and the closer should be the daily cost ofshort delays to the normal cost of delay (that is, to the cost of a ship-day). Therefore, if the operator's private cost of a day's delay riseswith the length of the delay, this is sufficient evidence of monopolyand moreover of inefficient monopoly. It should not persist in thelong run because even the tightest conference cannot suppress someforms of competition among its members.
Surcharges and the type of service
The private cost of congestion will differ according to the type ofvessel used and the contractual stipulations between operators andshippers. Since liner conferences include many types of vessels, theuniform surcharge will reflect some kind of average of congestion coststo different operators in the cartel, weighted presumably by theirindividual bargaining strength. But will the cost of delay and hencealso the surcharge (or its equivalent in charter rates) differ also ac-cording to the type of service?
Liners, unlike tramps, work on sailing schedules. Since the domi-nant conference organization of liners suppresses price competition,operators have to compete by other methods. Frequency of serviceand reliability are probably the most important forms of this non-

92 CHAPTER 4. CONGESTION LEVIES AND SURCHARGES
price competition; while some shippers would prefer less regularsailings at lower freight rates, such altematives are not offered in acartelized service. The cost of delay can be illustrated again by thePort Swettenham study of 1967. This considers the case of a 4-daydelay affecting a liner company operating a 30-day round trip withcalls at eight or nine ports. If the normal turnaround time in eachof those ports is 2 days, a 4-day delay in one port requires that oneof the remaining eight ports on the itinerary be omitted, always as-suming that the vessel has to be positioned on time at the terminalport. If four vessels in the company or the conference experience thisdelay, it accumulates to 16 ship-days. This amounts to a full roundof eight port calls niissed out on the service which can only berecovered by commissioning a fifth ship and putting it on this service.Assuming the policy of strict scheduling, the entire cost of the addi-tional round trip should be attributed to the congestion.
The Swettenham report illustrates the additional cost of congestionto liners if the conference observes strict scheduling. The cheapestsuitable vessel which the conference could charter in 1967 for theadditional trip cost M$3,460 per day. The interpolated round triptakes 30 days, each to be valued at the daily cost of the additional ship.Since the additional ship was brought in to compensate for 16 ship-days lost through delay in the congested port, the daily cost of con-gestion is M$6,500 [= (30/16) x M$3,460]-roughly twice the dailycost of the actual ship. For longer round trips the daily cost of conges-tion thus computed would be greater and so, other things being equal,would be the amount of the surcharge (although not the percentagesurcharge8"). The corresponding percentage surcharge will vary ac-cording to the level of the average freight rate and the amount ofcargo each ship normally carried to the congested port. The Swetten-ham report of 1967 did not consider that the rate of vessel use wouldbe affected by the additional voyage and suggested that the surchargefor a 4-day delay should be about 20 percent of the freight rate forscheduled services to Port Swettenham. (The effect of the same delayon the unscheduled carrier could increase the rate per ton only about10 percent.) The cost differential arises from the liners' strict adher-ence to schedule. If this cost is charged to the congested port's cargo,the unscheduled tramps and bulk carriers will have a price advantage.Furthermore, the longer the abnormal delay, the wider the gap be-
31. The freight rates which bear the surcharge vary with distance or durationof transit.

CONGESTION IN PRACTICE 93
tween the cost of shipping on liners and on tramps-provided thatthe liners continue to cling to their policy of strict scheduling and ofcharging the resulting cost to the congested port.32 Since the trampsand bulk carriers would be in a better position to compete away theconference traffic, it is unlikely that the conference freight rates willrise to reflect the full cost of congestion.
Surcharges and the degree of monopoly
If conferences or ships compete, the theory of congestion indicatesthat the congestion levies will be too low. But conferences would beexpected also to use their monopolistic power so that the actual sur-charge will be lower as competition increases.
The effect of monopoly on liner conference congestion surchargescan be seen in the relative level of surcharges imposed by conferencesserving the same port over different distances (Table 4.3). Intuitively
TABLE 4.3. CONGESTION SURCHARGES ON SHIPMENTS TO BOMBAY
AND KARACHI, 1973
Effective RatePort Conference Route from (%)
Bombay India/Pakistan UK/India, Pakistan 3.12.73 30West coast of India, India, Pakistan-U.S. 10.12.73 30
Pakistan/U.S. Atlantic and Gulfports
Japan/India, Persian both ways: Japan- 1.12.73 15Gulf/Japan India, Pakistan,
Persian GulfGulf, Arabian Sea/ Persian Gulf, Ara- 1.12.73 15
Orient rate agree- bian Sea, Southeastment Asia, Taiwan,
Korea, PhilippinesKarachi India/Pakistan 3.12.73 20
West coast of India,Pakistan/U.S. 10.12.73 20
Thailand/west coastof India, Pakistan,Persian Gulf Southeast and 1.12.73 15
South Asia
32. In the unnecessarily discrete units of the Swettenham example, a furtherservice may have to be added if delay in the congested port lengthens to 8 daysper ship.

94 CHAPTER 4. CONGESTION LEVIES AND SURCHARGES
it is clear that the shorter the sea distance, the greater the percentageadded to normal freight cost by abnormal congestion. Similarly, forships in direct service to a particular port, the greater the cost per tonof a day's delay in port, the larger the percentage rise in the voyagecost per ton caused by increased congestion.33 It was shown in Chap-ter 1, however, that the longer routes will tend to have the largervessels and that the cost per ton of idling in port is less for thoselarger vessels. On these grounds, the percentage by which congestionraises the freight charge per ton should be less on the longer routes.These predictions, of course, derive from a competitive model of ship-ping, and such a pattem would not necessarily be expected to emergeon cartelized routes. Indeed, the dominant feature on long sea routesmay be the power of the cartel; as shown in an earlier study, there isa general rule that short routes are competitive and long routes tightlycartelized.34 The experience of additional demand leading to conges-tion will tend to add to the monopoly power exercised by the confer-ence as demonstrated in Figure 4.2 (above), and so the conferencewould be expected to exploit its control of the scarcity.
Table 4.3 shows that in two random instances, surcharges weresmaller on the shorter routes than on the long routes to Europe orthe United States. Some of the difference may be explained by dif-ferences in the percentages of cargo destined for Bombay or Karachion the intercontinental and the intra-Asian voyages, but the impor-tance of the two ports on these routes makes this an unlikely ex-planation of the full discrepancy. In this case the lower surchargesseem to give the truer indication of the cost of congestion to theships.
33. Using the notation of Chapter 1, let the ship's idle time in port rise by Al.Voyage cost per ton will then increase by:
Al =-&A+gC)(I-a) A,
and so, for the proportional effect of idle time on unit cost:
Al B(V/C) (I-a) AlV/C I 0.5DK+I(-a)+C/(L+mC)
where K = (h + B/C)/(g+A/C), the ratio of the daily cost per ton of theship at sea and in port.
The proportional increase in unit cost for another hour's congestion rises withthe daily cost of waiting in port, but it declines with the distance of the voyage.
34. E. Bennathan, A. A. Walters, and others, The Cost of Ocean Transport inthe Foreign Trade of Asia (processed).

CONGESTION IN PRACTICE 95
Further evidence for a monopolistic element in some surcharges isfound in the fact that they are frequently maintained after abnormalcongestion has ceased. The explanation lies in the carrier's wish torecoup losses sustained because of the delayed imposition of the levy.This would be impossible in a competitive market. The same portmay also be surcharged by one conference but not by others.35 Thiswould be consistent with variations of the extent of competition ondifferent routes.
To the extent that differences in the size of surcharges reflect thecompetition faced by conferences, it will be the lower surcharges thatrepresent the better estimates of the congestion cost suffered byships. The higher surcharges contain a share in the scarcity rent whichcongestion creates and which conferences appropriate according tothe strength of their market position.
This raises a general question: should the port authority not merelytake on the job of congestion pricing but also the task of raisingrevenue for the economy as a whole? Clearly there is the possibilityof using the port monopoly as a source of finance for govemment oras an instrument of the national interest. This is discussed in thenext chapter.
Appendix. Bilateral Monopoly and Strategic Behavior
Essentially there is a confrontation of two monopolists: the portand the shipowner. The steamship owner will know the minimum netreturn (that is to say, net of port charges) which he will require if heis to continue to call in the port, but he is not likely to reveal thatvalue to the port authority or to the owners of cargo. This minimumnet return will depend on the alternative use of the ships-perhapsavoiding the call at the port entirely and so being able to use theships serving the trade elsewhere. Similarly the monopolist steamshipowner may know that the extent to which he can raise prices is notmerely limited by the availability of other transport services (includ-ing steamship and air services), but also by the elasticity of supplyand demand of the commodity.
The port authority again will know the minimum price at which itis willing to provide port services. Between the maximum that the
35. All India Shippers Council, Fourth Annual Report for the Year 1970 (NewDelhi, 1971), pp. xxix and following.

96 CHAPTER 4. CONGESTION LEVIES AND SURCHARGES
steamship company is willing to pay and the minimum at which theport authority is willing to supply, there would normally be a con-siderable gap.
So far the port authority has been assumed to charge a specific fee(per ton) for its services (as in Figure 4.1, above) and not to chargea congestion levy nor, further, to extract a monopoly profit by charg-ing high tariffs. In other words, the port authority, perhaps realisti-cally, has been assumed to behave in a passive manner. But supposethat the port authority does not adopt a supine stance. Suppose thatthe authority takes into account the effects of its tariff policy on thebehavior of the conference and so, with consummate cunning, calcu-lates the effect on its own accounts.
There is an infinite number of strategies that the port authoritycould pursue. There is the use of bluff, concealing information, andall the other familiar features of bargaining. Unfortunately, it is im-possible to give any precise rules about the outcome of such a process.The monopolist steamship owner is likely to have many port authori-ties to contend with in other countries, however, and therefore islikely to be quite experienced in the bargaining process; the portauthority is likely to lose out.
In general these reflections suggest that the port authority, evenwhen faced with a monopolist steamship owner, should price thefacilities of the port according to scarcity in relation to the demandfor them. In what follows the problems of strategy, bluff, and counter-bid are ignored. Strategic behavior and bargaining nevertheless maybe very important for providing special facilities such as exclusiveuse container terminals or bulk cargo wharves. These are in the natureof once-and-for-all deals for a certain contractual period (say, 5 years).The port authority would be wise to get specialist advice on nego-tiating such arrangements.

Chapter 5
Port Pricesand the National Interest
THE OBJECT OF MARGINAL COST PRICING iS to allocate resources so thatthe relative values which users place on another unit of differentgoods and services corresponds to the economy's relative cost ofsupplying them. In the preceding chapters the conditions under whichmarginal cost pricing can achieve that objective were discussed. Eco-nomic policy, however, may pursue other objectives. In practice, thetwo major alternatives are profit maximization and the maximizationof the national benefit which underlies much foreign trade policy. Inthis chapter, both of these altematives are discussed in relation toports.
Port Profit Maximization Comparedwith Marginal Cost Pricing
Ports which lack monopoly power have little choice in the waythey set their charges. But most ports have some monopoly powerand thus also some choice between setting prices approximately equalto marginal cost and pricing their services to maximize profits.
The effects of profit maximization on prices and output depend onthe circumstances of the case and are usually difficult to ascertain evenin specific cases. The difficulty is naturally greatest in enterprises likeports which are usually multiproduct firms selling each type of servicein a variety of markets, each with its own demand conditions. To
97
98 CHAPTER 5. PORT PRICES AND THE NATIONAL INTEREST
advance beyond the broadest generalities and, in particular, to obtainan idea of the size of the effects of pricing to maximize profits, it isnecessary to work with a model. This section explores the effects ofprofit-maximizing pricing in a port that is a perfect monopoly inrelation to the shippers of its hinterland. This is admittedly a limitingcase. Only a few ports conform to this type. In most ports, the ship-pers can either ship overland or by another port.' But while the modelhas no great descriptive value, it contains some realistic features.Thus ports should be expected to be in a stronger position in relationto shippers than ships; and other aspects of the model capture someof the characteristic demand conditions of areas depending chieflyon gathering activities or forestry.
Imagine a port on a northern coast, as shown in Figure 5.1, andsuppose that it is an export port only. Traffic originates along thestraight road PR, where R is the limit of cultivation of the exportproduct along the highway. The f.o.b. price offered for the exportcrop at the port is constant, whereas the price that the farmerreceives at the farm gate excludes transport cost to the port and theport charge.
The internal transport cost is assumed to remain constant. Theonly variable considered is the price levied by the port for its services,which are assumed to be homogeneous and are required in identicalform for each identical ton of output exported. Even if the basicactivity of producing the output crop is subject to conditions ofconstant return to scale, the increased transport cost, as distance awayfrom the port increases, yields increasing marginal cost for the totalproduction of the commodity. Imagine that land is homogeneous(for example, a 100-square meter plot when cultivated will produce1 ton) and that the product has to be transported in an east->westor west--east direction to the road at a constant cost of $1 per 100meters.2 The area of cultivation will then be RQQ'.
When the price charged by the port for its services is varied there
1. Ports in southern Thailand, western Malaysia, and Singapore are rather farfrom the situation of this monopolistic port. Chittagong and Bangkok are in anintermediate position, but Manila or Tanjong Priok may be as adequately de-scribed by this model as they would be by any other.
2. The assumption corresponds to that made in the Ellet model described inA. A. Walters, Economics of Road User Charges, World Bank Staff OccasionalPapers, no. 5 (Baltimore: Johns Hopkins Press, 1968). The ton-mile cost of trans-port along the road is also assumed to be constant and independent of distance.

PORT PROFIT COMPARED WITH COST PRICING 99
FIGURE 5.1. A PORT AND ITS HINTERLAND
Q P Q'
R
QfS Q P Q' Q'*
Q* Q~ ~~R
are several consequences. A reduction in the pOrt prices will extendproduction along the road and also will increase the boundary ofcultivation in the east->west direction (Figure 5.1) to the asteriskedvalues. The marginal revenue obtained by the port for a small reduc-tion of port charges would contain the quantity increase represented bythe arrow-shaped area Q*QRQ'Q'*R* as one of its components.
The main purpose in developing this model was to explore some-thing like the upper limit of the absolute value of the elasticity ofdemand that may be expected in port economics. 'Me model incor-porates an infinitely elastic demand for the commodity at the port.

100 CHAPTER 5. PORT PRICES AND THE NATIONAL INTEREST
Furthermore, in this model all that is required to bring land intoproduction-with the consequent increase in demand for port services-is that it pay for the transport cost to the port and for port charges.Yet the main conclusion that emerges from the formal investigationof this case is that the demand curve is inelastic for monopoly portservices. In particular, the elasticity of the demand curve declinesrapidly as port prices are reduced.3
In these circumstances the port's profit-maximizing price will alwaysexceed marginal cost, provided only that marginal cost is less thanthe price at which demand for port services would dwindle to nothing:
rPot's profit ~ omaximizing Port's s
( 1 ) price for its 'A margintl + / 3monopoly cost derandservices Pri
The excess of the profit-maximizing price over marginal cost can alsobe expressed in terms of internal transport cost to the port: when theport has maximized its profits, its price will be above marginal costby an amount equal to half the transport cost to the most distantpoint (in terms of transport cost) in its catchment area.4
The effect of profit maximization on output of port services in thismodel is to reduce it to four-ninths of the level that would beachieved under marginal-cost pricing conditions.5 This result is illus-trated by the demand curve in Figure 5.2, drawn, for convenience,assuming zero marginal cost. The profit-maximizing price is thensimply one-third of the zero-demand price for port services.
The most general lesson that may be drawn from this case is thatwhere the monopoly power of the port is considerable, even if it hadoverinvested considerably, it could usually cover its cost by raisingprices and restricting exports. There are then good reasons to expandthe output of the port up to somewhere near capacity by using multi-part tariffs or some form of spatial or commodity discrimination.When marginal cost is near zero and considerable capacity is standingempty, it would be wasteful to operate the port at four-ninths of itspotential either for reasons of profit maximization or to enable theauthority to cover its cost.
3. Appendix A.4. Appendix A.5. Appendix A.

NATIONALLY OPTIMAL PRICING AND INCIDENCE 101
FIGURE 5.2. DEMAND CURVE FOR PORT SERVICES
Price of port service(p(O))
Port's zero-demand price (9/'y)
I\
Fort's \maxirmum
pbrofit price \
\ I ~~~~~~~~Port's price=MR> MC 011tpUt
1~~~
9 tt] ~~~~Demand=export (X)
Port's maximum promt output
Note: Marginal revenue = 3 p(0) - ;for monopolist policy of maximum profit,
pro fit price f
pb(O)>/3j; maximum gross revenue = 4 r$il
Nationally Optimal Pricing and Incidence
National port policy requires a study of the relation between theport price, the fteight rate, port profit, and the benefits to traders anddomestic consumers. Therefore, the question of how port pricingmight serve the general national interest must be considered. Therest of this chapter discusses how port prices must be fixed if theexternal conditions which face port and national port users are takenas unalterably given.

102 CHAPTER 5. PORT PRICES AND THE NATIONAL INTEREST
The distributional aspects of intemational transport differ in onemajor respect from those of predominantly national projects. In thenormal case of a public utility, for instance, suppliers and consumersare mainly nationals. In that case, marginal cost pricing itself, supple-mented where necessary by the computation of shadow prices, per-forms a major distributional function. Standard fiscal methods canthen at least regulate the distribution of any monopolistic surplusesthat remain in the economy. In intemational transport services, how-ever, some, if not actually all, of the suppliers are foreigners. Thusthe problem of distribution between foreigners and nationals arises.This is greatly complicated by the fact that nationals, such as nationalshipowners or airlines, also help to supply the services. This is becom-ing increasingly characteristic in at least some of the developing coun-tries; ever more of them try to reach the politically accepted target of40 percent participation of national shipowners in the national seatrades." In this chapter, nevertheless, it is assumed first that ship-owners are foreigners and that the port, inland transport operators,traders, and the consumers of imports and producers of export com-modities are nationals. This is a most helpful simplification in whatis already a far-from-simple problem. This analysis thus presumes thatthe distribution of income or benefit to and from national shipownerscan be taken care of by internal fiscal arrangements.
It is not unusual for ports to seek to control the distribution ofcosts and benefits between nationals and foreigners through differ-ential increases in charges payable by ships and other charges payableby the shipper. The distinction between charges on the basis of whonormally pays them is a common feature of port tariffs. The classifi-cation reflects roughly the way in which decisions on the use of portservices are taken in a conventional transport operation.7 It is thus
6. Compare, United Nations, Conference on Trade and Development, UnitedNations Conference of Plenipotentiaries on a Code of Conduct for Liner Con-ferences, vols. I and 2 (New York, 1975) and B. M. Deakin, "Shipping Con-ferences: Some Economic Aspects of International Regulation," Maritime Studiesand Management, vol. 2, no. 1 (July 1974), pp. 5-31. See also, A. H. Vanags,"Flag Discrimination: an Economic Analysis," [Advances in Maritime Economics,ed. R. 0. Goss. (Cambridge: Cambridge University Press, 1977)] and A. A.Walters, review of Advances in Maritime Economics [Journal of Political Econ-omy. April 1979].
7. The division of actual payment differs according to the terms of carriage.When cargo is carried on liner terms, the shipowner covers the expense of movingthe cargo from and to the sheds and includes at least this cost in the freight rate.

NATIONALLY OPTIMAL PRICING AND INCIDENCE 103
in accordance with the principle that the party which causes the portto incur particular costs should both know the price and pay it. Whendecisions on how the port is to be used tend to be concentrated inone hand, it will be both convenient and efficient that the chargesshould be levied on that single party, and this is accordingly the prin-ciple of many container tariffs. The separation of charges paid by theship from those paid by shippers is thus functionally efficient andadministratively convenient. But it would be a mistake to think thatit also can affect the distribution of income or of cost between shipsand shippers. A given increase in port charges will have the sameeffect on the ship and the shippers, whether it is loaded on the chargesclaimed from the ship or on those claimed from the shipper. Whetherthe given increase in port revenue is obtained in one way or theother, the effect on freight rates and the ship's revenue will be thesame. The port is unable to control the incidence of its charges onship and shipper. The distribution of the burden is determinedexactly as in the case of a commodity tax: by the elasticities ofdemand and supply of shipping.8
Barring strictly short-run effects, it is thus futile for ports to attemptto protect national shippers by raising revenue mainly from thevessels. But the attempt is frequently made.9 It has also been sug-gested that dues on foreign shipping are met primarily from externalsources whereas dues on cargo are intemal revenue and that the coun-try's foreign exchange receipts will, therefore, benefit from raisingcharges on the ships rather than on the shippers.10 Excepting againstrictly short-run effects, this is another example of the same fallacy.
It may seem that even though ports cannot protect their nationalshippers by tilting the balance of charges against the vessel, at leastnothing will be lost by trying except some wasted ingenuity. But thiscan obviously not be guaranteed. The efficient use of port resources
8. The time lag between the initial change of port charge and the final stateof the distribution of the cost between the parties is ignored. In the case ofliner conferences, this lag may be as long as 1 year because conference tariffsare not being changed continuously.
9. Compare, Coopers and Lybrand Associates Limited in association with SirBruce White, Wolfe Barry and Partners, and Shankland Cox Partnership. "Lem-baga Pelabohan Kelang. Port Development Feasibility Study." Final Report,2 vols. (August 1974), p. 5.
10. Feasibility Study, Port of Chittagong Expansion, Bangladesh, prepared forthe Asian Development Bank (Louis Berger International Inc.), vol. II (De-cember 1974).

104 CHAPTER 5. PORT PRICES AND THE NATIONAL INTEREST
requires that separate services should be priced according to their cost.If cost rises for services which are paid normally by the shipper, anyprior decision to raise revenue to cover cost by increasing the chargeto vessels will prejudice the efficiency of port pricing. It will distortthe relation between price and cost across the port's operations.
As a start of this analysis, consider the general pattern of portinvestment and pricing and the effect on nationals according to thefollowing layout.
T se rt autrority or tgovernment m
[nvestment > Port price > ~~~~Freight -rate
andvcurrent coticre onrunigtepr are(rckuinoned aseroppor-
l ~~~Surpluses of
|Benefits to national
This schematic arrangement ignores the surplus that may accrue tomonopolistic labor unions that may control the port; both investmentand current cost incurred in running the port are reckoned as oppor-tunity cost.
To simplify matters without doing violence to reality, suppose thatthe commodities are supplied and demanded at a constant price inworld markets which are located a constant distance from the port.Thus variations in the freight rate have their entire effects on domesticresidents-traders and consumers-and, of course, on the port.
The criterion for optimum port pricing emerges easily from thisscheme. The total benefit is the profit to the port and the surplusearned by traders or enjoyed by domestic consumers. In principle, areduced charge for port services will be reflected in a reduced freightrate (discussed in more detail in Appendix B), and the reducedfreight rate is an advantage to the traders and to the consumers.

BILATERAL MONOPOLY: SHIPS AND PORTS 105
The marginal conditions for maximum national benefit also emergereadily from this scheme. The port should fix its price so that theadditional loss entailed by a small reduction in this price is just offsetby the additional advantage accruing to traders from the resultingreduction in the freight rate. In other words, the marginal loss to theport should be balanced by the marginal gain to the customers of theshipping lines.
One of the main problems is to find the relation between the portprice and the freight rate. At the simplest level, it has been suggestedthat changes in port prices do not have an effect on freight rates.'"This would eliminate two of the relations in the above figure.Unfortunately, the shipping companies will not absorb variation inport charge unless they are restricted to certain small variations.'2
Some passing on and perhaps multiplication or markup is bound totake place.
Bilateral Monopoly: Ships and Ports
The difficulty with this port-charge/freight-rate relation turns onthe competitive structure of the shipping industry. If the country isserved by one monopolist firm and if the port industry is organizedalso as a state monopoly, a bilateral monopoly emerges.
The natural outcome of bilateral monopoly, according to a standardtheorem of economics, is the production of that volume of outputof the intermediate good or service that maximizes the joint profit ofbuyer and seller.'s This result is reached by an all-or-nothing deal (orsimply, discriminating monopoly): the stronger party maximizing itsown profit while reducing the profits of the weaker party to nothing.An all-or-nothing bargain forced by, say, the strong port on the weakshipping monopoly would dictate that the ships must buy that volumeof port services (XM) for which the port's marginal cost equals theships' marginal revenue product (Figure 5.3).
11. See, for example, Ian Heggie, "Charging for Port Facilities," journal ofTransport Economics and Policy, vol. 8, no. 1 (1972), pp. 15-16.
12. It is clear that the problem would be simple and the solution silly, sincethe port could simply raise prices and increase its profits endlessly.without in-curring any penalty of an increase of freight rates.
13. W. Fellner, "Prices and Wages under Bilateral Monopoly," QuarterlyJournal of Economics, vol. LXI (August 1947), pp. 503-532.

1o6 CHAPTER 5. PORT PRICES AND THE NATIONAL INTEREST
FIGURE 5.3. BILATERAL MONOPOLY
$ d MG (port)d x ("marginal supply")
-Marginal cost (port)("supply")
Average cost (port)
Average revenueproduct (ship)
IlMarginal revenue prodtuct(ship) ("demand")
O so s t X *Tons (X)XI X, X. d MR (ship)
dx ("marginal demand")
This same transaction would come about between the departmentsof a profit-maximizing enterprise consisting of a port-plus-shippingcompany. But the price paid by the ship would be fixed by the strongport at $A per ton, equal to the ship's average revenue product whichexcludes profits. Alternatively, a strong ship confronting a weak portwould offer a price of only $B per ton for the same quantity of Xmtons annually and would enforce this deal (and a price at which theport would normally only wish to supply X1 tons of service annually)by the threat of not calling at this port at all.
This solution, implying the output Xm and an indeterminacy ofprice between $A and $B per ton, is only feasible to the extent thatall-or-nothing deals are feasible in the market for port services. Themost obvious opportunities for this type of bargain exist in the deal-ings between ports and container consortia. Consortia bargain forseparate terminals in the ports and will seek to obtain this at a profit-

BILATERAL MONOPOLY: SHIPS AND PORTS 107
maximizing price under threat of omitting the port. The port, on theother hand, may insist on a certain number of annual calls which arepaid for whether or not performed.
Large-scale containerization is usually acknowledged to be a matterof national policy and not just of concern to the ports. The dealsoffered by container operators, therefore, are often addressed to gov-ernments rather than to ports, and the question of the incidence ofparticular proposals is often obscured further by the participation ofa national line in the consortium.
A proposal of this kind was made to a southeast Asian governmentby a domestically owned shipping company on behalf of itself and amajor foreign operator from the most important trading partner. Theproposal was that two of the country's scarce deep-water berths shouldbe franchised to the national operator to develop into containerberths, that the leasees should also be given exclusive rights to theinland transport of containers, and that container traffic in the coun-try's deep-water port should be confined to national carriers and totheir foreign associates. In addition, freight rates should not bereduced until the licensees had recovered their outlay, and the portshould not exact rent for leasing berths since the expected rate ofreturn (which on closer analysis seemed to be about 16 percentannually) was low. In retum, the leasees would both develop thecontainer berths and provide a certain number of container sailingsper month on the route to the major trading partner. The proposalwas regarded as an all-or-nothing offer by the government and ulti-inately was rejected.
Where no all-or-nothing deal is technically possible, the solution tothe bilateral monopoly situation will be less efficient and will restrictoutput more. Thus Figure 5.3 shows the case where the monopolistship confronts the competitive port. The best it can do is to demandX2 tons of service annually, which the port will supply at $C perton. With this quantity the ship maximizes its profit, as shown bythe fact that the marginal cost of the port service to the ship[(d(me)p) /dxJ equals the ship's own marginal revenue product.
The difficulty with bilateral monopoly situations is that there is nogeneral rule for the port to follow once it is in such a situation-except the obvious rule that it should avoid getting into the situationby its long-run policy. It is always better for the port to be faced bycompetitive shipping enterprises than by a monopoly, weak or strong.

I o8 CHAPTER 5. PORT PRICES AND THE NATIONAL LNTEREST
But varying the competitive mix of the shipping interests confrontingthe port, if this is at all practicable, requires a long-run strategy.14
Optimal Pricing with Passive Shipowners
The problems of bilateral monopoly can be avoided only by assum-ing that the steamship monopoly reacts passively to the pricing policyof the port. This assumption gives the maximum leverage to the portauthority; this must be remembered in interpreting the results. Buteven in practice, a port authority is confronted rarely by a singlemonopolist steamship owner or even by a single conference. Thetypical case is that of several conferences and a few miscellaneoustramps and bulkers. Again it is difficult to analyze the reactions ofsuch a mixed bag of customers, but this analysis covers the extremesof this case-passive monopoly and perfect competition.
The market price for a quantity X of the port's services will bedetermined by the demand for the services from the steamship owners.If the steamship owner is a monopoly in relation to the shippers ona route, then he will be willing to buy an additional unit of portservices at a maximum price equal to the difference between hismarginal revenue and his marginal costs, that is to say:
_ = [Marginal] [Marginal ship1(2) Port price = revenue cost (net of
( [ of ship port charge)
Thus, if the marginal cost for ship operation is constant:
3 Change in port pricel - Change in marginal revenueL as X increases J L as X increases 1
it there is a constant elasticity of demand for shipping:
(4) Change in + 11 F Change inI port price I = l e J Lfreight ratej
where e is the elasticity of demand which is assumed to be constant."5
14. However, some pricing policies may, in fact, be inconsistent with thatobjective, as shown in Chapter 8.
15. AMR=AIP(1 + A) (1 + P + Pt
whe 1 s th1 r if a (- = O
where e has the range co c- a <-1.

OPTIMAL PRICING WITH PASSIVE SHIPOWNERS 109
With a constant elasticity of demand, therefore, any given change inthe port price will be magnified by the factor e/(e + 1) and will bereflected in the freight rate. Consider, for example, a constant elas-ticity of minus three; an increase of $0.10 in the port charge per tonwill be reflected in a $0.15 rise in the freight rate if marginal costis constant.
In this special case, any change in port charge is fully, or more thanfully, passed on to the shippers. In particular, the monopolistic ship-ping firm always raises the freight rate by more than the increase inthe port charge and lowers the freight rate by more than the decreasein port charge. But the validity of this conclusion requires that theelasticity of demand for shipping be constant. If it is variable anddeclines in absolute value as quantity increases, then the monopolist'sresponse to variations in his marginal cost will be to pass on less thanthe full change in port charges. The linear demand curve provides anexample. Its elasticity declines as quantity increases, and its slope isnumerically equal to one-half of the slope of the marginal revenuecurve. In this case"6:
_ _ _ _ ~~~~~~Ch a11ge in margiZ otF Increasu in 1 In 1ncrease a rn(59 ) freight rate I = port charge q-/antity supplied
In Figure 5.4, marginal cost is constant with respect to quantity sup-plied so that the freight rate increases bv one-half of the increasein port price. If marginal cost rises as quantity increases, even less ofthe rise in port charges will be passed on by the shipping monopoly.
The degree of variability of the elasticity of demand for shippingthus is critical for the leverage of ports on freight rates and thusindirectly on the shipper who pays the freight rates. In economicanalysis and econometric estimation, models embodying constantelasticities of demand frequently are used. Although this is done forconvenience rather than for plausibility, variable elasticity is regardedto be much the more plausible assumption in the economics of ship-ping and ports. The kinked (concave) demand curve which is usedlater to explain the pricing decisions of shipping conferences thus has
16.dX - MR; with AMC as a shift in the marginal cost schedule.2Xd2
d d dCAMC = -- MR + dX dX dX (if C stands for total cost);
Hence, - dX = 2 [AMC-dX dX ].'dX dXW

110 CHAPTER 5. PORT PRICES AND THE NATIONAL INTEREST
FIGURE 5.4. LINEAR DEMAND CURVES: THE PROFIT-MAXIMIZINGMONOPOLIST ABSORBS PART OF THE COST CHANGE
Cost and Price ($)
Pe
{ -LMC ,~~~~~~~CAMC
MCI
MR D Throughput (X)
Note: Increase in marginal cost = AMC; slope of linear demand curve Dx2½ (slope of MR curve); increase in price = (P2 - P1) = V-AMC.
elasticity declining with quantity of cargo shipped and forms a limit-ing case where cost changes over a certain range are wholly absorbedby the supplier.
Nevertheless, the initial assumption of constant elasticity of de-mand is held here for a while. This is done not only because of thegreat convenience of eliminating one variation from the analysis, butalso because some of those results that are especially interesting arenot discredited in any essential way by the assumption.17
17. The relative harmlessness of the implausible assumption is confirmed bythe similarity of the main results under either assumption in the algebraic Ap-pendix B to the chapter.

OPTIMAL PRICING WITH PASSIVE SHIPOWNERS 17.1
FIGuRE 5.5. INTERACTION OF PORT PRICE AND FREIGHT:
THE CASE OF CONSTANT ELASTICITY OF DENIAND FOR SHIPPING
p
NW NEDemand for shipping
45°
Demand for shipping
\ | \ X I MC of ships
-- t ,>s-- (=port charges)p°, I I "-MR for shipping
l___________________ \ ' X ThroughputMR of port \ I
Demand for port .
MC of Port 45°
Demand for port services
SW SE
Note: P = freight rate; P, = port price; e = absolute value of the elasticity ofdemand. The assumptions in this figure are: constant elasticity of demand forfreight; zero marginal cost of ship operation; constant marginal cost of port; pas-sive reaction of monopolist shipowners to port pricing policies and profit-maxi-mizing policy of port.

112 CHAPTER 5. PORT PRICES AND THE NATIONAL INTEREST
The consistency of port and freight charges, under the assumptionof constant elasticity of demand for shipping, may be examined inFigure 5.5. The SW segment shows the demand for the services of theport. Marginal cost is constant in both shipping and port operations,and in shipping it is taken to be zero. The demand curve for shippingis assumed to have a constant elasticity of absolute value greater thanunity. Beginning in the SW quadrant, the profit-maximizing portoutput and price at p,0 can be established. This is reflected throughthe NW quadrant first, at the ratio of unity to give the marginal costof shipping (equals port charge) and, second, at the ratio */(e* -1),where e is now defined as the absolute value of the demand elas-ticity, to find the consistent freight rate pO.18 Any variation in the portprice will be reflected through the transformations in the NWquadrant into the freight rate.
The Incidence of Port Chargeson Traders and Consumers
If the port reduces the price of its services below the value thatmaximizes the port profit, the consequences on the freight rate canbe traced easily. If elasticity of demand for shipping is constant:
(6) Fall in freight rate = [ea* (e* - 1)] [fall in port price].
Now the value of the fall in the freight rate to traders and consumerscan be measured by the maximum amount they are willing to payfor the rate reduction, which is (Quantity of freight) X (Fall infreight rate). For the traders, this is shown as the positively hatchedarea in Figure 5.6(a), that is to say, ApOX0. Since Ap0 is negative,the gain to traders is minus this value.
Now this gain is compared with the loss to the port. This is shownby the vertically hatched area in Figure 5.6 (b) and is simply the differ-ence between the marginal cost and the marginal revenue for anincrease of throughput generated by the reduction in the port price(and so the consequential reduction in freight rates) and the expan-sion of traffic. If the loss to the port is less than the gain to traders,
18. It is easy to incorporate constant nonzero marginal cost of shipping opera-tions; then the transformation line is still a line but does not pass as a raythrough the origin.

THE INCIDENCE OF PORT CHARGES ON TRADERS AND CONSUMIERS 113
FIGURE 5.6. DEMAND FOR SHIPPING AND DEMAND FOR PORT
NE$ (a)
Demand Demand for shipping
AP' _~i \ ,//
2P N
I I ii
o X. xi Throughput (X)
$ SW(b)
Demand for port
Demand
ApO'
MCI______ ________LX_____…{'11 ~--- MR
X. X' Throughput (X)

114 CHAPTER 5. PORT PRICES AND THE NATIONAL INTEREST
then the port should cut its tariffs and induce the expansion ofservices. Clearly it is possible that, if the port price has sufficientleverage on the freight rate, it may be best for the port not merelyto run at a loss, but also to charge prices for port services which arebelow the marginal cost of the ports. This possibility is illustrated inthe circumstances of XI in Figure 5.6(a) and (b). If the negativelyhatched area in (a) still exceeds the horizontally hatched area in(b), then it is nationally advantageous for the port to price itsservices below marginal cost.
In the case of constant elasticity much hinges on the multiplierE*/ (* - 1) which gives the port price its clout. The lower the abso-lute value of the elasticity of demand, the greater the multiplicativeeffect of a given change in the port tariff on the freight rate. This is,of course, a traditional result."9
Perfect Competition in Shipping
The case of perfect competition can be analyzed in this framework.Then the change in the port price is reflected in a one-for-one trans-form to the freight rate. In Figure 5.5 the reflection is effected throughthe 450 line in the NW quadrant. In the shipping business thefreight rate is equal to marginal cost including the price of the servicesof the port. Clearly the port would best charge the marginal cost forits services since it is tantamount to selling them directly to tradersand consumers. The reduced profits that the port suffers from ex-panding its services from the maximum-profit to the marginal-costequals-price-output is more than offset by the value of the reductionin freight rates to traders and consumers.20 But this rule only holds ifthe elasticity of demand for shipping is constant. If the elasticitydeclines absolutely as the quantity shipped increases, then the na-tionally optimal port charge will exceed marginal port cost; the de-
19. The limiting case of e approaching infinity is not the case of perfect com-petition in shipping, however, since e refers to the market elasticity of demand.The case of e -> co is when the price of shipping is essentially fixed irrespectiveof the domestic demand conditions, and so the quantity of services is determinedentirely by the (rising) marginal cost curve.
20. This is presuming that the price of factors of production measures theiropportunity cost in alternative employments.

SHIPPING MON£OPOLY 115
clining elasticity of demand for shipping now acts much like a lowelasticity of demand for port services and raises the optimal port priceabove marginal cost.2 ' This is the analogue to the classical optimumtariff of intemational trade theory.
Shipping Monopoly
The case of the steamship monopoly is not simplified so easily,even with constant elasticity of demand. But it is of central impor-tance to the policy of ports in many developing countries. Thereforethe results obtained by rather technical treatment are reported inAppendix B adding some numerical examples below.`2 No specialassumption is made about the elasticity of demand for shippingalthough normally demand curves are considered that exhibit decreas-ing (absolute) elasticity as the quantity shipped rises.23
Marginal profit and profit-maximizing charge of a port
For simplicity assume that the marginal cost of ship operations isconstant. Then the increased profit from the expansion of the port'soutput by 1 ton is:
(7) psR - C.' - Cp' + p8R.
where p8 is the freight rate per ton; R is the ratio of the ship's mar-ginal revenue (MR) to the freight rate, or 1 + (1/i) where e standsfor the elasticity of demand for shipping and is less than zero; C,' isthe marginal cost (MC) of ship operations (excluding port charges);C,' is the marginal cost of port operation; and t is a term whichdepends on the rate at which R declines as the quantity of shippingoutput increases, so that it will, for example, be the larger the faster
21. Appendix B, "Equalizing the Marginal Gain of Traders with the MarginalLoss of the Port."
22. Appendix B, "Maximizing the Benefits to Nationals," which contains theproofs of the propositions and some further analytical development, all unfortu-nately requiring some mathematical formulations.
23. If the elasticity of demand varies in this way, the absolute leverage of theport on the freight rates is lower than when elasticity is constant; less than thefull change in the cost of shipping caused by a change in port charges is passedon to the traders.

i1 6 CHAPTER 5. PORT PRICES AND THE NATIONAL INTEREST
R declines with increasing shipping output. If the elasticity of demande is constant, w vanishes.24
For slightly easier interpretation the above equation may be re-written as the port's marginal profit equal to:
(8) [p.R (R + -)-C.']-C,'
or: [MRup (R + s) - MCshP, vaius added] - MC,GTt,
the whole being interpretable as the difference between the port'smarginal revenue and its marginal cost, marginal revenue (in brackets)being the difference between a multiple of ship's marginal revenueand ship's marginal cost.
Consider now a port which acts as a profit maximizer in its dealingswith a shipping industry (or conference or owner) which is mo-nopolized and yet reacts passively to the port's policy. In these cir-cumstances the port will seek to set the profit-maximizing chargeequal to:
(9) [Cp' + (IR-1) C,' +p
The first two terms are a sort of weighted sum of the marginal costs.The third term adds to the port's optimal price according to the rateat which elasticity declines with rising shipping tonnage; for example,the more rapidly elasticity drops off, the more the port will profitfrom higher charges.
The nationally optimal port charge
The gain to traders from the reduced freight rate associated withexpanded output by 1 ton is:
(10) -XAP,= -PaAX*t X p
or: - (p8AX)/e.which, since e < 0, is positive. The object of a nationally optimalpricing policy will now be to fix the level of port charges so that asliglht reduction will cause a gain to the traders which just offsets the
24. In this summary of the argument presented in Appendix B, the elasticityis defined as negative.

SHIPPING MONOPOLY 117
loss caused to port profit. This nationally optimal price (pp ) turnsout to be25:
(11) R 1 [e, (P,, +t)J Cp' + p,,Raz
The nearer R is to 1 (that is to say, the greater the elasticityof demand for shipping), the closer the approximation to marginalcost pricing; except that with variable elasticity of demand (forexample, elasticity decreasing as quantity rises) the optimal price willalways lie above marginal cost:
(12) PP' = (C' + p.C) for R _ 1.
Next, the port's profit-maximizing price is compared with the na-tionally optimal price:
'13) F Profit-maximnizing _ [Nationally optimal1L Port charge J L port charge J
1 p8 -P8, P.=R c -R v
where e is less than zero. This can be interpreted as follows: whenthe port has set the nationally optimal price, this nationally optimalprice equals
-[Port's profit] F Degree of 1 F Marginal gain 1(14) maximizing _ monopoly X to nationals from
price in shipping reduction in freight rateJ
The use of the term degree of monopoly is not wholly accurate. Itsstandard meaning is the ratio of price to marginal cost, but here it isapplied to the ratio of price to marginal revenue; but it still servesas an index of monopoly.28 The implication is clear: the higher thisdegree of monopoly in shipping, the lower the nationally optimalprice relative to the port's profit-maximizing price.
The optimal charge and marginal port cost
If shipping is monopolistic, the port's profit-maximizing charge willalways exceed the nationally optimal charge. For example, if the elas-ticity of demand for shipping, e = -2 (so that R = 1/2) and if
25. Equation 8 in Appendix B, after transformation.26. The ratio of price to marginal revenue should be described as gross degree
of monopoly.

118 CHAPTER 5. PORT PRICES AND THE NATIONAL INTEREST
the factor representing the variability of the elasticity of demand,w = -. 25, the port's profit-maximizing charge can be calculated asbeing equal to2 7 :
(15) 4 Cp' + C'
but the nationally optimal port charge equals:
(16) 4/5 C9' -1/5 C'.
Maximizing the gain of nationals thus requires a sharp cut in theport's profit-maximizing price. Moreover, in this case the resultingoptimal charge fails to cover the marginal cost of port operationseven if that is zero. Port operations will therefore require subsidizing.In Appendix B further numerical examples where the optimal portcharge falls short of marginal cost are presented, including caseswhere optimal pricing demands a subsidy that is greater than theport's marginal cost itself.
There may be strong strategic reasons against allowing such in-direct subsidies to monopolistic shipowners, but the proposition byitself is in no sense eccentric. The standard prescription for nationalpolicy toward monopolies that cannot be broken up is that theyshould be subsidized through reductions in their input prices. Theobject is to overcome the monopolistic restriction of output or theprice-raising effect of the operation of monopolies. The required sizeof such an input subsidy is not related to the cost of producing theinput (for example, the marginal cost of port operations per ton ofthroughput) but rather to the strength and responses of the mo-nopoly. This matter is pursued in Appendix B. Here it is only addedthat input subsidies to monopolies are normally combined with atleast the proposal of a lump-sum tax or at least a tax that is inde-pendent of the level of output. This suggests that what is really neededis a form of charging for the services of the port similar to two-parttariffs. This subject is discussed in Chapter 8.
National and Foreign Shipping Lines
So far in this chapter, the argument has been pursued on theassumption that the shipping services are all rendered by firms whichare owned by foreigners. In practice, however, many developing coun-
27. Assume that the marginal cost of shipping operations is constant. For thefull equations on which these calculations are based, see Appendix B.

RELEVANCE OF THE MODEL 119
tries have their own shipping industry, and these national companiesmust be counted as part of the national interest just as much astraders or ports.
The national shipping companies will use domestic resources, suchas labor and capital, that will have an opportunity cost elsewhere inthe economy. And if successful, such companies will eam a surplusover and above the prices that they pay for their inputs and that areassumed to be approximately equal to their opportunitv cost. Thissurplus is the value of the national merchant marine to the country.
In calculating the effects of variations in port prices, the effects onthe surpluses of national shipping companies have been ignored. It isclear, however, that if a reduction in port charge causes an increasein the surplus of the national shipping enterprise, then this ought tobe included with the gain of domestic traders.
In many countries, these economic surpluses are negative, repre-senting a misallocation of domestic resources. However, it is stillpossible for a reduction in port tariff to reduce the loss. While thisshould be counted as part of the benefit, the policy is very muchsecond best. Rather than pursue any more detailed analyses of thisissue, the all-foreign-shipping case is used to investigate the relevanceof the model.
Relevance of the Model
As shown in Appendix B, the optimum price for the port may beexpressed by the rather fearsome formula:
(17)
P1" = [1/(1 (+ R2 - R + Rw)I [(2R - _ 1- Rw)Ca' + RCp']
where 1 + R2 - R + R<o 5# 0. And in the Appendix, values for theport price for various combinations of the parameters are shown.
This formula needs to be used with considerable caution. It shouldbe regarded as a general guide which should be borne in mind whensetting tariffs, and it should not be used mechanically nor appliedwithout considerable reflection. Clearly this formula has been de-rived without considering a large number of constraints and limita-tions that must apply in the real world.28 If these constraints were
28. For example, there is an asymptote when the denominator is zero andwhen the optimum price swings wildly from plus infinity to minus infinity! Thereasons for such results are discussed in Appendix B.

120 CHAPTER 5. PORT PRICES AND THE NATIONAL INTEREST
included formally, then what is already rather complex would becomehopelessly complicated.
There is, however, another approach. The general recommendationis one of marginal cost pricing, and marginal cost is still the basis evenwhen the reaction effects are taken into account as in the formulaabove. But only relatively small deviations from marginal cost shouldbe considered as feasible. The formula may, with discretion, be usedto show the direction of the deviation, and this should be borne inmind in fixing the tariff schedules.
It is important to realize that the pricing policies of ports cannotcorrect many of the significant distortions in competition in the ship-ping industry. The amount of leverage is small. However, one of thecommon (European) propositions-the subsidization of ports-is soimportant that it deserves a critical review of the basis of the argu-ment.
The assumptions behind the case for subsidy cannot be claimedto be characteristic of many port and shipping conditions. First, theexclusion of strategic and tactical behavior on the part of the port andmonopolist conference is a serious omission since some such behavioris apparent in the real world. Second, it has been assumed that thereare no possibilities of substitution of different amounts of port servicewith a given amount of ocean freight carriage. Obviously there areconsiderable possibilities here, and the assumption of fixed propor-tions is too stringent. Lastly, increasing marginal cost of shippingoperations is likely as the port becomes congested, and the assump-tion that C" equals zero is clearly invalid; in fact C" is greater thanzero and may be very large indeed in a highly congested port.
All these reasons suggest that any case for pricing below marginalcost must be modified considerably. For example, it clearly would bewrong to subsidize steamship owners to cover their congestion cost.Nevertheless for throughputs which are considerably below the ca-pacity of the port, the case for a low variable charge and a high fixedlevy seems to be good.
A general caveat therefore must be attached to these conclusions,and particularly to the case for subsidies that may arise. This caveatis that none of the conditions under which these conclusions wouldhold can be presumed to be general; their existence has to be provedin each case. Nor must it be thought that these possible cases forsubsidy have anything in common with the standard cases on whichclaims for subsidies tend to be based in practice. In particular, theview that increased charges would harm nationals is as likely as not

APPENDIX A. A MODEL OF THE PROFIT-MAXIMIZING PORT 121
to be based on an erroneous understanding of the incidence of portcharges.
Appendix A. A Model of the Profit-maximizing Port
The basic equations of the model which was described informally in"Port Profit Maximization Compared with Marginal Cost Pricing."(above) and in Figure 5.1 are now set out. The first equation describesthe amount of output originating m (100 meters) from the port. Thisis shown as a linear function of the price levied by the port plus theintemal transport cost. Thus:
x(m) = A -yp(m)where
p(m) = p(O) + tm,
2x(m) is the quantity offered for export at a distance m (100 meters)down the road, p(m) is the price of transport along the road plusthe port charge p(O), and t is the transport cost, constant per tonper 100 meters, along the road. For simplicity, suppose that there areno variable factor inputs into production other than those of trans-port.
C(X) is the port cost function, where X is the total traffic shippedthrough the port:
X = f 2x(m) dm.
Thus the profit of the port authority is given by:
-, = p(0)*X-C(X)
and the marginal profit is
d7r = dp(0) X + p(O) _ C'
where C' is marginal cost.
Owing to the choice of units for t and x(m), the total output X canbe represented as the product of the distance R and value of x(0).2 9
29. The assumptions imply that the transport costs of a ton on the east -e westtrails is $1 per ton per 100 meters. Thus, t will generally be less than unity.For the Ellet model, the extent of cultivation is determined by this absolutetransport cost, but for the purpose of calculating the elasticities and the effectsof different price policies, only the ratio of the two transport costs is relevant.

122 CHAPTER 5. PORT PRICES AND THE NATIONAL INTEREST
(That is the base of the triangle QP multiplied by the height PR, seeFigure 5.1.) Solving forx(0):
x(O) =/3-yp(0).
At R it is clear that:
x(R) = 0,
and so:
x(R) = O= -yp(R)
= -- y[P(0) +Rt].
Thus:
R = -/P(0)
Total output is therefore:
X = [f-yp(0)]2*
Then:
dX = 2 [ _ yp(0)1.dp- (0) t[-P()J
From the first-order condition for profit maximization:
d7r= I =- [PP()]±P(°) -C'=O
-2 k+ (p(O)/2 + p(O) -C'= 0.
So that:
,b(O) 2 3C + 1,8
This can be expressed altematively in terms of R.
Since:
p(R) = p(0) +Rt
and:
p(R) = 1/y,

APPENDIX A. A MODEL OF THE PROFIT-MAXIMIZING PORT 123
p(O) 2 C2 +1p(R)
p(0) R= C + Rt
which gives the markup of price above marginal cost.80
If the two price rules are substituted into the output formula,profit maximization reduces output of the exported good to four-iiinths of the level that would be achieved under marginal cost pricingconditions (Figure 5.2).
The ratio of the total revenues is given by the more complicatedequation:
Maximurn7r revenue 4 [2y/C + ,sl0MC revenue =27 C J
and the profit-maximizing revenue will exceed marginal cost pricingr evenue if y and C' are sufficiently small relative to 8 so that ,8 > 19/4yC'. Thus, if marginal cost is very low and if the triangle is not veryelongated (that is to say, if R is small relative to the width), thenit is very likely that the profit-maximizing revenue will be muchgreater than the marginal cost revenue. In the limiting case of near-zero marginal cost and capacity in excess of (4/9) 1 8(ty)-1 the portwill charge a price 8/(3/y) to maximize gross and net revenue at(4/27) [/32/ (y2t) I which will be available for the fixed cost of the port.
The elasticity of demand for the port's services with respect to itsown price p(0) can be put in various forms. All, however, involveeither the value of x(0) or the value of p(0). With the linear sys-item the elasticities are not independent of the absolute values; thesmaller the output the larger the (absolute value of the) elasticityof demand.'Ihus:
elasticity = p(0) dXX dp (0)
=- 2yp(0)/[P - yp(O)]
30. To avoid error in applying this formula, however, note that R is a func-tion of p(O) and of course a function of marginal cost since Rt = (2/3t)(-C' + P/-y), and so the expansion of the distance of cultivation along theroad is given by dR/dC' which is -2/3t.

124 CHAPTER 5. PORT PRICES AND THE NATIONAL INTEREST
or
=2 2-( ° < x(O) <p.
Appendix B. Maximizing the Benefits to Nationals
Let p, = the price per unit of the port service; p8 = the freightrate; Cp, the cost of port service, and hence, Cp' = the marginalcost of the port service; C8 = the cost of shipping (excluding portcharge), and hence, C,' = the marginal cost of shipping (excludingport charge), and so forth for higher derivatives, Ce" etc.; X = ton-nage of ship cargo = port throughput; e = elasticity of demand forshipping; R = (I + (1/,E) ), the ratio of marginal revenue in shippingto the freight rate. Other symbols will be introduced and explainedas the need arises.
Monopolist shipowners
The price which the monopolistic shipping conference would beprepared to pay for the port's service is the difference between theirmarginal revenue (MR,) and marginal cost. Thus, with fixed pro-portions:
(1) pp = MR.-C' = p.R-C.'.
The profits of the port (7r) are then:
= Xpp - port cost for X = Xp, - C.
From this the marginal profit of port throughput is:
d_ d(Xpp) ,dX = dX-C
= d[X(p 8 R - C 8 ')] -C
= d (psR-C 8 .) + (p.R-CC.) -Cp'
= pa[ X d] + XR dpX - XC + (p.R -C.,) - C,'.
X(dR/dX) can be written as RX where w is the elasticity of R withrespect to changes in ship or port throughput X. If the elasticity of

APPENDIX B. MAXIMIZING THE BENEFITS TO NATIONALS 125
demand for shipping (e) is constant, dR/dX = 0, and hence also0-O. If the elasticity of demand for shipping decreases in absolute
value as X increases, dR/dX and w will both be negative; but both willbe positive if the absolute value of the elasticity of demand for ship-ping increases as X increases.Y1 Thus the last expression for marginalport profit can be rewritten:
(2) d p,Rw + XR dp -XC 8" + pR -C,' - Cp'.
Next:
XRdX = X [1 + I ] d =p8 [ + 1].XdX Xl±dX[1
Therefore:
d7XdX p,RwD + e [1 + E]CN X + P.8 [I1 + Cs ]C -CUXt
= p,R& + ph [I + e32 - -Cp
or
(3) dX = pcR"- + pR2-C8 X-Cs' - Cp'.
Finally, since p, = p8R -C,:
(4) dX- = p,Rw + ppR + C'R + C8 '"X - C8 - Cp'.
The profit-maximizing port will fix its price so that d7r/dX 0 O. Afterintroducing this marginal condition into Equation (4), the maximumprofit price is:
(5) PP = R [C8' + C8s'X + Cp,' - C'R - p.R]
- [C,' + C81(1 - R) + C8"X - p,Ru].
31. With certain special forms of demand function there is a unique functionalrelation between R and et. One example is the linear demand curve. For most otherdemand curves, however, there is no simple functional relation between R and e>.

126 CHAPTER 5. PORT PRICES AND THE NATIONAL INTEREST
This general equation can now be applied to a number of specialcases.
The simplification of constant marginal cost of ship operations(C8"= 0) merely removes one term from Equation (5). As R -e 1,p- > (C,' - P.)
THE CASE WHEN e IS CONSTANT. In this case, e = 0, and a furtherterm is removed from Equation (5). The port's profit-maximizingprice is now:
(6.1) P=1[C + (1-R)C 8 '] 0 < R - 1.
Hence, as R - 1, p, -) C,'. As R decreases there is a double kickto the price of the port since it marks up on its own (port) marginalcost by 1/R and adds on the steamship owner's marginal costs markedupby (1 -R)/R= -1/(1+).
THE CASE WHEN lEt IS NOT CONSTANT AND DECREASES AS X INCREASES.
This is the most plausible situation. It embraces the cases of lineardemand curves for shipping and of demand curves which are kinkedconcave to the origin.
In this case dR/dX is negative and so, therefore, is (. The profit-maximizing price of port services now becomes (from Equation 5):
(6.2) PP = [Cp' + Cs'(1 - R) - p.R.].
The last term in the brackets is negative, and it is thus an additionto p, whenever the elasticity of demand for shipping is not constantbut decreases (absolutely) as quantity shipped rises. This additionwill be the greater the more rapidly the elasticity of demand declinesand the higher is the shipping freight rate.
As R -> 1, p, -e (Cp' - pw), which means that the port's profit-maximizing price will stay above marginal port cost according to thespeed at which elasticity of demand for shipping declines as through-put rises.
THE CASE WIIEN lel IS NOT CONSTANT BUT INCREASES AS X INCREASES
(w>0). This will give a modifying influence to the markup of theport price above cost since the port will be encouraged to charge lowerprices to exploit the much larger quantity generated at high through-put volumes.

APPENDIX B. MAXIMIZING THE BENEFITS TO NATIONALS 127
Competitive steamship owners
This can be derived easily from the monopolistic case (Equation 2)lby writing R = 1. Thus:
d; = X dp- C"X + P, - C' _ '
Tx [ dX + P8O
= - , P8 + -]C- , - CX - C'] + Pew
(7) = [pR - C8' -Cs"X - Cp'] + p8-I
Consider first the terms in square brackets. The first term is themarket marginal revenue curve of the freight market. The last termis the marginal cost of the port services. The middle two terms ofEquation (7) (Cs' - C,"X) describe the marginal change in totalfreight cost as output is increased; that is:
c, ,, CX C, I dC,' X c 8 '-c8 "x=c 8 '[-I dX XC]'
=C., [I_ (IC dX )-1]
which looks like the familiar marginal revenue elasticity formula.If the marginal cost is plotted (Figure 5.7), the shaded area can be
deducted from the value of C,'.Now pp = p -C.' for a competitive shipping industry, so Ps = PP+ C0'. Substituting into Equation 7:
-dIX- [(pp + C,1)R - Cs' - C8"X - C'] + pst)
If the port was a profit maximizer:
pP = R [Cp' + (1 - R) C,' + C8"X -px- ].
Or if C" is assumed to be zero (constant marginal cost of shipping):
pp =_[Cp' + (I 1-R) C.' -p8
and if the elasticity of demand for shipping is assumed to be con-stant (, = 0), then this is the same as Equation (6.1) above: theprofit maximizing port charges the same price whether it is confronted

128 CHAPTER 5. PORT PRICES AND IHE NATIONAL INTEREST
FIGURE 5.7. INCREASING MARGINAL SHIPPING COSTAND INCREMENTAL Loss
S
C',
C + AczW~Ic.^+c.~~~~~~~~ I 7
X. X+AX Throughput
b,y competitive shipowners or by monopolists. For example, if R = V2
(elasticity of minus 2), then the profit-maximizing port price isgiven by:
,, = 2Cv' + C,'.
But the output is lower in the monopolist case than under competi-tive conditions. Consequently, the port profit (wvhen maximized)under circumstances wbere there is a monopolistic steamship industrywill be less than if there is compctition.
However, if the elasticity of demand for shipping is variable andif its absolute value declines as output increases ((O < O), then withO < R < 1, the profit-maximizing port will charge a higher price tocompetitive sbips than to monopolists. With competitive steamshipsthe addition to the port's profit-maximizing price is pe,)/R against

APPENDIX B. MAXIMIZING THE BENEFITS TO NATIONALS 129
only P,&i when steamships are monopolized (Equation (6.2)). Forexample, with w = -1 and R = 1/2, pp for competitive shipownersequals 2Cp' + C.' +2 ps, but p, for monopolistic shipowners equals2Cp' + CS' + p,. Consequently, the port's revenue need not be lessunder circumstances of a shipping monopoly.
The gains to national owners of cargo
The gain to cargo owners of reduced freight rates is measured bythe quantity of cargo multiplied by the (small) reduction in thecharge per ton of cargo; that is to say, -XAp8 . This is the com-pensating variation of income associated with the price change Aps.
This can be expressed in terms of AX by the transposition
- X Ap. * AX. Taking the limit as AX becomes very small,AX.
(8) -XAP8 . AX - Xdp8 * dX _ PS dXAX ~dX
defining e < 0.
This implies that the price (or freight rate) divided by the elasticityof demand will measure the marginal gain (loss) to nationals otherthan the port authority of a reduction (increase) in the freight rateassociated with a small change in throughput.
Equalizing the marginal gain of traderswith the marginal loss of the port
The optimum policy for a country as a whole is to pursue a policyof port pricing that will maximize total benefits to nationals. (Thedistribution of these benefits and costs between nationals and do-mestic authorities is ignored). This will occur when the mnarginalprofit (loss) of the port is just equal to the marginal loss (gain) ofthe domestic traders.
THE COMPETITIVE CASE. The marginal profit is:
dX = p,R - C8 ' - C.' + p,o, (from Equation 7 above)
assuming that C" = 0. Thus the best policy would ensure that:
p.R - C8' - C,' + p P

130 CHAPTER 5. PORT PRICES AND THE NATIONAL INTEREST
or that
PR(l + )-C 8' - Cp' = 0.
Competition in the shipping industry assures that p= p, - C8 '.Substituting this into the optimum policy relation:
(pI + CII') (1 + -) -C., - Cp' = O
from which the port's profit maximizing price is:
PP-[1 + ] [Cr'- Cs'].
With constant elasticity of demand curves ( 0 = 0) it is then bestfor the port to charge marginal cost: pp = C'. This result can berationalized by the normal arguments. If the port charges above mar-ginal cost, this will be reflected identically in the freight rates chargedby the competitive firms in shipping, and so the traders will have topay.
But if the elasticity of demand is variable and if it decreases arith-metically as output increases (so that X < 0), the optimum policyrule becomes more complicated. Moreover, it cannot be defined ex-cept for the range 0 > w > -1. For values within that range the portwill always charge a price above marginal cost. For example, with
=o =-Y2, p, = 2Cp' + C,'. Over the specified range, therefore, adeclining elasticity of demand acts like a low elasticity of demandin that it lifts price above marginal cost.
TmE MONOPOLISTIC CASE. Assume, as before, that the marginal costof shipping is constant; hence C8" = 0.
The marginal condition for maximum national benefit is then ob-tained by setting the port's marginal profit (Equation (4)) equal tothe marginal gain of traders:
- = pR ± + ppR + C.R- C'-Cp' = PS .d-XC
From this the nationally optimal port price is derived:
(9) pen =- P. + CSZ( - R) + C,' - R.o
where Ie 1and 0 < R -• 1.
First, note that as R -* 1, p,p -- (C,' - pso). In this special casethere is thus no difference between the port's profit-maximizing price

APPENDIX B. MAXIMIZING THE BENEFITS TO NATIONALS 131
and the nationally optimal price (see, for instance, "The case where|eJ is not constant and decreases as X increases," above). If the de-mand curve for shipping has constant elasticity, the optimal price ineither sense will be equal to marginal cost.
In all other circumstances, however, the port's unconstrained mo-nopoly price will exceed the nationally optimal price. (The possi-bility of a positive elasticity of demand is excluded as being anoddity.) This can be verified by subtracting Equation (9) from Equa-tion (6.2) to get:
(10) 1 [P e ] s P[ M
where MR8 is the marginal revenue of the shipowners. An interpreta-tion of this difference is suggested in Equation (13) of the main textof this chapter.
Last, the relation between the nationally optimal price and themarginal cost of the port must be examined. For this purpose Equa-
tion (3) is rearranged and a substitution is made for p,. Thus analtemative formulation of the nationally optimal port price isobtained:
p 1pn = R [(2R -R 2 - 1 - R.) Ca' + RC,'],I +R- - R+R.
where 1 + R2_ R + R, =A 0.2
A solution for the optimal port price, p.;, for given (v and e isshown in the following table:
-1.5 -2.0 -10.0w R = 1/3 R = 1/2 R = 9/10
-0.5 0.9 C,' - 0.7 C.' CP' 2 C' + 0.1 C.'-1.0 l.4C,'-0.5C,' 2C;' -Cs' 90C 8 '+89 C,'-2.0 negative negative negative
0 0.6 Cp''- 0.8 C,' 0.66 C,' + 0.33 C,' C' + 0.01 C.'+1.0 0.3 C8' - 0.7 C.' 0.4 C,'+ 0.6 C,' 0.5 C,' - 0.5 C.'
32. For purposes of comparison (see main text of Chapter 5), Equation 6.2can be rearranged for the profit-maximizing port charge:
1 [(I R) C,'+ C,'] (R >

132 CHAPTER 5. PORT PRICES AND THE NATIONAL INTEREST
The formula given above must be used with considerable caution.It has been derived by considering the equality of marginal gain andmarginal cost. But to ensure that the net benefit to the domestic resi-dents is maximized, marginal cost must increase (or diminish lessrapidly than additional benefits), and marginal gain must decrease (ordecrease more rapidly than marginal cost). These are the second-orderconditions for an equilibrium. In tlhis Appendix it was not thought tobe appropriate to explore formally the second-order conditions in thismodel; nor have the questions of existence and multiple equilibriumbeen pursued. In part, this reluctance is explained by the tedious andcomplex character of the exercise. But the main reason is that herethe interest is in applications, and in applying this model to reality,it is likely to be quite obvious whether or not the equilibrium will bea maximum or a minimum.
The formula has an asymptote when 1 + R2 - R + R(o = 0, andso, in the region of this equality, the optimum port price swingswildly from plus infinity to minus infinity. Such a result is, of course,absurd, yet it is by no means uncommon in calculations of this type.83
The question remains how to interpret or perhaps to interpret awaysuch absurdities.
These odd results arise primarily because port pricing is beingasked to do more than it can deliver. The cost and competitive con-ditions of the shipping industry, port, and traders may be so out ofjoint that no conceivable juggling with port prices will correct them.34
For example, it is clear that the above formula may produce a nega-tive port price-shippers are paid to use the port. But on any commonsense grounds, this is simply not feasible. And even if it were feasible,it is certain that other methods could be found which would solvebetter the problems of the cost and competitive condition of theeconomy.
33. For example, the reader will find that asymptotes of this kind appear inthe formal statements of the UNIDO Guidelines (United Nations, IndustrialDevelopment Organization, Guidelines for Project Evaluation (New York, 1972)).Thus the shadow price of investment can be plus infinity or minus infinity ac-cording to the sign of the difference between the marginal rate of social timepreference, and the product of the marginal saving rate and the marginal returnon investment.
34. The analogue of this in the UNIDO Guidelines absurdities is that whenthe shadow price of investment approaches the asymptote, the instruction is toput all resources in investment and ignore the negative branch. But then weshould all be dead very soon.

APPENDIX B. MAXIMIZING THE BENEFITS TO NATIONALS 133
The range of applicability of the formula should be restricted tovalues which are neither massive multiples nor tiny fractions of themarginal cost of the port. In practice, it would be used to indicatethe appropriate direction of deviations of price from marginal cost.If the indicated deviations are small-imagine that they suggest, forexample, that a markup of marginal port cost by one-tenth of themarginal shipping cost (this is the result with R = 0.9 and 0)-then this is worth exploring in practice. But if the formula givesresults which suggest that trivially low prices or very high prices shouldbe charged, it is best to look elsewhere for instruments to correct thewrongs of the economy. And then port price should be fixed alongthe general line of marginal cost using the two-part tariff techniqueto ensure that cost is covered.

Chapter 6
Strategic Pricing
IN THE PRECEDING CHAPTER the use of port charge as an instrument tomaximize the national gain from shipping was discussed. Much of theinvestigation was concerned with pricing port services to shippingmonopolies. This attention to noncompetitive shipping is warrantedby the large share of liner conferences in the trades of developingcountries; some statistical evidence on this ill-documented subject ispresented in Appendix A to this chapter. But the conclusions whichwere reached in the last chapter were based on two premises. The firstwas that the port authorities have to accept the competitive condi-tions in the country's ocean trades as unalterably given. This seemsunduly restrictive; faced with monopolistic shipowners on certainroutes, it is often possible to reduce the monopolist position in thecountry's shipping by a strategic use of pricing. The second premisewas that changes in port charges will be reflected in freight charges;this may be plainly false.
Pricing to Promote Competition
It has been argued that shipping conferences would not transmitcost-saving price reductions or improvements in port services throughthe conference rate to that port because the conference tends toequalize freight rates for a number of ports in the same general area.For example, the same nominal freight rate is charged across the
134

PRICING TO PROMOTE COMPETITION 135
Pacific for all the ports on the west coast of North America, and, asanother example, Calcutta and Chittagong have the same rates forshipments from Europe. What then is the advantage to any port orits national users of improving its services since it is unlikely to secureany net benefits or competitive advantage over other ports in theregion?
In fact the conference has many ways of responding to eitherchanges in port charges or in the quality of port service. The obviousway is for the conference to rearrange its sailings so that the moreexpensive port is served less frequently or by less desirable services.Certain variations in the conditions may be imposed also.
More important, however, is the fact that conferences do introducesurreptitious variations in charges which do reflect the cost of portcalls. In the case of Vancouver traffic that is routed through Seattle,the conference absorbs the additional cost of inland transport fromSeattle to Vancouver. Thus conference vessels not only are saved frompaying the higher port charges of Vancouver, but also, and more im-portant, they avoid the cost of the additional ship time of a call atVancouver. Essentially the conference cuts the rate for transit throughSeattle.
The proposition that changes in port charges or services will notbe reflected in freight rates is tnre in one important respect. Themain constraint on conference pricing is the risk of entry of trampsand nonconference competition. This suggests that if the conferencereduced its rates, it would attract little traffic since the overall elas-ticity of demand for ocean carriage is quite low. Thus there is a kinkin the demand curve facing the conference.' This causes a discon-tinuity in the marginal revenue curve. Considerable variations canoccur in the cost conditions of the conferences without any effect onthe freight rate. In Figure 6.1 the demand curve facing the conferenceis given by the highly elastic section above its current freight rate,which is a little less than those of potential competitors, and it isrelatively inelastic for ranges of freight rate below that value. In theregion of XO the marginal revenue curve of the conference falls verti-cally. Thus for a considerable range of marginal costs, the level ofoutput Xo and the associated freight rate PO will continue to be thelbest ones for the conference. However, this argument merely ration-
1. See E. Bennathan and A. A. Walters, The Economics of Ocean Freight'Rates, Praeger Special Studies in International Economics and Development (NewYork: Praeger, 1969).

136 CHAPTER 6. STRATEGIC PRICING
FIGuRE 6.1. KINKED DEMAND CURVE AND CHANGES IN COST
Price
n
D
C,
I D
O i \ MR 1|MR0~~~~~
XM Annual tons of cargo
alizes the observation that changes in port cost do not appear to havea corresponding effect on the rate levied by the conference. It cannotexplain why the conference maintains the same rate to ports wherethe cost of carriage and call differ considerably. i
In principle an attempt may be made to incorporate the similarityof freight rates for different ports into the analysis by using the sametype of reasoning. For example, let demand for transportation fromLondon to two ports, say Vancouver and Seattle (or V and S) bethe same as in Figure 6.1. If the cost of operating to Vancouver ishigher than to Seattle, say C. compared with C,, then, provided thereis not an enormous difference between them, the conference will beinduced to equalize the two rates. This seems to explain the similarityof rates; but here appearances may be deceptive. The demand curveis drawn with respect to a given price charged by the competitors ofthe conference, and in particular the elastic branch of the kinked

PRICING TO PROMOTE COMPETITION 137
demand curve reflects this price. Under competitive conditions anyvariation in port charge will be reflected in the price of the trampsand bulk carriers or in the cost of using such chartered vessels relativeto the liner freight rates. A reduction of port charges which is con-fined to the noncompetitive operators-and this may often just meanthe liners since they tend to be cartelized-may indeed fail to showup in the freight rates. But if the reduced charges are extended alsoto competitive port users, it will cause the demand curve for theconference to move bodily downwards, so in principle, there would bean effect on the rate charged by the conference. In the extreme case,if PO is determined by the costs of competitors, which include theport charge, then a reduction in port charges will be reflected in anequal reduction in the value of P., and the price of the conferenceshould fall correspondingly.
This result only follows if the port improvement or the reductionof port charges applies to all operations from the port at an equalamount per ton. Many port improvements, however, are not of thisform. For example, the change from conventional handling to a con-tainer system will generally affect the port cost and charges only forgeneral cargo carried in containers. The cost of bulk carrier and trampsand indeed of conventional liner operation will remain broadly thesame. Under these conditions a reduction in costs and charges forport facilities (per ton) may well have no effect on the rate chargedby the conference for container traffic or, indeed, for their conven-tionally handled traffic.
T'herefore, if a container terminal is built, but no general improve-ment is made in port services for conventionally handled and bulkcargoes, then the reduced port charges for container traffic are unlikelyto be reflected in the container tariffs. The cost curve will move downthe vertical section of the marginal revenue curve in Figure 6.1, andthe container tariff will be the same as the unchanged conventionaltariff.2 The traffic generally will be the same as it was before since thetariffs will not have changed. It is possible, however, that the reduc-tion in cost is so great that it pays the conference to reduce its freight
2. In practice container operation may considerably improve the quality ofservice, so with unchanged tariffs there may be some implicit reduction in price.T'here are, however, many cases when the conference charges a container sur-charge on general cargo, thus absorbing any benefit generated. With the kinkedform of demand curve and the competitive conditions postulated, this is whatis expected.

138 CHAPTER 6. STRATEGIC PRICING
rate and to expand traffic. Given the normally low elasticity of de-mand for generated traffic, this is not a likely outcome except forcompeting ports.
There are, however, circumstances in which partial improvementsin port facilities will lead to reductions in the rates charged by thebeneficiaries. But the most important of these again depends on thestate of competition or rather on the weakening of the market powerwhich conferences and consortia seek to achieve. If competitiondevelops between or within container consortia, the groups or thebreak-aways will lower their rate more or less in conformity with cost.The averaging of rates over a range of ports will cease by the sametoken.
Another realistic possibility is that the container terminal may bea new addition to the capacity of a port with congestion on its existingquays and sheds. Thus whether the port charges a congestion levy orwhether the conference extracts one, the construction of the con-tainer berths will result in a reduction of the price (or a correspondingimprovement in the quality of service) for conventional handling bynonconference vessels. If congestion falls equally on all vessels,3 itsdisappearance will lower cost and the rate charged in the competitivesector of shipping. The reduced cost and so freight rate of competitivevessels would again modify the container consortium's charges.
Therefore, there are good economic reasons why the particularimprovement of port facilities or the reduction of port chargeswill not necessarily result in any diminution of the freight rate chargedby the conference or consortium. It is only by bringing down thecompetitor's price that the pricing policy of the conference or con-sortium will be affected, and this may be done only through generalport improvements for conventional or bulk carriage which will,paradoxically, have some effect on the conference pricing.
It would be unwise, however, to conclude that the one way inwhich the country can be sure to collect the surplus from its improve-ment in port facilities is to lower port charges (or improve the service)for conventional or bulker vessels. Port charges are still only a smallfraction of the total operating cost, except perhaps for coastal andshort sea-route vessels; they are smaller, indeed, for conventional andbulk vessels than for mainline container vessels. The change in portcharges may constitute a small fraction of the total cost of the con-
3. This is not always the case; see Chapter 5.

DISCRIMINATION AND COUTNTERDISCRIMINATION 139
ference members. Conference tariffs are set by a committee procedure,and considerable cost is incurred in upsetting existing rates that, nodoubt, were the product of long and protracted bargaining sessions.Conference rates tend to be sticky unless the conference happens tobe fighting a vigorous attack by some outside vessels. The conferencemay absorb such cost reductions and even may suffer some small lossof traffic to its competitors to preserve the hard-won internal balance.
Discrimination and Counterdiscrimination
The most prominent feature of monopoly pricing in shipping isprice discrimination, mainly by origin-destination and by the valueof commodities. Discrimination is defined as differences in price,freight rate, or, for that matter, in port charge which cannot be at-tributed to differences in cost.4 It is thus an emanation of monopoly,and the price strategy of the national port has to contend with it.T'herefore, the possibilities have to be explored of countering dis-crimination directly by counterdiscrimination or indirectly by methodsdesigned to weaken the price-discriminating power of the shippingcartel.
Discrimination by origin and by destination
Discrimination depends upon the ability of the seller to split hismarket into segments and to prevent resale from one customer to an-other. In liner conference tariffs, the same rates apply usually to awide variety of ports. In the Far East Freight Conference, the samerates extend from the Arabian Gulf ports to the ports of NorthernEurope, and there are nominally the same rates from Japan to Van-couver or Seattle. The conference finds it practicable to segment itsmarket; for example, it is impossible for anyone to consign a shipmentto the gulf ports from Singapore and then to send a shipment free ofcharge from the Gulf to Northem Europe on the argument that theship space from Singapore to Bergen has been bought already. Theconference would not allow such practices.
4. This differs from the common man's concept of discrimination where theidea applies to prices for services of a similar appearance whether or not thoseservices cost the same to provide.

140 CHAPTER 6. STRATEGIC PRICING
Discrimination can be practiced by the conference charging thesame rate to destinations with widely different costs. The similaritiesof rates can be explained in part, and perhaps in large part, by theexistence of altemative competitors to the carriage by the conference.For example, competition to the Gulf ports for general cargo is vir-tually nonexistent, whereas the European ports have large generalcargo movements at competitive rates. Conferences can thereforerecoup by large markups on Gulf traffic.
It would be quite fortuitous if the equalization practices of theconferences reflected exactly the appropriate discrimination accordingto their cost conditions, to the competition on that route, and to theelasticity of supply of traffic. There is, no doubt, a considerable pres-sure to simplify the tariff so that it has an air of nondiscriminatoryfairness and differentials do not have to be defended. However, thesituation in many countries where conferences have established strongpositions clearly permits discrimination by origin, if only competitioncan be held sufficiently at bay. The temptation thus exists frequently,and there is ample evidence that it is also acted upon. It is not difficultto rationalize some of the observed forms of spatial price discrimina-tion; in Appendix B the process and effects of this type of price dis-crimination are demonstrated in a stylized, yet not unrealistic, case. Inthe simplest case, the exporter's foreign-market price is assumed to begiven and he will supply his goods-and thus demand shippingservices-as long as that foreign price exceeds his cost, includingtransport cost. If exporters are located at different distances from theport, the conference with power to practice price discrimination willcharge the highest rate to the nearest exporter and the lowest to thefarthest exporter.5 The abatement of price to distant shippers will berelated to inland transport cost. In simple cases the rule would thenbe that the conference absorbs a particular percentage of inland trans-port cost down to the distant point where no more traffic is forth-coming because the freight rate and internal transport cost are toohigh. If, instead of thinking of shippers at different distances froma port, different ports are considered to be at a different distance froma main port, then it can be assumed also that the ships' cost will risewith distance. Rising cost will then naturally offset part of the ratereduction according to distance. The same principle of price dis-
5. In practice, the nearest exporter may have access to alternative means ofshipping so that the farther exporter is charged more than the nearer one. Butthat is a case of price discrimination according to competitive conditions and notaccording to distance and therefore is a different matter.

DISCRIMINATION AND COUNTERDISCRIMINATION 141
crimination can also be transplanted into situations of regional pro-ductivity differences in export production. It will then lead the ship-ping monopoly to seek to absorb part of the productivity differenceby charging lower rates to the less productive regions.6
It is clear that a discriminating conference will be able to earn moreprofits than a conference that is restrained from such discrimnination;one, for example, that is required by law to carry all goods at thesame rates, irrespective of their origin. It is also clear that the dis-crimination will result in a larger volume of exports through the con-ference ports than would have been the case with one price only.7
However the populace of the country will be worse off with dis-crimination rather than without it. The conference will be appro-priating their surplus. Indeed with the perfect discrimination assumedin this illustration, the conference will be expropriating all the surplusthat arises from export demand.8
Expressed in terms of the effects on ports, the charging practices ofliner cartels, including cartels of container operators, tend to absorbthe relative advantages of location or port productivity. This policy isso generally accepted that container projects tend to take it forgranted. The freight rates or through-transport rates that get acceptedin the cost-benefit calculations of container projects are thus some-times based not on ascertainable cost of a new service to and from aparticular port but rather on the rates (possibly somewhat augmentedto reflect the cost of the additional service) on the main nearby trunkroutes. This is done with the firm expectation that the container lineswill average out cost over the entire route.9 But the use of such
6. All these variants are elaborated in Appendix B of this chapter.7. This is true, however, only if the rigid assumptions of the model are
adhered to. In particular, in the case of varying demand functions with distancethe result may be a smaller output for export; but these cases are ignored.
8. It might be conjectured that if the conference were wholly owned in thecountry, then such discrimination would clearly improve the condition of thecountry generally. But even this argument is not correct. With a particular con-straint, the discrimination is worse than single price solutions. But with other con-straints, this result would not necessarily hold. Fortunately, however, these com-plications do not matter in this context since the country in question never hascomplete ownership or even any substantial fraction of the ownership of thesteamship companies.
9. See Economist Intelligence Unit in association with Wallace Evans andPartners, Consulting Civil and Structural Engineers, The Containerization ofThailand's Sea Trade (prepared for the Government of Thailand, Ministry ofCommunications, 1973), p. 53.

142 CHAPTER 6. STRATEGIC PRICING
administered prices may not always provide a safe ground for portinvestment that may not be profitable on the basis of competitivepricing or services.
The policy question for ports (if chosen as instruments of nationalpolicy) is whether they can recapture surpluses that have been an-nexed by ships. In the end this raises the question of counterdis-crimination. The alternatives are to discriminate against ships whichabsorb surpluses, to use opportunities for price discrimination tosubsidize the use of shipping monopolies, or to seek to preempt thesurpluses which ships extract from national shippers.
The first problem is to see whether it is feasible for the port authori-ties to discriminate and in what way they could discriminate. Varia-tion in port charges often may be associated with variations in theprice paid for inland transport. Both rail and port authorities areusually under the same authority, the Ministry of Transport, and itwould not be too difficult to coordinate their charging practices. Insome countries the railway authority is responsible for the port andcan often discriminate against the road trucker. Thus, discriminationby the port authority is feasible, the question is whether it is desirable.
Discrimination among goods
Discrimination among goods is traditional in port economics largelybecause it is thought to enable the port to cover its cost and to chargelow development levies for low-valued commodities. In principle themarkup of charge above marginal cost should be proportional to theinverse of the total elasticity of demand. If the elasticity of demandis related in a significant way to the inverse of the value per ton orper volumetric quantity, the variation in the port levy with respect tothe value of the commodity will extract revenue according to theability to pay.
Since both the railways and the liner conference price accordingto ability to pay, it may be argued that the port authority should notadd to such discrimination.10 A particular objection is that the con-
10. In fact, however, where in-depth studies of the relationship between railrates and cost have been attempted, the discrimination against high-valued com-modities is often more apparent than real. In Gilbert Walker's phrase, "thecream lies at the bottom of the railway's bottle." The cream of the traffic, suchas high-valued, high-rated commodities, costs so much more to move that the netrevenue from them is lower than for low-rated commodities and is often nega-tive. See Gilbert Walker, "Transport before and after 1953," Oxford EconomicPapers, New Series, vol. 5, no. 1 (Oxford: Oxford University Press, March 1953).

DISCRIMINATION AND COUNTERDISCRIMINATION 143
ferences discriminate against the manufactured goods of developingcountries being exported to both developed and other developingcountries. Should not the port charges be adjusted so that they offsetthe discrimination of the conference?
It is clear that some of the variation in the conference rate couldbe offset, provided the conference and the port authorities did notpursue strategic bargaining. Any reduction in the port charge forhigh-valued goods may be passed on at least in part by the conferencein the form of a rate reduction. But there is an important exceptionsince the demand may have the characteristic kinked shape that wouldproduce no response in rates over a variety of changed cost conditions.This is an important argument for the port not to attempt to counterdirectly the discrimination of the conference with respect to com-modity. (There is, however, an argument for indirect discriminationwhich is discussed below.)
Granted that the port should not attempt to offset the discrimina-lion of the conference, the question remains whether it should dis-criminate according to value of commodity at all; should it not pricesimply according to cost? If there are economies of scale in the portoperation, then to recover total cost, it might be best to mark up allcosts by a constant percentage. In particular if there is no way toprice separately the port services to conference and nonconferencevessels, then there may be a case for imposing a lower markup overcost on the high-rated commodities even though such cost reductionsprobably would not be reflected directly in the price of the conference.The lower port price for what is regarded as typically liner traffic maycause increased competition from nonconference liners and tramps.'rhus the upper limit of the conference's pricing latitude will be1brought down.
Discrimination against the conferences
The most important areas of discriminatory pricing to be con-sidered by the port are in the field of differential ship dues. First themost obvious way is to levy different fees according to the type ofship used by liner operators, tramp owners, and bulkers. Again on theassumption that the best way to curb monopoly power is to encouragecompetitors (including nonconference liners), it would be best todiscriminate in favor of bulk carriers or tramp vessels and to chargefees for the conference vessels so that the loss on the others is re-couped. If the kinked demand curve theory is correct, then the in-crease in port charge for the conference will have little effect on rais-

144 CHAPTER 6. STRATEGIC PRICING
ing the conference freight rate. On the other hand the competitivestructure of the tramp industry will ensure that the lower port cost isreflected in the rate (or simply shows up in the charterer's accounts).The lower cost of shipping by chartered vessels should then providemore competitive conditions which, in their turn, will influence con-ference freight rate negotiations.
So far this discussion has been in terms of the charge varyingaccording to the type of vessel used. This is probably the easiest formof discrimination to practice: there is a considerable variation in suchcharges levied at present with often little rhyme or reason to justifythem. But it would be much more efficient to vary the port chargeaccording to whether the vessel belonged to a conference or not. Thischarge would deliberately discriminate against the conference andavoid penalizing, and indeed would encourage, the nonconferencecompetitors, whether they be liners, bulkers, or tramps. This wouldsubject the conferences to a more effective competitive discipline.
The difficulty of discriminating port charges according to whethera vessel operates in conference or not is considerable. First, accordingto some port authorities, it is difficult to distinguish whether a vesselis controlled by a conference or not. No doubt differential chargeswould increase considerably such attempts to disguise conferenceliners. It seems possible, however, to decide whether a steamship com-pany operates the conference tariff or not, and that is the critical issue.Secondly, it would tend to exacerbate the relationships between theconference on the one hand and the port authorities and governmenton the other since the discrimination is so obviously directed towardthe conference as such. Such an especially high port levy may berationalized, however, on the grounds that the conference enjoys spe-cial privileges of collusion, uncontrolled by government and that aprice should be paid for this privilege (as indeed a price is exactedfrom the shippers and importers). However, those who have longenjoyed a free privilege are unlikely to appreciate the argument thatthey now ought to pay for it.
Finally, port pricing may be used to counteract in a limited waywhat are regarded as undesirable consequences of the organization ofthe liner industry. Thus, if conference organization causes an un-necessarily large number of sailings into port," the port may allow
11. This can be the result of allocating sailing rights among the members ofthe conference, an adjunct or substitute for cargo quotas. Unless the allowednumber of sailings is performed in a period, the rights are lost.

APPENDIX A. THE CLASSES OF DRY CARGO VESSELS 145
quantity discounts in the charges for moving general cargo. Thesimplest way to allow such discounts might be through raising thoseparts of the total ship payments in port that relate to the particularcall while reducing the charge for working general cargo.
Where, on the other hand, conferences have rationalized the service(for instance, on the west coast of India), cargo tends to get shut outby vessels. In this situation, the policy should be the inverse of whatis appropriate in a situation of an undesirably high ratio of ship callsto cargo worked. The rate for cargo working should then be raisedrelative to the cost of sailing into the port to encourage some excesscapacity. The container ship might thus be allowed to sail into portand to take up a berth free of charge for a specified time, although aload is put on the charge for the actual movement of containers.
Appendix A. The Classes of Dry Cargo Vesselsin the Ports of Developing Countries
Liners tend to predominate in the dry cargo trade of most develop-ing countries. They clearly predominate in the distant voyage tradesof Southeast Asian ports. Earlier studies showed that liners loadedover half of Singapore's cargo (dry plus vegetable oil and latex) anddischarged almost two-thirds of all imports through the port. Thetraffic of Bangkok depended even more heavily on liners (Table 6.1).The situation has not changed substantially since these sample studies.More recently it was established at Chittagong that 90 percent of thevessels at the general cargo jetties (which handle bulk as well asbreak-bulk cargoes) were liners; only 10 percent were charteredvessels.' 2
Liners tend to be organized in conferences or rate-fixing agree-ments. Table 6.1 points to the dominance of conference liners in theimports of Singapore and in the imports and exports of Bangkok.The position of conferences is strongest on the long distance routes,as is illustrated by the share of conference carriers in the cargo ton-nage on the main routes from and to Bangkok (Table 6.2).
12. Louis Berger International, Inc., "Feasibility Study, Port of ChittagongExpansion, Bangladesh," (prepared for the Asian Development Bank and Chitta-gong Port Trust), vol. II (December 1974). No similar statistics are availablefor Port Kelang.

146 CHAPTER 6. STRATEGIC PRICING
TABLE 6.1. CLASSES OF VESSELS IN TME PORTS OF SINGAPORE AND
BANGKOK, 1966 AND 1967
Cargo tonnageVessel calls loaded and discharged
Percentage Percentage of totalNumber of totalof vessel vessel Cargo Cargo
calls DWT loaded discharge
Port of SingaporeLiners 81 75 55 64
(Conference liners) (58) (70) (36) (54)(Independents) (23) (5) (19) (10)
Tramps and other char-tered vessels' 66 25 45 36
Total 147 100 100 100Port of Bangkok
Liners 110 84 80 88(Conference liners) (73) (71) (54) (81)(Independents) (37) (14) (26) (7)
Tramps and other char-tered vessels 22 15 20 12
Controlled by confer-ence (7) (6) (9) (4)
Total 132 100 100 100
a. Some of the vessels in this category performed the inward or the outwardjourney as liner on regular schedule.
Sources: D. J. Blake, E. Bennathan, and A. A. Walters, "Survey of Vessels inthe Port of Singapore (Roads and Wharves) during One Week in September1966" (Bristol, 1970; processed) and E. Bennathan and Direk Malakon, "Surveyof Vessels in the Port of Bangkok (Klong Toi and Private Wharves) duringFour Selected Weeks between November 1966 and August 1967" (Bangkok,1970; processed).
Appendix B. A Simple Modelof Origin-Destination Discrimination
A simple characterization of the process is to suppose that the con-ference carries the produce of farmers who live along a road goingfrom the port to the interior.13 Suppose that the conference can dis-
13. This is a slight adaptation of A. A. Walters, "A Development Model ofTransport," American Economic Review (Papers and Proceedings), vol. 58, no. 2.(May 1968), pp. 360-377 and of A. A. Walters, Economics of Road UserCharges, World Bank Staff Occasional Papers, no. 5 (Baltimore: Johns HopkinsPress, 1968), chapter IV.

APPENDIX B. A SIMPLE MODEL 147
TABLE 6.2. THE SHARE OF CONFERENCE LINES IN THE CARGOTONNAGE OF ROUTES INTO AND OUT OF BANGKOK, 1966 TO 1967
Cargo tonnagel onconference carriers
Loaded DischargedRoute (percent) (percent)
Short-distance routes 0 6Hong Kong 6Japan and Korea 93 90Continental Europe and United Kingdom 74 100Bay of Bengal 100U.S. Atlantic 100
a. Omitting all cargo flows with a tonnage less than 5 percent of the totalBangkok cargo flow counted in the survey.
Source: E. Bennathan and Direk Malakon, "Survey of Vessels in the Port ofBanglkok (Klong Toi and Private Wharves) during Four Selected Weeks betweenNovember 1966 and August 1967."
criminate in its rates according to the origin of the goods. The farmerhas to pay $t per unit for every mile of transport along the road, sothat for m miles he pays $tm. Assume that one unit of quantity isthe most that can be produced in a given mile and that all miles ofcountry are homogeneous. The amount that the farmer will send forexport (and correspondingly the amount that he will consume orspend in leisure) will depend upon the price that he must pay todeliver it at the foreign market. This is equal to the price which islevied by the conference for transport over the ocean, and since theconference can discriminate according to origin, the expression mustbe written as P(m), the price for the m'th mile along the highway.Including the inland transport cost down the road, therefore, thecost per unit of sending the goods to the foreign market is: P(m)+ mt dollars. The farmers' demand for transport to the foreign mar-ket is therefore assumed to be a linear function of the price, that isto say,
(1) X(m) = a-b [P(m) + mt].
Cost of shipping and spatial discrimination
This, of course, is only the demand of the farmer situated m milesaway from the port. Now suppose that the marginal cost of oceantransport for the conference is constant, c. The net revenue from thefarmer at the m'th mile is then:

148 CHAPTER 6. STRATEGIC PRICING
(2) [P(m)-c] X(m) = [P(m)-cl [a-b(P(m) + mt)j.
The value of P(m) at which this net revenue is maximized is then:
P(m) =0.5b-1 (a-bmt + cb)
or:
(3) P(m) = 0.5 [(a/b) - mt + c].
This simply tells how the conference would price its services if itcould discriminate according to the origin of the goods.
One interesting result is that the conference will reduce its rates asit gets farther and farther away from the port since it has to over-come the additional expense of the inland transport cost to generateadditional traffic. The simple rule is that the conference will reduceits price by 50 percent of the overland transport cost. In the jargonof the conference or the container service, it will absorb 50 percentof the inland transport cost. Of course, the conference will not con-tinue to absorb 50 percent of the transport cost as the farms becomemore and more distant. There is a limit, and that will occur when notraffic is offered because the freight rate and internal road transportcost are too high, and this is clearly when:
(4) X(m.nax) = a-(b/2) [(a/b) - mt + c + 2mt] = O
that is to say,
a- (a/2) + (bmt/2) - (bc/2) -bmt = 0
(5) mmax = (a -be)/lbt.
This gives the maximum distance down the road that the conferencewill find it profitable to collect traffic as a function of the confer-ence's cost (c) and the cost per mile of road transport (t).
Variations in cost
One interesting aspect of this analysis concerns the variation ofconference ship cost with the origin of the traffic. The model simplyhas one port and cannot reproduce the variation in port and trafficconditions which are characteristic of operations. Suppose that thereis a continuous port operation along the road-as though the ship cantravel up the highway and collect traffic at each point. Althoughseemingly absurd, this assumption does capture the essential featureof the conference collecting traffic at different ports at varying cost.

APPENDIX B. A SIMPLE MODEL 149
The marginal cost of collecting a small unit of cargo c(m) may bean increasing function of the distance from what may be called themain port. The solution is now taken as:
(6) P(m) = (a/2b) - (mt/2) + (c(m)/2).
Thus the increasing cost of ports as m increases offsets part of thetendency to reduce freight rates for the more distant locations. (Tomaintain the fiction the collection points at point m are assumed tobe associated with additional transport costs of mnt to get the goodsto the port at m.)
It is conceivable (if unlikely) that the function c(m) is of theform: c(m) = tm. Then the conference would not vary the priceaccording to the port. There would still be discrimination since pricesdo not vary according to cost; they are constant. This would providean altemative rationalization for the constancy of freight rates overthe region. Alternatively the cost of ports could be classified accord-ing to the amount of traffic that passes through them-marginal costdiminishing as the quantity of traffic increases. This assumption wouldgive similar results.
The model of the single port and its hinterland may be developedfurther, and incidentally made more realistic, by supposing that thereare several such ports serving hinterlands, each through its road; eachdiffers, however, in its productivity. This will be reflected in theparameters a and perhaps also b of the model. The highly productivehinterlands may be considered to have large values of the parametera, and relatively low-productivity areas will have low a's and stop. Theresult will then be that monopolistic shipowners would charge highfreight rates for the high-productivity areas. If the volume of trafficfrom such areas is higher than from poor areas and if shipping andport operations are subject to economies of scale, there will be areaction on the cost of collecting the cargo [c(m)] which will coun-teract, through the cost relation, the ship's price discrimination againstthe high productivity area.
Movements in cost, however, may be relatively unimportant in de-termining the conference tariffs as was pointed out earlier in thischapter. Only when traffic becomes attractive to tramps, bulkers, andother nonconference carriers will the conference's markup over costbe limilted.

Chapter 7
Competition among Ports
IN ANALYZING PORTS it is often convenient to assume that there islittle or no competition for their services. But in practice this is rarelytrue.
Inland Competition
The most straightforward case of competition among ports is wheretwo or more of them share a continuous hinterland. The ports thuscompete for the business of importers or exporters who could routetheir goods through any one of the ports and could switch from oneto the other. Ports in a situation of inland competition will, there-fore, keep their prices for identical services closely in line with eachother.
A clear example is the competition between Port Kelang and Singa-pore: the Malaysian trader may ship his goods across the causewayand use the facilities of Singapore instead of shipping throughKelang. Congestion at one port should quickly lead to vessels beingdiverted to the other, absorbing, if necessary, the additional cost ofinland transport to a particular location.' In the opinion of traders
1. Congestion in Kelang in 1961 thus led to the diversion of vessels to Singa-pore from where cargoes for Malaysia were carried by Malaysian railways atsubsidized rates to the consignee's nearest siding.
150

INLAND COMPETITION 151
at Kelang, vessels and cargo would find it profitable to switch toSingapore if delays at Kelang mount to 2 days and if a surcharge wasimposed on the port. Even where the quality of facilities differs muchmore than between Singapore and Port Kelang and where inlandaccess is much more differentiated, congestion regularly leads to sub-stitution between ports. The 1976-77 congestion in Middle Easternports offers many examples of this. Another case is the diversion ofcargoes from the port of Chittagong to the anchorage of Chalna inBangladesh across the traditional line of division according to geo-graphical catchment areas and to the handling requirements of car-goes. Developments of transport infrastructure in Bangladesh lead tosimilar results.2
Even where a particular country has a feasible and seemingly effi-cient port located outside its borders, the issue is, in principle, simple.Traders should ship through that port where the cost is less, allowingas always for any service differential between the two ports. If portpricing and internal transport pricing policy (for example, fromMalaysian farms or factories to the port) are based on marginal cost,there will be an efficient allocation of cargo and traffic.
'he total overall cost will depend on whether the commodity isshipped by conference vessel or by competitive shipping. First con-sider the conference service: the price of a shipping service is thesame whether the goods are carried from Singapore or from Kelang.It seems as though the cost of the ocean carriage would be the same,but this is not the case. By virtue of its size, Singapore has manymore frequent and varied services. Consequently, by shipping throughSingapore, the goods probably will not have to wait so long for a ship,and the trader will save on inventory and wastage costs.
An example of this is timber shipments from West Malaysia. Thedifference in the frequency of services is such that the average waitingtime of one timber shipper was estimated to be about 4 to 5 weeksfor Kelang against 1 to 2 weeks for Singapore. Even a delay as smallas 3 weeks involves considerable inventory cost and, when interestrates are high and liquidity is scarce, may cause considerable cashflow problems.
Such differences in the quality of service are not offset easily by
2. The opening of the Ghasiakhali canal has made Dacca equidistant fromChittagong and Chalna anchorage. Moreover, if the Pusur River channel toChalna is dredged as has been proposed, traffic at Chittagong may be reducedby 15 to 20 percent, which is roughly the output of two berths.

152 CIAPTER 7. COMPETITION AMONG PORTS
port charges." Charges at the usual levels are frequently small beercompared with the cost of internal transport. In Malaysia, for ex-ample, internal transport cost will be at least US$0.10 a ton-mileeven under the most favorable conditions, for bulk commodities suchas timber. Thus even a differentiation in port charges of US$1 is onlylikely to shift the boundary of equal cost access by 10 miles. Improve-ment in domestic transport, such as building better roads, is likely totip the balance in favor of the port with the relative advantages,given ihe prices ruling. Thus the improvement of the highwaysthrough Johore and up to Kuala Lumpur has made Singapore moreattractive as a port outlet.
As a result Malaysia has tried to discourage Malaysian traffic fromusing Singapore and to induce traders to use Kelang and other Ma-laysian ports. Undoubtedly, one method has been to keep the portcharges low for Kelang. Second, the Malaysian authorities have notstreamlined the customs exit and entry procedures on the Johorecauseway that connects Singapore to Malaysia. They have, so to say,introduced an impedance to discourage the use of Singapore. Third,the rates of Malaysian railways discriminate in favor of the domesticports and against Singapore.
Very similar practices are found in the competition between Van-couver and Seattle. Traffic originating in the province of Ontario willreceive a special "crow's nest pass" rate if it is sent through the Cana-dian railways to Vancouver, rather than by the U.S. railways to Seattle.And there is an absorption practice that has the same discriminatoryeffect. The absorption of inland transport cost-or rather of differ-ences between transport cost to different destinations-is a commonpractice of container carriers. It discriminates both against a particularport (by reducing the inland transport charge for carriage from an-other port) and against shippers located nearer to the favored port.
The cost of protecting the national port is usually bome by the
3. For example, wharfage plus stevedorage plus labor charges at Kelang tomove the timber direct from a road vehicle to ship or lighter came to M$13.30per metric ton in 1973; the similar set of payments-in neither case exhaustivefor the shipment of timber-came in Singapore to perhaps S$8.75 per ton. Inneither case did such rates apply to all the timber shipped: much of it goes overprivate jetties into junks, and then overside mid-river onto the ship. The porttariff at Kelang was increased in 1975 by about 30 percent. See Port of SingaporeAuthority, PSA Tariff 1973 (Singapore, 1973) and Port Swettenham Authority,Scale of Rates, Dues, and Charges, By-laws, 1966, incorporating amendmentsup to April 18, 1974.

TRANSSHIPMENT COMPETITION 153
country's residents. An interesting example of this is once again theexport of Malaysian timber through Singapore, most of which isexported over private jetties. The total ocean transport cost of timberdelivered in Europe comprises 31 to 40 percent of the c.i.f. value;internal trucking cost accounts on average for another 20 percent.Port charges at the loading end only are about 3 to 5 percent of totalcost.4 But with transport cost absorbing over 50 percent of the c.i.f.price, the port charge is quite a large proportion of the remainder.Allowing for labor and other expenses, the ratio of port cost toresidual income may be approximately 1:4 to 1:3. This illustrates thesensitivity of timber exports to the port charge, all other things beingequal.
Transshipment Competition
The more complex form of interport competition involves trans-shipment and multiport use. A commodity shipped from the UnitedStates to Surabaya may be shipped direct from New York to Surabayaor may be transported to Singapore and then transshipped to Sura-baya. In this sense, Singapore competes with Surabaya. But Singaporemay also be competing with an alternative transshipment port, suchas Hong Kong. In such a case of pure transshipment competition, theinterest of Indonesia (assuming that it cannot hope to get the cargodirect to its ports) is simply to obtain the most competitively lowrate, no matter where the goods are transshipped. For Hong Kongand Singapore, however, the transshipment business is a matter ofcompetitive contention. If Singapore is to secure the business in thisexample, her transshipment rates will have to be set sufficiently lowin relation to both Surabaya import rates and Hong Kong transship-ment rates.
When equidistant ports compete for transshipments to a thirdport, then port charges become the decisive factor in the outcome ofthe competition. Equidistance of alternative transshipment ports andthe equality of all the other determinants of transit cost are not, ofcourse, the usual situation. Hong Kong is thus farther from Indonesiathan is Singapore, so that the size of vessels and the economic volumeof cargo has to be greater for transshipment through Hong Kong.
4. Some timber is exported over the quays in conference vessels as well as innonconference tramps. Little or no timber is exported in containers, althoughthey are being used for plywood and other regular lengths.

154 CHAPTER 7. COMPETITION AMONG PORTS
Much of the transshipment business from Singapore to Indonesia andEast Malaysia, on the other hand, is being done by small coasterscarrying modest loads. But their location relative to high densitytraffic flows eliminates many ports from a particular race. For thosethat remain, the relative volume of transshipment trade will be deter-mined largely by port charges, including labor rates. A market existsthat is potentially larger-and sometimes much larger-than the mar-ket for their home traffic. If there is competition between transship-ment ports within the same region (such as Singapore and HongKong) or between the transshipment port and well developed portsin the country of destination (for example, Singapore and Djakartaor Port Kelang), then the transshipment demand will have relativelyhigh elasticity.
In Figure 7.1 the home demand for the port's services and trans-shipment demand are drawn side by side, each linearized. The total
FIGURE 7.1. DEMAND FOR THE SERVICES OF A REGIONAL
TRANSSHIPMENT PORT: "SMALL" HOME TRAFFIC
AND "LARGE" TRANSSHIPMENT MARKET
Price ($) Price ($) Price($)
71 Da ~~~~~~~h+ DTMRp Mc
~-*-MRT
0 X, MR, X. Dr, Tons (X)
(i (ii) (iii
Home traffic demand Transshipment demand Total demand
Note: Dh = home demand; Dr = transshipment demand; Dh + Dr = totaldemand; X = Xi + Xr; OM = marginal cost for X tons of traffic annually;Ph = profit- maximizing price for home traffic; Pr = profit-maximizing price fortransshipment traffic.

TRANSSHIPMENT COMPETITION 155
market consists of the limited home market with relatively low demandelasticity (i) and the relatively large and elastic demand for trans-shipments (ii). After the separate demand curves have been addedup horizontally, a total demand curve with a convex kink results (iii).If the port maximizes profits, it would set prices for each of the twosubmarkets according to the rule: marginal cost (for the total output)equal to marginal revenue for the submarket.
The principle of discrimination in favor of transshipment cargoesexists in most port tariffs, although not on the scale found in majortransshipment ports like Hong Kong or Singapore. In Table 7.1, the
TABLE 7.1. PORT OF SINGAPORE AUTHORITY TARIFF, 1973:TRANSSHIPMENT DIFFERENTIAL PER TON OF CONVENTIONALCARGO FOR A HYPOTHETICAL VESSEL
NormaZinport/ Trans-export shipment Reshipmentcargo cargo cargo
(S$ per ton) (S$ per ton) (S$ per ton)
Charges Account Vessel(assume vessel of 6,000 GRTdischarging/loading 3,000tons)
1. Port dues 0.30 0.30 0.302. Pilotage, tugs, berthing/
unberthing labor, garbageremoval 0.43 0.43 0.43
3. Dockage and stand-bycharge 3.00 3.00 3.00
4. Stevedorage 4.75 4.25 4.755. Total of above for two
vessels 16.96 15.96 16.96Charges Account Shipper/Consignee
6. a. Receiving, storing,reshipping: 1 ton 0 3.00 3.00
b. Wharf handlingcharges: 2 tons 4.00 0 0
7. a. Storage (up to 4 weeks) 0 0 0b. Storage: 7 days for
imports; up to 3 daysfor exports 8.80 0 1.00'
8. Total of above 12.80 3.00 4.00
Grand total 29.76 18.96 20.96
Note: S$ per ton in and out.a. S$0.10 per day for first 4 weeks; say, 10 days = S$1.00.

156 CHAPTER 7. COMPETITION AMONG PORTS
Singapore charges per ton of conventional cargo for a hypotheticalshipping operation are compared, distinguishing normal cargo (ex-ported from or imported into Singapore), transshipment cargo, andreshipment cargo.5 Charge per ton (on the basis of roughly similarservices and thus omitting many items that would in practice berequired for one or the other type of operation) are 36 percent lowerfor transshipment cargoes and 29 percent lower for reshipment cargoesthan for normal import or export cargoes.6
If marginal cost in the Port of Singapore was known, the perceiveddifferences in the elasticities of demand for port services that areimplicit in the transshipment differentials could be determined readily.As it is, the value of marginal cost must be guessed. It may either betaken as approximately equal to handling charges for transshipmentcargo (items 2, 4, and 6a of Table 7.1) or as exceeding handlingcharges by the remaining charges levied on the onward carrier per tonof transshipment cargo (items 1 and 3).
The justification for the latter altemative is that each ton of trans-shipment cargo received by the port will cause an income under theheads of port dues and dockage at the time of the outward move-ment; handling charges for transshipment cargo might, therefore, havebeen set below marginal cost to that extent. Both altematives sufferfrom the implicit assumption that the marginal cost of storage wasin fact zero, and this seems implausible for 1973 and parts of 1974.
Applying the standard formula,7 the elasticities of demand calcu-lated under the former assumption are (in absolute value) 1.7 forhome traffic; 2.4 for reshipment, and 2.9 for transshipment traffic.
5. The main difference between transshipment and reshipment cargo is thatthe former must be moving on a through bill of lading. Transshipment must,therefore, be arranged before the cargo leaves its original port of shipment.Reshipment cargoes are imported usually by local merchants who leave the goodsin the port until they have arranged a sale to a buyer in another port, oftenafter dividing up the original consignment.
6. The value of the advantages obtained by transshipment and reshipment car-goes is most probably rather greater than these average margins because operatorsregard storage terms-4 weeks free for transshipment and S$0.10 per day forreshipment-as perhaps the major advantages. Reshipment cargoes can be storedat low cost while a buyer is being found, and a long period of free storage fortransshipment cargoes allows shipping companies to use the lowest-cost methodof on-carriage without any offset to the possible savings.
7. Elasticity of demand (submarket) = price (submarket)/[price (submarket)- marginal cost (total) ].

TRANSSHIPMENT COMPETITION 157
UJnder the alternative latter assumption they become 2.1 for Singaporetraffic; 3.9 for reshipment, and 5.7 for transshipment traffic.8
These results, although based on much guesswork, are not markedlyinconsistent with prior expectations. They are the estimates that arerevealed by the behavior of the port authorities in setting tariffs.Naturally they reflect the possibility that, if Singapore changes itstariff, competitive ports will also change theirs. If competitors did notreact, the elasticity of demand would be considerably larger than theseestimated values."
Of course, Singapore is not typical of ports in the developing coun-tries. It is in close inland competition with various Malaysian ports,and this should account for the size of the implicit elasticity of de-rnand for home cargo services-not far from 2 and thus higherthan would be expected in ports such as Bombay that have asubstantially captive hinterland. Furthermore, the size of its trans-shipment and entrepot business is unusual in the developing world.Thus, its demand elasticities may seem to be atypical and of littleinterest for preparing systems of port tariffs for other countries. How-ever, this is not so. The entrepot and transshipment business of theworld's, and particularly the developing countries', ports is likely toincrease dramatically over the next decade or so. This is not becauseof the growth of conventional transshipment cargo; indeed this isexpected to decline relatively. The real impetus for concentration andtransshipment comes from the economies of containerization, whichare discussed next.
8. The latter assumption yields a higher elasticity of demand for transshipmentservices because it comes closer to the assertion that transshipment traffic getscharged marginal cost, which, if introduced into the calculation, would makeelasticity of demand infinitely large.
9. The demand for port services for Singapore (home) trade should not bevery inelastic. So much of what appears to be home trade is really transit orentrepot trade; the port of Singapore is in inland competition with the ports ofpeninsular Malaysia and even southern Thai ports. In terms of recorded foreigntrade values for 1974, 41 percent of all exports and 18 percent of the totalimports were entrepot trade, and in terms of the balance of payments, the grossincome from "other transportations and services, n.i.e." amounted to 29 percentof merchandise exports. Reshipment trade, again, may have an appreciably lowerelasticity of demand than transshipment (as indeed reflected in the PSA rates)..It seems to be a profitable branch of Singapore commerce. The gross reward ofreshippers is reported to be 1 to 2 percent of the invoiced value. The net returnon capital used will be determined by turnover, and if this is seventeen timesthe working capital, the return would be 20 to 25 percent annually.

158 CHAPTER 7. COmPETITION AMONG PORTS
The Effect of Containerization
Conventional transshipment has been losing ground, certainly rela-tive to the home trade of the chief transshipment ports and possiblyeven in terms of absolute tonnages.10 The reason is not just the morerapid growth of the home trade, but also the development of portfacilities in traditional countries of destination and the accompanyingpolitical or administrative measures to foster direct shipments at theexpense of indirect shipments. The growth of national merchantmarines reinforces this trend. National lines gain admission toconferences on the basis of deals which tend to militate against trans-shipment. The conferences themselves discourage free transshipment,if only by ensuring that the freight rate for indirect shipment is notbelow that for direct shipment." The object is to keep cargo underconference control and to channel any savings which transshipmentmight offer to the conference carriers.
But these tendencies are being reversed by the advent of containershipping. Main line services are spreading more widely than was ex-pected some years ago, but they, nevertheless, continue to be restrictedto narrow routes; distribution and collection farther afield is left tofeeder services.12 The main container ship is highly capital intensiveand, therefore, depends on fast voyage turnaround. This implies ashortened conventional liner itinerary and a reduced number of portcalls. The growth of large container companies and consortia permitsa high degree of rationalization of container ship movements exceptduring rate wars.
The competitive aspects of port containerization manifest them-selves in the investments of many ports in national container projectsand in the associated competition, actual or potential, between estab-lished or aspiring transshipment ports and national ports in the sameregion. Furthermore, it is reflected in the lively competition betweenthe transshipment ports. The catchment areas for container trans-
10. Singapore entrepot trade-not transshipment trade-has declined from59 percent of the value of total trade in 1965 to 28 percent in 1974.
11. Compare B. M. Deakin, Shipping Conferences, University of Cambridge,Department of Applied Economics Occasional Papers no. 37 (Cambridge: Cam-bridge University Press, 1973), p. 55.
12. See Appendix A.

THE EFFECT OF CONTAINERIZATION 159
shipment are wide: Singapore thus transships for ports in the Bay ofBengal, and Singapore and Hong Kong are themselves feeder portsfor Japan.
Container port managers are thus anxious to keep their prices belowthose of others, cautiously allowing for quality differences.13 Theintensity of competition for the container transshipment business isreflected clearly in port tariffs. In Singapore, transshipment containersthus are paying 43 to 52 percent less than normal import or exportcontainers-a significantly greater proportional difference than the36 percent allowed for conventional transshipment cargoes.14 Con-tainerization has also raised the competition between ports for main-line container services as distinct from feeder service.
With the advent of containerization, the elasticity of demand forport services thus will have increased. It should have increased mostfor transshipment ports competing with others in the same regionbecause port prices should then have the greatest scope for influencingport use.
Competitive transshipment differences imply discrimination. Con-tainer handling rates in Kelang result in charges to national exportersor importers which are between 36 percent and 100 percent abovethose charges on transshipment operations; and the mean percentageexcess is even higher than that in Singapore. (See Appendix B,Table 7.5.) Therefore, the real size and the effects of this discrimi-nation must be evaluated.
First, the case when the port authority is required to break even isexamined. Realistically, average cost may be assumed to be decliningand operations well below the capacity level. Thus in Figure 7.2, themarginal cost (MC) is constant, and average cost (AC) falls con-tinuously over the whole of the relevant range of throughput. A usefulcaricature is the case when the demand for domestic containers isvery inelastic and the demand for transshipment highly competitive.Then such competition will drive the price of transshipment down tothe competitor's price. However, the port authority will levy average
13. The actual relation between the prices of different ports, some of themcommon user ports and others containing mainly private terminals, is difficult toestablish; the very meaning of equality depends on the operations methods andrequirements of users; Singapore handling rates thus are thought to be well belowthose of Hong Kong or Taiwan, but its storage rates are higher.
14. These figures relate to 1973. See Appendix B.
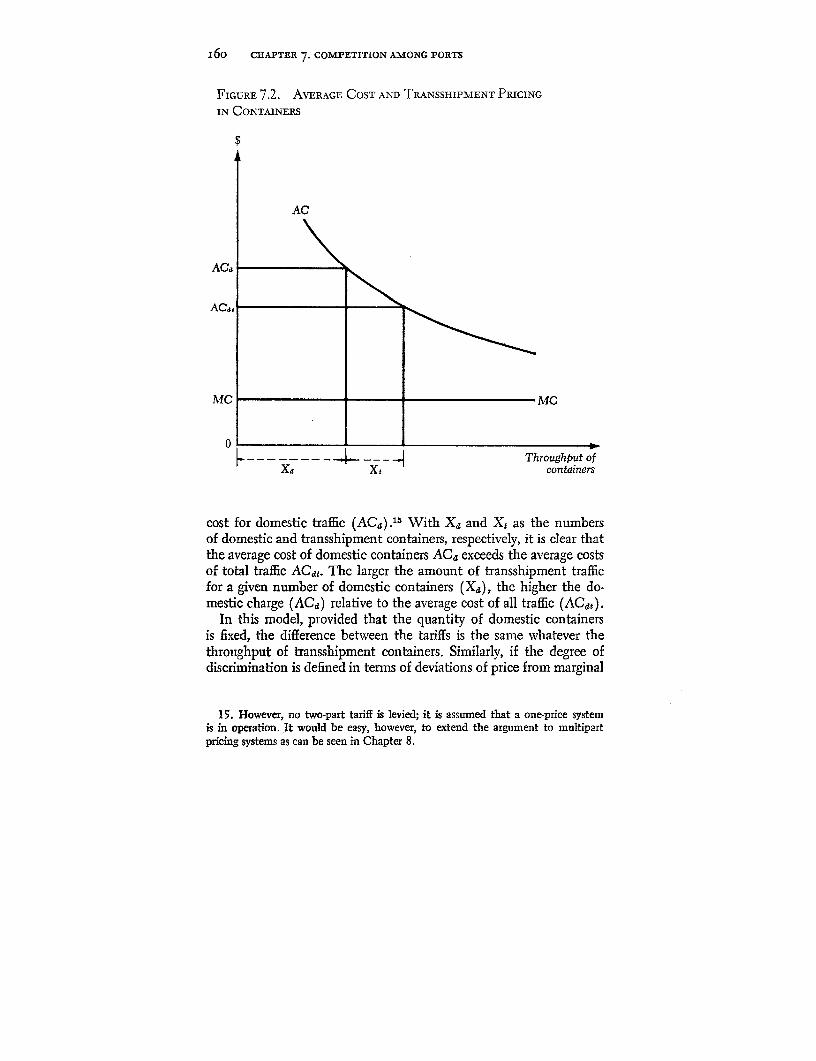
I6o CHAPTER 7. COMPETITION AMONG PORTS
FIGURE 7.2. AVERAGE COST AND TRANSSHIPMENT PRICING
IN CONTAINERS
$
AC
AC,tt
Mc Mc
0
… -4--- ---. 4Throughput ofXI, Xi containers
cost for domestic traffic (ACe).15 With Xa and Xt as the numbersof domestic and transshipment containers, respectively, it is clear thatthe average cost of domestic containers ACQ exceeds the average costsof total traffic ACdt. The larger the amount of transshipment trafficfor a given number of domestic containers (X,), the higher the do-mestic charge (ACd) relative to the average cost of all traffic (ACdt).
In this model, provided that the quantity of domestic containersis fixed, the difference between the tariffs is the same whatever thethroughput of transshipment containers. Similarly, if the degree ofdiscrimination is defined in terms of deviations of price from marginal
15. However, no two-part tariff is levied; it is assumed that a one-price systemis in operation. It would be easy, however, to extend the argument to multipartpricing systems as can be seen in Chapter 8.

THE EFFECT OF CONTAINERIZATION 16i
cost, then the amount of discrimination remains the same-again forany level of transshipment, provided that the quantity of domesticcontainers remains the same.16
In a port of given size, price discrimination may be the only wayfor the port to cover cost. Nondiscriminatory pricing, such as mar-ginal cost pricing, may then only be possible in a port of differentsize. Price policy is thus not separable from the issue of investment.The model in Figure 7.2 can be developed further. In Figure 7.3,national demand for container port services is relatively limited andinelastic, with the demand curve NN'. Aggregate demand, however,including transshipment, is NKD. Let marginal cost be constant untila certain level of capacity is used. Consider the special situationwhere the smallest feasible berth could cover its cost by charg-ing either a price Pa = average cost or Pm which is the profit-maximizing price. Pa, is less than Pm and will be charged if the portis under orders to cover cost at the lowest price level. If it is decidedto equip the port for trading in the wider regional market, the portwill work with higher fixed cost and, it is assumed, lower marginalcost (MC2 ) over the relevant range. It is easy to imagine the situa-tion in which average cost for the larger scale (AC2) lies continu-ously above the total demand curve NKD. If the port is theninstructed to break even, it will be forced to exercise its monopolypower over home trade by moving from average cost pricing towardprofit-maximizing pricing combined with price discrimination. Theprice charged to national shippers will accordingly be lifted from P,,to or toward P,,' depending on whether the port is allowed to makeprofits, is merely enjoined to break even, or to minimize losses.
Annual throughput increases in this case from OX2 tons to OX5,but service to nationals shrinks from OX2 to OX,. The less elastic isnational demand for the port's services, the smaller will be the changein quantity demanded. In the limit, the quantity (OX2 - OX,) willbe zero, and the sole effect of the increase in the charge to nationalswill be to reduce their income. The result may thus be to transferrevenue from exporters or importers to the port. But if the enlarged
16. Although this is the appropriate definition of discrimination for economicanalysis, it is probably not the one espoused most readily by traders and men ofcommerce. They may tolerate readily a low-priced occasional transshipment con-tainer, but domestic traders are likely to complain energetically when transship-ment becomes important and when nationals are precluded from enjoying thereduced charges to the low average cost occasioned by such success.

I62 CHAPTER 7. COMPETITION AMONG PORTS
FIGURE 7.3. NATIONAL PORT VERSUS REGIONAL PORT
Price and cost ($) (a)
N
P,aP,r/
P.
Pal K MC.
hR2 ~1 I - - -= ~ MRD
N' Annualtons
XI X2 Xs
Total costlrevenue ($) (b)
Cs
B RX
T rs
Annual tons
0
Note: (a) AC, and MC, = average and marginal costs (respectively) of anational port; AC2 and MCG = average and marginal costs (respectively) of aregional port; N N' = national demand; NKD = regional demand. (b) C, =total cost of national port; C1 = total cost of a regional port; R, = total revenueof a national port; R, = total revenue of a regional port.

ECONOMIC CAUSES AND IMPLICATIONS 163
port merely covers cost or if its net profit does not increase by the fullamount of the loss of national shippers' revenue, the redistributionof income benefits nonnationals. The most obvious beneficiaries inthis case would be the shipping lines-some of them nationals butthe great bulk nonnational. The cost conditions leading to this resultwere discussed already in Chapter 3, but the demand conditionswhich face the aspiring regional port are peculiar (Figure 7.3b).17
No regional port of importance-let alone one aspiring to that posi-tion anew-has any reason to expect the demand for its services tobe stable. The chief reason for this uncertainty is competition of otherregional ports. In addition, however, the decision of container con-sortia whether to ship directly to a particular port or to transship willbe based largely on criteria of the relative volumes of cargo emanatingfrom different ports. Feeder operations cause additional handlingcost. The main ship will, therefore, go where there is most cargoavailable for direct loading or unloading, leaving other ports to feederservices. The balance of cargo on offer is bound to change over time,and the carrier's responses will not be very sensitive to differences inport rates. The development of regional port services thus is attendedby risks which fHow both from the great development cost and fromthe economics of container carriers and their potential monopolypower. Whether the matter is considered from the point of view ofthe port or of the national shippers-two components of the econ-omy-competitive container port building looks risky even for wellestablished transshipment ports. Some implications of this are ex-plored below.
Economic Causes and Implications
Declining average cost of port operation suggests that the port mayfind it possible and profitable to discriminate in its tariffs. Discountsmay be offered for distant locations in its catchment area. It is possi-ble, however, that other agencies may operate discriminatory pricingsystems; for example, conferences tend to absorb internal transportcosts or port costs to get traffic that would otherwise have gone to
17. Compare, Joan Robinson, The Economics of Imperfect Competition (Lon-don: Macmillan and Co., Limited, 1933). Chapter 15 contains a curve of thistype.

164 CHAPTER 7. COMPETITION AMONG PORTS
another port served by a noncolluding conference or by other non-conference vessels.
As port size increases, the element of fixed cost becomes more im-portant, the degree of indivisibility becomes larger, and so marginalcost tends to become smaller relative to average cost for normaloperating conditions. The large port is under great pressure to fill upavailable capacity, especially when marginal cost moves close to zero.As the technology of ports switches from labor-intensive to capital-intensive forms, the potential for port competition increases consider-ably.
An example of this form of competition is the location of the mainterminal for the container services (usually operated by consortia)between the United States and Europe, and the Far East. Both Singa-pore and Hong Kong are natural locations for main terminals. Thecontainer consortia will choose betveen them on the basis of pricesand the other services that are available. For this entrepot port status,therefore, there is enormously keen competition. The natural geo-graphical advantages might be imagined to yield overwhelming costdifferentials, but in practice, both in the Far East and on the westernseaboard of the North American continent, that does not seem tobe the case.
The critical question is what differential in port pricing, assuminga given and equal level of service in Hong Kong and in Singapore,would cause a shift from the one-at present this is Hong Kong-tothe other? The changes in relative port prices which will lead to sucha switch cannot, however, be regarded as taking place bit by bit sinceany shifts would occur in lumps, and in practice, they would be largelumps. For example, the transfer of the large SL7 ships of Sealandwould mean a loss of about one-seventh of Hong King's containeroperation. Similarlv, once it has been decided to build oil refiningcapacity in a port with ships as main customers in response to therelative cost situation that is also determined by port charges, thedevelopment and its competitive impact are not easily reversible.
Unfortunately, an accurate impression of the consequences ofchanging the port charges cannot be obtained unless an exhaustivemodeling of the whole system is carried out-a task far beyond theaims of this study. The impressions gathered from interviews can onlybe reported here. Port authorities and container operators in Singa-pore thus agreed that there are considerable opportunities for switch-ing services between Singapore and Hong Kong and for demotingone of the contenders to the status of a feeder port. As a rough order

ECONOMIC CAUSES AND IMPLICATIONS 165
of magnitude, Singapore thought that if the container charge weredoubled, the port would lose virtually all its container vessel traffic,assuming that no other ports changed their charges. The effect ofclean slate decisions and decisions by consortia already using the portmust also be distinguished carefully. The former are likely to bemuch more sensitive to movements in relative price than the latter.In sum, however, the demand elasticity for container operations seemsundoubtedly greater than two (in absolute value) for ports such asSingapore, Hong Kong, and Seattle, which at present have substantialmain terminal container services."'
It follows that if the elasticity is (absolute) 2, if there is con-stant marginal cost up to the capacity of the terminal, and if thedemand is such that the facility is being operated well below itscapacity, then the charges that are levied by the profit-maximizingport will be twice the marginal cost. In fact, the calculations forSingapore suggest that container charges are probably higher than this.One conceivable explanation of the apparent inconsistency is thatthe port is not a profit-maximizing agency and so does not followoptimum pricing policies-but in the case of Singapore, this seemsimplausible. The most obvious explanation is that the calculation ofmarginal cost does not consider the probability of congestion that,even when the berths are used only 25 percent of the time, doesnevertheless occur and involves cost to container consortia in thesmall but finite probability of delay.19
The existing situation between Singapore and Hong Kong reflectsthe great importance of size and the service quality differential. Al-though the Singapore tariff for containers is only a little more than
18. In the earlier experiment with the Singapore transshipment tariff a value ofminus 2 for the elasticity of demand for conventional home traffic was ac-cepted as reasonable. The implicit values of the elasticity of demand for conven-tional transshipment and reshipment cargo (some 20 percent of total conventionalport traffic) were higher than this. The aggregate elasticity of demand for con-ventional cargo services would thus also be higher than (absolute) 2.
19. There are two alternative explanations: (a) Singapore is expecting asecular growth in container traffic primarily because it has switched from moreconventional methods (which perhaps may capture some traffic from Hong Kong)and because it expects capacity to be filled even at existing prices in the nearfuture. In that case, the cost of reducing the price now and then raising it againlater may be greater than the loss of interim underuse; (b) the port authorityis expecting inflation, and so by maintaining the same nominal price, they are, infact, reducing the relative price.

166 CHlAPTER 7. COMPETITION AMONG PORTS
one-half of the Hong Kong tariff, it seems that Singapore has notmade significant inroads into Hong Kong's existing main terminalcontainer traffic so far. It is, of course, somewhat early to draw con-clusions since the first full year of operation was only 1973. The costof breaking into the mainline container terminal market is large.
This suggests another reason for the fact that Singapore has notlaunched into a fully fledged rate war against Hong Kong-HongKong may retaliate by cutting its rates also. Although the elasticity ofdemand may be above 2 if Hong Kong maintained the same rates, thethreat of a substantial traffic loss would induce Hong Kong to cut itstariff schedule. The perceived elasticity of demand for Singapore maythus be considerably less than 2, thus justifying the higher markupabove marginal cost. This rate-war reason seems to be important toport authorities.
The effects of interport competition are not restricted to the twomain terminal ports. Competition has effects throughout the wholeport complex of a region. Low container rates through Singapore willbe instrumental in keeping down the container tariffs through Kelang,Bangkok, Djkarta, and other ports in the region. The effects of com-petition emerge clearly from a comparison of the container tariffs ofSingapore and Port Kelang (Appendix B, Table 7.5).
The direct inducement is to engage in feeder services to the maintransshipment centers rather than to set up small container ports fordirect small ship or low frequency container service direct to Europeand to the United States. The economies of scale in container opera-tion make feeder service operation efficient. Not surprisingly, the com-petitive solution is best for all parties. The smaller ports would nothave to operate inefficient and costly (probably subsidized) containerservices, ports such as Singapore would operate at minimum cost, andthere would be the maximum efficient container penetration of con-ventional traffic. Unfortunately, this ideal is unlikely to be achieved.In part, this is because countries are unwilling to have their traffichandled by a port in a country that could conceivably become un-friendly and so discriminate against it. But there is no sense in which,should a confrontation occur, a country could be denied containeroperations; they would merely have to pay more for it. In general,countries probably retain expensive container services in the beliefthat they provide jobs which would otherwise migrate abroad, eventhough such jobs may have to be subsidized, and the subsidy mayexceed the value added when that is calculated at world prices ratherthan in terms of domestic cost.

ECONOMIC CAUSES AND IMPLICATIONS 167
To attempt to maintain port monopolies in the face of increasedcompetition by administrative measures may be worse than subsidizedport competition. Boycott arrangements are particularly expensive,and it is doubtful whether they achieve many of their aims. The mostcommon protective devices, apart from discriminating charges, arediscriminatory regulations (barriers of red tape). Whether theseattempts to limit the development of port competition are at all suc-cessful cannot be ascertained at present. However, it is worth sum-marizing the consequences of the increased competition that isrealized.
The first consequence is that ports will have considerably reducedmonopoly power and will find it harder to make a profit or to covertheir cost, at least for container services where there is considerableexcess capacity and where marginal cost is low relative to average cost.The switch from conventional to container methods increases mark-edly the average competitiveness of ports.
The second effect is that the erosion of port monopoly power hasbeen associated with some increase in the monopoly power of thesteamship owners, primarily through the consolidation of containerconsortia. The consortia can play one port off against another, andfull-fledged container services are very expensive to produce since theyrequire massive injections of capital.20
The methods by which ocean carriers service a particular port arelargely under their control, and in the case of container shipping,almost wholly so. The carriers' demand for the facilities of a par-ticular port may, therefore, turn out to be rather unstable. This willbe least true of those well established ports in which container opera-tors set up their own terminals. But there are many other ports inwhich container operators will only undertake minor investments, ifany. The decision whether to serve such a port by feeder or by mainservice will be taken on considerations of the relative cost of feederservice and of diverting the main line vessel.
The lesson seems to be, first, that many ports may much overesti-mate the virtue of full-fledged container projects to attract and secureregular use by mainline vessel rather than by feeder. The probabilitiesare difficult to estimate because so much of the information lies out-
20. Nevertheless, on the Pacific conference, the behavior of nonconferencevessels-mainly Russian owned-has provided considerable competition duringthe slack trade period of the summer of 1975. But such competition has createdan even more ruthless search for cheaper port facilities.

168 CHAPTER 7. COMPETITION AMONG PORTS
side the country itself, and some of it consists of the intentions ofcontainer lines which they would not, under all normal circumstances,find it wise to disclose fully. Second, mainline service to a port bringswith it a certain amount of transshipment business. But for all but afew ports, the demand for transshipment services should be even moreunstable than demand for mainline container vessel berths. Not onlydoes a port's transshipment business depend on the carrier's decisionon how another port is to be serviced, but transshipment itself is alsosubject to intense competition between ports.
This leads, finally, to port pricing. It may seem natural for eachport to offer some price reductions for transshipments. It is clear,however, that ports should not plan to use monopolistic price dis-crimination against national shippers except if it would result in lowercharges to the national shippers than would be possible without pricediscrimination.2' Tactics may occasionally require discrimination thatwould produce such a result. Port investment projects, however,should not countenance it. It may, of course, be claimed that thelarge port offers a better service to the national shipper than thesmall one: a greater frequency of direct service and a better choice ofvessels. The greater price demanded of the national shipper, it mightthen be argued, would be more than compensated for by the improvedquality. There is no denying that the larger port offers a service ofgreater value to shippers. Nevertheless, investment projects which canbe shown to yield a net benefit only on that argument should be verysuspect; at least in the case of existing ports with facilities of normalquality. Price discrimination against national shippers can benefit notthe port but the carriers who, if they are conferences, may not evenpass on their gain to shippers in the same region. The port shouldnever risk becoming the instrument by which national exporters andimporters subsidize the intemational shipping industry.
Appendix A. Container Services: Mainline and Feeder
Container services, unlike conventional break-bulk services, com-prise both mainline and feeder operations. Operators tend to concen-trate their main container ships on the routes between the main cargo
21. In the example analyzed in Figure 7.3 above, the opposite result wasobserved. If the port had been a profit maximizer rather than an average-costpricer, price discrimination and the enlarged port service would have lowered theprice that shippers have to pay for port services.

APPENDIX A. CONTAINER SERVICES: MAINLINE AND FEEDER 169
ports to minimize the turnaround time between the chief terminalports of the service. The scope of feeder operations in the Far Eastis documented in Table 7.2 which summarizes the late 1975 positionon the U.S./Far East route. Southeast Asia's two main containerports-Hong Kong, which handled 726,000 TEU in 1974, and Singa-pore, which handled 153,000 TEU-are also the chief transshipmentports for South and Southeast Asia. They are served by both main-line and feeder services. Malaysia, which handled 37,000 TEU in1974 with Port Kelang as its only container terminal able to take mainline vessels of the second and third generation, receives direct callsbut is served mainly by feeders. Bangkok depended entirely on feedersuntil the opening of full-scale facilities in 1976.
TABLE 7.2. U.S./FAR EAST CONTAINER SHIP OPERATORS:DIRECT AND FEEDER SERVICES, OCTOBER 1975
Frequencyof calls
perOperator month End points Direct call Feeder
American President 4 California, HIong Kong, PhilippinesLines Japan, Malaysia,
Pacific NW, Korea,U.S. Atlantic Singapore,
TaiwanEvergreen Line 1 U.S. Atlantic Hong Kong,
Korea,Taiwan
Fesco Pacific Line 3 California, Hong KongJapan,USSR
Japan Line, K-Line, 4 Japan, Pacific Hong KongMitsui-OSK NWLine, NYK Line,Showa Line,U.S. Line
Japan Line, K-Line, 6 California, Hong Kong,Mitsui-OSK, Japan KoreaYS Line
NYK Line, Showa 4 California,Line Japan
K-Line 3 California, Hong Kong,Japan, Korea,Pacffic NW Philippines,
Taiwan(Table continues on the following page)

170 CHAPTER 7. COMPETITION AMONG PORTS
TABLE 7.2 (continued)
Frequencyof calls
perOperator month End points Direct call Feeder
Japan Line, K-Line, 4 Canada, Japan, Hong Kong,Mitsui-OSK U.S. Atlantic Korea,Line, NYK Line, Philippines,YS Line Taiwan
Maersk Line 4 California, Hong Kong, Indonesia,Canada (via Singapore, Malaysia,NY), Japan, Taiwan Philippines,U.S. Atlantic Thailand
Orient Overseas 3 Japan, Pacific Hong Kong Korea,Container Line NW Philippines,
SingaporeOrient Overseas 4 California, Hong Kong Korea,
Container Line Japan Philippines,Singapore
Orient Overseas 2 Canada, Japan, Hong Kong Philippines,Container Line U.S. Atlantic Taiwan
Phoenix Container 2 California, Hong Kong Hong Kong,Liners Japan, Korea,
Pacific NW Malaysia,Philippines,Singapore,Taiwan
Sea-Land Service 4 California, Hong Kong Korea,Japan, Philippines,Pacific NW Singapore,
Taiwan,Thailand,Vancouver
Seatrain Lines 2 California,Japan
Seaway Express 4 Atlantic, Guam, Hawani, China,Lines California, Hong Kong, Malaysia,
Japan, Korea, Philippines,Panama Taiwan Singapore,
ThailandZim Container 2 California, Hong Kong, Philippines
Service Canada, Korea,Japan, TaiwanU.S. Atlantic
Source: Containerization International (London), vol. 9, no. 11 (November1975), p. 25.

APPENDIX A. CONTAINER SERVICES: MAINLINE AND FEEDER 171
Feeder operations add two handling operations to those requiredby direct call. Cost comparisons between movement by feeder serviceand by the mainline ship making a diversion from its main routenormally show the cost per container to be higher for the feederservice, except where the distance is relatively great or the numbersof containers small. A containerization study for Thailand,22 for exam-ple, produced the estimates for methods of container transport givenin Table 7.3.
TABLE 7.3. Shipping Freight Cost per Ton, Europe-BangkokOIl the Europe-Japan Route, 1972
Type of vessel Cost (US$)
Main vessel (2000 x 20 feet; load factor: 0.75; 11 tons per container)Europe and Japan 31.70Additional cost of diversion to Thai deep water port, averaged over
1,000 TEU (= 11,000 metric tons): 500 discharged and 500loaded at Thai port 4.40
Feeder vessel (500 X 20 feet)Additional cost of carrying 500 units from Singapore to Bangkok
and 500 units from Bangkok to Singapore, from and to mainvessel 12.40
Another recent study compares the cost of moving containers byfeeder service or by diverting a container ship with a capacity of 2,500TEU. It finds that for 750 miles the cost of the feeder service exceedsthat of the direct call when there are more than 300 containers.23
The least that can be concluded from these calculations is that greatconstancy should not be expected in the optimal methods of servingindividual ports. The growth of container traffic in a particular portmight well unsettle the pattem and lead to direct calls replacingfeeder services. In any case the decision will be highly sensitive to thelevel of port charges in the transshipment port. Fifty-five percent ofthe cost of feeder services from Singapore to Bangkok thus consists ofhandling charges. From the figures in the containerization studyquoted earlier, it is found that a 10 percent increase in Singapore port
22. Economist Intelligence Unit in association with Wallace Evans and Part-ners, Consulting Civil and Structural Engineers, The Containerization of Thai-land's Sea Trade (prepared for the Government of Thailand, Ministry of Com-munications, 1973), pp. 56-58.
23. E. T. Laing, "The Costs of Deep Sea General Cargo Shipping," MarineTransport Centre (University of Liverpool, June 1974; processed), pp. 43 et seq.

172 CHAPTER 7. COMPETITION AMONG PORTS
cost would reduce by 5 percent the number of containers for whichfeeders-and thus the use of the port of Singapore-would provide acheaper service than direct calls.24 Containerization has thus increasedthe elasticity of demand for port services with respect to port chargesand port costs.
Appendix B. Container Transshipment Differentialsin the Port Tariffs of Port Kelang and Singapore
In Table 7.4 the Singapore tariff rates of 1973 have been combinedinto the cost per container of a hypothetical container transport op-eration. This illustration assumes a particular and typical ship size,a rather fast rate of working, and a particular rate of use of portstorage. All cost items are omitted that are irrelevant to the com-parison. The calculation of the-total price for this hypothetical basketof services shows that the FCL transshipment container pays 52 per-cent and the LCL transshipment container 43 percent less than thecorresponding normal import or export container. This differential isthus much greater than that for conventional transshipment cargoes(36 percent).25
Port Kelang and Singapore compete in many ways. Port Kelangseeks to attract main vessels instead of feeders and wants to take overcontainer transshipments to Penang and ports in East Malaysia. Sev-eral instruments of policy are being used to this end; inland competi-
24. See Daniel, Mann, Johnson, and Mendenhall; Louis Berger, Developmentof the Ports of Sattahip, and Da Nang and of Route 9 (study conducted onbehalf of the Southeast Asian Coordinating Committee for Transportation andCommunications at the request of the Governments of Laos, South Vietnam,and Thailand. Contract AIR/SA/IR-197 (Regional)). (Los Angeles: March1973).
25. No direct comparison is possible between the prices in Tables 7.1 and 7.4.The nature of operations, including the size of vessel and use of storage, aredifferent in the two hypothetical cases. Furthermore, Table 7.1 is based on theprice for a complete transshipment operation-in and out-and a correspondingdouble operation with a normal shipment. In Table 7.4, merely one-half of atransshipment operation is compared with one normal cargo operation-in orout. After adjustments of this last difference, the hypothetical cases yield aboutthe same price per ton (assuming 11 tons = one 20-foot container) for a normalconventional shipment and for a containered FCL shipment (S$14.88 andS$14.90, respectively); but for the FCL container transshipment, there is amarkedly lower charge than for the conventional transshipment: S$7.09/tonagainst S$9.48/ton. The charge for the LCL transshipment is higher than forthe conventional transshipment.

APPENDIX B. CONTAINER TRANSSHIPMENT DIFFERENTIALS 173
TABLE 7.4. PORT OF SINGAPORE AUTHORITY TARIFF: TRANSSHIPMENT
DIFFERENTIAL PER CONTAINER AND PER TON OF CONTAINERED CARGO
FOR A HYPOTHETICAL VESSEL, 9,000 GRT, 1973
FCL LCL'Containership using container
quay crane; conventional Normal Normal
ship using ship's derrick. import/ Trans- import! Trans-
Using port equipment and export shipment export shipment
ship's chassis (S$) (S$) (S$) (S$)
Charges Account Vessel
(assume vessel of 9,000
GRT, discharging/loading
545 20-foot containers,
staying 1 day, one-half of
which is for unloading)
Port dues 2.48 2.48 2.48 2.48
Pilotage, tugs, berthing,
labor, garbage removal 2.58 2.58 2.58 2.58
Dockage and standby
charge 2.90 2.90 2.90 2.90
Total of above: I vessel 7.96 7.96 7.96 7.96
Stevedorage, including wharf-
age 140.00 70.00 180.00 110.00
Storage:
a) Transshipment 0 0
b) Home: free period + 4
days empty 16.00 16.00
Grand total 163.96 77.96 203.96 117.96
Per ton (1 container = 11
tons) 14.90 7.09 18.54 10.72
Note: S$ per container or per ton in or out.
a. The service to LCL transshipment containers consists of receiving the trans-
shipment container from first carrier, removal to CFS and unstuffing, then stuffing
the same cargo into another transshipment container and reshipping on a secondcarrier. For normal shipments, the LCL tariff is applicable (a) when a unit of
loaded container is discharged from the ship, moved to the marshalling yard for
storage and subsequently removed to the CFS, the contents unstuffed and the
empty container moved to the marshalling yard or (b) when a unit of empty
container is stuffed at the CFS and the reverse operations to (a) are performed.
tion with Singapore for containerable commodities such as rubberand plywood has led to the erection of informal impediments in thefrontier procedures and the use of government influence, and portrates for normal and transshipment containers have been set close tothose of Singapore. Kelang port rates for the handling of normal FCLcontainers-of importance in the import trade and in rubber exports-were thus apparently held below the Singapore rate in 1974 (Table7.5).

TABLE 7.5. TRANSSHIPMENT DIFFERENTIALS FOR CONTAINERS: PORT KELANG (1974 AND PROPOSED 1975)AND PORT OF SINGAPORE (1972 AND 1973)
Containership using container quay craneor conventional ship using ship's derrick Containership using ship's container crane
(Wholly using Port equipment) (Wholly using port equipment)Container tariff: Stevedorage Port Kelang PS.A. Port Kelang PS.A.including whzarfage per 20- __ _ _ _ _ _ _ _ _ _ _ _ _ ___ _ _ _ _ ___ _ _ _ _ _ _
foot-long container 1974 1975 1972 1973 1974 1975 1972 1973
FCL containerNormal (S$) 140 190 140 150 120 170 120 130Transshipment (one operation)
(S$) 110 140 100 80 90 120 100 60Normal/transshipinent (1.27) (1.36) (1.4) (1.88) (1.33) (1.42) (1.2) (2.2)
LCL containerNormal (S$) 260 330 180 200 240 310 160 180Transshipment1. Receiving from first carrier,
removal to CSF and un-stuffing (S$) 140 180 130 120 120 160 130 100

Normai/(transshipment 1) (1.86) (1.83) (1.38) (1.67) (2.0) (1.94) (1.23) (1.8)2. Stuffing same transshipment
container with export/trans-shipment cargo and reship-ping in second carrier (S$) 2600 3304 - 20Ob 240a 3100 __b 1800
Empty FCLReceiving (S$) 140 180 140 150 120 160 120 130Stuffing with break-bulk trans-
shipment cargo and reship-ping (S$) 140 180 _b 200 120 160 _ 180'
Stuffing with break-bulk trans-shipment and Malaysian exportcargo and reshipping (S$) 260' 330_ 200' 240 310 __b 180'
a. A rebate of S$4 per ton is given for every ton of transshipment cargo moved in a container.b. The break-bulk cargo shall be charged according to the transshipment/reshipment rates by tonnage for one operation only and
the container, including stuffing or unstuffing, shall be charged according to Tariff Item 56. This transshipment/reshipment ratewill not apply to Singapore cargo.
c. A rebate of S$3 will be given for every ton of transshipment cargo moved in a container.Sources: Port of Singapore Authority, PSA Tariff 1973 and Port Swettenham Authority, Scale of Rates, Dues, and Charges, By-
laws 1966 and By-laws 1975.

176 CHAPTER 7. COMPETITION AMONG PORTS
Second, competition expresses itself in the transshipment differ-entials and in the way they are being charged. Port Kelang thus offersa larger rebate for transshipment cargo to be stuffed into containerstogether with national cargo, and between 1974 and 1975 the differ-ential in favor of FCL transshipments was raised. For LCL transship-ments, which involve a great deal of labor in stuffing or unstuffingcontainers, the percentage differential adopted by Port Kelang wassubstantially greater than in the Singapore tariff. The absolute Singa-pore rate for this type of service is probably too low relative to Singa-pore cost but is being kept so low to win the business from privatecontainer freight stations. Kelang rates for this service are absolutelyhigher, but the size of the percentage differential indicates the im-portance of LCL trade in Malaysia as in most other developing coun-tries. The table further points to the sharp increases in the Singaporetransshipment differentials both absolutely and relative to normalrates; in 1973 rates for transshipment were lowered, but those fornormal container handling were raised.

Chapter 8
Multipart Tariffs
THE MAIN FEATURES of port cost functions are a large fixed cost and arelatively low variable cost up to the point where congestion reallybecomes felt. These features are even more marked for the newmethods of cargo handling such as containerization. The main ex-penses are the heavy charges for financing the substantial capitalrequired, and these are the same however much the port is used.
One of the main tasks of an efficient pricing system is to ensurethat use is extended where the cost is less than the revenue to beobtained. Thus the price for using the facilities should be suitablylow-and probably not much above the marginal cost of use. On theother hand, to the user of the facilities the total value per unit will beconsiderably larger than the marginal cost. This value to the user canbe extracted, at least in part, by levying a charge that is completelyunrelated to the extent to which the facility is used by him.
In the near future this form of charging should become more preva-lent since certain kinds of port facilities, particularly container ter-minals, are being overbuilt in the developing world. Since the mar-ginal cost will be very low, it is important to make full use of installedcapital. It would be inefficient to waste this large capacity.
General Problems of Design
In principle, charges should be designed so that one part (the fixedcharge) pays at least for the fixed cost of the facilities and one part
177

178 CHAPTER 8. MULTIPART TARIFFS
(the variable charge) is levied according to the use of the facilitiesand measures the marginal cost. The variety of fixed and variablecharges can be multiplied according to the number of specifiedservices.
The main difficulty with two-part tariffs is that often there is nospecific piece of plant associated with the supply of a service to aparticular customer. Port services are unlike, for example, electricityservices in the sense that the port does not install an end-distributionplant and a generating plant to supply all customers on demand, andmany of the steamship owners will call only very occasionally at aport and will not use these services regularly. Although in the de-veloping world, generally the greater part of traffic is handled byconference liners on a regular call basis, charges must be designedthat allow for the casual port call and the one-off visit.'
The obvious approach is to give the steamship owner the optionof paying for services on a two-part tariff basis or on an all-in chargebasis. But it will follow that the two-part tariff must produce acharge per call which is less than the charge for a casual call by atramp, otherwise the two-part tariffs would be ineffective. This ar-rangement will confer an advantage on the shipowners who call inregularly at the port as against the casual caller. However, this dif-ferentiation may do no more than reflect the cost advantages to a portof knowing that it has a regular subscription-list clientele. Withregular calls it is easier to plan a quay occupation schedule to avoidwaste and waiting. There is, therefore, good reason to arrange chargessuch that the regular subscription-list clients have lower overall chargesthan the casual visitor. Alternatively, the service may be differentiatedby negotiating booked quay space at the times specified and agreedso that the steamship owner is assured that there will be no waiting,wvhereas the casual visitor will have to chance incurring considerablewaiting cost. In this case the nominal subscription-list charge may beconsiderably larger than the casual tariff, but the difference is morethan overcome by the differential quality of the service provided.
The possibility of covering cost without simultaneously restrictingthe use of facilities forms the main traditional case for a two-parttariff. But the method possesses further advantages. The flat chargeof the two-part tariff can be used discriminatively to implement poli-
1. The casual caller is likely to be a tramp or bulk carrier and thus providesthe very important competitive constraint on conference pricing.

POSSIBLE DESIGNS OF MULTIPART TARIFFS 179
cies on welfare or income distribution, once again without majoreffects on the use of the things that are thus priced. The flat charge canthus be varied between different classes of vessels (for example, be-tween liners and tramps or between cartellized and independent linersinsofar as they can be distinguished) or between different classes ofthe port's customers. Changes in an all-in charge, on the other hand,can be undertaken to affect either the use of resources or the distribu-tion of income between different groups of buyers but not usuallyboth at the same time.
Possible Designs of Multipart Tariffs
The main problems in designing systems of two-part tariffs is torelate the elements of the charge to some easily observed measurethat, at the same time, reflects the cost. Principles must be compro-mised by practical possibilities.
Lease-a-quay (LAQ)
Probably the most extreme form of two-part tariff is in the lease-a-quay (LAQ) system. The port authority simply would build thefacilities and then rent them out to either a single user or to a con-sortium on an annual basis or on a longer term lease with reversionaryclauses. Normally the rent would be quite independent of the extentto which the facility is used, although there may be a clause in thecontract to allow for use intensity. Such LAQ arrangements are nor-mally associated with the exclusive use of the quay by the steamshipcompanies' staff and equipment, and the steamship company wouldlook after its own quayside services.
A charge will be made for any nonquay services supplied by theport authority. If the nornquay facilities are not congested and do notinvolve resources-perhaps the most obvious example is the channel-then any such charge should be included in the lease arrangementsfor the quay. If, on the other hand, the services do involve the useof resources, then they can be charged according to the principles inChapters 5 and 6. Perhaps the most obvious examples are the use oftugs, storage outside the quay area, and special port equipment.
The most important advantage of this arrangement is that thesteamship owner may adjust his use of the port facilities to minimize

180 CIHAPTER 8. MULTIPART TARIFFS
his cost. If, for example, the quay would otherwise lie unused, he willregard the marginal cost of using the quay as zero, and so he will beinduced to use the service as a free good. Similarly he will not bedeterred from shipping goods through the port because of any goodslevy over and above the marginal cost of the carriage.
The second advantage of such an arrangement is that it may usethe incentive of private profit to enhance efficiency. Port authoritiesare not generally under the same compelling pressure as firms in acompetitive environment to seek the least-cost method of deliveringthe services. Ports tend to be either less efficient labor managers thanprivate employers or else more vulnerable to political or organizedpressure.2 The leasing arrangement thus makes possible an amicablecombination of public ownership and private efficiency.3
The main problem with the LAQ system is that it only can beapplied in a few situations in developing countries. The most obviouscases are specialized commodity or trade quays, such as for timber(as in Malaysia, for example), cement, grain (Chittagong), or bulkfoodstuffs or oil. In many cases the quay is restricted to one user orconsortium. Ownership conditions may vary considerably; some buya freehold interest in the port and build their own quay and facilities.In principle the port exercises no control over the quay and its use,although, in practice, the port will often exact a small fee per ton asin the Singapore oil facilities. Such an annual payment will be capi-talized as a negative value in the contract, and the port will gainnothing except some insurance that it will share in an unexpectedincrease in trade with the obvious corollary that it will suffer fromunforeseen declines.4
LAQ schemes also operate between a port and shippers. Petroleumfacilities leased to oil companies are perhaps the most prominentexamples, but there are many other instances of jetties or other parts
2. In Singapore, for example, conventional vessels tend to turn around fasterin the roads than in port. This discrepancy is attributed to the fact that cargooperations in the roads are by shippers' labor and that shippers control their labormore effectively than the port, which pays labor by the tonnage of cargo worked.
3. A corollary of this is that the port authority must recognize that the steam-ship owner may earn substantial profits from his port operations.
4. The fact that the governments of developing countries with more or lesssubstantial monopoly ports do have great power over firms that have sunk theircosts in the facilities is excluded from consideration. Withdrawal would be ex-tremely costly.

POSSIBLE DESIGNS OF MULTIPART TARIFFS 181
of ports being let to private or public sector shippers. In La Goulette,for example, the bulk grain facilities were leased to the governmentrnonopoly in charge of cereal marketing.
The LAQ system also has been used extensively for container quaysand terminals, but virtually all the examples are in developed coun-tries. Probablv the most notable are the Sea-Land operations at NTewJersey, Seattle, and Hong Kong. These require an enormous flow oftraffic-far greater than appears in the countries of the developingworld. Most of the large ports in the developing world will requireonly two container berths at most. It would usually be unfeasible-and even if feasible, undesirable-to reserve one berth entirely for onecontainer firm.
The main objection to an LAQ system in developing countries isthat it would surrender some of the monopoly power of the port toforeign steamship owners. Consider, for example, the most likelyarrangement in the port of a developing country that offers a quayfor rent on, say, a 5-year contract. If that rental is advantageous tothe lessee, it will be so only because he manages to secure a largeenough part of the market for shipping services to assure intensiveuse of the quay. This can be achieved by eliminating competitioneither by mutual agreement or by aggressive practices. The single-userberth will ensure that the steamship owner has more power to excludepotential competitors. Even if the contract specifies that the lesseernay sublet the berth to other users, this will not generally limit hispower since control is still vested in the single firm. It is possible tostipulate in the contract that the lessee be required to offer the berthto third-party steamship owners for specified fractions of the time atspecified prices. But there are obvious difficulties in securing a suitableform of agreement and of enforcing it.
The monopoly power of the shipowner might be thought to belimited by the fact that the lease was offered for sale on a competitivebid basis. But this is not so. First the bidding is unlikely to be com-petitive since it would be easy to organize collusion, at least in linertraffic (including container ship traffic) on the pattern of the existingconference. Furthermore, approaches by potential lessees come atlong intervals and have to be treated one at a time and occasionallyin the knowledge that if no agreement is reached, the company mayset up facilities in another port: the potential lessee frequently suc-ceeds in making the potential lessors compete with one another.
But even if it were possible to arrange competitive bidding, thismerely would ensure that the successful bidder did not secure mo-

182 CHAPTER 8. MULTIPART TARIFFS
nopoly pTofits from the berth. He would be induced to pursuemonopolistic policies to earn the surplus necessary to pay for the lease.However, one of the basic objectives of the LAQ system will beachieved since the lessee will regard the payment of the lease as afixed cost, and he will be induced to seek traffic provided that themarginal revenue covers the very low marginal cost up to capacity.The structure of charges will induce him to expand output well be-yond what he would produce under the single charge or single feesystem. The LAQ system, therefore, is particularly useful when thereare commodities, such as timber, which move in sufficient quantitythat a country may require several of these quays and jetties whichwould compete with one another or with overside loading.
In the container field and perhaps in other specialized unitizedcargo handling systems, the opportunities for the LAQ approach arelimited by the small size of the market. It is likely, however, that thepotential for LAQ will grow partly because of the growth in worldtrade and the increasing use of containerization but also partly be-cause of the concentration of port facilities. The example of HongKong and Singapore is of interest here. Hong Kong and Singaporecompete for the role of main terminal for the large container vessels;the offer of an LAQ arrangement is, undoubtedly, an importantbargaining counter in securing the traffic. With the annual growth ofintemational trade at 5 or 6 percent, other countries will find thattheir ports, when suitably concentrated, may be able to offer LAQcontainer arrangements. Therefore, LAQ arrangements have limitedapplicability in developing countries, but their potential importanceis likely to grow.
Leasing arrangements are quite frequently contracted for facilitiesother than quays and berths such as special cranes that the particularshipowner requires. In cases of this kind the customer usually paysfor and installs the equipment, leasing only the site and generalservices from the port. But the shipowner will try to put such equip-ment on his ship if at all possible. This enables him to use the equip-ment at any port and avoids the hostages to fortune and politicalchange involved in locating costly facilities on the premises of someforeign port. Shipowners tend more and more to install, for example,suitable cranes on their vessels. This is noticeable, for example, inKeppel Wharf at Singapore, where the ship normally is unloaded andloaded by the local port labor force using the ship's gear.
In general, the need for flexibility in patterns of operation and the

POSSIBLE DESIGNS OF MULTIPART TARIFFS 183
desire to give few hostages to fortune or politics inhibits the lease-a-facility system. Except for certain specialized and specific pieces ofequipment it is unlikely to provide a model arrangement for pricingin developing countries.
Annual fee to enter (AFTE)
Another way to introduce two-part tariffs is to provide an annualfee to enter the port. Once a steamship owner had paid his annualsubscription, he could enter the port for, perhaps, a low nominal fee,or if the port has considerable overcapacity, the visiting fee could bemade virtually zero. This sort of charging arrangement is particularlyimportant when the particular facilities are uncongested.
The AFTE case is best made with respect to the charge usuallylevied for dredging the port. The most common basis for this chargeis one of the traditional indicators of vessel size. The trend of expertopinion, however, is to relate this charge to the ship's draft, and draft,of course, is also correlated with the size or capacity of the vessel.Given the depth of channel, however, cost does not vary with shipsize, so there should be no difference in the dredging charge.5 Largevessels drawing a deep draft should not be penalized in favor of smallvessels. However, it is commonly suggested that since the channelwas dredged deeper especially for the larger vessels, somehow theirwillingness to pay for the additional dredging should be tested. Andthere is no better test of willingness than to see if, when actuallycharged for the additional dredging, they continue to use the channeland do not bypass the port. But if it is to be at all useful, the will-ingness-to-pay criterion is required before the decision is made todredge. Evidence after the fact is of little value except for analogousdecisions in related ports. In any case, the correct criterion of willing-ness to pay should not be formulated in terms of a payment for eachuse of the channel; the users will normally prefer to pay AFTEannually for unlimited use of the channel.6 Commutation of user feesgenerally will be a much more efficient way both to measure the
5. See also A. A. Walters, "Marginal Cost Pricing in Ports," The Logisticsand Transportation Review, vol. 12, no. 3 (1975).
6. This point has been argued and developed in A. A. Walters, Economicsof Road User Charges, World Bank Staff Occasional Papers, no. 5 (Baltimore:Johns Hopkins Press, 1968).

184 CHAPTER 8. MULTIPART TARIFFS
willingness to pay and to use the channel.7 But still such commutationfees will, in any case, usually provide a rationalization after the chan-nel exists, although in a limited number of cases where there is asingle dominant user, the contracts can be entered into before theconstruction is undertaken.
Several questions have to be settled at the outset when designingtwo-part tariffs of the AFTE type. The first is whether the chargeshould be levied only on the shipping firm (covering a specific listof vessels) or whether it should also be paid by a wider group suchas a conference or container consortium in respect of all their mem-bers. In one sense, this issue does not matter provided that the shipsthat are entitled to use the specified port services are listed anddefined precisely in the agreement. Nevertheless, the more vesselsadmitted under the aegis of the AFTE, the greater the advantage tothe constituent firms or conference.
The second question is how to calculate the standing charge. Onenatural approach is to levy the standing charge on the basis of theprevious years' history. This is the way that such charges were fixedon the railways in Britain, and there is considerable administrativeexperience in arranging what were called agreed charges. The AFTEmust be fixed so that it is advantageous to the shipowner since it can-not be made obligatory without seriously discouraging occasionalcalls. Furthermore, it should not be revised yearly on the basis of lastyear's traffic, because then it would merely amount to a discount onactual traffic but paid with a delay of one year. Contractually it mightbe best to revise it every 3 years on the basis of (say) 6 monthspicked at random throughout the year, duly allowing for any seasonalvariation. The AFTE as a charge per ship, nevertheless, should declineas the number of visits of ships increases.
This suggests an alternative way to introduce a modified form ofthe AFTE. Ships may receive a discount according to the num-ber of visits they make; alternatively, the port authorities mayoffer to sell packages of ten visits during the yvear. Since quantity
7. The annual fee will not deter the steamship owner from using the channel.This is appropriate since the cost to the port is virtually zero, and so he will beable to extract the maximum services from the facility. This will in turn inducehim to make a maximum annual bid for the right to use the channel, and sothis will better measure his willingness to pay. In practice, such commutationfees must be combined with a system of daily fees.

POSSIBLE DESIGNS OF MULTIPART TARIFFS 185
discounts are not at all uncommon in shipping arrangements, thiswould be easier to administer than the strict AFTE method. Even so,there are problems: should the quantity discounts be specific to aparticular ship, to a particular firm, or to a conference? The transfer-ability of the right to a discount must be limited in one way or an-other, otherwise there would be a secondary market in port rights;this would simply let the single price system in through the backdoor. If the quantity discount were made available to the conferenceas an entity, there would be some considerable additional advantagegiven to a firm that belonged to a conference. This could be offset bya conference registration fee which would then entitle the conferenceto the greater quantity discounts.
There are certain disadvantages to such AFTE arrangements. Per-haps the most serious is that the scheme is likely to confer someadvantage on the large user. It might also be thought that the regularuser will gain: the liner services on which the trade of developingcountries tends to depend so heavily against the tramp operator whohas a small share of the trades. In practice, this will often be true,but not always so. In the case of chartered vessels-tramps or bulkcarriers-the large charterer who plans to bring vessels reasonablyregularly to the port can then easily become the contractor under theAFTE scheme; in a later section the scheme is extended to him.Essentially, therefore, the scheme is biased towards the large user;although in practice often also in favor of the liner company andwithin that class it is biased towards the large operators rather thanthe less frequent or occasional callers. The liner conferences will thusbe certain gainers. Throughout this study, it has been stressed thatthe main safeguard for a developing country is the vigorous competi-tion of nonconference vessels. And any discrimination against suchnonconference vessels would add in some measure to the monopolypower of the conference. If, for some reason, this cannot be offset byrestructuring the charges to redress the handicap suffered by the non-conference type of vessels, then such AFTE arrangements may not beworthwhile. Furthermore, such quantity discounts will encourage theconference to make additional calls at the port. Although this will giveadditional frequency of service, the conference may take the oppor-tunity to exploit its additional monopoly power farther, perhaps usingthe usual rationalization that costs have increased.
The other main disadvantage of the AFTE is the administrativecomplexity. The only variant, without quite daunting administrative

186 CHAPTER B. MULTIPART TARIFFS
difficulties, is the quantity discount system where an owner buys ablock of services (say, ten port entries) and cannot transfer them.
To illustrate the working of a quantity discount AFTE system,figures from the port of Singapore can be used. The ship charges fora 6,000-ton GRT vessel entering Singapore in 1975 were about S$6,000(US$3,000). This is only about half of the total charge, amountingto, say S$17,000 for a cargo of 3,000 tons discharged. The quantitydiscount arrangement would charge for the first visit at S$9,000, forthe second S$8,000, and so on down to say a S$3,000 minimum. Thissystem would involve an increase of the total charges of about 19percent for the casual one-off caller and substantially reduced chargesfor more than seven calls each year.
The cost of port operations for the one-off casual tramp caller,which unloaded 3,000 tons, would increase from about S$5.50 toS$6.50 per ton-a rise of roughly US$0.50. And this would be re-flected partly in the tramp's cost and freight rates; only partly becausetramp services would be expected to reorganize somewhat to avoidsuch high charges, by using larger vessels or by accumulating biggerloads. Although this might appear to be a small amount per ton, itmight cause a significant reduction in tramp competition against theconferences and illustrates the point made above. On the other hand,however, the regular bulk carriers will benefit even more than theconventional conference vessels from the quantity discount arrange-ments.8 Consequently more competition would be expected from thisgrowing sector as a consequence of the change of pricing policy.Whether the cheaper bulk carriage will offset the conference's advan-tage must be a matter for practical judgment in particular cases.
In order to introduce a policy of quantity discounts, the followingguidelines are suggested. First, the charges should be calculated sothat the port revenues are increased, and certainly every precautionshould be taken to see that they are not reduced. In the illustrativeargument for Singapore, it seems likely that the change suggestedwould result in a considerable increase in revenue, but more analysisis needed to make certain of this.
Second, the system should only be introduced if persistent excesscapacity for some time-say, more than 1 year-is likely. In manyports of the world this is liable to be the case. In the Singapore exam-ple, with excess capacity, the charge of S$3,000 for the marginal vessel
8. Stevedoring charges are a much smaller fraction of total port cost per tonwith bulkers than with conventional vessels.

POSSIBLE DESIGNS OF MULTIPART TARIFFS 187
is probably still considerably above the marginal cost of dockage andstandby.9
Third, the quantity discount system is probably most useful whenthe business of the port is dominated by a handful of conferences,as in the case of Bangkok. This is the usual situation in developingcountries; in this respect, Singapore is an exception. Then suitablequantity discount schedules may be agreed on with the whole con-ference.10
Container clharges
The most important application of the two-part tariff and the quan-tity discount is in container operation. This results from a combina-tion of factors. The first factor is that there is considerable over-investment in container facilities, particularly in developing countries.It is remarkable, but perhaps not surprising, that the ports of Kelangand Singapore were not making any profits on their container instal-lations. The state of Kelang's container accounts is not astonishing,but it is surprising that even as large and as vigorous a port authorityas that of Singapore with all the geographical advantages of her loca-tion could not make an adequate return on capital invested.-'
The second factor is associated with this unprofitability; there isconsiderable competition between ports for container vessels andservices. Ports with existing container installations have little bar-gaining power, as is demonstrated by the competition between Singa-pore and Hong Kong.
The third factor is that unit cost declines rapidly for any use sub-stantially below capacity. As shown in Chapter 3, the marginalcost is very low compared with average cost. For example the marginalcost of handling a container may be only $1 to $2 compared with anaverage variable cost of $6 to $10. These are often associated with portcharges of $30 to $60 for handling a container.
The rationalization of such a markup over cost is that, because of
9. Singapore is one of the ports where there is now little or no excess conven-tional capacity, but the building of Pasir Panyang as well as the extension ofother facilities is likely to create some in the near future.
10. In those circumstances also it often appears that the frequency of serviceis a most important variable for traders. The quantity discount system wouldencourage greater frequency of sailings and so improve the service.
11. This is taken to be a true statement of the situation even for the periodbefore the recession of 1975.

i88 CIAPTER 8. MULTIPART TARIFFS
the faster turnaround of container vessels, the container carrier, oftena consortium, enjoys a considerable reduction in his cost. The sizablemarkup is explained as a way to recoup some of the advantages ofcontainer operation for the port. The container operator will still bewilling to offer a service provided that the cost is less than the con-ventional alternative. If the port authority is not too greedy in raisinghandling cost, the port and the operator will share the benefits.
But port authorities discourage the development of containerizationby such a high markup. This may be of little consequence. Con-tainerization may be so advantageous that it is worthwhile paying thehigher handling charge for virtually all cargoes; this approximates tothe case in Seattle where all general cargo is now containerized. Butin many ports this is not so; conventional operation is often importantand continues as the dominant form of handling alongside somecontainerized cargoes on certain routes. The port handling charge isan important factor in determining whether or not to containerizecargo.
The most compelling considerations, however, are the very largeeconomies of scale in container operation. As the number of con-tainers increases, there are dramatic reductions in the average handlingcost primarily because of the more intensive use of equipment. It isimportant not to inhibit in any way the realization of these economiesand so to encourage the containerization of marginal cargoes. Oncecontainer facilities are installed, the charges for container handlingshould be kept low enough to realize the economies of scale.
This suggests that the charging system should have a low variablecharge for handling, which is consistent with the low marginal costimplied by the economies of scale, and a fixed charge for the use ofthe port facilities by the consortium. The contract of the port withthe container consortium would specify the annual rent for the rightto operate a container service to the port.12 The two-part tariff willencourage the container firm to bid vigorously for additional trafficand to realize the economies of scale inherent in container operation.The fixed rental charge, however, will ensure that the country or portwill share in the advantages of containerization. If there is consider-able competition among container firms for the privilege of supplyinga port with containerized service-and there is evidence of this on
12. This payment is in addition to the real cost of renting any of the normalfacilities of a port that a container firm may require.

POSSIBLE DESIGNS OF MIULTIPART TARIFFS 189
certain routes-then the port authorities can extract much of theadditional profit of container operation by this method of charging.
This argument applies to specialized container facilities where nor-mally the ship carries only containers. There is no inherent reason,however, why the same system should not apply to the part-containership which is more common in the developing world. The fixed rentalcharge could be based on the capacity of the ships to carry contain-ers, whether they are carried or not. Then this would encourage thecontainerization of traffic, again assuming there is excess capacity inthe port's container facilities.
Shippers' license to use the port (LUP)
The port's charges to shippers could, in principle, be based also ona variant of the AFTE scheme. The most obvious application wouldbe to those shippers-often a well-defined group-who normally im-port or export theiT caTgoes on chartered vessels and who, therefore,exercise control over most of the shipping operation in port. Theprices of the various services available in the port to shippers whohave paid the standing charge could then be set as close as possibleto marginal cost. There also are less obvious extensions of the prin-ciple to shippers who use the port regularly. A nontransferable licenseto use the port (LUP) could thus be sold to shippers, entitling theholder to use the port's resources at prices equal to incremental vari-able cost. Once again the administrative problems are sufficientlygrave to make it worthwhile only where sizable excess capacitv exists.
The disadvantages of the LUP proposal for shippers are similar tothose of the AFTE proposal for ships. In order not to discourageoccasional shippers, it may be necessary to offer shippers the choicebetween regular charges and special charges available only to thosewho choose the two-part tariff. If shippers are to be attracted to theLUP system, it would have to incorporate a quantity discount whichmight be based on a shipper's total payments to the port for a pastperiod or, in the case of a new shipper, on a typical annual paymentmade to the port by shippers of small or medium size shipping similarcommodities. As in the case of the AFTE scheme, apart from index-ing for changes in the general price level, the flat or standing chargeshould be revised only infrequently.
If a quantity discount is built into the scheme, then, like AFTE,it may cause a bias in favor of large size and thus of concentrationand monopoly. But this may be regarded as less of a problem in the

190 CHAPTER 8. MULTIPART TARIFFS
case of two-part tariffs applied to shippers, especially in those coun-tries where foreign trade is already largely monopolized by publiccorporations. The difficulty of preventing resale of the LUP, however,is at least as great as it is under AFTE. Resale might be preventablewhere import and export licensing is being practiced but only at theexpense of additional bureaucratic activity. In the absence of suchlicensing, LUP could be confined to shipping agents, but again onlyat the expense of fostering concentration.
The difficulties of the scheme are clear; unless it can be policedadequately to prevent major evasion, its object will be frustrated. Thedisadvantage in the form of a stimulus to concentration may also beserious. But the advantages of two-part tariff can be great, and theseor alternative schemes merit close study and experiment.
Port Charges as a Percentage Levy
One of the main conclusions from the discussion of the two-parttariff is that it is difficult to apply to conventional vessels. There aremany problems of how to design the fixed charge so that unfortunateside effects are avoided. Perhaps the most important side effect is thatsuch multipart charges would favor conference vessels. Although spe-cial schemes of charges might be introduced to avoid such dis-crimination, there are great administrative complications, and it isdoubtful whether they would be worthwhile.
As an alternative there is a simple method of charging that wouldretain at least some of the desirable effects of the two-part tariff andthat avoids many of its pitfalls. This is to convert part (and in somecases even all) of the port charges into a percentage levy on the freightcharge; the port charge would be fixed at a constant fraction of thefreight charge. Thus the vessel calling at a port would make availableto the port authority (as they do now to the customs) the manifestof the goods to be unloaded or loaded, except that the ship's agentwould be required to leave the manifest, including the data on freightcharges, intact. The levy of the port authority would then be calcu-lated at (say) 10 percent of the total of the freight receipts.
There are many consequences of the fractional freight charge.First, the conference and other vessels will be encouraged to makemore frequent visits with smaller loads. It has been argued that con-ferences make too many sailings under normal port charging, thusthis system of charges may encourage this particular inefficiency.

PORT CHARGES AS A PERCENTAGE LEVY 19I
There are, however, good reasons for thinking that any such in-efficiency will be small because of the tendency to encourage ratecutting. In ports where the number of sailings seems excessive relativeto the average cargo tonnage, a disincentive can be built into thepercentage levy in the form of a discount based on the cargo tonnageper vessel. The fraction of the freight charge might thus decline from,say, 10 to 8½2 percent as the quantity of cargo per vessel increasedfrom 1,000 to 7,000 tons. Insofar as the largest loads will contain arelatively large element of homogeneous cargo, which is cheaper tohandle per unit than heterogeneous consignments, the discount willreflect the pattern of cost.
Second, one of the main advantages of a fractional freight chargeis that the steamship owners will be encouraged to reduce rates if,at the same time, one of their main costs-port cost-is reduced inequal proportion. The port charge will decline along with the priceas the throughput of a shipping firm is expanded by price cutting.The big difference between the fractional freight charge and theordinary quantity discount is that the latter awards the discount forall increases in quantity, whereas the fractional freight charge givesdiscounts only if the steamship owner reduces the freight rate. Thusit avoids all the administratively complex problems of deciding whatis the appropriate quantity measure and of policing such agreementsto avoid resale or other forms of masquerade.
Third, the fractional freight charge does discriminate against long-haul traffic. But such traffic is more likely to be cartelized than theshort-haul voyages. In terms of ability to pay the long-haul voyageshave greater potential. In addition, there is discrimination accordingto the value of the commodity as well as to the cost of carriage. Againthis would vary port charges according to ability to pay.13 It wouldalso be possible to favor transshipment cargo, which is normallyshown separately on the manifest. Insofar as the elasticity of demandfor port services by transshipment cargo is considerably greater thandomestic cargo, this may be considered a sensible way to raise revenueand to maximize the profit of the port.14
13. Some discrimination in favor of exports might be expected also. For ex-ample, the charge for exports may be considerably less than the import fractionalcharge. Although there is no reason to suppose that by rigging charges in thisway the foreigner will pay more than the domestic resident, governments areoften misled into bad policies by deceptive appearances.
14. See Chapter 7.

192 CHAPTER 8. MULTIPART TARIFFS
Fourth, the fractional freight charge would vary with oscillations infreight rates. When there is a slump, the freight, and so also theport charge, would fall; under boom conditions the port charge wouldrise. Broadly speaking this automatic movement of charges with thecycle is a good thing. Under slump conditions there is likely to beexcess capacity, and the marginal cost is likely to be very low. Theport charge would not be expected to vary nicely to reflect the mar-ginal cost of port operations over the cycle, but it is about the bestthat can be done.
Fifth, secularly the charge would tend to adjust automatically toany inflation of the general world price level. Freight rates, and par-ticularly conference rates, have generally risen with bunker, labor, andship prices. The fractional charge would reflect these variations. Ofcourse by the same token as in the argument above, the freight ratesmay not reflect exactly the inflation in the cost of the port, but thedeviation is likely to be small.
Sixth, characteristically this fractional freight charge moves awayfrom charges fixed according to cost, and this undoubtedly has dis-advantages. Where cost deviates greatly from normal, it is probablybest to arrange for special port charges. The obvious example of thisis the congestion charge. All port levies would be negotiated subjectto the overriding right of the port to impose a congestion charge onspecific facilities. Similarly the port should levy charges for the useof storage space or quay space beyond the period specified in thefractional charge tariff. The different vulnerability of different itemsof port services to congestion may serve as the criterion for selectingthose port charges that are to be compounded in the percentage levy.But the exclusion of conventional items of port charges from such ascheme diminishes its simplicity. A major question in the detaileddesign of a percentage levy is the extent to which the services of portlabor are to be covered by the fractional charge. This is a particularconcern for liners since the terms of carriage include a part of shorehandling in the freight charge. The nature of the best compromisewill vary from case to case, depending on the standardization of laboroperations, on the labor intensity of cargo operations, and on theextent to which the port's labor is casual or a fixed force.
Seventh, the simplicity of the fractional charging system is itsgreatest asset. It requires neither a knowledge of all costs nor a detailedspecification of port operations. With all its disadvantages it pos-sesses built-in flexibility. Furthermore it is easily understcod and,

PORT CHARGES AS A PERCENTAGE LEVY 193
congestion apart, everyone will know how the charges are going tovary for some time ahead. There will be no sudden jumps in chargesto catch up with inflation, and the adjustment should be smooth.
There are many problems about the appropriate way to introducesuch a charging system. Probably the most acceptable way is to calcu-late charges, preferably just after one of the periodic increases, on thebasis of the traditional tariffs and then to offer the steamship com-panies the same total freight payment (less a small discount as aninducement) calculated as the fractional freight charge. The secondquestion is whether there should be some minimum payment per ship.It seems feasible to design the tariff so that each ship pays a minimumof, say, $400 per visit to the berth. Arrangements already exist in Bang-kok, Singapore, and Kelang for charging ships that merely put intoharbor.15
There may be many other, perhaps undesirable, side effects of sucha system of fractional charging. First, it may encourage cargo to besent to neighboring ports and transshipped on a short feeder route toits destination port where the fractional freight rate charging operates.There might be some artificial distortion of the pattem of oceantransport. (However, as in the case of Singapore, Kelang, and In-donesian ports, governments often discriminate, on what seem to bedoubtful arguments, in favor of direct services; the short-sea-route biaswould offset this.) Second, it might lead to incorrect recording of thefreight charges to secure a lower port charge. It is difficult to see howthis would upset the port's charges, however, since characteristicallythe conference liner would be tempted to show charges greater thanthose that are actually paid; any chiseling would not be revealed in themanifest, which would record the agreed conference freight rate. Thechiseling conference member will have an incentive to report thehigh rate and to pay the higher port charge. Third, the charge maybe difficult to apply to certain tramp vessels that may be on charterhire and where no specific freight rate is charged for identified cargo.The problem is not likely to be important in the case of an arm's-length charter, where the charter party includes the rate and is as
15. There are, however, good reasons for keeping such charges very low whenthere is no risk of congestion. The nationals will benefit from the purchases ofbunkers, stores, and services made by the ship, and the corresponding increase inthe surpluses of nationals is a pure gain.

194 CHAPTER 8. MULTIPART TARIFFS
easy or as difficult to inspect as the liners' freight revenue. But whereimporter and exporter are closely related (and all the more where oneof them owns the ship), the problem of transfer pricing is likely toarise. The rate may have been chosen at the convenience of theaccounting system. The natural procedure is then to charge the con-ference freight rate or altemative tramp rates to calculate portcharges; but there are many other alternatives that might be used.
Last, in this review of practical questions, different percentageswill have to be fixed for freight charges covering different ranges ofservice. Conventional port-to-port service on liner terms is standard-ized as regards the services to be rendered by the shipowner to theshipper, and this makes conventional liner traffic a good candidate forthe fractional scheme. By contrast, a great variety of terms can befound in charter contracts and in container carriage. Containers maybe stuffed and stripped in the port, at freight stations outside theport; or at shippers' premises. Container traffic is thus characterizedby additional labor services and at least some inland transport onthe shipowners' account. The administratively feasible solution tothese problems will depend much on local circumstances.
Concluding Comments
From all this discussion it emerges that no simple scheme can beapplied to all port charges. Cost, in the sense in which it has beendefined, provides only the floor on which a tariff system should beerected. The outline of this system must depend on judgment ofthe extent of competition and of the opportunities for generating orkilling traffic and trade. However, such systems will be difficult todevise and complex in their form. This is the rationale for seekingsome simple rule-of-thumb such as the fractional-freight-chargemethod.
In practical cases of existing port tariffs inconsistencies, absurd dif-ferentials, and gross discrimination exist based on political favor ratherthan on the economic advantage. This suggests that even using thebasic principles of cost and comparability, there is ample room fortariff reform. A start can be made easily. There is no need to wait forthe formulation of any of the methods of charging outlined above.Yet even when the tariff reform program has just begun with the

CONCLUDING COMMENTS 195
elimination of absurdities, the various systems do provide a frameworkto give direction and an objective for designing new tariffs. As withall reform proposals, the best must never be allowed to emerge as theenemy of the good.

Chapter 9
Port Pricing in Practice
TiH ULTIMATE TEST of the usefulness of principles is whether theyare practicable; and this test cannot be performed in the confines ofthis study. Not only would it demand the simulation of a completesystem based on a realistic case study, but in addition the cost ofchange and its optimal phasing would have to be assessed. A test ofpracticability obviously should be the next step after the considera-tion of principles, but it remains a separate task.
However, the meaning of at least some of the propositions in thisstudy can be clarified by applying them to concrete examples. Thecases were selected from the port tariffs and procedures of fourSouth and Southeast Asian ports: Singapore, Kelang, Bangkok, andChittagong.'
1. Port of Singapore Authority, PSA Tariff 1973 (Singapore, 1973). PortSwettenham Authority, Scale of Rates, Dues and Charges By-Laws, 1966, incor-porating all amendments up to April 18, 1974 and By-laws, 1975 (proposedamendments of charges). Port Authority of Thailand, Tariff of Port Charges,Port of Bangkok, 2d and 4th ed. (Klong Toi, Bangkok, 1966 and 1974). Coopersand Lybrand Associates Limited, Report on the Tariff Review, (prepared for thePort Authority of Thailand) (London, January 8, 1975). W. D. Scott and Co.Pty. Ltd., Final Report: Port Operations Consultancy Services (prepared for thePort Authority of Thailand, Port of Bangkok, Klong Toi, Bangkok. Sydney, June1973; processed). Chittagong Port Trust, Schedule of Charges on Goods andVessels (corrected up to notification no. CAO-IV(98)/7534, January 29, 1975).Bangladesh Gazette (Chittagong, 1975). Government of Pakistan, Ministrv ofCommunications (Railway Division), General Rules and Schedules for Working
196

THE BASE OF PORT CHARGES 197
The Port of Singapore is large by international standards with muchtransshipment and transit business and a marked excess of inboundcargo (Table 9.1). Port Kelang competes with Singapore for Ma-laysian traffic and differs from the other ports in that it handles some-what more exports than imports. Bangkok, the chief civilian port of acountry larger than Malaysia, is a river port with a pronounced excessof imports and a past history of shed congestion. Chittagong, a riverpOrt that had the lowest number of calls and cargo tonnage amongthe four ports in 1974, is predominantly an import port with greatproblems of cargo clearing and a history of severe shed congestion.
Comparisons between the tariff policies or the tariffs and thecharges are not made because of the dissimilarities between the tariffsand the economic and technical situation of the ports. Their pricingrules will merely be used as realistic examples, and not surprisingly,those rules which appear on the surface to conflict with the proposi-tions in this study will be given the most attention.
The Base of Port Charges
For ports operating in competitive conditions, the base of theircharges is the single most important consideration in the design ofthe tariff. A wrong choice in this matter will distort the use of theport by setting up a bias in favor of relatively costly methods of usingthe port.
Channel dues and berth hire
The first example is the base of channel or port dues (the entry feeto the port) and of berth hire. A very common base for both is theship's net registered tonnage (NRT); Bangkok uses this measure forits channel dues and wharf rates (dockage), and Chittagong uses it
of the Chittagong Port (Railwvay) Jetties (in force from January 1, 1959), Gazetteof Pakistan (Karachi, December 15, 1958, with amendments). Louis Berger Inter-national Inc., "Feasibility Study, Port of Chittagong Expansion, Bangladesh,"(study prepared for Asian Development Bank), vol. II (December 1974).Economist Intelligence Unit in association with Scott Wilson Kirkpatrick andPartners, Bangladesh Transport Survey, Final report (prepared for the Govern-ment of the Peoples' Republic of Bangladesh under assignment by the OverseasDevelopment Administration of the Foreign and Commonwealth Office) Part 9,Management and Financial Studies (London, November 1974).

198 CHAPTER 9. PORT PRICING IN PRACTICE
TABLE 9.1. FOUR PORTS IN DEVELOPING ASIA: INDICATORS
OF OUTPUT, 1974
Number Imports Exports Total cargoof (million (million (million
vessels tons) tons) tons)
Port of SingaporeShip calls' (over 75 NRT) 19,629Cargo handled (freight tons) 37.7 22.8 60.5
Dry (9.1) (5.7) (14.8)Oilinbulk (28.6) (17.1) (45.7)
Port KelangShip calls 3,170
Foreign going and con-tainer ships and tankers (2,524)
Cargo handled (long tons) 2.7 2.9 5.6Dry cargo (2.0) (2.2) (4.2)Over authority's facilities (2.4) (1.9) (4.3)
Port of Bangkok (provisional)Ship calls 4,330Cargo handled (measurement
tons) (authority's instal-lations) 8.6 2.4 10.0
Dry (3.5) (2.4) (5.9)Petroleum (5.1) (5.1)
Port of Chittagong(July 1974-June 1975)
Ship calls 749Cargo handled excluding 4.2 0.3 4.5
bulk oil (3.0) (3.3)
a. One-half of arrivals and departures of vessels.Sources: Port of Singapore: Port of Singapore Authority, Report and Accounts
for the Year Ended 31 December 1974 (Singapore, 1975), pp. 52-56. PortKelang: Kelang Port Authority, Annual Report 1974 (Kelang, 1975), pp. 33-45.Port of Bangkok: Port Authority of Thailand, Port Operations Department, PortOperations Statistics 1974 (Bangkok, 1975), and information supplied by Minis-try of Communications, Royal Thai Govemment, Bangkok. Port of Chittagong:Chittagong Port Trust, Statement of Cargo Handled at Chittagong Port duringthe Period from July 1974 to June 1975 (processed), pp. 1-4 and Budgetestimates of income and expenditure for 1975-76 with revised estimates for1974-75 (Chittagong, 1975), pp. 1-2.

THE BASE OF PORT CHARGES 199
for port dues. But the NRT of ships can be varied enormously byquite small changes in ship design and in dead weight tonnagewithout affecting the port's cost of servicing the ship. NRT is thusaltogether unsuitable as a base for port charges. A popular alternativeis gross weight tonnage. Singapore uses it as the base of port and lightdues and of dockage, and Kelang uses it to determine the minimumwharfage for ships alongside the wharf.2 GRT is less open to abusethan NRT, but the correlation with cost is again not at all high; noris there a good correlation with cargo carrying capacity.
None of these ports use length of ship as the basis for entry fees orberth hire. This seems an unequivocal and easily ascertainable meas-ure, clearly related to the cost of providing quay length or maneuver-ing basins, but it is rarely used by ports.3 A ship's draft might bethought to be another reasonably efficient basis for port dues or berthhire, but there are measurement problems, and a ship's actual draftmay vary widely from its maximum.4
Fundamental issues in fixing the base
The choice of base for channel dues as discussed so far hinges onthe avoidable cost of port services. Whichever characteristic of a shipbest indicates variations in port cost caused by different ships shouldbe chosen. The choice of base for berth hire can be examined in thesame light. In particular there is the question whether the charge forusing a berth should vary with measurable characteristics of the ves-sels, such as NRT or DWT or draft, or whether the port should fix adifferent rent for different berths. The latter solution has beenadopted at Hong Kong and at Chittagong where it has caused objec-tions by shipowners and consultants.5 If the cost of servicing shipsdiffers more between a port's berths than within any berth, then berthhire should, of course, differentiate between berths, whatever else itmay be doing in addition; and the simplest system may be to setdifferent prices for different berths.
2. At Kelang, wharfage is the equivalent of cargo dues in other ports.3. Haifa and Ecuador are ports that charge berth hire by length.4. In Rotterdam, the prevailing method of charging is by the actual draft or
the depth of the water in the dock. This has the disadvantage that the port maybe tempted to direct a small draft ship into a deep water dock.
j. Louis Berger International Inc., "Feasibility Study, Port of Chittagong Ex-pansion, Bangladesh."

200 CHAPTER 9. PORT PRICING IN PRACTICE
But what if the port's costs do not vary with a ship's NRT, DWT,or draft, or according to which berth the ship occupies? As discussedin the earlier chapters of this study, the cost to be reflected in pricesis short-run marginal cost. The case can be dealt with easily wheremarginal cost as reflected in the ports accounts does not differ be-tween different berths but where berths differ significantly in theconvenience of using them. Some of them will then fill up regularlyat times of high demand before the others are taken up. The scarcityrent generated by the convenient berths should then be appropriatedby the port through differential pricing of berths, just as expoundedin Chapter 4. Whenever one ship would be willing to bid againstanother for the use of a berth at a particular time or where one shipwould be willing to bribe another into letting it use a particular berth,the port would be justified in appropriating this surplus if it can doso without incurring a cost greater than the prospective gain.
That leaves other cases where there is neither excess demand fora particular berth nor any noticeable difference in the port's privateshort-run marginal cost of operating different berths. (For simplicityassume these costs to be zero across all the port's berths.") This casemay describe very well the situation envisaged by tariff makers inmany ports. To deal with this case the discussion in later sections ofthis chapter must be anticipated. First insofar as cost is concerned,there is no argument in the case for charging different amounts fordifferent berths or for different NRT or DWT. The use of each berthproduces the same variation in port cost. Second, with positive fixedcost and zero marginal cost for operating the berths, what chargeshould be levied for the use of berths and channel; should they differas between users and, if so, what should determine the differences?If the port is not perfectly competitive, it could of course raise someof its charges above marginal cost without driving ships away. In thatcase it should load fixed costs onto those charges which ships couldnot avoid if they wish to enter the port at all; in other words, the portshould avoid any distortion in the use of its resources. The port maythen decide to levy these loaded charges according to the ship's abilityto pay, and this ability can often be correlated with certain technicalcharacteristics of the vessel or with the length of its voyage. But aspointed out in Chapter 6, a mere exploitation of the ability to pay
6. This situation is not difficult to imagine for a port which does not levyinclusive charges but prices different operations such as labor, cranes, berthingservices separately.

THE BASE OF PORT CHARGES 201
may not be the optimal policy for a port in this situation. A concreteexample is a berth that is particularly suited for loading or dischargingbulk cargoes. Vessels taking bulk cargoes-bulk carriers or just tramps-tend to operate more competitively than general cargo vessels. If thepolicy is to encourage competition among the vessels serving thecountry's trade, lower rates should be charged for the berths suitablefor bulk trades than for the standard general cargo berths.
Further consideration of the base: the case of handling charges
The normal basis for cargo handling charges is the unit of cargo,for example, tons. But if the ship causes delays to cargo movement-perhaps because it is not designed for cargo handling at the averagerate of the port-the optimal basis of the rate would be time ratherthan tonnage. Charges based on tonnage are indeed sometimes com-bined with penalties for slow movement.7 But labor charges basedsolely on time, for example, rates for labor and clerks charged to shipsat Kelang, have all the disadvantages of cost-plus pricing except ifthe party which pays the charge can also control the labor operations.8
Port traffic managers agree readily that tariffs should be designedto attract certain types of vessels into their wharves-particularlyvessels which allow a fast movement of cargo. Port and berth duesshould thus act as an incentive for quick turnaround. As the port'sability to clear ships increases, it can strengthen this incentive. But adistinct incentive is required for the optimal use of distinct services;if the port's labor force or wharf equipment complementary withlabor are fixed factors of production, tariffs should encourage theirefficient use. This consideration argues for basing labor charges onboth the quantity of output and the rate of output. Naturally such asystem is less convenient than a charge based on a single criterion;it would require a multiplicity of scales (for example, charges for 10,15, or 20 tons per hour at rates which rise in lesser proportion than thetonnage). It is true that in many ports or wharves the average shipcan move cargo faster than the port can; this accounts presumably forshipowners and shippers everywhere preferring to employ their ownlabor whenever the rules permit. But there is nothing in this situation
7. This is the rule in Pasir Panjang (Singapore) which serves coasters andlighters.
8. Port Swettenham Authority, Scale of Rates, Dues, and Charges, By-laws,1966, incorporating amendments up to April 18, 1974.

202 CHAPTER 9. PORT PRICING IN PRACTICE
that should argue against labor charges being graduated by the rateof working; the scheme would never work to the disadvantage of themore modern ship. The counterarguments are just the administrativeinconvenience of the scheme and the possibility that it might enlargethe scope for undesirable practices by labor or by those who control it.An alternative method is to set minimum rates of working belowwhich the vessel incurs penalties or is banished from the wharf.9 Thissuffers from the weakness that it provides a discontinuous incentive,unlike, for instance, a charge for space occupied by cargo. A superioralternative is the Port of Singapore's dockage remission coefficient.The dockage charge within the main conventional harbor at Singa-pore (Keppel Harbor) is thus abated according to the total cargoloaded or discharged per unit of time.'0
Marginal-Cost Pricing: Charging for the Useof the Uncongested Channel
Dredging cost is often one of the most important costs of main-taining a port, sometimes as much as one quarter of total port cost.There are two main issues connected with dredging. First there isusually a choice in the depth to which the channel is dredged-thedeeper the water, the larger the ship that can use it and usually thelower the cost of shipping. Second, there is the problem of choosinga method of financing the additional dredging cost; obviously somecharge on ships should be made, but there are many possible choicesof dredging levy. In practice channel dues are often levied accordingto the NRT or GRT of the ship; thus the larger ships pay the higherdues. But NRT and GRT are only related indirectly and inaccuratelyto the allegedly significant factor in the use of the channel. The draftrequired by a ship is thought to be the best measure by which to levychannel dues. The deeper the water required by the vessel, the moreit should contribute to the total dredging cost of the channel.
9. In the Pasir Panjang wharf at Singapore, coasters incur a penalty if theywork at less than 15 tons per hour per hook. At Chittagong, the authority mayorder a vessel off the jetty if it is working less than 400 tons per day.
10. Port of Singapore Authority, PSA Tariff 1973, Item No. 13. The abate-ment is made in accordance with a dockage remission coefficient, which variesdirectly with the amount of cargo and inversely with time alongside and the GRT.Remission is given when the coefficient exceeds a minimum value.

MARGINAL-COST PRICING 203
The criterion for the best channel depth does depend upon thec:harging practices actually used to finance the expenditure on dredg-ing. Furthermore the dredging may be considered a good thing bythe world as a whole, but for the national interest, the issue is simplywvhether the net benefit accrues to residents, including the portauthority. If the dredging is primarilv to permit bulk carriers to usethe port, then the lower cost of the bulkers generally will be passedon to the shippers; and for most developing countries, as arguedabove, these would be in the form of increased export prices andreduced import prices. Similarly any dredging charge would be shiftedvirtually intact to domestic nationals. This simplifies the incidenceanalysis greatly. But there are many ways to levy the dredging chargethat have markedly different effects on the vessel composition of theservice to the port.
It is normal practice for economists and management consultantsto advise that the vessels requiring the deepest draft of the channelshould pay for the additional cost of dredging. For example, if thechannel is dredged to clear 40-foot vessels yet only (say) twentyvessels drawing 40 feet of water pass through the channel in a year,whereas all the others draw only 30 feet, then the twenty vesselsshould bear the cost of dredging the channel from 30 feet to 40 feet.T his is thought to be some sort of principle of marginal cost pricing;those vessels that cause the cost pay."
While such debates have substance for issues of equity and abilityto pay, they are irrelevant for marginal cost pricing. Once a channelis dredged, or once it is decided to maintain a channel at a certaindepth, then, unless the channel is congested, the marginal cost of thepassage of a vessel, of whatever draft, is virtually zero. It is true thatthe wash from the larger or deeper or faster vessels may create condi-tions that require more frequent dredging to maintain the channel,but the evidence suggests that such additional dredging is minor
11. Ian Heggie, "Charging for Port Facilities," journal of Transport Economicsand Policy, vol. VIII, no. 1 (1972), pp. 15-16. This method of charging wasaiso thought best by the U.K. Docks and Harbour Authorities Association. Theprinciple seems to have been accepted also by the consultants advising on thetariff of the Port Authority of Thailand (Coopers and Lybrand AssociatesLimited, Report on the Tariff Review, Appendix G3). Such studies often pointout the difficulties with levying charges according to actual draft. This value isdifficult to interpret and to measure. And even though maximum draft figuresare available from Lloyds, their relevance might be reasonably disputed when avessel uses a port only half laden.

204 CHAPTER 9. PORT PRICING IN PRACTICE
compared with the amount that is required to remove natural silting.Thus a useful approximation is that the passage of an additional shipof any draft less than the maximum of the channel will generate noadditional costs.12
There are two important reasons for not penalizing the large shipby heavy channel dues. First, the large ship will exploit the economiesof scale of ship size, and second, the large ship-particularly the bulkcarrier-is operated on a competitive basis and provides a threat anda discipline to the conference operators. The first point is particularlyimportant. It seems silly to dredge a deep channel only to chargesuch high fees for the very vessels that the channel was designed toaccommodate that some are deterred from using the port. Chargesmust be designed not to discourage use, so that the port and populationof the country may share in the economies of the large ship that theconstruction of the deeper channel has made possible. The secondpoint is of considerable importance for countries such as Thailand orCanada that ship exports in bulk. The conference operators are to alarge extent disciplined in their pricing policies by the competitivebehavior of tramps and bulkers, and this competition is particularlyimportant in the export trades of countries that ship large quantitiesof low-valued goods. Any discouragement to the competitors of theconference will encourage the conference to maintain high tariffs.Furthermore, it will provide an additional coherence to the conferencestructure and will discourage chiseling, the usual process by whichconferences break down.
Marginal-Cost Pricing and Congestion Pricing:The Case of Storage Charges
Transit sheds are a major focus of port congestion. Thus the formand size of storage charges are particularly important elements of porttariffs. All the four ports allow a certain amount of free time, but thelength of this free period varies: Singapore allows 3 days for importsand exports; Kelang also allows 3 days but computes them more gen-erously and excludes holidays; Bangkok allows 3 days for imports butonly 1 day for exports; and Chittagong allows imports 4 free days,
12. Pilot, tugboat, and other ancillary costs are excluded.

MARGINAL-COST AND CONGESTION PRICING 205
holidays excluded, but 15 days, excluding holidays, for exports. Someof these differences probably result from the situation of the ports.C'hittagong is predominantly an import port, located quite far fromthe chief internal markets. At Bangkok, manv of the exports aredeposited first in private warehouses where they could stay in princi-ple until the ship arrives without encumbering the port's facilities.'3
But storage absorbs resources. If practically all cargo always stays inport for at least X days, there would be a patent inconvenience if aseparate charge were to be made for the unavoidable stay, and thecost should be recovered from a general charge. But this is clearly notthe case: some cargo never enters the sheds. Therefore there is nogood reason other than tradition of allowing free storage time afterthe vessel has concluded discharging operations.14
Port tariffs further differ in the size of the charge and in the pro-gression of the charges with time elapsed. Singapore and Kelang levyrelatively high charges expressly to clear their sheds. The time progres-sion of the scales, however, shows great contrasts. The schedules inthe tariffs of Singapore and Kelang thus contain daily rates which riserapidly over the first 14 days and are then succeeded by a lower ratefor any successive week. For example, for the Kelang Port Authority(1975), storage charges on imports in transit sheds and covered yardstorage sheds, levied from the common landing date, excluding portholidays are:
M$ per day per ton
4th day or part thereof 1.608th day 3.8014th day 9.803rd and subsequent weeks,
per week or part thereof 7.50
Storage rates in the tariffs of Bangkok and Chittagong, by contrast,escalate steadily to a level which then is maintained. For example,
13. A similar consideration accounts for an exception made in the allowanceof free storage time at Kelang: only 1 day is allowed to goods loaded fromprivate godowns.
14. We agree in this matter with the views expressed in United Nations,Conference on Trade and Development, Secretariat. Port Pricing, (TD/B/C.4/1110/Rev. 1) (New York, 1975), paragraphs 155 and 156.

206 CHAPTER 9. PORT PRICING IN PRACTICE
for the Port Authority of Thailand (1974), charges for inward cargoesstored within or outside transit sheds are:
Bht per day per ton
1st week 4.003rd week 6.008th week 11.009th and subsequent weeks 12.00
No generally valid rules can be established for the form of thestorage tariff except that it should be consistent with the port'scost of storing goods. It seems to be generally accepted that portwarehouse storage should be charged according to cost. There is noreason why transit sheds should be treated differently. If ships andcargo arrive at random, there is no reason why the daily chargeshould vary with the days of storage. On the other hand, if there is aregular flow of cargo arrival, marginal cost of storage rises with time,and there might be a case for escalating the daily rates; and so therewould be if expected cost rises with length of storage. The most diffi-cult scheme to rationalize is that practiced by Singapore and by PortKelang. Rapidly escalating daily rates are appropriate in some circum-stances as has been pointed out. The subsequent abatement of thedaily charge, however, amounts to a quantity discount for space-daysin the transit sheds. The argument that quick removal causes thelargest cost to the shipper is true but irrelevant; what matters is theport's cost, not the shipper's, and that will be constant or rising eachday the sheds are occupied."5
Loading Port Charges
A port that expects normally to operate with unexhausted econo-mies of scale faces the problem of how to cover cost. If all prices areset at the level of marginal cost, there will be a deficit. If competitionfor port services is not perfect, the port may levy charges at a levelthat will cover fixed cost or at least that will contribute somethingtowards it. The problem may be attacked by a multipart tariff such
15. Compare the discussion of the point in Coopers and Lybrand AssociatesLimited, Report on the Tariff Review, D.3 and following. Their reasoning is diffi-cult to follow.

LOADING PORT CHARGES 207
as discussed in Chapter 8, but this is the exception in conventionalports. The second best solution is to load some of its charges, and theproblem is then to design the tariff (select charges for loading) so asnot to discourage use of the port's facilities.
Port tariffs therefore contain general charges and specific charges.The general charges are unrelated to the use of specific services andact as a sort of cover charge which ships must pay if they wish to usethe port at all. River or channel dues and cargo dues are the mainexamples of general charges. Specific charges are levied for servicesthat cause an avoidable cost. Crane charges represent the class ofspecific charges.
Ports differ in their use of this form of tiered tariff. In Kelang thedistinction is defined least clearly; the port, for example, levies noseparate berth hire charge but merges it in the charge for wharflabor.l6 Bangkok, on the other hand, charges separately for the useof the wharf and uses a tapering scale: the initial payment of wharfrate entitles the vessel to stay for 72 hours, but additional time at thewharf is charged for at a lower rate per day."7 This seems an attractiveidea and corresponds to the method of charging for telephone calls insome countries: a high rate per minute for the first 3 minutes andless for additional minutes. But the rate is still tied to time: insteadof buying a right to use the port or the wharf, the vessel buys time atthe wharf. This method only seems safe if there are no grounds forexpecting congestion, and that is not really the case of Bangkok.Moreover, the implicit quantity discount for time at the wharf worksagainst ships equipped or organized for fast cargo working, againstcargoes that tend to move fast and thus of bulked cargoes, and there-fore against competitive vessels which should perhaps be given anincentive by the port tariff."8
The purpose of distinguishing between general and specific charges
16. Port Swettenham Authority, Scale of Rates, Dues, and Charges, By-laws1966, Item 25.
17. Port Authority of Thailand, Tariff of Port Charges, Port of Bangkok,4th ed. (Klong Toi, Bangkok, 1974), p. 5. A vessel of 4,000 NRT will thus payBht4,400 for the first 3 days and Bhtl,200 for the fourth day (or Bht8,000 for6 days).
:18. These charges apply only to the wharves at Klong Toi. Bulk imports aredischarged largely at private wharves within the port area. This point may, there-fore, not be relevant to the case of Bangkok so much as to the general methodwhich the tariff illustrates.

208 CHAPTER 9. PORT PRICING IN PRACTICE
is to price certain underused facilities more nearly at marginal costwhile still adhering to the normal rule that, as far as possible, costshould be covered for the port as a whole. Underused facilities canthus be priced at average cost for the capacity actually used; the costof the unused part (say, forklifts or manhours) is treated as overheadcost and is transferred to the general charge. Whether this policysucceeds in its twin aims of improving the use of all the port's facilitiesand of raising its revenues will depend on whether the tariff makershave foreseen correctly all the possibilities of substitution. For in-stance, if the port has more equipment than is demanded even atpeak times, the cost of the excess may be loaded on to port dues.19
But if port dues are only payable on cargo worked across the wharf,ships can avoid the higher charge by discharging into lighters fordirect delivery to the consignees. The one sure result would be tolower further the use of shore equipment. Altematively, if port duesare levied on all cargo worked in the port's territory but at differentrates for cargo discharged over the jetty or midstream, the pattern ofvessel operations may again be altered to minimize the cost of dis-charging.
Basically similar questions about the effects of loading up portcharges are raised by an example from the history of the Port ofBangkok tariff. Bangkok charged wharfage at the same rate per ton,irrespective of whether the cargo was discharged over the wharf (land-side) or overside into lighters with the vessel standing in either casealongside the wharf. In 1973 the wharfage or cargo dues on cargo dis-charged overside were raised, on the recommendation of a consultantwho had pointed out that by charging the same rate the port waslosing revenue. This was happening because shore labor and equip-ment had to stand idle while the vessel discharged some of its cargolandside and another part overside and because cargo dischargedlandside also paid handling charges and often incurred storage chargesas well.20 But if a vessel discharging into lighters immobilizes shorelabor and equipment, it should have paid for them at marginal cost.If more revenue was required, the charge for using the port or thewharf should have been raised for everyone, leaving it to the vessel todecide whether to discharge overside or over the wharf. It is at least
19. Coopers and Lybrand Associates Limited, Report on the Tariff Review.20. W. D. Scott and Co. Pty. Ltd. Final Report: Port Operations Consultancy
Services. Prepared for the Port Authority of Thailand, Port of Bangkok, KlongToi, Bangkok. Sydney, June 1973. Processed, pp. 14-18.

PRICE DISCRIMINATION IN PORT TARIFFS 209
possible that the recommendation would lead to an uneconomic sub-stitution; this would have occurred if an increase in the amount ofcargo discharged over the wharf had raised the ports avoidable cost.
Price Discrimination in Port Tariffs2'
Ports, as pointed out in Chapter 5, cannot control the way in whichthe burden of their charges is distributed ultimately between shipsand shippers. This at least is the situation under competition. Thesituation may seem to be different whenever liner conferences appearto average out increases in the cost associated with a particular portover the freight rates charged to all the ports within a certain range.There are grounds, however, for believing that this equalizing practiceis only effective in the short run; in the longer run the relation be-tween the shipping companies' cost and price in a particular portshould not be affected by this particular cartel policy.22
Price discrimination in the more normal sense, on the other hand,is available readily to any port which does not operate under condi-tions of perfect competition. Ports exercise this power to discriminatein various ways and in pursuit of many different objects-of fairness23or national policy or port profits. Transshipment differentials aremade on commercial considerations (see Chapter 7), but the reducedcharges to ships engaged in local (near-distance or coastal) tradescontain an element of national policy.24 Apart from transshipmentcharges, however, the most interesting instances of differentiation arebetween export and import cargoes and between different commodi-ties. Price discrimination at Singapore is confined wholly to trans-shipment cargo. The examples are taken therefore from the porttariffs of Bangkok, Chittagong, and Kelang.
21. Price discrimination was discussed in Chapters 6 and 7. The term is usedhere in its technical sense of services produced at the same cost being sold atdifferent prices.
22. See Chapter 6, above.23. An example is provided by the Chittagong port tariff which abates storage
charges for cargo held up in the port through delays caused by customs or forother reasons that are not the shipper's fault. See Chittagong Port Trust, Scheduleof Charges on Goods and Vessels, section 9.
24. Instances of this treatment are found in the ports tariffs of Chittagong andPort Kelang.

210 CHAPTER 9. PORT PRICING IN PRACTICE
Exports versus imports
The three ports offer a variety of concessions to export traffic. AtBangkok, landing charges on inward cargoes and quay dues on out-ward cargoes are difficult to compare because they vary according tocommodities. The ranges of these class rates are:
Landing (inward cargo) Bhtl5-31.25 per cubic meterQuay due (outward cargo) Bhtl.15-1.25 per cubic meter
Handling charges for export cargoes are levied at half the rate ofimports. The free storage time for exports is just 1 day against 3 daysfor imports, but the storage rent for the first week after free time isBhtll.25 per cubic meter of export goods against Bht21 per cubicmeter for imports.
At Chittagong, landing and shipping charges strongly favor exports.Summary comparisons are difficult because of differentiation by com-modity. The residual class charges are:
Landing charge (goods charged freight by weightin parcels less than 35 cwt) Tk6.20 per ton
Shipping charge (all other goods, freight chargedby weight, parcel not exceeding 35 cwt) Tk3.38 per ton
River dues (the equivalent of wharfage) are charged at Tk4.50 perton on goods arriving from foreign ports and at Tk2.25 per ton ongoods shipped abroad; raw jute is charged only Tk2.00 per ton. Freestorage time is 4 days for imports and 15 days for exports, but storagerent for comparable classes is charged on imports at seven times therate on exports. The port furthermore possesses punitive powers tocharge four times the scheduled rent on imports but only three timesthe scheduled rate on exports.
At Kelang, free storage time is 3 days for imports but 7 days forexports; storage charges for imports are a multiple of those for exports.For example,
Importsfirst 4 days after free time M$1.60 per ton per daytenth day after free time M$5.80 per ton per day
Exportsfirst 14 days after free time M$0.70 per ton per dav

PRICE DISCRIMINATION IN PORT TARIFFS 211
In some of these instances lower charges to exports may correspondto lower costs; imports and exports will often require differentamounts or types of services because they tend to be presented to theport in different ways. Similarly, port resources are saved if ships canbe dispatched quickly, and this depends on the presence of the exportcargo wvhen the ship is ready for loading. But cost differences cannotaccount for all these differences in charges, whether in terms of thetype of charge (for example, river dues) or of the size of the differ-ence (for example, handling or storage charges). To some extentthe port is charging what the traffic will bear: exports tend on thewhole to have a lower c.i.f. value per ton than the import cargoes of(leveloping countries. But it is clear from investigations in thevarious ports that discrimination in favor of export cargo is meant topromote exports. At Chittagong it thus appears that while landingcharges for several classes of commodities are always well above thelabor rates paid by the port for shore handling, this is not so for allexport commodities.25 But it does not seem to be in the best nationalinterest to channel aid to exporters through the ports, irrespective ofwhether the port has to recover cost or is allowed to operate at adeficit. If the provision of export subsidies is thus diffused, the con-trol over the use of national resources is weakened. If states at thesame time levy taxes on exports (for example, the Thai rice premiumand the taxes on rubber in Malaysia and on raw jute in Bangladesh),the situation becomes distinctly confused.
Discrimination among commodities
Liner freight rates are differentiated according to commodities; inaddition many rates are based on weight or volume, whichever willyield the larger revenue to the ship.26 Commodity differentiation infreight tariffs exists also in the traditional railway tariffs and is im-
25. This conclusion emerges from comparing Chittagong Port Trust, Scheduleof Charges on Goods and Vessels, with the Chittagong Port Trust, Rate Schedulefor Shore Handling Work for the Calendar Year 1975 (Chittagong, 1975,processed). The schedule lists the rates payable by the port to the shore-handlingcontractors-the stevedoring firms which have been selected by the ship and areemployed thereupon by the port to undertake the shore handling.
26. If the freight rate is given as $5 W/M (W = 1 ton and M = 40 cubicfeet) and if I ton of the commodity occupies 60 cubic feet, the shipper will pay$7.50 per ton to the ship.

212 CHAPTER 9. PORT PRICING IN PRACTICE
bedded also in many port tariffs. Chittagong and especially Bangkokthus vary charges according to the class of the commodity.27
At Chittagong raw jute bears a lower river due than other exportcargoes. Landing and shipping charges contain further differencesbetween commodities, and some of the differences are patently un-related to cost differences. Storage rent is differentiated similarlyaccording to commodities. For example, rent on export cargo forcotton, hemp, and fiber, is TkO.10 per bale per day; for jute manu-factures is TkO.lS per bale per day; and for tea is Tk1.50 per chestper week.
At Bangkok, landing charges (imports) and quay dues (exports) aswell as handling charges are based on an elaborate commodity classi-fication.28 Landing charges consist of four class rates, ranging fromBhtI5 per cubic meter to Bht31.25 per cubic meter, and of sevenspecial classes. The classification appears to have been based largelyon the value of goods. For example, landing charge for antiseptics isthe Class 2 rate and for perfumery and cosmetics is the higherClass 3 rate. The ranking of commodities in the classification forapplying handling charges is not the same as for landing charges orquay dues.
The rates based on commodities reflect certain differences in thecost of handling and of port liability. Above all, however, they appearto reproduce rather than to counteract the ocean liner practice ofcharging what the traffic will bear. They reflect the value of thecommodity within the limits imposed by competition from other portsor by other modes of transport. Container port tariffs normally do notdiscriminate according to value of commodity even though discrimi-nation still persists in the freight rates of many container operators. Ifport charges for conventional break bulk cargo discriminate accordingto the value of commodities while containers are charged at a flat rate,the port encourages wittingly or unwittingly the containerization ofhigh-value cargoes. In these cases, the shippers' decisions whether tocontainerize will not be based on the true cost.
27. In the Port Kelang tariff, the export shipping charge (payable by thecargo owner) for dry rubber is M$5.00 per ton against M$5.50 for otherexport goods. See Port Swettenham Authority, Scale of Rates, Dues, and ChargesBy-laws, 1975. Item 40.
28. The tariff recently proposed by Coopers and Lybrand Associates Limiteddoes not differentiate between commodities.

ALLOCATION OF RESOURCES BY RULE 213
Allocation of Resources by Rule
All port managers allocate some of the port's resources by rulerather than by pricing. In many cases this is sensible since allocationby pricing involves cost: the administrative cost of levying a chargeand the cost of changing prices as the demand and supply situationin the port changes. Nonprice allocation thus will be economical intemporary situations of excess demand. For example, cranes and otherheavy lift equipment then may get shared out equally between users.It would not be sensible to try to auction them off at such times. Butthere are other and more permanent problems of allocation that portstend to solve by nonprice methods but where the advantages ofallocation by rule are less obvious. Allocation by rule is resorted towvhen there are conflicting demands for scarce resources. This confersa benefit on the recipient of the resource and results in a loss for theone whose request is denied. Two conclusions follow. First, thebeneficiary of the rule gains from being given access to a scarceresource without having to pay for it. The owner of the scarce resource(the port) does not obtain the benefit; if it did it could either usethe revenue to expand the facility or to reduce charges elsewhere inthe port. Second, there is no certainty that the gain obtained by thebeneficiary exceeds the loss to the one who was ruled out. Whetherthe revenue position of the port or of ships and shippers is considered,the outcome of allocation by rule thus is not normally very satisfac-tory. Allocation by rule-in small things as in big-can create un-wholesome temptations. If prices were used instead of rules, the gainsfrom the scarce resource would be obtained by the port, and theresource would be allocated to that user who places the greatestvalue on it.
Among the various instances of nonprice allocation practiced byports, berth allocation seems a possible candidate for the introductionof pricing. In the allocation of berths the rule first-come-first-servedis widely practiced, but there are many exceptions. In Bangkok andChittagong, for example, import vessels tend to get preference overothers, such as vessels arriving in ballast for loading. At Kelang, theNorth Port tends to give preference to container mother ships andsecondly to ships carrying more than seventy-five containers. In theSouth Port, ocean berth preference is given apparently to liquid

214 CHAPTER 9. PORT PRICING IN PRACTICE
carriers.29 A recent feasibility study which proposed the constructionof new timber wharves also recommended that bulk timber carriersshould be given priority at these wharves. The recommendation wasbased on the argument that time is more costly for these specializedcarriers than for general carriers and that delays to timber carrierswould lead to the greater increase in freight rates. Container terminalshave similar priority rules: the largest vessels get served first.
These few examples point to various reasons for berth preference.Ships thus are given preference in the berths most suitable for servic-ing them, which means either that the port's cost of servicing themin that berth is lower than elsewhere or that the ship's cost is mini-mized. Alternatively, preference is given to the ship for which delaywould be most expensive.30 In yet other circumstances, the experi-enced port manager will give preference to the vessel that will dis-charge and load fastest, holding off the slower vessels.
Berth allocation is a continuing activity, and differences in the lay-out and equipment of berths are fixed features of the port. The useof price to take some of the strain of allocation by rule therefore maybe particularly appropriate. The cases cited contain their own pre-scriptions; where the ship is indifferent between different berths butthe port is not, lower the relative price of this berth to this type ofship. Where a type of ship prefers one particular berth, raise the rela-tive price of that berth.
It is not always easy to price a resource so as to obviate the need forregular allocation by rule. If the price is set too high, the resource willbe underused; if too low, the price cannot perform the allocation.While port prices need not perhaps be fixed as rigidly as they tend tobe-and certainly not for such long periods-frequent changes arecostly, and auctioning is impracticable. If the need for allocation byrule can be reduced somewhat by pricing, there is reason enough tobe satisfied."1
29. Berths 4 and 5 are pumping berths.30. That is the full import ship at Chittagong or the large container ship at
Singapore or Kelang.31. Even so, some facilities in some ports will have to continue to be allocated
by rule because of sharp, frequent, and irregular fluctuations in demand whichleave them alternately standing idle and in excess demand.

Glossary
Port and Shipping Terms
All-in charges: Single charge for all services.
Alongside: With the vessel standing at the quay or jetty, the cargois moved from ship direct to surface of quay (or in inverse direction).Opposite: overside.
Berth: Section of quay (pier, wharf, or jetty) notionally designed toaccommodate one vessel and including a section of the surface overwhich labor, equipment, and cargo move to and from the vessel. Bytransference, in shipowner's language, service to a port.
Berthing fee (or charge): A charge levied by certain ports on thevessel to pay for the use of the berth (and not always payable, orfully payable, if the ship stays mid-stream).
Break-bulk (cargo): Cargo packed in separate packages (lots or con-signments) or individual pieces of cargo, loaded, stowed, and un-loaded individually; as distinct from bulk cargo.
Bulk carriers; bulker: Ship designed to carry bulk, nonliquid cargo.
CFS: Container freight station.
215

216 GLOSSARY
Channel: Passage of water leading to the port that is normallydredged and policed by the port authority.
Channel dues: Charge levied (on the vessel) for using the channel.
Charter rate: Payment by charterer (such as cargo owner) to ship-owner for the charter of the vessel. It is determined by market con-ditions and terms of charter.
c.i.f.: Cost + insurance + freight. This corresponds in principle tothe landed price of shipments before tax.
Coaster: Ship that plies between coastal ports on the same coast orarchipelago or in interisland trades.
Conference (liner or steamship conference): A combination (tech-nically, a cartel) of shipping companies (or owners) which setscommon liner freight rates on a particular route and which regulatesthe provision of services.
Conservancy authority: Regulates navigation in channels and port.It is also charged with the maintenance of banks and dredging andgenerally with the safety of vessels using the river, channel, or port,and occasionally also with the provision and maintenance of naviga-tional aids.
Cranage: A port charge levied for the use of cranes. It is paid byship or cargo owner or by both parties in certain proportions accord-ing to the customs of the port.
cwt: Hundred weight, 112 lbs.
Decasualization of dock labor: Policy implemented in various coun-tries to depart from the system of casual (daily hired) dock labortoward a regularly employed labor force that is subject to the usualterms of employment and job security. In several countries, docklabor under this system is employed not by the port but by a separatebody (dock labor board).
DWT: Dead weight tonnage. The weight in long tons that a vesselcan carry when fully laden.
FCL: Full container load; a container that is delivered to the ship-ping company full of the consignor's cargo. The meaning changesaccording to who uses the term; ports may describe containers as FCLif they leave the port's area without having been unstuffed (orstripped).

GLOSSARY 217
Feeder (service): Transport of containers which are first carried bythe main line container vessel to a port of transshipment, unloaded,and then loaded on a smaller vessel for feeding to a further port.Feeder service implies transshipment.
f.o.b.: Free on board. In the case of ocean carriage it means thevalue of the goods (including the value of packing) when placed onboard the vessel. It includes such charges as the shipper had to payto the port but excludes cargo insurance (and freight) and corre-sponds only approximately to market value in the exporting country.
Freight tons: A heterogeneous unit for counting cargo or traffic inliner shipping. It is based on the rules by which freight rates areassessed. For cargo paid by weight tons, the weight ton (long, short,or metric) is a freight ton. For cargo paid for by measurement tons(for example, 40 cubic feet), the measurement ton is the freight ton.
General cargo: Cargo, not homogeneous in bulk, which consists ofindividual units or packages (parcels).
GRT: Gross register tonnage, a measure of the total space of a vesselin terms of 100 cubic feet (equivalent tons) including mid-deck,between deck, and the closed-in spaces above the upper deck, lesscertain exemptions. The GRT of most of the world's ships is recordedin Lloyds Register. See also, NRT and DWT.
Hook: Loading and discharging point along a vessel; the hook islowered by ship's derrick or crane to receive the net holding thecargo. Hence, hook hours, the base of a measure of port output(cargo tons moved per hook hour).
Landing charges: A charge levied by certain ports on the cargo-ownerfor receiving and handling imports. The corresponding charge forexports is called shipping charge.
Lash: Lighter aboard ship. This is a technique of water transport bywhich cargo is loaded on barges which are in tum taken up by anocean vessel which transports them and ultimately releases them tocarry the cargo into port.
LCL: Less than container load; cargo destined for shipment in acontainer that is delivered by the consignor for consolidation withother cargo and insertion in a container by the shipping companyat a container freight station.

218 GLOSSARY
Measurement ton: A unit of quantity of cargo based on its cubicmeasurement (for example, 40 cubic foot or 1 cubic meter).
n.i.e.: Not indicated elsewhere. This term is applied to goods orservices in port tariffs.
NRT: Net register tonnage, the GRT minus the spaces that are non-earning-machinery, permanent bunkers, water ballast, and crew quar-ters. Over the range 0 to 6,000 NRT there is a reasonably good cor-relation between NRT and DWT: DWT = 2.5 NRT.
One-off visit: A nonroutine or nonsehedule call at a port.
Overside: Cargo being loaded or unloaded from ship into bargesstanding along the vessel. Opposite: alongside.
Palet (palette): Tray or other solid base on which cargo is loadedfor loading or unloading; a form of unitized cargo (paletized). Paletships are designed to carry cargo piled on palets.
Port dues: A charge levied by certain ports on the vessel or cargo.
Quay charges (rent): A port charge levied on the vessel for the useof the quay.
Roads (Singapore): Water passages or stopping places in the port'sarea for vessels working cargo overside or waiting for berth.
Roll-on/roll-off: Cargo carried in wheeled containers or wheeledtrailers aboard and moving on to the ship and off it on wheels, usuallyover ramps.
Ship measurements: Measures of cubic capacity, in tons of 100 cubicfeet; see GRT, NRT, and DWT.
Shipping charges: See landing charges.
Stevedore: Labor employed to load and unload cargo and, by trans-ference, the organizer of this work. In many ports, stevedores onlywork aboard ships for the account of vessel or cargo-owner, and workashore is done by the port's labor.
TEU: Twenty-foot equivalent unit. Standard unit for counting (equi-valent) containers of various dimensions: 20 x 8 x 8 feet; in otherwords, a 20-foot equivalent container.
Trampers (Tramps): Nonsheduled, nonconference vessels.
Transit shed: A shed in the port area, usually in customs-bonded area,which is positioned behind the berth to receive cargo unloaded fromvessel or for loading. Distinct from warehouse.

GLOSSARY 219
Unitized cargo: Cargo packed in units for easy presentation to vesseland port; for example, containered cargo and paletized cargo.
Wharfage: A charge levied by some ports on the cargo owner for theuse of the port surface over which the cargo moves.
Domestic Currency Rates per Unitof Special Drawing Rights
1971 1973 1975 1977
Bangladesh (Tk) 8.068 9.891 17.373 17.486Thailand (Bht) 22.721 24.579 23.882 24.780Malaysia (M$) 3.133 2.958 3.030 2.873Singapore (S$) 3.149 2.999 2.914 2.841India (Rp) 7.833 9.808 10.462 9.971United Kingdom (f)a 2.351 1.926 1.729 1.569United States ($) 1.086 1.206 1.224 1.162
Note: Special drawing rights (SDRs) are defined in terms of a weighted aver-age of the sixteen most important currencies in world trade.
a. In SDR per £ sterling.

References
The word processed indicates works that are reproduced by mimeograph,Xerox, or another manner other than conventional typesetting andprinting.
All India Shippers Council. Fourth Annual Report for the Year 1970.New Delhi, 1971.
Bennathan, E., and Direk Malakon. "Survey of Vessels in the Port ofBangkok (Klong Toi and Private Wharves) during Four SelectedWeeks between November 1966 and August 1967." Bangkok, 1970.Processed.
Bennathan, E., and A. A. Walters. The Economics of Ocean FreightRates. Praeger Special Studies in International Economics and Devel-opment. New York: Praeger, 1969.
Bennathan, E., A. A. Walters, and others. The Cost of Ocean Transportin the Foreign Trade of Asia. Processed.
Blake, D. J., E. Bennathan, and A. A. Walters. "Survey of Vessels inthe Port of Singapore (Roads and Wharves) during One Week inSeptember 1966." Bristol, 1970. Processed.
Canadian Transport Commission, Systems Analysis Branch, The Con-tainer Study in Summary. Report 70. Principal authors, P. M. Buntingand L. M. O'Connell. Ottawa, November 1973.
Chittagong Port Trust. Budget Estimates of Income and Expenditure for1975-1976 with Revised Estimates for 1974-1975. Chittagong, 1975.
Chittagong Port Trust. Rate Schedule for Shore Handling Work for theCalendar Year 1975. Chittagong, 1975. Processed.
220

REFERENCES 221
Chittagong Port Trust. Schedule of Charges on Goods and Vessels. Cor-rected up to notification no. CAO-IV(98)/7534, January 29, 1975.Bangladesh Gazette. Chittagong, 1975.
Chittagong Port Trust. Statement of Cargo Handled at Chittagong Portduring the Period from July 1974 to June 1975. Processed.
Coase, R. H. "The Economics of the Lighthouse." journal of Law andEconomics, vol. 18, no. 1 (April 1975), pp. 25-31.
Containerization International (London), vol. 9, no. 11 (November1975), p.25.
Coode and Partners, Economist Intelligence Unit, and L. E. Taylor. PortSwettenham Improvement Scheme. 1968 Pre-Investment FeasibilityStudy. Prepared for the Honourable Minister of Transport, Govern-ment of Malaysia. London, 1968.
Coopeis and Lybrand Associates Limited in association with Sir BruceWhite, Wolfe Barry and Partners, and Shankland Cox Partnership."Lembaga Pelabohan Kelang. Port Development Feasibility Study."Final Report, 2 vols. August 1974.
Coopers and Lybrand Associates Limited. Report on the Tariff Review.Prepared for the Port Authority of Thailand. London, January 8, 1975.
Dally, H. K. "Containers-a Note on Berth Throughputs and TerminalHandling." National Ports Council Bulletin (London), no. 4 (April1973), pp. 6 0-6 5 .
Daniel, Mann, Johnson, and Mendenhall; Louis Berger. Development ofthe Ports of Sattahip and Da Nang and of Route 9. Study conductedon behalf of the Southeast Asian Coordinating Committee for Trans-portation and Communications at the request of the Governments ofLaos, South Vietnam, and Thailand. Contract AIR/SA/IR-197 (Re-gional). Los Angeles, March 1973.
Deakin, B. M. Shipping Conferences. University of Cambridge, Depart-ment of Applied Economics Occasional Papers no. 37. Cambridge:Cambridge University Press, 1973.
Deakin, B. M. "Shipping Conferences: Some Economic Aspects of In-temational Regulation." Maritime Studies and Management, vol. 2,no. 1 (July 1974), pp. 5-31.
Directorate of Transport Research, Ministry of Shipping and Transport,Government of India. Port Transport Statistics of India. New Delhi,March 1971.
Economist Intelligence Unit Limited in association with Scott WilsonKirkpatrick and Partners. Bangladesh Transport Survey. Final report.Prepared for the Government of the Peoples Republic of Bangladeshunder assignment by the Overseas Development Administration of theForeign and Commonwealth Office. Part 9, Management and FinancialStudies. London, November 1974.

222 REFERENCES
Economist Intelligence Unit in association with Wallace Evans andPartners, Consulting Civil and Structural Engineers. The Containeriza-tion of Thailand's Sea Trade. Prepared for the Government of Thai-land, Ministry of Communications, 1973.
Fellner, W. "Prices and Wages under Bilateral Monopoly." QuarterlyJournal of Economics, vol.61 (August 1947), pp. 503-32.
Govemment of Pakistan, Ministry of Communications (Railway Divi-sion). General Rules and Schedules for Working of the ChittagongPort (Railway) Jetties (in force January 1, 1959). Gazette of Pakistan.Karachi, December 15, 1958.
Heaver, Trevor D. "The Routing of Canadian Container Traffic throughVancouver and Seattle." Study prepared for the Western Transporta-tion Advisory Council and the Centre for Transportation Studies of theUniversity of British Columbia. Vancouver, B.C.: WESTAC, January1975.
Heggie, Ian. "Charging for Port Facilities." Journal of Transport Eco-nomics and Policy, vol. 8, no. 1 (1972), pp. 15-16.
Houthakker, H. S., and S. P. Magee. "Income and Price Elasticities inWorld Trade." The Review of Economics and Statistics, vol. 51, no. 2(May 1969),pp. 111-25.
Israel Shipping Research Institute, Freight Research Division. Informa-tion Paper, no. 30 (November-December 1973); no. 31 (January1974); no. 32 (February 1974); no. 33 (March 1974); and no. 46(April 1975)). Haifa: Israel Shipping Research Institute.
Kelang Port Authority. Annual Report 1974. Kelang, 1975.Laing, E. T. "The Costs of Deep Sea General Cargo Shipping." Marine
Transport Center, University of Liverpool, June 1974. Processed.Louis Berger International, Inc. "Feasibility Study, Port of Chittagong
Expansion, Bangladesh." Study prepared for the Asian DevelopmentBank and Chittagong Port Trust. 2 vols. December 1974. Processed.
Martinez, Miguel. "Distribution of Benefits of Port Improvements: CaseStudy of the Port of La Goulette (Tunisia)." Study prepared for theWorld Bank, 1976. Processed.
McCaul, James R., Robert B. Zubaly, and Edward V. Lewis. "Increasingthe Productivity of U.S. Shipping." Paper read at the Spring Meeting,Williamsburg, Va., May 24-27, 1972, no. 3. New York: the Societyof Naval Architects and Marine Engineers, 1972.
Organization for Economic Cooperation and Development (OECD)."Ocean Freight Rates as Part of Total Transport Costs." Paris, 1968.
Plumlee, Carl H. "Optimum Size Seaport." Journal of the Waterwaysand Harbors Division. Proceedings of the American Society of CivilEngineers. vol. 92, no. WW3 (August 1966), pp. 1-24.

REFERENCES 223
Port Authority of Thailand. Port Operations Department. Port OperationsStatistics 1974. Bangkok, 1975.
Port Authority of Thailand. Tariff of Port Charges, Port of Bangkok.2d ed. (1966); 4th ed. (1974). KlongToi, Bangkok.
Port of Singapore Authority. PSA Tariff 1973. Singapore, 1973.Port of Singapore Authority. Report and Accounts for the Year Ended
31 December, 1974. Singapore, 1975.Port Swettenham Authority. Scale of Rates, Dues, and Charges, By-laws,
1966, incorporating amendments up to April 18, 1974 and By-laws1975, incorporating changes applied in 1975 and proposed for 1976.
Producers Boards' Shipping Utilization Committee, New Zealand. NewZealand's Overseas Trade: Report on Shipping, Ports, Transport, andOther Services. Wellington and London, February 1964.
Ray, Anandarup, and James W\V. Loudon. "Central American Ports Study."World Bank Economic Staff Working Paper, no. 117. Washington,D.C.: World Bank, October 1971.
Robinson, Joan. The Economics of Imperfect Competition. London:Macmillan, 1933.
Scott, W. D., and Co. Pty. Ltd. Final Report: Port Operations Con-sultancy Services. Prepared for the Port Authority of Thailand, Port ofBangkok, Klong Toi, Bangkok. Sydney, June 1973. Processed.
Shoup, D. Ports and Economic Development. Washington, D.C.: Brook-ings Institution, 1967.
United Nations, Conference on Trade and Development, Secretariat.Port Pricing. (TD/B/C.4/1110/Rev. 1). New York, 1975.
United Nations, Conference on Trade and Development. United NationsConference of Plenipotentiaries on a Code of Conduct for Liner Con-ferences. vols. 1 and 2. New York, 1975.
United Nations, Economic and Social Council, Economic Commissionfor Latin America, ECLA/OAS Joint Transport Programme. MaritimeFreight Rates in the Foreign Trade of Latin America. part I (E/CN.12/812/Rev. 1) and part II (E/CN.12/812/Add. 1). New York, 1970.Processed.
United Nations Industrial Development Organization. Guidelines forProject Evaluation. New York, 1972.
United States Congress, Subcommittee on Federal Procurement andRegulation of the Joint Economic Committee. Discriminatory OceanFreight Rates and the Balance of Payments. Hearing. 89th Cong., 1stsess., June 30, 1965. Washington, D.C.: U.S. Govemment PrintingOffice, 1965.
Vanags, A, H. "Flag Discrimination: an Economic Analysis." Advances

224 REFERENCES
in Maritime Economics, ed. R. 0. Coss. Cambridge: Cambridge Uni-versity Press, 1977.
Vanags, A. H. "Maritime Congestion." Advances in Maritime Eco-nomics, ed. R. 0. Goss. Cambridge: Cambridge University Press, 1977.
Walker, Gilbert. "Transport Policy before and after 1953." Oxford Eco-nomic Papers, New Series, vol. 5, no. 1 (March 1953), pp. 1-33.
Walters, A. A. "A Development Model of Transport." American Eco-nomic Review, Papers and Proceedings, vol. 58, no. 2 (May 1968), pp.360-77.
Walters, A. A. Economics of Road User Charges. World Bank Staff Occa-sional Papers, no. 5. Baltimore: Johns Hopkins Press, 1968.
Walters, A. A. "Marginal Cost Pricing in Ports." The Logistics andTransportation Review, vol. 12, no. 3 (1975).
Walters, A. A. Review of Advances in Maritime Economics. Journal ofPolitical Economy (April 1979).
Walters, A. A. "The Theory and Measurement of the Private and SocialCosts of Highway Congestion." Econometrica, vol. 29 (1961). Re-printed in Readings in Economics of Transport, ed. Dennis Munby.Harmondsworth: Penguin, 1969.

Index
Aden, 86 and, 12-13; port size and, 51; pricingAFTE. See Annual fee to enter base for, 12-13, 22, 199-201; trampsAll-in charges: defined, 215 and, 201; turnaround time in, 201.All India Shippers' Council, 95n See also QuaysAnglo-Saxon doctrine: defined, 3-4 Bombay, 90, 157Annual fee to enter (AFTE): for Break-bulk cargo: defined, 215. See also
bulkers, 11; for charter vessels, 11, Cargo185-86; congestion and, 183; dredg- Bulk carriers: AFTE for, 11; channeling cost defrayed by, 11, 183; for dues for, 13, 203-04; defined, 215;liner conferences, 11, 184-87; for discrimination against, 10, 137, 143-one-off caller, 11, 184, 186; quantity 44, 201; freight rates of, 91-93;discount system for, 11, 184-87; ship LAQ and, 11; liner conferences and,size and, 183; for tramps, 185-86. 79, 137. See also Charter vessels;See also Channel dues Tramps
Bangkok, 98n, 166, 196-97; discrimina- Calcutta, 86, 135tion in tariffs at, 209-10, 212-13; Cargo: break-bulk, 16, 22, 145, 215;feeder lines and, 169, 171; fractional bulk, 145, 201; dry bulk, 16, 145;freight charge at, 193; labor for mov- unitized, 16, 29. See also Containering cargo at, 15; liner conferences vesselsand, 73, 145-46; port tariffs at, 88; Cargo handling: competitive port modelquantity discount system for, 187; for, 16-25; congestion indicator and,storage charges at, 204-05; tiered 82-83, 85, 87, 89; container servicestariff at, 207-08 and, 15, 22, 163, 171-76, 194; for
Basrah (Iraq) ), 89n feeder lines, 163; port size and, 51;Bennatban, Esra, 29n, 79n, 86n, 94n, pricing of, 22-23, 201-02; turn-
135n around time for, 13. See also LaborBerthing fee: defined, 215 Cartels. See Shipowners (monopolist)Berths: congestion in, 82-85, 86n, 87; Chalna (Bangladesh), 86, 151
container throughput and condition Channel dues: based on GRT, 199;of, 20, 55, 57, 87; cost according to based on NRT, 12, 197, 199-200,type, 20, 55-57; defined, 215; feeder 202; for bulkers, 13, 203-04; defined,service and, 20; NRT ship capacity 216; dredging cost defrayed by, 202-
225

226 INDEX
Channel dues (continued) Conservancy authority, 15, 21; defined,204; for liner conferences, 13, 204; 216. See also Channel duesnational interest and, 203; as per- Container vessels, 16; berths for, 20,centage of voyage cost, 22; pricing 55, 57, 87; bilateral monopolyand, 12-13, 87-88, 197-201. See model for, 106-07; cargo handlingalso Annual fee to enter and, 15, 22, 163, 171-76, 194; con-
Charter rate: defined, 216 gestion and, 87; discrimination favor-Charter vessels: AFTE for, 11, 185-86; ing, 10-11, 13, 212; economies of
congestion and, 89; fractional freight scale of, 12, 58-60, 188-89; frac-charge and, 193-94; port charges tional freight charge for, 194; inlandfor, 22. See also Bulkers; Tramps transport and, 152-53; LAQ fee for,
Chittagong (Bangladesh), 98n, 196; 11, 181-82; mainline versus feeder,berth hire at, 199; channel dues at, 20, 169-72; partial, 189; pricing and,197; congestion at, 83-84; discrin- 10-12, 137-38, 145, 164-66, 187-ination in tariffs at, 209-11, 213; 89; quantity discount system for,inland transport serving, 151; labor 187; storage services and, 20, 159n;for moving cargo at, 15; LAQ appli- subsidies for, 166-67; transshipmentcable at, 180; liner conferences and, possible with, 10-11, 158-63, 171-86, 135, 145; storage at, 87, 204-05 76; turnaround time and, 169, 188;
Coase, R. H., 54n voyage cost of, 22-24Conferences. See Liner conferences Cooper and Lybrand Associates, 86n,Congestion: abnormal, 86-91; AFTE 90n, 103n, 196n, 203n, 206n, 208n,
and, 183; berth index of, 82-85, 86n, 212n87; cargo handling and, 82-83, 85, Cranage, 15, 22, 87; defined, 216.87, 89; causes of, 82-86; chartervessels and, 89; container vessels and,87; exports and, 89; inland transport Dacca, 151nas cause of, 82-83, 85, 88-89, 151; Dally, H. K., 20n, 57nlevy (see Congestion levy); Eghters Daniel, Mann, Johnson, and Menden-and, 83, 85, 89; normal, 84-86; over- ball, 172nside operations due to, 84n, 85; poit Dead weight tonnage (DWT): chan-size and, 33, 51, 85-86, 138; roll-on/ nel dues based on, 199; cost of con-roll-off services due to, 89; sea route gestion related to, 21; defined, 216.distance related to surcharge for, 93- See also Gross register tonnage; Net94; ship size and, 21, 94; shipowner- register tonnageshipper costs of, 84, 88-89; storage Deakin, B. M., 24n, 102n, 158nand, 13, 80-84, 87-88, 197, 204; Discrimination: through allocation bysurcharges for competitive ship- rule, 213-14; against bulkers, 10,owners, 76-79, 89, 93-95; surcharges 137, 143-44, 201; among commod-for liner conferences, 64-65, 72-79, ities, 10, 13, 142-43, 209, 211-12;89-95, 103n; tiered tariffs and, 207; favoring container traffic, 10-11, 13,tramps and, 79, 92-93; transship- 212; export-import, 13, 191n, 209-ment and, 89; turnaround time and, 11, 213; by and against liner con-85, 87. See also Freight rates, ferences, 10, 139-42, 143-45, 147-Queuing 49, 209; national interest and, 10,
Congestion levy: case for, 7-8, 65-70, 141, 209-11; price, 139-45, 209, 21281-82; for competitive conferences, Djakarta, 154, 16676-79; and freight rate, 8, 76, 79; Dredging: cost defrayed by AFTE, 11,for liner conferences, 22-25, 36-37, 183; cost defrayed by channel dues,72-74, 76, 79; for monopolistic car- 202-04; port size and, 51; ship drafttels, 74-76; national interest and, 64; and, 13. See also Channel dues; Con-for national shipowners, 120; SRMC- servancy authorityLRMC pricing and, 32-33; substitu- Dry bulk. See Cargo (dry bulk)tion of, 80-81. See also Freight rates DWT. See Dead weight tonnage

INDEX 227
Economist Intelligence Unit, 141n, cable at, 181-82; transshipment at,171n, 197n 153-55
Ellet model, 98n, 121n Houthakker, H. S., 29nEuropean doctrine: defined, 3-4Exports: congestion and, 89; discrim-
ination favoring, 13, 191n, 209-11, Imports: congestion cost of, 89; dis-213; and elasticity of demand for crimination against, 13, 191n, 209-port services, 28-29; fractional freight 11; and elasticity of demand forrate on, 191n port service, 28-29; monopolistic
port's effect on, 28-29Inland transport. See Transport, inland
Far East Freight Conference, 139 Israel Shipping Research Institute, 89nFeeder lines, 159; berth hire for, 20;
cargo handling by, 163; cost and, 10,164, 167, 169, 171-72; defined, 217; Kelang [Port Swettenham (Malaysia)]:fractional freight rate for, 193; port congestion at, 90-93; container serv-size and, 166; throughput of, 10-11, ices at, 159, 166, 169, 187; discrim-158-63, 171-76. See also Trans- ination at, 55-56, 196-98, 209-10,shipment 212n; fractional freight charge at,
Fellner, W., 105n 193; inland transport at, 150-52;Freight rate: in bilateral monopoly labor charges at, 15, 201; storage at,
model, 105-07; of bulkers, 91-93; 204-06; tiered tariff at, 207; trans-congestion levy as part of, 8, 76, 79; shipment at, 154, 159, 172-76;distance and, 92n, 94; fractional, wharfage at, 199190-94; of liner conferences, 10, 22,85-86, 89-95, 134-39, 148-49; ofmonopolistic shipowners, 74-76, 109-11; under perfect competition, 114- Labor, 55, 104; congestion and over-15; port pricing and, 12, 64, 104-05, time, 87n; employment of, 15-16;117; throughput and, 112-16; of decasualization of, 216; fractionaltramps, 77, 193-94; for transship- freight rate and, 192, 194; portment, 158 pricing and, 22-23; port size and,
Freight tons: defined, 217 46n; ship costs and, 22, 180n, 201-Full container load (FCL): defined, 02; subsidization of, 7, 54; through-
216 put rate of, 13, 201-02; for trans-shipment, 154; turnaround time and,180n. See also Cargo handling
La Goulette [Halq al-Wadi (Tunisia)],Goss, R. O., 102n 19n, 72, 181Government of Pakistan, Ministry of Laing, E. T., 171n
Communications, 196n Latakia (Syria), 90Gross register tonnage (CRT): chan- Lease-a-Quay (LAQ), 11, 179-83
nel dues based on, 199; defined, 217; License to use port (LUP), 189-90and pilotage fees, 22. See also Dead Lighters: congestion and, 83, 85, 89;weight tonnage; Net register tonnage substitution and, 30; tiered tariffs for,
208Liner conferences: AFTE for, 11, 184-
Haifa (Israel), 86n, 199n 87; channel dues for, 13, 204;Halifax (Nova Scotia), 59-60 competition and, 79, 91-92, 135-Heggie, Ian, 105n, 203n 39, 149; congestion surcharges for,Henecon, 61 64-65, 72-79, 89-95, 103n; defined,Hong Kong: berth hire at, 199; con- 216; discrimination by and against,
tainer services at, 164-66, 169, 187; 10, 139-45, 147-49, 209; dominancefeeder services and, 159; LAQ appli- of, 145-46; fractional freight rate of,
228 INDEX
Liner conferences (continued) One-off call, 11, 184, 186; defined, 218190-94; freight rate of, 10, 22, 85- Organization for Economic Coopera-86, 89-95, 134-39, 148-49; inland tion and Development, 27n, 28ntransport and, 135, 140, 142, 146- Overside operations, 84n, 85; defined,49, 151-53; LAQ fee for, 181; port 218levy for, 22-25, 36-37, 72-74, 76,79; quantity discount system and,144-45; scheduling of, 91-93; sub- Pacific Conference, 167nscription-list charge to, 178-79; Palettes, 29; defined, 218transshipment through, 158 Penang 172
Location of a port: economies of scale Pilotage, 22concerning, 43-44, 46, 48-50, 61; Plumlee, Carl H., 47ninland transport and, 44 Poisson frequency distribution, 47, 63n.
Loudon, James W., 60n, 61n See also QueuingLouis Berger International, Inc., 103n, Port Authority of Thailand, 196n, 207n
145n, 172n, 197n, 199n Port dues: defined, 218Port of Singapore Authority, 152n,
196n, 202nMagee, James W., 60n, 61n Ports: activities at, 15-17; in competi-Magee, S. P., 29n tive model, 17-21; in monopolisticManila, 98n model, 9, 26-30, 130-33; one-portMarginal cost pricing: average cost ver- alternative to, 48-50; planning, 42,
sus, 35-36; in noncompetitive arena, 55-57, 60-62, 134-38; two-port al-35-37; port size and, 34-35; resource ternative for, 49-50competition and, 36; short run-long Port size: cargo handling and, 51; con-run, 31-35 gestion as factor of, 33, 51, 85-96,
Martinez, Miguel, 19n 138; cross-section cost study of, 58-Measurement ton: defined, 218 60- economies of scale and, 43-50;Monopoly. See Ports (in monopolistic expansion analysis of, 51-53; feeder
m-nodel); Shipowners (monopolist) lines and, 166; inland transport and,Munby, Dennis, 69n 7, 48-50, 61; labor and, 46n; mar-
ginal cost pricing and, 34-35; priceNa-vik (Norway), 86 competition and, 164-66, 168; shipNarvik (Norway), 86 size and, 46-50; throughput relatedNational interest: Anglo-Saxon doctrine to, 51-53, 55-57, 61; turnaround
of, 3-4; channel dues and, 203; con- time related to, 19n. See also Sub-gestion and, 8, 64, 73, 78n; in com- sidiespetitive shipping model, 127-30; Port Swettenham. See Kelangdiscrimination and, 10, 141, 209-11; Port Swettenham Authority, 152n,European doctrine of, 3-4; fractional Port Senh0 A7n 212nfreight rate and, 193n; inland trans- Producers Boards' Shipping Utilizationport and, 152-53; in monopolistic Committee, New Zealand, 24nport model, 9, 130-33; in monop-olistic shipowners model, 124-26;national cargo and, 129-33; nationalshipowners and, 102-05, 118-21, Quantity discount system: AFTE and,161-63, 168; tariff based on ship size 11, 184-87; for container vessels,and, 5-6; transshipment and, 10-11, 187; versus fractional freight rate,161-63,168 191; for liner conferences, 144-45
National Ports Council, 57n Quays: fractional freight rate at, 192;Net registered tonnage (NRT): berth LAQ fee for, 179-83; versus palettes,
hire based on, 12-13; channel dues 29. See also Berths; Lightersbased on, 12, 197, 199-200, 202; Quebec, 59-60defined, 218. See also Dead weight Queuing: in competitive port model,tonnage; Gross register tonnage 20-21; congestion and, 7-8, 41, 83-

INDEX 229
84; Poisson frequency distribution size and, 46-50; queuing and, 5. Seeand, 47, 63n; ship size and, 5. See also Feeder lines; Transshipmentalso Congestion Shoup, D., 27n
Singapore, 196, 198; berths at, 193;cargo handling at, 201n, 202; chan-
Ray, Anandarup, 60n, 61n nel dues at, 199; container servicesReshipment, 156-57 at, 159, 164-66, 169, 171-75, 187;Robinson, Joan, 163n discrimination at, 209; dockageRoll-on/roll-off services, 89; defined, charge at, 202; inland competition
218. See also Congestion of, 150-53, 157; labor for movingRotterdam, 199n cargo at, 15; LAQ applicable to, 180,
82; liner conferences and, 145-46;quantity discount system at, 186-
Scheduling, 79, 91-93, 135 187; storage at, 204-06; throughputScott Wilson Kirkpatrick and Partners, of, 13; transshipment at, 153-57,
197n 159, 165n, 172-75, 197; turnaroundSea-Land operations, 181 time at, 180nSea routes, distance of: congestion sur- Stevedores: defined, 218. See also
charge and, 93-94; fractional freight Cargo handling; Laborrate for, 191, 193; freight rate for, Storage: congestion in, 13, 80-84, 87-92n, 94; liner conferences and, 145, 88, 197, 204; container services and,149; port pricing and, 12, 200; ship 20, 159n; fractional freight rate for,size and, 18-20; transshipment and, 192; at monopolistic port, 29; pric-153-54. See also Feeder lines ing, 22, 41, 204-06; related to re-
Seattle: container services at, 58-59, shipment and transshipment, 156n;165, 188; LAQ applicable to, 181; throughput and, 13-Vancouver competition, 135-36,152 Subsidies: versus congestion levy, 181;
Services charges: defined, 22. See also for container services, 166-67; Euro-Berths; Cargo handling; Labor pean doctrine of, 7; limited, 53-54;
Shankland Cox Partnership, 86n, 90n, in monopolistic shipping, 76, 118;103n for national shipowners, 11, 120-21;
Ship measurements. See Dead weight throughput and, 9tonnage; Gross register tonnage; Net Substitution, 6, 29-30, 80-81register tonnage Surabaja (Indonesia), 153
Shipowners: AFTE and, 184; competi-tive, 9-10, 17-21, 91, 127-30; con-gestion costs of, 8, 67-70, 74-76, 89, Tanjong Priok (Malaysia), 98n91, 93-95, 130-33; LAQ fees and, Tankers, 16181-82; monopolist, 9, 30, 74-76, Taylor, L. E., 91n91, 93-95, 105-12, 115-18, 124-28, Thailand-Europe Conference, 86130-33; national, 102-05, 118-21, Throughput: congestion charges and,161-63, 168; national interest and, 70-72, 74-75, 80-81, 87-88; by124-33; -shipper port charges, 22, container transshipment, 160-61; de-24-25, 102-05; substitution by, 6, mand variations in, 38-40, 112-14;29-30. See also Bulkers; Liner con- fractional freight rate and, 191;ferences; Tramps freight rate and, 112-16; labor
Shippers: congestion costs of, 88-89; charges for, 13, 201-02; in monop-national, 102-05, 118-21, 161-63, olist cartel, 74-75; of monopolist-168; moropolist, 109; -ship port competitive sbipowner, 128-29; incharges, 22, 24-25, 102-05. See also monopolist port model, 26-28; byBulkers; Tramps national shipowners, 121; port size
Ship size: AFTE based on, 183; chan- and, 51-53, 55-57, 61; in profit-nel dues based on, 12-13, 197, 199- maximizing port model, 126; storage200, 202-04; congestion and, 21, 94; and, 13; subsidies for, 9. See alsonational interest and, 12, 18-21; port Turnaround time

230 INDEX
Tramps: AFTE for, 185-86; berth hire Unions. See Laborfor, 201; congestion and, 79, 92-93; United Nations Conference on Tradedefined, 218; discrimination against, and Development, 22n, 24n, 25n,143-44; freight rates of, 77, 193-94; 102n, 205nliner conferences and, 79, 135, 137; United Nations Economic and Socialone-off visits by, 178; unscheduled Council, Economic Commission fornature of, 92-93. See also Bulkers; Latin America, 27nCharter vessels United Nations Industrial Development
Transit sheds: defined, 218. See also Organization, 132nStorage United States Congress, Subcommittee
Transport, inland: as congestion cause, on Federal Procurement and Regula-82-83, 85, 88-89, 151; and container tion of the Joint Economic Commit-serices, 152-53; liner conferences tee, 28nand, 135, 140, 142, 146-49, 151-53; Unitized cargo: defined, 219. See alsonational interest and, 152-53; in one- Cargo (unitized)port alternative, 48-50; port com- User charges: defined, 21-22petition and, 10, 11, 36, 150-53;port location and, 45-46; port sizeand, 7, 48-50, 61; profit-maximizing Vanags, A. H., 63n, 102n
Tra ani t: conetio and, 8 Vancouver: container services at, 58-through containers, 10-11, 158-63, 60;-Seattlecompetition, 135-36, 152171-76; distance, 153-54; feederlines and, 10, 158-59, 163, 171;fractional freight rate for, 191; Waiting. See Queuing; Throughput;freight rate for, 158; interport com- Turnaround timepetition and, 153-57, 165n, 168, Walker, Gilbert, 142n172-76, 209; liner conferences and, Wallace Evans and Partners, 141n,158; national interest and, 10-11, 171n161-63, 168 Walters, A. A., 8n, 28n, 29n, 53n, 67n,
Tripoli, 90 69n, 79n, 81n, 84n, 86n, 94n, 98n,Turnaround time: birth hire and, 201; 102n, 135n, 146n, 183n
cargo handling during, 13; in com- W. D. Scott and Co. Pty. Ltd., 196n,petitive model analysis, 17-21; con- 208ngestion and, 85, 87; for container Wharfage: defined, 219vessels, 169, 188; improved by ship's White, Bruce, 86n, 90n, 103nlabor, 180n; port size and, 19n. See Wolf Berry and Associates, 86n, 90n,also Congestion; Throughput 103n

THE MINING INDUSTRY ANDTHE DEVELOPING COUNTRIESRex Bosson and Bension Varon
"An excellent account of how the worldmining industry operates, some of thechanges it is going through, and the relatedconflicts between private business andnational governments."
-Foreign Affairs
"Required reading for anvone concernedwith the economics of a mineral-producingcountry."
-Business Times
292 pages. Figures, tables, bibliography.Available in cloth and paper editions.
ECONOMY-WIDE MODELS ANDDEVELOPMENT PLANNINGEdited by Charles R. Blitzer, Peter B.Clark, and Lance Taylor
T welve essavs survev the specification anduses of economv-wide planning models fordeveloping countries, with attention focusedon a medium-term and perspective planning.Designed to aid both practical planners andpotential model builders bv providing asummarv of techniques and a discussion ofthe performance of the models.
384 pages. Figures, tables, bibliography.Available in cloth and paper editions.
Jacket design by Richard Stoddard.World Bank photo by Tomas Sennett.

The World Bank-
THE EFFICIENT OPERATION of a developing country's port is vital to thehealth of that country's economv. Not only should the port perform itstransport services properly, but these services should be priced to dis-tribute the benefits of port investments between the domestic economyand foreign interests.
Although manv ports try to promote the national interest, up to nowthere has been no coherent principle on which to base pricing and tariffpolicies. As a result, three-month queues block some ports while otherslanguish with empty berths, and benefits constantly leak awav to foreignshipowners and traders.
This book analyzes pricing policies for port services and the use ofprices to control the distribution of benefits, and it recommends pricingand invesment policies designed to increase the economic well-being of
developng countries. Bv offering the first sustained application of the
principTs of economics to the pricing policies of ports, the authors pro-
mote the concept of cost-based port tariffs.
The basic argument of the book is that the efficient operation of a port
requires its authorities to levy prices that are based on short-run marginal
cost. This implies that when dcmand for the facilities is persistently high
and there are substantial queues, the authority should raise the tariff by
adding a congestion levv. Correspondingly, when demand is low relative
to port capacity, the authorities should use two-part tariffs to promote
more traffic.
Port managers, planners, and accountants; management and economists
in shipping enterprises; economiiists in transport and finance ministries;
and teachers and students of transport cconomics will find this addition
to the literature to be instructive and necessary reading.
Esra Bennathan is a consultant to the World Bank and professor of
political economy at the University of Bristol. Alan A. Walters is urban
adviser to the Central Projccts Staff of the World Bank and professor
of economics at The Johns Hopkins University.
Oxford University Press ISBN 0-19-520092-6
Copyright © 2022 FDOKUMEN