Port Phillip Bay
20
Port Phillip Bay Joe Sampson, Alan Easton, and Manmohan Singh Abstract Port Phillip Bay (also commonly referred to as Port Phillip) is a large bay in Victoria, Australia. It is an urban waterway as it drains Melbourne. The bay has a narrow entrance, where tidal velocities are high. Port Phillip was formed about 6,000 years ago. Aborigines had lived in the area for tens of thousands of years. Europeans first arrived in the area in 1802. The bay has a temperate climate. The tides, due to the Moon and Sun, fluctuate vertically by about 2 m at the entrance and less than 1 m for the rest of the bay. Waves in the bay are mainly generated by the wind. The bay has 132 beaches, which are quite popular for swimming. The bay and its environs are home to a variety of flora and fauna. A substantial amount of shipping comes from and goes to the Port of Melbourne. Over four million people live around the bay. The population quite possibly could double in the next 40 years, putting pressures on the environment. The Federal, State and Local governments involved with the bay will have to cope with the effects of global warming, which will likely intensify with time. It could cause flooding of bayside areas regularly. Substantial population growth in the future could cause pollution and put increased demands on the water supply to Melbourne. The Victorian Government has plans to deal with these matters. Keywords Port Phillip History Tides Global warming Storm surges Waves Beaches Ecology Shipping Urban areas J. Sampson (*) M. Singh Mathematics Discipline, Faculty of Engineering and Industrial Sciences, Swinburne University of Technology, Hawthorn, VIC 3122, Australia e-mail: [email protected]; [email protected] A. Easton Academic and Student Affairs, University of Papua New Guinea, Port Moresby, Papua New Guinea e-mail: [email protected] E. Wolanski (ed.), Estuaries of Australia in 2050 and Beyond, Estuaries of the World, DOI 10.1007/978-94-007-7019-5_4, # Springer Science+Business Media Dordrecht 2014 49
Transcript of Port Phillip Bay

Port Phillip Bay
Joe Sampson, Alan Easton, and Manmohan Singh
Abstract
Port Phillip Bay (also commonly referred to as Port Phillip) is a large bay in Victoria,
Australia. It is an urban waterway as it drains Melbourne. The bay has a narrow entrance,
where tidal velocities are high. Port Phillip was formed about 6,000 years ago. Aborigines
had lived in the area for tens of thousands of years. Europeans first arrived in the area in
1802. The bay has a temperate climate.
The tides, due to the Moon and Sun, fluctuate vertically by about 2 m at the entrance and
less than 1 m for the rest of the bay. Waves in the bay are mainly generated by the wind. The
bay has 132 beaches, which are quite popular for swimming. The bay and its environs are
home to a variety of flora and fauna. A substantial amount of shipping comes from and goes
to the Port of Melbourne. Over four million people live around the bay. The population
quite possibly could double in the next 40 years, putting pressures on the environment. The
Federal, State and Local governments involved with the bay will have to cope with the
effects of global warming, which will likely intensify with time. It could cause flooding of
bayside areas regularly. Substantial population growth in the future could cause pollution
and put increased demands on the water supply to Melbourne. The Victorian Government
has plans to deal with these matters.
Keywords
Port Phillip � History � Tides � Global warming � Storm surges � Waves � Beaches � Ecology �
Shipping � Urban areas
J. Sampson (*) � M. Singh
Mathematics Discipline, Faculty of Engineering and Industrial
Sciences, Swinburne University of Technology, Hawthorn,
VIC 3122, Australia
e-mail: [email protected]; [email protected]
A. Easton
Academic and Student Affairs, University of Papua New Guinea,
Port Moresby, Papua New Guinea
e-mail: [email protected]
E. Wolanski (ed.), Estuaries of Australia in 2050 and Beyond, Estuaries of the World,
DOI 10.1007/978-94-007-7019-5_4, # Springer Science+Business Media Dordrecht 2014
49

Box 1
Joe Sampson and colleagues studiedMelbourne-fringed
Port Phillip Bay in temperate Australia. Europeans first
arrived in the area in 1802; over four million people
now live around the bay. A substantial amount of
shipping comes and goes to the Port of Melbourne. As
a result the bay was substantially degraded but in recent
decades the Victorian Governments initiated major
water quality remediation measures. In the future The
Bay will have to cope with the effects of global
warming, which could cause flooding of bayside areas
regularly, as well use a likely doubling of the population
by 2030 that would exacerbate pollution and put
increased demands on the water supply to Melbourne.
The Victorian Government has plans to deal with these
matters and Melbourne’s future looks promising
provided relevant Federal, State and Local governments
take necessary actions.
Introduction
Port Phillip Bay is a large bay in Victoria, Australia.
Melbourne, the capital of Victoria, is at its northern edge.
The Bay has a narrow entrance, where tidal velocities are
high. The entrance is known as Port Phillip Heads or The
Rip. The southern section of the bay, near the Heads,
contains extensive sand banks, that are uncovered at low
tide. The bay area is about 1,900 km2. It is about 58 km
from North to South and 65 km from East to West at its
widest points. Unlike most bays it has a narrow entrance.
There are high tidal velocities at the entrance. It is deepest at
the entrance, reaching about 100 m. However, most of the
bay is fairly shallow, with depths usually below 20 m. The
coastline is about 250 km long from Point Lonsdale to Point
Nepean, which are on opposite sides of the entrance, which
is about 3 km wide. Much of the coastline is urbanised.
Figure 1 is a detailed locality map of Port Phillip Bay.
Figure 2 is a location map of The Bay. Figure 3 is a detailed
map of Port Phillip. Figure 4 shows some locations and
depth contours in The Bay.
Rivers and Creeks
A number of rivers and creeks flow into Port Phillip Bay (see
Fig. 1). The most significant is the Yarra River, which enters
the bay at Melbourne and begins in the Yarra Ranges. The
Yarra River is 242 km long. The Yarra has about 50
tributaries feeding into it. There are several species of fish
in the Yarra. The Upper Yarra Reservoir was built in 1957,
mainly to reduce flooding downstream. This reduced the
river’s average flow by half.
The following is a summary of information from
Melbourne Water (2012). The Yarra is in good condition
in the upper sections, where it flows through forested, moun-
tain areas that have been used for water supply for 100 years.
But in the lower reaches it is in poor condition due to
erosion, pollution, weeds and changes to land use and river
flows. As land in the middle and lower sections was cleared
for agriculture and urban development clay soils were
eroded giving the river a muddy colour. Over the past
20 years, however, there has been a general improvement
in the river’s water quality resulting from the increased
sewering of catchments and the diversion of industrial
discharges into the sewerage system. In recent years, loss
of habitat has been slowed through revegetation, erosion
control and removal of barriers to fish migration. This has
helped some animals, such as platypus, which have been
found again in areas where they had disappeared.
50 J. Sampson et al.

Other confluents include the Werribee River,
Maribyrnong River, Little River, Patterson River and
Mordialloc Creek (see Fig. 1).
Rivers’ and Creeks’ Water Quality
Melbourne Water, a Victorian Government authority,
manages Melbourne’s water supply catchments, sewage,
rivers and major drainage systems throughout the Port
Phillip region. It monitors water quality at 136 sites along
rivers and creeks in the Port Phillip and Westernport region.
The water monitoring plan is designed to assess long-term
trends (typically over 10 years). Sites are sampled monthly
and tested for the following water quality indicators: water
temperature, dissolved oxygen, salinity, pH level, nutrients
Fig. 1 Port Phillip Bay, showing,
bathymetry, locations and rivers
(Melbourne Water and CSIRO)
Fig. 2 Location map of Port Phillip Bay (From Ryder et al. 2004)
Port Phillip Bay 51

(e.g. a nitrite, ammonia), faecal contamination (E. coli) and
metals (e.g. arsenic, copper). Each year a water quality fact
sheet is produced with annual summary data for all the sites.
Summary statistics for E. coli measurements (in orgs/
100 mL) at six sites shown for 2011 in Table 1 are: the
number of samples collected (‘n’), the minimum and maxi-
mum levels measured, and the 25th, 50th and 75th
percentiles. The EPA (environmental Protection Agency)
Victoria’s objective is for the 50th percentile to be less
than 150 orgs/100 ml. It can be seen that for the six sites
the results overall are not satisfactory, which is true overall
of all of the sites.
Fig. 3 Detailed map of Port Phillip (Wikipedia). White indicates urban areas
Fig. 4 Depth contours (m) and locations in Port Phillip Bay. Locations
are indicated by letters; P is for Pt. Lonsdale, R for Pt. Richards Channel
No. 1, Q for Queenscliff, H for Hovell Pile, C for West Channel Pile,
G for Geelong,W forWilliamstown,A is in the South Channel, S is in theSymonds Channel and T is in the Portsea Channel
Table 1 E. coli (orgs/100 mL) at six sites for 2011
E. coli (orgs/100 mL) n Min 25th % 50th % 75th % Max
Kananook Creek 11 200 600 780 5,300 19,000
Little River 11 0 20 80 130 190
Maribyrnong River 11 20 70 100 280 6,000
Mordialloc Creek 10 130 260 370 745 6,500
Werribee River 11 20 160 200 420 760
Yarra River 11 80 255 320 710 5,500
Melbourne Water (2011)
52 J. Sampson et al.

Geology
According to Short (2005) the uplifted Mornington Peninsula
(bordering the south and south-east of the bay) is composed of
200–500 million year old sedimentary rocks (i.e. rock frag-
ments moved bywind, rain and other agents and which in time
solidify) and metasedimentary rocks (i.e. sedimentary rocks
changed due to changes in physical and chemical conditions)
while the bay and the western shore are a depression covered
in the north by Miocene (10–25 million year old) coarse
sedimentary rocks and in the west by Pliocene (2–10 million
year old) coarse sedimentary rocks and to the south the
Bellarine Peninsula borders the depression and is composed
of Tertiary (3–65 million year old) sediments and volcanics.
History
The bottom of Port Phillip Bay and Bass Strait had been part
of a land surface joining Victoria and Tasmania (Keble
1946). Port Phillip Bay was formed about 6,000 years ago
during the last Ice Age when the land surface area was
flooded (Bird 2006).
The Aboriginal people lived in the area now the base of
the bay from 20,000 to 40,000 years ago; in oral history there
are stories of the flooding of the bay (Broome 2005). Prior to
the arrival of Europeans in the Port Phillip region there were
already five aboriginal language groups (the Wathaurong,
the Woiwurrung, the Daungwurrung, the Djadjawurung and
the Boonwurrung), together known as the Kulin nation,
totalling about 10,000 at the time of the Europeans’ arrival.
The aborigines were semi-nomadic, hunting animals
(including kangaroos, emus, wallabies, echidnas, possums,
wombats, turkeys, lizards, quolls and grubs) and fish (includ-
ing crayfish, shellfish, mussels and scallops), making use of
boomerangs, spears, fish hooks and nets; they also collected
plant foods (Presland 2010). Presland provides an account of
life in a Boonwurrung camp close to the shore of Port Phillip
Bay, in the warmer months of the year. A camp might
comprise 30 people. Campfires were lit. Gum from trees
was used not only as a source of sugar but also for plugging
leaks in wooden water containers.
The first British to enter the bay were the crew of HMS
Lady Nelson, captained by Lieutenant Murray (Lee 1915).
Murray sent his first mate, Mr. Bowen, with a small crew of
five to examine Port Phillip Bay. The launch returned and
the first mate reported that he had found an entrance to the
harbor. He saw no aborigines but did see their huts. Murray
arrived there on February 15th 1802. He named a high
mountain in the south east Arthur’s Seat; and a group of
islands where swans were plentiful, which he named Swan
Isles (they comprise Swan Island and neighbouring islands).
He named the bay Port King after Governor King of New
South Wales. King renamed it Port Phillip, after the first
Governor of New South Wales. Murray noticed a number of
aboriginal fires and huts. At one stage onshore Murray and
some others met a group of male aboriginals, each in possum
skins and each with a bundle of spears. At first relations were
friendly but later there was an altercation in which the
aboriginals threw spears and the British fired guns. Murray
reported favourably on the soil and vegetation. Murray took
possession of the Port on the 8th of March. Murray reported
back to Governor King on March 24th.
On April 27th 1802 Captain Matthew Flinders, of Royal
Navy, entered Port Phillip Bay, thinking that he was the first
British person to discover it (Flinders 1814), unaware that
Murray had been there 10 weeks earlier. Flinders named
Indented Head (on the west coast of the bay) where he met
some aborigines with whom he exchanged presents. Flinders
stated that the country surrounding the bay was fertile and
suitable for agriculture. Flinders said that “were a settlement
to be made at Port Phillip, as doubtless there will be some
time hereafter, the entrance could be easily defended; and it
would not be difficult to establish a friendly intercourse with
the natives.” When he arrived in Sydney on May 8th he
recommended to the Governor that a penal colony be built
on Port Phillip Bay.
The British government decided to establish a convict
settlement on Port Phillip Bay (Bonwick 1857). In early
1803 Governor King sent Charles Grimes, surveyor-general
of New South Wales, to walk round and survey the bay; on
February 2 Grimes discovered the Yarra River, which enters
the bay at the northern end (Flemming 1803). In late 1803
Colonel Collins was sent out from England to make a con-
vict settlement at Sullivan Bay, near Sorrento. The convicts
were 367 males, 17 with their wives, plus 7 children, one of
whom, John Fawkner, was a co-founder of Melbourne.
Some convicts, escaped including a William Buckley, who
lived with the aborigines for several years. According to
Broome (2005) the aborigines “believed him to be
Murrangurk, a deceased relative, transformed into ghost-
like whiteness and strangely bereft of his former language
and customs. They took him in, tolerated his oddness and
gave him a wife.” Presland (2010) says that Buckley lived
with them for 32 years and that “the arrival of Batman’s
party at Indented Head in June 1835 attracted Buckley’s
interest and awakened in him a desire to re-enter European
society. His published reminiscences of his 32 years with the
Wataurong today provide invaluable information about the
pre-European way of life of Aboriginal people in the Port
Phillip area.” Collins was not satisfied with the settlement
and moved to Tasmania (Bonwick 1857).
John Batman, who had been a settler in Tasmania in
1835, bought from eight aborigine chiefs 600,000 acres of
Melbourne for some blankets, knives, looking glasses,
Port Phillip Bay 53

tomahawks, beads, scissors, flour and other objects
(Bonwick 1857). The British government rejected the deal
(Broome 2005). On the 15th of August, 1835, a group of
people, including John Fawkner, arrived at Port Phillip Bay.
They shortly afterwards settled in the Melbourne area. The
Melbourne settlement gradually expanded, with suburbs
gradually extending along the west and east coasts and
well into the hinterland. In 1838 the town of Geelong, on
the southwestern coast of the bay, was proclaimed.
In 1906, G. H. Rogers, then head teacher of Dromana
State School, wrote to Gordon McCrae and asked him as one
who had lived at Arthur’s Seat (an inland suburb adjacent to
Dromana), at the south east of the bay, from the 1840s, to
give him an account of those days (Daley 1940). McCrae
replied in two letters, including a detailed description of the
animals. He said: “My father took up Arthur’s Seat. . .about
1844. I arrived there. . .with my brothers”.
Of aborigines he said “There was a tolerably large tribe of
natives on the run, and we have had as many as 200 at a time
camped in our paddocks. They were a mild, inoffensive
people, largely a fishing tribe, and seemed to enjoy a sense
of security when within the posts and rails far larger than that
in the open. We could trust them with guns or arms of any
kind and found them honest and most useful about the place
in aid of other people. The young fellows made excellent
stock riders. Some of the women washed well, and the men
in several instances shot for the pot and hunted and killed
kangaroos for us with our dogs.”
He said “Our house we built entirely (save fittings) from
hardwood timber, mainly stringy-bark from trees that we
felled at the back of the mountain towards the north, where
there was any amount of box, stringy-bark, peppermint, and
messmate.”
Of fish he said “We did a lot of fishing and found a
splendid schnapper-ground off Mt. Martha Point. I remem-
ber once our filling the boat right up to the sights one
afternoon with schnapper weighting from 13 to 16 lb. each.
We baited our lines with mutton-fish or Venus’ ear, the
shells of which we prised off the rocks with our knives.
Along with the schnapper we had coat-fish, parrot-fish and
leather-jackets, but out on the sandy bottom opposite the
house we always got flathead, dog-fish very often, and along
the shore we used to have some sport with sting-rays and
shark-tailed rays, as also the pig-fish (Castracion) which is
said to be as old as the world”.
Of the animals he said “when I was in my ‘teens, we had
kangaroos in immense droves, also brush kangaroos or wal-
laby, and paddy-melon, bandicoots of two varieties, the
great opossum of two sorts, also the ring-tail, the flying
squirrel and flying mouse. In the gullies we had the wild
dog or dingo, which we caught occasionally in box-traps
with a sliding up-and-down door; at the back of the mountain
the porcupine ant-eater or echidna in numbers”. “Of reptiles
we had the great iguana or tree-lizard, running to 5 ft in
length; a considerable variety of snakes, including a python;
many lizards of different sizes and figures, and with these the
rock or sleeping lizard.”
On the beaches he said “we had the pelican, the penguin,
the grey and grey-white gull, which the blacks called
‘bungan’, the small white and lavender gull, the pied
oyster-catcher, the tern, the cormorant and the little sand-
piper and musk duck.”
In the swamps were “the Nankeen bird with one long white
drooping feather behind the ear; the rail, the bittern, the snipe
and jack-snipe, ducks of several sorts – wood duck, black
duck, teal, spoonbill, black swan, and geese, cranes blue and
white, coots, water-hens, kingfishers here and there, also the
swamp or ground-parrot with the barred tail feathers.”
On the flats were “spur-wing plovers, minas, and
leatherheads, besides in the timber outside many varieties of
parrot – lorry, rosella, blue mountain or honeysuckle parrot,
sulphur-crested white cockatoo, black cockatoo of two kinds,
grey cockatoo with scarlet crest, corella or cockatoo parrot.
Among the cherry trees specially the bronzewing pigeon and
satin birds.”
In the scrubs by the waterholes were “the various honey-
eaters, warblers, and red-coat robins, also the emu-wren with
the two long emu feathers in its tail; the laughing jackass
everywhere, and frequently the butcher-bird (a shrike, but
known to some as the whistling jackass). In the bottoms
where there was good cover there was any amount of
quail. The turkey was not within our limit; none nearer
than Boneo or the big swamp. Of birds of prey we had
very large eagle-hawks, falcons, also owls, some of the
white and of great size. Beyond the honey-eating parakeets
and love birds – though there must be more – I find myself at
the end of my bird-list.”
The timber included coast Banksia (or honeysuckle) and
grass-tree.
Climate
Port Phillip Bay has a maritime temperate climate (Sturman
and Tapper 1996). The weather is very changeable due to the
receiving of air movements both from the warm inland areas
and the cold Antarctic Ocean. According to Black and
Mourtikas (1992) winds are variable although westerlies
prevail in winter and southerlies or south-westerlies in sum-
mer. The summers are warm, having a mean maximum
temperature of about 25 �C and a mean minimum of 14 �C,while the winter figures are 14 �C and 7 �C. Annual rainfallfluctuates greatly, ranging from about 400 mm on the north-
western shore to about 800 mm on the southeastern shore.
Nicholls and Larsen (2011) provided evidence that
Melbourne has warmer weather when there are northerly
54 J. Sampson et al.

winds from the interior, particularly after a dry period. The
hottest temperature ever recorded for Melbourne was
46.4 �C on the 7th of February 2009. The coldest tempera-
ture ever for Melbourne was �2.8 �C on the 21st of July
1869. The wettest year in Melbourne was 1916 when
968 mm fell. The wettest month in Melbourne was February
1972 when 238 mm fell. The wettest day in Melbourne was
the 3rd of February 2005 when 113 mm fell.
Tides
The tides, the vertical and horizontal motion of the water due
to the gravitational pull of the Moon and Sun, have a maxi-
mum variation of height of about 2 m at the entrance and
generally about 1 m for the rest of the bay. The tide enters
the bay at Port Phillip Heads from Bass Strait. Experimental
measurements show that the current is fast in the vicinity of
the entrance, of the order of 4 m per second, but very small
for most of the bay and that the maximum tidal height
diminishes sharply from Point Lonsdale at the entrance to
Queenscliff, which is about 4 km away inside of the bay. For
regions just beyond the Sands region in the South of the bay,
high tides occur approximately about 3 h after they occur at
Point Lonsdale, at the Port Phillip Heads.
There is an approximate 12 hourly cycle to the tides. The
times of greatest current at the entrance are times of greatest
water slope; this is either at high water or low water at Port
Phillip Heads. Slack water at any point in the bay is followed
by high water about 3 h later, then slack water 3 h later then
low water 3 h later then slack water 3 h later and so on. At
slack water the water slope is close to horizontal and there is
little motion throughout the bay. Tidal flow changes direc-
tion at Port Phillip Heads slightly after slack water. At high
water at Port Phillip Heads the water flows into the bay while
at low water it flows out.
The tides are modified by the wind. The Port of
Melbourne Corporation issues tide tables for Point Lonsdale,
Melbourne and Geelong (Port of Melbourne Corporation
2013) which are useful for boating and shipping. These
tables are based on calculations from the National Tidal
Centre, which is run by the Bureau of Meteorology. These
tables give the times of high tides and low tides (occurring
successively approximately) every 6 h, plus at Port Phillip
Heads only the flood times (when the tide starts to flow into
the bay) and the ebb tides (when the tide starts to flow out
of the bay). The tide tables assume a calm bay and hence
ignore the effect of winds on heights. The Bureau of Meteo-
rology website gives similar results plus maximum and
minimum tidal current speeds.
Tide stream signals are shown by night at the Point
Lonsdale lighthouse below the main light. For the first half
of the flood stream there is one green light and two green
lights for the second half of the flood. For the first half of the
ebb stream there is one red light and two red lights for the
second half.
The highest and lowest of tides occur in the wake of
South Westerly and Northerly winds respectively (Easton
1970). In spite of such effects predictions at Williamstown
usually are quite accurate. A highest recorded tide of
2.044 m above chart datum was recorded on 30th November
1934 after a severe storm South Westerly storm. The lowest
recorded tide of �0.356 m occurred on 19th September
1926. These extreme levels compare with the mean high
water level of 0.79 m and the mean water level of 0.23 m.
Under normal weather conditions negative tides are not
recorded. In the 22 years from 1934 to 1956 the tide
exceeded 1.5 m on four occasions and, each time, it was
accompanied by a deep depression of 980 millibars or less.
The centre of a depression must be South of Melbourne to
cause such extreme tides. The highest recorded tide at Port
Phillip Heads was 2.160 m recorded on 4th July 1981. The
lowest recorded tide was 0.400 m recorded on 27 October
1972. In contrast the mean highest tide is 1.35 m and the
mean lowest tide is 0.45 m. The highest recorded tide at
Geelong was 1.619 m, recorded on 29th June 1980. The
lowest recorded tide at Geelong was 0.231 m, recorded on
7th March 1972. In contrast the mean highest tide was
0.85 m and the mean lowest tide is 0.35 m.
On 28th November 1954, following a change of wind
from North to South, the tide level at Williamstown rose
0.43 m in 30 min and then fell 0.34 m in 55 min (Bradley
1957). Similar short period changes occur frequently.
Seiches with ranges of up to 0.46 m are also common in
Port Phillip Bay. A seiche is a standing wave. Seiches
usually follow the passage of a front across the bay.
An analysis of the Williamstown tide record at the time of
the Krakatoa eruption showed oscillations with a range of
0.10 m and a period averaging 86 min; they were not con-
sidered to result from that eruption (Wharton 1888). This
record contained a wave with a period of 8.3 h (Honda et al.
1908) calculated as the period a seiche would have in Port
Phillip Bay.
At Point Lonsdale winds and seiches produce more irreg-
ular tides. Tidal currents, which may reach 10–15 km/h, are
greatest when the differences between the levels in Port
Phillip Bay and Bass Strait are largest.
The sea level at various locations in Port Phillip Bay is
measured by tide gauges. The Port of Melbourne Corpora-
tion operates six tide gauges in Port Phillip Bay at Point
Lonsdale, Queenscliff, West Channel Pile, Hovell Pile,
Fawkner Beacon andWilliamstown. The Victorian Regional
Channel Authority operates tidal gauges at Geelong and
Point Richards (see Fig. 4). The data from the gauges is
sent daily to the National Tidal centre, operated by the
Bureau of Meteorology. The tide record for at least 1 year,
Port Phillip Bay 55

preferably 3 years, is mathematically analysed into a number
of components called tidal constituents (or partial tides).
Each constituent is what is called a sine wave, defined by
three terms; the amplitude, period and phase. The amplitude is
a measure of the strength of the term, the period the time
between successive repetitions of the term and the phase
measures when it starts repeating itself. The period of each
term is known beforehand by gravitational theory, being
determined by the motion of the moon or sun or both. On
the other hand, amplitudes and phases are obtained by mathe-
matical analysis of tidal gauge data. Once the values of the
terms for each constituent are determined at a given site the
height of the tides can be predicted at that location for the next
calendar year by adding the partial tides. Similar analysis
occurs for predicting the tidal current at Point Lonsdale.
Figure 5 shows an example of one partial tide at Point
Lonsdale: the M2 component. The vertical coordinate is
height and the horizontal coordinate time. The amplitude
(i.e. the height of each peak above the horizontal axis) is
0.455 m., the period (i.e. the horizontal distance between
successive peaks) is 12.42 h and the phase 36.5� (this is
related to when the curve first crosses the time axis at
1.3 h). M2 is caused by the moon’s gravitational pull. Fig-
ure 6 shows the K1 constituent over 1 day. K1 is caused by
the moon’s and the sun’s gravitational pull. K1 has ampli-
tude 0.149 m, period 23.93 h and phase 280.5�.The addition of partial tides is illustrated in Fig. 7 by the
adding of M2 and K1, the two the largest constituents at
Point Lonsdale. The resultant sum is two unequal high tides
and two unequal low tides each day.
Figure 8 shows the sum of the M2, K1, S2, O1 and N2
partial tides at Point Lonsdale over 1 day. These five partial
tides give an accurate estimate of the total tide, although the
National Tidal Centre uses 112 partial tides to give a more
accurate picture. Figure 9 shows the sum of the M2, K1, S2,
O1 and N2 partial tides at Point Lonsdale over 31 days. The
tidal range around day 4 is almost twice what it is around day
12. This alternation of high tidal and low tidal range is called
spring tides and neap tides. This is a common feature
throughout Port Phillip Bay.
As only a limited number of tidal gauges exist in Port
Phillip Bay to better understand the variation of tidal heights
(and tidal currents) throughout the bay the tides can be
modelled mathematically using equations derived from
physics e.g. the shallow water equations (Vreugdenhil
1998). Because Port Phillip Bay has a mathematically
5 10 15 20t (hrs)
–0.6
–0.4
–0.2
0.2
0.4
0.6
z (m)
Fig. 5 The M2 partial tide at Point Lonsdale
5 10 15 20t (hrs)
–0.6
–0.4
–0.2
0.2
0.4
0.6
z (m)
Fig. 6 The K1 partial tide at Point Lonsdale
5 10 15 20t (hrs)
–0.6
–0.4
–0.2
0.2
0.4
0.6
z (m)
Fig. 7 The sum of the M2 and K1 partial tides at Point Lonsdale
5 10 15 20t (hrs)
–0.8
–0.6
–0.4
–0.2
0.2
0.4
0.6
z (m)
Fig. 8 The sum of the M2, K1, S2, O1 and N2 partial tides at Point
Lonsdale over 1 day
56 J. Sampson et al.

complicated shape these equations cannot be solved exactly;
they must be solved approximately, although still with great
accuracy, using computers to do the large number of
calculations required. Such calculations are called numerical
modelling. To test the accuracy of any model used the
measured tidal heights at places where tidal gauges exist
and measured tidal currents at certain locations are com-
pared with modelled results. Input to the model are the
values of the main partial tides (e.g. the five most significant)
near the entrance to the bay. A number of papers have been
published on modelling the tides in Port Phillip Bay. These
include papers by Easton (1978), Black et al. (1993), Walker
(1997), Lawson and Treloar (2004a, b) and Sampson (2008).
Storm Surges
Storm surges, the flooding of land from sea during a storm,
do occur regularly in Port Phillip Bay.
For example, a storm surge occurred in May 1994, which
caused inundation of low-lying areas in the suburb of South
Melbourne. According to McInnes and Hubbert (1996)
storm surges are most frequently caused by periods of
sustained westerly winds which occur when cold fronts
travel along the southern Australian coast; they mainly
occur in Autumn and Spring.
Bird (2006) said “there have been many storms in Port
Phillip Bay, and at the end of November 1934 there was a
major storm surge. A combination of heavy rainfall and river
flooding, low barometric pressure and southerly gales raised
high tide water level in the bay by as much as a metre. This
caused extensive flooding, rapid erosion of cliffs cut in soft
clay and sandstone on the east coast of the bay, and erosion
of beaches.”
Hubbert and McInnes (1999) modelled two storm surges
that occurred on two occasions in Port Phillip Bay in 1994
using shallow water equations similar to those used in
modelling tides; the equations include meteorological
effects. The graph of observed and modelled sea levels at
one location over a 60 h period shows the two curves to be
fairly close to each other.
Waves
The waves in Port Phillip are mainly caused by wind (they
can be generated by vessels). According to Lawson and
Treloar (2004a) the ocean waves (caused by ocean winds)
do not penetrate Port Phillip Bay north of the Sands, the
shallow region in the south of the bay. For the rest of the bay
the waves are generated by winds blowing over the bay.
The period of a wave is the time for one wave to pass a
fixed point, typically about 10 s. A wave recording system
has been deployed off the coast of Point Lonsdale since
1993, being currently operated by the Port of Melbourne
Corporation. Wave data is available online from www.
portofmelbourne.com/shipping/weather/waves/wavedadata.
aspx The data shown is: the maximum wave height over a
half-hour length of time (typically about 4 m); the significant
height (i.e. the average height of the highest one third of
waves in the half-hour, typically about 3 m), the peak wave
period (the maximum wave period over the half-hour, typi-
cally 15 s) and the wave direction (generally in an approxi-
mate north or south direction depending on whether it is high
tide or low tide).
The wind-generated water waves can be mathematically
modelled using the shallow water equations, which are used
to model tides; the effect of wind is included in the
5 10 15 20 25 30t (days)
–0.5
0.5
z (m)Fig. 9 The sum of the M2, K1,
S2, O1 and N2 partial tides at
Point Lonsdale over 31 days
Port Phillip Bay 57
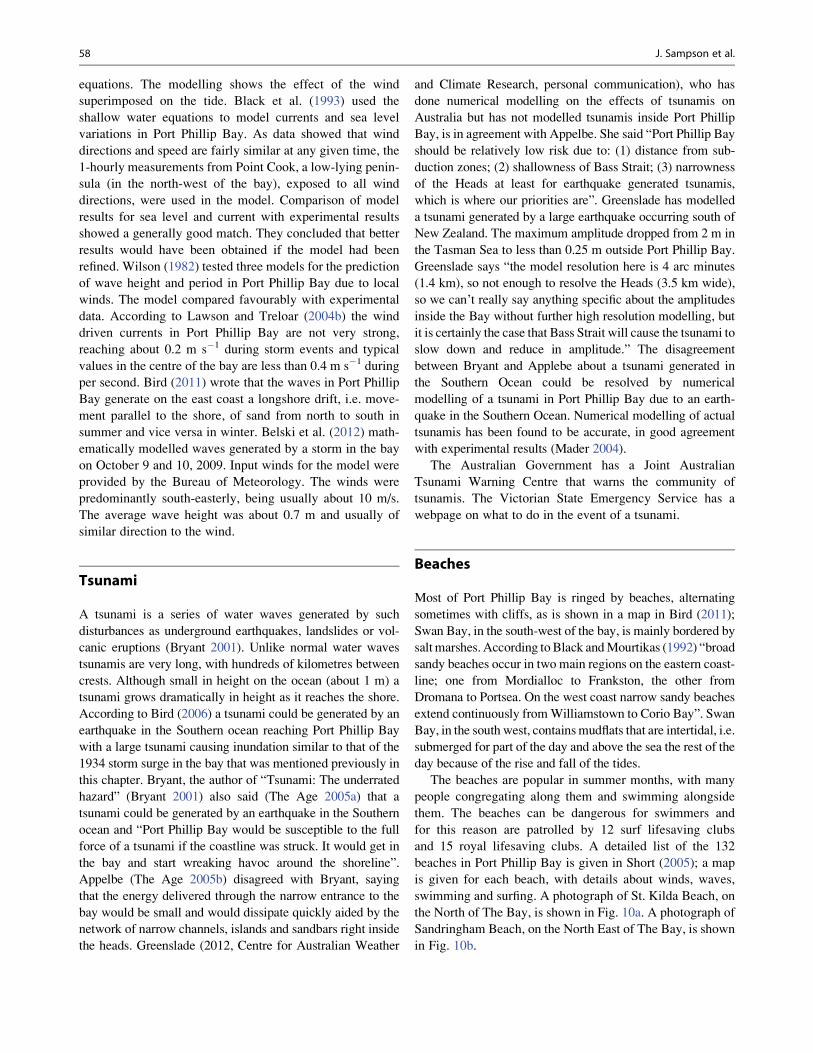
equations. The modelling shows the effect of the wind
superimposed on the tide. Black et al. (1993) used the
shallow water equations to model currents and sea level
variations in Port Phillip Bay. As data showed that wind
directions and speed are fairly similar at any given time, the
1-hourly measurements from Point Cook, a low-lying penin-
sula (in the north-west of the bay), exposed to all wind
directions, were used in the model. Comparison of model
results for sea level and current with experimental results
showed a generally good match. They concluded that better
results would have been obtained if the model had been
refined. Wilson (1982) tested three models for the prediction
of wave height and period in Port Phillip Bay due to local
winds. The model compared favourably with experimental
data. According to Lawson and Treloar (2004b) the wind
driven currents in Port Phillip Bay are not very strong,
reaching about 0.2 m s�1 during storm events and typical
values in the centre of the bay are less than 0.4 m s�1 during
per second. Bird (2011) wrote that the waves in Port Phillip
Bay generate on the east coast a longshore drift, i.e. move-
ment parallel to the shore, of sand from north to south in
summer and vice versa in winter. Belski et al. (2012) math-
ematically modelled waves generated by a storm in the bay
on October 9 and 10, 2009. Input winds for the model were
provided by the Bureau of Meteorology. The winds were
predominantly south-easterly, being usually about 10 m/s.
The average wave height was about 0.7 m and usually of
similar direction to the wind.
Tsunami
A tsunami is a series of water waves generated by such
disturbances as underground earthquakes, landslides or vol-
canic eruptions (Bryant 2001). Unlike normal water waves
tsunamis are very long, with hundreds of kilometres between
crests. Although small in height on the ocean (about 1 m) a
tsunami grows dramatically in height as it reaches the shore.
According to Bird (2006) a tsunami could be generated by an
earthquake in the Southern ocean reaching Port Phillip Bay
with a large tsunami causing inundation similar to that of the
1934 storm surge in the bay that was mentioned previously in
this chapter. Bryant, the author of “Tsunami: The underrated
hazard” (Bryant 2001) also said (The Age 2005a) that a
tsunami could be generated by an earthquake in the Southern
ocean and “Port Phillip Bay would be susceptible to the full
force of a tsunami if the coastline was struck. It would get in
the bay and start wreaking havoc around the shoreline”.
Appelbe (The Age 2005b) disagreed with Bryant, saying
that the energy delivered through the narrow entrance to the
bay would be small and would dissipate quickly aided by the
network of narrow channels, islands and sandbars right inside
the heads. Greenslade (2012, Centre for Australian Weather
and Climate Research, personal communication), who has
done numerical modelling on the effects of tsunamis on
Australia but has not modelled tsunamis inside Port Phillip
Bay, is in agreement with Appelbe. She said “Port Phillip Bay
should be relatively low risk due to: (1) distance from sub-
duction zones; (2) shallowness of Bass Strait; (3) narrowness
of the Heads at least for earthquake generated tsunamis,
which is where our priorities are”. Greenslade has modelled
a tsunami generated by a large earthquake occurring south of
New Zealand. The maximum amplitude dropped from 2 m in
the Tasman Sea to less than 0.25 m outside Port Phillip Bay.
Greenslade says “the model resolution here is 4 arc minutes
(1.4 km), so not enough to resolve the Heads (3.5 km wide),
so we can’t really say anything specific about the amplitudes
inside the Bay without further high resolution modelling, but
it is certainly the case that Bass Strait will cause the tsunami to
slow down and reduce in amplitude.” The disagreement
between Bryant and Applebe about a tsunami generated in
the Southern Ocean could be resolved by numerical
modelling of a tsunami in Port Phillip Bay due to an earth-
quake in the Southern Ocean. Numerical modelling of actual
tsunamis has been found to be accurate, in good agreement
with experimental results (Mader 2004).
The Australian Government has a Joint Australian
Tsunami Warning Centre that warns the community of
tsunamis. The Victorian State Emergency Service has a
webpage on what to do in the event of a tsunami.
Beaches
Most of Port Phillip Bay is ringed by beaches, alternating
sometimes with cliffs, as is shown in a map in Bird (2011);
Swan Bay, in the south-west of the bay, is mainly bordered by
saltmarshes.According toBlack andMourtikas (1992) “broad
sandy beaches occur in two main regions on the eastern coast-
line; one from Mordialloc to Frankston, the other from
Dromana to Portsea. On the west coast narrow sandy beaches
extend continuously fromWilliamstown to Corio Bay”. Swan
Bay, in the south west, containsmudflats that are intertidal, i.e.
submerged for part of the day and above the sea the rest of the
day because of the rise and fall of the tides.
The beaches are popular in summer months, with many
people congregating along them and swimming alongside
them. The beaches can be dangerous for swimmers and
for this reason are patrolled by 12 surf lifesaving clubs
and 15 royal lifesaving clubs. A detailed list of the 132
beaches in Port Phillip Bay is given in Short (2005); a map
is given for each beach, with details about winds, waves,
swimming and surfing. A photograph of St. Kilda Beach, on
the North of The Bay, is shown in Fig. 10a. A photograph of
Sandringham Beach, on the North East of The Bay, is shown
in Fig. 10b.
58 J. Sampson et al.

Beach Water Quality
EPA (Environment Protection Authority) Victoria, a govern-
ment body, monitors levels of entrecocci (bacteria),
measured in organisms/100 mL (org/100 mL) weekly at 36
beaches in Port Phillip Bay (see Fig. 11) (EPA Victoria
2012b). During the 2011–2012 summer season the EPA
found bacterial water quality suitable for swimming during
fine weather at Port Phillip Bay beaches during Summer
2011–2012, with only a handful of sites exceeding the
water quality trigger levels, with each of these exceedences
following heavy and persistent rain. The EPA assesses beach
water quality against bacterial water triggers. If a sample
greater than 400 org/100 mL is collected a resample is
collected; if the resample is again greater than 400 org/
100 mL a swim advisory is issued. If a sample of
1,000 org/100 mL is obtained a swim advisory is issued.
Long term trends in water quality at the 36 beaches are
assessed by comparisons of annual 75th percentiles against
the State Environment Protection Policy (Waters of Victora)
(SEPP (WoV)) 75th percentile objective of 150 org/100mlL.
Over a period of five summers (from 2007–2008 to
2011–2012) the objective was reached at 16 of the 36
beaches for all five summers, at 11 for four summers, at 11
for three summers and at one for two summers. In
2007–2008 all 36 sites reached the objective; in 2008–2009
35 did; in 2009–2010 34; in 2010–2011 23; in 2011–2012
19. The more rainfall in a summer the fewer the sites that
Fig. 10 (a) St Kilda Beach (The Age June 22 2012) (b) Sandringham Beach (The Herald Sun April 4 2012) (c) Burrunan Dolphins (The Age Sep16 2011) (d) Swanson Dock, Port of Melbourne, with container terminals; the Yarra River is in the foreground (Port of Melbourne Corporation)
Fig. 11 Beaches monitored by EPA Victoria
Port Phillip Bay 59

met the objective. According to EPA Victoria (2012b) “on
days of fine weather water quality was found to be generally
good but during and after rain, bacterial levels could be
elevated and exceed bacterial water level quality triggers”.
Table 2 shows a sample of results.
The results at 6 sites for 5 of the 16 weekly entrecocci
results over the 2011/2012 summer period are shown in
Table 3.
Salinity
According to EPA (2012a) “salinity is an important parame-
ter for the ecology, transport and mixing characteristics of
Port Phillip Bay. Salinity has been shown to influence the
abundance and composition of biological communities as
well as having physiological effects on hatching success and
growth of squid and prawns in other systems, even with
small (<5 psu) changes”. Table 4 shows annual mean salin-
ity at a number of places in The Bay (refer Figs. 5 and 13)
and comparisons with State Environment Protection Policy
(Waters of Victora) (SEPP (WoV)) objectives.
Islands
Port Phillip Bay has a small number of islands, most of
which are in the south of the bay. The largest is Swan Island,
of area 1.4 km2. The island is bordered mainly by marshes.
Fortifications were built on the island in the 1870s during the
Crimean War to stop a Russian invasion of the bay. The
island contains a training area for ASIS (the Australian
Secret Intelligence Service).
The Mud Islands in the south of the bay consist of three
low-lying islandswhich enclose a lagoon, which is surrounded
by a marsh. A large number of birds are on the island.
Ecology
In the History section of the chapter the flora and fauna in the
southeast of the bay in the nineteenth century, according to
George McCrae who lived there from the 1840s, was
discussed.
Wildlife that exists on land areas around the bay include
possums, kookaburras, cockatoos, lorikeets, bats, snakes and
foxes.
According to Museum Victoria (2006) there are 350 spe-
cies of fish in the bay, including sharks, stingrays, perch,
mullet, snapper, whiting and perch, plus many mammals,
Table 2 Enterococci (orgs/100 mL) 75th percentiles for a sample of beaches in Port Phillip Bay over five summer periods; SEPP (WoV)
objective: 75th percentile of 150 or/100 mL
Beach 2007–2008 2008–2009 2009–2010 2010–2011 2011–2012
Dromana 15 20 26 58 172
Mornington 47 155 20 70 160
Mentone 20 146 195 273 230
Hampton <10 <10 20 53 74
Williamstown 20 20 26 240 96
St Helens 68 <10 10 43 44
Rainfall (mm) Nov–Mar; average of five sites 224.8 165.0 250.8 463.2 312.7
EPA Victoria (2012b)
Table 3 The results at 6 Port Phillip Bay beaches for 5 of the 16 weekly entrecocci results (orgs/100 mL) over the 2011/2012 summer period
Beach 21 Nov 11 27 Dec 11 10 Jan 12 6 Feb 12 5 Mar 12
Seaford 210 10 52 63 250
Aspendale North 73 41 230 74 63
Beaumaris 96 500 510 460 330
Brighton 86 98 <10 30 41
Port Melbourne 20 16,000 51 330 990
Altona 10 320 1,000 120 52
EPA Victoria (2012b)
Table 4 Annual mean salinity (psu) compared to SEPP (WoV)
objectives (2008–2011)
Location SEPP (WoV) objective 2008 2009 2010 2011
Corio Bay 33.1–36.5 38.1 38.0 37.3 35.0
Hobsons Bay 32.1–35.5 36.8 36.7 35.5 32.4
Werribee 32.6–36.0 37.4 37.3 36.7 34.6
Central Bay 32.1–35.5 37.2 37.1 36.5 34.4
Dromana 33.1–36.5 36.9 36.8 36.0 34.3
60 J. Sampson et al.

including dolphins, sea lions, seals and whales. The Burrunan
dolphin species, discovered in 2011, lives only in the bay and
Gippsland Lakes, eastern Victoria (see Fig. 10c).
According to Department of Sustainability and Environ-
ment (2012a) the bay also supports several hundred species
of molluscs, several hundred species of crustaceans, at least
200 species of seaweeds, several hundred species of
polychaetes (bristle worms), two species of seagrass, several
hundred species of cnidarians (jellyfish, corals, etc.) and
several hundred species of sponges.
The Port Phillip Bay Environmental Management Plan
(EMP) has a number of objectives including the most impor-
tant priorities – to reduce nutrient and marine pest risks
(The State of Victoria, Department of Natural Resources
and Environment 2002). Action on implementation of the
EMP is reported annually. Copies of these annual reports can
be found at http://www.dse.vic.gov.au/coasts-and-marine/
marine/report-library
The Seagrass and Reefs Program for Port Phillip Bay (The
Program) (Department of Sustainability and Environment
2012b) is a Victorian Government program. The aim of the
program is to better understand the ecology of seagrass and
temperate reef habitats to ensure the sustainability of the
marine environment and to have Government, industry and
community better informed and so better able to manage the
bay marine environment. As seagrasses and reefs are impor-
tant fish habitats, it will be of benefit to have improved
management of these ecosystems. A recent study found that
the health of the seagrass (measured by seagrass cover, length
and stem density) is higher or consistent with past seasonal
trends at six of eight monitoring sites (Hirst et al. 2012).
The “Taxonomic Toolkit for Marine Life of Port Phillip
Bay” (Museum Victoria 2012) provides information and
images for over 1,000 animal species inhabiting The Bay.
It is useful for marine scientists, environment managers and
the general public.
The Port Phillip Bay (Western Shoreline) and Bellarine
Peninsula Ramsar site involves seven separate areas, mainly
along the western coast of the bay (see Fig. 12); it includes
Swan Bay and the Mud Islands (the Ramsar Convention is
an intergovernmental treaty, whose member countries wish
to maintain the ecological character of their wetlands and
use them sustainably). According to the Victorian Govern-
ment Department of Sustainability and Environment website
Fig. 12 Port Phillip Bay (Western Shoreline) and Bellarine Peninsula Ramsar site (Department of Sustainability and Environment (Victoria))
Port Phillip Bay 61

“features of the site include more than 579 non-marine plant
species (of which 332 are native), more than 304 animal
species (of which 285 are native including 50 % of the global
population of the global population of the orange bellied
parrot), a drought refuge for water birds when inland lakes
and wetlands dry out and with sites of cultural heritage due
to wetlands plentiful in resources that have attracted Aborig-
inal tribes for thousands of years”.
Cohen et al. (2000) found that there is generally a
decreasing amount of biomass and species diversity with
increasing bay depth.
Costermans (1983) says that trees around Melbourne
include gums, stringybark, peppermints, box, coast banksia,
tea-trees, wild cherry and wattle.
Shipping
Because sections of Port Phillip Bay are fairly shallow
channels have been built, beginning in the late nineteenth
century to access berths in Melbourne and Geelong, with a
margin of safety beneath the bottoms of their hulls and the sea
bed. The South Channel is a shipping channel running in an
east–west direction from the bay entrance to near Dromana,
on the south-east coast. There are channels running into
Melbourne and into Geelong. A map of the navigation
channels and port waters is shown in Fig. 13. The Port of
Melbourne fronts onto Hobson’s Bay The POMC (Port of
Melbourne Corporation) is responsible for piers and wharves
in Melbourne and the Geelong Port for those in Geelong. The
draught for the Melbourne channels is 14 m. A photograph of
Swanson Dock, Port of Melbourne, is shown in Fig. 10d.
The Port of Melbourne is Australia’s largest container
and general cargo port, handling about 37 % of Australia’s
container trade. More than 40 shipping lines make around
3,100 ship calls a year to Melbourne. In 2011 the Port was
handling 2.5 million containers. This is expected to double
by 2025.
The history of the Port of Melbourne, which fronts onto
Hobson’s Bay, as discussed in Port of Melbourne Corpora-
tion (2012a, b), is summarised in this paragraph. An under-
water bar at the Yarra River entrance ruled out the entry of
vessels more than 9 ft of water. After the settlement of
Melbourne in 1835 ships arriving from overseas had to
drop anchor in Hobson’s Bay or Sandridge (Port Melbourne)
Pier. Passengers and goods then had to be shipped up the
river in smaller vessels. The rapid sixfold growth of Victoria
from 1851 to 1861 placed a lot of strain on the port. The
Yarra River was widened and deepened in the 1880s. Victo-
ria Dock, a major dock facility, was opened in 1893. By
1908 it was handling 90 % of Victoria’s imports. In 1914 its
capacity was enlarged by the addition of a central pier and in
1925 the entrance was widened. Between the two world wars
with rapidly increasing tonnage and size of ships channels
and berths continually required dredging. More and more
docks have been built over the years: Appleton in 1956,
Webb in 1960 and Swanson in 1969.
Mathematical modelling of tides was useful in predicting
beforehand the effect of the proposed Port Phillip Bay Chan-
nel Deepening Project, which began on 8 February 2008.
Prior to the project the guaranteed minimum depth in the
main commercial shipping channels of the bay was 11.6 m at
all tides. The government of Victoria, in the late 1990s,
announced plans to deepen the channels in the bay so that
they could accommodate ships of up to 14 m draft at all
times. The plans were to deepen sections of the Great Ships
Channel at the bay’s entrance, the South Channel and
channels going into Port Melbourne and Williamstown. In
July 2004 the Port of Melbourne Corporation (which had
assumed some of the duties of the former Victorian Channel
authority), the Victorian State government authority respon-
sible for the channel deepening project, released the Envi-
ronmental Effects Statement on the channel deepening
project. The section of the Environmental Effects Statement
dealing with the effect of the channel deepening on the tides
was written by Lawson and Treloar (2004a, b). Lawson and
Treloar modelled the astronomical tides in Phillip Bay.
The levels of tides for the existing topography and for the
topography including the proposed channel deepening were
computed. Their results showed that the effect of the pro-
posed channel deepening on then existing tidal levels in Port
Phillip Bay (using the partial tides M2, S2, K1, O1 and N2)
would be to increase the maximum tidal height at most
locations, with the greatest increase 0.008 m and the greatest
reduction 0.002 m. Sampson et al. (2005) also modelled the
Fig. 13 Shipping channels in Port Phillip Bay (Port of Melbourne
Authority)
62 J. Sampson et al.

then existing tides and the post channel deepening tides,
giving results very close to those of Lawson and Treloar
with the maximum tidal height increasing at most locations,
but with a greatest increase of 0.007 m and a greatest reduc-
tion of 0.002 m. According to the report published by the
Australian Government/Bureau of Meteorology (2011)
measured high tides post channel deepening are generally
around 0.01 m higher than pre channel deepening, which is
in general agreement with the results of Lawson and Treloar
and Sampson et al.
There are plans to expand Melbourne’s port capacity
(Port of Melbourne Corporation 2012a; The Age 2012b).
These are discussed in the later The Future section.
Living Communities
Urban Areas
Most of the population surrounding the bay is concentrated
in Melbourne and its suburbs (4.17 million people in June
2011, according to the ABS (Australian Bureau of Statis-
tics)). Melbourne is at the north of the bay, while its suburbs
extend along the east and west coast and into the hinterland.
The rest of the population is in Geelong and its suburbs (0.18
million in 2010, ABS), on the west of the bay.
Impact of Urbanisation/Industrialisation on theMarine Environment and Management of Such
This paragraph summarise information from an Australian
Government document (Australian Government 2006). By
the end of the nineteenth century, the waste and sewage
pollution of the Yarra River was causing serious health
problems. This led to the Melbourne Metropolitan Board
of Works to initiate a major sewerage program in 1893
with the first Melbourne homes being connected to a waste
treatment plant at Werribee. Management of the bay
involves a network of government, private sector and com-
munity agencies working together. The coordination of
actions is through the Association of Bayside Municipalities
(ABM), comprising the ten municipalities bordering The
Bay. Current management objectives were developed in
response to a major environmental study of the bay by
CSIRO in 1992–1996 (CSIRO 1996) plus long term trends
identified by the EPA (Environment Protection Authority)
Victoria from ongoing monitoring data for 1984–1999. Pub-
lication of a litter study by Melbourne Water in 1993 led to
programs to change behaviour with pet faeces, cigarette
butts and litter from take away foods. The CSIRO study
compared recent long term monitoring with earlier sampling
data and concluded that nutrient levels have been reasonably
stable since 1984 and are less than those in the 1970s prior to
the major upgrading of sewage treatment. Stormwater pollu-
tion is most evident when runoff after summer storms causes
beach closures or significant deposit of litter on beaches.
Management and monitoring of water quality is by the
EPA. The EPA sets targets for water quality through
enforceable regulations. Melbourne Water is responsible
for water harvesting, supply and treatment. Local govern-
ment, through the ABM, is responsible for beach cleaning
and management of local creeks and drains and promotion of
public awareness about water quality. The ABM councils,
with support from the federal and state governments, have
undertaken capital works programs for installation of gross
pollution and sediment traps.
The CSIRO 1992–1999 study concluded that “despite a
population of over three million people living around its
shores, the Bay is generally cleaner and healthier than
other bays around the world near large cities.” The study
concluded that there has been a long-term decline in the
level of most toxicants (e.g. mercury, copper, zinc) in the
Bay, probably due to stronger environmental regulations and
diversion of liquid waste to the sewerage system.
The Future
Global Warming
The evidence for global warming and its impact on the Bay
in the future and what governments need to do to minimise
the impact is discussed here in detail.
According to IPCC (2007) global average sea level in the
twentieth century rose at a rate of about 1.7 mm per year.
Satellite observations since 1993 show that sea level has
been rising at a rate of about 3 mm per year. The IPCC
says that the sea level is projected to rise at an even greater
rate in the twenty-first century, the major causes being global
warming due to thermal expansion of the oceans (water
expands as it warms) and the increasing melting of ice.
One scenario is that by the mid-2090s the global sea level
is 0.44 m above 1990 levels. Another scenario (Australian
Government/Department of Climate Change 2009), has a
sea level rise of up to 1.5 m or more at the end of the century.
Mitchell et al. (2000) give the following results for sea level
rises from tide gauges in Port Phillip Bay: Williamstown:
0.26 mm per year (32 years of data), Geelong: 0.97 mm/year
(25 years) and Point Lonsdale: �0.63 mm/year (34 years).
Lawson and Treloar (2004a) made this comment on the data:
“the variability in these numbers indicates the difficulty of
determining long-term trends from historical tide-gauge data
since there would not be expected to be any variability in the
long-term sea-level between these sites. It is more likely
that the variability reflects some variation in the relative
Port Phillip Bay 63

movements of the tide gauges with respect to sea level.”
Lawson and Treloar obtained the hourly recorded sea-levels
fromWilliamstown tide gauge for the years 1966–2002 inclu-
sive (37 years). For each year themean (average) sea level was
mathematically calculated making use of all the partial tides.
The general trend was for the mean sea level to rise by 2.3 mm
per year, i.e. about ten times what Mitchell obtained. Lawson
and Treloar says that if one excludes from their data years
where there are data gaps and restricts the calculations to the
years used by Mitchell et al. a similar result is obtained.
Lawson and Treloar conclude that “it is recommended that it
be assumed that there is a rise in sea level relative to land in
Port Phillip at a rate between 1 and 2 mm per year.” However
the IPCC has been estimating about 3 mm per year.
According to Schwartz (1967) each centimetre of sea
level rise in the Great Lakes in North America results in a
metre of beach recession. Using this result a 3 mm sea level
rise per year would result in 30 cm recession of beaches per
year or 30 m per decade. A 0.44 m sea level rise by the 2090s
as estimated by IPCC, would lead to a 44 m beach recession,
which, according to Bird (2006), is more than the width of
the beaches so that they would have to be artificially
nourished to prevent disappearances.
According to Bird (2006) the effects of rising sea level in
Port Phillip Bay will be that “the mouths of inflowing creeks
and rivers such as the Yarra and the Werribee will become
wider and deeper as high tides attain augmented levels. Near-
shore water will deepen, allowing larger waves to break on the
shore, intensifying erosion of cliffs and beaches. Where the
cliffs are in hard rock, such as the granodiorite of Mount
Martha, erosion will be slight as the sea rises, but the soft
clay and sandstone cliffs of the Bellarine Peninsula and the
north-eastern coast between Sandringham and Balcombe Bay
are likely to be cut back more rapidly as wave attack reaches
higher levels.”
Rising sea level and increased wind speed during storms,
both caused by global warming, will mean that a storm surge
at high tide will cause more coastal flooding. McInnes et al.
(2009) modelled a 1 in 100 year storm surge plus tidal height
in 2100 with a 19 % increase in the winds forcing the storm
surge and 82 cm of sea level rise at five Victorian locations,
not including Port Phillip Bay; they showed an increase in
overall height of the surge of about 2.4 m. They assumed that
tide ranges were not changed with rising sea levels but said
that tidal range may actually increase in Port Phillip Bay.
The City of Port Phillip, which has a population of about
90,000, is at the north end of the bay. It produced a study
(City of Port Phillip 2007) on planning for climate change.
The study showed the St Kilda foreshore and the area around
Elwood canal as being prone to storm surge flooding and
stormwater flooding.
According to a report by the Australian Government/
Department of Climate Change (2009) about 30,000
residential buildings in regions bordering Port Phillip Bay
may be at risk of inundation from a sea level rise of 1.1 m
and storm tide associated with a 1-in-100 year extreme
storm. The current replacement value of such buildings is
of the order of $7 billion. A quarter of buildings in Hobson’s
Bay and Port Phillip local government areas may be at risk
of storm tide (storm surge plus tide) by 2100.
The same Australian government report of 2009 says “if
it were necessary to protect cities such as Sydney or
Melbourne, dykes would potentially need to be constructed
around low-lying lands or across estuary entrances, as is
done in the Netherlands. A dyke across the entrance to Port
Phillip Bay would be challenging to construct. ‘The Rip’
between the heads would require a dyke of some 3 km long
and constructed in some 20 m water depth. Despite this
distance, ‘The Rip’ is relatively narrow compared with the
circumference of the rest of the Bay, which is around
220 km. The dyke would need to have locks to allow water
and ships to pass. The locks would then be shut if a storm
surge or high tide was forecast. However, because of the
powerful currents and swells (waves not generated by local
winds), constructing a dyke stretching across ‘The Rip’
would be a difficult engineering challenge and would be
very expensive.”
Federal, State and Local governments are all aware of the
steps that they need to take to minimise the impact of global
warming. The Australian Government is a signatory to the
Kyoto Protocol, which binds industrial countries to reduce
their emissions of greenhouse gases. The carbon tax,
introduced in 2012, is designed to reduce greenhouse gas
emissions.
New Container Port
An article in The Age newspaper on September 4, 2012,
(The Age 2012a), stated that the Victorian government is
considering building a massive new ‘Bay West’ container
port, near Point Cook on the north west coast. Industry
sources were quoted as being concerned that a hard surface
would make any dredging difficult.
Expanding Melbourne’s Port Capacity
In 2011 the Port was handling 2.5 million containers. This is
expected to double by 2025.
For this reason there are plans to expand Melbourne’s
port capacity (Port of Melbourne Corporation 2012a; The
Age 2012b). There will be a new container terminal at Webb
Dock. Two and a half million cubic metres of silt will be
dredged from near Webb Dock as part of the $1.2 billion
redevelopment plan. In addition 50,000 cubic metres will be
64 J. Sampson et al.

dumped within the area of the Port of Melbourne Dredged
Material Ground, located near the centre of The Bay; there
will be no environmental impact assessment because the
state government says that it is not necessary. See Fig. 14
for a diagram of the proposed project.
Population Growth
According to the ABS (Australia Bureau of Statistics),
Melbourne’s population grew by 17.4 % from 2001 to 2010,
i.e. at a rate of 1.8 % per year. If this rate continued the
population at 2050 would be double that of 2010, i.e. around
eight million people. An increased population might increase
pollution in Port Phillip and the Yarra River and other rivers
and creeks.
As well an increased population will place more demands
on the water supply, some of which comes from the Yarra
River. The government has what is called “A Water-Supply
Demand Strategy for Melbourne 2006–2055” (Melbourne
Water 2006). It outlines socially acceptable and cost-
effective actions to save and source water for Melbourne
till 2055. The actions are:
(i) maintain existing water conservation savings;
(ii) smarter management of existing river supplies;
(iii) save more water at home;
(iv) save more water at work and play;
(v) reduce water leaks and wastage;
(vi) increase the use of local water sources;
(vii) investing in water efficiency opportunities around
Melbourne; and
(viii) harnessing alternative strategies.
A Cleaner Yarra River and Port Phillip Bay
In March 2012 the Victorian Government Minister for
Environment and Climate Change, Ryan Smith, set up a
government taskforce to develop an action plan for the
Yarra River and Port Phillip Bay, focussing on four key
priorities. The first priority was to enable more effective
coordination between government agencies in protecting
water quality and providing timely information to com-
munities about water quality events. The second priority
was to manage threats to water quality, including pollution,
litter and stormwater inputs by identifying new priority
actions to address them. The third priority was to develop
easier ways for the community to access information about
water quality of the Yarra and The Bay. The fourth priority
was to support Victorians to take actions that care for and
protect the Yarra and the bay.
In October 2012 the Victorian Government Department of
Sustainability and Environment released the plan, a five-year
plan, called “A Cleaner Yarra River and Port Phillip Bay”, to
Fig. 14 Proposed new container terminal at Webb Dock (Port of Melbourne Authority)
Port Phillip Bay 65
“improve the health of the Yarra River and Port Phillip Bay”.
The report says that good water quality in the river and bay is
important for healthy ecosystems and clean safe swimming.
The report stated that good water quality in the Yarra
River and Port Phillip Bay is vital to provide healthy and
diverse ecosystems, clean and safe swimming and recrea-
tional and commercial fishing and aquaculture industries.
The report went on to state that water quality in the Yarra
has improved significantly over the past few decades and has
been stable in recent years, comparing well to similar rivers
in major urban areas overseas. An independent report by the
Office of Environment Monitor found that after 4 years of
bayside monitoring that overall Port Phillip Bay was in good
health, consistent with the previous decade. Water quality in
both the Yarra and Port Phillip can be impacted after heavy
rain, with pollution washing pollutants into waterways.
The action plan involves 17 priority actions: namely,
1. identify the lead agencies for managing water quality in
the Yarra River and Port Phillip;
2. develop a new Environment Management Plan for Port
Phillip Bay that will help address key risks to bay health
including marine pests and nutrient loads;
3. put in place a Response Plan for water quality events in
Port Phillip Bay such as algal blooms;
4. extend the role of the Yarra River and Port Phillip Bay
government taskforce to oversee and coordinate imple-
mentation of the plan;
5. update best practice environmental guidelines for
dredging;
6. work with catchment managers to improve water quality
at beaches in Port Phillip Bay;
7. revise the guidelines for urban stormwater management
for new urban development, to facilitate and support
best practice;
8. identify litter hotspots and develop local partnerships
with community, businesses and local government to
cut litter in these areas;
9. target pollution hotspots to improve compliance by
industry, land developers and other sources of pollution
in waterways;
10. investigate and trial improved early warning and com-
munity information programs for sewage spills and
leaks affecting waterways;
11. develop innovative approaches to reduce wastewater
impacts on waterways, including accelerating the
sewering of unsewered areas;
12. update guidance and requirements for on-site wastewa-
ter management;
13. provide water quality information and advice through a
single website so that Victorians can quickly and easily
access up-to-date information on beach water quality,
including beach closures and algal blooms;
14. prepare a report that summarises Yarra River and Port
Phillip Bay water quality and health and actions to
improve them;
15. improve key water quality monitoring and reporting
programs, including the Port Phillip Bay Beach report;
16. support Victorians to take action to protect water quality
and reduce litter; and
17. encourage people to report litter and pollution, learn more
about water quality and join community groups to take
action to protect the Yarra River and Port Phillip Bay.
Future Melbourne
On the Future Melbourne website, set up by the City of
Melbourne, trends and challenges facing Melbourne are
discussed, including climate change and adapting to it, sig-
nificant population change, rapid technological change and
an increase in oil prices.
Summary
The population around Port Phillip Bay quite possibly could
double in the next 40 years, putting pressures on the
environment.
The governments involved with Port Phillip will have to
cope with the effects of global warming, which is likely to
intensify with time. It could cause flooding of bayside areas
regularly. Substantial population growth in the future could
cause pollution and put increased demands on the water
supply to Melbourne. The Victorian Government has plans
to deal with these matters. Port Phillip’s future looks
promising provided relevant Federal, State and Local
governments take necessary actions.
References
Australian Government (2006) Australia’s national programme of action
for the protection of the marine environment from land-based
activities. Case Study 11: Port Phillip Bay. http://www.environment.
gov.au/coasts/pollution/npa/pubs/port-phillip.pdf
Australian Government/Bureau of Meteorology (2011) Tide height
assessment in Port Phillip Bay, report 9: quarter ending 31 Decem-
ber 2011. National Tidal Centre, Bureau of Meteorology, Common-
wealth of Australia. http://www.oem.vic.gov.au/Assets/1076/1/
TideHeightAssesment_201112.pdf
Australian Government/Department of Climate Change (2009) Climate
change risks to Australia’s coast. http://www.climatechange.gov.au/
publications/coastline/climate-change-risks-to-australias-coasts.aspx
Belski A, Babanin A, Zieger S, Dobynin M, Plesckachevsky A (2012)
Investigation and modelling of suspended particulate matter in Port
Phillip Bay. In: Proceedings of the twenty-second (2012) interna-
tional offshore and polar engineering conference, Rhodes, Greece.
66 J. Sampson et al.

Bird ECF (2006) The effects of a higher sea level on the coast of Port
Phillip Bay. Vic Nat 123:49–54
Bird E (2011) Changes on the coastline of Port Phillip bay, Office of the
Environmental monitor, State Government Victoria
Black KP, Mourtikas S (1992) Literature review of the physics of Port
Phillip Bay, CSIRO Port Phillip Bay Environmental Study, techni-
cal report no. 3. C.S.I.R.O, Melbourne
Black K, Hatton D, Rosenberg M (1993) Locally and externally-driven
dynamics of a large semi-enclosed bay in southern Australia.
J Coast Resour 9(1993):509–538
Bonwick J (1857) Discovery and settlement of Port Phillip, George
Robertson. trove.nla.gov.au/work/8484650
Bradley JE (1957) Abnormally high tides in the port of Melbourne.
Proc R Soc Vic, new series, 69:37–40, Melbourne
Broome R (2005) Aboriginal Victorians: a history since 1800. Allen
and Unwin, Crows Nest, Australia
Bryant E (2001) Tsunami: the underrated hazard. Cambridge Univer-
sity Press, New York, USA
City of Port Phillip (2007) Planning for climate change, a NATCLIM
initiative. http://www.environment.gov.au/coasts/pollution/npa/
pubs/port-phillip.pdf
Cohen BF, Currie DR, McArthur MA (2000) Epibenthic community
structure in Port Phillip Bay, Victoria, Australia. Mar Freshw Res
51(7):689–702
Costermans LF (1983) Trees of Victoria. Costermans Publishing,
Frankston
CSIRO (1996) Port Phillip Bay Environmental Study 1992-1996. http://
www.melbournewater.com.au/content/library/publications/reports/
rivers_and_creeks_reports_pdf/Port_Phillip_Bay_Environmental_
Study.pdf
Daley C (1940) Arthur’s seat in the forties. Vic Hist Mag 18(3):57–64
Department of Sustainability and Environment (2012a) Port Phillip
Bay. http://www.dse.vic.gov.au/coasts-and-marine/marine/bays,-inlets,
-estuaries-and-lakes/port-phillip-bay
Department of Sustainability and Environment (2012b) Seagrass
and reefs program for Port Phillip Bay. http://www.dse.vic.gov.
au/coasts-and-marine/marine/seagrass-and-reefs-program-for-port-
phillip-bay
Easton A (1970) The tides of the continent of Australia. PhD thesis, The
Flinders University of South Australia
Easton A (1978) A tidal model of Corio Bay, Victoria. In: Noye J (ed)
Numerical simulation of fluid motion. North-Holland, Amsterdam,
Australia, pp 357–369
EPA Victoria (2012a) Baywide water quality monitoring program.
Milestone report no.9. Port Phillip water quality: November
2007–December 2011. March 2012 http://www.oem.vic.gov.au/
Assets/1084/1/EPAWQMilestoneRep9_05Apr12_Final.pdf
EPA Victoria (2012b) Beach report 2011–2012, August 2012. http://
www.epa.vic.gov.au/our-work/publications/publication/2012/
august/1484
Flemming J (1803) A journal of the exploration of Charles Grimes.
dalmura.com.au/genealogy/Robbins/Journal.PDF
Flinders M (1814) A voyage to Terra Australis, Book 1 Chapter IX.
freeread.com.au/ebooks/e00049.html
Hirst A, Heislers S, Ball D, Blake S, Coots A (2012) Bayside seagrass
monitoring program. Milestone report no. 15. Fisheries Victoria tech-
nical report series no. 1568. http://www.oem.vic.gov.au/Assets/
1080/1/SeagrassMonitoring_MilestoneRep15_27Feb12_Final.pdf
Honda K, Terada T, Yoshida Y, Isitani D (1908) An investigation on the
secondary undulations of oceanic tides. J Coll Sci Tokyo 24:1–110
Hubbert GD, McInnes KL (1999) A storm surge inundation model for
coastal planning and impact studies, 1999. J Coast Res 15:168–185
IPCC (Intergovernmental Panel on Climate Change) (2007) Fourth
assessment report: climate change, 2007. IPCC, Geneva, Switzerland
Keble RA (1946) The sunklands of Port Phillip Bay and Bass Strait.
Mem Nat Mus Vic 14:69–122
Lawson and Treloar Pty Ltd, POMC Channel Deepening, Sediment
Transport and Water Quality Modelling (2004a) Report prepared
for the Port of Melbourne Corporation by Lawson and Treloar Pty
Ltd, report Rm2054/J5372 ver 1.0 FINAL June 2004, Notting Hill
Lawson and Treloar Pty Ltd, POMC Channel Deepening, Sediment
Transport and Water Quality Modelling Model Calibration (2004b)
Report prepared for the Port of Melbourne Corporation by Lawson
and Treloar Pty Ltd, report Rm2074/J5372 ver 1.0 FINAL June,
Notting Hill
Lee I (1915) The logbooks of The ‘Lady Nelson’, Grafton and Co,
London. http://openlibrary.org/books/OL658013M
Mader CL (2004) Numerical modeling of water waves. CRC Press,
New York, USA
McInnes KL, Hubbert GD (1996) Extreme events and the impact of
climate change on Victoria’s coastline, Environment protection
authority, state government of Victoria, publication 488. Environ-
ment Protection Authority, Melbourne, Australia, 69 pp
McInnes KL, Macadam I, O’Grady J (2009) The effect of climate
change on extreme sea levels along Victoria’s coast. CSIRO,
Aspendale, Australia
Melbourne Water (2006) A water-supply demand strategy
for Melbourne 2006–2055. http://www.melbournewater.com.au/
content/library/water_storages/water_supply-demand_strategy.pdf
Melbourne Water (2011) Summary water quality data 2011. http://
www.melbournewater.com.au/content/library/publications/reports/
rivers_and_creeks_reports_pdf/Summary%20Waterway%20Water
%20Quality%20Data%202011.pdf
Melbourne Water (2012) The Yarra River. http://www.melbournewater.
com.au/content/rivers_and_creeks/the_rivers_and_creeks_system/the_
yarra_river.asp
Mitchell W, Chittleborough J, Ronai B, Lennon GW (2000) Sea level
rise in Australia and the pacific. S Pac Sea Lev Clim Change Newsl
5(1):10–19
Museum Victoria (2006) Melbourne’s wildlife. CSIRO Publishing,
Collingwood
Museum Victoria (2012) Taxonomic toolkit for marine life of Port
Phillip Bay. http://portphillipmarinelife.net.au/
Nicholls N, Larsen S (2011) Impact of drought on temperature
extremes in Melbourne, Australia. Aust Meteorol J 61:113–116
Port of Melbourne Corporation (2012a) Expanding Melbourne’s port
capacity. http://portcapacity.portofmelbourne.com/downloads/
120502-expanding-port-capacity.pdf
Port of Melbourne Corporation (2012b) History of the port. http://www.
portofmelbourne.com/community/maritimeheritage/porthistory.aspx
Port of Melbourne Corporation (2013) Victorian tide tables. Melbourne
Presland G (2010) First people. Museum Victoria, Melbourne
Ryder K, Temara A, Holloway DA (2004) Avoidance of crude-oil
contaminated sediment by the Australian seastar, Patiriella exigua
(Echinodermata: Asteroidea). Mar Pollut Bull 49(11–12):900–909
Sampson J (2008) Some solutions of the shallow water wave equations.
PhD thesis, Swinburne University of Technology, Melbourne
Sampson J, Easton A, Singh M (2005) Modelling the effect of proposed
channel deepening on the tides in Port Phillip Bay. Aust N Z Ind
Appl Math J 46(E):C888–C901
Schwartz ML (1967) The Brun theory of sea level rise as a cause of
shore erosion. J Geol 75:76–92
Short AD (2005) Beaches of the Victorian coast and Port Phillip Bay.
Surf Life Saving Australia Ltd, Bondi Beach, Australia
Sturman A, Tapper N (1996) The weather and climate of Australia.
Oxford University Press, Melbourne, Australia
The Age (2005a) Are we prepared for the worst? http://www.theage.
com.au/news/Asia-tsunami/Are-we-prepared-for-the-worst/2004/
12/31/1104344982287.html?from¼moreStories. 5 October 2008
The Age (2005b) Port Phillip Bay is in no danger from a tsunami. http://
www.theage.com.au/news/Letters/Port-Phillip-Bay-is-in-no-danger-
from-a-tsunami/2005/01/04/1104832107215.html
Port Phillip Bay 67

TheAge (2012a) Government urged to consider secret ‘BayWest’ option
for port. http://www.theage.com.au/victoria/government-urged-to-
consider-secret-bay-west-option-for-port-20120903-25amq.html
The Age (2012b) Bay dredging in $1.2 b dock expansion. http://
www.theage.com.au/victoria/bay-dredging-in-12b-dock-expansion-
20121208-2b2fx.html
The State of Victoria, Department of Natural Resources and Environment
(2002) Port Phillip BayEnvironmentalManagement Plan. http://www.
dse.vic.gov.au/__data/assets/pdf_file/0020/97121/Port_Phillip_Bay_
Environmental_Management_Plan_-_Background_Document.pdf
Victorian Government Department of Sustainability and Environment
(2012) A cleaner Yarra River & Port Phillip Bay. Department of
Sustainability and Environment, Melbourne, Australia
Vreugdenhil CB (1998) Numerical methods for shallow-water flow.
Kluwer, Dordrecht, Netherlands
Walker SJ (1997) Hydrodynamic models of Port Phillip Bay, Technical
report no. 38, Port Phillip Bay environmental study. Port Phillip
Bay Environmental Study, CSIRO Environmental Project Office,
Yarralumla, Australia
Wharton WLJ (1888) On the seismic sea waves caused by the eruption
of Krakatoa, August 26th and 27th, 1883. In: Symons GJ (ed) The
eruption of Krakatoa and subsequent phenomena. Trubner and Co,
London, pp 89–150
Wilson KJ (1982) Forecasting shallow water wind wave characteristics.
Bureau of Meteorology, Melbourne, Australia, 22 pp
68 J. Sampson et al.