Controlling strength and permeability of silica investment ...
Upload
khangminh22Category
view
0download
0

GEOLOGICA ULTRAIECTINA
Mededelingen van de Faculteit Aardwetenschappen der
Rijksuniversiteit te Utrecht
No. 99
Porous Structure and Particle Size of Silica and Hydrotalcite
Catalyst Precursors
a thermoporometric study

CIP-DATA KONINKLIJKE BIBLIOTHEEK, DEN HAAG
Titulaer, Mark Kurt
Porous structure and particle size of silica and hydrotalcite catalyst precursors / Mark Kurt Titulaer.
Utrecht: Faculteit Aardwetenschappen der
Rijksuniversiteit Utrecht.-(Geologica Ultraiectina,
ISSN 0072-1026; No.99) Thesis Rijksuniversiteit Utrecht. -With ref. -With
summary in Dutch
ISBN 90-71577-53-8 Subject headings: silica / hydrotalcite / thermoporometry

Porous Structure and Particle Size of Silica and Hydrotalcite Catalyst Precursors
De Poreuze Structuur en Deeltjesgrootte van Silica en Hydrotalcite Katalysator Precursors
(Met een samenvatting in het Nederlands)
PROEFSCHRIFT
TER VERKRIJGING VAN DE GRAAD VAN DOCTOR AAN DE RIJKSUNIVERSITEIT TE UTRECHT, OP GEZAG VAN DE RECTOR MAGNIFICUS, PROF. DR. J.A. VAN GINKEL, VOLGENS BESLUIT VAN HET COLLEGE VAN DEKANEN IN HET OPENBAAR TE VERDEDIGEN OP WOENSDAG 24 MAART 1993 DES NAMIDDAGS OM 12.45 UUR
DOOR
Mark Kurt Titulaer
geboren op 29 juli 1964 te Hilversum

PROMOTOR: PROF. IR. J.W. GEUS associated with the Faculty Chemistry of the Rijksuniversiteit Utrecht
PROMOTOR: PROF. DR. R.D. SCHUILING CO-PROMOTOR: DR. J.B.H. JANSEN associated with the Department of Geochemistry of the Rijksuniversiteit
Utrecht

To my parents To Jean, Caroline, Yord, and Suzanne

Table of Contents
PROLOGUE 8
Chapter 1 General introduction 9
Chapter 2 The preparation and characterization of 15 sol-gel silica spheres
Chapter 3 The differences in the elementary processes 37 proceeding during ageing of hydrogels and xerogels
Chapter 4 The rise in pH during ageing of porous 59 sol-gel silica spheres
Chapter 5 The shrinkage of hydrothermally aged 77 porous silica spheres measured by thermoporometry

Chapter 6 Control of the porous structure of silica 107 gel by the preparation pH and drying
Chapter 7 The effect of drying on the pore 133 dimensions of electrodialyzed silica sol gels
Chapter 8 Characterization of tubular chrysotile by 175 thermoporometry, nitrogen sorption, DRIFTS and TEM
Chapter 9 The shrinkage and swelling of differently 207 pillared hydrotalcite investigated by thermoporometry
Chapter 10 The quantity of reduced nickel in synthetic 243 takovite ; effects of preparation conditions and calcination temperature
SAMENVATTING 263
CURRICULUM VITAE

8
Prologue
In this thesis, experimental work is described, which is done in the period 1-7-1987
till 1-7-1991. Without the help of many, it had never been accomplished. I wish to
thank for their support the staff members, colleagues, students, supporting divisions,
librarians of the Institute for Earth Sciences, Department of Inorganic Chemistry
(employees of the former Analytical Chemical Laboratory). Department of Practical
Pharmacy, Chemical Thermodynamics Group, who have contributed to parts of the
thesis. Especially I wish to mention Ad van der Eerden for technical assistance, Ineke
Kalt and Rikky van Zelst of the secretary's offices, Willem Nieuwenhuizen and Herman
Trommar of the glass-works, Lou Louwerse and Henk Erkelens of electronics, Fred
Quint, Fred Trappenburg, Izaak Santoe, and Jacco Bergehenegouwe of the audio-visual
department of the IVAU, and Jan den Boesterd of the audio-visual department of the
faculty Chemistry for making illustrations and photographs, Dr. Ben Dekker and Piet
Elberse for their technical assistance with the N2 adsorption and desorption experi
ments, Marjan Versluis for XRD-, Paul Anten for ICP-AES- , and Ton Zalm for TGA-DTA
analysis, and Jan Ebskamp providing me the most unusual equipment. Dr. Jos van
Dillen, and Jos Kock of the practicum "Maken II", thank you, for your assistance with
coaching the students.
My roommates and colleagues; Ronald Bakker, Jan van Beek, Paul Buining, Peter
Dirken, Theo Kloprogge, Jack Voncken, Ronald Vogels, thank you, for your cooperation
and pleasant lunch times in the canteen of the IVAU.
Dr. Ben Jansen and prof. ir. John Geus, thank you, for your enthusiasm, ideas, and
patience with the correction of the first manuscripts. Finally, I wish to thank my
parents, giving my the opportunity to study, and, of course, my brother for the
'computer facilities'.

9
Chapter 1
General Introduction
Industrial utilization of heterogeneous catalysts has continuously increased during this
century. The nineteenth century had shown the development of catalysts for the
production of sulphuric acid and for the oxidation of hydrochloric acid to elemental
chlorine. At the beginning of the twentieth century the catalytic oxidation of ammonia
over platinum gauze to nitrogen oxide, which is subsequently reacted with water to
nitric acid, has been developed. After the introduction of the ammonia and the
methanol synthesis, processes based on solid catalysts, the use of catalysts in the
production of fuels rapidly rose during the thirties and forties with the development of processes, such as, the Fischer-Tropsch synthesis and catalytic cracking. The FischerTropsch synthesis involves the production of hydrocarbons to be used as gasoline substituents from carbon monoxide and hydrogen. The reaction of carbon monoxide
and hydrogen to hydrocarbons is carried out over supported cobalt and iron catalysts. Catalytic cracking is one of the most successful catalytic developments. Heavier
hydrocarbons are catalytically reacted to hydrocarbons of a lower boiling point and to
carbon. Combustion of the carbon deposited on the catalyst provides the thermal energy for the endothermic cracking reaction. Hydrogenation of coal aimed also at the
production of gasoline substituents. The hydrogenation of coal led to the development of sulphur-resistant catalysts containing molybdenum or tungsten. Later on catalytic
reforming based on platinum and subsequently on platinum-rhenium catalysts was
introduced. Abatement of environmental pollution brought about the need for removing impurities, such as, sulphur, nitrogen, nickel, and vanadium out of crude oil fractions.
The above catalysts for coal hydrogenation were adapted for hydrodesulphurization, hydronitrification, and hydrodemetallization, and are presently used on a very large
scale. These processes are used to purify fuels from sulphur, nitrogen, and metals, and
thus considerably decrease the air pollution caused by the combustion of the fuels produced from crude oil. Hydrogen sulphide released during the hydrodesulfurization of
fossil fuels is catalytically processed in large units to elemental sulphur according to the Claus process. Recently catalysts, based on Pt, Pd, and Rh, for the purification of
automotive exhaust gases have to be installed in almost every new car. Finally,
catalysts for the selective catalytic reduction of nitrogen oxides present in flue gases with ammonia are increasingly being used.
With most solid catalysts the active surface area per unit volume is decisive; a large
active surface area per unit volume of catalyst is a prerequisite for industrial application. With precious metals, such as, platinum or rhodium, a maximum active
surface per atom of precious metal is required in view of the high price of precious

10 Chapter 1
metals. Almost all catalytically active solids severely sinter under the conditions of the
thermal pretreatment or the catalytic reactions. Sintering first of all decreases the
active surface area per unit volume, which usually is unacceptable. Moreover, the
pressure drop of sintered fixed bed catalysts may be too high, while the gas flow
through a sintered catalyst bed may be very non-uniform and strongly deviating from
the required plug flow. Sintering may lead to the formation of more open regions within
the catalyst bed through which slip of the gas flow proceeds.
To suppress effectively the sintering of catalytically active solids, the active
components are generally applied onto a suitable support. The support must be
sufficiently thermostable and generally must exhibit an elevated surface area per unit
volume. Though the support can display catalytic activity, usually the activity of the
support is either not important or even not attractive. An instance of an undesired
activity is the presence of acid sites at the surface of a methanol synthesis catalyst.
The acid sites catalyzing the reaction to dimethylether adversely affect the selectivity of the catalytic reaction. The opposite is observed with catalytic reforming. Catalytic
reforming rises the octane number of gasoline fractions by passing the gasoline vapor through a catalyst bed in which Pt, Pt-Re, or Pt-Ir has been deposited onto an acid
support. Besides isomerization of linear to branched hydrocarbons, dehydrogenation
and cyclization to aromatic compounds proceeds. The support must contain suitable
acid sites, that together with the platinum or platinum alloy particles accelerate the
dehydrocyclization reactions without exhibiting carbon deposition.
The mechanical strength of the bodies of supported catalysts as well as the porous
structure of the support is highly important. Disintegration of catalyst bodies in fixed
bed reactors leads to high pressure drops over the catalyst bed that cannot be
tolerated. With fluidized catalyst beds a high resistance of the catalyst bodies against attrition is a prerequisite. The porous structure of solid catalysts is, especially with
fixed catalyst beds, important. To achieve acceptable pressure drops over the reactor
the catalyst bodies must have dimensions of at least some mm's. Often the transport
of reactants and reaction products through the pores within the catalyst bodies cannot
keep up with the rate of the catalytic reaction proceeding at the catalytically active surface. As a result the performance of a catalyst in a technical reactor is often
significantly less than suggested by the rate of the chemical reaction. Transport
limitations thus often lower the overall rate of catalytic reactions in technical
installations. Most important, however, is the effect of transport limitations on the
selectivity of catalytic reactions. When reactions products liable to subsequent
undesired reactions cannot leave the catalyst bodies sufficiently rapidly, the selectivity
may drop considerably. Instances are the hydrogenation of fatty oils, where reaction to
completely saturated hydrocarbon chains has to be prevented, and the oxidation of
hydrogen sulphide to elemental sulphur, where oxidation to sUlphur dioxide must be
avoided. Plugging of the pore mouths of catalyst bodies can rapidly deactivate solid
catalysts. Important is to prevent plugging of pore mouths with hydrodemetallization catalysts, where mainly nickel and vanadium are deposited on or within the catalyst
bodies, and with catalytic reactions where carbon can be deposited, such as, catalytic

11 General Introduction --------------'---'-
reforming.
Procedures for the technical production of solid catalysts can be divided into two
main groups. The first group of procedures involves preparation of a, generally
non-porous, solid in which the precursor of the active component and of the support
are thoroughly mixed. With the subsequent thermal treatment some components are
selectively removed from the solid providing a, generally highly, porous solid containing
the supported active component. With the ammonia synthesis catalyst magnetite
(Fe 30 4 ), alumina, and potassium oxide are melted to a homogeneous melt in an
electrical furnace. After cooling the melt is ground to bodies of some mm's size.
Reduction of the non-porous solid selectively removes the oxygen of the iron oxide,
leading to highly porous metallic iron stabilized by the remaining alumina.
The porous structure of the final supported catalyst is difficult to control with this
procedure, which is used for technically important catalysts, such as the ammonia
synthesis catalyst, and the high- and low-temperature carbon monoxide shift
conversion catalysts. With the CO shift conversion, which involves the reaction of
carbon monoxide with steam to carbon dioxide and hydrogen, a hydrotalcite containing
Zn, Cu, and AI is precipitated. Drying and calcination selectively remove the water and
carbon monoxide, and the subsequent reduction removes the oxygen bonded to copper
from the catalyst.
The second production procedure involves the application of the precursor of the
active component onto a separately produced support. Often a relatively finely divided,
powdered support is used with the procedure involving a separately produced support.
Finally a shaping procedure must be applied to produce the desired catalyst bodies.
Again the porous structure of the catalyst bodies eventually produced is difficult to
control. When the porous structure of the catalyst is of decisive importance, the best
procedure is to start from pre-shaped bodies of the support having the required porous
structure, mechanical strength, and physical dimensions. Commercially a wide range of,
mainly alumina and silica, support bodies of different size, shape, and porous structure
is available. Procedures to apply active precursors into pre-shaped support bodies, such
as, incipient wetness impregnation, have been developed. It is therefore highly
important to be able to control the porous structure of catalyst supports. Especially
combination of shaping of support bodies with establishment of the desired porous
structure is very attractive.
Often catalyst supports are produced by reactions in aqueous solutions. Separation of
the support from the liquid and drying severely affect the porous structure of the final
solid. The high surface energy of water causes the formation of axerogel, in which the
elementary particles are tightly connected, out of the original, much less dense,
hydrogel. Though the structure of porous solids after removal of water can be
accurately determined by adsorption and desorption of nitrogen at 77 K and by mercury
penetration, the porous structure of hydrogels is more difficult to assess. Nevertheless
establishment of the porous structure of hydrogels is essential, since the structure of
the hydrogel determines the porous structure of the final xerogel obtained after
separation from the liquid and drying. Thermoporometry allows one to assess

12 Chapter 1
accurately the porous structure of hydrogels.
The subject of this thesis is the control of the porous structure of catalyst bodies.
The first part deals with silica, that can be utilized as catalyst support with many
industrially important catalytic reactions. The second part of the thesis deals with the
preparation and characterization of solid catalysts having a tubular or a platelet
microstructure. The success of zeolites in catalytic reactions is due to the fact that the
shape of the porous structure can be controlled on an atomic scale. The possibility to
adapt also the surface composition of zeolites has led to important catalytic
possibilities. Besides zeolites other minerals have structures that are interesting for
catalytic applications. Natural minerals usually are contaminated, which renders
utilization for catalytic purposes difficult, in spite of the favourable price. As with
zeolites synthetic minerals therefore have to be preferred. Synthetic chrysotile will be
studied, mainly to calibrate the porometric technique. The preparation and
characterization of layered structures will subsequently be dealt with. Structures of
platelets the separation of which can be controlled by insertion of suitable charged
clusters ("pillaring") are presenting interesting catalytic properties.
The first part of this thesis deals with the determination of the porous structure of
hydrogels and the change of the porous structure during the transition to the xerogel.
First of all the preparation of suitable silica bodies will be studied. A procedure that can
also be used on a large scale is the preparation of sol-gel spheres. The spheres are attractive catalyst support bodies, since pneumatic loading and emptying of industrial
reactor is viable with the easily flowing and mechanically strong silica spheres prepared
by a sol-gel process. Furthermore the spheres exhibit a relatively low pressure drop to a
liquid or gas flow passed through a fixed bed. Chapter 2 deals with the preparation and
characterization of silica sol-gel spheres. The porous structure of the silica spheres can be well controlled by hydrothermal treatment. Usually wider pores result from
hydrothermal treatment, while the pore volume does not decrease significantly. With
most supports it is difficult or impossible to control the porous structure. Since the
transport of reactants and reaction products within catalyst bodies is determining often
the performance of solid catalysts, control of the porous structure is highly important.
Transport limitations often cause the performance of solid catalysts in liquid phase
reactions to be less favourable than that of homogeneous catalysts, in which transport
limitations do not arise easily. It is therefore interesting to investigate thoroughly the
effects of drying and of hydrothermal treatment of silica sol-gel spheres. Chapter 3
describes hydrothermal treatment of hydrogel and xerogel spheres. and Chapter 4
considers the increase in pH during hydrothermal treatment of silica sol-gel spheres.
The amount of sodium adsorbed on the silica surface, which affects subsequent
application of catalytically active precursors and the catalytic properties of the final
catalysts, is also dealt with in Chapter 4. The shrinkage of sol-gel spheres during
hydrothermal treatment is described in Chapter 5.
Usually silica sol-gel bodies are produced from elementary silica particles of a size of 5 nm. The size of the elementary silica particles is difficult to control and the sodium
content of the thus produced silica may present problems during application of the

13 General Introduction
active precursor or adversely affect the catalytic performance. Chapters 6 and 7
therefore deal with alternative procedures to produce silica gels. Chapter 6 describes a
pH static preparation and the effect of the pH on the size of the elementary silica
particles. Chapter 7 presents an interesting procedure to produce gels of silica by
means of electrodialysis.
Measurement of the porous structure of chrysotile tubes is described in Chapter 8.
Since the dimensions of the diameter of the chrysotile tubes can be assessed
electronmicroscopically, the tubes are very appropriate to calibrate the
thermoporometric technique. Preparation and pillaring of hydrotalcite is dealt with in Chapter 9. Again thermoporometry is a very useful technique to characterize the porous
structure of the tiny plates. Finally the reduction of a nickel containing hydrotalcite
structure, takovite, and the effect of the reduction on the particle size is described in
Chapter 10.

15
Chapter 2
The preparation and characterization of sol-gel silica spheres·
M.K. Titulaer, J.B.H. Jansen and J.W. Geus'
Department of Geochemistry, Institute of Earth Sciences, University of Utrecht,
Budapestlaan 4, P.O. Box 80.021, 3508 TA Utrecht, The Netherlands.
'Department of Inorganic Chemistry, University of Utrecht, Sorbonnelaan 16, P.O. Box
80.083, 3508 TB Utrecht, The Netherlands.
"This paper is a contribution of the Debye Institute, University of Utrecht, The
Netherlands.
ABSTRACT
Silica sol-gel spherical bodies are prepared containing 2 to 13 wt% Si0 2 in water. The silica sol is prepared by addition of a sodium silicate solution to a dilute nitric acid
solution. The silica sol thus obtained is introduced dropwise into hot paraffin oil, which
results in spherical hydrogel bodies. The pore volume of the spheres is varied between
0.16 and 1.4 ml/g, and the pore radii between 0.8 and 60 nm. The pore structure of the
hydrogels is investigated by thermoporometry.
The hydrogels are washed and dried at 293, 333, and 393 K. The pore structure of the
dried spheres is determined by nitrogen adsorption and desorption at 77 K. Drying causes
a considerable shrinkage of the pore dimensions. The pore radius of the sample containing
2 wt% Si0 2 in water diminishes from 10.2 to 2.9 nm, while the pore volume decreases
from 0.9 to 0.5 ml/g. Drying the gelled spheres at temperatures above 293 K leads to a
lower shrinkage, and consequently to a higher pore volume of the dried spheres. The pore
structure of both xerogel and hydrogel spheres is modified by means of a hydrothermal
treatment. Hydrothermal treatment of the hydrogel spheres increases the pore volume,
whereas that of the of the xerogel spheres remains constant. Differences observed with
the hydrothermally aged hydrogel and xerogel spheres are attributed to the ripening
mechanism being dependent on the initial pore structure.

16 Chapter 2
INTRODUCTION
Amorphous silica is used as a catalyst support [1 I. a glass precursor [21. a paint
thickener, or a coating film [31. With all applications the pore structure and size of the
powder have to be controlled, especially when the silica is used as a catalyst support,
since the pore structure and the specific surface area of the support may determine the
performance and deactivation of the catalyst [4]. The pore structure comprises pore size
distribution, pore volume, pore shape, and the (internal) surface area. The pore structure
of silica gels critically depends on the preparation conditions [5,6]. Furthermore, the
increase of the solubility of silica in water at high temperatures allows modification of the
pore structure of the silica gels by hydrothermal ageing [5,7-91.
Porous silica bodies can be prepared by a sol-gel process [9-11]. The silica source may
be either a siliciumalcoxide, such as, tetraethyl or tetramethyl orthosilicate (TEOS and
TMOS), or a concentrated sodium silicate solution (waterglass). The alcoxide, dissolved
in alcohol, can be hydrolyzed by addition of water. The primary silica sol particles, which
are generated during the hydrolysis, link together and build a monolithic reticulated alcogel
[121. The gel network resulting from the hydrolysis of alcoxides is very soft and fragile.
Removal of the alcohol is accompanied by an undesired shrinkage. The silica density of
the dried xerogel is evidently higher than of the previous hydrogel. The shrinkage of the
alcogel can be reduced by hypercritical drying. To that end the sample is placed in a steel
vessel and the alcohol is evacuated above its critical temperature. This treatment results in an aerogel of a low density [13].
The aim of the present work is to investigate the effect of the preparation conditions and
of the hydrothermal treatment on the pore structure of spherical silica gel bodies prepared
from sodium silicate. The spheres consist of small primary particles. The influence of the
pH on the primary particle size will be dealt with first. Secondly, the effects of the silica
concentration in the sol and of the drying temperature on the pore structure of the xerogel
will be investigated. Finally, the change in pore structure of hydrogels and of xerogels as
affected by the duration of the hydrothermal treatment will be compared. As coalescence
of the silica spheres proceeds above the critical temperature of water, thermal treatment
at a temperature below the critical temperature is chosen [141.
The sodium silicate solution is analyzed by inductively coupled plasma atomic emission
spectrophotometry (ICP-AES), and atomic absorption spectrophotometry (AAS). The
textural analysis of the gel samples is performed by transmission electron microscopy
(TEM), thermoporometry, N 2 adsorption and desorption at 77 K, and mercury penetration.
Thermoporometry
The pore structure of hydrogels and xerogels in water is examined by thermoporometry.

17 Preparation of Sol-Gel Silica Spheres
This recently developed technique is based on the lowering of the solidification or fusion
point of a suitable compound (usually water), which is present within the pores of a solid
material [15,16]. The advantage of this technique is the fact that the sample does not
have to be dried first. By measuring the endothermic heat flux due to fusion, and
subsequently, the exothermic heat flux with solidification of the fluid in the material,
information is obtained about the pore size distribution, the pore volume, the pore shape,
and the internal surface area of the sample. The depression of the freezing point of water
is caused by the high surface energy of the critical nucleus of ice, the radius Rn (in nml,
of which is approximately equal to the pore radius Rp (in nm) :
Rn = -64.67/dT-0.23 (nm) (1 )
Rn is related to the temperature difference dT (in K) between the experimental solidification
temperature T. and 273 K. Since freezing and melting proceeds at temperatures lower
than 273 K, dT is always negative. The technique is appropriate to measure pore radii in
the range of 1 to 150 nm, according to the theory in [15-20].
The pore volume, Vn (in mllg), of the wet samples, which corresponds to the volume of
the ice present within the pores of the silica divided by the weight, W, of the silica (in g)
is estimated by integration of the heat flux-versus-time plot using Eqn. 2. Division of this
value by the solid-liquid enthalpy change H (Jig) and the density D of ice (g/ml) provides
the pore volume Vn :
V n = J (P*dt)/H*W*D (mllg) (2)
H = 332 + 3.3*dT (Jig) (3)
The surface area, An' of the ice crystals (in m 2) divided by the weight, W, of the silica
(in g) is calculated from V n, Rn, and the shape factor F according to the empirically
determined Eqn. 4 :
(4)
The shape factor, F, is calculated from the fusion hysteresis [16,171. and has a theoretical
value of unity for a pure spherical, two for a cylindrical, and infinite for an open slit pore
shape. In practice, an infinite shape factor can never be found. The expressions (3) and (4) deviate from the expressions in the literature [18,19]. This discrepancy will be
addressed in the discussion.

18 Chapter 2 ----------------'----~-~---------
EXPERIMENTAL
Formation of the silica gel spheres
The solution of silica sol particles in water is formed by lowering the pH of a sodium
silicate solution according to a procedure based upon the method of Plank and Drake [21].
The final pH must be between 3 and 9.35. Above the value of 9.35, which is the first
ionization constant of monosilicic acid (MSA) in 1 M NaCI [221, the supersaturation of
MSA decreases and the sol particles dissolve. Additionally, below the point of zero charge
of silica, which is at a pH level of about 3, there are few ionized silanol groups on the silica
surface. The presence of ionized surface silanol groups is required for the growth and
gelling of the sol particles. Above the pH of 3 the silica surface is negatively charged [231.
The formation of an aqueous hydrogel involves two stages, viz., (i) addition of the
sodium silicate solution to an acid solution and formation of the sol, and (ii) increase of
the pH of the acid solution above 3 during the addition and gelling of the sol particles.
Two solutions A and B are prepared. The stock sodium silicate solution A is prepared
by mixing commercially available waterglass (Merck Natronwasserglas, Art. 5621) with an equal volume of doubly distilled water. The composition of the stock solution A is listed
in Tab. 1. The total silicon content is determined by ICP-AES [241, the sodium content
both by ICP-AES and AAS. The MSA is reacted with ammonium heptamolybdate, and the yellow p-silicomolybdate complex is determined colorimetrically at 410 nm, according to
the procedure of Iler [251. With colorimetry, standard silicon and sodium solutions in the
range of 1 to 100 mg/I Si0 2 and of 1 to 10 mg/I Na 2 0 are prepared.
The nitric acid solution B is prepared by diluting 65 wt% nitric acid (Merck, art. 456)
with water.
Stable sols of two different weight concentrations of silica are prepared, viz., sample 1a
containing 5 wt%, and sample 2a containing 13 wt% of silica in water (Tab. 2). In
practice, the weight concentration of silica can be varied between 2 and 13 wt% Si0 2 in
water. Above 13 wt%, rapid gelling of the sol proceeds before the spherical bodies are
formed, and below 2 wt% Si0 2 , no significant gelling of the silica sol occurs.
The sodium silicate solution A is slowly added to 50 ml of a stirred diluted nitric acid
solution B (present in a plastic cup in an ice-water bath). Th~ nitric acid solution B is kept
at 273 K to avoid premature gelling. The rate of addition of A is kept constant at 60 ml/h
with a Gilson Minipuls 2 pump. Two different nitric acid solutions of 0.4 and 2 M HN0 3
are used to prepare the samples 1a and 2a (Tab. 2), respectively. The added volume of
the waterglass solution A ;s expressed by the empirically determined Eqn. 5.
(mil (5)

19 Preparation of Sol-Gel Silica Spheres
with V Si ' the volume of added sodium silicate A (in mil. [HN0 3 ] the initial nitric acid concentration (in molellJ of B, and [Na+j the sodium concentration (in mole/I) of A.
When a pH of 5 is reached, the sol is quickly introduced through a hollow vibrating
needle into a double walled vessel (length 70 cm, diameter 9.5 cm) containing a cylinder
of 5 I hot paraffin oil. The temperature of the oil is kept at 363 K by means of a water
thermostatic bath (Tamson). The sol-gel conversion of the spherical sol droplets in the
paraffin oil is accelerated by the high temperature. The formation of siloxane bonds
between the primary sol particles calls for an activation energy between 50 and
84 kJ/mole depending on the silica structure [7,26,27]. Even higher values up to
100 kJ/mole have been reported [28]. The spherical hydrogel bodies of few mm's are
caught in 2 I demineralized water under the paraffin cylinder and subsequently washed
with 1.5 I demineralized water.
TEM and thermoporometry of hydrogel spheres
Samples 1a and 2a are not dried (hydrogel). The microstructure of the spheres of sample 2a (13 wt% silica in water) is investigated within a Philips EM 420 transmission
electron microscope (TEM) operated at 100 kV. A suspension of the hydrogel spheres in
ethanol is therefore prepared. A droplet of the suspension is brought on a holey carbon film
applied onto a copper specimen grid and dried. The hydrogels 1a and 2a are characterized by thermoporometry, which is performed with
a Setaram DSC 111 microcalorimeter. Two different cooling rates of the wet samples, 2
and 30 K/h, respectively, are applied.
Drying of hydrogel spheres
Samples 1band 2b, with 5 and 13 wt% silica, respectively, are dried at 393 K (Tab. 2).
A second batch is prepared with 2 M HN03 to check the reproducibility of the sol-gel
processes. This batch containing 13 wt% silica, is dried at 393, 333, and 293 K
(samples 3-5). A third batch, containing 13 wt% silica, is dried at 293 K (sample 6). No
hydrogels of samples 3 to 6 are investigated. Subsequently, the xerogels 1b, 2b, 3-6 are
calcined at 723 K, where no significant sintering occurs [29].

20 Chapter 2
Characterization of the dried spheres
The six samples 1b. 2b, and 3 to 6 are evacuated for 6 hat 473 K for N2 adsorption and
desorption within a Carlo Erba Sorptomatic 1800. The BET surface area and related pore
volume can be calculated from the extent of N2 adsorption. The pore size distribution is
calculated from the desorption isotherm [31], The xerogel spheres of sample 1band 2b
are impregnated with distilled water at a reduced pressure of about 0.03 hecto Pa. The
impregnated wet samples are measured by thermoporometry and the textural data thus
obtained are compared with those calculated from N2 adsorption and desorption (Tab. 2).
Hydrothermal ageing of hydrogel and xerogel spheres
Strengthening of the gel structure is achieved by hydrothermal ageing of the gel spheres
at 473 K. The pore radius, pore volume. and surface area are assessed as a function of
the period of time of the hydrothermal treatment, which amounts to 2, 4, 7, 23, and
47 h. The change in pore structure of xerogel spheres in 1 M NaCI is compared with that of hydrogel spheres of an equal silica concentration after hydrothermal treatment at the
above temperature of 473 K.
The xerogel spheres of sample 2b, dried at 393 K, are divided into five fractions for
hydrothermal treatment for the above five periods of time. The xerogel fractions (3.15 g each) are treated with 20.85 ml 1 M NaCI. The same treatment is performed on the
hydrogel spheres of sample 2a. which have not been previously dried. The hydrogel
spheres are washed with 1 M NaCI solution. In each experiment 24 g of the hydrogel
spheres. and the impregnated xerogel spheres with 1 M NaCI are placed in Teflon cups
in steel pressure vessels of 48 ml.
After hydrothermal treatment, the spheres of both sample 2a and b are washed with
distilled water and dried at 393 K. The hydrothermally aged samples are characterized by
Hg penetration, because Hg penetration is applicable for pore sizes larger than 4 nm [311.
The pore size distribution and pore volume are calculated with the Washburn equation and
the volume of Hg intruded at different pressures [31]. The internal surface area is
estimated from the pore volume and pore radius, assuming a cylindrical pore shape.
Examination of the shape factor Fin thermoporometric characterization
A commercial silica xerogel sample 7 is impregnated with water and measured by thermoporometry. Sample 7 has a pore radius of 7.7 nm and a specific pore volume of
1.8 ml/g, determined from N2 adsorption and desorption data.

21 Preparation of Sol-Gel Silica Spheres
Thermoporometry of sample 7 is performed using a Netzsch DSC controller 200 and a
model 43 measuring cell. The calorimeter has been calibrated for the 'relative calorimetric
sensitivity', the 'time-lag', and the 'thermal heat resistance' (THR). Due to the calibration
the position of the peak in the DSC profile does not depend on the rate of cooling or
heating. The following measuring sequence is used:
1. a cooling step from 293 to 213 K, rate -2 K/min
2. a heating step from 293 to 271.5 K, rate 1 K/min
3. a cooling step from 271.5 to 213 K, rate -1 K/min
4. a heating step from 213 to 293 K, rate 1 K/min
RESULTS
Sodium silicate solution
Otterstedt et al. [33) determined the size of the silica particles within the sodium silicate
solution to be 2 nm. Alexander [31) derived the relationship between the colloidal particle
size and the monosilicic acid concentration. The particle size is a function of the
sodium-to-silica ratio in the stock sodium silicate solution [32,33]. The ionized surface is
believed to be covered with a monolayer of hydrated sodium ions. A high sodium content
increases the surface area and reduces the particle size. A large part of the silica is
expected to be present as monosilicic acid, but not as large as the 63 mole% of the silicon
present as soluble silica (MSAI. as determined with the silicomolybdate method (Tab. 1).
Table 1 Composition and properties of the stock sodium silicate solution.
pH
lSi)
[Na)
[MSA]
density
3M
1.5 M
1.9 M
1.19 g/ml
0.047 g Na 20/mi
1) below the second ionization constant pK. of H3Si04' [43]

22 Chapter 2
Figure 1 TEM micrographs of fragmented hydrogel spheres gelled at a pH of 5,
with initial magnifications of 32,000 x (a) and 54,000 x (b). The sol particle size is 5 nm. (c) spherical silica sol gel bodies of few mm's size. The spheres are dried at
393 K.

23 Preparation of Sol-Gel Silica Spheres
I
em I
TEM of hydrogel spheres
TEM photographs of fragmented hydrogel spheres of sample 2a (Fig. 1) show that the
sol primary particles in the hydrogel have a size of about 5 nm. Accordingly the small
primary silica particles of a diameter of 2 nm present in the sodium silicate solution react
to particles of 5 nm during formation of the hydrogel. Small particle sizes of sol solutions
of silica prepared at low pH levels without any ripening have been reported by Okkerse and
de Boer [341.
Gel spheres of 5 and 13 wt% silica
The solid weight concentration of silica in the hydrogel is calculated from the weight
after drying :
wt% = (wt xerogell wt hydrogel) * 100 (%) (6)
The weight concentration of silica to be expected from the silica content of the added

24 Chapter 2
stock sodium silicate solutions, can be evaluated from the empirical Eqn. 7.
wt% 100 * Vs; * 0.18/(50+Vs;*1.19) (%) (7)
with Vs;, the volume of added sodium silicate solution A (in mil, 0.18 the silica
concentration in A (in g/ml), 50 the volume of B (in mil with a density of 1 g/ml, and 1.19
the density of A (in g/mll (Tab. 1).
The pore structure parameters of the hydrogel spheres of samples 1a and 2a and the
xerogel spheres 1band 2b are given in Tab. 2. The solid weight concentration according
to Eqn. 6 appears to be slightly higher than the theoretical silica concentration according
to Eqn. 7 (see Tab. 2). The apparent pore radius, Rn , of 10.2 nm of hydrogel sample 1a
of a low silica content is slightly larger than the radius of 8.4 nm of sample 2a, while the
meso pore volume, Vn, of both samples is equal (0.9 ml/g).
Dried silica spheres
A photograph of the sol-gel xerogel spheres dried at 393 K, which have a size of few
mm's size, is shown in Fig. 1c. Drying of the hydrogel samples leads to a reduction of the
pore radius to about 33 % of the original size, regardless of the silica concentration, which
ranges from 5 to 13 wt%. The thermoporometric shape factor F changes from 2.6 for the
hydrogel to 1.7 for the xerogel, indicating a more spherical pore shape after drying. The pore radius, Rp , (2.5 nm), the pore volume, Vp, (0.8 ml/g), and the BET surface area
(455 m 2/g) of the xerogels samples 1band 2b as measured by N 2 adsorption and
desorption are equal within the experimental accuracy. The pore radius, R , of the xerogeln
spheres 1band 2b determined by thermoporometry is larger than that obtained by N2
adsorption and desorption (Tab. 2). The fact that thermoporometry yields the pocket size instead of the size of the pore necks may explain the difference of the pore radii
determined by thermoporometry and nitrogen sorption.
The thermoporometric pore volume, V n, is lower than the liquid N2 pore volume, Vp,
owing to a non-freezing layer of at least a thickness, t, of 0.9 nm at the silica-water
interface (Rp == Rn + 0.9 nm) [35]. The pore volume of the samples can (roughly) be
corrected for this layer and the ice surface area, An' following Eqn. 8.
(ml/g) (8)

25 Preparation of Sol-Gel Silica Spheres
Table 2 Texture of hydrogel and xerogel spheres of various weight content of silica. The
xerogel spheres are dried at 393 K. Rn , V n and An obtained by thermoporometry
involve only the physical values of ice and not the pore characteristics.
hydrogel xerogel
Sample 1a 2a 1b 2b [HN0 3] (mole/l) 0.4 2 wt% Si0 2 (Eqn.6) 5 13 idem 1a idem 2a
wt% Si0 2 (Eqn.7) 4 10
thermoporometry
cooling branch
rate (K/h) -2 -2 -30 -4 -5 Rn (nm) 10.2 8.4' 6.4 2.9 3.5 Vn (ml/g) 0.9 0.9 0.5 0.5
heating branch
rate (K/h) 2 30 2
shape factor F 2.6 2.8 1.7
An (m 2 /g) 200 2 240 308 2802
Vn 1.5
N2 adsorption and desorption of xerogel Rp (nm) 2.5 2.3
V p (ml/g) 0.81 0.76
BET surface area (m 2/g) 459 455
1) average of 8.2 and 8.6 nm. 2) assumption of a cylindrical pore shape
Drying temperatures 273,333, and 393 K
The effect of the drying temperature, viz., 293, 333 and 393 K, for the samples 5, 4
and 3, respectively, on the pore structure of the xerogel is illustrated in Tab. 3 and in
Fig. 2, where the extent of N2 adsorption of the samples is plotted as a function of the
relative N2 pressure. Reduction of shrinkage is observed at drying temperatures above
293 K, since the samples dried at 333 and 393 K exhibit a high pore volume.
The sigmoid shape of the curves of Fig. 2 exhibited by the samples dried at 393 and
333 K indicate the occurrence of multilayer adsorption. Xerogel spheres dried at 293 K
have narrow pores. An isotherm displaying the shape of a Langmuir isotherm is observed. The BET surface area values of samples 5 and 6 are maybe smaller than the real surface
areas.

26 Chapter 2
1.0
393K 0.8
~ I Q)
E 0.6 ::l 0 > en "0 ell
.g 004
<J Q) a. (J)
0.2
0.0 -+-----,---..--..,.----,---r--~-.....,..-__.,r_-.___-_j
0.0 0.2 0.4 0.6 0.8 1.0
reI. pressure P/Po
Figure 2 Adsorption isotherms of N2 at 77 K on xerogel spheres dried at various temperatures. The thick lines represent adsorption and the thin lines the desorption isotherms.
Hydrothermal ageing of hydrogel and xerogel spheres
The growth of the mean pore size with ageing time of the samples 2a and b is represented in Fig. 3. A close relationship exists between the particle size of the initial sol
and the pore radius. Between large particles large pore radii are expected. The driving force
(Ostwald ripening) drops when the sol particles in the silica gel grow, which explains the
gradual decline in pore growth.
Fig. 4 displays the change of the pore volume with the period of time of hydrothermal treatment for hydrogel 2a and xerogel 2b. Only the pore volume of the hydrogel samples
significantly increases. The pore volume of the xerogel samples, already submitted to

27 Preparation of Sol-Gel Silica Spheres
shrinkage upon drying, remains at a constant low level [7,29]. In Fig. 5 the surface area
is plotted as a function of the period of time of hydrothermal treatment of hydrogel and
xerogel spheres, samples 2a and 2b, respectively. The decrease in surface area is
accompanied by pore growth as evident from Figs. 3 and 5.
Table 3 Influence of the drying temperature on the texture of xerogel spheres determined
by measuring the N2 adsorption and desorption isotherm.
sample T(K) Rp(nm) Vp(ml/g) BET surface area (m 2 /g)
1b
2b
3
393
393 393
2.5
2.3
3.5
0.81
0.76
0.83
459
455 424
4 333 2.1 0.55 689
5 6
293 293
<2 0.8
0.28 0.16
486 621
The shape factor Fin thermoporometric characterization
Fig. 6 shows the thermogram of sample 7, which comprises the cooling step (3) and
the heating step (4). The two endotherm peaks plotted in the positive direction of step (4)
represent water in the pores at -3 °e and bulk water at 0 °e. The exotherm peak plotted
in the negative direction at -7 °e of cooling step (3) represents water in the pores of the
silica gel. The shape factor F of sample 7 is the ratio of A and B, which is AlB = 7/3 2.3 in Fig. 6.
DISCUSSION
The silica concentration calculated according to Eqn. 6 appears to be slightly higher
than the theoretical value calculated from Eqn. 7 (Tab. 2). The difference is attributed to sodium and water captured in the cavities of the gel structure in combination with not
fully condensed, adsorbed MSA at the silica-water interface [7,29,31,36]. ehertov [7]

28 Chapter 2
reports the release of interglobular water from hydrothermally sintered silica as assessed by means of ignition and differential thermogravimetric measurement up to 1273 K. The
release of sodium and condensation of silanol groups during hydrothermal treatment
causes a dramatic change in pH of the hydrothermal ageing fluid; the pH level rises from
6 to 10.
In the literature [6.7.34.37] the silica concentration is assumed to affect the pore
structure of hydrogel and xerogel spheres only slightly. Plank and Drake have reported
differences in pore structure for samples of various silica concentrations ranging from 1.5
to 10 wt% [21]. Subjecting the gels to an exchange of the sodium ions before drying [21] may initiate a variation in pH with drying [9]. In our experiments sodium exchange has not
been performed, and. therefore, the pore structure of the xerogel is not a function of the
silica concentration. but depends on the pH and the primary particle size [38].
70
60
50
E c
- 40 l/l::::l '6 ro "
30cD 0 Q.
20
10
0
T = 473K wt Si02 / wt 1MNaCI=.15
0 10 20 30 40 50
time (h)
Figure 3 Pore growth of aged hydrogel and xerogel spheres with increasing duration of the hydrothermal treatment. The pore radius of the silica spheres has been plotted as a function of the period of time of the hydrothermal treatment. The pore radius has been measured by Hg intrusion.

29 Preparation of Sol-Gel Silica Spheres
1.6-,-----------------------.....,
hydrogel 1.2
I ~
Q.l xerogelE
::J o 0.8 >
I
Q.l o a. U Q.l a. C/) 0.4
T= 473K wt Si02 / wt 1MNaCI=.15
O.O+-----r----.....,...----...,..----,..------j o 10 20 30 40 50
time (h)
Figure 4 Influence of hydrothermal gel ripening on the pore volume of hydrogel and xerogel spheres. The pore volume has been calculated from the Hg intrusion results.
Silica xerogels prepared by Okkerse and de Boer [34] at a static pH level of 3 and dried
at 393 K have a high specific surface area (820 m21gl, a small primary particle size, and
a low pore volume (0.3 m/lg). Silica xerogel prepared at a static pH level above 5.5 has
a low specific surface area (440 m21gl, large primary particles, and a high pore volume
(0.8 ml/g). The pH in solution B varies from a to 5 during preparation of the sol, but the
final pH level of 5 seems to be most important, because the pore structure of our samples
resembles that of the silica gels of Okkerse and de Boer prepared at a static pH level of
5.5 [34].

30 Chapter 2
500 -,-------------------------....,
T =473K wt Si02 / wt 1MNaCI=.15
400
~ E -300 ctl ~ ctl Q)
~ '5 200 (/)
~ c.. (/)
100
xerogel --.,-- 06
0+--------,r-------,------.,--------,------1 a 10 20 30 40 50
time (h)
Figure 5 Development of the specific surface area of hydrogel and xerogel spheres with the period of time of hydrothermal treatment.
Effect of the drying temperature
Shrinkage during drying is affected by two factors, viz., i) the capillary stress in the
liquid pressing the primary particles together, and ii) neck growth between the primary
particles and strengthening of the gel structure, which counteracts the capillary stress.
The shrinkage proceeds until the mechanical strength of the porous body can withstand
the pressure exerted at the silica-liquid contact angle. Eqn. 9 expresses the capillary stress
in the liquid, P, on the pore surface, as a function of pore radius, Rp (nml. water-vapor
surface tension, y (N/ml. and e the contact angle, derived from the relations P*dV =y*dA,
dA/dV = 2/r, and the radius of curvature r =Rp/cose :

31 Preparation of Sol-Gel Silica Spheres
P = 2 y * cosO I Rp (Pa) (9)
The surface tension of water-vapor at drying temperatures of 293, 333, and 393 K is
0.073,0.066, and 0.059 N/m by extrapolation, respectively (Handbook, 56 th edition!. The
capillary force probably is less important at high drying temperatures, which is caused by
1.00
Shape Foetor F=A/B=7/3=2.3
---. CJ1 ::;;;:E 0:::
""-. W I3: 0.50 f E a o zOJ wCJ1
I -+-' (jJ
?: ""-. x ::::l heating branch (4) "I 0.00
-+-' c0 (jJ cooling branch (3) ::;;;:-c
0::: W I f a x w
A - 0.50 -h-r-l--,-r-r-r-r-,..,........,.....,......,....,.....,....,...-r-r-r-r...,......,-r-l--r-1r-r-r-r-,...,-.,.....,...,....,J
-60 -40 -20 o T-273 (K)
Figure 6 Thermogram of silica gel sample 7. 5.4 mg xerogel and 30 mg water, together 35.4 mg of the wet gel, is measured by thermoporometry. Exothermic peaks are plotted negatively, and endothermic peaks positively. The thermogram comprises a cooling branch (3) (rate -1 K/min) with an exotherm peak of water in the pores of the gel and a heating branch (4) (rate I K/min) with two endotherm peaks, one
of water in the pores at -3° C and one of bulk water at 0° C. The shape factor F , dT(A)/dT(B), is 2.3. The heating branch (4) lies above and the cooling branch (3) lies below the dashed line of 0 mW/mg at point C. This is due to the Cp of ice. The Cp can be estimated: 0.03 heat-flux/wet-gel*35.4 mg wet-gel! (30 mg water* 60 sec/K) = 2.1 Jig.

32 Chapter 2
the reduced surface tension of water. The effect of the surface tension of the evaporating
solvent on the final decreased pore volume of the xerogel is clearly demonstrated in work
of Dashpande et al. [39]. Furthermore, the residence time of the meniscus in the pores
decreases with drying at high temperatures. Therefore, the specific pore volume in the
pores of the spheres increases when they are dried at higher temperatures.
Comparison between aged hydrogel and xerogel
From Fig. 3, a pore growth more rapid with the xerogel 2b than with the hydrogel 2a is
evident. In the literature [7] similar results have been attributed to the effect of the initial
pore and surface structure. The initial pore radius, Rp , of the xerogel 2b is smaller than the
initial radius, Rn , of hydrogel 2a (Tab. 2). The xerogels probably contain more condensed
silanol groups than the hydrogels. The fact that the surface silanol groups play an
important role in the deposition of silica is confirmed by the literature [7,9,36,40].
The meso pore volume of xerogel being virtually constant with ageing, as indicated in
Fig. 4, is also confirmed by low-field NMR spin-lattice relaxation [41]. Some decrease of
the pore volume of the xerogel is probably due to condensation of OH groups present on
different elementary silica particles, which leads to densification of the gel matrix. The
process is called syneresis. The increasing pore volume of aged hydrogels agrees with the
result of Pauthe et al. [421. The authors found an increase of the meso pore volume
(1 nm < R< 30nm) with ageing of not dried alcogels.
The ice-water transformation enthalpy
Our expression (3) of the ice-water transformation enthalpy, H, differs from the
expression introduced by Brun et al. [15]. The authors use the following relation for H :
H 332 + 7.43*dT + 5.56*10-2 *dT 2 (Jig) (10)
Eqn. 10 assumes the presence of a layer of thickness t of water which cannot solidify due
to interaction with the surface of the solid. With a cylindrical pore shape, the volume of
the non-freezing water, which affects the value of H, the transformation enthalpy
according to Eqn. 10, depends on dT, the drop in the solidification temperature. Because
Rn is a function of dT, the volume of the non-freezing water is a function of dT. The
following equation of H has been given in [18] :

33 Preparation of Sol-Gel Silica Spheres
H = 332 + 0.25*dT (JIg) (11)
The origin of the constant 0.25 JIg *K in Eqn. 11 has not been clarified. Recently, Cuperus
et al. [201 reported a value of H, where it is not clearly described whether the apparent
transition energy H is corrected for the non-freezing layer;
H 332 + 11.39*dT + 0.155*dT 2 (JIg) (12)
We prefer an expression of H applicable to water within pores of different shapes, because
the pore volume can be corrected for the non-freezing layer afterwards (without
assumption of a spherical shape). The enthalpy, H, should be corrected for the energy
involved in the formation of a ice-water interface, that is :
dH, = dso*dT 1.2 *dT (JIg) (13)
Besides, the heat of phase transformation must be corrected for the difference in heat
capacity Cp of supercooled water and ice (C~, and C~) (zero order approximation) :
(4.2-2.1)*dT = 2.1 *dT (JIg) (14)
Both corrections (dH, +dH2 ) are applied in our Eqn. 15 and earlier in Eqn. 3.
H = 332 + (dH, +dH 2 ) = 332 + 3.3*dT (JIg) (15)
The shape factor Fin thermoporometric characterization
The theory of the shape factor [181 assumes exclusively spherical and cylindrical pores.
Accordingly the value of the shape factor F should necessarily be confined to values
between 1 (spherical pores) and 2 (cylindrical pores), since the pore shape can be neither
pure cylindrical nor pure spherical [17,191 :
1 < F < 2 (16)

34 Chapter 2
However, open slit-shaped pores exhibit theoretically a shape factor of infinity, which is
of course with real pore systems never observed. Our experimental data (Table 2) indicate
for the hydrogel sample 2a a mean shape factor F of 2.7. With cooling rates of 2 and
30 K/h shape factors of 2.6 and 2.8, respectively, have been measured. The shape factor
of the xerogel sample 7 is 2.3. Bearing in mind the fact that the sample 7 is a dried gel
and that the shape factor F is diminished after drying, the shape factor of the not dried
sample 7 was probably larger than 2.3.
The value m, which gives together with the radius, Rn, the surface-to-volume ratio of the
pores according to Eqn. 17, is 2 for cylindrical and 3 for spherical pores. The factor m,
which thus is used to calculate the surface area, An' from the ice crystal radius, Rn, and
the pore volume, Vn, is related to the shape factor F by m = 4-F [191.
(17)
According to ref. [191, F is limited to values < 4. Therefore, we prefer the empirical
relation m = 1 + 2/F above the empirical relation m = 4-F. The relation m = 1 + 2/F is used in Eqn. 4.
CONCLUSIONS
1) A procedure to prepare spherical gel bodies of a uniform pore structure is described.
The xerogel pore structure is mainly determined by the drying temperature and not by the
silica concentration. Pore volumes between 0.2 and 0.8 ml/g can be obtained upon drying
at temperatures between 293 and 363 K. Even values for the pore volume as high as
1 .4 ml/g are attained after hydrothermal treatment of hydrogel spheres. The pore radius
varies between 0.8 and 60 nm and, consequently, the surface area between 690 and
38 m 2/g with ageing times varying between 0 and 47 h.
2) When the hydrogel samples are treated hydrothermally, the elementary particles in
the gel are compressed to a more dense xerogel. A change of the pore shape to a more
spherical shape is detected by thermoporometry. The radius of the dried xerogel pores,
as determined by thermoporometry, is larger than the radius measured by N2 adsorption
and desorption (Rn> Rp), because thermoporometry yields the internal radius of the pores
instead of the pore neck radius. Moreover, the pore volume and the internal surface area
of the xerogel spheres as obtained by thermoporometry are too low; Vn < Vp , which is
caused by a non-freezing layer of a thickness of 0.9 nm.

35 Preparation of Sol-Gel Silica Spheres
3) The features observed during hydrothermal ageing of hydrogel and xerogel spheres
are remarkably different. A more pronounced pore growth of the xerogel spheres is
observed. An increase of pore volume, on the other hand, is found with hydrogel spheres,
whereas the pore volume of xerogel spheres which were already submitted to a certain
extent of shrinkage remains constant.
ACKNOWLEDGMENTS
This investigation is a result of participation in the Debye Institute. The authors wish
to thank J.J. van Beek, dr. P.A. Buining, dr. J.T. Kloprogge, and dr. C.J.G. van der Grift
for the critical review of the paper.
REFERENCES
1. J.W. Geus, Preparation of Catalysts III, Ed. G. Poncelet, P. Grange and P.A.
Jacobs, Elsevier, Amsterdam, (1983) 1
2. J. Zarzycki, M. Prassasand J. Phalippou, J. Mat. Sci., 17 (1982) 3371
3. A.J. Hurd and C.J. Brinker, J. Phys. France, 49 (1988) 1017
4. P.H. Berben, A. Scholten, M.K. Titulaer, N. Brahma, W.J.J. van der Wal and J.W.
Geus, Stud. in Surf. Sci. and Catal. 34 : Catal. Deact. IV, Ed. B. Delmon and G.
Froment, Elsevier, Amsterdam, (1987) 303
5. R.Yu. Sheinfain and I.E. Neimark, Kinetika i Kataliz USSR, 8 II (1967) 433, Engl.
Transl. 370
6. G.A. Nicolaon and S.J. Teichner, Bull. Soc. Chim. France, 8 (1968) 3107,5 (1968)
1906
7. V.M. Chertov and V.V. Tsyrina, Coli. J. USSR, 47 V (1985) 922
8. A.V. Kiselev, V.M. Luk'yanovich, Yu.S. Nikitin, E.B. Oganesyan and A.I.Sarakhov,
Call. J. USSR, 31 III (1969) 388
9. V.A. Fenelov, V.Yu. Gavrilov and L.G. Simonova, Preparation of Catalysts III, Ed.
G. Poncelet, P. Grange and P.A. Jacobs, Elsevier, Amsterdam, (1983) 665
10. C.J.G. van der Grift, J.W. Geus, H. Barten, R.G.1. Leferink, J.C. van Miltenburg and
A.T. den Ouden, Characterization of Porous Solids, Eds. K.K. Unger et al., Elsevier,
Amsterdam, (1988) 619
11. B.J.J. Zelinski and D.R. Uhlmann, J. Phys. Chem. Solids, 45 X 1069
12. C.J. Brinker, K.D. Keefer, D.W. Schaefer and C.S. Ashley, J. Non-Cryst. Solids, 48
(1982) 47
13. M. Prassas, J. Phalippou, J. Zarzycki, J. de Physique, 43 (1982) C9-257
14. I. Shapiro and I.M.Kolthoff, J. Am. Chem. Soc., 721 (1950) 776

36
15. M. Brun, A. Lallemand, J.F. Quinson and C. Eyraud, Thermochimica Acta, 21
(1977) 59
16. C. Jallut, J. Lenoir, C. Bardot and C. Eyraud, J. Membr. Sci., 68 (1992) 271
17. C. Eyraud, J.F. Quinson and M. Brun, Characterization of Porous Solids, Eds. K.K.
Unger et al., Elsevier Amsterdam, (1988) 295
18. J.F. Quinson and M. Brun, Characterization of Porous Solids, Eds K.K. Unger et al.,
Elsevier Amsterdam, (1988) 307
19. J.F. Quinson, M. Astier and M. Brun, Applied Catal., 30 (1987) 123
20. F.P. Cuperus, D. Bargeman and C.A. Smolders, J. Membr. Sci., 66 (1992) 45
21. C.J. Plank and L.C. Drake, J. Call. Sc., 2 (1947) 399
22. R.H. Busey and R.E. Mesmer, Inorg. Chem., 16 X (1977) 2444
23. R.P. Abendroth, J. Call. Interf. Sci., 34 IV (1970) 591
24. P.W.J.M. Boumans, Inductively Coupled Plasma Emission Spectroscopy, 90 I, Wiley Interscience, (1987)
25. R.K. Iler, The Chemistry of Silica, Wiley N.Y., (1979) 94-101
26. J.D. Rimstidt and H.L. Barnes, Geochim. et Cosmochim. Acta, 44 (1980) 1683
27. A.C. Makrides, M. Turner and J. Slaughter, J. Call. Interf. Sci., 73 (1980) 345
28. C.B. Hurd, R.C. Pomatti and J.H. Spittle, J. Am. Chem. Soc., 66 (1944) 388
29. N.V. Akshinskaya, T.A. Baigubekova, A.V. Kiselev and Yu.S. Nikitin, Call. J. USSR,
28 II (1966) 164. Engl. Transl. 139 30. S. Lowell and J.E. Shields, Powder Surface Area and Porosity, 2nd. Ed., Chapman
and Hall London, (1984) 1-135
31. G.B. Alexander, J. Phys. Chem., 61 (1957) 1563
32. R.K. lIer, Soluble Silicates, Ed. J.S. Falcone Jr., ACS Symposium Series 194,
Washington D.C. (1982) 96
33. J.A. Otterstedt, M. Ghuzel and J.P. Sterte, J. Call. Interf. Sci., 115 I (1987) 95
34. C. Okkerse and J.H. de Boer, J. Chim. Phys., 57 (1960) 534
35. LV. Yazynina, V.1. Kvlividze and A.V. Krasnushkin, Call. J. USSR, 49 VI (1987)
1188 36. B.A. Fleming, J. Call. Interf. Sci., 110 I (1986) 40
37. K. Gartner and R.Griessbach, Kolloid-Zeitschrift, 160 I (1958) 21
38. K.S.W. Sing and J.D. Madeley, J. Appl. Chem., 3 (1953) 549
39. R, Deshpande, D.W. Hua, D.M. Smith and C.J. Brinker, J. Non-Cryst. Sol., 144 (1992) 32
40. E.G. Bohlman, R.E. Mesmer and P. Berlinsky, Soc. Pet. Eng. J., 20 (1980) 239
41. P.J. Davis, C.J. Brinker and D.M. Smith, J. Non-Crystal. Sol., 144 (1992) 32
42. M. Pauthe, J.F. Quinson, H. Hdach, T. Woignier, J. Phalippou and G.W. Scherer,
J. Non-Crystal. Sol., 130 (1991) 1
43. S.A. Greenberg, J. Am. Chem. Soc., 80 (1958) 6508
37
Chapter 3
The differences in the elementary processes proceeding during ageing of hydrogels and of xerogels
M.K. Titulaer, P.E. Groenendijk1, J.B.H. Jansen, and J.W. Geus'
Department of Geochemistry, Institute of Earth Sciences, University of Utrecht,
Budapestlaan 4, P.O. Box 80.021, 3508 TA Utrecht, The Netherlands.
'Department of Inorganic Chemistry, University of Utrecht, Sorbonnelaan 16, P.O. Box
80.083, 3508 TB Utrecht, The Netherlands.
ABSTRACT
Spherical porous sol-gel silica bodies are prepared by addition of a sodium silicate
solution to a dilute nitric acid solution. The thus prepared silica sol of 13 wt% silica in
water is introduced dropwise into hot paraffin oil, which results in spherical hydrogel
spheres. Some batches of the hydrogel spheres are dried at 393 K, forming xerogel
spheres. The spheres of a few mm's size have been aged under different hydrothermal
conditions. The pore structure of the spheres is modified by an autoclave treatment in
water. Differences in the ageing mechanisms of hydrogel and xerogel spheres are
monitored by the development of the pore radius, pore volume, and surface area. The
differences can be ascribed to the different kinetics of silica polymerization of hydrogel and
xerogel. Various ageing conditions are compared, viz., 1) temperatures between 298 and
523 K, 2) pH levels between 3.3 and 6.8, 3) ion strengths between 0 and 6 M, and 4)
pressures between 1 and 2800 hecto Pa. The hydrothermal treatment is performed at a
constant duration of 24 h. The pore structure of the spheres is mainly influenced by the
temperature, the pH, and the silica over water ratio with ageing, whereas the ion strength
and the pressure have little effect.
INTRODUCTION
Though a large body of literature has been published on the preparation of alcogels and
the adaption of the pore structure, mainly dealing with utilization of the alcogels in the
38 Chapter 3
production of glass at low temperature, only a few amount of papers are considering the
differences in the elementary processes proceeding during ageing of the hydrogels, on the
one, and xerogels, on the other hand. The gels studied in this work are prepared from
sodium silicate solutions. We are mainly interested in the development of the pore
structure of the gels, in view of the use of the aged gels as a model system of a catalyst
support.
In the previous Chapter 2 we have described the preparation of porous silica bodies of
a few mm's size with a pore structure controlled by varying the drying conditions and the
duration of a subsequent hydrothermal treatment. The spheres are prepared by addition
of 76 ml of a sodium silicate solution (3 M Si, 1.5 M Na) to 50 ml of a 2 M HN03 solution
present in a plastic cup in an ice-water bath. The resulting silica sol containing 13 wt%
Si02 in water is immediately after preparation introduced dropwise into a cylinder of
paraffin oil kept at 363 K, forming spherical hydrogel bodies. After washing with
demineralized water, some batches of hydrogel spheres are dried at 393 K, forming xerogel
spheres.
The silica gel spheres consists of a network of primary sol particles of 5 nm size.
Ostwald ripening of the primary particles in the gel is accelerated by hydrothermal
treatment of the spheres. Reorganization of the silica results in the final pore structure. As
a result of ageing, the specific surface area decreases, and the pore size is increases. The
research dealt with in this chapter is focused upon the effects of different ageing
conditions, such as, 1) temperature, 2) pH, 3) concentration of NaCl, 4) pressure, and 5)
silica-to-water ratio. Ageing of hydrogels and xerogels is especially compared. The
development of the pore structure is assessed with nitrogen sorption on untreated xerogel
spheres, and with mercury penetration with gels treated at stepwise varied conditions after
drying.
Silica solubility in the hydrothermal fluid
The ripening of silica gel proceeds rapidly at high temperature, because i) of the large
silica solubility S(T), and thus expected large gradients of the silica solubility, and ii) a high
rate of polymerization and depolymerization. Empirical functions for the solubility SIT) of
silica are Eqn. 1 published by Fournier and Rowe [11 and Eqn. 2 by Fleming and Crerar [21 :
log S(T) = -7311T + 4.52 (1 )
log SIT) = -8401T + 5.12 -7.9xlO·4 *T (2)
where SIT) is the solubility (ppm = mg Si0211l, and T the temperature (K). By application
of the equation dlog S(T)/ d(11T)=-H,/2.303*R using Eqn.1 with R = 8.314

39 Hydrothermal Ageing of Sol-Gel Silica Spheres
J *mole-' * K-', the heat of solution is calculated to be 14 kJ/mole. The solubility strongly
depends on the structure of the silica-electrolyte interface. At 298 K a value of
115 ppm monosilicic acid (MSA) is generally accepted for amorphous silica, whereas the
solubility of quartz is approximately ten times lower, viz., 11 ppm [3].
The effect of the silica sol particle size
The equilibrium solubility S(T,d) in ppm of a sol particle of a diameter d (nm) at a given
temperature T (K) according to the Kelvin equation of ref. [4] is :
log [S(T,d)/S(T)] = 4*y*Vm/(2.303*R*T*d) = 257/(T*d) (3)
S(T) is the solubility of a silica surface of a virtually infinite large radius of curvature, which
is 115 ppm at 298 K, y the surface tension of silica, which is 0.045 N/m, Vm the molar
volume of 2.73*10-5 m 3 /mole, and R the gas constant of 8.314 J*mole-'*K-'. The silica
in the hydrothermal fluid is transported due to a concentration gradient caused by the
equilibrium solubility of particles of different sizes (Ostwald ripening). The silica is
transported from the small sol particles of a high equilibrium solubility to the large particles
of a lower equilibrium solubility. The small particles thus dissolve, and attain an even
higher equilibrium solubility by the reduced particle size. A combination of Eqn. 1 with
Eqn. 3, yields the Eqn. 4 :
log S(T,d) 257/(T*d) -731rr + 4.52 (4)
,which can be rewritten by the relation As=2727/d with As is the specific surface area
of the silica sol particles (in m 2/g) to :
log S(T,As) = 0.094*Asrr -731rr + 4.52 (5)
Effect of the pH
An apparently high silica solubility is established when the pH reaches the first MSA
ionization constant of 9.8 at 298 K [5]. Fleming and Crerar have reviewed the literature

40 Chapter 3
[2). The authors arrived at Eqn. 11, which completely describes the relationship between
the solubility of silica, the pH and the temperature.
MSA + OH" -- > MSA + H20 (6)
(7)
log Kw(T) = 0.0265 *T-22.03 (8)
(9)
log Ke(T) = 1479fT-0.65 (10)
(11 )
with S(pH,T) the silica solubility (ppm) as a function of the temperature T (Kl, and the pH.
Effect of the concentration of NaCI
The values of Kw and of Ke at 298 K, the equilibrium constant defined in Eqn. 9, depend
on the concentration NaCI. [NaCI] in ref. [61 by :
logKw(298K,NaCIl = 10gKw+0.22[NaCII+ 1.022"/[NaCII/(1 +"/[NaCI]) (12)
logKe(298K,NaCIl = 10gKe+0.11 [NaCIl + 1.022../[NaCIl/(1 +../iNaClJ) (13)
Furthermore, the addition of NaCI has several effects on the development of the pore
structure during hydrothermal ageing. NaCI affects both the number of ionized surface
silanol groups and the solubility of amorphous silica. Marshal [7] has made a detailed study
on the effect of 0 to 6 M of a 1-1 electrolyte on the solubility of silica between 298 and
573 K. An important conclusion is that the solubility does not depend on the anion of the
salt added but decreases in the order Mg 2 +,Ca2+ > Li+ > Na +> K+. Smaller cations bind
water more strongly. The cations remove 'free' water from the solvent and thus decrease
the solubility of silica. Since the ionic radii Li+, Na+, and K+ are 0.68, 0.98, and 1.33 A, respectively, the effect of the above cations on the solubility of silica agrees with the removal of 'free' water. The solubility in 0 to 6 M NaCl, similar to that in NaN03 , is given by Eqn. 14:

41 Hydrothermal Ageing of Sol-Gel Silica Spheres
log [S(T)/S(NaCI,Tl] = 0.008285 * [NaCI] * 10280/T (14)
where S(NaCI,Tl is the silica solubility in NaCI (in ppm = mg Si0 2/1) at a given temperature
T (in K), S(T) the salt free solubility as a function of the temperature, and [NaCI] the
sodium chloride concentration (in mole/l). The solubility in 6 M NaCI at 298 K, which is
42 ppm is considerably lower than that in water, which is 115 ppm, a decrease of 63%.
At the higher temperature of 573 K in 6 M NaCI, the decrease of solubility is less, viz.,
the solubility is only 30% lower than the level of 1700 ppm in pure water.
Effect of the pressure
Increasing the pressure from 1 to 1,000 hecto Pa, shifts the equilibrium of Eqn. 15 to
the smallest molar volume (Vm (Si0 2 +2H 2 0-MSA) > 0 m 3 /molel. Raising the pressure
increases the density of water at 473 K from 0.86 to 0.92 glml and consequently, the
solubility of silica from 900 to 1237 ppm (Eqs. 16-20, and experimentally derived Eqn. 21)
[1,8,91.
(15)
dU q + Weef = T*dS - P*dV + I; tJ;*dn; (J) (16)
where dU is the energy of the system, q is the thermal energy and weef the volume work
of the system, which decreases the energy of the system and has a negative sign. The
Gibbs free energy, dG, of the system for the reaction of Eqn. 15, thus free of the thermal
energy change and the volume work is given by ;
dG = dU - d(TS) + d(PV) = -S*dT + V*dP + I;tJ;*dn; = 0 (J) (17)
(19)

42 Chapter 3
Vm(Si02 +2H20-MSA) * dP - 2.303*R*T * dlog [MSA] (J/mole) (20)
and experimentally derived from Eqn. 20 :
log [S(P,T)/S(Po,T)] 2.3 * (D(P,T)-D(Po,T)) (21)
where V is the change in molar volume with polymerization (m3/mole), dP the increasedm
pressure (N/m 2), R is 8.3 (J/mole*K), T the temperature (K), [MSA] the monosilicic acid
concentration (mole/I), S(P,T) the silica solubility as a function of pressure and temperature
(ppm), D(P,T)-D(Po,T) the change in density of water with increased pressure (in g/mll.
Polymerization at the silica surface in the hydrothermal fluid
The kinetics of the polymerization of silica from supersaturated MSA solutions has been
studied in three ways, viz., i) quenching a hot silica solution [10,11], ii) lowering the pH
of a sodium silicate solution by addition of a strong acid [12], and iii) cation exchange over
a resin column [13,14]. The dissolution kinetics is simply investigated by addition of silica
to water, and measuring the MSA concentration as function of time [151. The kinetics of
the polymerization of silica can roughly be divided into two regimes : 1) nucleation and
formation of LMS (Low Molecular Silica), and 2) growth of large colloidal particles in later
stages of the polymerization. The dimerization of MSA follows in all probability an SN2
reaction path, exhibiting a second order in MSA and a first order in the hydroxyl
concentration [16-19], Only MSA, and not the dimers and LMS species, is probably
responsible for the transport of silica in the hydrothermal fluid, because the diffusion
coefficient decreases with the polymeric size, according to a Stokes-Einstein relationship
[20l. In the literature, the rate of the drop in MSA has reported to be first order [21,22],
third order [23-25], and even fourth order [10] with respect to the MSA concentration,
depending on the various models used. As the polymerization proceeds, large colloidal
particles appear, which take over the role as nucleophile instead of ionized MSA.
Furthermore, the silica concentration reaches the equilibrium solubility. The growth of the
sol particles is first order with respect to not ionized MSA and ionized surface silanols
(Eqn. 22) [12,26,27]. The rate of dissolution is proportional to the number of ionized
surface silanols, but zero order with respect to MSA (Eqn. 23).
d[MSA)/dt = -k,(T) * [SisO"] * ([MSA]-Sx(T)) (22)
d[MSAl/dt = kb(T) * [SisO") (23)

43 Hydrothermal Ageing of Sol-Gel Silica Spheres
(24)
with [MSAj the concentration of MSA in solution (ppm), Sx(T} the equilibrium solubility
of MSA adsorbed at the silica-water interface, which is 200 ppm at 298 K (Eqn. 25),
d[MSAlIdt (ppm *s·'). kj(T), and kb(T} the forward and backward rate constant (mole" *1 *s
and s·'). respectively, and [Si.O·] the concentration of ionized surface silanol groups
(mole/l). The salt-free forward rate constant ~(T) for amorphous silica is 1.03 mole" * 1* S·l
at 298 K [26].
log S.lT) = -575fT + 4.23 (25)
where Sx(T) is the solubility of adsorbed MSA (ppm). and T (in K). The pH and the ion
strength are determining the number of ionized surface silanol groups. There is confusion
about the number of surface silanols per unit surface area, probably due to the presence
of adsorbed MSA during polymerization, and the effect of the calcining step before the measurement of the amount surface silanols. The density of silicon atoms on a fully
condensed surface (9.2 nm·2) is similar to the density of the a x b plane of hexagonal
p-tridymite or of the (110) plane of cristobalite, which surface is covered with tertiary
silanol groups. Fifty percent of the silanol groups point out of plane, which leads to a
density of 4.6 nm·2 [28-301. A value of 3.5 nm·2 silanol groups at the surface is reported
in ref. [31]. The spectroscopic amount of silanol groups comprises 1 A nm·2 of isolated,
3.2 nm·2 of vicinally paired (together with the isolated silanols 4.6 nm·2). and 1.6 nm·2 of
internal groups in bulk Si02 (together 5.8 nm·2) after drying at 383 K [16,32-351. The
vicinally paired silanol groups seem to be hydrogen bonded to each other on the surface
and are chemically much less reactive than the free silanol groups [281. The maximum
proton exchange capacity of 5.8 nm·2 of silica gel in 3 M NaCI0 3 is determined by a coulometric titration, which shows that internal groups can participate in the exchange
reaction [36]. The activation energy of polymerization is 61 kJ/mole and that of dissolution
50 kJ/mole. The difference is about the heat of solution H. of 11-14 kJ/mole
[1,19,26,37].
Sx(T) is the equilibrium concentration of an intermediate reaction species at a silica
surface covered by adsorbed MSA, which amounts to 200 ppm at 298 K. Holt and King
[38,151 established the existence of the adsorbed layer exhibiting a high solubility. An
instantaneous rapid dissolution of the adsorbed layer is observed, when silica powder or
quartz is added to a NaOH solution [27]. whereas rapid adsorption of the layer takes place
when calcined (and, hence, MSA-free) silica powder is added to not saturated MSA solutions. The existence of adsorbed MSA on the silica surface is probably the main
difference between a hydrogel and a calcined xerogel. The presence of the adsorbed species during polymerization implies that the density of
silanol groups is higher than 4.6 nm·2• Weres et al. [39] found a value of 6.8 nm·2 during

44 Chapter 3
the early stages of polymerization, with a maximum of 7.85 nm,2.
The order of the particle growth rate in the hydroxyl concentration decreases from 1.3
to 0 when the pH is raised from 6 to 7.3, because at a high pH level the surface is
saturated with SisO' groups. Efforts to explain the surface ionization with physical
absorption of OH' have failed. In refs. [40-441. a site-binding model has been proposed in
which both chemical and physical interactions are considered simultaneously. In this model
the surface charge and the solution equilibria can be calculated in the presence of most
electrolyte ions. The surface ionization and complexation with sodium is represented in
Eqn. 26.
SisOH + Na; --> SisO'-Na+ + H; (26)
The subscript s means surface. The SiO'-Na+ surface species have no particular bonding
structure. Both Na; and H; show a Boltzmann distribution (Eqn. 27).
[H;] 1 [Na;] = exp(4.3*fl * [Wl 1 [Na+] (27)
with [H;] the concentration at the silica surface, [H+] the concentration in the bulk of the solution, 4.3 factor varying with the reciprocal temperature, which is 4.3 at 298 K, and
f the fraction ionized surface sites. If the fraction f is known, the concentration [SisO'] in
solution can be calculated with Eqn. 28 and used in Eqs. 22 and 23.
[SisO'] = W * As * f * 7.85*10 18 /6*10 23 * V (28)
with W the weight of Si02 (in gl, As the specific surface area (m2/gl, f the fraction ionized
silanol groups, 7.85 * 10 18 m,2 the quantity of surface silanol groups during the
polymerization, 6 * 10 23 Avogadro's number (mole,1 l, and V the volume of the hydrothermal
fluid (I). Eqn. 30 shows the relation between the fraction f of the ionized surface silanol
groups, the pH, and the [NaCI], which is derived from the experimental Eqn. 29. It appears
that the amount ionized surface silanol groups is increased with the pH and the [NaCI],
explaining the decreased critical coagulation activity (cca) for NaCI of Ludox silica at higher
pH levels with dlog(cca) 1 dpH = -0.326. Only small differences between NaCl, NaN03 ,
NaBr03 are measured due to the mean activity coefficients introduced by the different
anions [45,46]. According to the DLVO theory the cca is usually increased with increased
pH.

45 Hydrothermal Ageing of Sol-Gel Silica Spheres
Ki = exp(4.3*f) * [H+]*[Si,O--Na+] I [Si,OH]*[Na+] (29)
log [f/(1-f)] + 1.87*f = pH - pKj + log [NaCI] (30)
where Ki is the intrinsic acid constant, which is determined by a double extrapolation
technique in [44]. The pKi in the presence of NaCI is 6.4-6.9, while the 'salt free' pK, used
in Eqn. 30 is relatively high, viz., 8.2 [36,43,44]. However, a low spectroscopic salt-free
value of the ionization constant pK. of surface silanols is reported in ref. [471. viz., 7.1.
EXPERIMENTAL
Hydrogel spheres of a few mm's size are dried at 393 K for 24 h, and calcined at 723 K
for 24 h, resulting in a xerogel. The results of treatments of xerogel spheres are compared with those of hydrogel spheres with an equal concentration of silica in water. In the
hydrothermal experiments an amount of 3.15 g xerogel spheres is treated with 20.85 ml
of a 1 M NaCI solution in rotating teflon cups in steel pressure vessels of 48 ml. An
amount of 24 g of the hydrogel spheres is washed with 1 M NaCI and treated
simultaneously in the pressure vessels. All hydrothermal experiments are performed at the
vapor saturation pressure [81. except for the high-pressure experiments.
High-pressure experiments are carried out in Tuttle type autoclaves [48]. The sample
is sealed in a ductile gold capsule with a graphite arc welder. The fluid filling grade is
chosen so, as to not exceed the excess external argon pressure. The autoclaves are placed
vertically and externally heated. Temperatures are measured by chromel alumel
thermocouples at several spots in the autoclaves. A fillerrod holds the capsule at the hot
spot of the furnace and minimizes the argon content of the vessel. The closure nut of the autoclave is cooled to prevent damage of the thread and the closure rings by the high
temperature.
First, the effect of different ageing temperatures is investigated. The temperature is
varied in five intervals between 373 and 523 K at a fixed duration of 24 h, a silica-to
water ratio of 0.15 gIg, a NaCI concentration of 1 M, and a pH of 6. The silica-to-water
ratio of 0.15 gIg is equal to the 13 wt% silica content of the hydrogel spheres.
The pH values are varied from 3.2 to 8.6 with increments of two pH units, at a
temperature of 473 K. Diluted hydrochloric acid and sodium hydroxide solution are used to establish the desired pH. The sodium chloride concentrations used are 0, 1, 2,4, and
6 M, and the silica-to-water ratio 0.15, 0.4, 0.6, and 0.8 wt/wt. The variation of the silica
to-water ratio is only performed with xerogel spheres, because the ratio of the hydrogel
spheres is fixed. High-pressure experiments are done at the vapor saturation pressure,
500, 1500, and 2800 hecto Pa.
After the hydrothermal treatment the xerogel and hydrogel spheres are washed, dried at 393 K for 24 h. and subsequently calcined at 723 K for 24 h. The pore radius, pore
volume, and internal surface area are assessed by Hg penetration (Carlo Erba 2000). Only
the intrusion is measured.

46 000
~ .s < wa: < w 0 <u.a: ::;) rn 0u: 0 W Q. rn
400
300
200
100
0
Chapter 3
(AI
A RADIUS XEROGEl
• RADIUS HYDROGEL
A SURFACE AREA XEROGEl
o SURFACE AREA HYDROGEL
'60
140
120
E '00 S
rn ::;)
'" iii5
24 hw a:
60 ~
40
20
0 250 300 350 400 450 550"'"
000 (8)
400 ~ .s < wa:< 300 w 0 < u.a: ::;) rn 0u:
200
0 W Q. rn
100
0 250 300 350 400 450 550"'"
2-0 Ie)
I .•
;g; .§. w :; ::;) 1.2
g --'
wa: ~
0.80u: (3 W Q. rn
0.'
A XEFlOGEL AGED 24 OR47 H
160
140
'20
'00
eo
eo
40
E Ern ::;)
i5 ii wa: 0 Q.
47 h
20
0
0 H'fDROOEl AGED 24 OR 47 H
0.0 250 300 350 400 450 500 560
TEMPERATURE (K)

47 Hydrothermal Ageing of Sol-Gel Silica Spheres 1400
(O)
1200
1000
eo. ~ 800
~ :.c " 6000.. 0
,g 400.ij
T = 473 K 200 fJH = 6
NaCI] = I M vapor saturation pres~ure I
0 0 100 200 300 400 500
specific surface area A. (m2/g) 4000
(E)
3500
As = 0 m2/g pH = 6
3000
lNaCI] = I M vapor saturation pressure
~ 2000:.c (;".. 1500 o ~ ·in 1000
500
Figure 1 0+1--,,--,,--,,--,,--,,--1 250 300 350 400 450 500 550
temperature (K)
Ageing of hydrogel and xerogel spheres as a function of temperature at a duration of 24 h (a), and 47 h (b). The initial pore radius, surface area, and pore volume of the xerogel spheres is 2.3 nm,
455 m2/g, and 0.76 ml. The spheres are treated in 1 M NaCI with a pH of 6 with a silica-to-water
ratio of 0.15 gIg. (c) The progress of the pore volume. (d) Evolution of the equilibrium solubility of
silica at 473 K as a function of the specific surface area of the silica sol particles, which is the engine of the Ostwald ripening. The values of the solubility in the plot are based on the relations of the
introduction. Eqs. 12 and 13 are not considered here, but do not play an important role at a medium
pH level of 6. (e) Evolution of the equilibrium solubility of silica under the experimental conditions
as a function of the temperature. Both the solubility of silica, S, and the solubility of adsorbed MSA,
S., are plotted as a function of the temperature. Again, Eqs. 12 and 13 are not considered in the
calculation of the equilibrium solubility of the silica, because the extrapolations of Eqs. 12 and 13 to high temperature are unknown.

48 Chapter 3
RESULTS
Effect of the ageing temperature
Figure 1a and 1b show the development of the specific surface area and the pore radius
of the silica spheres at different ageing temperatures and at a fixed duration of 24 hand
47 h, respectively. The spheres are treated in 1 M NaCf, because in the absence of NaCl,
the hydrogel spheres are destroyed, the spherical shape is lost, and a powder is obtained.
The initial pore volume of the xerogel spheres is 0.76 ml/g, the pore radius 2.3 nm, and
the specific surface area 455 m2 /g, measured by N2 adsorption and desorption. A rapid
decrease of the surface area of both xerogel and hydrogel samples is observed with
increased temperature of thermal treatment, which is due to an increase of the primary
particle size due to the treatment. The initial primary particle size before the treatment is
5 nm as determined with TEM. The particle size after treating for 24 h at 525 K according
to Fig. 1a is estimated by the method in ref. [491 by application of d = 6/(D * As} with D the
particle density of 2.2 * 10 6 g/m3 , and As the specific surface area in m2/g. The resulting
particle size d::: 52 nm with the hydrogel (52 m 2/gl. and d::: 130 nm with the xerogel
(21 m2/g). The primary particle size is 72 nm of the xerogel after being treated for 47 h
at 523 K according to Fig. 1b. Hence, the primary particle size ;s increased by a factor of
130/5 = 26 after the thermal treatment. It appears that the decline in surface area is
faster with the xerogel than with the hydrogel, whereas the pore radius of the xerogel
grows more rapidly than that of the hydrogel (Fig. 1a). A difference in ageing between
hydrogel and xerogel spheres is again apparent in Fig. 1c. A specific pore volume of the
hydrogel spheres, rising from 0.76 to 1.9 ml/g with increased ageing temperature is
displayed. The difference in pore volume after ageing for 24 and 47 h, and recorded as one
set of data (Fig. 1c). The pore volume of the xerogel spheres in Fig. 1c is only slightly
increased from 0.76 to 0.99 ml/g at 298 and 523 K, respectively.
Effect of the pH
Changes in surface area and pore volume with ageing as a function of pH are displayed
in Fig. 2a. Especially the hydrogel spheres show a more profound development of the pore
radius at higher pH levels, ranging from 7 to 46 nm at pH levels of 3.2 to 8.6,
respectively. The surface area of the hydrogel rapidly drops from 190 to 40 m 2 /g.
Xerogels show only a small development of the pore radius at higher pH levels, which
is less pronounced than that of hydrogels (Fig. 2a). The pore radius of xerogels increases from 40 to 51 nm at pH levels of 3.2 to 8.6, respectively. The change in surface area of
the xerogels is consequently very small, and the surface area remains more or less

49 Hydrothermal Ageing of Sol-Gel Silica Spheres
1----_----_---_---_' 13 are not considered in the calculation 0.0 ...
2 W of the equilibrium solubility of the silica. 4000 l
1 (C)
3500 l A. = 0 m2/g T = 473 K [NBCl] = 1 M3000~ vapor saturation pressure
;""~ 2000
o u Sx~ 1500
S10001=========:::::'
500 +-----,----.,------,------j 2 6 8 10
pH
_ 400
J'! §. <w !1f 300
~ ~ a: iil200 o u:: <3 w 0m 100
1.6
g §. w ::E ::::l 1.2 g w
~ o 0.8
u:: <3 w 0m
0.4
(A)
• RADIUS XEROGEL
• RADIUS HYDROGEL A SURFACE AREA XEROGEL
o SURFACE AREA HYDROGEL
2.0.,--------------------, (Il)
o
o
A PORE VOLUME XEROGEL
o PORE VOLUME HYDROGEL
so
40 E .s m ::::l ,., 0 ~ w
~ Figure 2 20
10 Effect of the pH on (a) the specific
surface area and pore radius of aged hydrogel and xerogel spheres treated in 1 M NaCI with a silica-to-water ratio of
0.15 gig, a duration of 24 h at a temperature of 473 K. The initial surface area is 455 m2 /g, and pore radius 2.3 nm. (b) Progress of the pore volume. The initial pore volume is 0.76 ml/g. (c) The solubility of silica (in ppm) as a function of the pH under the
experimental conditions based on the equations of the introduction. Since the extrapolations of Eqs. 12 and 13 to high temperature are unknown, Eqs. 12 and

____
50 Chapter 3 '00
90 ... XEROOEl o HVDRCX3R
n n u o
0 ....--o---.,--------""""'--~-__i,
'50,-------------------, (8)
o
o o o
...
...
... XEROOEl
o HYDAOGB.
01--------------------:', 2.0,-------------------,
(e)
g 1.0
.§. 0
w o :E ~ 1.2
~ W
~ ... o O.0r--:--"'-------"l...----,,n~...
&1 0.. rJJ
0.4
6. XEROGEl
o HYDROGEL
00 ....---c---~-_--~--~-_____:l,
NaC! (mole~)
...
I
Figure 3
Effect of the concentration NaCI on (a) the pore radius, (b) the specific surface area, and (c) the pore volume of aged hydrogel and
xerogel spheres, treated at a constant duration of 24 h, temperature of 473 K, silica-to-water ratio of 0.15 gig, and a pH of 6. The initial pore radius, surface area, and pore volume of the xerogel spheres is 2.3 nm, 455 m2/g, and 0.76 ml/g. (d) Development of the equilibrium solubility of silica under experimental conditions as a function of the concentration of NaCI calculated with the equations of the introduction. S and S. denote the equilibrium solubility of amorphous silica and of the layer of adsorbed MSA present on the silica surface, respectively.

51 Hydrothermal Ageing of Sol-Gel Silica Spheres
1200
(o)
1000
~ 800E a. ~
~ 600:.c :> -0 en
0 400 .~
·iii
200 T ::: 473 K pH ::: 6 As = a rn2/g vapor saturation pressure
0-1 I I I --, I 1 2 3 4 5 6 7
[Noel] (mole/I)
constant at a low level 38 m2 /g. At a pH of 8.6, the hydrogel and xerogel have almost
identical pore radii and surface areas.
The dependence of the pore volume on the pH is illustrated in Fig. 2b. At pH levels from
3 to 6, initially fast increase of the pore volume is observed for both hydrogel and xerogel
spheres. The increase continuous until the pore volume reaches a maximum at a pH of about 6, thereafter the pore volume declines. Ageing of hydrogels leads again to high pore
volumes as compared to that of xerogels.
Effect of the concentration of NaCI
Ageing in fluids of 0 to 6 M NaCI merely affects the pore radius of hydro- and xerogel
spheres as is apparent from Fig. 3a. Only the pore radius of the xerogel shows a slight
minimum between a [NaCI] of 2 and 4 M. The specific surface area of the xerogel is
relatively small at a high [NaCI] of 6 M as shown by Fig. 3b. The surface area of the
hydrogels is hardly affected by the [NaCI]. In the whole range, the pore radius of the
xerogel spheres is two times as large, and the surface is two times as small as that of the
hydrogel spheres according to Fig. 3a and b. The specific pore volume of treated hydrogels
and xerogels weakly declines with the [NaCI] in Fig. 3c. The specific pore volume of the
hydrogel is again large with respect to that of the xerogel.

52 Chapter 3 500
IAI
.. .. _400
,? S.
... RADIUS XEROGEL..: w
• RADIUS HYDROGELa: :lOO..: ...6. SURFACE AREA XEROOet w (.) o SURFACE AREA HYDROGEL..: u.a: ~ •200en (.)
u:: •C3 w •Q. en 0100
0
... " "
0
",0 (8)
\.. 0
~ w ::Ii ~ 1.2...J
~ 0 wa::;:
0..(.)
u:: C3 W Q. en
0.'
o HYDROGEL A XEROGEL
0.0
8D
50
40 E .s en ~
Ci:J)
ii wa: Figure 4:;:
'"
10 Effect of the pressure on the development of
0 ()a the pore radius and specific
surface area, and (b) the pore volume of hydrogel and xerogel spheres, treated in 1 M NaCI at a constant duration of 24 h, temperature of 473 K, silica-to-water ratio of 0.15 gIg, and pH of 6. The initial pore radiUS, surface area, and pore volume of the xerogel spheres is 2.3 nm, 455 m2/g,
and 0.76 ml/g. (c) Development of the equilibrium solubility of silica under experimental conditions as a function of the pressure calculated with the equations of the
introduction. S and Sx denote the 0
2400
2000
(C)
500 1000 '500
Sx
2000 """ :J)()()
-----equilibrium solubility of amorphous silica , and of the layer of adsorbed MSA
present on the silica surface, respectively.
e '6OO Q.
-3 S ~ 1200 .Q
.. :> "0
0 800,g ;;
As = 0 m2/g T = 473 K
6~H iliaCI] = 1 ~'~L r I 0 500 1000 '500 2000 2500 3000
pressure (hecla Po)

53 Hydrothermal Ageing of Sol-Gel Silica Spheres
Effect af the pressure
The pore radius, surface area, and pore volume of silica gel spheres treated at 473 K
is hardly affected by the pressure as can be seen in Fig. 4a and b. The pore size of xerogel
spheres is twice as large as that of the hydrogel spheres, whereas the specific surface
area is twice as small. The course of the pore volume shows the same pressure
independent pattern in Fig. 4b. The pore volume of aged hydrogels is again about twice
as high as that of xerogel.
Effect af the silica-ta-water ratia
A strange stepwise development of the pore radius and specific surface area with the
silica-to-water ratio is exhibited in Fig. 5a to c. No experiments are performed with hydrogel spheres, because it is impossible to raise the silica weight ratio of 0.15 gig
without drying the hydrogel spheres before treatment. The pore radius of the xerogel
spheres remains more or less constant until a ratio of 0.6 gig (Fig. 5a), thereafter the pore
radius steeply increases from 30 to 80 nm. A bimodal pore size distribution is seen with
the xerogel sample of 0.6 gig. Rapid ripening is evident when the excess of water is
diminished. Because there is no change in the pore volume in Fig. 5b, the specific surface
area of xerogel steeply drops from 55 to 30 m 2 /g (Fig. 5cl.
DISCUSSION
The kinetics of polymerization and depolymerization is at high temperatures is favored,
because the kf{T) and kb(T), the forward and backward rate constant of polymerization
increase exponentially with temperature, explaining the exponentially increase of pore
radius, and the decrease of surface area in Fig. 1a and b, respectively. The high
temperature, T, does not necessary increase the gradient of silica solubility between
particles of different sizes, d, thus of different specific surface area, A, (Fig. 1d), as
explained by Eqs. 4 and 5, which contain a factor 11T*d and A,IT, respectively. The
ripening of xerogel spheres proceeds more rapidly than that of hydrogel spheres, probably
due to the surface structure of xerogel, which contains more tertiary silanol groups. The
acidity of tertiary silanol groups is high with respect to that of secondary and primary
silanol groups. The charge on the xerogel surface is negative, which favors the dissolution
and deposition of silica. The increased pore volume of the hydrogel after ageing at high temperatures as shown in Fig. 1c and reported in ref. [501 is probably due to repelling forces between the primary particles, in agreement with SAXS measurements [511, where

54 Chapter 3
less dense gel clusters are observed at high temperatures. No particular increase of the
pore volume of xerogel proceeds in Fig. 1c, because with xerogel a dense structure has
already formed with strong bonds between the sol particles, counteracting the repelling
force with ageing.
The effect of the pH is twofold. First, the equilibrium silica solubility is increased (Fig. 2c), and an increased gradient between particles of different sizes is expected, and
secondly, the silica gel surface has a more negative charge. The increase of the pore radius
at high pH levels is more pronounced with hydrogel than with xerogel according to Fig. 2a.
Obviously, the pH more strongly affects the surface charge and solubility, and thus the ripening of the hydrogel spheres. The surface of hydrogel spheres is covered with not fully
condensed MSA of a high acidity constant. The surface of xerogels is already saturated
with ionized groups. The pH therefore influences more strongly the surface charge of
hydrogel spheres, which leads to differences in the ripening rate. An increased pore volume
of hydrogels after an acid treatment is reported in work of Okkerse [6). The explanation
is sought in the fact that sol particles are rapidly fixed by dehydratation, which impedes
the mutual approach, resulting in an open packing. We feel the packing density in the
hydrogel to be mainly a function of the surface charge. The maximum in pore volume as a function of the pH in Fig. 2b can be explained as follows. First, the gel structure is less
dense at higher pH levels by repelling electrostatic forces and a more rapid deposition of
silica, thus strengthening the gel structure. Above a pH of 6 the solubility of silica is high
and a large amount of primary particles dissolve. Consequently the gel network weakens, is more seriously affected by shrinkage, and the pore volume decreases. At high pH levels
a large part of the silica remains in solution as soluble silica.
Fig. 3a to c show a small effect of NaCI on the development of the pore structure. The
reduction of the solubility (Fig. 3d), thus a decreased gradient of the solubility between the particles of different sizes, is counteracted by the increase of surface ionization and,
hence, the polymerization rate (see introduction). Net identical ripening rates are found.
Only at high [NaCIJ, the radius of the xerogel increases, and the surface area and specific
pore volume decrease.
Some decrease of the silica solubility by the increased pressure is expected (Fig. 4c), but
minor changes of the pore structure are observed in Fig. 4a and b. The pressure is,
therefore, less important than the treating temperature and the pH of the hydrothermal
fluid.
An explanation for the sudden steep increase of the pore radius (Fig. 4a) and the
decrease of the surface area (Fig. 5c) above a silica-to-water ratio of 0.6 gig, cannot be
readily developed. The spheres are homogeneously treated in a rocking system, with
rotating steel vessels. Some reasons for the steep increases might be i) a more rapid
transport by volatile MSA species; ii) transport of silica along the silica surface, or iii) a
more rapid rise of the pH in a smaller volume of the fluid.

-----
55 Hydrothermal Ageing of Sol-Gel Silica Spheres 100
80
lAl
-- A X1%POAE VOlUME
E ..s eo en ::> is a: wa:: 70 "lCo PORE"" VOlUME~ '" A ",
20
0 0.0 0.2 0.8 0.8
2.0 (8)
1.8
~ w :::li :l 1.2...J
~ w
~ 6 .. hQ.80u:: <3 w Q. en
0..
0 0.0 0.2 0.' 0.8 0.8
100 tel
80 'iii,:;;S« wa:: 60
w 0 '" «
«
'" u..a:: ::> 40en 0u:: <3 w Q. en 20
00.0 D•• 0.< --o~ 0.8
WEIGHT RATIO SiO./H.O (gig)
Figure 5
Effect of the silica-to-water ratio on (a) the pore radius,
1.0
(b) the pore volume, and (c) the specific surface area of aged xerogel spheres, at a constant duration of 24 h, temperature of 473 K, concentration NaCl of 1 M, and a pH of 6. The initial pore radius, surface area, and pore volume of the xerogel spheres is 2.3 nm, 455 m2/g, and 0.76 ml/g.
1.0
I 1.0

56 Chapter 3
CONCLUSIONS
1) With ageing temperatures from 298 to 523 K at a constant duration of 24 h the pore
structure of xerogels is considerably affected, which results in pore radii ranging from 2.7
to 136 nm, surface areas decreasing from 455 to 21 m2 /g, whereas the pore volume
remains constant at about 0.8 mllg. Hydrothermal treatment of hydrogel spheres results
in pore radii between 2.7 and 70 nm, surface areas decreasing from 455 to 53 m2/g, and
pore volumes between 0.8 and 1.9 ml/g.
2) Under all conditions the ripening of the xerogel silica bodies is faster than that of the
hydrogel bodies, which is probably due to the more dense structure and the acidity of the
xerogel silica surface, which contains ionized groups. However, the hydrogel spheres attain
a high pore volume by repelling forces between the primary sol particles, whereas the pore
volume of the xerogel, which has already been subjected to a certain extent of shrinkage
remains constant. The silica is mainly reorganized within the pores.
3) The temperature, pH, and silica-to-water ratio are important parameters with the
ageing of silica. The [NaClJ and pressure hardly affect the development of the pore
structure. The increased polymerization and ageing rate with increased [NaCI] is
counteracted by the decreased solubility of silica.
4) Ripening of the primary particles in the gel structure is fast at high temperatures and
pH levels, because the silica solubility and the related transport of silica is increased at high
temperatures and pH levels. The pH level influences more strongly the ageing of hydrogel
spheres, because the acidity of the hydrogel surface covered with more primary and
secondary silanol groups is low, and more affected by the pH.
5) Stepwise variation of the pH of xerogel spheres from 3.2 to 8.6 at 473 K leads to
pore radii from 40 to 50 nm, surface areas from 37 to 27 m2/g, at a constant pore volume
of 0.8 ml/g. For hydrogel spheres the changes with the variation of the pH level with
ageing are more profound, pore radii varying from 7 to 46 nm, surface areas from 190 to
40 m 2/g, and a maximum pore volume of 1.5 ml/g at a pH of 6.
6) The effect of hydrothermal ageing with different silica-to-water ratios on xerogel
spheres at 473 K can be divided into two regions. Below a silica-to-water ratio of 0.6 gig,
the pore radius is constant at 30 nm, and the surface area at 53 m2lg. Above this ratio the
pore size steeply increases to 78 nm, and consequently the surface area decreases to
30 m 2/g. The pore volume, however, remains at 0.8 ml/g.

57 Hydrothermal Ageing of Sol-Gel Silica Spheres
REFERENCES
1. R.O. Fournier and J.J. Rowe, American Mineralogist, 62 (1977) 1052
2. B.A. Fleming and D.A. Crerar, Geothermics, 11 (1982) 15
3. J.A. van Lier, P.L. de Bruyn and J.Th.G. Overbeek, J. Phys. Chem., 64 (1960)
1675
4. G.B. Alexander, J. Phys. Chem., 61 (1957) 1563
5. R.H. Busey and R.E. Mesmer, Inorganic Chemistry, 16 (1977) 2444
6. I.L. Svensson, S. Sjoberg, and L.O. Ohmann, J. Chem. Soc., Faraday Trans., (1) 82(1986)3635
7. W.L. Marshall, Geochimica et Cosmochimica Acta, 44 (1980) 907
8. J.R. Fischer, J. Research U.S. Geol. Surv., 114 (1976) 189
9. R.O. Fournier, Geochimica et Cosmochimica Acta, 47 (1983) 579 10. H.P. Rothbaum and A.G. Rohde, J. Coli. Interf. Sci., 71 (1979) 533
11. E.G. Bohlmann, R.E. Mesmer and P. Berlinsky, Soc. Pet. Eng. J., 20 (1980)239,533
12. L. Righetto, A. Polissi, D. Comi, B. Marcandalli, I.R. Bellobono and G. Bidoglio,
Annali di Chimica, 77 (1987) 437
13. G.B. Alexander, J. Am. Chem. Soc., 76 (1954) 2094 14. M.F. Bechtold. J. Phys. Chem., 59 (1955) 532
15. G.S. Wirth and J.M. Gieskes, J. Coli. Interf. Sci., 68 (1979) 492
16. Physical and Chemical Aspects of Adsorbents and Catalysts, Ed. B.G. Linsen (1970). Academic Press, London, 213-264
17. S.A. Greenberg and D. Sinclair, J. Phys. Chem., 59 (1955) 435
18. V.V. Strelko, Coli. J. USSR, 32 (1970) 430
19. A.D. Bischop Jr and J.J.Bear, Thermochimica Acta, 3 (1972) 399
20. K.R. Applin, Geochimica et Cosmochimica Acta, 51 (1987) 2147
21. H. Baumann, Kolloid Zeitschrift, 162 (1959) 28
22. A.C. Makrides, M. Turner and J. Slaughter, J. Coli. Intert. Sci., 73 (1980) 345
23. C.B. Hurd, Chem. Rev., 22 (1938> 403 24. K. Goto, J. Phys. Chem., 60 (1956) 1007
25. S.P. Maulik, B.N. Gosh and S. Bandyopahyay, J. Ind. Chem. Soc., 40 (8) (1963)
607
26. B.A. Fleming, J. Coli. Interf. Sci., 110 (1986) 40
27. G. Bird, J. Boon and T. Stone, Chemical Geology, 54 (1986) 69
28. S. Kondo, M. Igarashi and K. Nakai, Colloids and Surfaces. 63 (1992) 33
29. L.T. Zhuravlev, Langmuir, 3 (1987) 316
30. W.A. Deer, R.A. Howie and J. Zussman, An Introduction to the Rock-forming
Minerals, Longman Group Limited, England (1966). 340-344
31. W.M. Heston, Jr., R.K. lIer and G.W. Sears, Jr., J. Phys. Chem., 64 (1960) 147 32. J. Erkelens. B.G. Linsen. J. Coli. Intert. Sci., 29 (1969) 464 33. C.G. Armistead, A.J. Tyler. et.al ,J. Phys. Chem., 73 (1969) 3947
34. C.H. LochmQller, M.T. Kersey, Langmuir, 4 (1988) 572

58
35. R.Sh. Mikhail, A.M. Khalil, and S. Nashed, Thermochimica Acta, 24 (1978) 383
36. P. Schindler and H.R. Kamber, Helvetica Chimica Acta, 51 (1968) 1781
37. J.D. Rimstidt and H.L. Barnes, Geochimicaet CosmochimicaActa, 44 (1980) 1683
38. P.F. Holt and D.T. King, J. Chem. Soc., 24 (1955) 773
39. O. Weres, A. Yee and L. Tsao, J. Call. Interf. Sci., 84 (1981) 379
40. L.H. Allen and E. Matyevic, J. Call. Interf. Sci., 33 (1970) 420
41. L.H. Allen, E. Matyevic, L. Meites,J.lnorg. Nucl. Chem., 33 (1971) 1293
42. D.E. Yates, S. Levine, T.W. Healy,J. Chem. Soc. Faraday Trans., 70 (1974) 1807
43. J.A. Davis, R.O. James and J.O.Leckie, J. Call. Intert. Sci., 63 (1978) 480
44. S.K. Milonjic, Colloids and Surfaces, 23 (1987) 301
45. L.H. Allen and E. Matijevic, J. Call. Interf. Sci., 31 (1969) 287
46. S.K. Milonjic, M.M. Kopecni and Z.E. lIic, Bulletin de la Societe Chimique Beograd,
48 (1983) 351
47. M.L. Hair and W. Hertl, J. Phys. Chem., 74 (1970) 91
48. A.D. Edgar, Experimental Petrology, Oxford University Press, London (1973),
94-118 49. R. Snel, Applied Catalysis, 12 (1984) 189 50. V.1. Malkiman, V.L. Struzhko, V.M. Shamrikov, V.M. Chertov, and E.1. Kosenko,
Call. J. USSR, 51 (1989) 691, Engl. Trans!. (1990) 596
51. P. Tang, D.E. Colflesh and B. Chu, J. ColI.lnterf. Sci., 126 (1988) 304

59
Chapter 4
The rise in pH during ageing of porous sol-gel silica spheres
M.K. Titulaer, W.K. Kegel', J.B.H. Jansen, and J.W. Geus'
Department of Geochemistry, Institute for Earth Sciences. University of Utrecht,
Budapestlaan 4, P.O. Box 80.021,3508 TA Utrecht, The Netherlands.
'Department of Inorganic Chemistry, University of Utrecht, Sorbonnelaan 16, P.O. Box
80.083, 3508 TB Utrecht, The Netherlands.
ABSTRACT
The increase in pH observed after hydrothermal ageing of porous silica gel spheres of
1-3 mm in size in 1 M NaCI is studied. The rise in pH influences the solubility of silica in
the hydrothermal fluid. A model explaining the increase in the pH comprises condensation
of silanol groups and the release of ionized monosilicic acid in the fluid. The amount of surface silanol groups is investigated by DRIFTS and surface titration. The decrease of the number of surface silanol groups with ageing of the porous spheres is established with DRIFTS. The presence of a layer of adsorbed sodium on the silica surface is demonstrated by surface titration.
INTRODUCTION
Silica-rich sol-gel spheres are used to manufacture catalysts and catalyst supports. The silica gel spheres dealt with in this chapter are porous bodies of a diameter 1 to 3 mm, containing a three-dimensional network of submicron primary sol particles. The preparing
conditions of the spheres have been described in Chapter 2 and ref. [1]. The silica gel
spheres were prepared by a sol-gel procedure, which can also be used in the preparation
of ceramic separation membranes [21. Variations in the conditions during preparation and
in the hydrothermal treatment of the spheres enable one to control the pore structure so
as to establish the desired pore structure of the catalyst support or the separation membrane.

60 Chapter 4
The use of hydrothermally treated silica spheres have several advantages over the commonly use of dry powders. For example, powders have to be processed to shaped
bodies by pressing to pellets or extrusion with a suitable binder. With a silica sol,
furthermore, the catalyst precursor, for example, a transition metal oxide or a clay mineral,
can be mixed with the silica before gelling. An excellent dispersion of the precursor within the gel is thus obtained. The pore dimensions of the gel can be controlled subsequently by
hydrothermally ageing.
The cause of the rise of the pH level and the silica solubility in the hydrothermal fluid is
the topic of the present work. To explain the observed changes in the pH the surface structure of the silica spheres is investigated by diffuse reflected infrared Fourier
transformed spectroscopy (DRIFTS) and surface titration.
MATERIALS AND PROCEDURES
Preparation and hydrothermally treatment of silica gel
The sol-gel method of producing porous silica comprises the following steps. A
supersaturated silica sol solution can be prepared from a Na silicate solution according to three procedures, viz., (i) adding a sodium silicate solution to a concentrated aqueous acid solution [1 I. (ii) exchange of Na + for protons by an appropriate exchange resin column [31.
and (iii) removal of the Na+ by electro-dialysis [4]. The primary silica sol particles in
solution coagulate in a reticular gel network. Particle growth and ripening under hydrothermal conditions above 298 K results in a gel of an increased pore size [5]. The temperature, the duration and the initial pH level are important control variables of the
hydrothermal treatment [6]. An increase of the pH affect the solubility of silica and the ionization of surface silanol groups, and thus the ripening process of silica under
hydrothermal conditions [61. Spherical silica sol gel bodies are prepared according to the first of the above procedures
[1]. The hydrogel spheres are dried at 393 K, resulting in xerogel spheres. An amount of
3.15 g of the xerogel spheres is hydrothermally aged in 20.85 ml of a 0, 1,2,4, and 6 M
NaCI solution. The periods of time of ageing are varied from 2 to 47 h, and the temperature from 298 to 523 K. Some batches of the hydrogel spheres were not dried
before hydrothermal ageing. The thus obtained batches are designated as hydrothermally
aged hydrogels. After hydrothermal treatment, the spheres are separated from the
hydrothermal fluid by filtration, and dried at 393 K. The pH of the filtered fluid is
measured.

61 Increased pH with Ageing of Sol-Gel Silica Spheres
The solubility of silica in the hydrothermal fluid
The silica solubility in the hydrothermal fluid after ageing of silica spheres in 1,2,4 and
6 M NaCI is measured. Since the filtered solid does not contain solids, the silica solubility
can be assessed by measuring the silica concentration in the solution. Two different
solubilities can be distinguished, viz., (i) the MSA (monosilicic acid) solubility, and (ii) the
'true' solubility, comprising both MSA and colloidal forms of silica. The MSA solubility is
usually determined by using the reaction of the silicate ion with an acidified ammonium heptamolybdate solution, followed by colorimetric determination of the resulting yellow
silicomolybdate complex [7,81. The a- and P-silicomolybdate complexes are stable at the
pH range of 3.8 to 4.8 and 1.0 to 1.8, respectively. A minor depolymerization of silica
proceeds at the low pH range [9J. The a-complex is the most stable, but asks for a
relatively long period of time, viz., 12 to 30 minutes, to form, whereas the p-complex,
which has a large absorption coefficient in the UV spectrum, is easily produced in 2 to
7 minutes. The P-silicomolybdate procedure is followed in this work.
Reagents (A) is prepared having an acidity of 1.5 M. Reagents (B) of pH = 7 contains
0.56 M MoO/-, 1.16 M NH4 +, and 6.7* 10-3 M NH3 • The unstable reagents (C) is prepared by adding of 200 ml of reagents (A) and 100 ml of reagents (B) to 500 ml distilled water [10J. An aliquot of 50 ml of solution (C) is added to 1 ml of the filtered hydrothermal fluid (0). After two minutes, the absorption of the yellow silicomolybdate complex at 410 nm
is measured in a 1 cm quartz-glass cuvette on a Perkin Elmer Lambda 1 UVNIS spectrophotometer.
The 'true' silica the solubility in solution is established by inductively coupled plasma
atomic emission spectrophotometry (ICP-AES) on a 30 channel simultaneous instrument type 34000 (Applied Research Laboratories, Valencia, USA). The colloidal forms of silica
in solution are estimated by subtracting the P-silicomolybdate solubility from the 'true'
solubility. The hydrothermal fluids of the various samples are diluted ten times to reduce the expected interference of Na on the silicon determination by ICP-AES.
DRIFTS of powdered silica spheres
Hydrothermally aged xerogel and hydrogel spheres, representing a series of descending surface areas, are measured with DRIFTS. After powdering the hydrogel spheres are dried
for the first, and the xerogel spheres for a second time for a period of 17 h at 393 K,
shortly before the DRIFT spectra are recorded. One xerogel sample is stored for a longer
period at room temperature, before the DRIFT spectrum is recorded. The infrared spectra
are recorded in the range 4000-2500 cm-1 on a Perkin Elmer FT-1720 device, with a Spectra-Tech Diffuse Reflectance Accessory 'Collector' _The specific absorption bands
of the surface silanols are [10-1 2J :

62 Chapter 4
1. 3748 cm-1 sharp band of isolated silanol groups at the surface
2. 3670 em" inner silanol groups (perturbed OH in the bulk Si02)
3. 3600 em' broad band of interparticle hydrogen bonded
silanol groups (and vicinal paired silanols) 4. 3000-3500 em" band of absorbed water
The band of vicinal paired hydroxyls is in some cases not clearly separated from the band
of absorbed water.
Percolation of OH- in the porous spheres
The adsorption of OH' on the silica surface is measured as a function of time. After
equilibrium, the adsorption of hydroxyls on the silica surface is complete. The period of
time to reach equilibrium is determined for different samples. A few drops of 2 wt% NH3
are added to 50 ml distilled water, until a pH of 9 is obtained. The solution is kept under
a constant N2 flow and is separated from the atmosphere by a 30 em long tube of a
diameter of 1 em. In each experiment 1 g of the spheres is added via the tube to the
solution. The spheres have pore volumes of 1 mllg and pore radii ranging from 2.5 to
9 nm. The rate of adsorption of hydroxyl ions on the silica surface is compared with that
of 1 g pore-free fumed silica (Aerosil 380, Degussa BRD). The specific surface area of the
fumed silica sample is 300 m2/g.
The decrease in pH is recorded as a function of time with an antimony (Sb) electrode and silver-silver chloride (Ag/AgCI/KCIl reference electrode [13,14]. The period of time is
determined where the pH has exactly covered 50% of the range between the initial pH o
and the equilibrium pH~. The accuracy is within 1 mY or 0.02 pH unit.
Spheres added to solutions of different pH
After the equilibrium period of time of the different samples has been determined, which
is less than 20 h, the maximal adsorption of hydroxyl ions is measured after 20 h as a
function of the pH. An amount of 1 g of xerogel spheres, having a pore radius 8 nm and
a surface area of 156 m 2/g, is added to 50 ml of either (i) distilled water, or (ii) 1 M NaCI
, or (iii) 3 M NaCI. Different pH values, ranging from 1 to 12, are established by adding
a few drops of diluted 27 wt% ammonia or of 37 wt% HCI. The exchanged INa] after
addition of the spheres is measured by AES.

63 Increased pH with Ageing of Sol-Gel Silica Spheres
RESULTS
Rise in pH with hydrothermally ageing
Fig. 1 shows the pH of the hydrothermal fluid as a function of the internal surface area
of the xerogel spheres after hydrothermal treatment. The initial starting pH of the 1 M NaCI solution, in which the spheres have been suspended, is 6. The specific surface area of the
untreated spheres is 455 m 2/g. The final pH of the hydrothermal fluid rises as the surface
area of the spheres has decreased by the treatment. This process continues until the
surface area has decreased to about 50 m 2/g, and the pH of the fluid has reached a level
between 10 and 11.
11
0
10
-0 '3
9 0
0 E 'Q)
..c. 8 o 0+-' 0 0 ' -0 00 >, 0
0 0
..c. '+-0 7
I 0..
6 0
5+------,;-------r---,--------,------1 500 400 300 200 100 a
specific surface area (m2/g)
Figure 1 Increase of the pH after hydrothermal ageing of the xerogel spheres. The
solid line represent the best fit.

64 Chapter 4
11,---------------------,
________---- 273 K Figure 2
298 K
_______------ 323 K
348 K The first ionization constant of MSA __________--- 373 K
as a function of the temperature and -- 423 K
the [NaCl] as reported by Busey and -:====== 473 K Mesmer [15]. = 498 K
----- 523 K
573 K
~ z. ...J 7
! I
6 -+rrn-TTTTTTTT1""rrTTl"T1"TITTTTT"1OTTTT"nTTTTTTTTTTTTTTTT-rrT,nTTTjo 234 5 6
[NaCl]
Increased silica solubility at high pH levels
The increased silica solubility at high final pH levels of the hydrothermal fluid is
represented in Fig. 3. The pattern of Fig. 3 is common for amorphous silica [16,17]. Both
the 'true' and MSA solubility rapidly increase when the pH reaches the first ionization
constant of MSA, which is 9.35 in 1 M NaCI at 298 K reported by Busey and Mesmer [151 and displayed in Fig. 2. The reported first ionization constant is significantly higher than
the value of 8.47 calculated with the Eqs. 8, 10, 12, and 13 of the previous Chapter 3 and
the relation: -log KA(T,NaCI) = -log KB(T,NaCI) -log Kw(T,NaCI)
The solubility of silica as measured from the yellow silicomolybdate complex is slightly
below the 'true' solubility of silica, because a small quantity of silica is present as
polymers. The amount of silica present as polymers is about 36 and 120 ppm at a pH of
7 and 10, respectively (ppm = mg Si0 2 /1) (Fig. 3). The solubility calculated from the
silicomolybdate concentration suggests a faint minimum between a pH of 7 and 8, which
agrees with the data from the literature [16,17].
Solubility of silica after ageing in 1,2,4 and 6 M NaCI
The solubility of silica after ageing as a function of the concentration of NaCI is shown
in Fig. 4. The pH of the fluid is 6 to 7. The solubility decreases at rising sodium chloride

65 Increased pH with Ageing of Sol-Gel Silica Spheres
600,---------------------., o -molybdosilicic acid t:. -ICP
solubility in 1 M NaCI 500
..--.. "N 400 o Ul theoretical solubility 0E
'-./ 300 >, ~ /:;
I
/0
t:. /o t:. ~.~
CfJ t:.t:. 9-6 100
-",etoe'i~~ /' s cP
best fit of silicomolybdate solubility
O---r---r----,---...,------,----,---,-----! 4 5 6 7 8 9 10 11
pH
Figure 3 The solubility of silica in the hydrothermal fluid as a function of the pH measured after hydrothermal treatment. The dashed line is the best fit. The solid line is the pure theoretical solubility based on the relation: S(298 K,IM NaCl,pH) = 106*(1 +10 pH-935).
concentrations. The experimental 'true' solubility as assessed by ICP-AES is slightly above
that measured by the silicomolybdate procedure. Both solubilities are situated at levels
below the curve representing the literature data of Marshall [18,191.
The amount of surface silanol groups as measured by DRIFTS
The infrared spectra of hydrothermally aged xerogel and hydrogel spheres are
represented in Fig. 5a and b, respectively. The absorption of isolated surface silanols at
3738 em" decreases lineary with the drop of the surface area measured after ageing. The
band due to adsorbed water at 3500-3000 cm-1 exhibits a lower intensity, and the band

66 Chapter 4
due to internal silanol groups at 3670-3663 cm-' a higher intensity at lower surface areas.
The position of the bands is different from the positions reported by Kondo and coworkers
[121. The peak due to free silanol groups at 3738 cm-' is at a lower frequency than the
value of 3748 cm-' reported in the literature [121 as well as the band due to inner silanol
groups, which peaks at 3663 cm-', while the literature mentions a peak at 3670 cm-', and the band of due to vicinally hydrogen bonded silanol groups, the peak of which is at 3588 cm-' below the value of 3600 cm-' mentioned in the literature. The effect of drying
just before recording a DRIFT spectrum is illustrated in Fig. 5c. Drying just before recording the spectrum increases the absorption of isolated silanols at 3738 cm-', and diminishes
the adsorption of water at 3500-3000 cm-'.
140
120
C'100 ......... N 0 (f)
0> 80 E
'-../
:£ 60:0 :::l
0 (fJ
0 40 .s>
(fJ
20
0
o -molybdosilicic acid t:. -ICP
t:.
0 Log(So/S)=O.085* [Nocll
t:. 00
0 2 3 4 5 6 7
sodium chloride (mole/I)
Figure 4 The silica solubility as a function of the concentration of NaCl in the hydrothermal fluid at 293 K. The solid line represents the literature data of Marshall : 10g(S/So) = 0.085*[NaCl], with So the salt-free solubility of 115 to 130 ppm.

67 Increased pH with Ageing of Sol-Gel Silica Spheres
(a)
2500
(b)
Figure 5 DRIFT spectra of hydrothermally aged xerogel and hydrogel spheres: (a) aged
xerogel spheres, dried and calcined at 393 K of a surface area decreasing from 337 to 30 m2/g; (b) aged hydrogel spheres, dried at 393 K of a surface area decreasing from 269 to 40 m2/g; (c) influence of the calcining temperature of
aged xerogel spheres before measuring the infrared spectra.

68 Chapter 4
Rate of OH- adsorption as a function of the pore radius
Addition of an amount of 1 g fumed silica to 50 ml solution of a pH of 10.5 results in
an instantaneous decrease of the pH (Fig. 6a), whereas addition of 1 g of silica sol-gel
spheres results in a gradual decline of the pH (Fig. 6b). The maximal adsorption of OH' at
a pH of 9 and the period of time to reach 50% of the decrease in pH are recorded as a
function of the pore size of the xerogel spheres and mentioned in Tab. 1. It appears from
Tab. 1 that the period of time to reach 50% of the pH drop increases with smaller pore
radii, and that the maximum adsorption capacity drops with decreasing pore radii. The
small adsorption capacity of small pore radii is probably caused by the repulsive pore
potential in smaller pores [20]. The charge density cannot achieve its maximum value,
because there is an overlap of the negative surface potentials. The rate of OH- absorption
can be fitted with the empirical relation:
(1 )
where the pH changes with time t (in s), pH~ is the pH after equilibration, pHothe initial pH of 9 at to' which is the starting time (in s), -5*10'6 a constant (in nm,2.43*s·'), and Rp
the pore radius (in nm).
Table 1 The halftime t'h (s) of the percolation process of OH', where pH = (pHo+ pH~)/2.
An amount of 1 g of the spheres is added to 50 ml of a solution of a pH of 9. The
maximal adsorption is measured as a function of the pore radius Rp '
R p t 'h (s) Log(OH-ad.*m2/mde)
Aerosil 380 0 0 -7.38
silica spheres 9.0 465 -8.39
8.7 828 -8.69
8.0 1080 -8.93
7.0 1266 -9.01
2.5 14520 -8.99

69 Increased pH with Ageing of Sol-Gel Silica Spheres
11.0
0
A I Aerosil380
10.0
:I: a.
9.0
~ ~
8.0
9.5
B silica spheres
8.0 +-----,---------,----,---------,------{
9.0
:I: a.
8.5
5 10 15 20 25
time (minutes)
Figure 6 Course of the pH during adsorption of hydroxyls by (a) non-porous Degussa Aerosil 380, and (b) porous silica sol gel spheres.
Adsorption of OH- or H+ as a function of the pH
In distilled water, above a pH of 7.7, adsorption of OH- and below this pH, adsorption
of H+ is obvious (Fig. 7). Below the pH of 5 in distilled water, the amount of desorbed Na+
is measured by AES (diamonds). The amount of desorbed Na+ is equal to the amount of
adsorbed H+. The slope of 0.85 of the solid line below the pH of 5, indicates that Na+ and
H+ are exchanged. In 1 and 3 M NaCI OH- is adsorbed above a pH of 6.2 and below this pH, H+ is adsorbed (triangles). The results of the experiments in 1 and 3 M NaCI are not
significantly different.

70 Chapter 4
Acid treatment of the spheres
The silica sol-gel spheres are treated with 50 wt% sulphuric acid, washed with distilled
water until neutral pH, and dried. The acid-treated spheres are added to the solutions of
a different pH. Above a pH of 3 only OH' is adsorbed (Fig. 7). The slope of the dashed line
is exactly unity intersecting the x-axis at a pH of 3. Sodium-free fumed silica (Aerosil
380,Degussa, BRD) is also added to the solutions of different pH. The experiment is not
represented in Fig. 7. Above a pH of 3 only OH' is adsorbed. The pattern resembles the
experiment of the acid-treated spheres in Fig. 7.
~ -4,-----------------------. (lJ
o omaximum surface silanolsE -6 " " "
8 10 12 14 -14~ opH Espheres added
to 0 M NaCI -12~ E * -lOg; -0
+ -8 :£
'--' (]l
o -6 -I
""'-.. ~
~ -8 en -0 o I -10
:r o '--'
g' -12 -I
-14
spheres that had an acid treatment"
"tV
" 2 4 6-14 0
~
(lJ
~ -12 ""'-.. ~ E -10 *en -0 o -8 +:r '--'
g' -6
spheres added to 1 and .3 M NaCI
o maximum surface silanols-I <>
-4·....I------------------------L-4
pH
Figure 7 Exchange of Na + at the surface of an aged silica xerogel sample of a specific
surface area of 156 m2/g as a function of the pH. Addition of spheres to 50 ml
distilled water (circles) and I and 3 M NaCI (triangles), The exchanged Na+ in
solution is measured with AES (diamonds). The squares and dashed line represents the same sample, which had an acid treatment before the Na exchange
experiments.

71 Increased pH with Ageing of Sol-Gel Silica Spheres
DISCUSSION
Solubility of silica in the hydrothermal fluid of different pH levels
Changes in the pH affect the silica solubility, and, thus the ripening process and porous
structure of the silica gel [21,22]. The ripening process involves condensation of (surface)
silanol groups. Techniques, providing evidence of the condensation of silanol groups and
release of Na + (Eqn. 2) are DRIFTS and surface titration. The depolymerization of silica is
catalyzed by hydroxyl ions and by the increased negative charge of the silica surface at
high pH levels [23] (Eqn. 3).
,----Sis-OH ,----S i5---' o --> 0 0 + Na+ + OH (2)
L-Sis-O- Na+ L-Sis---.J
(3)
The subscript s means surface. More ionized MSA in solution increases the pH, because
MSA is a weak acid (pK. = 9.8) with respect to that of the ionized surface silanol groups
(pK. is 7.2). The acid constant pK. of the MSA is 9.35 in 1 M NaCI [23]. According to
Eqn. 3 the solubility of silica is increased after the hydrothermal treatment. With the pK.
of 9.35 and Eqn. 3, the solubility, S, at any pH can be estimated from the relation
S = So * (1 + 10PH-9.35) [21] with the neutral pH solubility So of about 106 ppm in
1 M NaC!. The theoretical solubility with the relation based on Eqn. 3, is shown by the
solid line in Fig. 3.
Decreased silica solubility with increased sodium chloride concentration
The decrease of the silica solubility after ageing at higher sodium chloride concentrations
is known as the 'salting out' effect. Therefore, the silica solubility obtained by the psilicomolybdate method of about 101 ppm at a neutral pH, represented in Fig. 3, is below
the salt-free value of 115 to 130 ppm [17]. At temperatures up to 573 K, the salting-out
effect is counteracted by complexes of MSA with the anions in solution [18,19]. In the
neutral pH region, at low temperatures, the solubility of silica depends on the electrolyte concentration, obeying the relation (Eqn. 4) :

72 Chapter 4
(4)
where So is the salt-free solubility (in ppm), S the actual silica solubility (in ppm), I:j the
sum of the various electrolytes present, OJ the proportionality constant of the electrolyte,
which is 0.085 (\/mole) for NaCI [18], and [Mj) is the electrolyte concentration (in molelll.
Amount of surface silanol groups
The DRIFTS absorption due to isolated silanols at 3738 cm-' decreases at lower surface
area, whereas the absorption due to perturbed inner sHanols at 3663 cm-' increases, in
accordance with results of Kondo et al. [12). The existence of the 3663 cm- 1 band is
attributed to the enclosed intra-globular hydroxyls present between the necks, which
increases during growth of the sol particles [24). The IR absorption bands of free, inner,
and hydrogen-bonded silanol groups at 3738, 3663, and 3588 cm', respectively, being at lower wavenumbers than the literature values of 3748, 3670, and 3600 cm-1
,
respectively, in ref. [12) may be due to the presence of sodium near the silanol groups.
The relationship between the amount of surface silanol groups and the specific surface
area agrees with the results by Sears [25) and by Mefford and Langenfeld [26). These
authors performed titration of surface silanol groups of colloidal silica particles from a pH
of 4 to 9 in 0.1 M NaCI. A linear relationship between the surface area and the
consumption of NaOH was established. Hence, the number of OH- adsorption sites (silanol
groups) on the silica surface is constant. This implies that a decrease of OH- adsorption
sites after ageing is mainly caused by a decrease of surface area. Calcining a xerogel
sample just before recording the DRIFT spectrum increases the absorption by isolated
silanol groups at 3738 cm- l , and decreases the absorption due to adsorbed water at
3500-3000 cm- l in Fig. 5c [27). The favorable arrangement of six-membered silicon rings
at the surface might be the explanation. Three silanol groups, number 1, 3, and 5,
respectively, point out of the plane of the ring at mutual distances of 5.5 A. At the centre
of the triangle water is adsorbed with three hydrogen bonds of 2.7 Aeach [28). The OH
band is shifted to a wave number between 3500 and 3000 cm-1, and no longer separated
from the band of adsorbed water.
Two approaches are followed in the literature to explain the adsorption of hydroxyl ions
on glasses and porous gels [29). The first approach considers the silica surface to be a
porous gel [30). Various cations can penetrate the gel, in which most of the cations are
present in the double layer. More successful is the second approach, the 'site-binding'
model, which involves a combination of electrostatic effects and complexation of counter
ions on localized sites of the surface. The difference between the two approaches is the
affinity of alkali metal adsorption. According to the first approach the extent of adsorption decreases with larger ionic radii of the adsorbing ions. Since the ionic radii increase in the order Li + < Na + < K+, the extent of adsorption should drop in the order Li + > Na + > K+. The

73 Increased pH with Ageing of Sol-Gel Silica Spheres
second approach, the site binding model, predicts the affinity to rise in the reverse order
Li +< Na +< K+ [31 ,321. The appropriate explanation therefore depends on the nature of the
silica. The 'site-binding' model is the most suitable with our gels. The surface complexation
is described by the purely theoretical Eqn. 5, the equilibrium constant is given by Eqn. 6,
and the surface potential by a Nernst type Eqn. 7.
(5)
(6)
cp == (-2.303*R*T/F) * (pH - PZC) (7)
z + is the charge (in C) of M, the metal ion, F is the Faraday constant of 9.6 * 10 4 C/mole,
cP the surface potential (in Vl, R the gas constant of 8.314 J*mole-'*K-', T the
temperature (in Kl, and PZC the point of zero charge. The maximum silanol group coverage
of the silica surface is about 5.8 nm-2 after calcination at 383 K, often written as
92.6 pC*cm-2 or 9.60 pmole*m- 2 [331. The iso electric point (IEP) and the PZC of
amorphous silica are both located between a pH of 2 and 3 [341, while the first ionization
constant pK. of the silanol group is 7.2. Normally, the difference between the IEP and the
pK. of other oxides is less than 2 [291. The surface ionization is increased at a high sodium
chloride concentration [34,351.
The existence of a layer of adsorbed Na+
The intrinsic acid constant pK; for complexation with Na+ is 6.2. No adsorption of H+
or OH- should proceed, when the Na complexed spheres are added to a 1 and a 3 M NaCI solution of this pH, as is illustrated in Fig. 7. Addition of the Na+ containing spheres to
Na-free solutions, results in more H+ being exchanged against Na + in order to establish the
corresponding Na+ concentration in the solution. Consequently, the curve intersects the
pH-axis at a pH higher than 6.2 approaching the pK. of silanols, viz., 7.7 in a sodium-free
experiment. The layer of adsorbed Na+ is completely removed by treating the spheres
with 50 wt% sulphuric acid. After all the Na+ has been removed from the silica surface,
the IEP is 3.

/74 Chapter 4
CONCLUSIONS
1) The condensation of Na+ complexed silanol groups and the rise in the concentration
of ionized MSA increase the pH in the hydrothermal fluid after ageing of porous silica
spheres. The silica solubility plays an important role in the ageing process of the spheres.
2) The condensation of surface silanol groups after the hydrothermal ageing can be
monitored by measuring the intensity of the 3738 cm-' band by DRIFTS. Attention should
be paid to the fact that drying silica at 393 K before recording the DRIFT spectrum influences the intensity of the 3738 cm-1 band.
3) The IR-bands of free, inner, and hydrogen-bonded silanol groups at 3738,3663, and
3588 cm-1, respectively, are at wavenumbers smaller than 3748, 3670, and 3600 cm-1
mentioned in the literature, possibly due to the presence of sodium ions near the surface silanol groups.
4) The existence of a layer of adsorbed Na on the spheres has been satisfactory demonstrated, because H+ and Na+ are exchanged below a pH of 6.2. Addition of spheres
to basic solutions results in the adsorption of OH" on these specific sites of the silica
surface. The percolation process of OH" into the pores of the porous spheres can be
described as diffusion controlled.
5) Silica samples, containing Na, behave differently from samples, free of Na. When a
pseudo-IEP of 6.2 is observed, the sample contains Na, because 6.2 is the intrinsic constant of a Na+ and H+ exchange equilibrium. Observation of an IEP of 3 implies that
the silica surface is free of Na.
ACKNOWLEDGMENTS
This investigation is a result of participation in the Debye Institute. The authors thank
J.J. van Beek, dr.P.A. Buining and dr.J.T. Kloprogge for the critical review of the paper.

75 Increased pH with Ageing of Sol-Gel Silica Spheres
REFERENCES
1. C.J.G. van der Grift, J.W. Geus, H. Barten, R.G.1. Leferink, J.C. van Miltenburg
and A.T. den Duden, Characterization of Porous Solids, Ed. K.K. Unger et aI.,
Elsevier, Amsterdam, (1988) 619
2. D. Gallagher and L.C. Klein, J. Call. Interf. Sci., 109 (1986) 40
3. D.O. Lasic, Colloids and Surfaces, 20 (1986) 265
4. U.S. Patent 3668088, R.K.ller, Method of Producing Colloidal Silica by
Electrodialysis of a Silicate (1972)
5. N.V. Akshinskaya, V.E. Beznogovan, A.V. Kiselev and YU.S. Nikitin, J. Phys. Chem. USSR, 36(1962) 1233
6. V.V. Popov, E.N. Lebedev, L.M. Antonova, A.P. Tomilov, A.S. Pushkin, V.F.
Golikov, and T.A. Gerasina, Call. J. USSR, 51 (1989) 610-615, Engl. Trans.
535-539
7. J.D.H. Strickland, J. Am. Chem. Soc., 74 (1952) 868
8. V.W. Treusdale and C.J. Smith, Analyst 100 (1975) 203, Analyst 100 (1975) 797, Analyst 101 (1976) 19
9. G.B. Alexander, J. Am. Chem. Soc., 75 (1953) 5655
10. R.K. Iler, The Chemistry of Silica, Wiley N.Y. (1979)
11. S. Kondo, H. Fujiwara, T. Jchii, and I. Tsuboi, J. Chem. Soc. Faraday Trans., (I)
75(1979) 646
12. S. Kondo, M. Igarashi and K. Nakai, Colloids and Surfaces, 63 (1992) 33
13. R.G. Bates, Determination of pH, 2nd ed., Wiley N.Y. (1973)
14. C.C. Westcott, pH measurements, 1st ed., Ac. Press. N.Y. (1978)
15. R.H. Busey and R.E. Mesmer, Inorg. Chem., 16 (1977) 2445
16. G.B. Alexander, W.M. Heston and R.K. Iler, J. Phys. Chem., 58 (1954) 453
17. A.G. Volosov, I.L. Khodakovskiy , B.N. Ryzhenko and V.1. Vernadskiy,
Geochemistry International, 9 (1972) 362 Trans. from Gheokhimiya, 5 (1972)
575 18. W.L. Marshall, Geochimica et Cosmochimica Acta, 46 (1982) 289
19. W.L. Marshall, Geochimica et Cosmochimica Acta, 44 (1980) 907
20. R.P. Abendroth, J. Phys. Chem., 76 (1972) 2547
21. R. Snel, Applied Catalysis, 12 (1984) 189 22. M. Yamane, in: Sol-Gel technology for thin films, fiber, preforms, electronics and
specialty shapes, Ed. L.C. Klein, Noyes Publications, New Jersey (1988),
200-225 23. G. Okamoto, T. Okura and K. Goto, Geochimica et Cosmochimica Acta, 12
(1957) 123
24. A. V. KiseJev, V.1. Lygin, Infrared Spectra of Surface Compounds, Wiley N.Y. (1975), 75-103
25. G.W. Sears Jr., Anal. Chem., 28 (1956) 1981
26. A. Meffert and A. Langenfeld, Z. Anal. Chem., 249 (1970) 231

76
27. J. Erkelens and B.G. Linsen, J. Call. Interf. Sci., 29 (1969) 464
28. G. Foti and E.sz. Kovats, Langmuir 1989, 5, 232
29. D.E. Yates and T.W. Healy, J. Call. Interf. Sci., 55 (1976) 9
30. Th.F. Tadros and J. Lyklema, J. Electroanalytical Chem., 22 (1969) 9
31. P.W.Schindler, B. FOrst, R. Dick and P.U. Wolf, J. Coli. Interf. Sci., 55 (1976)
469 32. Yu.G. Frolov, V.A. Kasaikin and S.B. Tarasov, Call. J. USSR, 47 (1986) 856,
Trans. from Kolloidnyi Zhurnal, 47 (1985) 989
33. R.Sh. Mikhail, A.M. Khalil. and S. Nashed, Thermochimica Acta, 24 (1978) 383 34. G.H. Bolt, J. Phys. Chem., 61 (1957) 1166
35. Th.F. Tadros and J. Lyklema, J. Electroanalytical Chem., 17 (1968) 267

77
Chapter 5
The shrinkage of hydrothermally aged porous silica spheres measured by thermoporometry
M.K. Titulaer, J.C. van Miltenburg', J.B.H. Jansen, and J.W. Geus2
Department of Geochemistry, Institute for Earth Sciences, University of Utrecht,
Budapestlaan 4, P.O. Box 80.021,3508 TA Utrecht, The Netherlands
lChemical Thermodynamics Group, University of Utrecht, Transitorium 3, Padualaan 8, 3584 CH Utrecht, The Netherlands. 2Department of Inorganic Chemistry, University of Utrecht, Sorbonnelaan 16, P.O. Box
80.083, 3508 TB Utrecht, The Netherlands.
ABSTRACT
Spherical sol-gel silica hydrogel bodies of a size of few mm's are aged in 1 M NaCI solutions under hydrothermal conditions. The hydrogel bodies have a spherical shape and are prepared by the sol-gel technique. The aged spheres suspended in water are
characterized by thermoporometry. With this technique the depression of the freezing point of water in the micro-porous body is measured, which provides information about the pore
size, pore volume, and the pore shape. Hydrothermal treatment at high temperatures
increases both the pore volume and pore size of the hydrogel spheres. By thermoporometry
the pore size and pore volume is determined before and after drying. It appears that the
pore volume and pore size of the dried gel (xerogel) is a function of the pore volume and pore size of the hydrogel after ageing. The pore size and pore volume decrease upon
drying. The measured ice crystal radius by thermoporometry, Rn, is indicative for the pore radius, Rp , and the ice pore volume, Vn, indicative for the pore volume, Vp • With increased
intensity of hydrothermal treatment, resulting in increased values of Rnin hydrogels of 8.6
to 27 nm, the absolute drop of Rnby drying is 5.1 and 7 nm, but relatively 59 and 26 %. The absolute drop of the ice pore volume, Vn, is 0.4 and 0.6 ml/g, and relative 44 and
43 %. With drying the ice surface area An is slightly increased with 42 and 30 m2/g at a
Rnof 10.9 and 25 nm, respectively. Clearly the decrease of the pore radius is due to the densification of the gel structure, but no pores are enclosed because the surface area is hardly affected by the drying step.

78 Chapter 5
INTRODUCTION
Amorphous silica is used as a thermostable support for catalytically active solids. An
important example is the nickel-on-silica catalyst employed in the hydrogenation of fatty
oils. Another example is the chrome-on-silica catalyst of the Phillips process for the
polymerization of ethylene. The porous structure of catalyst supports is often of decisive
importance for the performance of the catalyst obtained after application of the active
component.
Together with the size of the support bodies, the porous structure of the support
determines the rate of transport of reactants and reaction products through the solid
catalyst. With many industrial catalysts the permissible pressure drop over a fixed catalyst
bed asks for catalyst bodies thus large that the physical transport within the catalyst
bodies is controlling the overall rate of the catalytic reaction. The effect of transport
limitations on the selectivity of catalytic reactions is often more serious than merely decreasing the reaction rate. A low rate of transport can favor the proceeding of undesired
sequential reactions. An instance is the oxidation to carbon (dijoxide and water with the
selective catalytic oxidation of organic compounds, as with the production of ethylene
oxide and maleic anhydride.
As said above, the size of the catalyst bodies is often prescribed by the pressure drop
over a fixed catalyst bed. With catalysts being used suspended in a liquid, the requirement
to separate the catalyst readily from the liquid also calls for a minimum size of the catalyst bodies. When the size of the catalyst bodies cannot be decreased, control of the porous
structure of the catalyst, and thus of the support, can only remedy transport limitations. The most generally used supports, viz., alumina and silica, are mainly produced by
chemical reactions in an aqueous liquid. After separation from the liquid, the supports are dried and, if desired, calcined at more elevated temperatures. The high surface energy of
water brings about that the elementary particles of the support are compressed when
during the drying process the meniscus of the liquid travels through the pores of the solid.
The importance of the porous structure of the catalyst renders a thorough investigation of the effects of the drying step on the porous structure of the support very worthwhile.
The catalyst support studied in this work has been prepared by a sol-gel process. The drying step, which is critical in the preparation of the silica support [1-31. is the main
subject of this study. Also the effect of (hydrothermal) ageing of silica before drying on
the porous structure will be investigated. To study the porous structure of solids suspended in water, thermoporometry is very suitable. This study therefore also deals with
the theoretical background of thermoporometry and evaluates the experimental results of
thermoporometry by comparison with mercury penetration and nitrogen sorption.
Porous spherical hydrogel bodies are prepared by the sol-gel procedure and are aged at
room temperature in water or under hydrothermal conditions without being dried. The
hydrothermal conditions are varied in this study. The aim of the study is to establish whether hydrothermal ageing strengthens the gel structure by transport and deposition of
silica. If the gel structure is reinforced, it can withstand the capillary forces during subse

79 Shrinkage of Porous Silica Spheres
quent drying. Thermoporometry, which yields information about the pore size, the pore
volume, and the pore shape of porous materials can characterize the wet silica spheres
before drying. Thermoporometry is based on the depressing of the solidification point of
a fluid, such as, water, benzene, dicyclohexane (C lOH ,S ) [4-6]. In the case of water,
thermodynamics predicts the formation of ice within narrow pores at temperatures lower
than the freezing point of bulk water, viz., 273.15 K. Provided the concentration of soluble
salts within the pores of the solid is negligible, the freezing point depression, dT, which
is T-T0 < 0, is a function of the pore radius.
The amount of water freezing or melting within the porous system can be detected
separately from bulk water by differential scanning calorimetry (DSC). The heat-flow during
freezing of water and fusion of ice within the porous material is recorded.
Thermoporometry enables one to measure ice crystal radii, Rn , between 1 and 150 nm [7].
The minimum value of 1 nm of the radius which can be measured is due to (i) the
minimum temperature of 210 K that can be established within the DSC apparatus used in
this work with gaseous nitrogen as a cooling agent, and (ii) the fact that water present in
pores of radii, Rp , smaller than 1 nm is strongly bonded to the silica surface and does not
freeze. Interference with the peaks of 'bulk water' and 'pore water' in the thermogram
leads to the upper limit of 150 nm.
After dealing with the theoretical background of thermoporometry, experimental results
on silica samples before and after drying are presented. The dried silica samples are also
characterized by mercury intrusion and nitrogen sorption. First the results obtained by the different techniques on the same samples will be compared to evaluate the
thermoporometric results. Subsequently the effects of drying of differently pretreated silica
spheres will be considered.
Thermoporometry
Since many catalyst supports are produced by reactions in aqueous solutions and drying strongly affects the porous structure of gels, it is important to assess the porous structure
of solids dispersed in the liquid in which they have been prepared. Thermoporometry is a
technique that enables one to establish the porous structure of solids dispersed in water.
Thermoporometry is based upon the fact that the temperature at which a liquid freezes
or melts depends on the curvature of the interface between the liquid and the solid. During
penetration of the interface into the pores of a solid, the interface has to assume a semi
spherical shape of a radius that is equal to the radius of the pore. Alternatively nucleation
of the solid can proceed within the pores of the solid provided the radius of the smallest
stable nucleus fits in the pore.
To derive the required thermodynamic relations, we will consider a solid the pores of
which have been completely filled with the liquid. The porous solid is present within the solidified bulk liquid. The penetration of the solid-liquid interface into the pores or the
generation of stable nuclei of the solid within the pores now will be dealt with. A reversible

80 Chapter 5
transfer of dn moles from the liquid to the solid phase involves a change in energy, dU,
given by :
dU = T*dS - P*dV + V,.*dA,s + JI.dn. + JI,dn, (J) (1)
where TdS and PdV have the usual meaning, V,. is the interfacial energy, dAis the change
in the interfacial area, JI. and JI, the molar Gibbs free energy of the solid and the liquid,
respectivelY,and dns and dn, the number of moles added to the liquid and solid phase,
respectively. The change in Gibbs free energy, dG, accordingly is :
dG = -S*dT + V*dP + V,. *dA,. + JI.dn. + JI,dn, (J) (2)
The condition for equilibrium is :
(J) (3)
, or :
(J) (4)
With the transfer of dn, moles from the solid to the liquid the relation between the number
of moles is:
dns = -dn, (mole) (5)
, and the condition for equilibrium becomes:
(J) (6)
When the interfacial area does not change during the transfer of the material, the usual
equilibrium condition results, viz.,
(J) (7)

81 Shrinkage of Porous Silica Spheres
Figure 1 Formation of a critical ice-nucleus with radius R", and the penetration of the ice-meniscus in the wet gel.
and:
JJ, = JJs (J/mole) (8)
The equilibrium is established at a temperature To, where the enthalpy difference, h~-h~,
is compensated by the entropy difference according to :
(J/mole) (9)
To = (h~-h~)/(S,-Ss) (K) (10)
When the interfacial area changes during the transfer of material as displayed in Fig. 1, the
equilibrium condition is :
(J/mole) (11 )

82 Chapter 5
• or :
(J/mole) (12)
With the semi-spherical interface at the entrance of the pores and the spherical interface
of the nuclei within the pores (Fig.1) :
(13)
With V l being the molar volume of the liquid and dv, the change in the volume of the liquid
phase. the following relation holds.
dn (mole) (14)
• and (dA,./dn,) can be rewritten to :
(15)
The surface AI. can be expressed in the coordinates x·y. the change in surface area dA,s in (x·dy) + (y·dxl. and the change in the volume. dvl • in the coordinates -x·y·dz. With
the radii of curvature. R, and R2 • of the meniscus the following relations can be derived:
dx/x = dz/R, and dy/y = dz/R2 (16)
With aid of Eqn. 16 can be deduced:
(17)
With a semi-spherical interface. where R, and R2 are equal to Rn • the relation between the
change in the volume of the liquid phase and the interfacial area is :
(18)

83 Shrinkage of Porous Silica Spheres
-cu- Ho(L)0 a
............,-~
I I I I I I II I
Figure 2 lID
cu '"' ~ cu cu cu Gibbs free energy (Jl." Jl.l) as
....'"' a function of the temperature. 1JI .a I
.a I... I t.' I
I I
TI To I
temperature (K)
The minus sign accounts for the combination of the increase in the interfacial area from
a plane to a curved surface just when the penetration starts (dA" = +) (Fig. 1), when dn,
moles are transferred from the liquid to the solid with freezing (dn, = -). The following
condition for equilibrium results,
(J/mole) (19)
Now the molar Gibbs free energy of the solid must be equal to that of the liquid minus the
energy involved with the change in the interfacial area to achieve equilibrium. The drop of
p, by the change in interfacial energy results in the equilibrium to be established at a
temperature, T, which is lower than the equilibrium temperatures with a flat interface, To.
The relation between the temperature and the molar free energies is schematically
indicated in Fig.2. Neglecting the temperature and pressure dependence of the enthalpy
and entropy, the molar Gibbs free energy of the solid and the liquid can be represented by
straight lines intersecting at the temperature To. At To the solid and liquid are in equilibrium
across a flat interface. When the solid phase is at atmospheric pressure and the liquid
phase is present within the pores of the solid having a radius Rn, the equilibrium
temperature is at the intersection of the straight line representing the free energy of the
solid and the dashed line drawn at a vertical distance from the line representing the free
energy of the liquid of :
(J/mole) (20)

84 Chapter 5
At the intersection of the dashed line holds:
(J/mole) (21 )
H,(T) and S,lT) are terms, which describe the enthalpy and entropy as function of the
temperature. The temperature dependence of the enthalpy is :
H,m = H~ + J cp,m * dT (J/mole) (22)
, and that of the entropy:
S,(T) = S~ + J Cp,(T)!T * dT (J/mole*K) (23)
Thus:
lJ/mole) (24)
(J/mole) (25)
(K) (26)
Hence:
(K) (27)
where dS~ is the entropy of fusion. The value reported by Brun et al. [81 is 1.2227 J *g" *K' " while a value of 1.215 J *g" *K" is calculated with the fusion enthalpy of water mentioned in the literature [91. which amounts to 332 JIg.
(m) (28)
Brun et al. [81 have determined the value of the interfacial energy of the liquid water-ice
interface that led to the best agreement with porous dimensions determined by mercury penetration and nitrogen sorption. The interfacial energy VI' is :

85 Shrinkage of Porous Silica Spheres
Vis = (40.9+0.39*dT) * 10-3 (N/m) (29)
where dT is the decrease in the freezing point, (T-T o)' For the fusion enthalpy at 273 K we
use the same value as used by Brun et aI., viz.,
dS~ 1.2227 (JIg *K) (30)
= -67.17/dT - 0.64 (nm) (31)
However, the dependence of Rn on dT mentioned by Brun et al. [8] is :
Rn = -64.67/dT - 0.23 (nm) (32)
The volume of water, Vn , undergoing the phase transformation, is smaller than the real
pore volume, Vp' because a non-freezing layer of a thickness, t, of about 0.9 nm does show up at the silica-ice interface [3,8,10,11] (Fig. 1). The value of 0.9 nm is the average
of the values of 0.8 and 1.0 nm mentioned in the literature. The non-freezing layer
consisting of three monolayers of water [12] has been satisfactorily demonstrated by
proton NMR spectroscopy [111, DSC [13,141, and viscosity measurements [151, though
a low thickness of 0.3 ± 0.1 nm has been obtained by low-field proton NMR spin relaxation
measurements [16]. Brun et al. [8] applies a value of t of 0.8 nm, and therefore:
Rp = -64.67/dT + 0.57 (nm) (33)
The relation of Eqn. 33 is used to determine the interfacial energy, Vis' as a function of the
temperature.
It is possible to correct for the temperature dependence of the entropy by using the
specific heats of the solid and the liquid according to :
(J/mole*K) (34)

86 Chapter 5
The entropy of Eqn. 34 is merely a property of the bulk of the water, schematized by the
solid lines in Fig. 2. The dS~ and Cp,-Cp, term are quoted as the A and 8 term on page 66
in ref. [81, the normal entropy, and the entropy variation due to the lowering of the
transformation temperature.
As said earlier in Eqn. 21, at the intersection of the dashed line holds;
(J/mole) (35)
(J/mole*K) (36)
, and with Eqn. 28 :
(J/mole*Kl (37)
S,(T)-S,(T) = (H~-H~)!T + (Cp,-Cp,1T) *dT + (dS~1T) *dT (J/mole * K) (38)
dS, = dS~ + To J T (Cp,-Cp,lT)*dT + To J T (dS~fT)*dT (J/mole*K) (39)
Eqn. 39 contains a third correcting term C mentioned by 8run et. al. [8] due to the liquidsolid interface curvature. It can clearly be seen from Eqn. 39 that the ice-water enthalpy
H can be expressed by :
(J/mole) (40)
The ice-water enthalpy H is corrected for the energy dH involved in the preparation of the
meniscus, which is 1.2 *dT, and for the difference in heat capacity between water and
ice, (CPrCP,)*dT, respectively [6]. According to Angell et al. [171. the heat capacity of
water, Cp" is 4.1 - 2.8*10·3 *dT + 9.5*10·4 *dT2 (J/g*Kl. The heat capacity of ice, Cp"
is 2.11 + 7.9 * 1O-hdT (JIg * K) [9]. 80th corrections are applied to the enthalpy:
H (41)
Another correction involves the entropy of the interface. Brun et al. [8] assume the

87 Shrinkage of Porous Silica Spheres
presence of cylindrical pores to develop an expression for the correction. The surface area,
A, of a cylindrical pore is :
A (42)
where L is the pore length.
(43)
The surface free energy, GS, is equal to the interfacial energy y* A (J) :
GS = y*A (H'-T*SS) (J) (44)
, whence:
dGS = dy*A (dH' - T*dSs - dT*SS) (J) (45)
The entropy contribution of the interface accordingly is :
(J/mole*K) (46)
The total energy, W'th' released during the transition of the liquid to the solid raising the
interfacial area by an amount A hence is :
(JIm ole) (47)
(J/mole) (48)
, and thus with aid of Eqn. 28 :
W'th = T*dS, * (1 + (dyldT) * ((T-To)ly,,) * (dS~/dSf)) (J/mole) (49)

88 Chapter 5
where dVldT=0.39*10·3 N/m*K. We do not include the correction for the interfacial
entropy and in view of small correction also not derivation of the correction for the
pressure dependence of the fusion entropy, for which we refer to [B, 1BI. The value of the
ice-water surface tension, 1',., of (40.9 +0.39 *dT) * 10.3 N/m is close to the silica-water
surface tension of 45 * 10.3 N/m [19,20].
The pore volume of wet gel determined in four ways
The pore volume of the silica sample can be determined directly by integrating the
heat-flux with time in two ways: 1) in the cooling step of the measurement sequence
(freezing water). and 2) in the heating step (melting ice). The pore volume, Vn , is calculated
by:
(ml/g) (50)
in which P; is the heat-flux (in W). t;+1-t; the measuring interval of 20 s, H is the ice-water
enthalpy of Eqn. 41 (in Jig). and W is the amount of silica (in g). Two alternative ways of
measuring the pore volume are the use of 3) the crystal size distribution, and 4) the
amount of bulk water.
The pore volume Vn by using the ice crystal size distribution
The ice crystal size distribution in a cooling experiment, dVn/dR against Rn, can be
derived from Eqn. 32 [4,21 I. The contribution to the total ice volume of measurement
point i is :
dVn/dR; = (P/HD) * (1/cr) * (dT1164.67) (m/lnm) (51 )
in which P; is the heat-flux (in J/s). H is the ice-water enthalpy of Eqn. 41 (Jig). D the
density of ice (g/m\), cr is the cooling rate (K/s), dT; is the freezing-point depression (K),
and 64.67 a constant (nm *K). The determination of the pore volume is integration of the
product dV/dR; with dR, (Eqn. 52), with dR; the change in the value of the radius at
measurement point i (Eqn. 53) :
(m/lg) (52)

89 Shrinkage of Porous Silica Spheres
dRj = R;+k + Rj•k I k (nm) (53)
in which Vn is the pore volume of the wet gel (in ml/g), and k an integer, representing the
interval before and after measurement point i, varying from 1 to 20. Applying a cooling
rate of 30 K/h, a value k of 1 is sufficient to measure an accurate dR, and pore volume
V n • However, for small cooling rates, 1 K/h, a relative high value of k must be chosen,
k = 20, because the fault in dT; is relative large on the Setaram DSC 111.
Measurement of V by using the amount of bulk watern
Finally, the pore volume can be measured in a less laborious manner: by subtraction of
the amount of bulk water in the thermogram, melting at 273 K, from weight of water,
expressed by Eqn. 54.
(ml/g) (54)
V n is the pore volume of the wet gel, W(H 20h the total amount of water obtained with a balance, W(H 20)B the amount water melting at 273 K obtained by DSC, and W(Si02 ) the
weight of dry silica (in g), and D the density of water (g/ml). The total amount of water
in the sample cup is determined by measuring the weight loss after drying of the wet xero
or hydrogel.
The role of the pore shape factor F and the non-freezing layer t
Ice crystals in pores of solid materials melt at temperatures below the bulk freezing
temperatures. The quotient of the freezing point depression with solidification, dT" and
with fusion, dTt , is the shape factor F.
F = dT, I dTf (55)
The magnitude of the shape factor F provides information about the shape of the pores. The shape factor F has a value of 1 for pure spherical pockets, and a value of 2 for
cylindrical pores [7]. Usually, a value of F between 1 and 2 is experimentally found. If the
90 Chapter 5
temperature of the solidification and fusion curves overlap, the contribution of the spherical
and cylindrical pores can be separated using the procedure of Jallut et al. [41. Quinson et
al. [221 derive a factor m from the shape factor F, viz., m = (4-F). However, we prefer
m = (1 +2/Fl.
The value Vn can be corrected for the non-freezing layer t by :
(ml/g) (56)
in which V~ is the corrected pore volume (in mUg), Rnis the crystal size (nml, and t is the
non-freezing layer (in nm). Jackson and McKenna [51, studying the solidification of
dicyclodecane do not correct for the 'non-freezing' layer. As a result the apparent
solidification enthalpy measured within pores of a radius of 5 nm is 30 % lower than the
enthalpy in pores of a radius 25 nm or more.
The surface area of the ice crystal An (m 2/g Si02 ) can be derived from the pore volume
Vn according to Eqn. 57.
(57)
The value of An can also be corrected for the non-freezing layer t in Eqn. 58.
(58)
The corrected specific surface area A~ can be compared with the BET surface area of the dried silica spheres.
EXPERIMENTAL
Preparation and hydrothermally ageing of the spheres
The preparation of porous silica gel by means of the sol-gel procedure has been known
for more than 50 years [231. RecentlY, the preparation of spherical silica gel bodies has
been developed [24]. The pore structure of the resulting silica can be modified by adapting one or more of the steps in the sol-gel preparation of the spheres.

91 Shrinkage of Porous Silica Spheres
The steps are:
A. preparing a hydrosol by acidifying a sodium silicate solution,
8. gelling of the spherical sol droplets in hot paraffin oil, forming
hydrogel spheres. The density of the sol aggregates is influenced by the gelling
temperature, and the pH [251,
C. ageing of the hydrogel, which causes an increase of the pore radius,
and of the pore volume, and a decrease of the silica surface area [261,
D. removal of the excess of the electrolyte by washing, or by adding sodium exchange media,
E. drying of the hydrogel, forming a xerogel,
F. addition of an electrolyte, and ageing of the xerogel,
G. drying of the aged xerogel,
H. calcining the dried gel.
It is not necessary to apply either step C, or steps F-G. Ageing at high pH levels leads to
an enhanced pore volume due to the repulsion amongst negatively charged particles. The
effect will be even more pronounced when (i) the silica concentration is high at high pH,
or (ii) pore regulating agents (PRA's) are used, because an increased charge density raises
the repulsion [27,28]. While we have to use thermoporometry to characterize the wet gels,
we used additional techniques to investigate the dried silica spheres, viz., N2 sorption, and Hg penetration.
Sample codes
Six fractions of hydrogel spheres are prepared, consisting of 5 nm primary particles, and
having a concentration of 13 wt% silica in water, viz., two standard hydrogel fractions,
H1 and H2, which are stored in water (Steps A, B and D). Fraction H1 is gelled at room
temperature, while fraction H2 is gelled in hot paraffin oil of 363 K. Four hydrogel fractions, H3 to H6, are washed with 1 M NaCI, and are aged (Steps A to Dl, viz., 2 h at
473 K at a pH of 6 (H3l, 23 hat 423 K and a pH of 6 (H4l, 24 hat 473 K and a pH of 5.2
(H5l, and 7 h at 473 K and a pH of 6 (H6).
One standard xerogel fraction (X7) is prepared by drying H2 at 393 K (Steps A, 8, D and
E). Two xerogel fractions are aged in 1 M NaCI of pH = 6 (Steps A, 8, D to H) for 7 h at
473 K (X8l, and for 23 hat 373 K (X9). The weight ratio of silica/water with ageing is
0.15. The aged hydrogels H1 to H6, before and after drying, and the xerogels X7 to X9 only
after drying are characterized by thermoporometry. The drying temperature is 393 K.
Before thermoporometry is applied to the dried samples, the pores are completely filled with water. Amounts of 0.24 to 0.30 g not dried hydrogel, containing 0.02 g dry silica are
measured. Xerogel spheres, containing 0.09 g silica, are added to an excess of water and

92 Chapter 5
are measured. The weight of the aluminum sample cup is 0.22 g. Thermograms are
recorded at low cooling and heating rates, viz., -1 and + 1 K/h, respectively. With samples
containing narrow pores, the measurements have to be extended to low temperatures with
slightly higher cooling and heating rates, larger than 1 K/h. For example, samples H2 and
X7 are measured at cooling rates of -2 and -5 K/h.
All the samples are measured on the Setaram DSC 111, except for one hydrogel, viz.,
H1, which is measured on a Netzsch 43 DSC in combination with a model 200 data
station (Selb, Germany).
RESULTS AND DISCUSSION
Evaluation of thermoporometric results
The thermogram of the hydrogel H2 is represented in Fig. 3. Formation of ice crystallites during cooling is evident from the exothermic peak at 265.8 K. The branch measured
during heating exhibits an endothermic fusion peak at a higher temperature, viz., 270.3 K.
The melting of bulk water shows up at 273.15 K during heating. An appreciable hysteresis
between the freezing and the fusion temperature, dT, and dT" respectively, thus is
apparent. The shape factor corresponding to the hysteresis, dT,/dT" is high, viz., 2.6.
Table 1 Thermoporometry applied on sample (a) X8 with Rp = 30 nm, V p = 1.0 ml/g, and
(b) X9 with Rp =8 nm, V p =0.8 ml/g, and BET surface area 156 m2/g on a
Setaram DSC 111, and (c) H1 on a Netzsch DSC 43.
rate (K/h) Rn (nm) Vn (ml/g) F An (m 2/g)
(a) X8 -30 15
7h -7 20 0.8' 1.5 62
473K -1 30
(b) X9 1 0.7 2 1.03 first time heating
23h -1 8.3 0.8' 2.1 172 second time cooling
373K 1 0.62 fourth time heating
(c) -60 5.0 0.4' 0.42 1.6 180 after 4 days
H1 -60 5.1 0.3' 0.32 1.6 132 after 27 days
-60 5.5 0.3' 0.32 1.6 123 after 180 days
Vn obtained by 1) cooling, 2) heating, and 3) the bulk peak

93 Shrinkage of Porous Silica Spheres
-40
-36
-32
-28
-24
~ S X :::J ....J u.. ~ <U.J :I:
-20
-16
-'2
-8 (b)
-4
(a) i l~'. dTs
§260 264 268 272 276
TEMPERATURE (K)
Figure 3 Thermogram represents standard hydrogel H2 with a concentration silica of 13 wt% SiOz in water. The amount solid silica is 0.02 g. The cooling and heating rate is -2 and +2 Klh, respectively. The measuring interval is 20 s, and the sensitivity of the Setaram DSC 111 is 250 p.W. The cooling step is (a), and the heating step (b).
The effect of the cooling rate on the pore radius calculated from the experimental
thermogram has been investigated on sample X8, the xerogel dried at 393 K and
hydrothermally treated for 7 h at 473 K. For the xerogel X8 mercury porosimetry provided
a mean pore radius of 30 nm and a pore volume of 1.0 ml/g. As can be seen in Tab. 1,
cooling rates of 30 and of 7 K/h led to pore radii of 15 and 20 nm, respectively, while only
the low cooling rate of 1 K/h resulted in the pore radius of 30 nm, which was observed
with mercury porosimetry.
In Tab. 1 and 2 the pore volumes determined according to the four procedures indicated
above are mentioned. It can be seen that the value of Vn determined from the surface area
of the peak in the cooling step is mostly slightly smaller than the Vn value calculated from
the fusion peak. The hydrogel H2 showed a value for V n that is considerably higher than
pore volume calculated from the peak measured during the heating step. It is remarkable
that the hydrogel H2 also exhibited an exceptionally high value of F, the pore shape factor, viz., 2.6. The hydrogel H5 also has a pore volume calculated from the fusion peak that is significantly higher than that calculated from the freezing peak, viz., 1.9 and 1.6 ml/g.

94 Chapter 5
Table 2 Pore structure of aged hydrogels (a) before drying, and (b) after drying, compared
with (c) Hg penetration, and (d) N2 adsorption and desorption, both applied on
dried spheres.
sample H2 H3 H4 H5 H6
gelling 2 h pH=6 23 h pH =6 24h pH = 5 7 h pH=6
363 K 473 K 423 K 473 K 473 K
(a) Rn (nm) 8.6 10.9 19 25 27
Vn (ml/g) 0.9' 1.52 1.0' 1.1 2 0.9' 1.6' 1.92 1.4'
1.03 1.94 2.1 3
F 2.6 1.6 2.3
An (m 2 /g) 240 204 115
(b) Rn (nm) 3.5 7.1 11 .1 15 20 Vn (ml/g) 0.5' 0.7' 0.6 2 0.6' 1.0' 1.1 2 0.8'
0.7 3 1.04 1.03 1.1 4 0.93
V~ (mllg) 0.8' 0.9' 0.7' 1.1 ' 0.9'
F 1.4 1.8
An (m 2 /g) 2865 246 145
A~ (m 2 /g) 3605 285 150
(a-b) -dRn (nm) 5.1 3.8 7.9 10 7
-dRn (0/0) 59 35 42 40 26 -dVn (ml/g) 0.4 0.3 0.3 0.6 0.6 -dVn (0/0) 44 30 33 38 43
dAn (m 2 /g) 465 42 30
(c) Rp (nm) 5.2 9.4 13 16 Vp (ml/g) 0.8 1.0 1.3 1.1
(d) Rp (nm) 2.3 6.6 15
Vp (ml/g) 0.76 1.0 1.4
A. (m'/g) 455 218 123
Vn obtained by 1) the cooling step, 2) the heating step, 3) the pore size distribution, 4)
measuring the amount bulk water. The surface area An obtained by 5) assumption of a
cylindrical pore shape.

95 Shrinkage of Porous Silica Spheres
respectively. The shape factor is also relatively high, viz., 2.3. The V n value calculated
according to the above procedure (iii) from the cumulative ice crystal size distribution does
not differ significantly from that calculated from the cooling step. However, the pore
volume calculated from the cumulative ice crystallite size distribution is even larger with
the hydrogel H5, viz., 2.1 mllg. The pore volume calculated from the peak due to bulk
water is larger than the pore volumes calculated according to the other procedures. Since
this procedure also measures the non-freezing layer, t, it should be the most reliable.
Unfortunately, however, the procedure has experimentally the lowest accuracy, due to
weighing errors and leakage of water from the aluminum sample cup. Additionally some
water may be present in pores within the gel structure of radii Rn smaller than 1 nm, which
will lead to a greater pore volume. However, the amount of water present in micropockets
within the gel structure is assumed to be negligible in base catalyzed silica gels [29].
A number of reasons other than merely an experimental error can be raised to explain
that the pore volume Vn calculated from the freezing peak is smaller than-that calculated from the thawing peak. First of all, water may be freezing initially to an amorphous solid,
which subsequently more slowly recrystallizes to ice, and which melts as crystalline ice
during the heating cycle. A delayed crystallization to ice may lead to a freezing peak which
is relatively low and which is exhibited at an appreciably lower temperature than with
direct crystallization to ice. The low temperature of the freezing peak should lead to a high pore shape factor and the low peak to a relatively low pore volume, V n • Also the
temperature correction of the enthalpy, CPI' has been debated. If the value of CPI is not
entirely correct, the value of the pore volume can also be affected. Etzler [301 has
established that the heat capacity of liquid water, CPI' strongly depends on the pore radius
of the silica. It is strange, however, that the heat capacity passes through a maximum at
decreasing pore sizes. The maximum, 5.52 J/K*g, is exhibited at a pore radius of 7 nm. Everett [311 has extensively dealt with the effects of solidification of a liquid present
within a porous material on the structure of the material. Often solidification of the liquid
results in disintegration of the porous solid. Everett emphasizes that the disintegration is
not due to expansion of the impregnated liquid during freezing. Also with liquids that take
up a lower volume with the transition to the solid can bring about disintegration due to
transport of the liquid to pores of larger dimensions. Since the density of ice at 273.15 K
is significantly lower than that of liquid water at 277 K, a volume expansion, which may
be as high as 8 to 20 % depending on the temperature and the pressure [32], will proceed
during the freeZing of water. The freezing of water present within a porous material
therefore may severely affect the structure of the material. Jallut et al. [41 have mentioned
that the effect of the solidification of an impregnated liquid on the structure of a porous
material caused thermoporometry to be a destructive analysis procedure.
To assess an effect of the freezing of water on the structure of porous silica, we
measured several times consecutively the thermogram of the xerogel X9, which was dried
at 393 K and subsequently treated for 23 h at 373 K. From the data of Tab. 1 it appears
that freezing and thawing of water present within the pores of xerogel X9 does not significantly affect the pore volume. The first measurement led to a pore volume of
0.7 mllg, while the fourth time heating measurement (after three times solidification of

96 Chapter 5
0.75
~ (a)
U '" N
~ E 0 ElI: :!2 >U
0.50
0.25
~ 0.00
0 3 4 5 6 7 8 9 10 11 12 13 14
CRYSTAL RADIUS Rn (nm)
0.75
(b)
~ 0.50
N
'ffi E (; .s lI: :!2 >U
0.25
/"
\... 0.00
0 2 3 4 5 6 7 8 10 12 13 14• PORE RADIUS Rp (nm)
Figure 4 Crystal size distribution of standard xerogel X7 by thermoporometry (a), and the pore size distribution by N2 adsorption, and desorption (b). The integral under curve (a) and (b), (Ej dVjdRj * dR; IVJ is normalized on 1.

97 Shrinkage of Porous Silica Spheres
water) resulted in a pore volume of 0.6 mllg. Apparently the structure of the xerogel of
silica is sufficiently strong to withstand the mechanical pressure differences caused by the
transport of freezing water. Cracking of the narrow pores present in the silica xerogel is
unlikely. Investigating water present in polymer in an ultrafiltration membrane Cuperus et
aI., on the other hand, observed an increase in pore radius due to freezing and thawing.
Cracking of pores seems to proceed within wide pores that are in contact with narrow
pores. Ice extruded from the narrow pores into the wide pores that are cracked.
Comparison with mercury porosimetry and nitrogen sorption
The research described in this chapter is aimed at the effect of drying and thermal
treatment on the porous structure of silica. Nevertheless it is interesting to compare the
pore radii and pore volumes as determined by thermoporometry with the values resulting
from mercury porosimetry and nitrogen desorption.
Using Eqn. 32 the ice crystal size distribution of sample X7, the xerogel which is
obtained by drying H2 at 393 K, has been calculated from a thermogram measured on the sample. The resulting ice crystal size distribution, Ro ' is represented in Fig. 4a. The pore
size distribution, Rp , has also been determined from the desorption of nitrogen. The
distribution is shown in Fig. 4b. The shape of both distributions is remarkably similar.
However, the mean pore radius as determined from the thermogram, viz., 3.5 nm, is
slightly larger than the mean pore radius calculated from the desorption of nitrogen, viz.,
2.3 nm. The mean value of the thermoporometric pore radius is thus higher than the mean
value calculated from nitrogen desorption in spite of the presence of the non-freezing layer of water. The smaller value of the nitrogen pore radius is attributed to the presence of
spherical pores, which is indicated by the pore shape factor of 1.5. The nitrogen
desorption is determined by the neck radius of the pores, which is smaller than the
dimension measured by thermoporometry.
In Fig. 5 the other mean pore radii as resulting from mercury porosimetry and nitrogen
desorption have been plotted as a function of the pore radius resulting from
thermoporometry. It can be seen that now the agreement is remarkably good. The pore
radii determined by mercury intrusion are about 2 nm smaller than the radii calculated by
thermoporometry. The values determined thermoporometrically being equal or even larger than those
measured by mercury penetration and nitrogen desorption is unexpected, as mentioned
above. The presence of a layer of non-freezing water suggests the pore radii determined
by thermoporometry to be smaller than those measured by nitrogen desorption or mercury
intrusion. With ink bottles pores, however, desorption of nitrogen and penetration of
mercury is dominated by the relatively small entrance of the pores. With thermoporometry
the diameter of the spherical pore itself and not that of the entrance is measured (Fig. 1). We therefore attribute the results of Fig. 5 to the presence of spherical pores in the
hydrogels.

/ /
/ /
/ /
o N2 t>. Hg /
/ /
/
Figure 6
/ /
/ / The pore volume, Vp , of
/ / nitrogen sorption and
/ / mercury penetration plotted
/ / against the ice-pore
/ /
/ / volume, Vo, obtained
thermoporometry. by
/ /
98 Chapter 5
20-,---------------,--/-------,
O-f-r-r-r-.,-,-,-...,..,,,-.-r-r-r-...-r-,-...,..,r-r-,-.,-,--,-.-I o 5 10 15 20 25
Pore rodius thermoporometry (nm)
1.5 ...,---------------,---------"
0.0 +-,----r---r-,-...,----,---,----r---,-,-..,.--r----r---.----j 0.0 0.5 1.0 1.5
Pore volume thermoporometry (ml/g)
j --15 ;! "Cl
~ CII Z 10 III
:a:lIII
'" III
'" ~ 5
bii, ! III =1.0
1 CII Z III
~ '0 1'0 0.5 III
'"o Po.
/ /
/ /
/
o o N2 t>. Hg
/
/ /
/
t>. Figure 5
/ /
/ / t>. Pore radii, ~, of nitrogen
/ /
/0
sorption and mercury penetration plotted against
/ /
t>. the radii, R", obtained by /
/ thermoporometry.
/0 /
/

99 Shrinkage of Porous Silica Spheres
The values for the pore volume are plotted in Fig. 6. The pore volume determined by thermoporometry, Vn, appears to be consistently about 0.2-0.3 ml/g lower than the
volumes measured by mercury penetration and nitrogen sorption. It is obvious to attribute
the lower value measured by thermoporometry to the non-freezing layer of water. The
surface area calculated from the surface of the ice crystallites, An' is (22 ± 6) m 2/g higher
than the BET surface area (Tab. 3). The presence of micropores in the hydrogel H2 is
evident from the fact that the BET surface area is much larger than the surface area
calculated from the thermoporometrically determined pore radius and pore volume. The
mean pore radius calculated from the BET surface area and the pore volume determined
by nitrogen sorption is 3.3 nm. The difference with the experimentally determined pore
radius of 2.3 nm again indicates the presence of narrow pores in the hydrogel H2.
Table 3 BET surface areas compared with surface areas determined thermoporometrically.
Sample X9 H2 H3 H5
BET surface area (m 2/g) 156 455 218 123
Therm. surface area An (m 2/g) 172 286* 246 145
*) assumption of a cylindrical pore shape
A pore radius which is equal with thermoporometry, mercury penetration, and nitrogen
desorption, and a pore volume, which is smaller with thermoporometry, suggests the
surface area calculated from thermoporometric data to be smaller. However, the thermopo
rometric surface areas are consistently larger than the BET surface areas.
Effect of thermally ageing and subsequent drying and on the porous
structure of hydrogels
The effect of ageing hydrogels at room temperatures and hydrothermally at higher
temperatures can be studied readily by thermoporometry. As indicated by the data of
Tab. 1, the value of Rnwhich is indicative for the pore radius, Rp , of the hydrogel increased
and the value of Vn, indicative for the pore volume, Vp , slightly decreased during ageing
in the solution at room temperature. The surface area consequently dropped by 32 %. Gelling at 383 K led to a higher ice-pore radius, viz., 8.6 nm, a higher ice-pore volume,
viz., 0.9 ml/g, and a higher ice-surface area, viz., 240 m 2/g, than observed for the gel aged

100 Chapter 5
in water at room temperature. Thermally treating for 2 hours at 473 K does not strongly
decreased the pore volume, but raised the pore radius to 19 nm. Finally treating the
hydrogel for 7 or 24 hours at 473 K led to a pore radius of 27 nm, and a surface area of
115m2!g.
Drying the aged silica gel severely affected the pore radius and the pore volume. The
pore volume dropped by 30 to 44 % in accordance with values reported in the literature
[31. The decrease of the pore volume does not depend on the thermal pretreatment. The
decrease of the pore radius of the gel treated at 393 K is no less than 59 %. The gel
thermally treated at higher temperatures showed a drop in pore radius of 26 to 40 %. The
compressing action of the meniscus travelling through the gel causes the pore volume and
the mean pore radius to drop considerably, without bringing about a loss in surface area.
The surface area even rises during drying. Fig. 7 shows the effect of drying on the mean
pore radius. The experimental points representing the mean pore radii after drying are
situated appreciably below the dashed straight line which corresponds to no shrinkage at
all. 30,----------------------------------,.,
/ /
/E -S <.9 /Z ):a: Cl 20 / o a: L1J /t;: « c: a: en :::J 15 «a: --'
~ >- 10 a: (,)
L1J ~
o
o
ICE CRYSTAL RADIUS Rn BEFORE DRYING (nm)
Figure 7 Shrinkage of hydrothermally aged hydrogels with drying measured by thermoporometry. The dashed line represents no shrinkage. The solid line
represents the crystal radius before drying, R", is drawn against the R" of dried, and with water impregnated spheres.

101 Shrinkage of Porous Silica Spheres
The increase in surface area An during drying (Tab. 2a-bl is in sharp contrast to the behaviour of two-step acid-base a/cogels during drying. It has been reported [331 that the
alcogel loose about 50 % of the surface area on drying.
An increase of the ice-pore volume, Vn' of the hydrogels with ageing, resulting in larger
ice-pore radii, Rn, is visible in Tab. 2a. The ice-pore volume increases from 0.9 to 1.4 ml/g,
while the ice-pore radius increases from 8.6 to 27 nm. An increase of the pore volume
with ageing before drying should be visible as an increase of the pore volume of the
hydrogels after drying. In Fig. 8, the pore volume Vp of aged and dried hydrogel spheres
is drawn against the pore radius Rp by Hg penetration. The samples with different ageing
conditions are those of Chapter 3. The pore radius Rp increases with intensity of treatment.
It appears that the value of Vp of the hydrogel spheres increases with Rp • The increase of
the pore volume of the dried gels is not only due to the reinforcement of the gel structure
by ageing [31. but also due to repelling forces amongst the silica sol particle with ageing.
2.4
........ bIl
...........
S 2.0- o ------E]
bIl.::.... CIJ : 1.6
0 0
lo< CIJ...., .... al 1.2 0
0 0 tf
f1
0. :> 0
CIJ
8 ;::l 0.8 ...... 0 0
0 > CIJ lo<
&0.4
0.0 o 10 20 30 40 50 60 70 80
pore radius Rp after ageing (nm)
Figure 8 Pore volume Vp of hydrothermally aged hydrogel spheres against the pore radius ~ after drying with Hg penetration.

102 Chapter 5
The fractal nature of silica hydrogels
The silica particles of the hydrogel is believed to have a fractal structure. A fractal
structure of the silica sol particles could be demonstrated by a fractal pore size distribution.
Recently, the fractal nature of carbon blacks, dispersed in water is investigated by
Ehrburger-Dolie and coworkers [34]. The mass fractal of a silica gel is obtained by
measuring the mass included by an exponential increasing volume block with the 3ndimension (l3)n = 1 , where I is the ruler (m). and n an integer 1,2, .. ,00. The mass M (in
g) is a function of I by ; M _Ind. In the increasing volume /3n a repetition of the structure is
seen. If the volume contains a rod (M -I), plate (M _1 2). or body (M _13) with uniform
density D, the dimensions dare 1,2, and 3, respectively, and not fractal. The fractal
dimension of a gel with not uniform density varies as a real between 1 and 3. The density
D is expressed by :
D = M/V _ Ind IIn3 _ In1d-31 (g/ml) (59)
, and the pore volume Vp (Rp=ln) :
(mJlg) (60)
, and:
(ml/g*nm) (61 )
where dVn/dRi is obtained from Eqn. 51 and Rn" from Eqn. 32. From the right side of the
distribution curve, the fractal dimension can be obtained by the slope of the -log(dVn/dRn )
against the 10gRn plot, which is 2-d (Eqn. 61) at least if d> 2, which is not the case of
linear aggregates of carbon blacks in work of Ehrburger-Dolie et al. [341. The fractal
dimension (d < 2) is obtained in a more laborious manner from the left side of the
distribution curve using Eqn. 60 :
(62)
Rmin denotes the left onset radius of the distribution curve, and Rmax the radius at the

103 Shrinkage of Porous Silica Spheres
maximum of the crystal size distribution curve; dVJdR; = max, and V~ is integration of the ice volume from the minimum radius Rm;n ;
(63)(V~-V~,m;n)
However, in ref. [341, the pore volume Vn is integrated from the maximum of the crystal size distribution;
(64)
(65)
,thus;
(66)(V~-V~,min)/(V~,max-V~)
, and Eqn. 62 can be rewritten to ;
(67)
The slope of the 10g(Vn-Vn,min)/(Vn,max-Vn) against the log(Rn-Rmin)/(Rmax-Rn) plot should deliver the fractal dimension d by (d-3). Since Rp=ln, very broad pore size distributions are
expected with fractal structures. The pore size distribution curves of our gels are very
small and uniform. The fractal nature of our silica hydrogels does at least not show up in
a fractal pore size distribution.

104 Chapter 5
CONCLUSIONS
1) Thermoporometry offers the possibility to investigate the shrinkage processes with
drying of wet hydrothermally aged silica spheres.
2) When the technique is performed on a Setaram DSC 111, the cooling and heating
rates should have the smallest practical values of + 1 and -1 K/h, at least on a
Setaram DSC 111. However, when thermoporometry is applied on a Netszch 43 DSC and
model 200 data station, it is possible to work at much higher cooling and heating rates,
60 K/h. Obviously, the Netszch DSC, which is far less sensitive, has no heat transport
problems.
3) Serious cracking of the pores by applying thermoporometry is not evidenced.
Probably, the non-freezing layer t receives the expansion of ice by extrudation.
4) Silica hydrogel, prepared by the sol-gel technique, and stored at room temperatures,
is only slightly affected by ageing. In contrast, ageing at high temperatures, causes an
increase of the pore volume and pore radius of the hydrogel. With thermoporometry it
appears that the increase already proceed before drying.
ACKNOWLEDGMENTS
The authors thank J.J. van Beek for his critical review of the article.
REFERENCES
1. A.E. Afanaseev, and A.N. Boltushkin, Call. J. USSR, 49 (1987) 1043
2. T. Kawaguchi, J. Iura, N. Taneda, H. Hishikura, and Y. Kokubu, J. Non Cryst.
Sol., 82 (1986) 50
3. L.L. Hench, and J.K. West, Chern. Rev., 1990 (90) 33
4. C. Jallut, J. Lenoir, C.Bardot, and C. Eyraud, J. Membran. Sci, 68 (1992) 271
5. C.J. Jackson, and G.B. McKenna, ASC Polymer Preprints, 32 (1992) 439
6. I. Higuti, and Y. Iwagami, J. Phys. Chern., 56 (1952) 921
7. J.F. Quinson, M. Astier, and M. Brun, Applied Catalysis, 30 (1987) 123
8. M. Brun, A. Lallemand, J.F. Quinson, and C. Eyraud, Therrnochirnica Acta, 21 (1978) 59
9. Handbook of Chemistry and Physics, 56th ed., Ed. R.C. Weast, CRC Press,

105 Shrinkage of Porous Silica Spheres
Cleveland (1975) 10. S. Takagi, J. of Coli. Interf. Sci., 137 (1990) 446
11. F. Ehrburger, V. Querin, J. Lahaye, Colloids and Surfaces, 14 (1985) 31
12. LV. Yazyna, V.1. Kvlividze, and A.V. Krasnushkin, Coli. J. USSR, 49 (1987)
1188 13. T. Sakamoto, H. Nakamura, H. Uedaira, and A. Wada, J. Phys. Chem., 93
(1989) 357
14. M. Tasaka, S. Suzuki, Y. Ogawa, and M. Kamaya, J. of Membr. Sci., 38 (1988)
175 15. LV. Dedyulya, and N.V. Churaev, Coli. J. USSR, 50 (1988) 204
16. P.J. Davis, C.J. Brinker, and D.M. Smith, J. Non-Cryst. Sol., 142 (1992) 189
17. C.A. Angell, M. Oguni, and W.J. Slichina, J. Phys. Chem., 86 (1982) 998
18. M. Brun, A. Lallemand, J.F. Quinson, and C. Eyraud, J. Chim. Phys. (France), 70
(1973) 973-978, 979-989, 990-996 19. G.B. Alexander, J. Phys. Chem., 61 (1957) 1563
20. A.C. Makrides, M. Turner, and J. Slaughter, J. Coli. Interf. Sci., 73 (1980) 345 21. L.G. Homshaw, J. Coli. Interf. Sci., 84 (1981) 127, 141 22. J.F. Quinson, J. Dumas, J. Serughetti, J. Non. Cryst. Sol., 79 (1986) 397
23. S.S. Kistler, J. Phys. Chem., 36 (1932) 475
24. C.J.G. van der Grift, H. Barten, J.C. van Miltenburg et aI., in 'Characterization of Porous Solids', Ed. K.K. Unger et aI., Elsevier, Amsterdam (1988). 619
25. P. Tang, D.E. Colflesh, B. Chu, J. Coli. Interf. Sci., 126 (1988) 304 26. R. Snel, Applied Catalysis, 11 (1984) 271
27. R. Snel, Applied Catalysis, 12 (1984) 189
28. R. Snel, Applied Catalysis, 12 (1984) 347 29. M. Pauthe, J.F. Quinson, H. Hdach, T. Wignier, J. Phalippou, and G.W. Scherer,
J. Non-Crystal. Sol., 130 (1991) 1
30. F.M. Etzler, Langmuir, 4 (1988) 878
31. D.H. Everett, J. Chem. Soc., Faraday Trans., 57 (1961) 1541 32. F.P. Cuperus, D. Bargeman, and C.A. Smolders, J. Membran. Sci., 66 (1992) 45
33. P.J. Davis, C.J. Brinker, D.M. Smith, and R.A. Assink, J. Non-Crystal. Sol., 142 (1992) 197
34. F. Ehrburger-Dolle, S. Misono, and J. Lahaye, J. Coil. Interf. Sci, 135 (1990) 468

107
Chapter 6
Control of the porous structure of silica gel by the preparation pH and drying-
M.K. Titulaer, M.J. den Exter', H. Talsma<, J.B.H. Jansen, and J.W. Geus'
Department of Geochemistry, Institute for Earth Sciences, University of Utrecht,
Budapestlaan 4, P.O. Box 80.021,3508 TA Utrecht, The Netherlands
'Department of Inorganic Chemistry, University of Utrecht, Sorbonnelaan 16, P.O. Box
80.082, 3508 TB Utrecht, The Netherlands
<Department of Pharmaceutics, University of Utrecht, Sorbonnelaan 16, P.O. Box
80.083, 3508 TB Utrecht, The Netherlands
-This paper is a contribution of the Debye Institute. University of Utrecht, The
Netherlands.
ABSTRACT
The decrease of pore dimensions with drying of silica gels as a function of the
preparation pH is investigated. The gels of 8.2 wt% Si0 2 in water are precipitated
between a pH of 1 and 10 in a computerized static pH equipment. The shrinkage is exclusively monitored by thermoporometry, which is applied to the wet as well to the
dried gels. The dried gels are characterized with four traditional techniques: transmission
electron microscopy, nitrogen sorption at 77 K, mercury penetration, and a Sears titration.
The fixed pH influences the polymerization rate of silicate anions, and therefore the size
and branching of the sol particles in the gel. At a low static pH of 1 to 2, very small but
highly branched sol particles of 2 to 3 nm diameter are developed in the gel with an
extreme microporosity. It is established that each sol particle is surrounded by
approximately eleven others. With thermoporometry it is determined that particle
aggregation behaves as hydrogel. Shrinkage proceeds with drying, and no pores can be
measured by thermoporometry. The pore radius Rp decreases from 3.1 nm to a value
below 3.1 nm, and the specific pore volume from 0.4 mUg to about 0.13 mUg. At a high
static preparation pH above 4, less branched and platy sol particles are formed with sizes up to 26 nm at a pH of 10. Before drying, the aggregates are highly porous and the pores
to large to be determined by thermoporometry. At a pH of 4 and 5, excessive shrinkage

108 Chapter 6
proceeds, and the pore radii Rp decrease to 2.8 and 6.8 nm, and the pore volumes to 0.8 and 0.9 mllg, respectively. The mercury pore volume of the dried gels with a maximum of 2.8 ml/g is essentially larger than both the thermoporometry and nitrogen pore volume,
which is explained by macro-pores, not being measured with latter techniques. The gels
measured with thermoporometry, mercury penetration and nitrogen adsorption exhibit a
maximum in pore volume between a pH of 4 and 8. The silica sol particles in the gel grow
larger and repel each other at high pH. Finally, at very high pH above 8, the gel weakens
and suffers more from the capillary forces with drying, due to the decreasing amount
interparticle bonds.
INTRODUCTION
Silica gel is widely applied as a filler, a paint thickener, a filter, a catalyst carrier, or as a c1ay- or zeolite precursor. Because reactions proceed at the silica surface in water, the
amount of surface area is very important. Besides, the pore size and pore volume of the
gel influence the processes of diffusion of the reactant to the silica surface. Undesired shrinkage by the decrease in pore size and pore volume has to be minimized with drying.
Usually, silica gels prepared by the addition of sodium silicate to a strong acid (nitric acid). A sodium silicate solution (water glass) is prepared from heated quartz and soda, and
subsequently dissolved in water. Subsequent drying of the wet gel (hydrogel) consisting
of silica sol particles leads to a dried gel (xerogel). Disadvantage is the fact that the size of the silica sol particles, the branching of the sol, and pore volume of the silica gel, can not be desirably varied, because the point of gelling is always attained by quickly raising the pH from a very low value. The knowledge of the effects of sol particle size and branching as controlled by the preparation pH on the amount shrinkage of the gel is
therefore limited [1]. A method to evaluate these effects is developed by the preparation of gels at a static
pH. A new pH-static method of gel preparation is introduced in this paper. The preparation
is deviating from the method in ref. [1 L where different amounts of acid and sodium silicate of high pH are rapidly mixed to obtain the desired pH. Firstly, the composition of
the starting silica sodium silicate solution is investigated with 29Si-NMR. The pore size,
pore volume, specific surface area, and pore shape of the desired hydrogels is explored by thermoporometry. The shrinkage with drying of the hydrogels is monitored.
Thermoporometry is applied on the hydrogels as well as on the xerogels. The xerogels are examined with five techniques, thermoporometry, transmission electron microscopy (TEM),
Hg penetration, N2 sorption at 77 K, and a Sears titration.

109 Shrinkage of pH-static Prepared Silica Gels
MATERIALS AND METHODS
29Si NMR spectroscopy
The chemical surroundings of the 29Si isotopes in the various polymers of the starting sodium silicate solution are investigated by 29Si Nuclear Magnetic Resonance (NMR). A
high silicium concentration of 0.5 to 1.5 M is required [2] even at the low temperature of
-13°C [3,4], and mostly a long measuring time of 2 to 4 h must be used in order to obtain
an accurate signal, even with an enriched 29Si solution of 95 mole% [2]. In Tab. 1 the
specific chemical shifts in ppm of the NMR resonance peaks are listed relative to the peak
of tetra methyl silane (TMS), The listed values of the literature [5,6] are used as a
reference for the experimental determined values of our solution.
An amount of 400 ml Merck sodium silicate solution (Art. 5621, 6.85 M Si, 3.91 M Na)
is diluted with 1600 ml demineralized water to a concentration of 1.37 M Si, 0.98 M Na
and a pH of 11.3. The chemical shifts of the polysilicate anions expressed in ppm are
measured relative to the resonance frequency of TMS on a Bruker WP 200 WB
equipment, with the following specifications: a magnetfield of 4.69 Tesla: a radio frequency of 39.76 MHz: and a frequency band of 5 kHz, which is about 125 ppm. The
pulse angle with the magnetfield is 45° and the duration of the pulse is 0.82 jJS. The scan
delay is 16 s. The spectrum is recorded with 512 scans and takes about nine quarters of
an hour.
Manufacture of pH-static silica gels
The molar ratio of Si0 2/Na20 of the starting sodium silicate solution is 3.511. The lSi]
is 6.85 M and the [Na] is 3.91 M. The solution contains various silicium polymers and
mono silicic acid (MSA). The sodium silicate solution is slowly injected into a dilute nitric
acid solution, which is kept at a constant pH level by simultaneously injection of nitric acid.
To investigate the effect of the pH of the solution, the pH is kept at 1,2,4,5,8,9, and 10. Fig. 1 shows schematically the equipment for the synthesis of the various pH-statically
prepared silica gels. A double walled and water cooled vessel of 3.5 I contains an initial
amount of 1925 ml demineralized water of 293 K. A concentrated sodium silicate solution
(Merck 5621,6.85 M Si and 3.91 M Na) is injected into the water at a rate of 0.5 mllmin
by a peristaltic pump (Gilson Minipuls 3, U.S.A.) over a period of 21 to 23 h.
The rate of the second peristaltic pump, which adds 3.2 M (18.5 wt%) nitric acid to the
solution, is controlled by a microcomputer (Apple 2 Europlus, U.S.A.). The pH difference between the given set point, pHsp , and the actual measured pH; regulates the rate of
addition. The measured pHi is initially slightly higher than the set-point pHsp •

110 Chapter 6
Table 1 Chemical shift of z9Si in polymeric species relative to TMS, according to ref. [5,6].
chemical shift (ppm)
literature literature our solution ratio
MR 3/1' pH 11.4 Si(%)
monomer -71.1 -73.2 -73.9 0.3
dimer ..., r -79.3 -81.3 -82.15 3.2
linear trimer Q1Q~ ..J
cyclic trimer Q~c -83.5
cyclic polymers Q~ -87.6 -89.9 -90.45 27.2 and chain middle groups prismatic Q~ -92.3 tricyclic hexamer branched polymers Q~ -96.3 -99.2 -99.16 42.8 and cubic octamer
tridimensional -109.8 -107.97 26.3 linked groups
1) MR = Molar ratio of SiOz/NazO. o CONSORT P207
APPLE 2 PLUS PH-METER MICROCOMPUTER
Figure 1
The equipment used for the preparation of pH-static silica
gels. An amount sodium silicate is added by pump I with a constant rate of 0.5 ml/min. A second
pump 2 is controlled by the computer and adds concentrated nitric acid in such a way, that the pH is constant during the addition of sodium silicate.
GILSON MINIPULS 3
PUMP
GILSON MINIPULS3
PUMP
o.l.(]
GLASS ELECTRODE

111 Shrinkage of pH-static Prepared Silica Gels
Eqn. 1 gives the rotation rate of the acid pump (RPM;) as a function of the pH difference. pH;-pHsp< relating a proportional constant P (min-1
) and an integral constant I (min-1). Both
P and I are previously stored in the computer (Tab. 2). The measuring interval of pH; in the
program is 3 s.
(1 )
with 0 < RPM; < 47.9 min-', where RPM; is expressed in min-', and I; is the sum from
measuring point 1 to i. The rate of addition, v;, of the 3.2 M HN0 3 solution is a function
of RPM; by :
v; = 0.16 * RPM; + 0.05 (mllmin) (2)
with 0 < v; < 7.7 mllmin. At every measuring point i the rate of the acid addition is
adjusted. The control system keeps the pH within 0.01 pH unity of the set-point. The
set-point pHsp< the total amount of sodium silicate added. and the nitric acid solution are listed in Tab. 2. The final silica concentration in the gel suspensions is about 1.37 M Si (7.9 wt% Si0 2).
The pH; is measured with a microcomputer pH-meter (Consort P207, Belgium). The
configuration of the RS-232 interface between the computer and the pH-meter is shown
in Fig. 2a. Fig. 2b shows schematically the configuration of the RS-232 interface between the computer and the nitric acid pump. The pH-measuring and pump control program is written in Applesoft BASIC, and a small part, reading in the pH;, in Big Mac Assembler language.
Thermoporometry of hydrogels
The pores of the gels are measured with thermoporometry, which is based on the
freezing point depression of water. The depression of the freezing point and thermal energy
released or absorbed is measured as a heat-flux with a differential scanning calorimeter (DSC) (7). The ice-crystal radius Rn (nm) in a pore is inversely proportional to the freezing
point depression dT. (K) (Eqn. 3) (7). The freezing point depression dTs is the freezing
temperature T. subtracted from the normal freezing temperature To at 273.15 K, (Ts-To),
which has a negative sign.
Rn = -64.67/dT.-0.23 (nm) (3)

112 Chapter 6
Table 2 Preparation conditions of the silica gels in the static pH equipment, with the set
point pH the final amounts of the sodium silicate and nitric acid in 1925 mlw HN03 , and the proportional and integral constants to keep the pH at the desired level, pHsp
pH,p P' (min-') 12 (min-') 6.85 M Si3 (mil 3.2 M HN03 4 (mil
1
2
20
20
0.2
0.2
680
635
835
710
4
5 6
5
5 20
0.05
0.05 0.2
635
635 661
675
705 737
8
9 10
20
20
20
0.2
0.2
0.2
625 690
655
630 645
562
sp = set point, 1) P = proportional constant, 2) I = integral constant, 3) ml added sodium silicate solution, 4) ml HN0 3 solution injected into initially 1925 ml H20
The specific pore volume Vn is expressed as the volume of water frozen within the pores
per unit weight of dry silica. The specific pore volume V is calculated according to Eqn. 4, n
where W is the weight of the dry silica.
(ml/g) (4)
where Ii Pi is the integral of the heat-flux during freezing of the water of every sample
point i (J/s), Ti+,-Ti the temperature interval (Kl, 0i the density of water (about 1 g/mll, Hi the solidification enthalpy of 332 JIg, W the weight of silica (g). and sr the scan rate (K/s).
Eqn. 4 accounts for the effect of the temperature on the solidification enthalpy.
The pore shape factor F provides information about the shape of the pore, and varies
between 1 for spherical and 2 for cylindrical pores. The value of F is the ratio of dT"
T,-273.15, of the freezing plot, and dTf ' T f-273.15, of the melting plot according to
Eqn. 5 :
F = dT./dTf (5)

113 Shrinkage of pH-static Prepared Silica Ge/s
CONSORT PH·METER
A PIN 2
APPLE COMPUTER
2 receive data
3 3 transmit data
4 c: request to send
clear to send
data set ready :3 E~ rec. line sig. del.
20 data terminal ready
7 7 ground
GILSON PUMP APPLE COMPUTER
2 2 transmit data B lfl3 3 receive data
4 4
5
:3 E:5
7 7
Figure 2 Configuration of the RS-232 interfaces, (a) between the computer and the pH-meter. The
display of the pH-meter, represented as XX.XX pH is send one X after another to the Apple 2 Europlus computer in ASCII-codes by the RS-232 interface in slot 2 of the
computer. The clock rate of the RS-232 card is 16 times the baud rate. The data are send a-synchronous, in a 8 bit format, no parity and 2 stop bits with a baud rate of 2400 S·l.
(b) between the pH-meter and the nitric acid pump 2. The communication between the
microcomputer and the Gilson pump is provided by the RS-232 interface in slot 3 of the
computer. The clock rate of the RS-232 card is 16 times the baud rate. A model 605
RS-232 adapter provides the interface between the RS-232 computer output and the Gilson Serial Input/Output Channel (GSIOC). In remote control the display of the Gilson pump,
represented as XX.XX RPM respectively, is send one X after another by the computer in ASCII codes, asynchronous in a 8 bit format, even parity, 1 stop bit, with a baud rate of 9600 S·l.

114 Chapter 6
Finally, the surface area An (in m 2/g) of the ice-crystal in the gel is calculated according to
Eqn. 6 :
(6)
A non-freezing layer of 0.9 nm thickness at the silica-water interface requires a correction
of Rn, Vn, and An to calculate the real pore radius Rp , pore volume V~, and surface area A~,
respectively [7].
The hydrogels (32 mgl, which contain 28 mg water and 4 mg Si0 2, are brought in an
aluminum sample cup. Subsequently, the heat-flux of freezing of water and, subsequently,
of fusion of ice is measured as a function of the temperature with a Netzsch DSC model
43 measuring cell attached to 200 data station. The following measuring sequence is
applied: (1) a cooling step from 293 to 213 K at a rate of -2 K/min, (2) a heating step
from 213 to 268 K at a rate of 1 K/min, measuring the fusion peak of pore ice, (3) a
cooling step from 268 to 213 K at a rate of -1 K/min, measuring the solidification peak of pore water, and, finally, (4) a heating step from 213 to 293 K at a rate of 1 K/min,
measuring both pore and bulk ice.
Xerogels characterized with thermoporometry, TEM, Hg-penetration, and
BET surface area
An amount of 14 mg of the xerogel is added to 37 mg water and examined with
thermoporometry. For TEM investigation, the gels prepared at a pHsp of 4 to 10 are
filtrated on a BOchner funnel, washed twice with demineralized water, and dried at 393 K.
The gels prepared at a pHsp of 1 and 2 are washed, filtrated and dried after two days of
gelling. A suspension of the dried gels in ethanol is prepared by ultrasonic treatment. A
droplet of the suspension is brought upon a holey carbon film applied on a copper
specimen grid and examined within a Philips EM 420 transmission electron microscope
(TEM), operated at 100 kV.
Hg penetration is measured on 0.1 to 1.0 g of the samples in a Porosimeter 2000 (Carlo
Erba) with a dilatometer volume of 16 ml. Hg (density 13.5 g/ml) is intruded into the
sample with a maximum pressure of 2000 hPa.
N2 is sorbed by about 0.25 g of the dried samples at 77 K within a Sorptomatic 1800
equipment (Carlo Erba). The sample is outgassed for 6 h at 473 K in vacuum before
measuring the BET surface area and the pore volume from the sorption isotherm [81.

115 Shrinkage of pH-static Prepared Silica Gels
Sears titration of the xerogels
The specific surface area of the xerogels is measured by titration of the surface silanols
with a concentrated sodium hydroxide solution [9]. The number of surface silanols per unit
surface area is assumed to be a function of the drying and calcination temperature, and
not of the particle diameter in the gel. A constant ion strength during the titration is
achieved by addition of extra NaCI. The silica solubility at high pH is decreased by the
addition of NaCI. The titration is therefore suitable up to high pH levels of about 12 [101.
The titration is performed under N2 atmosphere to avoid interference of carbondioxide.
An amount of 1.5 g of the dried silica gels is introduced into 150 ml 3 M NaCI. The well
stirred suspension is brought at a pH of 2 with a few drops of 2 M HCI. An amount of
0.5 ml 0.112 M NaOH solution is stepwise added until a pH of 4 is reached.
Subsequently, the suspension is titrated from the pH of 4 to the pH of 9. The amount of
NaOH needed for titration of fumed silica (Aerosil 380. 376 m 2/g: Aerosil 200, 186 m2 /g: Aerosil OX50, 43 m 2/g) is given by Eqn. 7.
A. = 31.1 * V - 41.9 (7)
where A. is the specific surface area (m2 /g), V the volume of added 0.112 M NaOH solution (ml). With Eqn. 7, the specific surface areas of the group gels prepared under pH
static conditions is determined. From the slope of Eqn. 7 it follows that 1.44 silanol groups
per unit area (nm2) are ionized at a pH of 9 (Eqn. 8), which represents 41 % of the 3.5 nm'2 silanol groups ionized at a pH of 12 [10,11].
(8)
where NOH the number ionized surface silanols at a pH of 9 (nm·2 ).

116 Chapter 6
RESULTS AND DISCUSSION
The initial sodium silicate solution
-Composition
The 29Si NMR spectrum of the 1.37 M Si, 0.98 M Na solution of pH 11.3 is recorded in
Fig. 3. The 29Si-NMR spectrum demonstrates the chemical shift of the monomer QO at
-73.9 ppm, the dimer Q~, and the linear trimer (Q1Qn at -82.15 ppm, the chain middle
group Q~ at -90.45 ppm, the branched polymer Q~ at -99.16 ppm, and the tetrahedrally
coordinated Si Q4 at -107.97 ppm (Tab. 1). The ratio of the signal surface integrals QO :
Q1 : Q2 : Q3 : Q4 is 0.3 ; 3.2: 27.4: 42.8 : 26.3. Only a small amount of silica appears
to be present as monomer Q~, which is 4.1 * 10.3 M or 247 mg Si02/1.
Particles of a size of 2 nm are present in the initial sodium silicate solution (11) ; the
particles may control the sol particle size in the gels formed at low pH,p of 1 and 2. The
29Si signal at -107.97 ppm is partly attributed to the particles of 2 nm. The equilibrium
silica solubility of the 2 nm particles is calculated with Eqn. 9 (12) :
Log (S/So) = 4y*Vm/(2.303 * R*T*d) = 0.86/d (9)
where S is the silica solubility of the particle (mg/I), So the silica solubility at a plane
surface area of an infinitely large particle, which amounts to 115 mg Si0 2/1 [13,14], vthe
interfacial energy of 0.045 N/m, Vm the molar volume of 2.73*10.5 m3/mole, R the
gasconstant. 8.3 J *mole" *K", T the temperature of 298 K, and d the diameter (in nm).
According to Eqn. 9, the equilibrium solubility of the 2 nm particles is only 310 mg
Si02/1, which is close to the amount of monomer calculated from the Q~ peak, which is 247 mg Si02/1. It will appear that the size of the silica particles present in the gels formed
at low pH levels of 1 and 2 are of the same order of magnitude as that of the nuclei in the
sodium silicate solution [15], viz., 2 to 3 nm.
Small oligomers of a size less than the diameter 2 nm of the silica sol particles are also
present in the initial sodium silicate solution. Svensson et al. (6) and Hoebel et al. [16,17)
have shown that cage-like polysilicate species dominate in sodium silicate solutions at
molar ratios Si02/Na20 ?: 3.3, and in tetra methyl ammonium silicate solutions (TMAnSi)
at high SilTMA ratios. The distribution of Si over the different polysilicate species has been
calculated in ref. (6) with the known ionization constants Po,", where the Q' peak is
assigned to the dimer (n = 2), representing a mole fraction Si of a = 0.05 of the polysilicate species, Q2 assigned to the (cyclic) tetramer (18) (n =4, a=0.24), Q3 to the (cyclic)
octamer (n=8, a=0.39), and Q4 partly to structured oligomers (n =32, a=0.19) and partly to the amorphous sol particles of 2 to 3 nm (a=0.13).

117 Shrinkage of pH-static Prepared Silica Gels
Q~ + Q~Q~
0 2 0 3 0 4O~ ~ n n n
::2 0)0
a.. a.. ~
l"- I" Ll'l Ll'l CD 0) '=t ~ -=I: ,....: 0N 0 0 ~
~O? ~ $ ~
, I I' Ii' I '" I I ii' I I' i' i I' i I I iii' I I ii' I Ii' I I I' i 'i j I I I I I '" I Ii" 'I o -10 -20 -30 -40 -50 -60 -70 -80 -90 -100 -110 -120
PPM
Figure 3 A 29Si-NMR spectrum of the sodium silicate solution with a molar ratio SiO/Na20 of 3.5/1 and a pH of 11.3. The concentration Si is equal to that of the prepared
gels, which is 1.37 M Si.
-Charge on the polysilicate species
The average negative charge per Si on the monomer and oligomers, q(total), in the
sodium silicate solution used is calculated from the relation:
[Na+]- [OH'] + q(tota/) * [Siq ] = 0 (10)
Eqn. 10 leads with the dissociation constant of water k,. = -13.7 to a q(tota/) of -0.7 in a
0.98 M Na solution [6]. The average negative charge per Si on the monomer q(mono) is
calculated from the relation of Eqn. 11 and from the known ionization constants of MSA,
Pl,l = 3.5*10'10 mole/dm 3 and P2.1 = 8.9*10'23 mole 2/dm 6 , in the 0.98 M Na+ solution
[6,19].
q(mono)

118 Chapter 6
-------------= -1.03 (11)
A small fraction of the monomer is thus doubly ionized. Finally, the average charge per Si
on the polymeric particles, q(polyl. is calculated with Eqn. 12 :
q(poly) *([Sil-[Q~I) + [Q~I *q(mono) lSi] *q(total) (12)
The q(poly) in our sodium silicate solution obtained from Eqn. 12 is -0.7, and hence equal
to the q(total) calculated with Eqn. 10, due to the small amount of monomer present in
the sodium silicate solution.
-Polymerization from monomers to silica sol particles.
The first step in silicic acid polymerization is the formation of a dimer Q~, which is
confirmed with 29Si NMR [21 :
Q~ + OH' --> (Qn- + H2O (13)
(Q~)" + QO1 --> (Q~)- + H2O (14)
(Q~)" + H20 --> Q~ + OH- (15)
+ Qf + Q~ -- > Q~ + H2O (16)
where Q~ is the monomer, and (Q~)- the ionized monomer. The ionization constant of the
weak monosilicic acid Q01 is 9.8 [20]. Monosilicic acid is ionized for 50 % at a pH of 9.8. The polymerization rate is large when the concentration of (Q~)" and Q~ are reasonably
high in the pH range 8 to 9 [20]. The equilibrium constant of reaction of Eqn. 16 : Q~ /
(Qn 2 is 10 mole· 1dm3 [21. The formation of a linear trimer (Q~Q1) is simultaneously with
that of the dimer Q~ [51 :
Q~ + Q~ --> (Q~Q1) --> Q~c --> Q~c --> Q~ (17)
The concentrations of the dimer and of the linear trimer decrease both with formation
of the cyclic trimer Q~c' the formation of which is immediately followed by that of the

119 Shrinkage of pH-static Prepared Silica Gels
multisilicate ring structures Q~c and the branched structures Q~ with the double square sring silicate Sis0 2o , [5,161. The polymerization is described by the general Eqn. 18 :
(18)
where n is the number of Si nuclei, c the number of ring closures, and q the negative
charge on the polysilicate anion. The ionization constant P.o,n of the polymeric species is
expressed by :
(19)P·o,n
The activation energy of polymerization is 61.1 kJ/mole [21 J. At the low pH level of 2 the
polymerization rate is second order in the monomer concentration (Eqn. 16) and first order in [OH'] (Eqn. 13). At the high pH level of 7.2 the rate is first order in the monomer,
because the monomer is deposited on the surface of fast growing sol particles [211.
Large clusters of silica are formed in the final stages of the polymerization of silica. The
final stages comprise the particle growth and the gelling the sol. An increase of the particle
or cluster size is measured by an increase of the turbidity [14,20-241. We have determined
the size of the silica sol primaries and clusters after drying with transmission electron
microscopy (TEM).
Transmission electron microscopy (TEM)
Representative electronmicrographs of the xerogels obtained after drying of hydrogels
prepared at different pH levels are represented in Fig. 4a to 4g. The micrographs of the
xerogels show that the primary sol particle size strongly depends on the pHsp It can be
seen in Fig. 4a that the diameter of the sol particles produced at a low pHsp of 1 or 2 is
only 2 to 3 nm. Apparently the solubility of silica at pH levels of 1 to 2 is small, which
results in stable silica particles of a very small size. Above a pH level of 2 the size of the
elementary silica particles increases; sol particles of a size of 5 to 8 nm result on
preparation of the hydrogel at a pHsp of 4 and 5. Xerogels obtained from hydrogels
prepared at a pHsp level of 9 contain large particles, exhibiting a plate-like shape and less
branched than the particles present in xerogels from hydrogels prepared at lower pHsp
levels. The size of the elementary particles is no less than 21 to 26 nm.

120 Chapter 6
pH= 1
pH=2
Figure 4 TEM images of silica gels, prepared at different static pH levels, (a) pH = 1, magnification to the film 54000 times, (b) pH=2, 32000 times.

121 Shrinkage of pH-static Prepared Silica Gels
pH=4
pH=5
Figure 4 (continued) (c) pH=4, 54000 times to the film, (d) pH=5, 54000 times.
D

122 Chapter 6
pH=8
pH=9
Figure 4 (continued) (e) pH=8, 18000 times to the film, (t) pH=9, 54000 times.

123 Shrinkage of pH-static Prepared Silica Gels
pH= 10
Figure 4 (continued) (g) pH=lO, 32000 times to the film.
The electronmicrographs thus show that at pH levels around the IEP the size of the
elementary silica particles strongly changes; at higher pH levels much larger silica particles
result. At still higher pH levels, where the solubility of the silica is much higher, the size,
the shape and the aggregation of the elementary particles is much different from that at
lower pH levels. It is interesting to investigate the effects of the size and aggregation of
the elementary particles on the pore radii, pore volumes, and surface areas of hydrogels
and xerogels.
Thermoporometry of hydrogels and xerogels
The thermoporometric data measured for the hydrogels and the xerogels are summarized
in Tab. 3. The ice crystal radius, Rn, the ice volume, Vn' the shape factor, F, and the ice
surface area, An' are indicated, as well as the characteristic properties corrected for the
non-freezing layer of water of 0.9 nm, viz., the pore radius, Rp, the pore volume, Vn*, and
the surface area, An *.
In the hydrogel samples prepared at a pH,p of 1 and 2, small ice nuclei of a radius of
2.2 nm are formed, which points to pore radii of 3.1 nm (2.2 +0.9 nm) after correction for

124 Chapter 6
the non-freezing layer. The size of the pores in the hydrogels, viz., about 6 nm, is hence
considerably larger than that of the particles, viz., 2 to 3 nm. When the hydrogels prepared
at a pH,p of 1 and 2 are dried, the resulting xerogels exhibit very narrow pores. The pores
within the xerogels are too small to allow the formation of ice crystallites to proceed.
Apparently the structure of the hydrogel containing silica particles of 2 to 3 nm is highly
liable to a strong compression upon drying, which points to a limited number of chemical
bonds between the silica particles. The compression of the elementary silica particles
during drying to the xerogel is evident from the fairly small pore volume of 0.2 ml/g before
correction. The surface areas of the hydrogels are relatively small, viz., about 280 m 2/g.
Table 3 Thermoporometric characterization of pH-static prepared silica hydrogel (28 mg
water and 4 mg Si02) and xerogel (37 mg water and 14 mg Si02), where Rn is
the ice crystal radius in nm, Vn the pore volume in mllgSi0 2 , An the ice crystal
surface area in m2/gSi0 2 , and V~ and A~ the corrected pore volumes and the
calculated surface areas of the gels, respectively.
Rn Rp Vn V~ F An A~
(nm) (nm) (ml/g) (ml/g) (m 2/g) (m 2/g)
hydrogel
1 2.2 3.1 0.2 0.4 1.8 192 272
2 2.2 3.1 0.2 0.4 1.7 198 281
4-10 '
xerogel 1-2 2
4 1.9 2.8 0.3 0.8 1.4 383 694
5 5.9 6.8 0.7 0.9 2.1 232 258
8-10 1
1) shoulder on bulk water peak at 273 K, 2) no pore water detected
The hydrogels prepared at a pH,p of 4 to 10 have large pores, which causes the peak
due to freezing of water present within the pores to appear in the thermogram as shoulders
of the peak due to bulk water at 273 K, because the dTs and dTf are very small (Eqn.3l.
Apparently the larger particles of diameters of 5 to 26 nm present in the hydrogels enclose
much larger pores, which indicates a much more open gel structure. The xerogel resulting
from drying of the hydrogel prepared at a pHsp of 4, which contains elementary silica
particles of 5 to 8 nm, exhibits a pore radius of 2.8 nm, which corresponds to pores of a
dimension of about 6 nm. Hence drying of the hydrogel leads to a close packing of the
elementary silica particles. The xerogel obtained by drying the hydrogel prepared at a pHsp

125 Shrinkage of pH-static Prepared Silica Gels
of 5, however, displays a pore radius, which is substantially larger, viz., 6.8 nm. The larger
pore radius indicates that at a pH,p of 5 a much more stiff gel structure results, which shrinks much less on drying. Apparently at a pH of 5 reaction of hydroxyl groups on
neighbouring silica particles proceeds more extensively leading to a more stiff structure.
The different structures of the xerogels obtained from hydrogels prepared at pH,p of 4 and 5 is also evident from the shape factors, which are 1.4 and 2.1, respectively. A higher
pH,p apparently leads to more cylindrical pores.
The change in structure of the xerogel when the pH,p at which the hydrogel is prepared
is raised from 4 to 5, is also evident from the pore volume. Before correction of the non
freezing layer the pore volume of the xerogel obtained on drying the hydrogel prepared at
a pH,p of 4 is 0.3 mllg, while for the xerogel from the hydrogel prepared at a pH,p of 5 the
pore volume before correction is 0.7. Since the correction for the non-freezing layer of 0.9
nm is relatively large with the small pore radius of 1.9 nm measured for the xerogel
obtained from the hydrogel prepared at a pH,p of 4, the corrected pore volume and the surface area are fairly large, viz., 0.8 ml/g and 694 m 2/g, respectively. The xerogel from
the hydrogel prepared at pH,p of 5 exhibiting a significantly higher pore volume of 0.7 ml/g
again points to a more stiff gel structure. The surface area before correction of the nonfreezing layer is lower with the xerogel from the hydrogel prepared at pH,p of 5 than of
that from the hydrogel prepared at pH,p of 4, viz., 232 and 383 m 2/g, respectively. Nevertheless the surface areas of the gels resulting from drying hydrogels prepared at pH,p
level of 4 and 5 are higher than the surface areas of the hydrogels prepared at pH,p of 1 and 2. The surface areas therefore again indicate a higher extent of reaction between the
elementary silica particles at higher pH levels.
With the hydrogels prepared at pH,p levels of 8 to 10, the linking of the larger silica
particles is that strong that also after drying fairly large pores remain. As a result freezing of the water within the large pores is evident only as a shoulder on the peak of bulk water
situated at 273.15 K. From the thermograms therefore no pore radii and pore volumes can be derived.
Surface area measurements
The specific surface areas of the gels as obtained by different experimental techniques will be compared in this section. In Tab. 4 the surface area from the transmission
electronmicrographs (TEM) is calculated from the particle size observed in the micrographs
according to the relation:
A, 6/(D *d) 2727/d (20)
where A, is the specific surface area (in m2/gj, D the density of silica, which is

126 Chapter 6
2.2 * 10 6 g/m3 , and d the diameter of the elementary particles (nm). The surface area from
the adsorption of N2 is calculated according to the BET equation, and that from the Hg
penetration from the pore radius and pore volume distribution. The calculation of the
results of the Sears titration has been dealt with above.
Table 4 Particle size of sol particles or small sol aggregates in the silica gels measured
with TEM and the reconstructed surface area if the particles where isolated in
the solution.
sol diameter d(nm)
1
2 4
5 8
9 10
2-3
2-3
5-8
5-8
16-21
21-26 21-26
1364-909
1364-909
545-341 545-341
170-130
130-105 130-105
1) A s=6/(D*d)=2727/d, with the density D of Si0 2
The surface areas obtained by the different techniques show the largest differences for
the gels prepared at pHsp levels of 1 and 2 in Fig. 5. The particle size observed in the electronmicroscope suggests a surface area of no less than 1100 m 2/g. Hg penetration
results in surface areas of only 10 m 2 /g, and the Sears titration to 62 and 21 m 2/g for
xerogels obtained from hydrogels prepared at pH sp levels of 1 and 2, respectively. It is
interesting that thermoporometry on the hydrogels and N2 adsorption on the xerogels lead
to about an equal surface area. Thermoporometry shows surface areas of about 280 m 2/g,
and N2 adsorption of about 250 and 200 m 2 /g. It is evident that the small elementary silica
particles enclose very narrow pores into which Hg can hardly penetrate. Also the hydroxyl
ions used in the Sears titration cannot enter readily all the narrow pores of the xerogel. lIer
[131 showed that the BET surface area of the linked particles, As(BET). can be related to
the surface area of isolated particles calculated from the dimensions determined with TEM,
As(TEM), by Eqn. 21.
As(BET) = As(TEM) * (1- n *0. 177 * (d + O. 177)/d 2) (21)
where n is the coordination number of the sol particles, and 0.177 nm the radius of the
of the N2 molecule. According to the relation of Eqn. 21 with As(BET)-=225 m 2/g, and

127 Shrinkage of pH-static Prepared Silica Gels
A,ITEM) "" 1100 m 2/g, a coordination number n of 10 to 11 is derived for the particles
with a diameter d of 2 to 3 nm prepared at a low pH.p of 1 and 2. A hexagonal close packing would yield the vale n of 12.
1200
1100
1000
900
800
~ 700Eo; ~ <Il 600 CD U III 'l: 500:> III
400
300
200
100
0
¢ TEM particle size
[J BET surface area
o sears titration
t. Hg-penetraiion
• Thermoporometry hydrogel
• Thermoporometry xerogel
2 4 8 10 120
pHsp
Figure 5 The surface area of the silica gels as function of the static preparation pH, obtained from TEM images (diamonds), thermoporometry of hydrogel (black spheres), thermoporometry of xerogel (black squares), N2 adsorption at 77 K (open squares), Sears titration (open spheres), and Hg penetration (triangles).
When the pH,p at which the hydrogel is prepared is increased from 4 to 5.
thermoporometry of xerogel indicates a sharp increase in the pore radius and pore volume
(Tab. 3). With N2 adsorption and Hg intrusion the same sharp change is apparent. The BET
surface area drops from about 630 m2 /g to about 300 m 2/g, whereas the surface area
calculated from the intrusion of Hg rises from about 10 to about 250 m2 /g. It is remarkable that the surface area calculated from the Hg intrusion is about equal to that measured by
thermoporometry. viz., about 258 m 2 /g. The surface area measured according to the Sears titration, viz., about 200 m 2 /g, is not much different from the values resulting from the

128 Chapter 6
other techniques. In view of the accuracy of the assessment of the particle size in the
electronmicroscope, the agreement with the surface area calculated from the particle size
is very satisfactory.
The xerogels having fairly wide pores obtained on drying hydrogels prepared at pHsp
levels above 5 show surface areas from N2 adsorption, Hg penetration, and
electronmicroscopy that agree very well. The Sears titration exhibits a surface area that
is consistently a factor of two higher than the surface area determined by the other techniques, except for the xerogel resulting from drying the hydrogel prepared at pHsp of
6. The last xerogel displays a surface area by the BET procedure, the Sears titration, and
the Hg penetration of 191, 187, and 131 m2/g, respectively.
3.0
0 N2 adsorption
0 1/0 - 1/2.2
A Hg-penetration 2.5 • H20 hydrogel
• H20 xerogel
_ 2.0 !1! :§. <P E ::l
g 1.5
& 0 a. 0
'8 8en 1.0
0 0
0 0.5
0
0.0 2 4 6 8 10 12
pHsp
Figure 6 The specific pore volume of the silica gels as function of the static preparation pH, obtained from thermoporometry of hydrogel (black spheres), thermoporometry of xerogel (black squares), N2 adsorption at 77 K (open squares), and Hg penetration, by measuring (i) the amount penetrated Hg at high pressure (open spheres), and (ii) the bulk density of the samples at atmospheric pressure (open triangles) .

129 Shrinkage of pH-static Prepared Silica Gels
Pore volume measurements
The pore volumes are calculated from measurement of the Hg penetration, N2 sorption
at 77 K, and thermoporometry. The pore volume is calculated in two different ways, viz.,
from (i) the amount of Hg penetrated, and (ii) the bulk density of the sample with Hg in the
measuring cell. The reciprocal true density of silica, 2.2 g/ml, is subtracted from the
reciprocal bulk density Db of the xerogel according to Eqn. 22.
1/Db -1/2.2 (ml/g) (22)
where Vp is the pore volume in ml/g. The results are represented in Fig. 6. The plot of the pore volume exhibits a discontinuity
with xerogels from hydrogels prepared at a pHsp level above 4. The pore volumes of
hydrogels and xerogels prepared at pHsp levels below 4 are lower than 0.4 ml/g, in
accordance with results in ref. [19]. The very low pore volumes are at the same order of
magnitude of a hexagonal close packing of sol particles, (3.../2-TT)/2.2TT = 0.16 ml/g, or
cubic close packing, (1-TT/6)/2.2 = 0.22 ml/g. With preparation at pHsp levels above 4 the
pore volume steeply rises to a level of about 0.8 ml/g and slowly drops at pHsp levels
above about 8.
The pore volume of the hydrogel prepared at pHsp 1 and 2 determined by
thermoporometry is higher than that measured by N2 adsorption and Hg penetration. In
spite of the limited penetration of Hg into xerogels from hydrogels prepared at pH,p levels of 1 and 2, the pore volume is about equal to the to that calculated from the sorption of
N2 •
When the pHsp during preparation is increased to 4, the pore volume of the xerogels
measured by thermoporometry becomes 0.8 to 0.9 ml/g, and the pore volume measured
by Hg intrusion and N2 sorption to about 0.7 ml/g. At still higher levels of pH sp during the
preparation, the pore volume as measured by Hg penetration increases sharply to about
2.3 ml/g, whereas the N2 pore volume passes through a faint maximum at a pHsp of about
8. The maximum is at a pore volume of about 0.8 ml/g. The pore volumes of N2 sorption
and thermoporometry at high pHsp of 5 to 10 are far below the pore volumes determined
by Hg penetration (Fig. 6).
The shape of the pore volume against pHsp plot determined by Hg penetration
experiments is the same of that in ref. [11. Though the shape is equal, the maximal pore
volume in our plot of 2.8 ml/g is a factor 3.5 higher that the maximal pore volume in
ref. [1 L viz., 0.8 ml/g. The difference might be explained by the differences in the
preparation conditions. Our hydrogels are prepared slowly over a period of 21 to 23 h,
whereas the gels in ref. [11 are prepared by rapidly mixing of sodium silicate and acid. The slow preparation shows a larger effect of the pH on the resulting pore structure.
It is interesting that the differences in the surface area and the pore volume of the

130 Chapter 6
xerogels obtained by drying hydrogels can be attributed to the particle growth and gelling
kinetics, as controlled by the pH. Low rates of silica polymerization are observed at low
pH levels below the IEP of silica [21]. The activation energy of particle growth at the IEP
of 3 attains the relatively high value of 77.4 kJ/mole, as compared to a minimum of
65.3 kJ/mole at a pH of 4.3 in ref. [251, while 63.2 kJ/mole is measured at a pH of 4 in
ref. [21]. Relatively low values of the activation energy, ranging from 57.6 kJ/mole at
pH 3.5 to 30 kJ/mole at pH 4.5, are calculated from viscosity measurements in ref. [26].
Turbidity experiments have shown that the increase in molecular weight of the sol particles
or clusters can be described by Eqn. 23 of Coudurier et al. [21] at medium pH levels of 4
to 5, and by Eqn. 24 of Greenberg and Sinclair [20] at high pH levels of 8 to 10.5 :
Ln Mw(t)/Mw(to) = k, * (t-to) (23)
(24)
where the molecular weight at time t, Mw(t), is a function of the turbidity, r(t), by :
r(t) = 0 Jn [Ml * 1(9,t)1I" * 2rrR 2 *sin9d9 = A * Mw(t) (m-') (25)
where [Ml is the concentration of sol particles (in m-3 ), 1(9,t)/lo the ratio of the intensity of
the scattered light of a single particle at the angle 9 and the time, 1, no the refractive index
of water of 1.336, dn/dc (in m 3 /g) the increment of the refractive index with increasing
weight concentration silica, c, A the monochromatic wavelength (in nm), N.v Avogadro's
number (in mole-'). The turbidity with especially large sol particles or clusters is corrected
for the dissymmetry with a Zimm-equation [20,22,27].
The agglomeration rate of the sol particles to large clusters clearly decreases from a fast
exponential rate at the medium pH level of 4 to 5 (Eqn. 23) to a less rapid power rate
function at high pH levels of 8 to 10.5 (Eqn. 24). It has been demonstrated that the rate
of agglomeration of sol particles into large clusters increases until a pH of 6. Subsequently,
above a pH of 6, the rate decreases, while the deposition of MSA on the sol particles still
proceeds [21]. It is probably the reason why the pore volume measured by Hg penetration
and N2 sorption weakly declines above the pH level of 6. The large sol particles at high pH
are less branched at high pH levels and suffer more from the capillary forces with drying.

131 Shrinkage of pH-static Prepared Silica Gels
CONCLUSIONS
1) Shrinkage during drying of hydrogels to xerogels can readily be monitored by
thermoporometry. If thermoporometry is applied on the pH-statically prepared hydrogels,
only those prepared at a low pHsp of 1 and 2 lead to Rp= 3.1 nm, V~ =0.4 ml/g, and
A~ = 272-281 m 2 /g. The hydrogels prepared above a pH,p of 4 cannot be measured,
because their macroporosity is too high. As a consequence of shrinkage, thermoporometry
cannot be applied to the xerogels prepared at pH,p of 1 and 2. During drying, the pores
become too small to allow the formation of ice-nuclei. Thermoporometry can be applied
to xerogels from hydrogels prepared at a pHsp of 4 and 5, because of their decreased pore
size and high pore volume. Thermoporometry is again not appropriate for xerogels from
hydrogels prepared above a pH,p of 5. The increased pore size and pore volume causes the
formation of ice-nuclei just below 273 K, even after drying.
2) An elementary particle size increasing from 2-3 nm of silica gels prepared at a static
pHsp of 1 and 2, through 5-8 nm at pH,p 5, to 21-26 nm at a pHsp of 10 is very well
illustrated by TEM. Consequently, the corresponding surface areas decrease from
1364-909 m2 /g at a PH,p of 1 and 2, through 545-341 m 2 /g at a pH,p 5, to 130-105 m 2/g at a pHsp of 10.
3) Pore volumes between 0.13 and 0.6 m2/g obtained by Hg penetration show that very
microporous xerogels are produced at a low static pH,p below 4. Due to the fine
microporosity, Hg and hydroxyl ions can hardly reach the surface area of the primary sol
particles, and consequently too low surface areas are measured as compared to
thermoporometry and N2 sorption.
4) Surface areas of about 200 m 2 /g measured by thermoporometry on hydrogels and by
N2 adsorption on xerogels are higher than those measured by Hg penetration and Sears
titration on xerogels and obviously smaller than the TEM data of 1364 to 909 m2/g. The
discrepancy between thermoporometry and N2 adsorption, on the one, and TEM, on the
other hand, are presumably caused by the very close packing and the branching of the
particles and the annular crevices at necks, where ice and N2 cannot penetrate.

132
REFERENCES
1. Physical and Chemical Aspects of Adsorbents and Catalysts, Ed. B.G. Linsen,
Academic Press, London (1970), 213-262
2. R.H. Meinhold, H.P. Rothbaum, R.H. Newman, J. Col/. Interf. Sci., 108 (1985)
234-236
3. G. Engelhardt, H. Jancke, D. Hoebbel, W. Wieker, Z. Chern., 14 (1974) 109-110
4. G. Engelhardt, D. Zeigan, H. Jancke, D. Hoebbel, W. Wieker, Z. Anorg. AI/g.
Chern., 418 (1975) 17-28
5. P.W.J.G. Wijnen, T.P.M. Beelen, J.W. de Haan, C.P.J. Rummens, L.J.M. van de
Ven, R.A van Santen, J. Non-Cryst. Sol., 109 (1989) 85-94
6. J.L. Svensson, S. Sjoberg, and L-O Ohman, J. Chern. Soc., Faraday Trans., (1)
(1986) 3635-3646
7. J.F. Quinson, M. Astier, M. Brun, Applied Catalysis, 30 (1987) 123-130
8. S. Lowell, and J. E. Shields, Powder Surface Area and Porosity 2nd Ed., Chapman
and Hall, London (1984). 1-135
9. G.W. Sears, Anal. Chern., 28 (1956) 1981-1983 10 W.M. Heston, R.K. lIer, G.W. Sears, J. Phys. Chern., 64 (1960) 147-150
11. J-E.A. Otterstedt, M. Ghuzel, J.P. Sterte, J. Col/. Interf. Sci., 115 (1987) 95
12. G.B. Alexander, J. Phys. Chern., 61 (1957) 1563-1564
13. R.K. lIer, The Chemistry of Silica, John Wiley and Sons N.Y. (1979)
14. E.D. Shchunkin, V.V. Yaminsky, Col/aids and Surfaces, 32 (1988) 19-32
15. H. Ballacioglu, and D. Balkose, Col/aid Polyrn. Sci., 267 (1989) 460-464
16. D. Hoebbel, P. Starke, A. Vargha, Z. Anorg. AI/g. Chern., 530 (1985) 135-143
17. D. Hoebbel, R. Ebert, W. Wieker, E. Assmann, and H. Mende, Z. Anorg. AI/g. Chern., 558 (1988) 171-188
18. L.S. Dent Glasser, and C.K. Lee, J. Appl. Chern. Biotechnol., 21 (1971) 127-133
19. N. Ingri, Acta Chernica Scandinavica, 13 (1959) 758-775
20. S.A. Greenberg, D. Sinclair. J. Phys. Chern., 59 (1955) 435-440
21. M. Coudurier, B. Baudru, J-B. Donnet, Bul/. Soc. Chirn. de France, 9 (1971)
3147-3165
22. A. Audsley, and J. Aveston, J. Chern. Soc., 6 (1962) 2320-2329
23. S.P. Moulik, B.N. Gosh, and S. Bandyopadhyay, J. Indian. Chern. Soc.. 40 (1963)
607-614
24. T.M. Karnaukhova, N.K. Ivanov, M.S. Zaharov, Col/. J. USSR, 48 (1986), Russ.
686-691, Eng!. Trans!. 580-584
25. H. Stade, and W. Wieker, Z. Anorg. AI/g. Chern., 384 (1971) 53-66
26. W. Vogelsberger, J. Opfermann, U. Wank, H. Schulze, and G. Rudakoff, J. Non
Crystal. Sol., 145 (1992) 20-24
133
Chapter 7
The effect of drying on the pore dimensions of electro
dialysed silica sol gels *
M.K. TituJaer, M.J. den Exter', H. Talsma2, J.B.H. Jansen, and J.W. Geus'
Department of Geochemistry, Institute for Earth Sciences, University of Utrecht.
Budapestlaan 4, P.O. Box 80.021, 3508 TA Utrecht. The Netherlands.
'Department of Inorganic Chemistry, University of Utrecht, Sorbonnelaan 16, P.O. Box
80.082, 3508 TB Utrecht. The Netherlands.
2Department of Pharmaceutics, University of Utrecht, Sorbonnelaan 16, P.O. Box
80.083, 3508 TB Utrecht, The Netherlands.
*This paper is a contribution of the Debye Institute, University of Utrecht, The
Netherlands.
ABSTRACT
Electrodialysed silica sol-gels are prepared of a silica concentration of 1.37 M in water.
The shrinkage of the gels with drying is investigated. The silica sol solutions are prepared by removal of sodium ions from a sodium silicate solution through a Nafion membrane. A
uniform sol solution results containing sol particles of 5 nm diameter as measured by
transmission electron microscopy, and 7.3 nm as measured with dynamic light scattering.
The presence of a layer of structural water of about 1 nm on the silica surface is assumed.
The dialysed silica sol particles of a few nm in size are gelled at several pH levels, ranging
from 2.7 to 7.8. The sols display a minimum gelling time of 279 minutes at a pH of 5.9 established by measuring the shear viscosity with time. The gelling time increases below
the pH level of 5.9 due to the low amount of ionized surface silanol groups, and above the
pH level of 5.9 due to electrostatic repulsion between the sol particles.
The hydrogels, which are prepared from the silica sol solutions, have a size of the sol
particles not depending on the gelling pH. The porous structure between the sol particles
of the hydrogels is studied by thermoporometry in water.
Subsequently the gels are dried at 333 and 393 K, and again investigated in water. Air
drying does not lead to shrinkage. The pore structure only depends on the gelling pH. The
ice crystal radius, Rn , measured by thermoporometry, increases from 1.5 to 3.3 nm raising

134 Chapter 7
the pH of gelling from 2.8 to 6.5, while the low ice pore volume increases from 0.15 to
0.4 ml/g Si0 2 • The ice pore volume being increased, but the total pore volume (ice plus a
non-freezing layer) being equal of differently prepared gels point to the formation of short
pores with large radii at high pH levels.
INTRODUCTION
The former chapters are dealing with silica gels prepared by addition of waterglass to
an acid or precipitation by simultaneous addition of an acid and waterglass to a solution
at a constant pH. The resulting silica gels are present in solutions of a high ion strength.
The high ion strength brings about that the clustering of the silica particles proceeds
readily. Especially at low pH levels the silica particles agglomerate without chemical bonds
between the particles being established. Without chemical bonds the agglomerated silica
particles are liable to shrinkage upon drying.
Investigation of silica gels prepared at low ion strength is interesting to study the
formation of chemical bonds between silica particles. Especially the extent of shrinking
during drying may be considerably lower with silica gels produced at low ion strengths.
To prepare clear sodium-free silica sols electrodialysis is a very good procedure. The
preparation of sodium-free colloidal silica solutions has been known from 1930, when
Treadwell and Wieland published a procedure in which a platinum and a dripping mercury
electrode mounted in a waterglass solution were utilized [1). Hydrogen ions are generated
at the platinum anode, while the mercury cathode absorbs the metallic sodium resulting
from the reduction of dissolved sodium ions. Due to the replacement of sodium ions by
hydrogen ions, the pH of the waterglass solution drops, which leads to polymerization of
the silicate anions. In 1972 Iler improved the procedure separating the Pt anode and the
mercury cathode by a cation exchange (NAFION) membrane [2]. The Nafion membrane
(DuPont, F.R.G.) is composed of carbon fluoride chains with sulfonic (S03H) or carboxylic
acid (COOH) side chains. The sulfonic or carboxylic acid groups are ionized and introduce
a negative charge on the membrane. The negative charge causes the membrane to be
impermeable for silicate anions. The membrane is stable within a broad range of pH levels
and temperatures [3]. Using a Pt cathode together with a Nafion membrane we arrived at
a mercury-free procedure for the electrodialysis of silicate solutions.
The silicate solution is present within the anode compartment. Due to the transport of
sodium ions out of the anode compartment, a clear non-gelling silica sol is produced within
the anode compartment and NaOH ends up in the cathode compartment. The
electrodialysis process is monitored by measuring the current as a function of time, the
sodium concentration and the pH in the anode and cathode anode compartment. Since the
transport of the hydrogen ions generated at the Pt anode into the anode compartment
proceeds very rapidly, a very homogeneous solution during the decrease of the pH results.
The electrodialysis therefore can be performed extremely reproducibly.
The amount of the silicate anions present in the solution during the decrease in the pH

135 Drying of electrodialysed Silica Sol-Gels
due to the electrolysis, can be established by measuring the reaction with heptamolybdate
to the intensively yellow coloured silicomolybdate complex. The rate of the reaction to the
silicomolybdate complex depends on the size of the silicate anions; larger silicate anions
react more slowly than monosilicic acid (MSA). The size of the silicate anions therefore can
be assessed by measuring the rate of the reaction to the silicomolybdate complex. The size of the elementary silica particles present in the final sol of a low pH can be
measured by dynamic light scattering (DLS). Also the effect of ageing of the colloidal silica
solution on the size of the elementary silica particles can be assessed using DLS. The
influence of the period of time of ageing and the temperature of the liquid during ageing
on the size of the silica particles can also be studied.
Gelation due to the formation of chemical bonds between the elementary particles is
induced by raising the pH by addition of hydroxyl ions. Ionization of the surface hydroxyl
groups of the silica promotes the formation of chemical bonds between the silica particles
due to condensation of water and formation of siloxane bridges. Ionization of the surface hydroxyl groups, on the other hand, leads to electrostatic repulsion between the negatively
charged elementary silica particles.
The porous structure of the silica gels can be investigated excellently by thermoporometry. Since thermoporometry can be used with the hydrogels, the effect of drying on the porous structure can be reliably investigated by performing thermoporometry before and after drying. With a low ion strength a stiff gel structure and, hence, a small effect of drying on pore dimensions and pore volume can be expected.
To assess the relevance of dynamic light scattering and thermoporometry, it is important to corroborate the results of the above techniques with those of other well established
techniques. The BET surface area and the pore volume calculated from the extent of
nitrogen sorption at 77 K provides information that can be compared with the thermoporometric results. Assuming a small contact area a mean size of the elementary
silica particles can be calculated from the BET surface area. The size of the elementary silica particles in the dried gels can also be determined from electronmicroscopy. Finally the surface area of the dried gels will be estimated by measuring the diffuse reflection Fourier transform infrared absorption due to the surface hydroxyl groups of the silica.
EXPERIMENTAL TECHNIQUES
Electrodialysis
Fig. 1 shows schematically the experimental set up of the electrodialysis. The platinum
anode and cathode are separated by a Nafion type N-324 membrane. Boiling the membrane in water for 30 min swells the membrane as required for the electrodialysis. The
resistance at room temperature of the membrane is 4.5 ohm *cm 2 in 0.6 M KCI according

136 Chapter 7
to the specifications of DuPont. A two liter Na silicate solution is brought into the anode
compartment. The solution is prepared by dilution of 400 ml Merck art. 5621 Na silicate
(6.85 M Si and 3.98 M Na) with 1600 ml of demineralized water. The initial concentration of Si and Na is 1.37 M and 0.78 M, respectively. The cathode compartment contains 2 I
of 0.05 M NaN03 solution, which initially enhances the conductance of the cell. The
solutions in the anode and cathode compartment are vigorously stirred.
A potential of 7 V is put over the cell. Due to the electric field of 82.35 Vim, Na +
migrates through the membrane from the anode to the cathode compartment. The
electrodialysis takes 88 h to be completed.
Silicomolybdate sampling
(Vr----------1, 11----------,
......c--------,8.5 cm---------i.~
ANODE +
1.37 M Si
I 0.78 M Na
ci
I95cm 2
~ffi
==li!=,-==o':e: M NlaN03 ;;ii
I membrane CATHODE-
Figure 1 The electrodialysis cell. The anode and cathode compartment contain both 2 I liquid, and are separated by a Nation N-324 cation exchange membrane. A voltage of 7 V is applied on the cell.

137 Drying of electrodialysed Silica Sol-Gels
Determination of the solubility as silicomolybdate and sampling
The amount of small silicate anions, capable of reaction with heptamolybdate to
intensively yellow silicomolybdate, present within the anode compartment is determined
as a function of the period of time of electrodialysis. Six samples of 2 ml are drawn from
the 1.37 M Si solution during the period of time of 88 h of the electrodialysis. The samples
of 2 ml are diluted 50 times to a concentration of 2.74 * 10-2 M Si. Aliquots of 0.5 ml of
the 2.74*10-2 M Si solutions are added to 25 ml acidified ammonium heptamolybdate
solution, containing 0.07 M MoO~-, 0.15 M NH:, having a pH level of 1.2 [4]. A reaction
of the silicate anions with ammonium heptamolybdate proceeds. The reaction to the yellow
silicomolybdate complex in periods of time between 30 and 480 s is measured within a
Perkin-Elmer Lambda 1 UV-VIS spectrophotometer in a 1 cm cuvette at a wavelength of
410 nm.
Monomer standards of silica (Merck art. 9947), with concentrations of monomer (MSA)
ranging between 0 and 1.14* 10-2 M mono silicic acid (MSA), are measured after two
minutes reaction with the ammonium heptamolybdate. Aliquots of 0.5 ml of the MSA
solutions are added to 25 ml of the heptamolybdate solution.
Sol particles measured by DLS
The technique of dynamic light scattering is appropriate to measure the size of particles
in sol solutions with sizes as small as 1.5 nm [51, which is of the order of magnitude of
the size expected in our silica sol solutions. The sol particles of a silica solution having an concentration of silica equal as the prepared gels, viz., 1.37 M Si, would likely cluster
within a short period of time to particles of a larger size. The rate of clustering of sol
particles is expected to be smaller at low silica concentrations. Therefore, five time diluted
silica sols, of final concentrations of 0.27 M Si are dialysed. The 0.27 Si sodium silicate
solutions are prepared by addition of 80 ml of the sodium silicate solution (Merck Art 5621) to 1920 ml water.
Dust is removed from the dialysed sol by filtration over a Anatop 0.02 and 0.2 Jim
syringe filter (Anotec company, U.K.). The effect of the concentration and ageing of silica
on the particle size as measured by DLS is studied. The dialysed sols are stored under
different conditions, viz., (1) for a period of 10 weeks at 280 K, and for periods of (2) 4.5,
(3) 5.5, and (4) 7.5 weeks at 298 K. Additionally, the silica sol solution (4) stored for a
period of 7.5 weeks at 298 K is diluted by a factor 1.11 to 1.82 to concentrations of silica
decreasing from 0.25 to 0.15 M Si.
The instrument used for almost all measurements is a Malvern 4700 C correlator with
a GLC 5700 He-Ne gas laser (632.8 nm, slit 600, diaphragm 11, with a power output of
25 mW or more applied to silica sols kept at a temperature of 298 K. The fluctuation of

138 Chapter 7
scattered intensity of light is measured at different angles, 35, 45 90, and 125 degree 8.
Two measurements are performed with a Malvern Multibit K 7025 correlator with a
Spectra Physics model 165, 400-600 mW, Ar-Iaser (488.0 nm) applied on silica sol
solutions kept at a temperature of 293 K. The scattering angle of this instrument is 35 and
155 degree 8.
Formation of hydrogel monitored by measurement of the shear viscosity
The gelling time of the dialysed silica sol as a function of the pH is investigated. Aliquots
of 0.11 to 0.33 ml of 1 M NaOH are added to 40 ml of a dialysed silica sol of a
concentration of 1.37 M Si (Tab. 1). The effect of the different pH levels on the rate of the
gelling process is compared. The rate of gelling is measured by the increase of the viscosity with time using a rheometer. The viscosity (Pa * s). expressed as the ratio of the
shear stress (N/m2) and the shear rate (s·'). is measured on a Bohlin DG 24/27 rheometer
with a torque element of 0.278 g *cm. No physical meaning can be derived from the
measured viscosity of the silica sol solutions. The measurement can be used in a relative
way, in the determination of the gelling time, the time where the viscosity has a infinitely
large level.
The initial viscosity of the dialysed sol is measured as the shear stress at a shear rate
between 46 and 92 s·'. Addition of NaOH solution to the dialysed silica sol solutions
causes the viscosity to increase. The increased viscosity with is measured at a constant
shear rate of 463 s·' as a function of time. With increased viscosity less sensitive torque
elements must be used. The torque elements that are used are, 0.278 g *cm at gelling
periods less than 100 minutes, 3.984 g*cm after 100 minutes for the sol with a pH level
of 5.9,6.3, and 5.3. Finally the torque element of 90.25 g*cm is used after 273 minutes
for the silica sol of a pH level of 5.9, after 316 minutes for the silica sol of a pH level of
6.3, and after 432 minutes for the silica sol of a pH level of 5.3, respectively.
Table 1 Silica sols of different pH by addition of NaOH to 40 ml of the dialysed 1.37 M
Si solution.
ml1 M NaOH pH [Na +) * 103 (molel\) lSi) (molel\)
2.7 5.87 1.370
0.109 4.2 8.03 1.37
0.218 5.3 10.18 1.36
0.264 5.9 11.09 1.36 0.330 6.3 12.39 1.36

139 Drying of electrodialysed Silica Sol-Gels
The drying step of hydrogel to xerogel
The hydrogels formed after gelling of the silica sol solutions are subsequently dried.
Usually, the pore radius and pore volume of the hydrogel decrease upon drying. The
capillary force exerted by the water-vapor meniscus travelling through the pore is the main
cause of the shrinkage. The effect of the drying step on the pore radius, pore volume, and
surface area can be monitored by application of thermoporometry on the hydrogel before
and the xerogel after drying.
The change in the pore structure of dialysed hydrogels gelled at various levels of pH are
examined. Fresh hydrogels are gelled at pH levels of 2.8, 4.1, 5.0, and 6.5 (set A-O), and
one hydrogel is gelled at a pH level of 2.7 and stored for a period of 7.5 month at room
temperature (E). Xerogels are formed from hydrogels gelled at pH levels of 2.7 and 6.0 by
drying at a temperature of 333 K (F,G). Xerogels are obtained by drying hydrogels gelled
at the pH levels 2.7, 3.8, 4.0, and 6.0 at 393 K (H-Kl. And finally xerogels are prepared
from hydrogels gelled at pH levels of 2.8, 3.8, 6.0, after 1 month ageing as hydrogel by
drying at the temperature of 393 K (L-N).
Thermoporometry measures the heat-flux involved with freezing of water in the pores
of the hydrogel or xerogel within a Netzsch 43 differential scanning calorimeter (OSe)
connected to a type 200 data station. The ice crystal radius, Rn (nm), within the pores of
the sample, the ice pore volume, vnrl) (ml/g 8i0 2), and the ice surface area, An (m 2/g
Si0 2), is obtained from the heat-flux against the time plot. A second ice pore volume, Vn(2)
(ml/g Si02), is obtained by subtraction of the amount bulk water freezing outside the pores
from the total amount of water. The total amount of water is weighted in the sample
holder. A shape factor, F, is determined by thermoporometry, which is indicative for the pore
shape, and varies between spherical, F=1, and cylindrical, F=2. From the value of Rn,
Vn(l), and the shape factor F, the ice surface area An is calculated. A non-freezing layer
of 0.9 nm between the silica surface and ice, requires a correction of V n( 1) and An to the
real pore volume and surface area, V~ and A~.
The following procedure is applied in thermoporometry : (1) the sample in water is
cooled from a temperature of 293 to 213 K at a rate of -2 K/min measuring the super
cooling peak of pore water within and bulk water outside the sample; (2) the sample is
heated from a temperature of 213 to 270.5 K at a rate of 1 K/min measuring exclusively
the fusion peak of pore ice; (3) the sample is cooling from a temperature of 270.5 to
213 K at a rate of -1 K/min measuring the solidification peak of pore ice, and finally; (4)
a heating step from a temperature of 213 to 293 K at a rate of 1 K/min measuring the
fusion peak of pore and bulk ice separated.
The differential scanning calorimeter is well verified (1) for the relative calorimetric
sensitivity, linear on Hg (234.35 K) and Ga (429.75 K), (2) for the time lag of 22.9 s, and
(3) for the thermal heat resistance (THR) of 0.132 K/mW, which causes the freezing and
thawing peaks to be exactly at the right temperatures.

140 Chapter 7
Sol particles in the xerogels measured by TEM
After the gelling step the silica sol particle size in the xerogels is measured by TEM and
compared with the size of the initial silica sol solutions as determined by DLS. Three,
hydrogels, gelled at pH 4.2, 6.3, and 7.8 (set 0-0) are finely dispersed in ethanol, and a droplet of the fluid is brought upon a holey carbon film and air dried forming a xerogel.
TEM micrographs are recorded within a Philips EM 420 electron microscope with a
magnification to the film of 54000 times for the samples a and P prepared at the pH levels
of 4.2 and 6.3, and at 18000 times for the sample a prepared at the pH level of 7.8. The
primary particle size and branching of the silica sol particles in the gels as a function of pH
is investigated.
Pore structure of xerogels
The internal surface area of the xerogels is measured by nitrogen sorption, which additionally assesses the silica sol particle size and the branching of the particles. The BET surface areas obtained from the adsorption isotherm [6] of the nitrogen adsorption
measurements and determined of five xerogels obtained from hydrogels gelled at the pH levels of 2.8, 3.8. 5.1, 6.0 by drying at the temperature of 393 K (set R-UL and one
sample gelled at the pH level of 5.0 and dried at the low temperature of 333 K (V). Nitrogen is adsorbed on the samples within a Sorptomatic 1800 instrument (Carlo Erba, Italy). The gels are previously evacuated in vacuum for a period of 6 h at a temperature
of 473 K.
The specific surface area of the silica xerogels and the amount of adsorbed water on
equal amounts of the samples is assessed by DRIFTS. The method is based the infrared absorption of the 3747 cm" band of free surface silanol groups relative to the absorption at 4000 cm". The relative absorption at 3747 cm" is determined for samples with known
surface areas. The infrared absorption of xerogels are measured. prepared from electrodialysed
hydrogels gelled at pH levels of 2.7, 4.0, 5.0, and 6.0 (set W-Z) by drying at a
temperature of 393 K, are measured. The xerogels are powdered and measured by
DRIFTS. The gels are dried for a second time at 393 K. shortly before measurement of the
DRIFT spectrum. The DRIFT spectra are recorded in the range of 2500 to 4000 cm" on
a Perkin Elmer FT-1720 equipment in combination with a Spectra-Tech Diffuse Reflectance
Accessory Collector.

141 Drying of electrodialysed Silica Sol-Gels
RESULTS
Electrodialysis
The solid curve in Fig. 2a represents the current through the cell measured during the
electrodialysis. The sodium ion concentrations in the two compartments of the cell, the
resistances of which are connected in series, are determining the overall resistance and,
hence, the current. Initially the sodium ion concentration in the cathode compartment is
only 0.05 M, and that in the anode compartment 0.78 M. During the electrodialysis
sodium ions are transported through the membrane from the anode to the cathode
compartment. Accordingly the current, which is initially 0.36 A, passes through a
maximum of 0.9 A after 30 h of dialysis. The sodium ion concentrations measured in the
anode and cathode compartment as a function of time of electrodialysis are shown in
Fig. 2b. The dashed curve in Fig. 2b represents the sum of the sodium ion concentrations
in the anode and cathode compartment. The consumption of water by reaction to gaseous
H2 and O2 brings about the slight increase in the sum of the sodium concentrations. The
dashed curve in Fig. 2a is the current calculated from the sodium ion concentration in the cathode and anode compartment according to
(A) (1 )
where I is the current (A>. Na. and Nac the sodium concentration in the anode and cathode
compartment (molell), K a chosen constant (39.1 O"cm2mole">' A the membrane area
(95 cm2). 1000 a constant dealing with the conversion of 11 to 1000 cm3
, I the distance
between the electrodes (8.5 cm). and V the potential experienced over the cell. The value
of K is slightly smaller than the value corresponding to the molar conductivity of Na, which
is 50 O"cm 2mole" at infinite dilution [71. The potential difference, V, over the liquid in the cell is calculated from
V=7 -1.23 + 0.06 * (pHa-pHcl (V) (2)
where pH. and pH c are the pH in the anode and cathode compartment.
The resistance of the Nafion N-324 membrane is small as compared to the resistance of the solution. The resistance of the Nafion N-324 membrane is 4.5 O*cm 2 in 0.6 M KCI, which leads to a potential drop over the membrane at the maximum current density of

142
I I
Chapter 7
0.9/95 =0.0095 A/cm2, of about 0.0095 *4.5 =0.04 V, which is negligible as compared
to the potential difference of 7 V applied over the cell.
Figure 2 (a) the current as a function of electrodialysis time, which exhibits an initial current of 0.36 A, and a maximum current of 0.9 A after 30 h dialysis (solid line). The curve is averaged with the empirical function (dashed line). (b) the concentration Na in the anode and cathode compartment with electrodialysis time. The dashed line represents the total amount of Na in the cell.
1.2
1.0
0.8
g 0.6
C ~ ~ <>
0.4
0.2
0.0
1.0
0.9
0.8
~ 0.7 0 .§.
0.6 os z c: 0.50
~ C 0.4
2l 8 0.3
0.2
0.1
0.0
(A) i
~
'1: XPH anode 10.5
i "'\iI I I \ theory
:I \
\i \ /pH anode 9.6 : Iiexperimental \
\ I I \
iI
\\ \!
I '\ I
\~ 71 h1 i II I I I i I i i i i i i i I i
0 10 20 30 40 50 60 70 80 90
electrodialysis time t (h)
(8) Na anode + Na cathode
I---r-----I
iI
Na anode I I
!
!
Na cathode
10 20 30 40 50 60 70 80 90
electrodialysis time t (h)

-----------
----------
----------
143 Drying of electrodialysed Silica Sol-Gels
Fig. 3a shows the pH measured in the anode and cathode compartment during the
electrodialysis. Whereas the pH of the anode department drops gradually from 11.3 to 2.8,
the pH of the cathode department rapidly rises to about 11.6 and subsequently much more
slowly to 13.2. 16,---------------,
(A) pH cathode14
12
10
:a 8
Figure 3
1.6
'a; 15 1.4
.s 0'" 1.2
'"v
~ 1.0 co
~ :g 0.'
g
*0.•
:B 0.4
0 -'" E
i 0.2
0.0
0 10 20 30 40 50 60 70 80 00
electrodialysis lime (h)
1.6
(C) total Si concentratIon 1.4
i 1.2
.s ... 1.0
~ g
0.8
lij " :B 0.• ~ 0 E g 0.4 .;;;
0.2
0.0
'0 20 SO 40 50 60 70 80 00
electrodialysis lime (h)
(B) total Si concentration
_ initial si'~olybdate ~b~lIica _
electrodialysis time
Oh
17.5 h
24 h
42 h 49h
I
00
80
70
60
50
B (Ij40 a>
30
20
'0
0
71h-+ 0 120 240 360 480 600
reaction time ammonlumheptamoJybdate (5)
00
80
70
60
50 B (Ij40 a>
30
20
'0
(a) the development of the pH in
the anode and cathode compartment, decreasing at the
anode from 11.3 to 2.8, and increasing at the cathode from 5.4 to 13.2 after 72 h dialysis.
(b) the development of silicomolybdate solubility as a function
of electrodialysis time. The dashed line represents the total Si
concentration as measured with ICP-AES.
(c) the reaction time needed for
a complete reaction of
silicomolybdate soluble silica
with the acidified ammoniumheptamolybdate
solution. The plateau of
silicomolybdate solubility decreases with increasing
electrodialysis time from 480 s at starting time to 120 s after 71 h dialysis.

144 Chapter 7
The current-versus-time plot of Fig. 2a exhibits small discontinuities at pH levels of 10.6,
9.6, and 2.5 in the anode compartment. The ionization constant of MSA (monosilicic acid) corresponding to a pKz value 9.6 can account readily for the discontinuity at a pH of 9.6,
and that at pH 2.5 can be related to the IEP (iso-electric point) of silica. It is more difficult
to explain the discontinuity at pH 10.6.
Reaction to Silicomolybdate
The amount of small silicate anions (oligomers) is determined from the extent of reaction
within 480 s with an ammonium heptamolybdate solution to the yellow silicomolybdate.
The time required for complete reaction of the small silicate anions with heptamolybdate
to silicomolybdate is determined to be 480 s, as indicated in Fig. 3c. Fig. 3b shows the amount of silicate anions reacting to silicomolybdate within 480 s as a function of the time of the electrodialysis time. It can be seen that the concentration of silicate anions reacting
to silicomolybdate decreases from 0.92 M Si (55 g Si/l), which is 67 mole% of the total amount of silicon, to 0.01 M Si (0.007 mole%) after electrodialysis for 71 h.
The initial amount of rapidly reacting small silicate anions of 0.92 M Si is of the same
order of magnitude as the initial sodium concentration [NaJ. of 0.8 M. The course of the drop in the Na concentration in the anode compartment (Fig. 2b) is analogous to that of
the decrease in the concentration of silica capable of reaction to silicomolybdate (Fig. 3b). The rate of reaction of silicate anions with heptamolybdate depends on the size of the
silicate anions. Smaller silicate anions react much more rapidly. Fig. 3c represents the amount of silicate anions reacting to silicomolybdate as a function of the reaction time with heptamolybdate. Fig. 3c shows that initially a considerable fraction of larger silicate
anions is present, which leads to a gradual increase in the amount of reacting silicate
anions with time. Only after 480 s the amount of silicomolybdate does not increase further. After electrodialysis the final silicomolybdate concentration is lower, and is
established much more rapidly. After electrodialysis for 42 h, e.g., the final concentration
of silicomolybdate is reached already after 120 s. The disappearance of larger, more slowly
reacting silicate anions is thus evident from Fig. 3c.
Mean size of sol particles measured by Dynamic Light Scattering
As dealt with in the experimental section, the size of the silica particles in the colloidal
solutions is measured by DLS (dynamic light scattering). The silica sols are diluted and
aged for either 10 weeks at 280 K or at least 4.5 weeks at 298 K. Before the measurements were carried out, dust was removed by filtration over a filter either having pores of either 200 nm or of 20 nm. ICP-AES is used to establish the fraction of silica

145 Drying of electrodialysed Silica Sol-Gels
passing through the filter of a different pore size. The filter with pores of 0.2 Jim retains
8.5 % of the silica and the filter with pores of 0.02 Jim 17 % of the silica. Provided no
interaction between the colloidal silica particles is present, which leads to larger clusters,
the above data suggest that 83 % of the silica particles is smaller than 20 nm, 8.5 % is
between 20 and 200 nm, and another 8.5 % is larger than 200 nm.
To assess the effect of the scattering angle of the light. measurements on the same sol
aged for 5.5 weeks at 298 K are done at scattering angles of 35, 45, 90, and 125 0 • The
results are summarized in Tab. 2a. At least three independent measurements provide the
mean value and the scatter indicated in Tab. 2. The size of the silica particles varies from
8.8 to 11.8 nm without exhibiting a relation with the scattering angle. The experimental
data thus suggest a reproducibility of 1 to 2 nm.
-rhe effect of filtration through filters having pores of 0.2 and 0.02 Jim has also been
established. Tab. 2b summarizes the experimental data. The results also point to a reproducibility of 1 to 2 nm. In spite of the presence of 8.5 % of particles of a size
between 20 and 200 nm the colloidal silica solution being passed through the filter of 0.2
Jim shows a mean particle size as measured by dynamic light scattering not significantly
larger than that of the sol passed through the 0.02 Jim filter.
The above measurements are carried out within a Malvern 4700C at a wavelength of
632.8 nm equipped with a correlator. To roughly confirm the size of the silica particles,
the same colloidal silica solution aged for 10 weeks at 280 K is also measured within a
Malvern Multibit K 7025 apparatus operating at a wavelength of 488.0 nm. With the Malvern Multibit the reference time has to be determined by visual inspection of the
experimental data. The measurements were done at scattering angles from 35 to 155 0 •
Tab. 2c surveys the experimentally determined particle sizes. The particle size measured
at a wavelength of 632.8 nm is about 7.4 nm and that at a wavelength of 488.0 nm about 5.1 nm, as indicated in Tab. 2c. Since we have not optimized the interval time T with
measurement of the size of 5 nm it is probably less accurate as the value of 7.4 nm. Both
measurements are done at the same value of q of about 1 * 10- 2 nm-1 at scattering angles
of 35 and 45 0 (see appendix). The experimental data indicate that the sol is polydisperse, i.e., contains a particle size distribution. The polydispersity (yO), as dealt with in the
appendix, measured with both equipments is 0.3 and 0.5. We consider the measurements
with the Malvern 4700C with a wavelength of 632.8 nm to be more accurate than the
measurements with the Malvern Multibit with a wavelength of 488.0 nm, where the
interval time has been established less accurately.
The effect of dilution on the mean size of the silica particles present in sols aged for 5.5
and for 7.5 weeks at 298 K is represented in Tab. 2d. The mean size of the silica particles
consistently decreases with dilution of the sol from 9.2 nm at a concentration of 0.27
mole Sill to 6.4 nm at 0.15 mole Sill. Evidently dilution leads to selective dissolution of the
larger silica particles, to dissociation of small clusters of silica particles, or to dissolution
of a fraction of all silica particles.
The DLS measurements on sols aged for 5.5 weeks at 298 K or for 10 weeks at 280 K at scattering angles of 35, 45, 90, 125, and 135 0 represented in Tab. 2e point to a mean
particle size dh of 7.3 ± 0.6 nm after 10 weeks of aging at 280 K.

146 Chapter 7
Table 2 Particle size in the silica sol measured with DLS as a function of the a) scattering angle, b) filtering, c) different equipments with variation in wavelength, d) silica concentration, e) ageing conditions.
lSi] () q* 10 2 filter ageing (weeks)/ particle size mole/I (nm") (nm) temperature (K) dh (nm)*
a) lambda = 632.8 nm 0.27 35 0.79 200 5.5 /298 9.6 ± 0.1
45 1.01 9.2 ± 0.1 90 1.87 8.8 ± 0.4 125 2.35 11.8 ± 0.6
b) lambda = 632.8 nm 0.27 35 0.79 200 5.5/298 9.6 ± 0.1
20 10.1 ±0.1 45 1.01 200 9.2 ± 0.1
20 9.2 ± 0.8 90 1.87 200 8.8 ± 0.4
20 10.7 ± 1.0 125 2.35 200 11.8 ± 0.6
20 10.4 ± 1.2
c) lambda (nm) expo fit/cum. fit 632.8 45 1.01 200 10/280 7.4 ± 0.3 488.0 35 1.03 5.1 632.8 125 2.35 7.7 ± 0.7 488.0 155 3.35 5.2
d) lambda = 632.8 nm 0.27 45 1.01 200 5.5 /298 9.2 ± 0.1 0.25 7.5/298 9.1 ± 0.1 0.22 8.0 ± 0.5 0.19 7.7 ± 0.3 0.19 5.5/298 7.0 ± 0.4 0.16 7.5/298 6.9 ± 0.5 0.15 6.4 ± 0.2
e) lambda = 632.8 nm 0.27 35 0.79 200 5.5 /298 9.6 ± 0.1
10/280 7.5 ± 0.2 45 1.01 5.5/298 9.2 ± 0.1
10/280 7.4 ± 0.3 90 1.87 5.5 /298 8.8 ± 0.4
10/280 6.4 ± 0.6 125 2.35 5.5 /298 11.8 ± 0.6
10/280 7.7 ± 0.7 0.27 125 2.35 20 5.5/298 10.4 ± 1.2
4.5 /298 6.7 ± 0.2 none 4.5/298 6.4 ± 0.2
*) scatter of generally three measurements

147 Drying of electrodialysed Silica Sol-Gels------------'--'--=
Aging of the sol at a higher temperature of 298 K leads to a significantly larger dh of
9.6 nm. As has to be expected an increase of the temperature, which strongly affects the
solubility of silica, brings about a more rapid growth of the silica particles.
Gelling of the sol
The colloidal silica solution obtained by electrodialysis is subsequently gelled by addition
of sodium hydroxide. Cluster formation of the sol particles raises the viscosity, which
finally becomes infinitely large, when the cluster of silica particles link to a rigid gel. The
increase of the viscosity with time is measured with sols brought by addition of NaOH at
pH levels of 2.7, 5.3, 5.9, 6.3, and 7.8.
The initial viscosity of the sol is 1.06 ± 0.05 * 10.3 Pa *s, in accordance with Einstein's
law for a volume fraction of silica of 0.037. Fig. 4a shows the rise in the viscosity at
293 K as a function of the time elapsed after addition of NaOH to the dialysed sol. The
gelling time, i.e., the period of time upon which the viscosity reaches infinity, is displayed
in Fig. 4b as a function of the pH. The sol of pH 5.9 has the shortest gelling time, viz., 279 minutes. The gelling time exhibits a sharp minimum at a pH of 5.9. The viscosity of
the sols having initial pH levels of 2.7 and 7.8 changes hardly with time. To form a rigid
gel calls for a gelling time of no less than two weeks.
An exponential relationship can empirically describe the increase of the viscosity with
time. The thick curves in Fig. 4a are representing exponential fits with the average
equation
(3 )
where '1 is the viscosity, '1 0 the initial viscosity of (1.06 ± 0.05) * 10-3 Pa *s, t the time, and
toe' the gelling time. The viscosity-versus-time plots are compared with those of the
literature [8]. Whereas the above empirical relation Eqn. (3) describes well the curves
measured with the sols of a pH of 2.7, 4.2, and 5.9, the viscosity of the sol of pH 6.3
increases more steeply. After about 300 min the viscosity of the sol of pH 5.3 abruptly
rises to 0.35 Pa*s as indicated in Fig. 4a.

148 Chapter 7
Figure 4 (a) the development of the shear viscosity in the 1.37 M Si sol with different pH, 5.9, 6.3, 5.3, 4.2, and 2.7, respectively. The solid lines represent exponential fits. (b) the gelling time, where the viscosity reaches a value of infinity as a function of the pH.

149 Drying of electrodialysed Silica Sol-Gels
The experimental gelling time reflects the balance between the repulsive forces due to
the electrostatic charge on the colloidal silica particles, which rises with the pH, and the
attractive force, which increases at lower pH levels. The experimental gelling times, tg' are
in Fig. 4b described by two relations representing the attractive and the repulsive force
between the colloidal silica particles. The attractive force is represented by
(min)
The repulsive force is represented by
(min)
Shrinkage investigated by thermoporometry
Thermoporometry can provide reliable information about the effect of drying on the
porous structure of the silica gels. Tab. 3 and Fig. 5a and 5b are representing the
thermoporometric results measured on hydro- and xerogels. The ice-crystal radius, Rn, the
pore volumes, Vn( 1) and Vn(2), the surface area An' and the corrected values V~ and A~ of
hydro- (H) and xerogels (X) are determined as a function of the pH during gelling. As dealt
with above, the pore volume Vn(1) is measured by the water freezing within the pores, and
the pore volume Vn(2) by subtracting the water freezing outside of the pores from the total
amount of water.
Fig. 5a, which shows the ice crystal radii as a function of the gelling pH, indicates a
steep increase of the pore radius from 1.9 to 3.3 nm when the gelling pH is raised from
5.0 to 6.5. Drying apparently does not significantly affect the pore dimensions; the pores
within the xerogel are not narrower than that within the hydrogel. It must be concluded
that gelling of the sols obtained by electrodialysis leads to a fairly stiff gel structure.
In Fig. 5b the pore volume calculated from the amount of water freezing and melting
within the pores of the gels are represented as a function of the gelling pH. A more gradual
rise of the pore volume than the increase of the pore radius with the pH during gelling is
suggested by the measurements on gels prepared at pH levels of 2.8,5.0, and 6.7. The
pore volume measured after gelling at pH 4, however, does not exhibit the smoothly
increasing pore volume.
The pore volume rather increases than decreases upon drying, which again points to a stiff gel structure. Neither the drying temperature nor aging for one month in the
suspension significantly affect the porous structure of the silica gels. Aging at a low pH
of 2.8 for 7.5 month in the liquid, however, raises both the pore radius and the pore

150 Chapter 7
volume, but the increase of the pore volume is much higher.
Tab. 3 surveys the results more in detail. The effect of the pH during gelling on the
porous structure of the hydrogel is evident from the data of Tab. 2a. The shape factor, F,
indicates the presence of more cylindrical pores. The correction of the pore volume for the
layer of non-freezing water is considerable. Due to the correction the pore volume has
increased from 0.1 to 0.3 ml/g and from 0.3 to 0.5 ml/g. The effect of ageing in the liquid
is apparent from the data of Tab. 3b. The data display a rise in a pore radius and the higher
increase of the pore volume.
The effect of drying, which causes the conversion of a hydrogel to a xerogel is dealt
with in Tab. 3c, 3d, and 3e. Neither the pore radius nor the pore volume significantly
decrease by drying at 333 K, as shown by a comparison of the data of Tab. 3a and 3c.
The steep rise of the pore radius with the gelling pH is evident from the fact that the pore
radius of the silica gelled at pH 6.5 is 3.3 nm, and that of the silica gelled at pH 6.0 and
dried at 333 K 2.3 nm. Drying at a higher temperature of 393 K neither decreases the pore radius and the pore volume as can be concluded from a comparison of the data of Tab. 3a
and 3d. The pore radius and pore volume of the silica gelled at pH 6.0 and dried at 393 K
are relatively high. The effect of previous ageing of the gel for one month is also limited
as evident from Tab. 3e. The pore radius of the aged gel dried at 393 K is relatively large,
viz., 3.1 nm. The pore volume, Vn(2l, calculated from the amount of water outside of the pore system
freezing at the temperature of bulk water is appreciably higher than that calculated from
the water freezing within the pore system, which also points to the presence of a layer of
non-freezing water at the pore walls. After correction for the layer of non-freezing water,
some pore volumes calculated from the water freezing within the pores, Vn(1), are even
higher than that calculated from the water out of the pore system. With most of the samples the pore volume measured from the amount of water freezing outside of the pore
system agrees reasonably well with that calculated from the water freezing within the
pores after correction for the non-freezing layer of water. The mean pore volume calculated
from the water freezing within the pores, Vn(1 l, of hydro- and xerogels is 0.25 ±0.11 ml/g and the mean pore volume calculated from the amount of water freezing at the
temperature of bulk water, Vn(2J, 0.75±0.25 ml/g. The mean pore volume Vn(2) is close
to the mean value of the corrected pore volume, V~, of 0.6 ±0.2 ml/g.
As mentioned in a previous chapter, the pore volume calculated from the amount of
water freezing at the temperature of bulk water is liable to leakage of water into the
capsule containing the sample. In Tab. 3d the pore volume of the gel obtained at a pH of
3.7 calculated from the amount of water freezing at the temperature of bulk water is
considerably higher than that calculated from the water freezing within the pores, viz., 1.3
and 0.2 ml/g, respectively. Leakage of water into the sample holder thus is likely with this
measurement.
The mean shape factor, F, of 1.75 ±0.09 is between that of a spherical and cylindrical
shape, but tending more to a cylindrical shape. The mean ice surface area, An. of 279 ± 61 m 2/g is far less than the corrected surface area, A~, of 468 ± 110 m 2/g for the
non-freezing layer. It is interesting to compare the surface area with the BET surface area

151 Drying of electrodialysed Silica Sol-Gels
measured on the xerogels.
4.0...,-------------------,
(A)
3.0
2.0
1.0
•
•
o hydrogel, no ripening 1< hydrogel, 7.5 month ripening • xerogel dried at 393K. 1 month ripening as hydrogel .. xorogel dried at 333K, no ripening as hydrogel • xerogel dried at 393K, no ripening as hydrogel
0.0 +---,-----,-----,-----,----,-----j 2 4 5 6
gelling pH
0 hydrogel. no ripening 1< hydrogel. 7.5 month ripening 0.6 • xerogel dried at 393K, 1 month ripening as hydrogel .. .erogel dried at 333K, no ripening as hydrogel
• xerogel dried at 393K. no ripening as hydrogel
0.5~ (8) • .s ~
0.4 •~ Ql E :J 0.3 1< 0 .. 0
~ ~ 8- 0.2 ()
~ Ql a. 0.1 ..0 UJ
0.0 I I 2 4 5 6
gelling pH
Figure 5 (a) the ice-crystal radius Rn in the pores of the gel, indicative for the pore
radius Rv, as a function of the gelling pH. The solid line is a best fit increasing from 1.5 nm to 3.3 nm for a pH of 2.7 and 6.5, respectively. (b) the specific pore volume (ml.ice/g.Si02) as a function of the gelling pH, where the solid line is a best fit, increasing from 0.15 to 0.4 ml/g at a pH of2.7 and 6.5, respectively.

152 Chapter 7
Table 3 Thermoporometry applied on electrodialysed silica gels, both hydrogel (H)
(2 mgSi0 2 + 32 mgH 20) and xerogel (X) (13 mgSi0 2 + 21 mgH 2Q) ; a) effect
of the gelling pH on hydrogel, b) effect of ageing on hydrogel, c) xerogel dried at
a medium temperature of 333 K, d) xerogel dried at a high temperature of 393 K,
and e) effect of ageing as hydrogel on xerogel.
pH H/X ripening drying Rn F Vn(1) Vn(2) V'n An A'n (months) T (K) (nm) (ml/g) (m 2/g)
a)
A 2.8 H 0 1.5 1.8 0.1 0.3 183 323 B 4.1 H 0 1.5 0.3 C 5.0 H 0 1.9 0.2 D 6.5 H 0 3.3 1.9 0.3 0.5 193 255
b)
A 2.8 H 0 1.5 1.8 0.1 0.3 183 323 E 2.7 H 7.5 1.9 1.7 0.3 0.6 0.8 302 497
c)
F 2.7 X 0 333 1.4 1.8 0.1 0.7 0.3 217 395 G 6.0 X 0 333 2.3 1.8 0.3 0.6 0.6 333 497
d)
H 2.7 X 0 393 1.5 1.7 0.2 0.5 0.6 290 529 I 3.7 X 0 393 1.5 1.6 0.2 1.3 0.6 278 526 J 4.0 X 0 393 1.6 1.8 0.2 0.6 256 439 K 6.0 X 0 393 2.7 1.8 0.5 0.7 1.0 391 690
e)
L 2.8 X 393 1.5 1.8 0.2 0.6 277 489 M 3.8 X 393 1.7 1.6 0.2 0.7 0.6 286 510 N 6.0 X 393 3.1 1.8 0.4 0.9 0.7 338 461
ripening always as hydrogel, Vn(l) is the pore volume obtained from pore water, and Vn(2) calculated from the amount of bulk water, V~ and A~ are the pore volume and surface area
corrected for the non-freezing layer.

153 Drying of electrodialysed Silica Sol-Gels
Sol particle size of xerogels from TEM, BET, and DRIFTS
A comparison of the sol particle size determined by dynamic light scattering (DLS) with
that observed in the electron microscope and the size calculated from the BET surface area
is highly relevant to assess the reliability of the dynamic light scattering. Transmission
electron microscopy (TEM) indicates a sol particle size of the xerogels of 5 nm. The
particle size is observed to be independent of the gelling pH (Fig. 6a to c, and Tab. 4a).
The sol particles are homogeneously distributed after gelling at pH levels of 4.2 and lower,
but oriented in chains after gelling at high pH levels of, e.g., 7.8. The effect of the
electrostatic repulsion at higher pH levels is evident from the arrangement of the particles
in chains, which keeps the electrostatic repulsion at a minimum.
From BET measurements a mean particle size of 5 nm is calculated (Tab. 4b). The
particle size is calculated assuming a negligible contact area between the individual silica
particles. An effect of the gelling pH on the particle size calculated from the BET surface area is not apparent. The surface area of the silica gelled at a pH level of 6.0 is relatively
low, viz., 455 m 2 per g, which leads to relatively large particles, viz" of 6.0 nm. Nitrogen
adsorption at 77 K (Tab. 4b) points to a mean pore volume of the xerogels of 0.55 ml/g,
which again does not vary significantly with the pH of gelling.
The DRIFT spectra of xerogels gelled at pH 2.7, 4.0, 5.0, and 6.0 (set W-Z) show a
sharp absorption band at 3747 em" and a broad band at 3600-3000 cm'l (Fig. 7). The
absorption of the 3747 em" band, showing an intensity which is 0.96 relative to the absorption at 4000 em", is independent of the gelling pH. The band at 3747 em" is
attributed to surface silanols (chemisorbed water) [9-131. The absorption of the broad band
at 3600-3000 em" is lower at higher pH levels during gelling and ascribed to physisorbed water. From the relative absorption of 0.96 of the 3747 em" band and the linear regression, surface area = relative absorption * 538.9 - 69.3, a surface area of 448 m 2 /g
is calculated, which leads to a sol particle size of 6.1 nm (Tab. 4c).

154 Chapter 7
Table 4 The BET surface area, pore volume, and sol particle size of xerogels obtained
from a) TEM, b) N2
sample pH
a)
0 4.2 p 6.3
Q 7.8 b)
R 2.8
S 3.8
T 5.1
U 6.0
V 5.0 c)
W 2.7
X 4.0
Y 5.0 Z 6.0
absorption (2727/BET), and c) DRIFTS
drying T A. pore volume particle size
(K) (m 2/g) (ml/g) (nm)
293 5
293 5
293 5
393 612 0.54 4.5
393 556 0.54 4.9
393 553 4.9
393 455 6.0
333 573 0.58 4.8
393 448 6.1
393 448 6.1
393 448 6.1
393 448 6.1

155 Drying of electrodialysed SJ'lica Sol-Gels
200 om
Figure 6 TEM images of silica gels, gelled at a pH of (a) 4.2, magnification to the film
is 54000 times, (b) 6.3, magnification to the film 54000x, (c) 7.8, magnification to the film l8000x.

156 Chapter 7
DISCUSSION
From the I-t curve (Fig. 2a) the amount of H + produced by the anode is calculated
according to Eqn. 4
[Wl = 0 IT l(t)*dt/2F (mole/I) (4)
where [H +I is the concentration (mole/l) of the H + produced, F is the Faraday number
(9.6 * 10 4 C/molel, and T the period of time of electrodialysis, which amounts to
88 *3600 = 3.17 * 105 s. The amount of H+ produced, which is 0.875 mole/I, is higher than
the amount of Na+ transported, which is 0.78 mole/I. The yield of
0.78/0.875 * 100 = 89 % is equal to that of 90 % reported in [3,131. The yield being
lower than 100 % is due to the transport of minor amounts of OH- and certainly of H+ during the final stages of the electrodialysis, because the conductivity of H + is 7 times that
for Na+ [71.
The final pH of 13.2 within the cathode compartment reflects that of the produced
0.78 M NaOH solution. A large amount of silicate anions exists in the initial sodium
silicate solution that react slowly with ammonium heptamolybdate. The period of time
where the silicate anions have completely reacted with ammonium heptamolybdate is that
where the silicomolybdate plot against the reaction time is flat (Fig. 3c). The period of time
required for complete reaction drops at longer periods oftime of electrodialysis. The period
of time required for complete reaction is 480 s at the start of the electrodialysis, while it
decreases to 120 s after 42 h of electrodialysis. The large silicate anions in the acidified
anode compartment probably react first to amorphous silica, and finally the small silicate
anions, because a period of time for complete reaction of 120 s reaction time is typical for
MSA. The shape of the Na. plot against dialysis time (Fig. 2b) being identical to the plot
(Fig. 3b) of the silica able to react to soluble silicomolybdate, indicates that the
concentration of silica soluble as silicomolybdate is equal to the sodium concentration,
[Nal •. present in the anode compartment.
As dialysis of the sodium silicate proceeds small silica sol particles are developed, and
gelate at various values of pH according to the plot of Fig 4a. Vogelsberger et al. [81 have
measured plots of the reduced viscosity between 0 and 250, thus the viscosity between
1 * 10-3 and 0.251 Pa *s. Our plots of Fig. 4a have the same the same shape of the initial
of the curves of Vogelberger et al. [81. The theory (see appendix) prescribes a viscosity
against time plot obeying the relation:

157 Drying of electrodialysed Silica Sol-Gels
From the relation of Eqn. 5 and our empirical relation of Eqn. 3 it can be derived that:
t gBI - l/Ao - 1/[OH_ID.7
- exp[-2.3*0.7*pHI - exp[-1.6*pHI (6)
which happens to be the left hand slope of the gelling time against the gelling pH plot of
Fig. 4b. The right hand slope of Fig. 4b is due to repulsion amongst negatively charged
silica sol particles. The minimum in gelling time of the 1.37 M Si sol is 279 minutes at a
pH of 5.9 (Fig. 4bL while the literature value is 50 minutes for 0.5 M Si sols at a pH of
5.8 [141. Strangely the gelling time of Treadwell Konig [14] is short in spite of the fact that
their concentration Si is low. We feel that the long periods of time for gelling exhibited in
our experiments are due to the homogeneous decrease of the pH in the electrodialysis procedure, where a homogeneous solution can be easily achieved.
The negative logarithm of the ionization constant of the surface hydroxyl groups of silica in the absence of dissolved salts is 7. Using the above ionization constant it can be calculated that at a ph of 5.9. where the maximum rate of gelation is displayed, 10% of
the surface silanol groups are ionized. As dealt with in the literature, the rate of gelation is controlled by (i) the number of ionized surface silanol groups increasing with the pH,
which catalyze the linking of silica spheres, which dominates below a pH level of 5.9, and
(ii) the electrostatic repulsion, which dominates above a pH level of 5.9. The repulsion dominating at pH levels above about 5.5 causes a significant increase of the pore
dimensions of hydro- and xerogels as measured by thermoporometry. The increased pore radius. Rn• and pore volume, Vn ( 1L with gelation at higher pH levels exhibited in
Fig. Sa and b, respectively, is due to the repulsive force between sol particles of an equal size, as confirmed on TEM micrographs (Fig. 6a-c). At high pH levels the particles are
linked to particle chains enclosing relatively wide pores resulting in a larger pore volume.
A pore radius, Rn • slowly increasing during ageing of the hydrogel is measured; however,
the effect of ageing on the porous structure can be neglected if the gels are dried within a short period of time after gelling.
As evidenced by the Rn and Vn(l) values of hydro- and xerogels of the electrodialyzed
gels being equal (Fig. 5a and b), the silica gels prepared by electrodialysis display no
shrinkage. The shrinking behavior of the electrodialyzed silica gels is thus completely
different from the considerable shrinkage observed with gels prepared by addition of
waterglass solutions to acids. The fact that silica gels prepared by electrodialysis do not
shrink upon drying may be due to the absence of sodium. The electrostatic repulsive forces are larger without sodium ions being present in the solution.
The pore volumes Vn(2) calculated from the amount of water freezing at the temperature
of bulk water are larger than the pore volumes. Vn( 1L calculated from the amount of water freezing within the pores (Tab. 3). With the pore volume Vn(2) clearly the non-freezing
layer of a thickness 0.9 nm is involved. The mean pore volume measured by nitrogen sorption at 77 K of 0.55 mllg is equal to the mean pore volume Vn ' measured by
thermoporometry after correction for the non-freezing layer. which results in a mean value

158 Chapter 7
of 0.6 ±0.2 ml/g. The pore volume, Vn(1). measured by thermoporometry may exhibit an
increase at increasing pH levels during gelling. Fig. 5b suggests a pore volume rising when
the gelling is performed at a pH level of 6 or higher. However, the pore volume measured
by nitrogen sorption at 77 K shows a value of 0.55 ml/g that does not vary with the pH
during gelling. The pore volume measured by thermoporometry and corrected for the layer of non-freezing water, which is 0.6 ml/g, neither varies with the pH during gelling. We
therefore conclude that the rise in pore volume with the pH of gelling suggested by Fig. 5b
is due to shorter pores with larger radii.
absorbance
1.20-,-----------------------------, 3747 em'1
0.96 3600 - 3000 em"
0.72
0.48
0.24
0.0 +-------,---------,--------,-----------1 4000 3625 3250 2875 2500
wavenumber (cm-1 )
Figure 7 DRIFT spectra of silica gels, gelled at a pH of 2.7, 4.0,5.0,6.0, and dried at 393 K in air. Two peaks are visible, (i) a sharp peak ascribed to silanols, which intensity is independent of the gelling pH, and (ii) a broad absorption band between 3000 and 3600 cm-! ascribed to physisorbed water, which decreases with increased gelling pH.

159 Drying of electrodialysed Silica Sol-Gels
To establish the presence of a non-freezing water layer, it is highly interesting to
compare the surface areas calculated from the thermoporometric data with the reliably
measured BET surface areas. The xerogels obtained after drying the hydrogels at 393 K
exhibit BET surface areas varying from 455 to 612 m 2 per g. The surface area does not
seem to be related to the pH during gelling. Before correction for the non-freezing water
layer, the surface area calculated from the thermoporometric data varies from 256 to 391
m 2 per g. The surface areas, A~, resulting from correction of the thermoporometric surface
areas, is between 439 and 690 m2/g. Comparison of the surface areas of Tab. 3d and
table 4b unambiguously indicates the relevance of the correction for the layer of non
freezing water.
The surface area of the xerogels obtained from transmission electronmicroscopy (TEM)
assuming isolated particles is equal to the surface area measured using the BET procedure,
which deals with coherent particles. The fact that the surface areas calculated from TEM
and nitrogen sorption do not differ indicates that the extent of branching of the sol
particles is low, and that neck-growth between the particles can be neglected. The low
amount of dissolved electrolytes with the sols prepared by electrodialysis and the resulting
strong electrostatic repulsion are causing the arrangement of silica particles in chains,
which leads to a small contact surface area of the silica particles.
Another highly interesting comparison is that between the particle size observed in the
transmission electron microscope and the size determined by dynamic light scattering
(DLS). With TEM the volume being analyzed is usually very small and always the question
about the relevance of the measurements has to be raised. The fact that the BET surface
areas, which are measured on much larger sample volumes, agree with the size of the
silica particles determined by TEM demonstrates that the TEM results are reliable. First of
all it is interesting that the rough estimate of the particle size measured with the Malvern
Multibit K 7025 at a wavelength of 488.0 nm agrees perfectly with the size resulting from
electronmicroscopy and BET surface area determination. The particle size determined with
the Malvern 4700 C at a wavelength of 632.8 nm is 7.3 nm, which is substantially larger.
It is obvious to assume the layer of non-freezing water to be tightly attached to the silica
particles and to diffuse together with the particle through the liquid. The difference in the
particle size, which amounts to (7.3-5)/2 "" 1 nm, which is remarkably equal to the
thickness of the non-freezing layer. Shrinking of the silica particles during drying may also
proceed. Finally clustering of the elementary silica particles in the liquid may be present,
which raises the mean particle size measured by DLS.
The specific surface area calculated from DRIFTS is about 100 m2/g smaller than the
surface area calculated from TEM images and determined according to the BET procedure
from the adsorption of nitrogen at 77 K. The surface area from DRIFTS is only about
20 m2/g smaller than the surface area, A~, measured by thermoporometry. Probably an
amount of physisorbed water decreases the absorption at 3747 em". The infrared
absorption of physisorbed water between 3600 and 3000 cm-1 clearly drops at a higher
pH during gelling (Fig. 7). Because the larger pore size Rn(1) and higher pore volume Vn(1)
at higher pH during gelling is established by thermoporometry, the amount of physisorbed
water will be lower with larger pore radius and pore volume. Keeping the samples at a

160 Chapter 7
temperature of 453 K instead of at 393 K may be required to remove the physically
adsorbed water [121.
CONCLUSIONS
1) Silica gels are manufactured by electrodialysis, during which silicate anions polymerize
to small sol particles, which link together in a gel. The polymerization proceeds by removal
of Na and simultaneously lowering of the pH from 11.3 to 2.8. The course of the decrease
in the amount of silica soluble as silicomolybdate is equal to that of the drop in the Na+
concentration during electrodialysis.
2) The mean size of the silica particles within the sol formed in a dilute sodium silicate solution measured by DLS is 7.3 ±0.6 nm. The thus measured size increases with ageing,
and decreases by dissociation of aggregates or by dissolution during dilution from 0.27 to 0.15MSi.
3) The viscosity of the dialysed sol, brought at the desired pH level with some NaOH solution, increases due to cluster formation. The most rapid rate of gelling and thus most
rapidly increasing viscosity is measured at a pH of 5.9. Below a pH of 5.9 the rate of
gelling drops due to the small fraction of ionized surface silanol groups. Above a pH of 5.9
the rate decreases due to the repulsion between the negatively charged sol particles.
4) No shrinkage takes place with air drying of the hydrogels to the xerogels, as is evident from the equal pore dimensions measured by thermoporometry.
5) The size of the sol particles within the xerogels measured with TEM is independently of the pH during gelling 5 nm, which is equal to the size calculated from the BET surface area. The size determined by TEM and N2 adsorption is smaller than the size of 7.3 nm
determined by dynamic light scattering (DLS). presumably due to a structural layer of
water of a thickness of about 1 nm tightly bound to the silica.
6) An ice crystal radius, R and pore volume, V (1). in the pores of samples increasing no n
with the pH level during gelling is established with thermoporometry. For example Rn
increases from 1.5 to 3.3 nm, and Vn(1) from 0.1 to 0.5 ml/g after gelling at a pH level of
2.8 and 6.0, respectively.

161 Drying of electrodialysed Silica Sol-Gels
7) The pore volume, V n(1), obtained from thermoporometry, ranging from 0.1 to
0.5 mllg, is smaller than the pore volume, Vn (2), calculated from the amount of water
exhibiting the freezing temperature of bulk water, which ranges from 0.6 to 1.3 ml/g. The
procedure using the freezing of bulk water leading to a mean value of the pore volume of
0.75 ± 0.25 mllg clearly measures also the non-freezing layer of about 0.9 nm. Correction
of V n( 1) for this layer yields a value, V~, of 0.6 ± 0.2 ml/g, which agrees well with Vn(2),
and even better with the pore volume of 0.55 ml/g determined by nitrogen sorption at
77 K. The thickness of the non-freezing layer measured with thermoporometry is equal to
the thickness of about 1 nm of the structural layer apparent from the dynamic light
scattering (DLS) results.
8) The specific surface area obtained by measuring the absorption of the band at
3747 cm-' by DRIFTS is lower than the BET surface area of 550 m 2 /g. The difference is
probably due to the amount of physisorbed water, affecting the intensity of absorption at
3747 cm-'. The amount of physisorbed water, measured between 3000 and 3600 cm"
in the DRIFT spectrum, decreases with pore size increasing after gelling at a high pH level.
ACKNOWLEDGMENTS
The authors thank Dr. J.K.G. Dhont for the review of the dynamic light scattering
theory.
REFERENCES
1. W.D. Treatwell, and W. Wieland, Helv. Chim. Acta, 13 (1330) 842-864
2. R.K. IIer, U.S. Patent 3668088, Method of Producing Colloidal Silica by
Electrodialysis of a Silicate (1972)
3. M. Seko, Ind. Eng. Chern., Prod. Res. Dev., 15 (1976) 286
4. R.K. IIer, The Chemistry of Silica, Wiley Interscience, New York (1979), 94-101
5. A.H. Boonstra, T.P.M. Meeuwsen, J.M.E. Baken, G.V.A. Aben, J. Non-Cryst. Solids, 109 (1989) 153
6. J.S. Lowell, J.E. Shields, 'Powder surface area and porosity', 2nd ed., Chapman
and Hall, London (1984), 1-135
7. P.W. Atkins, Physical Chemistry, 2nd. Ed., Oxford University Press (1982),
888-919
8. W. Vogelsberger, J. Opfermann, U. Wank, H. Schutze, G. Rudakoff, J. Non-Cryst. Sol., 145 (1992) 20-24
9. B.A. Moorow, J.D. Gay, J. Phys. Chern., 92 (1988) 5569

162 Chapter 7
10. Physical and Chemical Aspects of Adsorbents and Catalysts, Ed. B.G. Linsen,
Academic Press, London (1970), 248-264
11. J.H. de Boer, M.E.A. Hermans, and J.M. Vleeskens, Proceedings of the Koninklijke
Nederlandse Akademie van Wetenschappen, series B physical sciences,
north-holland pUblishing company, 60 (1957) 45-59, 234-244
12. Y. Otsuboo, M. Horigome, K. Umeya, J. Coli. Interf. Sci., 83 (1981) 240
13. S. Kondo, H. Fujiwara, T. Ischii, and J. Tsuboi, J. Chern Soc. Faraday Transactions (I), 75 (1979) 646
14. W.D. Treadwell, and W. Konig, Helv. Chirn. Acta, 16 (1933) 468
15. V.R. Kaufman, S.C. Muller, K.H. Muller, D. Avnir, Chern. PhI'S. Lett., 142 (1987)
551
16. W. Vogelsberger, J. Coli. Interf. Sci., 103 (1985) 448
17. W. Vogelsberger, J. Coli. Interf. Sci., 88 (1982) 17
18. W. Vogelsberger, Z. PhI'S. Chern., Leipzig 258 (1977) 763
19. B.J. Berne, and R. Pecora, 'Dynamic Light Scattering with Applications to
Chemistry, Biology, and Physics', John Wiley and Sons, New York (1976)
20. R. Pecora, 'Dynamic Light Scattering, Applications of Photon Correlation Spectroscopy', Plenum Press, New York (1985)
APPENDIX
A model for the increased viscosity with the sol-gel transformation
Vogelsberger et al. [8,16-181 have derived a model for the increased viscosity with
gelling of the sol. The model is based on the nucleation and condensation of
supersaturated vapor to microclusters of liquid in finite systems. The energy, E.,f' involved with nucleation and condensation is expressed by :
E.,! = I V*dP + W,.f (J) (7)
which can be rewritten to ;
E = I P. V*dP + I y*dA (J) (8)k,f Pa
and by a circular integral to ;

163 Drying of electrodialysed Silica Sol-Gels -----------'--~-------'------------
E = J Po V*dP + dV*P + JP. (V-nV )*dP + J v*dA (J) (9)k..f Pa 0 Po I l ,
where p. is the initial pressure (Pa), p. the final pressure (Pa), Po the normal saturation
pressure, V the volume of the system (m 3), n, the number of liquid molecules (mole), V l
the molar volume of the condensed liquid (m 3 /mole), y the surface tension of the liquid
(N/m), and dA the increased surface area of the condensed liquid particles (m2). The
number of moles vapor, ny, and liquid, n" is constant on N moles:
(mole) (10)
(J) (11)
The term dV*Po neglects the increased volume of the liquid as compared to that of the
decreased volume of the vapor, where V v is the molar volume of the vapor.
(12)
(1- n/N) (13)
The supersaturation, y, is expressed by :
(14)
and therefore:
Ek,f = -N* RTln[y] + n,*RT + (N-n,)* RTln[(P./Po)*lP.IP.)] + J y*dA (15)
Ek,f = -N* RTln[y] + n,*RT + (N-n,l* RTln[y*(1- n,/Nl] + J y*dA (16)

164 Chapter 7
which can be rewritten to :
N*RT{-ln[YI + (n,/N) + (1- n/N)* RTln[y*(1- n/N)]
+ J V*dA/N*RT} (J) (17)
The term comprising the surface tension, y, can be expressed in the number of liquid
particles, M, and the surface area of one particle, 4m2 , by :
(18)J y*dA/N*RT
where r is the radius of the particle. The fraction of molecules in the liquid phase is
expressed by :
(19)
and the ratio of the number of particles, M, and number of molecules, N (mole), is
expressed by :
(20)Z=M/N
The energy, Ek,t, involved with nucleation and condensation can be expressed in the
particle radius r by :
Ek,tlN = RT{-ln[P./Pol + Z*4m 3/3VL + (1-Z*4m3/3VL)*RTln[P.lPo*(1-Z*4m3/3VL)1 + Z *4m2 * V/RT} (Jim ole) (21 )
Ek,/N RT{-ln[P./Pol + Z*b*r 3 + (1-Z*b*r3)*RTln[P./Po*(1-Z*b*r3 )]
+ Z*a*r2 *y} (J/mole) (22)
where two terms a and b, respectively, are introduced:
a = 4rr/RT (mole/J), b = 4rr/3VL (mole/m 3) (23)

165 Drying of electrodialysed Silica Sol-Gels
With the formation of a number of liquid particles M a path in the valley in the energy of
E.,tlN is followed and expressed by :
d(E.,/N)/dr =0 (J/mole*m) (24)
which leads to ;
(25)
which we recognize as the Kelvin equation where Po is the equilibrium pressure of a
particle with radius r.
-kinetic of condensation,
The rate of increasing liquid molecules is given by :
dn,ldt M*4m 2 *(a-B) (mole/s) (26)
a is a term which describes the rate of condensing vapor molecules, nv, on the surface per
unit time (mole/m 2 * s), and B the evaporating liquid molecules, nl , from the surface per unit
time (mole/m 2 *s). From the kinetic theory of gases can be derived:
a = a*nv * v(kT/2mn)!V (mole/m 2 *s) (27)
where a is a condensation coefficient, and m the mass (kg)
a*(no *f(rj) * v(kT/2mn)!V (mole/m 2 Os) (28)
where no * RT =Po *V, and fIr) a function of the particle radius r [16-18].
(mole/s) (29)
2VL *y/RT*r
dn,ldt

166 Chapter 7
(mole/s) (30)
The condensation rate in a finite system is given by :
(1N) * dn/dt (mole/m 3 *s) (31 )
thus:
rewritten to :
J F = CT" M *4m 2 "\I(kT12nml * (NN)2 * (1 IN) * {1-n/N-( 1Iy) *f{r)} (331
with aid of :
2VL*y/RT*r = In [y*(1-Z*b*r31] (36)
J F can be rewritten to :
J F = CT*(3N.vl2yJV((kT)3 12nm) * (NNI2*(n/N) *In[y* (1-n,/Nl] * {1-n/N-( 1Iy) *f{r)} (37)
Hence, in the case of silica sol particles formed from supersaturated MSA
solutions Vogelsberger et al. [8] arrive at :
1N * dn.ldt = A,*y*n.*ln[y*(1-n.lnt l] * {1-n./n,-1/y} (mole/mhs) (38)

167 Drying of electrodialysed Silica Sol-Gels
n, is the amount solid (molel. n, the total amount Si (molel. A, is a constant, and fIr) is
assumed 1. According to Vogelsberger et al [81 the increasing viscosity in the early stages
of the sol-gel transformation can be well described by ;
(39)
A o and Bo are given by ;
(40)
and:
(41 )
where f), denotes the reduced viscosity ('1/'10)-1 , t the time (sl. y the initial supersaturation
[MSA1,=o/So' koa pre-exponential frequency factor (s-'), [OH-l the hydroxide concentration
(mole/l), E. the activation energy (kJ/molel. R = 8.3 J/mole * K, T the temperature (K), So the silica solubility, Vmthe molar volume of the sol forming species (silica) (m 3 /mole), <P the volume fraction of silica, and f),1<P is a geometric factor, which is 5/2 for spheres.
(1) the term f),1Bo(t)y can be rewritten to <P/(S 0 *VmIt) *y) - [Si02]/(So *y)
- [SiO~I/[MSAlt~o (2) the complex term y(1-(f),1Bo(tly)) - ([MSAlt~o/So) *(1-[Si0211[MSAI,~o)
- ([MSA1t=o-[SiO 21)/So - [MSAl,ISo' the supersaturation with time
(3) the complex term {1-(f),/B o (t)y)-1/y} - ([MSAlt:o-[SiO 21-So)/[MSA1,=o
- ([MSA1t-So)l[MSA1t: o
In our system with already formed sol particles, [MSAl t is assumed constant with time.
With f» '1 0 follows for the viscosity:
'I .. '10 * exp[Ao * In[[MSA1/So1 * {([MSAkSo)/So} * t 1 (42)

168 Chapter 7
Dynamic Light Scattering (Photon Correlation Spectroscopy)
The method of DLS is based on the observation that the fluctuation in the intensity of
light scattered by the silica solution is a function of the Brownian motion of the sol
particles [19,20). The intensity shall fluctuate around the mean intensity < I(q) > , which
results from the scattering of the individual particles. The motion of the particles causes
the intensity of the scattered light to fluctuate at a rate depending on the particle size.
Small particles move faster and cause a more rapid fluctuation of the scattered light. The
fluctuations are analyzed with a digital autocorrelator.
We consider two particles at a distance r scattering light through the same angle 9. To
deal with the phase difference of the light scattered by the two particles, a scattering
vector g is defined. The vector g is the resultant of an incoming wave vector .!s.o of
magnitude n * 2 IT/A , and a scattered vector .!s., of magnitude n * 2 IT/A at an angle 9.
2 I .!s.o I sin(9/2) = n *4IT/A sin(9/2) (nm") (43)
where n is the refractive index of water (containing the silica soil, which is approximately
1.333, and A the wavelength of the He-Ne laser of 632.8 nm or the Ar laser of 488.0 nm,
and 9 the angle of scattering. The difference in phase Llq> of the light beam scattered by
the two particles is (.!s.t-.!s.ol.r. The autocorrelation function g(q,pT) is defined as the mean product of the intensity /(q,tj)
on time t j with the intensity I(q,tj + pT) after a number p of a chosen time interval nesulting
in a period of time pT. The above mean product is the average over a large number N of
intensities recorded at times t j :
(44)g(q,pT) = l/N * 1:7 =1 {/(q,tj+PT) * /(q,tj )}
< I(q,t + pT) *I(q,t) >
Three properties of the correlation function are,
(45)pT=O; g(q,O)
pT=OO ; g(q,oo) < /(q,t + 00) *I(q,t) > <I(q,t+ 00» * <I(q,t» (46)
< I(q,t) > 2
169 Drying of electrodialysed Silica Sol-Gels
because I(q,t + 00) is statistically independent of I(q,t), and
< I(q,t)2 > > g(q,pr) > < I(q,t) > 2 (47)
The correlation function g(q,pr) is related to the particle size dh of the silica. Two particles
with index k have a distance L before- and a distance L+ D.L after a time interval pr, thus
a difference I L(t + prj-LIt) I . The change in phase difference dD.C!> is
dD.C!> g. {L(t + pr)-L(t)} I 9 I * I D.L I * cosB (48)=0
where dD.C!> the phase change, 9 the scattering vector, D.L the displacement vector of the
particle after a time with magnitude pr, B is the angle between the scattering vector g, and
the displacement vector D.L. The particles move randomly over all angles B. The product
of the wave function of the electromagnetic radiation E'(q), scattered at time t j and E(q,D.L)
at time tj + pr of all the particles M is expressed by :
(49)
= B(q)/M * I~~, exp{i* I 9 I * I D.h I *cos6k}
where B(q) is an experimentally determined factor, and M the number of silica particles.
By neglecting the interactions between the particles in the dilute silica solution, the
second term I~~I=' Ek(q,r>*E,'(q) disappears, and Eqn.49 is a function of the
displacements, D.rk, of the isolated particles. The factor B(q) is a function of the laser
power output 10 (W/m 2 ), wavelength A (nm), and scattering vector 9 given by
B(g) == [MI*<1(8,t» (50)
where [Ml is the concentration of particles (m-3), < 1(8) > the mean scattered intensity of

170 Chapter 7
one particle (W/m 2), no the refractive index of the dispersion, dn/dc the slope of the
increase of the refractive index with rising silica concentration (m 3/g), c the silica
concentration (g/m 3), R the distance to the detector (m), N. Avogadro's number (mole-'),v
P(q) and S(q) the intra- and interparticle scattering functions, and Mw the molar weight of
the silica particles (g/mole), expressed in the diameter d (m) by :
Mw = (N.v *rr*density/6) * d3 (g/mole) (51)
where the density is that of silica (g/m 3 ). The intraparticle scattering function P(q) == 1 for
q *d«6, which is the case for the silica particles of a diameter of 5 nm with q == 10-2 nm-'.
The interparticle scattering function S(q) == 1 in the dilute silica solution.
From Fick's second law applied in three dimensions follows (7);
(52)
where D is the diffusion constant of the silica particles (m 2/s), p an integer, and r the
interval time. The correlation function is also a function of q, D, and pr. The correlation function g(q,pr) is the average of I(q,tj + pr) *I(q,tj) over a large amount number of
instances, t j , according to Eqn. 44 :
g(q,pr) < E(q,t + pr)E'(q,t+ pr) *E(q,t)E '(q,t) > = (53)
< E(q,t + pr)E'(q,t + pr) > * < E(q,t)E'(q,t) > +
<E(q,t+pr)E'(q,t» *<E(q,t)E'(q,t+pr» +
< E(q,t + pr)E(q,t) > * < E'(q,t)E'(q,t+ pr) >
or
g(q,pr) <1(q,tl>2 + 1 <E(q,t+pr)E'(q,t» 1 2 + 1 <E(q,t+pr)E(q,t» 1
2 (54)
which can be expressed as
(55)g(q,pr)

171 Drying of electrodialysed Silica Sol-Gels
The third term of the right-hand side of Eqn. 54 and Eqn. 55 is the square of a Dirac 6
function in q, which is 0 for q~O. The function f(pr) of Eqn. 55 can be rewritten using
Eqn. 49 as :
f(pr) = «I(q,t»/M) * I I~~, exp{i*g.ALJ I (56)
= <I(q,t» * I JdrP(r/pr)*exp{i*g.ALJI
where P(Ar/pr) is the probability function to find a particle at distance Ar after a time pr,
and
oJ ~ dAr P(Ar/pr} (57)
The integration of Eqn 56 can be converted to a time-dependent function, applying Fick's
law:
d/dpr P(Ar/pr) = D * V2 P(Ar/pr) (58)
v = d/dAr. and
d/dpr I JdAr P(Ar/pr}*exp{i*g.Ar} I = D* I JdAr V2 P(Ar/pr) *exp{i *g.Ar} (59)
= I D*IVP(Ar/pr)*exp{i*g.Adl:
- D*[ig.VAr P(Ar/pr)*exp{i*g.Ar}I:
- Dqh VAr * JdAr P(Ar/pr)*exp{i*g.Ar} I
The probability to find the particle at exactly the same place. P(O/pr), is 0, and the
probability to find the particle at infinite distance, P(co/pr), is 0, hence:
d/dpr I JdAr P{r/pr} *exp{i *g.Ar} I = - Dq2* I JdAr P(Ar/pr) *exp{i *g.Ad I (60)

172 Chapter 7
The integration of Eqn. 60 results in
I Jdllr P(llr/pr) *exp{i *g.llr} I = exp[-Dq2pr] (61 )
and the substitution of f(pr) =< I(q,t) > exp{_Dq2pr} into Eqn. 55 yields;
g(q,pr) {1 +exp[-2Dq2prl} * <1(q,t»2 (62)
Eqs. 45 and 46 lead for the correlation function g(q,pr) to
g(q,O) = 2<I(q,t»2 -= <1(q,t)2> (63)
g(q,OO) = <1(q,t»2 (64)
The experimentally determined function g(q,pr) strongly depends on a correct selection of
the interval time r. Too high values of r result in a flat g(q,pr) curve, and no value of D can
be determined. The value of r is selected by the Malvern System 4700, and is of the order
of few jJS. The g(p,pr) is determined as a function of p, where p counts from 1 to 128
for the 128 channel correlator. From the slope of the g(p,pr) curve, -2Dq 2pr, the diffusion
constant D can be calculated. The slope of the autocorrelation function is determined in
two ways, viz., (i) by a least square fitting of g(q,pr) by one exponential function (exp.
fit). comprising the terms a and b of Eqn 65, or (ii) a cumulant fit (cum. fit). where In
[g(q,pr)- < l(q,t) > 2/< l(q,t) > 2] is recorded as a function of pr and fitted with Eqn. 65 ;
In [g(q,pr)-<I(q,t»2/<I(q,t»2] = a + b*pr + c*(pr)2 (65)
where the diffusion constant D is derived from b which is -q2'2D, and Q is c/b2. Q is a
constant which describes the deviation of ideal behavior. A constant Q above 0.02 to 0.03
indicates a poly-disperse sol solution. The relative polydispersity in size is equal to the
square root of Q.

173 Drying of electrodialysed Silica Sol-Gels
The diameter dh of the sol particle follows from the Stokes-Einstein relation in ref. [71 :
k *T I 3",,0 = 4.3 * 10-1°/0 (nm) at 293 K (66)
4.9 * 10-1°/0 (nm) at 298 K
where k is Boltzmann's constant of 1.38 * 10-23 J/K, T the temperature (K), " the viscosity
of 1 * 10-3 Pa *s at 293 K or 0.89 * 10-3 Pa * s at 298 K, 0 the diffusion constant (m 2 /s).

175
Chapter 8
Characterization of tubular chrysotile by thermoporometry nitrogen sorption, DRIFTS and TEM"
Mark K. Titulaer', J. Cees van Miltenburg2, J. Ben H. Jansen', and John W. Geus3
,Department of Geochemistry, Institute for Earth Sciences, University of Utrecht,
Budapestlaan 4, P.O. Box 80.021,3508 TA Utrecht, The Netherlands; 2Chemiaboutl
Thermodynamics Group, University of Utrecht, Transitorium 3, Padualaan 8, 3584 CH
Utrecht, The Netherlands;
3Department of Inorganic Chemistry, University of Utrecht, Sorbonnelaan 16, P.O.
Box 80.083, 3508 TB Utrecht, The Netherlands.
"This paper is a contribution of the Debye Institute, University of Utrecht, the
Netherlands.
ABSTRACT
The maximum crystal radius Rn of ice in hollow wet chrysotile tubes is established by
thermoporometry to be between 2.8 and 3.2 nm, and the internal pore volume Vn of the
tubes between 0.008 and 0.02 ml/g. The hollow tubes of chrysotile, and for comparative
reasons small plates of talc, are hydrothermally synthesized at temperatures between 563 and 600 K, and pressures between 75 and 120 hPa. Mg/Si molar ratios in steps of 3/1.5, 3/2 (chrysotile). 3/3.6, and 3/4 (talc) are used to vary the size and shape of the pores. The
tubular morphology of the aggregates dried at 393 K is investigated by 1) transmission
electron microscopy (TEM). 2) nitrogen adsorption and desorption at 77 K, and 3) diffuse
reflectance infrared fourier transformed spectroscopy (DRIFTS). The radius within the
hollow tubes, R;, is between 2.5 and 4.0 nm as measured by TEM, and between 2.8 and
3.2 nm as determined by nitrogen adsorption and desorption. The measured radii agree
well with the value calculated from crystallographic data, which is smaller than 5.3 nm.
Within the dried aggregates the tubes are clustered in regular patterns, in which each tube
is surrounded by 6 other tubes. The external radius, Ro , between the clustered tubes is
from 1.6 to 2.9 nm as observed by TEM, and from 1.8 to 2.3 nm by N2 adsorption and
desorption. The external radius is not measured by thermoporometry. Whereas
thermoporometry only measures the average pore size and pore volume within the tubes,

176 Chapter 8
TEM and N2 adsorption and desorption additionally provide the corresponding values
between the tubes. A third pore radius, 5 to 20 nm, between the clusters of chrysotile
tubes is established with N2 adsorption and desorption.
Key Words- Thermoporometry, Chrysotile Asbestos, X-ray diffraction, N2 adsorption and desorption, Transmission electron microscopy, Infrared spectroscopy.
INTRODUCTION
Thermoporometry has been applied to characterize wet silica gels (Jallut et al., 1992;
Higuti and Iwagami, 1952) and, recently, polymers (Cuperus et al., 1992; Sasthav et al., 1992). Jallut et al. (1992) have published a critical state of the art review. The technique monitors the pore size, pore volume, and pore shape of porous solids. Thermoporometry
is based upon the freezing point depression, dT" of water (or depression of the solidification point of benzene). The freezing point depression is determined within a differential scanning calorimeter (DSC). by measuring in a linear temperature program the heat-flux involved with freezing as a function of temperature. Water has the advantage over benzene, in the determination of the pore size, that the solid does not have to be
dried first, which may cause a decrease of the pore volume. The freezing temperature is a function of the pore radius Rp within the solid, which is only valuable when the pores are
completely filled with water.
Ice will form a continuous plastic mass in the pores and freezing proceeds by 1) migration of the ice-water interface into the porous material (Sasthav et al., 1992) or 2)
nucleation of isolated ice spheres at several spots. The value of the crystal radius Rn of the ice nuclei in the pores is inversely proportional to the freezing point depression as given by Equation (1) ;
R = -64.671dT. - 0.23 (nm) (1 ) n
where Rn is the radius of the ice crystal in nm, -64.67 a literature constant in nm*K (Quinson et al., 1987). and dT. the freezing point depression in K, which is expressed as
a negative value. The thermoporometric measurement is appropriate for determination of ice crystal radii between 1 and 150 nm (Quinson et al., 1987). The pore volume of the
solid, V n , expressed as the volume of ice in ml divided by the weight of the porous solid
in g, is calculated by the summation of the heat-fluxes measured during freezing as a
function of the temperature (Equation 2) ;
Ii Pi*(Ti+,-T,l/(D*H*W*sr) (ml/g) (2)

177 Characterization of tubular chrysotite by thermoporometry
where Pi is the heat-flux in J/s measured at temperature Ti within the temperature interval
(Ti+,-Ti) of 0.04 K on the DSC, D is the density of ice, approximately 1 g/ml, H the
solidification enthalpy of ice of about 332 Jig, W the weight of the porous material in g,
and sr the scan rate of 0.5 K/min.
The radius Rn can also be measured in a heating experiment. The melting temperature
of ice is shifted towards a temperature higher than the measured freezing temperature, and
thus dTf is smaller. Consequently the value Rheeting, the size of the radius obtained in a
heating experiment, is larger than the Rcooling measured in a cooling experiment
(Equation 1). The value of Rh.etingfRcooling is dependent on the pore shape. A pore shape
determining factor F is introduced, which is expressed by Equation (3). The theoretical
value of F varies between 1 and 2, with a spherical and a cylindrical pore shape,
respectively (Quinson et al., 1987).
F Rheating/Rcooling (64.67 IdTf -0.23)/(64.67 IdT,-0.23) dT, I dTf (3)
where dT, is the freezing point depression in the cooling step of the measuring sequence,
and dTf the melting point depression of the ice occupying the pores in the heating step.
Chrysotile fibres, belonging to the serpentine mineral group, with the formula
M93 Si 2 0 5 (OH)4 display a perfectly cylindrical pore shape. The pore shape is of interest to
check certain theoretical assumptions of the thermoporometric characterization, e.g., the
pore shape factor F. Earlier, Scholten et al. (1975) used chrysotile tubes to check the
validity of the Kelvin equation for capillary condensation of N2 at 77 K, and the Washburn
equation for penetration of mercury into the tubes. In this work thermoporometry is applied to fibrous chrysotile, and for comparative reasons also to talc platelets, of the formula
M93 Si 4 0,o(OH)2'
Structure of chrysotile
The curvature of the tubes is due to the structure of the individual unit cells of cJino
chrysotile present in the tube wall. Figure 1 shows the projection of the monoclinic unit
cell of clino-chrysotile (M9 3Si 20 5 (OH)4) in the a x b plane. The space group of cJino
chrysotile is C (Deer et al., 1962). The oxygens of the Si0 4 tetrahedra not involved inm
the siloxane bonds point upwards and are connected to the brucite sheet. The brucite
sheet contains Mg in octahedral positions with two oxygens and four hydroxyls groups.
Noll et al. (1951, 1958) previously studied the curvature in the b-direction of the layers.
Without the curvature, a considerable misfit exists between the silica and brucite sheet
as illustrated by the differences of the sheet parameters. A calculation in the b-direction
is usually performed.

178 Chapter 8
x
~----------c=:r----I, ,,, , I, ,, I I I, I
I I , ,
X 0 i I, I I I
:
~----------c=:r---- -----~----------~
------)(----------~ '
B
A
.A Si (0) 3/ 0- TETRAHEDRA AT THE BOTTOM OF THE BRUCITE LAYER 2
@ OH AT THE BOTTOM OF THE BRUCITE LAYER IN THE SILICA LAYER
X Mg 2+ IN TRIOCTAHEDRAL OCCUPATION
o OH AT THE TOP OF THE BRUCITE LAYER
Figure 1 Projection of the monocline unit cell of clino-chrysotile in the a x b plane.

179 Characterization of tubular chrysotile by thermoporometry
The brucite sheet exhibits lengths of ab = 0.54 and bb = 0.94 nm (bb = .j3ab). and the silica sheet a, = 0.50 and b, = 0.87 nm (Noll et al., 1951). A bending in the b-direction
partly relieves the stress between the two sheets; the smaller silica sheet being at the
internal side. The thickness of the tetrahedral Si sheet, measured from the weighted mean
oxygen positions, is 0.226 nm, and that of the octahedral Mg sheet 0.208 nm, which
corresponds to a combined layer of 0.434 nm (Wicks and O'Hanly, 1988). The combined
thickness d of 0.434 nm is smaller than the sheet distance of 0.73 nm. The length of the
c-axis, 1.464 nm, measures two basal Mg-Si sheet distances of 0.73 nm. The thickness
of the layer of 0.73 nm has also been determined by electron microscopy on Ni-containing
garnierite (Scholten et al., 1975). which is structurally equivalent to chrysotile. The circle
of connected unit cells of chrysotile in the b-direction is always an integer n of bs and bb
(Equations 4 and 5).
2" R; = n b, (nm) (4)
2" (R; + d» = n bb (nm) (5)
where R; is the inner radius of curvature, d the effective thickness of the Si-Mg layer of
0.434 nm, and b, and bb are the cell parameters of the silica and brucite sheet. Equation (4) subtracted from Equation (5) yields Equation (6) :
(nm) (6)
Finally, the division of Equation (4) by Equation (6) results in :
R; = d b,l(bb-b,) = 0.43 *0.87/(0.94-0.87) 5.3 (nm) (7)
A similar calculation can be made for a bending in the a-direction with the result
R;=5.4 nm. Calculation with bending in the a*b diagonal with lengthv(a2 +b2) gives the
result R; = 5.4 nm. The inner radius is smaller than the theoretical value of 5.3-5.4 nm,
since the theoretical radius is situated within the tube wall. The molar ratio Mg/Si of talc being 3/4 is half that of chrysotile. In talc, the brucite sheet is bonded to two silica sheets, and talc will form plates. Thermoporometry should detect the absence of pores of talc
platelets, and the validity of the method can be checked. The aims of this paper are 1) the description of the hydrothermal synthesis of the
serpentine minerals with molar Mg/Si ratios of 311.5, 3/2 (chrysotile), 3/3.6, and 3/4 (talc), using two different silica sources, viz., (i) sodium silicate, and (ii) fumed silica

180 Chapter 8
powder (Aerosil, Degussa, BRD). 2) characterization of the reaction products with X-ray
diffraction (XRDl, 3) investigation of the pore structure of the dried samples with
transmission electron microscopy (TEM). and nitrogen adsorption and desorption (N 2 ads.
and des.). Additionally, 4) diffuse reflectance infrared fourier transformed spectroscopy
(DRIFTS) offers the possibility to monitor the curvature of the tube wall, and measure the
existence of adsorbed water on the clays. Adsorbed water may affect the size of the ice
crystals formed in the tubes. Finally, the measured pore radii, volumes, and surface areas
obtained by thermoporometry, TEM, and N2 ads. and des. will be compared.
EXPERIMENTAL
Hydrothermal synthesis
- sodium silicate (S series)
A stock 2.5 M magnesium chloride solution is prepared. A 3.5 M Si0 2, 1.5 M Na+
Si-containing solution is obtained by diluting Merck sodium silicate solution ART 5621 with
water in a 111 volume ratio. Amounts of 200 ml of the Mg-solution with appropriate
amounts of Si-solution are mixed, yielding Mg/Si molar ratios of 311 .5, 3/2, 3/3.6, and 3/4
(Table 1). To provide a molar ratio Na-to-CI of 1, additional NaOH (Merck, art. 6498) is
added to the suspensions S1-S4.
-fumed silica (A series) Appropriate amounts of Aerosil 380 powder (Degussa, BRD) for the above ratios are
dissolved into 100 ml of a hot 2.5 M NaOH solution of 393 K. The Si-containing solutions
thus prepared are cooled and added to 50 ml of the stock MgCI 2 solution, yielding
suspensions with ratios identical to the series S (Table 1).
Aliquots of 110 g of the suspensions S1-S4 and A5-A8 are placed in 225 ml TeflQn
tubes of a diameter of 4 em. The Teflon tubes are closed at both sides with Teflon'stops
and outer steel clamps. Two tubes are treated simultaneously in a two liter stainless steel
vessel. An amount of 750 ml distilled water is added in the bomb outside the tubes to
provide an equal water vapor pressure inside and outside the tubes. The bomb is
externally heated for 24 h at temperatures ranging from 563 to 600 K, yielding hydrostatic
pressures between 80 and 120 hPa. After a treatment the bomb is slowly cooled and the
magnesium silicate suspensions are centrifuged for 10 minutes at 5000 rpm. The residues
are resuspended in water, washed and centrifuged for 10 min at 5000 rpm to remove
excess sodium. Any possible leaching occurring by washing with distilled water is not
investigated. The last procedure is repeated twice. Finally. the synthetic clay is dried for 24 h at 393 K, and powdered.

181 Characterization of tubular chrysotile by thermoporometry
Table 1 Composition of the starting Mg and Si containing solutions, and conditions
of hydrothermal treatment.
sample ml.A ml.B Addition of NaOH pH Ratio Mg/Si T(K) P (hPa)
sodium silicate
S1 200 72 328 ml 2.8 M 11 .1 3/1.5 568 80
S2 200 96 304 ml 3.0 M 11 .1 3/2 600 120
S3 200 174 226 ml 3.7 M 10.6 3/3.6 563 75
S4 200 192 208 ml 3.8 M 10.6 3/4 573 85
ml.A silica in 2.5 M NaOH pH Ratio Mg/Si T(K) P (hPa)
9 Si0 2/100 ml
fumed silica (Aerosill
A5 50 3.8 10.4 311.5 568 80
A6 50 5.0 10.4 3/2 600 120
A7 50 9.1 9.6 3/3.6 563 75
A8 50 10.0 9.6 3/4 573 85
A: 510 g MgCI 2 .6H 20 in 11 H20; 2.5 M Mg2 + and 5 M 0 B: stock sodium silicate solution; 3.5 M Si0 2 <0.21 9 Si0 2 /mll and 1.5 M Na+
Analytical techniques
Powder XRD reflections are recorded on a Guinier-Johansson camera (CuK.1 radiation 1.5406 A). TEM micrographs and electron diffraction patterns are recorded with a Philips
EM 420 transmission electron microscope. TEM samples are prepared by suspending the
clay in ethanol by ultrasonical treatment. A droplet of the suspension is brought on a
holey carbon film supported on a copper grid, and air dried. The diffraction maxima of TEM
are measured as the radial distances, I, on the film in mm from the position of the incident
electron beam on the film. The lattice plane distances d in A are inversely proportional to
the radial distances I in mm, with a constant of 11.9 * 10.13 m 2 , unique to the camera. A
gold film is used as reference. The diffraction points are indexed using Equation (8) of
c1ino-chrysotile with the angle p of 93° (Brown, 1961; Zussman et al., 1957).

182 Chapter 8
I I I I o 10 20 30nm
Figure 2 Projection of the hexagonal closed packing of chrysotile needles of S2 in the b x c plane, with Rf the radius of the fibres, R; the internal radius, and R, the external
radius.
The projection of the clustered hollow needles of, e.g., sample 52 in the band c plane
is reconstructed in Figure 2, showing the fibre radius R,. the intra radius R;, and the
derived inter particle radius Ro ' assuming a surrounding of each needle by 6 others. This
projection of serpentine is actually photographed in work of Wicks et al. (1988). The derived internal and external pore volume Yo,; and Vp,o' and the internal and external surface
area As,; and As,o' are calculated with the formula 11 Ro = ((2t...;3)-1l*R f • 2) V p,; = R;2 I

183 Characterization of tubular chrysotile by thermoporometry
2.58*{R/-R;2) (ml/gl. 3) V p•o ={2-/3-")*R/I{"*2.58*{R/-R/») (ml/g), 4) As.;=2*103 VplR;
(m 2 /g), 5) As.o =As.;*R/R; (Table 3). With calculation of the pore characteristics from TEM
images, a grain density of 2.58 g/ml of the chrysotile wall is used. The density is
calculated with Equation (9) ;
D = 4 X Mw{M93{5i 20s)(OH)4 I Nav *a*b*c*sinp = 2.58 (g/ml) (9)
where Mw(M93{5i 20s)(OH)4' the molar weight of chrysotile, is 277.1 g/mole, N av ' the
Avogadro number (6.02*1023 mole"), and <[axc],b> = a*b*c*sinp, the volume of the
unit cell, which is 7.13 * 10'24 ml.
Thermoporometrv
A suspension of about 100 mg clay in 0.2 ml H20 (in an aluminum cup) is cooled in a
5etaram 111 differential scanning calorimeter (D5C) from 293 to 220 K at a cooling rate
of 0.5 K/min. The heat flux during the solidification of water is recorded as a function of
the temperature. Due to supercooling of bulk water present outside the pores of the solid,
the heat of solidification is involved at about 264 K, as recorded in the thermogram
(Charoenrein and Reid, 1989). In ?rder to avoid the supercooling of bulk water, the sample
is subsequently heated at a rate of 0.5 K/min from 220 to 265 K, just below the melting
point of bulk water at 273 K. The heat-flux during melting of the ice in the pores is
recorded. Finally, the sample is cooled a second time from 265 to 220 K, and the heat
involved with solidification of water within the pores is exclusively measured.
f!b adsorption and desorption and DRIFTS
The samples 51,52, A5, and A6 are evacuated for 6 h at 473 K under vacuum before
N2 is adsorbed employing a Carlo Erba Omnisorp (TM) 100. The BET surface areas and
pore volumes are calculated from the N2 ads. isotherm, using a surface area of 16.2 }..2
for a physically adsorbed N2 molecule. The pore size distribution is calculated from the
desorption isotherm according to the formula of Lowell and 5hields (1984). The infrared
absorption spectra in the range 4000-450 em" of the finely powdered clays 51-54,
A5-A8 (25 wt% in KBr) are measured on a Perkin Elmer FT-1720 equipment, in
combination with a spectra-tech diffuse reflectance accessory collector. DRIFT5 show two
types of vibrations, in the range of 4000 to 2000 em" OH-stretching vibrations and in the
range of 1225 to 450 em" lattice vibrations.

184 Chapter 8
RESULTS
XRDandTEM
The reaction products S1, S2, A5, and A6 are identified by XRD as a mixture of
chrysotile and brucite; A7 and AS as talc; and S3 and S4 as amorphous product
(Table 2). Brucite in the samples S1, S2, A5, A6 is measured by XRD, which may
introduce additional pores in the system. TEM micrographs and an electron diffraction
pattern of S1 in Figure 3 clearly demonstrate the fibrous morphology of chrysotile. The
electron diffraction pattern of S1 displays hOO, OkO, 001, hkO, hOI reflections, but no hkl
and Okl reflections. The OkO and 001 reflections are located on a line, which illustrates the
bending of the layers. No traces of brucite are seen, but brucite may be present as a few
large crystals, probably with pores> 5 nm. Drying brings about a parallel orientation of
the needles. Since the internal diameter is very unimodal as observed on different TEM micrographs, the average diameter is determined of some needles. The internal diameter
Di is 6 nm and the external diameter Of is 37 nm for S1. The textural parameters obtained
by TEM of S1, S2, A5, and A6 are given in Table 3. The needles of S1 have a length of
0.1-0.2,um (Figure 3), which is about ten times shorter than that of S2 of 1-2,um
(Figure 4). Low Mg/Si molar ratios of 3/1.5, yield short chrysotile of a length of
0.1-0.2 ,um, while the ratio corresponding to chrysotile of 3/2 yields long tubes of 1-2,um.
Amorphous sol particles, probably silica, are incorporated in the hollow tubes of S1, may
be because the silica sheet is at the inner side of the chrysotile tubes. The sol particles
seem to bear a surface charge and prefer a distance between them of about 22 nm.
In the TEM micrographs and the electron diffraction pattern of S2 (Figure 4), with the
Mg/Si molar ratio corresponding to chrysotile, again parallel oriented needles are seen. The
irregular spiral shape of some particles of S2 and of A6 (Figure 6) indicates a rotation axis
in the direction of the fibre axis a-direction. This implies that the curvature model with
bending only in the b-direction is oversimplified.
In Figure 5, the TEM micrographs of A5 with identical molar Mg/Si ratio as S1 illustrate
that the length of the needles is also comparable to S1 (Table 3). Fortunately, one of the needles is oriented perpendicular on the copper grid, which causes the tubular shape to
be clearly visible at the arrow. Small talc crystals of A 7 display no tubular morphology
(Figure 5). The talc crystals of A 7 remain small due to the absence of reduction of the
stress by bending. A ratio Mg/Si of 3/3.6 and 3/4 leads to platy talc crystals. Sample A6
with the same molar Mg/Si ratio as S2 exists of chrysotile needles of 1-2,um length
(Figure 6).

185 Characterization of tubular chrysotite by thermoporometry
Table 2 X-ray powder diffraction data of hydrothermally prepared samples.
Chrysotile, monocline a = 5.32A. b = 9.17A. c =14.64A,p= 93° (JCPDS file No 25-645)
Sample S1 III, S2 1/1, A5 III, A6 III, rer 1/1, hkl
dIAl 7.39 100 7.39 100 7.52 100 7.41 100 7.36 100 002 4.56 55 4.56 50 4.48 35 4.56 30 4.56 50 020 3.68 75 3.68 60 3.68 50 3.68 60 3.66 80 004 2.66 25 2.66 10 2.66 20 2.66 30 200
2.60 15 2.60 40 201 2.54 20 2.57 - 2.53 - 20-2
2.46 >1, 2.49 >1, 2.46 - 2.46 >1, 2.50 50 202 2.28 50 2.22 30 2.29 20 040 2.07 40 2.10 20 2.03 - 2.10 20 1.97 20 205
1.75 25 1.80 15 1.83 30 008 1.54 95 1.54 80 1.53 65 1.54 70 1.53 65 060 1.31 60 1.32 30 1.31 30 1.32 40 1.31 40 402
Talc. monocline a = 5.29A,b =9. 17A.c =18.96A. p =99°61' (JCPDS file No 19-770)
Sample S3 III, S4 1/1, A7 III, A8 III, ref' III, hkl
dIAl 9.54 100 9.65 100 9.35 100 002 4.58 >1, 4.56 60 4.59 45 020 2.60 <I, 2.60 30 2.60 20 13-2 2.49 <I, 2.51 50 2.50 20 13-3 1.53 >1, 1.53 65 1.53 55 060
Brucite, hexagonal a = 3. 147A, c = 4.769,0. (JCPDS file No 7-239)
Sample S1 1/1, S2 1/1, A5 III, A6 III, rer III, hkl
diAl 4.76 50 4.77 35 4.77 40 4.79 30 4.77 90 001 2.73 6 100
2.37 100 2.37 100 2.37 100 2.37 100 2.37 100 101 1.80 35 1.80 45 1.79 45 1.80 40 1.79 55 102 1.58 30 1.58 30 1.57 30 1.58 30 1.57 35 110 1.50 20 1.50 15 1.49 18 111 1.38 10 1.37 16 103
1.36 2 200 1.31 15 1.31 12 201
")JCPDS

186 Chapter 8
Figure 3 TEM micrographs and an electron diffraction pattern of Sl (chrysotile).
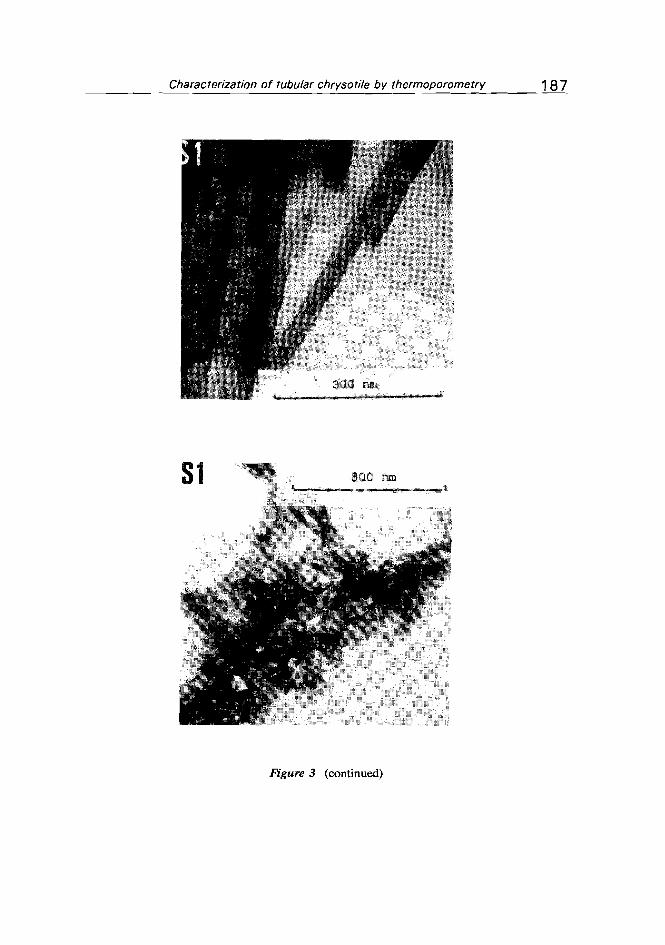
187 Characterization of tubular chrysotile by thermoporometry
81
Figure 3 (continued)

188 Chapter 8
Figure 4 TEM micrographs and an electron diffraction pattern of 82 (chrysotile).

189 Characterization of tubular chrysotile by thermoporometry
Figure 4 (continued)

190 Chapter 8
Figure 4 (continued)

Chapter 8 192
Figure 5 TEM micrographs of the AS (chrysotile) and A7 (talc)

Characterization of tubular chrysotile by thermoporometry 193
800 nm
Figure 5 (continued)

194 Chapter 8
Figure 6 TEM micrographs and a electron diffraction pattern of A6 (chrysotile). The photograph, which is rather astigmatic, shows the spiral shape of the chrysotile tubes.

195 Characterization of tubular chrysotile by thermoporometry
A6
Figure 6 (continued)

196 Chapter 8
Table 3 Porous structure of chrysotile by transmission electron microscopy (TEM).
sample 51 52 A5 A6
length of the tubes (pm) 0.1-0.2 1-2 0.1-0.2 1-2 diameter tubes 0,(2 *Rf ) (nm) 37 31 21 36 inner tube radius R; (nm) 3 4.5 2.5 4 inter tube radius Ro
1 2.9 2.4 1.6 2.8 thickness of the wall 6 (nm) 15 11 8 14 number of sheets in wall 21 15 11 19
internal porosity Vp,; (ml/g)2 0.01 0.04 0.02 0.02 external porosity Vp,o (ml/g)3 0.04 0.04 0.04 0.04 total porosity Vp,,+o (ml/g) 0.05 0.08 0.06 0.06 internal area A.,; (m 2 /g)4 7 16 19 10 external area A.,o (m 2 /g)5 43 54 78 45 total surface area (m 2 /g) 50 70 97 55
1) Ro=((2!v'3)-1)*R, 2) Vp,,=Rj2/2.58*(R/-R/Hml/g) 3) Vp,o= (2v'3-lT)*R/lliT*2.58*(R/-R;2)) (ml/g) 4) A"j=2*103 Vp/R; (m 2 /g) 5) A,oo = A", * R,/R;
Thermoporometry
An amount of water present within the pores can be deduced from the thermograms of pure chrysotile, e.g., 52 and A5 in Figure 7a and b (the position of the curves does not represent an absolute value of the heat-flux due to vertical displacement of the curves). In the first cooling step, 52 exhibits a large exothermic solidification peak at 265 K of supercooled bulk water (1), and a much smaller exothermic solidification peak at 255 K of pore water (2) (Figure 7a). The freezing point depression dT, is 18.3 K. The melting peak of the ice present within the tubes is registered during the heating step at 256.6 K (3). The 'fusion point' depression, dTf , of the melting of ice within the tubes is 16.6 K. The shape factor, F, is therefore 18.3/16.6 = 1.1, which is assumed to be characteristic for a spherical pore shape. During the second cooling cycle a solidification peak of pore water is observed at 255 K (4). The ice crystal radius Rn of 52 corresponding to the maximum of heat-flux is 3.3 nm (Equation 1).
The thermogram of chrysotile A5 in Figure 7b displays the solidification peak of pore water at 251.8 K (2) with dT, = 21.5 K, and during the heating step an endothermic fusion peak at 257.9 K (3) with dT, = 15.4 K. The shape factor F of A5, which is 21.5/15.4 = 1.4, is large as compared to the value of 1.1 of 52, which may imply that the ice crystals grow more cylindrically.
Macro pores appear as shoulders on the bulk peak at 273 K during the final heating step. Due to the overlap with the peak of bulk water at 273 K, no V n of these peaks can be determined. The shoulder and bulk peak are not displayed in Figure 7, due to the dominant heat-flux involved with fusion of the bulk water. The peak of the macro pores of A5 has its maximum at 268 K, with a dT, of -5.2 K, corresponding to a value for Rn of 6.1 nm.
The thermoporometric pore radii of the samples 51, 52, A5, A6 range from 2.8 to 3.3 nm, and the pore volumes V n from 0.016 to 0.02 ml/g (Table 4).

197 Characterization of tubular chrysotile by thermoporometry
~ -s x :J ...J lL
f-« w I
'" -4ffi i" 0 Gj
-8
82 (AJ
d T,
3 :
,--HE_A1_'NG__S_TE~
SECOND COOLiNG STEP
FIRST CODLiNG STEP
\ ~-~ -
~-----2;;-;4-;:-0---------;;2-=50C--------c260 '----'-----=2==70--230 280
TEMP. (K)
A5 [BJ
!1, 3: d T,
~
I
~ -S x :J ...J lL
HEATING STEP
f-« w I
FIRST COOLING STEP d T s :
~-----------~
'" -4
~ §
-8
230 240 250 260 270 280
TEMP. (K)
Figure 7 (a) Thermograms of S2, with 9 mg solid and 273 mg H20, illustrating the exothermic peak of supercooled bulk water at 265 K (1), the exothermic peak of pore water at 255 K (2), the melting peak of the pore ice at 256.6 K (3), and finally, the solidification peak of pore water at 255 K the second time (4). (b) A5 , with 142 mg solid and 161 mg H20, with the solidification peak of pore water at 251.8 K (2), and the endothermic fusion peak at 257.9 K (3) of pore water.
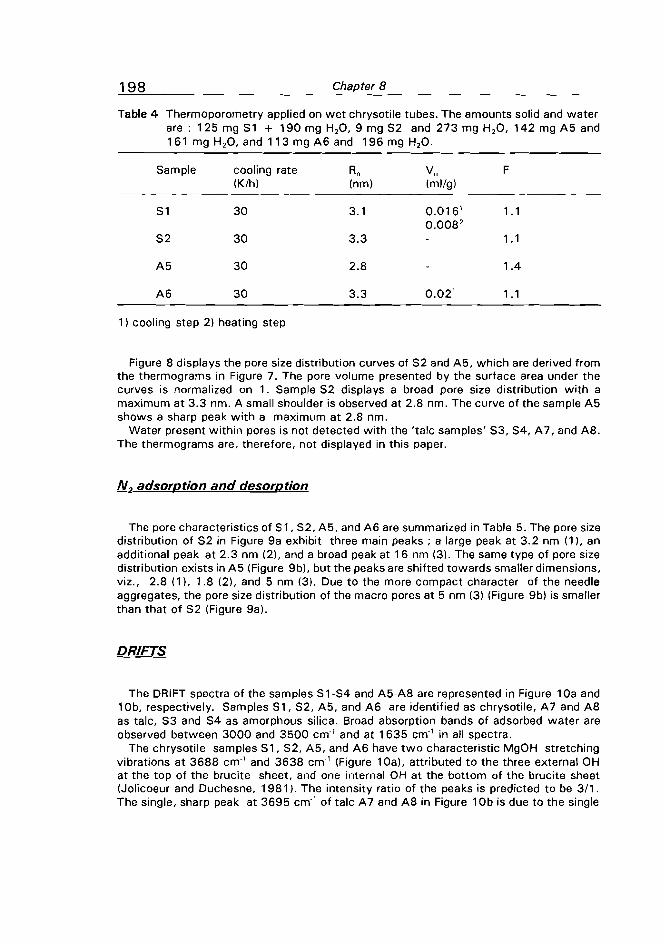
198 Chapter 8
Table 4 Thermoporometry applied on wet chrysotile tubes. The amounts solid and water are: 125 mg S1 + 190 mg H20, 9 mg 82 and 273 mg H2 0, 142 mg A5 and 161 mg H20, and 113 mg A6 and 196 mg H20.
Sample cooling rate Rn V n F (K/h) (nm) (ml!g)
S1 30 3.1 0.016' 1.1 0.008 2
S2 30 3.3 1 .1
A5 30 2.8 1.4
A6 30 3.3 0.02' 1.1
1) cooling step 2) heating step
Figure 8 displays the pore size distribution curves of S2 and A5, which are derived from the thermograms in Figure 7. The pore volume presented by the surface area under the curves is normalized on 1. Sample S2 displays a broad pore size distribution with a maximum at 3.3 nm. A small shoulder is observed at 2.8 nm. The curve of the sample A5 shows a sharp peak with a maximum at 2.8 nm.
Water present within pores is not detected with the 'talc samples' S3, S4, A 7, and A8. The thermograms are, therefore, not displayed in this paper.
N 2 adsorption and desorption
The pore characteristics of 51,52, A5, and A6 are summarized in Table 5. The pore size distribution of S2 in Figure 9a exhibit three main peaks; a large peak at 3.2 nm (1 I, an additional peak at 2.3 nm (21, and a broad peak at 16 nm (3). The same type of pore size distribution exists in A5 (Figure 9b), but the peaks are shifted towards smaller dimensions, viz., 2.8 (1 I, 1.8 (2), and 5 nm (3). Due to the more compact character of the needle aggregates, the pore size distribution of the macro pores at 5 nm (3) (Figure 9b) is smaller than that of 52 (Figure 9a).
DRIFTS
The DRIFT spectra of the samples 51-54 and A5-A8 are represented in Figure 10a and 10b, respectively. 5amples 81,82, AS, and A6 are identified as chrysotile, A7 and A8 as talc, 83 and 84 as amorphous silica. Broad absorption bands of adsorbed water are observed between 3000 and 3500 cm'1 and at 1635 cm" in all spectra.
The chrysotile samples S1, 52, A5, and A6 have two characteristic MgOH stretching vibrations at 3688 cm" and 3638 cm" (Figure 1Oa), attributed to the three external OH at the top of the brucite sheet, and one internal OH at the bottom of the brucite sheet (Jolicoeur and Duchesne, 1981 I. The intensity ratio of the peaks is predicted to be 3/1. The single, sharp peak at 3695 em" of talc A 7 and A8 in Figure 1Ob is due to the single

--
199 Characterization of tubular chrysotite by thermoporometry
internal MgOH-stretching vibration. In talc all hydroxyls are equivalent. The internal OH-stretching vibration at 3695 cm" is located at about the same wavenumber as the external OH-stretching vibration of chrysotile.
The absorption bands at about 1081 cm", 10 10 cm", and 947 cm" (Figure 1Oa) are typical for the 5i-O-5i stretching vibrations of the silica network (Yariv and Heller-Kallai, 1975, Luys et al., 1982). The 1081 cm" band is attributed to the out-of-plane symmetric stretching vibration of the silica sheet. The degeneracy of the single band at 1010 cm" in talc to two bands at 10 10 cm" and 947 cm" in chrysotile is explained by the bending of the silica sheet. The 1010 cm" band is attributed to 5i-O-5i stretching vibrations, mainly parallel to the b-axis in the direction of the curvature, while the 947 cm'! is due to 5i-O-5i stretching vibrations parallel to the a-axis. The relative intensity of both bands is affected by ultrasonic treatment of chrysotile (Yariv and Heller-Kallai, 1975).
The small peak at 1202 cm" for 5 1, 52, A5, and A6 represents small traces of amorphous silica. The absorption band of the Mg-O stretching vibration at 670 cm" of octahedrally coordinated Mg (A7 and AS) is shifted to a lower wavenumber of 655 cm" (A5 and A6). The Mg-O stretching vibration band at 660 cm'1 is the same for both the talc samples 53, 54, and the chrysotile samples 51, 52.
5
-~,1S
..--.4
~ AS "d'3:> "d
"d Cl.l
.~-2 cd
S J-< 0 ~ 1
0+--..L-~--.-------,--=-----,----=::::::r.---,-------1
2.0 2.5 ice
Figure 8 The heat flux curves of S2 and A5 transformed into not unimodal pore size distribution curves. The rather asymmetric distribution of the heat-flux curves, tailing to low temperatures has disappeared by the reciprocal dependency of the radius R,. on the temperature T, by R. = -64.67/(T,-273.15) -0.23
3.0 3.5 4.0 4.5 5.0 5.5 crystal radius Rn (nm)

200 Chapter 8
[AI
82~
~ 2-0->
"0
3
4 5 6 7 8 910 20 30 40 50 60 80 100
Rp(nm)
[B]
A5
20 30 40 50 60 80 100
Rp(nm)
Figure 9 Pore size distribution of ; (a) S2 (chrysotile), with two major peaks, a main peak at 3.2 nm (1), a secondary peak at 2.3 nm (2), and furthermore, a broad peak with a maximum at about 16 nm (3), (b) AS (chrysotile), but the three peaks are shifted towards low radii, 2.8 (1), 1.8 (2), and 5 nm (3).

201 Characterization of tubular chrysotile by thermoporometry
DISCUSSION
The heat-flux measured by thermoporometry originates from water present within the hollow chrysotile tubes, which is supported by the absence of an analogous heat-flux in talc. A shape factor F of 2 in thermoporometric characterization of a cylindrical pore shape should be expected for the chrysotile samples. However, low shape factors between 1.1 and 1.4 are experimentally measured (Table 4). The shape factors are even smaller than the minimum value of 1.4 of Jallut et al. (1992) reported for a matrix of compacted alumina grains approximating spherical pores. The ice crystals remain spherical after solidification. Cylindrical shapes may be obstructed by the presence of amorphous sol particles in the tubes (Figure 3). A second possibility is that the ice crystals grow spherical to form a chain of crystals.
The DRIFTS absorption bands at 3000-3500 cm-1, and at 1635 em" are attributed to
the stretching and bending vibration of water, and are especially strong for S3 and S4, which implies that water is bound to silica in the chrysotile structure (Suquet, 1989). The absorption bands are especially strong in 100 % leached samples and assigned to water adsorbed on Si-OH groups. Water adsorbed on silica may form a non-freezing layer of a thickness of 0.9 nm. The ice crystal radius Rn is expected to be 0.9 nm smaller than the pore radius Rp • The existence of such a layer in chrysotile can be verified by comparison of the thermoporometric results to the N2 adsorption and desorption results.
The N2 pore radius distribution curves of two chrysotile samples, S2 and A5, (Figure 9) can be explained using Figure 2. The peak (1) at about 3 nm is ascribed to the internal radius Rj of the tubes, the peak (2) at about 2 nm to the inter particle radius Ro between the tubes (the size of R; is larger than R.l, and the peak (3) between 4 and 100 nm to macro pores between the chrysotile clusters, or to pores in amorphous silica or brucite. The comparison of the pore characteristics of the chrysotile tubes obtained by the three methods TEM, H20 (thermoporometry), and N2 can be split in 1) the pore size distribution, 2) the pore volume. and 3) the (internal) surface area.
-pore size distributions The pore size distribution curves of S2 and A5 obtained by thermoporometry (Figure 8)
can be compared directly tQthe N2 ads. and des. curves (Figure 9). The maxima of the broad peak of S2 and the Sh,ll:p peak of A5 at 3.3 and 2.8 nm. respectively, correspond to the main peak (1) of N2 ads. and des. A very good agreement exists between the main peak radius Rp (1) as calculated fmm N. ads. and des., and the thermoporometric radius Rn (Table 6). The agreement indicates that the main peak in the desorption isotherm corresponds with the ice crystal radius.R • Surprisingly, the pore radius Rp is not 0.9 nmn
larger than the ice crystal radius Rn • which is usually observed with amorphous silica (Jallut et al., 1992). Probably all the silanol grou!'ls of the silica tetrahedra point to the brucite sheet and leave no hydrogen bonds to anchor the non-freezing layer. Due to the hydrophobic character of the inner chrysotile tubes the amount of adsorbed water measured by DRIFTS is situated elsewhere, maybe adsorbed to KBr. The secondary peak (2) of N2 ads. and des., Ro • with a smaller radius than the main peak R; (Table 5) is not measured by thermoporometry. Perhaps, the clustering of tubes disappears when resuspended in water, and the external radius Ro between the tubes becomes too large and the signal intensity too low to be measured with thermoporometry. The shoulder on the pore size distribution curve of S2 at 2.8 nm (Figure 9) may point to the existence of some clustering in water. The third N, peak (3) of A5 at 5 nm (Figure 9) is attributed to macropores corresponding to the large pore size Rn of 6.1 nm determined by thermoporometry, probably of ice formed between the chrysotile clusters.

202 Chapter 8
~ 3688 EXTERNAL OH - STRETCHING OUT OF PLANE Si - 0 - SI(/) (OPEN CIRCLES IN FIG. 1) SYMMETRIC STRETCHING SI • 0 • Si z «a: I
954
AS
A7
A8
A6
[B)
16353000-3500
3649
3695
1018 CRYSTALLOGRAPHICCRYSTALLOGRAPHIC
B • DIRECTION A - DIRECTION
84
83
82
51
[A]
660
10811010~ ASYMMETRIC STRETCHING
INTERNAL OH - STRETCHING 3638 (DOUBLE CIRCLES IN FIG. 1)
z o en (/)
o 3000 2000 1500 1000 500
WAVENUMBER (CM-1)
Figure 10 DRIFT spectra of (a) sodium silicate samples Sl-S4, (b) fumed silica (Aerosil) samples AS-AS.

203 Characterization of tubular chrysotile by thermoporometry
Table 5 N2 ads. and des. applied on chrysotile after evacuation for a period of 6 h at 473K.
Sample Rp (nm)
Vp (mllg) > 1nm 1nm<Rp< 5nm
surface area (m 2 /g) BET des. isotherm3
S1 3.2' 0.35 0.04 46 52 2.22
S2 3.2 1 0.39 0.06 54 70 2.3 2
A5 2.8' 0.25 0.13 87 115 1.82
A6 2.9' 0.54 0.05 63 74
1) main peak 2) secondary peak 3) A. = I k 2Vp,k/Rp,k with Rp,k between 1 and 30 nm
The crystal radii, Rn , obtained from thermoporometry agree well with the inner particle radii, Ri, determined from TEM micrographs (Table 6). Mostly the radii determined from TEM micrographs are slightly larger than those obtained by thermoporometry. The radii Rn
(H 20) and Ri (TEM) exhibit an identical trend with A5 < S1 < A6 < S2.
-pore volume measurements The thermoporometric pore volumes Vn of S1 and A6 are smaller than the N2 pore
volumes V p(N2) (1 nm < Rp< 5 nm) (Table 6), because thermoporometry determines the pore volume within the tubes, Vp,;, and not in between the tubes, whereas N2 ads. and des. measures both, Vp,i+O' The thermoporometric pore volumes, V n , of the tubes agree well with the internal pore volumes, Vp,;, calculated from TEM data (Table 6). No problems are' seen with the nucleation of ice by the fairly hydrophobic inner chrysotile walls, as expected from the results of Cuperus et ai, (1992), resulting in too low pore volumes Vn •
Maybe the hydrophillic silica sol particles in the cylinders initiate heterogeneous nucleation. The Vp,i+o(N 2) (1 nm < Rp< 5 nm) is slightly smaller than the TEM pore volume Vp,i+O' except with A5 (Table 6). The opposite is observed for Vp(N 2 ) (Rp> 1 nm) (Table 5), being larger than the total TEM pore volume (Vp,i+o) (Table 6). The high N2 pore volume is probably due to the macro pore volume, which is present in pores larger than 5 nm between chrysotile clusters or in amorphous silica or brucite.
-surface area measurements The BET surface areas by N2 adsorption (Table 5) (except that of A6) are slightly smaller
than the surface areas calculated from the TEM images (Table 3). For example, the BET surface area of S1 is 46 m 2 /g, and the TEM surface area is 50 m2 /g. The BET surface areas exhibit a similar trend as the TEM data, which is S1 < (S2,A6) < A5. The surface areas calculated from the N2 desorption isotherms based on the equation I k 2Vp,k/Rp,k are about 15 m 2/g larger than the BET surface areas (Table 5), and agree better with those of TEM. For example, the surface area of S1 is 52 m 2/g by N2 desorption and 50 m 2/g by TEM. The difference between the BET and N2 desorption surface area cannot readily be explained, but may be attributed to amorphous product in and between the needles measured with the BET method.

204 Chapter 8
Table 6 Comparison between the values obtained for Rp,;, Vp,i' and Vp,;+o' given the different complex compositions of the samples by the three methods TEM, thermoporometry (H 20), and N2 ads. and des. The value 0% represents the maximal fault (in %) in the determination of R; by the three techniques.
Rp,i 0% Vp,i Vp,i+o(1 nm < R< 5nm) Mg/Si (TEM) (H 2O) (N 2 ) max (TEM) (Thermo) (TEM) (N 2)
S1 3/1.5 3.0 3.1 3.2 6 0.01 0.016 0.05 0.04
S2 3/2 4.5 3.3 3.2 41 0.04 - 0.08 0.06
A5 3/1.5 2.5 2.8 2.8 11 0.02 - 0.06 0.13
A6 3/2 4.0 3.3 2.9 38 0.02 0.02 0.06 0.05
CONCLUSIONS
1) The internal pore radius Rp,; and pore volume Vp,i of the tubes is established by thermoporometry. The pore radii agree well with that of TEM and N2 adsorption and desorption.
2) Water attached to silica in chrysotile and talc as established by DRIFTS, does not form a layer of strongly bound water in the pores. The water within the pores completely participates in the water-ice phase transformation, because the internal pore radii obtained by thermoporometry and N2 adsorption and desorption are identical.
3) The thermoporometric shape factor F of about 1 is smaller than the expected theoretical value of 2, because the ice crystals in the tubes develop to a chain of spheres. Some amorphous material incorporated in the hollow tubes may prevent the formation of one single ice cylinder.
4) The N2 adsorption and desorption measurements point to a parallel orientation of clustered tubes. The value of the internal radius, Ri, and external radius, Ro' calculated from N2 adsorption and desorption are equal to those from TEM micrographs. Furthermore, the N2 pore volume Vp between a Rpof 1 and 5 nm is equal to that determined from TEM micrographs. The BET surface area obtained by N2 adsorption is slightly smaller than that obtained from TEM, while the surface area obtained by N2 desorption (Ik 2Vp,k/Rp,k) agrees better.
5) Addition of water to the dried and clustered tubes probably results in the disappearance of the clustering. Thermoporometry only measures the internal radius Rj and pore volume Vp,; within the tubes, while TEM and N2 adsorption and desorption provide the radii and the pore volume within and between the tubes, Rp,i+o and Vp,I+o' respectively.
6) Comparison of radii measured by thermoporometry and either TEM or nitrogen adsorption can indicate the hydrophobility of the surface of the porous solid.

--------205 Characterization of tubular chrysotile by thermoporometry
ACKNOWLEDGMENTS
The authors thank P.A. Elberse for the N2 ads. and des. measurements, M.J. Kappers for the DRIFTS measurements, and R.J. Bakker and J.T. Kloprogge for their critical review of the paper. Furthermore A.M.J. van der Eerden is thanked for the technical assistance with the hydrothermal synthesis experiments.
REFERENCES
Brown, G. (1961) (ed.) The X-ray identification and crystal structures of clay minerals: 25-33 and 88-101, Mineralogical Society, Jarrold and sons, London.
Charoenrein, S., and Reid, D.S. (1989) The use of DSC to study the kinetics of heterogeneous and homogeneous nucleation of ice in aqueous systems: Thermochim. Act. 156, 373-381.
Cuperus, F.P., Bargeman, D., Smolders, C.A. (1992) Critical points in the analysis of membrane pore structures by thermoporometry : J. Membr. Sci. 66, 45-53.
Deer, W. A., Howie, R. A., Zussman, J. (1962) Rock forming minerals. Vol 3 2 Sheet silicates, Longmans, London, 170-190
Higuti, I. and Miyata, Y. (1952) Calorimetric evidence for the capillary condensation theory: J. Phys. Chem. 56,921-927.
Jallut, C., Lenoir, J., Bardot, C., Eyraud, C. (1992) Thermoporometry. Modelling and simulation of a mesoporous solid: J. Membr. Sci. 68, 271-282.
Jolicoer, C., Duchesne, D. (1 981) Infrared and thermogravimetric studies of the thermal degradation of chrysotile asbestos fibres, evidence for matrix effects: Can. J.Chem. 59, 1521-1526.
Lowell, S., Shields, J.E. (1984) Powder surface area and porosity, 2nd ed., Chapman and Hall, London, 1-135.
Luys, M-J. at al. (1982) Characterization of asbestos minerals, structural aspects and infrared spectra: J. Chem. Soc., Faraday Trans. 78,3561-3571.
Noll, W., Kircher, H. (1951l Ober die morphologie von asbesten und ihren zusammenhang mit der kristallstructur : Neues Jahrbuch fUr Mineralogie, Monatshefte, 219-240.
Noll, W., Kircher, H., and Sybertz, W. (1958) Adsorptionsvermogen und spezifische Oberflache von Silikaten mit rohrenformig gebauten Primarkristallen : Kolloid Zeitschrift 157, 1-1 1.
Quinson, J.F., Astier, M., and Brun, M. (1987) Determination of surface areas by thermoporometry : ApDI. Catal. 30, 123-130.
Scholten, J ..I.F., Beers, A.M., and Kiel, A.M. (1975) Studies on pore structure of adsorbents and Catalysts: J. of Catal. 36, 23-29.
Sasthav, M., Raj, W.R.P., Cheung, H.M. (1992) Characterization of Microporous Polymeric Materials. Pore continuity and size distribution via thermal analysis: J. Coli. Inter(. Sci. 152 {21. 376-385.
Suquet, H. (19891. Effects of dry grinding and leaching on the crystal structure of chrysotile: Clays & Clay Minerals 37, 439-445.
Wicks, F.J, and O'Hanley, D.S. (1988) Serpentine Minerals, structure and petrology, in 'Reviews in Mineralogy vol. 19, Hydrous Phyllosilicates (exclusive of micas)', Ed. Baily, S.W., BookCrafters, Chelsea, Michigan, 91-129.
Yariv, S., and Heller-Kallai (1975) The relationship between the I.R. spectra of serpentines and their structures: Clays & Clay Minerals 23. 145-152.
Zussman, J., Brindley, G.W., and Comer. J.J. (1957) Electron diffraction studies of serpentine minerals: Amer. Mineral. 42, 133-153.

207
Chapter 9
The shrinkage and swelling of differently pillared hydrotalcite investigated by thermoporometry +
M.K. Titulaer, H. Talsma', J.B.H. Jansen, and J.W. Geus2
Department of Geochemistry, Institute for Earth Sciences, University of Utrecht,
Budapestlaan 4, P.O. Box 80.021, 3508 TA Utrecht, The Netherlands
'Department of Pharmaceutics, University of Utrecht, Sorbonnelaan 16, P.O. Box 80.082, 3508 TB Utrecht, The Netherlands
2Department of Inorganic Chemistry, University of Utrecht, Sorbonnelaan 16, P.O. Box
80.083, 3508 TB Utrecht, The Netherlands
+) This paper is a contribution of the Debye Institute, University of Utrecht, The
Netherlands.
ABSTRACT
Pillared hydrotalcite minerals MgeAI2(OH),eC03.4H20 are prepared with different interlayer anions, viz., carbonate, oxalate, malonate, succinate, adipate, sebasate, and
chloride. The chloride samples are prepared at pH values of 10, 9, 8, and 7. The
substitution of the respective anions is assessed by X-ray diffraction, infrared
spectroscopy, and transmission electron microscopy. The interlayer spacing of the
hydrotalcite with specific anions increases from 7.82 A (OH-), to 7.89 A (CO~-), 8.06 A (cn where the molar ratio Mg/AI is 3/1, 10.04 A (oxalate), 10 A (malonate), 12.4.A (succinate), 13.15 A (adipate), and 18.84 A (sebasate) where the molar ratio Mg/AI is 2.
Hydrotalcite interlayer spacings can be observed in the TEM photographs of succinate and adipate samples.
The chloride and bicarboxylic acid samples are almost free of carbonate as proved by the
absence of the 3050 cm-1 carbonate-water bridging band in the IR spectra. Strong C-C
bands at 1625-1572 cm-' and C-H bands at 2865,2940, and 2995 cm-' are visible in the
intra-red spectra of the hydrotalcites with bicarboxylic acids within the interlayer.
Differential thermal analysis and thermogravimetric analysis indicate the contamination of
the chloride samples at pH levels of 7 and 8 with hydroxyls.

208 Chapter 9
The shrinkage and swelling of the interlayer is investigated by thermoporometry. First, the wet clays as prepared are examined by thermoporometry. Subsequently, the clays are
dried i) at room temperature, and ii) at an elevated temperature of 120 0 C. After drying
the clays are again suspended in water and re-examined with thermoporometry. Drying at
room temperature and subsequent swelling in water leads to the same ice-crystal diameter
of 4 nm as the fresh carbonate samples. Drying at an elevated temperature of 120 0 C and
re-wetting leads to an interlayer distance reduced to 70%.
The radii of the ice-crystals measured in the wet clays with thermoporometry are plotted
as a function of the ionic radii of the anions in the dry clays. The resulting plot points to a successful thermoporometric measurement of the interlayer spacing of the wet clays.
The amount shrinkage can be calculated by a simple formula, viz., shrinkage = 2 * Rn!(d(003)-4.8)' where 2Rn (A) is the diameter of the ice-crystal of the wet clay, and
d(003)-4.8 (A) the interlayer spacing of the dried clay. The amount of shrinkage of the
clays with the anions carbonate, oxalate, and chloride as presented in the plot is assessed
on 13, 11, and 9 times. The amount of shrinkage of the clays with the anions malonate, succinate, adipate, and sebasate is assessed on 11, 8, 7, and 4 times.
INTRODUCTION
Pillared hydrotalcite, which is an anionic clay, can be used as well for its catalytic activity as for its specific powder properties. Anionic clays have positively charged sheets
with anions located at the interlayer. Examples of catalytic activity of hydrotalcite clays
are 11 after calcination as catalyst for the aldol condensation in the vapor phase forming CH 3 CR =CH2-C =O-R from 2 moles of CH 3 C =O-R (Reichle, 1985). where R are aliphatic carbon chains, 21 oxidation of alkenes (2-hexene, cyclohexene) to alcoxides by hydrotalcite
intercalated with polyoxo-molybdate and tungstate. The thickness of the interlayer strongly
affects the performance of the catalyst (Tatsumi et aI., 1992), 3) use of hydrotalcite
exchanged with mono- and bicarboxylic acids for the production of tetraalcoxisilanes at temperatures between 80 and 200 0 C by re-esterification of tetramethoxy- or
tetraethoxysilane with alcohol and continuous removal of methanol or ethanol, 4) esterification of an alcoxide (R;-(O-CH2-CRjH)n-OH) with a polycarboxylic acid, for
example, citric acid in the presence of a calcined hydrotalcite (Bunte et aI., 1992). Powder properties of hydrotalcite are, 1) halide exchanger forming R;-Br and R(CI from
Ri-CI and R(Br where Ri and Rj are aliphatic carbon chains (Suzuki et aI., 1990). 2) addition
of Zn-hydrotalcite to halogen containing polymers as filler, UV-radiation stabilizer, chloride
scavenger, and thermic stabilizer (Endres et aI., 1992, lida et aI., 1992; lzuka et aI., 1992,
Ogawa et aI., 19921, 3) utilization as toner powder (Kumagai et aI., 1992). 4) utilization
as thixotropic agent in ceramic and glass compounds (Geismar et aI., 1992). and 5) the use as photo-active cis-phenyl-carboxyl-ethene (cinnamatel hydrotalcite (Valim et aI., 1992).
As said before, the performance of hydrotalcite as a catalyst is highly influenced by the

209 Shrinkage and Swelling of Pillared Hydrotalcite
interlayer spacing. The determination of the interlayer spacing before and after drying is
the main topic of this paper. A method to measure the interlayer spacing before drying in
water is thermoporometry. The technique can also be applied to dried clays rewetted in
water. Natural hydrotalcite minerals could have impurities and have no uniform structure.
Therefore, synthetic hydrotalcite minerals are prepared with various interlayer spacings.
The different interlayer spacings should be measured by the thermoporometric technique.
The paper contains the following sections, viz., 1) preparation of synthetic hydrotalcite and
incorporation into hydrotalcites of the anions carbonate, malonate, adipate, sebasate, and
chloride, 2) characterization of the hydrotalcite clay minerals with pillars of a desired size
by X-ray diffraction (XRO), transmission electron microscopy (TEM), infrared spectroscopy
(lR), thermogravimetric analysis (TGA), differential thermal analysis (OTA), and inductively
coupled plasma atomic emission spectroscopy (ICP-AES), 3) assessment of a possible
relationship between the size of the pores of wet hydrotalcite before drying by
thermoporometry and the interlayer spacing of hydrotalcite after drying by XRO, 4) the
investigation of subsequent swelling after addition of hydrotalcite powder to water by
thermoporometry, 5) determination the reversibility of the shrinkage and swelling
processes. The various structures of hydrotalcite incorporated with different anions are
discussed in the next section.
The structure of hydrotalcite, M96AI2(OH),6C03.4H20, is based on the brucite structure,
which consists of octahedra of hydroxyl ions sharing edges. The Mg 2+ ions are present in
octahedral sites. Replacement of one third of the Mg 2+ ions by A1 3+ ions causes the sheet
to have a nett positive charge. The positive charge is neutralized by (hydrated) anions
present in the interlayers between the sheets (Figure 1a). XRO demonstrates that Mg and
AI form a mixed sheet, because superlattice effects due to cation ordering among the
octahedral sites are observed by Serna et al. (1982) and Schutz and Biloen (1987). Feitknecht (1942) and Ross and Kodama (1967) incorrectly assumed that the AI ions
occupied positions somewhere between the brucite sheets within the interlayer.
In natural hydrotalcite, the molar ratio Mg/AI is restricted to 3 and the molar fraction AI
expressed as x=AI/(AI+Mg) is 0.25, the interlayer anion is restricted to coL and the
amount interlayer water 4 H20. A vacancy of one oxygen in the interlayer is calculated
with the rule 8-3(carbonate)-4(water) = 1. The synthetic hydrotalcites of Miyata (1980),
however, contain no oxygen vacancies because 5 H20 is incorporated, which yields the
result 8-3(carbonate)-5(water) = 0 vacancies.
Two rules have to be obeyed to prepare compounds having the structure of hydrotalcite
(Miyata, 1973), viz., i) the ionic radii of M 2+ and M3+ must not vary more than 30 % in
size, e.g., 0.65 A for Mg2+ and 0.45 A for AI3+, and ii) the solubility products S, and S2
of M2+(OH)2 and M2+C03 must satisfy 0 < pS,-pS2 < 10, where pS, is the negative
logarithm of the solubility product of M 2+(OH)2' 1.8.10-" mole3/-3of Mg(OH)2' and pS2 the
negative logarithm of the solubility product of M 2+C03, 1.58 * 10-6 mole 2(-2 of MgC03, thus
10.74-5.80 "" 5.

210 Chapter 9
A large variety of minerals exist with the general formula :
(1 )
where M2+ = Mg2+, NiH, ZnH , CaH , SrH , BaH, Cd2+, CuH , MnH , and M3+ = AI3+,
Fe3+, Cr3+, OH the hydroxyls of the double hydroxide sheet. The variable x represents the
molar fraction of M 3+ expressed as M3+/(M2+ +M3+), where x can be varied between 0.2
(Mg/AI =4) and 0.33 (Mg/AI =2) for synthetic hydrotalcite (Miyata, 1980; Reichle, 1986;
Misra and Perrotta, 1992). The anions, A, of which CO~- is preferred, counterbalance the
positive charge of the brucite-like sheets, where n is the charge on the anion, e.g., CO~-,
OH-, soL F, CI-, Br-, N02-, N03-, 1-, CI04-, V,oO~s-, M070~4-' Cr20~-, siOL HC02, w'201~-,
cinnamate, benzenedicarboxylate (Miyata, 1975; Twu and Dutta, 1990; Schutz and Biloen,
1987), and, finally, H20 interstitial water.
Some of the double hydroxide minerals are presented in Table 1.
Table 1 Some double hydroxide clay minerals of the pyroaurite-sjogrenite group.
3R-polytype 2H-polytype
Mg6Fe2(OH)'6C03.4H20
Mg6Fe2(OH),6CI2.4H20
Mg6Fe2(OH)'6(OH)2.4H20
MgsAI2(OH),6C03·4H20 M96AI2(OH),6S04.4H20 M96AI2(OH),6(OH)2.4H20
Mg6Cr2(OH)'6C03.4H20
Ni6Fe2(OH),6C03.4H20
Ni6Fe2(OH)'6S04.4H20
Ni6AI2(OH),6C03.4H20
Ni6AI2(OH),6S04.4H20
Ca6AI3(OH)20.25(C03)O.375· 7H20 Ca6AI2(OH),2(S04)3·26H20
pyroaurite
iowaite
igelstromite
hydrotalcite motukoreaite
meixnerite
stichtite
revesite
honessite
takovite
carboydite
hydrocalumite
ettringite
sjogrenite
manasseite
barbertonite
Allmann (1968) has extensively investigated the crystal structure of the mineral group.
Two poly-types or subgroups exist with different layer stackings, viz., the low-temperature
rhombohedral3R poly-type, and the high-temperature hexagonal 2H poly-type, with three
and two basal layers in one unit cell, respectively. The length of the crystallographic a-axis measures 3.102 A, and that of the c-axis 23.404 A. A three fold screw-axis is parallel to
the c-axis. The stacking of the centers of mass of the oxygens of the brucite-like sheet is

211 Shrinkage and Swelling of Pillared Hydrotalcite
-AB-BC-CA- (Figure 1al, and the hydroxyls of two adjacent brucite-like sheets, B-B, are
situated directly above each other. The oxygens of adjacent brucite sheets are separated
by 2.72 A. which is 0.2 A less than the ionic diameter of 0 2- in vacuum, which is 2.92 A.
In Figure 1b, the relative position of the oxygen of carbonate or water in the inter/ayer is
displayed.
A
b 3Mg (OH)2 • AI (OH); B
B
b 3Mg (OH)2 - AI (OH); C
C
b 3Mg (OH)2 - AI (OH); A
b =brucite - like sheet i = interlayer
Figure 1 (a) schematic reproduction of the hydrotalcite clay minerals showing the positively charged brucite sheet, containing Mg and Al, alternated by the interlayer of carbonate and water molecules.
The oxygens of the double hydroxide sheet are plotted as solid spheres, and the oxygen
of carbonate or water as a dashed sphere. The centers of mass of the oxygens of
interlayer carbonate or water occupy a site distributed 0.58 A from the bonding axis of
hydroxyls of adjacent brucite sheets (Taylor, 1973). The angle between bonding axis of
the brucite sheet and the line connecting the oxygen of the brucite sheet and that of
interlayer carbonate (or water) is 22°. The distance between the oxygens of the brucite sheet and of carbonate (or water) is 1.47 A.
The thickness of the brucite sheet can be calculated by 2 * (1 + "';(2/3» * the crystal ionic
radius of oxygen of 1.32 A, yielding the result 4.8 A. The value 4.8 Atogether with the
hydroxyl distance of 2.72 Aprovides the minimum basal d(003) layer thickness of 7.52 A. The basal thickness increases from 7.6 to 7.9 Awith a molar ratio Mg/AI rising from 211
to 5/1 (Taylor, 1973), and from 7.6 to 8.0 Awith a molar ratio NilAI rising from 211 to 5.611 (Kruissink et aI., 1981).

212 Chapter 9
I I I \ \ \ ,
'0:,:0'
\,.. .... X .' ".
a
"/ /
"" .......
a crystallographic a-axis, which measures 3,102 A
o oxygen of the double hydroxide, brucite-like sheet
() oxygen of the mixed H20 and CO~- interstitial layer
X one of the six sites at the centre of mass of the oxygen of interstitial H20 (or CO~-) of a distance 0,56 Aof the line
connecting B-B of adjacent layers (which is parallel to the C-axis)
Figure 1 (continued) (b) oxygens of the brucite sheet and oxygens of the interlayer, containing CO~- and H20. The centres of mass of the oxygens of C~- and H20 occupy one of the six sites distributed 0.58 A from the axis connecting the oxygens B-B of adjacent brucite sheets (parallel to the three fold axis).

213 Shrinkage and Swelling of Pillared Hydrotalcite
The affinity of hydrotalcite for specific anions is a function of i) the negative charge of
the anion, and ii) the size of the anion. The affinity decreases in the sequence
CO~-> OH-> SO~-> F-> CI-> Sr-> N03-> 1- (Miyata, 1983). Especially CO~- is incorporated in
hydrotalcite, because the molecule lies flat with each oxygen exactly on one of the six
sites distributed 0.56 A from the hydroxyl bonding axis (Figure 1b). A different sequence
of affinity has been published by Sish (1980), where the affinity decreases
CO~->N03->OH-==CI->SO~-. The difference might be attributed to the preparation
conditions. Special precautions have to be taken when other anions than CO~- are desired
between the brucite-like sheets. Atmospheric CO2 must be excluded from the reaction
mixture, and the value of pH level at which the precipitation is performed must be
sufficiently low, approximately 7. The low pH is explained by the ionization equilibria of
carboxylic acid in water, viz., the concentration of CO~- in water decreases at lower pH
levels (equations. 4 and 5) (Kruissink et aI., 1981) :
with pK, 6.4 (2)
with pK2 10.3 (3)
Carbonate can be removed from the interlayer by calcination at 380 0 C. A reversible
intercalation can be performed by dispersion of the calcined product in water, in which the
specific anion has dissolved (Tagaya et aI., 1992; Misra and Perrotta, 1992). The last
mentioned method enables the preparation of hydrotalcite with specific anions other than
carbonate. The incorporation of anions with large radii in the hydrotalcite structure tends to increase
the disorder of the brucite sheet (Miyata, 1983), because its thickness decreases in the
order CO~-, 7.65-2.72=4.93, F, 7.66-(2*1.33)=5, CI, 7.86-(2*1.81)=4.24, Sr",
7.95-(2 * 1.95) =4.05, 1-, 8.16-(2 *2.16) = 3.84 A.
MATERIALS AND METHODS
Sample preparation
The nomenclature of the hydrotalcite samples is based on the molecular structure of the
specific anions incorporated in hydrotalcite. The code of the bicarboxylic acid samples is
based on the length of the carbon chain, for example C2 for oxalate with two C-atoms. The hydrotalcite with chloride samples are denoted as CI- in combination with the
preparation pH of, for example, 7 as CI-7.

214 Chapter 9
- C1, ratio Mg/AI =2/1, hydrothermally aged hydrotalcite with carbonate.
An aliquot of 2 I of a hydrotalcite suspension containing 0.5 M Mg 2 +, 0.25 M AI 3
+,
1.75 M NaOH, and 0.47 M CO~- (sample 1) is prepared from MgCI 2.6H 20, AICI3 .6H20,
NaOH, and Na 2C03 .1 OH 20, according to the procedure of Reichle (1985). An amount of
24 9 of the hydrotalcite suspension is aged for 24 h at 200 0 C in a Teflon coated steel
pressure vessel of 48 ml. After hydrothermal treatment, the suspension is coofed,
centrifuged for 10 minutes at 10000 rpm, and the resulting anionic clay is dried at room
temperature.
- C1, ratio Mg/AI =3/1, pH-statically prepared hydrotalcite with carbonate at pH 10.
An amount of 40.6 g (0.2 mole) MgCI 2.6H 2 0 and 16.1 g (0.067 mole) AIC1 3 .6H20
dissolved in 270 ml H20 is added at a rate of 14.4 ml*h-1 to 800 ml H20 of pH 10±0.01
contained in a double walled precipitation vessel of 3.5 I kept at 25 0 C by a thermostat.
The pH of the suspension formed during the addition is kept at a constant level of
10 ±0.01 by computer controlled addition of 40 9 (1 mole) NaOH and 18.0 g (0.063 mole)
Na 2C03 .10H20 in 500 ml H20. After the addition of the AI-Mg solution has completed,
300 ml of the hydrotalcite suspension is centrifuged for 10 minutes at 3000 rpm,
separated from the fluid, re-suspended in water, and washed and centrifuged additionally
three times at 3000 rpm. Finally, the solid is dried at 120 0 C for a period of time of 18 h.
- C2-C1 0, ratio Mg/AI =2/1, bicarboxylic acid anion (CnH2n-40~-) analogues of hydrotalcite,
with carbon numbers n of 2 (oxalate), 3 (malonate), 4 (succinate), 6 (adipate), and 10
(sebasate)
A solution of 22.7 g (0.1117 mole) MgCI2.6H 20 and 12.7 9 (0.0527 mole) AICI 3 .6H20
in 70 ml H20 is brought into a 250 ml two-neck round bottom flask fitted with a N2 inlet
and stop (solution A), and is evacuated three times and kept under nitrogen. A second
solution (8) of 2.24 9 (0.0178 mole) oxalic acid dihydrate (C2H20 4.2H20) in 200 ml H20
is prepared in a three-neck round bottom flask of 500 ml fitted with a mechanical stirrer,
N2 inlet, and stop. Solid KOH (22.5 g, 0.401 mole) is added, and the white solution is
three times evacuated and stored under nitrogen. A third solution (C) of 6.34 9
(0.050 mole) oxalic acid dihydrate and 5.71 g (0.1018 mole) KOH in 200 ml H20 is stored
also under nitrogen.
The clear solution (A) is heated to 45 0 C on a water bath, and subsequently transferred
into 100 ml dropping funnel with care being taken to expose the solution exclusively to
nitrogen. The dropping funnel with (A) is attached to a 500 ml round bottom flask
containing solution (8) again preventing contact with atmospheric air. Solution (A) is
subsequently added to (B) in a period of 1 h, and (B) is stirred for 30 minutes.
Centrifugation at 3700 rpm for 10 minutes results in a white anionic clay, which is added

215 Shrinkage and Swelling of Pillared Hydrotalcite
to solution (C) under nitrogen. After the addition is complete. the mechanical stirrer fitted
to the round bottom flask containing solution (C) is replaced by a reflux cooler under
nitrogen. The suspension is refluxed at 101 0 C for 16 h, cooled, and centrifuged for
10 minutes at 3700 rpm. After three washings with evacuated water and centrifugations
at 3700 rpm for 10 minutes. the anionic clay is dried at 125 0 C. An aliquot of 80 ml of
the anionic clay suspension is stored for thermoporometric purpose.
Hydrotalcite anionic clays with malonate (n = 3), succinate (n = 4), adipate (n = 6), and
sebasate (n = 10) as interstitial anions are prepared analogously according to the above
procedure , with the difference that the solutions (8) contain 0.0252 mole of the
bicarboxylic acids.
- CI-1 0 to CI-7, ratio Mg/AI = 3/1 , pH-static prepared chloride analogues of hydrotalcite at
pH 10 to 7.
The chloride analogues are prepared according to the same procedure as the hydrotalcite
prepared at the fixed pH level of 10, except for the fact that a carbonate-free 2 M NaOH
solution is added to the Mg-AI solution in a 3.5 I precipitation vessel, kept under nitrogen.
The water has previously been boiled to remove CO 2 , The pH of the Mg-AI solution is kept
ata constant level of 10±0.01. 9±0.01, 8 ±0.01. and 7 ±0.01 by a computer controlled
addition of the NaOH solution. An aliquot of 300 ml of the suspension is centrifuged for
10 minutes at 3000 rpm. washed with CO 2-free water, and centrifuged again. The
procedure is repeated twice. Finally. the anionic clay is dried at 120 0 C for 20 h. A small
amount of the wet anionic clay is stored for examination by thermoporometry.
Measurement of the amountofshrinkage and swelling by thermoporometry
The heat flux accompanying freezing of water and melting of ice within hydrothermally
aged C1 (ratio Mg/AI=2/1) is measured as a function of temperature within a Setaram
DSC 111. Differential Scanning Calorimeter (DSC). 140 mg H2 0 is added to 125 mg C1
(ratio Mg/AI = 2/1) before examination by thermoporometry.
An amount of 31.6 mg of the centrifuged wet anionic clay samples C1 (pH statically
prepared Mg/AI=3), C2 to C10, and CI-10 to CI-7 (series W) is measured, containing
about 5.5 mg dry solid and 26.1 mg water. The samples hydrothermally aged C1, pH
statically prepared C1. and C10 are dried first, rewetted by addition of 17.5 mg water to
15.9 mg solid, and measured after several weeks by thermoporometry (series D).
The anionic clay suspensions (series Wand D) are inserted into an aluminum sample pan,
and the heat-fluxes at temperatures below 0 0 C are measured with a Netzsch 200 DSC
and a model 43 measuring cell (Selb. Germany). The following measuring sequence is
applied 1) cooling from 20 to -60 0 C at a rate of -2 °C *min", 2) heating from -60 to
2.5 0 C at a rate of 1 °C *min", measuring the melting peak of pore ice, 3) cooling from

216 Chapter 9
2.5 0 C to -60 0 C at a rate of -1 0 C *mino' , measuring the freezing pea k of pore water, and,
finally, 4) heating from -60 to 20 0 C at a rate of 1 °C *mino1 , measuring the melting peak
of both pore and bulk ice outside the pores of the solid.
The crystal radius R (in nm) of ice formed in the pores of the anionic clay is a functionn
of the freezing point depression dT (in °C) by R = 64.67 *dT1 - 0.23. The specific poren
volume V n (in ml*go') is the division of the amount frozen water, IP*dt/(H*D). by the
weight of the solid, W, by V n = IP*dt/(H*D *W), where P is the heat-flux (J/s), dt the time
interval (min). H the ice-water transformation enthalpy (Jig). D the density of ice (g/mll.
Characterization of the dried anionic clays
XRD patterns are recorded on a Guinier-Johansson camera (CUKa ,l of 1.5406 A). TEM
micrographs and electron diffraction patterns are recorded with a Philips EM 420
transmission electron microscope. A suspension of the anionic clay in ethanol is, therefore,
ultrasonically treated. A droplet of the suspension is brought upon a holey carbon film
supported on a copper grid, and air dried. The TEM is operated at a voltage of 120 kV.
The reflections against the lattice planes of a spacing d (in A) are inversely proportional to
the radial distances, I, of the diffraction maxima on the film (in mm) with a constant of 211.9 * 10013 m as calibrated with a gold film. The diffraction points are indexed using
equation 4 of hydrotalcite, and equation 5 of the hexagonal supercell of hydrotalcite with
a molar ratio Mg/AI of 211 (Figure 2a).
(4)
where a = 3.102 A, and c = 23.404 A
(5)
where a' = -../3*a 5.37 A.

217 Shrinkage and Swelling of Pillared Hydrotalcite
A
Mg2+/AI3+ = 2/1 o = Mg2+
• = A13+
o = Mg2+
• = A13+
Figure 2 Supercells of hydrotalcite due to cation ordering among the octahedral sites, (a) molar ratio Mg/Al =211 , hexagonal with a*=.j3a=5.73 A, and c=23.404 A, (b) molar ratio Mg/Al=3/l, orthorhombic with a* = 3a = 9.31 A, b = 2.j3a = 10.75 A, and c=23.404 A.
B
Mg2+/AI3+ = 3/1
a* = 3a

218 Chapter 9
-stoichiometry
The molar ratio Mg/AI in the precipitates and the amount of bonded water expressed as
wH20 in M9s_sxAlsx(OH),a(C03)sx/2_wH20 is assessed by ICP-AES and TGA_ For ICP-AES
measurements, amounts of 50 mg of each anionic clay, viz., the samples C1 (Mg/AI =3),
C2 to C1 0, and CI-1 0 to CI-7, except of hydrothermally aged C1 (Mg/AI = 2) are suspended
in 100 ml 0.1 M HN03, forming clear solutions (except of the samples C10 and CI-7
forming suspensions). An aliquot of 10 ml of the solution thus obtained is diluted to
100 ml with 0.1 M HN03. The concentrations of [Mg] and [AI] (in mg metal *1-') are
measured within a 34000 Applied Research Laboratories instrument (Valencia, U.S.A.).
From the concentrations [Mg] and [AI] the amount water, w, in the initial 50 mg
hydrotalcite is calculated. The molar ratio Mg/AI is calculated from the measured
concentrations [Mg] and [AI] according to molar ratio Mg/AI = ([Mg]/[AIJ) * 1.11.
TGA-DTA profiles of about 32 mg of the dried samples in a nitrogen flow of 50 ml*min-'
are measured from 20° to 713° C at a rate of 5°C*min-' within a Dupont 951
thermogravimetric analyzer (Wilmington, U.S.A.), and a Dupont 1200 DTA cell,
respectively. The data of TGA and DTA experiments are collected by a Dupont 1090
thermal analyzer.
RESULTS
Structure of hydrotalcite precipitates investigated by XRD, TEM, and IR
-XRD
The XRD reflections of the differently pillared hydrotalcite samples are recorded in
Table 2. The two d(003) reflections, viz., 7.7 and 7.89 A, of the samples C1 are typical
for hydrotalcite with carbonate in the interlayer but with different Mg/AI ratios of 2/1 and
3/1. The d(003) spacing is increasing with a decreasing amount of AI.
Incorporation of large bicarboxylic acids, as in samples C2 to C6, causes the d(003)
reflections to increase from 10.04 A of C2, oxalate, to ± 10 A of C3, malonate, to
12.40 A of C4, succinate, to 13.15 A of C6, adipate. A layer distance of 18.84 A is
calculated from the d(006) reflection of C1 0, sebasate, by 2 *d(006), Additional d(Q03)
reflections, respectively, 8.32, 9.27, and 11.78 A are measured with the hydrotalcite
samples incorporated with C3, malonate, C4, succinate, and C6, adipate (Table 2). The
additional reflection d(003) of 7.85 A of the hydrotalcite sample incorporated with C6,
adipate, is explained by contamination of the C6 sample with carbonate.

219 Shrinkage and Swelling of Pillared Hydrota/cite
Table 2 X-ray diffraction diffraction values dIAl of synthetic pillared hydrotalcite clay
minerals with interstitial bicarboxylic anions with carbon numbers, varying from
1 to 10.
Hydrotalcite, hexagonal a = 3.102 A, c == 23.404 A (JCPDS file No 22-700 and 14-191 I
C1(Mg/AI == 2) 1110 C1 (Mg/AI =3) 1110 C2 1110 Ref. 1110 hkl
7.7 7.89 100 10.04 100 7.84 100 003 5.5 3.85 3.95 60 4.98 60 3.90 60 006
2.62 ,012 2.61 2.61 70 3.30 10 2.60 40 L009 2.55* 2.56 5 103'? 2.34 2.33 55 2.33 25 015 1.99 1.98 50 1.99 30 018 1.95 1.95 6 0012
1.74 10 1.75 10 1010 1.67 10 1.65 10 0111
1.525 1.54 50 1.52 35 1.541 35 110 1.496 1.51 50 1.50 20 1.498 25 ,113
L1013 1.418 1.43 10 1.41 5 1.4198 0114 1.32 * 1.33 5 203·? 1.31 1.302 6 001§ 1.276 1.28 20 1.265 10
C3 1110 C4 1110 C6 1110 C10 1110 hkl
.±10 -,
.±8.32...J 100 12.40-,
9.27 ...J 70 100
13.15-, 11.78 I
100 80
003
7.85 ...J 25 5.06 30 6.15 10 6.55 10 9.42 - 006 4.58 20 4.59 35 4.99 3 3.60 5 4.09 5 4.56 10 6.42 - 009 3.17 15 2.57* 55 103'? 2.34 15 2.28 5 015 2.15 10 2.14 5
1.97 10 018 1.85 10 1.89 10
1.62 5 0111 1.53 95 1.52 55 1.52 85 1.52 - 110 1.51 60 1.48 30 ,113
L101~ 1.31 10 1.31 10 0018
1.24 15
• hexagonal supercell a' = 5.37 A. c = 23.404 A (Fig. 2)

220 Chapter 9
In Figure 3, a linear curve results when the measured d(003) spacings are plotted against the carbon numbers n of Cn, intersecting the y-axis at 6.9 A. The spacing of 2 *d(006) plotted against the carbon numbers yield an identical line. The data set of Miyata (1973) has also been plotted in Figure 3. A second curve is constructed with the additional d(003) reflections, respectively, 8.32, 9.27, and 11.78 Aof the hydrotalcite samples incorporated with C3, malonate, C4, succinate, and C6, adipate. The second curve represented in Figure 3 is not observed by Miyata, and is situated below the upper curve. The curve is intersecting the y-axis at a relative low value of 4.7 A. The slope of the upper and lower curve is equal. The difference in d(003) spacing between the upper and the lower curve is, therefore, consequently constant on 2.2 A.
The slope of the upper and lower line in Figure 3 corresponding to 1.16 and 1.1 7 A/cnumber, respectively, is close to that of the product of the C-C distance with the sinus of the valence angle, which is 1.54*sin(110/2) =1.26 A/C-number. The intersection of the lower line with the y-axis, representing the d(003) spacing, is close to the thickness of the brucite sheet of 4.8 A, calculated with the ionic radius 1.32 Aof oxygen. The upper line evidently represents more than the thickness of the brucite sheet. Maybe, the bicarboxylic acids are present together with one carbonate ion or a water molecule at the interlayer. The existence of carbonate in sample C6 is demonstrated by the reflection at 7.85 A measured by XRD, but carbonate is not incorporated in every crystallite.
2O-,---------------r---------------,
o reported by Miyata, 1973 19
C d(003) 16 • 2*d(006)
17
16
15
.;;: 14 c:
~ 13 o e. 12 "0
"i Cl
11
'0 10
9
6
7
5
23456789 10 11
carbon number of bicarboxylic acid anions
Figure 3 Sheet distance d(003) and 2*d(006) as a function of the carbon number of the bicarboxylic acids with two lines of the layer distances (brucite sheet + interlayer) against the carbon numbers with the same slopes of 1.17 Ale-number, but cutting the y-axis at 6.9 and 4.7 A, respectively.
4+----,-----,----,--,----,------,-----,----,--,----,------1

221 Shrinkage and Swelling of Pillared Hydrota/cite
In table 3, the chloride samples prepared at the different pH levels of 10, 9, 8, and 7 have a d(003) reflection decreasing from 8.08 to 7.82 A at a pH level decreasing from 10 to 7. An exception is sample CI-8, which has a relative large d(003) spacing of 8.20 A.
Some XRD reflections marked with an asterisk in Table 2 and Table 3 cannot readily be explained and are attributed to superlattice reflections (Figure 2a and 2bl. The reflection at 2.56 A of the hydrothermally aged carbonate C1, the oxalate C2, and the malonate C3 is ascribed to a reflection from a hexagonal supercell, while the reflections 4.51 , 4.49, and 4.41 A of the chloride samples CI-9, CI-8, and CI-7, respectively, are attributed to reflections from an orthorhombic supercell (Figure 2b).
Table 3 X-ray diffraction values dIAl of synthetic pillared hydrotalcite clay minerals with
interstitial chloride prepared at different static pH values of 10 to 7.
, orthorombic supercell a'=9.31 A. b=10.75 A, c=23.404 A (Fig. 2)
-TEM
In Figure 4a-c the TEM micrographs of the hydrothermally aged carbonate sample C1
with a ratio Mg/Al of 2 show the hexagonal platelike crystals of a dimension between 300 and 900 nm. In the electron diffraction patterns of hydrotalcite, strange indices, such as,
(-1/3,2/3,0), (-2/3,1/3,0) appear(Figure 4cl. TheTEM reflections (-1/3,2/3,0), (-2/3,1/3,0)
can be ascribed to (1,0,0), (0,1,0) reflections of a hexagonal supercell using equation (5). TEM micrographs of hydrotalcite with the interstitial succinate C4 (Figure 4d and e) show
lattice fringes when the electron beam is approximately perpendicular to the c-axis. The

222 Chapter 9
distance between the fringes is 20.7 A. The distance of 20.7 A is about equal to d(002) of hydrotalcite with the anion succinate. which is 37.2/2 = 18.6 A (Table 2). The
interlamellar distance of 37.1 Aof adipate (C6) (Figure 4f and g) is close to the 3 *d(003)
of 3 * 13.15 =39.5 A. The fringes of the sample with adipate are irregular with respect to
those of the sample with succinate. No fringes can be seen in the micrographs of the
sample with sebasate. A TEM micrograph of the hydrotalcite C1 prepared at pH 10
displays thin flakes of material (Figure 4h).
Figure 4

223 Shrinkage and Swelling of Pillared Hydrotalcite
Figure 4 TEM micrographs and electron diffraction patterns of hydrotalcite samples : a) hydrothermally aged 24 h at 200° C with carbonate, magnification to the film 18000 times, b) 70000 times, c) 18000 times.

224 Chapter 9
Figure 4 (continued) Cl hydrothermally aged.

225 Shrinkage and Swelling of Pillared Hydrotalcite
Figure 4 (continued) hydrotalcite d) with succinate (C4) 70000 times, e) C4, 32000 times.

226 Chapter 9
Figure 4 hydrotalcite with interlayer f) adipate (C6) 54000 times, g) C6, 92000 times.

227 Shrinkage and Swelling of Pillared Hydrotalcite
Figure 4 h) hydrotalcite with interlayer carbonate at pH 10, 54000 times.
-IR
The IR spectra of the samples (25 wt% in KBr) of hydrotalcite containing the anions
oxalate, malonate, succinate, sebasate, and chloride at pH 10 and at pH 8 (C2-4, C6, Cl
10, CI-8) are shown in Figure 5. The peaks and the relative intensities of the hydrotalcite
with bicarboxylic acid samples are interpreted in Table 4, and that of the hydrotalcite with
chloride samples in Table 5. The maximum of the broad OH stretching vibration band of
the brucite sheet is slightly shifted from 3550 to 3450 cm-1 from carbonate (C1) to
sebasate (C10) (Table 4). Water is present in the anionic clays, as shown by the H20
bending vibration at 1650 cm-1 of the bicarboxylic acid samples, and at 1635 cm-' of the
chloride samples (Tables 4 and 5). The vibrations of the carboxylic groups in the region
1505 to 920 cm-1 are seen in the spectra of the series from carbonate to sebasate, and,
remarkably, also in the spectra of the chloride samples. Some carbonate is, therefore,
incorporated in the chloride samples, but not sufficiently to observe the CO~- to H20
bridging band at 3050 cm-'. The CO~- to H20 bridging band at 3050 cm-' is visible in the
carbonate (C 1) spectrum, but not in the spectra of the chloride samples CI-1 0 to CI-7 and
also not in the spectra of oxalate to sebasate (C2 to C1 0). The C-H stretching vibrations
at 2922 and 2865 cm-1 of the carbon chains of the carboxylic acids is detectable in the

228 Chapter 9=-------------------------
4000 3500 3000 2500 2000 1800 1600 1400 1200 1000 800 600 400
wavenumber (cm-1 )
Figure 5 IR spectra of the samples containing oxalate, malonate, succinate, sebasate, and chloride at pH 10 and 8.
spectra of the samples C1 to C1O. The very weak C-H vibrations at 2922 and 2865 cm-'
of carbonate C1 is attributed to carbonate in the proximity of hydroxyls of the double
hydroxide sheet. In contrast, the C-H stretching vibrations at 2922 and 2865 cm-1 of
hydrotalcite with sebasate is especially strong due to the length of the carbon chain
(Figure 5). The C-C vibrations of the carbon chains range from 1625 cm-' of oxalate (C2)
to 1572 em" of sebasate (C 10). The C-C vibration is, as to be expected, absent in the
spectra of the carbonate sample C1 and the chloride samples CI-10 to CI-7.
In Figure 5, the Mg-O stretching vibration at 660 em" and AI-O stretching vibration at
450 cm" of the brucite-like layer are strong with the anion carbonate to sebasate samples
2 to 7, but weak for the chloride samples 8 to 11, which indicates a poor crystallinity of
the chloride samples. The poor crystallinity may be due to the reduced thickness of the brucite sheet of 4.24 Aagainst a value of 4.8 Afor hydrotalcite with carbonate (Miyata, 1983).

Shrinkage and Swelling of Pillared Hydrotalcite 229
Table 4 Infrared spectroscopy of hydrotalcite samples with interstitial carbonate prepared
at the static pH of 10 (C 1), oxalate (C2), malonate (C3), succinate (C4), adipate
(C6), sebasate (C 10) (Kruissink et aI., 1981; Sish, 1980; Miyata, 1975).
wavenumber (cm-') sample 2 3 4 5 6 7
C1 C2 C3 C4 C6 C10
OH-stretch. 3550b 3500b 3460b 3450b 3440b 3450b
CO~- to H2O 3050sh
bridging
C-H r I 2922VW 2940W 2940vW
2995w
2940W 2960w 2950s
(CH 2) L 2865vW
2000sh 2865w
2075'h 2865vW
2100'h 2865W
2180w -sh
2870w
2200'h 2865'
1920'h 2000w -sh
H20 bending 1650' 1650b 1650sh 1650'h 1650'h
C-C 1625b 1592' 1575' 1565s 1572'
CO~- 1505'h stretching 1440' 1440' 1440sh 1460sh 1450'h
CO~- (n3 ) 1378' 1380'h stretching 1339' 1363s 1425' 1415s 1420s
1328w 1340w 1340w
1315sh
1280m 1300m 1320w
1160w 1190m 1235m 1265w 1265w
1218w
1180'h 1110w
1120'h 1160sh 1148w
1050sh 1065sh 1070sh 1060sh
958sh 970sh 960sh
935 sh 920'h
CO~- (n 2 ) 850sh 810sh 780sh 175m 775'h
Mg-O 650' 675'h 670'h 660m 670s 670m
stretching 565m
500'h 565 m
500'h 565 m
490sh 560m 560w
470'h AI-O out of 450m 455' 450' out of 450S
stretching range range
• strong, m medium, w weak, vw very weak, sh shoulder, b broad

230 Chapter 9
I Table 5 Infrared spectroscopy of hydrotalcite samples with interstitial chloride prepared
at the static pH of 10 (CI-1 0). 9 (CI-9). 8 ICI-8). and 7 (CI-7) (Kruissink et aI.,
1981; Sish, 1980; Miyata, 1975) ..
wavenumber (em"')
11
CI-7
3490 b
-
2935w
2865w
1635sh
-1500sh
1380sh
1160sh
1030sh
975'h
550'h 455m
sample
OH-stretching CO~" to H2O bridging
I C-H I (CH 2) L
H20 bending C-C CO~"
CO~" (n3 )
CO~" (n 2 )
Mg-O stretching
AI-O stretching
8
CI-10
3510b
-
2932w
2865w
2000sh
1635m
-1495sh
1380sh
860'h
650b
420b
9
CI-9
3440b
-
2926w
2856w
2000sh
1635m
-1500sh
1400sh
1370m
850sh
620'
out of range
10
CI-8 ~
3475 b
-
393r
2865w
2050sh
1640m
-1500sh
1380m
1030m
860sh
560sh
452m
s strong, m medium, W weak, vw very weak, sh shoulder, b broad

231 Shrinkage and Swelling of Pillared Hydrotalcite
Stoichiometry investigated by ICP-AES, TGA, and DTA
The molar ratios of Mg/AI of the anionic clay precipitates dissolved in acid solution and
measured by ICP-AES are listed in Table 6. The molar ratios of Mg/AI of the precipitates
are compared with those of the initial solutions. The molar ratio Mg/AI of 2.99 of the pH
static prepared hydrotalcite with carbonate sample C1 is equal to that of the initial
solution, which is 3. The molar ratio Mg/AI of 3.07 of hydrotalcite with chloride CI-10 is
also equal to that of the suspension, but decreases at lower levels of the pH during
preparation to a value of 1.42 of hydrotalcite with chloride CI-7. The hydrotalcite with
chloride sample prepared at a pH level of 7, CI-7, contains an excess of aluminum. Excess
aluminum is also measured for hydrotalcite with malonate C3 to adipate C6 (Table 6). The
mean value of Mg/AI of 1.8 of the solid is low with respect to that of 2 of the suspension.
In contrast, the molar ratio Mg/AI of 2.13 of hydrotalcite with oxalate C2 is high with
respect to the molar ratio of 2 of the initial solution. An excess of Mg is measured.
After determination of the ratio Mg/AI, the stoichiometric amount of water, w, in the
interlayer of Mga_axAlax(OH),6(Aax/n).wH20 is calculated. The value of w scatters between
1.5 and 12.8 (see table 6 and 8). The relative high value of 17.8 of the insoluble hydrotalcite with chloride sample CI-7 is unreliable.
Table 6 Reconstructed stoichiometry of pillared clay samples from ICP-AES data of a
solutions of 50 mg clay in 1 I 0.1 M HN03.
solid IMg]' lAW molar ratio Mg/AI stoichiometry with (mg/l) (mg/l) (mg/ll theor. exp3. assumption that solid is clay
C1 54 12.35 4.58 3 2.99 Mg6AI2(OH)'6C03·5.8H20 C2 48 8.65 4.53 2 2.13 M95.44AI2.56(OH) '6(C20 4) ,.la· 8. 2H2O C3 56 8.15 5.15 2 1.76 Mg5.lOAI2.90(OH)'6(C3H204k45·12.8H20 C4 51 9.04 5.59 2 1.80 M95.,4AI2.a6(OH),6(C4H404), .43.4·0H2O
C6 61 9.25 5.46 2 1.88 Mg5.24AI2.76(OH)'6(C8Ha04),.3a·9.3H20
CI-10 63 14.305.17 3 3.07 Mg6.o4AI,.96(OH)16CI,.96·5.8H20 CI-9 58 12.44 5.23 3 2.64 M95aoAI2.2o( 0 H), 6CI2.2o' 6 .OH 20
CI-8 51 7.36 8.74 3 0.94 Mg3.a7AI4.'3(OHl,8CI4.'3·1.5H20 CI-74 (53) 6.65 5.17 3 (1.42) (M94.7,AI3.29(OH),6CI329' 17 .8H2O)
1) Mw Mg =24.3 g/mole 2) Mw AI =27.0 g/mole 3) expo molar ratio = ([Mg]/[AI))"1 .11
4) qualitative

232 Chapter 9
Figure 6 shows the temperatures of four TGA and DTA peaks exhibited by the samples,
viz., the loss of interstitial water (endotherm) at about 2150 C for the carboxylic
samples C1, C3, and C6, and at about 2700 C for the chloride samples CI-8 to CI-7, an
endothermic dehydroxylation step of OH bound to AI (gibbsite) at about 3300 C of the
carboxylic samples, and at about 3600 C of the chloride samples, an endothermic dehydroxylation step of OH bound to Mg (brucite) at about 4050 C of the carboxylic and
chloride samples, about 600 C above the dehydroxylation step of OH bound to gibbsite,
and an exothermic oxidation step of the carbon chain of the carboxylic acid samples C3,
C4, and C10. The dashed lines in Figure 6 assume a constant difference of the temperatures of the four TGA and DTA peaks.
600 ¢ exothermic oxidation of -CH2- b. gibbsite dehydroxylation
o brucite dehydroxylation (& loss of carbonate) o loss of the interlayer water
500
410°C
~ 400
'" ..:~
'§ ::>
360"C
c. '" E 300 J!!
noH.P .. no H20
...... '""', no H20
,...",.-' " .... " " ,'"
200
CI-10 9 8 7 100 +---,------,.--,---,-----,--'--,---,------,-----1
Cl C2 C3 C4 C6 C10
Figure 6 TGA and DTA analysis of the samples carbonate to sebasate and chloride at a pH level of 10 to 7.
-hydrotalcite with bicarboxylic acid anions
The brucite dehydroxylation temperature for the samples C2, C4, and ClOis relatively
high when no loss of interlayer water is measured (squares in Figure 6). As mentioned, the
temperature of dehydroxylation of gibbsite (triangles in Figure 6) is situated about 600 C
under the temperature of dehydroxylation of brucite, except with the samples C4 and C10
that exhibit an even lower temperature of dehydroxylation of gibbsite as displayed by the arrows in Figure 6. The oxidation temperature of the carbon chain increases with increasing chain length from C3 to C1O. The oxidation of C6 is not observed.

233 Shrinkage and Swelling of Pillared Hydrotalcite
-hydrotalcite with chloride anions
The temperature of dehydroxylation of brucite of CI-1 0 at 410 0 C is 50 0 C above the
temperature of dehydroxylation of gibbsite, but decreases when the pH level during low
preparation pH from 10 to 7 (CI-10 to CI-71, where the gibbsite dehydroxylation
temperature at about 350 0 C is slightly increasing with 10 0 C. The experimental weight losses of both the bicarboxylic and chloride anionic clays (in %)
due to the loss of interlayer water (W1 I, dehydroxylation gibbsite (W2) and brucite (W3),
and oxidation of the carbon chain (W4) are presented in Table 7. The theoretical weight
losses are calculated using the proposed stoichiometric reactions under Table 7. For the
sake of simplicity, the stoichiometric amounts of Mg and AI are those of the initial
solutions, and not those of ICP-AES.
In table 8, the DTA-TGA analysis yields values, w, of bonded water in
M9sAI2(OH),s(Ax/n).wH20 between 0 and 5. The amounts of water are different from the ICP-AES results and seem to be restricted to 1,3, or 5 H20, while the values calculated from the ICP-AES data results in values between 1.5 and 12.8 (Table 81, clearly measuring
interlayer water as well as the amount of water adhering to the anionic clays.
Shrinkage and swelling as a function of the hydrotalcite anions
The thermoporometry results of the wet (W) samples show values of Rn, ranging from 0.9 to 3.1 nm, and values of Vn from 0.013 to 0.58 ml*g". The mean value Vn of
0.36 ml*g" of the wet (W) samples C1 to CI-7 (2 to 11 in Table 9) is high as compared
to that of the dried samples. The mean value of the shape factor F of both the wet (W) and dried (D) samples is 1.7, which is between that of a purely cylindrical (F =2) and spherical (F = 1) pore shape.
The dried (D) samples exhibit values of Rn from 1.4 to 2.2 nm, and values of Vn from 0.025 to 0.44 ml *g" (Table 9). The mean value Vn of the dried pH statically prepared
sample C1 (D) and the sample C1 0 (D) dried at 120 0 C is 0.026 ml *g".

234 Chapter 9
Table 7 TGA and DTA analysis of pillared hydrotalcite clay minerals with (i) interstitial
bicarboxylic anions with carbon numbers, varying from 1 to 10, C1 to C1 0, and
(ii) chloride prepared at static pH values of 10 to 7, CI-10 to CI-7.
C1 C2 C3 C4
sample
C6 C10 CI-10 CI-9 CI-8 CI-7
W1 W2
W3 W4
10 , 128
...J
, 137
...J
experimental weight loss (%)
3 4 , 10, , , , 1 I 132 1 I 31 137 14 139 ...J 149 ...J
...J 15...J ...J
, 1 31
...J
11 , 1 15
...J
16 , I 14
...J
W1 W2
W3 W4
theoretical weight loss (%) calculated with quoted formula 9' 34 4 7 10'1 , , , , , , , , 1322 I 41 3 I 41 5 I 143a I 137 10 I 37 10 ?
...J ...J ...J 141 6 ...J 1539 ...J ...J ...J ...J
1612
W1 loss of interlayer water, W2 structural water bound to AI (gibbsite), W3 structural water bound to Mg (brucite!. W4 oxidation of CH2 chain.
Mw = molar weight 1) Mw(3H20)/Mw(M96AI2(OH)'6C03.3H20) * 100 (%) 2) Mw(8H 20 +C02)/Mw(M96AI2(OH),sC03.3H20) * 100 (%)
3) Mw(8H20 + 1.33CO + 1.33C02)/Mw(Mg5.32AI2.ss(OH) lS(C20 4)1.33) * 100 (%)
4) Mw(H20)/Mw(M95.33AI2.6s(OH),s(C3H204)1.33.H20) * 100 (%)
5) Mw(8H20+4CO)/Mw(M95.32AI2.S6(OH)16(C3H204),.33.H20) * 100 (%) 6) Mw(10.6H20 + 1.33CO +4C)/Mw(Mgs.32AI2.66(OH) 1S(C4H40 4),.33) * 100 (%)
7) Mw(1.5H20)/Mw(M9s.33AI2.S6(OH)16(CsHa04l,,33.1.5H20) * 100 (%)
8)Mw(1 0.6H 20 + 5.32C + 1.33CH4+ 1.33CO)/Mw(M95.32AI2.SS(OH) 1s(C6Ha04l,,33.1.5H20) * 100 (%)
9) Mw(12H20 + 6.6C + 6.6CH4)/Mw(Mgs.32AI2.66(OH)16(C10H1604)1.33) * 100 (%) 10)Mw(7H20 + 2HCI)/Mw(MgsAI2(OH)'6CI2) * 100 (%)
11)Mw(5H20)/Mw(M96AI2(OH)1SCI2.5H20) * 100 (%) 12)Mw(3H20)/Mw(MgsAI2(OH)'6CI2.3H20) * 100 (%)

235 Shrinkage and Swelling af Pillared Hydratalcite
DISCUSSION
Assignment of thermoporometric Rn values to pores containing specific
anions
It is proved by XRO and IR spectroscopy, that the anions carbonate, malonate.
succinate. sebasate. and chloride are incorporated with minor contaminations in
hydrotalcite. The layer distances d(003) and 2 *d(006) increase with the carbon number
of the bicarboxylic acid anions. Also the layer distances of the chloride containing samples
(ionic radius 1.81 A) are larger than that of that of the carbonate (ionic radius 0 2- 1.46 A)
containing hydrotalcites.
The values of Rn in the wet anionic clays are attributed to water in interlayer pores
containing a specific anion. The peaks in the thermograms are attributed to the ice crystal
radii, Rn • indicative for the sheet distances in water ("" 2Rn). The effect of a possible nonfreezing layer appearing at the hydrotalcite-water interface is not considered here. The
values of Rn of hydrothermally aged Cl with a molar ratio Mg/AI of 2/1, containing
carbonate, which is dried at room temperature (0) and rewetted, are 1.9 and 2.2 nm (Table 9). The mean value of 2.05 nm is ascribed to water in the pores containing
carbonate. The sheet distance in water is. therefore, 2 * 2.05 "" 4 nm. A second ice crystal radius Rn of 1.0 nm of Cl (W) in water prepared at the statically
pH level of 10 (Mg/AI =3/1) points to a second, smaller anion present in the pores. and is
assigned to pores containing OH. Ice crystal radii, Rn , of values of 3 nm are measured with the wet (W) hydrotalcite
samples containing bicarboxylic acid anions, C2 to Cl O. The value of Rn is surprisingly
constant with increasing carbon chain of 2 to 10. The carbon chains, originally
perpendicular to the basal layers in dried hydrotalcite, are assumed to rotate into flat
positions between the sheets in water.
For the chloride samples, two sets of values of Rn are observed for CI-l0 to CI-7, viz.,
1) a decreasing Rn of 1.6 to 1.3 nm from pH 9 to 7, with a mean value of 1.43 nm, and
2) a small Rn of 1.0 ±0.1 nm, not observed for sample CI-9. The Rn of 1.43 nm is ascribed
to ice nuclei in the pores containing chloride. The Rn of 1.0 nm is again ascribed to ice in
the pores containing OH-. The decrease of d(003) from 8.08 to 7.82 Awith declining pH
from 10 to 7, indicates that chloride is incorporated at high pH and hydroxyls at low pH.
This is in agreement with the loss of interlayer water (hydroxyls) of the samples prepared
at the low pH values of 7 and 8 determined by OTA and TGA analysis (Figure 6).

236 Chapter 9
Table 8 Comparison between the stoichiometry of the clays obtained by ICP-AES and
TGA/DTA analysis
sample technique stoichiometry w.H2O w=
C1 ICP-AES MgsAI2(OH),sC03 5.8 TGA/DTA MgsAI2(OH),sC03 3
C2 ICP-AES Mg5.44AI2.5S(OH), S(C20 4),.,s 8.2 TGA/DTA Mg5.32AI2.SS(OH),S(C204)' .33 0
C3 ICP-AES M95., oAI2.90(OH),S(C3H204)'.45 12.8 TGA/DTA Mg5.33AI2.SS(0H) lS(C3H20 4) 1.33 1
C4 ICP-AES Mg5.'4AI2.se(OH),e(C4H404)'.43 4.0 TGA/DTA Mg5.32AI2.ee(0H), e(C4H40 4)'.33 0
C6 ICP-AES M95.24AI2.7e(0 H) lS(CeHs0 4), .3S 9.3 TGA/DTA Mg5.33AI2.ee(OH),e(CeHe04)' .33 1.5
Cl0 ICP-AES TGA/DTA Mg532AI2.es(0H), s(C, oH, sO4) 1.33 0
CI-l0 ICP-AES MgS.04AI,.ge(OH), sCI, .ge 5.8 TGA/DTA MgeAI2(OH),sCI2 0
CI-9 ICP-AES Mg5.eoAI2.20(0H), sC12.20 6.0 TGA/DTA MgsAI2(OH),sCI2 0
CI-8 ICP-AES M93.s7AI4.13(0H) lSC14.13 1.5 TGA/DTA M9sAI2(OH),eCI2 5
CI-7 ICP-AES (Mg4.71AI3.29(OH)leCI3.29 17.8 TGA/DTA MgeAI2(OH),sCI2 3
A plot of the experimental values of R against the ionic radii of the anions is represented n
in Figure 7. The ionic radii of 0 2- in vacuum and of CI" are taken for hydroxyls and chloride,
the sum of the atomic radii of C and 0, 1.31 +0.73 = 2.04 A, respectively, is taken for
carbonate. For carbonate it is taken into account that the molecule can rotate from a flat
towards a tilted position, with the negative charge of the oxygens as near as possible to
the positive brucite-like sheets. The radius is assumed to be in direction of the C-O valence
bond, perpendicular to the three fold axis of carbonate. The radius of oxalate is taken
perpendicular to the two fold axis, which measures 2.51 A. The regression points to a
successful measurement of the interlayer spacing by thermoporometry.

---
237 Shrinkage and Swelling of Pillared Hydrotalcite
4.0-,--------------------------, ¢ ionic radius 01 carbonate in direction Coo bond, (1.31 +0.73) t:. ionic radius of 112 o-C-C-O distance, which is:
112' ~(4' (1.31 + 0.73f + 1.~- 4· (1.31 + 0.73) '1.54' cos 120) 3.5 0 ionic radiJs 01 Miyata (1973)
o ionic radius 01 chlorine (1.81) and oxygen (1.46)
3.0 oxalate 0
E .E.. c: 2.5IX: III :::l '6 e Oi 2.01;; ~ u Cll
.!.! "C 1.5e :::l III as Cll E
1.0 ,/ ./
./ /
0.5 " "
0.0 0.0 0.5 1.0 1.5 2.0 2.5
ionic radius (A)
Figure 7 Plot of the ice crystal radius R" measure by thermoporometry against the radius of the anions incorporated in the clays as determined by XRD and JR.
Extent of shrinkage and swelling calculated from the Rn and d(003) values
The radius, Rn, of 2.0 nm of the wet (W) carbonate sample C1 prepared at a static
pH level of 10 is remarkably identical to that of the rewetted C1 sample, firstly dried (D)
at room temperature, which has a mean value of (2.2 + 1.9l/2 = 2.05 nm (Table 9). Firstly
drying at room temperature and subsequently rewetting thus leads to an equal ice-crystal
radius, indicating that the swelling of the anionic clay reversible.
The value of V n of 0.44 ml *g-' the firstly dried at room temperature and subsequently
rewetted C1 sample (D) is equal to the mean value of 0.48 ml*g-' of the not dried
hydrotalcite with bicarboxylic acid anions C2 to C1 0 (Wl (Table 9). This is a second prove that the swelling of C1 is reversible after drying at room temperature, and leads to an
equal pore dimension. This was established before with the measured ice-crystal radii.

238 Chapter 9
Table 9 Thermoporometric ice crystal radii Rn, pore volumes Vn, and shape factors F
measured on a Netzsch DSC 200 and model 43 measuring cell of pillared
hydrotalcite clay minerals with (i) interstitial bicarboxylic anions with carbon
numbers, varying from 1 to 10, and (ii) chloride prepared at static pH values of
10 to 7.
anion pH DryIWet'l Rn (nm) Vn (ml/g) F
1 C121 D 2.2b 1.9" 0.44"b 1.4"b
2 C1 31 10 W 2.0" 1.0b 0.06" 0.013b
D 1.4 0.025
3 C2 W 3.6b 3.1" 0.52 1.7
4 C3 W 2.9 0.58 1.9
5 C4 W 2.9 0.44 1.6
6 C6 W 3.1 0.54 1.6 7 C10 W 2.9 0.31 1.8
D 1.4 0.026
8 CI- 10 W 1.1 0.22 2.1 9 CI- 9 W 1.6 0.26 1.5 10 CI- 8 W 1.4" 0.9b 0.51" 0.30b 1.6" 1.7b
11 CI· 7 W 1.3" 1.1 b 0.46" 0.49b 1.6" 1.5b
1) Wet (W) means that the clay suspension is 10 minutes centrifuged at 3000 rpm and not
dried (5.5 mg clay + 26.1 mg H20), Dry (D) means that the centrifuged suspension is dried at 120 0 C (except of hydrothermally aged sample C1) and 17.5 mg H2 0 is added to
15.9 mg dried clay.
2) sample C1 (Mg/AI = 2) is measured on a Setaram DSC 111, clay is centrifuged 10 minutes at 10000 rpm dried at room temperature, and 140 mg H20 is added to 125 mg
dried clay.
3) pH-static prepared sample C1 at pH=10 (Mg/AI=3)
a) main peak
b) secondary peak
abl main peak + secondary peak together

239 Shrinkage and Swelling of Pillared Hydrotalcite
In contrast, the ice crystal radius, Rn , in the pH statically prepared carbonate sample C1
(D) (Mg/AI =3/1) dried at a high temperature of 120 0 C and rewetted is 1.4 nm, which is
70% of the radius, Rn , of 2.0 nm before drying. The drop in the radius, Rn , demonstrates
that the shrinkage during drying at high temperature is irreversible.
The extent of shrinkage upon drying of the anionic clay samples can be evaluated from
the ice crystal radii, Rn , of the anionic clays before drying as compared to the interlayer
spacing obtained by XRD after drying. The amount of shrinkage is calculated by the
division of sheet distance in water by the interlayer distance after drying :
shrinkage 2 *Rn/(d(003)-4.8) (6)
where 2Rn (A) is sheet distance of hydrotalcite in water, which is equal to the diameter of
the ice-crystal in the wet clay (Table 9), and d(003)-4.8 (A) is the interlayer spacing of the
dried clay, which is the subtraction of the d(003) reflections (A) (Tables 2 and 3) by the
thickness of the brucite-like layer of 4.8 A. The measured values of shrinkage are 2 * 20/(7 .89-4.8) "" 13 times of hydrotalcite with
the anion carbonate, 2 * 30/( 10.04-4.8) "" 12 times of hydrotalcite with oxalate, 2 * 29/( 10
4.8) "" 11 times of hydrotalcite with malonate, 2 * 29/( 12.4-4.8) "" 8 times of hydrotalcite
with succinate, 2 *31/( 13.15-4.8) "" 7 times of hydrotalcite with adipate, 2 * 29/(18.84
4.8) == 4 times of hydrotalcite with sebasate, and, finally, 2 * 14.3/(8-4.8) == 9 times of
hydrotalcite with chloride.

240 Chapter 9
CONCLUSIONS
1) Hydrotalcite anionic clay minerals with carbonate anions, various bicarboxylic acid
anions with increasing carbon numbers of 2 to 10, and chloride anions have been
successfully prepared. Two linear curves of the XRD reflections d(003) are fitted against
the carbon number of the bicarboxylic acid samples with identical slopes. One curve is
intersecting the y-axis at a value relatively high at 6.9 A, which is equal to the value
reported earlier in the literature, and the other curve reconstructed with additional d(003)
reflections at 4.8 A, which is equal to the thickness of the brucite-like sheet.
2) Carbonate·free chloride samples (CI-1 0 to CI-7) have been successfully prepared at
pH values of 10 to 7 as shown by XRD and IR. Hydroxyl contamination of the samples
prepared at a static pH of 8 and 7 is additionally demonstrated by XRD and TGA!DTA measurements.
3) After drying at room temperature, the swelling of the hydrotalcite anionic clays in water as measured by thermoporometry is reversible with a hydrothermally prepared hydrotalcite sample with carbonate at the interlayer, but irreversible with a pH-statically prepared hydrotalcite sample with carbonate at the interlayer and dried at an elevated
temperature of 120°C. Drying at a higher temperature and subsequent rewetting leads
to a reduction of 70% of the original sheet distance in water.
4) The ice crystal radius Rn of 2 nm measured with thermoporometry in the wet (W)
carbonate sample is attributed to pores containing carbonate. The Rn values of 3.1, 1.42, and 1.0 nm measured on samples containing oxalate, chloride, and hydroxyl, respectively,
are attributed to pores containing the corresponding anions.
5) A plot of the ice crystal radius, Rn , against the ionic radius of the anion 0 2', CI', CO~',
C20~' incorporated in the anionic clay mineral points to a successful measurement of the interlayer spacing by thermoporometry. The effect of a non-freezing layer normally
occurring at the solid-water interface is not considered.
6) The amount of shrinkage of the anionic clays is calculated by a simple formula, viz., shrinkage = 2 *R n!(d(003)-4.8), where 2Rn (A) is the diameter of the ice-crystal of the wet
clay before drying, and the subtraction d(003)-4.8 (A) the interlayer spacing of the dried
clay after drying as determined by XRD. The amount shrinkage of hydrotalcite with the
anions recorded in the R against the ionic radius plot, respectively, is assessed on 13, 11, n
and 9 times for the anions carbonate, oxalate, and chloride, respectively. An amount of
shrinkage of 11, 8, 7, 4 times is measured for hydrotalcite with malonate, succinate,
adipate, sebasate, which are not recorded in the plot.

241 Shrinkage and Swelling of Pillared Hydrotalcite
ACKNOWLEDGMENTS
The authors thank J.A.L.M. van Dorst and W.P.A. van de Noort for their experimental
work. concerning the preparation and characterization of the clay minerals. and J.T.
Kloprogge for the critical review of the paper.
REFERENCES
Allmann. R. (1968) The crystal structure of pyroaurite: Acta Cryst. B24. 972-977
Bish, D.L. (1980) Anion-exchange in takovite. application to other hydroxide minerals:
Bull. Mineral. 103. 170·175
Block, C., Breuer, W .• Endres, H.• and Hackgenei, J. (1992) Deutsches Patentamt.
Offenlegungsschrift DE 4040679 A 1
Bunte. R.• Rats. H-C.• Muller. R. (1992) Deutsches Patentamt, Offenlegungsschrift DE
4025925 A 1
Endres, H., Loeffelholtz. F.• Wedl. P.• Worscheck. K.• Hansen, A .• Geismar. G. (1992) Deutsches Patentamt. Offenlegungsschrift DE 4031818 A 1
Feitknecht. W. (1942) Zur kenntnis der Doppelhydroxide und basischen doppelsalze III
(Uber magnesium-aluminium doppelhydroxyd, experimentell bearbeitet von M.
Gerber) : Helv. Chim. Acta 25, 131-137
Geismar, G.• Endres. H. (1992) Deutsches Patentamt. Offenlegungsschrift DE 4033730
A1 lida, Y.• Shimoyama, N.• Oka. Y. (1992) Filler-containing expandable vinyl chloride polymer
compositions: Chem. Abstr. 117, 49906y. 49
lizuka. 5 .• Nishimura. M. (1992) Powdered stabilizers for chlorine-containing resins: Chem.
Abstr. 117. 49957r, 53
Kruissink, E.C., van Reijen, L.L., and Ross. J.R.H. (1981) Coprecipitated Nickel-Alumina
catalysts for methanation at high temperature, part 1.-Chemical composition and
structure of the precipitates: J. Chem. Soc., Faraday Trans. (1) 77, 649-663
Kumagai. J., Tan. R.. Ikeda. T., Fujii, T.. Okada. C.. Higashida, O. (1992)
Electrostatographic toner and developer: Chem. Abstr. 117. 58859n, 709
Misra. C., and Perrotta. A.J. (1992) Composition and properties of synthetic hydrotalcite : Clays and Clay Minerals 40 (2) 145-1 50
Miyata, 5., and Kumura. T. (1973) Synthesis of new hydrotalcite-like compounds and
their physico-chemical properties: Chemistry Letters, 843-848
Miyata. S. (1975) The synthesis of hydrotalcite-Iike compounds and their structures and physico-chemical properties-I. the systems Mg 2 + _AI 3 + -N0 3'. Mg 2 + _AI 3 +-CI', Mg2 + _AI 3 + -CI0 4', Ni 2 + _AI 3 +-CI'. Zn 2 + _AI 3 +-CI': Clays and Clay Minerals 23, 369-375

242
Miyata, S. (1980) Physico-chemical properties of synthetic hydrotalcites in relation to composition: Clays and Clay Minerals 28, 50-56
Miyata, S. (1983) Anion-exchange properties of hydrotalcite-like compounds: Clays and
Clay Minerals 31, 305-311
Ogawa, T. (1992) Fire-resistant vinyl chloride resin compositions: Chern. Abstr. 117, 28122z,73
Reichle, W.T. (1985) Catalytic reactions by thermally activated, synthetic, anionic clay
minerals: J. of Catalysis 94, 547-557
Reichle, W.T. (1986) Synthesis of anionic clay minerals (mixed metal hydroxides,
hydrotalcite): Solid States lonics 22, 135-141
Ross, G.J., Kodama, H. (1967) Properties of a synthetic magnesium-aluminium carbonate
hydroxide and its relationship to magnesium-aluminium double hydroxide,
manasseite and hydrotalcite: Am. Mineral. 52, 1036-1047 Schutz, A., and 8i1oen. P. (1987) Interlamellar chemistry of hydrotalcites, I. Polymerization
of silicate anions: J. of Solid State Chemistry 68. 360-368 Serna, C.J., Rendon, J.L., and Iglesias, J.E. (1982) Crystal-chemical study of layered
[AI 2 Li(OH)sl+X-.nH 20 : Clays and Clay Minerals 30, 180-184 Suzuki, S., Okamoto, M .• and Ono Y., Catalysis by synthetic hydrotalcite-like materials
in halide exchange between alkyl halides: J. of Molecular Catalysis 61, 283-294
Tagaya, H., Tsunaki, K., Hasegawa, M., Karasu, M., Chiba. K. (1992) Adsorption of carbondioxide into hydrotalcite-like compounds: Chern. Abstr. 117. 56712k
Tatsumi, T., Yamamoto, K., Tajima. H., Tominaga, H. (1992) Shape selective epoxidation
of alkenes catalyzed by polyoxometalates intercalated hydrotalcite: Chern. Lett. 1992, 81 5-81 8
Taylor, H.F.W. (1973) Crystal structures of some double hydroxide minerals: Mineralogical Magazine 39, 377-389
Twu, J., and Dutta, P.K. (1990) Decavanadate ion-pillared hydrotalcite, spectroscopic
studies of the thermal decomposition process: J. of Catalysis 124, 503-510 Valim, J., Kariuki, 8.M., King, J., and Jones, W. (1992) Photoactivity of cinnamate
intercalates of layered double hydroxides, Chern. Abstr. 117. 58585v, 686

243
Chapter 10
The quantity of reduced nickel in synthetic takovite ; effects of preparation conditions and calcination temperature *
M.K. Titulaer', J.B.H. Jansen', and J.W. Geus2
'Department of Geochemistry, Institute for Earth Sciences, University of Utrecht,
Budapestlaan 4, P.O. Box 80.021, 3508 TA Utrecht, The Netherlands.
2Department of Inorganic Chemistry, University of Utrecht, Sorbonnelaan 16, P.O. Box
80.083, 3508 TB Utrecht, The Netherlands.
*This paper is a contribution of the Debye Institute, University of Utrecht, The
Netherlands.
ABSTRACT
Takovite, NiBAI2(OH),BC03.5H20, with molar Ni/AI ratios of 2.5 and 3 is prepared by
precipitation at pH-levels of 7 and 10, periods of reaction of 3 and 20 h, and calcination
temperatures varying between 120 and 853 0 C. The quantity of reduced nickel is
determined as a function of the calcination temperature, and the solid phases remaining
after reduction are determined with XRD. The ratio Ni/AI, pH of precipitation, and
calcination temperature are important preparation conditions. A precursor of a Ni/AI ratio
of 2.5 precipitated at a pH-level of 10 exhibits on reduction metallic nickel particles of
about 15 nm irrespective of the drying or calcination temperature. After reduction a
considerable amount of NaAI02 is present. Metallic nickel particles of 6 nm are present in
a reduced precursor of Ni/AI ratio of 2.5 precipitated at a pH-level of 7. The size of the
nickel particles present in a reduced precursor of Ni/AI ratio of 3 precipitated at a pH-level
of 10 rises from 4-8 nm to 16 nm after calcination at temperatures increasing from 120
to 853 °e. The last precursor contain much less sodium, and show after reduction a
disordered NiO phase containing some alumina.
INTRODUCTION
Thermostable nickel-on-alumina catalysts of high loadings of nickel are useful as liquid
phase hydrogenation catalysts, currently used for carbon monoxide-hydrogen gas flows

244 Chapter 10
by steam reforming of methane and naphtas. Recently, Kruissink and Van Reijen [1] have
investigated the use of reduced nickelhydroxide t aluminumhydroxide coprecipitates for the
reaction of H2tCO flows to methane. Since steam is produced at high temperatures with
methanation sinter-stable alumina is preferred as support. Silica is liable to react with
steam at high temperatures to volatile species.
Ni-AI coprecipitates, reacting to the mineral takovite, can be prepared from nickel and
aluminum salts with molar ratios NitAI between 1 and 5.6 with fresh precipitates (and
between 2 and 3 with hydrothermally aged samples [2]). Takovite belonging to the group
of Feitknecht clays, is build up of mixed positively charged nickel and aluminum double
hydroxide layers, separated by layers of carbonate and crystal water. The morphology of
the clays consists of rod shaped sponge-like clusters of dimensions of 100x200 nm.
Surprisingly, the external morphology is not changed with calcination of the takovite to the
corresponding oxides and even after reduction of the NiO present after calcination to Ni
[3). The calcination of takovite (with NitAI = 3), and the reduction to the Ni-on-alumina
catalyst involve the following steps:
T NiBAI 2(OH),BC03.5H 20 --> 6 NiO + AI20 3 + 13H20 + CO 2 (1)
6 NiO + 6 H2 -- > 6 Ni + 6 H20 (2)
For the sample with NitAI = 2.5 the steps are:
T Ni5.7AI2.3(OH),B(C03)1.15.4.55H20 -- > 5. 7NiO + 1.15A120 3+ 12.55H20 + 1.15C02 (3)
5.7 NiO + 5.7H2 --> 5.7 Ni + 5.7 H20 (4)
In Eqs. 1 and 2 it is assumed that the nickel present in takovite is completely calcined
to the NiO and that the resulting NiO is completely reduced to metallic Ni. However,
calcination actually leads to different oxide phases, besides nickeloxide. Oxide phases
mentioned in the literature are a OOSI (disordered oxide spinel intermediate) phase, which
comprises NiO containing some aluminum ions with a characteristic XRO reflection at
1.464 A, and a NCA (nickel containing alumina) phase, which is a very poorly crystallized
nickel deficient spinel Ni1-&AI2+uI304 phase, of which the characteristic reflection is
1.415 A. The OOSI reflection by XRO is situated between the d( 110) of NiO of 1.476 A [4al and the d(440) of NiAI20 4 of 1.423 A [4b). The NCA reflection is situated between
the d(440) of NiAI 20 4 of 1.423 A [4bl and the d(440) of AI 20 3 of 1.400 [4cl
In the spinel structure (NiAI 20 4) the oxygen ions are arranged to a ccp structure. 50 % of the octahedral sites is occupied by the aluminum ions and 50 % is vacant. 12.5 % of
the tetrahedral sites is filled by the nickel ions and 87.5 % of the sites empty.

245 TPR of synthetic takovite
De Korte et al. [2] usually observed three maxima at 450,550, and 750 0 C in the TPR
profiles of takovite of Ni/AI ratio of two being calcined at 900 0 C. The first reduction peak
displaying an activation energy of 130 kJ/mole is attributed to NiO dispersed on a
supporting phase, the second peak, of an activation energy of 150 kJ/mole, to reduction
of the DOSI phase, and the third peak of an activation energy of 320 kJ/mole, to reduction
of the NCA phase. The rate-determining step in the reduction of the NiO or DOSI phase
is probably the formation of Ni-nuclei in the individual takovite crystals. The rate
determining step in the reduction of the NCA phase is assumed to be cation diffusion.
Calcination is an important procedure in the preparation of the catalysts. With high
calcination temperatures, it is observed that the maximum in the reduction of NiO to Ni is
shifted to high temperatures [2]. Less attention has been paid to the effect on the
calcination temperature on the fraction nickel present in the catalyst being reduced to
metallic nickel.
To investigate the effect of the Ni/AI ratios on the behavior of the catalyst precursors
during thermal treatment, nickel-on-alumina precursors exhibiting the takovite structure are
prepared of a Ni/AI ratio of 2.5 and 3.
When the takovites are prepared from solutions of soda, nickel nitrate and aluminum
nitrate, the anions taken up into the interlayer depend on the pH during the precipitation. At a pH-level of 7 more nitrate will be taken up, while after precipitation at a pH-level of
10 carbonate ions will be present in this interlayer. To study the effect of the anions in the
interlayer on the behavior of the catalyst precursor during calcination, takovite is precipitated at pH-levels of 7 and 10. The temperature of the liquid during precipitation and
the period of time involved in the precipitation can affect the crystallinity of the takovite,
and, hence, the reactions during calcination. To assess the effect of the crystallinity,
precipitations of takovite are carried out at 20 and 50 °C with precipitation times of 3 and of 20 h. Sodium ions remaining in the takovite precursors are difficult to remove by
washing. A sample containing an appreciable amount of sodium is studied too.
EXPERIMENTAL
Synthesis
The preparation conditions of the different samples are listed in Tab. 1. Five takovite
samples are prepared of Ni/AI molar ratios of 2.5 and 3, pH-levels of 7 and 10, synthesis
time of 3 h with one sample of 20 h, and temperatures of 20 and 50 0 C.
A 0.2 M AI-containing solution is prepared by dissolving 18.7 g (0.05 mole)
AI(N03)3.9H20 in 250 ml H20. Subsequently, 36.3 or 43.6 g Ni(N03)2.6H20 is added to establish molar ratios NitAI of 2.5 or 3. A second solution containing 0.26 M CO~- is
prepared by dissolving 36.25 g Na2C03.2H20 in 1 I water. The 1 I carbonate solution is

246 Chapter 10
prepared in a 3.5 I double walled precipitation vessel kept at 20 or 50 0 C by a thermostat bath.
The 250 ml Ni and AI containing solution is added at a rate of 1.4 ml/min to the
carbonate solution within a period of time of 3 h, except of sample 4 in which the solution is added within 20 h. The amount of carbonate is in a 2 *0.26/0.05 = 10.4 fold excess
as compared to the stoichiometrically required quantity. The pH is kept at a constant level
of 10 ±0.01 and 7 ±0.01 by computer-controlled addition of 3 M NaOH. After completion
of the addition of the Ni-AI solution, the suspensions are centrifuged at 3000 rpm for 5
minutes, and the clays are dried at 120 0 C (samples 1A-5A).
Table 1 Preparation conditions of the takovite minerals.
sample No. Ni/AI T(OC) time(h) pH d(003) AXRD
1 2.5 50 3 ,10 7.72 5 2.5 50 3 L7 7.69
1 ,2.5 50 3 10 7.72 2 L3 ,50 3 10 7.82 3 3 L20 ,3 10 7.82 4 3 20 L20 10 7.74
Sample codes
Sample 1 is divided in 6 fractions, of which 1A is only dried at 120 0 C, and 18 to 1F, are additionally calcined at 260, 399, 493,585, and 850 0 C, respectively, for a period of
time of 1 h in an Ar flow of 63 ml/min. Samples 2A to 2F are kept at 120, 260, 395,499, 586, and 853 0 C under identical conditions. Finally, samples 3A, 4A, and 5A are dried
at 120 0 C for XRD and TGA investigations, and 38,48, and 58 are calcined at 260 0 C
with TPR measurements.
TPR
Amounts of 0.5 9 of the sieve fraction between 0.7 and 2 mm of the takovite sample 1A-F, 2A-F, 38, 48, and 58 is placed in a vertical quartz reactor tube of 8.4 mm
diameter. The volume of the catalyst bed is 1 ml with a height of 1.8 em. The H2
consumption is measured from 20 to 850 0 C from an upstream 10%H2/90%Ar flow at a flow rate of 70 ml/min. The space velocity is 4200 h-1 and the linear gas rate 2.1 cm/s. The temperature is increased by an Eurotherm controlled furnace at a rate of 9.6 0 C/min,

247 TPR of synthetic takovite
and measured with a nickel-chromium/aluminum-chromium type K thermocouple. The H2 consumption is measured with a four filament thermal conductivity cell kept at 20° C
(10-077 wx TIC detector, Gow Mac). Each filament has a resistance of 30 Ohm, while a
current of 85 mA is applied to the Wheatstone bridge. The hot wire detector (HWD) signal
(in mV) is amplified and registered on a recorder. The total H2 consumption due to
reduction of nickel is measured by the integral of the HWD signal:
mmole H2 = JHWD * dT/387*sr = JHWD * dT/3715 (5)
where HWD is the HWD signal (in mVl. dT the increment of the temperature (in °Cl. 387
a constant (mV*min/mmolel. and sr the scan rate of 9.6 °C/min.
XRD
X-ray diffraction profiles of the dried samples 1A-5A are recorded on a Guinier-De Wolff
camera (Cu Ka ,1 = 1.5406 A). Nickel particle sizes of the reduced samples 1A-F, 2A-F, 38, 48, and 58 are derived from
the broadening of the reflections (200) (25,923 8) and (220) (38.186 8) of the cubic cell
(a =3.524 A, JCPDS 4-850) with the Scherrer equation:
L = 0.94*AI 2HW(8)*cos(2rr81360) (nm) (6)
where L is the particle size (in nml. A is 0.154 nm, HW(8) the width in 8 of the reflection
peak at half maximum intensity, 8 the diffraction angle. The halfwidth is corrected for the
spectral line width of the instrument by HW(8)COH = .,j(HW2(8)m•••-HW2(8)instrl. with
HW(8)inst< is 0.0008 rad 8 at (200) and 0.0012 rad 8 at (220).
TGA
The weight loss of the samples 1A, 2A, 4A, and 5A, which have been dried at 120 ° C
is measured in a 50 ml/min N2-flow as a function of the temperature, which increases from
20 to 900° C at a heating rate of 10 °C/min. The weight loss comprises removal of
carbonate and interlayer water at 215 0 C (W1 in wt%). Water of the double hydroxide
sheet near AI (W2 in wt%) is lost at 320° C, denoted as gibbsite dehydration. The water

Table 2 X-ray diffraction of synthetic takovite samples dried at 120 0 C and not reduced by H2 IJCPDS 15-87),
1A 10 pH 2A 10 pH 3A 10 pH 4A 10 pH 5A 7 pH ref. [1)
dIAl III, dIAl III, dIAl III, dIAl III, dIAl III, dIAl III, hkl
7.72 100 7.82 100 7.82 100 7.74 100 7.69 100 7.72 100 003
4.92 w 4.87 w 4.87 w 4.92 w 4.87 w
4.48 w 4.87 w 4.52 w 4.48 w
3.85 w 3.88 27 3.86 11 3.85 21 3.85 90 006 2.57 45 2.59 32 2.59 34 2.59 26 2.57 42 2.57 40 012
2.30 20 2.29 80 015 1.95 21 1.95 - 018
1.52447 1.527 32 1.527 25 1.524 23 1.52 23 1.520 80 110 1.496 40 1.500 27 1.52125 1.496 18 1.49 20 1.492 80 113 1.420 8 1.422 5 - 1.40 w 1.39 w 1.414 30 116 1.3119 1.28 w 1.29 w 1.29 w 1.308 50 119
w = weak

249 TPR of synthetic takovite
of the double hydroxide sheet near Ni (W3 in wt%) is lost at 350 0 C, denoted as Ni(OH)2
dehydration. The temperature of dehydration of Ni(OH)2 in the presence of AI20 3 is about
two times as high as the temperature normally observed with purely Ni(OH)2' viz., 180 0 C
(in a reducing flow). Stabilization of Ni(OH)2 by remaining AI20 3 is assumed.
Of 0.5 g of samples used in the TPR reactor experiments, the weight loss involved in the
reaction of (NiO +AI20 3 ) to (Ni +AI20 3 ) (W4 in %) is reconstructed by measurement of the
total weight loss (Wtotal in %). The weight loss W4 due to reduction of NiO to Ni is the
subtraction of the total weight loss Wtotal by the combined weight losses W1 + W2 + W3,
by W4 = Wtotal - (W1 + W2 + W3). The amount of H2needed for reduction of nickeloxide
is calculated with W4 by :
mmole H2 103 * W4(%) * 0.5 t 16*100 (7)
RESULTS
X-Ray Diffraction
The XRD reflections of the samples 1A to 5A, which have been dried, but not reduced
are those of takovite (Tab. 2). Samples 2A and 3A of a high molar ratio NitAI of 3 have
a large layer spacing with the reflection d(003) of 7.82 A. Sample 1A of a molar ratio 2.5
and sample 4A of a long reaction time of 20 h have intermediate d(003) values of 7.72
and 7.74 A. Sample 5A prepared at a low pH of 7 exhibits the smallest d(003) value of
7.69 A.
Reduction of the samples
-sample 1
Sample 1 contains a fair amount of sodium. The reduction profiles of the samples 1A
to 1F having a NitAI ratio of 2.5, as measured by the hydrogen consumption in a TPR
experiment, show different maxima, viz., 1. at 300 0 C (1 C and 1D); 2. at 350 0 C (1 A);
3. at 450 0 C (1 C); 4. at 520 0 C (1A and 1B); 5. at 550 0 C (1 D); and 6. at 600-700 0
C(1 E and 1F) (Fig. 1a). As can be seen in Fig. 1a, calcination at a temperature higher than
about 500 0 C causes the reduction to shift to levels above about 500 0 C. Apparently
decomposition of the takovites leads to a mixed nickeloxide t aluminumoxide phase in
which the nickel is difficult to reduce. The reduced samples 1A-F are identified as to
contain metallic Ni by XRD of a mean particle size L of 15 nm (Tab. 3). There is, hence,
no effect of the calcination temperature on the Ni particle size. The samples calcined above
493 0 C (1 D-F) show an additional gamma NaAI02 phase.

250 Chapter 10
100 A I
lA=120ClA 90 1B=260C
Ni/AI = 2.5 lC=399C 3ha1T=50C 10 = 493 C
80 pH = 10 lE=585C 1F=850C
70
60
.s ~
Oi c C> 50 "iii 0 3: J: 40
30
20
10
0 0 100 200 300 400 500 600 700 800 900
temperature (C)
Figure 1 TPR profiles of takovite after calcination at increasing temperature; (a) Ni/Al=2.5, pH=lO, 3 hat T=50° C, calcined from 120 to 850 0 C (lA-F), (b) Ni/Al=3, pH=10, 3 h at T=50° C, calcined from 120 to 853 0 C (2A-F), (c) samples lB to 5B prepared at various conditions but calcined at 2600 C before reduction at a temperature above the loss of carbonate and interstitial water at 215 0 C.
-sample 2
The reduction profiles of the samples 2A-F of a higher molar ratio Ni/AI of 3 (Fig. 1b)
show a gradual shift of the reduction maximum to higher temperatures from 450 to
700 0 C at a calcination temperature increasing from 120 to 853 0 C. The shift in the
reduction temperature proceeds more continuously with the precursor having a higher Ni/AI
ratio of 3 and containing less sodium. Shoulders at 300 and 350 0 C are seen with sample
2A (and 2Bl. but less strong than with 1A (Fig. 1a). The smooth curved TPR maxima of 2A-F are different from those of 1A-F, which show sharp peaks and submaxima. The
exception is sample 2F calcined at 853 0 C, which exhibits a sharp peak at 730 0 C

251 TPR of synthetic takovite
100 200 300 400 500 600
100 "1"""-:=:---------------------.----, B 2F
90
NitAI =3 3hatT=50C
80 pH =10
70
I 2E
2A=120C§' 60 26 =260 C §. 2C=395C<a
c: .2' 20 =499C50 II) 2E = 586CCl
2F = 853C3= :I: 40
30
20
10
0 0 700 600 900
temperature (C)
Figure 1 (continued) (b) Ni/Al=3, pH=10, 3h at T=50°C
The samples 2A-F after reduction show only XRD reflections of Ni and of a not entirely
reduced DOSI phase (reflection 1.45 A, Tab. 4). The nickel particle size of sample 2
increases from 4-8 to 16 nm with calcination temperatures raising from 120 to 853 0 C.
-samples 3-5
In Fig. 1c, the samples 38 and 48 with Ni/AI = 3, synthesized at a temperature of 20 0 C
for 3 and 20 h, respectively, and calcined at 260 0 C display an identical TPR profile as 28.
Apparently, neither the temperature of the liquid during the preparation nor the duration
of the precipitation strongly affect the reducibility of the catalyst precursor. The curves
display maxima at 500-550 0 C with shoulders at 350 0 C. Reflections of metallic Ni and
a not entirely reduced DOSI phase are observed with XRD (reflection 1.46 A, Tab. 5).
Furthermore, the nickel particle size is small, viz., 6 and 7 nm for 38 and 48, and equal to
that of 28 calcined at 260 0 C. The reduction profiles of sample 18 and 58 with the same
Ni/AI ratio of 2.5, produced at pH of 10 and 7, respectively, are remarkably different
(Fig. 1c). Presumably the difference is due to the sodium content. The shape of the TPR
curve of 58 is equal to that of 28-48 and similar phase reflections are determined, but the
TPR maximum is at a relatively high temperature of 600 0 C. Evidently the reduction
proceeds more difficult at a lower Ni/AI ratio. The nickel particle size is 6 nm.

Table 3 X-ray diffraction of takovite samples 1 A-F, Ni/AI =2.5, with calcination temperatures of 120 to 850° C and reduced with H2 •
lA 120°C 182600C lC 399°C lD493°C lE 585°C 1F 850°C Ni (JCPDS 4-850) d(.i\,) 1/1 1 dIAl 1/1, dIAl 1/1, dIAl 1/1, dIAl 1/1 1 dIAl 1/1, dIAl 1/1, hkl
2.01 100 2.02 100 2.02 100 2.02 100 2.02 w 2.12 w 2.03 100 111 1.74 52 1.74 w 1.75 57 1.75 60 1.74 w 1.76 w 1.76 42 200 1.23 37 1.23 w 1.22 45 1.22 45 1.23 w 1.24 w 1.24 21 220
gamma NaAI0 2 (JCPDS 19-1179) 4.23 57 4.23 38 4.22 44 4.25 90 101
3.53 w - 3.52 12 3.52 9 3.53 11 3.78 30 110 3.32 6 3.31 6 3.32 8 3.32 70 111
2.94 w 2.93 79 2.93 87 2.94 70 2.94 100 102 2.64 w 2.65 100 2.65 100 2.64 100 2.65 100 200 2.60 w
2.58 w 2.56 w 2.56 79 2.56 95 2.57 53 2.59 95 112 2.49 56 - 2.49 30 201 2.36 35 2.38 20 210 1.93 w 1.97 w 1.97 85 212
1.67 w 1.65 7 - 1.66 w 1.66 10 222 1.57 25 1.57 23 1.58 39 1.59 95 302 1.50 25 1.50 15 1.52 22 1.52 80 312
1.48 w 1.48 21 1.48 18 1.47 20 1.47 90 204 1.45 29 1.46 31 1.44 22 1.44 6 321
1.40 w 1.40 23 1.40 33 1.40 25 1.42 55 303 1.38 w 1.38 w 1.37 w 1.38 25 1.38 38 1.36 22 1.37 40 313
1.34 w - 1.34 27 1.34 31 - 1.36 90 322 1.27 10 1.27 21 1.26 w
16 13 15 15 16 17 Nickel particle size L(nm)
w=weak

253 TPR of synthetic takovite
100
90
80
70
60
.s ~
iUc:
50.!? en Cl 3: J: 40
30
20
10
0
C
calcining temperature 260C 1B NilAI =2.5, 3h at SOC, pH =10 2B NitAI = 3, 3h at SOC, pH = 10 3B NilAi ~ 3, 3h at 2OC, pH = 10 4B NitA! =3, 20h at 2OC, pH =10 5B NilAI =2.5, 3h at SOC, pH = 7
0 100 200 300 400 500 600 700 800 900
temperature (C)
Figure 1 (continued) (c) samples lB to 5B calcined at 260°C
Quantity of reduced nickel
The theoretical amount of H2 consumed during reduction of nickel is calculated from the theoretical weight loss W4 (in %) of 0.5 g takovite (Tab. 6). The theoretical amount H2 is
3.44 mmole for the reduction of takovite with a molar ratio Ni/AI of 2.5, and 3.75 mmole
for takovites with ratio Ni/AI of 3 (Tab. 6). In Tab. 6 also the extends of reduction
calculated by integration of the of the hydrogen consumption measured in the TPR
experiments are mentioned. It is apparent that the accuracy of the extent of reduction
calculated from the TPR results is higher than calculated from the weight loss. Since
desorption of water vapor produced during the reduction out of the generally highly porous
dehydrated and reduced sample proceeds slowly, a lower extent of reduction of the
calculated from the weight loss has to be expected. The weight loss measured with sample 2A suggests a very low extent of reduction in contrast with the TPR measurement
of sample 2A. The relatively low weight loss during the reduction might be due to the


255
6 C ¢ 0
*
o
48 38
58
6
TPR of synthetic takovite
presence of more narrow pores in the decomposed takovite prepared at 50° C. However
sample 1A, which differs only in the NitAI ratio, exhibits a much higher weight loss during reduction.
It is interesting to study the effect of the temperature of the previous calcination on the
reducibility of the nickel. Figure 2 shows the experimental hydrogen consumption
calculated by integration of the HWD signal recorded during the TPR experiment. The
hydrogen consumption is plotted as a function of the calcination temperature in Fig. 2.
5.0 -,------------------------~
4.0
theoretical NitAI = 3
theoretical NitA! = 2.5
3.0
experimental NitAI = 3 J:'"
0'"E E
2.0
experimental NitAI = 2.5
2A-F Ni/AI=3, 3h at SOC, pH=10 NitAI = 3, 20h at 20C, pH = 10
1.0 NitAI = 3. 3h at 20C, pH = 10 1A - F NitAI = 2.5, 3h at 50C, pH = 10
NitA! = 2.5, 3h at SOC, pH = 7
0.0 +---,------r----.---,-------r----,---,------,---I o 100 200 300 400 500 600 700 800 900
calcination temperature (C)
Figure 2 Integrated Hz consumption upon reduction of synthetic takovite of different NilAl ratios of 3 and 2.5 as a function of the calcination temperature. The horizontal lines represent the theoretical Hz consumption based on the stoichiometric amount of Ni in 0.5 g takovite. The curves of sample I with Ni/AI=2.5 and sample 2 with NitAI=3, represent the experimental Hz consumption calculated
from the surface integrals under the TPR profiles.

256 Chapter 10
Table 5 X-ray diffraction of takovite samples 38-58,dried at a temperature of 120°C,
calcined at 260 a C and reduced with H2 •
38260 0 C
dIAl III,
48260 0 C
dIAl III,
58260°C
dIAl III,
Ni IJCPDS 4-8501
dIAl III, hkl
2.03
1.75
1.22
100
38 29
2.01
1.74
1.22
100
53
39
2.02
1.75 1.22
100
58
46
2.03100
1.76 42
1.24 21
111
200
220
NiO IJCPDS 22-11891
2.41 w 2.41 w 2.41 60 003
2.09' 2.09' 2.09 100 012
1.46 w 1.47 w 1.48 35 110
takovite ? takovite?
evt. NaAI0 2
evt. NaAJ0 2
evt. NaAI0 2
Nickel particle size L Inml
It can be seen that the samples with molar Ni/AI ratio of 3 exhibit a reduction higher than calculated for the amount of NiO. The theoretical amounts of H 2 of 3,75 and
3,44 mmole needed for reduction of samples with molar ratios Ni/AI of 3 and 2.5 are
plotted as horizontal lines in Fig. 2. Presumably the apparently higher extents of reduction
of the sample with Ni/AI = 3 are due to the formation NiO, +x' where x is significantly higher than 0.01. It is well known that finely divided NiO takes up additional oxygen due to the oxidation to Ni(lll). At higher calcination temperatures the non-stoichiometric oxygen is
released and NiO assumes the green color of stoichiometric NiO. At still higher calcination
temperatures some Ni present as nickelaluminate cannot be reduced. After a first large
consumption of H2 at calcination temperatures between 100 and 200 0 C, the values
decline at temperatures between 700 and 750 0 C.
The extent of reduction of the samples with a molar ratio of 2.5 is at all calcination
temperatures below the theoretically calculated level. Evidently reaction to a non-reducible Ni-AI compound proceeds to a relatively higher extent. After calcination at temperature above 500 0 C an appreciable amount of badly reducible nickel results. It is likely that the
sodium present in the samples 1A to 1F promotes reaction of Ni(1I1 with the alumina.

257 TPR of synthetic takovite
DISCUSSION
In ref. [5] analogously precipitated compounds are described, that are hydrothermally
treated to improve the crystallinity of the precipitates. The catalyst precursors prepared
by Kruissink et al. [5] exhibit a layer spacing of 7.58 Aafter precipitation at a pH-level of
10, and of about 7.5 Aafter precipitation at a pH-level of 7. The above authors showed
that the incorporation of nitrate ions, also on precipitation at pH 7, remains low, viz., about
10% of the amount of carbonate incorporated. Substantially higher contents of nitrate are
obtained when the precipitation is performed at a pH-level of 5, or when sodium hydroxide
is exclusively used in the precipitation. The layer spacings of Tab. 2 indicate accordingly
no significant effect of the uptake of nitrate ions; the spacings vary from 7.82 to 7.69 A. The lowest spacing is exhibited by sample SA, which is precipitated at a pH level of 7,
which leads to the most nitrate being incorporated. Kruissink et al. [5] observed layer
spacings of 8.92 and 9.0 A only when much more nitrate ions were incorporated. The
nickel particle size after reduction increased from 6 nm of the takovite with carbonate
samples to 50 nm of the takovite with nitrate samples.
The size of the metallic nickel particles obtained after reduction also agrees well with the size of the nickel particles mentioned by Kruissink et al. [51. viz., 4 nm. Kruissink et al. [5]
also mentioned that precursors containing sodium exhibit lower activities. We have
confirmed the lower activity and established that the lower activity is due to the presence
of large nickel particles.
Reduction of NiO by atomic hydrogen proceeds already at room temperature. The
dissociation of molecular hydrogen therefore is likely to be the rate-determining step with
the reduction of nickel(lIloxide. Since the reduction of nickeloxide to metallic nickel has
been shown to initiate on a small number of sites at the surface of nickeloxide, the
dissociation of hydrogen will proceed on lattice defects at the surface. Dissociation of the
di-hydrogen and desorption of water from the surface proceed at a significantly rate above
150 0 C as can be concluded from the onset of the reduction at tem peratures around
150 0 C. Once metallic nickel has resulted from the reduction, the dissociative adsorption of hydrogen proceeds rapidly, and also the reduction.
Bulk Ni{OH)2 looses water at temperatures of about 200 0 C. When bulk Ni{OHl2 is
heated in a flow of nitrogen, reduction immediately follows the dehydration of Ni{OHl2. The
defect rich NiO resulting from the dehydration dissociates rapidly to molecular hydrogen
and, hence, is reduced readily. If Ni{OHl2 is dehydrated in flow of a non-reducing gas,
defects in the resulting NiO are annealed. Subsequent reduction therefore proceeds less
rapidly. Reduction of well annealed NiO calls for temperatures as high as 450 0 C to be
initiated. Lattice defects present in takovite will not be able to dissociate molecular hydrogen in
contrast to defects present in the surface of NiO, where nickel ions of a valency different
from that present in the defect-free lattice are involved. Consequently reduction of the
nickel ions will proceed only after decomposition of the takovite, which provides NiO,
analogously to the behavior of Ni{OHl2 being heated in a reducing gas flow.

Table 6 Thermogravimetric analysis (TGA) of synthetic takovite, dried at 120°C, with W1 loss of carbonate and interstitial water at
215° C, W2 + W3 dehydration of water bound to Gibbsite and Ni(OH)2 at 320 and 350 ° C, and W4 loss of weight by reduction
of NiO. W 1-W4 are expressed in % of the initial weight of 0.5 g takovite
sample W1(%) W2+W3(%) W4(%) W4(mmole H2) TPR (mmole H2)
Ni/AI expo theor. expo theor. expo theor. expo theor. exp.A exp.S series
1A' 2.5 15 18 16 17 9 11 2.81 3.44 3.1 3.3
2A2 3 13 18 17 17 3 12 0.94 3.75 4.1 4.0 4A2 3 13 18 16 17 7 12 2.19 3.75 3.9
5A' 2.5 15 18 16 17 13 11 4.06 3.44 3.2
expo and theor. mean loss of weight obtained either by the experiment or by the theoretical loss by the stoichiometry of ; 1)
Nio.72Alo.2s(OH)2(C03)0.14' 0.57H20 interstitial, and 2) Nio.75Alo.25(OH)2(CO 3)0.'2' 0.63H20 interstitial

259 TPR of synthetic takovite
The higher stability of takovite as compared to that of Ni(OH) 2causes the decomposition
and the subsequent reduction to occur at temperatures around 350 0 C, which is at
appreciable higher temperatures than that of Ni(OH)2'
The reduction profiles of sample 2, which does not contain much sodium can be
explained smoothly. After drying at 120 0 C the dehydration of nickel-rich takovite sets on
at a temperature of about 220 0 C. Apparently the precipitate produced at a pH level of 10 contains also takovites of a lower nickel-to-alumina ratio, which decompose to nickeloxide
at higher temperatures. The reduction of the nickeloxide thus formed also proceeds at
higher temperatures. A second shoulder to the main peak is shown at a temperature of
about 350 0 C, while the main peak is at 460 0 C. We feel that the three different peaks
at 300, 350, and 460 0 C are due to the presence of takovites of different nickel-to
alumina ratio. The first maximum at 300 0 C coincides with the AI(OH)3 (gibbsite)
dehydration, perhaps catalyzing some Ni(OH)2 decomposition, and the second as
mentioned before Ni(OH)2 decomposition. Since metallic nickel accelerates the reduction,
the width of the reduction profile and the presence of the shoulders indicate a finely
divided nickel containing species resulting from the decomposition of sample 1 dried at
120 0 C. Migration of atomic hydrogen spilling over from initially formed metallic nickel cannot proceed over a large distance. Intimate contact of takovites of a different nickel-to
alumina ratio therefore does not agree with the experimentally observed three reduction peaks.
Calcination at 260 0 C of sample 2 prior to the reduction leads to the formation of
nickeloxide slightly more difficult to reduce. When the previous calcination is performed
at 395 0 C, more nickeloxide results, which take up additional oxygen to NiO, +x during
cooling to room temperature. Due to the overstoichiometric amount of oxygen the
reduction sets on already at an extremely low temperature of 70 0 C (Fig. 1b), but due to the small amount of defects, the hydrogen consumption below 310 0 C remains low. With
sample 1B, calcined at 260 0 C the amount of NiO 1 +x is too small to become distinctly
apparent by hydrogen consumption at low temperatures (Fig. 1a).
Previous calcination at temperatures of 499 0 C or higher leads to reaction of nickeloxide
and aluminumoxide resulting from the decomposition of the takovite to nickelaluminate or
to a DOSI (disordered oxide spinel intermediate) phase. It is well known that reduction of
nickel spinel only proceeds at high temperatures. The reaction to a spinel phase becoming
more complete at higher temperatures is apparent from the gradual shift of the maxima of the reduction profile. Defects in the surface of the spinel easily dissociating hydrogen do
not exist.
Sample 1 contains a substantial amount of sodium. It is assumed that the presence of
sodium promotes the reaction of nickeloxide with alumina to nickelaluminate. Drying at
120 0 C and calcination at 260 and 399 0 C lead to reduction profiles exhibiting a
significant hydrogen consumption over a broad temperature range. After calcination at 585 and 850 0 C formation of nickelaluminate or a DOSI phase is apparent. Reduction of these
phases is fairly difficult. Reduction of nickel ions present in nickelaluminate or in a DOSI phase leads to relatively
large nickel particles. At the more elevated temperatures required for the reduction of the

260 Chapter 10
nickel ions in nickelaluminate or a DOSI phase, the resulting nickel atoms are highly mobile
over the aluminate or alumina. As a result the nickel atoms agglomerate to nickel particles
of a size of about 16 nm [61.
At lower temperatures nickel atoms and small clusters of nickel atoms are less mobile.
which result in smaller nickel particles. Accordingly reduction at lower temperatures leads to smaller particles of a size of 4 to 10 nm, which do not migrate or coalescence rapidly
at higher temperatures. It is interesting that also reduction at relatively low temperature
leads with sample 1, which contains sodium, to large nickel particles. We attribute the
formation of relatively large nickel particles to a high mobility of nickel metal atoms over
spinel surfaces. The mobility of nickel metal atoms over nickeloxide is lower than over
spinel surfaces. since the interaction of metallic nickel with nickeloxide is higher than with
a spinel surface.
CONCLUSIONS
1) With the reduction of nickel in takovite, the molar ratio Ni/Al, the pH level during
precipitation, and the calcination most significantly affect the shape of the TPR-profile, the solid phases after reduction, and the metallic nickel particle size. Less important are the
temperature of the liquid during the precipitation and the period of time involved in the
precipitation.
2) The main peak in the TPR profile of samples with a molar ratio Ni/Al of 3 shifts to
higher temperatures when previous calcination is performed at higher temperatures, while the sample with a molar ratio Ni/Al of 2.5 containing Na shows a relatively broad TPR profile after previous calcination at temperatures up to 500 0 C.
3) Raising the temperature of the previous calcination from 120 to 853 0 C leads to an
increase of the size of the nickel particles from 4-8 nm to 16 nm due to reaction to nickel aluminate at higher temperatures. The high mobility of nickel metal atoms over
sodiumaluminate causes the size of the nickel metal particles to be 15 nm irrespective of the temperature of the previous calcination.
4) After calcination of the takovite precursors below 400 0 C, the nickel can be completely be reduced to metallic nickel; calcination at higher temperatures produces
nickel aluminate a fraction of which cannot be reduced to metallic nickel. The presence of
sodium promotes formation of aluminates thus appreciably decreases the reducibility of nickel.

261 TPR of synthetic takovite
ACKNOWLEDGMENTS
The authors thank Tonny de Beer and Guido Mul for their contribution to the
experimental work, and dr.J.T. Kloprogge for the critical review of the paper.
REFERENCES
1 E.C. Kruissink, L.L. van Reyen, J. Chern. Soc., Faraday Trans., (1) 77 (1981) 649
2 P.H.M. de Korte, E.B.M. Doesburg, C.P.J. de Winter, and L.L. van Reyen, Solid State
lonics, 16 (1985) 73-80
3 E.B.M. Doesburg, G. Hakvoort, H. Schaper, and L.L. van Reyen, Applied Catalysis, 7
(1983)85
4 Joint Committee of the Powder Diffraction file Standards (JCPDS) a) NiO 22-1189, b)
NiAI 20 4 10-0339, c) AI 20 3 29-0063
5 E.C. Kruissink, L.E. Alzamora, S. Orb, E.B.M. Doesburg, L.L. van Reijen, J.H.R. Ross,
and G. van Veen, Studies in Surface Science and Catalysis 3, Preparation of Catalysts
2, Proceedings of the Second International Symposium, Louvain-Ia-Neuve, September
4-7 (1978), Ed. B. Delmon, P. Grange, P. Jacobs, and G, Poncelet, Elsevier (1979)
Amsterdam, 143
6 E.B.M. Doesburg, P.H.M. de Korte, H. Schaper, and L.L. van Reyen, Applied Catalysis
11 (1984) 155

263
SAMENVATTING
Een probleem dat bij de katalysator bereiding altijd aan de orde is geweest is de
vorming van actieve plaatsen voor de te katalyseren reactie en de rol van deze plaatsen in het katalytisch proces. Het antwoord moet vaak gezocht worden in de structuur van
de katalysator. De actieve plaatsen zijn juist in die omgeving aanwezig waarbij de
gewenste reactie gekatalyseerd wordt. Soms is de zeer directe omgeving van de
actieve plaatsen van belang, maar vaak speelt ook de drager waarop de katalyserende
verbinding is aangebracht een belangrijke rol. De drager is meestal een inert materiaal
die er voor zorgt dat de katalyserende deeltjes, bijvoorbeeld metaal deeltjes, niet met
elkaar grotere deeltjes gaan vormen, waardoor het gezamenlijk oppervlak van de
deeltjes en dus ook de katalytische activiteit afneemt. Een gevolg kan ook zijn dat de
grotere metaal deeltjes, bijvoorbeeld nikkel deeltjes, een andere katalytische werking
hebben. De separatie van de deeltjes van de actieve fase is echter niet de enige rol van de drager. De drager kan door zijn porie afmetingen een rol spelen in de selectiviteit
voor een bepaalde reactie. De afmeting van de bij de katalytische reactie ontstane
verbinding kan immers niet groter zijn dan van de porien in de drager. Daarnaast kan de drager door zijn eigen actieve oppervlakte groepen participeren in de werking van de
katalysator. Voorbeelden van poreuze dragermaterialen zijn aluminiumoxide (alumina) en siliciumdioxide (silica). Een veelbelovende groep van dragermaterialen zijn de gepilaarde
kleien. Deze materialen bezitten een plaatvormige structuur, waarbij de platen door middel van pilaarverbindingen gescheiden worden gehouden. In de spleetvormige porien
bevinden zich dan de katalytisch actieve pilaren. De plaatvormige kleideeltjes zijn op
hun beurt klein hetgeen voor een snelle aanvoer van reactanten en afvoer van het gewenste produkt zorgt.
Belangrijk voor de goede werking van de katalysator is de synthese stap die
reproduceerbaar moet kunnen worden uitgevoerd. Verbindingen met dezelfde
chemische samenstelling kunnen verschillende reacties katalyseren. Een praktijk
voorbeeld is de selectieve oxydatie van zwavelwaterstof naar zwavel over gedragen ijzeroxide katalysatoren. De werking van deze katalysatoren wordt in sterke mate
bepaald door de structuur van de aluminiumoxide drager. De dragermaterialen die in dit proefschrift zijn bestudeerd zijn poreus sol-gel silica,
een basisch aluminium-magnesium coprecipitaat (hydrotalcietl, en een aluminium-nikkel coprecipitaat (takoviet). Een silica gel is een zeer ijle drie-dimensionale structuur van
silica sol deeltjes van enkele nanometers. De silica gelen zijn bereid uit basisch silicium
houdend waterglas en een sterk zuur. De gebruikte waterglas oplossing bevat naast een
hoge concentratie silicaat anionen ook een hoge concentratie natrium ionen. Er zijn drie
bereidingsmethoden onderzocht om de poreuze silica gel structuur te produceren. De
drie methoden verschillen in de manier waarop de waterglas oplossing wordt
aangezuurd. De eerste methode behelst de additie van waterglas aan een sterk zuur, waarbij de silica sol deeltjes die bij deze additie gevormd worden zich vertakken tot een silica gel, de klassieke methode. Bij de tweede, pH-statische, methode worden de

264
waterglas en zuur oplossing gelijktijdig aan een oplossing van een constante pH
toegevoegd. De derde methode, de electrodialyse, verschilt van de eerste twee
methoden, in het feit dat de pH van de waterglas oplossing niet met een sterk zuur,
maar met aan een platina anode gegenereerde H+ ionen wordt verlaagd. Het gevolg van
de laatste methode is dat gedurende de vorming van de silica sol deeltjes de natrium
ionen uit de waterglas oplossing worden gedialyseerd. Interessant is het dan ook de
vorming van de silica sol deeltjes en de gelering van het sol tot een silica gel bij de
afwezigheid van natrium ionen te vergelijken met die van de eerste twee methoden.
De porie structuur van de silica gel drager wordt in een belangrijke mate bepaald door
de kinetiek van de precipitatie reacties van de silicaat anionen. De kinetiek van de
reacties by lage vormingstemperatuur kunnen worden afgeleid uit de kinetiek van de
reacties onder hydrothermale condities, waar de reacties als gevolg van de hoge
temperatuur vele malen sneller veri open. Ais gevolg van de precipitatie reactie reageren
reeds aanwezige kiemen van ongeveer 2 nm in de waterglas oplossing tot silica sol deeltjes van enkele nanometers. De grootte van deze deeltjes kan worden bepaald met behulp van een elektronen microscoop.
De op klassieke wijze door additie van waterglas aan sterk zuur bereide silica gelen zijn gegeleerd bij een pH van 5 en gedroogd bij een temperatuur van 393 K. De gelen bevatten sol deeltjes van ongeveer 5 nm, hebben een porie volume van 0.8 ml/g, en
hebben een intern oppervlak van ongeveer 457 m2 /g. De diameter van de porien tussen
de deeltjes is ongeveer gelijk aan die van de afmeting van de deeltjes, namelijk 4.8 nm gemeten met N2 adsorptie en 8.8 nm gemeten met thermoporometrie.
De pH statische bereidingsmethode leidt bij een lage pH waarde van 2 tot zeer kleine
deeltjes van 2 tot 3 nm met diameter van de porien van 6.2 nm tussen de deeltjes. Bij
een hogere statische pH van 4 en 5 worden deeltjes met een diameter van 5 a 8 nm gevormd met afmetingen van de porien van 5.6 en 13.6 nm, en bij een nog hogere pH
waarde van 9 en 10 worden deeltjes gevormd met een deeltjes afmeting van 21 a 26 nm. De porie diameter van de laatsgenoemde gelen is onbekend. De gelen die bij
een lage pH van 1 a 2 gevormd zijn, hebben een porie volume van 0.4 mllg en een
intern oppervlak van 286 m2 /g. Deze waarden voor het porie volume en intern
oppervlak zijn lager dan die zijn gemeten bij de klassieke zuur-base gelen, die bij een pH van 5 gegeleerd zijn. De pH statische silica gelen die bij een pH van 4 en 5 zijn bereid
hebben een gemiddeld porie volume van 0.9 ml/g en een gemiddeld intern oppervlak
van 476 m2 /g, vergelijkbaar met die van de klassieke zuur-base bereidings methode. Bij
de klassieke bereidingsmethode loopt de pH door een traject van een zeer lage pH
kleiner dan nul naar een pH van 5. Beneden een pH van 2 worden slechts kleine
deeltjes van 2 a 3 nm gevormd. Kennelijk treedt in het pH traject vanaf 2 tot 5 een reactie op waarbij uit de deeltjes van 2 nm de deeltjes van 5 nm worden gevormd. De
deeltjes van 5 nm zouden opgebouwd kunnen zijn uit de deeltjes van 2 a 3 nm, hetgeen
een aanwijzing zou kunnen zijn voor de fractale structuur van silica. Een dergelijke
fractale structuur kan echter niet uit de poriestraal verdelingen van de silica gelen worden waargenomen.
Interessant is de vergelijking van de porie structuur van de op electrochemische wijze

265
verkregen silica gelen, enerzijds, met de pH-statisch en klassiek gesynthetiseerde gelen,
anderzijds. De pH van de op electrochemische wijze gesynthetiseerde gelen loopt door
een traject van pH waarden van 11.3 tot 2.8. In het pH gebied 9 a 10 wordt een
deeltjes grootte van 21 tot 26 nm verwacht, terwijl deeltjes van 5 nm worden
gemeten. Dit verschil kan worden toegeschreven aan de geringe hoeveelheid natrium die door de dialyse in het traject pH 11.3 tot 2.8 in de waterglas oplossing aanwezig is.
Natrium heeft namelijk een katalytisch effect op aangroei van de sol deeltjes en op de
gelering. Bij afwezigheid van natrium worden dus kleinere deeltjes verwacht.
Natrium is in staat om het proton van een oppervlakte silanol groep te verwijderen en
veroorzaakt daardoor een negatieve lading op het silica deeltje, die slechts ten dele door
het natrium kan worden afgeschermd. De negatieve lading van het SiO'-Na+ complex
heeft een katalytisch effect op de vorming van siloxaan bindingen tussen de silica sol
en het monosilicium zuur (aangroei) en op de vorming van bindingen tussen de sol deeltjes onderling (gelering). Uit titratie experimenten is gebleken dat de negatieve logaritme van de ionisatie constante van de oppervlakte silanol groepen in de
aanwezigheid van natrium gelijk is aan 6.2. Tot een pH van 6 neemt het porie volume
van pH-statisch bereide gelen en hydrothermaal behandelde zuur-base silica gelen dan ook toe door een toename van siloxaan bindingen tussen de deeltjes, waarvan de
vorming door ge'ioniseerde silanol groepen gekatalyseerd wordt. Wellicht neemt het
porie volume ook toe door de afstotende werking tussen de sol deeltjes onderling. Uit hydrothermale experimenten is gebleken dat het porie volume van zuur-base hydrogelen bij een pH van 6 door een maximum van 1.4 ml/g loopt. Bij de pH-statische silica gelen bereikt het porie volume een maximum van 0.8 ml/g bij een pH van 6. Duidelijk is dat
bij een pH waarde boven 6 de electrostatische repulsie tussen de deeltjes van 5 nm te
sterk toeneemt en een geringer aantal siloxaan bindingen tussen deeltjes wordt gevormd. Het geringere aantal vertakte deeltjes verzwakt de gel structuur en de gelen
zijn meer onderhevig aan krimp.
De electrochemisch gesynthetiseerde silica gelen hebben een minimum in de
geleertijd van 279 minuten bij een pH waarde van 5.9. De geleertijd neemt beneden een
pH waarde van 5.9 toe door een gering aantal ge'ioniseerde silanol groepen en boven de pH van 5.9 door electrostatische repulsie tussen de sol deeltjes. De toename van de
oppervlakte lading heeft nog een ander effect. Door de afstotende werking worden
kortere strengen van silica sol deeltjes gevormd, die verder uit elkaar Iiggen. Het gevolg
is dat bij de verhoging van de gelerings pH van 2.8 tot 6.5 de porie diameter toeneemt
van 4.8 tot 8.4 nm, terwijl het porie volume gelijk blijft met 0.6 ml/g. Het krimp gedrag van de op drie manieren gesynthetiseerde gelen is onderzocht met
behulp van thermoporometrie. Met thermoporometrie wordt het warmte effect gemeten dat gepaard gaat met de vorming van ijs in de porian van de silica gel. Het warmte
effect wordt als functie van de temperatuur gemeten op een differentiale scanning
calorimeter. De afmeting van de gevormde ijs kristallen is een maat voor de porie grootte, de hoeveelheid ijs voor het porie volume. en de oppervlakte van het ijs kristal is een maat voor het intern oppervlak van de silica gel. De met thermoporometrie gemeten
waarden voor de ijskristallen moeten daarbij gecorrigeerd worden voor een niet

266
bevriesbare laag water van 0.9 nm, die bij de overgang silica-ijs aanwezig is, Informatie
over de aanwezigheid van de niet bevriesbare laag van 0.9 nm bij toepassen van
thermoporometrie wordt verkregen door de afmeting en het volume van het gevormde
ijs in de porie te vergelijken met de porie afmeting en porie volume die door de traditionele karakteriseringstechnieken stikstof adsorptie bij 77 K en kwik penetratie
worden verkregen. Daarnaast kan de deeltjes afmeting van het gehydrateerde sol in
water bepaald met dynamische lichtverstrooiing vergeleken worden met de elektronen
microscopisch vastgestelde waarde.
De aanwezigheid van de niet bevriesbare laag is vergeleken bij een hydrofiel silica
oppervlak en in holle chrysotiel naalden met een hydrofoob oppervlak. Uit dynamische
lichtverstrooiings metingen (DLS) is gemeten dat aan het silica oppervlak inderdaad een
sterk gebonden laag water aanwezig is. De waarde van het gehydrateerde silica deeltje
in water is met DLS bepaald op 7,3 nm en is groter dan de deeltjes grootte van 5 nm
bepaald met behulp van elektronen microscopie, hetgeen resulteert in een niet bevriesbare laag dikte ter grootte van ongeveer (7.3-51/2 "" 1 nm. De afmeting van het
ijs dat in de holle hydrofobe chrysotiel naalden gemeten wordt, is echter gelijk aan de afmeting van de porie. Kennelijk is in de hydrofobe holle chrysotiel buizen de sterk gebonden water laag afwezig. Het hydrofobe karakter van de chrysotiel buizen en de
afwezigheid van de niet bevriesbare laag heeft echter geen gevolg voor de penetratie
van water in de buizen en voor de vorming van ijs.
Met thermoporometrie kan de verandering in de porie structuur worden gemeten die gepaard gaat met de overgang ongedroogd silica gel (hydrogel) naar gedroogd gel (xerogel). Voor de metingen aan de xerogelen moeten de monsters eerst weer
ge'impregneerd worden met water. De silica gelen die op klassieke wijze zijn bereid en
bij een pH van 5 zijn gegeleerd en gedroogd zijn bij 393 K vertonen een afname van de porie diameter ter grootte van 59 % en van het porie volume ter grootte van 44 %. Een
vergelijkbare afname van het porie volume van 40 % wordt ook waargenomen bij de pH-statisch bereide gelen die bij een pH van 1 en 2 gesynthetiseerd worden.
Hydrothermale behandeling van de klassiek bereide gelen leidt tot een toename van de
sol deeltjes grootte en dus ook tot een toename van de door de deeltjes omsloten porie diameter. De porie diameter van het xerogel kan zo gevarieerd worden tussen 4.8 en
40 nm. Bij de laatstgenoemde porie afmeting van 40 nm wordt slechts een krimp van
de porie diameter waargenomen van 26 %, terwijl de krimp van het porie volume nog
tamelijk hoog is, namelijk 43 %. Hieruit blijkt dat door de hydrothermale behandeling de krimp van de porie diameter aanzienlijk lager wordt, maar dat de afname van het porie
volume nauwelijks door de hydrothermale behandeling be'invloed wordt.
Totaal verschillend is het gedrag bij drogen van electrochemisch gesynthetiseerde silica gelen met silica sol deeltjes van 5 nm. De porie diameter en het porie volume
blijken bij drogen niet af te nemen. De porie diameter van een bij pH 5 gegeleerd gel
blijft gelijk aan 5.6 nm en het porie volume blijft gelijk aan 0.6 ml/g na drogen bij
393 K. De afwezigheid van krimp is waarschijnlijk te wijten aan de geringe hoeveelheid natrium die bij het geleren aanwezig is. Dit blijkt uit een vergelijking met de krimp van de op klassieke wijze gesynthetiseerde zuur-base silica gelen. Na drogen bij 393 K van

267
een bij een pH van 5 gegeleerde zuur-base silica gel met een zelfde deeltjes afmeting
wordt een afname van de porie diameter gemeten van 19 tot 8.8 nm en in het porie
volume van 1.1 tot 0.8 ml/g. Hieruit blijkt dat de door natrium ge'induceerde negatieve
oppervlakte lading van de sol dee/tjes leidt tot een grotere porie afmeting en een iets
hoger porie volume. De deeltjes zin derhalve iets minder sterk vertakt en zijn meer onderhevig aan krimp.
De op de drie, klassieke, pH-statische, en electrochemische, methode
gesynthetiseerde gelen vertonen geen afname van het intern oppervlak bij drogen.
Tenslotte is de plaatafstand van gepilaard hydrotalciet in water onderzocht met
thermoporometrie, Deze plaatafstand is belangrijk omdat onder hydrothermale condities
de pilaren tussen de kleiplaten wordt aangebracht en in water de pilaren kunnen
worden uitgewisseld, zodat een katalysator met de juiste selectiviteit voor de te
katalyseren reactie wordt gesynthetiseerd. Hydrotalciet mineralen zijn hydrothermaal gesynthetiseerd met plaat afstanden in gedroogd klei varierend tussen 3 en 14 A. De porie afmetingen in water zijn onderzocht met thermoporometrie en vergeleken met de
plaatafstand in gedroogde toestand. De met thermoporometrie bepaalde afname van de
plaat afstand bij drogen is geschat op waarden varierend tussen 4 en 13 maal de
originele porie afmeting in water.

Curriculum Vitae
Mark Kurt Titulaer werd op 29 juli 1964 geboren in Hilversum. In juni 1982 behaalde hij het VWO diploma aan het Alberdingk Thijm College in Hilversum, en begon hij
datzelfde jaar met de studie scheikunde aan de Rijksuniversiteit Utrecht. Het
propaedeuse examen werd afgelegd in augustus 1983 en het doctoraal examen in juni
1987. In het hoofdvakonderzoek is meegewerkt aan de ontwikkeling van een ijzeroxide gedragen katalysator voor de selectieve oxydatie van zwavelwaterstof naar zwavel. De
katalysator is onder de naam SuperClaus katalysator geoctrooieerd en wordt thans
gebruikt als Claus tialgas katalysator. De keuzevakken waren Biochemie en
Voedingsmiddelenchemie van Dierlijke Oorsprong. Het laatste onderzoek betrof de
ontwikkeling van een methode om een zeer geringe hoeveelheid tetracycline in vlees
aan te tonen. Van juli 1987 tot augustus 1991 was hij als wetenschappelijk assistent
verbonden aan de vakgroep Anorganische Chemie in samenwerking met de vakgroep
Geochemie van het Instituut voor Aardwetenschappen, waar het in dit proefschrift beschreven onderzoek werd uitgevoerd. Vanaf augustus 1991 werd gedurende een jaar de militaire dienstplicht vervuld als ziekenverzorger/ambulance chauffeur.
Copyright © 2022 FDOKUMEN